Embed Size (px)
Citation preview
FORUM
Eradication of Invasive Species: Why the Biology Matters
ANDREW PAUL GUTIERREZ1,2,3 AND LUIGI PONTI2,4
Environ. Entomol. 42(3): 395Ð411 (2013); DOI: http://dx.doi.org/10.1603/EN12018
ABSTRACT Published bi- and tri-trophic physiologically based demographic system models havingsimilar sub components are used to assess prospectively the geographic distributions and relativeabundance (a measure of invasiveness) of six invasive herbivorous insect species across the UnitedStates and Mexico. The plant hosts and insect species included in the study are: 1) cotton/pinkbollworm, 2) a fruit tree host/Mediterranean fruit ßy, 3) olive/olive ßy, 4) a perennial host/lightbrown apple moth, 5) grapevine/glassy-winged sharpshooter and its two egg parasitoids, and 6)grapevine/European grapevine moth. All of these species are currently or have been targets foreradication. The goal of the analyses is to predict and explain prospectively the disparate distributionsof the six species as a basis for examining eradication or containment efforts against them. Theeradication of the new world screwworm is also reviewed in the discussion section because of itspivotal role in the development of the eradication paradigm. The models used are mechanisticdescriptions of the weather driven biology of the species. Observed daily weather data (i.e., maxÐmintemperatures, solar radiation) from 1,221 locations across the United States and Mexico for the period1983Ð2003 were used to drive the models. Soil moisture and nutrition were assumed nonlimiting. Thesimulation results were mapped using GRASS GIS. The mathematical underpinnings of the modelingapproach are reviewed in the appendix and in the supplemental materials.
KEY WORDS light brown apple moth, fruit ßies, pink bollworm, glassy winged sharpshooter,European grapevine moth
We’re in the middle of an eradication programand can’t afford the luxury of research.
ÑA “high USDA ofÞcial” quoted by PaulEhrlich (see Burk and Calkins 1983).
Howwould youmake recommendations for con-trol of an invasive species in the absence of infor-mation?
ÑQuestion to A.P. Gutierrez from an invasivespecies scientist, USDA/APHIS/PPQ, Raleigh,
NC.
Invasive species may be of any taxa, and collectivelyare estimated to cause in excess of $140 billion in lossesannually in the United States (Pimentel et al. 2005)and a trillion worldwide (Oerke and Dehne 2004).Eradicationof an invasive speciesmaybedesirablebutelusive, and need not be attempted in some cases (seeMyers et al. 1998, 2000). The sterile insect technique(SIT) (Knipling 1955), and other methods including
pesticides, pheromones, cultural practices, quarantine,and combinations including applications of biotechnol-ogy (Robinson 2002) have been used in eradication orcontainment efforts. However, despite years of effortandexpendituresofhundredsofmillionsofdollars,manyinvasive species problems remain unresolved.
In this article we examine prospectively the effectsof weather on the distribution and relative abundance(invasiveness) of six invasive herbivorous insect spe-cies across the United States and Mexico, and use theresults to examine the eradication or containmentefforts against them. We use published weather-driven, physiologically based demographic models(PBDMs) developed by us and our colleagues in thiseffort.
The host/insect systems in our study are: 1) cot-ton (Gossypium hirsutum L.)/pink bollworm (Pecti-nophora gossypiella (Saunders)) (Gutierrez et al.2006b); 2) a fruit tree host/Mediterranean fruit ßy(medßy, Ceratitis capitata (Wiedemann)) (Gutierrezand Ponti 2011); 3) olive (Olea europaea L.)/olive ßy(Bactrocera oleae (Rossi)) (Gutierrez et al. 2006c,2009; Ponti et al. 2009a, b); 4) grapevine (Vitis viniferaL.)/glassy-winged sharpshooter (Homalodisca vitripen-nis (Germar))/two egg parasitoids (Wermelinger et al.1991, Gutierrez et al. 2011); 5) a perennial host plant/lightbrownapplemoth(Epiphyaspostvittana(Walker))(Gutierrez et al. 2010a); 6) grapevine/European grape-vinemoth(Lobesiabotrana(Denis andSchiffermuller))
1 Division of Ecosystem Science, College of Natural Resources,University of California, Berkeley, CA 94720-3114.
2 Center for the Analysis of Sustainable Agricultural Systems (CA-SAS Global), 37 Arlington Ave., Kensington, CA 94707.
3 Corresponding author, e-mail: [email protected] Laboratorio Gestione Sostenibile degli Agro-Ecosistemi (UTAGRI-
ECO), Agenzia nazionale per le nuove tecnologie, lÕenergia e lo sviluppoeconomico sostenibile (ENEA), Centro Ricerche Casaccia, Via Anguil-larese 301, 00123 Roma, Italy.
0046-225X/13/0395Ð0411$04.00/0 � 2013 Entomological Society of America
(Gutierrez et al. 2012). Because of the pivotal role thenativenewworldscrewworm(Cochliomyiahominivorax(Coquerel)) played in the development of the eradica-tion paradigm, its eradication in the United States, Mex-ico, and Libya is reviewed in the discussion section(Gutierrez and Ponti in press). The extensive literatureand the basic mathematical structure underpinning themodels are outlined in the cited articles, while the gen-eral formofthephysiologicallybaseddemographicmod-els (PBDMs) common to all of the species is reviewed inthe Appendix and the Supplemental Materials.
Central to the analysis of the distribution and abun-dance of heterotherm species is the inßuences ofweather and climate (e.g., Andrewartha and Birch1954). Climate is the long-run pattern of meteorolog-ical factors (e.g., temperatures, rainfall, etc.) in a givenlocation or larger region, while the term weather re-fers to short-run measures of these factors. The biol-ogy of heterotherm species evolves in response toclimate, interacting species, and other factors in thenative range that in total deÞne its ecological niche(see van der Putten et al. 2010). This biology deter-mines a speciesÕ temporal and spatial dynamics and geo-graphic range, and the potential areas it may invade.Weather (e.g., daily) affects heterotherm physiology,behavior, interactions with other species, and hence thedynamics of the species in current time and place.
Modeling the Distribution and Abundance ofInvasive Species
Several methods have been used to assess the geo-graphic distribution of heterotherm species. For per-spective, we contrast the commonly used ecologicalniche modeling (ENM) approach(s) and the PBDMapproach used here. Each approach has strengths andweaknesses.ENMApproach. The ENM may be statistical, phys-
iological indices, or based on information theory (seeElith and Leathwick 2009). ENMs are relatively easyto implement and seek to characterize climatically thegeographic range of a species based on aggregateweather data (and other factors) from areas of therecorded distribution (Beaumont et al. 2009). ENMsare used to predict the potential native range of thespecies and prospectively its range in new areas. How-ever, ENMs have implicit ecological and mathematicalassumptions that lack mechanistic biological under-pinnings (Soberon and Nakamura 2009), and as theFourth Assessment Report of the IntergovernmentalPanel on Climate Change Working group 2 (Fischlinet al. 2007) concluded, ENMs are unable to accountfor species interactions and population processes.These deÞciencies make them problematic when ex-tended to climate change scenarios. We note that thephysiological index ENM (e.g., CLIMEX) has ele-ments in common with the PBDM approach outlinedbelow (see Gutierrez et al. 1974, Sutherst and May-wald 1985, Sutherst et al. 2007).PBDM Approach. Applications of the PBDM and
other demographic approaches were reviewed by Bar-low (1999) and Hawkins and Cornell (1999) (see
Appendix). PBDMs capture mechanistically the biol-ogy of species in response to weather and trophicinteractions independent of species distribution data.Tri-trophic PBDM systems may include bottom-upeffects on phenology, growth and development ofwhole plants and plant subunits (e.g., fruits, leaves,etc.); the relevant biology and dynamics of herbivo-rous species feeding on them; and as required thetop-down action of natural enemies (e.g., Gutierrezand Baumgartner 1984, Gutierrez et al. 1994). Con-sumer species affect the dynamics of the resourcespecies and vice versa. The tri-trophic grapevine/glassy-winged sharpshooter/parasitoid system modelprovides a good overview of the PBDM approach(Gutierrez et al. 2011).
With variations, the PBDM approach to modelingplant growth and development is well established inthe literature (see Marcelis and Heuvelink 2007,Rodrõguez et al. 2011). PBDMs for plants consist of ageand mass structured subunit population dynamicsmodels linked via photosynthate availability that gov-erns growth and development of extant subunits andthe production of new ones. Photosynthesis is esti-mated using a functional response model (predatorform) driven by current age structured assimilationdemands, leaf area index, light, temperature, and otherfactors (see Gutierrez et al. 2005, 2006b). We assumednonlimiting water and nutrients in our analyses be-cause data on plant species root depth, soil moistureholding capacity, and soil fertility on a continentalscale were unavailable. This may lead to over predic-tion of plant distribution in arid areas (see Hickler etal. 2009). A tri-trophic study of the noxious yellowstarthistle (Centaurea solstitialis L.) in California in-cluded soil moisture and explained the failed biolog-ical control of the weed (Gutierrez et al. 2005).
PBDMs for the insect species are also age-struc-tured but may have attributes of stage, mass, sex, dor-mancy, behavior, and other factors as necessary. Thedata required to formulate the models for each insectspecies are outlined in the Appendix (Figs. A1 andA2). The herbivore models are driven primarily bytemperature and the demand for and supply of pre-ferred plant subunits. The acquisition biology of thisand higher trophic levels is captured by the samefunctional response model used for plant photosyn-thesis, albeit with different units, and using either thepredator or parasitoid forms as appropriate (see Ap-pendix equations A3i and ii). Similarly, natural enemymodels are driven by temperature and their demandfor and supply of preferred host or prey stages.
Weather, Simulation, and GIS Analyses
Weather. Daily weather data (i.e., maximum andminimum temperatures, solar radiation (cal/cm2/d))from 1,221 locations across the continental UnitedStates and Mexico for the period 1 January1983through 31 December 2003 were used to run the mod-els continuously across years. Weather data for Hawaiiwere available from very few locations. The weatherdata were obtained from the Research Data Archive
396 ENVIRONMENTAL ENTOMOLOGY Vol. 42, no. 3
(RDA), Computational and Information Systems Lab-oratory (CISL), National Center for Atmospheric Re-search (NCAR), Boulder, CO.Simulation. The species are assumed present at all
locations with weather driving the dynamics modelsand determining the relative favorability of each lo-cation for them. Initial conditions differed among thesystems, but were the same for all locations within asystem study (e.g., olive/olive ßy). We do not attemptto model the geographic invasion of the species as thisis an impossible task. Numerous life-history variablesare computed daily for each species in each system,but total pupae per year was used as a measure offavorability for the holometabolus medßy, olive ßy,apple moth, and grapevine moth; total diapause larvaeplant per year was used for pink bollworm, and totalnew adults per year was used for the hemimetabolousglassy-winged sharpshooter. These summary variablesshould be viewed as indices of favorability.
The output variables were geo-referenced and writ-ten by year to batch Þles. Means, SDs and coefÞcientsof variation were computed for each variable acrossyears at each location. The system models were as-sumed equilibrating to local weather during the Þrstyear (1983), and hence these data were not used incalculating the summary statistics.GIS. Except in Hawaii, where a 1 km grid was used,
the simulation data were mapped using inverse dis-tance weighting on a 3 km raster grid using the GISsoftware GRASS (Geographic Resources AnalysisSupport System, GRASS Development Team 2011,http://grass.osgeo.org). The distribution patterns inthe maps reßect average local site favorability and thegeographic distribution and distance between loca-tions. Red on the color bar indicates high favorabilityand clear indicate very low favorability. The dots inthe maps are the locations of the weather station used.
Integration of the Biology and Model Results
The scope of the study is large, and hence a briefreview of the biology, invasion history, and eradica-tion or containment efforts for each of the six invasivespecies is given as background for evaluating theirprospective geographic distribution and abundance.The species are discussed in chronological order oftheir invasion of California.PinkBollworm.The stenophagous pink bollworm is
a tropical species of Indian or more likely Papua-NewGuineaÐNorth Australian origins (van den Bosch andMessenger 1973, see Grefenstette et al. 2009). It iswidely distributed in cotton growing areas worldwidewhere it also attacks other species of Malvaceae (e.g.,okra and hollyhock). Pink bollworm was Þrst discov-ered in Florida in 1932 on tree cotton, and spread tocommercial cotton in the United States and Mexico.The moth invaded the desert cotton areas of Arizonaand southern California in the late 1960s where itbecame the key pest. Dispersal of the pest in Californiais aided by southwesterly monsoon winds that annu-ally carry adult moths from the southern desert valleys
northward into the Central Valley and elsewhere(Stern and Sevacherian 1978).
In 1968, the U.S. Department of Agriculture(USDA) and the California Department of Agricul-ture (CDFA) began an eradication program in Ari-zona and California using the sterile insect technique(SIT) (Staten et al. 1992), but when eradicationproved elusive (Chu et al. 1996), the program wasredirected with the goal of preventing the establish-ment of pink bollworm in Central Valley cotton. In1997, genetically modiÞed cotton expressing the pro-toxin of the bacterium Bacillus thuringiensis (Bt) wasintroduced across much of the U.S. cotton belt, but notin the Central Valley of California (Godfrey 2004;Gutierrez et al. 2006a, b). Bt cotton is highly effectiveagainst pink bollworm reducing its populations to verylow levels (e.g.,Tabashniket al. 2010), and this createdconditions thought favorable for the renewal of erad-ication efforts.
In 2001 to 2002, a three-phase SIT eradication pro-gram piggybacked on the Bt cotton technology wasinitiated in the United States and Mexico (Grefen-stette et al. 2009; see Fig. 1a). Phase 1 targeted the ElPaso/Trans Pecos region of west Texas, southÐcentralNew Mexico, and northern Chihuahua, Mexico. Phase2 was begun in Arizona and New Mexico in 2006, andsub phase 3aÐb was begun in 2007Ð2008 along theColorado River and in the desert valleys of Arizona,California, and Mexico (http://www.aphis.usda.gov/plant_health/plant_pest_info/cotton_pests). The Cen-tral Valley is considered an area of pink bollworm sup-pression and control because the USDA claimed its SITprogram has prevented the mothÕs establishment there(Staten et al. 1992).
Based on abundant data, PBDMs for cotton and pinkbollworm used in this study were developed by Guti-errez et al. (1977), reÞned by Stone and Gutierrez(1986) with the effects of Bt cotton on the majorcotton pests in California added by Gutierrez andPonsard (2006) and Gutierrez et al. (2006a). Criticalelements of pink bollworm biology include tight linksto the phenology and dynamics of cotton fruiting, dia-pause initiation in late summer in response to decreasingphotoperiod, and temperature (Gutierrez et al. 1981),and cold-intolerance of diapause larvae (Gutierrez et al.1977, 2006b; see data in Venette et al. 2000).PinkBollwormDistribution andRelative Abundance.
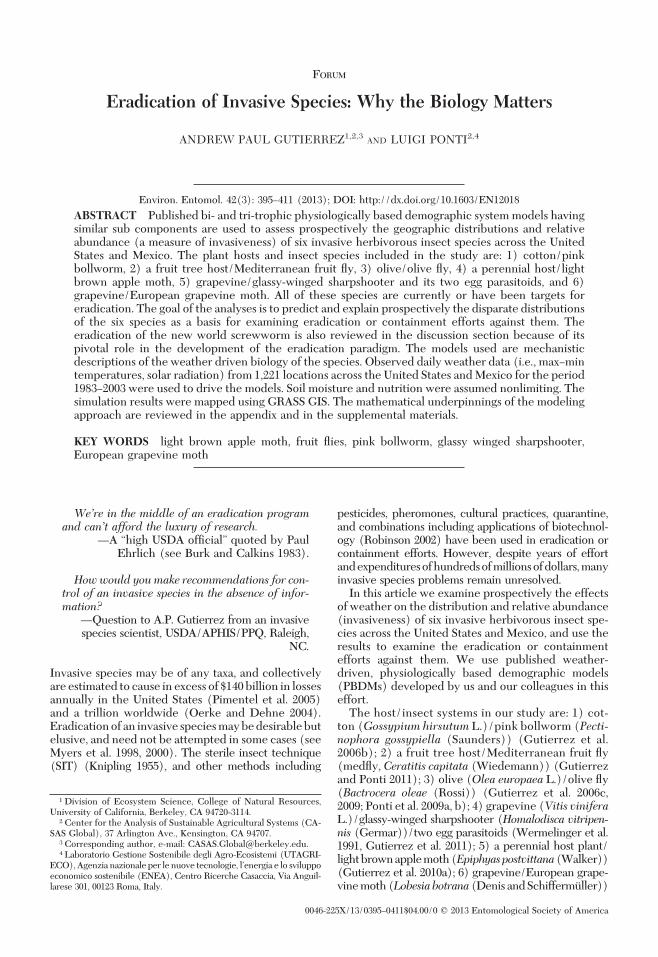
Three measures of favorability for pink bollwormwere estimated: normalized average winter survival ofdiapause larvae (Fig. 1b), average number of diapauselarvae/plant/year (Fig. 1c), and average cumulativelarvae/plant/year (i.e., larval days, Fig. 1d). Not allareas with temperatures favorable for pink bollwormhave sufÞcient rainfall and/or irrigation for cottonproduction (i.e., roughly the desert areas outside theshaded zones in Fig. 1a).
Winter survival is predicted to be highest in thesouthern desert regions of Arizona, California, andnorthwestern Mexico (Fig. 1b) where before the in-troduction of Bt cotton, high densities of diapauselarvae and summer larval populations were common(Fig. 1c and d, respectively). In sharp contrast, very
June 2013 GUTIERREZ AND PONTI: ERADICATION OF INVASIVE SPECIES 397
low winter survival is predicted in the Central Valley(CV) of California (see Gutierrez et al. 2006aÐc), andover much of the cotton belt in the southÐeast UnitedStates and the northern half of Texas, southern NewMexico, and northÐcentral Mexico (Fig. 1b). Highwinter survival is predicted in the Yucatan Peninsula(Fig. 1b), but a combination of high temperatures andphotoperiod in the region adversely affect diapauseinduction (see Gutierrez et al. 1981), and hence pop-ulation development (Fig. 1c and d).
The predictions of our model contrast sharply withthe Þndings of Venette et al. (2000) that abiotic factorsdo not preclude pink bollwormÕs establishment overmuch of the cotton belt, and that its absence is theresult of federal monitoring, quarantine, and localeradication programs. The predictions of the modelalso conßict with the claim that the ongoing SIT erad-ication or suppression program has kept pink boll-worm from establishing in the Central Valley of Cal-ifornia (Staten et al. 1992) under current climate, butthis is expected to change with climate warming(Gutierrez et al. 2006aÐc). We note that piggybackingthe SIT program on the Bt cotton technology in areaswhere PBW is able to persist increases the likelihoodof success for the ongoing eradication program.Mediterranean Fruit Fly. The polyphagous Medi-
terranean fruit ßy (medßy) is a tropical species of EastAfrican origins (Balachowski 1950) that is establishedin sub Saharan Africa, the Mediterranean Basin (e.g.,Italy), Argentina, Western Australia, Hawaii, Mexico,and Central America. The ßy was Þrst detected insouthern California in 1975 (Carey 1991) and an in-tensive area-wide eradication program based on in-secticides was initiated. The ßy was not detected again
in southern California until 1980 (Myers et al. 2000)when a detection/eradication program based on pro-tein-bait and insecticides was begun. An ongoing SITprogram against medßy was begun in 1994 that cur-rently extends through Mexico and Guatemala.
Low numbers of adult medßy have been detectedperiodically in the Los Angeles Basin that Meixner etal. (2002), using microsatellite and mitochondrialDNA analyses, determined were new invasions. Theßy was also discovered during 1975, 1980, and 1981 inSanta Clara County south of San Francisco Bay, andhas occasionally been found in inland locations in thestate (J.R. Carey http://entomology.ucdavis.edu/news/califmedßiescities. html, see Gutierrez andPonti 2011). We note that no ongoing measureablepopulations of the ßy have been found in California.
Key features of medßyÕs biology are its narrow ther-mal limits and reproductive quiescence in femaleswhen fruit are unavailable. To analyze prospectivelythe potential distribution of the ßy in tropical areassuch as Florida, Hawaii, and Mexico, the model de-veloped by Gutierrez and Ponti (2011) for ArizonaÐCalifornia and Italy was modiÞed so that fruit hostswould be available nearly all year-around. This changeenabled separation of the limiting effects of temper-ature on ßy dynamics from host availability.Medfly Distribution and Abundance. The model
predicts that only the coastal plain of southern Cali-fornia and Hawaii are potentially favorable for medßy(Fig. 2a and c), with Florida being less favorable, andother areas of the United States being unfavorable(Fig. 2b). As observed, tropical southern Mexico andareas bordering Guatemala are highly favorable forthe ßy, while the vast desert-highlands areas of north-
Fig. 1. Prospective distribution and abundance of the pink bollworm in the United States and Mexico below 2,000 m during1984Ð2003 using the model of Gutierrez et al. (2006b): (a) phases of the USDA eradication program (phases 1Ð3b, see text)and the Central Valley (CV) exclusion zone; (b) the normalized average winter survival of diapause larvae; (c) averagediapause larvae/plant/year; and (d) cummulative daily counts of larvae/plant/year. Note that shaded areas in Fig. 1a areroughly the distribution of commercial cotton in the southÐwest United States and northern Mexico. (Image reference:http://www.oxitec.com/moth-gallery/k10075Ð6-ars-pink-bollworms/).
398 ENVIRONMENTAL ENTOMOLOGY Vol. 42, no. 3
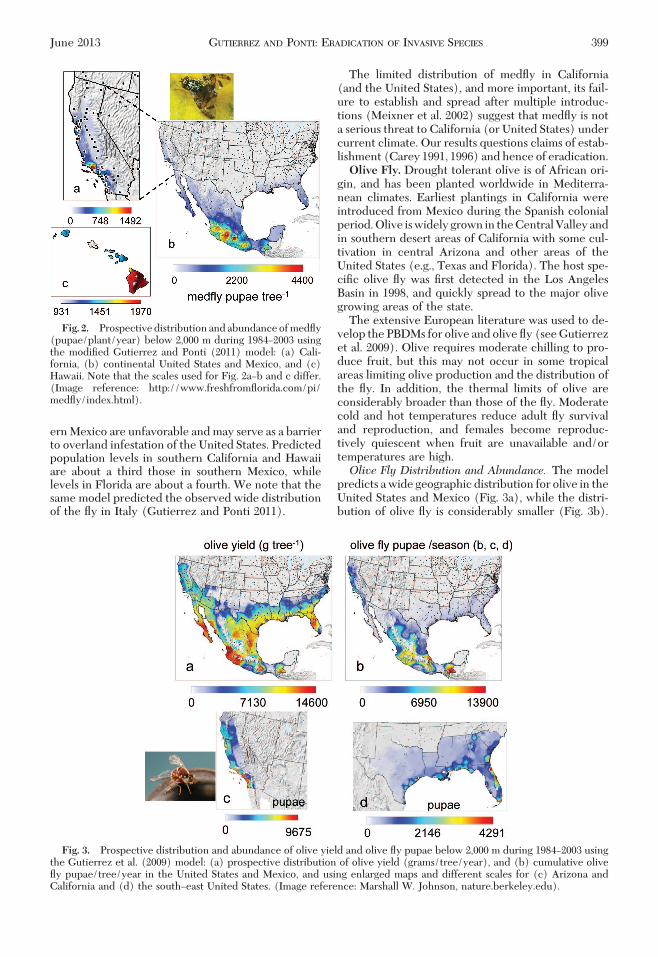
ern Mexico are unfavorable and may serve as a barrierto overland infestation of the United States. Predictedpopulation levels in southern California and Hawaiiare about a third those in southern Mexico, whilelevels in Florida are about a fourth. We note that thesame model predicted the observed wide distributionof the ßy in Italy (Gutierrez and Ponti 2011).
The limited distribution of medßy in California(and the United States), and more important, its fail-ure to establish and spread after multiple introduc-tions (Meixner et al. 2002) suggest that medßy is nota serious threat to California (or United States) undercurrent climate. Our results questions claims of estab-lishment (Carey 1991, 1996) and hence of eradication.Olive Fly. Drought tolerant olive is of African ori-
gin, and has been planted worldwide in Mediterra-nean climates. Earliest plantings in California wereintroduced from Mexico during the Spanish colonialperiod. Olive is widely grown in the Central Valley andin southern desert areas of California with some cul-tivation in central Arizona and other areas of theUnited States (e.g., Texas and Florida). The host spe-ciÞc olive ßy was Þrst detected in the Los AngelesBasin in 1998, and quickly spread to the major olivegrowing areas of the state.
The extensive European literature was used to de-velop the PBDMs for olive and olive ßy (see Gutierrezet al. 2009). Olive requires moderate chilling to pro-duce fruit, but this may not occur in some tropicalareas limiting olive production and the distribution ofthe ßy. In addition, the thermal limits of olive areconsiderably broader than those of the ßy. Moderatecold and hot temperatures reduce adult ßy survivaland reproduction, and females become reproduc-tively quiescent when fruit are unavailable and/ortemperatures are high.Olive Fly Distribution and Abundance. The model
predicts a wide geographic distribution for olive in theUnited States and Mexico (Fig. 3a), while the distri-bution of olive ßy is considerably smaller (Fig. 3b).
Fig. 2. Prospective distribution and abundance of medßy(pupae/plant/year) below 2,000 m during 1984Ð2003 usingthe modiÞed Gutierrez and Ponti (2011) model: (a) Cali-fornia, (b) continental United States and Mexico, and (c)Hawaii. Note that the scales used for Fig. 2aÐb and c differ.(Image reference: http://www.freshfromßorida.com/pi/medßy/index.html).
Fig. 3. Prospective distribution and abundance of olive yield and olive ßy pupae below 2,000 m during 1984Ð2003 usingthe Gutierrez et al. (2009) model: (a) prospective distribution of olive yield (grams/tree/year), and (b) cumulative oliveßy pupae/tree/year in the United States and Mexico, and using enlarged maps and different scales for (c) Arizona andCalifornia and (d) the southÐeast United States. (Image reference: Marshall W. Johnson, nature.berkeley.edu).
June 2013 GUTIERREZ AND PONTI: ERADICATION OF INVASIVE SPECIES 399
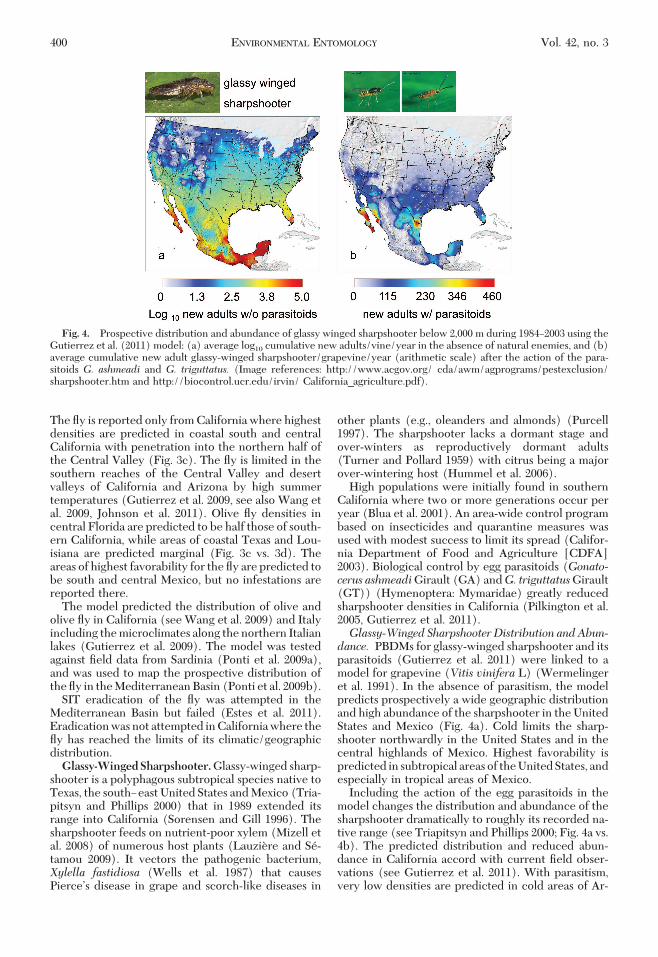
The ßy is reported only from California where highestdensities are predicted in coastal south and centralCalifornia with penetration into the northern half ofthe Central Valley (Fig. 3c). The ßy is limited in thesouthern reaches of the Central Valley and desertvalleys of California and Arizona by high summertemperatures (Gutierrez et al. 2009, see also Wang etal. 2009, Johnson et al. 2011). Olive ßy densities incentral Florida are predicted to be half those of south-ern California, while areas of coastal Texas and Lou-isiana are predicted marginal (Fig. 3c vs. 3d). Theareas of highest favorability for the ßy are predicted tobe south and central Mexico, but no infestations arereported there.
The model predicted the distribution of olive andolive ßy in California (see Wang et al. 2009) and Italyincluding the microclimates along the northern Italianlakes (Gutierrez et al. 2009). The model was testedagainst Þeld data from Sardinia (Ponti et al. 2009a),and was used to map the prospective distribution ofthe ßy in the Mediterranean Basin (Ponti et al. 2009b).
SIT eradication of the ßy was attempted in theMediterranean Basin but failed (Estes et al. 2011).Eradication was not attempted in California where theßy has reached the limits of its climatic/geographicdistribution.Glassy-Winged Sharpshooter.Glassy-winged sharp-
shooter is a polyphagous subtropical species native toTexas, the southÐeast United States and Mexico (Tria-pitsyn and Phillips 2000) that in 1989 extended itsrange into California (Sorensen and Gill 1996). Thesharpshooter feeds on nutrient-poor xylem (Mizell etal. 2008) of numerous host plants (Lauziere and Se-tamou 2009). It vectors the pathogenic bacterium,Xylella fastidiosa (Wells et al. 1987) that causesPierceÕs disease in grape and scorch-like diseases in
other plants (e.g., oleanders and almonds) (Purcell1997). The sharpshooter lacks a dormant stage andover-winters as reproductively dormant adults(Turner and Pollard 1959) with citrus being a majorover-wintering host (Hummel et al. 2006).
High populations were initially found in southernCalifornia where two or more generations occur peryear (Blua et al. 2001). An area-wide control programbased on insecticides and quarantine measures wasused with modest success to limit its spread (Califor-nia Department of Food and Agriculture [CDFA]2003). Biological control by egg parasitoids (Gonato-cerus ashmeadiGirault (GA) andG. triguttatusGirault(GT)) (Hymenoptera: Mymaridae) greatly reducedsharpshooter densities in California (Pilkington et al.2005, Gutierrez et al. 2011).Glassy-Winged Sharpshooter Distribution andAbun-dance. PBDMs for glassy-winged sharpshooter and itsparasitoids (Gutierrez et al. 2011) were linked to amodel for grapevine (Vitis vinifera L) (Wermelingeret al. 1991). In the absence of parasitism, the modelpredicts prospectively a wide geographic distributionand high abundance of the sharpshooter in the UnitedStates and Mexico (Fig. 4a). Cold limits the sharp-shooter northwardly in the United States and in thecentral highlands of Mexico. Highest favorability ispredicted in subtropical areas of the United States, andespecially in tropical areas of Mexico.
Including the action of the egg parasitoids in themodel changes the distribution and abundance of thesharpshooter dramatically to roughly its recorded na-tive range (see Triapitsyn and Phillips 2000; Fig. 4a vs.4b). The predicted distribution and reduced abun-dance in California accord with current Þeld obser-vations (see Gutierrez et al. 2011). With parasitism,very low densities are predicted in cold areas of Ar-
Fig. 4. Prospective distribution and abundance of glassy winged sharpshooter below 2,000 m during 1984Ð2003 using theGutierrez et al. (2011) model: (a) average log10 cumulative new adults/vine/year in the absence of natural enemies, and (b)average cumulative new adult glassy-winged sharpshooter/grapevine/year (arithmetic scale) after the action of the para-sitoids G. ashmeadi and G. triguttatus. (Image references: http://www.acgov.org/ cda/awm/agprograms/pestexclusion/sharpshooter.htm and http://biocontrol.ucr.edu/irvin/ California_agriculture.pdf).
400 ENVIRONMENTAL ENTOMOLOGY Vol. 42, no. 3
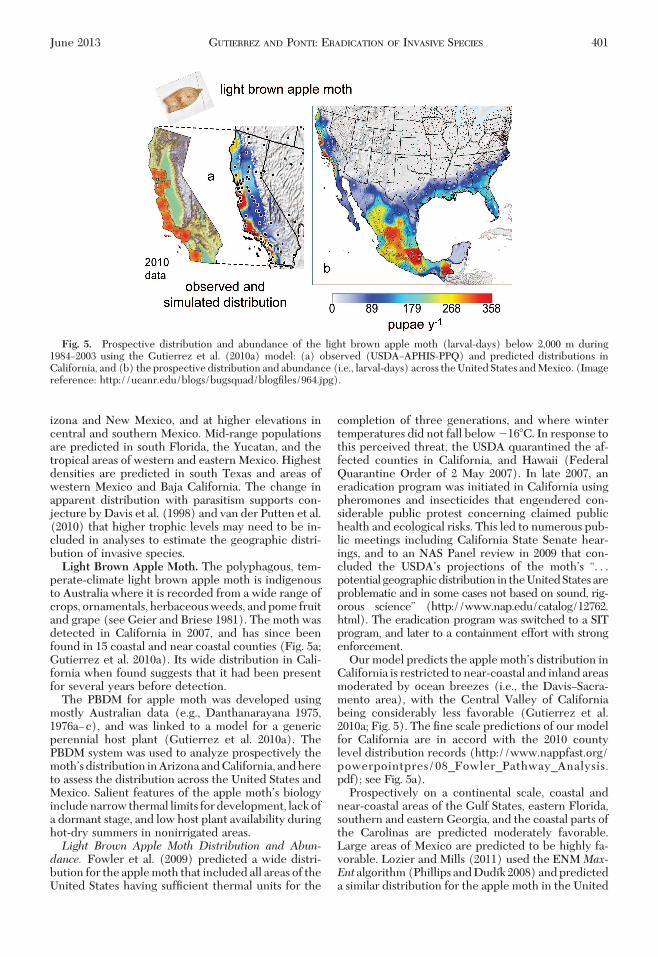
izona and New Mexico, and at higher elevations incentral and southern Mexico. Mid-range populationsare predicted in south Florida, the Yucatan, and thetropical areas of western and eastern Mexico. Highestdensities are predicted in south Texas and areas ofwestern Mexico and Baja California. The change inapparent distribution with parasitism supports con-jecture by Davis et al. (1998) and van der Putten et al.(2010) that higher trophic levels may need to be in-cluded in analyses to estimate the geographic distri-bution of invasive species.Light Brown Apple Moth. The polyphagous, tem-
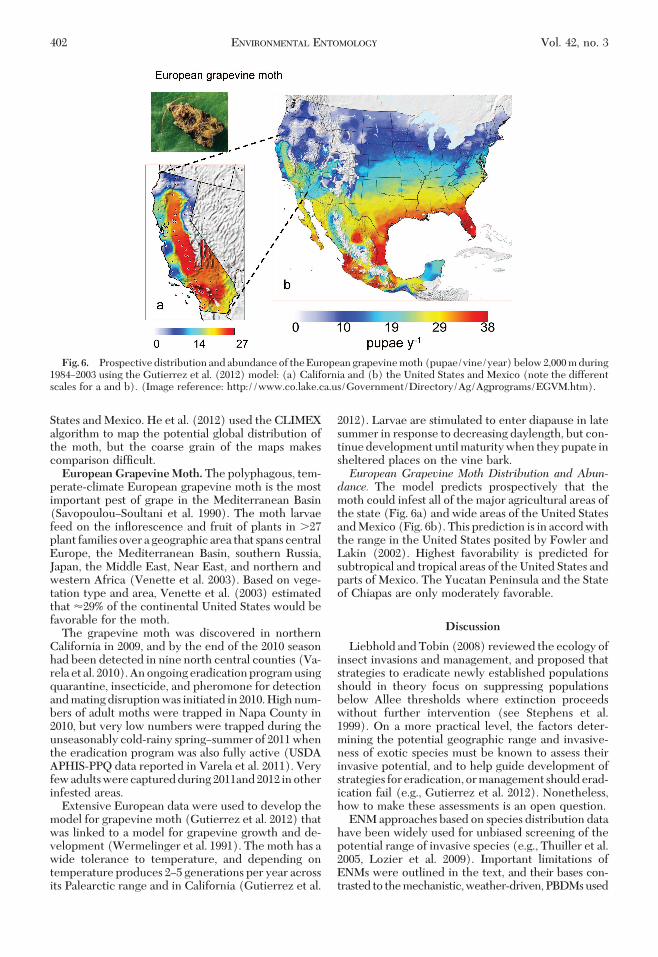
perate-climate light brown apple moth is indigenousto Australia where it is recorded from a wide range ofcrops, ornamentals, herbaceous weeds, and pome fruitand grape (see Geier and Briese 1981). The moth wasdetected in California in 2007, and has since beenfound in 15 coastal and near coastal counties (Fig. 5a;Gutierrez et al. 2010a). Its wide distribution in Cali-fornia when found suggests that it had been presentfor several years before detection.
The PBDM for apple moth was developed usingmostly Australian data (e.g., Danthanarayana 1975,1976aÐc), and was linked to a model for a genericperennial host plant (Gutierrez et al. 2010a). ThePBDM system was used to analyze prospectively themothÕsdistribution inArizonaandCalifornia, andhereto assess the distribution across the United States andMexico. Salient features of the apple mothÕs biologyinclude narrow thermal limits for development, lack ofa dormant stage, and low host plant availability duringhot-dry summers in nonirrigated areas.Light Brown Apple Moth Distribution and Abun-dance. Fowler et al. (2009) predicted a wide distri-bution for the apple moth that included all areas of theUnited States having sufÞcient thermal units for the
completion of three generations, and where wintertemperatures did not fall below �16�C. In response tothis perceived threat, the USDA quarantined the af-fected counties in California, and Hawaii (FederalQuarantine Order of 2 May 2007). In late 2007, aneradication program was initiated in California usingpheromones and insecticides that engendered con-siderable public protest concerning claimed publichealth and ecological risks. This led to numerous pub-lic meetings including California State Senate hear-ings, and to an NAS Panel review in 2009 that con-cluded the USDAÕs projections of the mothÕs “. . .potential geographicdistribution in theUnitedStatesareproblematic and in some cases not based on sound, rig-orous science” (http://www.nap.edu/catalog/12762.html). The eradication program was switched to a SITprogram, and later to a containment effort with strongenforcement.
Our model predicts the apple mothÕs distribution inCalifornia is restricted to near-coastal and inland areasmoderated by ocean breezes (i.e., the DavisÐSacra-mento area), with the Central Valley of Californiabeing considerably less favorable (Gutierrez et al.2010a; Fig. 5). The Þne scale predictions of our modelfor California are in accord with the 2010 countylevel distribution records (http://www.nappfast.org/powerpointpres/08_Fowler_Pathway_Analysis.pdf); see Fig. 5a).
Prospectively on a continental scale, coastal andnear-coastal areas of the Gulf States, eastern Florida,southern and eastern Georgia, and the coastal parts ofthe Carolinas are predicted moderately favorable.Large areas of Mexico are predicted to be highly fa-vorable. Lozier and Mills (2011) used the ENM Max-Ent algorithm (Phillips and Dudõk 2008) and predicteda similar distribution for the apple moth in the United
Fig. 5. Prospective distribution and abundance of the light brown apple moth (larval-days) below 2,000 m during1984Ð2003 using the Gutierrez et al. (2010a) model: (a) observed (USDAÐAPHIS-PPQ) and predicted distributions inCalifornia, and (b) the prospective distribution and abundance (i.e., larval-days) across the United States and Mexico. (Imagereference: http://ucanr.edu/blogs/bugsquad/blogÞles/964.jpg).
June 2013 GUTIERREZ AND PONTI: ERADICATION OF INVASIVE SPECIES 401
States and Mexico. He et al. (2012) used the CLIMEXalgorithm to map the potential global distribution ofthe moth, but the coarse grain of the maps makescomparison difÞcult.EuropeanGrapevineMoth. The polyphagous, tem-
perate-climate European grapevine moth is the mostimportant pest of grape in the Mediterranean Basin(SavopoulouÐSoultani et al. 1990). The moth larvaefeed on the inßorescence and fruit of plants in �27plant families over a geographic area that spans centralEurope, the Mediterranean Basin, southern Russia,Japan, the Middle East, Near East, and northern andwestern Africa (Venette et al. 2003). Based on vege-tation type and area, Venette et al. (2003) estimatedthat �29% of the continental United States would befavorable for the moth.
The grapevine moth was discovered in northernCalifornia in 2009, and by the end of the 2010 seasonhad been detected in nine north central counties (Va-rela et al. 2010). An ongoing eradication program usingquarantine, insecticide, and pheromone for detectionand mating disruption was initiated in 2010. High num-bers of adult moths were trapped in Napa County in2010, but very low numbers were trapped during theunseasonably cold-rainy springÐsummer of 2011 whenthe eradication program was also fully active (USDAAPHIS-PPQ data reported in Varela et al. 2011). Veryfewadultswerecapturedduring2011and2012 inotherinfested areas.
Extensive European data were used to develop themodel for grapevine moth (Gutierrez et al. 2012) thatwas linked to a model for grapevine growth and de-velopment (Wermelinger et al. 1991). The moth has awide tolerance to temperature, and depending ontemperature produces 2Ð5 generations per year acrossits Palearctic range and in California (Gutierrez et al.
2012). Larvae are stimulated to enter diapause in latesummer in response to decreasing daylength, but con-tinue development until maturity when they pupate insheltered places on the vine bark.European Grapevine Moth Distribution and Abun-dance. The model predicts prospectively that themoth could infest all of the major agricultural areas ofthe state (Fig. 6a) and wide areas of the United Statesand Mexico (Fig. 6b). This prediction is in accord withthe range in the United States posited by Fowler andLakin (2002). Highest favorability is predicted forsubtropical and tropical areas of the United States andparts of Mexico. The Yucatan Peninsula and the Stateof Chiapas are only moderately favorable.
Discussion
Liebhold and Tobin (2008) reviewed the ecology ofinsect invasions and management, and proposed thatstrategies to eradicate newly established populationsshould in theory focus on suppressing populationsbelow Allee thresholds where extinction proceedswithout further intervention (see Stephens et al.1999). On a more practical level, the factors deter-mining the potential geographic range and invasive-ness of exotic species must be known to assess theirinvasive potential, and to help guide development ofstrategies foreradication,ormanagement shoulderad-ication fail (e.g., Gutierrez et al. 2012). Nonetheless,how to make these assessments is an open question.
ENM approaches based on species distribution datahave been widely used for unbiased screening of thepotential range of invasive species (e.g., Thuiller et al.2005, Lozier et al. 2009). Important limitations ofENMs were outlined in the text, and their bases con-trasted to the mechanistic, weather-driven, PBDMs used
Fig. 6. Prospective distribution and abundance of the European grapevine moth (pupae/vine/year) below 2,000 m during1984Ð2003 using the Gutierrez et al. (2012) model: (a) California and (b) the United States and Mexico (note the differentscales for a and b). (Image reference: http://www.co.lake.ca.us/Government/Directory/Ag/Agprograms/EGVM.htm).
402 ENVIRONMENTAL ENTOMOLOGY Vol. 42, no. 3
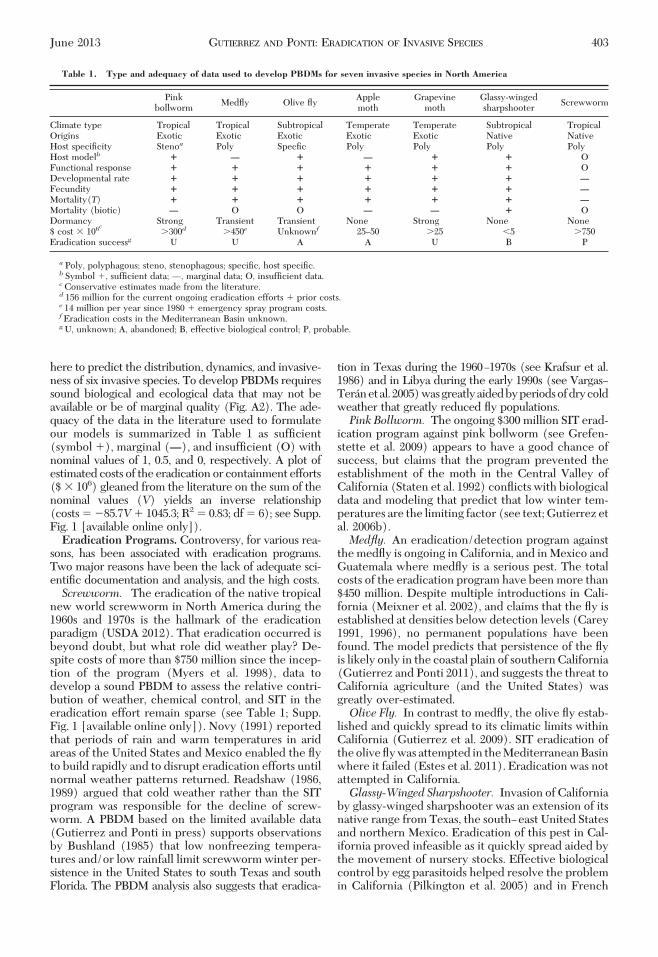
here to predict the distribution, dynamics, and invasive-ness of six invasive species. To develop PBDMs requiressound biological and ecological data that may not beavailable or be of marginal quality (Fig. A2). The ade-quacy of the data in the literature used to formulateour models is summarized in Table 1 as sufÞcient(symbol �), marginal (—), and insufÞcient (O) withnominal values of 1, 0.5, and 0, respectively. A plot ofestimated costs of the eradication or containment efforts($ � 106) gleaned from the literature on the sum of thenominal values (V) yields an inverse relationship(costs � �85.7V� 1045.3; R2 � 0.83; df � 6); see Supp.Fig. 1 [available online only]).Eradication Programs. Controversy, for various rea-
sons, has been associated with eradication programs.Two major reasons have been the lack of adequate sci-entiÞc documentation and analysis, and the high costs.Screwworm. The eradication of the native tropical
new world screwworm in North America during the1960s and 1970s is the hallmark of the eradicationparadigm (USDA 2012). That eradication occurred isbeyond doubt, but what role did weather play? De-spite costs of more than $750 million since the incep-tion of the program (Myers et al. 1998), data todevelop a sound PBDM to assess the relative contri-bution of weather, chemical control, and SIT in theeradication effort remain sparse (see Table 1; Supp.Fig. 1 [available online only]). Novy (1991) reportedthat periods of rain and warm temperatures in aridareas of the United States and Mexico enabled the ßyto build rapidly and to disrupt eradication efforts untilnormal weather patterns returned. Readshaw (1986,1989) argued that cold weather rather than the SITprogram was responsible for the decline of screw-worm. A PBDM based on the limited available data(Gutierrez and Ponti in press) supports observationsby Bushland (1985) that low nonfreezing tempera-tures and/or low rainfall limit screwworm winter per-sistence in the United States to south Texas and southFlorida. The PBDM analysis also suggests that eradica-
tion in Texas during the 1960Ð1970s (see Krafsur et al.1986) and in Libya during the early 1990s (see VargasÐTeranetal.2005)wasgreatlyaidedbyperiodsofdrycoldweather that greatly reduced ßy populations.Pink Bollworm. The ongoing $300 million SIT erad-
ication program against pink bollworm (see Grefen-stette et al. 2009) appears to have a good chance ofsuccess, but claims that the program prevented theestablishment of the moth in the Central Valley ofCalifornia (Staten et al. 1992) conßicts with biologicaldata and modeling that predict that low winter tem-peratures are the limiting factor (see text; Gutierrez etal. 2006b).Medfly. An eradication/detection program against
the medßy is ongoing in California, and in Mexico andGuatemala where medßy is a serious pest. The totalcosts of the eradication program have been more than$450 million. Despite multiple introductions in Cali-fornia (Meixner et al. 2002), and claims that the ßy isestablished at densities below detection levels (Carey1991, 1996), no permanent populations have beenfound. The model predicts that persistence of the ßyis likely only in the coastal plain of southern California(Gutierrez and Ponti 2011), and suggests the threat toCalifornia agriculture (and the United States) wasgreatly over-estimated.Olive Fly. In contrast to medßy, the olive ßy estab-
lished and quickly spread to its climatic limits withinCalifornia (Gutierrez et al. 2009). SIT eradication ofthe olive ßy was attempted in the Mediterranean Basinwhere it failed (Estes et al. 2011). Eradication was notattempted in California.Glassy-Winged Sharpshooter. Invasion of California
by glassy-winged sharpshooter was an extension of itsnative range from Texas, the southÐeast United Statesand northern Mexico. Eradication of this pest in Cal-ifornia proved infeasible as it quickly spread aided bythe movement of nursery stocks. Effective biologicalcontrol by egg parasitoids helped resolve the problemin California (Pilkington et al. 2005) and in French
Table 1. Type and adequacy of data used to develop PBDMs for seven invasive species in North America
Pinkbollworm
Medßy Olive ßyApplemoth
Grapevinemoth
Glassy-wingedsharpshooter
Screwworm
Climate type Tropical Tropical Subtropical Temperate Temperate Subtropical TropicalOrigins Exotic Exotic Exotic Exotic Exotic Native NativeHost speciÞcity Stenoa Poly SpecÞc Poly Poly Poly PolyHost modelb � — � — � � OFunctional response � � � � � � ODevelopmental rate � � � � � � —Fecundity � � � � � � —Mortality(T) � � � � � � —Mortality (biotic) — O O — — � ODormancy Strong Transient Transient None Strong None None$ cost � 106c �300d �450e Unknownf 25Ð50 �25 �5 �750Eradication successg U U A A U B P
a Poly, polyphagous; steno, stenophagous; speciÞc, host speciÞc.b Symbol �, sufÞcient data; Ñ, marginal data; O, insufÞcient data.cConservative estimates made from the literature.d 156 million for the current ongoing eradication efforts � prior costs.e 14 million per year since 1980 � emergency spray program costs.f Eradication costs in the Mediterranean Basin unknown.gU, unknown; A, abandoned; B, effective biological control; P, probable.
June 2013 GUTIERREZ AND PONTI: ERADICATION OF INVASIVE SPECIES 403
Polynesia (see Gutierrez et al. 2011). In contrast toother eradication efforts, the costs of the programwere relatively low.Light BrownAppleMoth. A $100 million eradication
effort was proposed for light brown apple moth inCalifornia based on a predicted wide distribution andhigh economic damage (Fowler et al. 2009, see text).The eradication program was abandoned, and yet nooutbreaks of the moth have been reported in Califor-nia (Wang et al. 2012, N.J. Mills personal communi-cation).Theobservedandpredictedgeographic rangeof the moth remains primarily near the coast (Guti-errez et al. 2010a).EuropeanGrapevineMoth. Theongoingeradication
program against European grapevine moth in Califor-nia seeks to eradicate the moth while its distributionis relatively limited. If eradication fails, the range ofthe moth will be very large (Fig. 6). However, theEuropean experience has shown that the pest is easilymanaged, albeit with associated increases in produc-tion costs and environmental damage (see Gutierrezet al. 2012).The Biology Matters.While the PBDMs were able
to predict prospectively the geographic range of thesix invasive species in our study, no set of biologicaltraits emerged that a priori would enable forecastingtheir invasiveness, much less their geographicranges. The geographic patterns of prospective fa-vorability of the species across North America arecheckered. Focusing on California, subtropical andtemperate species such as olive ßy, glassy-wingedsharpshooter, apple moth, and grapevine moth readilyestablished but in different areas of the state, while thetropical pink bollworm established only in frost-freedesert areas. Establishment of the tropical medßy ap-pears tenuous in coastal southern California, and yetits observed establishment is predicted in Italy (seeGutierrez and Ponti 2011) and southern Mexico/Gua-temala (this study).
Dormancy may enable species to survive adverseperiods (see Nechols et al. 1999), but it occurs in onlytwo of our six species: the pink bollworm and Euro-pean grapevine moth. Dormant pink bollworm larvaeare cold susceptible limiting the pestÕs northwardrange, while a combination of unfavorable high tem-peratures and daylength may affect diapause devel-opment (see Gutierrez et al. 1981) limiting its geo-graphic range in tropical areas (e.g., the Yucatan). Incontrast, dormant grapevine moth pupae are cold tol-erant and have wide thermal limits that enable the pestto invade a wide variety of climatic regions. The trop-ical medßy and subtropical olive ßy lack a true dor-mant stage but may enter reproductive quiescencewhen hosts densities are low, but only olive ßy wasable to establish widely in California because of itswider thermal limits.
A common thread across the invasive species stud-ied is that decisions to initiate eradication or contain-ment efforts were often not based on sound prospec-tive analyses of the factors determining the potentialdistribution and invasiveness. Lorraine (1991) cap-tured the essence of the problem in a study of the
medßy eradication program in California, concludingthat decision makers were unable to determine im-portant areas of uncertainty, identify and interpretfeedback (expert opinion), and respond adaptively tothe evolving problem. Discussions with scientists ingovernment agencies responsible for eradication pro-grams suggests the agencies often lack the ßexibleadministrative structure to allow their scientists thefreedom to inform agency decision making. Our ex-tensive experience with government agencies respon-sible for the eradication or containment programsstrongly suggests a distrust of non-inhouse analyses.Furthermore, eradication or containment programsare often implemented using militaristic metaphors todescribe the problem and control tactics; metaphorsthat often hinder the development of realistic man-agement and conservation goals (Larson 2005).
In the absence of sound analyses of the dominantfactors determining the distribution and abundance ofinvasive species, claims of eradication need (e.g., lightbrown apple moth in California; Gutierrez et al.2010a) or of success (e.g., medßy in California, Guti-errez and Ponti 2011) may not hold up to scientiÞcscrutiny, and at times may be exercises that appear tosucceed (e.g., pink bollworm in the Central Valley ofCalifornia; Gutierrez et al. 2006b, Grefenstette et al.2009), or may succeed after sufÞcient investment ofresources (e.g., screwworm; Krafsur et al. 1986, USDA2012, Gutierrez and Ponti in press). We propose thatthe Þeld of invasion biology has matured sufÞcientlyso that realistic prospective analyses of exotic species,be they ENM or PBDM based, can be made in a timelymanner and used to help develop science based erad-ication or containment policies and strategies. Wefavor the PBDM approach because the models serveas a dynamic library of the biology as it becomesavailable, and can be used to develop testable man-agement scenarios (e.g., Gutierrez et al. 2012). As aÞnal plea in a time of diminishing budgets, we arereminded of Sir Ernest RutherfordÕs (Nobel Laureatein Chemistry) admonition: “Gentlemen, we have runout of money. It is time to start thinking.”
Acknowledgments
We are grateful to the Þve reviewers whose criticisms andsuggestions helped guide the development of the article. Theforbearance of Editor E. Alan Cameron during the arduousAugean Þfth task effort to pare the article requires specialmention. Continued thanks are due M. Neteler (FondazioneEdmund MachÐCentro Ricerca e Innovazione, Trento, Italy,http://gis.fem-environment.eu) and the international net-work of co-developers for maintaining the GRASS software,and making it available to the scientiÞc community. Theresearch was supported by the Center for the Analysis ofSustainable Agricultural Systems (CASAS Global), Kensing-ton, CA (http://cnr.berkeley.edu/ casas/); and a Marie Cu-rie International Reintegration Grant within the seventhEuropean Community Framework Program (project num-ber: 224091; acronym: GlobalChangeBiology). No extramuralfunding for the work came from United States sources. Im-ages of the various species were copied from open sources onthe Internet, and are acknowledged in the Þgure legends.
404 ENVIRONMENTAL ENTOMOLOGY Vol. 42, no. 3
References Cited
Andrewartha H. G., and L. C. Birch. 1954. The distributionand abundance of animals. University of Chicago Press,Chicago, IL.
Balachowski, M. 1950. Sur lÕorigine de la Mouche de fruits(Ceratitis capitata Wied.). CR. Acad. Agric. France 36:259Ð362.
Barlow, N. D. 1999. Models in biological control: a Þeldguide, pp. 43Ð70. In B. A. Hawkins and H. V. Cornell(eds.), Theoretical Approaches to Biological Control.Cambridge University Press, Cambridge, United King-dom.
Beaumont, L. J., R. V. Gallagher,W. Thuiller, P. O.Downey,M.R.Leishman, andL.Hughes. 2009. Different climaticenvelopes among invasive populations may lead to underestimations of current and future biological invasions.Diversity Distrib. 15: 409Ð420.
Bieri, M., J. Baumgartner, G. Bianchi, V. Delucchi, and R.von Arx. 1983. Development and fecundity of pea aphid(Acyrthosiphon pisum Harris) as affected by constanttemperatures andbypeavarieties.Mitt. Schwei.Entomol.Ges. 56: 163Ð171.
Blua, M. J., R. A. Redak, D.J.W. Morgan, and H. S. Costa.2001. Seasonal ßight activity of twoHomalodisca species(Homoptera: Cicadellidae) that spread Xylella fastidiosain Southern California. J. Econ. Entomol. 94: 1506Ð1510.
Briere, J. F., P. Pracros, A. Y. Le Roux, and J. S. Pierre. 1999.A novel rate model of temperature-dependent develop-ment for arthropods. Environ. Entomol. 28: 22Ð29.
Burk, T., and C. O. Calkins. 1983. Medßy mating behaviorand control strategies. Fla. Entomol. 66: 3Ð18.
Bushland, R. C. 1985. Eradication program in the south-western United States. Misc. Publ. Entomol. Soc. Am. 62:12Ð15.
Carey, J. R. 1991. Establishment of the Mediterranean fruitßy in California. Science 253: 1369Ð1373.
Carey, J. R. 1996. The incipient Mediterranean fruit ßy pop-ulation in California: implications for invasion biology.Ecology 77: 1690Ð1697.
(CDFA) California Department of Food and Agriculture.2003. PierceÕs disease program report to the legislature,May 2003. Calif. Dep. Food and Agric., 8Ð11 December,2003, San Diego, CA.
Chu,C.C., T. J.Henneberry, R. C.Weddle, E. T. Natwick, J. R.Carson,C.Valenzuela, S.L.Birdsall, andR.T. Staten. 1996.Reduction of pink bollworm (Lepidoptera: Gelechiidae)populations in the Imperial Valley, California, followingmandatory short-season cotton management systems. J.Econ. Entomol. 89: 175Ð182.
Danthanarayana, W. 1975. The bionomics, distribution andhost range of the light brown apple moth, Epiphyas post-vittana (Walk.) (Tortricidae). Aust. J. Zool. 23: 419Ð437.
Danthanarayana, W. 1976a. Diel and lunar ßight periodici-ties in the light brown apple moth, Epiphyas postvittana(Walker) (Tortricidae) and their possible adaptive sig-niÞcance. Aust. J. Zool. 24: 65Ð73.
Danthanarayana, W. 1976b. Flight thresholds and seasonalvariations in ßight activity of the light-brown apple moth,Epiphyas postvittana (Walk.) (Tortricidae), in Victoria,Australia. Oecologia 23: 271Ð282.
Danthanarayana, W. 1976c. Environmentally cued sizevariation in the light-brown apple moth, Epiphyas post-vittana (Walk.) (Tortricidae), and its adaptive value indispersal. Oecologia 26: 121Ð132.
Davis, A. J., L. S. Jenkinson, J. H. Lawton, B. Shorrocks, andS. Wood. 1998. Making mistakes when predicting shiftsin species range in response to global warming. Nature391: 783Ð786.
Di Cola, G., G. Gilioli, and J. Baumgartner. 1999. Mathe-matical models for age-structured population dynamics,pp. 503Ð534. InC. B. Huffaker and A. P. Gutierrez (eds.),Ecological Entomology, Second ed. Wiley, New York,NY.
Elith, J., and J. R. Leathwick. 2009. Species distributionmodels: ecological explanation and prediction acrossspace and time. Annu. Rev. Ecol. Evol. Syst. 40: 677Ð697.
Estes, A. M., D. Nestel, A. Belcari, A. Jessup, P. Rempoulakis,and A. P. Economopoulos. 2011. A basis for the renewalof sterile insect technique for the olive ßy, Bactroceraoleae (Rossi). J. Appl. Entomol. 136: 1Ð16.
Fischlin, A., G. F. Midgley, J. T. Price, R. Leemans, B. Gopal,C. Turley, M.D.A. Rounsevell, O. P. Dube, J. Tarazona,and A. A. Velichko. 2007. Ecosystems, their properties,goods, and services, pp. 211Ð272. In M. L. Parry, O. F.Canziani, J. P. Palutikof, P. J. van der Linden, and C. E.Hanson (eds.), Climate Change 2007: Impacts, Adapta-tion and Vulnerability. Contribution of Working Group IIto the Fourth Assessment Report of the Intergovernmen-tal Panel on Climate Change. Cambridge UniversityPress, Cambridge, United Kingdom.
Fowler, G., and K. Lakin. 2002. Risk assessment: vine moth,Lobesia botrana (Denis and Schiffermuller) (Lepidop-tera: Tortricidae), pp. 1Ð17. U.S. Dep. Agric.ÐAPHIS,Center for Plant Health Science and Technology (Inter-nal Report), Raleigh, NC.
Fowler, G., L. Garrett, E. A. Neeley, D. Borchert, and B.Spears. 2009. Economic analysis: risk to US apple, grape,orange and pear production from the light brown applemoth, Epiphyas postvittana (Walker). U.S. Dep. Agric.ÐAPHIS-PPQ-CPHST-PERAL. (http://www.aphis.usda.gov/plant_health/plant_pest_info/lba_moth/downloads/lbameconomicanalysis.pdf).
Frazer, B. D., and N. E. Gilbert. 1976. Coccinellids andaphids: a qualitative study of the impact of adult lady birds(Coleoptera: Coccinellidae) preying on Þeld populationsof pea aphids (Homoptera: Aphididae). J. Entomol. Soc.B. C. 73: 33Ð56.
Geier, P. W., and D. T. Briese. 1981. The light-brown applemoth, Epiphyas postvittana (Walker): a native leafrollerfostered by European settlement, pp. 131Ð155. In R.Kitching and R. Jones (eds.), The Ecology of Pests.CSIRO, Melbourne, Australia.
Gilbert, N., A. P. Gutierrez, B. D. Frazer, and R. E. Jones.1976. Ecological relationships. Freeman and Co., NewYork, NY.
Godfrey, L. 2004. Correction on GE cotton in California.Calif. Agric. 58: 132.
GRASS Development Team. 2011. Geographic ResourcesAnalysis Support System (GRASS) Software, Version6.4.0. Open Source Geospatial Foundation. (http://grass.osgeo.org).
Grefenstette, B., O. El-Lissy, and R. T. Staten. 2009. Pinkbollworm eradication plan in the U.S. United States De-partment of Agriculture, (http://www.aphis.usda.gov/plant_health/plant_pest_info/cotton_pests/downloads/pbw-erad-plan2-09.pdf).
Gutierrez, A. P. 1992. The physiological basis of ratio de-pendent theory. Ecology 73: 1529Ð1553.
Gutierrez,A.P. 1996. Applied population ecology: a supply-demand approach. Wiley, New York, NY.
Gutierrez, A. P., and J. U. Baumgartner. 1984. Multitrophiclevel models of predator-prey energetics: II. A realisticmodel of plant-herbivore-parasitoid-predator interac-tions. Can. Entomol. 116: 933Ð949.
Gutierrez, A. P., and S. Ponsard. 2006. Physiologically baseddemographics of Bt cottonÐpest interactions: I. Pink boll-
June 2013 GUTIERREZ AND PONTI: ERADICATION OF INVASIVE SPECIES 405
worm resistance, refuge and risk. Ecol. Model. 191: 346Ð359.
Gutierrez, A. P., and L. Ponti. 2011. Assessing the invasivepotential of the Mediterranean fruit ßy in California andItaly. Biol. Invasions 13: 2661Ð2676.
Gutierrez, A. P., and L. Ponti. (in press). Eradication of thenew world screwworm: effects of temperature and rain-fall. Agric. For. Entomol.
Gutierrez,A.P.,D.E.Havenstein,H.A.Nix, andP.A.Moore.1974. The ecology of Aphis craccivora Koch and subter-ranean clover stunt virus. III. A regional perspective ofthe phenology and migration of the cowpea aphid.J. Appl. Ecol. 11: 21Ð35.
Gutierrez, A. P., G.D. Butler, Jr., Y.Wang, andD.Westphal.1977. The interaction of pink bollworm (Lepidoptera:Gelichiidae), cotton, and weather: a detailed model. Can.Entomol. 109: 1457Ð1468.
Gutierrez, A. P., G. D. Butler, Jr., and C. K. Ellis. 1981. Pinkbollworm: diapause induction and termination in relationto ßuctuating temperatures and decreasing photophases.Environ. Entomol. 10: 936Ð942.
Gutierrez, A. P., N. J. Mills, S. J. Schreiber, and C. K. Ellis.1994. A physiologically based tritrophic perspective onbottom-up-top-down regulation of populations. Ecology75: 2227Ð2242.
Gutierrez, A. P.,M. J. Pitcairn, C. K. Ellis, N. Carruthers, andR. Ghezelbash. 2005. Evaluating biological control ofyellow starthistle (Centaurea solstitialis) in California: aGIS based supplyÐdemand demographic model. Biol.Control 34: 115Ð131.
Gutierrez, A. P., J. J. Adamczyk, S. Ponsard, and C. K. Ellis.2006a. Physiologically based demographics of Bt cottonÐpest interactions II. Temporal refuges, natural enemyinteractions. Ecol. Model. 191: 360Ð382.
Gutierrez, A. P., T. d’Oultremont, C. K. Ellis, and L. Ponti.2006b. Climatic limits of pink bollworm in Arizona andCalifornia: effects of climate warming. Acta Oecol. 30:353Ð364.
Gutierrez, A. P., L. Ponti, C. K. Ellis, and T. d’Oultremont.2006c. Analysis of climate effects on agricultural systems,CEC-500-2005-188-SF. Report from the CaliforniaClimate Change Center. (http://www.energy.ca.gov/2005publications/CEC-500-2005-188/CEC-500-2005-188-SF.PDF).
Gutierrez, A. P., K. M. Daane, L. Ponti, V. M. Walton, andC. K. Ellis. 2008a. Prospective evaluation of the biolog-ical control of the vine mealybug: refuge effects andclimate. J. Appl. Ecol. 45: 524Ð536.
Gutierrez, A. P., L. Ponti, T. d’Oultremont, and C. K. Ellis.2008b. Climate change effects on poikilotherm tritrophicinteractions. Clim. Change 87: 167Ð192.
Gutierrez, A. P., L. Ponti, and Q. A. Cossu. 2009. Effects ofclimate warming on olive and olive ßy (Bactrocera oleae(Gmelin)) in California and Italy. Clim. Change 95: 195Ð217.
Gutierrez,A.P.,N. J.Mills, andL.Ponti. 2010a. Limits to thepotential distribution of light brown apple moth in Ari-zonaÐCalifornia based on climate suitability and hostplant availability. Biol. Invasions 12: 3319Ð3331.
Gutierrez, A. P., L. Ponti, and G. Gilioli. 2010b. Climatechange effects on plant-pest-natural enemy interactions,pp. 209Ð237. InD. Hillel and C. Rosenzweig (eds.), Hand-book of Climate Change and Agroecosystems: Impacts,Adaptation, and Mitigation. Imperial College Press, Lon-don, United Kingdom.
Gutierrez, A. P., L. Ponti, M. Hoddle, R.P.P. Almeida, andN. A. Irvin. 2011. Geographic distribution and relativeabundance of the invasive glassy-winged sharpshooter:
effects of temperature and egg parasitoids. Environ. En-tomol. 40: 755Ð769.
Gutierrez, A. P., L. Ponti, M. L. Cooper, G. Gilioli, J.Baumgartner, andC.Duso. 2012. Prospectiveanalysis ofthe invasive potential of the European grapevine moth(Lobesia botrana (Den. & Schiff.)) in California. Agric.For. Entomol. 14: 225Ð238.
Hawkins, B. A., and H. V. Cornell. 1999. Theoretical ap-proaches to biological control. Cambridge UniversityPress, Cambridge, United Kingdom.
He, S., S. P. Worner, and T. Ikeda. 2012. Modeling the po-tential global distribution of light brown apple mothEpiphyas postvittana (Lepidoptera: Tortricidae) usingCLIMEX. J. AsiaÐPaciÞc Entomol. 15: 479Ð485.
Hickler, T., S. Fronzek, M. B. Araujo, O. Schweiger, W.Thuiller, and M. T. Sykes. 2009. An ecosystem model-based estimate of changes in water availability differsfrom water proxies that are commonly used in speciesdistribution models. Global Ecol. Biogeogr. 18: 304Ð313.
Hummel, N. A., F. G. Zalom, N. C. Toscano, P. Burman, andC.Y.S. Peng. 2006. Seasonal patterns of female Homalo-disca coagulata (Say) (Hemiptera: Cicadellidae) repro-ductive physiology in Riverside, California. Environ. En-tomol. 35: 901Ð906.
Johnson, M. W., X. Wang, X., H. Nadel, S. B. Opp, K. Lynn–Patterson, J. Stewart–Leslie, and K. M. Daane. 2011.High temperature affects olive fruit ßy populations inCaliforniaÕs Central Valley. Calif. Agric. 65: 29Ð3.
Knipling, E. F.. 1955. Possibilities of insect control or erad-ication through the use of sexually sterile males. J. Econ.Entomol. 48: 459Ð462.
Krafsur, E. S., H. Townson, G. Davidson, and C. F. Curtis.1986. Screwworm eradication is what it seems. Nature323: 495Ð496.
Larson, B.M.H. 2005. The war of the roses: demilitarizinginvasion biology. Front. Ecol. Environ. 3: 495Ð500.
Lauziere, I., and M. Setamou. 2009. Suitability of differenthost plants for oviposition and development of Homalo-disca vitripennis (Hemiptera: Cicadellidae) and its impli-cation on mass rearing. Ann. Entomol. Soc. Am. 102:642Ð649.
Liebhold, A. M., and P. C. Tobin. 2008. Population ecologyof insect invasions and their management. Annu. Rev.Entomol. 53: 387Ð408.
Lorraine, H. 1991. The California 1980 Medßy eradicationprogram: an analysis of decision making under nonrou-tine conditions. Tech. Forecast. Soc. Change 40: 1Ð32.
Lozier, J. D., P. Aniello, andM. J. Hickerson. 2009. Predict-ing the distribution of Sasquatch in western North Amer-ica: anything goes with ecological niche modeling. J. Bio-geogr. 36: 1623Ð1627.
Lozier, J. D., and N. J. Mills. 2011. Predicting the potentialinvasive range of the light brown apple moth (Epiphyaspostvittana) using biologically informed and correlativespecies models. Biol. Invasions 13: 2409Ð2421.
Marcelis,L.F.M., andE.Heuvelink. 2007. Concepts of mod-elling carbon allocation among plant organs, pp. 103Ð111.In J. Vos, L.F.M. Marcelis, P.H.B. de Visser, P.C. Struik,and J.B. Evers (eds.), Functional-Structural Plant Mod-elling in Crop Production. Springer, Dordrecht, TheNetherlands.
Meixner, M. D., B. A.McPheron, J. G. Silva, G. E. Gasparich,andW.S. Sheppard. 2002. The Mediterranean fruit ßy inCalifornia: evidence for multiple introductions and per-sistent populations based on microsatellite and mitochon-drial DNA variability. Mol. Ecol. 11: 891Ð899.
Mizell III, R. F., C. Tipping, P. C. Andersen, B. V. Brodbeck,W. B. Hunter, and T. D. Northfield. 2008. Behavioral
406 ENVIRONMENTAL ENTOMOLOGY Vol. 42, no. 3
model for Homalodisca vitripennis (Hemiptera: Cicadel-lidae): optimization of host plant utilization and manage-ment implications. Environ. Entomol. 37: 1049Ð1062.
Myers, J.H.,A. Savoie, andE.vanRanden. 1998. Eradicationand pest management. Annu. Rev. Entomol. 43: 471Ð491.
Myers, J.H.,D.Simberloff,A.M.Kuris, and J.R.Carey. 2000.Eradication revisited: dealing with exotic species. TrendsEcol. Evol. 15: 316Ð320.
Nechols, J. R., M. J. Tauber, C. A. Tauber, and S. Masaki.1999. Adaptations to hazardous seasonal conditions: dor-mancy, migration, and polyphenism, pp. 159Ð200. InC. B.Huffaker and A. P. Gutierrez (eds.), Ecological Entomol-ogy, Second ed. Wiley, New York, NY.
Novy, J. E. 1991. Screwworm control and eradication in thesouthern United States of America. World Animal Re-view. (http://www.fao.org/ag/aga/agap/frg/feedback/war/u4220b/u4220b0a.htm).
Oerke, E. C., and H. W. Dehne. 2004. Safeguarding pro-duction losses in major crops and the role of crop pro-tection. Crop Prot. 23: 275Ð285.
Phillips, S. J., and M. Dudık. 2008. Modelling of speciesdistributions with Maxent: new extensions and a com-prehensive evaluation. Ecography 31: 161Ð175.
Pilkington, L. J., N. A. Irvin, E. A. Boyd, M. S. Hoddle, S. V.Triapitsyn, B. G. Carey,W. A. Jones, andD.J.W.Morgan.2005. Introduced parasitic wasps could control glassy-winged sharpshooter. Calif. Agric. 59: 223Ð228.
Pimentel, D., R. Zuniga, and D. Morrison. 2005. Update onthe environmental and economic costs associated withalien-invasive species in the United States. Ecol. Econ. 52:273Ð288.
Ponti, L., Q. A. Cossu, and A. P. Gutierrez. 2009a. Climatewarming effects on the Olea europaeaÐBactrocera oleaesystem in Mediterranean islands: Sardinia as an example.Global Change Biol. 15: 2874Ð2884.
Ponti, L., A. P. Gutierrez, and P. M. Ruti. 2009b. The olive-Bactrocera oleae (Diptera Tephritidae) system in theMediterranean Basin: a physiologically based analysisdriven by the ERA-40 climate data. Notiz. Prot. Piante(3rd series) 1: 113Ð128.
Purcell, A. H. 1997. Xylella fastidiosa, a regional problem orglobal threat? J. Plant Pathol. 79: 99Ð105.
Readshaw, J. L. 1986. Screwworm eradication a grand de-lusion? Nature 320: 407Ð410.
Readshaw, J. L. 1989. The inßuence of seasonal tempera-tures on the natural regulation of the screwworm, Co-chliomyia hominivorax, in the southern USA. Med. Vet.Entomol. 3: 159Ð167.
Regev, U., A. P. Gutierrez, S. J. Schreiber, andD. Zilberman.1998. Biological and economic foundations of renewableresource exploitation. Ecol. Econ. 26: 227Ð242.
Robinson, A. S. 2002. Mutations and their use in insect con-trol. Mutat. Res. 511: 113Ð132.
Rodrıguez, D., J. R. Cure, J. M. Cotes, A. P. Gutierrez, and F.Cantor. 2011. A coffee agroecosystem model. I. Growthand development of the coffee plant. Ecol. Model 222:3626Ð3639.
Savopoulou–Soultani, M., D. G. Stavridis, and M. E.Tzanakakis. 1990. Development and reproduction ofLobesia botrana on vine and olive inßorescences. Ento-mol. Hellenica 8: 29Ð35.
Severini,M., R. Alilla, S. Pesolillo, and J. Baumgartner. 2005.Grapevine and Lobesia botrana (lep. Tortricidae) phe-nology in the Castelli Romani area. Rev. Ital. Agromet. 3:34Ð39.
Soberon, J., and M. Nakamura. 2009. Niches and distribu-tional areas: concepts, methods, and assumptions. Proc.Natl. Acad. Sci. U.S.A. 106: 19644Ð19650.
Sorensen, J. T., and R. J. Gill. 1996. A range extension ofHomalodisca coagulata (Say) (Hemiptera: Clypeorrhyn-cha: Cicadellidae) to southern California. Pan-Pac. En-tomol. 72: 160Ð161.
Staten, R. T., R. W. Rosander, and D. F. Keaveny. 1992.Genetic control of cotton insects, 1992: the PBW as aworking programme, pp. 269Ð283. In Proceedings of anInternational Symposium on Management of Insect Pests,Vienna, Austria 19Ð23 October 1992.
Stephens, P. A.,W. J. Sutherland, andR. P. Freckleton. 1999.What is the Allee effect? Oikos 87: 185Ð190.
Stern, V., andV. Sevacherian. 1978. Long-range dispersal ofpink bollworm into the San Joaquin Valley. Calif. Agric.32: 4Ð5.
Stone, N. D., and A. P. Gutierrez. 1986. Pink bollworm con-trol in southwestern desert cotton. I. A Þeld-orientedsimulation model. Hilgardia 54: 1Ð24.
Sutherst, R. W., and G. F. Maywald. 1985. A computerizedsystem for matching climates in ecology. Agric. Ecosyst.Environ. 13: 281Ð299.
Sutherst, R. W., G. F. Maywald, and A. S. Bourne. 2007.Including species interactions in risk assessments forglobal change. Global Change Biol. 13: 1843Ð1859.
Tabashnik, B. E., M. S. Sisterson, P. C. Ellsworth, T. J. Den-nehy,L.Antilla,L.Liesner,M.Whitlow,R.T. Staten, J.A.Fabrick, and G. C. Unnithan. 2010. Suppressing resis-tance to Bt cotton with sterile insect releases. Nat. Bio-technol. 28: 1304Ð1307.
Thuiller,W.,D.M.Richardson,P.Pysek,G.F.Midgley,G.O.Hughes, andM.Rouget. 2005. Niche-based modelling asa tool for predicting the risk of alien plant invasions at aglobal scale. Global Change Biol. 11: 2234Ð2250.
Triapitsyn, S. V., and P. A. Phillips. 2000. First record ofGonatocerus triguttatus (Hymenoptera: Mymaridae)from eggs of Homalodisca coagualata (Homoptera: Ci-cadellidae) with notes on the distribution of the host. Fla.Entomol. 83: 200Ð203.
Turner, W. F., and H. N. Pollard. 1959. Life histories andbehavior of Þve insect vectors of phony peach disease.U.S. Dep. Agric. Tech. Bull. 1188: 28.
(USDA) United States Department of Agriculture. 2012.150 Years of making history: U.S. Dep. Agric.Õs 150thAnniversary. Agric. Res. Mag. 60: 10Ð19.
van den Bosch, R., and P. S. Messenger. 1973. Biologicalcontrol. Intext Educational Publishers, London, UnitedKingdom.
van der Putten, W. H., M. Macel, and M. E. Visser. 2010.Predicting species distribution and abundance responsesto climate change: why it is essential to include bioticinteractions across trophic levels. Phil. Trans. R. Soc. B.365: 2025Ð2034.
Vansickle, J. 1977. Attrition in distributed delay models.IEEE T. Syst. Man. Cyb. 7: 635Ð638.
Varela, L. G., R. J. Smith, andM. L. Cooper. 2011. Timing ofinsecticide treatments for European grapevine moth.(http://cenapa.ucdavis.edu/Þles/86251.pdf).
Varela, L. G., R.J. Smith, M. L. Cooper, and R.W. Hoenisch.2010. European grapevine moth, Lobesia botrana, inNapa Valley vineyards. Practical Winery and Vineyard,(http://www.practicalwinery.com/marapr10/moth1.htm).
Vargas–Teran, M., H. Hofmann, and N. Tweddle. 2005. Im-pact of screwworm eradication programmes using thesterile insect technique, pp. 629Ð650. In V. A. Dyck,J. Hendrichs, and A. S. Robinson (eds.), Sterile InsectTechnique. Principles and Practice in Area-Wide Inte-grated Pest Management. Springer, Dordrecht, TheNetherlands.
June 2013 GUTIERREZ AND PONTI: ERADICATION OF INVASIVE SPECIES 407
Venette, R. C., S. E. Naranjo, and W. D. Hutchison. 2000.Implications of larval mortality at low temperatures andhigh soil moistures for establishment of pink bollworm(Lepidoptera: Gelechiidae) in Southeastern UnitedStates cotton. Environ. Entomol. 29: 1018Ð1026.
Venette, R. C., E. E. Davis, M. DaCosta, H. Heisler, and M.Larson. 2003. Mini risk assessment: grape berry moth,Lobesia botrana (Denis & Schiffermuller) [Lepidoptera:Tortricidae]. U.S. Dep. Agric.ÐCAPS, (http://www.aphis.usda.gov/plant_health/plant_pest_info/pest_detection/downloads/pra/lbotranapra.pdf).
Wang, X. G., M. W. Johnson, K. M. Daane, and H. Nadel.2009. High summer temperatures affect the survival andreproduction of olive fruit ßy (Diptera: Tephritidae).Environ. Entomol. 38: 1496Ð1504.
Wang, X. G., K. Levy, N. J. Mills, and K. M. Daane. 2012.Light brown apple moth in California: a diversity of host
plants and indigenous parasitoids. Environ. Entomol. 41:81Ð90.
Watt, K.E.F. 1959. A mathematical model for the effects ofdensities of attacked and attacking species on the numberattacked. Can. Entomol. 91: 129Ð144.
Wells, J. M., B. C. Raju, H. Y. Hung, W. G. Weisburg, L. M.Paul, and D. J. Brenner. 1987. Xylella fastidiosa gen.nov., sp. nov: gram-negative, xylem-limited, fastidiousplant bacteria related to Xanthomonas spp. Int. J. Syst.Bacteriol. 37: 136Ð143.
Wermelinger, B., J. Baumgartner, and A. P. Gutierrez.1991. A demographic model of assimilation and allo-cation of carbon and nitrogen in grapevines. Ecol.Model 53: 1Ð26.
Received 16 January 2012; accepted 14 April 2013.
Appendix: A Review of PBDM
Overview
Tritrophic population dynamics models, includingthe physiologically based demographic modeling ap-proach (PBDM), were reviewed in Hawkins and Cor-nell (1999). Barlow (1999) proposed that PBDMs havelarge numbers of parameters and hence are difÞcult todevelop, but this is not the case. All of the models inthis study, except pink bollworm, were developedusing data in the literature. However, in the absenceof sufÞcient available data on a species, the modelstructure provides guidance as to the data to be col-lected, and this greatly shortens the process of modeldevelopment (see below). Data to parameterize thesubmodels may be obtained in a variety of ways withthe most direct one being laboratory age-speciÞc lifetable studies at different temperatures and gradientsof limiting factors as required. Such data enable cap-turing the effects of these factors on time varying vitalrates in the Þeld (e.g., daily) as driven by temperature,resource availability, and other factors. Observationson behavior may be critical and must be made.
Modeling is facilitated by the fact that the same dy-namics model and submodels for analogous processes inthe life histories are used across trophic levels (see be-low). The linkages between trophic levels encourages amodular structure permitting different combinations ofinteracting species to be implemented in a model runusing Boolean variables (e.g., Gutierrez et al. 2006aÐc,2008a, b, 2010b; Gutierrez and Ponti 2011). The analysesmaybeviewedfromtheperspectiveofanyspecies in thesystem. Population dynamics models developed in thismannermaybeviewedas time-varying life tables(sensu;Gilbert et al. 1976). The models were implemented inBorland Delphi Pascal.
The Dynamics Model
The time invariant and time-varying distributed-maturation time demographic models (see Vansickle
1977) were used to model the dynamics of all popu-lations in case studies be they plant or insect (see DiCola et al. 1999, pp. 523Ð524). The forcing variable istemperature (T), and time (t) is a day that from theperspective of the poikilotherm organisms is of vari-able length in physiological time units above its lowerthermal threshold. The numerical solution for thetime-varying model for the ith age class of a life stagewith i� 1, 2,. . . , k age classes (see Fig. A1) is equationA1 (see Severini et al. 2005).
ri t � 1 � ri t ��xt � k
Xt �ri� 1 t � rit �
�1 �Xt � ��it � 1 � Xt � 1
�xt � k �� [A1]
The state variable ri(t) is density as a rate that maybe in units of number or mass. Mean developmentaltime (X) in degree-days (dd) may vary on two con-secutive days (X(t),X(t�1)) because of nutrition andother factors (e.g., fertilizer for a plant or fruit age inpink bollworm). IfX is constant (i.e.,X(t)�X(t�1)),the model becomes the time-invariant form of themodel. �xtT is an increment of physiological age(x) (see below), and �it is the proportional agespeciÞc net loss rate that includes the rich biologyaffecting age class deaths, growth, predation, net im-migration, and other factors as required by the biologyof each species or stage. Immigration was not includedin our models. Births ßow into the Þrst age class (k�1, see below), and some individuals exit as deaths atmaximum age (from cohort k). The density of cohorti is Nit � rit � XTt/k, and the total density ina life stage (or population) is Nt � �
i � 1k Nit,
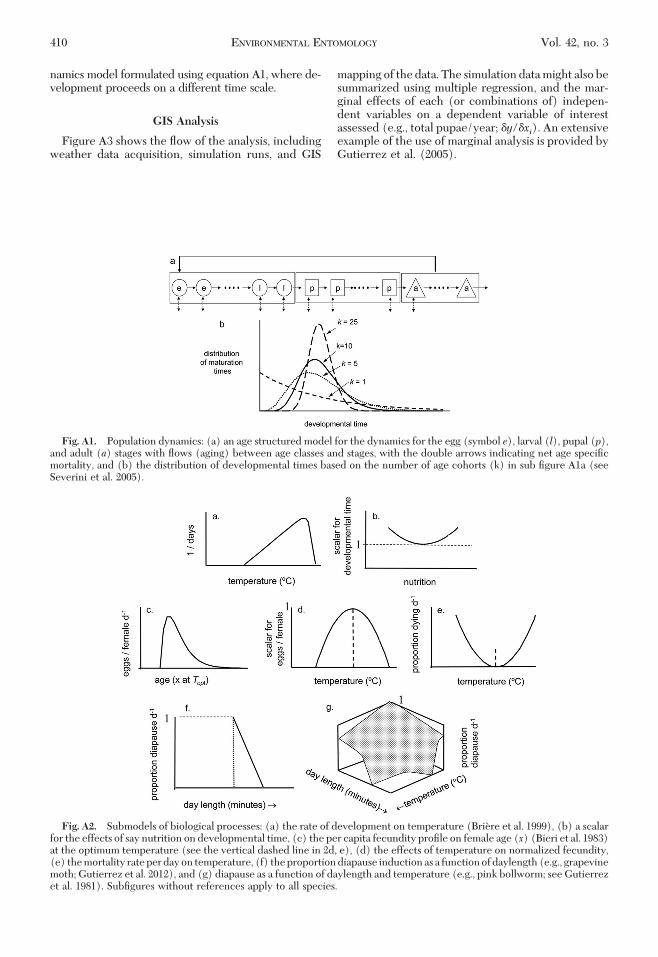
where k � X2/var, and var is the variance of observeddevelopmental times. One scheme for modeling theßow between ages and stages in the dynamics modelis illustrated in Fig. A1a, but other schemes may alsobe developed. Fig. A1b shows the distribution of de-velopmental times with different values of k.
408 ENVIRONMENTAL ENTOMOLOGY Vol. 42, no. 3
Submodels
SubÞgures in Fig. A2 lack numerical scales indicat-ing that the shapes of the functions are similar acrossspecies, albeit with different units.Developmental Rates and Time. The developmen-
tal rate is nonlinear with temperature (R(t(T)) (equa-tion A2 ; Fig. A2a; Briere et al. 1999), but can also beinßuenced by other factors.
RtT � 1/daysT �aTt � TL
1 � bT� TU
[A2]
VariablesaandbareÞttedconstantsandTLandTUarethe lower and upper temperature thresholds. A cohortinitiated at some time t0 completes development on
average when�t0
tRtTdt� 1. Average developmen-
tal time in dd is computed in the linear range of favor-able temperatures as X�dayT � Tt � TL). Dailyincrements of physiological time are computed as�xtT � RtTX.
Developmental times vary with temperature (equa-tion A2) but it may also vary with nutrition (e.g., fruitage for pink bollworm) that increases developmentaltime compared with the minimum time from the basescalar value of 1. A scalar function such as that illus-trated in Fig. A2b could be used to correct X(t(T)) inequation A1 for the effects of say nutrition or someother factor. In the time-varying form of the model,X(t(T)) may vary on daily or shorter time scales.
Growth and Reproduction
The Functional Response. All organisms are con-sumers, and the process of resource acquisition in themodels is demand driven (Gutierrez 1992, 1996, Guti-errez and Baumgartner 1984). The per capita resourceacquisition rate S is computed using the ratio-depen-dent functional response model (equation A3) at re-source (N) and consumer (C) densities, where D isthe per capita consumer demand, and � is the pro-portion of the resource that may be discovered during�t. The demand may be for photosynthate, water andnitrogen in plants, or prey biomass or hosts by highertrophic levels including the economic level (Regev etal. 1998). As appropriate for the biology, the per capitafunctional response model may be the parasitoid(equation A3i; Frazer and Gilbert, 1976) or predator(equation A3ii) forms of the model (see discussion inGutierrez 1996, p. 81). The predator form of the modelis related to WattÕs model (Watt 1959).
S � N� 1 � e�DC
N�1 � e
��N
DC�� (parasitoid form)
[A3i]
S � DC1 � e��N
DC (predator form)
[A3ii]
equations A3i and ii are type II models if � is constant,but type III if � is increasing on N (i.e., �(N)). Herewe focus on the parasitoid form, though similar argu-ments apply for the predator form.
To parameterize equation A3i, we assume for ex-position purposes that an herbivore female lays one ormore eggs per host (e.g., a parasitoid). If only oneprogeny survives per host, the supernumeraries areassumed to die. Further, assume that from life tablestudies females have a maximum average age-speciÞcoviposition proÞle at optimum temperature topt (i.e.,f(x, Topt)� eggs/female; at Topt and age x) (Fig. A2c;equation A4; Bieri et al.1983).
f x,Topt �ax
bx[A4]
The total eggs load (i.e.,D(t,T)) of the adult femalepopulation (C(x,t)) with age structure (x0 to xmax) is
Dt,TCt � sr � �TtT�x0
xmax
f x,Topt � C x,tdx
[A5]
The variable sr is the sex ratio that may vary overtime, and �TtT scales for the effects of temperature(Fig. A2d).
SubstitutingD(t,T)C(t) and host densities in equa-tionA3ienablescomputationof thenumberofegg laid(S) in hosts, with the ratio 0�S/DC�1 being the pro-portion of the demand satisÞed. Other factors mayaffect the time-varying demand rate (Gutierrez 1992,1996), and S/Dmay affect demographic variables suchas developmental times, and emigration and survivalrates. Adult and immature stages often have differentresource requirements, and the model formulationmust accommodate this as well. Similar logic could bedeveloped for plants seeking light, water, or nutrientsor predators seeking prey (e.g., Rodrõguez et al. 2011).
Mortality
Temperature and other factors affect the daily mor-tality rate and enter equation A1 as components of�tT. These effects vary widely across species butmay be captured by similar functions (e.g., Fig. A2e).
Dormancy
A review of dormancy in insects is found in Necholset al. (1999). In our study, dormancy (say winter dia-pause) occurs in the European grapevine moth in re-sponse to daylength (Fig. A2f; Gutierrez et al. 2012), orin pink bollworm in response to temperature and day-length (Fig. A2g; Gutierrez et al. 1981). Dormancy maybetransientandinducedbylowhostdensityand/orhightemperatures (e.g., olive ßy, medßy; see Gutierrez et al.2009, 2011). In some species, dormancy may also beinßuenced by nutrition (e.g., pink bollworm, olive ßy),and other factors that may be included in the model asidentiÞed. As a practical consideration, individuals en-tering dormancy may be transferred to a separate dy-
June 2013 GUTIERREZ AND PONTI: ERADICATION OF INVASIVE SPECIES 409
namics model formulated using equation A1, where de-velopment proceeds on a different time scale.
GIS Analysis
Figure A3 shows the ßow of the analysis, includingweather data acquisition, simulation runs, and GIS
mapping of the data. The simulation data might also besummarized using multiple regression, and the mar-ginal effects of each (or combinations of) indepen-dent variables on a dependent variable of interestassessed (e.g., total pupae/year; �y/�xi). An extensiveexample of the use of marginal analysis is provided byGutierrez et al. (2005).
Fig. A1. Population dynamics: (a) an age structured model for the dynamics for the egg (symbol e), larval (l), pupal (p),and adult (a) stages with ßows (aging) between age classes and stages, with the double arrows indicating net age speciÞcmortality, and (b) the distribution of developmental times based on the number of age cohorts (k) in sub Þgure A1a (seeSeverini et al. 2005).
Fig. A2. Submodels of biological processes: (a) the rate of development on temperature (Briere et al. 1999), (b) a scalarfor the effects of say nutrition on developmental time, (c) the per capita fecundity proÞle on female age (x) (Bieri et al. 1983)at the optimum temperature (see the vertical dashed line in 2d, e), (d) the effects of temperature on normalized fecundity,(e) the mortality rate per day on temperature, (f) the proportion diapause induction as a function of daylength (e.g., grapevinemoth; Gutierrez et al. 2012), and (g) diapause as a function of daylength and temperature (e.g., pink bollworm; see Gutierrezet al. 1981). SubÞgures without references apply to all species.
410 ENVIRONMENTAL ENTOMOLOGY Vol. 42, no. 3
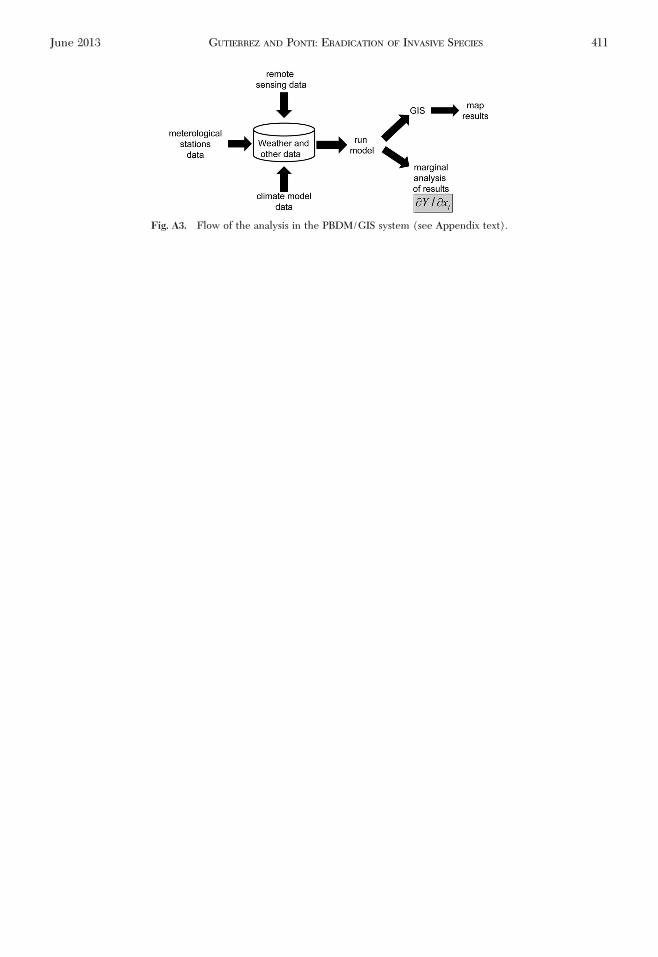
Fig. A3. Flow of the analysis in the PBDM/GIS system (see Appendix text).
June 2013 GUTIERREZ AND PONTI: ERADICATION OF INVASIVE SPECIES 411


