Embed Size (px)
Citation preview
1
CHAPTER 1
INTRODUCTION
1.0 Introduction
Ergonomics is a field that brings completely new transformations in
designing area. The focus of the design elements nowadays is based on human
activities and environment. Therefore, ergonomics approach is necessary in order
to maintain human comfort, safety and health.
The awareness of ergonomics is indeed crucial within today’s society, not
only within the industrial field, but also within the academic environment (Abdul
Halim, 2009). The design of the lecture hall and seminar rooms shall follow the
rules of ergonomics to attain the good safety and health of the user, in particular
toward the students and the lecturers.
2
1.1 Background of study
1.1.1 Ergonomics Hazards
Ergonomics hazards can be referred to as physical environment that could
cause strain and danger toward human body. Ergonomics hazards occur when the
physical tools or apparatus are poorly design and do not fulfilled the proper safety
and ergonomics design (Agboola, 2011). Meanwhile, exposing ourselves to the
poorly design equipment might cause some sore-muscle at the beginning of the
day or the following days. However, a long-term exposure may cause some
serious injuries.
The intervention of the human factor is hardly to be practice within school
environment. Indeed, the awareness of the incorporation of human factor is a bit
late in term of designing the school furniture (Chery and Dian, 2003).
The exposure of danger and insecurity of students and lecturers safety is
high before the intervention of human factors. Students and lecturers usually
complain about the eyes discomfort due to the position of the computer and the
space between the screen on the wall and height of the seat (William & Zingler,
1999).
Ergo-safe lecture halls environment is necessary in order to supply the best
teaching and learning aids towards the students and the lecturers besides having a
comfortable and nice academic environment. Therefore, the lecture halls and
seminar rooms of Central of Teaching Facilities (CTFs) shall have this element to
create a zero tolerant toward the ergonomics hazards.
3
1.1.2 Central of Teaching Facilities (CTFs)
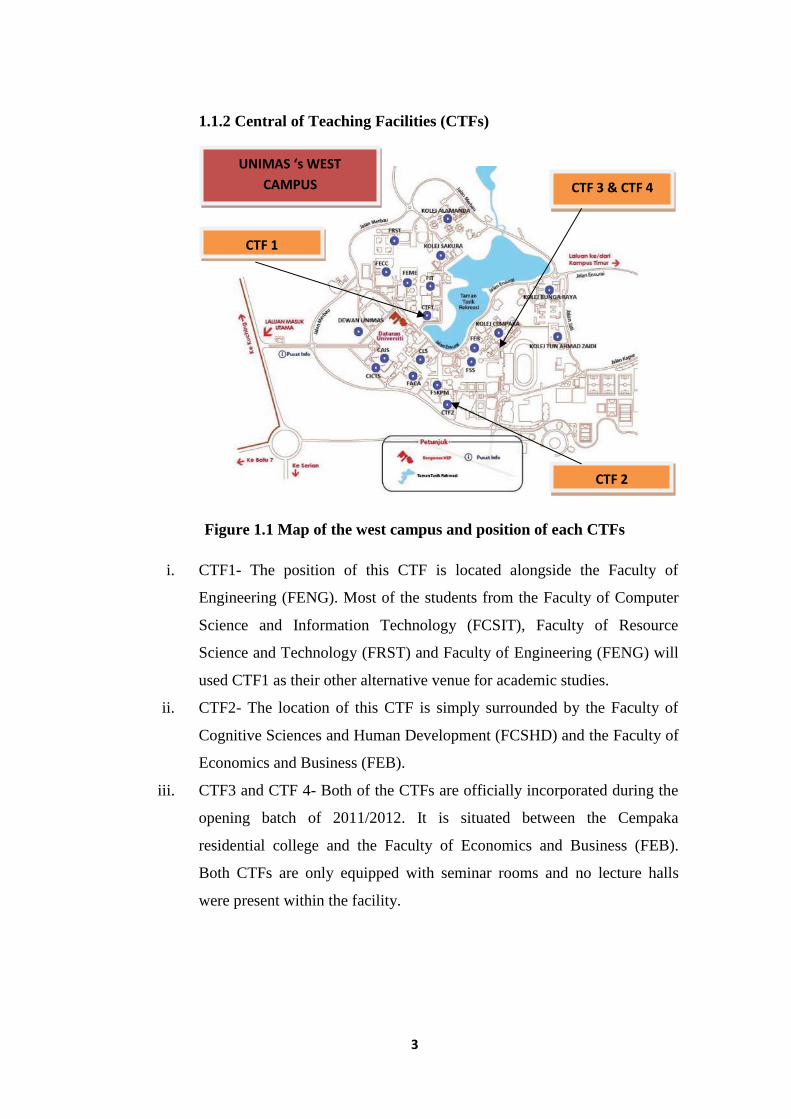
Figure 1.1 Map of the west campus and position of each CTFs
i. CTF1- The position of this CTF is located alongside the Faculty of
Engineering (FENG). Most of the students from the Faculty of Computer
Science and Information Technology (FCSIT), Faculty of Resource
Science and Technology (FRST) and Faculty of Engineering (FENG) will
used CTF1 as their other alternative venue for academic studies.
ii. CTF2- The location of this CTF is simply surrounded by the Faculty of
Cognitive Sciences and Human Development (FCSHD) and the Faculty of
Economics and Business (FEB).
iii. CTF3 and CTF 4- Both of the CTFs are officially incorporated during the
opening batch of 2011/2012. It is situated between the Cempaka
residential college and the Faculty of Economics and Business (FEB).
Both CTFs are only equipped with seminar rooms and no lecture halls
were present within the facility.
UNIMAS ‘s WEST
CAMPUS CTF 3 & CTF 4
CTF 2
CTF 1
4
1.2 Background of Organization
Universiti Malaysia Sarawak (UNIMAS) is Malaysia’s 8th
public university
and was the first to be aspired under the Wawasan 2020. UNIMAS also become
the first university established in Sarawak. UNIMAS was built on the 1st October
1992 and officially incorporated on 24th
December 1992, meanwhile Professor
Dato’ Zawawi Ismail was appointed as the first Vice Chancellor of UNIMAS by
YB Datuk Amar Dr. Sulaiman Hj. Daud, Malaysia’s former Minister of
Education. On 8th
August 1993, 118 students registered under two establish
faculties, Faculty of Social Sciences (FSS) and Faculty of Resource Science and
Technology (FRST).
On the following year, another four faculties were built, denoted as Faculty
of Cognitive Sciences and Human Development (FCSHD), Faculty of Applied
and Creative Arts (FACA), Faculty of Engineering (FENG) and Faculty of
Computer Science and Information Technology (FCSIT).
On 1st April 1994, Sarawak’s former Chief Minister, TYT Tun Datuk
Patinggi (Dr) Ahmad Zaidi Adruce bin Mohammed Noor was appointed as the
first Chancellor of UNIMAS. The period between 1995 until the end of December
1996 saw another future in establishing UNIMAS as one of the suitable venue for
further study, as another two faculties was officially received the students’ entry
from the Faculty of Medicine and Health Sciences (FMHS-1995) and Faculty of
Economics and Business (FEB-1996). Altogether there are eight faculties
according to the original plan. UNIMAS also consists by five institutes and eight
centers including the language studies launched by the year 2012.
UNIMAS also comprise with the enrolment of the pre-university students
that is allocated at the east campus. Undergraduates and postgraduates are
allocated at the west campus. Meanwhile, Faculty of Medicine and Health
Sciences is located nearby Sarawak General Hospital. UNIMAS is certified with
the prestigious MS ISO 9001:2000 due to the excellence core management
processes of student entries and certification of the graduates. UNIMAS has
achieved many prestigious awards and acknowledge researches by peers in at least
5
three areas; biotechnological researches, ICT and biodiversity. UNIMAS
continues its legacy by allowing more entries of students, maintaining and
upgrading the management quality for future reference.
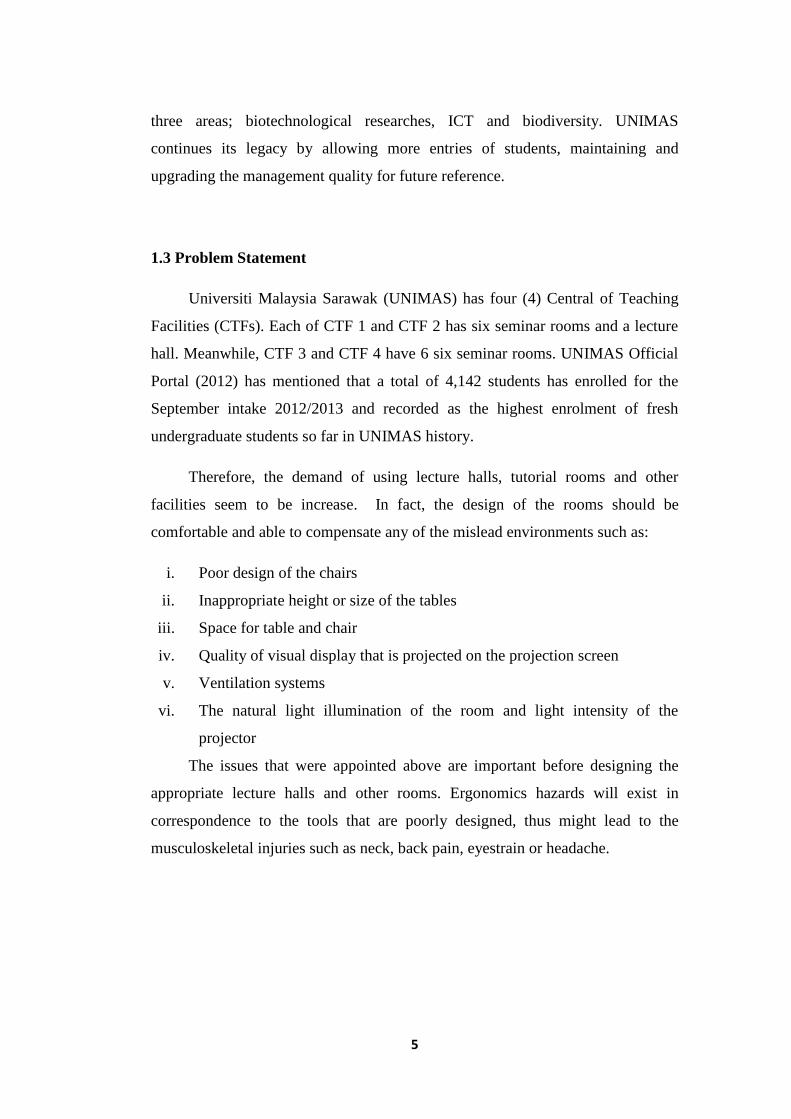
1.3 Problem Statement
Universiti Malaysia Sarawak (UNIMAS) has four (4) Central of Teaching
Facilities (CTFs). Each of CTF 1 and CTF 2 has six seminar rooms and a lecture
hall. Meanwhile, CTF 3 and CTF 4 have 6 six seminar rooms. UNIMAS Official
Portal (2012) has mentioned that a total of 4,142 students has enrolled for the
September intake 2012/2013 and recorded as the highest enrolment of fresh
undergraduate students so far in UNIMAS history.
Therefore, the demand of using lecture halls, tutorial rooms and other
facilities seem to be increase. In fact, the design of the rooms should be
comfortable and able to compensate any of the mislead environments such as:
i. Poor design of the chairs
ii. Inappropriate height or size of the tables
iii. Space for table and chair
iv. Quality of visual display that is projected on the projection screen
v. Ventilation systems
vi. The natural light illumination of the room and light intensity of the
projector
The issues that were appointed above are important before designing the
appropriate lecture halls and other rooms. Ergonomics hazards will exist in
correspondence to the tools that are poorly designed, thus might lead to the
musculoskeletal injuries such as neck, back pain, eyestrain or headache.
6
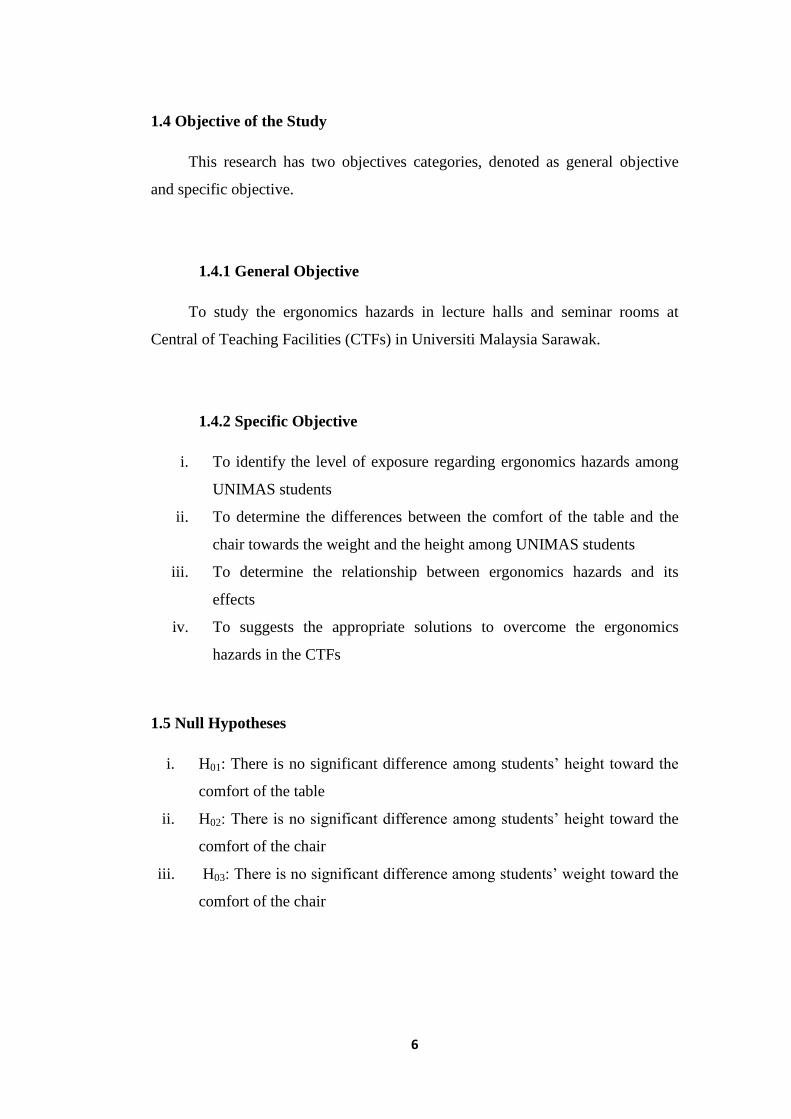
1.4 Objective of the Study
This research has two objectives categories, denoted as general objective
and specific objective.
1.4.1 General Objective
To study the ergonomics hazards in lecture halls and seminar rooms at
Central of Teaching Facilities (CTFs) in Universiti Malaysia Sarawak.
1.4.2 Specific Objective
i. To identify the level of exposure regarding ergonomics hazards among
UNIMAS students
ii. To determine the differences between the comfort of the table and the
chair towards the weight and the height among UNIMAS students
iii. To determine the relationship between ergonomics hazards and its
effects
iv. To suggests the appropriate solutions to overcome the ergonomics
hazards in the CTFs
1.5 Null Hypotheses
i. H01: There is no significant difference among students’ height toward the
comfort of the table
ii. H02: There is no significant difference among students’ height toward the
comfort of the chair
iii. H03: There is no significant difference among students’ weight toward the
comfort of the chair
7
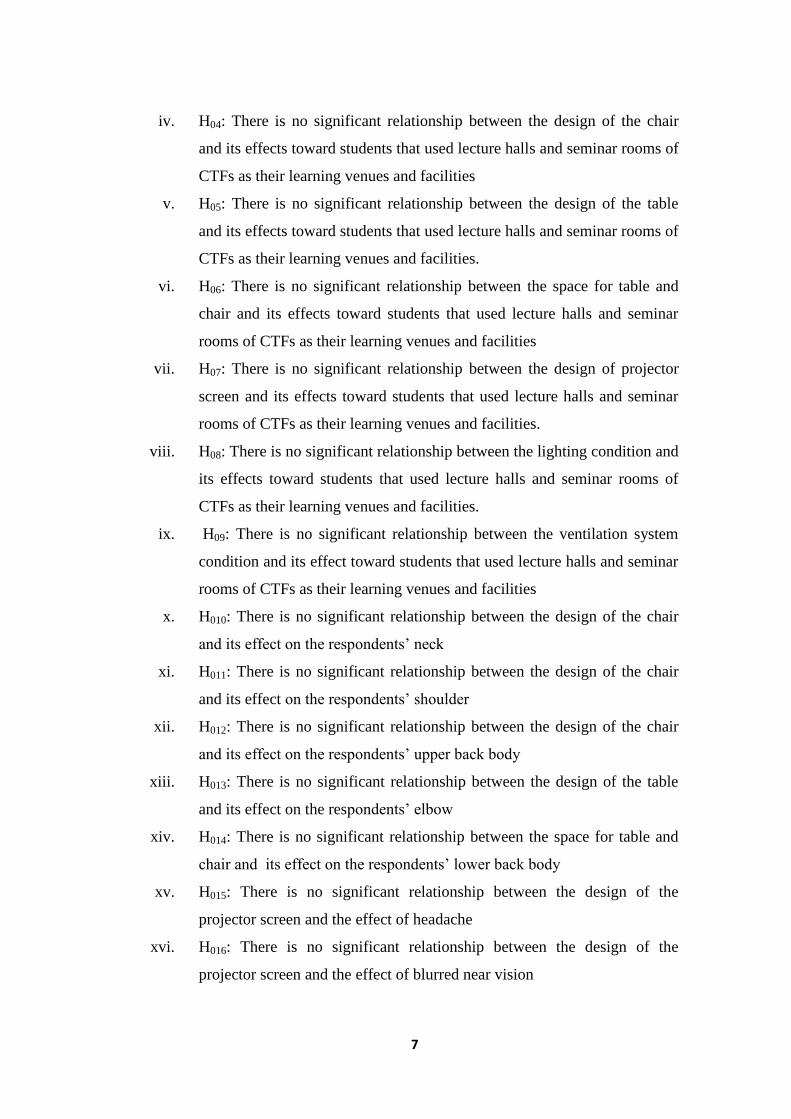
iv. H04: There is no significant relationship between the design of the chair
and its effects toward students that used lecture halls and seminar rooms of
CTFs as their learning venues and facilities
v. H05: There is no significant relationship between the design of the table
and its effects toward students that used lecture halls and seminar rooms of
CTFs as their learning venues and facilities.
vi. H06: There is no significant relationship between the space for table and
chair and its effects toward students that used lecture halls and seminar
rooms of CTFs as their learning venues and facilities
vii. H07: There is no significant relationship between the design of projector
screen and its effects toward students that used lecture halls and seminar
rooms of CTFs as their learning venues and facilities.
viii. H08: There is no significant relationship between the lighting condition and
its effects toward students that used lecture halls and seminar rooms of
CTFs as their learning venues and facilities.
ix. H09: There is no significant relationship between the ventilation system
condition and its effect toward students that used lecture halls and seminar
rooms of CTFs as their learning venues and facilities
x. H010: There is no significant relationship between the design of the chair
and its effect on the respondents’ neck
xi. H011: There is no significant relationship between the design of the chair
and its effect on the respondents’ shoulder
xii. H012: There is no significant relationship between the design of the chair
and its effect on the respondents’ upper back body
xiii. H013: There is no significant relationship between the design of the table
and its effect on the respondents’ elbow
xiv. H014: There is no significant relationship between the space for table and
chair and its effect on the respondents’ lower back body
xv. H015: There is no significant relationship between the design of the
projector screen and the effect of headache
xvi. H016: There is no significant relationship between the design of the
projector screen and the effect of blurred near vision
8
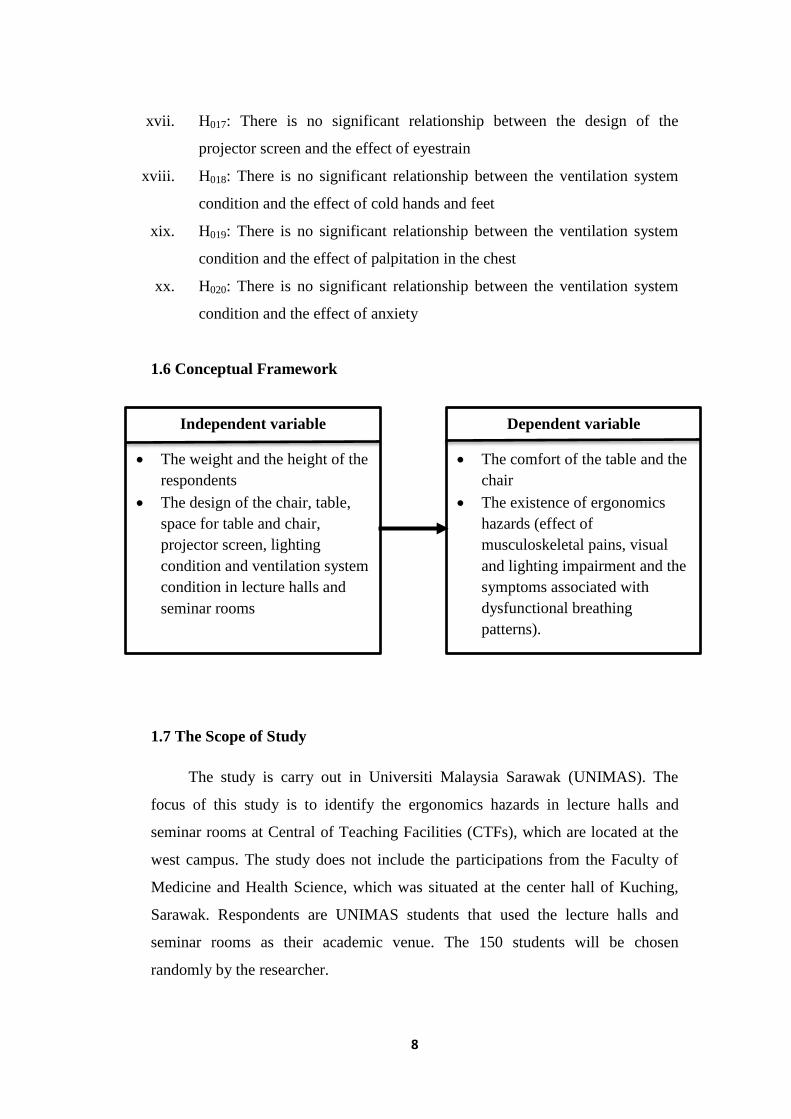
xvii. H017: There is no significant relationship between the design of the
projector screen and the effect of eyestrain
xviii. H018: There is no significant relationship between the ventilation system
condition and the effect of cold hands and feet
xix. H019: There is no significant relationship between the ventilation system
condition and the effect of palpitation in the chest
xx. H020: There is no significant relationship between the ventilation system
condition and the effect of anxiety
1.6 Conceptual Framework
1.7 The Scope of Study
The study is carry out in Universiti Malaysia Sarawak (UNIMAS). The
focus of this study is to identify the ergonomics hazards in lecture halls and
seminar rooms at Central of Teaching Facilities (CTFs), which are located at the
west campus. The study does not include the participations from the Faculty of
Medicine and Health Science, which was situated at the center hall of Kuching,
Sarawak. Respondents are UNIMAS students that used the lecture halls and
seminar rooms as their academic venue. The 150 students will be chosen
randomly by the researcher.
Independent variable
The weight and the height of the
respondents
The design of the chair, table,
space for table and chair,
projector screen, lighting
condition and ventilation system
condition in lecture halls and
seminar rooms
Dependent variable
The comfort of the table and the
chair
The existence of ergonomics
hazards (effect of
musculoskeletal pains, visual
and lighting impairment and the
symptoms associated with
dysfunctional breathing
patterns).
9
1.8 Significance of Study
The essential of the study is to provide knowledge and share information
within the UNIMAS community about the important issue of ergonomics hazards
in the lecture halls, seminar rooms and its facilities. In addition, the community
should be aware about the design of the lecture halls and seminar rooms. Human
need the proper comfort, therefore the awareness on the design of lecture halls and
seminar room are indeed crucial. This will determine on how far does the design
suit user in term of ergonomics aspect. This study can become an additional
resource and reference.
1.9 Limitation of Study
Limitation is obviously due to the focus group element. Some of the
students might not use lecture halls and seminar rooms of CTFs for each of the
subjects taken and the same room for every semester. Besides that, the data
collections are based on the usage of the lecture halls and seminar rooms during
semester II (2012/2013). Thus, only students of the second (2nd) year and above
are qualified to answer the questionnaire.
On the other hand, lecture halls and seminar rooms that has non-adjustable
chair are the main venue of the research. Seminar room 4 and seminar room 6 of
CTF 3 and CTF4 does not has the n0n-adjustable chair, thus the research does not
involve both of these seminar rooms. Other than CTFs, students are also provided
with other facilities such as tutorial rooms, experimental laboratory and studio.
The availability of any kind of these facilities is according to each of the faculty
respectively. The 150 respondents do not reflect the true population of UNIMAS
student community. Thus the data collected will not reflect the UNIMAS
population in general.
10
CHAPTER 2
LITERATURE REVIEWS
2.0 Chapter Overview
In this chapter, previous research literatures are viewed in order to attain a
better understanding and assist the underlying component of this research. The
components are including ergonomics, ergonomics hazards in the classroom,
musculoskeletal disorders and its relation with the lecture hall environment.
11
2.1 Ergonomics
Ergonomics is also known as human factors, which is the study of how
system component or physical jobs are fit into human specialty, comfort and
limitation. Ergonomics is indeed an important element that should be considered
within the designing process of any product.
Preece et. al (1994) has mentioned that ergonomics concept can measure the
problem within the product according to these factors:
i. People vary in may appearances
ii. People vary in shapes and sizes
iii. People vary in culture perspective
iv. People have different thoughts and point of views
v. People come from different specialties and professions
2.2. Ergonomics Hazards in The Classroom
Abdul Halim (2009) had mentioned that the application of ergonomics
aspect is being less appreciated in educational institutes but actively applied in the
workplaces area. Classrooms or lecture halls are another place that can be
considered as actively accompanied by the students and the educators. It is the
place where the students and the respective lecturers doing some educational
interaction. The facilities within the rooms are used according to its function,
however if the facilities’ design or the function face the lack of ergonomics
intervention, this could lead into the development of ergonomics hazards within
the rooms (Syazwan Aizat et. al, 2009).
12
2.2.1 Chair and Table
Syazwan Aizat et. al (2010) had evaluated the ergonomics intervention in
reducing the ergonomics risk factors of musculoskeletal disorder among children.
During the classroom’s lessons, the children will experience bad posture of sitting
where the head, back and neck rotate and flex for a long duration of times.
Syazwan Aizat et. al (2010) also mention that children spend 30% of their class
hours with sitting posture and their musculoskeletal system could be affected by a
bad and awkward posture.
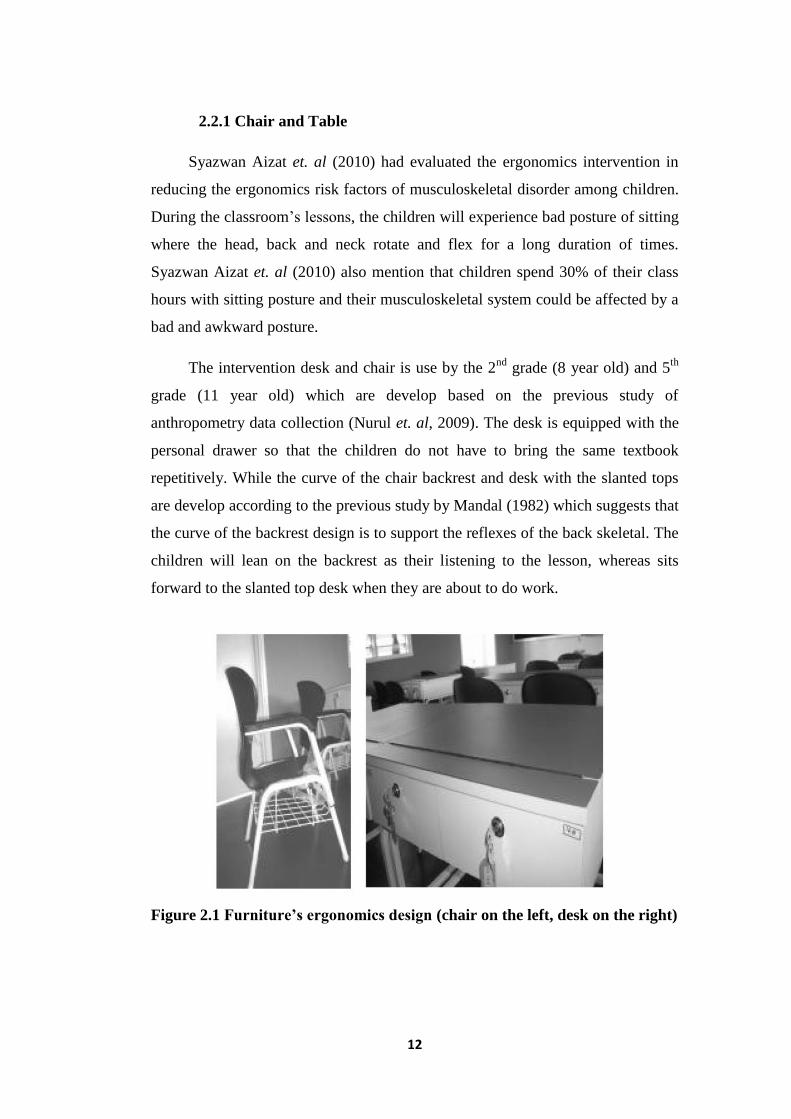
The intervention desk and chair is use by the 2nd
grade (8 year old) and 5th
grade (11 year old) which are develop based on the previous study of
anthropometry data collection (Nurul et. al, 2009). The desk is equipped with the
personal drawer so that the children do not have to bring the same textbook
repetitively. While the curve of the chair backrest and desk with the slanted tops
are develop according to the previous study by Mandal (1982) which suggests that
the curve of the backrest design is to support the reflexes of the back skeletal. The
children will lean on the backrest as their listening to the lesson, whereas sits
forward to the slanted top desk when they are about to do work.
Figure 2.1 Furniture’s ergonomics design (chair on the left, desk on the right)
13
Mandal (1982) also suggest that the chair must have 900 idea for sitting
support, 600
on the hip joint flexion, while 300 at the lumbar spinal. This will
avoid hazards and help to persevere children to sit 4-5 hours per day in school.
The space between slanted top desk and the chair indeed another point that should
be considered as people are come with different size (Preece et. al, 1994).
Atherton (2010) stated that traditional row arrangement classroom layout
will allow eye-contact among lecturers and students during teaching-learning
process but it may distract others if space provided is limited. This is due the fact
that when a person asked permission to go outside from the row, it indeed
distracts other attention. Nevertheless, arrangement between presentation screen
and seats in lecture halls also should be taken into consideration. Designing a
class with a lot of seats without slightly aware of having this inappropriate
whiteboard or display area position arrangement will makes students undergo the
neck aches, glare effect and eyestrain which could threaten their health in future
due to the long-term exposure. BRANZ Ltd (n.d) declared that the extreme
viewing angle cause the neck and eye discomfort due to the over focusing on the
screen or the whiteboard.
Grimes and Legg (2004) proposed the study on the extension
musculoskeletal disorder for school days until the working life due to the fact of
lacking ergonomics intervention towards the school chair and desk. During the
school period, most of the students are exposed to the poor posture of sitting thus
will cause the significance neck and back discomfort in adult’s working life. The
awareness of the ergonomics is being less concern in the classroom’s environment
however it is highly practice at the adult’s workplace. Therefore, the theory of
having the initial pit of musculoskeletal disorder could be related to the neck and
back pain during adolescent.
14
2.2.2 Lighting and Visibility of Display Area
In advance rooms such as the auditorium or seminar rooms, it is essential to
have the capability to adjust the light of the main stage and that light must be
independent light compare to the light above the students so that the stray light
can be avoided on the display area (Støfringsdal, 2010). If the room is equipped
by the distant learning, it is necessary to install the combination of incandescent
bulb and halogen bulb above the stage plus ascending seat. Støfringsdal (2010)
also state that the direct and indirect light should be install about the stage. While
vertical and horizontal light component will able to strike off the shadow onto the
lecturer’s face and at the same time guaranteed good rendering of the projected
screen.
Støfringsdal (2010) added in his description of having all fixtures within the
rooms except either the blackboard or the display area needs to have individual
dimming function. The light above the blackboard or display area should be able
to be turn on or off and its function is independent compare to the other lighting.
Indeed, it must be separated in zones so it can be control behind the powered
screens. Direct light toward the screen should be control easily by the lecturer in
order to reduce the stray light that came from the direct light. The control switch
could be placed separated which enable the lecturer to dim the direct light when
projector is in used.
2.2.3 Ventilation System
There would be four basic factors of temperature that will greatly affect
body temperature; air temperature, radiant temperature, humidity and air
movement (Sleeman & Rockwell, 1981). Nowadays, every classroom or lecture
hall is installed with air-conditioning system. Student studied in a comfortable
environment with the availability of this system, however it may bring such a vice
versa result if the system is malfunction and need a few days for maintenance.
15
BRANZ Ltd (2007) state that 18oC- 20
oC is the ideal temperature for any
type of classroom. Within this range of temperature, the temperature of the
external environment and the classroom environment is being exchanged. In
addition, the temperature of the classroom may become hot due to the fact that
human release heat from their body. Thus, having numerous of people within the
small rooms altogether with malfunction ventilation system might cause some
difficulty of air flows within the rooms.
Harmon (1953) suggested that 18oC to 20
oC is a good temperature for
classroom. The set button temperature is designed slightly to enable the students
or the educators of the classroom to control the humidity as well as to keep the
ventilation airflow. Unwanted odor can be reduce and at the same time allowing
the air exchange involving carbon dioxide and oxygen.
2.3 Anthropometry
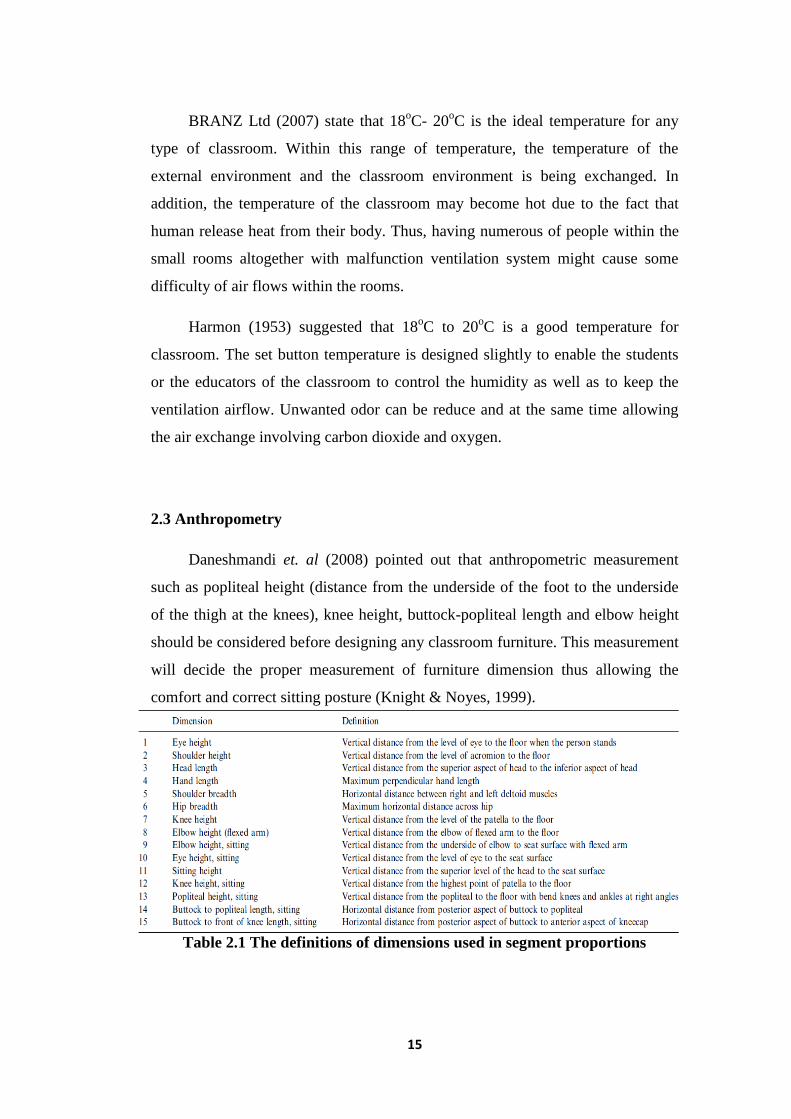
Daneshmandi et. al (2008) pointed out that anthropometric measurement
such as popliteal height (distance from the underside of the foot to the underside
of the thigh at the knees), knee height, buttock-popliteal length and elbow height
should be considered before designing any classroom furniture. This measurement
will decide the proper measurement of furniture dimension thus allowing the
comfort and correct sitting posture (Knight & Noyes, 1999).
Table 2.1 The definitions of dimensions used in segment proportions
16
Chery and Dian (2003) revealed that the application of human factors and
its implementation in designing the school furniture is rarely to be incorporated by
tradition. However, the awareness started when people realize that children should
have proper posture at the young age because during that period, young children
will inhabit their own sitting pattern, which would determine whether the sitting is
appropriate with the children’s body dimension while using the chair. Yeats
(1997) believe that as these children grow up, the sitting will always stays on its
own pattern and the possibility to change its pattern seem to be redundant in term
of familiarization and habit.
2.4 Musculoskeletal
2.4.1 Musculoskeletal Disorder
Chaiklieng, Suggaravetsiri and Boonprakob (2010) stated that ergonomics
hazards closely related with the increase effect of the musculoskeletal pain. A
persevere musculoskeletal pain is common in today’s society, where its attack
people for at least on the average of 70% - 85% of low back pain in one lifespan.
The theories that assume to contribute to this disorder are:
i. Individual factor (specialties and limitation)
ii. Anthropometric (body size and physical abilities)
iii. Ergonomics factor (workstation and instrument such as lifting,
repetitive work)
iv. Physical factor (the extend of sitting and awkward body posture)
v. Psychosocial factor (stress and muscle tension)
17
CHAPTER 3
METHODOLOGY
3.0 Chapter Overview
In this section, the description includes the research instrument, research
design, research location, population sample, reliability, research procedure data
collection and data analysis.
18
3.1 Research Design
Predicted hypotheses will be tested according to the data collection using
questionnaire survey. The research is focusing on the quantitative method as the
main component to measure the data. Questionnaire will help to prove and
validate the relationship between two variables.
3.2 Research Instrument
The instruments of this research involve the use of questionnaire survey
technique. Questionnaire survey technique is a quantitative method. The
questionnaire is adapted from the modification of four different existing
questionnaires:
• Office Ergonomics Hazards Identification Checklist (ESA) (2011)
• Nordiq Body Map Questionnaire (2009)
• Computer Vision Questionnaire(2009)
• The Nijmegen Questionnaire (2004)
The purpose of the modification is to adapt the CTFs’ lecture halls and
seminar rooms’ environment, thus allowing the identification of ergonomics
hazards and its effect toward students’ health and safety.
The questionnaire technique consists of two categories of questions, “close-
ended” and “open-ended”. “Close-ended” questions are structured questions and
Likert scale is used to show a multiple of choices. The respondents must only
choose one answer for one typical question. Five multiple of choices are denoted
as:
19
1 – Strongly Disagree
2 – Disagree
3 – Neutral
4 – Agree
5 – Strongly Agree
An “Open-ended” question is an unstructured question. Respondents are
free to give their thoughts and opinions without any limitation. However, the
answer description given by the respondents might be too abstract and difficult to
be explained in appropriate definitions. In addition, “open-ended” question is a
common part of questionnaire technique that was left without any answer given
by most of the respondents.
The questionnaire consists of four sections:
1. Section A – demographic question (respondent’s background)
2. Section B – questions related to identification of ergonomics
hazards within lecture halls and seminar rooms of CTFs
3. Section C – questions related to the identification of injuries while
interact with the facilities and other components in lecture halls
and seminar rooms of CTFs
4. Section D – the respondents’ thoughts or opinions about the whole
component of lecture halls and seminar rooms and their
suggestions for future improvement of lecture halls and seminar
rooms of CTFs
In section B, the questionnaire consist of 23 questions which involve the
division questions for chair, table, space for table and chair, visual display
projected to projected screen, lightning and ventilation system respectively.
20
In section C, it has 3 part sub-questions:
Question C (1) is the effect of musculoskeletal pains. It will be
related with the design of the table, design of the chair and space
for table and chair.
Question C (2) is the effect of the visual projected on the projector
screen and the lighting factor.
Question C (3) is the effect of the ventilation system condition
which may have the symptoms associated with dysfunctional
breathing patterns.
3.3 Research Location
The research is carried out at the west campus of Universiti Malaysia
Sarawak (UNIMAS). The main focus location is at Central of Teaching Facilities
(CTFs).
3.4 Population Sample
In this research, stratified random sampling is used. This type of sampling is
used to target the right students to response toward the questionnaire. The target
population are students of UNIMAS’s west campus which used the Central of
Teaching Facilities (CTFs) as their academic venue. Besides that, the students
must have the experience of using the lecture halls and seminar rooms during
semester II (2012/2013). Therefore, only students of the second (2nd) year and
above are qualified to answer the questionnaire.
On the other hand, lecture halls and seminar rooms that has non-adjustable
chair become the main venue of this research. Seminar room 4 and seminar room
6 of CTF 3 and CTF4 do not have non-adjustable chair. Thus, students that are
experienced in using seminar room 4 or seminar room 6 are disqualified to answer
the questionnaire.
21
Consequently, these students are already differentiated by the strata or a
small group according to their academic venue status. The sample size of this
research is 150 students which randomly chosen by the researcher. Students from
the Faculty of Medicine and Health Science are excluded from the research
population due to its external location, which is allocated outside the UNIMAS’s
main campus.
3.5 Reliability and Validity
3.5.1 Pilot Test
In the pilot test, 10 students are chosen randomly to answer the
questionnaire. The pilot test is crucial to be executed before performing the real
test. The validity of the questionnaire might be still redundant due to fact of its
modification from four different existing questionnaires. The pilot test will allow
the confirmation of the relevant and the validity of the questions. In addition, it is
also allow the researcher to test whether the respondent are really satisfied and
understand each of the questions presented in the questionnaire.
Indeed, Office Ergonomics Hazard Identification Checklist (ESA) is
originated from the United Kingdom. Therefore, it is clearly clarified that the
questionnaire is catered towards the western community. In other words, their
community expectation and body range is different from the community in
Malaysia. For that reason, the questionnaire is modified based on the body range
of Malaysia community and thus allowing the validity for this research.
Reliability measurement will base on the consistency of the score produce.
In the pilot test, reliability measurement must meet the consistency of the
reliability score. The reliability of the questionnaire is measure using Statistical
Package for Social Science (SPSS).
22
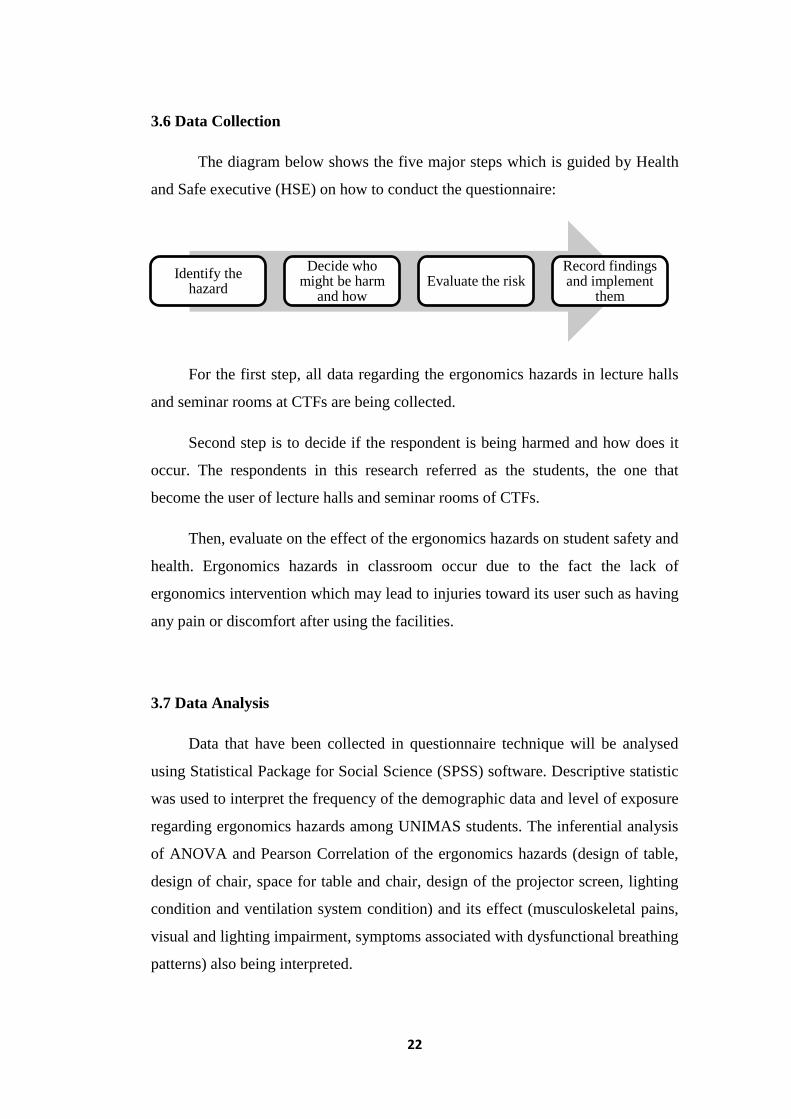
3.6 Data Collection
The diagram below shows the five major steps which is guided by Health
and Safe executive (HSE) on how to conduct the questionnaire:
For the first step, all data regarding the ergonomics hazards in lecture halls
and seminar rooms at CTFs are being collected.
Second step is to decide if the respondent is being harmed and how does it
occur. The respondents in this research referred as the students, the one that
become the user of lecture halls and seminar rooms of CTFs.
Then, evaluate on the effect of the ergonomics hazards on student safety and
health. Ergonomics hazards in classroom occur due to the fact the lack of
ergonomics intervention which may lead to injuries toward its user such as having
any pain or discomfort after using the facilities.
3.7 Data Analysis
Data that have been collected in questionnaire technique will be analysed
using Statistical Package for Social Science (SPSS) software. Descriptive statistic
was used to interpret the frequency of the demographic data and level of exposure
regarding ergonomics hazards among UNIMAS students. The inferential analysis
of ANOVA and Pearson Correlation of the ergonomics hazards (design of table,
design of chair, space for table and chair, design of the projector screen, lighting
condition and ventilation system condition) and its effect (musculoskeletal pains,
visual and lighting impairment, symptoms associated with dysfunctional breathing
patterns) also being interpreted.
Identify the hazard
Decide who might be harm
and how Evaluate the risk
Record findings and implement
them
23
CHAPTER 4
RESULTS AND DISCUSSIONS
4.0 Chapter Overview
Chapter four presents details of analyses and discussions of gathered data.
The results were both examined in both descriptive and inferential analysis; each
was divided into sequential order in answering and interpreting the questions and
data. From the analysis, discussions of findings were described later in the
discussion section.
24
4.1 Descriptive Analysis
4.1.1 Demographic Information
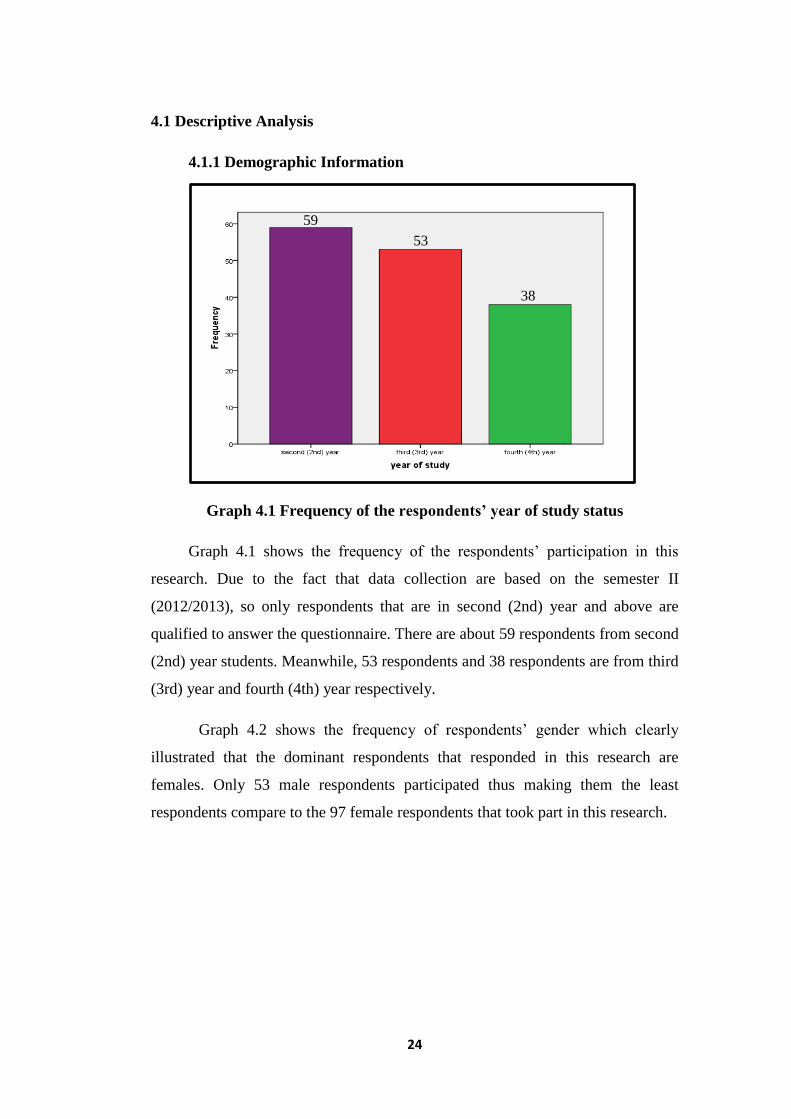
Graph 4.1 Frequency of the respondents’ year of study status
Graph 4.1 shows the frequency of the respondents’ participation in this
research. Due to the fact that data collection are based on the semester II
(2012/2013), so only respondents that are in second (2nd) year and above are
qualified to answer the questionnaire. There are about 59 respondents from second
(2nd) year students. Meanwhile, 53 respondents and 38 respondents are from third
(3rd) year and fourth (4th) year respectively.
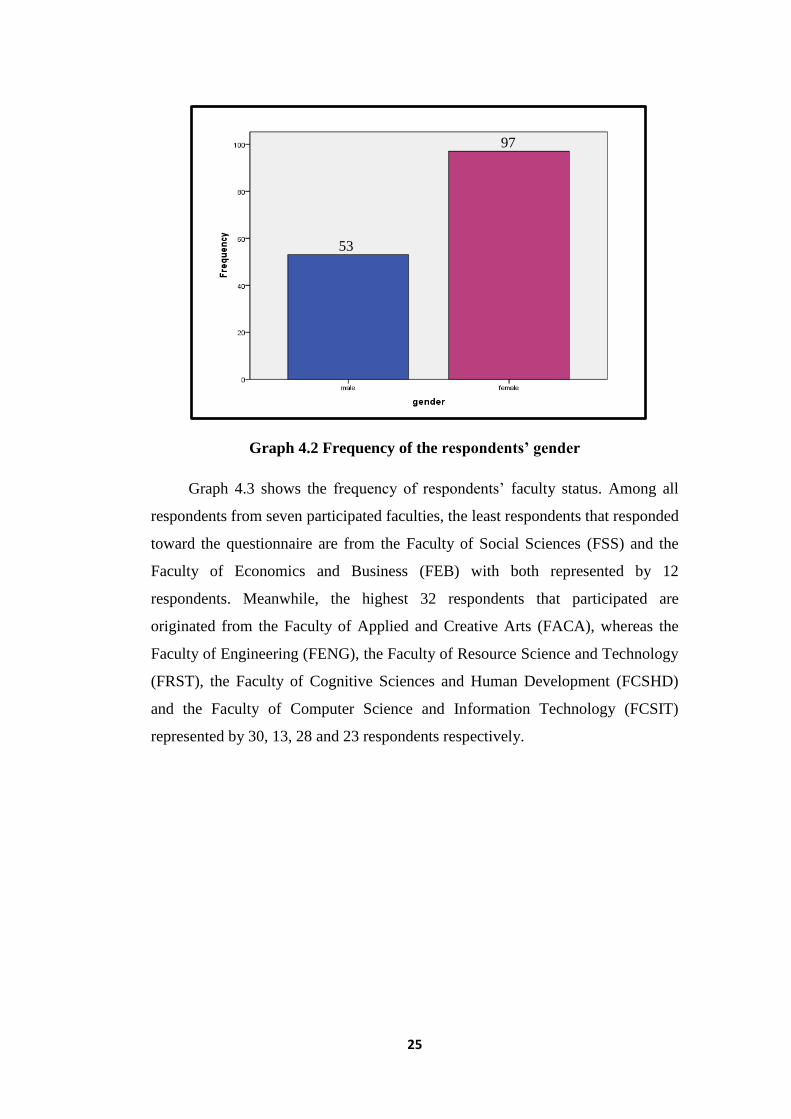
Graph 4.2 shows the frequency of respondents’ gender which clearly
illustrated that the dominant respondents that responded in this research are
females. Only 53 male respondents participated thus making them the least
respondents compare to the 97 female respondents that took part in this research.
59
53
38
25
Graph 4.2 Frequency of the respondents’ gender
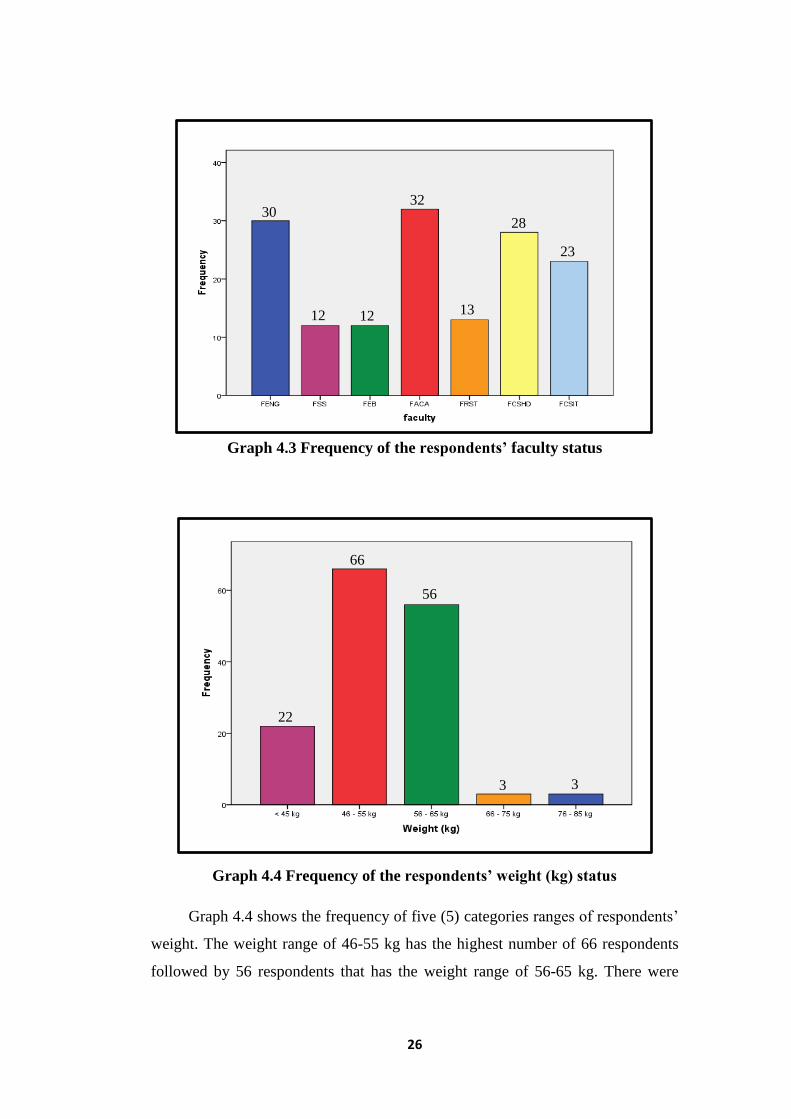
Graph 4.3 shows the frequency of respondents’ faculty status. Among all
respondents from seven participated faculties, the least respondents that responded
toward the questionnaire are from the Faculty of Social Sciences (FSS) and the
Faculty of Economics and Business (FEB) with both represented by 12
respondents. Meanwhile, the highest 32 respondents that participated are
originated from the Faculty of Applied and Creative Arts (FACA), whereas the
Faculty of Engineering (FENG), the Faculty of Resource Science and Technology
(FRST), the Faculty of Cognitive Sciences and Human Development (FCSHD)
and the Faculty of Computer Science and Information Technology (FCSIT)
represented by 30, 13, 28 and 23 respondents respectively.
53
97
26
c
//////////////////////////////////////////;
Graph 4.3 Frequency of the respondents’ faculty status
Graph 4.4 Frequency of the respondents’ weight (kg) status
Graph 4.4 shows the frequency of five (5) categories ranges of respondents’
weight. The weight range of 46-55 kg has the highest number of 66 respondents
followed by 56 respondents that has the weight range of 56-65 kg. There were
30
12 12 13
32
28
23
22
56
66
3 3
27
only 3 respondents’ whom falls on both weight ranges of 66-75kg and 76-85kg
respectively. Meanwhile, <45kg weight range category consist by 22 respondents.
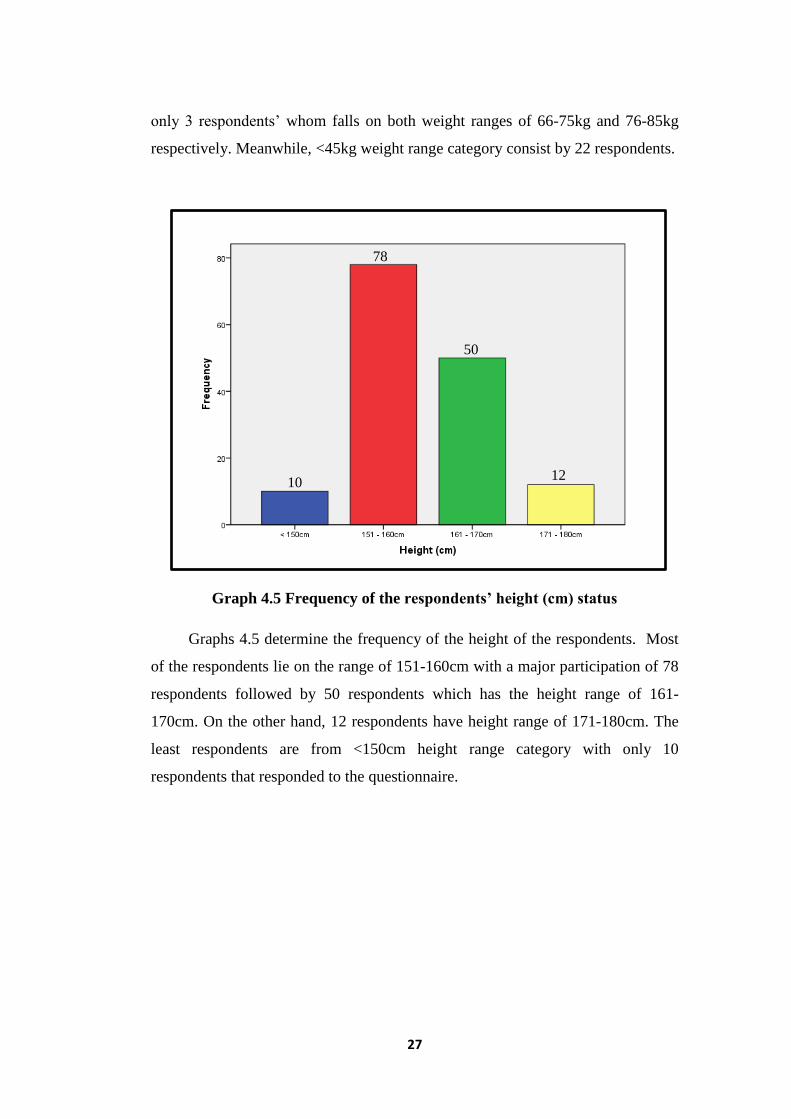
Graph 4.5 Frequency of the respondents’ height (cm) status
Graphs 4.5 determine the frequency of the height of the respondents. Most
of the respondents lie on the range of 151-160cm with a major participation of 78
respondents followed by 50 respondents which has the height range of 161-
170cm. On the other hand, 12 respondents have height range of 171-180cm. The
least respondents are from <150cm height range category with only 10
respondents that responded to the questionnaire.
10
50
78
12
28
4.1.2 Level of Exposure
Chair Items
Strongly
Disagree
Disagree
Neutral
Agree
Strongly
Agree
N % N % N % N % N %
1. The chair have
adequate and
comfortable
lumbar support
backrest
13
8.7
53
35.3
24
16.0
57
38.0
3
2.0
2. Seat pan (surface
to sit on) is well
design and
comfortable
4
2.7
59
39.3
31
20.7
50
33.3
6
4.0
3. While seated, feet
resting firmly and
flat on the floor
11
7.3
20
13.3
45
30.0
68
45.3
6
4.0
4. While seated,
knees slightly
lower than hips
5
3.3
14
9.3
68
45.3
58
38.7
5
3.3
5. While seated,
back is pressed
firmly up against
backrest
13
8.7
53
35.3
32
21.3
51
34.0
1
0.7
6. While seated,
head/neck relaxed
and upright
16
10.7
67
44.7
29
19.3
37
24.7
1
0.7
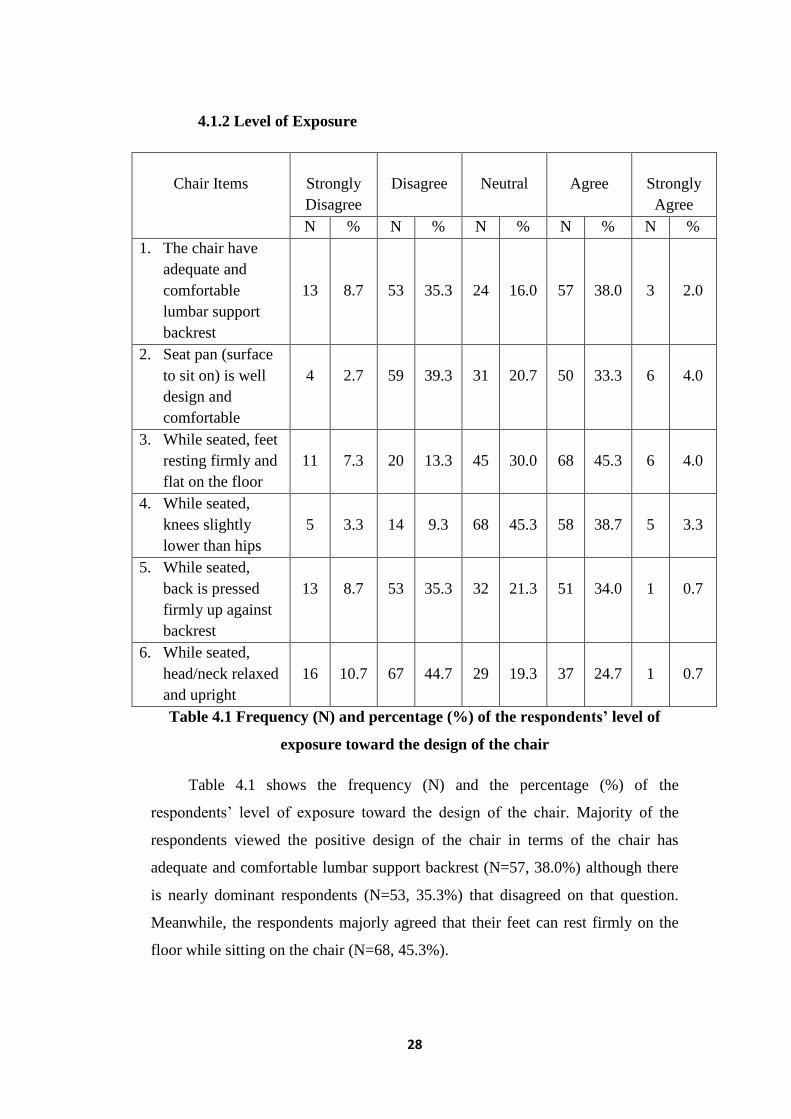
Table 4.1 Frequency (N) and percentage (%) of the respondents’ level of
exposure toward the design of the chair
Table 4.1 shows the frequency (N) and the percentage (%) of the
respondents’ level of exposure toward the design of the chair. Majority of the
respondents viewed the positive design of the chair in terms of the chair has
adequate and comfortable lumbar support backrest (N=57, 38.0%) although there
is nearly dominant respondents (N=53, 35.3%) that disagreed on that question.
Meanwhile, the respondents majorly agreed that their feet can rest firmly on the
floor while sitting on the chair (N=68, 45.3%).
29
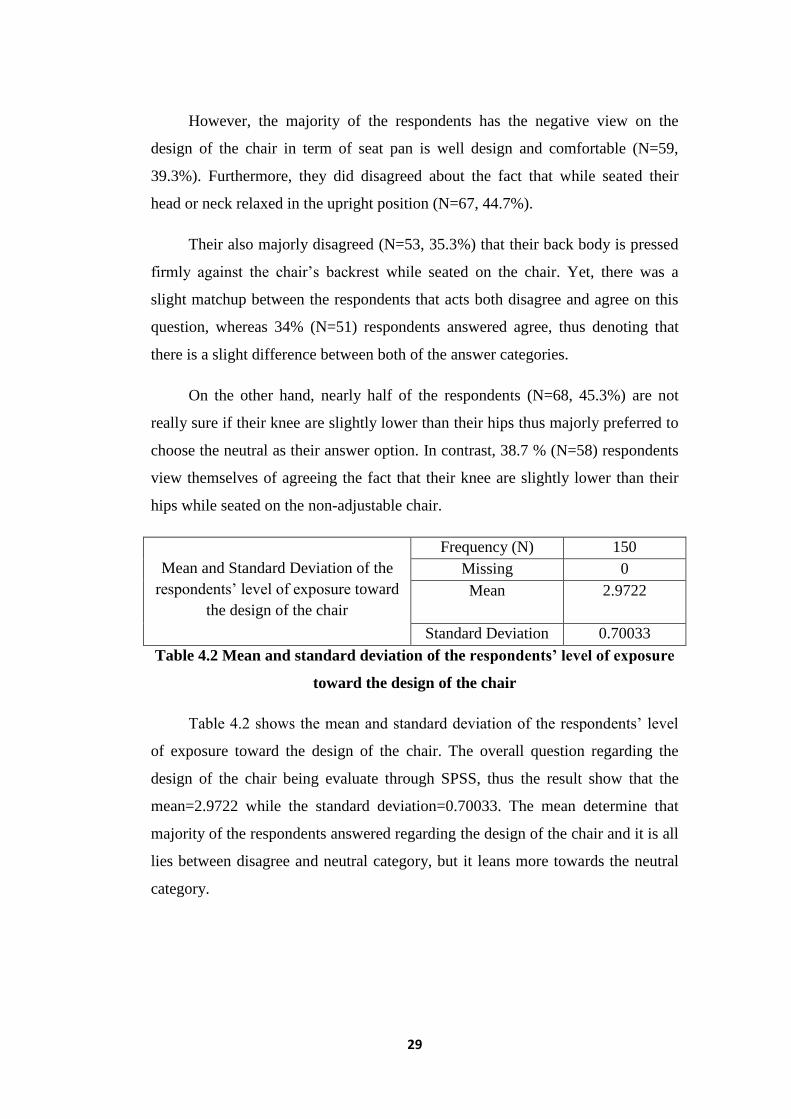
However, the majority of the respondents has the negative view on the
design of the chair in term of seat pan is well design and comfortable (N=59,
39.3%). Furthermore, they did disagreed about the fact that while seated their
head or neck relaxed in the upright position (N=67, 44.7%).
Their also majorly disagreed (N=53, 35.3%) that their back body is pressed
firmly against the chair’s backrest while seated on the chair. Yet, there was a
slight matchup between the respondents that acts both disagree and agree on this
question, whereas 34% (N=51) respondents answered agree, thus denoting that
there is a slight difference between both of the answer categories.
On the other hand, nearly half of the respondents (N=68, 45.3%) are not
really sure if their knee are slightly lower than their hips thus majorly preferred to
choose the neutral as their answer option. In contrast, 38.7 % (N=58) respondents
view themselves of agreeing the fact that their knee are slightly lower than their
hips while seated on the non-adjustable chair.
Mean and Standard Deviation of the
respondents’ level of exposure toward
the design of the chair
Frequency (N) 150
Missing 0
Mean
2.9722
Standard Deviation 0.70033
Table 4.2 Mean and standard deviation of the respondents’ level of exposure
toward the design of the chair
Table 4.2 shows the mean and standard deviation of the respondents’ level
of exposure toward the design of the chair. The overall question regarding the
design of the chair being evaluate through SPSS, thus the result show that the
mean=2.9722 while the standard deviation=0.70033. The mean determine that
majority of the respondents answered regarding the design of the chair and it is all
lies between disagree and neutral category, but it leans more towards the neutral
category.
30
Table Items
Strongly
Disagree
Disagree
Neutral
Agree
Strongly
Agree
N % N % N % N % N %
7. The work surface
of the table is
adequate for all
activities (the
table is not too
small for writing,
reading, drawing
or any activities
related to
learning)
44
29.3
56
37.3
25
16.7
23
15.3
2
1.3
8. The height of the
table is
appropriate and
comfortable
23
15.3
50
33.3
19
12.7
57
38.0
1
0.7
Table 4.3 Frequency (N) and percentage (%) of the respondents’ level of
exposure toward the design of the table
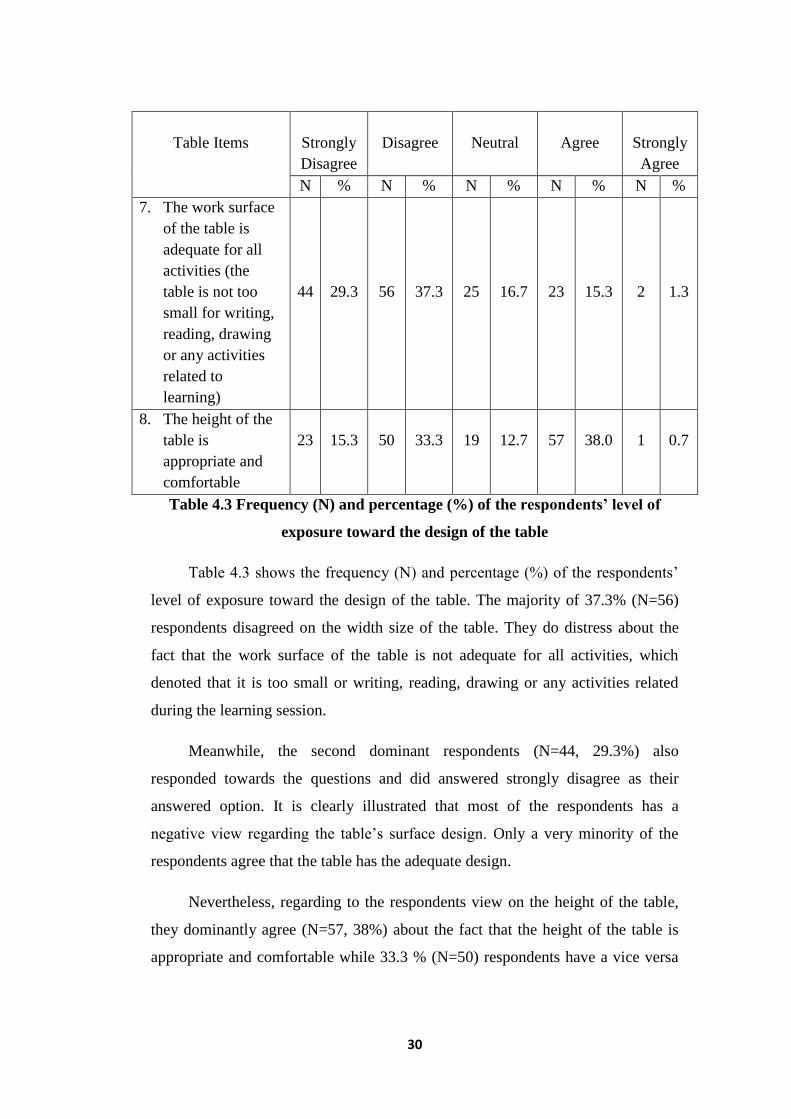
Table 4.3 shows the frequency (N) and percentage (%) of the respondents’
level of exposure toward the design of the table. The majority of 37.3% (N=56)
respondents disagreed on the width size of the table. They do distress about the
fact that the work surface of the table is not adequate for all activities, which
denoted that it is too small or writing, reading, drawing or any activities related
during the learning session.
Meanwhile, the second dominant respondents (N=44, 29.3%) also
responded towards the questions and did answered strongly disagree as their
answered option. It is clearly illustrated that most of the respondents has a
negative view regarding the table’s surface design. Only a very minority of the
respondents agree that the table has the adequate design.
Nevertheless, regarding to the respondents view on the height of the table,
they dominantly agree (N=57, 38%) about the fact that the height of the table is
appropriate and comfortable while 33.3 % (N=50) respondents have a vice versa
31
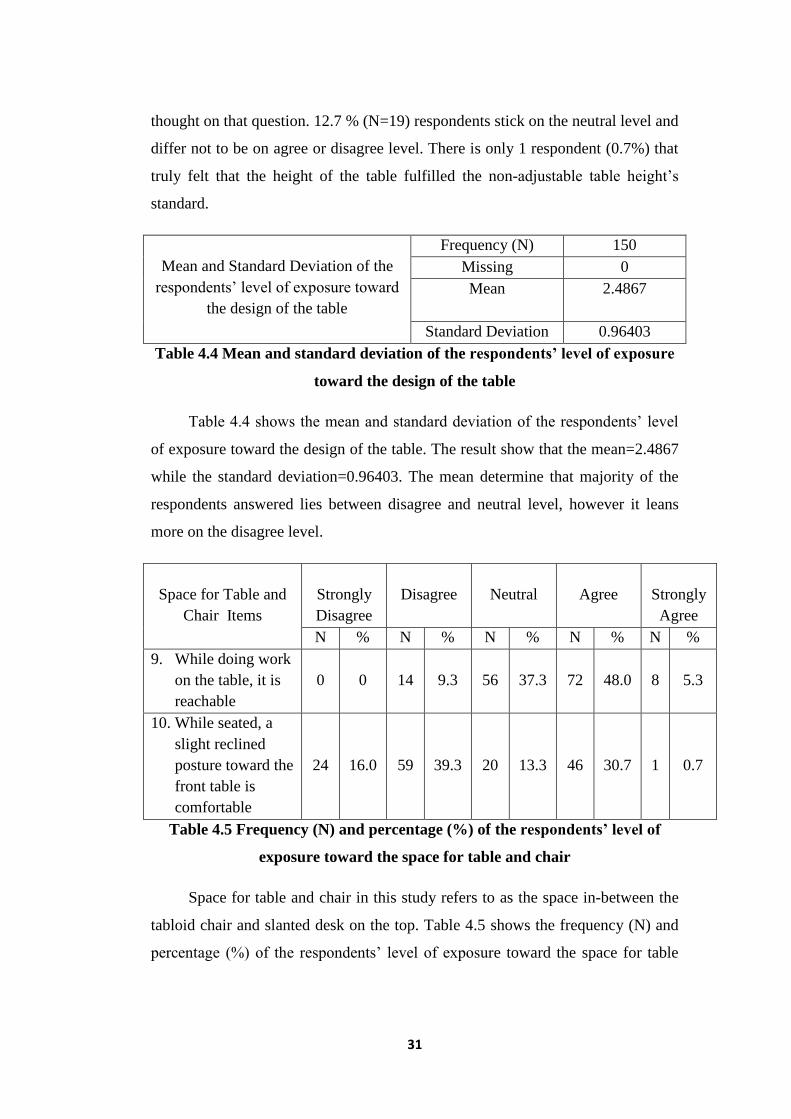
thought on that question. 12.7 % (N=19) respondents stick on the neutral level and
differ not to be on agree or disagree level. There is only 1 respondent (0.7%) that
truly felt that the height of the table fulfilled the non-adjustable table height’s
standard.
Mean and Standard Deviation of the
respondents’ level of exposure toward
the design of the table
Frequency (N) 150
Missing 0
Mean
2.4867
Standard Deviation 0.96403
Table 4.4 Mean and standard deviation of the respondents’ level of exposure
toward the design of the table
Table 4.4 shows the mean and standard deviation of the respondents’ level
of exposure toward the design of the table. The result show that the mean=2.4867
while the standard deviation=0.96403. The mean determine that majority of the
respondents answered lies between disagree and neutral level, however it leans
more on the disagree level.
Space for Table and
Chair Items
Strongly
Disagree
Disagree
Neutral
Agree
Strongly
Agree
N % N % N % N % N %
9. While doing work
on the table, it is
reachable
0
0
14
9.3
56
37.3
72
48.0
8
5.3
10. While seated, a
slight reclined
posture toward the
front table is
comfortable
24
16.0
59
39.3
20
13.3
46
30.7
1
0.7
Table 4.5 Frequency (N) and percentage (%) of the respondents’ level of
exposure toward the space for table and chair
Space for table and chair in this study refers to as the space in-between the
tabloid chair and slanted desk on the top. Table 4.5 shows the frequency (N) and
percentage (%) of the respondents’ level of exposure toward the space for table
32
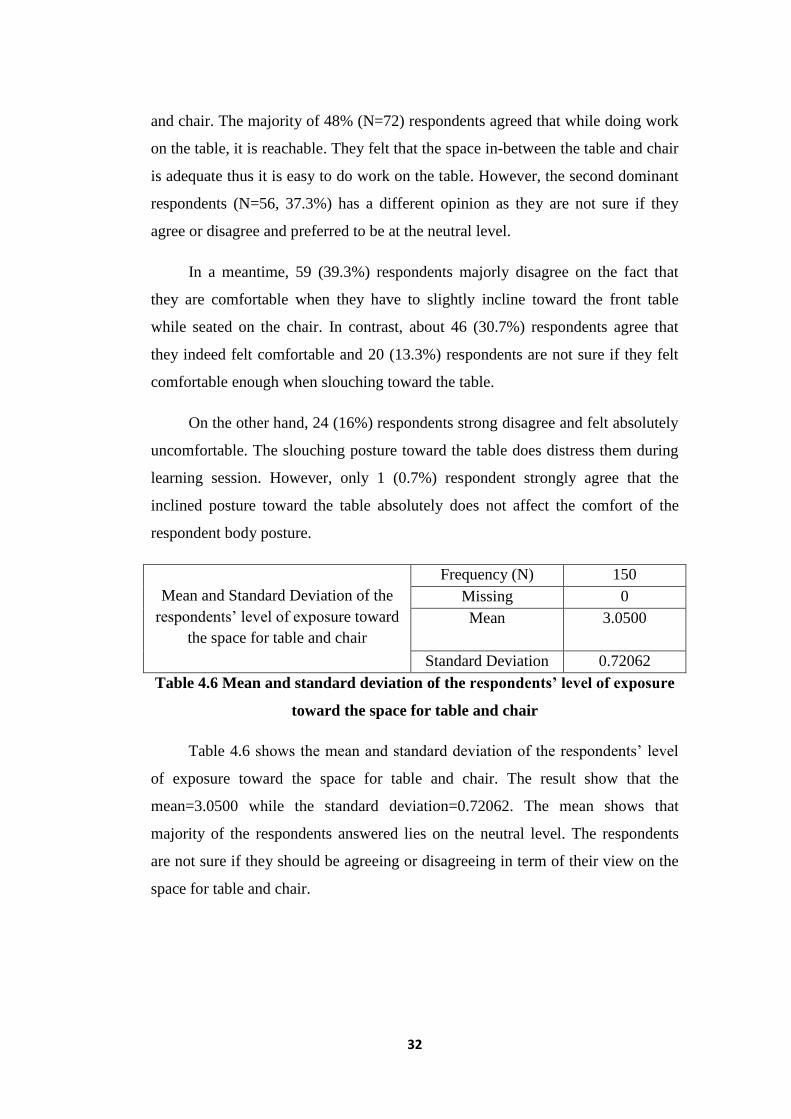
and chair. The majority of 48% (N=72) respondents agreed that while doing work
on the table, it is reachable. They felt that the space in-between the table and chair
is adequate thus it is easy to do work on the table. However, the second dominant
respondents (N=56, 37.3%) has a different opinion as they are not sure if they
agree or disagree and preferred to be at the neutral level.
In a meantime, 59 (39.3%) respondents majorly disagree on the fact that
they are comfortable when they have to slightly incline toward the front table
while seated on the chair. In contrast, about 46 (30.7%) respondents agree that
they indeed felt comfortable and 20 (13.3%) respondents are not sure if they felt
comfortable enough when slouching toward the table.
On the other hand, 24 (16%) respondents strong disagree and felt absolutely
uncomfortable. The slouching posture toward the table does distress them during
learning session. However, only 1 (0.7%) respondent strongly agree that the
inclined posture toward the table absolutely does not affect the comfort of the
respondent body posture.
Mean and Standard Deviation of the
respondents’ level of exposure toward
the space for table and chair
Frequency (N) 150
Missing 0
Mean
3.0500
Standard Deviation 0.72062
Table 4.6 Mean and standard deviation of the respondents’ level of exposure
toward the space for table and chair
Table 4.6 shows the mean and standard deviation of the respondents’ level
of exposure toward the space for table and chair. The result show that the
mean=3.0500 while the standard deviation=0.72062. The mean shows that
majority of the respondents answered lies on the neutral level. The respondents
are not sure if they should be agreeing or disagreeing in term of their view on the
space for table and chair.
33
Projector Screen Items
Strongly
Disagree
Disagree
Neutral
Agree
Strongly
Agree
N % N % N % N % N %
11. The projector display
maximum width of
visual toward the
projection screen
1
0.7
21
14.0
63
42.0
61
40.7
4
2.7
12. The projected screen
is situated directly
straight in front
3
2.0
27
18.0
48
32.0
64
42.7
8
5.3
13. While seated at the
chair at edge position
of lecture halls or
seminar rooms, it is
hard to see the
contain that are
projected on
projection screen
0
0
44
29.3
50
33.3
44
29.3
12
8.0
14. While sitting on the
front seat level,
student have to sit
relaxed to the back
rest with upright
posture to look at the
screen
5
3.3
30
20.0
25
16.7
64
42.7
26
17.3
15. The projection screen
is free from obvious
glare and reflections
0
0
25
16.7
45
30.0
70
46.7
10
6.7
16. The projection screen
show clear and easy
to see/readable
information and icon
0
0
38
25.3
53
35.3
57
38.0
2
1.3
Table 4.7 Frequency (N) and percentage (%) of the respondents’ level of
exposure toward the design of projector screen
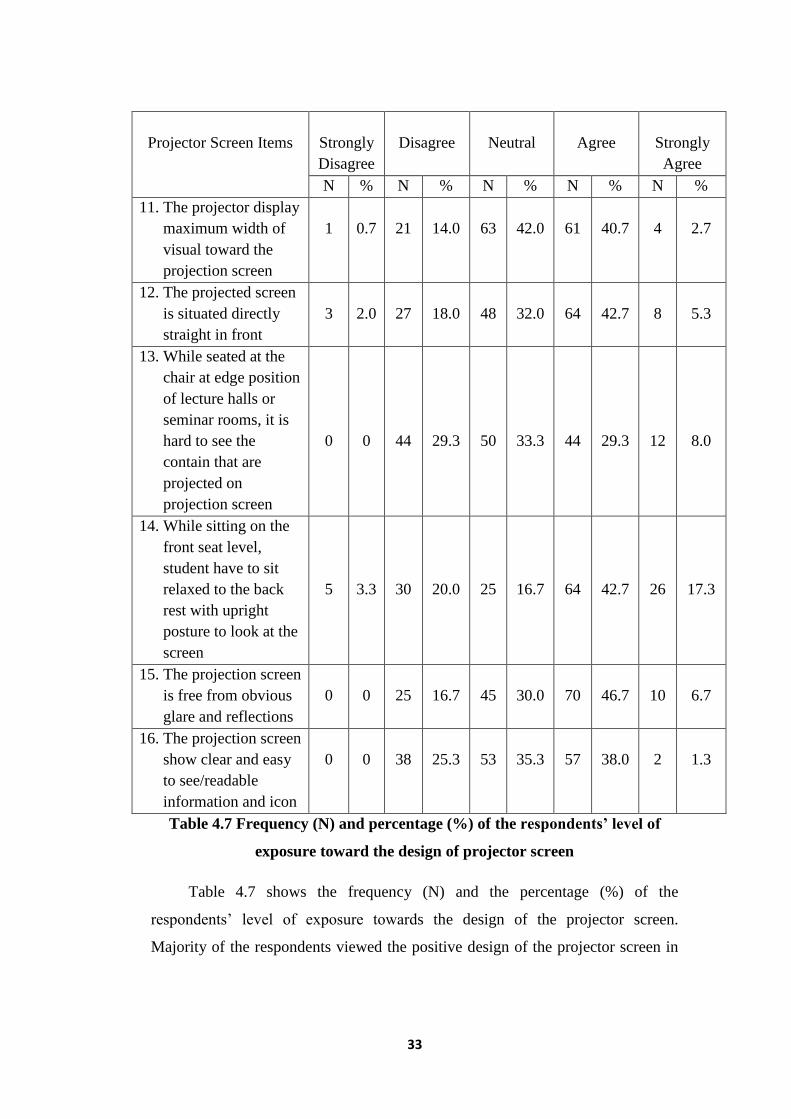
Table 4.7 shows the frequency (N) and the percentage (%) of the
respondents’ level of exposure towards the design of the projector screen.
Majority of the respondents viewed the positive design of the projector screen in
34
terms of the projector screen is being situated directly straight in front (N=64,
42.7%) of lecture halls and seminar rooms.
Meanwhile, the respondents majorly agreed that they have to be seated
relaxed onto the backrest with upright posture to look at the screen while sitting
on the front seat level (N=64, 42.7%). Indeed, 57 (38%) respondents agreed that
the projector screen show clear and readable information or icon although the
second dominant respondents (N=53, 35.3%) that disagreed on that question.
Nearly half of the respondents (N=70, 46.7%) has a positive view towards
the fact that the projector screen is free from obvious glare and reflections. In
contrast, only 25 (16.7%) respondents give responds and against the 70
respondents’ agreed thought regarding this question.
On the other hand, some respondents respond on the neutral level on the
certain questions regarding the design of the projector screen. The majority of the
respondents (N=63, 42%) are not really sure if the projector display maximum
width of visual on the projector screen, while the second dominant respondents
(N=61, 40.7%) agreed on that question.
In addition, the respondents (N=50, 33.3%) are not sure if sitting on the
chair at the edge of the position of the lecture halls and seminar rooms will give a
clear contain or visual on the projector screen. However, the respondents do
respond equivalently (N=44, 29.3%) on giving those agreed and disagreed thought
regarding this matter.
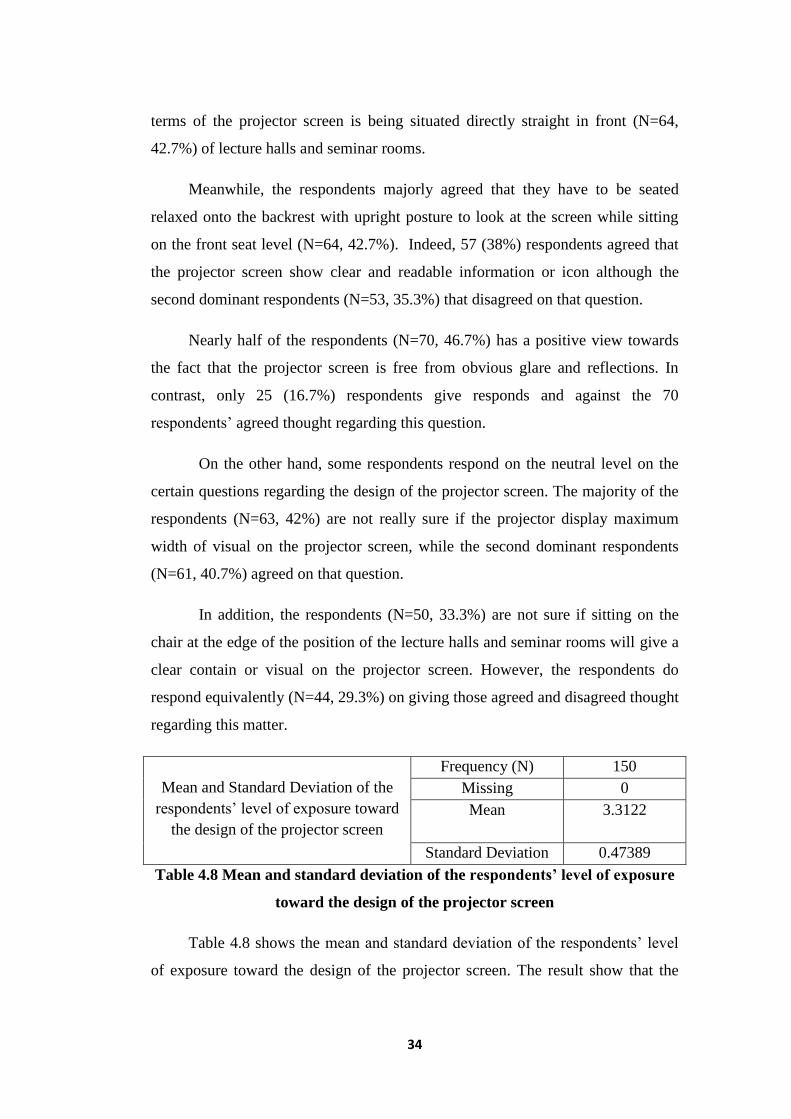
Mean and Standard Deviation of the
respondents’ level of exposure toward
the design of the projector screen
Frequency (N) 150
Missing 0
Mean
3.3122
Standard Deviation 0.47389
Table 4.8 Mean and standard deviation of the respondents’ level of exposure
toward the design of the projector screen
Table 4.8 shows the mean and standard deviation of the respondents’ level
of exposure toward the design of the projector screen. The result show that the
35
mean=3.3122 while the standard deviation=0.47389. The mean determine that
majority of the respondents answered lies on the neutral level. The respondents
are not sure if they should be agreeing or disagreeing in term of their view on the
design of the projector screen.
Lighting Items
Strongly
Disagree
Disagree
Neutral
Agree
Strongly
Agree
N % N % N % N % N %
17. The light of the
lecture halls and
seminar rooms is
adequate
1
0.7
24
16.0
43
28.7
76
50.7
6
4.0
18. The light of the
projector is adjust
according to the
light intensity of
the lecture halls
and seminar
rooms
5
3.3
52
34.7
41
27.3
49
32.7
3
2.0
19. The
glare/reflection/bl
ur visual display
on the projection
screen occur when
there is overhead
lighting
0
0
24
16.0
75
50.0
48
32.0
3
2.0
20. You have the
access to control
the brightness
light level of the
lecture halls and
seminar rooms.
11
7.3
51
34.0
47
31.3
38
25.3
3
2.0
Table 4.9 Frequency (N) and percentage (%) of the respondents’ level of
exposure toward the lighting condition
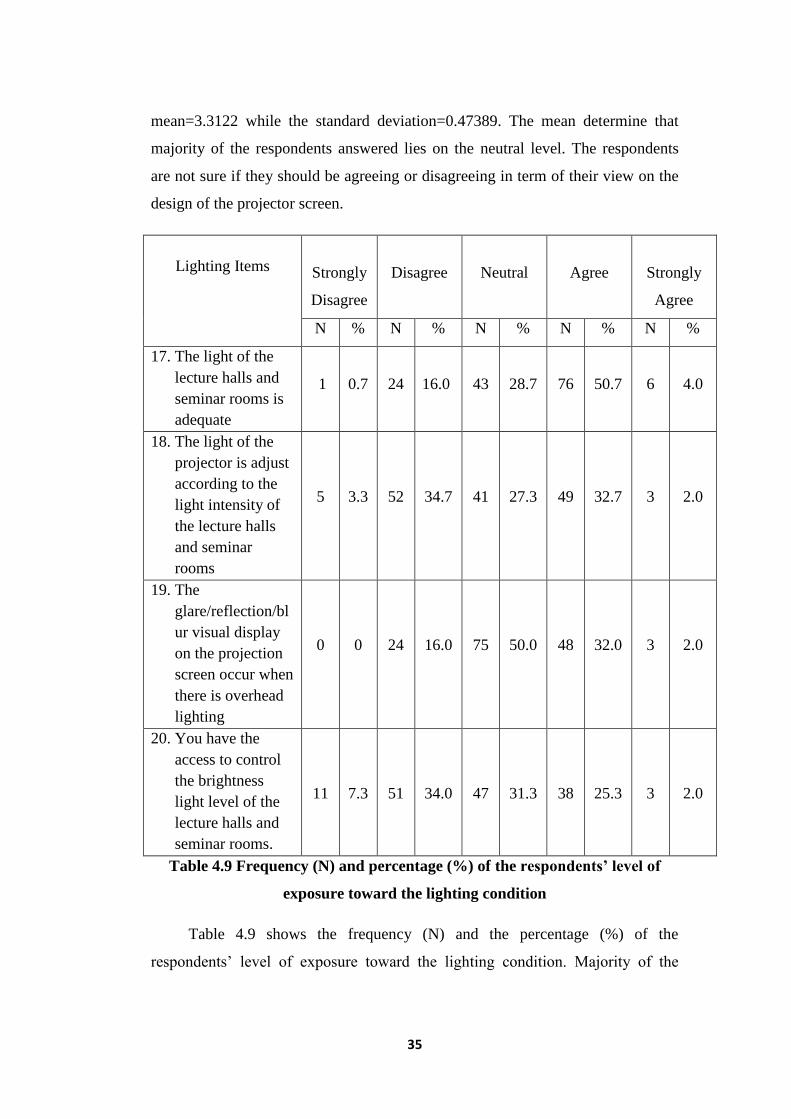
Table 4.9 shows the frequency (N) and the percentage (%) of the
respondents’ level of exposure toward the lighting condition. Majority of the
36
respondents viewed the positive lighting condition in terms the light is adequate
(N=76, 50.7%). More than half of the respondents agree that lighting condition
provided in the lecture halls and seminar rooms fulfilled their satisfaction and
sufficient. While, the second dominant respondents (N=43, 28.7%) unsure if the
lighting condition is adequate or vice versa. In addition, the exact half of the
respondents (N=75, 50%) also responded on the neutral level regarding their
opinion on the glare, reflection or blur effect on the projector screen. The
respondents are not sure if there is any glare, reflection or blur visual display
viewed on the projected screen due to the overhead lighting. While, 32% (N=48)
respondents positively felt that these effect are eventually occurred although 16%
(N=24) respondents responded disagree on that point.
However, the respondents (N=52, 34.7%) mostly felt that the light of the
projector is not adjusted according to the light intensity of the lecture halls and
seminar rooms. In contrast, the second dominant respondents (N=49, 32.7%) has a
different thought and agreed about the fact that the both of the light intensity can
be adjusted. There is only minority respondents that responded on both strongly
disagree (N=5, 3.3%) and strongly agree (N=3, 2%) on this matter.
Meanwhile, majority of the respondents (N=51, 34%) having a negative
view on the lighting’s access control ability. They thought that the lecture halls
and seminar rooms have insufficient lighting’s access control in term of
controlling the brightness lighting level. At the same time, a few respondents
(N=47, 31.3%) act on the neutral level while 25.3% (N=38) respondents
responded on the positive side regarding this question. Only minority that
answered both strongly disagree (N=11, 7.3%) and strongly agree (N=3, 2%).
Mean and Standard Deviation of the
respondents’ level of exposure toward
the lighting condition
Frequency (N) 150
Missing 0
Mean
3.0933
Standard Deviation 0.52340
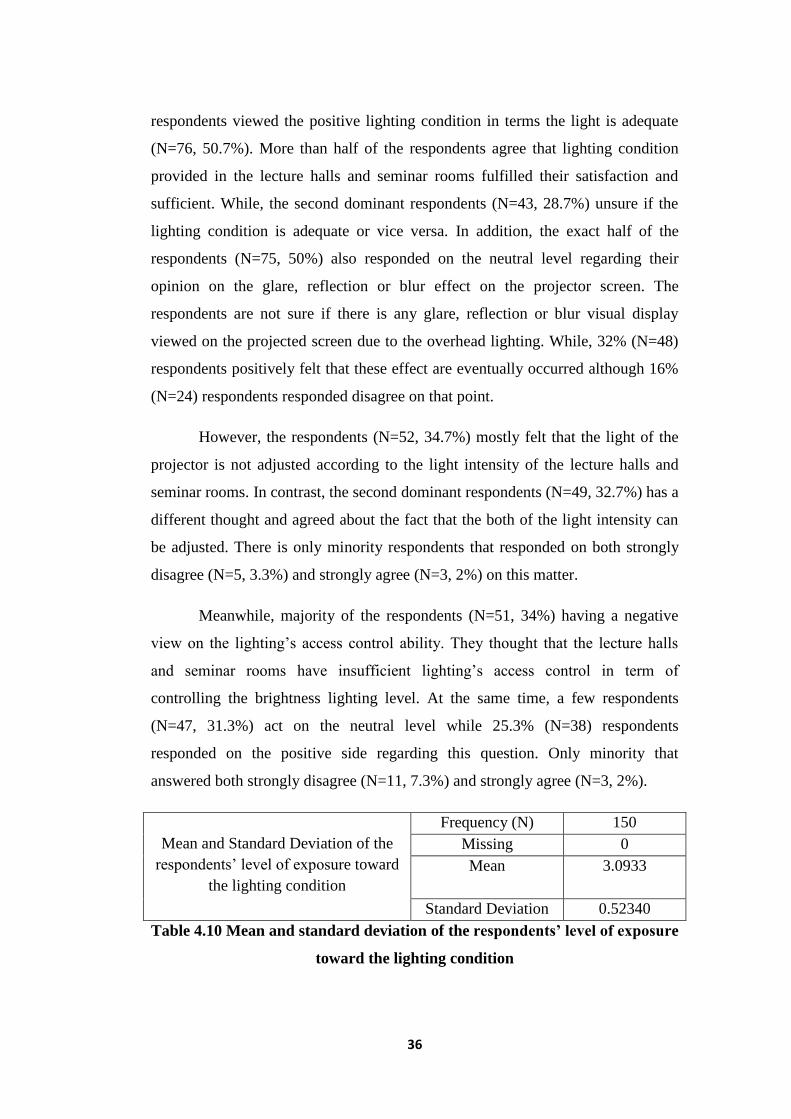
Table 4.10 Mean and standard deviation of the respondents’ level of exposure
toward the lighting condition
37
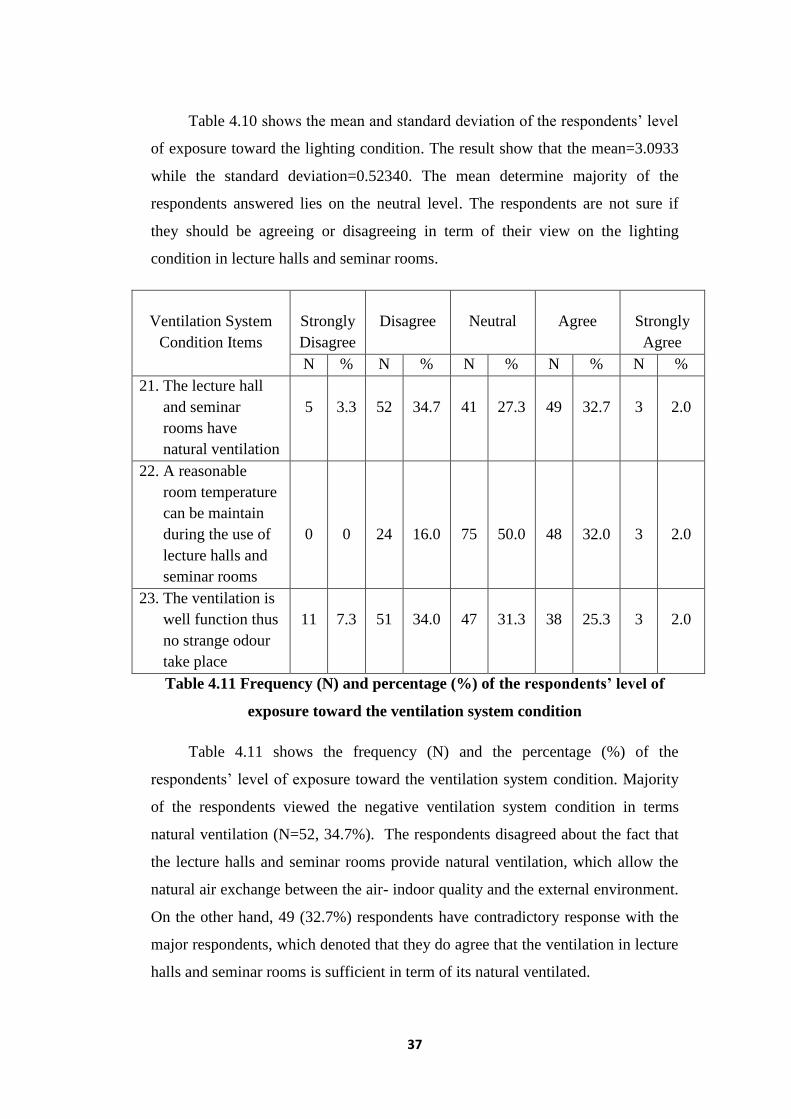
Table 4.10 shows the mean and standard deviation of the respondents’ level
of exposure toward the lighting condition. The result show that the mean=3.0933
while the standard deviation=0.52340. The mean determine majority of the
respondents answered lies on the neutral level. The respondents are not sure if
they should be agreeing or disagreeing in term of their view on the lighting
condition in lecture halls and seminar rooms.
Ventilation System
Condition Items
Strongly
Disagree
Disagree
Neutral
Agree
Strongly
Agree
N % N % N % N % N %
21. The lecture hall
and seminar
rooms have
natural ventilation
5
3.3
52
34.7
41
27.3
49
32.7
3
2.0
22. A reasonable
room temperature
can be maintain
during the use of
lecture halls and
seminar rooms
0
0
24
16.0
75
50.0
48
32.0
3
2.0
23. The ventilation is
well function thus
no strange odour
take place
11
7.3
51
34.0
47
31.3
38
25.3
3
2.0
Table 4.11 Frequency (N) and percentage (%) of the respondents’ level of
exposure toward the ventilation system condition
Table 4.11 shows the frequency (N) and the percentage (%) of the
respondents’ level of exposure toward the ventilation system condition. Majority
of the respondents viewed the negative ventilation system condition in terms
natural ventilation (N=52, 34.7%). The respondents disagreed about the fact that
the lecture halls and seminar rooms provide natural ventilation, which allow the
natural air exchange between the air- indoor quality and the external environment.
On the other hand, 49 (32.7%) respondents have contradictory response with the
major respondents, which denoted that they do agree that the ventilation in lecture
halls and seminar rooms is sufficient in term of its natural ventilated.
38
In addition, the majority of the respondents (N=51, 34%) disagree regarding
the ventilation’s well function system. The respondents do not feel that the
ventilation is functioned very well, thus this could bring some strange smelly
odour within the lecture halls and seminar rooms. While, 47 (31.3%) respondents
lies on the neutral level and 38 (25.3%) respondents agree on this question.
Meanwhile, half of the respondents (N=75, 50%) are not really sure if a
reasonable temperature can be maintain while using the lecture halls and seminar
rooms. However, 48 (32%) respondents are confident that the temperature can be
controlled if the indoor environment starts to feels too hot or too cold. Only
minority of 3 (2%) respondents strongly agree toward each of the 3 items of this
questionnaire.
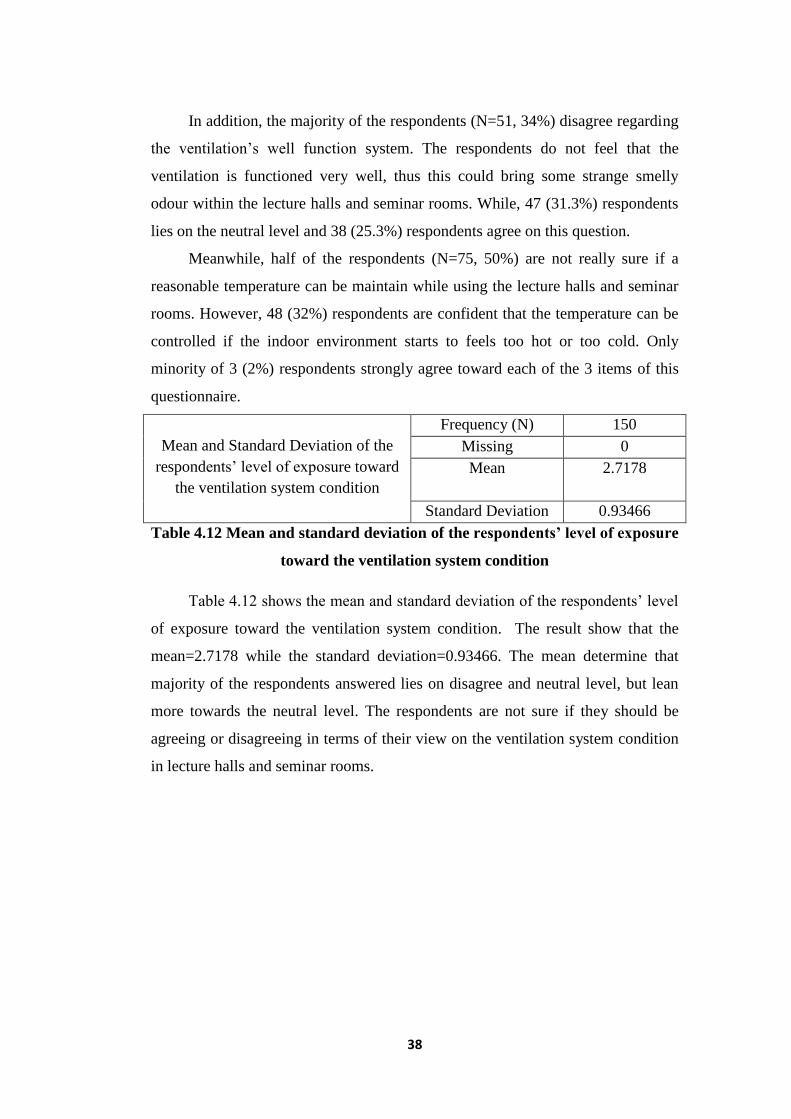
Mean and Standard Deviation of the
respondents’ level of exposure toward
the ventilation system condition
Frequency (N) 150
Missing 0
Mean
2.7178
Standard Deviation 0.93466
Table 4.12 Mean and standard deviation of the respondents’ level of exposure
toward the ventilation system condition
Table 4.12 shows the mean and standard deviation of the respondents’ level
of exposure toward the ventilation system condition. The result show that the
mean=2.7178 while the standard deviation=0.93466. The mean determine that
majority of the respondents answered lies on disagree and neutral level, but lean
more towards the neutral level. The respondents are not sure if they should be
agreeing or disagreeing in terms of their view on the ventilation system condition
in lecture halls and seminar rooms.
39
4.2 Inferential Analysis
4.2.1 The Analysis of Variance (ANOVA)
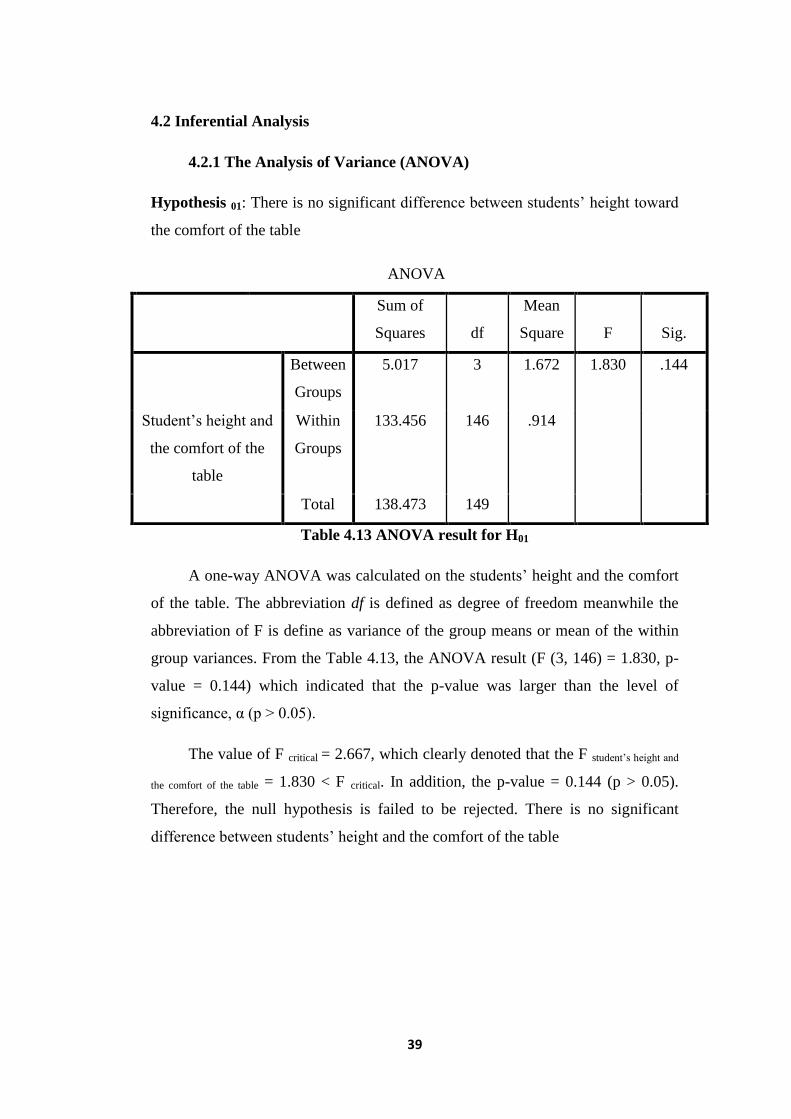
Hypothesis 01: There is no significant difference between students’ height toward
the comfort of the table
Table 4.13 ANOVA result for H01
A one-way ANOVA was calculated on the students’ height and the comfort
of the table. The abbreviation df is defined as degree of freedom meanwhile the
abbreviation of F is define as variance of the group means or mean of the within
group variances. From the Table 4.13, the ANOVA result (F (3, 146) = 1.830, p-
value = 0.144) which indicated that the p-value was larger than the level of
significance, α (p > 0.05).
The value of F critical = 2.667, which clearly denoted that the F student’s height and
the comfort of the table = 1.830 < F critical. In addition, the p-value = 0.144 (p > 0.05).
Therefore, the null hypothesis is failed to be rejected. There is no significant
difference between students’ height and the comfort of the table
ANOVA
Sum of
Squares df
Mean
Square F Sig.
Between
Groups
5.017 3 1.672 1.830 .144
Student’s height and
the comfort of the
table
Within
Groups
133.456 146 .914
Total 138.473 149
40
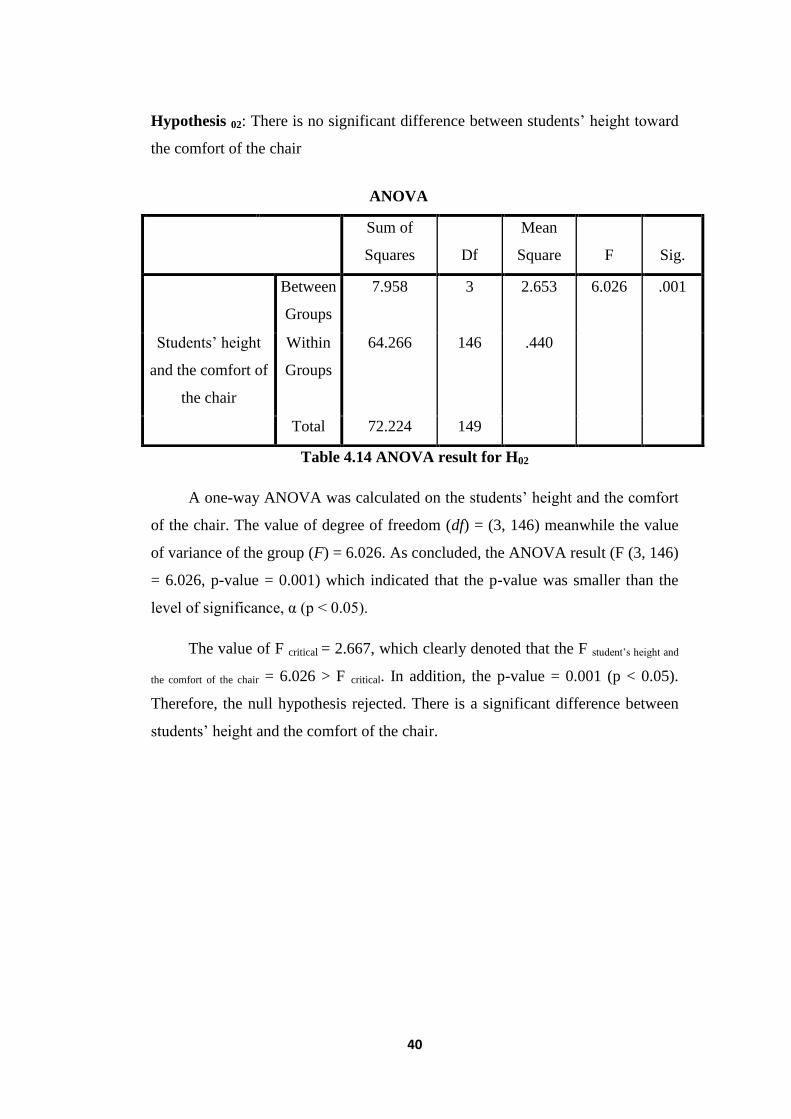
Hypothesis 02: There is no significant difference between students’ height toward
the comfort of the chair
Table 4.14 ANOVA result for H02
A one-way ANOVA was calculated on the students’ height and the comfort
of the chair. The value of degree of freedom (df) = (3, 146) meanwhile the value
of variance of the group (F) = 6.026. As concluded, the ANOVA result (F (3, 146)
= 6.026, p-value = 0.001) which indicated that the p-value was smaller than the
level of significance, α (p < 0.05).
The value of F critical = 2.667, which clearly denoted that the F student’s height and
the comfort of the chair = 6.026 > F critical. In addition, the p-value = 0.001 (p < 0.05).
Therefore, the null hypothesis rejected. There is a significant difference between
students’ height and the comfort of the chair.
ANOVA
Sum of
Squares Df
Mean
Square F Sig.
Between
Groups
7.958 3 2.653 6.026 .001
Students’ height
and the comfort of
the chair
Within
Groups
64.266 146 .440
Total 72.224 149
41
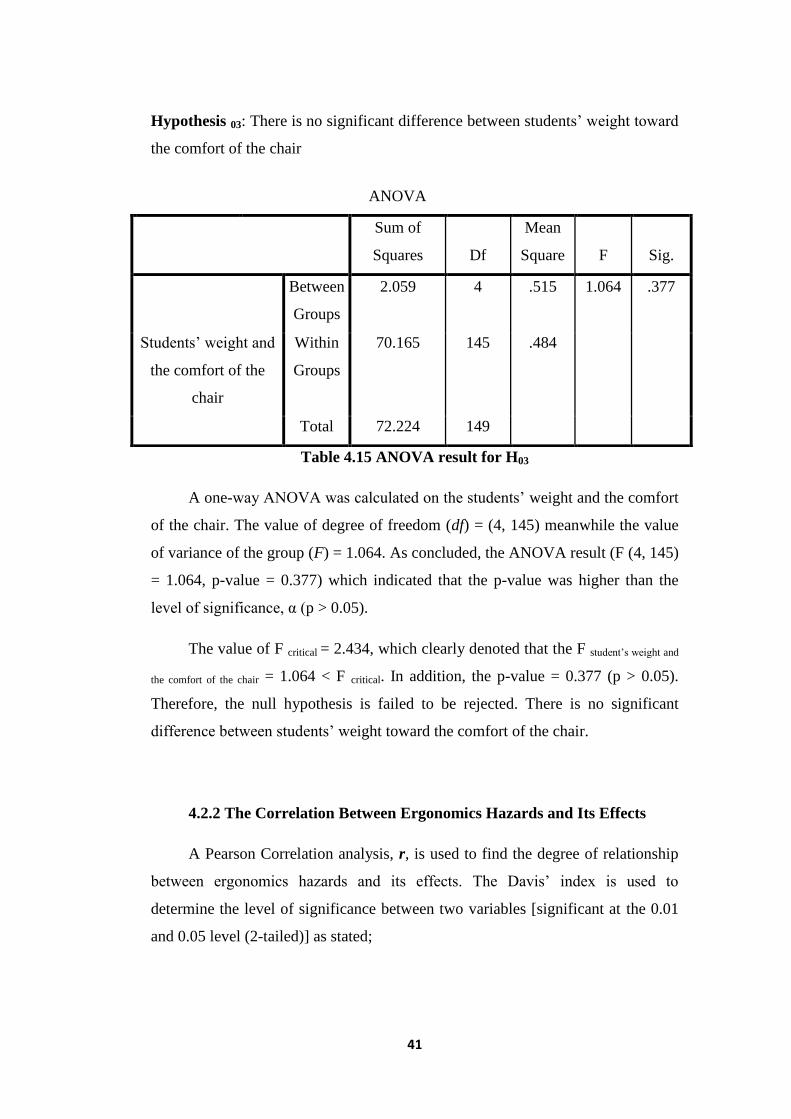
Hypothesis 03: There is no significant difference between students’ weight toward
the comfort of the chair
Table 4.15 ANOVA result for H03
A one-way ANOVA was calculated on the students’ weight and the comfort
of the chair. The value of degree of freedom (df) = (4, 145) meanwhile the value
of variance of the group (F) = 1.064. As concluded, the ANOVA result (F (4, 145)
= 1.064, p-value = 0.377) which indicated that the p-value was higher than the
level of significance, α (p > 0.05).
The value of F critical = 2.434, which clearly denoted that the F student’s weight and
the comfort of the chair = 1.064 < F critical. In addition, the p-value = 0.377 (p > 0.05).
Therefore, the null hypothesis is failed to be rejected. There is no significant
difference between students’ weight toward the comfort of the chair.
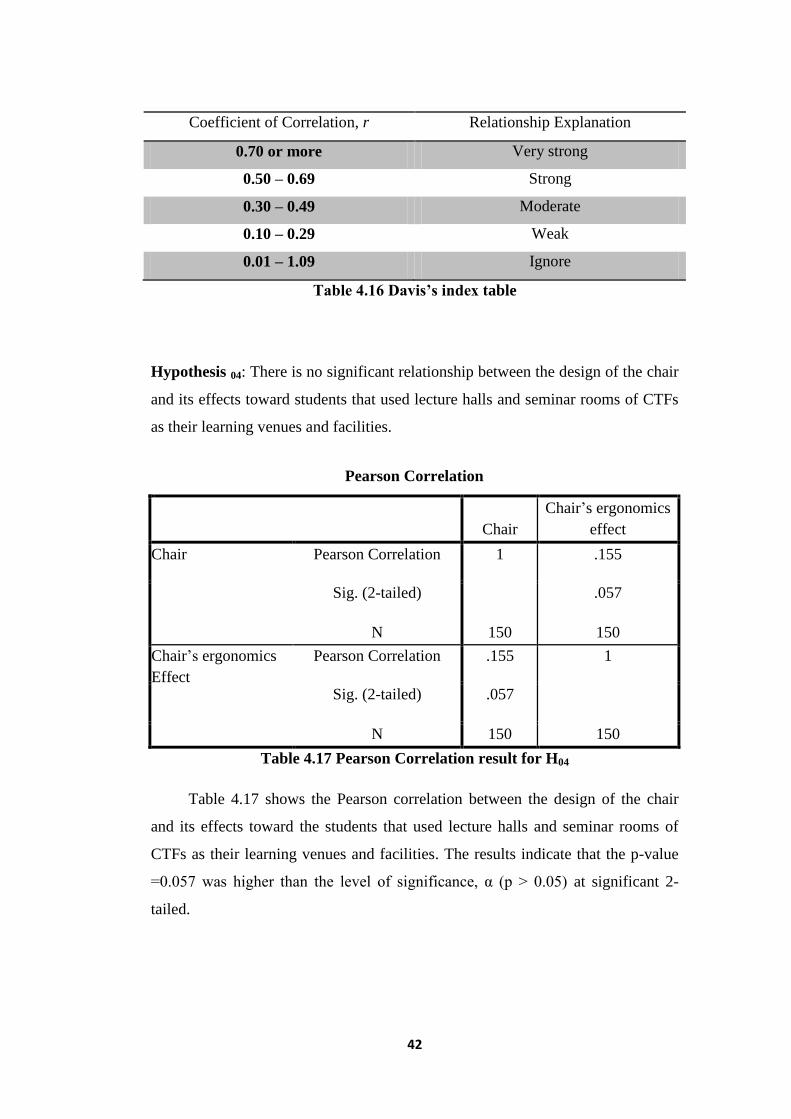
4.2.2 The Correlation Between Ergonomics Hazards and Its Effects
A Pearson Correlation analysis, r, is used to find the degree of relationship
between ergonomics hazards and its effects. The Davis’ index is used to
determine the level of significance between two variables [significant at the 0.01
and 0.05 level (2-tailed)] as stated;
ANOVA
Sum of
Squares Df
Mean
Square F Sig.
Between
Groups
2.059 4 .515 1.064 .377
Students’ weight and
the comfort of the
chair
Within
Groups
70.165 145 .484
Total 72.224 149
42
Coefficient of Correlation, r Relationship Explanation
0.70 or more Very strong
0.50 – 0.69 Strong
0.30 – 0.49 Moderate
0.10 – 0.29 Weak
0.01 – 1.09 Ignore
Table 4.16 Davis’s index table
Hypothesis 04: There is no significant relationship between the design of the chair
and its effects toward students that used lecture halls and seminar rooms of CTFs
as their learning venues and facilities.
Pearson Correlation
Chair
Chair’s ergonomics
effect
Chair Pearson Correlation 1 .155
Sig. (2-tailed)
.057
N 150 150
Chair’s ergonomics
Effect
Pearson Correlation .155 1
Sig. (2-tailed) .057
N 150 150
Table 4.17 Pearson Correlation result for H04
Table 4.17 shows the Pearson correlation between the design of the chair
and its effects toward the students that used lecture halls and seminar rooms of
CTFs as their learning venues and facilities. The results indicate that the p-value
=0.057 was higher than the level of significance, α (p > 0.05) at significant 2-
tailed.
43
The Pearson correlation value, r = 0.155 lies on the range 0.10 – 0.29 of
correlation. Since the p-value = 0.057 (p > 0.05), therefore, the null hypothesis is
failed to be rejected. There is no significant relationship between the design of the
chair and its effects toward the students that use CTFs.
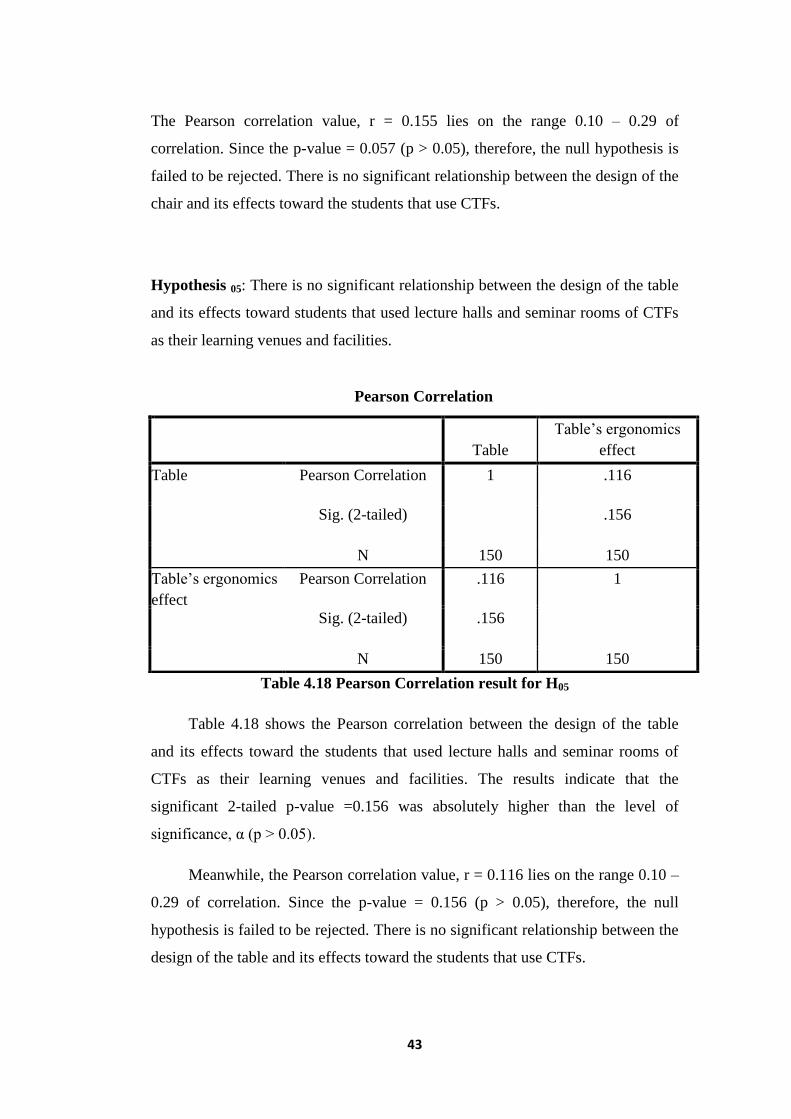
Hypothesis 05: There is no significant relationship between the design of the table
and its effects toward students that used lecture halls and seminar rooms of CTFs
as their learning venues and facilities.
Table 4.18 Pearson Correlation result for H05
Table 4.18 shows the Pearson correlation between the design of the table
and its effects toward the students that used lecture halls and seminar rooms of
CTFs as their learning venues and facilities. The results indicate that the
significant 2-tailed p-value =0.156 was absolutely higher than the level of
significance, α (p > 0.05).
Meanwhile, the Pearson correlation value, r = 0.116 lies on the range 0.10 –
0.29 of correlation. Since the p-value = 0.156 (p > 0.05), therefore, the null
hypothesis is failed to be rejected. There is no significant relationship between the
design of the table and its effects toward the students that use CTFs.
Pearson Correlation
Table
Table’s ergonomics
effect
Table Pearson Correlation 1 .116
Sig. (2-tailed)
.156
N 150 150
Table’s ergonomics
effect
Pearson Correlation .116 1
Sig. (2-tailed) .156
N 150 150
44
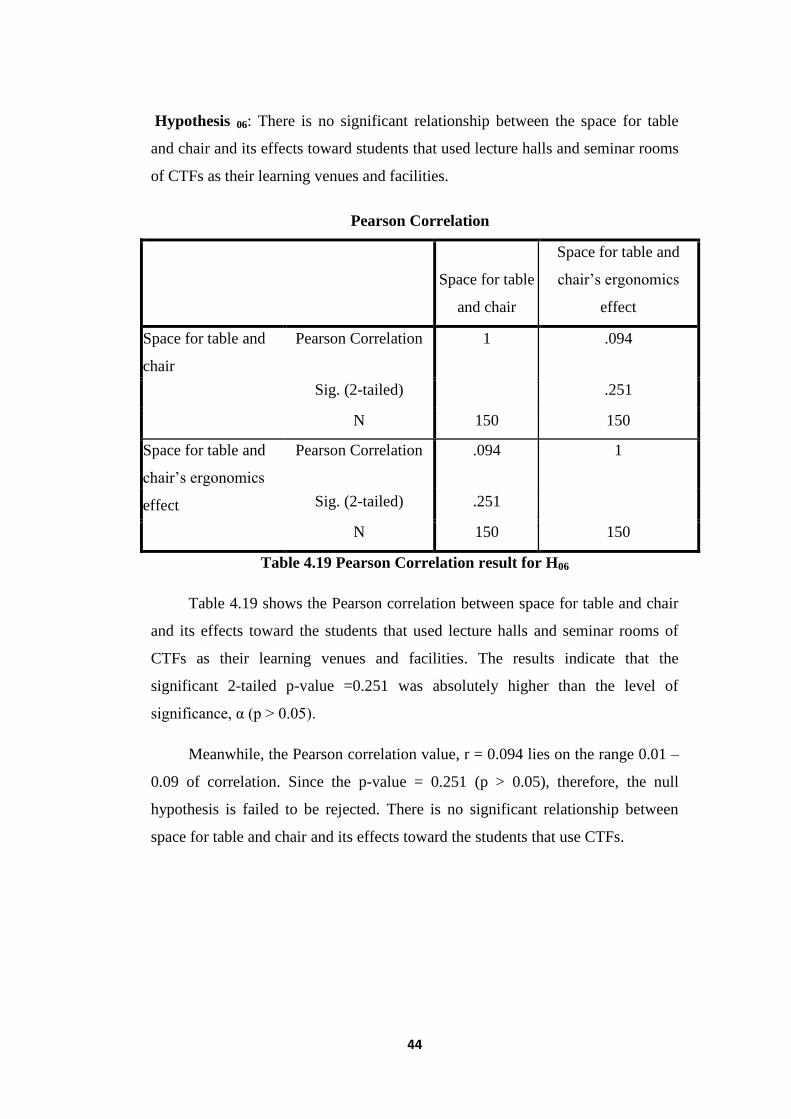
Hypothesis 06: There is no significant relationship between the space for table
and chair and its effects toward students that used lecture halls and seminar rooms
of CTFs as their learning venues and facilities.
Table 4.19 Pearson Correlation result for H06
Table 4.19 shows the Pearson correlation between space for table and chair
and its effects toward the students that used lecture halls and seminar rooms of
CTFs as their learning venues and facilities. The results indicate that the
significant 2-tailed p-value =0.251 was absolutely higher than the level of
significance, α (p > 0.05).
Meanwhile, the Pearson correlation value, r = 0.094 lies on the range 0.01 –
0.09 of correlation. Since the p-value = 0.251 (p > 0.05), therefore, the null
hypothesis is failed to be rejected. There is no significant relationship between
space for table and chair and its effects toward the students that use CTFs.
Pearson Correlation
Space for table
and chair
Space for table and
chair’s ergonomics
effect
Space for table and
chair
Pearson Correlation 1 .094
Sig. (2-tailed)
.251
N 150 150
Space for table and
chair’s ergonomics
effect
Pearson Correlation .094 1
Sig. (2-tailed) .251
N 150 150
45
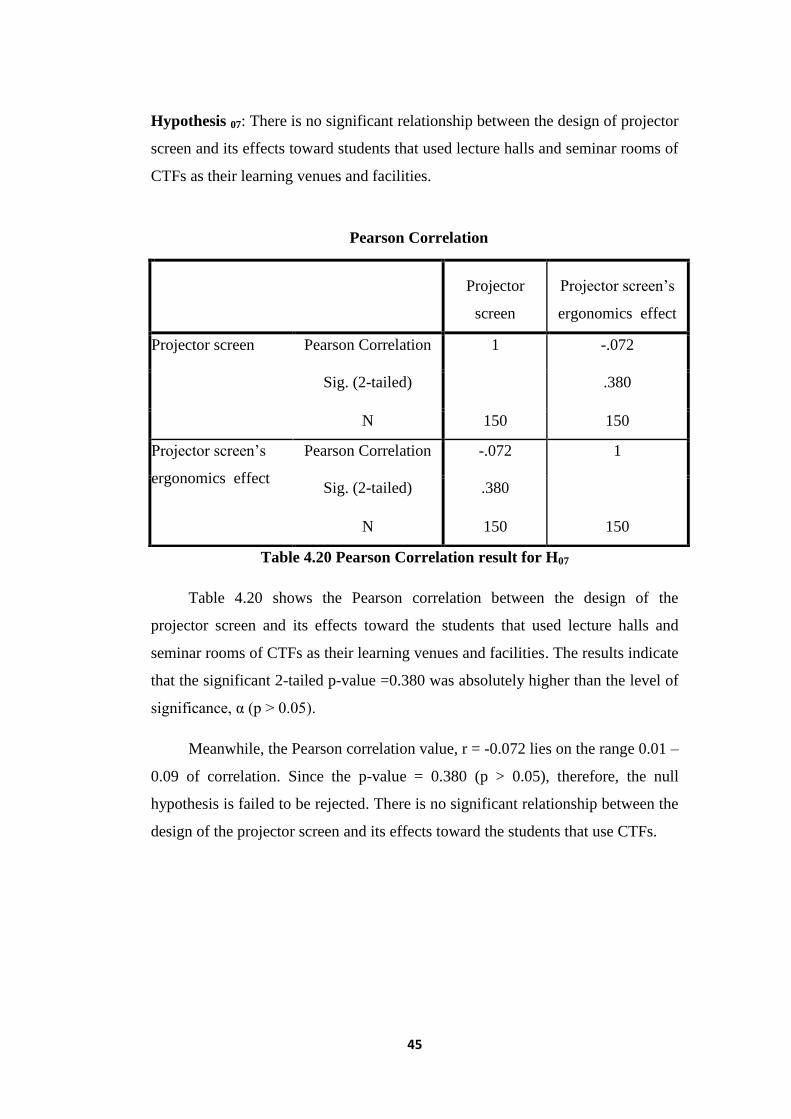
Hypothesis 07: There is no significant relationship between the design of projector
screen and its effects toward students that used lecture halls and seminar rooms of
CTFs as their learning venues and facilities.
Table 4.20 Pearson Correlation result for H07
Table 4.20 shows the Pearson correlation between the design of the
projector screen and its effects toward the students that used lecture halls and
seminar rooms of CTFs as their learning venues and facilities. The results indicate
that the significant 2-tailed p-value =0.380 was absolutely higher than the level of
significance, α (p > 0.05).
Meanwhile, the Pearson correlation value, r = -0.072 lies on the range 0.01 –
0.09 of correlation. Since the p-value = 0.380 (p > 0.05), therefore, the null
hypothesis is failed to be rejected. There is no significant relationship between the
design of the projector screen and its effects toward the students that use CTFs.
Pearson Correlation
Projector
screen
Projector screen’s
ergonomics effect
Projector screen Pearson Correlation 1 -.072
Sig. (2-tailed)
.380
N 150 150
Projector screen’s
ergonomics effect
Pearson Correlation -.072 1
Sig. (2-tailed) .380
N 150 150
46
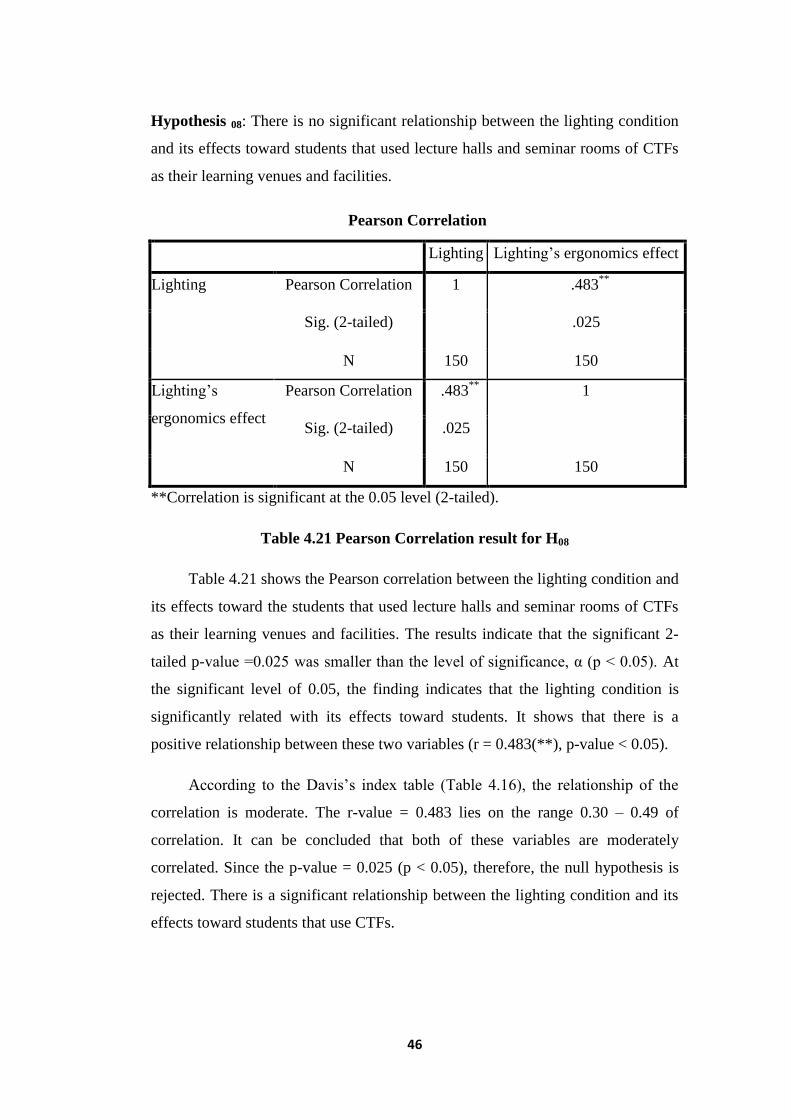
Hypothesis 08: There is no significant relationship between the lighting condition
and its effects toward students that used lecture halls and seminar rooms of CTFs
as their learning venues and facilities.
**Correlation is significant at the 0.05 level (2-tailed).
Table 4.21 Pearson Correlation result for H08
Table 4.21 shows the Pearson correlation between the lighting condition and
its effects toward the students that used lecture halls and seminar rooms of CTFs
as their learning venues and facilities. The results indicate that the significant 2-
tailed p-value =0.025 was smaller than the level of significance, α (p < 0.05). At
the significant level of 0.05, the finding indicates that the lighting condition is
significantly related with its effects toward students. It shows that there is a
positive relationship between these two variables (r = 0.483(**), p-value < 0.05).
According to the Davis’s index table (Table 4.16), the relationship of the
correlation is moderate. The r-value = 0.483 lies on the range 0.30 – 0.49 of
correlation. It can be concluded that both of these variables are moderately
correlated. Since the p-value = 0.025 (p < 0.05), therefore, the null hypothesis is
rejected. There is a significant relationship between the lighting condition and its
effects toward students that use CTFs.
Pearson Correlation
Lighting Lighting’s ergonomics effect
Lighting Pearson Correlation 1 .483**
Sig. (2-tailed)
.025
N 150 150
Lighting’s
ergonomics effect
Pearson Correlation .483**
1
Sig. (2-tailed) .025
N 150 150
47
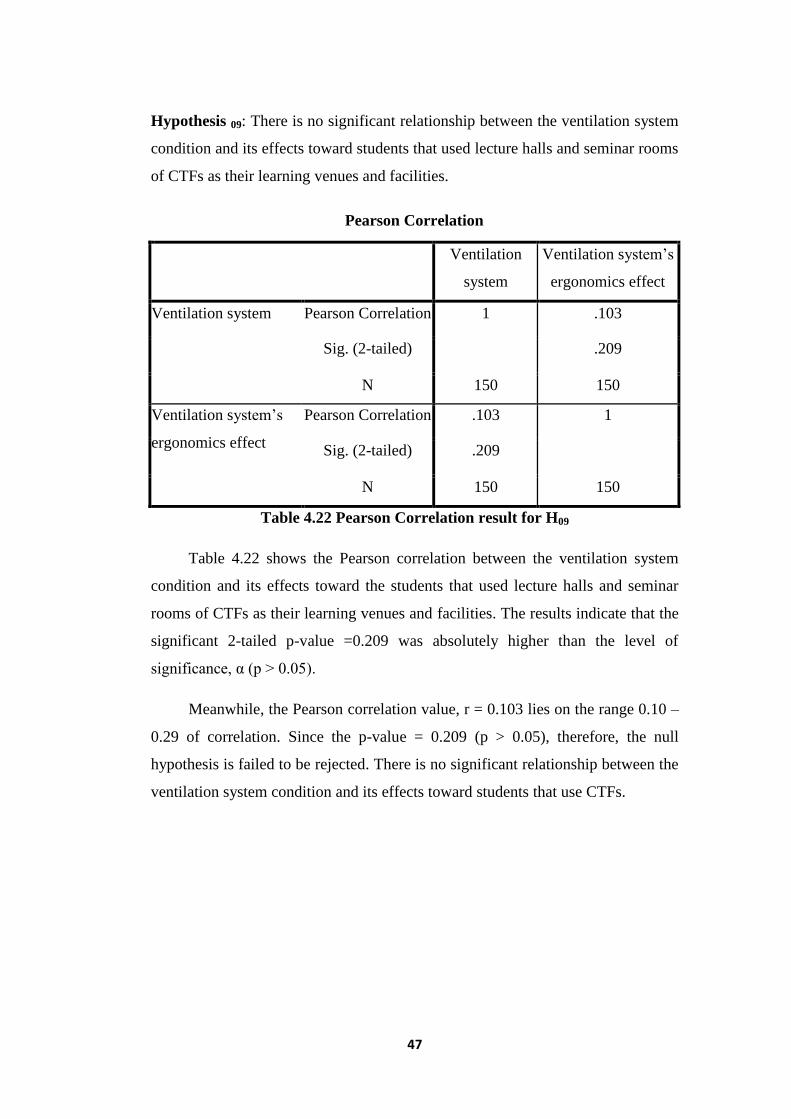
Hypothesis 09: There is no significant relationship between the ventilation system
condition and its effects toward students that used lecture halls and seminar rooms
of CTFs as their learning venues and facilities.
Pearson Correlation
Ventilation
system
Ventilation system’s
ergonomics effect
Ventilation system Pearson Correlation 1 .103
Sig. (2-tailed)
.209
N 150 150
Ventilation system’s
ergonomics effect
Pearson Correlation .103 1
Sig. (2-tailed) .209
N 150 150
Table 4.22 Pearson Correlation result for H09
Table 4.22 shows the Pearson correlation between the ventilation system
condition and its effects toward the students that used lecture halls and seminar
rooms of CTFs as their learning venues and facilities. The results indicate that the
significant 2-tailed p-value =0.209 was absolutely higher than the level of
significance, α (p > 0.05).
Meanwhile, the Pearson correlation value, r = 0.103 lies on the range 0.10 –
0.29 of correlation. Since the p-value = 0.209 (p > 0.05), therefore, the null
hypothesis is failed to be rejected. There is no significant relationship between the
ventilation system condition and its effects toward students that use CTFs.
48
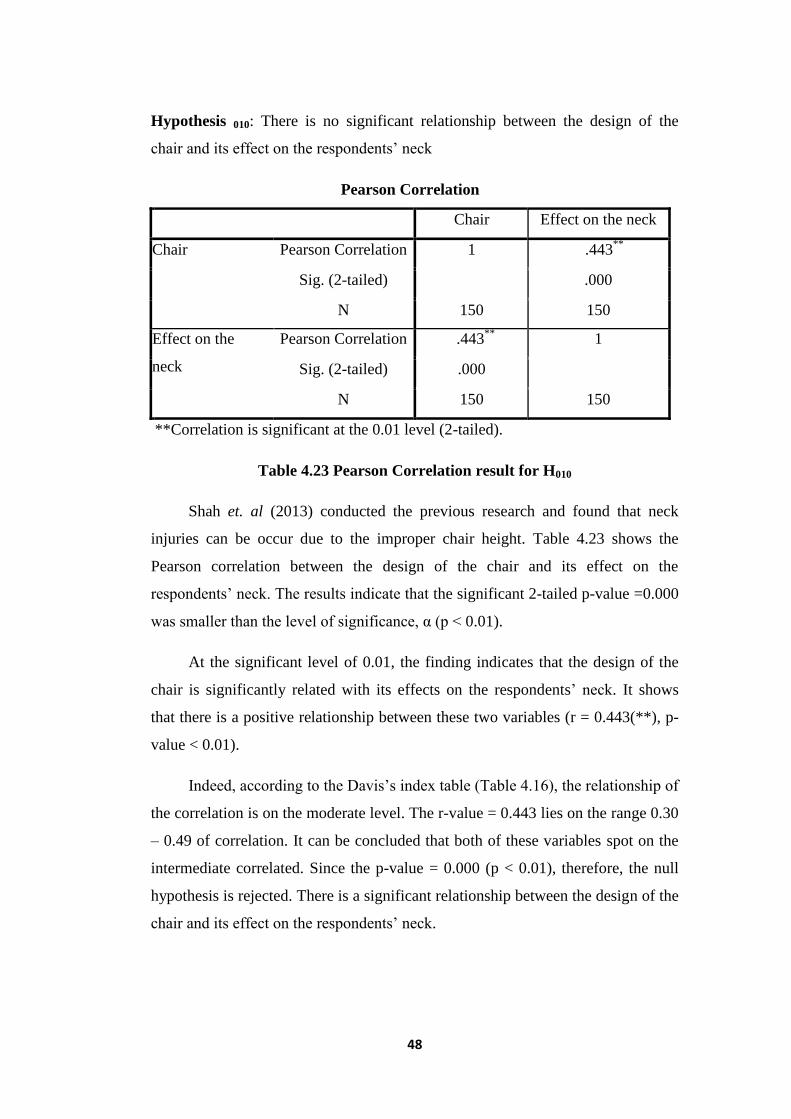
Hypothesis 010: There is no significant relationship between the design of the
chair and its effect on the respondents’ neck
Pearson Correlation
Chair Effect on the neck
Chair Pearson Correlation 1 .443**
Sig. (2-tailed) .000
N 150 150
Effect on the
neck
Pearson Correlation .443**
1
Sig. (2-tailed) .000
N 150 150
**Correlation is significant at the 0.01 level (2-tailed).
Table 4.23 Pearson Correlation result for H010
Shah et. al (2013) conducted the previous research and found that neck
injuries can be occur due to the improper chair height. Table 4.23 shows the
Pearson correlation between the design of the chair and its effect on the
respondents’ neck. The results indicate that the significant 2-tailed p-value =0.000
was smaller than the level of significance, α (p < 0.01).
At the significant level of 0.01, the finding indicates that the design of the
chair is significantly related with its effects on the respondents’ neck. It shows
that there is a positive relationship between these two variables (r = 0.443(**), p-
value < 0.01).
Indeed, according to the Davis’s index table (Table 4.16), the relationship of
the correlation is on the moderate level. The r-value = 0.443 lies on the range 0.30
– 0.49 of correlation. It can be concluded that both of these variables spot on the
intermediate correlated. Since the p-value = 0.000 (p < 0.01), therefore, the null
hypothesis is rejected. There is a significant relationship between the design of the
chair and its effect on the respondents’ neck.
49
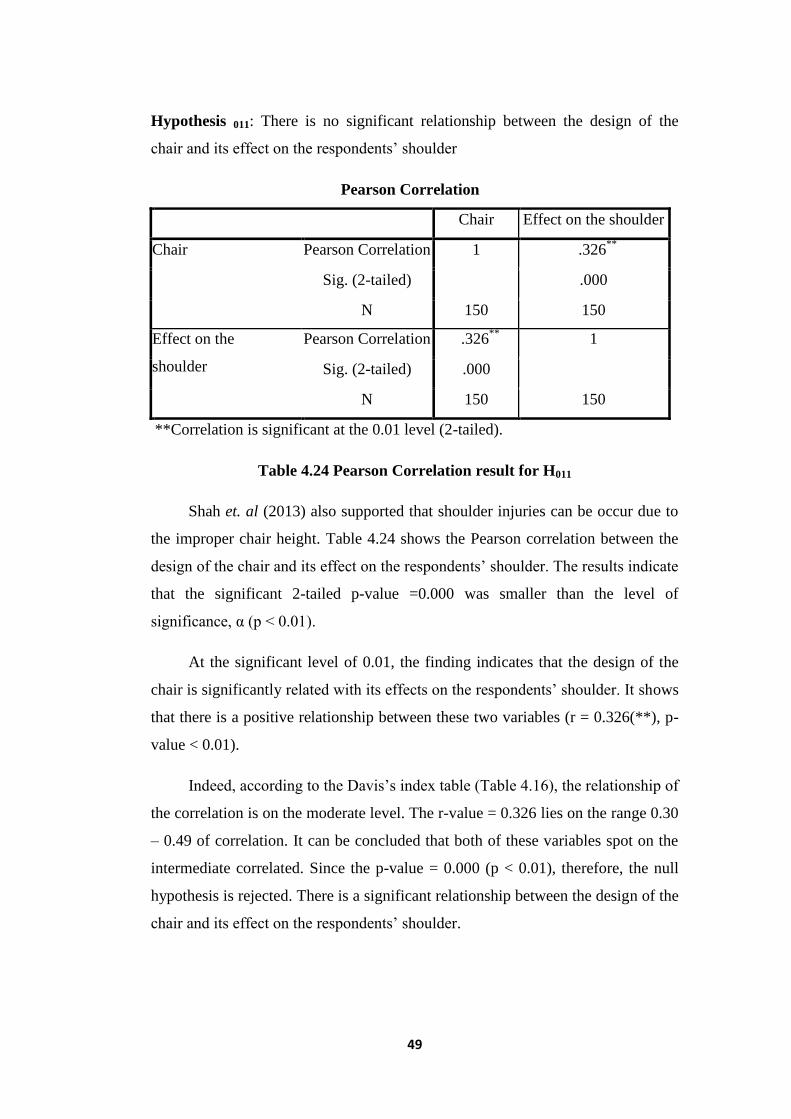
Hypothesis 011: There is no significant relationship between the design of the
chair and its effect on the respondents’ shoulder
Pearson Correlation
Chair Effect on the shoulder
Chair Pearson Correlation 1 .326**
Sig. (2-tailed) .000
N 150 150
Effect on the
shoulder
Pearson Correlation .326**
1
Sig. (2-tailed) .000
N 150 150
**Correlation is significant at the 0.01 level (2-tailed).
Table 4.24 Pearson Correlation result for H011
Shah et. al (2013) also supported that shoulder injuries can be occur due to
the improper chair height. Table 4.24 shows the Pearson correlation between the
design of the chair and its effect on the respondents’ shoulder. The results indicate
that the significant 2-tailed p-value =0.000 was smaller than the level of
significance, α (p < 0.01).
At the significant level of 0.01, the finding indicates that the design of the
chair is significantly related with its effects on the respondents’ shoulder. It shows
that there is a positive relationship between these two variables (r = 0.326(**), p-
value < 0.01).
Indeed, according to the Davis’s index table (Table 4.16), the relationship of
the correlation is on the moderate level. The r-value = 0.326 lies on the range 0.30
– 0.49 of correlation. It can be concluded that both of these variables spot on the
intermediate correlated. Since the p-value = 0.000 (p < 0.01), therefore, the null
hypothesis is rejected. There is a significant relationship between the design of the
chair and its effect on the respondents’ shoulder.
50
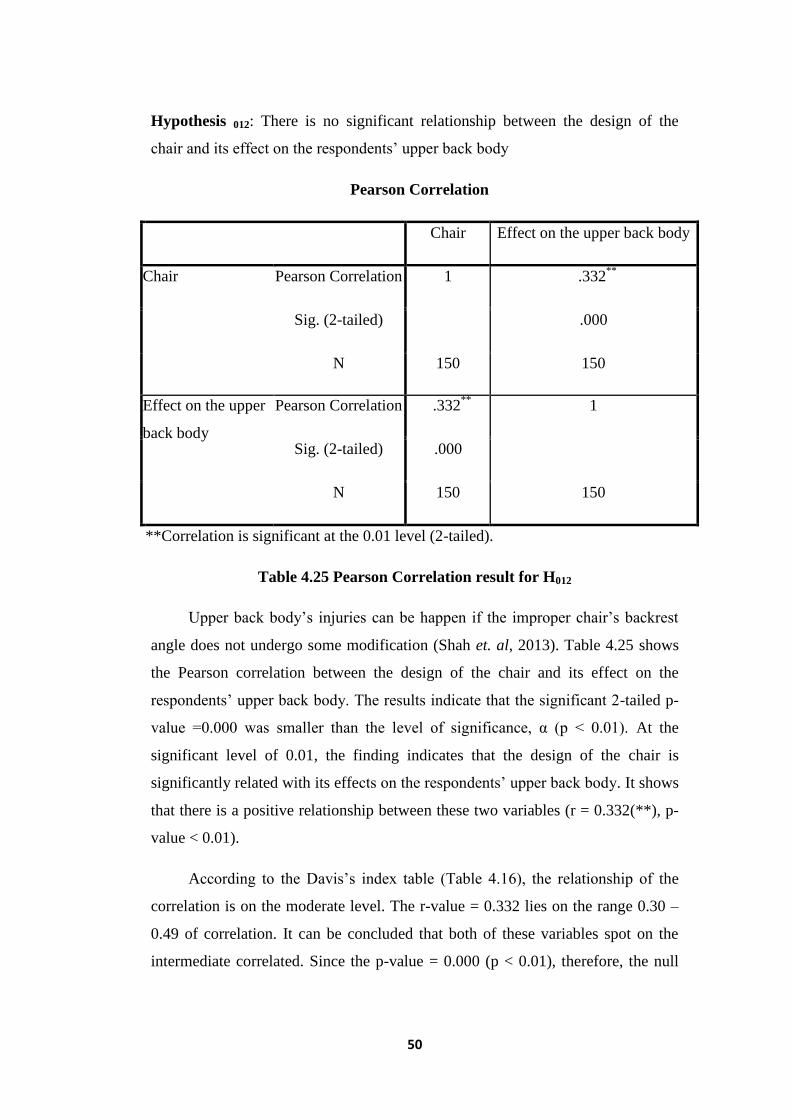
Hypothesis 012: There is no significant relationship between the design of the
chair and its effect on the respondents’ upper back body
Pearson Correlation
Chair Effect on the upper back body
Chair Pearson Correlation 1 .332**
Sig. (2-tailed) .000
N 150 150
Effect on the upper
back body
Pearson Correlation .332**
1
Sig. (2-tailed) .000
N 150 150
**Correlation is significant at the 0.01 level (2-tailed).
Table 4.25 Pearson Correlation result for H012
Upper back body’s injuries can be happen if the improper chair’s backrest
angle does not undergo some modification (Shah et. al, 2013). Table 4.25 shows
the Pearson correlation between the design of the chair and its effect on the
respondents’ upper back body. The results indicate that the significant 2-tailed p-
value =0.000 was smaller than the level of significance, α (p < 0.01). At the
significant level of 0.01, the finding indicates that the design of the chair is
significantly related with its effects on the respondents’ upper back body. It shows
that there is a positive relationship between these two variables (r = 0.332(**), p-
value < 0.01).
According to the Davis’s index table (Table 4.16), the relationship of the
correlation is on the moderate level. The r-value = 0.332 lies on the range 0.30 –
0.49 of correlation. It can be concluded that both of these variables spot on the
intermediate correlated. Since the p-value = 0.000 (p < 0.01), therefore, the null
51
hypothesis is rejected. There is a significant relationship between the design of the
chair and its effect on the respondents’ upper back body.
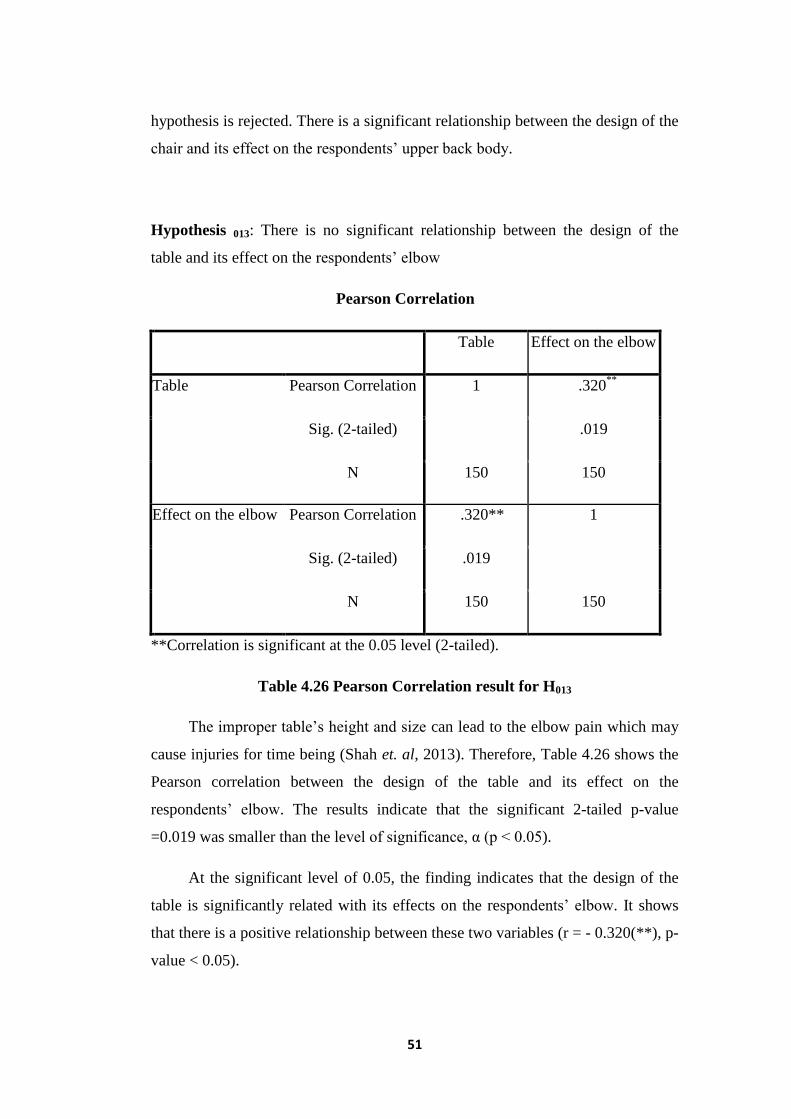
Hypothesis 013: There is no significant relationship between the design of the
table and its effect on the respondents’ elbow
Pearson Correlation
Table Effect on the elbow
Table Pearson Correlation 1 .320**
Sig. (2-tailed) .019
N 150 150
Effect on the elbow Pearson Correlation .320** 1
Sig. (2-tailed) .019
N 150 150
**Correlation is significant at the 0.05 level (2-tailed).
Table 4.26 Pearson Correlation result for H013
The improper table’s height and size can lead to the elbow pain which may
cause injuries for time being (Shah et. al, 2013). Therefore, Table 4.26 shows the
Pearson correlation between the design of the table and its effect on the
respondents’ elbow. The results indicate that the significant 2-tailed p-value
=0.019 was smaller than the level of significance, α (p < 0.05).
At the significant level of 0.05, the finding indicates that the design of the
table is significantly related with its effects on the respondents’ elbow. It shows
that there is a positive relationship between these two variables (r = - 0.320(**), p-
value < 0.05).
52
Indeed, according to the Davis’s index table (Table 4.16), the relationship of
the correlation is moderate. The r-value = 0.320 lies on the range 0.30 – 0.49 of
correlation. It can be concluded that both of these variables are moderately
correlated. Since the p-value = 0.019 (p < 0.05), therefore, the null hypothesis is
rejected. There is a significant relationship between the design of the table and its
effect on the respondents’ elbow.
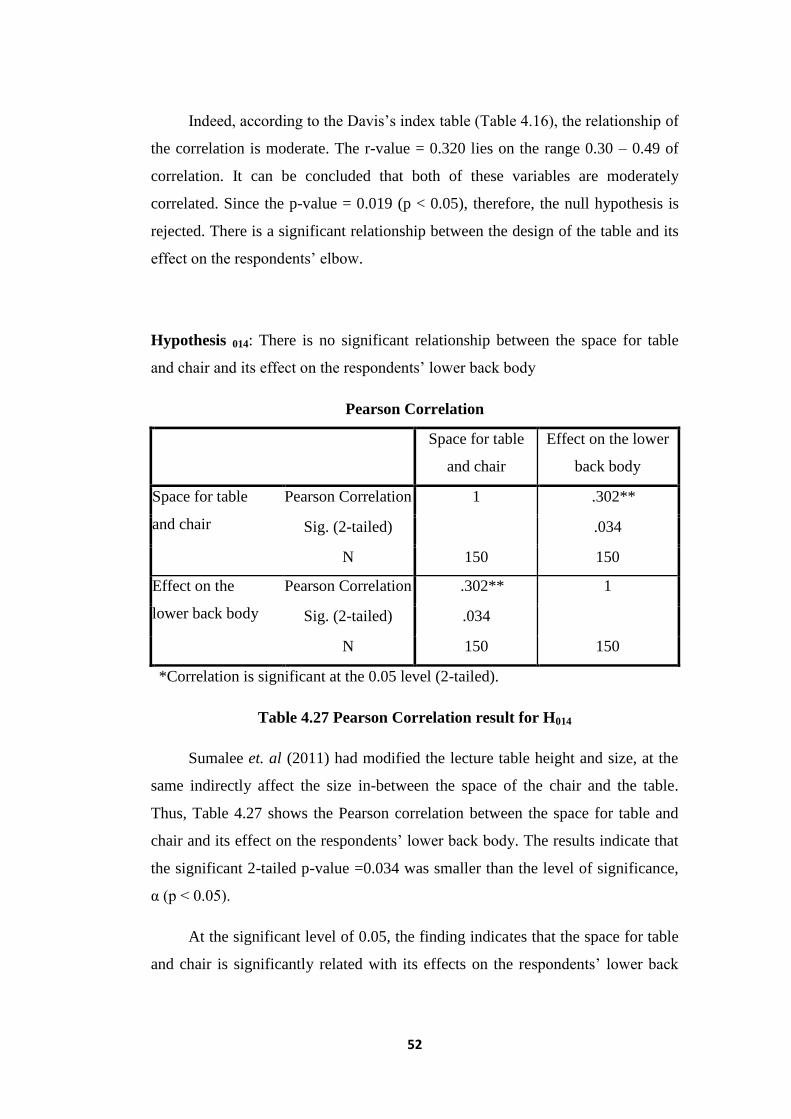
Hypothesis 014: There is no significant relationship between the space for table
and chair and its effect on the respondents’ lower back body
Table 4.27 Pearson Correlation result for H014
Sumalee et. al (2011) had modified the lecture table height and size, at the
same indirectly affect the size in-between the space of the chair and the table.
Thus, Table 4.27 shows the Pearson correlation between the space for table and
chair and its effect on the respondents’ lower back body. The results indicate that
the significant 2-tailed p-value =0.034 was smaller than the level of significance,
α (p < 0.05).
At the significant level of 0.05, the finding indicates that the space for table
and chair is significantly related with its effects on the respondents’ lower back
Pearson Correlation
Space for table
and chair
Effect on the lower
back body
Space for table
and chair
Pearson Correlation 1 .302**
Sig. (2-tailed) .034
N 150 150
Effect on the
lower back body
Pearson Correlation .302** 1
Sig. (2-tailed) .034
N 150 150
*Correlation is significant at the 0.05 level (2-tailed).
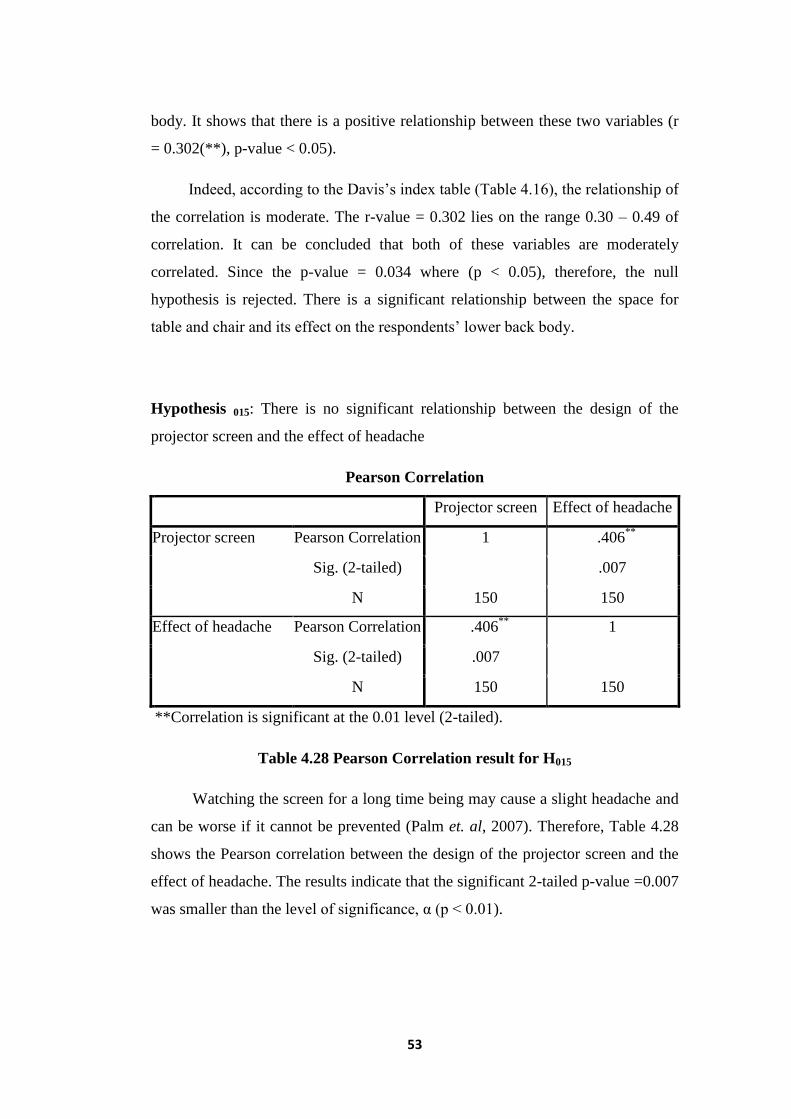
53
body. It shows that there is a positive relationship between these two variables (r
= 0.302(**), p-value < 0.05).
Indeed, according to the Davis’s index table (Table 4.16), the relationship of
the correlation is moderate. The r-value = 0.302 lies on the range 0.30 – 0.49 of
correlation. It can be concluded that both of these variables are moderately
correlated. Since the p-value = 0.034 where (p < 0.05), therefore, the null
hypothesis is rejected. There is a significant relationship between the space for
table and chair and its effect on the respondents’ lower back body.
Hypothesis 015: There is no significant relationship between the design of the
projector screen and the effect of headache
Pearson Correlation
Projector screen Effect of headache
Projector screen Pearson Correlation 1 .406**
Sig. (2-tailed) .007
N 150 150
Effect of headache Pearson Correlation .406**
1
Sig. (2-tailed) .007
N 150 150
**Correlation is significant at the 0.01 level (2-tailed).
Table 4.28 Pearson Correlation result for H015
Watching the screen for a long time being may cause a slight headache and
can be worse if it cannot be prevented (Palm et. al, 2007). Therefore, Table 4.28
shows the Pearson correlation between the design of the projector screen and the
effect of headache. The results indicate that the significant 2-tailed p-value =0.007
was smaller than the level of significance, α (p < 0.01).
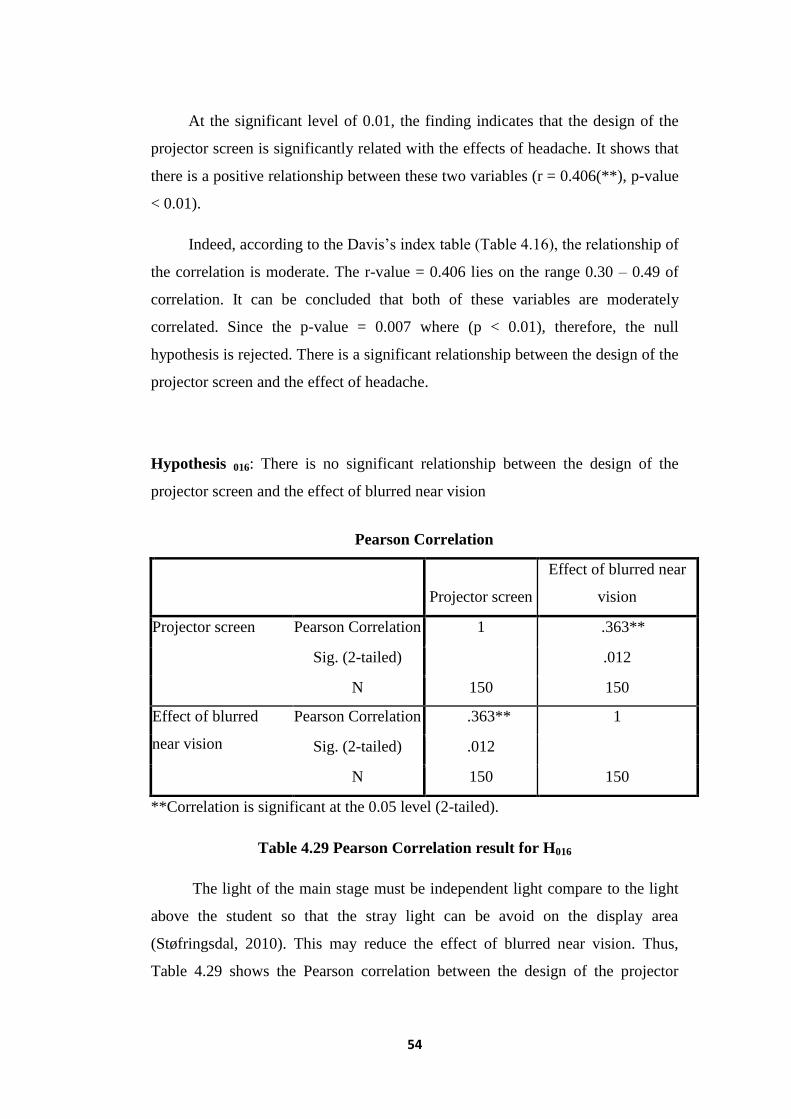
54
At the significant level of 0.01, the finding indicates that the design of the
projector screen is significantly related with the effects of headache. It shows that
there is a positive relationship between these two variables (r = 0.406(**), p-value
< 0.01).
Indeed, according to the Davis’s index table (Table 4.16), the relationship of
the correlation is moderate. The r-value = 0.406 lies on the range 0.30 – 0.49 of
correlation. It can be concluded that both of these variables are moderately
correlated. Since the p-value = 0.007 where (p < 0.01), therefore, the null
hypothesis is rejected. There is a significant relationship between the design of the
projector screen and the effect of headache.
Hypothesis 016: There is no significant relationship between the design of the
projector screen and the effect of blurred near vision
**Correlation is significant at the 0.05 level (2-tailed).
Table 4.29 Pearson Correlation result for H016
The light of the main stage must be independent light compare to the light
above the student so that the stray light can be avoid on the display area
(Støfringsdal, 2010). This may reduce the effect of blurred near vision. Thus,
Table 4.29 shows the Pearson correlation between the design of the projector
Pearson Correlation
Projector screen
Effect of blurred near
vision
Projector screen Pearson Correlation 1 .363**
Sig. (2-tailed) .012
N 150 150
Effect of blurred
near vision
Pearson Correlation .363** 1
Sig. (2-tailed) .012
N 150 150
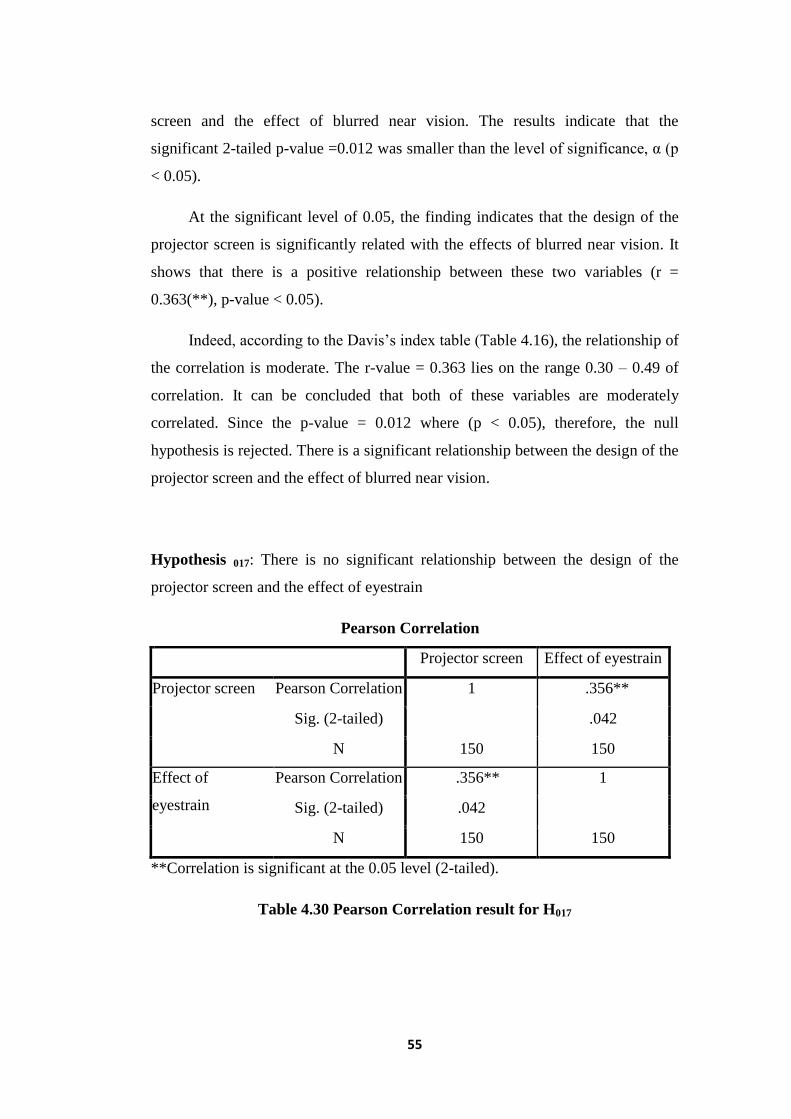
55
screen and the effect of blurred near vision. The results indicate that the
significant 2-tailed p-value =0.012 was smaller than the level of significance, α (p
< 0.05).
At the significant level of 0.05, the finding indicates that the design of the
projector screen is significantly related with the effects of blurred near vision. It
shows that there is a positive relationship between these two variables (r =
0.363(**), p-value < 0.05).
Indeed, according to the Davis’s index table (Table 4.16), the relationship of
the correlation is moderate. The r-value = 0.363 lies on the range 0.30 – 0.49 of
correlation. It can be concluded that both of these variables are moderately
correlated. Since the p-value = 0.012 where (p < 0.05), therefore, the null
hypothesis is rejected. There is a significant relationship between the design of the
projector screen and the effect of blurred near vision.
Hypothesis 017: There is no significant relationship between the design of the
projector screen and the effect of eyestrain
Pearson Correlation
Projector screen Effect of eyestrain
Projector screen Pearson Correlation 1 .356**
Sig. (2-tailed) .042
N 150 150
Effect of
eyestrain
Pearson Correlation .356** 1
Sig. (2-tailed) .042
N 150 150
**Correlation is significant at the 0.05 level (2-tailed).
Table 4.30 Pearson Correlation result for H017
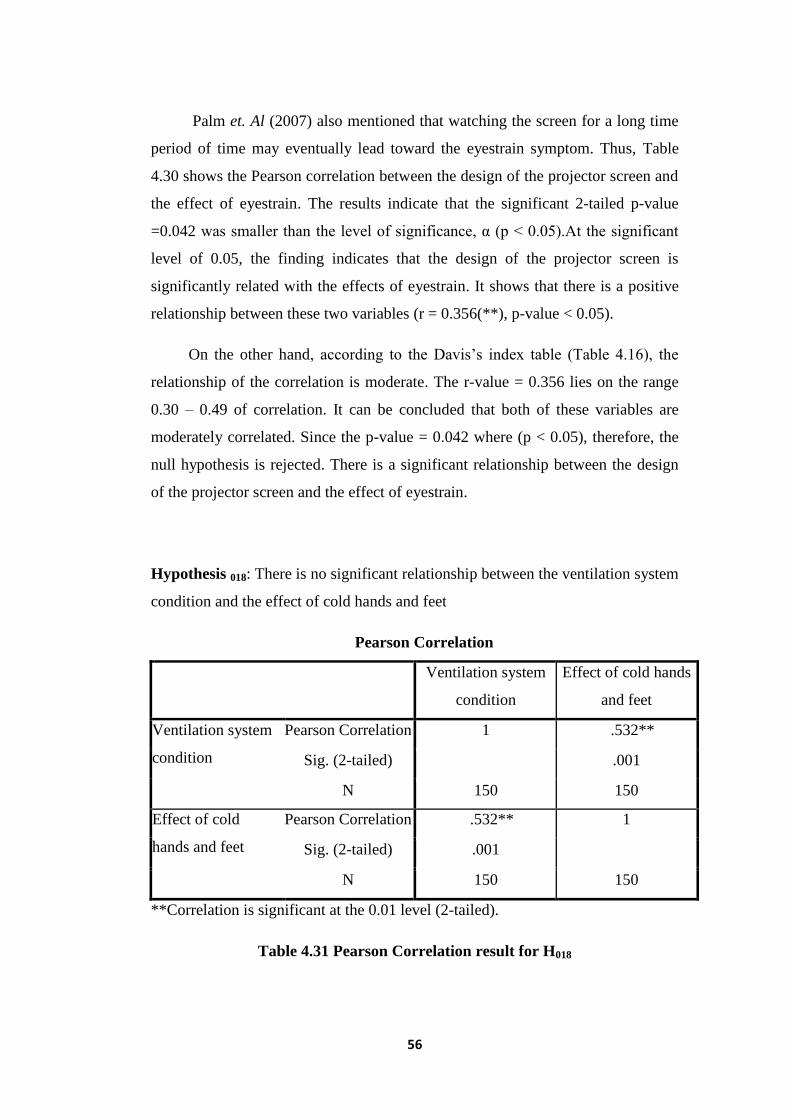
56
Palm et. Al (2007) also mentioned that watching the screen for a long time
period of time may eventually lead toward the eyestrain symptom. Thus, Table
4.30 shows the Pearson correlation between the design of the projector screen and
the effect of eyestrain. The results indicate that the significant 2-tailed p-value
=0.042 was smaller than the level of significance, α (p < 0.05).At the significant
level of 0.05, the finding indicates that the design of the projector screen is
significantly related with the effects of eyestrain. It shows that there is a positive
relationship between these two variables (r = 0.356(**), p-value < 0.05).
On the other hand, according to the Davis’s index table (Table 4.16), the
relationship of the correlation is moderate. The r-value = 0.356 lies on the range
0.30 – 0.49 of correlation. It can be concluded that both of these variables are
moderately correlated. Since the p-value = 0.042 where (p < 0.05), therefore, the
null hypothesis is rejected. There is a significant relationship between the design
of the projector screen and the effect of eyestrain.
Hypothesis 018: There is no significant relationship between the ventilation system
condition and the effect of cold hands and feet
Pearson Correlation
Ventilation system
condition
Effect of cold hands
and feet
Ventilation system
condition
Pearson Correlation 1 .532**
Sig. (2-tailed) .001
N 150 150
Effect of cold
hands and feet
Pearson Correlation .532** 1
Sig. (2-tailed) .001
N 150 150
**Correlation is significant at the 0.01 level (2-tailed).
Table 4.31 Pearson Correlation result for H018
57
Branz Ltd (2007) says that because of high used rate in the classrooms, it
needed at least 10 times higher fresh air than a house. In other words, classrooms
need much more humidity in order to preserve some indoor air quality. This
environment may lead toward the extreme of temperature, which may cause the
air indoor environment become too cold or too hot if the ventilation is
malfunctioned.
Table 4.31 shows the Pearson correlation between the ventilation system
condition and the effect of cold hands and feet. The results indicate that the
significant 2-tailed p-value =0.001 was smaller than the level of significance, α (p
< 0.01). At the significant level of 0.01, the finding indicates that the ventilation
system condition is significantly related with the effects of cold hands and feet. It
shows that there is a positive relationship between these two variables (r =
0.532(**), p-value < 0.01).
According to the Davis’s index table (Table 4.16), the relationship of the
correlation is strong. The r-value = 0.532 lies on the range 0.50 – 0.69 of
correlation. It can be concluded that both of these variables are strongly
correlated. Since the p-value = 0.001 where (p < 0.01), therefore, the null
hypothesis is rejected. There is a significant relationship between the ventilation
system condition and the effect of cold hands and feet.
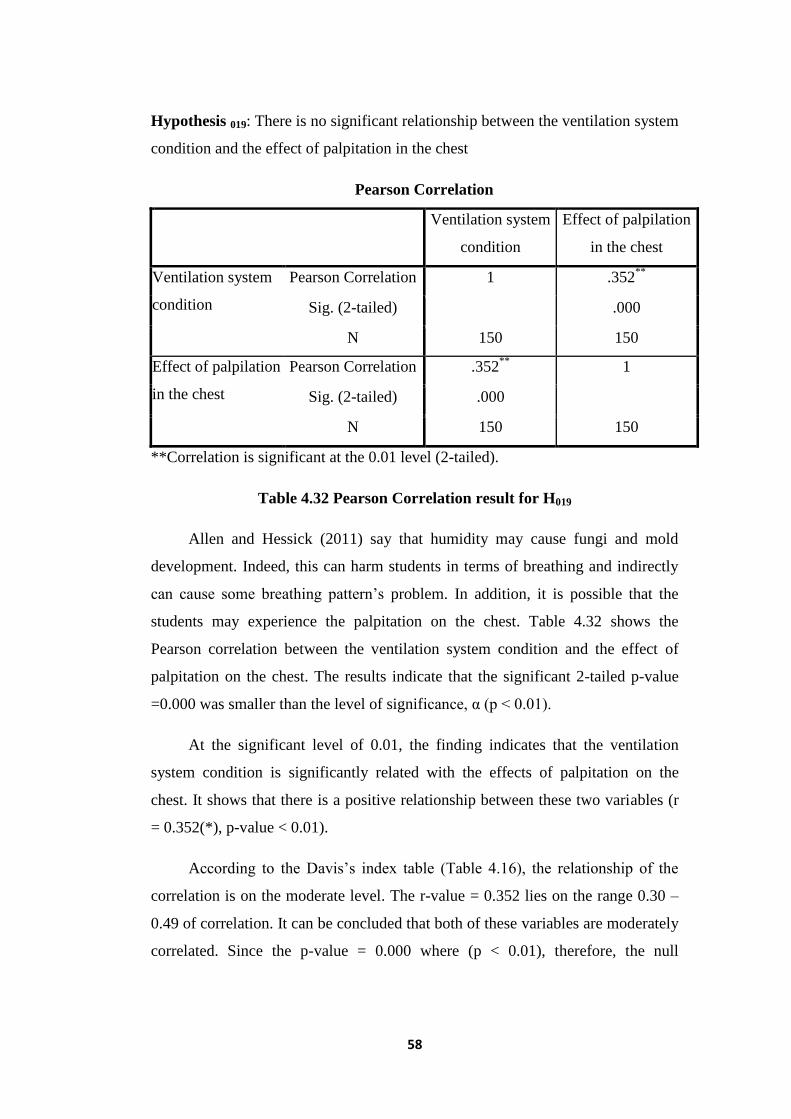
58
Hypothesis 019: There is no significant relationship between the ventilation system
condition and the effect of palpitation in the chest
Pearson Correlation
Ventilation system
condition
Effect of palpilation
in the chest
Ventilation system
condition
Pearson Correlation 1 .352**
Sig. (2-tailed) .000
N 150 150
Effect of palpilation
in the chest
Pearson Correlation .352**
1
Sig. (2-tailed) .000
N 150 150
**Correlation is significant at the 0.01 level (2-tailed).
Table 4.32 Pearson Correlation result for H019
Allen and Hessick (2011) say that humidity may cause fungi and mold
development. Indeed, this can harm students in terms of breathing and indirectly
can cause some breathing pattern’s problem. In addition, it is possible that the
students may experience the palpitation on the chest. Table 4.32 shows the
Pearson correlation between the ventilation system condition and the effect of
palpitation on the chest. The results indicate that the significant 2-tailed p-value
=0.000 was smaller than the level of significance, α (p < 0.01).
At the significant level of 0.01, the finding indicates that the ventilation
system condition is significantly related with the effects of palpitation on the
chest. It shows that there is a positive relationship between these two variables (r
= 0.352(*), p-value < 0.01).
According to the Davis’s index table (Table 4.16), the relationship of the
correlation is on the moderate level. The r-value = 0.352 lies on the range 0.30 –
0.49 of correlation. It can be concluded that both of these variables are moderately
correlated. Since the p-value = 0.000 where (p < 0.01), therefore, the null
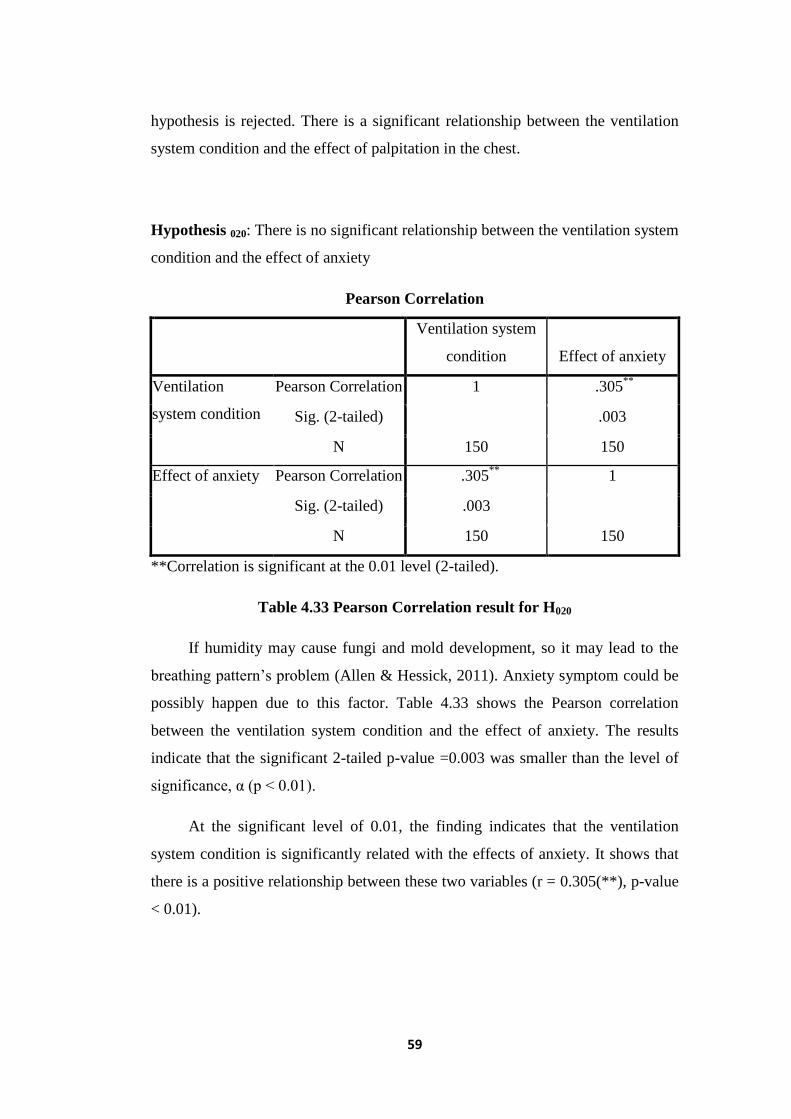
59
hypothesis is rejected. There is a significant relationship between the ventilation
system condition and the effect of palpitation in the chest.
Hypothesis 020: There is no significant relationship between the ventilation system
condition and the effect of anxiety
Pearson Correlation
Ventilation system
condition Effect of anxiety
Ventilation
system condition
Pearson Correlation 1 .305**
Sig. (2-tailed) .003
N 150 150
Effect of anxiety Pearson Correlation .305**
1
Sig. (2-tailed) .003
N 150 150
**Correlation is significant at the 0.01 level (2-tailed).
Table 4.33 Pearson Correlation result for H020
If humidity may cause fungi and mold development, so it may lead to the
breathing pattern’s problem (Allen & Hessick, 2011). Anxiety symptom could be
possibly happen due to this factor. Table 4.33 shows the Pearson correlation
between the ventilation system condition and the effect of anxiety. The results
indicate that the significant 2-tailed p-value =0.003 was smaller than the level of
significance, α (p < 0.01).
At the significant level of 0.01, the finding indicates that the ventilation
system condition is significantly related with the effects of anxiety. It shows that
there is a positive relationship between these two variables (r = 0.305(**), p-value
< 0.01).
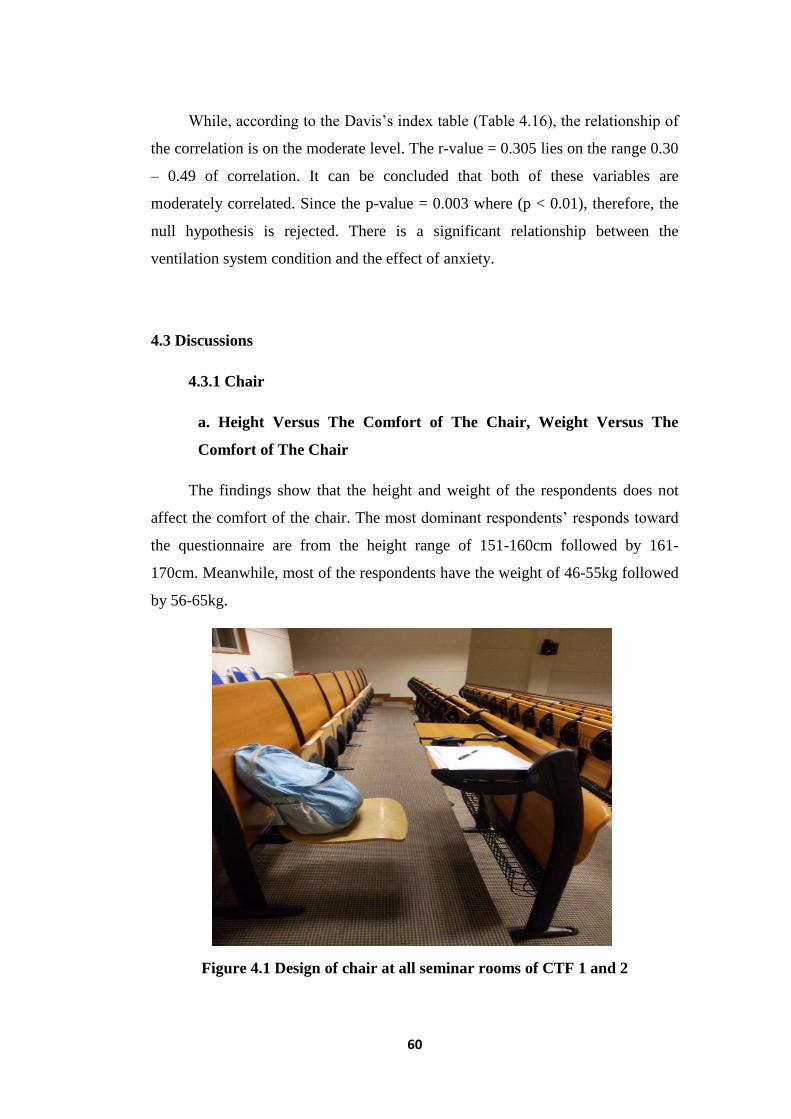
60
While, according to the Davis’s index table (Table 4.16), the relationship of
the correlation is on the moderate level. The r-value = 0.305 lies on the range 0.30
– 0.49 of correlation. It can be concluded that both of these variables are
moderately correlated. Since the p-value = 0.003 where (p < 0.01), therefore, the
null hypothesis is rejected. There is a significant relationship between the
ventilation system condition and the effect of anxiety.
4.3 Discussions
4.3.1 Chair
a. Height Versus The Comfort of The Chair, Weight Versus The
Comfort of The Chair
The findings show that the height and weight of the respondents does not
affect the comfort of the chair. The most dominant respondents’ responds toward
the questionnaire are from the height range of 151-160cm followed by 161-
170cm. Meanwhile, most of the respondents have the weight of 46-55kg followed
by 56-65kg.
Figure 4.1 Design of chair at all seminar rooms of CTF 1 and 2
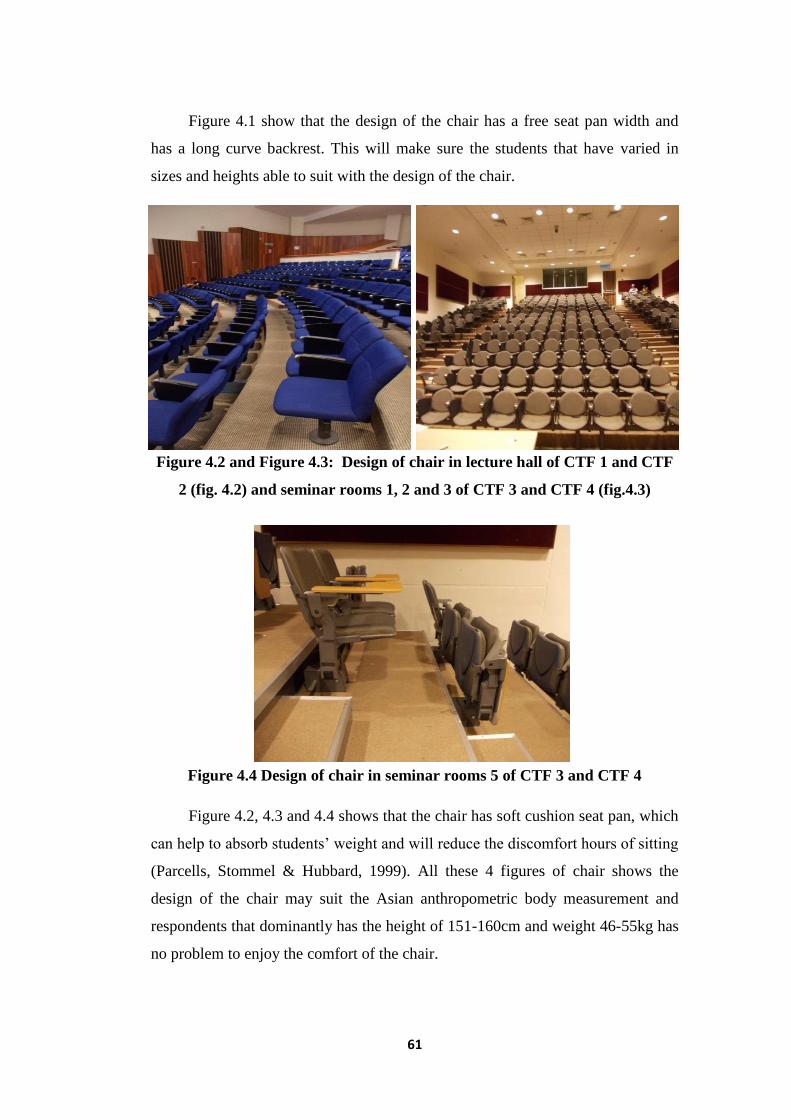
61
Figure 4.1 show that the design of the chair has a free seat pan width and
has a long curve backrest. This will make sure the students that have varied in
sizes and heights able to suit with the design of the chair.
Figure 4.2 and Figure 4.3: Design of chair in lecture hall of CTF 1 and CTF
2 (fig. 4.2) and seminar rooms 1, 2 and 3 of CTF 3 and CTF 4 (fig.4.3)
Figure 4.4 Design of chair in seminar rooms 5 of CTF 3 and CTF 4
Figure 4.2, 4.3 and 4.4 shows that the chair has soft cushion seat pan, which
can help to absorb students’ weight and will reduce the discomfort hours of sitting
(Parcells, Stommel & Hubbard, 1999). All these 4 figures of chair shows the
design of the chair may suit the Asian anthropometric body measurement and
respondents that dominantly has the height of 151-160cm and weight 46-55kg has
no problem to enjoy the comfort of the chair.
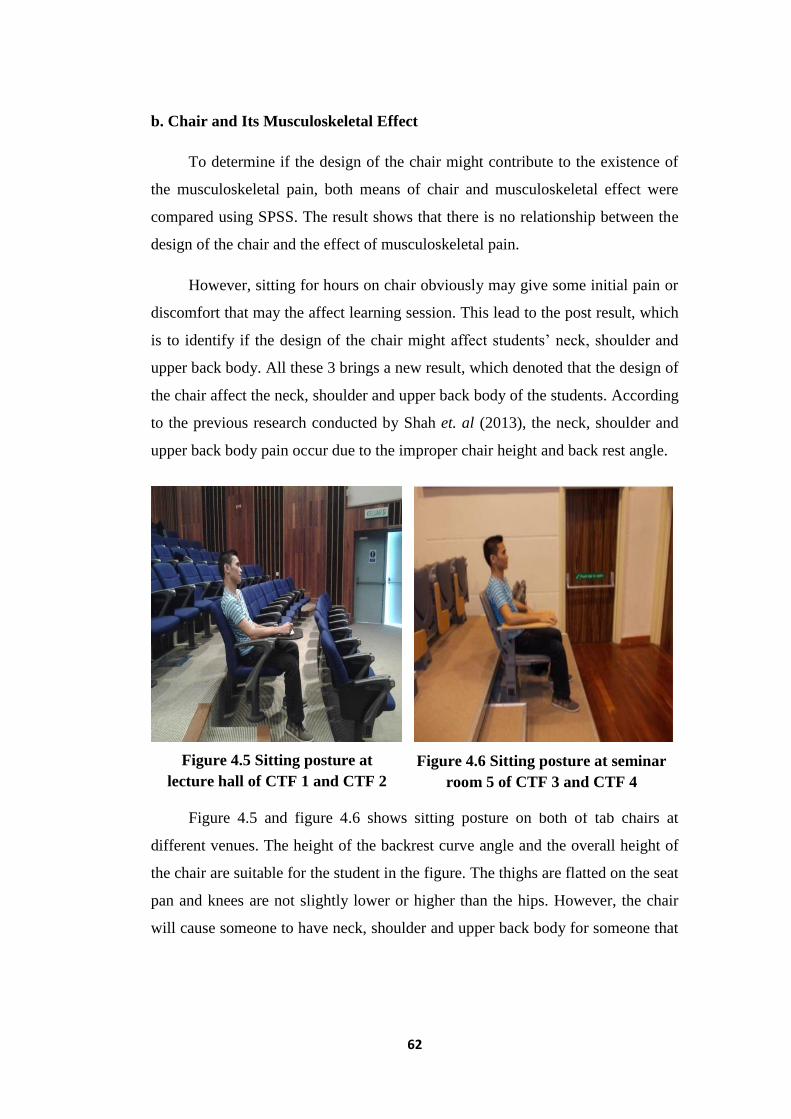
62
b. Chair and Its Musculoskeletal Effect
To determine if the design of the chair might contribute to the existence of
the musculoskeletal pain, both means of chair and musculoskeletal effect were
compared using SPSS. The result shows that there is no relationship between the
design of the chair and the effect of musculoskeletal pain.
However, sitting for hours on chair obviously may give some initial pain or
discomfort that may the affect learning session. This lead to the post result, which
is to identify if the design of the chair might affect students’ neck, shoulder and
upper back body. All these 3 brings a new result, which denoted that the design of
the chair affect the neck, shoulder and upper back body of the students. According
to the previous research conducted by Shah et. al (2013), the neck, shoulder and
upper back body pain occur due to the improper chair height and back rest angle.
Figure 4.5 and figure 4.6 shows sitting posture on both of tab chairs at
different venues. The height of the backrest curve angle and the overall height of
the chair are suitable for the student in the figure. The thighs are flatted on the seat
pan and knees are not slightly lower or higher than the hips. However, the chair
will cause someone to have neck, shoulder and upper back body for someone that
Figure 4.5 Sitting posture at
lecture hall of CTF 1 and CTF 2
Figure 4.6 Sitting posture at seminar
room 5 of CTF 3 and CTF 4
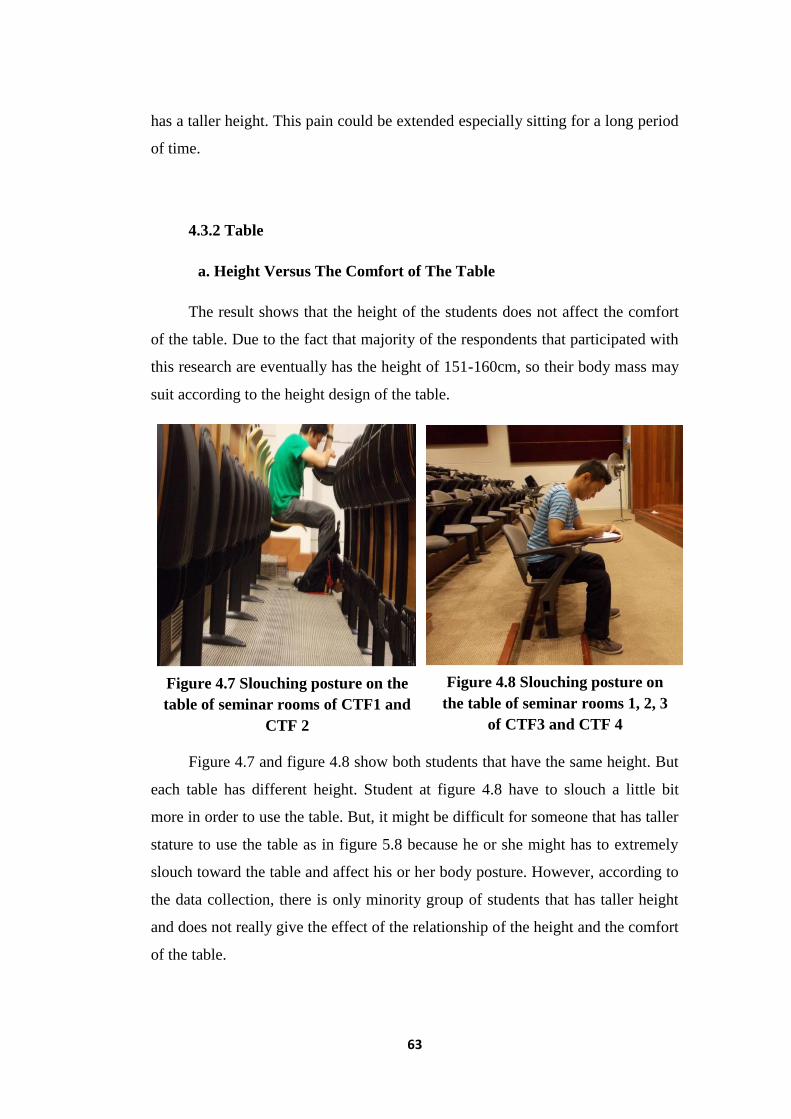
63
has a taller height. This pain could be extended especially sitting for a long period
of time.
4.3.2 Table
a. Height Versus The Comfort of The Table
The result shows that the height of the students does not affect the comfort
of the table. Due to the fact that majority of the respondents that participated with
this research are eventually has the height of 151-160cm, so their body mass may
suit according to the height design of the table.
Figure 4.7 and figure 4.8 show both students that have the same height. But
each table has different height. Student at figure 4.8 have to slouch a little bit
more in order to use the table. But, it might be difficult for someone that has taller
stature to use the table as in figure 5.8 because he or she might has to extremely
slouch toward the table and affect his or her body posture. However, according to
the data collection, there is only minority group of students that has taller height
and does not really give the effect of the relationship of the height and the comfort
of the table.
Figure 4.7 Slouching posture on the
table of seminar rooms of CTF1 and
CTF 2
Figure 4.8 Slouching posture on
the table of seminar rooms 1, 2, 3
of CTF3 and CTF 4
64
b. Table and Its Musculoskeletal Effect
The result shows that there is no relationship between the design of the
table and its effects toward students that used lecture halls and seminar rooms of
CTFs as their learning venues and facilities. However, by extracting any certain
significant musculoskeletal pain that can be related to the design of the table, thus
the result shows that the design of the table eventually can affect the elbow part of
the body.
Shah et. al (2013) concluded that the frequency of pain felt on hand by users
while writing depends on the height and table size. In their research, about 111
users sometimes feel the pain if sitting for a long time and does not feel any pain
if the time is shorter. It shows that the size of the table need be widen which is
basically not too small to do any writing activities.
Figure 4.9, figure 4.10 and figure 4.11 shows the design of the table in each
of the lecture halls and seminar rooms of CTFs respectively. It is clearly
illustrated that the width of the table is too small to do the writing activities
especially when there is a lot of writing activities that needed to be done. If a
single lecture prolong for more than 2 hours and students need to take notes, it
will initially cause a slight pain at the hands area. Besides that, students might
have two or three lectures per day, and each lecture might take 2 minimum hours.
So this would simply affect students to have the tendency of being affected by the
pain on the elbows area.
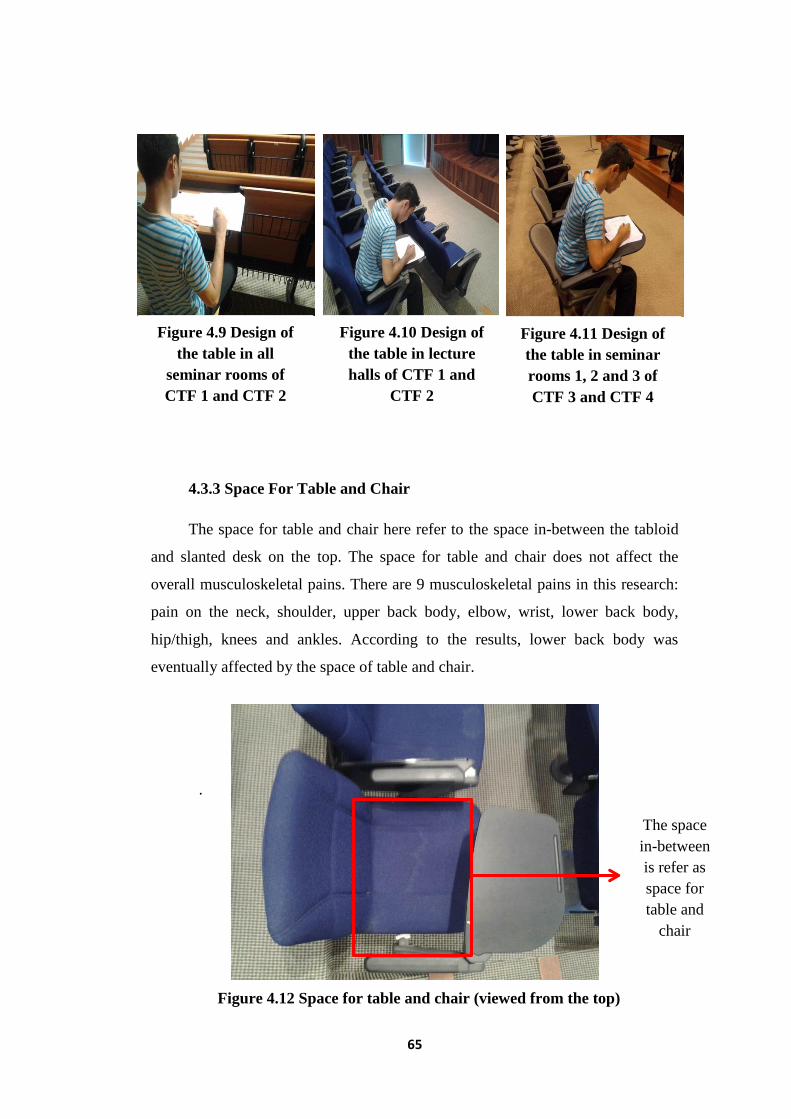
65
4.3.3 Space For Table and Chair
The space for table and chair here refer to the space in-between the tabloid
and slanted desk on the top. The space for table and chair does not affect the
overall musculoskeletal pains. There are 9 musculoskeletal pains in this research:
pain on the neck, shoulder, upper back body, elbow, wrist, lower back body,
hip/thigh, knees and ankles. According to the results, lower back body was
eventually affected by the space of table and chair.
.
Figure 4.9 Design of
the table in all
seminar rooms of
CTF 1 and CTF 2
Figure 4.10 Design of
the table in lecture
halls of CTF 1 and
CTF 2
Figure 4.12 Space for table and chair (viewed from the top)
The space
in-between
is refer as
space for
table and
chair
Figure 4.11 Design of
the table in seminar
rooms 1, 2 and 3 of
CTF 3 and CTF 4
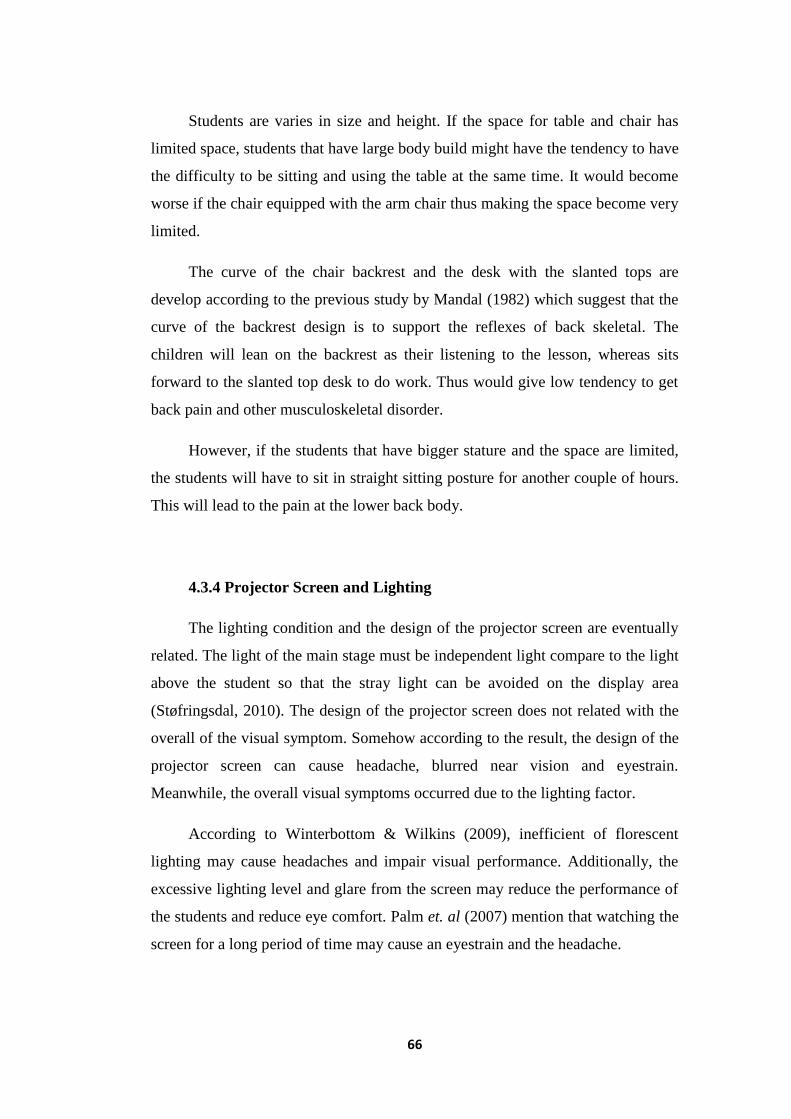
66
Students are varies in size and height. If the space for table and chair has
limited space, students that have large body build might have the tendency to have
the difficulty to be sitting and using the table at the same time. It would become
worse if the chair equipped with the arm chair thus making the space become very
limited.
The curve of the chair backrest and the desk with the slanted tops are
develop according to the previous study by Mandal (1982) which suggest that the
curve of the backrest design is to support the reflexes of back skeletal. The
children will lean on the backrest as their listening to the lesson, whereas sits
forward to the slanted top desk to do work. Thus would give low tendency to get
back pain and other musculoskeletal disorder.
However, if the students that have bigger stature and the space are limited,
the students will have to sit in straight sitting posture for another couple of hours.
This will lead to the pain at the lower back body.
4.3.4 Projector Screen and Lighting
The lighting condition and the design of the projector screen are eventually
related. The light of the main stage must be independent light compare to the light
above the student so that the stray light can be avoided on the display area
(Støfringsdal, 2010). The design of the projector screen does not related with the
overall of the visual symptom. Somehow according to the result, the design of the
projector screen can cause headache, blurred near vision and eyestrain.
Meanwhile, the overall visual symptoms occurred due to the lighting factor.
According to Winterbottom & Wilkins (2009), inefficient of florescent
lighting may cause headaches and impair visual performance. Additionally, the
excessive lighting level and glare from the screen may reduce the performance of
the students and reduce eye comfort. Palm et. al (2007) mention that watching the
screen for a long period of time may cause an eyestrain and the headache.
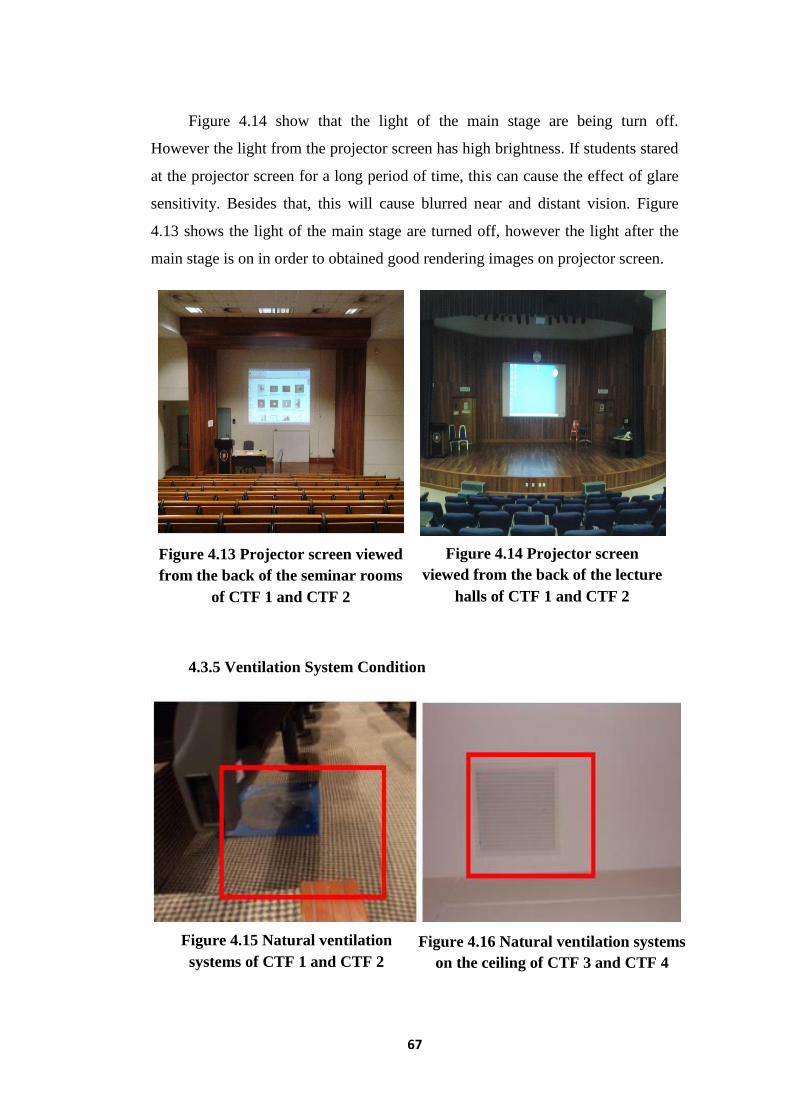
67
Figure 4.14 show that the light of the main stage are being turn off.
However the light from the projector screen has high brightness. If students stared
at the projector screen for a long period of time, this can cause the effect of glare
sensitivity. Besides that, this will cause blurred near and distant vision. Figure
4.13 shows the light of the main stage are turned off, however the light after the
main stage is on in order to obtained good rendering images on projector screen.
4.3.5 Ventilation System Condition
Figure 4.13 Projector screen viewed
from the back of the seminar rooms
of CTF 1 and CTF 2
Figure 4.14 Projector screen
viewed from the back of the lecture
halls of CTF 1 and CTF 2
Figure 4.15 Natural ventilation
systems of CTF 1 and CTF 2
Figure 4.16 Natural ventilation systems
on the ceiling of CTF 3 and CTF 4
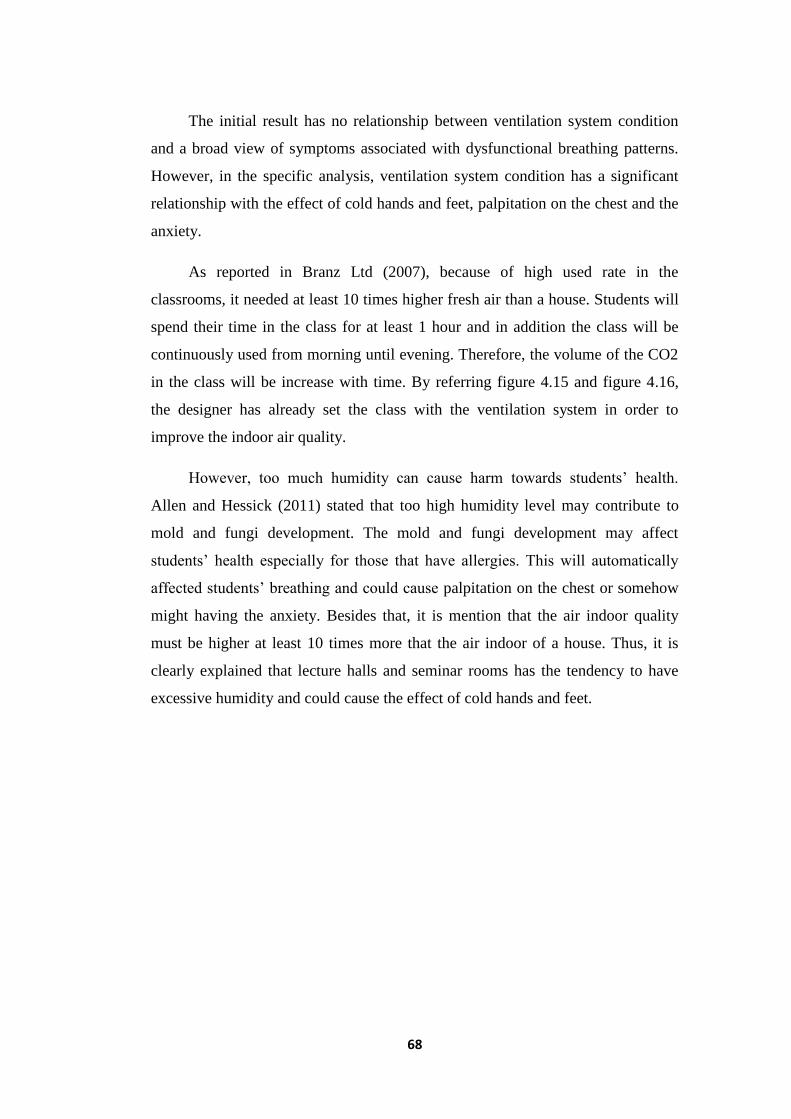
68
The initial result has no relationship between ventilation system condition
and a broad view of symptoms associated with dysfunctional breathing patterns.
However, in the specific analysis, ventilation system condition has a significant
relationship with the effect of cold hands and feet, palpitation on the chest and the
anxiety.
As reported in Branz Ltd (2007), because of high used rate in the
classrooms, it needed at least 10 times higher fresh air than a house. Students will
spend their time in the class for at least 1 hour and in addition the class will be
continuously used from morning until evening. Therefore, the volume of the CO2
in the class will be increase with time. By referring figure 4.15 and figure 4.16,
the designer has already set the class with the ventilation system in order to
improve the indoor air quality.
However, too much humidity can cause harm towards students’ health.
Allen and Hessick (2011) stated that too high humidity level may contribute to
mold and fungi development. The mold and fungi development may affect
students’ health especially for those that have allergies. This will automatically
affected students’ breathing and could cause palpitation on the chest or somehow
might having the anxiety. Besides that, it is mention that the air indoor quality
must be higher at least 10 times more that the air indoor of a house. Thus, it is
clearly explained that lecture halls and seminar rooms has the tendency to have
excessive humidity and could cause the effect of cold hands and feet.
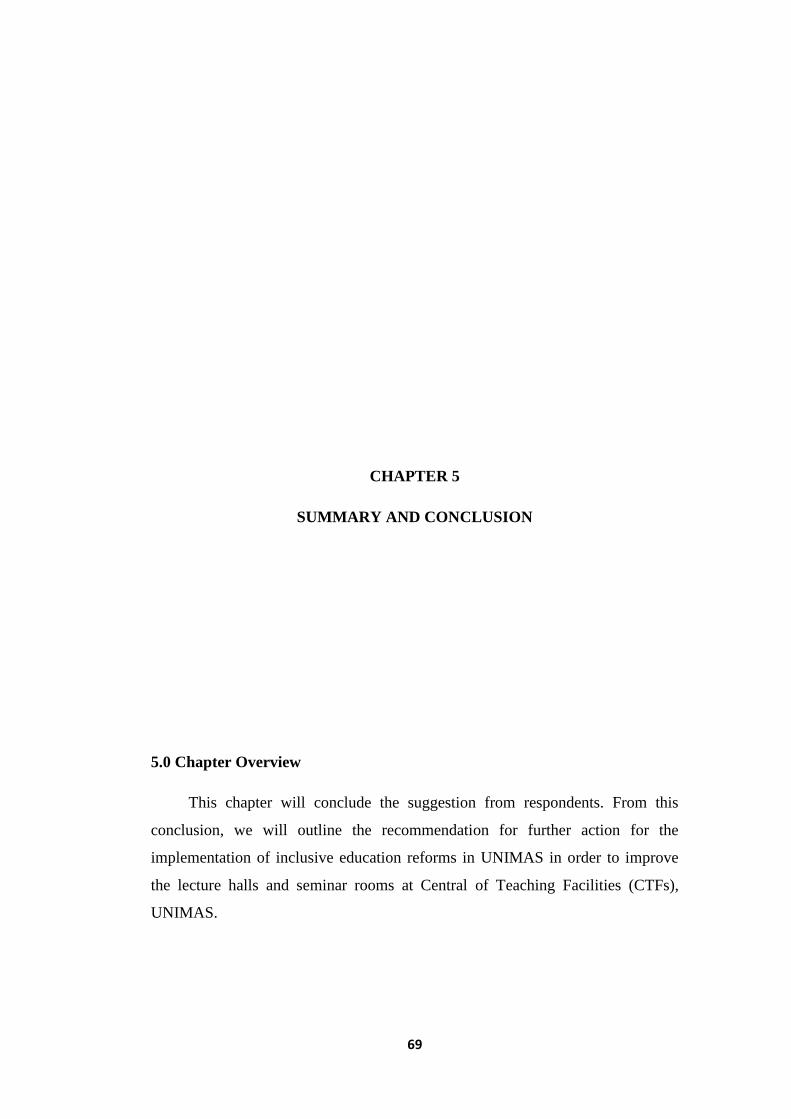
69
CHAPTER 5
SUMMARY AND CONCLUSION
5.0 Chapter Overview
This chapter will conclude the suggestion from respondents. From this
conclusion, we will outline the recommendation for further action for the
implementation of inclusive education reforms in UNIMAS in order to improve
the lecture halls and seminar rooms at Central of Teaching Facilities (CTFs),
UNIMAS.
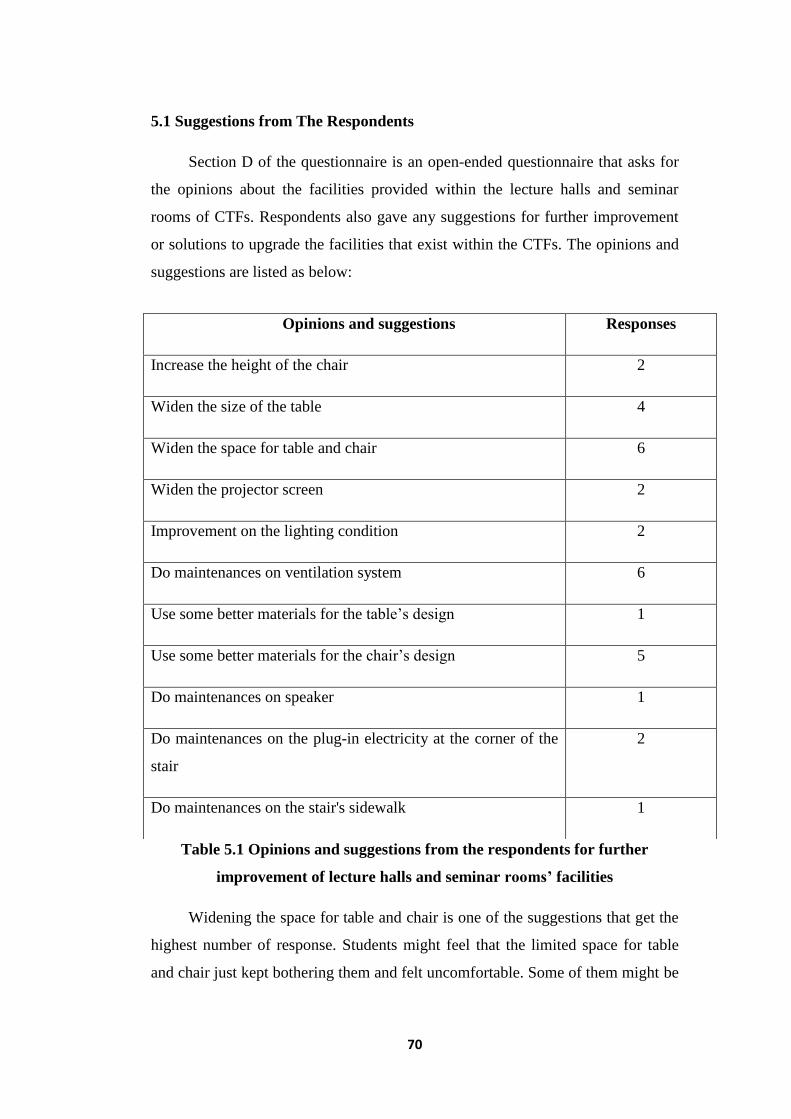
70
5.1 Suggestions from The Respondents
Section D of the questionnaire is an open-ended questionnaire that asks for
the opinions about the facilities provided within the lecture halls and seminar
rooms of CTFs. Respondents also gave any suggestions for further improvement
or solutions to upgrade the facilities that exist within the CTFs. The opinions and
suggestions are listed as below:
Table 5.1 Opinions and suggestions from the respondents for further
improvement of lecture halls and seminar rooms’ facilities
Widening the space for table and chair is one of the suggestions that get the
highest number of response. Students might feel that the limited space for table
and chair just kept bothering them and felt uncomfortable. Some of them might be
Opinions and suggestions Responses
Increase the height of the chair 2
Widen the size of the table 4
Widen the space for table and chair 6
Widen the projector screen 2
Improvement on the lighting condition 2
Do maintenances on ventilation system 6
Use some better materials for the table’s design 1
Use some better materials for the chair’s design 5
Do maintenances on speaker 1
Do maintenances on the plug-in electricity at the corner of the
stair
2
Do maintenances on the stair's sidewalk 1
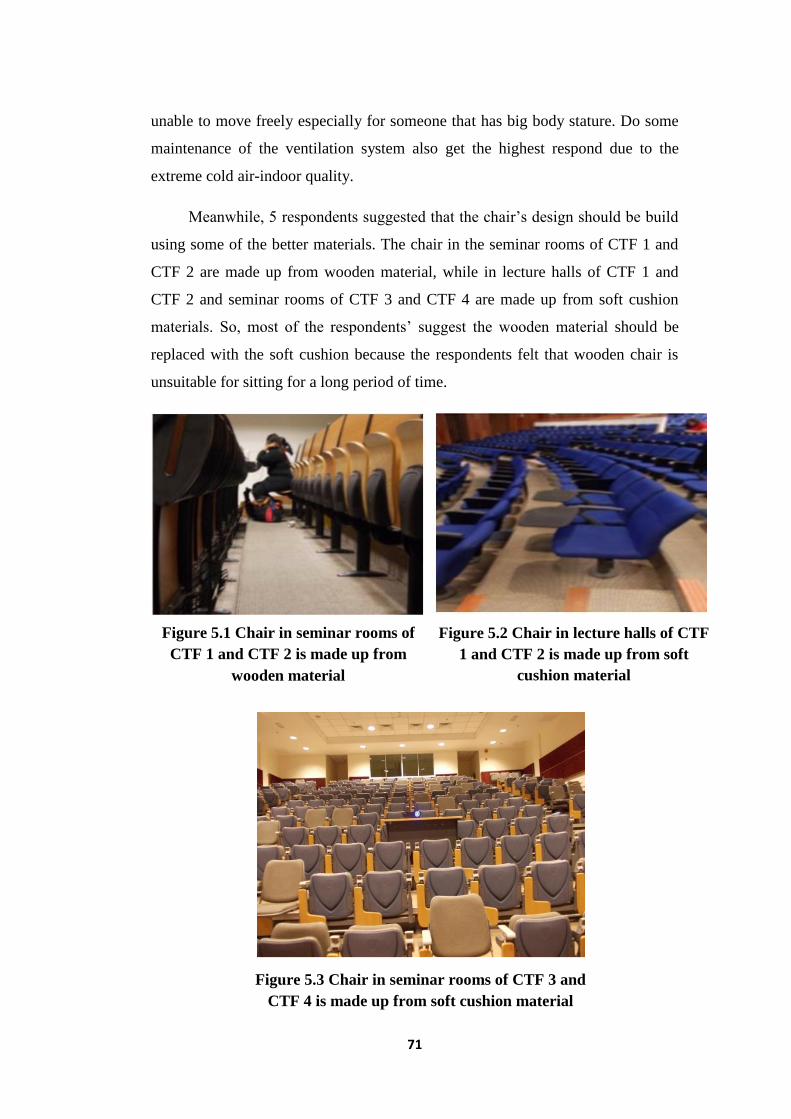
71
unable to move freely especially for someone that has big body stature. Do some
maintenance of the ventilation system also get the highest respond due to the
extreme cold air-indoor quality.
Meanwhile, 5 respondents suggested that the chair’s design should be build
using some of the better materials. The chair in the seminar rooms of CTF 1 and
CTF 2 are made up from wooden material, while in lecture halls of CTF 1 and
CTF 2 and seminar rooms of CTF 3 and CTF 4 are made up from soft cushion
materials. So, most of the respondents’ suggest the wooden material should be
replaced with the soft cushion because the respondents felt that wooden chair is
unsuitable for sitting for a long period of time.
Figure 5.1 Chair in seminar rooms of
CTF 1 and CTF 2 is made up from
wooden material
Figure 5.2 Chair in lecture halls of CTF
1 and CTF 2 is made up from soft
cushion material
Figure 5.3 Chair in seminar rooms of CTF 3 and
CTF 4 is made up from soft cushion material
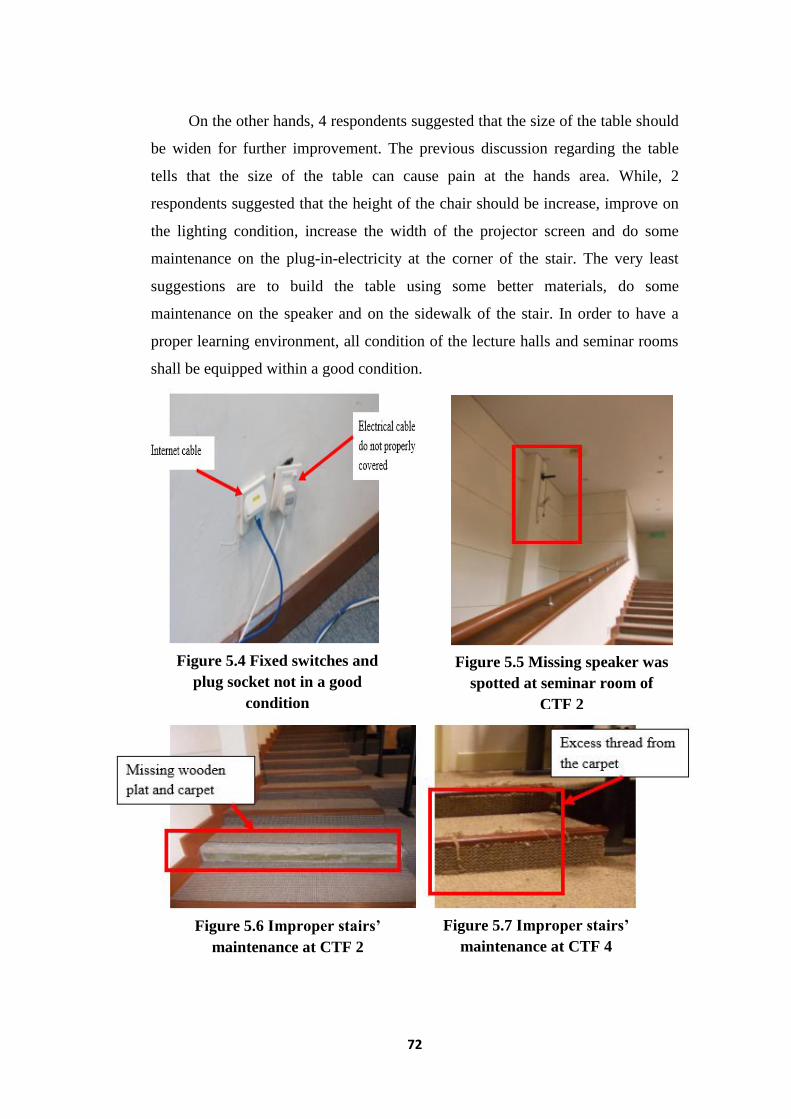
72
On the other hands, 4 respondents suggested that the size of the table should
be widen for further improvement. The previous discussion regarding the table
tells that the size of the table can cause pain at the hands area. While, 2
respondents suggested that the height of the chair should be increase, improve on
the lighting condition, increase the width of the projector screen and do some
maintenance on the plug-in-electricity at the corner of the stair. The very least
suggestions are to build the table using some better materials, do some
maintenance on the speaker and on the sidewalk of the stair. In order to have a
proper learning environment, all condition of the lecture halls and seminar rooms
shall be equipped within a good condition.
Figure 5.4 Fixed switches and
plug socket not in a good
condition
Figure 5.6 Improper stairs’
maintenance at CTF 2
Figure 5.7 Improper stairs’
maintenance at CTF 4
Figure 5.5 Missing speaker was
spotted at seminar room of
CTF 2
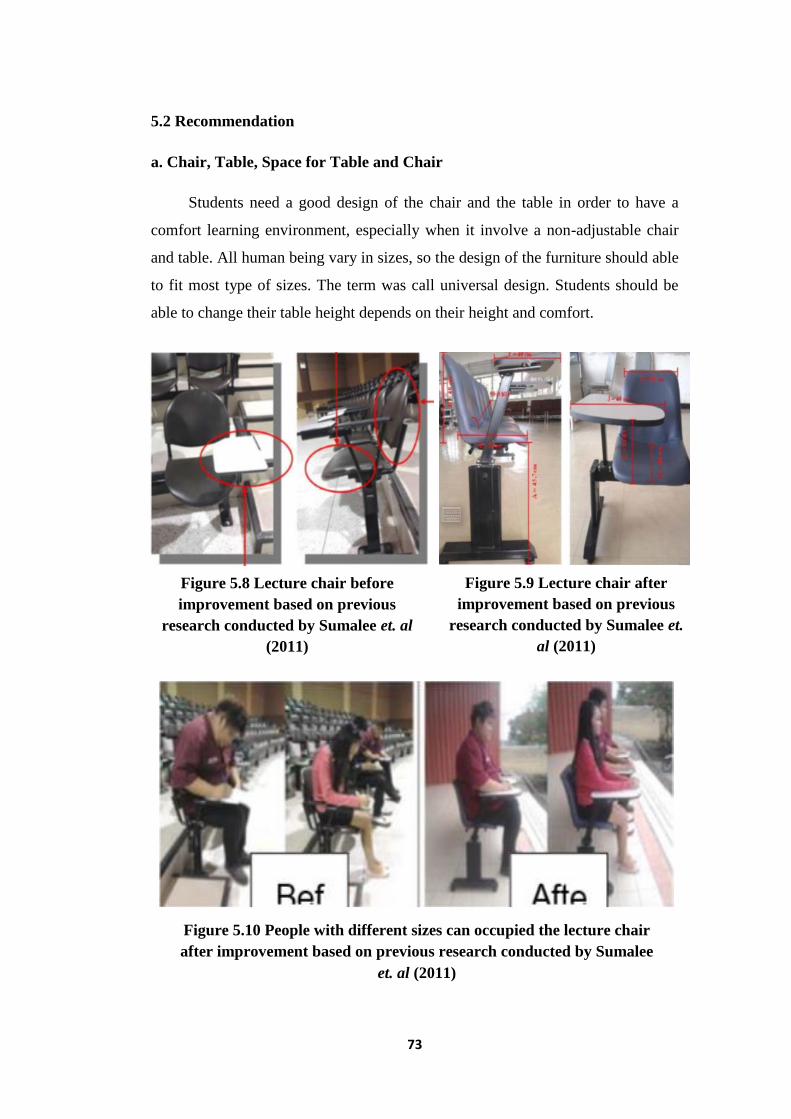
73
5.2 Recommendation
a. Chair, Table, Space for Table and Chair
Students need a good design of the chair and the table in order to have a
comfort learning environment, especially when it involve a non-adjustable chair
and table. All human being vary in sizes, so the design of the furniture should able
to fit most type of sizes. The term was call universal design. Students should be
able to change their table height depends on their height and comfort.
Figure 5.8 Lecture chair before
improvement based on previous
research conducted by Sumalee et. al
(2011)
Figure 5.9 Lecture chair after
improvement based on previous
research conducted by Sumalee et.
al (2011)
Figure 5.10 People with different sizes can occupied the lecture chair
after improvement based on previous research conducted by Sumalee
et. al (2011)
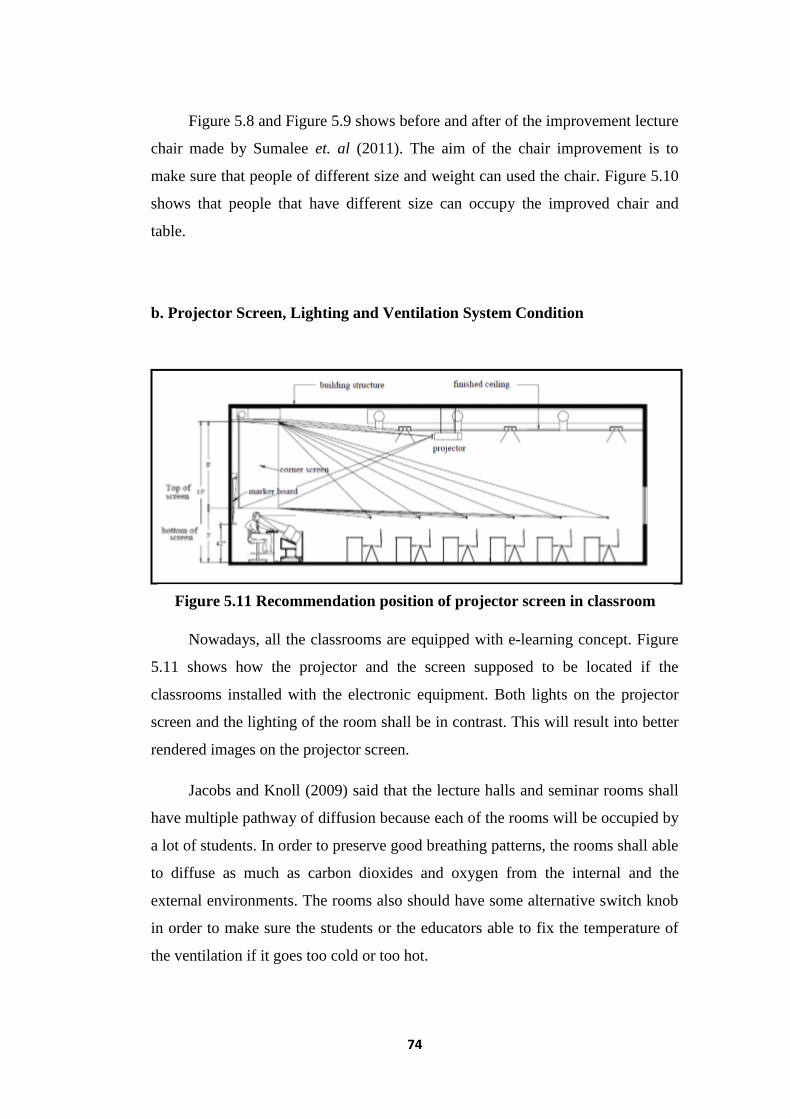
74
Figure 5.8 and Figure 5.9 shows before and after of the improvement lecture
chair made by Sumalee et. al (2011). The aim of the chair improvement is to
make sure that people of different size and weight can used the chair. Figure 5.10
shows that people that have different size can occupy the improved chair and
table.
b. Projector Screen, Lighting and Ventilation System Condition
Nowadays, all the classrooms are equipped with e-learning concept. Figure
5.11 shows how the projector and the screen supposed to be located if the
classrooms installed with the electronic equipment. Both lights on the projector
screen and the lighting of the room shall be in contrast. This will result into better
rendered images on the projector screen.
Jacobs and Knoll (2009) said that the lecture halls and seminar rooms shall
have multiple pathway of diffusion because each of the rooms will be occupied by
a lot of students. In order to preserve good breathing patterns, the rooms shall able
to diffuse as much as carbon dioxides and oxygen from the internal and the
external environments. The rooms also should have some alternative switch knob
in order to make sure the students or the educators able to fix the temperature of
the ventilation if it goes too cold or too hot.
Figure 5.11 Recommendation position of projector screen in classroom
75
5.3 Conclusion
As the conclusion, contractors or classroom designers or any person in
charge should be aware that the lecture halls or seminar rooms is like a second
home. Students spend half of their days in the classroom to earn their education.
Indeed, the classroom shall have high quality fittings and fixtures as well as the
furniture shall fulfil the universal design. To spend a lot of money in developing
high quality classrooms at the beginning of construction is even better rather than
spending a lot of money to support maintenance cost. Maintenance cost
sometimes is even much expensive compare to the cost of building the highest
quality design because it will remain much longer than low quality design.
Therefore, this study can be used as a module to recognize some aspect in
term of deficiencies in the lecture halls or seminar rooms that need to be
improved. This study has already revealed some aspects which need to be taken in
consideration and need some proper action for maintenances.


