Embed Size (px)
Citation preview
C O N F I D E N T I A L D O C U M E N T
M E L i S S A
M E L i S S A
Memorandum of Understanding 19071/05/NL/CP
Technical Note
prepared by/préparé par Laury Chaerle, Martin Weihreter reference/réference Contract number 22070/08/NL/JC issue/édition 1 revision/révision 0 date of issue/date d’édition 26.11.2009 status/état Final Document type/type de document Technical Note Distribution/distribution FC1 consortium, ESA/ESTEC
MELISSA FOOD CHARACTERIZATION: PHASE 1
TECHNICAL NOTE: 98.4.11
TEST PLAN AND PROCEDURES FOR A
PRELIMINARY TRADE-OFF OF THE CROP
CULTIVAR.

issue 1 revision 0 0 -
page ii of ix
MELiSSA Technical Note
A P P R O V A L
Title titre
Preliminary trade-off for test plan and
procedures
issue issue
1
revision revision
0
author auteur UBern UCL UGent UoGuelph UNapoli
FC1 Consortium
Valerie Page, Urs Feller
Muriel Quinet, Stanley Lutts
Laury Chaerle, Benjamin Secco, Martin
Weihreter, Dominique Van Der Straeten
Michael Stasiak, Mike Dixon
Roberta Paradiso, Stefania De Pascale
date date
18.09.2009
Reviewed by (UGent) approved by (UGent) Consultant
Martin Weihreter
Laury Chaerle
Dominique Van Der Straeten
Claude-Gilles Dussap (UBP)
date date
18.09.2009
26.11.2009
27.11.2009
06.11.2009
C H A N G E L O G
reason for change /raison du changement
issue/issue revision/revision date/date
C H A N G E R E C O R D
Issue: 1 Revision: 0
reason for change/raison du changement page(s)/page(s) paragraph(s)/paragraph(s)

issue 1 revision 0 0 -
page iii of ix
MELiSSA Technical Note
T A B L E O F C O N T E N T S
Table of Figures .................................................................................................................. vi
List of Tables ..................................................................................................................... viii
List of Abbreviations .......................................................................................................... ix
Glossary ............................................................................................................................... ix
1 Introduction ...................................................................................................................... 1
1.1 Hardware and monitoring parameter overview .................................................. 2
2 Bread Wheat (UBern) ...................................................................................................... 3
2.1 Growth chamber specifications .............................................................................. 4 2.1.1 Dimensions ............................................................................................................ 4
2.1.2 Lighting ................................................................................................................. 4
2.1.3 Environment control .............................................................................................. 6
2.2 Hydroponic system .................................................................................................. 9 2.2.1 Hydroponic system setup ...................................................................................... 9
2.2.2 Hydroponic system materials .............................................................................. 10 2.2.3 Pumps .................................................................................................................. 10 2.2.4 Substrate .............................................................................................................. 12
2.2.5 Nutrient solution composition ............................................................................. 12 2.2.6 Hydroponic system sensor .................................................................................. 13 2.2.7 Cooling system for the nutrient solution ............................................................. 13
2.2.8 Gullies cleaning ................................................................................................... 14
2.3 Test plan ................................................................................................................. 14 2.3.1 Cultivar selected .................................................................................................. 14 2.3.2 Seeds treatment ................................................................................................... 15 2.3.3 Plant cultural condition ....................................................................................... 16 2.3.4 Plant growth period ............................................................................................. 18
2.3.5 Nutrient solution analysis .................................................................................... 18 2.3.5.1 Macronutrients: N P K Ca Mg S in the nutrient solution ............................ 18 2.3.5.2 Micronutrients: Fe Mn Zn Cu Mo Cl Ni in the nutrient solution ................ 18
2.3.6 Kernel analysis .................................................................................................... 19 2.3.6.1 Macronutrients in the kernels ...................................................................... 19
2.3.6.2 Micronutrients in the kernels ....................................................................... 19 2.3.7 Food quality analysis ........................................................................................... 19
2.3.8 Plant development ............................................................................................... 19 2.3.9 Biomass data ....................................................................................................... 20 2.3.10 Yield estimation .............................................................................................. 20

issue 1 revision 0 0 -
page iv of ix
MELiSSA Technical Note
2.3.11 Timing of the measurements ........................................................................... 20 2.3.12 Reference of the measuring devices ................................................................ 21
2.4 Preliminary testing ................................................................................................ 22
2.5 References .............................................................................................................. 22
3 Durum Wheat (UGuelph) .............................................................................................. 23
3.1 Growth Chamber Specifications .......................................................................... 24 3.1.1 Dimensions .......................................................................................................... 24 3.1.2 Construction materials used ................................................................................ 24 3.1.3 Analysers ............................................................................................................. 24 3.1.4 Lighting ............................................................................................................... 24
3.1.5 Hydroponic system sensors ................................................................................. 26 3.1.6 Chamber sensors ................................................................................................. 26 3.1.7 Environment control ............................................................................................ 26
3.1.8 Control system ..................................................................................................... 27 3.1.9 Air handling ......................................................................................................... 27 3.1.10 Nutrient delivery system ................................................................................. 27
3.1.11 Pressure compensation .................................................................................... 27
3.2 Test plan ................................................................................................................. 30 3.2.1 Objective ............................................................................................................. 30 3.2.2 Growing period ................................................................................................... 30
3.2.3 Crop growth procedures ...................................................................................... 30 3.2.4 Sampling and analysis ......................................................................................... 33
3.2.5 Analytical methods .............................................................................................. 33
3.3 References .............................................................................................................. 35
4 Potato .............................................................................................................................. 36
Potato (UGent) ........................................................................................................................ 36
4.1 Growth chamber specifications ............................................................................ 37 4.1.1 Dimensions .......................................................................................................... 37
4.1.2 Lighting ............................................................................................................... 37 4.1.3 Environment control ............................................................................................ 40
4.1.3.1 Air temperature and relative humidity ........................................................ 40 4.1.3.2 Settings and error limits .............................................................................. 41
4.2 Hydroponic system ................................................................................................ 43 4.2.1 Hydroponic system explanation .......................................................................... 43 4.2.2 Hydroponic system material ................................................................................ 46 4.2.3 Pumps .................................................................................................................. 46
4.2.4 Substrate choice ................................................................................................... 46 4.2.5 Nutrient solution composition ............................................................................. 46 4.2.6 Hydroponic system sensors ................................................................................. 47

issue 1 revision 0 0 -
page v of ix
MELiSSA Technical Note
4.2.7 Gully cleaning ..................................................................................................... 49
4.3 Experimental protocol .......................................................................................... 49 4.3.1 Cultivar selected .................................................................................................. 49 4.3.2 Acclimated in vitro-plants treatment ................................................................... 50 4.3.3 Culture conditions ............................................................................................... 50 4.3.4 Plant growth period ............................................................................................. 51
4.3.5 Nutrient Solution Sampling ................................................................................. 51 4.3.6 Plant development ............................................................................................... 51 4.3.7 Gas exchange measurements ............................................................................... 51 4.3.8 Imaging of leaf area and leaf temperature ........................................................... 51
4.3.9 Biomass data ....................................................................................................... 52 4.3.10 Yield estimation .............................................................................................. 52 4.3.11 Timing of the measurements ........................................................................... 52
4.3.12 Preliminary testing .......................................................................................... 54
Potato (UCL) ........................................................................................................................... 55
4.4 Growth chamber specifications ............................................................................ 55 4.4.1 Lighting ............................................................................................................... 56
4.4.2 Environment control ............................................................................................ 58 4.4.3 Hydroponic system .............................................................................................. 61 4.4.4 Nutrient solution .................................................................................................. 63
4.4.5 Microorganisms monitoring ................................................................................ 63
4.5 Test plan ................................................................................................................. 64 4.5.1 Setup and protocol for germination and propagation .......................................... 64 4.5.2 Observation parameters for the plants ................................................................. 64
4.6 Summary ................................................................................................................ 68
5 Soybean ........................................................................................................................... 69
5.1 Growth chamber specifications ............................................................................ 69 5.1.1 Hydroponics system ............................................................................................ 69
5.1.2 Environment control ............................................................................................ 70 5.1.3 Experimental set up ............................................................................................. 71
5.2 Test plan ................................................................................................................. 76 5.2.1 Sampling and Measurements .............................................................................. 76
5.2.1.1 Plant growth and physiology ....................................................................... 76
5.2.1.2 Water consumption and nutrient uptake ...................................................... 77 5.2.1.3 Yield performance ....................................................................................... 78 5.2.1.4 Growth and Efficiency Indexes ................................................................... 78
5.2.1.5 Cultivation system requirements and critical points identification ............. 78 5.2.2 References of the measuring devices .................................................................. 79 5.2.3 References ........................................................................................................... 80
issue 1 revision 0 0 -
page vi of ix
MELiSSA Technical Note
5.3 Seed and product analysis .................................................................................... 81 5.3.1 Dry mass .............................................................................................................. 81
5.3.2 Fat content ........................................................................................................... 81 5.3.3 Protein content ..................................................................................................... 81 5.3.4 Fibre content ........................................................................................................ 81 5.3.5 Carbohydrate content .......................................................................................... 82
5.3.6 Phytic acid analysis ............................................................................................. 82 5.3.7 Isoflavones analysis ............................................................................................. 83 5.3.8 Analysis plan ....................................................................................................... 85 5.3.9 References of the measuring devices .................................................................. 86
5.3.10 References ....................................................................................................... 87
Table of Figures
Fig. 1 Growth chamber with equipment installed ............................................................... 3 Fig. 2 Scheme of the growth chamber with gullies numbered from A1 to D2 ................... 4
Fig. 3 Point of light intensity measurement above the gully ............................................... 4
Fig. 4 Light intensity mapping above the 8 gullies ............................................................. 5 Fig. 5 Spectrum of the light tube Osram FQ 39 W/ 830 HO Lumilux warm white ............ 6 Fig. 6 Spectrum of the light tubes Osram FQ 39 W/ 840 HO Lumilux cold white ............. 6
Fig. 7 Placement of thermometers and hygrometers in the growth chamber ...................... 7 Fig. 8 Temperature profile at gullies level and in the tank of gully D2 .............................. 8
Fig. 9 Relative humidity in the growth chamber ................................................................. 8 Fig. 10 Top view of the growth chamber with emplacement of the 8 gullies ....................... 9 Fig. 11 Front cross section of a gully .................................................................................. 10
Fig. 12 Scheme of the hydroponic system ........................................................................... 11
Fig. 13 Front view of the Grodan Plugs (piece of 10 cm) ................................................... 12 Fig. 14 Emplacement of the Rockwool pieces in the gully ................................................. 12
Fig. 15 Developmental stage of the wheat grain selected for transfer to rockwool ............ 16 Fig. 16 Grain of wheat in the hole of the rockwool ............................................................. 16
Fig. 17 Placement of the spring wheat cultivars in the growth chamber ............................. 17 Fig. 18 Scheme of the gully and the Rockwool ................................................................... 17 Fig. 19 Ears of plant from the preliminary experiment. The stamens are visible................ 20
Fig. 20 Pre-test with the four spring wheat cultivars ........................................................... 22 Fig. 21 View on the SEC2 growth chambers ...................................................................... 23 Fig. 22 Photon flux in µmol/m²s measured 135 cm from the floor ..................................... 25 Fig. 23 Photon flux in µmol/m²s measured 100 cm from the floor ..................................... 25 Fig. 24 Measurement locations for light mapping (not to scale) ......................................... 26
Fig. 25 Side schematic of one of the UoG sealed environment plant growth chambers ..... 28 Fig. 26 Top view schematic showing hydroponic tray location. ......................................... 28
Fig. 27 Nutrient system schematic ...................................................................................... 29 Fig. 28 Temperature and Humidity control in a 56 day old soybean crop. ......................... 29 Fig. 29 Setup of troughs and plant positioning within the growth chamber ....................... 31

issue 1 revision 0 0 -
page vii of ix
MELiSSA Technical Note
Fig. 30 Growth chamber with equipment installed ............................................................. 36 Fig. 31 Schema of the growth chamber with gullies numbered from 1 to 4. ...................... 38
Fig. 32 Point of light intensity measurement above the rack .............................................. 38 Fig. 33 Light flux mapping above rack 1 (higher) and 2 (lower). ....................................... 39 Fig. 34 Spectrum of the light tube MASTER TL-D Reflex 58W/840 ................................ 39 Fig. 35 Air input (rack 1) and output (rack 3) temperature, dark period from 0 to 8 AM... 41
Fig. 36 Day and night temperature mapping on rack 1 ....................................................... 42 Fig. 37 Relative humidity in the growth chamber – dark period 0 – 8 AM ........................ 42 Fig. 38 Front view of a trough ............................................................................................. 44 Fig. 39 Schematic of the hydroponic system ....................................................................... 44
Fig. 40 Schematic of the water handling system ................................................................. 45 Fig. 41 Response of the nutrient solution pH to the automated acid addition ..................... 48 Fig. 42 Response of the nutrient solution EC to the automated base addition .................... 49
Fig. 43 Potato vitro-plants after acclimatisation .................................................................. 50 Fig. 44 Tubers produced from the preliminary experiment ................................................. 54 Fig. 45 Schematic representation of the growth room in Louvain-la-Neuve ...................... 55
Fig. 46 Philips TL-D reflex super 80 58W/840 specification and spectrum ....................... 56
Fig. 47 Map of the light ceiling ........................................................................................... 57 Fig. 48 Light intensity along the gullies with standard deviation between gullies. ............ 57 Fig. 49 RH and temperature on table1 next to the door and the fan unit............................. 58
Fig. 50 RH and temperature on table2 ................................................................................. 59 Fig. 51 RH and temperature in the middle of the room (no direct contact with the lamps) 59
Fig. 52 Temperature control system in the growth room .................................................... 60 Fig. 53 Recirculating closed NFT hydroponic system for potatoes. ................................... 61 Fig. 54 Gullies and hydroponic systems .............................................................................. 62
Fig. 55 Views of the double gully, the nutrient solution tank and the submerged pump. ... 72 Fig. 56 Air conditioning system in the growth chamber and reflective film on the floor. .. 72
Fig. 57 Plastic basket for seeds and plants holding in the NFT gullies. .............................. 73 Fig. 58 The emission spectrum of HPS lamps LU600/T GE Lucalox® T15 - 600 W. ....... 73
Fig. 59 Layout of the gullies and the climate control devices. ............................................ 74
Fig. 60 Position of the measurements in relation to the lamps. ........................................... 74 Fig. 61 Virtual spatial light distribution in the growth chamber. ........................................ 74 Fig. 62 Temperature at the height of the gullies .................................................................. 75
Fig. 63 Random distribution of the soybean cultivars in the growth chamber .................... 76 Fig. 64 Schedule of the measurements on plant and crop and on nutrient solution. ........... 79 Fig. 65 A typical liquid chromatograph. .............................................................................. 85

issue 1 revision 0 0 -
page viii of ix
MELiSSA Technical Note
List of Tables
Tab. 1 Nutrient solution recipe for start-up solution and replenish tank solution .............. 13
Tab. 2 Characteristics of the spring wheat cultivars selected for the FC phase 1 .............. 15 Tab. 3 Timing of the measurements ................................................................................... 21 Tab. 4 Nutrient solution recipe for 150 L start-up and 10L replenish tank solution .......... 32 Tab. 5 Sample requirements ............................................................................................... 34
Tab. 6 Photoperiod and light range .................................................................................... 37 Tab. 7 Light flux in function of the plant position ............................................................. 37 Tab. 8 Sensors for online measurement of required environmental parameters ................ 43 Tab. 9 Growing phase nutrient solution composition ........................................................ 47
Tab. 10 Tuberisation phase nutrient solution composition .............................................. 47 Tab. 11 Sensors choice for online measurement of required environmental parameters . 47 Tab. 12 Characteristics of the potatoes cultivars selected for the FC phase 1 ................. 49
Tab. 13 Cultivars selected and quantity of plants ............................................................. 51 Tab. 14 Potato tuber nutrient analysis .............................................................................. 52 Tab. 15 Parameters and frequency of logging .................................................................. 53
Tab. 16 Specifications of the Symphony SP90M5 meter (pH, EC, O2, temperature) ...... 63
Tab. 17 Test sticks specifications ..................................................................................... 64 Tab. 18 Specifications of instruments for physiological parameters................................ 65 Tab. 19 Salt composition of the nutrient solution (mg per litre of nutrient solution). ..... 70
Tab. 20 Vertical and horizontal light distribution (mol/m2s average of 5 replicates). ... 75
Tab. 21 Vertical and horizontal temperature distribution (°C; average of 5 replicates) .. 75
Tab. 22 Vertical and horizontal RH distribution (%; average of 5 replicates). ................ 75 Tab. 23 Characterization of isoflavones present in soybean and soymilk extracted ........ 84 Tab. 24 Amount of soybeans, we need for every analysis and in total. ........................... 85

issue 1 revision 0 0 -
page ix of ix
MELiSSA Technical Note
List of Abbreviations
AAS: Atomic Absorption Spectrophotometry
CES: Controlled Environment Systems
CESRF: Controlled Environment Systems Research Facility
DAP: Days After Planting
DI: Deionised
DM: Dry Matter
EC: Electrical Conductivity
FID: Flame Ionization Detector
FW: Fresh weight
GC: Gas Chromatograph
HDPE: High-density polyethylene
HPLC: High Pressure Liquid Chromatograph
ICP: Inductive Coupled Plasma
LA: Leaf area
LC-MS/MS: Liquid chromatography-mass spectrometry
MDL: Minimum Detection Limit
NFT: Nutrient Film Technique
OD: Optical Density
PAR: Photosynthetic active radiation
PCA: Plate Count Agar
PE: Polyethylene
PP: Polypropylene
PPF: Photosynthetic Photon Flux
PU: Polyurethane
RH: Relative Humidity
SEC-2: Sealed Environment Chambers
TDF: Total Dietary Fibre
TVC: Total Viable Count
VOC: Volatile Organic Compound
VPD: Vapour Pressure Deficit
YGC: Yeast extract Glucose Carbonate medium
Glossary
Gully: also known as trough or gutter. Inclined channel used in hydroponic systems to hold
the plant root system, and where the nutrient solution flows through.

issue 1 revision 0 -
page 1 of 87
TN 98.4.11 Preliminary trade-off for test plan and procedures UGent
This document is confidential property of the MELiSSA partners and shall not be used, duplicated, modified or transmitted without their authorization
Memorandum of Understanding 19071/05/NL/CP
MELiSSA Technical Note
1 Introduction
This Technical Note is the result of contributions from members of the project consortium, and
was compiled by the management team at UGent. It describes the facilities used to cultivate
four different cultivars for each of the 4 crops selected for the FC project, and outlines the
experimental procedures for the WP 4200 tasks. Each partner has its own growth chamber
setup based on different hardware. The goal of this work is to unify the test procedures as far
as possible despite the differences in chamber hardware, crop cultivation needs and availability
of measuring equipment.
In all setups, the liquid phase is separated for all cultivars selected. From the 5 available
setups, only the Guelph chambers feature a sealed atmosphere in which one cultivar at a time
is grown. Hence only the measurements from the Guelph setup can be used for mass-balance
assessments as a function of time. The other setups grow the cultivars in a common
atmosphere. To avoid inhibitory effects on plant growth, the solution of the recirculating
hydroponic systems will be replaced during plant development.
The gathered crop growth data, corresponding to the involved labs measuring schedules for the
defined parameters, will be summarised with the use of a standardised template provided by
UGent. A link with the associated harvest analysis data will be defined for inclusion into the
MELiSSA Food Database structure.
To guarantee reliability and traceability of the data, each partner has been requested to include
a monthly overview of the overall chamber status (including possible failures etc.) into the
aforementioned template. Each partner adapts this template to their specific measuring
schedule as defined in this document.
The experience gained from these plant production trials will be used to evaluate and define
the PCU design requirements.
issue 1 revision 0 -
page 2 of 87
TN 98.4.11 Preliminary trade-off for test plan and procedures UGent
This document is confidential property of the MELiSSA partners and shall not be used, duplicated, modified or transmitted without their authorization
Memorandum of Understanding 19071/05/NL/CP
MELiSSA Technical Note
1.1 Hardware and monitoring parameter overview
The basic hardware characteristics and the common monitoring parameters for the first bench-
test of Phase 1 of the FC project are listed below. The details of the respective setups and the
associated measuring schedules for the comparison of the performance of 4 cultivars per crop
are elaborated in this document.
Controlled environment chamber hardware
Atmosphere UoGuelph: 2 sealed chambers,
1 cultivar per chamber, 2 subsequent experiments
UGent, UNapoli, UBern, UCL: walk in chamber
common atmosphere for 4 cultivars, 1 experiment
Liquid phase Independent recirculating NFT system per cultivar
UGent, UNapoli, UBern, UCL: 4 independent setups in 1 chamber
UoGuelph: 1 setup per chamber, 4 independent experiments
Monitoring parameters
Growth environment:
-light, chamber temperature and relative humidity evolution, CO2 level
Nutrient solution environment:
-gully flow, inclination and solution layer thickness; pH and EC control; nutrient solution T
-nutrient solution elemental analysis
Plant growth assessment:
-assessment of development: height, branching, flowering, seedset or tuberisation
-gas-exchange measurements: assimilation and transpiration (CO2, H2O)
UGent, UNapoli, UBern, UCL: short-term using open-circuit gas exchange systems
UoGuelph: continuous whole chamber CO2 usage and crop transpiration monitoring

issue 1 revision 0 -
page 3 of 87
TN 98.4.11 Preliminary trade-off for test plan and procedures UGent
This document is confidential property of the MELiSSA partners and shall not be used, duplicated, modified or transmitted without their authorization
Memorandum of Understanding 19071/05/NL/CP
MELiSSA Technical Note
2 Bread Wheat (UBern)
The growth chamber at the University of Bern was modified in order to fulfil all the growth
conditions as specified in the proposal for MELiSSA Food Characterisation Phase 1.
Fig. 1 Growth chamber with equipment installed

issue 1 revision 0 -
page 4 of 87
TN 98.4.11 Preliminary trade-off for test plan and procedures UGent
This document is confidential property of the MELiSSA partners and shall not be used, duplicated, modified or transmitted without their authorization
Memorandum of Understanding 19071/05/NL/CP
MELiSSA Technical Note
2.1 Growth chamber specifications
2.1.1 Dimensions
Growth chamber area: 8.32 m2 (3.05 m x 2.73 m)
Plant growing area: 1.52 m2 (1 m x 0.19 m x 8)
Growth space between plant root support and lamps is 80cm (see 2.2.1).
2.1.2 Lighting
The same light distribution is present over each gully. Two types of lamps are placed
alternatively in the lamp-module. The two types of lamps are:
1) Osram FQ 39 W/ 830 HO Lumilux warm white and
2) Osram FQ 39 W/ 840 HO Lumilux cold white.
Spectra are presented in Fig. 5 and Fig. 6. One lamp-module is made with four lamps of type 1
and four lamps of type 2. Six lamp-modules are placed on the six racks of the growth chamber,
but only four racks are used for the placement of the gullies. The method of photoperiod
control is: ON/OFF. The lamps turn on at 8:00 and turn off at 22:00. Reflectors were placed on
the wall close to the entry side of the gullies D1/D2 and in between the sink and gullies A1/A2
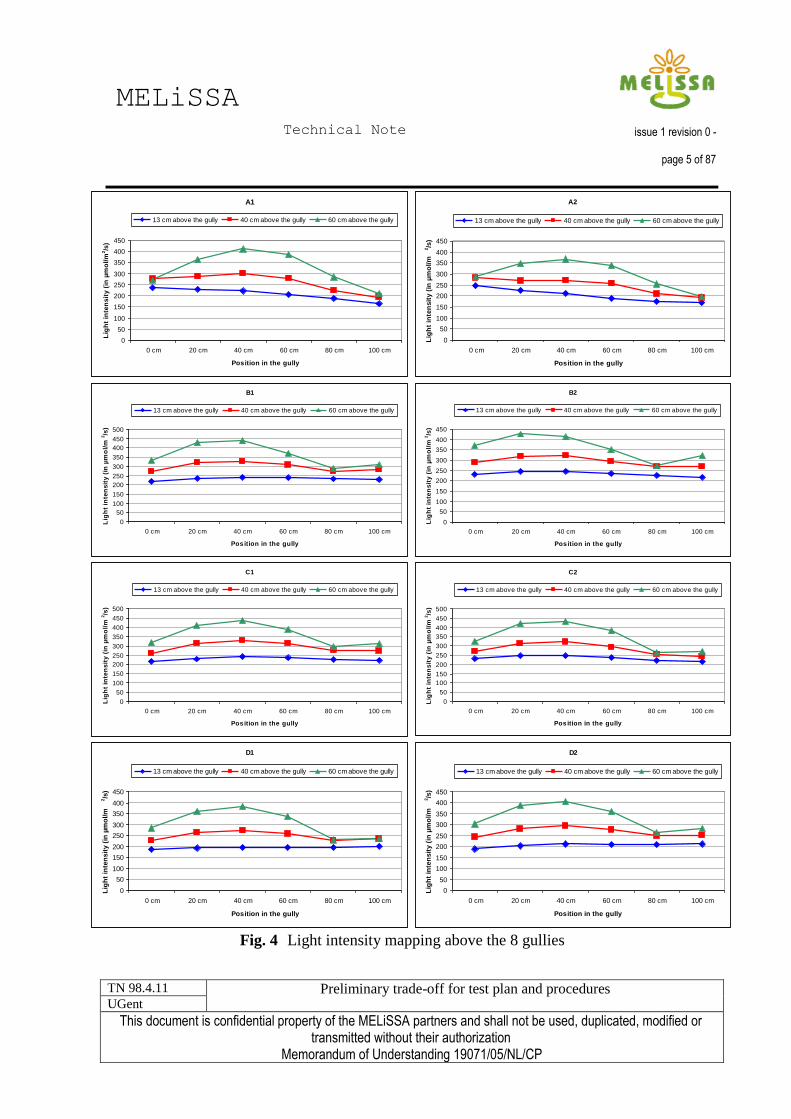
(see also Fig. 2) to increase light intensity. A mapping of the light intensities was made 13 cm
above the gullies (level of the first leaf), 40 cm above the gullies (canopy level when the plants
are at the tillers formation developmental stage) and 60 cm above the gullies (level of the flag
leaf). The ears extend above 60 cm (from preliminary experiment, the plant height was in
between 65-75 cm). The gullies are numbered from A1 to D2 as seen in Fig. 2. Fig. 3 shows
the measurement points. In Fig. 4, the results of the mapping are visible.
sink
A1 A2
B1
B2
C1
C2
D1 D2
Fig. 2 Scheme of the growth chamber with gullies numbered from A1 to D2
1m
20cm0 cm 40cm 80cm60cm 100cm
1m
20cm0 cm 40cm 80cm60cm 100cm
Fig. 3 Point of light intensity measurement above the gully
issue 1 revision 0 -
page 5 of 87
TN 98.4.11 Preliminary trade-off for test plan and procedures UGent
This document is confidential property of the MELiSSA partners and shall not be used, duplicated, modified or transmitted without their authorization
Memorandum of Understanding 19071/05/NL/CP
MELiSSA Technical Note
Fig. 4 Light intensity mapping above the 8 gullies
A1
0
50
100
150
200
250
300
350
400
450
0 cm 20 cm 40 cm 60 cm 80 cm 100 cm
Position in the gully
Lig
ht
inte
ns
ity
(in
µm
ol/
m2/s
)
13 cm above the gully 40 cm above the gully 60 cm above the gully
A2
0
50
100
150
200
250
300
350
400
450
0 cm 20 cm 40 cm 60 cm 80 cm 100 cm
Position in the gully
Lig
ht
inte
nsit
y (
in µ
mo
l/m
2/s
)
13 cm above the gully 40 cm above the gully 60 cm above the gully
B1
0
50
100
150
200
250
300
350
400
450
500
0 cm 20 cm 40 cm 60 cm 80 cm 100 cm
Position in the gully
Lig
ht
inte
ns
ity
(in
µm
ol/
m2/s
)
13 cm above the gully 40 cm above the gully 60 cm above the gully
B2
0
50
100
150
200
250
300
350
400
450
0 cm 20 cm 40 cm 60 cm 80 cm 100 cm
Position in the gully
Lig
ht
inte
ns
ity
(in
µm
ol/
m2/s
)
13 cm above the gully 40 cm above the gully 60 cm above the gully
C1
0
50
100
150
200
250
300
350
400
450
500
0 cm 20 cm 40 cm 60 cm 80 cm 100 cm
Position in the gully
Lig
ht
inte
ns
ity
(in
µm
ol/
m2/s
)
13 cm above the gully 40 cm above the gully 60 cm above the gully
C2
0
50
100
150
200
250
300
350
400
450
500
0 cm 20 cm 40 cm 60 cm 80 cm 100 cm
Position in the gully
Lig
ht
inte
ns
ity
(in
µm
ol/
m2/s
)
13 cm above the gully 40 cm above the gully 60 cm above the gully
D1
0
50
100
150
200
250
300
350
400
450
0 cm 20 cm 40 cm 60 cm 80 cm 100 cm
Position in the gully
Lig
ht
inte
nsit
y (
in µ
mo
l/m
2/s
)
13 cm above the gully 40 cm above the gully 60 cm above the gully
D2
0
50
100
150
200
250
300
350
400
450
0 cm 20 cm 40 cm 60 cm 80 cm 100 cm
Position in the gully
Lig
ht
inte
nsit
y (
in µ
mo
l/m
2/s
)
13 cm above the gully 40 cm above the gully 60 cm above the gully

issue 1 revision 0 -
page 6 of 87
TN 98.4.11 Preliminary trade-off for test plan and procedures UGent
This document is confidential property of the MELiSSA partners and shall not be used, duplicated, modified or transmitted without their authorization
Memorandum of Understanding 19071/05/NL/CP
MELiSSA Technical Note
Fig. 5 Spectrum of the light tube Osram FQ 39 W/ 830 HO Lumilux warm white
Fig. 6 Spectrum of the light tubes Osram FQ 39 W/ 840 HO Lumilux cold white
2.1.3 Environment control
Fresh air is injected in the growth chamber by an air replacement system working from 6:30 to
22:00. The fresh air comes from a central system where it is filtered and heated if needed
(winter). The cooling system of the growth chamber consists of a unit with a central air intake
and a dual cold air output in the direction of the entrance door and the back wall, respectively.
The ventilation of the cooling system is continuous, cooling with chilled water from central
unit building. The temperature setting is 22 °C during the day and 18°C during the night. The
temperature of the air is measured at the plant level by 8 mercury thermometers placed
between the gullies (see placement of thermometers in the Fig. 7). All thermometers have a
min/max function and are placed on each bench located between positions ab and cd (see Fig.
7 and Fig. 14) Min/max temperatures are reset weekly. See the confirmation of the temperature
target value in Fig. 8. The temperature of the growth chamber is measured and controlled via a
sensor (Duct Temperature Sensors, C7068, Honeywell, GmbH, Germany) located at midlevel
under lamp-module A1/A2 to remediate extra heat building up under lamp modules. The
relative humidity is measured by a hygrometer (Fischer GmbH, Germany) located on the wall
between the door and the gullies D1/D2 (combined plotting with temperature values, allowing

issue 1 revision 0 -
page 7 of 87
TN 98.4.11 Preliminary trade-off for test plan and procedures UGent
This document is confidential property of the MELiSSA partners and shall not be used, duplicated, modified or transmitted without their authorization
Memorandum of Understanding 19071/05/NL/CP
MELiSSA Technical Note
to calculate the temperature-independent vapour pressure deficit - VPD). The relative humidity
is also measured by an additional sensor (TFA mechanical hair hygrometer, Germany). See
Fig. 7 for the location of the hygrometers. See 2.3.12 for the specifications of the measuring
devices. Excess humidity is removed through condensation by the cooling system. As a result
the average relative humidity is approximately 65 % during the day and 75 % during the night.
The measurement of relative humidity by the TFA sensor is shown in Fig. 9. The conditions of
humidity in the growth chamber are good and a humidifier is not needed. If the conditions
change and a humidifier is needed, a humidifier can be installed. A hygrometer (recording
relative humidity and temperature for one week on a paper) was placed in the growth chamber
close to the wall between the door and gullies D1/D2. The O2 concentration is ambient. CO2
concentration is measured with a handheld IRGA analyzer (Environmental Instruments,
Anagas CD 95, Geotechnical Instruments, Leamington Spa, UK) weekly at chamber level,
with air intake tube located in the culture room near the gullies. Monitoring of growth chamber
parameters is foreseen by dedicated personnel. A safety thermostat turns off the lamps
automatically in case the temperature exceeds 35°C). In case of increase of temperature or
humidity, an alarm is sent to dedicated personnel. All the conditions of the growth chamber
(turn on/off the lamps, turn on/off the air replacement, temperature setting, real temperature,
humidity setting, real humidity, speed of ventilation) are saved. Reports can be printed
choosing the period of interest (1 week, 1 month or 1 year, with more or less details).
Fig. 7 Placement of thermometers and hygrometers in the growth chamber
sink
A1 A2
B1
B2
C1
C2
D1 D2
1
2
46 5
7
= Thermometer
3
8
Thermo-hygrograph
TFA Hygrometer

issue 1 revision 0 -
page 8 of 87
TN 98.4.11 Preliminary trade-off for test plan and procedures UGent
This document is confidential property of the MELiSSA partners and shall not be used, duplicated, modified or transmitted without their authorization
Memorandum of Understanding 19071/05/NL/CP
MELiSSA Technical Note
Temperature at gullies level
0
5
10
15
20
25
30
06:0
0
07:4
0
08:0
5
09:0
5
09:3
5
10:0
5
11:0
5
13:0
5
15:0
5
17:0
5
Tem
pera
ture
in
°C
thermometer 1
thermometer 2
thermometer 3
thermometer 4
thermometer 5
thermometer 6
thermometer 7
thermometer 8
Tank D2
Fig. 8 Temperature profile at gullies level and in the tank of gully D2
0
10
20
30
40
50
60
70
80
90
100
07:40 08:05 09:05 10:05 11:05 13:05 15:05 17:05
RH
in
%
Fig. 9 Relative humidity in the growth chamber

issue 1 revision 0 -
page 9 of 87
TN 98.4.11 Preliminary trade-off for test plan and procedures UGent
This document is confidential property of the MELiSSA partners and shall not be used, duplicated, modified or transmitted without their authorization
Memorandum of Understanding 19071/05/NL/CP
MELiSSA Technical Note
2.2 Hydroponic system
2.2.1 Hydroponic system setup
Fig. 10 shows the schematic plan of the growth chamber with the placement of the eight
gullies. The growth chamber has six rack positions with six lamp-modules on the top of each
rack. Only four racks are used to place the gullies (racks in blue in Fig. 10). The distance
between the rack and the lamp-module is 85 cm. The stainless steel gullies are one meter long,
19 cm wide and 6.5 cm high (see Fig. 11). They are placed on the rack with an inclination of 1
% (1 cm per 1 m). Four pieces of rockwool are placed in each gully to be the substrate of the
plant. Each gully is independent from the other gullies and is connected to one pump and one
tank for the nutrient solution. Each gully has a separate recirculating NFT system. The flow
rate is 2 L/min at the beginning of the growth of the plant (minimal flow rate to produce a thin
nutrient solution layer in the gully when rockwool is present, but not sufficient to cover the
complete width of gully when rockwool is absent). Later in the growth of the plants, when the
roots use the space around the rockwool and form barriers for the water flow, the nutrient
solution delivery flow rate is decreased with the help of a tube clamp adjustment or by
increasing the bypass flow. Since the nutrient film thickness is a critical parameter, it will be
monitored weekly to assure the roots are not completely flooded or have an insufficient water
supply; flow rate will be adjusted accordingly when needed. The root system of the plant is
protected against light with black/white blackout plastic. All the tubes going from the tank to
the pump and to the gully are covered with the same black/white blackout plastic to protect the
nutrient solution from the light. The tanks are also protected against light and heat with a
secondary layer of aluminium foil.
sink
273 cm
305 cm
Polypropylene food grade
tank for the nutrient
solution
1 m long gully
stainless steel
Rockwool
Fig. 10 Top view of the growth chamber with emplacement of the 8 gullies

issue 1 revision 0 -
page 10 of 87
TN 98.4.11 Preliminary trade-off for test plan and procedures UGent
This document is confidential property of the MELiSSA partners and shall not be used, duplicated, modified or transmitted without their authorization
Memorandum of Understanding 19071/05/NL/CP
MELiSSA Technical Note
Fig. 11 Front cross section of a gully
2.2.2 Hydroponic system materials
- Polyurethane coated stainless steel gullies (1 m long, 19 cm wide and 6.5 cm high).
- Polyethylene plastic black/white film to cover the gullies and protect the roots.
- Polypropylene food grade tank for the nutrient solution (volume of 20 L).
- Transparent green silicone tubing (diameter 16 or 24 mm) connected to the pumps.
- Polypropylene connection for the tubes.
- Polyacetal y-connections for the bypass of the tube.
- Polyethylene tanks for the stock of nutrient solution.
- White elastic adhesive Zwaluw Hybrifix Super 7 (for the water tightness of the gullies and
to protect the screw against oxidation).
2.2.3 Pumps
Pump EHEIM Universal 1260
Dimensions: 161 x 218 x 116 mm
Pump maximum rated flow rate: 3400 l/h (theoretical value with 0 m delivery head and no
tubing attached; pump characteristics diagram specifies the theoretical minimum 0 l/h flow rate
at the maximum delivery head of 3m). The setup delivery head equals 0.6m (height of tube
entry into gully, pump located on floor).
To reduce the remaining high volumetric flow, two by-passes are placed at the pressure side of
the pump (Fig. 12). This way it is possible to regulate the flow of nutrient solution in the target
range 1-2 l/min, and to continuously mix the nutrient solution in the tank. The flow is
continuous (constant flow rate).
Power consumption: 80 W
Despite their very high output, these pumps were chosen because the rotor magnet is coated.
Smaller pumps of this type have uncoated magnets which might release small amounts of
heavy metals to the nutrient solution.
19 cm
6.5 cm

issue 1 revision 0 -
page 11 of 87
TN 98.4.11 Preliminary trade-off for test plan and procedures UGent
This document is confidential property of the MELiSSA partners and shall not be used, duplicated, modified or transmitted without their authorization
Memorandum of Understanding 19071/05/NL/CP
MELiSSA Technical Note
Pump
= Flow of nutrient solution
Tank
= first bypass
= second bypass
= possible place for the clamp to diminish the
diameter of the tube, to regulate the flow rate
= distance between the two bypass loops,
adjustable to regulate the flow rate
Fig. 12 Scheme of the hydroponic system

issue 1 revision 0 -
page 12 of 87
TN 98.4.11 Preliminary trade-off for test plan and procedures UGent
This document is confidential property of the MELiSSA partners and shall not be used, duplicated, modified or transmitted without their authorization
Memorandum of Understanding 19071/05/NL/CP
MELiSSA Technical Note
2.2.4 Substrate
Grodan Multiblocks (Grodan AO 25/40 10/10 W), blocks of 25x25x40 mm (40 mm high)
fixed together in a plate, diameter of the holes 10/10 mm. The Grodan detachable plugs are
conical in shape, and have space between them for root development, nutrient flow and gas
exchange. The base of the plug is 16 X 16 mm. See Fig. 13.
10 cm
1.6 cm
3 c
m1 c
m
0.9 cm
2.5 cm
Fig. 13 Front view of the Grodan Plugs (piece of 10 cm)
Each sheet of rockwool is 15 x 22.5 cm (6 x 9 plugs). The weight of each piece was measured
prior to seeding. The seedlings were placed in every second hole of the rockwool (see Fig. 18).
Four pieces of rockwool were placed in the gully and named from a to d from the entry to the
exit of the gully (see Fig. 14).
a b c d
Fig. 14 Emplacement of the Rockwool pieces in the gully
2.2.5 Nutrient solution composition
The same nutrient solution as used by the University of Guelph (see the recipe below, Tab. 1)
is applied. However Ni is added since it is an essential micronutrient for the plants (Welch
1995). The final Ni concentration is the same concentration as in the nutrient solution usually
used to grow plants at the University of Bern (nutrient solution described in Hildbrand et al,
1994). See Tab. 1.
The start up nutrient solution is followed by a higher concentrated solution (Tab. 1) to
replenish during growth in response to decreased EC level. Nutrient solution is completely
changed every four weeks to reduce potential build up of salts or other phytotoxic compounds.
Nutrient solution samples are taken at the beginning of each new solution change and at the
end of the 4 week interval. The nutrient solution volume is 15 litres per tank.

issue 1 revision 0 -
page 13 of 87
TN 98.4.11 Preliminary trade-off for test plan and procedures UGent
This document is confidential property of the MELiSSA partners and shall not be used, duplicated, modified or transmitted without their authorization
Memorandum of Understanding 19071/05/NL/CP
MELiSSA Technical Note
Tab. 1 Nutrient solution recipe for start-up solution and replenish tank solution
Final concentration Final concentration
for start up solution for replenish solution
Macronutrients
Fe-EDTA Solution
FeCl3 * 6H2O 50 μM 134 μM
EDTA 47.6 μM 127.8 μM
KH2PO4 0.5 mM 10 mM
KNO3 2.5 mM 46 mM
MgSO4 * 7H2O 1 mM 10 mM
Ca(NO3)2 * 4H2O 2.5 mM 12 mM
Micronutrients
H3BO3 7.1 μM 92.7 μM
MnCl2 * 4H2O 7.3 μM 96.1 μM
ZnSO4 * 7H2O 0.9 μM 12.4 μM
CuSO4 * 5H2O 0.5 μM 6.7 μM
(NH4)6Mo7O24 * 4H2O 0.0016 μM 0.02 μM
Ni(NO3)2 * 6H2O 0.5 μM 6.7 μM
2.2.6 Hydroponic system sensor
The pH and electrical conductivity (EC) are checked manually with handheld meters once a
week. The meters (Adwa pocket pH meter AD-100 and Adwa pocket EC meter AD-204) are
calibrated each week with included calibration solution and checked once against a laboratory
instrument.
EC: 1.2 mS (expected value, based on information from UoGuelph)
pH: 5.6 – 6.0 (expected value, based on information from UoGuelph)
2.2.7 Cooling system for the nutrient solution
From the pre-test experiment (see part 2.4 and Fig. 8) it was shown that the temperature of the
nutrient solution was around 26 °C during the day. With an aluminium foil placed around the
tank, the temperature was around 25.5 °C. Under these conditions, a cooling system for the
nutrient solution is not needed. The temperature of the nutrient solution is measured by a
DUAL-TEMP infrared-probe thermometer.

issue 1 revision 0 -
page 14 of 87
TN 98.4.11 Preliminary trade-off for test plan and procedures UGent
This document is confidential property of the MELiSSA partners and shall not be used, duplicated, modified or transmitted without their authorization
Memorandum of Understanding 19071/05/NL/CP
MELiSSA Technical Note
If later during the growth of the plants, the temperature of the nutrient solution increases, a
cooling system may be installed. This cooling system is a Lauda Alpha Kältethermostat (461-
0058PRA8) from VWR International AG, Lerzenstrasse 16/18, 8953 Dietikon, Switzerland.
Oxygen solubility decreases with temperature; the risk of anaerobic conditions is however
estimated to be low (high mixing rate by circulation pump, fast flow in the gully and the thin
nutrient solution layer).
2.2.8 Gullies cleaning
The gullies are cleaned before the start-up with detergent and rinsed with deionised water. The
system is then run for 24 hours with deionised water.
Between the plant culture, the gullies are cleaned with hot citric acid (when needed), rinsed
with deionised water, disinfected with bleach NaOCl or peroxide 1% (limited duration of
contact TBC) and rinsed again with deionised water. Afterwards the system is run for 24 hours
with deionised water.
2.3 Test plan
2.3.1 Cultivar selected
The selected cultivars are the spring wheat Fiorina, CH Rubli, Greina and Aletsch. The list of
characteristics (see Tab. 2) was established following the information on winter and spring
bread wheat collected in the document “Liste recommandée des variétés de céréales pour la
récolte 2009” (available at http://swissgranum.ch/pdf/LR2009_Cereale_F.pdf or through the
UGent fileservers) published by the research station Agroscope Changins-Wädenswil ACW
(www.acw.admin.ch/), the research station Agroscope Reckenholz-Tänikon ART
(www.art.admin.ch/) and swiss granum (www.swissgranum.ch/). Some quantitative data about
yield, precocity of ear emergence, height of the plants, content of proteins, weight per 100
litres of grains and weight of 1000 grains were added in the list. This information was found in
the report “Blé de printemps Sommerweizen 2007” (available at http://www.db-
acw.admin.ch/pubs/ch_cha_08_pub_ble_printemps_resultats_f.pdf or through the UGent
fileservers) published by the research station Agroscope Changins-Wädenswil ACW and the
research station Agroscope Reckenholz-Tänikon ART. The small differences in the qualitative
and quantitative data are due to the fact that quantitative data were for the year 2007, while the
qualitative data were from the year 2008. Differences may occur in the growth of the plants for
the different year of cultivation.

issue 1 revision 0 -
page 15 of 87
TN 98.4.11 Preliminary trade-off for test plan and procedures UGent
This document is confidential property of the MELiSSA partners and shall not be used, duplicated, modified or transmitted without their authorization
Memorandum of Understanding 19071/05/NL/CP
MELiSSA Technical Note
Tab. 2 Characteristics of the spring wheat cultivars selected for the FC phase 1
Fiorina * Aletsch Greina* CH Rubli
2001 2003 1994 2008
Top 1 1 1
good middle middle to weak good
in q/ha 44.5 38.2 37.1 46.4
mid-precocious mid-precocious precocious precocious
± days comparing to standard variety 0.5 1.6 − 5.7 − 2.3
middle to short middle middle to short middle
in cm 81.9 87.5 70.8 86.0
lodging good good good good
powdery mildew good good middle good
yellow rust of wheat very good middle middle good
brown rust of wheat middle middle good middle
Septoria nodorum on the leaves middle middle middle to weak middle to good
Septoria nodorum on the ear middle middle middle to weak middle
Septoria tritici on the leaves middle middle middle middle
fusariose on the ear middle middle to weak middle to weak middle to weak
pre-harvest sprouting middle to good middle to good middle to good middle to good
good good middle to good good
in % 15.3 15.8 15.4 15.7
middle to good middle to good good middle to good
middle very good very good very good
in kg 76.2 79.4 77.2 79.9
middle small small small
in g 37.7 33.1 31.7 33
* can be sown in autumn
Variety
Content of proteins
Year of inscription
Quality class
Yield
Precocity of ear emergence
Height of the plants
Quantity of gluten
Weight for 100 liters of grains
Weight of 1000 grains
R
esis
tan
ce t
o
2.3.2 Seeds treatment
In order to avoid potential contamination problems, the seeds are sterilized prior to seeding in
the chamber by treating in 70% ethanol for 2 minutes followed by 20% commercial bleach for
10 minutes with gentle shaking and rinsed 5 times with sterile laboratory grade water.
Seeds are then germinated on wet filter paper (deionised water) in square plastic boxes with
cover, in the growth chamber (germination in the dark). The recipient is first cleaned with
detergent, well rinsed with deionised water, sprayed with ethanol and dried. Seeds are
germinated for two (CH Rubli), three (Aletsch and Greina) or four (Fiorina) days. Germinated
seeds are then selected for the same germination stage (when seed coat opens and stem and

issue 1 revision 0 -
page 16 of 87
TN 98.4.11 Preliminary trade-off for test plan and procedures UGent
This document is confidential property of the MELiSSA partners and shall not be used, duplicated, modified or transmitted without their authorization
Memorandum of Understanding 19071/05/NL/CP
MELiSSA Technical Note
roots emerge, see Fig. 15) and are placed in the wet rockwool (see Fig. 16). This protocol
minimizes root damage and bad positioning in the rockwool. One day after the transfer of the
germinated seeds, the proper placement of the plants in the rockwool is checked.
Fig. 15 Developmental stage of the wheat grain selected for transfer to rockwool
Fig. 16 Grain of wheat in the hole of the rockwool
2.3.3 Plant cultural condition
Wheat is grown in 1 x 0.19 m stainless steel gullies in rockwool (Grodan AO 25/40 10/10W)
using a recirculating nutrient film technique delivery system. Seeds are sown at a planting
density of 60 seeds per gully (15 seeds per rockwool piece and four rockwool pieces per gully,
see Fig. 18), two gullies per cultivar (Fig. 17). The distance between two plants is 5 cm and is
comparable to the distance between plants of wheat growing in the field (Basler 2008). The
four pieces of rockwool (15 cm x 22.5 cm) are placed in the gully so as to provide enough
space for the nutrient solution to flow around the rockwool. A plastic black/white blackout
cover with slits to accommodate the wheat is placed over the rockwool to minimize algae
growth and reduce evaporation. The rockwool is rinsed with deionised water prior to use to
remove particulate material from the substrate.

issue 1 revision 0 -
page 17 of 87
TN 98.4.11 Preliminary trade-off for test plan and procedures UGent
This document is confidential property of the MELiSSA partners and shall not be used, duplicated, modified or transmitted without their authorization
Memorandum of Understanding 19071/05/NL/CP
MELiSSA Technical Note
sink
A1 A2
B1
B2
C1
C2
D1 D2
Aletsch
CH Rubli
Fiorina
Greina
Fig. 17 Placement of the spring wheat cultivars in the growth chamber
1 m
Width of the gully = 19 cm
Width of the rochwool = 15 cm
Height of gully = 6.5 cm
Height of rockwool = 4 cm
Distance in between two holes = 2.5 cm
Distance in beetween two plants = 5 cm
Hole with one plant of wheat
Empty hole
22.5 cm
15 plants of wheat per rockwool piece
60 plants of wheat per gully
Fig. 18 Scheme of the gully and the Rockwool

issue 1 revision 0 -
page 18 of 87
TN 98.4.11 Preliminary trade-off for test plan and procedures UGent
This document is confidential property of the MELiSSA partners and shall not be used, duplicated, modified or transmitted without their authorization
Memorandum of Understanding 19071/05/NL/CP
MELiSSA Technical Note
2.3.4 Plant growth period
Seeds will be sterilized and placed in the growth chamber for germination on Monday 24 of
August. Two days (CH Rubli), three days (Greina and Aletsch) and four days (Fiorina) after
beginning of germination, the grains were ready for the transfer into the rockwool.
The estimated completion date is December 2009.
2.3.5 Nutrient solution analysis
pH and EC are manually measured (Adwa pocket pH meter AD-100 and EC meter AD-204,
gvz-rossat SA, Switzerland). Sampling of hydroponics solution is performed at the beginning
and end of each 4 week nutrient solution interval and stored for AAS, photometric or
reflectometric analyses.
2.3.5.1 Macronutrients: N P K Ca Mg S in the nutrient solution
- K, Ca, Mg measured by atomic absorption spectrophotometry (AAS)
- N measured by reflectometric method with analytical test strips (Reflectoquant Nitrate
Test, 5-225 mg/L NO3-, Merck, Germany) and handheld reflectometer (RQflex plus,
Merck, Germany)
- P measured by photometric method using a phosphate reagent (100 mL ammonium
heptamolybdate 5% + 100 mL ammonium vanadate 2.5% + 67 mL HNO3 concentrated).
(Stieger and Feller, 1994)
- S measured by photometric test, new method to be tested, kit of reagents (Spectroquant -
Sulfate Test, 25-300 mg/L SO42-
, Merck, Germany) and reflectometer (RQflex plus,
Merck, Germany)
2.3.5.2 Micronutrients: Fe Mn Zn Cu Mo Cl Ni in the nutrient solution
- Fe, Zn, Cu, Mn measured by AAS
- Cl measured by photometric test (kit of reagents Spectroquant Chloride Test, 2.5-250
mg/L Cl-, Merck, Germany and photometer Spectroquant NOVA 60, Merck, Germany),
new method to be tested and by reflectometric test (analytical test strips Reflectoquant
Chloride Test, 0.05-1.00 g/L Cl-, Merck Germany and reflectometer RQflex plus, Merck,
Germany), new method to be tested
- Ni measured by photometric test, new method to be tested (kit of solutions Spectroquant
Nickel Test, 0.02-5.00 mg/L Ni, Merck, Germany and photometer Spectroquant NOVA
60, Merck, Germany)
- Mo measured by photometric test, new method to be tested (kit Spectroquant
Molybdenum Cell Test, 0.02-1.00 mg/L Mo, Merck, Germany and photometer
Spectroquant NOVA 60, Merck, Germany)

issue 1 revision 0 -
page 19 of 87
TN 98.4.11 Preliminary trade-off for test plan and procedures UGent
This document is confidential property of the MELiSSA partners and shall not be used, duplicated, modified or transmitted without their authorization
Memorandum of Understanding 19071/05/NL/CP
MELiSSA Technical Note
2.3.6 Kernel analysis
2.3.6.1 Macronutrients in the kernels
- K, Ca, Mg measured by atomic absorption spectrophotometry (AAS)
- The kernels are heated in an oven at 550°C for several hours. The ashes are solubilised in
HCl. After mixing, deionised water is added. The sample solution is diluted with CsCl
Suprapur in HCl (for K) and LaCl3 in HCl (for Mg and Ca). (Stieger and Feller, 1994)
- P measured by photometric method using a phosphate reagent (100 mL ammonium
heptamolybdate 5% + 100 mL ammonium vanadate 2.5% + 67 mL HNO3 concentrated).
(Stieger and Feller, 1994)
2.3.6.2 Micronutrients in the kernels
Fe, Mn, Zn, Cu measured by atomic absorption spectrophotometry (AAS)
The kernels are heated in an oven at 550°C for several hours. The ashes are solubilised in HCl.
After mixing, deionised water is added. The sample solution is diluted with HCl. (Stieger and
Feller, 1994; Zeller and Feller, 1999)
2.3.7 Food quality analysis
The food quality analysis is a task for ETHZ consultant Prof. Erich Windhab, who proposes to
compare the harvested grains with grains grown in the field (e.g. seed material used for the
experiment).
2.3.8 Plant development
Plant morphogenic development is assessed non-quantitatively by visual control. This allows
determination of key developmental milestones such as appearance of leaves, initiation of
flowering, and phytotoxicity symptoms (chlorosis, leaf cupping, tip burn, etc.).
One representative plant per Rockwool block of 15 plants (a-d) is followed to determine its
height, number of tillers, number of leaves, number of ears and number of grains per ear.
The morphology (time-points of initiation) of the representative plant is followed for the stem
elongation, ear emergence, anthesis, and ear yellowing. Anthesis is defined as the moment
when the anthers release their pollen and is identifiable by the appearance of the stamen on the
ear, see Fig. 19). The proper leaf senescence during grain ripening is checked.

issue 1 revision 0 -
page 20 of 87
TN 98.4.11 Preliminary trade-off for test plan and procedures UGent
This document is confidential property of the MELiSSA partners and shall not be used, duplicated, modified or transmitted without their authorization
Memorandum of Understanding 19071/05/NL/CP
MELiSSA Technical Note
Fig. 19 Ears of plant from the preliminary experiment. The stamens are visible.
2.3.9 Biomass data
Plant growth parameters to be measured after harvest are fresh weight and dry weight of roots
(root dry weight is determined by the difference of the dry weight of the rockwool blocks
before and after the growth period), kernels, and the remaining above ground material (stem
and foliage), grain preprocessing debris (depending on processing approach at ETHZ).
2.3.10 Yield estimation
The estimated yield is 1-2 g grains per plant (estimation made with the results of the
preliminary experiment, wheat grown in hydroponic pots). With 15 plants per block it may be
approximately 25 g per block a-d. For the 60 plants per gully it may be 100 g grains per gully.
2.3.11 Timing of the measurements
The measurements of pH and electrical conductance of the nutrient solution, the CO2 in the
growth chamber, the air temperature at gully level, the temperature of the nutrient solution, the
visual assessment for the plant development (see 2.3.8), the flow rate, the macro and micro-
nutrient content in the kernels and the biomass are done following the information found in
Tab. 3. When the nutrient film thickness is excessive (flooding the roots) or insufficient (parts
of the gully bottom not covered by the film), nutrient flow rate will be adjusted.

issue 1 revision 0 -
page 21 of 87
TN 98.4.11 Preliminary trade-off for test plan and procedures UGent
This document is confidential property of the MELiSSA partners and shall not be used, duplicated, modified or transmitted without their authorization
Memorandum of Understanding 19071/05/NL/CP
MELiSSA Technical Note
Tab. 3 Timing of the measurements
Measurements Timing
T, Relative humidity Automatic
Chamber CO2 level Once a week
Air temperature at gully level Weekly min and max
Plant development Once a week
Temperature of the nutrient solution Once a week
EC Electrical conductance Once a week (twice if necessary at full vegetative
development stage)
pH Once a week (twice if necessary at full vegetative
development stage)
Flow rate At start, after flow adjustment, at harvest
Nutrient solution (nutrient content) Every 4 weeks, before and after solution exchange
Biomass After the harvest
Kernels nutrient content After the harvest
2.3.12 Reference of the measuring devices
pH
Adwa pocket pH meter AD-100, gvz-rossat SA, Switzerland
Range: -2.0-16.0 pH, resolution: 0.1 pH, accuracy ± 0.1 pH
EC
Adwa pocket EC meter AD-204, gvz-rossat SA, Switzerland
Range: 0.00-19.99 mS/cm, resolution: 0.01 mS/cm, accuracy: ± 2 % full scale
Light intensity
Quantum Meter, Photosynthetic Photon Flux (μmol m-2
s-1
), sun and electric calibration,
Spectrum Technologies, Inc.
Range: 0-2000 μmol m-2
s-1
(full sunlight) ± 5 %
CO2
Environmental Instruments, Anagas CD 95, Geotechnical Instruments, Leamington Spa, UK
Range 0-2500ppm; accuracy ±150ppm in the range 0-1000 ppm. Measuring flow 350ml/min.
Hygrometers
- Hygrometer (mechanical thermohygrographs plotting relative humidity and temperature),
Feingeratebau K. Fischer GmbH, Germany
- Hygrometer (mechanical hair hygrometer indicating relative humidity), TFA, Germany
Thermometer
DUAL-TEMP infrared-probe thermometer, TFA, Germany
Infrared: range: -33 - +220°C accuracy: ±2°C
Probe: range: -55 - +330 °C accuracy: ±1°C
issue 1 revision 0 -
page 22 of 87
TN 98.4.11 Preliminary trade-off for test plan and procedures UGent
This document is confidential property of the MELiSSA partners and shall not be used, duplicated, modified or transmitted without their authorization
Memorandum of Understanding 19071/05/NL/CP
MELiSSA Technical Note
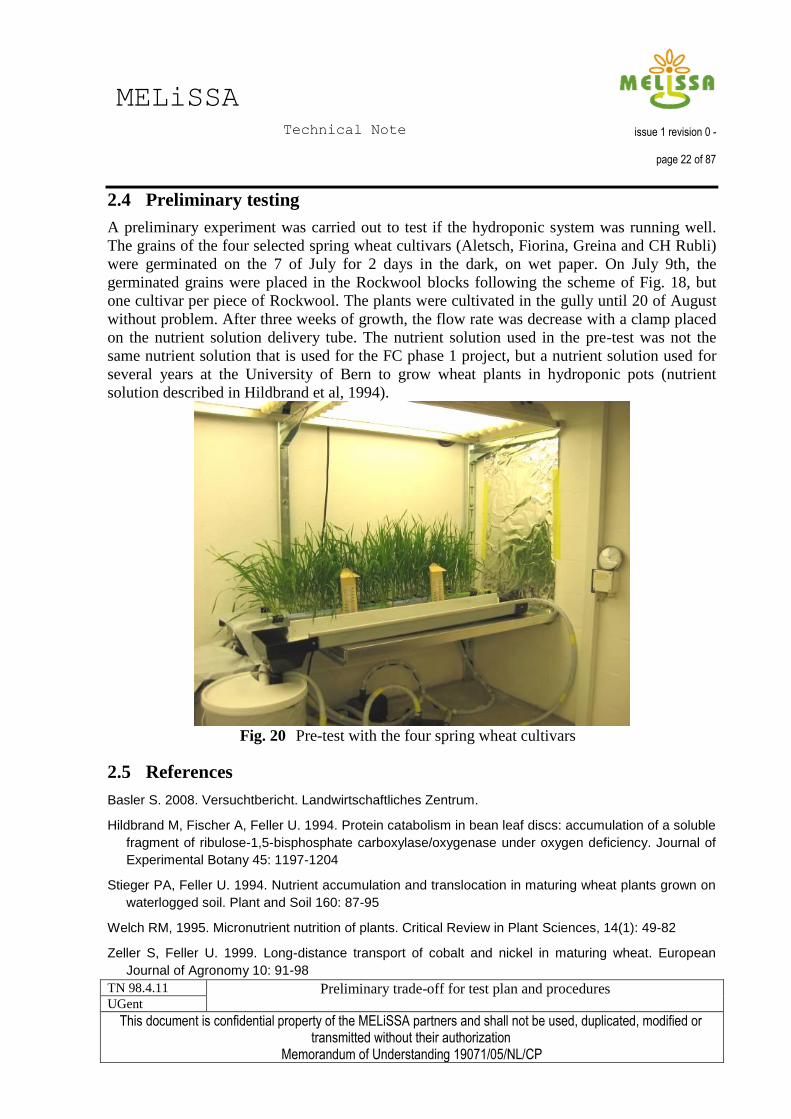
2.4 Preliminary testing
A preliminary experiment was carried out to test if the hydroponic system was running well.
The grains of the four selected spring wheat cultivars (Aletsch, Fiorina, Greina and CH Rubli)
were germinated on the 7 of July for 2 days in the dark, on wet paper. On July 9th, the
germinated grains were placed in the Rockwool blocks following the scheme of Fig. 18, but
one cultivar per piece of Rockwool. The plants were cultivated in the gully until 20 of August
without problem. After three weeks of growth, the flow rate was decrease with a clamp placed
on the nutrient solution delivery tube. The nutrient solution used in the pre-test was not the
same nutrient solution that is used for the FC phase 1 project, but a nutrient solution used for
several years at the University of Bern to grow wheat plants in hydroponic pots (nutrient
solution described in Hildbrand et al, 1994).
Fig. 20 Pre-test with the four spring wheat cultivars
2.5 References
Basler S. 2008. Versuchtbericht. Landwirtschaftliches Zentrum.
Hildbrand M, Fischer A, Feller U. 1994. Protein catabolism in bean leaf discs: accumulation of a soluble
fragment of ribulose-1,5-bisphosphate carboxylase/oxygenase under oxygen deficiency. Journal of
Experimental Botany 45: 1197-1204
Stieger PA, Feller U. 1994. Nutrient accumulation and translocation in maturing wheat plants grown on
waterlogged soil. Plant and Soil 160: 87-95
Welch RM, 1995. Micronutrient nutrition of plants. Critical Review in Plant Sciences, 14(1): 49-82
Zeller S, Feller U. 1999. Long-distance transport of cobalt and nickel in maturing wheat. European
Journal of Agronomy 10: 91-98

issue 1 revision 0 -
page 23 of 87
TN 98.4.11 Preliminary trade-off for test plan and procedures UGent
This document is confidential property of the MELiSSA partners and shall not be used, duplicated, modified or transmitted without their authorization
Memorandum of Understanding 19071/05/NL/CP
MELiSSA Technical Note
3 Durum Wheat (UGuelph)
The Controlled Environment Systems Facility (CES) provides a complete research venue
suitable for measurement of plant growth, gas exchange, volatile organic compound (VOC)
evolution, and nutrient remediation in a precisely controlled environment. The facility is
comprised of 24 sealed environment chambers including 14 variable pressure (hypobaric) plant
growth chambers capable of sustaining a vacuum. CES's personnel have extensive experience
in the fields of plant physiology, environment analysis and sensor technology.
The SEC2 walk-in plant growth chambers (aka 'blue boxes') are capable of a high degree of
closure and are dedicated specifically to canopy-scale lighting studies, trace hydrocarbon
analyses, nutrient recycling studies, and control/manipulation of abiotic growth factors in
sealed environment plant production. These sophisticated chambers represent the current
technical venue for large scale plant studies related to space life sciences at the University of
Guelph.
Fig. 21 View on the SEC2 growth chambers

issue 1 revision 0 -
page 24 of 87
TN 98.4.11 Preliminary trade-off for test plan and procedures UGent
This document is confidential property of the MELiSSA partners and shall not be used, duplicated, modified or transmitted without their authorization
Memorandum of Understanding 19071/05/NL/CP
MELiSSA Technical Note
3.1 Growth Chamber Specifications
3.1.1 Dimensions
Volume = 29 m3 (430 ft
3) (4.5 m x 2.8 m x 2.3 m) per chamber
Plant growing area = 5 m2 (54 ft
2) (2 m x 2.5 m) per chamber
3.1.2 Construction materials used
Stainless steel 316 (walls, floor, valves, plumbing)
Glass (roof)
Teflon (tubing, gas expansion bladders)
Polypropylene (tubing, valves)
Heresite (oxidation barrier on fans, heat exchangers, motor parts)
Viton (O-rings, solenoid seats)
Silicone sealant (DOW-Corning RTV 732) and silicone grease
3.1.3 Analysers
LiCor LI6262 Gas Analyser for CO2/H2O vapour
California Analytical Instruments Oxygen Analyser (model 100P)
Gas Chromatograph/Mass Spectrometer (HP-5890/HP-5971)
Gas Chromatograph (SRI 8610C) for ethylene analysis
Dionex DX500 HPLC Ion Chromatograph (off-line nutrient analysis)
3.1.4 Lighting
9x600 Watt high pressure sodium + 6x400 Watt metal halide per chamber
Light level (PPFD): 365 to 845 µmol m-2
second-1
PAR at medium plant height and
370-664 µmol m-2
second-1
PAR at bench height (see Fig. 22 to Fig. 24)

issue 1 revision 0 -
page 25 of 87
TN 98.4.11 Preliminary trade-off for test plan and procedures UGent
This document is confidential property of the MELiSSA partners and shall not be used, duplicated, modified or transmitted without their authorization
Memorandum of Understanding 19071/05/NL/CP
MELiSSA Technical Note
810-860
760-810
710-760
660-710
610-660
560-610
510-560
460-510
410-460
360-410
Fig. 22 Photon flux in µmol/m²s measured 135 cm from the floor
640-670
610-640
580-610
550-580
520-550
490-520
460-490
430-460
400-430
370-400
Fig. 23 Photon flux in µmol/m²s measured 100 cm from the floor
547 647 665 677 671 662 508 433
612 724 750 774 761 725 567 498
663 787 834 845 831 796 623 533
656 779 835 844 829 791 655 549
637 737 805 812 803 769 681 588
577 684 733 767 731 694 722 624
564 655 683 681 674 653 706 611
507 609 637 663 627 607 683 579
430 524 553 567 561 519 623 533
365 433 447 451 457 422 551 474
526 573 607 608 590 576 527 446
543 588 632 635 614 601 547 462
549 591 646 648 629 615 560 477
556 600 658 664 647 629 573 500
556 601 661 662 647 627 570 523
542 587 646 650 632 608 555 533
502 543 593 599 589 563 510 515
470 509 542 545 538 511 458 485
421 454 492 491 486 464 411 445
375 404 436 435 437 426 370 419

issue 1 revision 0 -
page 26 of 87
TN 98.4.11 Preliminary trade-off for test plan and procedures UGent
This document is confidential property of the MELiSSA partners and shall not be used, duplicated, modified or transmitted without their authorization
Memorandum of Understanding 19071/05/NL/CP
MELiSSA Technical Note
Fig. 24 Measurement locations for light mapping (not to scale)
3.1.5 Hydroponic system sensors
Electrical conductivity (two per chamber)
pH (two per chamber)
3.1.6 Chamber sensors
Air humidity sensors (two per chamber)
Air temperature sensors (two per chamber)
Root zone temperature sensors (four per chamber)
Light PAR sensor: LiCor Quantum Sensor (one per chamber)
3.1.7 Environment control
Temperature ( 10 to 40 C ) + 0.2 C
CO2 concentration ( ambient to 3000 ppm ) + 10 ppm
O2 concentration (ambient)
Relative humidity (50% to 95%) + 5%

issue 1 revision 0 -
page 27 of 87
TN 98.4.11 Preliminary trade-off for test plan and procedures UGent
This document is confidential property of the MELiSSA partners and shall not be used, duplicated, modified or transmitted without their authorization
Memorandum of Understanding 19071/05/NL/CP
MELiSSA Technical Note
3.1.8 Control system
The data acquisition and control system consists of MS-DOS (Version 6.22, Microsoft
Corporation) based computer software (L.W. Anderson Software Consultant) that commands
an Allen-Bradley PLC-5/10 controller mounted on a 1771-A3B1 12 slot backplane. The 1771
input/output (I/O) system includes three 16 channel 12-bit A/D modules (1771-IFE), one 8
channel 12 bit analogue output module (1771-OFE2), one 16 channel digital output module
(1771-OBD), and three 16 channel digital input modules (1771-IBD). The external tank
solution level sensor utilizes a float contactor coupled to a control unit with relay outputs
which control a gravity return solenoid valve (ASCO, Brantford, Ontario; see Fig. 27, NC2).
Alarm warnings from the Lander DACS (various parameters - temperature too high/low,
lighting fault, etc) are captured by a Linux computer and upon receipt, automated email
messages are sent to operations personnel.
3.1.9 Air handling
SEC2 chambers air is conditioned for temperature and humidity and is re-circulated inside the
chambers. Externally supplied chilled water and hot water are circulated through sealed and
"Heresite" coated (baked oxidation barrier) heat exchange coils mounted in an internal plenum
at the rear of each chamber. Condensate from the chilled water coil is measured and collected
in the hydroponics nutrient reservoir. Heresite coated fans and fan motors with silicone
covered wiring are also mounted in the plenum and distribute the air through stainless steel
ducts with baked enamel louvers. Modulated hot and chilled water valves effect temperature
and dehumidification control of the aerial environment.
3.1.10 Nutrient delivery system
The nutrient requirements for the plants are supplied in a hydroponics medium and stored in an
external 100 L tank and an internal 200 L tank. The solution is pumped into polypropylene
tubing to the head of sloped stainless steel troughs. The five 2.5 metre long troughs are
designed to accommodate a variety of root media as a substrate for the hydroponics solution.
These include glass beads, Rockwool, Lecca (expanded clay particles), silica sand, etc. Gravity
provides the return of the solution to the internal reservoir, which in turn supplies the external
delivery tank through a solenoid valve connected to a level sensor within the external tank.
The condition of the solution with respect to pH and electrical conductivity is monitored and
adjusted continuously through measured injections of acid, base and/or various nutrient mixes.
3.1.11 Pressure compensation
Each SEC2 chamber is fitted with ten 200 litre double sealed Teflon® liners (Now
Technologies Inc., Minneapolis, MN) manifolded on a 50 mm diameter stainless steel tube
which is connected through the rear wall of the chamber. This provides a total expansion
volume potential of 2.0 m3 or ±1.0 m
3. Given the 29 m
3 internal volume of the chamber, this
represents about 7% (±3.5%) volume expansion/contraction in response to temperature
fluctuations inside the chamber. The total temperature range influencing gas volume in the
chamber represented by this capacity is about 20 Kelvin degrees (±10 degrees).

issue 1 revision 0 -
page 28 of 87
TN 98.4.11 Preliminary trade-off for test plan and procedures UGent
This document is confidential property of the MELiSSA partners and shall not be used, duplicated, modified or transmitted without their authorization
Memorandum of Understanding 19071/05/NL/CP
MELiSSA Technical Note
Fig. 25 Side schematic of one of the UoG sealed environment plant growth chambers
Fig. 26 Top view schematic showing hydroponic tray location.

issue 1 revision 0 -
page 29 of 87
TN 98.4.11 Preliminary trade-off for test plan and procedures UGent
This document is confidential property of the MELiSSA partners and shall not be used, duplicated, modified or transmitted without their authorization
Memorandum of Understanding 19071/05/NL/CP
MELiSSA Technical Note
Fig. 27 Nutrient system schematic
Fig. 28 Temperature and Humidity control in a 56 day old soybean crop.

issue 1 revision 0 -
page 30 of 87
TN 98.4.11 Preliminary trade-off for test plan and procedures UGent
This document is confidential property of the MELiSSA partners and shall not be used, duplicated, modified or transmitted without their authorization
Memorandum of Understanding 19071/05/NL/CP
MELiSSA Technical Note
3.2 Test plan
3.2.1 Objective
The objectives of this study are as follows:
1. Monitor CO2 assimilation/evolution
2. Monitor evapotranspiration
3. Monitor hydroponic nutrient system parameters (pH, EC, selected ions)
4. Monitor ethylene evolution
5. Evaluate growth parameters
6. Produce wheat kernels for further processing
3.2.2 Growing period
The study period refers to the time between initiation and completion of analysis. The study
schedule may be changed during this period depending on schedules, priorities, and earlier
results. The wheat varieties to be used in this experiment are Avonlea and Strongfield, each
with a growth period of approximately 102 days.
Estimated Starting Dates: Avonlea July 6, 2009
Strongfield July 13, 2009
Commander February 8, 2010
Eurostar February 15, 2010
Estimated Completion Date: Approximately 120 days after start date
3.2.3 Crop growth procedures
Plant cultural conditions: Wheat is grown in 2.45 x .017 m stainless steel troughs in
rockwool (Grodan AO 36/40 6/15W) using a recirculating nutrient film technique delivery
system. There is a total of 5 troughs per chamber. Seeds are sown at a planting density of 135
seeds per trough split into three pads of 45 seeds (Fig. 29). A plastic black/white blackout
cover with slits to accommodate the wheat is placed over the rockwool to minimize algae
growth and reduce evaporation rates. A modified half-strength Hoagland‟s solution is used
(Tab. 4). The rockwool is rinsed with deionised water prior to use to remove particulate
material from the substrate.

issue 1 revision 0 -
page 31 of 87
TN 98.4.11 Preliminary trade-off for test plan and procedures UGent
This document is confidential property of the MELiSSA partners and shall not be used, duplicated, modified or transmitted without their authorization
Memorandum of Understanding 19071/05/NL/CP
MELiSSA Technical Note
Fig. 29 Setup of troughs and plant positioning within the growth chamber
Solution pH is automatically adjusted by the control system to 5.8 +/- 0.2 with additions of
dilute acid (nitric acid @ 0.5 M HNO3) or base (potassium hydroxide @ 0.5M KOH). The
Solution electrical conductivity is monitored and automatically adjusted by the control system
to 1.2 mS with the modified stock solution (Tab. 4).
Nutrient solution is completely changed every four weeks to reduce potential build up of salts
or other phytotoxic compounds.

issue 1 revision 0 -
page 32 of 87
TN 98.4.11 Preliminary trade-off for test plan and procedures UGent
This document is confidential property of the MELiSSA partners and shall not be used, duplicated, modified or transmitted without their authorization
Memorandum of Understanding 19071/05/NL/CP
MELiSSA Technical Note
Tab. 4 Nutrient solution recipe for 150 L start-up and 10L replenish tank solution
MACROS
Formula F.W. g/L Stock
concentration
For 150L
start up
(1/2 HOAG)
For 10L
replenishment
container
1. Fe-EDTA Solution
FeCl3 * 6H2O 270.3g 2.42 8.96mM 840ml 150ml
EDTA 292.2g 2.49 8.52mM
2. KH2PO4 136.09g 136.09 1M 75ml 100ml
3. KNO3 101.1 g 101.1 1M 375ml 460ml
4. MgSO4 * 7H2O 246.48g 246.48 1M 150ml 100ml
5. Mixed micros (see
part 1 and 2 below) see below Varies 150ml 130ml
6. Ca(NO3)2 * 4H2O 236.1 g 236.1 1M 375ml ¨ 120ml
7. Water 148.035L 8.94L
1. Mix each individual macro above in separate labelled carboys found in the Harvest Lab
2. Prepare the mixed Micros (#6) as shown below.
3. Add desired amount of Macro #1 - #6 to either 150 L or 10L replenish tanks - amounts
specified for each listed in table above
MIXED MICROS (For #5 in Recipe Above)
PART 1 - Mix each micronutrient separately as shown below
Nutrient F.W. g/500
ml
Stock
concentration
H3BO3 61.83g 14.7 0.4560M
MnCl2 * 4H2O 197.9g 36.61 0.37M
ZnSO4 * 7H2O 287.54g 9.2 0.064M
CuSO4 * 5H2O 249.68g 6.50 0.052M
(NH4)6Mo7O24 * 2H2O 1235.86g 0.10 1.01mM
SEPARATE
MICRONUTRIENT STOCK
SOLUTIONS
Weigh out amts in highlighted
column into individual 500 ml
bottles and add 500 mL
deionised water
PART 2 - Prepare mixed micro solution by combining micro stocks (part 1) into 8L Carboy
Nutrient Separate stock
concentration
ml for 8L
carboy
Final
concentration
H3BO3 0.4560M 120 7.13mM
MnCl2 * 4H2O 0.37M 160 7.40mM
ZnSO4 * 7H2O 0.064M 120 0.96mM
CuSO4 * 5H2O 0.052M 80 0.52mM
(NH4)6Mo7O24 *
2H2O 1.01mM 80 0.01mM
Measure amts in highlighted
column from the individual
micro bottles above.
Mix all in a single 8 L Carboy
Bring to 8 L with 7440 mL of
deionised water

issue 1 revision 0 -
page 33 of 87
TN 98.4.11 Preliminary trade-off for test plan and procedures UGent
This document is confidential property of the MELiSSA partners and shall not be used, duplicated, modified or transmitted without their authorization
Memorandum of Understanding 19071/05/NL/CP
MELiSSA Technical Note
Seed treatment: In order to avoid potential contamination problems, the seeds are sterilized
prior to seeding in the chamber by treating in 70% ethanol for 2 minutes followed by 20%
commercial bleach for 20 minutes with gentle shaking and rinsed 3 times with sterile
laboratory grade water.
Environmental parameters: In each chamber, lighting is provided by nine 600 Watt High
Pressure Sodium (HPS) and six 400 Watt Metal Halide (MH) lamps cycled to provide a 16-h
light/8-h dark photoperiod. Air temperature is isothermal at 23°C (Mackowiak, Owens and
Hinkle, 1989). CO2 is maintained at concentration of 1200 µmol mol-1
(partial pressure of 0.12
kPa), and relative humidity is set to 60% RH for the duration of crop growth. Once the crop
has reached physiological maturity, the demand humidity is set to 0% in order to accelerate the
drying process.
3.2.4 Sampling and analysis
Environment: Profiles of chamber atmospheric temperature, humidity (VPD), CO2, and O2
data are recorded at one minute intervals for the duration of this experiment. The only
exception is that oxygen sampling shares one analyzer between the two chambers, with
alternating two hour sampling intervals.
Nutrient solution: pH and EC are automatically measured and adjusted on a daily basis by the
control system. Sampling of hydroponics solution is performed at the beginning and end of
each 4 week nutrient solution interval and submitted for HPLC analysis at the end of the
experiment (see 3.2.5 and 3.3). The following ions are analyzed: N, P, K, Ca, Mg, S, Fe, Mn,
Zn, Cu, Mo, Cl, B.
Ethylene: Air samples are monitored for ethylene through GC analysis at the CESRF
laboratory every standard working day through the atmosphere sampling ports. Ethylene is
sampled starting the first day after closure, and continue until harvest.
Biomass data: Plant growth parameters to be measured at the end of the growth period are dry
weight of roots, kernels, and the remaining above ground material. Data is collected on a per
pad basis for the entire chamber.
Edible biomass data: A single composite sample from each cultivar is tested for nutrient
content (carbon, nitrogen, phosphorus, potassium, calcium and magnesium) and proximate
composition including proteins, lipids, carbohydrates, and gluten index.
3.2.5 Analytical methods
Ethylene: Air samples from each chamber are taken, and a subsample is passed through the
1.0 mL sample loop of an SRI 8610C (SRI Instruments Inc., Menlo Park, California, USA) gas
chromatograph (GC) equipped with a flame ionization detector (FID) and 30 metre 0.53mm ID
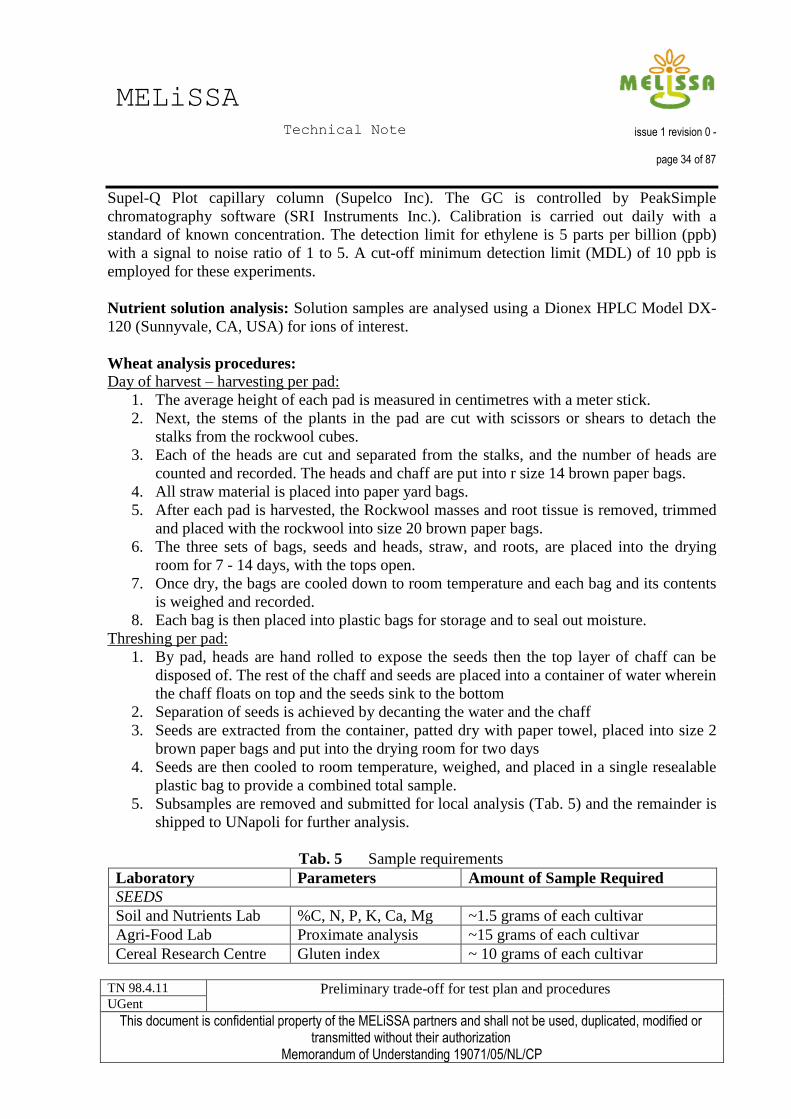
issue 1 revision 0 -
page 34 of 87
TN 98.4.11 Preliminary trade-off for test plan and procedures UGent
This document is confidential property of the MELiSSA partners and shall not be used, duplicated, modified or transmitted without their authorization
Memorandum of Understanding 19071/05/NL/CP
MELiSSA Technical Note
Supel-Q Plot capillary column (Supelco Inc). The GC is controlled by PeakSimple
chromatography software (SRI Instruments Inc.). Calibration is carried out daily with a
standard of known concentration. The detection limit for ethylene is 5 parts per billion (ppb)
with a signal to noise ratio of 1 to 5. A cut-off minimum detection limit (MDL) of 10 ppb is
employed for these experiments.
Nutrient solution analysis: Solution samples are analysed using a Dionex HPLC Model DX-
120 (Sunnyvale, CA, USA) for ions of interest.
Wheat analysis procedures: Day of harvest – harvesting per pad:
1. The average height of each pad is measured in centimetres with a meter stick.
2. Next, the stems of the plants in the pad are cut with scissors or shears to detach the
stalks from the rockwool cubes.
3. Each of the heads are cut and separated from the stalks, and the number of heads are
counted and recorded. The heads and chaff are put into r size 14 brown paper bags.
4. All straw material is placed into paper yard bags.
5. After each pad is harvested, the Rockwool masses and root tissue is removed, trimmed
and placed with the rockwool into size 20 brown paper bags.
6. The three sets of bags, seeds and heads, straw, and roots, are placed into the drying
room for 7 - 14 days, with the tops open.
7. Once dry, the bags are cooled down to room temperature and each bag and its contents
is weighed and recorded.
8. Each bag is then placed into plastic bags for storage and to seal out moisture.
Threshing per pad:
1. By pad, heads are hand rolled to expose the seeds then the top layer of chaff can be
disposed of. The rest of the chaff and seeds are placed into a container of water wherein
the chaff floats on top and the seeds sink to the bottom
2. Separation of seeds is achieved by decanting the water and the chaff
3. Seeds are extracted from the container, patted dry with paper towel, placed into size 2
brown paper bags and put into the drying room for two days
4. Seeds are then cooled to room temperature, weighed, and placed in a single resealable
plastic bag to provide a combined total sample.
5. Subsamples are removed and submitted for local analysis (Tab. 5) and the remainder is
shipped to UNapoli for further analysis.
Tab. 5 Sample requirements
Laboratory Parameters Amount of Sample Required
SEEDS
Soil and Nutrients Lab %C, N, P, K, Ca, Mg ~1.5 grams of each cultivar
Agri-Food Lab Proximate analysis ~15 grams of each cultivar
Cereal Research Centre Gluten index ~ 10 grams of each cultivar

issue 1 revision 0 -
page 35 of 87
TN 98.4.11 Preliminary trade-off for test plan and procedures UGent
This document is confidential property of the MELiSSA partners and shall not be used, duplicated, modified or transmitted without their authorization
Memorandum of Understanding 19071/05/NL/CP
MELiSSA Technical Note
3.3 References
Total carbon and total nitrogen:
Official Methods of Analysis of AOAC International, 16th Edition (1997), AOAC International, Arlington,
VA.
Sheldrick, B.H. 1986. Test of the Leco CHN-600 Determinator for soil carbon and nitrogen analysis.
Can. J. Soil Sci. 66(3):543-545
Sweeney, Rose A. 1989. Generic combustion method for determination of crude protein in feeds:
Collaborative Study. J. Assoc. Off. Anal. Chem. 72: 770-774.
McGeehan, S.L. and D.V. Naylor. 1988. Automated instrumental analysis of carbon and nitrogen in
plant and soil samples. Commun. Soil Sci. Plant Anal. 19:493
Proximate analysis: Official Methods of Analysis of AOAC International, 16th Edition (1997), AOAC International, Arlington,
VA.
NO3-N:
Keeney, D.R. and D.W. Nelson. 1982. Nitrogen - inorganic forms. p. 643-687. In: A.L. Page, et al. (ed.).
Methods of Soil Analysis: Part 2. Agronomy Monogr. 9. 2nd ed. ASA and SSSA, Madison, WI.
Plant minerals (excluding N): Isaac, R.A. and W.C. Johnson. 1975. Collaborative study of wet and dry ashing techniques for the
elemental analysis of plant tissue by atomic absorption spectrophotometry. J. Assoc. Off. Anal.
Chem. 58: 436-440.
Havlin, J.L. and P.N. Soltanpour. 1989. A nitric acid and plant digest method for use with inductively
coupled plasma spectrometry. Commun. Soil Sci. Plant Anal. 14:969-980.
General:
CL Mackowiak, LP Owens, and CR Hinkle, 1989, Continuous Hydroponic Wheat Production Using A
Recirculating System , NASA Technical Memorandum TM 102784

issue 1 revision 0 -
page 36 of 87
TN 98.4.11 Preliminary trade-off for test plan and procedures UGent
This document is confidential property of the MELiSSA partners and shall not be used, duplicated, modified or transmitted without their authorization
Memorandum of Understanding 19071/05/NL/CP
MELiSSA Technical Note
4 Potato
Given the particularities of potato culture, especially the induction and monitoring of the
tuberisation process, the performance of the 4 selected cultivars is followed up at 2 different
locations (UGent and UCL) with a maximum of characterisation methods.
UGent and UCL setup and plant growth environmental settings are harmonised as much as
possible, given the different characteristics of the available plant growth facilities. Nutrient
solution composition and hydroponic cultural practices overview are provided by a company
specialised in seed potato production: HZPC (Hettema and De ZPC (Zaai- en Pootgoed
Coöperatie)), as a consultant to UGent.
The analysis plan includes the measurement of the same set of basic plant growth
environmental parameters, albeit with different methodology as determined by the
control/logging functionality of each plant growth facility. Each lab's specific expertise is
reflected by additional techniques included in the respective analysis plans.
Potato (UGent)
The Ghent University‟s workbench demonstrator is positioned in a walk-in chamber with
precise environment control (Fig. 30).
Fig. 30 Growth chamber with equipment installed

issue 1 revision 0 -
page 37 of 87
TN 98.4.11 Preliminary trade-off for test plan and procedures UGent
This document is confidential property of the MELiSSA partners and shall not be used, duplicated, modified or transmitted without their authorization
Memorandum of Understanding 19071/05/NL/CP
MELiSSA Technical Note
4.1 Growth chamber specifications
4.1.1 Dimensions
The chamber measures 3m in length, 1.5m in width, and 2m in height (9m3). The plant
growing area consists of four 0.5m wide and 1.70m long shelves (Fig. 31) which can each hold
one 1.70m gully providing a total growing area of 3.4m2 (0.5m x 1.7m x 4). Two gullies with a
length of 1.7 m and two of 1.65 m are used. All gullies are 16 cm wide and 9.5 cm high.
4.1.2 Lighting
Each gully has the same illumination system and thus the same light distribution. Four 146 cm
long dimmable units of eight fluorescent lamps (Master TL-D reflex Super 80 58W / 840 from
Philips: http://www.philips.be) illuminate the four 170 cm shelves, with a distance between the
lights and the shelves of 66.5 cm. The method of photoperiod control is ON/OFF: a 16 h day
and an 8 h night period (Tab. 6). Based on available info, these conditions should guarantee a
successful tuber induction in all cultivars selected. Longer light periods can be inhibitory for
tuber induction.
Tab. 6 Photoperiod and light range
Light PPF 250-400 µmol m-2
s-1
Photoperiod 16 h light, 8 h dark
Not all plants in each gully receive the same amount of light. At both ends of the gullies a
slightly lower intensity is apparent. In Tab. 7, the light flux as a function of plant position is
shown. The first values correspond to the average light flux at rack level. The second values
represent the flux at 30cm below the light tube, which is the maximal plant height.
A mapping of the light intensities was made at different levels (Fig. 32):
- 52.5 cm from the lights: that corresponds to the height the in acclimated and elongated in-
vitro plants reach at the start of the test when they are fixed to the horizontal support.
- 46.5 cm from the lights: this is an intermediate growth height.
- 30 cm from the lights: this is the maximum height the plants can reach, without being
affected by the movements of the monitoring robot. Under nominal conditions
(determined by adjustable nitrogen dosage) the plants do not grow higher. In case of taller
growth, the plants will be pruned to the appropriate size.
Light intensity values are shown in Fig. 33, spectral quality is assumed constant (Fig. 34).
Tab. 7 Light flux in function of the plant position
*PPF: Photosynthetic Photon Flux
PPF*
µmol m-2
s-1
Suboptimal
(84-280)
Optimal
(188-320)
Suboptimal
(90-290)
Plant
position
(each 10cm)
1 2 3 4 5 6 7 8 9 10 11 12 13 14 15 16

issue 1 revision 0 -
page 38 of 87
TN 98.4.11 Preliminary trade-off for test plan and procedures UGent
This document is confidential property of the MELiSSA partners and shall not be used, duplicated, modified or transmitted without their authorization
Memorandum of Understanding 19071/05/NL/CP
MELiSSA Technical Note
Fig. 31 Schema of the growth chamber with gullies numbered from 1 to 4.
Fig. 32 Point of light intensity measurement above the rack
Gully 1 Gully 3
Gully 4 Gully 2

issue 1 revision 0 -
page 39 of 87
TN 98.4.11 Preliminary trade-off for test plan and procedures UGent
This document is confidential property of the MELiSSA partners and shall not be used, duplicated, modified or transmitted without their authorization
Memorandum of Understanding 19071/05/NL/CP
MELiSSA Technical Note
Light mapping gully 1 (distance from the lamps)
0
50
100
150
200
250
300
350
0
10
20
30
40
50
60
70
80
90
100
110
120
130
140
150
160
170
176
Distance on the gully (cm)
um
ole
m2
52.5
46.5
30
Light mapping gully 2 (distance from the lamps)
0
50
100
150
200
250
300
350
0
10
20
30
40
50
60
70
80
90
100
110
120
130
140
150
160
170
Distance on the gully (cm)
um
ole
m2
52.5
46.5
30
Fig. 33 Light flux mapping above rack 1 (higher) and 2 (lower).
Fig. 34 Spectrum of the light tube MASTER TL-D Reflex 58W/840

issue 1 revision 0 -
page 40 of 87
TN 98.4.11 Preliminary trade-off for test plan and procedures UGent
This document is confidential property of the MELiSSA partners and shall not be used, duplicated, modified or transmitted without their authorization
Memorandum of Understanding 19071/05/NL/CP
MELiSSA Technical Note
4.1.3 Environment control
4.1.3.1 Air temperature and relative humidity
Air temperature and humidity are controlled by a Siemens RMU730 PLC (cascade PID
control, using two RTD (LG-Ni 1000) temperature sensors for respectively cooled input air
and chamber exit air). Air relative humidity is increased with a steam humidifier (Carel
UR010HL001) and lowered by condensation in the chamber air/chilled water (provided by a
Daikin EUWA5KZW1 unit) heat exchanger. Ventilation is manually adjustable with a
Variable Frequency Drive (Hitachi L200 075HFEF). The air ventilation layout consists of air
input and output through opposite metallic perforated walls.
For online measurement of air temperature and relative humidity, the Vaisala Humicap®
temperature and humidity transmitter is used (HMT333;
http://www.vaisala.com/businessareas/instruments/products/humidity/fixed/hmt330).
Technical specifications for relative humidity:
Measurement range: 0-100 % RH
Accuracy at +20 °C: ± 1.0 % RH (0-90 % RH)
± 1.7 % RH (90-100 % RH)
Sensor: Vaisala Humicap® 180
Technical specifications for temperature:
Measurement range: -40 to+80 °C
Accuracy at +20 °C: ± 0.2 °C
Sensor: PT100 RTD 1/3 Class B IEC 751
Data signal output: RS-232
- PLC Programmable Logic Controller RMU730 (http://www.siemens.com/index.jsp) with
ACS7 operating/logging software. Cooling and heating by PI control of modulated 3-way
chilled water valve and heating resistances, and humidification by steam supply.
- Air ventilation maximum 8000 m3/h – adjustable with Variable Frequency Drive Hitachi
L200 075HFEF (http://www.hitachi-ies.co.jp/pdf/catalog/SM-E242R.pdf).
Ventilation unit with chilled water coil, electrical resistances and filter section.
- Steam humidifier Carel UR010HL001 (http://www.carel.com/carelcom/web/eng/catalogo/
prodotto_dett.jsp?id_gamma=34&id_tipologia=9&id_prodotto=67)
- Chilled water primary circuit Chiller Daikin EUWA5KZW1
(http://global.daikin.com/global/our_product)
- Perforated walls from RMIG (http://www.rmig.com/):
Material: stainless steel
Diameter perforation: 5 mm
Distance between perforations: 8 mm (centre to centre)
Open area due to perforation: 35%
Distance to real walls: 0.24 m
Distance to backside of air-duct (an inclined plate ensures an even distribution of air
flow along the vertical): 0.24 m at air entry from ceiling of room
0.04 m at bottom of room
Dimensions perforated wall input: 3 x 2 m (total wall surface)

issue 1 revision 0 -
page 41 of 87
TN 98.4.11 Preliminary trade-off for test plan and procedures UGent
This document is confidential property of the MELiSSA partners and shall not be used, duplicated, modified or transmitted without their authorization
Memorandum of Understanding 19071/05/NL/CP
MELiSSA Technical Note
Dimensions perforated wall output: 2 x 2 m (total wall surface)
4.1.3.2 Settings and error limits
Light range: 0-400 μmol m-2
s-1
PAR
Temperature range: 20 to 30 °C
Error temperature: ± 0.2 °C
Humidity range: 60 to 80 % RH
Error humidity: ± 5 % RH
Fresh air supply: 0 to 2 m3 h
-1
Air circulation: 3000 to 8000 m3 h
-1
The ventilation of the cooling system is continuous. The temperature of the air and relative
humidity are measured by Vaisala Humicap® and Delta T sensors. Setpoint for temperature is
20 degrees, the setpoint for relative humidity is 70 % RH (corresponding to a VPD of 0.82 kPa
at 20 degrees). The O2 concentration is ambient and measured with a PP Systems electro-
chemical cell every 10 minutes (OP-1 Probe). CO2 concentration is measured with a WMA-4
IRGA. The measuring takes place every ten minutes at chamber level, with the air intake tube
located in the culture room. The measuring range is 0-2000 ppm (Tab. 8). A safety thermostat
turns off the lamps automatically in case of temperature increase due to cooling system failures
(setting at 25°C). All the conditions of the growth chamber (turning on/off the lamps,
temperature, humidity, ventilation speed) are logged.
Temperature fluctuations are within 0.4 degrees during the day, on average there is 0.5 degree
temperature difference between the racks at both sides of the room (Fig. 35).
Temperature mapping
19.00
19.20
19.40
19.60
19.80
20.00
20.20
20.40
20.60
20.80
21.00
25/09/2009
12:00
26/09/2009
00:00
26/09/2009
12:00
27/09/2009
00:00
27/09/2009
12:00
28/09/2009
00:00
28/09/2009
12:00
29/09/2009
00:00
Time
Te
mp
era
ture
Air input
Air output
Fig. 35 Air input (rack 1) and output (rack 3) temperature, dark period from 0 to 8 AM

issue 1 revision 0 -
page 42 of 87
TN 98.4.11 Preliminary trade-off for test plan and procedures UGent
This document is confidential property of the MELiSSA partners and shall not be used, duplicated, modified or transmitted without their authorization
Memorandum of Understanding 19071/05/NL/CP
MELiSSA Technical Note
Along the length of the rack a heterogeneity in temperature of about 1 degree was measured
during the day period (Fig. 36), which does not correlate with the larger expected light system
heat load in the centre of the rack. Hence a difference in air flow speed is assumed.
Humidity increases upon the day/night transition (Fig. 37), due to the transient change in T.
Temperature mapping on rack 1
18
18.5
19
19.5
20
20.5
21
21.5
22
16 90 104 130 166
Place on the rack
Tem
pera
ture
day
night
Fig. 36 Day and night temperature mapping on rack 1
Relative Humidity
60
65
70
75
80
85
9/25/09
12:00
9/26/09
0:00
9/26/09
12:00
9/27/09
0:00
9/27/09
12:00
9/28/09
0:00
9/28/09
12:00
9/29/09
0:00
Time
RH
%
acs
humicap
dl2
Fig. 37 Relative humidity in the growth chamber – dark period 0 – 8 AM

issue 1 revision 0 -
page 43 of 87
TN 98.4.11 Preliminary trade-off for test plan and procedures UGent
This document is confidential property of the MELiSSA partners and shall not be used, duplicated, modified or transmitted without their authorization
Memorandum of Understanding 19071/05/NL/CP
MELiSSA Technical Note
Tab. 8 Sensors for online measurement of required environmental parameters
Parameter Sensor
In air:
CO2 WMA-4 IRGA from PP Systems measuring range 0-2000ppm
ADC2250 IRGA dual channel with 2 plant or leaf cuvettes
O2 Electo-chemical cell measuring range 0-30% attached to
WMA-4 from PP Systems (OP-1 Probe)
Light Quantum Sensor SKP 215 (Skye instruments)
Temperature Vaisala Humicap®, Delta T
Temperature nutrient solution NTC-10K
Humidity Vaisala Humicap®, Delta T
Ethylene ETD-300 from Sensor Sense connected to the cuvettes
Weight of gully (whole plant) Load cells (MP40 from Sartorius) for shelf 2
4.2 Hydroponic system
4.2.1 Hydroponic system explanation
Gullies were obtained from JBHydroponics (Maasdijk, NL). They are made of PU coated
stainless steel and are 170 cm long, 16 cm wide at the bottom (25 cm at the top) and 9.5 cm
high. On one side, 2 cm holes are pierced every 10 cm at 1.2 cm from the bottom of the gully.
In these holes plastic tubes are fixed (2 cm long and 2 cm diameter) with their extremities
covered by black flexible plastic, in which a cross was cut to allow the plant stem to pass
through (for general view see Fig. 38). This setup is used to minimize light in the gully in
order to prevent greening of tubers.
Gullies are positioned with a downward angle of 5%, nutrient flow is adjusted to 2 L/min, and
the gullies drain by gravity. Gullies are connected to separate tanks (LxBxH 40x20x20cm)
made from food grade HDPE by means of submerged NJ1700 (AquariumSystems NewJet
1700 L/h) pumps. Each gully has a separate nutrient solution circuit (Fig. 39). EC, pH, and
nutritive solution level are measured by sensors and automatically readjusted with 3 stock
solution tanks (pH with H3PO4 or KOH tank by manual switching, EC with K2SO4 and
KH2PO4,) and injected via three Hanna Instruments blackstone BL 1,5 injection pumps (output
1.5 L/h, 13 bar). Tank level is adjusted with distilled water. Upon detection of a decrease in
water level by the level sensor, a fixed amount of 1liter of water is transferred through the
action of an air compressor connected to a submerged 1l recipient fitted with an auto-fill valve
(opening and allowing water in when the compressor is off, closing when the compressor is
on). The water handling system with its associated electronic control is displayed in Fig. 40.
The nutrient solution temperature is kept constant with a cooling system (TECO TR5 160W,
Teco, Ravenna, Italy). The cooling capacity is sufficient for two tanks. The MJ1000 pump
(1000 L/h, AquariumSystems MaxiJet) circulates the cooled water through a coil made of
silicon tubing positioned in each nutrient solution tank.

issue 1 revision 0 -
page 44 of 87
TN 98.4.11 Preliminary trade-off for test plan and procedures UGent
This document is confidential property of the MELiSSA partners and shall not be used, duplicated, modified or transmitted without their authorization
Memorandum of Understanding 19071/05/NL/CP
MELiSSA Technical Note
Air
en
try
Fig. 38 Front view of a trough
20
Pump
Pump Pump
Air
compressor
EC pHddl
Fig. 39 Schematic of the hydroponic system

issue 1 revision 0 -
page 45 of 87
TN 98.4.11 Preliminary trade-off for test plan and procedures UGent
This document is confidential property of the MELiSSA partners and shall not be used, duplicated, modified or transmitted without their authorization
Memorandum of Understanding 19071/05/NL/CP
MELiSSA Technical Note
Fig. 40 Schematic of the water handling system
60
L S
up
ply
ta
nk
F
Flo
w m
ete
r
Ma
nu
al va
lve
40
L W
ate
rta
nk 1
40
L W
ate
rta
nk 2
Ma
nu
al va
lve
Ma
nu
al va
lve
Hu
mid
ifie
r su
pp
ly p
um
p
Hu
mid
ifie
r
Ste
am
Hu
mid
ifie
r d
rain
Ste
am
in
jectio
n p
oin
t co
nd
en
s
Clim
atisa
tio
n
Co
rrid
or
Ye
llow
ro
om
Clim
atisa
tio
n c
on
de
ns
Dis
tille
d w
ate
r ta
nk
Nu
trie
nt so
lutio
n s
up
ply
pu
mp
Div
ing
be
ll
red/g
ree
n
1,1
lite
r
Air p
um
p r
ed
/gre
en
Div
ing
be
ll
ye
llow
/blu
e
1,1
lite
rAir p
um
p y
ello
w/b
lue
Be
ll ve
ntlin
e g
ree
n
Be
ll ve
ntlin
e b
lue
Wa
ter
leve
l m
ete
r
Wa
ter
leve
l m
ete
r
Lo
w w
ate
r
leve
l
sw
itch
off
Ta
nk
refill
Hyd
rop
on
ics
refill
Mitsu
bis
hi A
L2
co
ntr
olle
r
Nu
trie
nt so
lutio
n
blu
e
15
LL
eve
l m
ete
r
Nu
trie
nt so
lutio
n
gre
en
15
L
Nu
trie
nt so
lutio
n
ye
llow
15
L
Nu
trie
nt so
lutio
n
red
15
L
Ma
nu
al ve
ntlin
e
ad
justm
en
t va
lve
Ma
nu
al ve
ntlin
e
ad
justm
en
t va
lve
Le
ge
nd
:
Liq
uid
lin
e
Ga
s lin
e
Se
nso
r e
lectr
ic lin
e
Actu
ato
r e
lectr
ic lin
e

issue 1 revision 0 -
page 46 of 87
TN 98.4.11 Preliminary trade-off for test plan and procedures UGent
This document is confidential property of the MELiSSA partners and shall not be used, duplicated, modified or transmitted without their authorization
Memorandum of Understanding 19071/05/NL/CP
MELiSSA Technical Note
4.2.2 Hydroponic system material
Polyurethane coated stainless steel gullies produced by JBH (two of 1.7 m and two of 1.65 m
long due to space constraints, 16 cm wide and 9.5 cm high).
Black polyethylene plastic covers delivered with the gullies.
Tanks made from food-grade black HDPE, submerged NJ1700 (l/h) pumps.
Cooling system TECO TR5 with 160W cooling capacity, MJ1000 circulation pump, one
cooler is shared by two nutrient solution tanks.
Oxygen solubility decreases with temperature; the risk of anaerobic conditions is however
estimated as low (high mixing rate by circulation pump, fast flow in the gully and thin nutrient
solution layer – below 5mm), so no airpumps are installed.
Black rigid nylon tubing (8mm internal diameter, Norgren PA12) was used for the nutrient
solution circuit.
PVC food grade tubing and valves for the bypass in the nutrient solution tanks (Georg Fisher
PVC-U).
Silicone tubes for IRGA measurement setup.
Flexible transparent Polyethylene tubes for dosing pump connections (Hanna Instruments).
4.2.3 Pumps
Pump NJ1700
Pump out put: 1000-1700 L/h (nominal value without attached tubing)
Power consumption: 32 W
One bypass was placed at the pressure side of the pump to regulate the flow of nutrient
solution and to provide mixing of the nutrient solution in the tank. A continuous flow is
provided within the target range of 1-2 l/min (constant flow rate), independent of the pump
delivery head of 0.4m (lower shelves) or 1.1m (upper shelves).
4.2.4 Substrate choice
No substrate is used; roots are grown in a thin nutrient solution layer (NFT).
4.2.5 Nutrient solution composition
The nutrient solution recipe as made available by the UGent consultant HZPC, and used at the
UCL lab (Tab. 9) was slightly modified to assure the plants would fit in the limited rack space,
As nitrogen determined shoot height, the nitrate amount was halved, theoretically
corresponding to plants of 30-40cm height (with reference to greenhouse grown plants at
HZPC).
The start up nutrient solution is replaced by a solution containing no nitrogen (Tab. 10) to
induce efficient tuberisation by nitrogen starvation. The startup nutrient growth solution is thus
entirely removed after three weeks and replaced by a tuberisation nutrient solution.
Nutrient solution samples are taken at the beginning of each new solution change and at the
end of the 4 week interval. The volume of the nutrient solution is 15 litres per tank.

issue 1 revision 0 -
page 47 of 87
TN 98.4.11 Preliminary trade-off for test plan and procedures UGent
This document is confidential property of the MELiSSA partners and shall not be used, duplicated, modified or transmitted without their authorization
Memorandum of Understanding 19071/05/NL/CP
MELiSSA Technical Note
pH is kept at 5.5 with H3PO4
EC is kept at 2000 µS/cm with K2SO4 (startup) or KH2PO4 and K2SO4 (tuberisation)
Every 3 weeks one spoon of TENSO cocktail of oligo-elements is added.
Tab. 9 Growing phase nutrient solution composition
HZPC growing phase nutrient solution: plants of 30-40cm % 1L 4L 10L 15L
5 ml 8.75 35 87.5 157.5 K2SO4
10 ml 1.5 6 15 27 KH2PO4
5 ml 5 20 50 90 Mg SO4
5.9 ml 6.25 25 62.5 112.5 Ca(NO3)2
6 ml 0.3125 1.25 3.125 5.625 iron-chelate
g 0.05 0.2 0.5 0.9 TENSO cocktail (oligo-elements)
Tab. 10 Tuberisation phase nutrient solution composition
HZPC tuberisation phase nutrient solution: plants of 30-40cm 1L 4L 10L 15L
% ml 2.75 11 27.5 41.25 K2SO4
5 ml 6.75 27 67.5 101.25 KH2PO4
10 ml 3.75 15 37.5 56.25 Mg SO4
5 ml 0.3125 1.25 3.125 4.6875 iron-chelate
6 g 0.05 0.2 0.5 0.75 TENSO cocktail (oligo-elements)
4.2.6 Hydroponic system sensors
All sensor outputs (see Tab. 11) are logged to a DL2e data logger (delta-T devices, www.delta-
t.co.uk).
Tab. 11 Sensors choice for online measurement of required environmental parameters
In solution:
Parameter Sensor
Temperature NTC 10K sensor (1 in each nutrient feeding tank)
O2
offline – manual measurement*
HI-914604 dissolved oxygen meter with HI 76407/4F
electrode (Hanna Instruments) – measurement at pump
water input
EC HI700-221-2 Controller + HI7639 sensor and Pt100 T-
sensor (Hanna Instruments)
pH pH 500-1212 Controller + HI6101405 sensor and Pt-100 T-
sensor (Hanna Instruments)
* Manual measurement and data transfer

issue 1 revision 0 -
page 48 of 87
TN 98.4.11 Preliminary trade-off for test plan and procedures UGent
This document is confidential property of the MELiSSA partners and shall not be used, duplicated, modified or transmitted without their authorization
Memorandum of Understanding 19071/05/NL/CP
MELiSSA Technical Note
The pH and electrical conductivity (EC) are controlled automatically. The nutrient solution
from each gully is measured once per minute.
EC: 1.8 mS/cm (expected value, based on information from HZPC)
pH: 5.5 (expected value, based on information from HZPC)
The automatic ON/OFF control based adjustment of pH and EC to the above defined setpoints
was tested:
pH: See. Fig. 41 after manual addition (13:40) of a small quantity of 0.01M KOH to the
nutrient solution tank (to reach a pH just above the setpoint), the controller automatically adds
acid to balance the deviation from the setpoint. The figure shows how the nutrient solution pH
reacts to the controller intervention.
EC: Fig. 42 shows the respective controller answer to a manual addition of 1l water to the
nutrient tank at the EC setpoint. This emulates the automatic nutrient solution tank level
control functionality during the plant growth test.
test pH vs. pH dosing pump
60.12 ml
5,44
5,46
5,48
5,50
5,52
5,54
5,56 1
3:2
6:2
4
13:3
3:3
6
13:4
0:4
8
13:4
8:0
0
13:5
5:1
2
14:0
2:2
4
14:0
9:3
6
14:1
6:4
8
14:2
4:0
0
14:3
1:1
2
14:3
8:2
4
14:4
5:3
6
14:5
2:4
8
timeline
pH
0
10
20
30
40
50
60
70
ml
0.0
1M
H3P
O4
Fig. 41 Response of the nutrient solution pH to the automated acid addition

issue 1 revision 0 -
page 49 of 87
TN 98.4.11 Preliminary trade-off for test plan and procedures UGent
This document is confidential property of the MELiSSA partners and shall not be used, duplicated, modified or transmitted without their authorization
Memorandum of Understanding 19071/05/NL/CP
MELiSSA Technical Note
test EC vs. EC dosing pump
58.12 ml
1700
1720
1740
1760
1780
1800
1820
1840
15:5
7:3
6
16:0
4:4
8
16:1
2:0
0
16:1
9:1
2
16:2
6:2
4
16:3
3:3
6
16:4
0:4
8
16:4
8:0
0
16:5
5:1
2
17:0
2:2
4
17:0
9:3
6
17:1
6:4
8
17:2
4:0
0
17:3
1:1
2
timeline
EC
(u
S/c
m)
0
10
20
30
40
50
60
70
ml
1.2
5 %
K2S
O4
Fig. 42 Response of the nutrient solution EC to the automated base addition
4.2.7 Gully cleaning
The gullies are cleaned before start-up with detergent and rinsed with deionised water. The
system is then run for 24 hours with deionised water.
Between plant growth trials, the gullies are cleaned with hot citric acid (when precipitations
are visible), rinsed with deionised water, disinfected with bleach (NaOCl) and rinsed again
with deionised water. The system is then run again for 24 hours with deionised water.
4.3 Experimental protocol
4.3.1 Cultivar selected
An overview of the selected cultivars‟ characteristics is given in Tab. 12.
Tab. 12 Characteristics of the potatoes cultivars selected for the FC phase 1
Cultivar Yield FW
(hydroponics) DW in field tuber size Height Maturity
Annabelle High Low 18,4% Small Medium-
High Very early
Bintje Low Medium to
high
Medium to
large Medium
Early to
intermediate
Desiree Middle 21,40% Large Medium Intermediate
to late
Innovator High High 21,30% Large Medium to
low
Early to
intermediate

issue 1 revision 0 -
page 50 of 87
TN 98.4.11 Preliminary trade-off for test plan and procedures UGent
This document is confidential property of the MELiSSA partners and shall not be used, duplicated, modified or transmitted without their authorization
Memorandum of Understanding 19071/05/NL/CP
MELiSSA Technical Note
4.3.2 Acclimated in vitro-plants treatment
For the start-up of the experiment in-vitro plantlets are used as they are disease free and at a
homogeneous development state. These plants are produced by the consultant HZPC
(Nederland). Acclimatisation takes place at HZPC for two weeks in an open hydroponic gully
system.
Acclimated plants are too small to fit into the JBH gullies so they are first grown in smaller
gullies (1.5 m x 15 cm x 4 cm) for the stem elongation phase(20°C, 80 µmol/m2s PAR).
All cultivars are grown with the HZPC growth nutrient solution from two common tanks.
Fig. 43 Potato vitro-plants after acclimatisation
4.3.3 Culture conditions
Potatoes are grown in four PU-coated stainless steel gullies (JBH) in a thin nutrient solution
layer using a recirculating nutrient technique. Two types of gullies are available; two of 1.66 x
0.16 m which can both hold 15 plants and two of 1.7 x 0.16 m which contain 16 plants.
Each selected cultivar is grown in a separate gully (with its own nutrient solution).
In parallel, two extra gullies of the JBH type mentioned above are set-up in another controlled
environment room (propagation room: room as used for the elongation phase) at a light
intensity corresponding to the other 4 gullies. In this comparative experiment the 4 cultivars
are setup in a mixed way in both gullies.

issue 1 revision 0 -
page 51 of 87
TN 98.4.11 Preliminary trade-off for test plan and procedures UGent
This document is confidential property of the MELiSSA partners and shall not be used, duplicated, modified or transmitted without their authorization
Memorandum of Understanding 19071/05/NL/CP
MELiSSA Technical Note
Tab. 13 Cultivars selected and quantity of plants
Cultivars Number of plants Gully position
Annabelle 15 Gully 2
Bintje 16 Gully 1
Desiree 16 Gully 3
Innovator 15 Gully 4
4.3.4 Plant growth period
In the first bench pre-test (carried out in propagation room), potatoes were grown with a 20
hour day and 4 hours dim light photoperiod (due to chamber control restrictions), and the
switch from growing phase to tuberisation occurred after 5 weeks. The experiment lasted 4
months to final harvest. The growing period for further trials is also estimated to be four
months.
4.3.5 Nutrient Solution Sampling
pH and EC are automatically measured. Sampling of hydroponics solution is performed at the
beginning and end of nutrient solution change.
4.3.6 Plant development
Plant morphogenic development is measured weekly for the height, number of stolons, number
of tubers, date of stolon appearance, date of tuber appearance, date of flowering and size of
tubers.
4.3.7 Gas exchange measurements
An ADC-2250 open-loop gas exchange system will be used to measure single plant or single
leaf CO2 assimilation and transpiration. Such an infrared gas analysis system (IRGA) uses a
pump to circulate air over the enclosed leaf surface in the cuvette, and determines the changes
in concentration of CO2 and H2O as a function of time.
4.3.8 Imaging of leaf area and leaf temperature
The installed gantry robot is carried by a frame that is mounted vertically in the middle of the
room. User access to the plants is through the same corridor. For user safety it is not possible
to reach into the working area of the robot while an experiment is running. The robot can move
in the x, y and z direction and furthermore the arm carrying the camera‟s can rotate (used
components are toothed belt linear axis: http://www.indunorm.eu). All these movements are
very precise (repeatability 0.1 mm) due to the use of closed-loop stepping motors
(www.orientalmotor.de) and planetary gears (http://www.alphagetriebe.de). An application
written with national instruments Labview (www.ni.com) controls both robot and image
acquisition.
The vision components are a thermal infrared camera ThermoVision® A10 (pixel resolution
160x120; http://www.flir.com) and a BCi5 CMOS colour camera (http://www.vector-
international.be) capturing high-resolution colour images (1280x1024 pixels).

issue 1 revision 0 -
page 52 of 87
TN 98.4.11 Preliminary trade-off for test plan and procedures UGent
This document is confidential property of the MELiSSA partners and shall not be used, duplicated, modified or transmitted without their authorization
Memorandum of Understanding 19071/05/NL/CP
MELiSSA Technical Note
The firewire (IEEE1394) output of the A10 and the USB2 output of the BCi5 camera are
captured by a Labview application upon positioning of each of the cameras above the target
plant. The software provides a module to compensate for the difference in alignment and field
of view of the camera‟s, to obtain a perfect match between the different images sequences
when analyzing the data.
4.3.9 Biomass data
Plant growth parameters to be measured at the end of the harvest are the fresh weight and the
dry weight of roots, dry weight of stems and leaves, fresh weigh and size of tubers.
4.3.10 Yield estimation
Nutritional analysis of harvested potatoes will be carried out by IPL.
Tab. 14 Potato tuber nutrient analysis Analyte Analysis method (AOAC number if not
otherwise stated)
mass of sample
needed (DW)
(FW)
Moisture/ Dry matter 984.25 / 920.151A 2 g 10 g
Ash 923.03 Same sample
Na, K 969.23 C Same sample
Ca, Mg, Fe,Zn, Cu, Mn 985.35 Same sample
Cl 971.27 2 g 10 g
Proteins
Kjeldahl N 984.13 0,5 g 3 g
Lipids
Total (fast & cheap usual
method)
ISO1443 4 g 20 g
Fibers
TDF 985.29 2 g 8 g
Glucids
total, by difference 0 g
Others
Vitamin C EN14130 or AOAC 984.261
2 g 10 g
P IDF33A
Alkaloids 997.13 6 g 30 g
4.3.11 Timing of the measurements
For the harvest, fresh and dry weight of foliage, roots, stem and tuber fresh weight will be
measured. After individual plant yield measurement, harvest will be divided in 2 classes as
indicated in the table above (optimal light versus suboptimal light).

issue 1 revision 0 -
page 53 of 87
TN 98.4.11 Preliminary trade-off for test plan and procedures UGent
This document is confidential property of the MELiSSA partners and shall not be used, duplicated, modified or transmitted without their authorization
Memorandum of Understanding 19071/05/NL/CP
MELiSSA Technical Note
Tab. 15 Parameters and frequency of logging Frequency logging Online/ Manual
Fixed airflow
Solution flow Weakly check Manual
Daily measurements Light quantity 5 min Online
Air temperature 30sec and 5 min Online
Humidity 30sec and 5 min Online
CO2 in air 5 min Online
O2 in air 5 min Online
Ethylene 1 min Online
Oxygen in solution weekly Manual
pH 5 min Online
EC 5 min Online
Solution temperature 5 min Online
Weight gully 4 1 h Online
EC stock solution used 5 min Online
Water stock used 5 min Online
Acid/Base stock used 5 min Online
Video imaging 1 h Online
Thermal imaging 1 h Online
Weekly measurements projected leaf area: images from video cam on robot Online
leaf temperature: images from thermal cam on robot Online
tuber area measurement – manual / image analysis
of captured images
Manual
CO2 assimilation ADC2250 IRGA system with
small leaf cuvette or whole plant cuvette
Online / 1day period
Leaf transpiration ADC2250 IRGA system with
small leaf cuvette or whole plant cuvette
Online / 1day period
Ethylene emanation measurement Sensorsense
system small leaf cuvette or whole plant cuvette
Online / 1day period
O2 level in leaf cuvette or whole plant cuvette Online / 1day period
Plant height Manual
Number of stolons Manual
Number of tubers Manual
Date of stolon appearance Manual
Date of tuber appearance Manual
Date of flowering Manual
Week 3, 8 and harvest Complete nutrient solution composition control Manual
Harvest Foliage fresh weight Manual
Stem fresh weight Manual
Root fresh weight Manual
Tuber fresh weight Manual
Foliage dry weight Manual
Stem dry weight Manual
Root dry weight Manual
Nutritional analysis by IPL, average per category Manual
plant 1-4 suboptimal light Manual
plant 5-12 optimal light Manual
plant 13-16 suboptimal light Manual

issue 1 revision 0 -
page 54 of 87
TN 98.4.11 Preliminary trade-off for test plan and procedures UGent
This document is confidential property of the MELiSSA partners and shall not be used, duplicated, modified or transmitted without their authorization
Memorandum of Understanding 19071/05/NL/CP
MELiSSA Technical Note
4.3.12 Preliminary testing
A pre-test experiment with 2 gullies was setup to determine if the hydroponic system would be
performing well. Six cultivars (Berber, Bintje, Carlita, Desiree, Felsina, Vitelotte) were grown
under controlled conditions (20 h light plus 4h dim light, 70% RH, 19 to 24˚C, pH 5.5 and EC
1500 μS). All cultivars produced tubers (Fig. 44) but excessive stem elongation and root
production was observed. The growth of a large root mass led to an elevated solution level in
the gullies and subsequent overflowing. Therefore, for the FC phase 1 bench-test, the general
nutrient solution initially used was replaced by the 2 nutrient solutions prepared according to
recipes supplied by HZPC. This mitigated excessive development of roots and shoots. Use of
the HZPC tuberisation solution in one of the gullies during the preliminary test proved to
control shoot growth to the desired size.
Fig. 44 Tubers produced from the preliminary experiment

issue 1 revision 0 -
page 55 of 87
TN 98.4.11 Preliminary trade-off for test plan and procedures UGent
This document is confidential property of the MELiSSA partners and shall not be used, duplicated, modified or transmitted without their authorization
Memorandum of Understanding 19071/05/NL/CP
MELiSSA Technical Note
Potato (UCL)
The UCL-GRPV has growth chambers with controlled temperature and photoperiod. The
growth chamber that is used for the MELiSSA project contains a height-adjustable light ceiling
with adjustable photoperiod. The growth chamber was adapted for the hydroponic culture of
potato.
4.4 Growth chamber specifications
Four separate liquid systems (one per cultivar) are used (Fig. 45).
sink
Light ceiling: 3m x 1.6m (61 lamps tubes TL-D reflex super 80 58W/840)
Table 1.7m x 0.9mGully: 1.7m x 0.25m
0.1 m
Air c
on
ditio
ner
Growth room in Louvain-la-Neuve
Fig. 45 Schematic representation of the growth room in Louvain-la-Neuve
Two tables of 1.7m x 0.9 m are located under the light ceiling, subsequently termed Table 2
(on the left in Fig. 45), and Table 1 (on the right). On each table, two gullies (1.7 m x 0.25 m)
are used. The gullies are positioned on the borders of the tables so that the plants can grow in
the centre (Fig. 45). A fence (mesh size 2cm x 2cm) of 40 cm height separates the two sides.
There are 16 plants per gully (10 cm space between plants). The plants are accessible from all
sides of the tables, which are located centrally in the chamber of 4.8x2.5m.

issue 1 revision 0 -
page 56 of 87
TN 98.4.11 Preliminary trade-off for test plan and procedures UGent
This document is confidential property of the MELiSSA partners and shall not be used, duplicated, modified or transmitted without their authorization
Memorandum of Understanding 19071/05/NL/CP
MELiSSA Technical Note
4.4.1 Lighting
The light ceiling contains 61 fluorescent lamp tubes (TL-D reflex super 80 58W/840 Philips,
Fig. 46) and can be moved to adjust the distance between the plants and the lamps. Each
second lamp can be turned on/off independently to adjust light homogeneity (Fig. 47). As the
harvest will be divided in two parts concerning the influence of light level on nutritional
composition, the lamps at the edges of the table were turned off. The pattern shown assures the
intensity is equally distributed over the gullies of the 4 cultivars.
The distance between the table and the light is maintained at 1m during the whole experiment.
Light intensity was measured at table level, at 20cm above the table and at 40cm above table
level, the latter anticipated as being the maximum plant height to be attained.
- Light intensity: ±200-300 µmol/m²s PPFD (Fig. 48, trace 0cm, corresponding to table
level); PAR quantum sensor (single channel light measuring system SKP 215, Skye
instruments LTD.; range 0-20000 µmol/m²/s; accuracy ± 3%; wavelength 400-700 nm).
- Photoperiod: 16h light/8h dark; ON/OFF control system.
Fig. 46 Philips TL-D reflex super 80 58W/840 specification and spectrum

issue 1 revision 0 -
page 57 of 87
TN 98.4.11 Preliminary trade-off for test plan and procedures UGent
This document is confidential property of the MELiSSA partners and shall not be used, duplicated, modified or transmitted without their authorization
Memorandum of Understanding 19071/05/NL/CP
MELiSSA Technical Note
Tubes positions on the light ceiling
Lamps turned off because some are not working and to increase the
light intensity difference along the gullies
Lamps turned off to have the more homogene light intensity possible Fig. 47 Map of the light ceiling
light intensity
150
200
250
300
350
400
0 20 40 60 80 100 120 140 160
gully (cm)
µm
ol/
m²/
s
o cm
20 cm
40 cm
Fig. 48 Light intensity along the gullies with standard deviation between gullies.
In Fig. 48 the “40cm” trace corresponds to plants of maximum height, 40cm above table level.

issue 1 revision 0 -
page 58 of 87
TN 98.4.11 Preliminary trade-off for test plan and procedures UGent
This document is confidential property of the MELiSSA partners and shall not be used, duplicated, modified or transmitted without their authorization
Memorandum of Understanding 19071/05/NL/CP
MELiSSA Technical Note
4.4.2 Environment control
The temperature in the room is adjusted by an air conditioner (cooling system slit-system
HITACHI type RPC-4AQ2/RAS-4AQK2). The evaporator unit is in the room. The condenser
unit is located outside on the roof. The cooling capacity is 10.6 kW. The dimensions of the
fan/evaporator unit are 1300x225x625 mm (Fig. 52).
The setpoints for temperature is 20°C; the range of measured values is as follows:
- Temperature: 20°C - 25°C
- Relative humidity: 60 - 90%
Temperature and relative humidity is measured by data loggers (Tinytag view 2). One data
logger is used on each table (called Melissa 1 and Melissa 2). Another data logger is positioned
between both tables (not directly illuminated by the lamps, called chamber) (Fig. 49 to Fig.
51). The data loggers‟ main technical specifications are as follows:
- Measurement interval: 10 min
- Operating range: -25°C to +50°C; 0-100%RH
- Accuracy: 0.4°C; 3% RH at 25°C
The complete specification sheet is available on the UGent fileserver or through:
http://87.117.252.3//images/downloads/451.pdf
An overheating sensor (thermostat) is installed in the room (Fig. 52). This security thermostat
switches off the lights when the temperature increases over 30°C.
Melissa 1
30.00 %RH
40.00 %RH
50.00 %RH
60.00 %RH
70.00 %RH
80.00 %RH
90.00 %RH
100.00 %RH
23/0
7/2
009 0
0:0
0:3
5
23/0
7/2
009 0
4:0
0:3
5
23/0
7/2
009 0
8:0
0:3
5
23/0
7/2
009 1
2:0
0:3
5
23/0
7/2
009 1
6:0
0:3
5
23/0
7/2
009 2
0:0
0:3
5
24/0
7/2
009 0
0:0
0:3
5
24/0
7/2
009 0
4:0
0:3
5
24/0
7/2
009 0
8:0
0:3
5
24/0
7/2
009 1
2:0
0:3
5
24/0
7/2
009 1
6:0
0:3
5
24/0
7/2
009 2
0:0
0:3
5
25/0
7/2
009 0
0:0
0:3
5
25/0
7/2
009 0
4:0
0:3
5
25/0
7/2
009 0
8:0
0:3
5
25/0
7/2
009 1
2:0
0:3
5
25/0
7/2
009 1
6:0
0:3
5
25/0
7/2
009 2
0:0
0:3
5
26/0
7/2
009 0
0:0
0:3
5
26/0
7/2
009 0
4:0
0:3
5
26/0
7/2
009 0
8:0
0:3
5
26/0
7/2
009 1
2:0
0:3
5
26/0
7/2
009 1
6:0
0:3
5
26/0
7/2
009 2
0:0
0:3
5
27/0
7/2
009 0
0:0
0:3
5
27/0
7/2
009 0
4:0
0:3
5
27/0
7/2
009 0
8:0
0:3
5
27/0
7/2
009 1
2:0
0:3
5
27/0
7/2
009 1
6:0
0:3
5
27/0
7/2
009 2
0:0
0:3
5
28/0
7/2
009 0
0:0
0:3
5
28/0
7/2
009 0
4:0
0:3
5
28/0
7/2
009 0
8:0
0:3
5
28/0
7/2
009 1
2:0
0:3
5
20.00 °C
21.00 °C
22.00 °C
23.00 °C
24.00 °C
25.00 °C
26.00 °C
27.00 °C
28.00 °C
29.00 °C
30.00 °C
RH
T°
Fig. 49 RH and temperature on table1 next to the door and the fan unit

issue 1 revision 0 -
page 59 of 87
TN 98.4.11 Preliminary trade-off for test plan and procedures UGent
This document is confidential property of the MELiSSA partners and shall not be used, duplicated, modified or transmitted without their authorization
Memorandum of Understanding 19071/05/NL/CP
MELiSSA Technical Note
Melissa 2
30.00 %RH
40.00 %RH
50.00 %RH
60.00 %RH
70.00 %RH
80.00 %RH
90.00 %RH
100.00 %RH
23/0
7/2
009 0
0:0
0:3
6
23/0
7/2
009 0
4:0
0:3
6
23/0
7/2
009 0
8:0
0:3
6
23/0
7/2
009 1
2:0
0:3
6
23/0
7/2
009 1
6:0
0:3
6
23/0
7/2
009 2
0:0
0:3
6
24/0
7/2
009 0
0:0
0:3
6
24/0
7/2
009 0
4:0
0:3
6
24/0
7/2
009 0
8:0
0:3
6
24/0
7/2
009 1
2:0
0:3
6
24/0
7/2
009 1
6:0
0:3
6
24/0
7/2
009 2
0:0
0:3
6
25/0
7/2
009 0
0:0
0:3
6
25/0
7/2
009 0
4:0
0:3
6
25/0
7/2
009 0
8:0
0:3
6
25/0
7/2
009 1
2:0
0:3
6
25/0
7/2
009 1
6:0
0:3
6
25/0
7/2
009 2
0:0
0:3
6
26/0
7/2
009 0
0:0
0:3
6
26/0
7/2
009 0
4:0
0:3
6
26/0
7/2
009 0
8:0
0:3
6
26/0
7/2
009 1
2:0
0:3
6
26/0
7/2
009 1
6:0
0:3
6
26/0
7/2
009 2
0:0
0:3
6
27/0
7/2
009 0
0:0
0:3
6
27/0
7/2
009 0
4:0
0:3
6
27/0
7/2
009 0
8:0
0:3
6
27/0
7/2
009 1
2:0
0:3
6
27/0
7/2
009 1
6:0
0:3
6
27/0
7/2
009 2
0:0
0:3
6
28/0
7/2
009 0
0:0
0:3
6
28/0
7/2
009 0
4:0
0:3
6
28/0
7/2
009 0
8:0
0:3
6
28/0
7/2
009 1
2:0
0:3
6
20.00 °C
21.00 °C
22.00 °C
23.00 °C
24.00 °C
25.00 °C
26.00 °C
27.00 °C
28.00 °C
29.00 °C
30.00 °C
RH
T°
Fig. 50 RH and temperature on table2
chamber
30.00 %RH
40.00 %RH
50.00 %RH
60.00 %RH
70.00 %RH
80.00 %RH
90.00 %RH
100.00 %RH
23/0
7/2
009 0
0:0
0:0
3
23/0
7/2
009 0
4:0
0:0
3
23/0
7/2
009 0
8:0
0:0
3
23/0
7/2
009 1
2:0
0:0
3
23/0
7/2
009 1
6:0
0:0
3
23/0
7/2
009 2
0:0
0:0
3
24/0
7/2
009 0
0:0
0:0
3
24/0
7/2
009 0
4:0
0:0
3
24/0
7/2
009 0
8:0
0:0
3
24/0
7/2
009 1
2:0
0:0
3
24/0
7/2
009 1
6:0
0:0
3
24/0
7/2
009 2
0:0
0:0
3
25/0
7/2
009 0
0:0
0:0
3
25/0
7/2
009 0
4:0
0:0
3
25/0
7/2
009 0
8:0
0:0
3
25/0
7/2
009 1
2:0
0:0
3
25/0
7/2
009 1
6:0
0:0
3
25/0
7/2
009 2
0:0
0:0
3
26/0
7/2
009 0
0:0
0:0
3
26/0
7/2
009 0
4:0
0:0
3
26/0
7/2
009 0
8:0
0:0
3
26/0
7/2
009 1
2:0
0:0
3
26/0
7/2
009 1
6:0
0:0
3
26/0
7/2
009 2
0:0
0:0
3
27/0
7/2
009 0
0:0
0:0
3
27/0
7/2
009 0
4:0
0:0
3
27/0
7/2
009 0
8:0
0:0
3
27/0
7/2
009 1
2:0
0:0
3
27/0
7/2
009 1
6:0
0:0
3
27/0
7/2
009 2
0:0
0:0
3
28/0
7/2
009 0
0:0
0:0
3
28/0
7/2
009 0
4:0
0:0
3
28/0
7/2
009 0
8:0
0:0
3
28/0
7/2
009 1
2:0
0:0
3
20.00 °C
21.00 °C
22.00 °C
23.00 °C
24.00 °C
25.00 °C
26.00 °C
27.00 °C
28.00 °C
29.00 °C
30.00 °C
RH
T°
Fig. 51 RH and temperature in the middle of the room (no direct contact with the lamps)
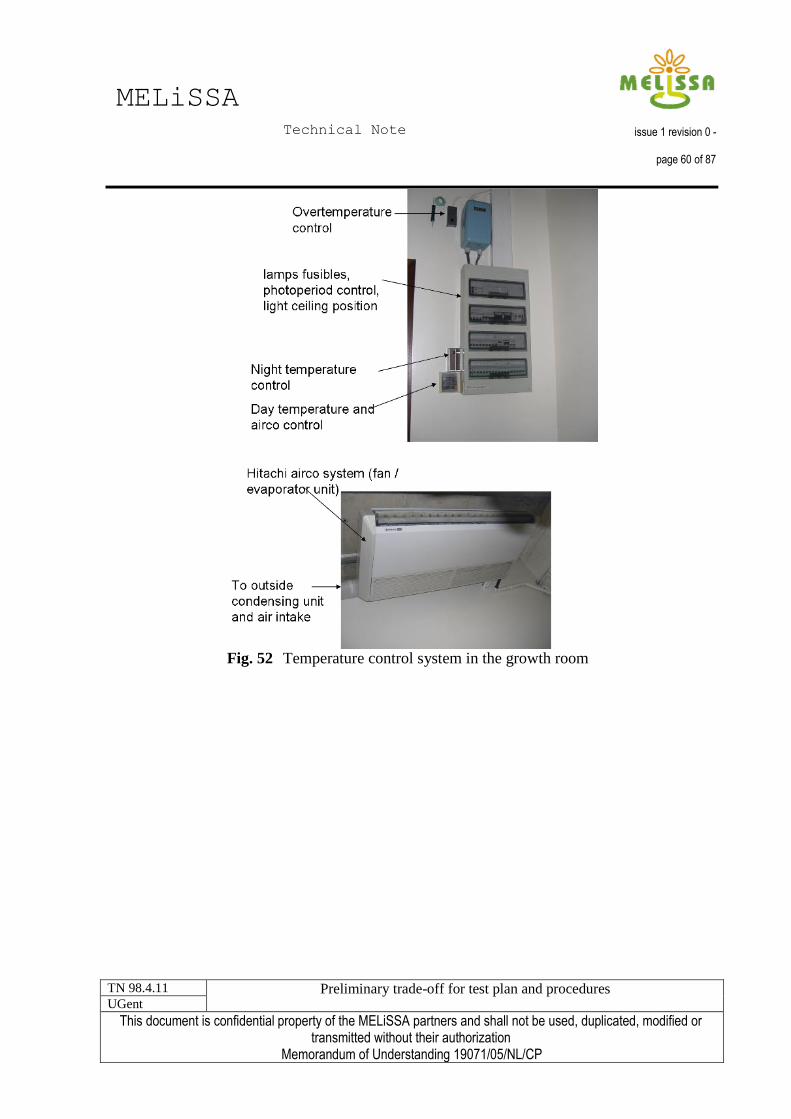
issue 1 revision 0 -
page 60 of 87
TN 98.4.11 Preliminary trade-off for test plan and procedures UGent
This document is confidential property of the MELiSSA partners and shall not be used, duplicated, modified or transmitted without their authorization
Memorandum of Understanding 19071/05/NL/CP
MELiSSA Technical Note
Fig. 52 Temperature control system in the growth room

issue 1 revision 0 -
page 61 of 87
TN 98.4.11 Preliminary trade-off for test plan and procedures UGent
This document is confidential property of the MELiSSA partners and shall not be used, duplicated, modified or transmitted without their authorization
Memorandum of Understanding 19071/05/NL/CP
MELiSSA Technical Note
4.4.3 Hydroponic system
The hydroponic system is based on recirculating closed NFT. Four separate systems are used
(one per trough, Fig. 53 and Fig. 54).
GULLY
0.25m
0.1 m
Top view
Front view
Side view
9.5cm
1.7m
1.7m
3.5cm
5cm
10cm1.5cm
Nutritive solution (20l)
2cm
Cooling systempump
2Gully2
Air pump
Fig. 53 Recirculating closed NFT hydroponic system for potatoes.

issue 1 revision 0 -
page 62 of 87
TN 98.4.11 Preliminary trade-off for test plan and procedures UGent
This document is confidential property of the MELiSSA partners and shall not be used, duplicated, modified or transmitted without their authorization
Memorandum of Understanding 19071/05/NL/CP
MELiSSA Technical Note
Fig. 54 Gullies and hydroponic systems
Each of the four systems consists of:
- One galvanized steel trough with PU coating (1.7 m x 0.25 m x 0.95 m, JBH Guttersystem
250/200-95, JB Hydroponics, Maasdijk, NL) with an inclination of 1.5 cm on 1.7 m
length.
- One 30 L food grade PP tank (Allibert) containing 20 L of nutrient solution.
- One centrifugal (non-priming) pump (Eheim universal 1260 submergible) with 2400 L/h
capacity, mounted outside of the nutrient solution tank to reduce the heat load.
- A connection before the pump to disconnect the pump if necessary.
- A 2 way divider connection allowing the recirculation of the nutrient solution to the tank
after the pump.
- PVC Tubing with a 16/22 mm (internal/external) diameter.
The systems share:
- One cooling system (Teco cooler TR5 160W) per table (one cooler for two tanks).
- One air pump (Superfish Koi-flow 60) (60L/min) to oxygenate the nutrient solutions (one
for the 4 gullies).

issue 1 revision 0 -
page 63 of 87
TN 98.4.11 Preliminary trade-off for test plan and procedures UGent
This document is confidential property of the MELiSSA partners and shall not be used, duplicated, modified or transmitted without their authorization
Memorandum of Understanding 19071/05/NL/CP
MELiSSA Technical Note
4.4.4 Nutrient solution
- Flow rate: 5 l/min per gully.
- Composition, EC, pH: The same recipes and protocols as UGent (Tab. 9 and Tab. 10).
- Temperature: 20°C.
- Each system contains 20 L of nutrient solution. The solution level is checked each week
and adjusted when needed.
- After 5 weeks tuberisation solution with less N replaces the start up solution. After 10
weeks the nutrient solution is exchanged.
- EC and pH are controlled manually every day with a Symphony SP90M5 meter (see
Tab. 16). The adjustments are done by adding demineralised water, concentrate solution,
KOH or HNO3.
- O2 level is manually measured daily with a Symphony SP90M5 oxygen meter.
- Solution T is manually measured daily (Symphony SP90M5).
- Control of nutrient solution composition is determined at the beginning of the experiment,
after 5 weeks (old and fresh), after 10 weeks (old old and fresh) and at the end of the
experiment. Three replicates are taken per sampling.
K, Ca, Mg, Fe, Mn, Zn, Cu, Na, P, S, Mo, B, Cr, Pb, Al are measured with an ICP
(inductively coupled plasma) system. NO3-, NO2
-, NH4
+, PO4
3-, Cl
-, SO3
- levels are
measured by HPLC in the UCL/SOLS laboratory.
Additionally, the concentration of NO3- (Merck Microquant® (MiQ)), SO4
2- (Aquaquant®
(AQ)), PO43-
(Aquamerck® (AM)) can be determined with test sticks during plant
development (Tab. 17) and the amounts of K, Ca, Mg are measured by atomic absorption
spectrophotometer (AAS4, Thermo scientific). The nutrient solution is injected in the
machine after filtration (0.45 µm filter). The minimum detection levels are 0.008 mg/l,
0.009 mg/l and 0.003 mg/l for K, Ca and Mg respectively.
4.4.5 Microorganisms monitoring
At the beginning of the experiment, after 5 weeks, after 10 weeks and at the end of the
experiment, the total count for bacteria and fungi in the nutrient solution is determined. This is
only scheduled for UCL. Other partners do not perform this analysis.
The quantity of microorganisms in the nutrient solution is determined by the total viable count
(TVC). PCA (Plate Count Agar) will be used to monitor the number of bacteria. Plates are
incubated for 3 days at 37°C. YGC (Yeast Extract Glucose Carbonate medium) will be used to
monitor the number of yeast and mould. The plates are incubated for 5 days at 25°C.
Well isolated colonies will be counted to obtain first indications of the global microbial
population.
Tab. 16 Specifications of the Symphony SP90M5 meter (pH, EC, O2, temperature)
Range Accuracy Resolution
pH -2 to 20 0.002 0.001
Conductivity 3000 mS/cm Not specified Not specified
DO 0 to 9 mg/l 0.2 mg/l Not specified
T -5 to 105 Not specified 0.1

issue 1 revision 0 -
page 64 of 87
TN 98.4.11 Preliminary trade-off for test plan and procedures UGent
This document is confidential property of the MELiSSA partners and shall not be used, duplicated, modified or transmitted without their authorization
Memorandum of Understanding 19071/05/NL/CP
MELiSSA Technical Note
Tab. 17 Test sticks specifications
element method range accuracy
N03- colorimetric 5-90 mg/l 5 mg/l
SO42-
colorimetric 25-300 mg/l 25 mg/l
PO43-
colorimetric 1.3-13.4 mg/l 1.5 mg/l
4.5 Test plan
4.5.1 Setup and protocol for germination and propagation
In vitro plants are used as starting material: 16 plants per cultivar are put in the gullies (one
gully per cultivar) using a nutrient solution with normal nitrate content. The space between the
plants in the gullies is 10 cm. The 4 cultivars used are Annabelle, Bintje, Désirée and
Innovator. In vitro plants are provided by HZPC (20 plants per box). The size of the in vitro
plants before transfer to the gullies is about 10 cm. The plants are rinsed to remove the agar
and placed immediately in the gullies.
After 5 weeks (formation of the first stolons), the solution is replaced by a low nitrate
tuberisation solution. The plants are maintained in this nutrient solution until the end of the
experiment (nutrient solution is renewed once at week 10). The plants are harvested after ± 100
days of growth.
The plants are cultivated in 16h/8h (day/night) photoperiod at a light intensity of 200-300
µmol/m²s. The temperature is maintained around 20-25°C and the relative humidity around 60-
90%. The temperature of the nutrient solution is controlled and must be maintained at 20°C.
Cultivar layout in the growth chamber: see Fig 40. from left to right Innovator, Bintje,
Annabelle, Desiree
4.5.2 Observation parameters for the plants
The growth of the plants is followed every week for each plant:
- Plant height
- Number of leaves
- Number of stolons
- Number of tubers
- Date of stolon formation
- Date of tuberisation
- Date of flowering
- Number of stolons and tubers
- Percentage of gully covered by the roots (using visual spectrum images and specific
software; involvement of UCL-EPAV consultant specialised in this topic)

issue 1 revision 0 -
page 65 of 87
TN 98.4.11 Preliminary trade-off for test plan and procedures UGent
This document is confidential property of the MELiSSA partners and shall not be used, duplicated, modified or transmitted without their authorization
Memorandum of Understanding 19071/05/NL/CP
MELiSSA Technical Note
The physiological parameters of the plants are followed every week for each plant on the
youngest expanded leaf (young leaf photosynthetic active, Tab. 18):
- Net photosynthesis and instantaneous transpiration (portable Infra Red Gas analyzer
LCA4 ADC Bioscientific Ltd):
The LCA4 instrument provides measurement of CO2 and H2O exchanges associated with
a leaf specimen enclosed in an ADC‟PLC‟ type of leaf chamber. Instantaneous CO2
assimilation rate (μmol CO2·m−2
·s−1
) and instantaneous transpiration rate (mmol
H2O·m−2
·s−1
) are determined by monitoring depletion of CO2 and H2O.
- Stomatal conductance (porometer AP4 deltaT):
Stomatal aperture is the dominant factor in the diffusion conductance of leaf surfaces,
which controls both the water loss from plant leaves and the uptake of CO2 for
photosynthesis. The AP4 measures diffusion conductance by comparing the precise rate of
humidification within a small cuvette to readings obtained with a calibration plate.
- Kinetics of chlorophyll fluorescence (fluorescence monitoring system 2 Hansatech
Instruments):
The leaf portion is acclimated to darkness for 30 min. Fluorescence is measured at 12 bit
resolution and excited by six light emitting diodes providing a saturating beam of actinic
red light (650 nm, 600 W/m2, 3200 μmol·m
−2·s
−1). Maximum yield of photochemistry
(Fv/Fm), absorbance per cross section (ABS/CS, antenna size), number of reaction center
in cross section (RC/CS), rate of primary photochemistry per cross section (TR0/CS0),
electron transport per cross section (ET0/CS), as well as the dissipation energy per cross
section (DI0/CS) and the performance index (PI) were measured according to the JIP
method of Strasser and Strasser (1995) which implies the measurement of a fast
fluorescence transient with a 10 μs resolution in a time span of 40 μs to 1 s to allow the
dynamic measurement of a photosynthetic sample at a given physiological state.
- Chlorophyll concentration SPAD (CCM-200 opti-sciences):
The cell (3 cm of diameter) of the machine is attached to the leaf. Chlorophyll has several
distinct optical absorbance characteristics that the CCM-200 uses to measure relative
chlorophyll concentration without destructive sampling.
- Leaf area meter (area meter AM 300 ADC Bioscientific Ltd):
The AM300 consists of a high resolution scanner and a scan board with integral data
analysis and image storage. An adjustable contrast control makes the AM300 suitable for
damaged, discoloured or diseased leaf applications.
Tab. 18 Specifications of instruments for physiological parameters
Measured value Device Measurement range Accuracy
IRGA LCA4 ADC CO2: 0-1600
H2O: 74 0/00 (at 40°C)
CO2: 0.2 vpm
H2O : 0.5% fsd
Porometer AP4 delta T 5-12000 mmol/m²s ± 10%
Chlorophyll fluorescence FMS2 PAR: 0-20000 µmol/m²s
T: -10°C - 90°C
Chlorophyll content meter CCM-200 ± 1 CCI unit
Leaf area meter ADC AM 300 Max width = 100 mm ± 2%

issue 1 revision 0 -
page 66 of 87
TN 98.4.11 Preliminary trade-off for test plan and procedures UGent
This document is confidential property of the MELiSSA partners and shall not be used, duplicated, modified or transmitted without their authorization
Memorandum of Understanding 19071/05/NL/CP
MELiSSA Technical Note
In addition to the above mentioned non-destructive measurements, destructive measurements
are performed after the harvest for each plant:
- Fresh weight of the leaves, stems, roots, tubers (for each tuber and total per plant).
- Dry weight of the leaves, stems, roots.
- Total soluble sugar content and starch content in the leaves and the roots according to
Yemm and Willis (1954):
1g of frozen samples (young leaf, old leaf, roots) is ground in liquid nitrogen to a fine
powder and then extracted with 4 ml of 70% ethanol. Extracts are centrifuged for 15 min
at 6600 g. The supernatant is used for the quantification of the total soluble sugar content.
Starch in the pellet is hydrolyzed in 8 ml HCl 1 M at 95°C for 2 hours and filtered on
Miracloth. The solution is neutralized with NaCl. For both fractions, 1 ml of Anthrone
solution (250 ml H2SO4cc + 12.5 ml H2O + 0.5 g Anthrone) is added to 200 µl of sample
and boiled for 10 minutes. Then the OD is measured at 625 nm.
- carbon isotopic discrimination (13
C versus 12
C discrimination by photosynthesis depends
on stomatal aperture) in order to evaluate the water-use efficiency (WUE, ratio of energy
captured by photosynthesis per unit of water transpired, depends on efficient regulation of
stomatal aperture) on young and old leaves :
1 g of tissue (DW) is ground to a fine powder. Carbon isotope composition (δ13
C) is
determined in duplicate for each sample with an isotope mass spectrometer (Isotope
Services Inc, Los Alamos, NM, USA) and calculated with respect to PeeDeeBelemnite
reference as δ13
C (‰) = [(Rsample/Rreference) − 1 × 1000] where R is 13
C/12
C ratio. Carbon
isotope discrimination (Δ) is calculated according to the formula of Hubick et al. (1886):
Δ = [(δa − δp)/(1 + δp)]*1000 where δp is the δ13
C of the leaf sample and δa is the δ13
C of
the atmospheric CO2 (− 8‰).
This measurement gives an integrated assessment of stomatal conductance over the
development time of the samples tissue. Manual gas exchange measurements only provide
time point measurements.
At harvest, for each cultivar the tubers are divided into two classes based on the light intensity
received by the parent plants (low intensity/high intensity). Imediately after harvest, or after 1
week of hardening, tubers are sent to IPL for further analysis. To assess longer term storage
ability tubers can be stored at 4 to 6°C in the dark in order to evaluate tuber dormancy. Tubers
are kept at 6°C in the dark and the time to produce sprouts is logged.

issue 1 revision 0 -
page 67 of 87
TN 98.4.11 Preliminary trade-off for test plan and procedures UGent
This document is confidential property of the MELiSSA partners and shall not be used, duplicated, modified or transmitted without their authorization
Memorandum of Understanding 19071/05/NL/CP
MELiSSA Technical Note
REFERENCES:
Hubick KT, Farquhar GD, Shorter R (1986) Correlation between water-use efficiency and carbon
isotope discrimination in diverse peanut (Arachis) germplasm. Aust J Plant Physiol 13: 803–816
Strasser BJ , Strasser RJ (1995). Measuring fast fluorescence transients to address environmental
questions: the JIP-test. In: Mathis P, ed. Photosynthesis: From Light to Biosphere. vol. V. Kluwer
Academic Press, Dordrecht . pp. 977–980.
Yemm EW, Willis J (1954) The estimation of carbohydrates in plant extracts by anthrone. Biochem J
57: 508–514

issue 1 revision 0 -
page 68 of 87
TN 98.4.11 Preliminary trade-off for test plan and procedures UGent
This document is confidential property of the MELiSSA partners and shall not be used, duplicated, modified or transmitted without their authorization
Memorandum of Understanding 19071/05/NL/CP
MELiSSA Technical Note
4.6 Summary
Invitro
pla
nts
in
gully
wk0
wk
1
wk
2
wk
3
wk4
wk5
wk6
wk7
wk8
wk9
wk10
wk11 w
k12 w
k13 w
k14
w
k15
Nu
tritiv
e s
olu
tion
ch
ang
e (
less
N)
Nu
tritiv
e s
olu
tion
ch
ang
e (
less
N)
ha
rve
st
Co
mp
lete
co
mp
ositio
n c
on
trol
Co
mp
lete
co
mp
ositio
n c
on
trol
Co
mp
lete
co
mp
ositio
n c
on
trol
Co
mp
lete
co
mp
ositio
n c
on
trol
Nu
tritiv
e s
olu
tion
pla
nts
Bio
logic
alto
tal cou
nt
Bio
logic
alto
tal cou
nt
Bio
logic
alto
tal cou
nt
Bio
logic
alto
tal cou
nt
K,
Ca
, M
g
N,
S,
P
K,
Ca
, M
g
N,
S,
P
K,
Ca
, M
g
N,
S,
P
K,
Ca
, M
g
N,
S,
P
K,
Ca
, M
g
N,
S,
P
K,
Ca
, M
g
N,
S,
P
Ea
ch
da
y:
pH
, E
C,
O2,
T°
ea
ch
we
ek:
solu
tio
n le
vel
roo
m
Ea
ch
10
min
ute
s:
T°,
RH
FW
lea
ve
s,
ste
ms,
roo
ts,t
ube
rs
DW
le
ave
s,
ste
ms,
roo
ts
sta
rch
an
d s
olu
ble
sug
ars
(le
ave
s,
roo
ts)
C iso
topic
dis
cri
min
atio
n (
lea
ve
s)
Tu
bers
ha
rve
stlo
w/h
igh
inte
nsity
Ea
ch
we
ek:
Gro
wth
pa
ram
ete
rs:
-pla
nt h
eig
ht,
nu
mb
er
of le
ave
s,
nu
mb
er
of
sto
lon
s,
nu
mb
er
of
tub
ers
, da
te o
f sto
lon
form
atio
n, d
ate
of
tub
erisa
tion
, d
ate
of
flo
we
rin
g
Ph
ysio
logic
alpa
ram
ete
rs:
IRG
A,
po
rom
ete
r, f
luo
rim
ete
r, S
PA
D,
lea
fa
rea
me
ter
Lig
ht in
ten
sity
Lig
ht in
ten
sity
Lig
ht in
ten
sity
Lig
ht in
ten
sity

issue 1 revision 0 -
page 69 of 87
TN 98.4.11 Preliminary trade-off for test plan and procedures UGent
This document is confidential property of the MELiSSA partners and shall not be used, duplicated, modified or transmitted without their authorization
Memorandum of Understanding 19071/05/NL/CP
MELiSSA Technical Note
5 Soybean
The bench tests on the soybean cultivars are performed at the University of Napoli. One walk
in growth chamber has been adapted to fulfil the requirements for WP 4200, as described in
the following section.
5.1 Growth chamber specifications
5.1.1 Hydroponics system
Experiments are carried out in a 16 m2 walk-in growth chamber (4 m x 4 m) equipped with a
recirculating NFT system (Fig. 55 and Fig. 56). Four cultivars of soybean have been selected
for the bench tests. Three PP 60-cm high double gullies equipped with PE tubing and
connections are used for each cultivar. A total of 12 double gullies are arranged in the
chamber. 14 plants are grown per double trough (42 plants per cultivar in total). Each
individual gully is 12 cm wide, 93 cm long and 5 cm high and is equipped with 3 sprinklers, to
provide the nutrient solution. Seeds are placed in a small plastic basket in the gully holes (Fig.
57) in Perlite, keeping the moisture of the substrate constant.
Fertigation is performed with one separate nutrient solution reservoir (PP) per each double
gully and each reservoir is equipped with its own submersible pump. Nutrient solution returns
to the nutrient reservoir by gravity.
The nutrient solution is based on the standard Hoagland solution 1/2 strength (Hoagland and
Arnon, 1950), modified by Wheeler et al. (2008), according to specific requirement of
soybean. The starting nutrient solution has the following ion concentration:
7.5 mM N, 3.0 mM K, 0.5 mM P, 2.5 mM Ca, 1.0 mM Mg, 1.0 mM S, 60 M Fe, 7.4 M Mn,
0.96 M Zn, 1.04 M Cu, 7.13 M B and 0.01 M Mo (Wheeler et al., 2008).
The salt composition of the nutrient solution is shown in Tab. 19.
EC and pH are kept at 1.2 dS m-1
and 5.8 (Wheeler et al., 2008), respectively. Both are
controlled manually and adjusted daily by adding deionised water and/or fresh nutrient
solution and nitric acid or potassium hydroxide respectively in the storage tanks.
Water depletion is measured daily and the volume of the nutrient solution is kept constant.

issue 1 revision 0 -
page 70 of 87
TN 98.4.11 Preliminary trade-off for test plan and procedures UGent
This document is confidential property of the MELiSSA partners and shall not be used, duplicated, modified or transmitted without their authorization
Memorandum of Understanding 19071/05/NL/CP
MELiSSA Technical Note
Tab. 19 Salt composition of the nutrient solution (mg per litre of nutrient solution).
Calcium nitrate 545,00
Potassium nitrate 200,00
Iron chelate (Fe-EDTA, Fe EDDHA) 48,20
Magnesium sulphate 135,00
Monopotassium phosphate 68,14
Potassium sulphate 60,00
Boric acid 4,40
Copper sulphate 0,235
Zinc sulphate 2,643
Manganese sulphate 1,437
Ammonium molybdate 0,183
5.1.2 Environment control
Experiments are carried out under controlled environmental conditions (light intensity,
temperature, relative humidity, and photoperiod (ON/OFF)).
Light is provided by 9 High Pressure Sodium (HPS) lamps (LU600/T GE Lucalox® T15 - 600
W, manufactured by GELighting) which are placed 20 cm from the ceiling in three lines (3
lamps per line). The light spectrum of lamp emission is shown in.Fig. 58.
The growth chamber walls and floor are coated with a reflective Mylar film in order to
optimize the light distribution. Lamps are separated from the growing environment by a pane
of tempered glass designed to prevent convective heat transport into the room. The lamp inter-
space is cooled by 4 ventilators.
Temperature and humidity control is performed by an air conditioning system (McQuay Intl.,
M5CM 040 ER - three-phase; 12 kW). To decrease relative humidity (RH), the system is
controlled by a programmable hygrostat connected to a RH probe.
A fogging system is used for cooling and humidification. The system is equipped with a high
pressure pump (70 bar) equipped with a safety valve. To increase RH over a certain threshold,
the fogging system is switched on by a second programmable hygrostat connected to a second
RH probe. Fresh water is sprinkled by 12 sprinklers placed on the top of the lateral walls (3
sprinklers per wall).
Two small fans are placed at the top and at the bottom of one wall for periodic change of the
internal air.
The layout of the climate control devices and the gullies is shown in Fig. 59. Measurements
have been carried out to map the possible light, T and RH gradients in order to minimize any
border effect at the crop level. Particularly, the extinction profile of light distribution at
different distances from the lamps and the uniformity of temperature and RH have been
studied according to the scheme in Fig. 60. .
Results show that the light distribution profile reflects the distance from the single lamp and
the relative position to more lamps. However, the values of light intensity found in the vertical
space that are really occupied by the canopy (height from 0 to 80 cm from the gully) are

issue 1 revision 0 -
page 71 of 87
TN 98.4.11 Preliminary trade-off for test plan and procedures UGent
This document is confidential property of the MELiSSA partners and shall not be used, duplicated, modified or transmitted without their authorization
Memorandum of Understanding 19071/05/NL/CP
MELiSSA Technical Note
acceptable for crop growth and development. The plant canopy is anticipated to be limited to
80cm, hence the PPFD values of Tab. 20 are considered homogeneous.
A virtual scheme of the spatial light distribution has been simulated on the basis of the
measured data (Fig. 61).
Temperature within the vertical and the horizontal planes ranged between the interval 25.4 -
26.5 °C and RH from 67.1 to 73.3%, with no relevant gradient among the measurement
positions (Tab. 21 and Tab. 22).
Temperature gradients in the chamber are limited to 0.4°C. 5 points at gully height (60 cm
from the floor) at different distances from the air conditioning system were measured. Each
measurement was performed 3 times. In Fig. 62 the average values are given.
5.1.3 Experimental set up
Four cultivars of soybean have been selected for the bench tests according to the defined
selection criteria: „PR91M10‟, „Clara‟, „Regir‟, „Atlantic‟. Selected cultivars are all classified
as early maturing and photoperiod independent.
Plants are grown from certified seed sources. Germination tests are performed before starting
the bench test in order to measure the germination percentage and the Mean Germination Time
(MGT = Dn/n; where n is the number of seeds germinated per day, D the number of days
from the beginning of the test).
Germination is carried out at 20 °C in the dark (Martìnez-Villaluenga et al., 2006; Weeler et
al., 2004). A pre-soak treatment in DI water is performed in preliminary trials (Mackowiak et
al., 1999) in order to evaluate the effect of the seed imbibition on the germination performance
(time and percentage).
Seeds in the small plastics baskets are covered with white acrylic covers for 4 days after
planting to shade seedlings and maintain high humidity. Three seeds are used for each hole and
are reduced to one after seedling emergence (approximately 8 DAP). Plants are sealed in the
gully holes by a two sided polyethylene film, with the black inside, to reduce the amount of
light in the roots, and the white one outside to reflect light back into the developing canopy.
The experiment is set at the growing conditions listed below, considering the optimum values
for soybean.
A minimum PPFD of 600 mol cm-2
s-1
is obtained at the canopy level by regulating the height
of the gullies, according to a day/night regime of 12/12 hours (Wheeler et al., 2008).
Temperature regime is established at 26/20 °C (light/dark) and relative humidity (RH) is kept
within the optimum range of 65-75% (Wheeler et al., 2008).
The experiment is carried out under ambient CO2 and O2 concentration and atmospheric
pressure.
Light intensity, temperature and relative humidity are recorded hourly by using a Delta OHM
DO 9847K data logger. Average and integral values are calculated daily.

issue 1 revision 0 -
page 72 of 87
TN 98.4.11 Preliminary trade-off for test plan and procedures UGent
This document is confidential property of the MELiSSA partners and shall not be used, duplicated, modified or transmitted without their authorization
Memorandum of Understanding 19071/05/NL/CP
MELiSSA Technical Note
Fig. 55 Views of the double gully, the nutrient solution tank and the submerged pump.
Fig. 56 Air conditioning system in the growth chamber and reflective film on the floor.

issue 1 revision 0 -
page 73 of 87
TN 98.4.11 Preliminary trade-off for test plan and procedures UGent
This document is confidential property of the MELiSSA partners and shall not be used, duplicated, modified or transmitted without their authorization
Memorandum of Understanding 19071/05/NL/CP
MELiSSA Technical Note
Fig. 57 Plastic basket for seeds and plants holding in the NFT gullies.
Fig. 58 The emission spectrum of HPS lamps LU600/T GE Lucalox® T15 - 600 W.
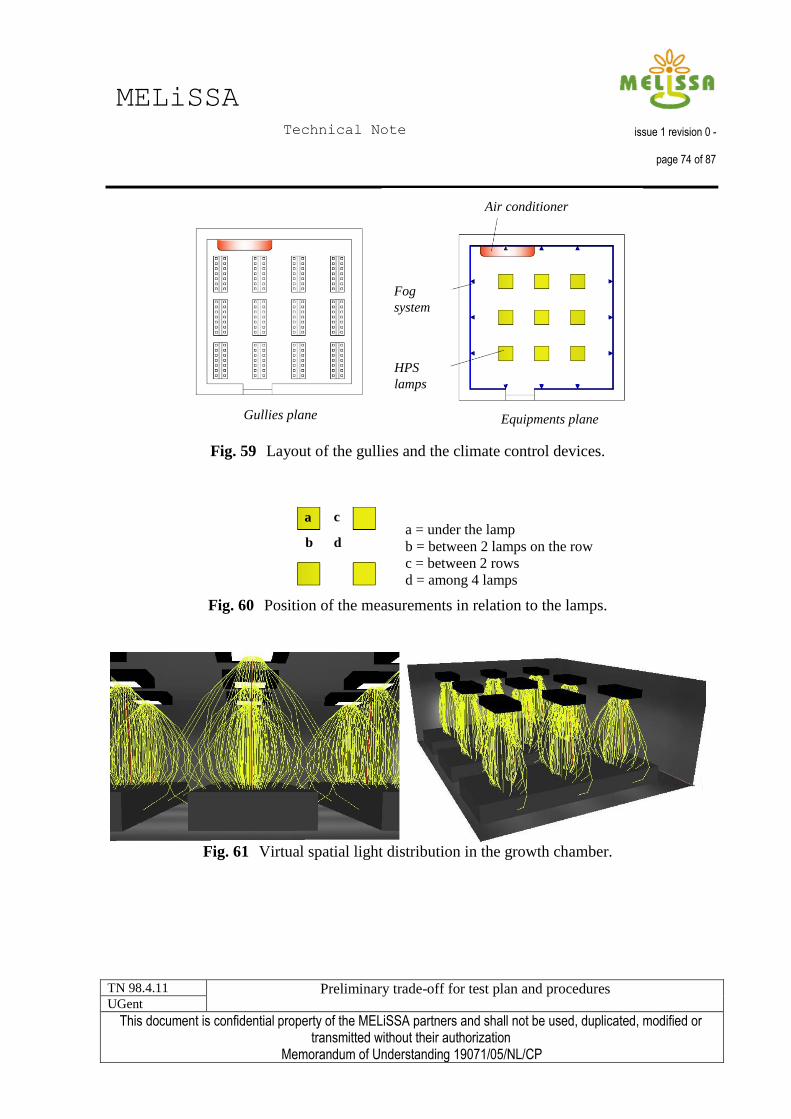
issue 1 revision 0 -
page 74 of 87
TN 98.4.11 Preliminary trade-off for test plan and procedures UGent
This document is confidential property of the MELiSSA partners and shall not be used, duplicated, modified or transmitted without their authorization
Memorandum of Understanding 19071/05/NL/CP
MELiSSA Technical Note
Gullies planeGullies plane
Air conditioner
Fog
system
Equipments plane
HPS
lamps
Air conditioner
Fog
system
Equipments plane
HPS
lamps
Fig. 59 Layout of the gullies and the climate control devices.
a
b
c
d
a
b
c
d
Fig. 60 Position of the measurements in relation to the lamps.
Fig. 61 Virtual spatial light distribution in the growth chamber.
a = under the lamp
b = between 2 lamps on the row
c = between 2 rows
d = among 4 lamps

issue 1 revision 0 -
page 75 of 87
TN 98.4.11 Preliminary trade-off for test plan and procedures UGent
This document is confidential property of the MELiSSA partners and shall not be used, duplicated, modified or transmitted without their authorization
Memorandum of Understanding 19071/05/NL/CP
MELiSSA Technical Note
Tab. 20 Vertical and horizontal light distribution (mol/m2s average of 5 replicates).
Height from the gully
(Distance from the lamp) a b c d
120 (40) 1452 1522 383 586
80 (80) 840 800 785 791
40 (120) 643 742 660 750
0 (160) 574 601 635 636
26.0 26.3
26.2 26.3
26.2
26.0 26.3
26.2 26.3
26.2
Fig. 62 Temperature at the height of the gullies
Tab. 21 Vertical and horizontal temperature distribution (°C; average of 5 replicates)
Height from the gully
(Distance from the lamp) a b c d
120 (40) 25.6 26.2 25.7 26.1
80 (80) 25.7 25.4 25.8 25.7
40 (120) 25.8 26.2 25.9 26.1
0 (160) 25.7 25.5 25.8 26.5
Tab. 22 Vertical and horizontal RH distribution (%; average of 5 replicates). Height from the gully
(Distance from the lamp) a b c d
120 (40) 73.3 69.5 72.0 68.8
80 (80) 72.9 67.1 73.1 67.6
40 (120) 71.4 72.3 70.9 67.1
0 (160) 71.0 67.2 70.9 70.2
The 4 cultivars are randomly distributed over the 12 independent hydroponic units as seen in
Fig. 63.

issue 1 revision 0 -
page 76 of 87
TN 98.4.11 Preliminary trade-off for test plan and procedures UGent
This document is confidential property of the MELiSSA partners and shall not be used, duplicated, modified or transmitted without their authorization
Memorandum of Understanding 19071/05/NL/CP
MELiSSA Technical Note
P
P
A P
A
A R
R
RC
C
CP
P
A P
A
A R
R
RC
C
CP
P
A P
A
A R
R
RC
C
C
Fig. 63 Random distribution of the soybean cultivars in the growth chamber
5.2 Test plan
Given the typical crop cycle duration and on the basis of the previous research experiences of
UNapoli, 15 weeks have been estimated as the expected time to complete a whole growing
cycle. A summary of the measurements schedule is shown in Fig. 64.
5.2.1 Sampling and Measurements
5.2.1.1 Plant growth and physiology
The plant growth and development is measured at 7-day intervals. Growth analysis is based on
non-destructive measurements of plant height, number of lateral shoots and leaves. Plant LA is
estimated by measuring leaf length and width, taking into account the specific leaf shape.
Measurements are carried out on 6 plants per each cultivar (3 plants per gully).
Leaf gas exchanges (stomatal conductance, net photosynthesis and transpiration rate) are
monitored every two weeks by using a portable photosynthesis system (WALZ HCM 1000;
measuring principle: variation of CO2 concentration on the basis of the specific absorbance of
these molecules in the Infra Red waveband; measuring unit: mol CO2 m-2
s-1
). Gas exchange
is studied under the experiment environmental conditions and as a function of light intensity.
Light saturation curves are performed at increasing levels of light intensity (PPFD 0, 50, 100,
250, 1000, 1500 e 2000 mol m-2
s-1
), by using a built-in halogen lamp, keeping constant leaf
chamber conditions (Walz, 1996). Whole plant gas exchange is estimated by up scaling the
leaf net photosynthesis to the estimated plant LA.
On the leaf samples used for the gas exchange measurements, the water status of plant tissues
is determined periodically by additional measurements of stomatal conductance with a
porometer (Leaf Porometer AP4, Delta T Devices, Cambridge; measuring principle: diffusion
conductance rate on the basis of the humidification in the cuvette; measuring unit: stomatal
conductance in mmol m-2
s-1
; measuring range 5.0÷1200 mmol m-2
s-1
; accuracy ±10%) and by
determining the leaf water potential, with a psychrometer working on the dew point method

issue 1 revision 0 -
page 77 of 87
TN 98.4.11 Preliminary trade-off for test plan and procedures UGent
This document is confidential property of the MELiSSA partners and shall not be used, duplicated, modified or transmitted without their authorization
Memorandum of Understanding 19071/05/NL/CP
MELiSSA Technical Note
(PotentiaMeter WP4 Decagon Device; measuring principle: chilled mirror dew point;
measuring unit: negative pressure units MPa). A 12 cm2 leaf sample is required for LWP (WP4
Dewpoint PotentiaMeter Operator‟s Manual, 2000; measuring range 0†-40 MPa; accuracy
±0.1 MPa).
The chlorophyll content is estimated on the basis of leaf greenness, measured by using a
Chlorophyll Meter Konica-Minolta (SPAD 502; measuring principle: optical density
difference at two wavelengths; measuring unit: SPAD units; measuring range 0÷199). For
higher accuracy it is then measured directly by extraction in acetone and spectrophotometetric
determination (Jeffrey and Humphrey, 1975; measuring principle: molecule optical properties
(specific light absorbance); measuring unit: g cm-2
leaf area; g mg-1
leaf dry weight). A 2
cm2 leaf sample is required for the extraction.
All physiological measurements are performed on two fully expanded leaves per plant on three
plants per cultivar.
In addition to the values of air CO2 concentration determined during the gas exchange
measurements, CO2 is measured monthly during a full light and dark period.
5.2.1.2 Water consumption and nutrient uptake
Crop water consumption is calculated on the basis of the water balance of each double gully,
by measuring the volume of the supplied water and nutrient solution, subtracting the amount of
water evaporated from the gully system (minimized by plastic covering, determined in the
absence of plants). The water use efficiency (WUE), as g of biomass per kg of water
consumed, is calculated at the end of the growing cycle.
Concentration of the main macronutrients (NO3-, PO43-, K+) in the recycling solution is
measured weekly during the crop cycle, while more detailed analyses (NO3-, PO43-, K+, Cl-,
Ca2+, Mg2+, SO42-, B3+) are performed at the start (fresh solution), at the end of vegetative
phase (approximately after 7 weeks, nutrient solution exchange) and at the end (harvest) of the
growing cycle. Samples are collected separately for the four cultivars and chemical analyses
are performed with a spectrophotometer Hach DR 4000. Spectrophotometer measurements are
performed on samples of nutrient solution diluted in deionised water, according to the
protocols provided by the manufacturer (Hach, 1995).
The nitrate concentration in the recycling solution is also determined weekly using a portable
reflectometer Nitracheck kit. Samples are read on test reactive strips (Merckoquant) and values
are compared to those from the analytical procedure (measuring principle: colorimetric reading
of reactive strips; measuring unit: mg l-1 or ppm).
Plant tissue analyses are performed twice, at the full vegetative growth and at the harvest stage,
on the different organs (roots, stems, leaves). Organic nitrogen is determined by the Kjeldahl
Method (Kjeldahl, 1883). The main nutrient concentration (N, P, K, Ca, Mg, S, Fe, Cl) is
determined on leaf extract, with a spectrophotometer Hach DR 2000. Analyses are carried out
separately, on the DM of 6 plants per cultivar (3 plants x double gully) samples per organ per
each cultivar, in order to investigate the specific nutrient requirements. DM is measured after
oven-drying at 60°C and until a constant weight is achieved. Spectrophotometer readings are
determined on water extracts according to the protocols provided by the manufacturer (Hach,
1995). Total uptake and nutrient partitioning is calculated for each element and cultivar.

issue 1 revision 0 -
page 78 of 87
TN 98.4.11 Preliminary trade-off for test plan and procedures UGent
This document is confidential property of the MELiSSA partners and shall not be used, duplicated, modified or transmitted without their authorization
Memorandum of Understanding 19071/05/NL/CP
MELiSSA Technical Note
5.2.1.3 Yield performance
Edible/non edible biomass produced per surface, volume and time unit are measured for each
cultivar. Fresh weight, dry weight, % of DM and DM partitioning are measured separately for
the different organs. Balances with ±0.001g sensitivity are used for fresh and dry weight
measurements. On non-edible biomass, cellulose and lignin are determined following
MELiSSA procedures. Plant LA is measured at the harvest using a leaf area meter (LI-COR
3000, LI-COR, Lincoln, NE, USA). The number and the weight of pods and seeds are
measured at the harvest for the different cultivars compared. The volume of the drained
solution (water waste) and the weight and volume of non edible plant tissues (plant waste) are
measured after the harvest.
5.2.1.4 Growth and Efficiency Indexes
The raw data of plant growth is collected in order to follow the time course of the main
parameters (plant height, number of lateral shoots and leaves). At the end of the growing cycle,
the more suitable growth indexes among the following will be calculated on the basis of the
collected data:
- CGR (Crop Growth Rate) = 1/A* (M2-M1)/(T2- T1), where A = leaf area, T1 = start time,
T2 = final time, M1 = plant biomass at T1 (DM), M2 = plant biomass at T2 (DM);
- NAR (Net Assimilation Rate) = 1/(L2-L1)* (M2-M1)/(T2-T1), where T1 = start time, T2
= final time, M1 = plant biomass (DM) at T1, M2 = plant biomass (DM) at T2, L1= plant
leaf area at T1, L2 = plant leaf area at T2;
- HI (Harvest Index) will be calculated at the harvest by dividing the edible DM by the total
DM in order to compare the yield performances of the four cultivars;
- WUE (Water Use Efficiency) expressed as g of edible DM per liter of nutrient solution,
will be calculated by dividing the edible DM production by the cumulative water
consumption;
- RUE (Radiation Use Efficiency), expressed as g of edible DM per mol of PAR, will be
calculated by dividing the edible DM production by the light integral measured at the
harvest at the canopy level.
5.2.1.5 Cultivation system requirements and critical points identification
The experiment is monitored on a daily basis by dedicated personnel. No unattended periods
longer than the night time occur during the tests. Climatic data logger work continuously
during the experimental period in order to detect any atypical value in environmental
parameters.
Based on the sterilisation protocol of seeds (seed certification, seed sterilization), many of the
potential risks related to plant pathogens are reduced. In addition, safety procedures are used in
order to minimize any other risk (preliminary cleaning of all the devices, use of lab coats and
gloves for personnel).

issue 1 revision 0 -
page 79 of 87
TN 98.4.11 Preliminary trade-off for test plan and procedures UGent
This document is confidential property of the MELiSSA partners and shall not be used, duplicated, modified or transmitted without their authorization
Memorandum of Understanding 19071/05/NL/CP
MELiSSA Technical Note
Plant and crop
Growth analysis
Gas exchanges
Water status
Chlorophyll content
Plant tissue analysis
Yield performances
Plant and crop
Growth analysis
Gas exchanges
Water status
Chlorophyll content
Plant tissue analysis
Yield performances
Nutrient concentration (macronutrients)
NO3 concentration
Nutrient concentration (detailed)
Recycling solution
Nutrient concentration (macronutrients)
NO3 concentration
Nutrient concentration (detailed)
Recycling solution
NO3 concentration
Nutrient concentration (detailed)
Recycling solution
Fig. 64 Schedule of the measurements on plant and crop and on nutrient solution.
5.2.2 References of the measuring devices
Portable photosynthesis system (WALZ HCM 1000)
Non destructive measurement
Leaf Porometer (AP4 Delta T Devices)
Non destructive measurement
Psychrometer (PotentiaMeter WP4 Decagon Device)
Destructive measurement
Chlorophyll Meter (Konica-Minolta SPAD 502)
Non destructive measurement
Leaf Area Meter (Li-Cor 3100, Li-Cor, Lincoln, NE, USA)
Destructive measurement Spectrophotometer (HACH DR 4000)
Destructive measurement

issue 1 revision 0 -
page 80 of 87
TN 98.4.11 Preliminary trade-off for test plan and procedures UGent
This document is confidential property of the MELiSSA partners and shall not be used, duplicated, modified or transmitted without their authorization
Memorandum of Understanding 19071/05/NL/CP
MELiSSA Technical Note
Portable Reflectometer (Nitracheck kit) Analytic Balance (ORMA mod. BC)
5.2.3 References
Hach, 1995. HACH DR 4000-U Spectrophotometer Handbook. Hach Company, Loveland, Colorado
(USA).
Hach, 1997. HACH DR 2000 Spectrophotometer Handbook. Hach Company, Loveland, Colorado
(USA).
Hoagland D. R. and Arnon D. I., 1950. The water-culture method for growing plants without soil.
College of Agriculture, Univ. of California, Berkeley, California, USA, Circular 347, 32 pp.
Jeffrey. S. W., Humphrey. G. F., 1975. New spectrophotometric equations for determining chlorophylls
a, b, c1 and c2 in higher plants, algae and natural phytoplankton. Biochem. Physiol. Pflanz. 167:
191-194.
Kjeldahl J., 1883. A new method for the determination of nitrogen in organic matter. Z. Anal. Chem. 22:
366.
Mackowiak C. L., Stutte G. W., WheelerR.M., Ruffe L. M., Yorio N. C., 1999. Tomato and soybean
production on a shared recirculating hydroponic system. Proc. Int. Sym. Growing Media and
Hydroponics. ED. A.P. Papadopoulos. Acta Hort. 481, ISHS: 259-266.
Martìnez-Villaluenga C., Yu-Haey K., Lambein F., Frìas J., Vidal-Valverde C., 2006. Kinetics of free
protein amino acids, free non-protein amino acids and trigonelline in soybean (Glycine max L.) and
lupin (Lupinus angustifolius L.) sprouts. Eur Food Res Technol, 224: 177-186.
Prosky L., Asp N.F., Schweizer T.F., De Vries J.W., Furda I., 1998. Determination of insoluble and total
dietary fiber in food and food products. J.A.O.C.S., 71: 1017-1023.

issue 1 revision 0 -
page 81 of 87
TN 98.4.11 Preliminary trade-off for test plan and procedures UGent
This document is confidential property of the MELiSSA partners and shall not be used, duplicated, modified or transmitted without their authorization
Memorandum of Understanding 19071/05/NL/CP
MELiSSA Technical Note
Strayer R.F., 1994. Dynamics of microorganism populations in recirculating nutrient solutions. Adv.
Space Res., 14: 357-366.
Walz GmbH, 1996. Portable Photosynthesis System HCM-1000. Software version 1.01. Heinz Walz
Ed. Eichenring 6 – D-91090 Effeltrich (Germany).
Weeler R.M.,Corey K.A., Volk G.M., Mackowiak, C.L., Yorio N.C., Sager J.C., 2004. Soybean canopy
gas exchange rates: effects of lighting. Eco-Engineering, 16 (3): 209-214.
Wheeler R.M., Mackowiak C.L., Stutte G.S., Yorio N.C., Ruffe L.M., Sager J.C., Prince R.P., Knott
W.M., 2008. Crop productivities and radiation use efficiencies for bioregenerative life support. Adv.
Space Res., 41: 706-713.
WP4 Dewpoint PotentiaMeter Operator’s Manual, 2000. Decagon Devices Inc. 950 NE Nelson CT.
Pullman, WA – USA.
5.3 Seed and product analysis
5.3.1 Dry mass
Dry mass is calculated as percentage difference between fresh weight and weight after
desiccation in an oven set to 60°C.
5.3.2 Fat content
Fat content is determined gravimetrically using the Soxhlet method.
-5 g of dry sample is placed inside a thimble made from thick filter paper, which is then
-The thimble is loaded into the main chamber of the Soxhlet extractor (Bicasa Mod. BE 53).
-Ethyl ether is used as the extraction solvent.
-Fat content is expressed as percentage on fresh weight or dry mass.
5.3.3 Protein content
Protein content is determined by Kjeldahl method (Kjeldahl, 1883 using a digestor (DK20
Healding Digester, VELP SCIENTIFICA) and a distillation unit (UDK 140, VELP
SCIENTIFICA).
Titration of released ammonia allows calculation of nitrogen percentage and protein content
using a conversion factor of 5.70 for soybean proteins.
5.3.4 Fibre content
Total dietary fibre is determined using AOAC method 985.29.
1 g of defatted sample is melted in 40 ml Tris Buffer Mes 0.05 mM pH 8.2 inside a crucible.

issue 1 revision 0 -
page 82 of 87
TN 98.4.11 Preliminary trade-off for test plan and procedures UGent
This document is confidential property of the MELiSSA partners and shall not be used, duplicated, modified or transmitted without their authorization
Memorandum of Understanding 19071/05/NL/CP
MELiSSA Technical Note
The sample, with 50 µL α- amylase is heated held at 100°C for 35 min in order to obtain
gelatinization, hydrolysis and depolymerisation of starch.
After cooling to 63°C, 100 µL protease is added and the solution is heated again at 100°C for
30 min in order to obtain melting and depolymerisation of protein. The reaction is stopped
with 5 ml HCl and the pH is adjusted to 4.1/4.8.
200 µL amino- glucosidase is added and the solution is heated to 60°C for 30 min in order to
obtain hydrolysis of starch fragments to glucose.
300 ml ethanol at 60 °C is added and the solution is left in the extraction for 1 h in order to
precipitate soluble fibre and eliminate protein and glucose. The solution is filtered and the
residual is washed 3 times with 25 ml 78% ethanol, 2 times with 10 ml 100% ethanol and 2
times with acetone.
The crucible with extracted fibres is put in stove at 103 °C for 12 hours and is then weighed:
dry residual (R).
Then the crucible is put in a muffle furnace (505 °C) for 5 h and is then weighed. Based on
that, the amount of ashes is calculated.
Total dietary fibre (TDF) is calculated as follows:
TDF= {[R-(p+A)/100*R]-W}/M*100
where:
M = sample weight
R = dry mass of M
A = ashes of M
p = protein in R
W = white = WR-WP-WA
WR = dry mass in white
WA = ashes in white
WP = protein in white
5.3.5 Carbohydrate content
Total amount of carbohydrates are determined as difference from dry mass.
5.3.6 Phytic acid analysis
The method described by Ishiguro et al (2003) will be used.
In order to extract phytic acid from soybeans, 0.5 g of milled seeds are mixed in 10 ml of 0.5
M HCl and shaken for 1 h at room temperature, followed by centrifugation for 6 min at 18000
x g. The supernatant is then analysed as detailed below. For soymilk samples the extraction
step is not necessary.
0.9 mL of sample is mixed with the same volume of 6% trichloroacetic acid (TCA) solution
containing 20% sodium sulphate. The mixture is allowed to settle for 20 min at room
temperature and centrifuged at 8000 x g for 3 min. The supernatant (1.0 ml) is mixed with a
half volume (0.5 ml) of FeCl3 solution (0.2 % Fe in 0.5 M HCl). The mixture is incubated in a

issue 1 revision 0 -
page 83 of 87
TN 98.4.11 Preliminary trade-off for test plan and procedures UGent
This document is confidential property of the MELiSSA partners and shall not be used, duplicated, modified or transmitted without their authorization
Memorandum of Understanding 19071/05/NL/CP
MELiSSA Technical Note
water bath at 97°C (Grant W14) for 90 min, cooled at room temperature and then centrifuged
at 1000 x g for 6 min. The precipitate is dispersed into 1.0 ml of washing solution containing
0.6 % HCl and 2.5% Na2SO4 and then centrifuged at 1000 x g for 6 min. The precipitate is
dissolved in 1.0 ml of 0.9 N HCl.
The iron content is measured by the o-phenantholine method:
1 ml of 10% hydroxylamine is added to the mixture; after 5 min, 5 ml of 0.25 % o-
phenantholine
is added and the volume is adjusted to 50 ml. After 5 min the absorbance at 510 nm is read by
the spectrometer UV/ VIS LAMBDA 10 Perkin Elmer.
Phytate reference solution for a standard calibration is prepared by dissolving phytic acid
calcium salt (Sigma Aldrich) in HCl 0.1 N.
The result of the spectrophotometric analysis (absorbance value) is converted in phytic acid
concentration. Calibration range is 0.500÷0.063 ppm.
Accuracy of the method is estimated based on the mean percentage of error of the measured
concentration (ConM) to the theoretical concentration (ConT) according to this equation:
Bias (%) = [(ConT-ConM)/ConT] x 100
The accuracy was always well below the 10%
5.3.7 Isoflavones analysis
The method described by Otieno et al (2007) is used. The extraction of isoflavones from
soymilk is carried out with a mixture 70% MetOH (1 g of dried and milled seeds in 30 ml and
0.5 g of frozen-dry soymilk in 25 ml of mixture) for 30 min at room temperature in an
ultrasonic bath. The mixture is then centrifuged and the supernatant analyzed.
The first step of identification is performed by LC/MS/MS as it is currently the most sensitive
and selective analytical method for rapid qualitative and quantitative analysis.
The isoflavones have been found to produce characteristic radical ions; product ion fragment
reveale unique fragmentation pathways for each isoflavone compounds, so characteristic
fragmentation of different isoflavones can be unequivocally identified and differentiated.
Information about production ion for soy isoflavones are obtained from Otieno et al. (2007).
An HPLC apparatus equipped with two Micropumps Series 200 (Perkin Elmer, Shellton, CT,
USA), an UV/VIS series 200 (Perkin Elmer, Shellton, CT, USA) detector set at 280 nm and a
Prodigy ODS3 100 Å column (250 x 4.6 mm, particle size 5 µm) (Phenomenex, CA, USA) are
used. The eluents are: A water 0.2% formic acid; B acetonitrile/methanol (60:40 v/v). The
gradient program is as follows: 20-30% B (6 min), 30-40% B (10 min), 40-50% B (8 min), 50-
90% B (8 min), 90-90% B (3 min), 90-20% B (3 min) at a constant flow of 0.2 mL/min. The
LC flow is split and 0.8 mL/min is sent to the mass spectrometry. Injection volume is 20 µL.
MS and MS/MS analyses of were performed on an API 3000 triple quadrupole mass
spectrometer (Applied Biosystems, Canada) equipped with a TurboIonspray source working in
the positive ion mode.
6 glucosides (daidzin, genistin, glycitin, acetyl-genistin, malonyl-daidzin, malonyl-genistin)
and only one aglycone (genistein) were identified (Tab. 23).

issue 1 revision 0 -
page 84 of 87
TN 98.4.11 Preliminary trade-off for test plan and procedures UGent
This document is confidential property of the MELiSSA partners and shall not be used, duplicated, modified or transmitted without their authorization
Memorandum of Understanding 19071/05/NL/CP
MELiSSA Technical Note
Tab. 23 Characterization of isoflavones present in soybean and soymilk extracted
Compound Precursor ion [M-H+]
(m/z)
Product ion
Genistein 271 243
215
187
Daidzin
417 199
255
Genistin
433 215
271
Glycitin 447 285
Acetyl-genistin 475 431
417
Malonyl-daidzin 503 417
Malonyl-genistin 519 433
In the second step of quantification, filtered extract (20 μL) is injected into an HPLC
(Shimadzu LC 10, Shimadzu, Kyoto, Japan) with a photodiode array detector.
Instrumental characteristics are the following:
- Accuracy of flow rate setting ±2%
- Precision of flow rate ±03%
- Pressure setting accuracy ±10%
- Pressure indication accuracy ±2%.
Separation is achieved on a Phenomenex column (C18 prodigy 5μ ODS3 100A size 250x 4.60
nm). Elution is performed using water and formic acid 0.2% (A) and HPLC-grade
acetonitrile/methanol (60:40 v/v) (B) as the mobile phases, on a gradient starting with 20% B
in A to reach 30% B at 6 min, 40% B at 16 min, 50% B at 24 min, 90% B at 32 min, 90% B at
35 min, and 20% B at 38 min. The flow rate is 0.8 mL/min, and chromatograms are recorded
at 280 nm.
Flavonoids are first identified and confirmed by an LC/MS/MS analysis and then quantified
(LC with diode array UV/VIS detector) using, as external standard genistein and genistin for
all glucosides.
Genistein stock solution is prepared by dissolving standard (Sigma Aldrich) in methanol while
genistin stock solution is prepared by dissolving standard (Sigma Aldrich) in a mixture
MetOH/H2O 70/30.
Results of chromatographic analysis (see Fig. 65) expressed as peak area, are converted into
concentrations. Calibration range is 1÷50 ppm for genistein and 15÷250 ppm for genistin.
Accuracy of the method is estimated based on the mean percentage of error of the measured
concentration (ConM) to the theoretical concentration (ConT) according to this equation:
Bias (%) = [(ConT-ConM)/ConT] x 100
The accuracy is around 5%

issue 1 revision 0 -
page 85 of 87
TN 98.4.11 Preliminary trade-off for test plan and procedures UGent
This document is confidential property of the MELiSSA partners and shall not be used, duplicated, modified or transmitted without their authorization
Memorandum of Understanding 19071/05/NL/CP
MELiSSA Technical Note
(1: daidzein – 2: glicitin – 3:genistin – 4:malonyl-daidzin 5: malonyl-genistin 6:acetyl-genistin
7:genistein)
Fig. 65 A typical liquid chromatograph.
5.3.8 Analysis plan
For every cultivar, 3 sampling * 2 repetitions are performed.
Summarising a dry mass and phytic acid analysis on fresh soybeans (or soymilk) is performed.
Furthermore, the dry mass and phytic acid analysis on dry mass is done.
Tab. 24 shows the amount of beans, we need for every analysis and in total.
Tab. 24 Amount of soybeans, we need for every analysis and in total.
Analysis Amount (DW) Amount (FW)
Dry mass 50 g fresh weight
Protein content 5 g of dry samples
Fat content 1 g of dry samples
Fiber content 1 gr (defatted sample)
Phytic acid content 0.5 g fresh weight
Isoflavavones profile 1 g of dry samples
Tot. amount 7 g of dry mass 50.5 g fresh weight
1
2
3
4
5
6
7

issue 1 revision 0 -
page 86 of 87
TN 98.4.11 Preliminary trade-off for test plan and procedures UGent
This document is confidential property of the MELiSSA partners and shall not be used, duplicated, modified or transmitted without their authorization
Memorandum of Understanding 19071/05/NL/CP
MELiSSA Technical Note
5.3.9 References of the measuring devices
All measurements are destructive. Soxhlet extractor (BICASA mod BE 53) DK 20 Heating Digester VELP SCIENTIFICA
UDK 140 Distillation Unit VELP SCIENTIFICA Thermostat bath (GRANT W14)
Spectrometer UV/ VIS (LAMBDA 10 Perkin Elmer) Micropumps Series 200 (Perkin Elmer)
API 3000 triple quadrupole mass spectrometer (Applied
Biosystems) HPLC (Shimadzu LC 10, Shimadzu)
issue 1 revision 0 -
page 87 of 87
TN 98.4.11 Preliminary trade-off for test plan and procedures UGent
This document is confidential property of the MELiSSA partners and shall not be used, duplicated, modified or transmitted without their authorization
Memorandum of Understanding 19071/05/NL/CP
MELiSSA Technical Note
5.3.10 References
Ishiguro T., Ono T., Nakasato K., Tsukamoto C. & Shimada S. (2003). Rapid measurement of pyhate in
raw soymilk by Mid-infrared spectroscopy. Biosci. Biotechnol. Biochem, 64:752-757.
Kjeldahl J., 1883. A new method for the determination of nitrogen in organic matter. Z. Anal. Chem. 22:
366.
Otieno D., Rose H. & Shah N. (2007) Profiling and quantification of isoflavones in soymilk from soy
protein isolate using extracted ion chromatography and positive ion fragmentation tecniques. Food
chemistry, 105, 1642-1651.
Prosky L., Asp N.G., Schweizer T.F., De Vries J.W. & Furda I. (1998). Determination of insoluble,
soluble and total dietary fiber in food and food products. J. AOCS, 71, 1071-1023.


