Embed Size (px)
Citation preview

This article was downloaded by:[NEICON Consortium][NEICON Consortium]
On: 26 January 2007Access Details: [subscription number 762905488]Publisher: Taylor & FrancisInforma Ltd Registered in England and Wales Registered Number: 1072954Registered office: Mortimer House, 37-41 Mortimer Street, London W1T 3JH, UK
Molecular PhysicsAn International Journal in the Field of ChemicalPhysicsPublication details, including instructions for authors and subscription information:http://www.informaworld.com/smpp/title~content=t713395160
Estimate of ionicity of zeolite NaA using the frequencyshift values of physisorbed molecular hydrogenAlexander V. Larin
To link to this article: DOI: 10.1080/00268979650025911URL: http://dx.doi.org/10.1080/00268979650025911
Full terms and conditions of use: http://www.informaworld.com/terms-and-conditions-of-access.pdfThis article maybe used for research, teaching and private study purposes. Any substantial or systematic reproduction,re-distribution, re-selling, loan or sub-licensing, systematic supply or distribution in any form to anyone is expresslyforbidden.The publisher does not give any warranty express or implied or make any representation that the contents will becomplete or accurate or up to date. The accuracy of any instructions, formulae and drug doses should beindependently verified with primary sources. The publisher shall not be liable for any loss, actions, claims, proceedings,demand or costs or damages whatsoever or howsoever caused arising directly or indirectly in connection with orarising out of the use of this material.© Taylor and Francis 2007

Dow
nloaded By: [NEIC
ON
Consortium
] At: 17:22 26 January 2007
M o l e c u l a r P h y s i c s , 1996, V o l . 88, N o . 5, 1399 ± 1410
Estimate of ionicity of zeolite NaA using the frequency shift values of
physisorbed molecular hydrogen
By ALEXANDER V. LARIN
Department of Chemistry, Moscow State University, Leninskie Gori, Moscow,
B-234, 119899 , Russia
and EVELYNE COHEN DE LARA
Departement de Reshershes Physiques, Laboratoire associe au CNRS, Universite
Pierre et Marie Curie, 4, place Jussieu Tour 22, 75252 Paris Cedex 05, France
(Recei Š ed 2 June 1994 ; re Š ised Š ersion accepted 7 August 1995)
An estimate of the ionicity of the zeolite NaA is given. It is based on the® tting of the frequency shift value of the fundamental vibrational transition in
physisorbed molecular hydrogen. The interaction energy U is calculated by
ion± molecule pairwise addition with the ions of the zeolite. Frequency shiftvalues are calculated as a displacement of vibrational levels of the fundamental
transition due to the interaction of hydrogen with the zeolite. The level positions
are calculated by integration of the Schro$ dinger vibrational equation. Thecontributions to the total frequency shift value of a hindered rotation and of a
centre of mass vibration are estimated. The in¯ uence of the zeolite parameters
on the resulting ionicity is discussed.
1. Introduction
The calculation of adsorbate± adsorbent interaction requires information on the
charges of the ions of an adsorbent. These charge values can be estimated from
spectroscopic experimental data. An example of such an application to the intensities
of the fundamental transition band in the IR spectra of adsorbed N#
was given in [1].
However, the intensity interpretation requires an estimate of the molecular position on
or inside the adsorbent. As a result, preliminary analysis of the interaction energy (IE)
with the adsorbent is required.
The charges may be found by step-by-step application of all possible experimental
data. The initial chose of a charge distribution based on the frequency shift values
D mv« Õ v
has the advantage that it is related to the restriction on the IE by the `frequency
shift ® IE ’ relation (1) shown for H#
in [2] :
D mv« Õ v
F U( qv« ) ® U( q
v) (1)
where U( q ) is the interaction energy with respect to internuclear distance q . So a
charge distribution is chosen, ® tting ® rst the frequency shift (FS) values to the
experimental ones. FS calculations may be done for H#
via the Buckingham method
[3, 4] or by numeric solution [2]. As a preliminary stage, a simpli® ed method (1) [2] may
be recommended.
In this paper two problems are studied. The ® rst is related to the contributions to
the frequency shift calculation from a shift of the rotational levels and from a shift of
the levels of the vibrational motions of the molecular centre of mass relative to the
0026± 8976 } 96 $12 ± 00 ’ 1996 Taylor & Francis Ltd

Dow
nloaded By: [NEIC
ON
Consortium
] At: 17:22 26 January 2007
1400 A. V. Larin and E. Cohen de Lara
zeolite. These contributions are estimated. The second is related to the ionicity
estimation by the method used
(the ionicity :
q!
¯ (2 } 3) q(NaI) (1 } 4) q(Na
II) (1 } 12) q(Na
III) q(Si) q(Al)
¯ r q(OI) q(O
II) 2q(O
III) r , or if q(Na
I) ¯ q(Na
II)
¯ q(NaIII
) then q!
¯ q(Na) q(Si) q(Al)).
The in¯ uence of the choice of the parameters of charge dependence of the ionic
polarizabilities and radii on the resulting charge distribution is presented.
2. Theoretical model
When a molecule is adsorbed the interaction U( q ) with the adsorbent leads to a
displacement of the vibrational levels E gv
! E av. The levels may be found numerically
via the solution of the Schro$ dinger vibrational equation with potentials V!
and V! U
respectively, where V!
is the internal vibrational energy of the free molecule. The
details of the solution have been presented [2, 4]. The shift contributions come from the
diŒerences of the energy levels of a hindered rotor ( D m " , u ) and of the molecular centre
of mass vibrations ( D mR) in the upper and lower states of the intramolecular vibrational
transition Š ® Š « :
D mv« Õ v
¯ (E av« ® E a
v) ® (E g
v« ® E gv) D m " , u D m
R. (2)
Previously, these contributions were shown to be small by applying the harmonic
approximation for the motions [5]. The advanced approximations applied for the
D m " , u , D mR
calculations are described below.
2.1. Hindered rotation additions to the shift Š alue
One may compare the inherent energy of molecular rotational motion (close to the
value of rotational constants B F 60 cm Õ " for hydrogen) with the frequency of the
intramolecular (or internal) vibration (near to 4200 cm Õ " [6]). These values show that
during the period of the relatively slower rotation of the molecular axis, the molecule
vibrates many times. One may suppose that the Born± Oppenheimer approximation
for the separation of the rotation and intramolecular vibration in reasonable.
The structure of the rotational levels is found by a variational procedure based on
approach [7] and implemented as a computer program for the solution of the
eigenvalues ev,k,p,q
of the equation
9 1
sin "
¥¥ " 0 sin "
¥¥ " 1
1
sin "
¥ #¥ u #
U v( " , u ) ® ev,k,p,q: r Š , k, p, q ª ¯ 0, (3)
where r Š , k, p, q ª is the vibrational ± rotational function, Š is the intramolecular
vibration quantum number, k is the number of a rotational state with the same
quantum numbers p ¯ ( ® 1)J, q ¯ ( ® 1) rm
r , J is the angular rotational momentum, m
is the projection of J on the OZ axis of the local (molecular centre of mass) coordinate
system, and u and " are the coordinates corresponding to the molecular axis rotation
in two planes, the ® rst parallel ( u ) and the second perpendicular ( " ) to the OXY plane
of the local coordinate system. The latter is taken with the OZ axis oriented along the
centre of mass vector Rm
. The OX axis is oriented parallel to the OXY plane of the
coordinate system of the central cage.

Dow
nloaded By: [NEIC
ON
Consortium
] At: 17:22 26 January 2007
Estimate of ionicity of zeolite NaA 1401
The two-dimensional hindered rotor model (4) [7, 8] is used in this paper :
U v( " , u ) ¯ kv
cos # " lv
(1 ® cos 2 u ). (4)
This rotational potential was shown to yield a successful solution for ortho± para
separation of H#
on the zeolite Na" #
A (or NaA) [9] and for the torsional structure of
the electronic transition band in the N#± C
’H
’cluster (when cos 6 u in equation (4)) [10].
Transitions between the most populated the lowest rotational states correspond to
( r 0, 1, 1, 1 ª % r 1, 1, 1, 1 ª ) for para-H#
( p-H#) and ( r 0, 1, ® 1, ® 1 ª % r 1, 1, ® 1, ® 1 ª ) for
ortho-H#
(o-H#). The respective shift of the rotational levels is as follows :
D m " , u ¯1
23
4
e" , " , Õ " , Õ "
® e! , " , Õ " , Õ "
e" , " , " , "
® e! , " , " , "
for o-H#,
for p-H#.
(5)
2.2. Additions from external Š ibration to the total shift Š alue
In the adsorbed state on the zeolite the translational motions of the free molecule
transform into one vibration of the molecular centre of mass along radial coordinate
R (external vibration) and two hindered motions over the angular coordinates h , U
related to the centre of the unit cell (UC) [9].
The characteristic energies of the internal (near 4200 cm Õ " [6]) and external (near
200 cm Õ " , see [9]) vibrations are su� ciently distinguished. During the period of the
relatively slow external vibration the molecule vibrates many times with respect to the
intramolecular distance. Hence, the Born± Oppenheimer assumption of the separation
of the H#
internal and external vibrations in quite reasonable.
The external vibration level positions are found by solving equation (6) :
9 ® 1
2M
¥ #¥ R #
U v(R) ® EvvR : r Š , Š R ª ¯ 0, (6)
where M ¯ (m Õ " M Õ "z
) Õ " is the reduced mass of a molecule with mass m and the
zeolite with mass Mz, and U v(R) is the interaction with respect to radial coordinate R .
The centre of mass of the zeolite crystal is supposed to be at the centre of the central
zeolite cage. The potential U v(R) for vibration of the molecular centre of mass was
calculated assuming a ® xed molecular axis (i.e. ® xed angles " , u ). Here " and u
correspond to an energetically favourable position due to large rotational barriers kv
and lv
[9].
D mR
appears from the diŒerences between the zero point energies of external
vibration of H#
relative to the zeolite fragment in the diŒerent states of intramolecular
vibration ( Š ¯ 0, 1) :D m
R¯ E "
!® E !
!, (7)
where the upper index Š of the eigenvalues E vvR
is related to the state of the
intramolecular vibration.
As to angular h and U motions of the molecular centre of gravity, the respective ® ne
structure was not resolved experimentally and is not discussed here. A discussion of
the corresponding model was given in [9].
2.3. Estimate of the interaction Š alue
Using the relations deduced above one can estimate the zero point energy of H#adsorbed in each Š state :
Uzp,v
¯ ev, " ,p,q
E v!. (8)

Dow
nloaded By: [NEIC
ON
Consortium
] At: 17:22 26 January 2007
1402 A. V. Larin and E. Cohen de Lara
The average interaction Ua,v
of H#
adsorbed in a given Š state is
Ua,v
¯ Uv U
zp,v¯ U
v e
v, " ,p,q Ev
!, (9)
where Uv¯ E a
v® E g
v. The average interaction at small coverages is determined by the
most energetic site, provided that the temperature is su� ciently low. Then the value
Ua, !
may be compared with the value © U ª estimated from known isosteric heat
adsorption Qst
[11, 12] :
© U ª ¯ kT ® Qst
, (10)
taking into account the negative sign of the interaction used in this paper.
3. Results and discussions
3.1. The molecular position
Previous information on the zeolite spatial ionic coordinates and the characteristics
of hydrogen was given in [2] and [9]. The electrostatic, inductive, dispersive and
repulsive components of the interaction are taken into account [2]. Two features
distinguish the IE calculation in this paper from previous ones [2, 9, 13]. (1) The IE
convergence for the Fm3c model of the zeolite was shown to correspond to 27
surrounding a cages (see table 1). The same test for the Pm3m model corresponded to
seven cages [14]. The diŒerence is related to the asymmetric positions of Na+III
ions in
the a cages. (2) The q(Al) } q(Si) relation was taken as 0 ± 575 instead of 0 ± 975. This
corresponds to the charge relation found for Al (0 ± 46) and Si (0 ± 80) in Na$AlO
$and
Na#SiO
$, respectively [15]. The new value of the ratio does not change the IE value
appreciably (less than 1 %). It is a formal value, concerning the IE or the frequency
shift calculation.
After considering these corrections, we have nearly the same IE surface as that
found in [2] and [9]. The two deepest wells occur near to the C$
axes ( " ¯ 0 ± 304 p
(0 ± 696 p ) rad, u ¯ 1 ± 25 p rad) closest to the Na+III
ion. The coordinates of the molecular
centre of mass related to the spherical coordinates of the central cavity are given in
table 2 for some models of the zeolite. Coordinates " and u of the minimuma depend
slightly on the model used. The orientation of the molecular axis for all cases coincides
with the OX axis ( " ¯ p } 2, u ¯ 0) of the local coordinate system. Both these points are
the most probable adsorption centres at the temperature of spectroscopic meas-
urements (77 K [16], 90 K [17]). Thus, the FS values are sought when H#
is localized
on one of these sites.
3.2. Hindered rotation and external Š ibration additions to shift Š alue
Before studying the in¯ uence of the zeolite parameters on the resulting FS one
should discuss the precise method of the FS calculation. Do D m " , u and D mR
contribute
enough to the total FS (equation (2)) ? To answer the question an estimate of the
respective FS components (equation (2)) is needed.
To ® nd D m " , u the rotational barriers kv
and lv
of the potential (equation (4)) are
calculated by approximations of two interaction surfaces, when Š ¯ 0 and 1 (see table
3). In accordance with the separation in the intramolecular vibration and other
motions (see sections 2.1 and 2.2), the internuclear distances are taken as ® xed diŒerent
values qvkpq
¯ qvk« p« q« ¯ q
veither for the diŒerent rotational states r Š , k, p, q ª , or for the
diŒerent external vibration states r Š , Š R ª . The values of the average distances are found

Dow
nloaded By: [NEIC
ON
Consortium
] At: 17:22 26 January 2007
Estimate of ionicity of zeolite NaA 1403
Table 1. The minima positionsa for the diŒerent ionicities of the zeolite (q(Na) ¯ 0 ± 7, q(OI) ¯
q(OII
) ¯ q(OIII
)).
q!} eb ® 10 $ U } E
hc R } a
!d U } p h } p
0 ± 7 8 ± 169 7 ± 10 1 ± 27 0 ± 32
2 ± 0 7 ± 139 7 ± 00 1 ± 27 0 ± 323 ± 0 6 ± 501 6 ± 88 1 ± 27 0 ± 32
4 ± 0 5 ± 887 6 ± 72 1 ± 27 0 ± 32
5 ± 0 5 ± 258 6 ± 48 1 ± 26 0 ± 326 ± 0 4 ± 677 6 ± 10 1 ± 26 0 ± 33
7 ± 0 4 ± 205 5 ± 64 1 ± 26 0 ± 34
7 ± 0e 4 ± 214 5 ± 60 1 ± 264 0 ± 3457 ± 7 3 ± 912 5 ± 38 1 ± 26 0 ± 35
a The minimum was found on the R± h ± U grids with the steps
0 ± 02 a!
(R), 0 ± 02 rad ( h , U ), except case e.
b 1 e E 1 ± 602 18 ¬ 10 Õ " * C.
c 1 Eh
E 4 ± 359 75 ¬ 10 Õ " ) J.
d 1 a!
E 5 ± 291 77 ¬ 10 Õ " " m.
e The respective steps along h , U were 0 ± 005 rad.
Table 2. Convergence of the interaction energy for the diŒerent numbers of the a cagesconsidered (q
!¯ 3 ± 9, q(Na) ¯ 0 ± 7, q(O
I) } q(O
II) ¯ 0 ± 7143, q(O
III) } q(O
II) ¯ 1 ± 0).
® 10 $ U } Eh
Na+III
ion positionNumber of
cages Case 1 Case 2
1a 5 ± 641 5 ± 747
7 6 ± 081 6 ± 143
27 4 ± 828 5 ± 71033 4 ± 829 5 ± 712
41 4 ± 829 5 ± 712
a The ions Na+III
of the nearest seven cages were also considered.
by numerical evaluation of © Š r q r Š ª } © Š r Š ª , where the r Š ª are calculated by the
LEVELS program. Values of qv
thus found are equal to 1 ± 4475 and 1 ± 5444 a!
for Š ¯ 0
and Š ¯ 1 (as compared to the values 1 ± 4476 and 1 ± 5508, correspondingly, obtained
in [18]). Respective rotational constants Bv
are given in table 3.
An additional test of the rotational energy level positions comes from the
experimental values of the band splitting [17]. The diŒerence of the energy variations
of the lowest rotational states of o-H#
and p-H#
(curves 2 and 3 in ® gure 1, respectively)
with Š (equation (5)) may be interpreted as the band splitting value (curve 4). Its
comparison permits also an analysis of the zeolite models corresponding to the
diŒerent q(Na) values (® gure 1). Sodium ions are the closest ones to the molecule.
Their charge variation markedly changes the ® eld gradient± quadrupole interaction.
The latter was shown [19] to be the reason for the hindered rotation in adsorbed state.
Increase of the kv
and lv
barriers (4) with q(Na) changes appreciably the band splitting.
The latter agrees with observed splitting ( ® 5 ³ 1 cm Õ " , [17]) when the q(Na) ranges
from F 0 ± 6 to F 0 ± 7 e. As a result, q(Na) ¯ 0 ± 7 e was chosen for the basic model (E in
table 5) here to study the zeolite parameters’ in¯ uence.

Dow
nloaded By: [NEIC
ON
Consortium
] At: 17:22 26 January 2007
1404 A. V. Larin and E. Cohen de Lara
Table 3. The ionicity dependence of the energies of the lowest rotational states of the
rotational barriers kv
and lv, and of the lowest external vibrational states E v
!(see equation
(6)) of H#
in vibrational states Š ¯ 0, 1.
Lowest
rotationalstate } cm Õ "
Š q!} e o-H
#p-H
#kv} B
va l
v} B
vE v
!} cm Õ "
0 0 ± 7 283 ± 8 261 ± 0 3 ± 6 5 ± 8 160 ± 82 ± 0 283 ± 2 260 ± 2 3 ± 5 5 ± 8 144 ± 93 ± 0 295 ± 2 273 ± 2 3 ± 5 6 ± 5 126 ± 24 ± 0 291 ± 1 268 ± 8 3 ± 5 6 ± 2 111 ± 85 ± 0 282 ± 2 259 ± 1 3 ± 4 5 ± 8 97 ± 86 ± 0 272 ± 5 248 ± 0 3 ± 2 5 ± 4 86 ± 67 ± 0 261 ± 6 235 ± 0 3 ± 1 4 ± 9 84 ± 07 ± 7 251 ± 5 222 ± 5 3 ± 1 4 ± 4 83 ± 5
1 0 ± 7 277 ± 8 260 ± 1 4 ± 5 7 ± 3 155 ± 57 ± 7 246 ± 2 226 ± 0 3 ± 9 5 ± 5 80 ± 7
a B!¯ 2 ± 559 ¬ 10 Õ % au, B
"¯ 2 ± 283 ¬ 10 Õ % au.
q(Na)/e
Dv/
cm±
1
Figure 1. Experimental band splitting ® 5 ³ 1 cm Õ " [17] (line 1) and FS addition. Lines, 2, 3,
the `rotational ’ shifts (equation (5)) of o-H#
and p-H#, respectively. Line, 4, value of the
band splitting ( e" , " , Õ " , Õ "
® e! , " , Õ " , Õ "
® e" , " , " , "
e! , " , " , "
). Line 5, the external vibration shift
(equation (7)).
The absolute value of the frequency shift contribution from external vibration (7)
does not exceed 6 cm Õ " over the whole range of the ionicity. This contribution is shown
to decrease with the ionicity due to the smaller interaction values for higher ionicities
(from 5 ± 3 to 2 ± 8 cm Õ " at ionicities 0 ± 7 and 7 ± 7, respectively). The results of the solutions
of the external vibration equation (6) are tested with respect to the number of points

Dow
nloaded By: [NEIC
ON
Consortium
] At: 17:22 26 January 2007
Estimate of ionicity of zeolite NaA 1405
Table 4. In¯ uence of the choice of step size D R and start point Rm
of integration of vibrational
equation (6) on the vibrational energies EvR
of the centre of gravity vibration of H#relative to the zeolite fragment for the state Š ¯ 0 of intramolecular vibration.
EvR
D R } A/ Rm
a 0 1 2
0 ± 0053 2 ± 168 711 ± 82 590 ± 82 485 ± 55
0 ± 0037 2 ± 325 711 ± 84 590 ± 86 485 ± 610 ± 0053b 2 ± 168 711 ± 82 590 ± 81 485 ± 55
0 ± 0381 2 ± 624 711 ± 84 590 ± 86 485 ± 55
a Rm
was taken as the separation between Na+I
and the centre of
gravity of H#.
b In other cases the mass of the zeolite was taken as 10 % au, here it
is 9 ¬ 10 $ au.
and step size variation along the radial coordinate R (table 4). The latter is taken as the
separation between the Na+I
position (RNa
) and the H#
position (Rm
), so that r R r ¯r R
Nar ® r R
mr , r R
Nar ¯ 6 ± 3932 A/ . The step size dependence of the frequency calculated
was shown to be unimportant, if the step size is in the wide interval from 0 ± 001 to
0 ± 08 a!
with respect to R (the frequency estimated does not depend on the exact wall
position). Variation of the mass Mz
of zeolite crystal only slightly in¯ uences the
resulting levels.
The sum of the external vibration correction (equation (7)) (curve 5 in ® gure 2) and
the `rotational ’ correction (5) for p-H#
and o-H#
(curves 2, 3) is less than 6 cm Õ " over
the whole range of q!. As a result, contributions (5) and (7) are small compared with
the FS value of intramolecular vibration (2). It is smaller also than the error (nearly
10 %) of the approximation © Š r U( q ) r Š ª } © Š r Š ª F U( qv) suggested in [2] to obtain
equation (1).
3.3. Estimate of the zeolite ionicity
Previously, we have shown the ionicity estimate based on the coincidence of the
calculated and observed FS values [2] without the D m " , u and D mR
contributions. The
values of D m " , u (5) included in equation (2) lead to a diŒerent total FS values for p-H#and o-H
#. Two estimates of the ionicity may be performed by comparison of the FSs
calculated using equation (2) with the experimental ones [17] for p-H#
and o-H#. The
comparison is shown in ® gure 2. Nearly the same ionicities (3 ± 7 e) are obtained for
both spin modi® cations.
This coincidence of the ionicities for p-H#
and o-H#
does not yield a precise ionicity
value. This value may be changed if the ionic parameters are distinct from previously
studied ones. If X-ray spectroscopy data prove the oxygen charge about ® 1 e [19],
semiempirical [20] and periodic Hartree± Fock [21] calculations lead to nearly ® 0 ± 7 e.
This corresponds to q!F 2 ± 8. Another reason for a lower ionicity arises from a
comparison of the sodium charges given in the literature. Similar values are calculated
from X-ray ® ne structure (from 0 ± 75 e in Na#SiO
$to 0 ± 81 e in NaClO
%[15]) and from
cation vibrational frequencies in the NaA zeolite (0 ± 612, 0 ± 66 e for NaI, Na
II,
respectively) [27]. These are in contradiction with the lower sodium charges (near
0 ± 3± 0 ± 4 e) provided by semiempirical methods [20]. As one may conclude from table 5,
the lower q(Na) lead to a lower q!
(cases 5± 11). So the discussion of the ionicity
Dow
nloaded By: [NEIC
ON
Consortium
] At: 17:22 26 January 2007
1406 A. V. Larin and E. Cohen de Lara
q0 /e
Dv/
cm±
1
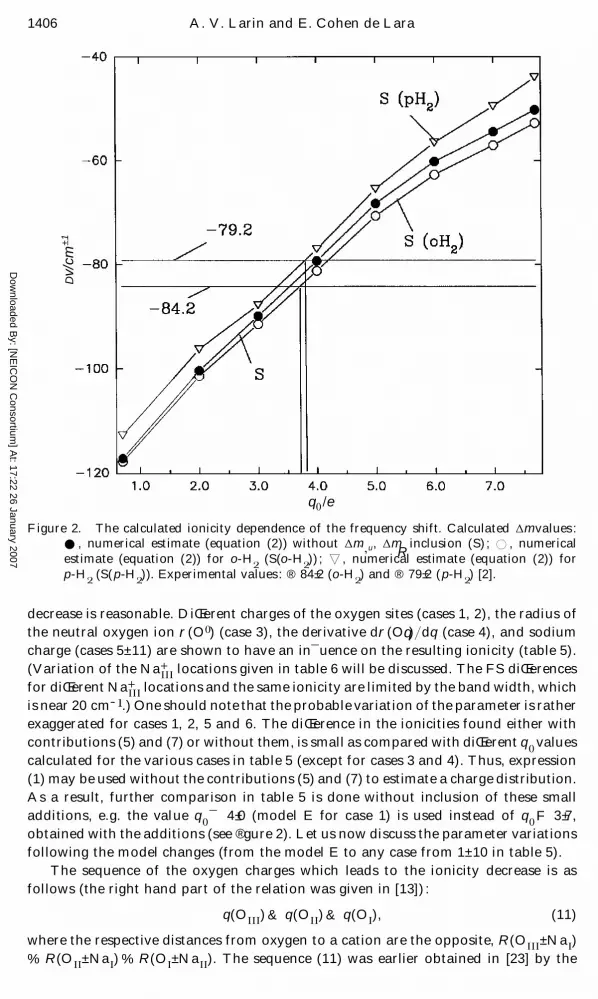
Figure 2. The calculated ionicity dependence of the frequency shift. Calculated D m values :
E , numerical estimate (equation (2)) without D m ",
u , D mR
inclusion (S) ; D , numerical
estimate (equation (2)) for o-H#
(S(o-H#)) ; x , numerical estimate (equation (2)) for
p-H#
(S(p-H#)). Experimental values : ® 84 ± 2 (o-H
#) and ® 79 ± 2 (p-H
#) [2].
decrease is reasonable. DiŒerent charges of the oxygen sites (cases 1, 2), the radius of
the neutral oxygen ion r (O ! ) (case 3), the derivative d r (Oq) } dq (case 4), and sodium
charge (cases 5± 11) are shown to have an in¯ uence on the resulting ionicity (table 5).
(Variation of the Na+III
locations given in table 6 will be discussed. The FS diŒerences
for diŒerent Na+III
locations and the same ionicity are limited by the band width, which
is near 20 cm Õ " .) One should note that the probable variation of the parameter is rather
exaggerated for cases 1, 2, 5 and 6. The diŒerence in the ionicities found either with
contributions (5) and (7) or without them, is small as compared with diŒerent q!
values
calculated for the various cases in table 5 (except for cases 3 and 4). Thus, expression
(1) may be used without the contributions (5) and (7) to estimate a charge distribution.
As a result, further comparison in table 5 is done without inclusion of these small
additions, e.g. the value q!¯ 4 ± 0 (model E for case 1) is used instead of q
!F 3 ± 7,
obtained with the additions (see ® gure 2). Let us now discuss the parameter variations
following the model changes (from the model E to any case from 1± 10 in table 5).
The sequence of the oxygen charges which leads to the ionicity decrease is as
follows (the right hand part of the relation was given in [13]) :
q(OIII
) & q(OII
) & q(OI), (11)
where the respective distances from oxygen to a cation are the opposite, R(OIII
± NaI)
% R(OII
± NaI) % R(O
I± Na
II). The sequence (11) was earlier obtained in [23] by the
Dow
nloaded By: [NEIC
ON
Consortium
] At: 17:22 26 January 2007
Estimate of ionicity of zeolite NaA 1407
Table 5. The in¯ uence of the choice of the ionic characteristics for ® xed frequency shift
(79 ± 3 ³ 0 ± 7 cm Õ " ) on the resulting ionicity of the zeolite NaA (one of the parameters is
changed as compared with model E).
q!} e
Number Na+III
ion positionof
model Case Case 1 Case 2
1 q(OIII
) } q(OII
) ¯ 1 ± 5 2 ± 9 3 ± 02 q(O
I) } q(O
II) ¯ 0 ± 7143 3 ± 2 3 ± 2
3 r (O ! ) ¯ 1 ± 40 4 ± 5 4 ± 74 d r (Oq) } dq ¯ 0 ± 4a 4 ± 4 Ð5 q(Na) ¯ 1 ± 0 6 ± 6 7 ± 96 q(Na) ¯ 0 ± 9 5 ± 6 6 ± 47 q(Na) ¯ 0 ± 8 4 ± 8 5 ± 28 Model Eb 4 ± 0 4 ± 29 q(Na) ¯ 0 ± 6 3 ± 2 3 ± 4
10 q(Na) ¯ 0 ± 5 2 ± 3 Ð
a Parameter d r (Oq) } dq ¯ 0 ± 584 e a Õ "!
in oxygen dependencer (Oq) ¯ r (O ! ) q(O) (d r (Oq) } dq) is replaced by 0 ± 4 e a Õ "
!.
b Model E corresponds to the values : q(Na) ¯ 0 ± 7 e, d r (Oq) } dq ¯0 ± 584 e a Õ "
!, the radius of neutral oxygen in the zeolite r (O ! ) ¯ 1 ± 52 A/ ,
q(OI) } q(O
II) ¯ q(O
III) } q(O
II) ¯ 1 and q(Al) } q(Si) ¯ 0 ± 575.
Table 6. Models of Na+III
ions located at the six nearest cages.
Case Coordinates of Na+III
ions } a!
1 x ® 6 ± 6816 6 ± 6816 ® 16 ± 5185 ® 6 ± 6816 16 ± 5185 6 ± 6816y 16 ± 5185 ® 16 ± 5185 0 ± 0000 0 ± 0000 0 ± 0000 0 ± 0000
z 0 ± 0000 0 ± 0000 6 ± 6816 16 ± 5185 ® 6 ± 6816 ® 16 ± 5185
2 x 0 ± 0000 ® 29 ± 8817 ® 16 ± 5185 ® 6 ± 6816 ® 6 ± 6816 ® 6 ± 6816y ® 16 ± 5185 ® 6 ± 6816 0 ± 0000 29 ± 8817 0 ± 0000 0 ± 0000
z 6 ± 6816 0 ± 0000 6 ± 6816 0 ± 0000 ® 29 ± 8817 ® 16 ± 5185
CNDO } 2D method for 6-rings constructed either from Al or from Al and Si (in the
last case q(OIII
) F q(OII
) without cation coordination). This qualitative result is
pronounced in the case of the Mg cation coordination to the ring. It is shown on the
possible diŒerent oxygen charges relation owing to the diŒerent in¯ uence of the cation
for the diŒerent cationic forms of a zeolite.
One may propose the following explanation of sequence (11). This charge
redistribution is related to electronic eŒects. The repulsive component of the IE is an
eŒective electronic repulsion, i.e. this part is responsible for the oxygen charge
distribution (11) in our case. The case when the FSs values at two diŒerent positions
R"
and R#
with axis orientations ( "", u
") and ( "
#, u
#) respectively, are equal
U( q", "
", u
", R
") ® U( q
!, "
", u
", R
") F U( q
", "
#, u
#, R
#) ® U( q
!, "
#, u
#, R
#)
is not typical for H#
owing to its positive quadrupole moment [24]. As a result, nearly
the same IE occurs in all the zeolite models obtained by ® tting the FS to the
experimental one, e.g. via (1). If one decreases the parameter (q(OIII
) } q(OII
) or
q(OII
) } q(OI)) for another model, it leads to a lower radius for the oxygen atom closest
to the adsorbate. A lower oxygen (OIII
or OII
) radius in accordance with the charge

Dow
nloaded By: [NEIC
ON
Consortium
] At: 17:22 26 January 2007
1408 A. V. Larin and E. Cohen de Lara
q(X)/e
±q(0
)/e
Figure 3. ` Charge of X-atom ® oxygen charge ’ relations. X ¯ Na : D , calculated in here
(table 5) ; y , Na#SiO
$. X ¯ Si : * , calculated in here ; y , Na
#SiO
$; E , SiO
#; + , KAlSi
$O
)(all from [15]) ; _ , periodic Hartree± Fock calculation for silicalite [21].
dependence of radius leads to an overestimation of the IE owing to smaller repulsion
with the zeolite 6-ring including OIII
and OII
sites. So, one needs the higher radius in
this position to obtain the same IE and FS values. It is achieved by an ionicity (oxygen
charge and radius) increase and, consequently, a repulsion increase for this model.
Smaller r (O ! ) values (case 3 in table 5) lead to a lower repulsion and higher
absolute value of total IE. As a result, one should increase the ionicity to obtain the
smaller attractive interaction. Nearly neutral oxygen ( ® 0 ± 25 e) was considered in [25]
with radii 1 ± 40 and 1 ± 52 A/ . The ® rst was given by Pauling as van der Waals radius [22].
A radius in the range 1 ± 29± 1 ± 40 A/ allows one to satisfy the proposition on the
intersection absence of the spherical oxygen atoms included in the same TO%tetrahedra, where T ¯ Si, Al [9]. So, a lower r (Oq) value may be the reason for the
ionicity variation. Variation of the parameter a of the function r (Oq) ¯ r (O ! ) aq
in¯ uences the q!
in the same manner as r (O ! ) (case 4).
We compare our models with diŒerent sodium charges to that known for Na#SiO
$[15] in ® gure 3. The point (q(Na), q(O)) ¯ (0 ± 75, ® 1 ± 14) determined by X-ray
spectroscopy is close to the line q(Na) ¯ f(q(O)) found using the results of table 5
(cases 5± 11) for the zeolite. The relation q(Si) } r q(O) r ¯ 2 presented in ® gure 3 should
be valid for the compounds consisting from TO%
tetrahedra, if q(Si) ¯ q(Al) is
accepted (the latter does not hold in our model (q(Al) } q(Si) ¯ 0 ± 575)). The q(Si) } r q(O) rrelation varies from 1 ± 99 to 2 ± 15 while q(Na) ranges from 0 ± 5 to 1 ± 0. If the q(Na)
increase can be interpreted as a weakening of the Na± O covalent bond, it in¯ uences
slightly the charge redistribution between Si (Al) and O ions in TO%.
Overall, one may conclude that lower q(Na) and oxygen charge redistribution (11)
leads to lower ionicity. The sodium charge decrease may be diŒerent for each of the
sodium sites (NaIII
, NaII
, NaI) owing to diŒerent distances to the nearest ions. Further
correction of the charge distribution may be done based on the intensities of the IR
spectra. Each peak is proportional to the relative occupation of the respective type of

Dow
nloaded By: [NEIC
ON
Consortium
] At: 17:22 26 January 2007
Estimate of ionicity of zeolite NaA 1409
q0/e
10
3U
/Eh
Figure 4. Comparison of the interaction © U ª (10) with the calculated values Ua, !
(9) : D ,
o-H#; E , p-H
#; x , without additions U
zp, !. The experimental Q
st( ® 2 ± 86 ¬ 10 Õ $ [11],
® 3 ± 86 ¬ 10 Õ $ Eh
[12]) are shown as full lines and © U ª by dashed lines (temperature 90 K,
kT F 2 ± 8 ¬ 10 Õ % Eh).
adsorption centres. DiŒerent peaks are sensitive to the diŒerent zeolite parameter, e.g.
q(OIII
) } q(OII
) is more important for the positions near the 6-ring and q(OI) } q(O
II) is
important for the adsorption near the 4-ring.
3.4. The interaction estimate
The validity of the rotational mode shown by the comparison of the experimental
and calculated band splitting (section 3.2) permits us to estimate the interaction. A
comparison of the IE calculated by formula (9) with the values estimated from the
known isosteric heat adsorption Qst
by means of relation (10) is given in ® gure 4. The
lowest and highest Qst
over the known values were found to be 1 ± 8 kcal mol Õ "( ® 2 ± 86 ¬ 10 Õ $ E
h) [11] and 2 ± 42 kcal mol Õ " ( ® 3 ± 86 ¬ 10 Õ $ E
h) [12]. The temperature
included in the relation (10) is accepted as 90 K for both cases (but rather smaller for
[12] where the Qst
estimation is based on three isotherms for 90, 87 and 77 K). The
diŒerences in the experimental Qst
values do not permit us to made any conclusion
about the value of q!
when the interaction Ua, !
(9) and the experimental © U ª value
coincide. But the agreement is more probable when the ionicity ranges between 1 ± 5 and
4 ± 0 e.
An application of a model allowing `axis rotation± external vibration interaction ’
should lead to a lower zero point energy in the ground state Uzp, !
[26]. As a result,

Dow
nloaded By: [NEIC
ON
Consortium
] At: 17:22 26 January 2007
1410 A. V. Larin and E. Cohen de Lara
respective interaction Ua, !
(9) increases in absolute value at the same ionicity. It leads
to higher ionicity value, obtained when the interaction estimation (9) and the
experimental © U ª values (10) coincide.
4. Conclusion
The addition of hindered rotation and of the centre of mass vibration to the total
frequency shift value are both estimated as small compared with the total frequency
shift. Comparison of experimental and calculated frequency shifts is done separately
for o-H#
and p-H#. It shows that they possess nearly the same ionicity. The zeolite
model found meets the coincidence of the frequency shift and band splitting value to
the experimental one. The respective sums of the calculated interaction energy, the
zero point energy of the rotation and the zero point energy of the external vibration
coincide with the experimental isosteric heats of adsorption. The zeolite parameters
which may in¯ uence the resulting ionicity have been discussed. Ionicity `decreases ’
if either sodium charge decreases or oxygen charges increase according to
q(OIII
) & q(OII
) & q(OI).
We are grateful to Professor R. J. Le Roy for use of the program LEVELS, which
we obtained thanks to the kindness of Dr A. J. Stace from the School of M olecular
Science, Sussex University.
References
[1] C o h e n d e L a r a , E., and D e l a v a l , Y., 1978, J. chem . Soc. Faraday Trans., 64, 790.
[2] L a r i n , A. V., and C o h e n d e L a r a , E., 1994, J. chem . Phys., 101, 8130.
[3] B u c k i n g h a m , A. D., 1960, Trans. Faraday Soc., 56, 753.[4] L a r i n , A. V., 1995, Chem . Phys. Lett., 232, 383.
[5] L a r i n , A. V., and P a r a b u z i n , V. S., 1987, Russ. J. Phys. Chem ., 61, 866.
[6] K o l o s , W., and W o l n i e w i c z , L., 1965, J. chem . Phys., 43, 2429.[7] M a c R u r y , T. B., and S a m s , J. R., 1970, Molec. Phys., 19, 337.
[8] E v e t t , A. A., 1960, J. chem . Phys., 33, 789.
[9] L a r i n , A. V., and P a r b u z i n , V. S., 1992, Molec. Phys., 77, 869.[10] L a r i n , A. V., P o l y a n s k i i , S. V., and T r u b n i k o v , D. N., 1993, Chem . Phys. Lett., 213, 613.
[11] B a s m a j i a n , D., 1960, Can. J. Chem ., 38, 141.
[12] N i k i t i n , J. V. (editor), 1990, Eksperimental’nue Metodu Š gazo Š oi Khromatogra® i
(Moscow : MGU Publishers) (in Russian).
[13] P a r b u z i n , V. S., and L a r i n , A. V., 1988, High-purity Substances, 86.
[14] C o h e n d e L a r a , E., and N g u e n T a n , T., 1979, J. phys. Chem ., 80, 1917.[15] B a r i n s k i i , R. L., and N e f e d o v , V. I., 1966, X-ray Spectral Determination of Atomic
Charges in Molecules (Moscow : Nauka).
[16] C o h e n d e L a r a , E., 1989, Molec. Phys., 66, 479.[17] F o r s t e r , H., and S c h u l d t , M., 1978, J. molec. Struct., 47, 339.
[18] P o l l , J. D., and W o l n i e w i c z , L., 1978, J. chem . Phys., 68, 3053.
[19] M y e r s , A. L., and P r a u s n i t z , J. M., 1965, J. Faraday Trans., 611, 755.[20] B e r a n , S., and D y b s k y , J., 1979, J. phys. Chem ., 83, 2538.
[21] W h i t e , J. C., and H e s s , A. C., 1993, J. phys. Chem ., 97, 8703.
[22] P a u l i n g , L., 1960, The Nature of the Chemical Bond (Ithaca, NY : Cornell UniversityPress).
[23] M o r t i e r , W. J., G e e r l i n g s , P., V a n A l z e n e y , C., and F i g e y s , H. P., 1982, J. phys. Chem .,
83, 855.[24] L a r i n , A. V., unpublished.
[25] B r o i e r , P., K i s e l e v , A. V., L e z n i k , E. A., and L o p a t k i n , A. A., 1968, Zur. Fiz. Chim., 42,
2556.[26] K a t o r s k i , A., and W h i t e , D., 1964, J. chem. Phys., 40, 3183.
[27] K y o n g T a i N o , T u n g S u p K i m , Y e a Y o u n g H u h , W a n K y u e K i m , and M u S h i k J h o n ,
1987, J. phys. Chem., 91, 740.


