Embed Size (px)
Citation preview
7
ESTIMATION OF BENEFITS FROM DEER AND MOOSE HUNTING IN MANITOBA
R . E. Capel and R. K. Pandey
Wildlife producrion has been suggesred as a socially beneficial alrernarive 10 agri- culrure on marginal land. Since mosr wildlife species are fugirive common properry resources, the private secror is assumed 10 be incapable of generaring oprimum O U I - purs. merefore, public invesrmenrs in habiiar and game prorecrion and manage- menr are assumed ro be beneficial, provided rhar funds are appropriarely allocared. Criteria are needed for optimizing such public invesrmenrs, and the benefit cosr approach is currently used. Benefir evaluaiion is one imporranr aspecr of rhis ap- proach. In rhe present study rhe benefirs of deer and moose hunting in a selecred area of Maniroba have been esrimared and projecrions made for 1975 and 1980. The benejir calcularions are based on esrimared demands for hunring, using a model in which disrance and hunring sire quality are independent variables. The demand and benefit esiimares will be of inrerest 10 land use planners and wildlife managers. Dara used in rhe study were obrained f rom surveys by the Manitoba Wildli/p Branch and rhe Deparrmenr of Agriculrural Economics, Universiry of Maniroba.
I1 a PIP suggiri que la producrion du gibier serair une alrernarive qui apporrerair des bPne5ces soriaux 0; I‘on prarique I‘agriculrure a rerres marginales. Eranr donne que la pluparr des espices sauvages son1 de caractire fugitif ainsi qu’une proprier6 commune. nous croyons qu’il esr impossible pour le secreur privP de produire un rendemenr oprimal. Par ronsequanr, nous prisumons que des invesrissemenrs publics rrair a la proieciion er la gesiion du gibier er de son habirar offrenr des avanrages. pourvu que les fonds soienr correcremenr disrribuis. On a besoin de crirPres pour oprimaliser de rels invesrissemenrs publics, er la merhode “benejir-cost ” err dusage couranr. L’ivaharion des binejices esc un aspecr imporranr de ceire merhode. Dans la presenre Prude les binepees de la chasse aux chevreuils er aux orignaux dans une region sdecrionnie du Manitoba onr ere esrimes er des projecrions oni Pie effecruees pour les annees 1975 er 1980. Les calculs des bPneFces onr pour base des esrimarions des demander pour la chasse. a parrir d u n modde dans lequel les variables inde- pendanres son1 la disrance ei la qualiri des endroirs de chasse. Les esrimarions des demandes er des binifices seronr inririssanies aux planificareurs de I’utilisarion des rerres er aux direcreurs de I‘enrrerien des rerrains de chasse. Les donnies urilisies dans ceire Prude oni Pie‘ obrenu a parrir de quesrionnaires urilises dans des enquPies menees par la Division de Chasse er PPche du Maniioba er par le Diparremenr d’Economie Rurale de I’Universire‘du Maniroba.
Introduction and Objectives Hunting enthusiasts claim that much of the rural land which cannot
be used profitably in agriculture should be used for game production. They argue that government should take the primary responsibility for necessary investment and management because they believe that the private sector is not capable of establishing an optimum allocation of resources for production of most types of game. “Fugitive” species, which include game in most situations, are, by their nature, common property resources. There- fore, persons bearing costs of production-e.g., providing habitat or suffer- ing crop damage-cannot sell the product (game) at prices that cover costs, thus output is less than the competitive assumed optimum.
If government is to invest taxpayers’ funds in wildlife production and management, there should be criteria for optimizing these investments. Benefit cost analysis includes the approaches and methods currently recom-
R. E. U P E L is Associate Professor, Department of Agricultural Economics, University of Manitoba. and R. K . PANDEY is Graduate Assislant, Department of Agricultural Economics, University of Manitoba.
8
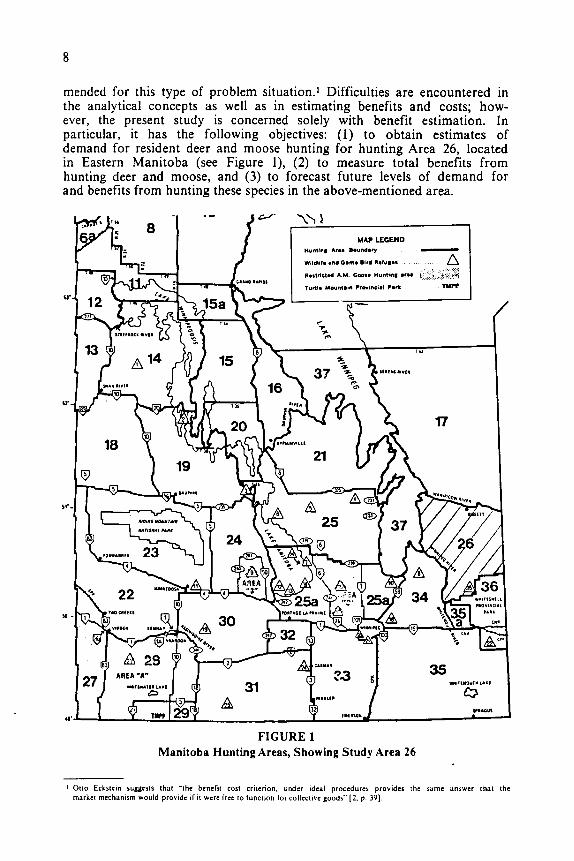
mended for this type of problem situation.' Difficulties are encountered in the analytical concepts as well as in estimating benefits and costs; how- ever, the present study is concerned solely with benefit estimation. In particular, it has the following objectives: (1) to obtain estimates of demand for resident deer and moose hunting for hunting Area 26, located in Eastern Manitoba (see Figure l), (2) to measure total benefits from hunting deer and moose, and (3) to forecast future levels of demand for and benefits from hunting these species in the above-mentioned area.
FIGURE 1 Manitoba Hunting Areas, Showing Study Area 26
I Otto Eckstcin ruigcrls that "the benefit cost criterion. under idcul proccdurcr provides Ihc same unswer that thc market mcchanism would provlde II 11 wrrc lrrc to function lor C O ~ ~ C C I I V ~ good," [?. p 391.
9
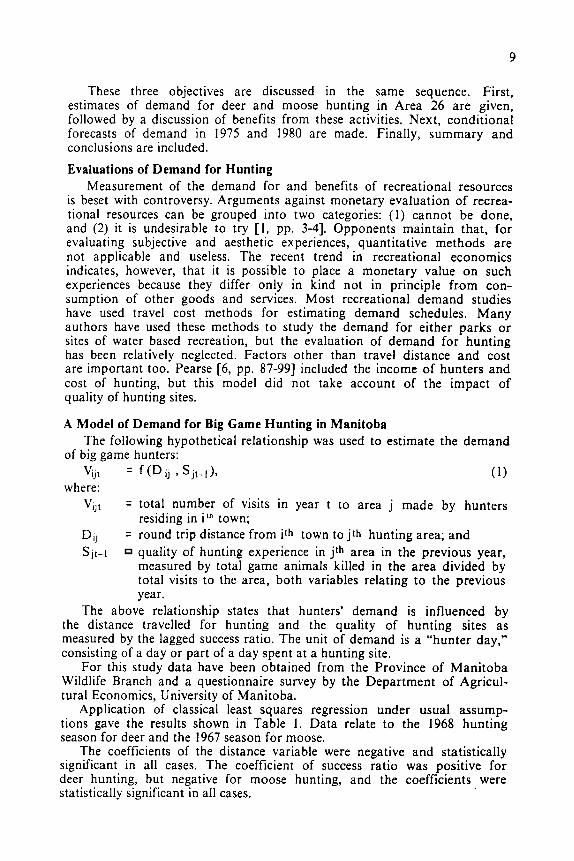
These three objectives are discussed in the same sequence. First, estimates of demand for deer and moose hunting in Area 26 are given, followed by a discussion of benefits from these activities. Next, conditional forecasts of demand in 1975 and 1980 are made. Finally, summary and conclusions are included.
Evaluations of Demand for Hunting Measurement of the demand for and benefits of recreational resources
is beset with controversy. Arguments against monetary evaluation of recrea- tional resources can be grouped into two categories: (1) cannot be done, and (2) it is undesirable to try [ I , pp. 3-41. Opponents maintain that, for evaluating subjective and aesthetic experiences, quantitative methods are not applicable and useless. The recent trend in recreational economics indicates, however, that it is possible to place a monetary value on such experiences because they differ only in kind not in principle from con- sumption of other goods and services. Most recreational demand studies have used travel cost methods for estimating demand schedules. Many authors have used these methods to study the demand for either parks or sites of water based recreation, but the evaluation of demand for hunting has been relatively neglected. Factors other than travel distance and cost are important too. Pearse [6, pp. 87-99] included the income of hunters and cost of hunting, but this model did not take account of the impact of quality of hunting sites.
A Model of Demand for Big Game Hunting in Manitoba
of big game hunters:
where: V,,,
D,J SJt-1
The following hypothetical relationship was used to estimate the demand
\'IJt = f (DiJ 1 'JI-I), (1 )
= total number of visits in year t to area j made by hunters
= round trip distance from i t h town to j t h hunting area; and quality of hunting experience in jth area in the previous year, measured by total game animals killed in the area divided by total visits to the area, both variables relating to the previous year.
The above relationship states that hunters' demand is influenced by the distance travelled for hunting and the quality of hunting sites as measured by the lagged success ratio. The unit of demand is a "hunter day," consisting of a day or part of a day spent at a hunting site.
For this study data have been obtained from the Province of Manitoba Wildlife Branch and a questionnaire survey by the Department of Agricul- tural Economics, University of Manitoba.
Application of classical least squares regression under usual assump- tions gave the results shown in Table 1. Data relate to the 1968 hunting season for deer and the 1967 season for moose.
The coefficients of the distance variable were negative and statistically significant in all cases. The coefficient of success ratio was positive for deer hunting, but negative for moose hunting, and the coefficients were statistically significant in all cases.
residing in i'h town;
10
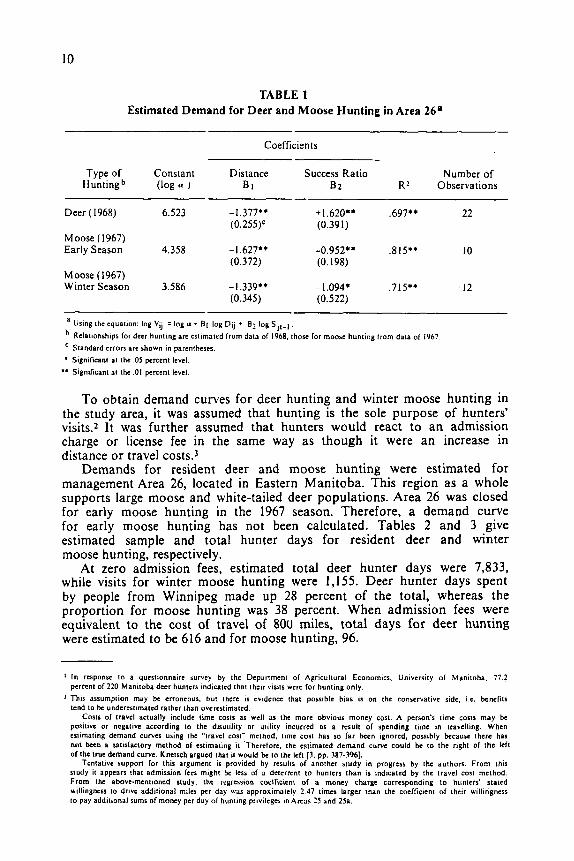
TABLE 1 Estimated Demand for Deer and Moose Hunting in Area 26p
Coefficients
Type of Constant Huntingb (log a J
Deer (1968) 6.523
Moose ( 1967) Early Season 4.358
Moose (1967) Winter Season 3.586
Distance Success Ratio Number of BI B 2 R 2 Observations
-1.377** +1.620** .697** 22 (0.255)c (0.391)
-1.627** -0.952** .815** 10 (0.372) (0.198)
-1.339** - l.094* ,7151, 12 (0.345) (0.522)
~ ~~~
a Using the equation: log Vi, = log u + BI log Di, + 82 log S,t-l,
Relationships lor deer hunting are cslimated from data of 1968. thow for moose hunting from data of 1967 Standard crrors are shown in parentheses ' Significant at the OS percent Icvel.
'* Significant at the .01 percent level.
To obtain demand curves for deer hunting and winter moose hunting in the study area, it was assumed that hunting is the sole purpose of hunters' visits.2 It was further assumed that hunters would react to an admission charge or license fee in the same way as though it were an increase in distance or travel costs.3
Demands for resident deer and moose hunting were estimated for management Area 26, located in Eastern Manitoba. This region as a whole supports large moose and white-tailed deer populations. Area 26 was closed for early moose hunting in the 1967 season. Therefore, a demand curve for early moose hunting has not been calculated. Tables 2 and 3 give estimated sample and total hunter days for resident deer and winter moose hunting, respectively.
At zero admission fees, estimated total deer hunter days were 7,833, while visits for winter moose hunting were 1,155. Deer hunter days spent by people from Winnipeg made up 28 percent of the total, whereas the proportion for moose hunting was 38 percent. When admission fees were equivalent to the cost of travel of 800 miles, total days for deer hunting were estimated to be 616 and for moose hunting, 96.
I I n response to a questionnaire survcy by the Dcpanmcnt or Agricultural Economics, University of Manitoba. 11.2 percent of 220 Manitoba deer hunters indicated that their visits WCR lor hunting only.
' This assumption may be erroneous. but there is evidence that possible bias IS on the conservative side. ik. benefits tend to bc underestimated rather than overestimated.
Costs of travel actually include time costs as well as the more obvious money cost. A person's time costs may be positive or negative according to the disutility or utility incurred as a result of spending time i n travelling. When csiimating demand curves using the "travel cost" method. time cost has so far been Ignored. possibly because there has not been a ulisfactory method of estimating i t . Therefore. the estimated demand curve could be to the right of the left of the true demand curve. Knetsch argued that i t would be to the left [3. pp. 387-3961.
Tentative ruppon for this argument is provided by results of another study in progress by the authors. From this study i t appears that admission lees might bc less 01 a deterrent to hunters than is indicated by the travel cost method. From the abovc-mentioncd study. the regression coslficient of n money charge corresponding 10 hunters' stated willingness to drive additional miles per day was approximutely 2 47 times larger than the coefficient of their willingness l o pay additional sums of money per day 01 hunting prlvikgcs in Arms 25 and 25u.
1 1
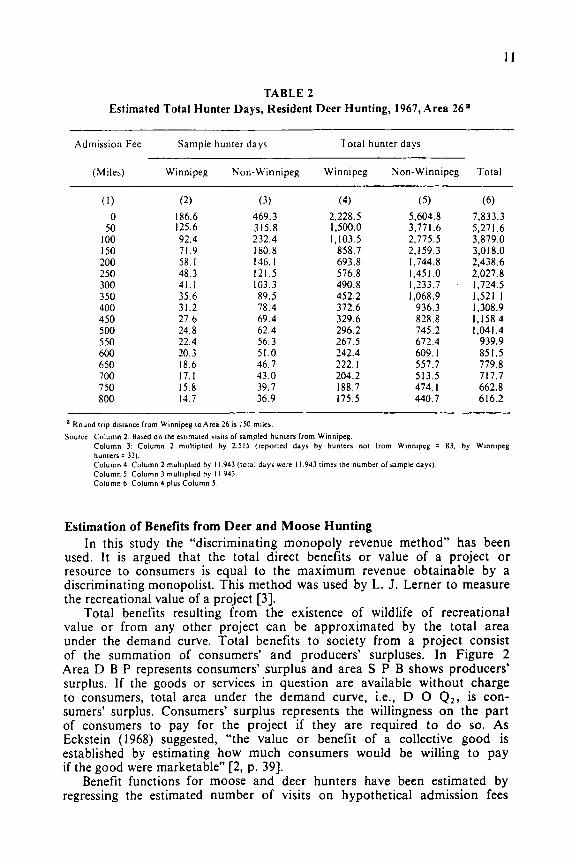
TABLE 2 Estimated Total Hunter Days, Resident Deer Hunting, 1967, Area 26s
Admission Fee Sample hunter days Total hunter days
(Miles) Winnipeg Non-Winnipeg Winnipeg Non-Winnipeg Total
( 1 ) (2) (3) (4) (5) (6) 0 186.6 469.3 2,228.5 5,604.8 7,833.3
50 125.6 315.8 1.500.0 3,771.6 5,271.6 I00 92.4 232.4 1.103.5 2,775.5 3,879.0 150 71.9 180.8 858.7 2,159.3 3,018.0 200 58. I 146.1 693.8 1,744.8 2,438.6 250 48.3 121.5 576.8 1,451.0 2,027.8 300 41.1 103.3 490.8 1,233.7 1,724.5 3 50 35.6 89.5 452.2 1,068.9 1.521.1 400 31.2 78.4 372.6 936.3 1,308.9 450 27.6 69.4 329.6 828.8 I , 158.4 500 24.8 62.4 296.2 745.2 1,041.4 5 50 22.4 56.3 267.5 672.4 939.9 600 20.3 51.0 242.4 609.1 85 I .5 650 18.6 46.7 222. I 557.7 779.8 700 17. I 43.0 204.2 513.5 717.7 750 15.8 39.7 188.7 474. I 662.8 800 14.7 36.9 175.5 440.7 616.2
a Round trip dislancc from Winnipeg lo Arca 26 IS I50 milch.
Source: Column 2 Based on ihc criimatcd visits of sampled huntcrs from Winnipeg. Column 3. Column 2 muliiplicd by 2.515 (rcportcd days by hunlcrs not lrom Winnipeg = 83. by Winnipcg hunicrr = 33) Column 4. Column 2 muliiplicd by I I 943 (tolal days wcrc I I 94.1 times Ihc number ol‘s~mplc days) Column 5: Column 3 muliiplicd by I I 943. Column 6 . Column 4 plu, Column 5
Estimation of Benefits from Deer and Moose Hunting In this study the “discriminating monopoly revenue method” has been
used. It is argued that the total direct benefits or value of a project or resource to consumers is equal to the maximum revenue obtainable by a discriminating monopolist. This method was used by L. J. Lerner to measure the recreational value of a project [3].
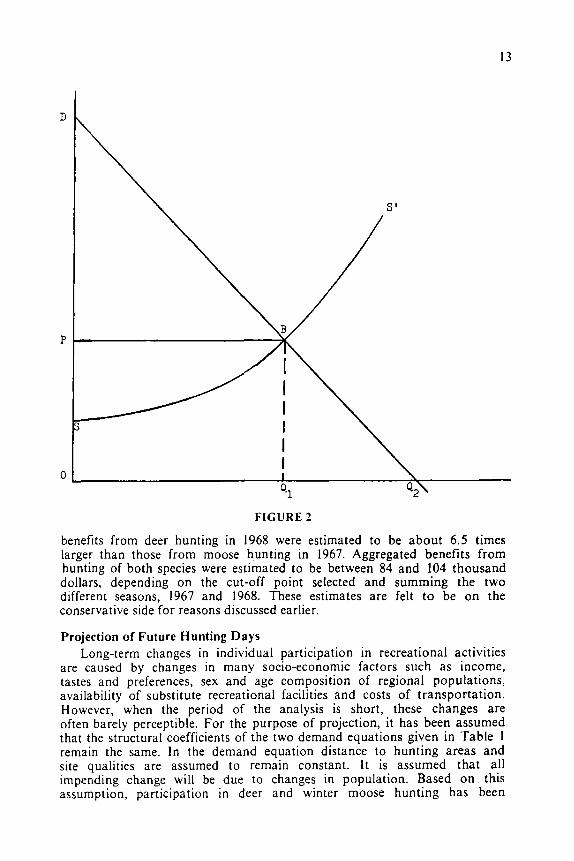
Total benefits resulting from the existence of wildlife of recreational value o r from any other project can be approximated by the total area under the demand curve. Total benefits to society from a project consist of the summation of consumers’ and producers’ surpluses. In Figure 2 Area D B P represents consumers’ surplus and area S P B shows producers’ surplus. If the goods or services in question are available without charge to consumers, total area under the demand curve, i.e., D 0 Q2, is con- sumers’ surplus. Consumers’ surplus represents the willingness on the part of consumers to pay for the project if they are required to d o so. As Eckstein (1968) suggested, “the value or benefit of a collective good is established by estimating how much consumers would be willing to pay if the good were marketable” [2, p. 391.
Benefit functions for moose and deer hunters have been estimated by regressing the estimated number of visits on hypothetical admission fees
12
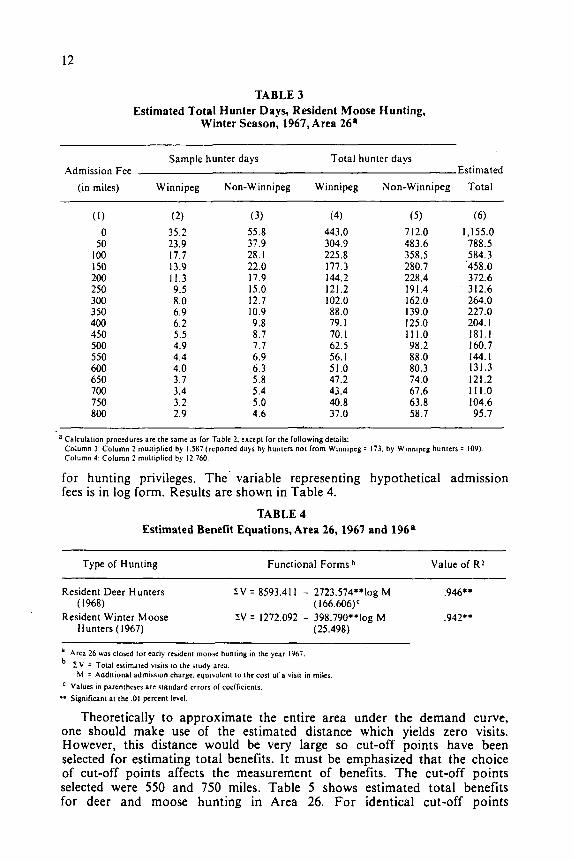
TABLE 3 Estimated Total Hunter Days, Resident Moose Hunting,
Winter Season, 1967,Area 26a
Sample hunter days Total hunter days Admission Fee Estimated
(in miles) Winnipeg Non-Winnipeg Winnipeg Non-Winnipeg Total
(1) 0
50 100 150 200 250 300 350 400 450 500 550 600 650 700 750 800
35.2 23.9 17.7 13.9 11.3 9.5 8.0 6.9 6.2 5 .5 4.9 4.4 4.0 3.7 3.4 3.2 2.9
(3) 55.8 37.9 28.1 22.0 17.9 15.0 12.7 10.9 9.8 8.7 7.7 6.9 6.3 5 . 8 5.4 5.0 4.6
(4) 443.0 304.9 225.8 177.3 144.2 121.2 102.0 88.0 79. I 70. I 62.5 56. I 51.0 47.2 43.4 40.8 37.0
( 5 ) (6) 712.0 1,155.0 483.6 788.5 358.5 584.3 280.7 458.0 228.4 372.6 191.4 312.6 162.0 264.0 139.0 227.0 125.0 204.1 111.0 181.1 98.2 160.7 88.0 144.1 80.3 131.3 74.0 121.2 67.6 111.0 63.8 104.6 58.7 95.7
a Calculauon proccdurcs arc the samc ds lor Table 2. cxccpt lor the lollowing dcwils Column 3 Column 2 multiplicd by I 587 (reported dJyr by huntcrr no1 lrom Winnipeg 1 173. by Winnipcg hunters = 109) Column 4 Column 2 rnuluplicd b) 12 760
for hunting privileges. The variable representing hypothetical admission fees is in log form. Results are shown in Table 4.
TABLE 4 Estimated Benefit Equations, Area 26,1967 and 196*
Type of Hunting Functional Forms h Value of R*
Resident Deer Hunters CV = 8593.41 I - 2723.574**10g M .946**
Resident Winter Moose CV 1272.092 - 398.790**10g M ,942" ( 1968) ( 166.606)c
Hunters (1967) (25.498)
Area 26 was closed for early resident moose hunting in thc ycrr 1967
'.V Total Csllmdlcd Visdts to the study JreJ M = Additional admission chdrge. equivalent to the cost or a visit in miles
Valucr in parentheses arc slanddrd crrors or coefficients
** Significant at thc 01 percent lcvcl
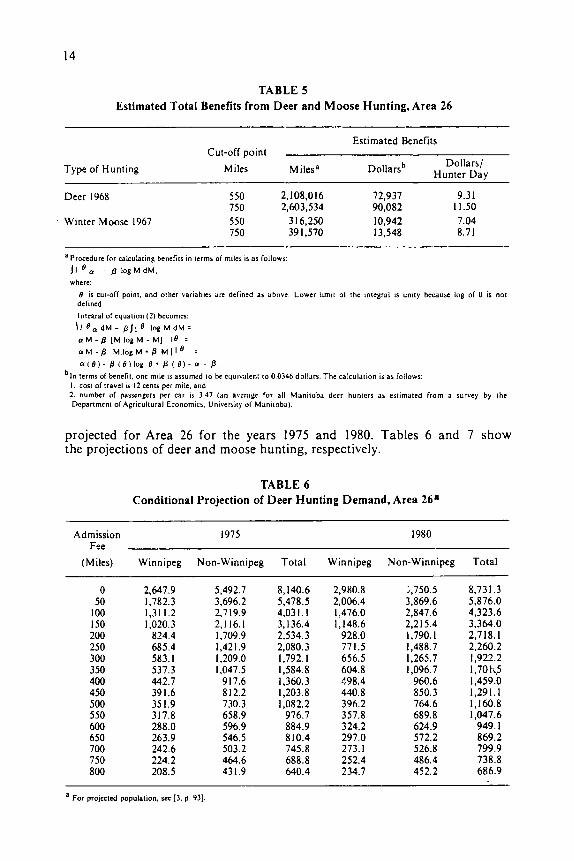
Theoretically to approximate the entire area under the demand curve, one should make use of the estimated distance which yields zero visits. However, this distance would be very large so cut-off points have been selected for estimating total benefits. It must be emphasized that the choice of cut-off points affects the measurement of benefits. The cut-off points selected were 550 and 750 miles. Table 5 shows estimated total benefits for deer and moose hunting in Area 26. For identical cut-off points
13
\
FIGURE 2
benefits from deer hunting in 1968 were estimated to be about 6.5 times larger than those from moose h,unting in 1967. Aggregated benefits from hunting of both species were estimated to be between 84 and 104 thousand dollars, depending on the cut-off point selected and summing the two different seasons, 1967 and 1968. These estimates are felt t o be on the conservative side for reasons discussed earlier.
Projection of Future Hunting Days Long-term changes in individual participation in recreational activities
are caused by changes in many socio-economic factors such as income, tastes and preferences, sex and age composition of regional populations, availability of substitute recreational facilities and costs of transportation. However, when the period of the analysis is short, these changes are often barely perceptible. For the purpose of projection, it has been assumed that the structural coefficients of the two demand equations given in Table I remain the same. In the demand equation distance to hunting areas and site qualities are assumed to remain constant. It is assumed that all impending change will be due to changes in population. Based on this assumption, participation in deer and winter moose hunting has been
14
TABLE 5 Estimated Total Benefits from Deer and Moose Hunting, Area 26
Estimated Benefits Cut-off point
Dollars/ Type of Hunting Miles Milesa Dollarsb Hunter Day
Deer 1968 550 2,108,016 72,937 9.31 750 2,603,534 90,082 11.50
Winter Moose 1967 550 3 16,250 10,942 7.04 750 39 1,570 13.548 8.71
aProccdurc for calculating benefits in tcrma of miles i s as followi:
JI ' a - B I o g M d M .
where
-9 is cut-off point. and other variable arc defined as above Lower limit of thc integral i s unity becauae log of 0 is not d c h c d .
lntcrcral of cquation (2 ) becomes:
\ l ' , d M - l j . l l e I o g M d M :
a M - P ( M l o g M - M I 1 18 = a M - 8 M . l o g M + B M I I e =
terms of benefit. onc milc i s assumed to he equivalent to 0 0346 dollars. The calculation ib a, follows:
a l e ) - p 1 8 ) i o g e ' p ( 8 ) - ~1 - p
I. cost of travel 15 12 cents per milc. and 2. number of passengers per car i s 3 4 1 (an aheragc for 811 Manitoba deer hunters as estimated from a survey by the Dcpanmcni or Agricultural Economics. Univcriity 01 Manitoba).
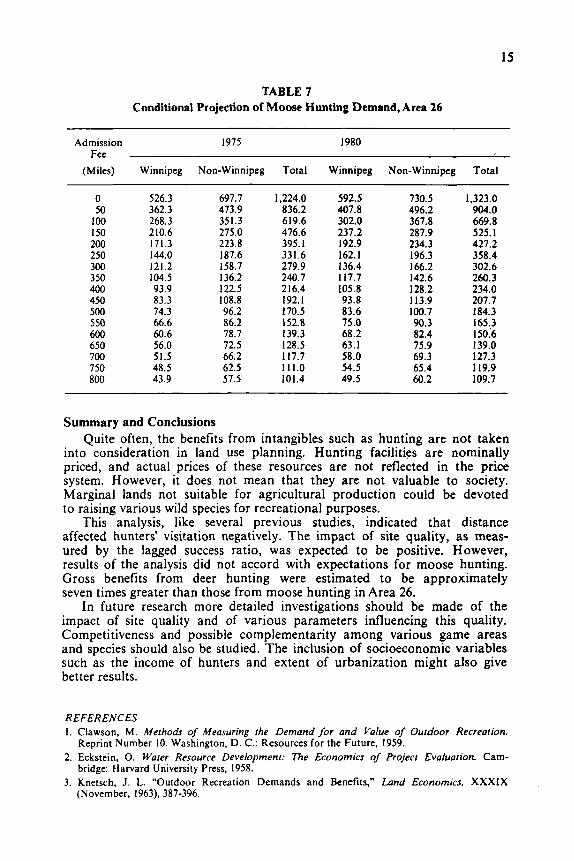
projected for Area 26 for the years 1975 and 1980. Tables 6 and 7 show the projections of deer and moose hunting, respectively.
TABLE 6 Conditional Projection of Deer Hunting Demand, Area 26p
Admission 1975 1980 Fee
(Miles) Winnipeg Non-Winnipeg Total Winnipeg Non-Winnipeg To ta l
0 2,647.9 5,492.7 8,140.6 2,980.8 ;,750.5 8,73 I .3 50 1,782.3 3,696.2 5,478.5 2.006.4 3.869.6 5,876.0
100 1.31 1.2 2,719.9 4,031.1 1,476.0 2,847.6 4,323.6 150 1,020.3 2.1 16.1 3,136.4 1,148.6 2,215.4 3.364.0 200 824.4 1,709.9 2,534.3 928.0 1,790. I 2,718.1 250 685.4 1,421.9 2,080.3 771.5 1,488.7 2,260.2 300 583. I 1,209.0 1,792. I 656.5 1.265.7 1,922.2 350 531.3 1,047.5 1,584.8 604.8 1,096.7 1,701{5 400 442.7 917.6 1,360.3 C98.4 960.6 1,459.0 450 391.6 8 12.2 1,203.8 440.8 850.3 1,291.1 500 351.9 730.3 1,082.2 396.2 764.6 I , I 60.8 550 3 17.8 658.9 976.7 357.8 689.8 1,047.6 600 288.0 596.9 884.9 324.2 624.9 949.1 650 263.9 546.5 810.4 297.0 572.2 869.2 700 242.6 503.2 745.8 273.1 526.8 799.9 750 224.2 464.6 688.8 252.4 486.4 738.8 800 208.5 43 1.9 640.4 234.7 452.2 686.9
a For PrOJCCtcd population. KC [I. p 931
15
TABLE 7 Conditional Projection of Moose Hunting Demand, Area 26
Admission 1975 1980 Fee
(Miles) Winnipeg Non-Winnipeg Total Winnipeg Non-Winnipeg Total
0 526.3 697.7 1,224.0 592.5 730.5 1,323.0 50 362.3 473.9 836.2 407.8 496.2 904.0 I00 268.3 351.3 619.6 302.0 367.8 669.8 150 210.6 275.0 476.6 237.2 287.9 525.1 200 171.3 223.8 395.1 192.9 234.3 427.2 250 144.0 187.6 331.6 162.1 196.3 358.4 300 121.2 158.7 279.9 136.4 166.2 302.6 350 104.5 136.2 240.7 117.7 142.6 260.3 400 93.9 122.5 2 16.4 105.8 128.2 234.0 450 83.3 108.8 192.1 93.8 113.9 207.7 500 74.3 96.2 170.5 83.6 100.7 184.3 5 50 66.6 86.2 152.8 75.0 90.3 165.3 600 60.6 78.7 139.3 68.2 82.4 150.6 650 56.0 72.5 128.5 63.1 75.9 139.0 700 51.5 66.2 117.7 58.0 69.3 127.3 750 48.5 62.5 111.0 54.5 65.4 119.9 800 43.9 51.5 101.4 49.5 60.2 109.7
Summary and Conclusions Quite often, the benefits from intangibles such as hunting are not taken
into consideration in land use planning. Hunting facilities are nominally priced, and actual prices of these resources are not reflected in the price system. However, it does not mean that they are not valuable to society. Marginal lands not suitable for agricultural production could be devoted to raising various wild species for recreational purposes.
This analysis, like several previous studies, indicated that distance affected hunters’ visitation negatively. The impact of site quality, as meas- ured by the lagged success ratio, was expected to be positive. However, results of the analysis did not accord with expectations for moose hunting. Gross benefits from deer hunting were estimated to be approximately seven times greater than those from moose hunting in Area 26.
In future research more detailed investigations should be made of the impact of site quality and of various parameters influencing this quality. Competitiveness and possible complementarity among various game areas and species should also be studied. The inclusion of socioeconomic variables such as the income of hunters and extent of urbanization might also give better results.
REFERENCES 1. Clawson. M. Methods of Measuring the Demand for and Value of Outdoor Recreation.
2. Eckstein. 0. Water Resource Development: The Economics of Project Evaluarion. Cam-
3. Knetsch, J. L. “Outdoor Recreation Demands and Benefits,” Lond Economics, XXXlX
Reprint Number 10. Washington, D. C.: Resources for the Future, 1959.
bridge: Harvard University Press, 1958.
(November, 1963), 387-396.
16
4. Lerner, L. J . “Quantitative Indices of Recreational Values,” Wafer Resources and Economic Development of the Wesf, Report Number 11. Western Agricultural Economics Research Council, 1962.
5. Maki, W. R. and J . A. MacMillan. Regional Systems for Developmen: Planning in Manitoba. Research bulletin 70-1. Winnipeg: Department of Agricultural Economics, Uni- versity of Manitoba, 1970.
6. Pearse, P. H. “A New Approach to the Evaluation of Non-Priced Recreational Resources,” Lund Economics, XLIV (February, 1968), 87-99.