Embed Size (px)
Citation preview
Eptg
Ga
b
c
a
ARRAA
KGPOPAU
1
cwcoolbba
utwnt
(
0h
Journal of Chromatography A, 1325 (2014) 40– 48
Contents lists available at ScienceDirect
Journal of Chromatography A
j our nal homep age: www.elsev ier .com/ locate /chroma
stimation of measurement uncertainty of polychlorinated biphenyls,olycyclic aromatic hydrocarbons and organochlorine pesticides inhe atmosphere using gas chromatography–mass spectrometry andas chromatography–electron capture detector
üler Aslan-Sungura,∗, Eftade O. Gagab, Serpil Yenisoy-Karakas c
Department of Environmental Engineering, Abant Izzet Baysal University, 14280 Bolu, TurkeyDepartment of Environmental Engineering, Anadolu University, 26470 Eskis ehir, TurkeyDepartment of Chemistry, Abant Izzet Baysal University, 14280 Bolu, Turkey
r t i c l e i n f o
rticle history:eceived 1 October 2013eceived in revised form 2 December 2013ccepted 3 December 2013vailable online 11 December 2013
a b s t r a c t
Estimation of uncertainty of measurement is a crucial issue to achieve accurate measurement results.When the target has adverse environmental and health effects, accuracy of the results become moreimportant. POPs are the pollutants that have toxic effects and unfortunately, there is a lack of infor-mation about uncertainty of the method for determining POPs in air samples. In this work, uncertaintycalculations were carried out for PCBs, OCPs, and PAHs in air samples analyzed by using GC–MS andGC–ECD. The main dominant sources for combined uncertainty were calibration curve, recovery and
eywords:as chromatographyolychlorinated biphenylsrganochlorine pesticidesolycyclic aromatic hydrocarbonsir samples
repeatability. The relative uncertainties were found to be in the range of 23–52% for PCBs, 24–59% forOCPs and 23–90% for PAHs.
© 2013 Elsevier B.V. All rights reserved.
ncertainty
. Introduction
Persistent organic compounds (POPs) are the most importantlass of organic pollutants that consist of three important groupshich are polychlorinated biphenyls (PCBs), organochlorine pesti-
ides (OCPs) and polycyclic aromatic hydrocarbons (PAHs). Becausef their semi-volatility, POPs are transported at low concentrationsver long distances in the atmosphere. POPs are characterized byow water solubility and high lipid solubility, resulting in theirioaccumulation in fatty tissues of living organisms. Therefore,oth humans and environmental organisms are exposed to POPsround the world which has chronic and acute toxic effects.
PCBs are persistent organic pollutants that have been widelysed in the environment that bioaccumulate and biomagnify inhe food chain and resist biodegradation. Health hazard of PCBs
ere identified in a number of reports and due to their persistentature in the environment they can easily transported one mediumo another such as soil and food [1–5].∗ Corresponding author. Tel.: +90 5557020970.E-mail addresses: aslan [email protected] (G. Aslan-Sungur), [email protected]
E.O. Gaga), yenisoykarakas [email protected] (S. Yenisoy-Karakas ).
021-9673/$ – see front matter © 2013 Elsevier B.V. All rights reserved.ttp://dx.doi.org/10.1016/j.chroma.2013.12.005
OCPs are bioaccumulative persistent, and have adverse healtheffects on human and animal health, causing nervous systemdamage, diseases of the immune system, reproductive and devel-opmental disorders, and cancers [6–8]. Thus, it is still detected andreported in different compartments of the environment all over theworld [9,10].
PAHs are generated during incomplete combustion of organicmatter and released into the urban environment mainly throughanthropogenic activities such as vehicle emissions, coal and fossilfuel combustion for power generation, petroleum refining, indus-trial processing, chemical manufacturing, oil spills and coal tars[11–13]. Several PAHs are known carcinogens and many studieshave been performed about the health effects of PAHs on humanalso for environment [14–18].
Many analysis methods were developed to measure persistentorganic pollutants in the environment. Analysis of PCBs, PAHs andOCPs in air samples currently performed by gas chromatography(GC) coupled to mass spectrometry (MS) and electron capturedetector (ECD). Two main important steps, extraction and clean-
up procedure in this study are optimized before quantification bychromatographic techniques [19].Estimation of measurement uncertainties should be taken intoconsideration for the determination of POPs due to their adverse
roma
eAtdmrcta[sPta
2
2
cPPP(GDHfk(Fs(I
2
Uhao(ptatTdsPsf
duhev(uma
G. Aslan-Sungur et al. / J. Ch
ffects on humans and environment even at low concentrations.ccording to the international vocabulary of basic and general
erms in metrology [20], the uncertainty of a measurement isefined as “a parameter associated with the result of a measure-ent that characterizes the dispersion of the values that could
easonably be attributed to the measurand”. The interest of cal-ulating the measurement uncertainties is to show the data qualityhat is fundamentally important for laboratories, their clientsnd all institutions using these results for comparative purposes21,22]. However, there is no published paper about a comprehen-ive evaluation of uncertainty associated to the determination ofOPs in air samples. The aim of this study is to determine the uncer-ainty measurement calculation of the PCBs, OCPs and PAHs in thetmosphere using bottom-up approach.
. Experimental
.1. Target PAH, PCB and OCP compounds
The PCB (with IUPAC nomenclature), OCP and PAHompounds investigated in the atmosphere as follows:CB-18, PCB-20, PCB-28, PCB-31, PCB-44, PCB-52, PCB-101,CB-105, PCB-118, PCB-138, PCB-149, PCB-153, PCB-170,CB-180, and PCB-194; Alpha-HexachlorocyclohexaneAlpha-HCH), Beta-Hexachlorocyclohexane (Beta-HCH),amma-Hexachlorocyclohexane (Gamma-HCH) (Lindane),elta-Hexachlorocyclohexane (Delta-HCH), Dieldrin, 4,4′-DDT,eptachlor epoxide, Endosulfan I, 4,4′-DDE, Endrin, Endosul-
an II, 4,4′-DDD, Endrin aldehyde, Endosulfan sulfate, Endrinetone, and Methoxychlor; Acenaphtylene (Acy), AcenaptheneAce), Fluorene (Flu), Anthracene (Ant), Phenanthrene (Phe),luoranthene (Flt), Pyrene (Pyr), Benzo(a)anthracene (BaA), Chry-ene (Chr), Benzo(b)fluoranthene (BbF), Benzo(k)fluorantheneBkF), Benzo(a)pyrene (BaP), Dibenzo[a,h]anthracene (DahA),ndeno[1,2,3-c,d]pyrene (Ind), Benzo[g,h,i]perylene (BghiP).
.2. Sample preparation
In this study, high volume PUF sampler (Andersen PUF sampler,SA) was used with a flow of 0.225 m3 min−1. After twenty-fourours, the samples were taken and wrapped with aluminum foilnd stored in desiccators until the extraction time. Particle phaserganics were collected by a 90-mm diameter glass fiber filterGFF), while gaseous phase organics were captured by a two-pieceolyurethane foam (PUF) cartridge. The samples were collected inwo phases, during two summer months (June 25–August 23, 2007)nd two winter months (December 13, 2007–February 12, 2008). Aotal of 120 samples were collected and analyzed in both seasons.welve field blank samples (6 for GFF, 6 for PUF) were collected toetermine any contamination during sampling, sample handling,ample preparation, and analyses. Pre-baked GFF and pre-cleanedUF cartridges were brought to the sampling location in sealed ves-els and then placed into the sampler. They were kept in the sampleror several minutes prior to operation.
GFF and PUF samples were soxhlet-extracted with a mixture ofichloromethane (DCM) and petroleum ether (PE) (1:4) with vol-mes of 150 mL and 650 mL, respectively, for 24 h, at 4 cycles perour. The volume of the extracts was reduced to 10 mL by rotaryvaporator at 500 mbar and 40 ◦C. They were transferred to 15 mLials by washing the walls of the balloons with solvent mixture
DCM:PE, 1:4) several times for further volume reduction to 1 mLnder a gentle stream of nitrogen. Extracts were transferred to alu-inum oxide–florisil columns for cleanup and fractionation of thenalytes.
togr. A 1325 (2014) 40– 48 41
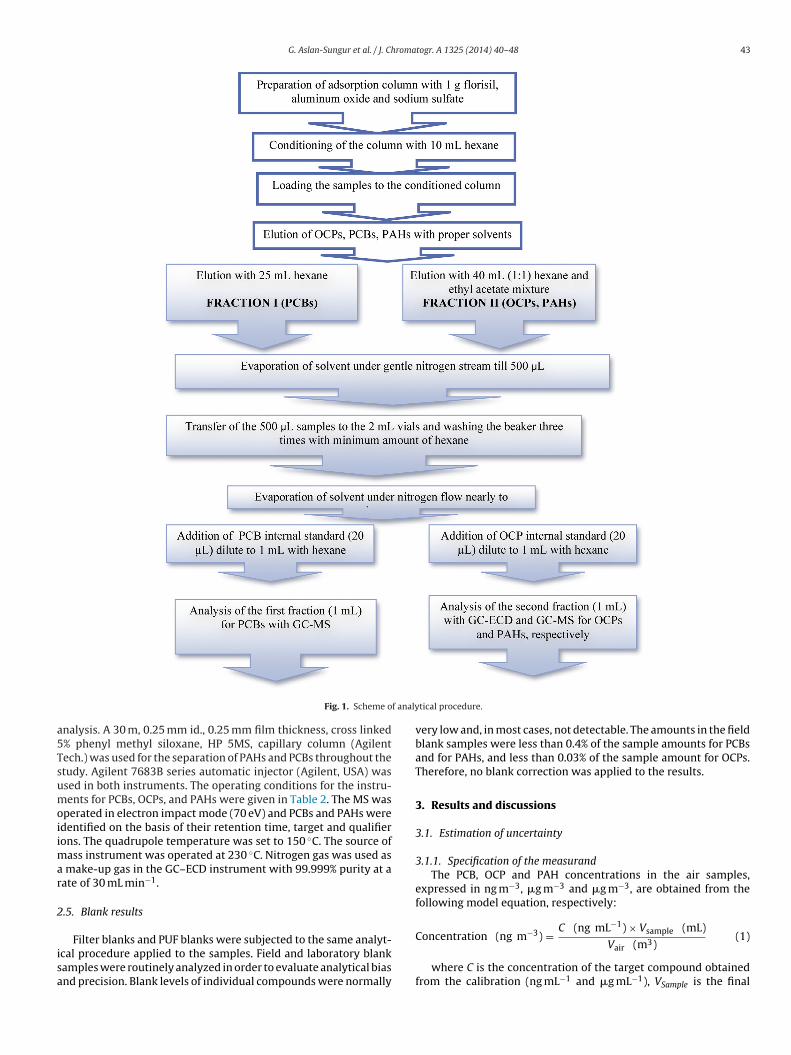
The adsorption column was 10 cm long and 0.5 cm width (diam-eter), and prepared by placing glass wool in the tip of the columnto support sorbent material. Aluminum oxide, florisil, and sodiumsulfate (1 g each) were put in to the column. The sodium sulfatewas used to reduce water and moisture content in the samples onthe top of the column. The analytical procedure after the extractionprocedure is illustrated in Fig. 1.
2.3. Chemicals and materials
All solvents and reagents used in the study were of chro-matographic grade. PCB congener standard (100 �g mL−1), internalstandard (PCB-30 and PCB-204, 100 �g mL−1), and surrogatestandard (PCB-14, PCB-65, PCB-166, 100 �g mL−1) were pur-chased from Absolute Standards (USA). OCP standard solution(2000 �g mL−1) was obtained from Dr. Ehrenstorfer (Germany).OCP internal standard (Pentachloronitrobenzene, 100 �g mL−1)and OCP surrogate solution (2,4,5,6-Tetrachloro-m-xylene andDibutyl chlorendate, 2000 �g mL−1) were obtained from AbsoluteStandards (USA) and Fisher Scientific (UK), respectively. PAH stan-dards (PM 610, 100 �g mL−1) were purchased from AccuStandards(USA). PAH surrogate solution (Acenaphthene-d10, Crysene-d12,Perylene-d12, Phenanthrene-d10, 1000 �g mL−1) was from UltraScientific (USA).
Sodium sulfate, florisil (0.150–0.250 mm) and neutral alu-minum oxide (0.063–0.2 mm) were purchased from MerckCompany (USA). The granulated sodium sulfate was anhydrousand of 99% purity. Glass microfiber filters (90 mm dia., pore size:2.7 �m) were from Whatman Company (USA). All of the sampleswere spiked with surrogate standards prior to their extraction.Prior to extraction, 20 �L of 32 �g mL−1 deuterated PAH mixture,40 �g mL−1 OCP surrogates, and 50 �g mL−1 PCB surrogates wereadded to the samples in order to determine the recovery efficienciesfor checking the internal quality control.
Calibration standards were prepared from the main stock stan-dards with appropriate dilutions with n-hexane. The calibrationcurve with intercept, the coefficient of determination (r2), residualstandard deviation (S) and slope (B1) data were reported in Table 1.All of the stock, intermediate and standard solutions were storedin the refrigerator.
The standard solutions were prepared for the PCBs, OCPs andPAHs at five points. For PCBs calibration, 5, 10, 25, 50, and 100 ppbstandard solutions were used. PCB-30 and PCB-204 were used asinternal standards. PCB-30 as an internal standard was used forthe calculation of PCB-18, PCB-20, PCB-28, PCB-31, PCB-44, PCB-52,PCB-101, PCB-105 and PCB-118. The rest of the PCBs were calcu-lated by using PCB-204 responses. The calibration points were 0.01,0.05, 0.1, 0.2, and 0.5 ppm for OCPs. Pentachloronitrobenzene wasused as an internal standard for OCPs and 20 �L from 1 ppm addedinto standard solutions and samples. The OCPs were analyzed withGC–ECD. The internal standard calibrations were performed forboth PCBs and OCPs, however external calibration was used forPAHs since internal standards were not available in our laboratoryfor PAHs. GC–MS was calibrated with for standard mixtures of PAHsusing the concentrations of 0.1, 0.25, 0.5, 1 and 2 ppm.
2.4. Instrumentation and applied methods
A Hewlett Packard (HP) 6890N series gas chromatographequipped with the electron capture detector (Agilent, USA) wasutilized for analysis of the OCPs. A 60 m, 0.25 mm id., 0.25 �m filmthickness, cross linked 5% phenyl methyl siloxane, HP 1MS, cap-
illary column (Agilent Tech.) and 15 mCi of nickel 63 type ECDdetector was used for separation and detection of OCPs.A HP 6890N series gas chromatograph (Agilent, USA) coupledwith HP 5973 mass spectrometer (Agilent, USA) was used for the
42 G. Aslan-Sungur et al. / J. Chromatogr. A 1325 (2014) 40– 48
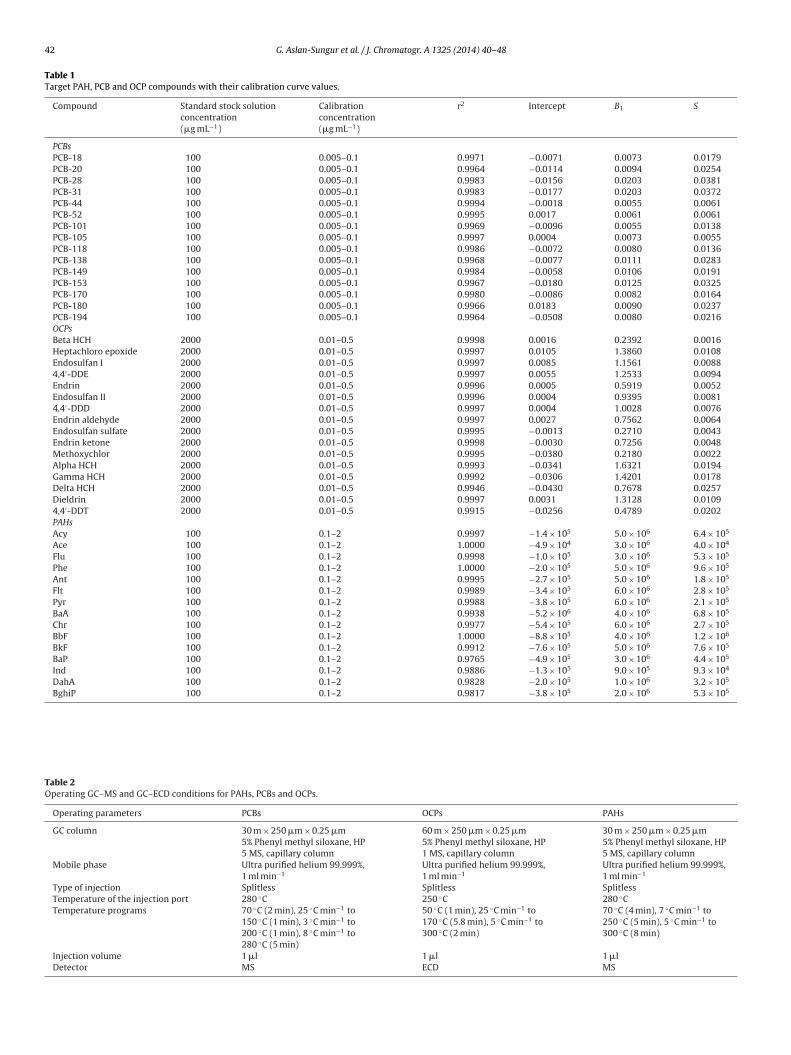
Table 1Target PAH, PCB and OCP compounds with their calibration curve values.
Compound Standard stock solutionconcentration(�g mL−1)
Calibrationconcentration(�g mL−1)
r2 Intercept B1 S
PCBsPCB-18 100 0.005–0.1 0.9971 −0.0071 0.0073 0.0179PCB-20 100 0.005–0.1 0.9964 −0.0114 0.0094 0.0254PCB-28 100 0.005–0.1 0.9983 −0.0156 0.0203 0.0381PCB-31 100 0.005–0.1 0.9983 −0.0177 0.0203 0.0372PCB-44 100 0.005–0.1 0.9994 −0.0018 0.0055 0.0061PCB-52 100 0.005–0.1 0.9995 0.0017 0.0061 0.0061PCB-101 100 0.005–0.1 0.9969 −0.0096 0.0055 0.0138PCB-105 100 0.005–0.1 0.9997 0.0004 0.0073 0.0055PCB-118 100 0.005–0.1 0.9986 −0.0072 0.0080 0.0136PCB-138 100 0.005–0.1 0.9968 −0.0077 0.0111 0.0283PCB-149 100 0.005–0.1 0.9984 −0.0058 0.0106 0.0191PCB-153 100 0.005–0.1 0.9967 −0.0180 0.0125 0.0325PCB-170 100 0.005–0.1 0.9980 −0.0086 0.0082 0.0164PCB-180 100 0.005–0.1 0.9966 0.0183 0.0090 0.0237PCB-194 100 0.005–0.1 0.9964 −0.0508 0.0080 0.0216OCPsBeta HCH 2000 0.01–0.5 0.9998 0.0016 0.2392 0.0016Heptachloro epoxide 2000 0.01–0.5 0.9997 0.0105 1.3860 0.0108Endosulfan I 2000 0.01–0.5 0.9997 0.0085 1.1561 0.00884,4′-DDE 2000 0.01–0.5 0.9997 0.0055 1.2533 0.0094Endrin 2000 0.01–0.5 0.9996 0.0005 0.5919 0.0052Endosulfan II 2000 0.01–0.5 0.9996 0.0004 0.9395 0.00814,4′-DDD 2000 0.01–0.5 0.9997 0.0004 1.0028 0.0076Endrin aldehyde 2000 0.01–0.5 0.9997 0.0027 0.7562 0.0064Endosulfan sulfate 2000 0.01–0.5 0.9995 −0.0013 0.2710 0.0043Endrin ketone 2000 0.01–0.5 0.9998 −0.0030 0.7256 0.0048Methoxychlor 2000 0.01–0.5 0.9995 −0.0380 0.2180 0.0022Alpha HCH 2000 0.01–0.5 0.9993 −0.0341 1.6321 0.0194Gamma HCH 2000 0.01–0.5 0.9992 −0.0306 1.4201 0.0178Delta HCH 2000 0.01–0.5 0.9946 −0.0430 0.7678 0.0257Dieldrin 2000 0.01–0.5 0.9997 0.0031 1.3128 0.01094,4′-DDT 2000 0.01–0.5 0.9915 −0.0256 0.4789 0.0202PAHsAcy 100 0.1–2 0.9997 −1.4 × 10⁵ 5.0 × 10⁶ 6.4 × 10⁵
Ace 100 0.1–2 1.0000 −4.9 × 10⁴ 3.0 × 10⁶ 4.0 × 10⁴
Flu 100 0.1–2 0.9998 −1.0 × 10⁵ 3.0 × 10⁶ 5.3 × 10⁵
Phe 100 0.1–2 1.0000 −2.0 × 10⁵ 5.0 × 10⁶ 9.6 × 10⁵
Ant 100 0.1–2 0.9995 −2.7 × 10⁵ 5.0 × 10⁶ 1.8 × 10⁵
Flt 100 0.1–2 0.9989 −3.4 × 10⁵ 6.0 × 10⁶ 2.8 × 10⁵
Pyr 100 0.1–2 0.9988 −3.8 × 10⁵ 6.0 × 10⁶ 2.1 × 10⁵
BaA 100 0.1–2 0.9938 −5.2 × 10⁶ 4.0 × 10⁶ 6.8 × 10⁵
Chr 100 0.1–2 0.9977 −5.4 × 10⁵ 6.0 × 10⁶ 2.7 × 10⁵
BbF 100 0.1–2 1.0000 −8.8 × 10⁵ 4.0 × 10⁶ 1.2 × 10⁶
BkF 100 0.1–2 0.9912 −7.6 × 10⁵ 5.0 × 10⁶ 7.6 × 10⁵
BaP 100 0.1–2 0.9765 −4.9 × 10⁵ 3.0 × 10⁶ 4.4 × 10⁵
Ind 100 0.1–2 0.9886 −1.3 × 10⁵ 9.0 × 10⁵ 9.3 × 10⁴
DahA 100 0.1–2 0.9828 −2.0 × 10⁵ 1.0 × 10⁶ 3.2 × 10⁵
BghiP 100 0.1–2 0.9817 −3.8 × 10⁵ 2.0 × 10⁶ 5.3 × 10⁵
Table 2Operating GC–MS and GC–ECD conditions for PAHs, PCBs and OCPs.
Operating parameters PCBs OCPs PAHs
GC column 30 m × 250 �m × 0.25 �m 60 m × 250 �m × 0.25 �m 30 m × 250 �m × 0.25 �m5% Phenyl methyl siloxane, HP5 MS, capillary column
5% Phenyl methyl siloxane, HP1 MS, capillary column
5% Phenyl methyl siloxane, HP5 MS, capillary column
Mobile phase Ultra purified helium 99.999%,1 ml min−1
Ultra purified helium 99.999%,1 ml min−1
Ultra purified helium 99.999%,1 ml min−1
Type of injection Splitless Splitless SplitlessTemperature of the injection port 280 ◦C 250 ◦C 280 ◦CTemperature programs 70 ◦C (2 min), 25 ◦C min−1 to
150 ◦C (1 min), 3 ◦C min−1 to200 ◦C (1 min), 8 ◦C min−1 to280 ◦C (5 min)
50 ◦C (1 min), 25 ◦C min−1 to170 ◦C (5.8 min), 5 ◦C min−1 to300 ◦C (2 min)
70 ◦C (4 min), 7 ◦C min−1 to250 ◦C (5 min), 5 ◦C min−1 to300 ◦C (8 min)
Injection volume 1 �l 1 �l 1 �lDetector MS ECD MS
G. Aslan-Sungur et al. / J. Chromatogr. A 1325 (2014) 40– 48 43
f analy
a5Tsumoiimar
2
isa
Fig. 1. Scheme o
nalysis. A 30 m, 0.25 mm id., 0.25 mm film thickness, cross linked% phenyl methyl siloxane, HP 5MS, capillary column (Agilentech.) was used for the separation of PAHs and PCBs throughout thetudy. Agilent 7683B series automatic injector (Agilent, USA) wassed in both instruments. The operating conditions for the instru-ents for PCBs, OCPs, and PAHs were given in Table 2. The MS was
perated in electron impact mode (70 eV) and PCBs and PAHs weredentified on the basis of their retention time, target and qualifierons. The quadrupole temperature was set to 150 ◦C. The source of
ass instrument was operated at 230 ◦C. Nitrogen gas was used as make-up gas in the GC–ECD instrument with 99.999% purity at aate of 30 mL min−1.
.5. Blank results
Filter blanks and PUF blanks were subjected to the same analyt-cal procedure applied to the samples. Field and laboratory blankamples were routinely analyzed in order to evaluate analytical biasnd precision. Blank levels of individual compounds were normally
tical procedure.
very low and, in most cases, not detectable. The amounts in the fieldblank samples were less than 0.4% of the sample amounts for PCBsand for PAHs, and less than 0.03% of the sample amount for OCPs.Therefore, no blank correction was applied to the results.
3. Results and discussions
3.1. Estimation of uncertainty
3.1.1. Specification of the measurandThe PCB, OCP and PAH concentrations in the air samples,
expressed in ng m−3, �g m−3 and �g m−3, are obtained from thefollowing model equation, respectively:
C (ng mL−1) × Vsample (mL)
Concentration (ng m−3) =Vair (m3)(1)
where C is the concentration of the target compound obtainedfrom the calibration (ng mL−1 and �g mL−1), VSample is the final
44 G. Aslan-Sungur et al. / J. Chromatogr. A 1325 (2014) 40– 48
Timer
Flow rate
calibrati on
temperature
calibration
Certified conc.of elements
calibrati on
Concentration obtained from calibration curve
Dilution
calibration temperatureCertified Conc.(IS)
Concentration
Repeatability
Recovery Vsample
Calibration curve
the de
v(
3
tbsVsf
(((((((
tu
ce )2
+ Air
VAir+
Rep+
R(2)
3
tpa
3tcg
u
m
Table 3The manufacturer specification data of analytical volumetric glassware, and POPstandards.
Items Purity (%) Quantity Manufacturer’sspecification
Volumetric flask – 100 mL ±0.014Pipette – 1 mL ±0.0023Air sampler (PUF) – 324 m−3 day−1 ±%10Hexane thermal expansion – – 1.41 × 10⁻³ ◦C−1
PCBs – 100 �g mL−1 ±0.0202
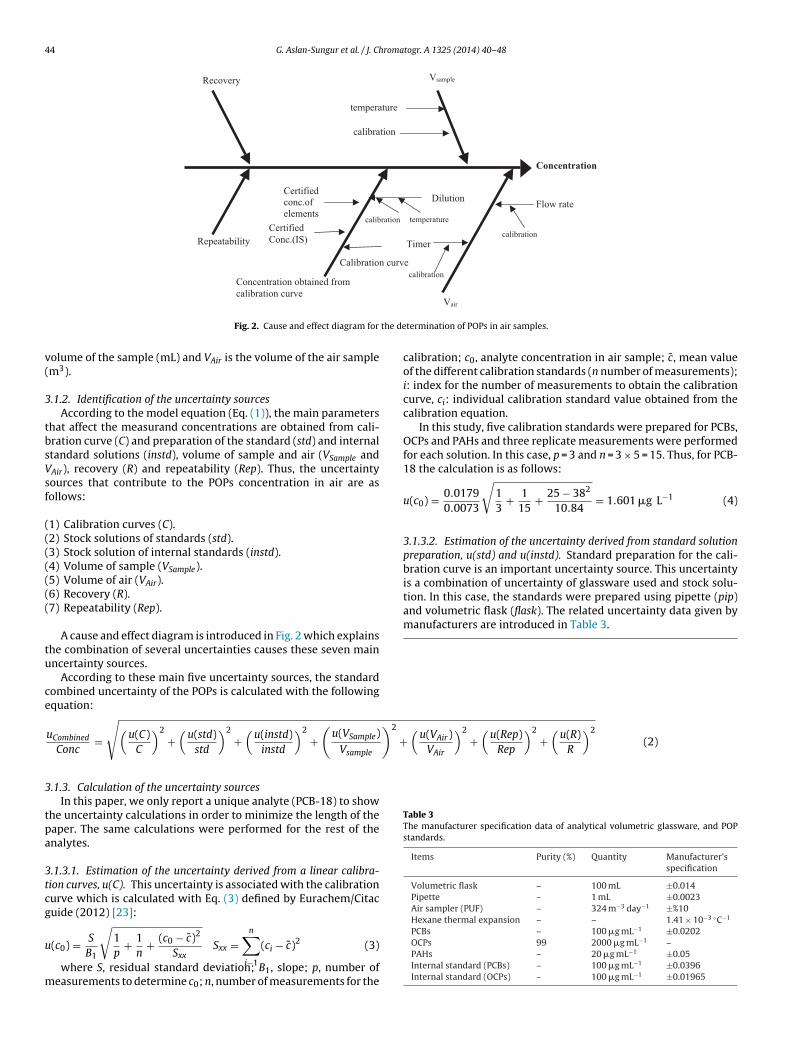
Fig. 2. Cause and effect diagram for
olume of the sample (mL) and VAir is the volume of the air samplem3).
.1.2. Identification of the uncertainty sourcesAccording to the model equation (Eq. (1)), the main parameters
hat affect the measurand concentrations are obtained from cali-ration curve (C) and preparation of the standard (std) and internaltandard solutions (instd), volume of sample and air (VSample andAir), recovery (R) and repeatability (Rep). Thus, the uncertaintyources that contribute to the POPs concentration in air are asollows:
1) Calibration curves (C).2) Stock solutions of standards (std).3) Stock solution of internal standards (instd).4) Volume of sample (VSample).5) Volume of air (VAir).6) Recovery (R).7) Repeatability (Rep).
A cause and effect diagram is introduced in Fig. 2 which explainshe combination of several uncertainties causes these seven mainncertainty sources.
According to these main five uncertainty sources, the standardombined uncertainty of the POPs is calculated with the followingquation:
uCombined
Conc=
√(u(C)
C
)2
+(
u(std)std
)2
+(
u(instd)instd
)2
+(
u(VSample)Vsample
.1.3. Calculation of the uncertainty sourcesIn this paper, we only report a unique analyte (PCB-18) to show
he uncertainty calculations in order to minimize the length of theaper. The same calculations were performed for the rest of thenalytes.
.1.3.1. Estimation of the uncertainty derived from a linear calibra-ion curves, u(C). This uncertainty is associated with the calibrationurve which is calculated with Eq. (3) defined by Eurachem/Citacuide (2012) [23]:√
n
(c0) = S
B1
1p
+ 1n
+ (c0 − c)2
SxxSxx =
∑i−1
(ci − c)2 (3)
where S, residual standard deviation; B1, slope; p, number ofeasurements to determine c0; n, number of measurements for the
Vair
termination of POPs in air samples.
(u(V )
)2 (u(Rep)
)2 (u(R)
)2
calibration; c0, analyte concentration in air sample; c, mean valueof the different calibration standards (n number of measurements);i: index for the number of measurements to obtain the calibrationcurve, ci: individual calibration standard value obtained from thecalibration equation.
In this study, five calibration standards were prepared for PCBs,OCPs and PAHs and three replicate measurements were performedfor each solution. In this case, p = 3 and n = 3 × 5 = 15. Thus, for PCB-18 the calculation is as follows:
u(c0) = 0.01790.0073
√13
+ 115
+ 25 − 382
10.84= 1.601 �g L−1 (4)
3.1.3.2. Estimation of the uncertainty derived from standard solutionpreparation, u(std) and u(instd). Standard preparation for the cali-bration curve is an important uncertainty source. This uncertaintyis a combination of uncertainty of glassware used and stock solu-tion. In this case, the standards were prepared using pipette (pip)and volumetric flask (flask). The related uncertainty data given bymanufacturers are introduced in Table 3.
OCPs 99 2000 �g mL−1 –PAHs – 20 �g mL−1 ±0.05Internal standard (PCBs) – 100 �g mL−1 ±0.0396Internal standard (OCPs) – 100 �g mL−1 ±0.01965
roma
tittbuttut
u
u
pE
u
wmva
tf
u
u
u
u
u
o
m
u
G. Aslan-Sungur et al. / J. Ch
The following Eqs. (5)–(8) are used for calculation of the u(std):
u(std)Cstd
=
√(u(pip)Vpip
)2
+(
u(stock)Cstock
)2
+(
u(flask)Vflask
)2
(5)
where u(pip) is the uncertainty of the pipette and u(stock) ishe uncertainty of the stock solution. Calculation of the u(pip)s the combination of the uncertainty comes from the calibra-ion of the pipette [u(pipcal)], and the uncertainty source fromhe temperature effect [u(temp)]. Preparing the standard solutiony using a flask, u(flask), and the purity of the stock solution,(purity) or uncertainty of stock solution, u(stocksoln) should beaken into account in the uncertainty calculation of standard solu-ion. In order to prepare 1000 �g L−1 standard solution, we aresing 100 �g mL−1 PCB stock solution with 0.0202 �g L−1 uncer-ainty (k = 2).
(pip) =√
(u(pipcal))2 + (u(temp))2 (6)
(flask) =√
(u(flaskcal))2 + (u(temp))2 (7)
The temperature effect is the result of the variation in tem-erature in laboratory which is generally accepted as ± 3 ◦C inurachem/Citac guide [23].
(temp) = 3 × V × Q
1.73(8)
here u(temp), standard uncertainty of the temperature effect; V,easured volume (e.g. 1 mL for pipette); and Q, the coefficient of
olume expansion of the hexane (Qhexane: 1.41 × 10⁻³ ◦C−1). Rect-ngular distribution is accepted.
According to the equations given below and the necessary dataaken from Table 3, the calculations were performed for PCB-18 asollows:
(temp) = 3 × 1 × 1.41 × 10−3
1.73= 0.0024 mL for pipette (9)
(temp) = 3 × 100 × 1.41 × 10−3
1.73= 0.014 mL for flask (10)
(pip) =√
(0.0023)2 + (0.0024)2 = 0.0034 mL (11)
(stocksoln) = 20.2k
= 20.22
= 10.1 �g L−1 (12)
or
(purity) = 1 − 0.991.73
= 0.0058 for OCP stock solution (13)
where the k is the coverage factor that is used in the calculationf the expanded uncertainty (k is taken as 2 in the certificate).
u(std)1000
=√(
0.014100
)2+
(10.1
100000
)2+
(0.0034
1
)2
= 0.00415 �g L−1
u(std) = 4.15 �g L−1
(14)
The same calculation procedure for u(std) was followed to esti-
ate the u(instd) and the same result for PCB-18 was obtained:(instd) = 4.15 �g L−1 (15)
togr. A 1325 (2014) 40– 48 45
3.1.3.3. Estimation of the uncertainty derived from sample volumeu(VSample) and air volume u(VAir). The sample volume was takenas 1 mL using pipette, which means that the pipette uncertainty[u(pip)] (Eq. (6)) is the source of u(Vsample). According to Eq. (6), theu(pip) was calculated for PCB-18 as 0.0034 mL, so:
u(VSample) = 0.0034 mL (16)
Air sampling was carried out with high volume PUF sampleradjusted to 0.225 m3 min−1 flow rate for 24 h. The volume of aircollected in a day is equal to 324 m3. The manufacturer specifi-cation uncertainty for the air sampler is ±%10 (Table 3), thus theuncertainty comes from the air volume is as follows:
u(VAir) = 32.4 m3 (17)
3.1.3.4. Estimation of the uncertainty derived from recovery, u(Rrep).Repeatability of the analysis gives the variation among the analyseswhich is defined with standard deviation of the successive analy-sis. The repetition of the analysis for each analyte (three times)was performed in different days. The uncertainty comes from therepeatability is calculated by using the following equation:
u(Rep) = RSD√n
(18)
where RSD is the relative standard deviation that is obtained bydividing the standard deviation to the mean of the analysis and nis the number of the repetition (in this case, n = 3).
In this study, percent recovery of the analyte was determinedthree times that is reported in Table 4 with their mean of recovery(%), standard deviation (STD) and RSD. According to Table 4, u(Rep)for PCB-18 is calculated as:
u(Rep) = 0.054√3
= 0.031 (19)
3.1.3.5. Estimation of the uncertainty derived from recovery, u(R).Recovery experiments were repeated three times for each ana-lyte (Table 4) by applying extraction procedure. Recovery (R) canbe obtained from Cobs/CCRM where Cobs: observed concentrationafter extraction, CCRM: the CRM concentration. In this study, 1 ppmCRMs was prepared and after extraction, cleanup and analysis, theobserved mean values reported as mean recovery (%) in Table 4.Uncertainty term for recovery (R) can be calculated by using thefollowing equation:
u(R) = R
√(u(Cobs)
Cobs
)2
+(
u(CCRM)CCRM
)2
(20)
For PCB-18:
u(Cobs) = 0.054√3
= 0.031 (21)
RPCB-18 = Cobs
CCRM= 0.74 ppm
1 ppm= 0.74 (22)
u(CCRM−PCB−18) = Uncertainty for 1 ppmk
= 8.308 × 10⁻³
2
= 4.15 × 10⁻³ �g L−1 (23)
where uncertainty for 1 ppm was calculated using the uncer-tainty values from the certificate results of CRM and 1 pipette and100 mL capacity volumetric flask (Table 3) as in the case of prepar-ing the standard solution.
46 G. Aslan-Sungur et al. / J. Chromatogr. A 1325 (2014) 40– 48
Table 4Mean recovery results with three replicates (n), standard deviation (STD) and rela-tive standard deviation (RSD) for POPs.
Compound n Meanrecovery (%)
STD RSD
PCBsPCB-18 3 74 4 0.054PCB-20 3 77 6.6 0.0857PCB-28 3 75 5.4 0.072PCB-31 3 70 5.4 0.077PCB-44 3 90 4 0.044PCB-52 3 83 4.9 0.059PCB-101 3 105 3.2 0.031PCB-105 3 105 3.7 0.035PCB-118 3 93 3 0.032PCB-138 3 103 2.8 0.027PCB-149 3 78 4.6 0.059PCB-153 3 101 3.5 0.035PCB-170 3 102 3.6 0.035PCB-180 3 98 4.7 0.048PCB-194 3 106 3.7 0.035
OCPsBeta BHC 3 82 8.0 0.098Heptachloro epoxide 3 74 11.1 0.150Endosulfan I 3 82 8.0 0.0984,4′-DDE 3 101 10.8 0.107Endrin 3 91 2.6 0.029Endosulfan II 3 95 8.8 0.0934,4′-DDD 3 79 15.7 0.197Endrin aldehyde 3 90 4.2 0.047Endosulfan sulfate 3 101 13.1 0.130Endrin ketone 3 98 6.2 0.063Methoxychlor 3 92 13.2 0.144Alpha HCH 3 49 6.4 0.130Gamma HCH 3 73 13.1 0.180Delta HCH 3 80 3.1 0.039Dieldrin 3 96 12.8 0.1344,4′-DDT 3 94 5.8 0.062
PAHsAcy 3 66 14 0.098Ace 3 56 9.1 0.150Flu 3 81 8.8 0.098Phe 3 86 6.4 0.107Ant 3 90 5.4 0.029Flt 3 107 3.7 0.093Pyr 3 99 5.8 0.197BaA 3 108 4.5 0.047Chr 3 112 7.9 0.130BbF 3 118 8.5 0.063BaP 3 115 4.7 0.144BkF 3 102 4 0.130Ind 3 109 5.2 0.180
u
a
tc
Table 5Calculation of relative uncertainty (%) for PCB-18 in air samples.
PCB-18 Value (X) u(X) u(x)/X
Std solution (�g L−1) 1000 4.15 0.00415Internal standard (�g L−1) 1000 4.15 0.00415Volume of air (m3) 324 32.4 0.1Volume of sample (mL) 1 3.4 × 10⁻³ 0.0034Calibration uncertainty (�g L−1) 25 1.60 0.064Recovery 0.74 0.134 0.181Repeatability 1 0.031 0.031Relative combined uncertainty 0.2264Measurement result (�g L−1) 0.01Standard combined uncertainty 2.26 × 10⁻³
)2+
2.2
DahA 3 114 7.4 0.039BghiP 3 113 6.3 0.134
Then, substituting Eqs. (21)–(23) into Eq. (24) for PCB-18:
(R) = 0.74
√(0.0310.74
)2+
(4.15 × 10⁻³
1
)2
= 0.031 (24)
The u(R) and recovery factor (R) values were calculated for eachnalyte according to formulas (20)–(24). The R values should be
uCombined
0.01=
√(1.6025
)2+
(4.151000
)2+
(4.151000
uCombined =
ested whether they should be taken into consideration during thealculation of the analyte concentration in the sample or not. To
Expanded uncertainty (k = 2) 4.53 × 10⁻³
Relative uncertainty (%) 45
achieve this purpose, significance test should be applied on R; if Ris significantly different from 1, then the model equation shouldbe corrected by adding R into the model equation. The significancetest statistic t was calculated using Eq. (25).
t =∣∣1 − R
∣∣u(R)
(25)
This t value was compared with two-tailed critical values (tcritic)at 95% confidence level (in this case tcritic is 2.92 for 3 replicates).The significance test result for PCB-18 obtained as follows:
t =∣∣1 − 0.74
∣∣0.031
= 8.39 (26)
So; t > tcritic which indicates that R value was significantly differ-ent from 1 indicates that R value should be included into the modelequation.
The R values were estimated and tested for the other analytesand the following analytes do not require any correction with Rin their model equations (i.e. t < tcritic): PCB-194, PCB-180, PCB-170, PCB-153, PCB-138, PCB-105, PCB-101, 4,4′-DDE, Endosulfan II,4,4′-DDD, Endosulfan sulfate, Methoxychlor, Gamma HCH, Dield-rin, 4,4′-DDT, Ant, Pyr, BaA, Chr, BbF, and BaP.
In general case, applying this R factor correction in the modelequation is not the practical way thus Yenisoy-Karakas [24] sug-gested that the bias comes from this uncorrected term should beconsidered in calculation of u(R) and the following equation wasdefined:
u(R′) =√(
1 − R
k
)2+ (u(R))2 (27)
u(R′) calculation for PCB-18:
u(R′) =√(
1 − 0.742
)2+ (0.032)2 = 0.134 (28)
3.1.4. Estimation of the combined uncertaintyThe combined uncertainty was calculated by using Eq. (2) for
each analyte and PCB-18 is given as an example calculation in Eq.(29):
(0.0034
1
)2+
(32.4324
)2+
(0.031
1
)2+
(0.1340.74
)2
6 × 10⁻³ �g L−1
(29)
Table 5 summarizes the calculation of relative uncertainty forPCB-18. The relative uncertainty results for all PCBs, OCPs and PAHsare introduced in Table 6.
G. Aslan-Sungur et al. / J. Chromatogr. A 1325 (2014) 40– 48 47
Table 6Results of combined uncertainty (UCombined) and relative uncertainty (%) for all POP analytes.
PCBs uCombined (×10−3) Relativeuncertainty (%)
OCPs uCombined (×10−3) Relativeuncertainty (%)
PAHs uCombined Relativeuncertainty (%)
PCB-18 2.19 45 Beta BHC 8.0 32 Acy 0.039 74PCB-20 1.08 43 Hep. epoxide 10 41 Ace 0.045 90PCB-28 1.09 43 Endosulfan I 8.0 32 Flu 0.030 46PCB-31 1.29 52 4,4′-DDE 6.8 27 Phe 0.030 46PCB-44 0.67 27 Endrin 5.9 24 Ant 0.014 26PCB-52 0.81 32 Endosulfan II 6.6 27 Flt 0.013 24PCB-101 0.67 27 4,4′-DDD 11 44 Pyr 0.012 23PCB-105 0.59 24 End. aldehyde 6.1 24 BaA 0.025 35PCB-118 0.64 26 End. sulfate 7.5 30 Chr 0.014 27PCB-138 0.66 26 Endrin ketone 5.8 23 BbF 0.154 64PCB-149 0.97 39 Methoxychlor 8.2 33 BkF 0.024 35PCB-153 0.67 27 Alpha HCH 15 59 BaP 0.022 32PCB-170 0.63 25 Gamma HCH 11 46 Ind 0.017 28
9.2
7.6
9.2
3
fFo
PCB-180 0.69 27 Delta HCH
PCB-194 0.69 28 Dieldrin
4,4′-DDT
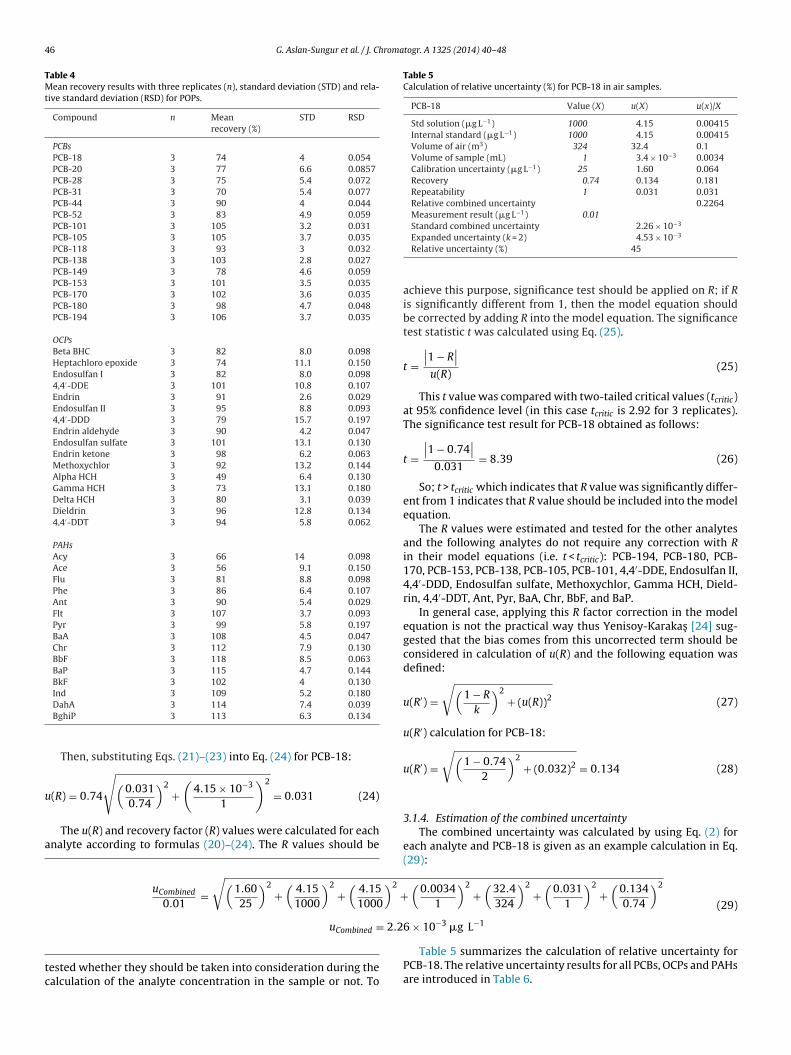
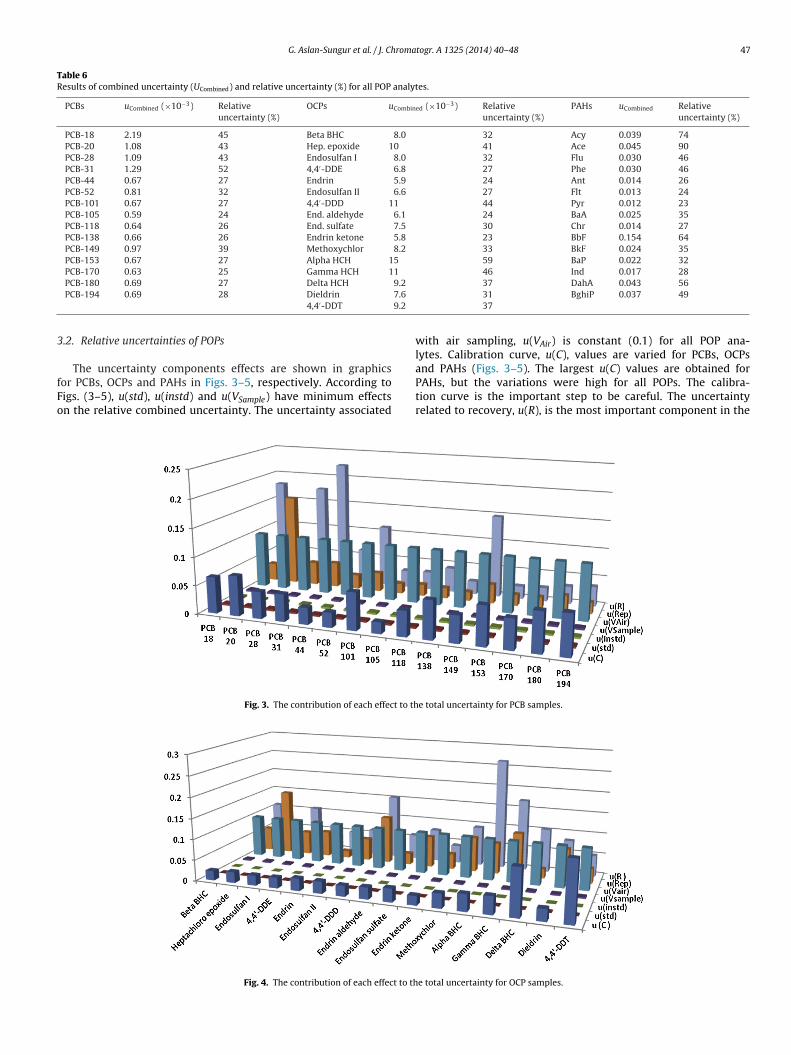
.2. Relative uncertainties of POPs
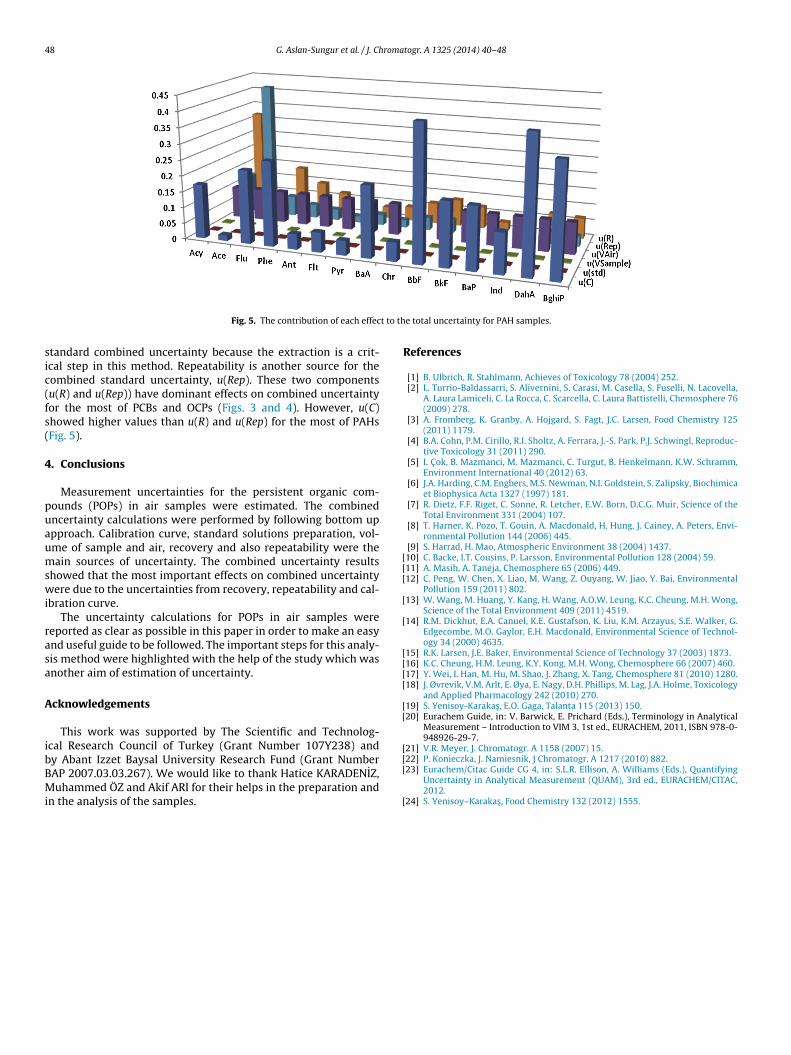
The uncertainty components effects are shown in graphicsor PCBs, OCPs and PAHs in Figs. 3–5, respectively. According toigs. (3–5), u(std), u(instd) and u(VSample) have minimum effectsn the relative combined uncertainty. The uncertainty associated
Fig. 3. The contribution of each effect to th
Fig. 4. The contribution of each effect to th
37 DahA 0.043 5631 BghiP 0.037 4937
with air sampling, u(VAir) is constant (0.1) for all POP ana-lytes. Calibration curve, u(C), values are varied for PCBs, OCPs
and PAHs (Figs. 3–5). The largest u(C) values are obtained forPAHs, but the variations were high for all POPs. The calibra-tion curve is the important step to be careful. The uncertaintyrelated to recovery, u(R), is the most important component in thee total uncertainty for PCB samples.
e total uncertainty for OCP samples.
48 G. Aslan-Sungur et al. / J. Chromatogr. A 1325 (2014) 40– 48
t to th
sic(fs(
4
puaumswi
rasa
A
ibBMi
[[[
[
[
[[[[
[[
[
Fig. 5. The contribution of each effec
tandard combined uncertainty because the extraction is a crit-cal step in this method. Repeatability is another source for theombined standard uncertainty, u(Rep). These two componentsu(R) and u(Rep)) have dominant effects on combined uncertaintyor the most of PCBs and OCPs (Figs. 3 and 4). However, u(C)howed higher values than u(R) and u(Rep) for the most of PAHsFig. 5).
. Conclusions
Measurement uncertainties for the persistent organic com-ounds (POPs) in air samples were estimated. The combinedncertainty calculations were performed by following bottom uppproach. Calibration curve, standard solutions preparation, vol-me of sample and air, recovery and also repeatability were theain sources of uncertainty. The combined uncertainty results
howed that the most important effects on combined uncertaintyere due to the uncertainties from recovery, repeatability and cal-
bration curve.The uncertainty calculations for POPs in air samples were
eported as clear as possible in this paper in order to make an easynd useful guide to be followed. The important steps for this analy-is method were highlighted with the help of the study which wasnother aim of estimation of uncertainty.
cknowledgements
This work was supported by The Scientific and Technolog-cal Research Council of Turkey (Grant Number 107Y238) and
y Abant Izzet Baysal University Research Fund (Grant NumberAP 2007.03.03.267). We would like to thank Hatice KARADENIZ,uhammed ÖZ and Akif ARI for their helps in the preparation andn the analysis of the samples.
[[
[
e total uncertainty for PAH samples.
References
[1] B. Ulbrich, R. Stahlmann, Achieves of Toxicology 78 (2004) 252.[2] L. Turrio-Baldassarri, S. Alivernini, S. Carasi, M. Casella, S. Fuselli, N. Lacovella,
A. Laura Lamiceli, C. La Rocca, C. Scarcella, C. Laura Battistelli, Chemosphere 76(2009) 278.
[3] A. Fromberg, K. Granby, A. Hojgard, S. Fagt, J.C. Larsen, Food Chemistry 125(2011) 1179.
[4] B.A. Cohn, P.M. Cirillo, R.I. Sholtz, A. Ferrara, J.-S. Park, P.J. Schwingl, Reproduc-tive Toxicology 31 (2011) 290.
[5] I. C ok, B. Mazmanci, M. Mazmanci, C. Turgut, B. Henkelmann, K.W. Schramm,Environment International 40 (2012) 63.
[6] J.A. Harding, C.M. Engbers, M.S. Newman, N.I. Goldstein, S. Zalipsky, Biochimicaet Biophysica Acta 1327 (1997) 181.
[7] R. Dietz, F.F. Riget, C. Sonne, R. Letcher, E.W. Born, D.C.G. Muir, Science of theTotal Environment 331 (2004) 107.
[8] T. Harner, K. Pozo, T. Gouin, A. Macdonald, H. Hung, J. Cainey, A. Peters, Envi-ronmental Pollution 144 (2006) 445.
[9] S. Harrad, H. Mao, Atmospheric Environment 38 (2004) 1437.10] C. Backe, I.T. Cousins, P. Larsson, Environmental Pollution 128 (2004) 59.11] A. Masih, A. Taneja, Chemosphere 65 (2006) 449.12] C. Peng, W. Chen, X. Liao, M. Wang, Z. Ouyang, W. Jiao, Y. Bai, Environmental
Pollution 159 (2011) 802.13] W. Wang, M. Huang, Y. Kang, H. Wang, A.O.W. Leung, K.C. Cheung, M.H. Wong,
Science of the Total Environment 409 (2011) 4519.14] R.M. Dickhut, E.A. Canuel, K.E. Gustafson, K. Liu, K.M. Arzayus, S.E. Walker, G.
Edgecombe, M.O. Gaylor, E.H. Macdonald, Environmental Science of Technol-ogy 34 (2000) 4635.
15] R.K. Larsen, J.E. Baker, Environmental Science of Technology 37 (2003) 1873.16] K.C. Cheung, H.M. Leung, K.Y. Kong, M.H. Wong, Chemosphere 66 (2007) 460.17] Y. Wei, I. Han, M. Hu, M. Shao, J. Zhang, X. Tang, Chemosphere 81 (2010) 1280.18] J. Øvrevik, V.M. Arlt, E. Øya, E. Nagy, D.H. Phillips, M. Lag, J.A. Holme, Toxicology
and Applied Pharmacology 242 (2010) 270.19] S. Yenisoy-Karakas , E.O. Gaga, Talanta 115 (2013) 150.20] Eurachem Guide, in: V. Barwick, E. Prichard (Eds.), Terminology in Analytical
Measurement – Introduction to VIM 3, 1st ed., EURACHEM, 2011, ISBN 978-0-948926-29-7.
21] V.R. Meyer, J. Chromatogr. A 1158 (2007) 15.
22] P. Konieczka, J. Namiesnik, J Chromatogr. A 1217 (2010) 882.23] Eurachem/Citac Guide CG 4, in: S.L.R. Ellison, A. Williams (Eds.), QuantifyingUncertainty in Analytical Measurement (QUAM), 3rd ed., EURACHEM/CITAC,2012.
24] S. Yenisoy–Karakas , Food Chemistry 132 (2012) 1555.


