Embed Size (px)
Citation preview

noh loc ge yTf ao n
det
Muti ats n
n aI g
a e
k m
o eh ns tA
V ia sra an
E
T
S
T
M
2
0
1
7

On
Emerging Trends in Science, Technology and
Management (ETSTM-2017)
Organized by
Ashoka Institute of Technology and Management,Varanasi-221007, Uttar Pradesh, India
11th and 12th November 2017

Copyright @ 2017, Ashoka Institute, Varanasi
First Edition: November, 2017
All rights reserved.
No part of this book may be reproduced in any form, by Photostat, microfilm, xerography, or any other means, or incorporatedinto any information retrieval system, electronic or mechanical, without the written permission of the copyright owner.
ISBN: 978-93-5281-325-4Rs. 500 (INR)
Publishing for one world.Ashoka Institute of Technology and Management,Engineering Chauraha, Paharia, Sarnath, Varanasi-221007, Uttar Pradesh, India.Visit us at: www.ashokainstitute.com,Email: [email protected]

CONFERENCE ORGANIZING COMMITTEE
Chief PatronProf. Vinay Kumar Pathak, Hon’ble, Vice Chancellor, AKTU, Lucknow
Er. Ashok Maurya, Founder Chairman, Ashoka Institute
PatronsEr. Ankit Maurya, Chairman
Mr. Amit Maurya, Vice-Chairman
Conference DirectorProf. Sarika Shrivastava
ConvenerDr. Ramjeet Singh Yadav, Assoc. Prof., CSE
Co-ConvenerMr. Rajendra Tewari, Asst. Prof. (Mgmt.)
Organising Committee
Technical SupportMr. Randip Sharma
Mr. Ajay
Mr. Maneesh Kumar Maurya
Er. S.S. Kushwaha, Dean
Mr. Ashim Dev, Registrar
Dr. Brijesh Singh, Assoc. Prof. (Pharmacy)
Dr. Ajay Bhushan Prasad (Humanities)
Dr. A. Maurya (Mathematics)
Dr. Amit Kumar Patel (Chemistry)
Mr. Niraj Kr. Rai (Physics)
Mr. R.K. Yadav (ME)
Mr. Somendra Banarjee, Asst. Prof. (EE)
Mr. Sandeep Kumar Mishra, Asst. Prof. (ECE)
Mr. Dharmendra Dubey, Asst. Prof.(CE)
Dr. Nitin Verma, Asst. Prof. (BT)
Ms. Reetika Nagar, Asst. Prof. (Bio.Tech.)
Mr. Arvind Kumar, Asst. Prof. (CSE)

TECHNICAL ADVISARY COMMITTEEProf. S.N. Upadhyay, Former Director, IIT, BHU, Varanasi
Prof. P.S. Dubey, Director General, Ex-Professor, IIT-BHU
Prof. R. Shankar, (DST-Ramanna, UGC-Emeritus Fellow & BHU-Distinguished
Professor), Atomic Physics Laboratory, BHU, Varanasi
Prof. H.P. Mathur, Institute of Management, BHU, Varanasi, UP, India
Prof. A.K. Agrawal, Department of Mechanical Engineering, IIT, BHU, Varanasi
Prof. B. Mishra, Department of Pharmaceutical Engineering, IIT, BHU, Varanasi
Prof. Lalmani, Managing Director, Ex-Professor, NIT, Srinagar
Prof. Anurag Mishra. Director, Pharmacy, AITM, Varanasi
Prof. Bharti Diwivedi, Professor, IET, Lucknow
Prof. K.S. Verma, Director, REC, Ambedkar Nagar
Dr. Anurag Tripathi, Department of Electrical Engineering, IET, Lucknow
Dr. Biswajit Maity, Scientist Biochemistry Division, CDRI, Lucknow, UP, India
Prof. S. Chatterjee, NITTTR, Chandigarh
EDITORIAL BOARDEditor
Dr. Ramjeet Singh Yadav
Associate Editor
Dr. Brijesh Singh
Designer in Chief
Mr. Arvind Kumar

PREFACE
Throughout the world, nations have started recognizing that emerging trends inScience, Technology and Management is now acting as a catalyst in speeding up theeconomic activities in efficient governance, citizens’ empowerment and in improvingthe quality of human life. Recent developments in Science and Technology havetouched almost every conceivable area of human life. Emergence of Science,Technology and Management on the national agenda, witnesses the impact of allbranch of Technology, Pharmacy and Management on good governance, sustainabledevelopment, globalization of economy and social empowerment. In light of this, thetheme, emerging trends in Science, Technology and Management, is very muchrelevant and timely, even now.The objective was to bring the eminent, scientists, researchers, industrialists,technocrats, government representatives, social visionaries and experts from all strataof society, under one roof, to explore the new horizons of innovative technology toidentify opportunity and define the path forward. This new path should eliminateisolation, discourage redundant efforts and promote scientific progress aimed toaccelerate India’s overall growth to prominence on the International front andcontribute effectively to realize and achieve the Mission of Honorable Prime MinisterShri Narendra Modi of being development Nation. The conference will feature regularpaper presentation sessions, invited talks, key note addresses, panel discussions andposter exhibitions.This conference attracted researchers and practitioners from academia, industry andgovernment agencies, in order to exchange ideas and share their valuable experience.Over 150 papers were received; till the last date; thereby making the job of thetechnical programme committee extremely difficult. After a series of tough reviewexercises, 71 papers were recommended to be accepted for presentation in ETSTM-2017 during the two days under parallel tracks. Out of 150 papers, a set of 71 paperswere further recommended for publication in the hard copy of the ConferenceProceeding. These papers represent wide variety of research topics in all the emergingareas of Science, Technology and Management. Some of the application orientedpapers may not be very rich in technical content, but provide extensive informationabout the new areas where computing can really be useful for the overall prosperity ofthe mankind which in turn might facilitate the overall growth in the country. I amsure, these contributions will definitely enrich our knowledge and motivate many ofus to take up these challenging application areas and contribute effectively for theglobal development of Technology and Management.I would like to thank our Hon’ble Founder Chairman-Ashoka Institute, Er. AshokMaurya who is always a constant source of inspiration for young generation, forhaving given me this noble opportunity at Ashoka Institute of Technology andManagement, Varanasi. I would also like to thank Hon’ble Er. Ankit Maurya,Chairman and Mr. Amit Maurya, Vice-Chairman, Ashoka Institute, for giving me allencouragements, support and a path aimed to quality and excellence, comparable tothe best in the world.

We are grateful to a number of people without whom we would not have been able tosuccessfully organize this mega event. On behalf of the organizing committee, I thankto my esteemed authors for having shown confidence in us and considered ETSTM-2017, a platform to showcase and share their original research work. I wish to expressmy gratitude to my focused and dedicated team of Chairs and Co-Chairs, members ofthe National Advisory Committee, Technical Programme Committee, LocalProgramme Committee, Web Administration and Content Development Committee,Management Committee, my team of Teaching and Non-teaching staff members andfinally my students for being a great source of strength to me in making this eventsuccessfully.I am personally thankful to Prof. Sarika Shrivastava, Director Conference andDirector, Ashoka Institute, for having offered their technical support and helped me atall the difficulty and critical times in the whole process of making this Conferencegreat success.I am also thankful to Prof. P.S. Dube-Director General, Prof. Anurag Mishra- DirectorPharmacy, Prof. Lalmani-Managing Director, Mr. Ashim Dev-Registrar, helped mefor making this conference success.Those who have organized conferences of this magnitude, edited and compiled suchConference Proceeding know the amount of time and effort that goes into such aproject. Anyone who is related to the editor can tell you at whose expense that timewas spent. Mere thanks to Dr. Brijesh Singh, Mr. Rajendra Tewari and All Head ofDepartments of the Ashoka Institute, seem small as compared to tremendous supportand indulgence they gave and tolerated me all along, while I devoted my time inplanning the Conference and editing and compiling the Proceedings.Finally, I am thankful to one and all, who have contributed or indirectly in makingthis conference successful.Tremendous amount of efforts put in to compile this huge and voluminous Proceedingwill be successful only if these papers could motivate some of us in taking the majorEmerging Trends in Science, Technology and Management for a huge country likeIndia, in the coming years.Last but not the least, I take this opportunity to give the credit of successfully bringingout this Proceedings to my team, one and all, and personally own the responsibility ofall errors, deficiencies and shortcomings. As the available time was very short, inspite of our best efforts to produce a quality publication with a consistent format,errors may remain. I apologies to our readers and contributors for that and requestthem to kindly send/e-mail their criticism and suggestions, which will be vital for theimprovement.
Dr. Ramjeet Singh YadavEditor and Convener of Conference

Message from Founder Chairman
“Acknowledgment is an art, one can write glib stanzas without meaning a word
on the other hand can make a simple expression of gratitude.”
It is with pleasure that I wish to welcome organizers, participants, faculty and
delegates at this prestigious conference. It is an occasion of honour and privilege that
Ashoka Institute of Technology and Management, Varanasi, is organizing its National
Conference on the topic “Emerging Trends in Science, Technology and
Management (ETSTM-2017)”, on November 11th and 12th 2017. The aim of the
National Conference is to give a chance to the researchers and academicians to
present their approaches towards latest technology and interact with one another.
We place on record and warmly acknowledge the continuous encouragement,
invaluable supervision, timely suggestions and inspired guidance offered by everyone
involved with the conference in order to make it a success.
(Er. Ashok Maurya)
Message from Honourable Vice-Chancellor
“Everything is energy and that’s all there is to it. Match the frequency of the reality
you want and you cannot help but get that reality. It can be no other way. This is not
philosophy. This is physics.” – Albert Einstein.
Ashoka Institute at Varanasi, right from its inception, has been devoted towards the
creation of an up-to-date academic environment for its students and research scholars.
With the commitment of highly qualified and efficient staff, the school endeavors
vigorously to make a mark in the field of research and development.
The National Conference organized by the Ashoka Institute of Technology and
Management, Varanasi on “Emerging Trends in Science, Technology and
Management (ETSTM-2017)” is another venture to provide a platform for
academicians – teachers, students, research scholars and industry personnel – all over
the nation to discus on contemporary trends and innovations in Science, Technology
and Management which is of nation’s utmost importance.
I wish the conference all the very best and urge all the participants to brainstorm the
various thrust areas of the conference.
Let the good work continue forever and forever…Best Wishes.
Prof. Vinay Kumar Pathak
Vice Chancellor
Dr. A.P.J. Abdul Kalam Technical University,
Lucknow

Message from Chairman
Participation to this conference provides a platform for the learners and researchers to
communicate their findings to greater scientific community and strengthens their
commitment to the pursuit of their career in advanced technologies.
It is a moment of pride for me to welcome all scholars and delegates to the National
Conference on “Emerging Trends in Science, Technology and Management”
(ETSTM-2017) on 11th-12th November 2017.
Research plays a crucial role in economics that value knowledge, creation and
innovation. The conference will also give an opportunity to showcase the vibrant
academic atmosphere to the scholars to have pace with the trends of happenings in the
fields of technology and sciences, i.e. to be inculcated for being a perfect blend for the
corporate today. It's expected that deliberations from research scholars, faculty
members, invited speakers from various walks of life and dignitaries shall enrich and
fortify the knowledge domain.
(Er. Ankit Maurya)

Message from Vice Chairman
I am happy to know that Ashoka Institute of Technology and Management, Varanasi
is organizing a National Conference on Emerging Trends in Science, Technology
and Management (ETSTM-2017) during November 11-12, 2017. I am sure the
conference will provide a common platform to eminent academicians, scientists and
researchers as well as to students to deliberate over the subject and share their views
on the concerned topic which will lead to more in depth study and research. I wish the
Conference a grand success.
(Amit Maurya)

Message from Director General
I am pleased to know that Ashoka Institute of Technology and Management, Varanasi
is organizing a two days National Conference on Emerging Trends in Science,
Technology and Management (ETSTM-2017) during November 11-12, 2017.
As perfection should be understood in terms of scope and limitation of a problem,
which an innovative brain chases in order to bring an ease to the common people in
the society. And for the same an intellectual explores and exploits available resources
in a way that not only achieve comfort but also bring in harmony. I wish the
pertaining issues would be dealt by the experts of the field in this upcoming
conference.
I wish them grand success in their mission ahead.
(Prof. P.S. Dube)
Message from Director
National Conference on Emerging Trends in Science, Technology and
Management (ETSTM-2017) is being organized to provide an opportunity for
desired interaction amongst academicians and delegates from different fields of
expertise and those employing Research as tool in different fields of Engineering and
Technology.
The ETSTM-2017 will focus on current developments of pure and applied sciences
and various interdisciplinary fields as Mechanical Modelling, Bioinformatics,
Artificial Intelligence, Non-linear Dynamics, Manufacturing Technology, Nano
Technology, Computer Technology, Pharmacy, Electrical Engineering, Bio-
Technology etc. Invited talks by distinguished scientists and presentation of research
papers will constitute various sessions during the conference.
Wishing good luck and success to the team for all its efforts.
(Prof. Sarika Shrivastava)

Message from Director Pharmacy
It gives me immense pleasure to convey my best wishes for the National Conference
on Emerging Trends in Science, Technology and Management (ETSTM-2017)
scheduled to be held on November 11th and 12th, 2017 and organized by Ashoka
Institute of Technology and Management, Varanasi.
A conference provides an opportunity to the aspirants who really want to make a
difference in the world. The right use of could only be possible by selection/rejection
of information and data for collection in order to come forward with new and safer
ideas that once put into reality will be the difference to itself, that would cater
eventually to individual as well as national growth.
The above could only be possible if the researchers and industry people working in
technologies, system design and other related sub areas, are brought under one
umbrella to enable exchange of ideas and interaction between them for the
advancement of field of Science, Technology and Management.
I wish for the same to be brought into reality.
(Prof. Anurag Mishra)

Message from Managing Director
“Demand of the time is to have an effective approach in research and development,
where the expert guidance of valued personas shall render their spirit of knowledge to
the seeking scholars to arise a never ending journey to the knowledge of theory.”
In accordance to the statement above us the family of educators intends to organize a
two days National Conference on “Emerging Trends in Science, Technology and
Management” (ETSTM-2017) on 11th- 2th November 2017.
I wish that congregations of intellectuals not only share the insightful information out
of their reservoir but also train the upcoming innovators, to ignite the future of
enlighten.
(Prof. Lalmani)

TABLE OF CONTENTS
1. Impact of Reactive Power Compensating Devices on VoltageProfile of Squirrel Cage Induction Generator Based Wind EnergyConversion System Connected to GridDr. Sarika Shrivastava, Dr. Anurag Tripathi. Dr. K.S. Verma
1-6
2. A Critical Study for the Emerging Scope of EncryptionTechnology and Mathematical Coding for Cloud Application andEvaluation of its Performance & ImpactsDr. Raj Kumar, Dr. Pankaj Saxena
7-9
3. Creation of Linguistic Information Gateway For IndianLanguagesDr. Seema Singh, Dr. Raj Kumar
10-13
4. Use of Wireless Devices And IOT in Management of DiabetesVinaytosh Mishra, MKP Naik
14-21
5. Synthesis and CNS Activity of New Indole DerivativesDr. Anand Pratap Singh
22-25
6. Comparative Analysis of Classification Techniques of DataMining to Classify Student ClassPankaj Kumar Srivastava, Ojasvi Tripathi, Ayushi Agrawal
26-30
7. A Review on Different Control Strategies for MagneticLevitation SystemBrajesh Kumar Singh, Awadhesh Kumar
31-35
8. A Study And Review of Open Loop and Closed Loop Model ofSpeed Control of BLDC MotorPriyanshi Kushwaha, Supriya Maurya, Sandeep Kumar Singh
36-42
9. Artificial Neural Network Based Deep LearningPreeti Shahi, Shekhar Yadav
43-45
10. A Study on Effectiveness of Digital Marketing and Its ImpactAnukaran Khanna, Prateek Khanna, S.N. Singh
46-49
11. Goods and Services Tax: Biggest Indirect Tax Reform in IndiaAfter IndependenceDr. Ajay Bhushan Prasad
50-53
12. A Study and Review of Switching Losses in Metal OxideSemiconductor Field Effect TransistorKamal Singh, Dr. Kuldeep Sahay, Sandeep Kumar Singh
54-59
13. A Theoretical Approach for The Advancement in Sepic DC-DCConverterKamal Singh, Dr. Kuldeep Sahay, Sandeep Kumar Singh
60-63
14. Review of Artificial Intelligent Based MPPT for PV SystemsSaurabh Kumar, Shekhar Yadav
64-67
15. Modes of Drug Delivery System to BrainSutrishna Sen, Parmar Keshri Nandan
68-71
16. Effect of Digi Marketing on Gen Next Customers: A Study onMillenials 1980-2017Anshuman Rana,Neha Singh
72-74
17. Immunotherapy and Recent Advancements in Cancer TreatmentRashi Srivastava, Dr. Pushpa Maurya
75-81
18. Safe Waste-Water Disposal System in Reference to AcuteEncephalitis Syndrome: A ReviewYoggya Mehrotra, Shekhar Yadav
82-86
19. Abnormality and Noise Rejection in ECG Using Filters: ASurvey
87-90

Anju Yadav, Priya Shree Madhukar, Shekhar Yadav20. Delignification of Pine Needle and Sorghum Stover by Treatment
with Para Formic Acid/Para Acetic Acid (PFA/PAA)Vaishnavi Sinha, Parmar Keshri Nandan
91-93
21. Solar-Wind-Biomass Hybrid Power Generation Plant–A ReviewAbhishek Anguria, Mr. Somendra Banerjee, Dr. Sarika Shrivastava
94-102
22. Impact of Bagasse Cogeneration in the Sugarcane Industries ofUttar Pradesh: A Holistic ReviewVijay Kumar Verma, Sharmila Singh
103-108
23. Fuel Cell and Micro Wind Turbine System Based Hybrid PowerGeneration–A ReviewPreeti Patel, Abhishek Anguria, Mr. Manu Kumar Singh
109-114
24. Enhanced Traveling Salesman Problem Solving by GeneticAlgorithm Technique with Hybrid HeuristicDharm Raj Singh, Rohit Kumar Singh, Manoj Kumar Singh
115-120
25. Role of Natural Flavonoids in Delaying Cataract ProgressionTanu Chaubey, Anurag Mishra
121-127
26. Speed Control of DC Motor Using Linear Quadratic RegulatorParul Kashyap, Priyanka Singh, Seema Chaudhary
128-132
27. A Comparative Study of OFDM and CDMA Tools to Enhancethe Performance of Power Line CommunicationVirendra Pratap Yadav, Mr. S.N Singh
133-139
28. Effect of Flexible AC Transmission System (Facts) on PowerSystem Stability and Their RelationS.N. Singh, Manu Singh, Anand Vardhan Pandey
140-146
29. Comparisons of Performances of Facts Controllers in PowerSystemsBindeshwar Singh, Rajat Shukla, Piyush Dixit
147-156
30. Central Government Efforts for The Development of Varanasiand Its Impact on Tourism Industry: Management PerspectivePriya Singh
157-160
31. Application of EMD and PDD on Mechanical Fault Analysis ofan Induction MotorSudhir Agrawal, Chandra Prakash, Dr. V. K. Giri
161-166
32. Mechanical Fault Identification of an Induction Motor UsingVibration SignalSudhir Agrawal, Anuj Pudel, Dr. V. K. Giri
167-176
33. The Stem Cells Therapy: Gateway to the World RegenerativeMedicines and TherapeuticsPooja Verma, Arjun Kumar, Saba Khan
177-182
34. Digital Marketing in Current ScenarioPriti Rai, Milan Malviya, Shubham Verma
183-186
35. Overview and Post Damage Analysis of Nepal Earthquake 2015Anjani Kumar Shukla, Vipin Kumar Singhal, P.R. Maiti
187-194
36. Work Life Balance for Working Mothers in IndiaMrs. Sharmila Singh, Mr. Vijay Kumar Verma, Ritika Jaiswal, SanjoliJaiswal
195-197
37. A Review on Phytochemical, Medicinal and PharmacologicalProfile of Ficus BengalensisPrashant Kumar Yadav, S.S. Sisodia, Tanu Chaubey, Rajesh Verma,Pankaj Maurya, Brijesh Singh, Anurag Mishra
198-202
38. Bioremediation of Heavy MetalsPragya Pandey, Arjun Kumar, Arifa Siddiqui
203-207
39. Biosensors in Environmental Monitoring 208-213

Saba Khan, Garima Rai, Pragya Rai40. ICI Reduction Efficiently Using Window Functions and Their
ComparisonDeepak Kumar Singh, Kumar Arvind
214-218
41. Edible Vaccine: A Boon in Vaccine TechnologyPrashansa Samdarshi, Saba Khan, Reetika Nagar
219-223
42. Enhanced Analog Performance of Double Material Gate OxideSige-On- Insulator Double Gate MOSFETSaurabh Verma, Amrish Kumar
224-229
43. A Prototype Control System for Wearable Dopamine RegulationSandeep Kumar, Shaheen Afroz
230-234
44. Over the Counter Medications: An Assessment of their Safetyand UseMonika Joshi, Ravi Shankar, Anurag Mishra, Brijesh Singh, ArpritKumar
235-237
45. Sodium-Ion Batteries the Future AspectAnuja Singh, Vishal Verma, Raj Jaiswal
238-241
46. DWT-DFRNT Multiple Transform Method Based a RobustDigital Watermarking Technique for Image ContentsSwati Singh, Richa Pandey, Sumit Kumar
242-248
47. Extraction of Anthocyanine From Syzygium Cumini andComparative Study With Red WineMs. Pragya Pandey, Ravina Kumari
249-250
48. A Review Article on Fast Dissolving Drug Delivery SystemAbhishek Kumar, Dr. Anurag Mishra, Brijesh Singh, Pradhi Srivastava,Shiv Kumar Srivastava, Ravi Tripathi, Gangesh Pandey
251-256
49. Analysis of Reducing Short Channel EffectAnuja Singh, Shalini Prajapati, Sonam Kumar Chaurasia
257-261
50. Cloud Computing and Smart GridAnkit Dixit, Dr. Sarika Shrivastava, Vikash Kumar
262-267
51. Analytical Comparison of Parameters in the Single Gate (SG),Double Gate (DG) and Triple Gate (TG) MOSFETSaurabh Verma, Shahana Akhtar
268-271
52. Hybrid Freeza-CArman, Mohit Singh, Satyam Dev
272-275
53. Real Time Crowd Control System Using Embedded WebTechnologyKumar Arvind, Deepak Kumar Singh
276-279
54. Digital MarketingMohammad Asif
280-283
55. Security Issues in Network Virtualization: A ReviewNavin Mani Upadhyay, Kumari Soni, Juli Singh, Abhay Kumar Maurya
284-291
56. Finite State Machine Based an Intelligent Traffic Light withReduced Energy ConsumptionArvind Kumar, Amit Kumar Maurya, Priyanshi Srivastava, AakashSingh, Dr. R.S. Yadav
292-296
57. Filtering of Optimal Power Saving Routing Protocols in MobileAdhoc Network: A Comparative StudyKm. Soni Ojha, Juli Singh, Navin Mani Upadhyay, Saloni Singh, VivekKr. Srivastava
297-302
58. A Survey on Big Data and Its TechnologiesJuli Singh, Km. Soni Ojha, Dr. R. S. Yadav, Saumya Gupta, SaloniSharma, Diksha Srivastava, Kritika Soni
303-307
59. Comparative Analysis of Shortest Path Algorithms on Pair of 308-314

DistancePankaj Kumar Srivastava, Alankrita Vishwakarma, Swarnima Mishra,Kavya Srivastava
60. Data clustering on IP address Using K-Means Algorithm forStart-Up BusinessAmit Kumar Maurya, Raina Kashyap, Janhvi Singh, Arvind Kumar,Srishti, Soumya Priya
315-318
61. A Queue Based Approach to Travelling Salesman ProblemAmit Kumar Maurya, Arvind Kumar, Akhilesh Kumar Mishra, AnkitaSingh, Abhay Kumar Maurya
319-322
62. Prodrug Design to Optimize Drug Delivery to Colon: a ReviewSingh Brijesh, Ghosh S.K.
323-336
63. A Comparative Study of Different Classification MethodsJuli Singh, Soni Ojha, Navin Mani Upadhyay, Bharat Kumar, Md. Imran,Manish Kr. Gupta
337-339
64. GPS Based Railway Crossing Level SystemRakesh Kumar Singh, Ankur Srivastava, Samli Gupta, RubyVishwakarma, Priyanshu Vishwakarma
340-342
65. Selective Creatinine Determination Using Molecularly ImprintedPolymer (MIP) Based Colorimetric SensorDr. Amit Kumar Patel
343-346
66. A Study Of Employee Performance Evaluation Using DataMining TechniquesAnkur Srivastava, Rakesh Kumar Singh, Km. Soni
347-350
67. Industrial Waste Water Treatment: A ReviewAkanksha Raj Sriwastava, Nitin Verma
351-356
68. Numerical Simulation and Parametric Optimization in Turning ofInconel 718Rajiv Kumar Yadav, Kumar Abhishek, Siba Sankar Mahapatra
357-362
69. A Review: Current Trends of Medicinal Plants HavingAntidiabetic ActivityNath Devendra, Singh Sandhya, Kumar Rajesh, Maurya Pankaj
363-366
70. Npa a Major Issue in Current Banking ScenarioVishal Gupta and Rajendra Tewari
367-368
71. A Comprehensive Review: Solid Lipid Nanoparticles ContainingMethotrexateShiv Kumar Srivastava, Abhishek Kumar, Pradhi Srivastava and RaviTripathi
369-372

National Conference on Emerging Trends in Science, Technology and Management, 11-12 Nov 2017, ISBN: 978-93-5281-325-4 Page 1
IMPACT OF REACTIVE POWER COMPENSATINGDEVICES ON VOLTAGE PROFILE OF SQUIRRELCAGE INDUCTION GENERATOR BASED WIND
ENERGY CONVERSION SYSTEM CONNECTED TOGRID
Dr. Sarika ShrivastavaAshoka Institute of Technology &
Management, [email protected]
Dr. Anurag TripathiIET, Lucknow
Dr. K.S. Verma,REC, Ambedkar Nagar- U.P.- India
Abstract — Fixed speed wind energy conversion systems based on squirrel cage induction generators (SCIG)has a significant existence in wind energy technology. Availability of reactive power is obligatory for thereliable and stable performance of the power system. Insufficient reactive power has navigated to voltagecollapses and has been a foremost source of various recent major power outages universally. This paperexhibits the simulation results of a grid integrated wind farm with and without reactive powercompensation by capacitor banks and static synchronous compensator (STATCOM) to achieve voltagestability improvement during startup, normal operation, symmetrical and unsymmetrical fault conditions.The effect of reactive power compensation on voltage profile is compared.
Keywords— Wind energy conversion system (WEC), SCIG, symmetrical fault; unsymmetrical fault, FACTS,Voltage stability, reactive power; startup.
1. INTRODUCTION
Penetration of wind energy in modern power systems generates many technical and economicchallenges that need to be addressed for satisfactory large scale wind energy integration. Variablewind velocity results in fluctuations of output power produced by wind turbines. The fluctuating poweroutput becomes a challenge with increased share of wind energy in power systems. Large powervariations cause voltage and frequency deviations from nominal values that can cause activation ofprotective relays which may lead to disconnection of the wind turbines from the grid. Wind turbinesconnected to weak grid such as distribution network, are sensitive to supply disturbances [1].With the increase in wind energy penetration, the interaction between the grid and the wind farmsgenerating electricity becomes more and more critical. Today, wind energy converters not only offerpower plant capabilities similar to conventional resources but may exceed their performance in variousaspects. The characteristics of the different types of wind generating systems used in wind turbines startto affect the behavior of the power system differently. Increasing penetration of wind energyconversion system (WECS) in the conventional power system has put tremendous challenge to thepower systems operators as well as planners to ensure reliable and secure grid operation [2].The squirrel-cage induction generator propositions various advantages of high efficiency, a quicklydamped short-circuit current, reliability, economy and sparsity of related apparatus for control,regulation, and protection. It demands a large quantity of reactive power, which can only be satisfied bythe charging current of the power system with difficulty, because of the conditions to be met [3].
2. REACTIVE POWER CAPABILITY OF SCIGReactive power is mandatory for the stable and reliable operation of the power system. It is essentialfor the flow of active power from generator to the load centers and maintains bus voltage within thedesired limits.Grid utilities need extended reactive power provide capability not solely throughout faultconditions, however additionally in steady-state operation [4].Availability of adequate reactive power is essential for the stable operation of electrical power system.The induction generator is a fixed speed wind energy system draws reactive power from the grid. Theamount of reactive power Q drawn by an induction generator varies with the active stator Ps or the slipof the generator. The generator draws reactive power close to one third of the total power rating when itis not delivering any active power grid . This reactive power is mainly associated with the magnetisinginductance Lm of the generator. The amount of reactive power requirement increases with the statoractive power delivering to the grid. This increase is mainly caused by the large rotor current flowingthrough the stator and rotor leakage inductances Lls and Llr. SCIG based wind turbines are not able toprovide reactive power support themselves and equipped with static sources like capacitor banks ordynamic reactive power sources like SVCs or STATCOM. Compared to the SVC, the STATCOMgives a higher support to the transient margin as directed by both calculations and simulations [5,6,7].

National Conference on Emerging Trends in Science, Technology and Management, 11-12 Nov 2017, ISBN: 978-93-5281-325-4 Page 2
(5)
3 3Re( ) Re( ) (6)
2 2
me m
e s s r r
dJ T T
dtP P
T j i j i
Reactive power is central to voltage instability analysis. Deficit or excess reactive power ends up involtage instability either locally or globally and any increase in loadings may could cause voltagecollapse.
Fig. 1: SCIG connected to grid
3. MODELING OF SCIG WIND ENERGY CONVERSION SYSTEM
The induction generator space vector model is composed of three sets of equations, voltage equations,flux equations and motion equations [8,9].Voltage Equations:
(1)
( ) (2)
and are stator & rotor voltage vectors(V) , and are stator and rotor currents(A),
ss s s s
r r r r r r
s r
s r
s
dv R i j
dtd
v R i jdt
v vi i
and are stator and rotor flux linkage(Wb),r and are stator and rotor winding resistances(A)
rotating speed of arbitrary reference frame and(rad/s) rotor electrical angular speed(rad/s)
s r
r
R RFlux linkage equations:
( ) (3)
( ) (4)
s ls m s m r s s m r
r lr m r m s r r m s
L L i L i L i L i
L L i L i L i L i
Where Lls- stator leakage inductance, Llr- rotor leakage inductance, Ls=Lls+Lm - stator self inductance(H) and Lr=Llr+Lm is rotor self-inductance (H),
Motion Equations:
Where J-Moment of inertia (kgm2), P- No. of pole pairs, Tm-mechanical torque from generator shaft(N-
m), Te- electromagnetic torque & ωm is rotor mechanical speed.Fig 2 shows the space-vector equivalent circuit of SCIG in arbitrary reference frame which can easilynbe transformed into other reference frames.d-q reference model of IG can be derived from space vetcor model by decomposing the vectors intocorresponding d and q axis components. The simulation model of induction generator is based on d-qreference frame model.
4. SCIG BASED WINDFARM SYSTEM DESCRIPTION
Fig 3 depicts the simulation model of SCIG based wind farm under study. A squirrel cage inductiongenerator is fed by drive train system. The drive train system consists of low speed shaft, gearbox andhigh speed shaft which is directly coupled to the rotor of induction generator. The three phase stator

National Conference on Emerging Trends in Science, Technology and Management, 11-12 Nov 2017, ISBN: 978-93-5281-325-4 Page 3
winding is coupled to the grid through coupling transformer [10].
Fig. 2: Space-vector equivalent circuit of SCIG in arbitrary reference frame
The simulation model consists of SCIG based wind farm consisting of six 1.5-MW wind energyconverters. The wind farm is integrated is connected to a 25-kV distribution system injects power to a120-kV grid via a 30 -km 25-kV feeder. The 9-MW wind farm is composed by three pairs of 1.5 MWwind energy converters. In the given system wind energy converters use squirrel-cage inductiongenerators those run on nearly constant speed. The stator winding is coupled directly to the 60 Hz gridand the rotor is driven by a variable-pitch wind turbine. The pitch angle is adjusted to control thegenerator output power at the rated value for winds exceeding the nominal speed (9 m/s).To generate power the induction generator speed has to be slightly higher than the synchronous speed.The range of speed varies between 1 pu at no load and 1.005 pu at full load. Every wind energyconverter has a protection system that monitors voltage, current and speed of the machine. Squirrelcage induction generator requires reactive power which is being supplied by capacitor banks. Eachwind energy converter is equipped with capacitor bank of the rating of 350 KVAR. The remainingreactive power required to maintain the 25-kV voltage at 1 pu is provided by a 3-MVar STATCOMwith a 3% droop setting. The Wind energy converter is wind controlled [11, 12].
Fig. 3: Wind farm with Squirrel Cage Induction Generator integrated with Grid
In Pitch Control, during normal operation the pitch angle is set at optimal value to capture maximumpower. When wind speed is higher than the rated value, blades are turned out of the wind direction toreduce the captured power [8]. The system under consideration is analyzed during startup as well asnormal steady state condition. The system is subjected to symmetrical fault & unsymmetrical faults atone of the wind turbine terminals and effect of reactive power compensation by capacitor banks &STATCOM on voltage profile is at grid has been obtained.
National Conference on Emerging Trends in Science, Technology and Management, 11-12 Nov 2017, ISBN: 978-93-5281-325-4 Page 4
0 5 10 15 200.2
0.4
0.6
0.8
1
1.2
Time t(s)
Volta
ge V
(p.u.
)
Voltage V at 25 kV Bus with time t
With C compensation onlyWith Cap. & STATCOMWithout Cap. & STATCOMWith STATCOM only
5. SIMULATION RESULTS
Case I: SCIG connected to grid start up with and without support of Reactive power Q byCapacitor Bank and STATCOM: The dynamic performance of a SCIG based wind energyconversion system during startup verifies that SCIG draws large reactive power due to high inrushcurrent and torque oscillations. The voltage profile is significantly affected by reactive power. As perthe simulation results depicted in fig.4 the voltage profile without reactive power support is very poorwhich can be improved by the connected capacitor banks of suitable rating. The voltage profile at gridcan further be improved by STATCOM.
Fig. 4: Simulation result for startup with & without Reactive Power Support
Case II: SCIG connected to grid under normal condition with and without support of Reactivepower Q by Capacitor Bank and STATCOM: The simulation results shown in fig 5 depict variationin voltage at 25 kV grid with and without support of reactive power under normal condition. The effectof reactive power support by capacitor bank alone and with STATCOM has been shown in the fig. 5.
Fig. 5: Simulation result for normal operation with & without Reactive Power Support
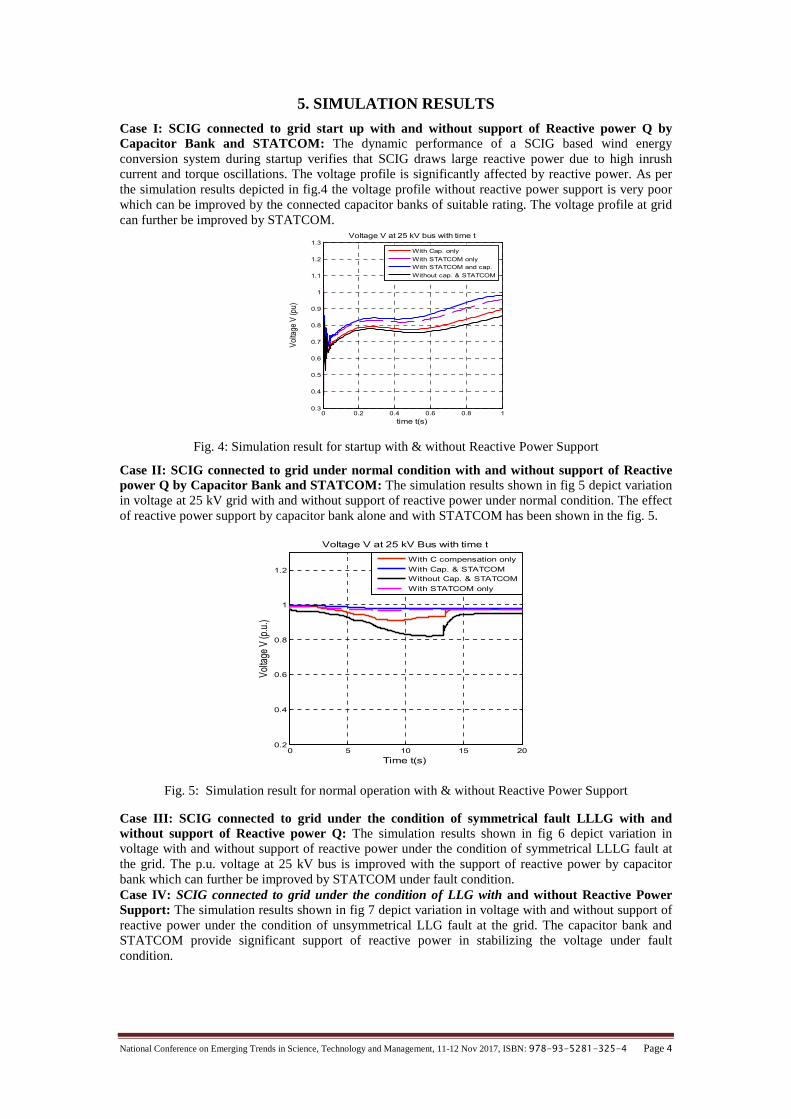
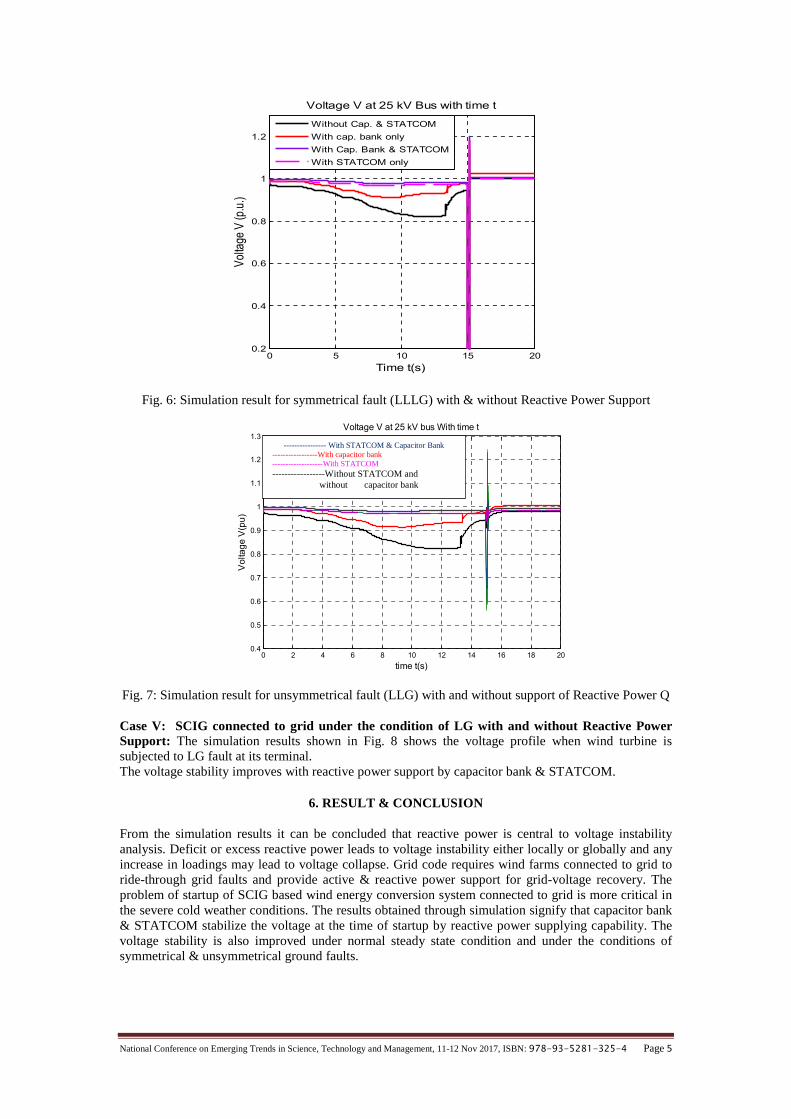
Case III: SCIG connected to grid under the condition of symmetrical fault LLLG with andwithout support of Reactive power Q: The simulation results shown in fig 6 depict variation involtage with and without support of reactive power under the condition of symmetrical LLLG fault atthe grid. The p.u. voltage at 25 kV bus is improved with the support of reactive power by capacitorbank which can further be improved by STATCOM under fault condition.Case IV: SCIG connected to grid under the condition of LLG with and without Reactive PowerSupport: The simulation results shown in fig 7 depict variation in voltage with and without support ofreactive power under the condition of unsymmetrical LLG fault at the grid. The capacitor bank andSTATCOM provide significant support of reactive power in stabilizing the voltage under faultcondition.
0 0.2 0.4 0.6 0.8 10.3
0.4
0.5
0.6
0.7
0.8
0.9
1
1.1
1.2
1.3Voltage V at 25 kV bus with time t
time t(s)
Volta
ge V
(pu)
With Cap. onlyWith STATCOM onlyWith STATCOM and cap.Without cap. & STATCOM
National Conference on Emerging Trends in Science, Technology and Management, 11-12 Nov 2017, ISBN: 978-93-5281-325-4 Page 5
Fig. 6: Simulation result for symmetrical fault (LLLG) with & without Reactive Power Support
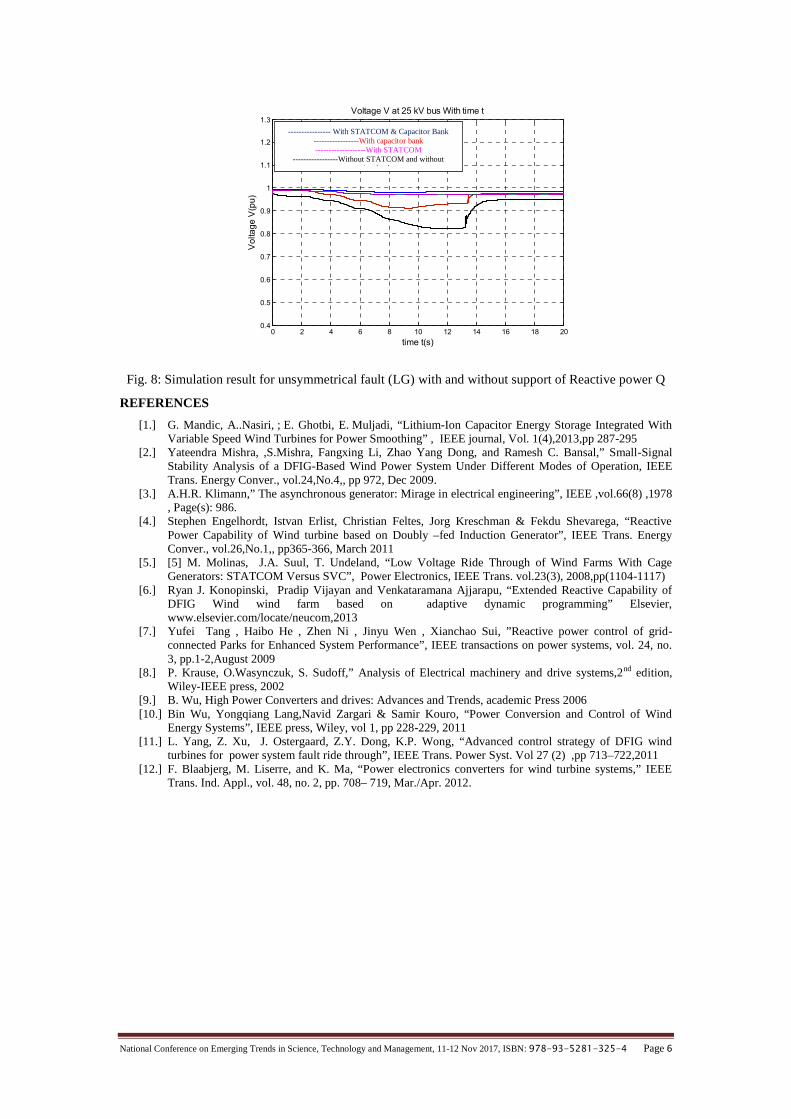
Fig. 7: Simulation result for unsymmetrical fault (LLG) with and without support of Reactive Power Q
Case V: SCIG connected to grid under the condition of LG with and without Reactive PowerSupport: The simulation results shown in Fig. 8 shows the voltage profile when wind turbine issubjected to LG fault at its terminal.The voltage stability improves with reactive power support by capacitor bank & STATCOM.
6. RESULT & CONCLUSION
From the simulation results it can be concluded that reactive power is central to voltage instabilityanalysis. Deficit or excess reactive power leads to voltage instability either locally or globally and anyincrease in loadings may lead to voltage collapse. Grid code requires wind farms connected to grid toride-through grid faults and provide active & reactive power support for grid-voltage recovery. Theproblem of startup of SCIG based wind energy conversion system connected to grid is more critical inthe severe cold weather conditions. The results obtained through simulation signify that capacitor bank& STATCOM stabilize the voltage at the time of startup by reactive power supplying capability. Thevoltage stability is also improved under normal steady state condition and under the conditions ofsymmetrical & unsymmetrical ground faults.
0 5 10 15 200.2
0.4
0.6
0.8
1
1.2
Time t(s)
Volta
ge V
(p.u.
)
Voltage V at 25 kV Bus with time t
Without Cap. & STATCOMWith cap. bank onlyWith Cap. Bank & STATCOMWith STATCOM only
0 2 4 6 8 10 12 14 16 18 200.4
0.5
0.6
0.7
0.8
0.9
1
1.1
1.2
1.3
time t(s)
Vol
tage
V(p
u)
Voltage V at 25 kV bus With time t
---------------- With STATCOM & Capacitor Bank-----------------With capacitor bank-------------------With STATCOM-----------------Without STATCOM and
without capacitor bank
National Conference on Emerging Trends in Science, Technology and Management, 11-12 Nov 2017, ISBN: 978-93-5281-325-4 Page 6
0 2 4 6 8 10 12 14 16 18 200.4
0.5
0.6
0.7
0.8
0.9
1
1.1
1.2
1.3
time t(s)
Vol
tage
V(p
u)
Voltage V at 25 kV bus With time t
Fig. 8: Simulation result for unsymmetrical fault (LG) with and without support of Reactive power Q
REFERENCES
[1.] G. Mandic, A..Nasiri, ; E. Ghotbi, E. Muljadi, “Lithium-Ion Capacitor Energy Storage Integrated WithVariable Speed Wind Turbines for Power Smoothing” , IEEE journal, Vol. 1(4),2013,pp 287-295
[2.] Yateendra Mishra, ,S.Mishra, Fangxing Li, Zhao Yang Dong, and Ramesh C. Bansal,” Small-SignalStability Analysis of a DFIG-Based Wind Power System Under Different Modes of Operation, IEEETrans. Energy Conver., vol.24,No.4,, pp 972, Dec 2009.
[3.] A.H.R. Klimann,” The asynchronous generator: Mirage in electrical engineering”, IEEE ,vol.66(8) ,1978, Page(s): 986.
[4.] Stephen Engelhordt, Istvan Erlist, Christian Feltes, Jorg Kreschman & Fekdu Shevarega, “ReactivePower Capability of Wind turbine based on Doubly –fed Induction Generator”, IEEE Trans. EnergyConver., vol.26,No.1,, pp365-366, March 2011
[5.] [5] M. Molinas, J.A. Suul, T. Undeland, “Low Voltage Ride Through of Wind Farms With CageGenerators: STATCOM Versus SVC”, Power Electronics, IEEE Trans. vol.23(3), 2008,pp(1104-1117)
[6.] Ryan J. Konopinski, Pradip Vijayan and Venkataramana Ajjarapu, “Extended Reactive Capability ofDFIG Wind wind farm based on adaptive dynamic programming” Elsevier,www.elsevier.com/locate/neucom,2013
[7.] Yufei Tang , Haibo He , Zhen Ni , Jinyu Wen , Xianchao Sui, ”Reactive power control of grid-connected Parks for Enhanced System Performance”, IEEE transactions on power systems, vol. 24, no.3, pp.1-2,August 2009
[8.] P. Krause, O.Wasynczuk, S. Sudoff,” Analysis of Electrical machinery and drive systems,2nd edition,Wiley-IEEE press, 2002
[9.] B. Wu, High Power Converters and drives: Advances and Trends, academic Press 2006[10.] Bin Wu, Yongqiang Lang,Navid Zargari & Samir Kouro, “Power Conversion and Control of Wind
Energy Systems”, IEEE press, Wiley, vol 1, pp 228-229, 2011[11.] L. Yang, Z. Xu, J. Ostergaard, Z.Y. Dong, K.P. Wong, “Advanced control strategy of DFIG wind
turbines for power system fault ride through”, IEEE Trans. Power Syst. Vol 27 (2) ,pp 713–722,2011[12.] F. Blaabjerg, M. Liserre, and K. Ma, “Power electronics converters for wind turbine systems,” IEEE
Trans. Ind. Appl., vol. 48, no. 2, pp. 708– 719, Mar./Apr. 2012.
---------------- With STATCOM & Capacitor Bank-----------------With capacitor bank-------------------With STATCOM
-----------------Without STATCOM and withoutcapacitor bank
National Conference on Emerging Trends in Science, Technology and Management, 11-12 Nov 2017, ISBN: 978-93-5281-325-4 Page 7
A CRITICAL STUDY FOR THE EMERGING SCOPE OFENCRYPTION TECHNOLOGY AND MATHEMATICAL
CODING FOR CLOUD APPLICATION ANDEVALUATION OF ITS PERFORMANCE & IMPACTS
Dr Raj Kumar, Associate ProfessorDept of Computer Science, Agra University, Agra
Dr Pankaj Saxena, Associate ProfessorRBSMTS Campus, AKTU, Agra
Abstract-Applications from many engineering and scientific fields show similar complexities in theircharacteristics and computational requirements. Thus, one such deployment brings the promise for moreapplications. The potential benefit is that once the applications are coded, the effort invested pays itself offover a long period by applying the same pattern to similar applications. At the same time, however, weattempt to reduce the complexity of application development by using parallel scripting. We examinemultiple cloud computing offerings, both commercial and academic, to evaluate their potential forimproving the turnaround time for application results. Since the target application does not fit well intoexisting computational paradigms for the cloud, we employ parallel scripting tool, as a first step toward abroader program of adapting portable, scalable computational tools for use as enablers of the future smartgrids. In this paper we describe our experience in deploying one representative commercial smart gridapplication to the cloud, and leveraging resources from multiple cloud allocations seamlessly with the helpof the Swift parallel scripting framework [4]. The application is used for planning and currently has a timehorizon suited primarily to relatively long-term resource allocation questions. Our goal here is to show thatcloud resources can be exploited to gain massive speedups without locking the solution to any specific cloudvendor.
Keyword- Smart grid, Supervised Sharing, Resource Management, Clustering, Cloud mapping
1. INTRODUCTION
A large section of the community has a collective vision [14]–[17] for the near and long-term future ofdistributed and cloud computing comprising the following salient points: 1) A wide scale spread andadaptation of cloud models of computation across HPC and HTC infrastructures 2) Economicalutilization of storage space and computational power by adapting more and more new application areasto run in clouds Workflow-oriented applications have been reported to be specially suited to the cloudenvironment [18], [19]. Swift has been ported and interfaced to one cloud [20]. Ours is the first multi-cloud implementation.Cloud performance issues have been studied in the past [17], [21]. Our work covers these areas, albeitwith a finer view of evaluating cloud characteristics for a new application area. With this approach, weattempt to validate the community vision while at the same time solve a real world problem. Engineersdesigning an autonomic electrical power grid (“smart grid”) constitute one such user group.Stakeholders from both the production and consumption sides of the emerging smart grid aredeveloping computation intensive applications for multiple aspects of the problem.Some of these concepts will require major technology steps, such as the deployment of synchrophasorbased monitoring technologies that could enable real-time grid-state estimation on the production anddelivery side of the equation, and the widespread use of smart-meter based technologies to optimizebehavior on the consumption side [1]–[3]. In practice, cloud allocations are granted to groups ininstitutions and often a group ends up having its slice from multiple cloud allocations pies.Furthermore, one is limited by the allocation policies on how much of the resources one can obtainsimultaneously from a single allocation. For instance, standard Amazon EC2 allocation allows only 20cloud instances per allocation for a region at a time [7]. Even when cloud resources are virtualized,accessing resources across multiple clouds is not trivial and involves specialized setup, configuration,and administrative routines posing significant challenges.Scripting has been a popular method of automation among computational users. Parallel scriptingbuilds on the same familiar practice, with the advantage of providing parallelization suitably interfacedto the underlying computational infrastructures.Adapting applications to these models of computation and then deploying the overall solution,however, is still a challenge. Parallel scripting has reasonably addressed this challenge by playing arole in deployment of many solutions on HPC platforms [5].
National Conference on Emerging Trends in Science, Technology and Management, 11-12 Nov 2017, ISBN: 978-93-5281-325-4 Page 8
2. CLOUD COMPUTING
Clouds present a familiar usage model of traditional clusters with an advantage of direct, super-user,scheduler-less access to the virtualized resources. This gives the users much required control over theresources and simplifies the computing without jeopardizing the system security. We do observedisparities between the commercial and academic clouds in terms of elasticity and performance.Network bandwidth plays a crucial role in improving application performance. Data movement inclouds is only as fast as the underlying network bandwidths. Bandwidth disparities in clouds and thosebetween regions of a single cloud must be taken into account before designing an applicationdistribution strategy. In a mixed model such as ours, prioritizing tasks could alleviate many of thesedisparities.
3. IMPACT ON ECONOMY
The economy of computation in presence of commercial academic collaboration is especially notable.Thanks to a universal, pay-as-you-go model of computation, we are not dealing with clustermaintenance and cross-institutional access issues. With the ability to run the application on multipleclouds, we can move on to another cloud if need be and avoid vendor lock-in. A high-level policy andusage agreement allows the costs of cloud allocation to be shared among multiple parties having stakesin the same research. The timely availability of processed data, supporting con- figuration, andapplication libraries is a key to performance computing for smart grid applications.Many smart grid applications are inherently distributed in nature because of a distributed deploymentof devices and buses. The work described in [26] is the closest treatment of steering smart gridcomputations into the clouds. The work analyzes smart grid application use-cases and advocates ageneric cloud-based model. In this regard, our work verifies the practical aspects of the modelpresented, by evaluating various aspects of clouds. Amazon EC2 is a large-scale commercial cloudinfrastructure. Amazon offers compute resources on demand from its virtualized infrastructuresspanning eight centers from worldwide geographical regions. Three of the centers are in the UnitedStates, two in Asia, and one each in the EU, South America, and Australia. An institutional allocationfrom Amazon will typically allow one to acquire 20 instances of any size per region.In addition, Amazon provides a mass storage device called S3, which can be configured to be mountedon instances as a local file-system. For the current work, we considered the US-based regions mainlyfor the proprietary and secondly for performance reasons. Consequently, we were limited to amaximum of 60 instances from the Amazon EC2 cloud. Amazon provides a web-based console and anative command-line implementation to create, configure, and destroy resources.
4. EMERGING SCOPE OF CLOUD
The GE Energy Management’s Energy Consulting group has developed the Concorda Software Suite,which includes the Multi Area Production Simulation (MAPS) and the Multi Area ReliabilitySimulation (MARS). These products are internationally known and widely used [8] for planning andsimulating smart power grids, assessing the economic performance of large electricity markets, andevaluating generation reliability.The MARS modeling software enables the electric utility planner to quickly and accurately assess theability of a power system, comprising a number of interconnected areas, to adequately satisfy thecustomer load requirements. Based on a full, sequential Monte Carlo simulation model [9], MARSperforms a chronological hourly simulation of the system, comparing the hourly load demand in eacharea with the total available generation in the area, which has been adjusted to account for plannedmaintenance and randomly occurring forced outages. Areas with excess capacity will provideemergency assistance to those areas that are deficient, subject to the transfer limits between the areas.
5. CONCLUSION
We first present the cloud characterization results by measuring network and data-movement propertiesof clouds. We then perform our application execution on incrementally sophisticated scenarios: startingfrom a single local-host to single cloud in serial mode to multiple clouds in task parallel mode. Theapplication submission was done from a single remote submit-host. The application data resides on thesubmit-host, and the executables with supporting libraries were preinstalled on cloud images fromwhich cloud instances were spawned. In this paper we discuss and evaluate the cloud side of a network-intensive problem characterized by wide-area data collection and processing. We use a representativeparallel scripting paradigm. We analyze the properties of multiple cloud systems as applied to ourproblem space. One notable limitation of each of the environments is that they do not have efficientsupport for fault tolerance and seamless assurance of data availability in the event of failure. Not only

National Conference on Emerging Trends in Science, Technology and Management, 11-12 Nov 2017, ISBN: 978-93-5281-325-4 Page 9
computational but performance bandwidth resources are needed in order to achieve desired applicationperformance. Apart from a basic application execution, in a complex and networked environment,additional requirements are foreseen. These requirements include high assurance, dynamicconfiguration, fault tolerance, transparent connection migration, distributed data repository, and overalltask coordination and orchestration of computation. Not all requirements are addressed in this work.
REFERENCES[1.] A. Bose, “Smart transmission grid applications and their supporting infrastructure,” IEEE Transactions on
Smart Grid, vol. 1, no. 1, pp. 11–19, Jun. 2010.[2.] J. Hazra, K. Das, D. P. Seetharam, and A. Singhee, “Stream computing based synchrophasor application for
power grids,” in Proceedings of the first international workshop on High Performance Computing, Networkingand Analytics for the Power Grid, ser. HiPCNA-PG ’11. New York, NY, USA: ACM, 2011, pp. 43–50.
[3.] E. Lightner and S. Widergren, “An orderly transition to a transformed electricity system,” Smart Grid, IEEETransactions on, vol. 1, no. 1, pp. 3–10, Jun. 2010.
[4.] M. Wilde, M. Hategan, J. M. Wozniak, B. Clifford, D. S. Katz, and I. Foster, “Swift: A language fordistributed parallel scripting,” Parallel Computing, vol. 39, no. 9, pp. 633–652, September 2011.
[5.] J. M. Wozniak and M. Wilde, “Case studies in storage access by loosely coupled petascale applications,” inProc. Petascale Data Storage Workshop at SC’09, 2009.
[6.] S. Jha, D. S. Katz, A. Luckow, A. Merzky, and K. Stamou, “Understanding scientific applications for cloudenvironments,” in Cloud Computing: Principles and Paradigms, R. Buyya, J. Broberg, and A. M. Goscinski,Eds., March 2011, ch. 13, p. 664.
[7.] “Amazon EC2 FAQ.” [Online]. Available: http://aws.amazon.com/ec2/faqs/#How many instances can I run inAmazon EC2
[8.] L. A. Freeman, D. T. Van Zandt, and L. J. Powell, “Using a probabilistic design process to maximize reliabilityand minimize cost in urban central business districts,” in 18th International Conference and Exhibition onElectricity Distribution, 2005. CIRED 2005, pp. 1–5.
[9.] J. S. Liu and R. Chen, “Sequential monte carlo methods for dynamic systems,” Journal of the AmericanStatistical Association, vol. 93, pp. 1032–1044, 1998.
[10.] D. Nurmi, R. Wolski, C. Grzegorczyk, G. Obertelli, S. Soman, L. Youseff, and D. Zagorodnov, “TheEucalyptus open-source cloud-computing system,” in 9th IEEE/ACM International Symposium on ClusterComputing and the Grid (CCGRID ’09), May 2009, pp. 124–131.
[11.] M. Hategan, J. Wozniak, and K. Maheshwari, “Coasters: uniform resource provisioning and access forscientific computing on clouds and grids,” in Proc. Utility and Cloud Computing, 2011.
[12.] G. von Laszewski, M. Hategan, and D. Kodeboyina, “Java CoG kit workflow,” in Workflows for e-Science, I.Taylor, E. Deelman, D. Gannon, and M. Shields, Eds. Springer, 2007, ch. 21, pp. 341–356.
[13.] “FUSE: Filesystem in Userspace.” [Online]. Available: http://fuse.sourceforge.net/[14.] R. Buyya, C. S. Yeo, S. Venugopal, J. Broberg, and I. Brandic, “Cloud computing and emerging IT platforms:
Vision, hype, and reality for delivering computing as the 5th utility,” Future Generation Computer Systems,vol. 25, no. 6, pp. 599–616, 2009.
[15.] K. Yelick, S. Coghlan, B. Draney, and R. S. Canon, “The Magellan Report on Cloud Computing for Science,”US Department of Energy, Washington DC, USA, Tech. Rep., Dec. 2011.
[16.] D. S. Katz, S. Jha, M. Parashar, O. Rana, and J. B. Weissman, “Survey and analysis of production distributedcomputing infrastructures,” CoRR, vol. abs/1208.2649, 2012.
[17.] A. Iosup, S. Ostermann, M. Yigitbasi, R. Prodan, T. Fahringer, and D. Epema, “Performance analysis of cloudcomputing services for many-tasks scientific computing,” IEEE Transactions on Parallel and DistributedSystems, vol. 22, no. 6, pp. 931–945, june 2011.
[18.] S. Crago, K. Dunn, P. Eads, L. Hochstein, D.-I. Kang, M. Kang, D. Modium, K. Singh, J. Suh, and J. Walters,“Heterogeneous cloud computing,” in IEEE International Conference on Cluster Computing (CLUSTER), sep2011, pp. 378–385.
[19.] Y. Zhao, X. Fei, I. Raicu, and S. Lu, “Opportunities and challenges in running scientific workflows on thecloud,” in Cyber-Enabled Distributed Computing and Knowledge Discovery (CyberC), 2011 InternationalConference on, oct. 2011, pp. 455 –462.
[20.] K. Maheshwari, J. M. Wozniak, A. Espinosa, D. Katz, and M. Wilde, “Flexible cloud computing through SwiftCoasters,” in Proc. Cloud Computing and its Applications, 2011.
[21.] Iosup, M. Yigitbasi, and D. Epema, “On the performance variability of production cloud services,” in 11 th
IEEE/ACM Int’l Symp. on Cluster, Cloud, and Grid Computing (CCGrid). IEEE, May 2011, pp. 104–113.
National Conference on Emerging Trends in Science, Technology and Management, 11-12 Nov 2017, ISBN: 978-93-5281-325-4 Page 10
CREATION OF LINGUISTIC INFORMATIONGATEWAY FOR INDIAN LANGUAGES
Dr. Seema SinghDr. Raj Kumar
Department of Computer Science, Agra University, Agra
Abstract-The world is changing at a staggering pace. The way we communicate, learn, create and accessinformation and knowledge is being revolutionized by new information and communication technologies(ICTs), and the increasing flow of content they generate. UNESCO has always been at the heart ofinternational thinking and action about the impact of this changing environment and the role oftechnologies for inclusive and sustainable development. We are promoting the potential of open andinclusive technologies, free, independent and pluralistic media and information organizations to advancedevelopment in a way that enhances the rights and opportunities of people to become fully empoweredcitizens. We are working to ensure that technological advances and the explosion of information and mediacontent benefit all members of society and marginalize no one. This is why UNESCO introduced thecomposite concept of Media and Information Literacy (MIL). MIL is driven by the idea that citizens,communities and nations require a new set of competencies to access data and information, organize,evaluate for creation, utilization and communication of knowledge, so as to achieve their personal, social,professional and educational goals.We believe that media and information literacy is one of the preconditions of sustainable development andthat literate use of information and media will help ensure that everyone enjoys the full benefits of freedomof expression and access to information. UNESCO has published several ground-breaking documents tofacilitate the application of MIL. The need for accessing educational resources on Information Literacy hasbeen identified by various professional communities encouraged this new publication.In order to provide inclusive and multilingual Information Literacy resources for Library and InformationScience professionals, teachers, researchers, and students, among others, this second edition brings togetherInformation Literacy contributions in one-hundred and twenty seven languages from all over the world.
Keywords- E-literacy, E-contents, OCR, OER, multilingual, linguistics.
1. INTRODUCTION
The concept of Information Literacy, at least as it has become more widely known beyond the libraryworld, is not more than about 45 or 50 years old. However, within the library world, while not havingalways been referred to as “Information Literacy,” the concept has been known and practiced for amuch longer period than 45 or 50 years.Librarians point out that the concept and practice has been gradual and evolutionary, and was basedupon, and expanded upon a very long history of library orientation, library instruction, andbibliographic instruction, dating back at least to the nineteenth century and perhaps even longer.In the library world, helping people learn how to identify, describe and articulate in precise terms andlanguage and an information need, and then search effectively and efficiently for useful information tomeet that need, began way before the advent of use of ICTs that are continuing to evolve and impact allof us in very dramatic ways. In the 1980s, the computer revolution began to take hold and informationitself was beginning to be thought of as a resource in organizational contexts, not just in the context ofindividual persons.At that same time, as distinguished commentators like Daniel Bell began to write about the transitionfrom an Agrarian Society to an Industrial Society and then to an Information Society and KnowledgeSocieties, there seemed to be no existing term or concept that fully met the emerging need foreducating and training people in the value of knowing how to search for and retrieve good and relevantinformation, and avoid the dysfunctions of having to handle too much unneeded and irrelevantinformation. Management experts admonished the new “information managers” to follow the tried andtested practices of planning, budgeting, inventorying, auditing and controlling, but applied toinformation resources as opposed to more conventional resources like manpower, money and materials.At that time the idea of thinking of information as an organizational resource that could be planned,managed and controlled was virtually heretical People said: “you can’t manage data and informationany more than you can put a genie back in a bottle. Information is too amorphous, too vague, tooshapeless and formless, too unstructured It’s not like human beings, money, facilities, supplies andequipment, land, crops or trees, with a concrete shape and tangible form which you can, with varyingdegrees of success and using various specialized methods and techniques, touch, smell and feel, as wellas see and hear” And so, in part because of these caveats and misgivings, information literacy was veryslow to catch on with the general public.

National Conference on Emerging Trends in Science, Technology and Management, 11-12 Nov 2017, ISBN: 978-93-5281-325-4 Page 11
2. PURPOSE OF STUDY
Since the term and concept Information Literacy was developed by researchers from anglo-phonecountries such as the United States and the United Kingdom, the language used to record, describe,announce, publish and communicate information and messages concerned with the concept, itspractice, and so on, was primarily English.Because English is used so universally in the world today, many researchers and practitioners alike arereluctant to author, record, publish and disseminate their materials in their own native languagesdespite the fact that they use their own native language to communicate verbally and in simple textform with their close peers, family and friends. Moreover, if we are honest, when a professional,academic, businessperson or government official visits a foreign land, the only practical way s/he cancommunicate (unless s/he happens to also know the native language) is to use English (or in somecountries French, Spanish or other widely used world language) or to use the services of a qualifiedtranslator.But outside that office, conference, university or similar professional setting, there are millions ofordinary people who do not speak, read or write English at all, or speak it very poorly but can neitherread nor write it, and/or are embarrassed to use it even if they speak it poorly, because they feel theyare not sufficiently fluent and then there are large swaths of the world population with high illiteracyrates even in their own native language. Are we, then, to forget, disregard or ignore those ordinarycitizens who are literacy challenged when it comes to learning even the basic principles and tools ofInformation Literacy?In summary, English is very widely understood and used by Library and Information Science (LIS)professionals, as well as by Communications and Media professionals worldwide, and most otherprofessionals, government officials, and business persons.The formal and informal education and training, teaching and learning formats such as universitycourses, as well as informal formats such as in-house or outsourced workshops and seminars,internationally, regionally and at the country level, all have addressed the theory and practice ofInformation Literacy. But because the language used has been primarily English, the great majority ofnon-English speaking populations around the world have not been able to fully benefit from theknowledge of how to learn and to practice effective and efficient information literacy attitudes andbehaviors. This means that they have not been able to learn how, when, and where to use informationliteracy tools, methods and techniques so as to empower themselves to better solve problems and makedecisions.
3. LINGUISTIC GATEWAY
To deal with multilingual issue, it was felt that a simple inventory of some of the most important, but atthe same time selected, information literacy resources in many, if not most of the world’s majorlanguages, as well as many of the less widely used languages, could be useful not only to LIS and otherprofessionals, but especially to ordinary people, students and non-specialists as well, especially thosewith lower educational achievements.It could be useful, too, to people who do not have any, or very few opportunities to attend workshops,seminars, or other similar gatherings where information literacy is taught, learned and discussed,because of geographic, financial, government entitlement, or for other reasons. Also, those living inremote rural and isolated communities are at a distinct disadvantage, as mentioned earlier.In other words, while most senior LIS professionals are bilingual and fluent in both English and theirnative language(s), many less highly educated people, including ordinary laypersons, students, non-specialists and disadvantaged persons are neither very fluent in English, nor even bilingual in a secondmajor language other than English such as French or Spanish, but are, of course, fluent in their nativelanguage(s), which may include one or more regional languages and/or dialects. And while they maybe passably fluent in speaking English, many more are neither fluent in reading nor in writing English.
4. SCOPE
People like disabled persons, and those persons living in isolated and rural communities are often thevery persons who need information literacy training the most, because they do not have ready access tothe full range of readily available and accessible caregiver assistance and resources normally needed todeal with life’s many crises and challenges in such areas as health, education, citizenship, employment,community life participation, governance, etc. And, as stated above, such disadvantaged persons arenot in a position, for many different social, economic and geographic reasons, to search for, access andlearn from senior bilingual LIS professionals who are trained in Information Literacy and who couldteach them.

National Conference on Emerging Trends in Science, Technology and Management, 11-12 Nov 2017, ISBN: 978-93-5281-325-4 Page 12
For all of these reasons, this kind of project is believed worthwhile. IFLA also maintains anotherimportant international Information Literacy resource, called the Information Literacy InternationalResources Directory.
5. LIMITATION
There are about 7,000 living languages spoken by the world’s 7 billion people, and obviously wecannot embrace all of them. Most are languages spoken by only one or a few tribes, sects, or ethnicgroups within a country, often in remote and isolated geographic locations that frustrates any kind ofhuman or other traffic in or out, and therefore many of these languages are at a high risk of dying out.English may not even be the most frequently spoken language given the growth of China and India.However, the project aims to include the most widely spoken languages, and invites contributions forlanguages which may have been omitted. Having said that, however, no language is unimportant andthe objective is to be as inclusive as possible.The International Federation of Library Associations and Institutions (IFLA), regional LIS associationssuch as Commonwealth Library Association (COMLA), and national LIS associations encouraged thisproject, as well as UNESCO.Recently, we could observe a growing plurality of new concepts and terms such as Media andInformation Literacy (MIL), Multiple Literacy’s, Trans-literacy, Meta-literacy. Some of the languagecontributions included herein even comprise both information and media literacy resources, andsometimes even the newer MIL concept.The terms media literacy and information literacy could not always be easily compared and contrastedas between the endeavors of researchers and teachers in different regions. In the Russian Federation,for example, media education and information education have evolved largely as separate disciplines,and taught and learned in quite different educational and everyday life contexts, following differentresearch methodologies, and have gone in different directions, or as sometimes phrased “evolved ondifferent “tracks ” That is in part because the concepts of information culture and the concept of mediain the Russian Federation and France, for example, are quite different from that practiced in anglo-phone countries.
6. CONCLUSION
In the 21st Century, with the Second Millennium’s Google and search engines, and the Internet, thepossibility of stopping the information tsunami was virtually doomed forever. Media and media modes– the channels and conduits that move data and information from senders to receivers - proliferated too.The variety of information content arrangements, the many different audio and video communicationmodalities, and the diversity of the information formats and packages, all exploded. This was true notjust for data and information in text form, but for music, videos, pictures and photos as well.Finally, the ICTs became truly mobile, and became so small that people could access their information,music, pictures, and messages – virtually any audio/video resources- everywhere they went and anytime they wanted with the software necessary to use the downloaded material and often with a set ofdifferent applications to exploit their tremendously versatile potentials.In sum, the information and communication choices people were confronted with were far greater thanever before, and the need for educating and training people so that they efficiently, productively, andwisely could select the best and most appropriate alternative(s) from the whole range of communicationand information handling alternatives became critical.Therefore, the renaissance and “formalization” of the concept of Information Literacy in the very late20th and very early 21st Centuries can fairly be attributed to a discipline confluence of Library andInformation Science and Technology, Computer Science and Technology, Telecommunications,Communications, Information Management, Knowledge Management, E-learning, Online Education,the Information and Software Industry, the Internet, Search Engine technologies, Media technologies,Mobile Device technologies, and many other closely related and still-evolving disciplines, fields, ideas,and theories.
REFERENCES[1.] Parul Sharma, Mahesh Singh and Pankaj Kumar (2013), Approach to ICT in Library Training, Education
and Technology: Issues and Challenges, ICAL 2009, pp.669.[2.] Sirje Virkus (2012), Challenges of Library and Information Science Education Institute of Information
Studies, Talinn University, Estonia.[3.] Sawant, S. S. (2012). The study of the use of Web 2.0 tools in LIS education in India Library, Hi Tech
News, 29 (2), 2012 (ISSN 0741-9058) doi: 10.1108/ 07419051211236549.

National Conference on Emerging Trends in Science, Technology and Management, 11-12 Nov 2017, ISBN: 978-93-5281-325-4 Page 13
[4.] Anup Kumar Das, (2008), Open Access to Knowledge and Information: Scholarly Literature and DigitalLibrary Initiatives the South Asian Scenario, UNESCO, New Delhi.
[5.] http://ocw.mit.edu.[6.] http://openlearn.open.ac.uk.
National Conference on Emerging Trends in Science, Technology and Management, 11-12 Nov 2017, ISBN: 978-93-5281-325-4 Page 14
USE OF WIRELESS DEVICES AND IOT INMANAGEMENT OF DIABETES
Vinaytosh Mishra, MKP NaikDepartment of Mechnical Engineering,
Indian Institute of Technology (BHU), India
Abstract - Self Management is an important part of Diabetes Management. The Self Management can notonly make the treatment effective but also makes the treatment cost effective in case of chronic diseases likeDiabetes and metabolic disorders. With the advent of handheld diagnostic equipment and wearabletechnologies, the self-management has achieved new dimensions. The Internet of Things (IoT) concept playsa significant role in self-management in Diabetes Management. IoT uses sensors to assist diabetesmanagement by monitoring blood pressure, glucose level, calorie intake and physical activity. This researchproposes an intelligent service model for healthcare which gives an effective feedback to an individual indiabetes management. This model identifies the risk events beforehand and raises alarm for patient, familyand healthcare team. The paper further discusses scenarios for diffusion of IoT based self-management indiabetes.
Keywords-Diabetes, Self Management, IoT, Healthcare
1. INTRODUCTION
Diabetes is rising as an epidemic in many parts of the world. The growing prevalence of diabetes hasearned India a tag of world’s diabetes capital. In the year 2014, there were 387 million individuals withdiabetes, and this number is estimated to become 592 million by 2035[1].The regional prevalence ofdiabetes is estimated to become 10.1% by the year 2035. The major reasons for this rapid surge areasedentary lifestyle, increased urbanization and increased life expectancy. The South Asian populationis genetically at high risk of developing diabetes and hence the thresholds for the effect of BMI on age-adjusted type 2 diabetes (T2D) prevalence rates are lower for Indians [2].The T2D is expected to occurten year earlier than European due to the sweat genes [3]. With the progression of the disease, multiplecomplications like retinopathy, nephropathy, neuropathy, cardiac risk and diabetes foot occur. The costof diabetes management increases manyfolds with multiple complications [4]. This close monitoringand awareness are critical in diabetes management. The literaturesuggests that technologies like IoTcan play a significant role in this area.
2. LITERATURE REVIEW
Recent advances have made it possible for thewireless system to integrate and synchronize informationfrom different devices and communicate remotely with the medical center. Internet of Things (IoT)makes all objects become interconnected and smart, which has been recognized as the nexttechnological revolution. As its typical case, IoT-based smart rehabilitation systems are becoming abetter way to mitigate problems associated with chronic disease, aging populations and a shortage ofhealth professionals [14].Ubiquitous sensing enabled by Wireless Sensor Network (WSN) technologies are changing the wayhealthcare was being delivered. This enables us to measure, infer and understand health indicators,using sensors and wearable technologies. The proliferation of these devices creates the Internet ofThings (IoT), wherein sensors and actuators blend seamlessly in healthcare ecosystem, and theinformation is shared across platforms in order to develop a common operating picture (COP) [5].Literature suggests that patients, as well as healthcare providers both, are going to be benefited fromIoT in near future provided it is implemented properly. Some users of healthcare IoT are mobilemedical applications or wearable devices that allow patients to capture their health data. Hospitals useIoT to keep tabs on the location of medical devices, personnel, and patients [6].Diabetes is a major chronic disease problem worldwide with significant economic and social impact[7].The innovation in medical diagnostic equipment has shifted the control from labs to doctors andeventually patients. The internet and mobile technologies are changing the way healthcare was beingdelivered.The main communication form of present Internet is human-human with internet and sensorsconstituting the intermediate layers and IoT provide connectivity for everyone and everything. The IoTembeds some intelligence in Internet-connected healthcare things to communicate, exchangeinformation, make decisions, invoke actions and provide efficient management in Diabetes and anotherchronic disease [9].Omnipresent diabetes care things utilizing body sensor networks generate a clinically significant datathat need to be managed and stored for clinical use. This data can be used for risk prediction, alarm
National Conference on Emerging Trends in Science, Technology and Management, 11-12 Nov 2017, ISBN: 978-93-5281-325-4 Page 15
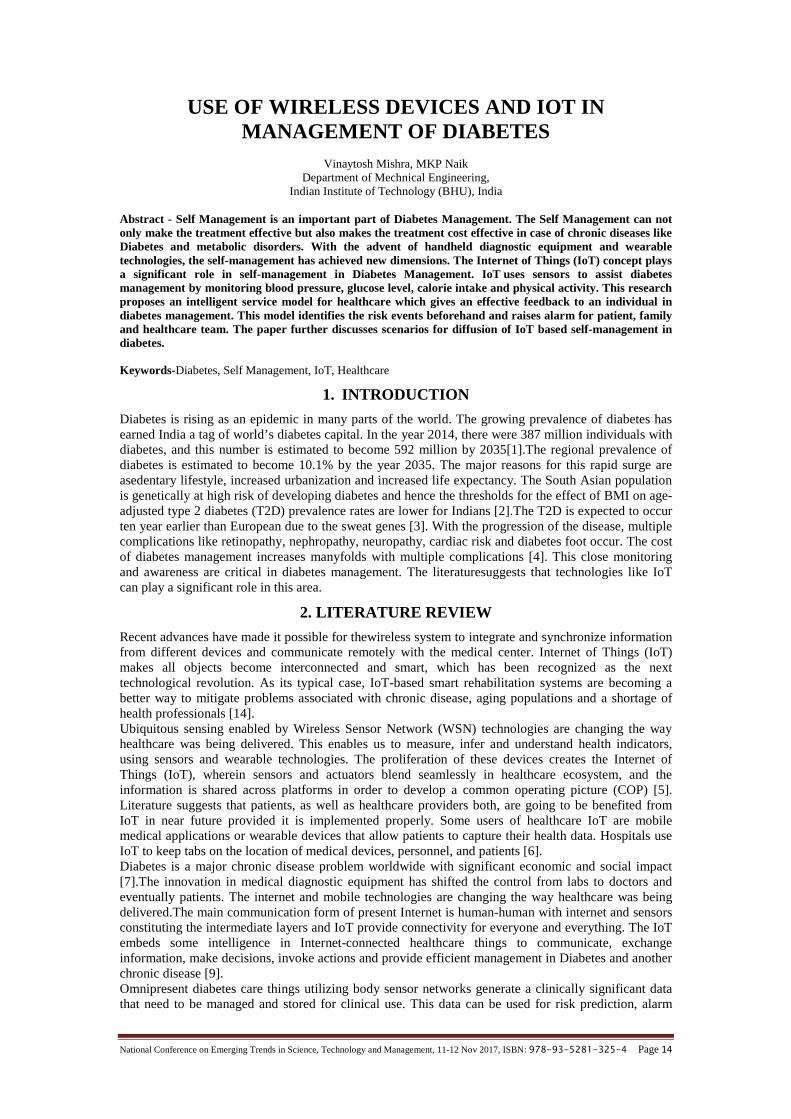
raising, treatment customization and evidence based medicine [13]. Cloud computing along with theInternet of Things (IoT) can help ineffectively managing and processing of this clinical data online[11].A generalized IoT architecture is explained in Figure 1 below. The sensors are connected to IoTdevices which are further connected to cloud directly or through IoT gateway. The IoT backend iscapable of data storage process automation for the specific use.
Fig. 1: Generalized IoT Architecture
The devices like Glucometer, Continuous Glucose Monitoring System (CGMS), Ambulatory BloodPressure Monitoring System (AMBP), Hypoglycemia Alarm, Activity Tracking WearableTechnologies (ATWT), Target Heart Rate Monitoring Devices (TMD) and Diet & Nutrition Apps haveadvancedsensors and actuators which form IoT devices [8]. These devices can communicate with cloudbased applications, which using IoT Backend help in managing diabetes management efficiently.Medical Technology requires three different players to evolve: academy, industry, and healthcare. Theuse of IoT in healthcare is at the initial stage and is based on academic research findings. Thesefindings are refined to innovations by research and development (R&D) activities within the firm.Finally, testing and further refinement will be conducted in the hospital setting. It may further takesome time to get adopted in self-management use in chronic disease management like diabetes. Thedevelopment of medical technologies can be described in five stages: (1) exploration, (2) development,(3) diffusion and accommodation, (4) assessment, and (5) feedback [10]. The impact of IoT inhealthcare, although still in its initial stages of development, has been significant. IoT in personalizedhealthcare can be instrumental in achieving customized healthcare at affordable costs[12].There is lackof literature on diffusion of IoT in healthcare and especially in diabetes management. This researchtries to fill this gap.
3. OBJECTIVE
1. Investigate the preliminary evidence that the Internet of Things can improve the quality ofhealthcare in Diabetes Management
2. Propose an intelligent service model for healthcare which gives an effective feedback to anindividual in diabetes management
3. Investigate the diffusion of technology in case of IoT based self-management in diabetes.
4. METHODOLOGY
For objective one the research used the systematic literature review (SLR) for use of Wi-Fi and self-care devices in healthcare. These two trends can shape the future of the use of IoT in diabetesmanagement in near future. An SLR is a secondary study for identifying, evaluating and interpreting allavailable research relevant to a particular research question on the topic. [20]. The search engine usedfor the research is PubMed. It comprises more than 26 million citations for biomedical literature fromMEDLINE, life science journals, and online books.The research question for the SLR is: “Is there preliminary evidence that the Internet of Things canimprove the quality of healthcare in Diabetes Management?”

National Conference on Emerging Trends in Science, Technology and Management, 11-12 Nov 2017, ISBN: 978-93-5281-325-4 Page 16
For research objective, two papers uses afocus group of eight doctors practicing in cardio diabetes areato take inputs from the sensor enabled, wireless devices being used in diabetes management in India. Afocus group is a small group of six to ten people led through anopen discussion by a skilled moderator.The group needs to be largeenough to generate rich discussion but not so large that someparticipantsare left out.The method applied for objective three is Bass Diffusion Model. The Bass Model is the most widelyapplied new-product diffusion model. It has been tested in many industries and with many newproducts (including services) and technologies [15].The portion of the potential patients that adopts theIoT at time t given that they have not yet adopted is equal to a linear function of previous adopters.This relationship can be described by Equation [1]:
( )( ) = p + [A(t)] [1]
M=Potential Size of Patientst=Time interval
p=Innovation coefficientq=Imitation coefficient
f(t)=Fraction of potential patients that adopts at time tF(t)=The portion (fraction) of the potential patients that have adopted up to and including time t
f(t) is time derivative of F(t) can be represented as:( ) = ( ) [2]The first time adopter at any time t is given by:
a(t)=Mf(t) [3]Hence the cumulative number of the adapter till time t is given by:
A(t)=M F(t), t>0 [4]The proportion of patients to adapt in time t divided by patients to adopt the IoT is given by:( )( ) [5]
Using equation [2] to [5] equations [1] can be modified as:( ) = + ( − ) ( ) − A (t)2 [6]( ) = + ( − ) ( ) −q[F(t)2] [7]Solving equation [7] gives us cumulative adaptation at a time t is given by:
[8]Substituting [8] in to [7] we get following equation:
[9]Differentiating [9] with respect to time we get following equation:
[10]Differentiating [10] with respect to time again gives us following equation:
[11]
Solving for t when( ) = 0 gives:
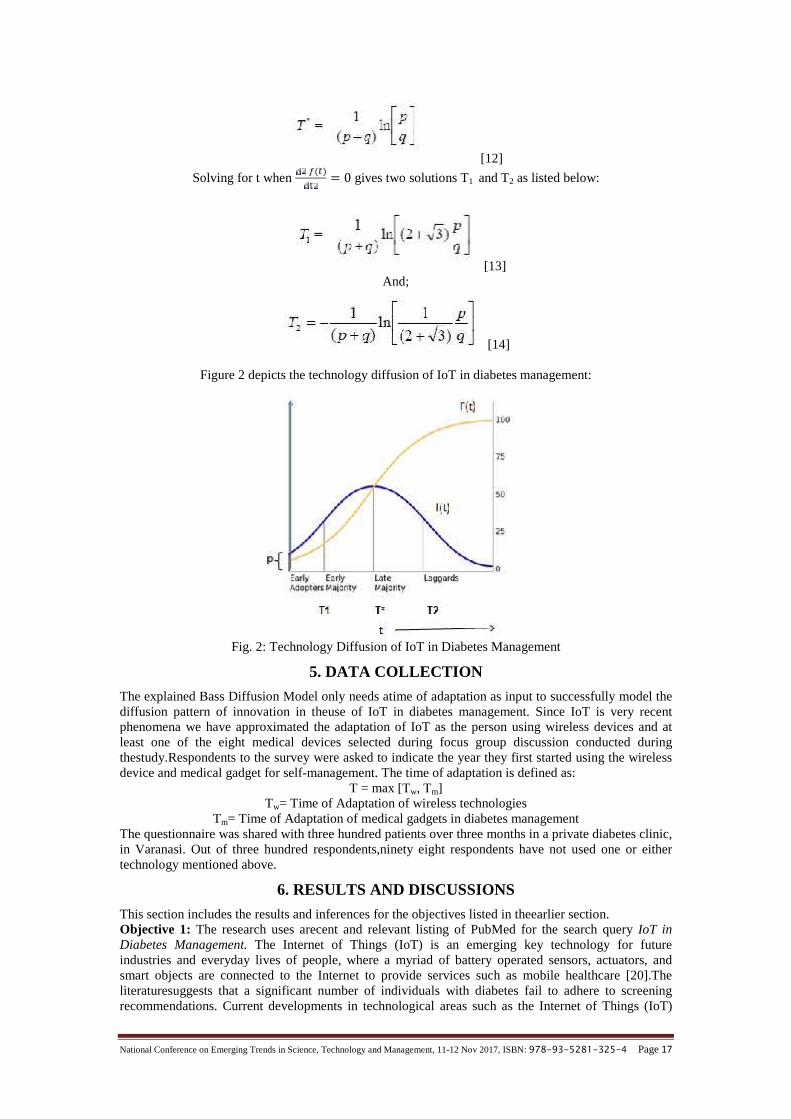
National Conference on Emerging Trends in Science, Technology and Management, 11-12 Nov 2017, ISBN: 978-93-5281-325-4 Page 17
[12]
Solving for t when( ) = 0 gives two solutions T1 and T2 as listed below:
[13]And;
[14]
Figure 2 depicts the technology diffusion of IoT in diabetes management:
Fig. 2: Technology Diffusion of IoT in Diabetes Management
5. DATA COLLECTION
The explained Bass Diffusion Model only needs atime of adaptation as input to successfully model thediffusion pattern of innovation in theuse of IoT in diabetes management. Since IoT is very recentphenomena we have approximated the adaptation of IoT as the person using wireless devices and atleast one of the eight medical devices selected during focus group discussion conducted duringthestudy.Respondents to the survey were asked to indicate the year they first started using the wirelessdevice and medical gadget for self-management. The time of adaptation is defined as:
T = max [Tw, Tm]Tw= Time of Adaptation of wireless technologies
Tm= Time of Adaptation of medical gadgets in diabetes managementThe questionnaire was shared with three hundred patients over three months in a private diabetes clinic,in Varanasi. Out of three hundred respondents,ninety eight respondents have not used one or eithertechnology mentioned above.
6. RESULTS AND DISCUSSIONS
This section includes the results and inferences for the objectives listed in theearlier section.Objective 1: The research uses arecent and relevant listing of PubMed for the search query IoT inDiabetes Management. The Internet of Things (IoT) is an emerging key technology for futureindustries and everyday lives of people, where a myriad of battery operated sensors, actuators, andsmart objects are connected to the Internet to provide services such as mobile healthcare [20].Theliteraturesuggests that a significant number of individuals with diabetes fail to adhere to screeningrecommendations. Current developments in technological areas such as the Internet of Things (IoT)
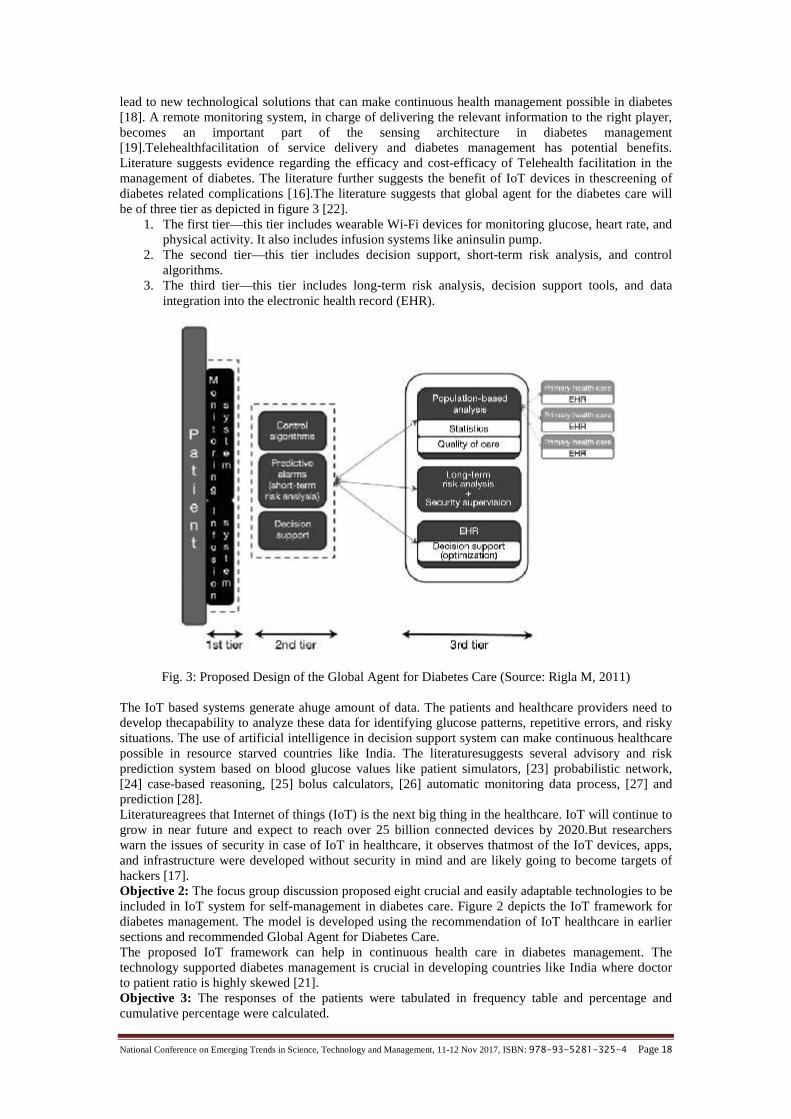
National Conference on Emerging Trends in Science, Technology and Management, 11-12 Nov 2017, ISBN: 978-93-5281-325-4 Page 18
lead to new technological solutions that can make continuous health management possible in diabetes[18]. A remote monitoring system, in charge of delivering the relevant information to the right player,becomes an important part of the sensing architecture in diabetes management[19].Telehealthfacilitation of service delivery and diabetes management has potential benefits.Literature suggests evidence regarding the efficacy and cost-efficacy of Telehealth facilitation in themanagement of diabetes. The literature further suggests the benefit of IoT devices in thescreening ofdiabetes related complications [16].The literature suggests that global agent for the diabetes care willbe of three tier as depicted in figure 3 [22].
1. The first tier—this tier includes wearable Wi-Fi devices for monitoring glucose, heart rate, andphysical activity. It also includes infusion systems like aninsulin pump.
2. The second tier—this tier includes decision support, short-term risk analysis, and controlalgorithms.
3. The third tier—this tier includes long-term risk analysis, decision support tools, and dataintegration into the electronic health record (EHR).
Fig. 3: Proposed Design of the Global Agent for Diabetes Care (Source: Rigla M, 2011)
The IoT based systems generate ahuge amount of data. The patients and healthcare providers need todevelop thecapability to analyze these data for identifying glucose patterns, repetitive errors, and riskysituations. The use of artificial intelligence in decision support system can make continuous healthcarepossible in resource starved countries like India. The literaturesuggests several advisory and riskprediction system based on blood glucose values like patient simulators, [23] probabilistic network,[24] case-based reasoning, [25] bolus calculators, [26] automatic monitoring data process, [27] andprediction [28].Literatureagrees that Internet of things (IoT) is the next big thing in the healthcare. IoT will continue togrow in near future and expect to reach over 25 billion connected devices by 2020.But researcherswarn the issues of security in case of IoT in healthcare, it observes thatmost of the IoT devices, apps,and infrastructure were developed without security in mind and are likely going to become targets ofhackers [17].Objective 2: The focus group discussion proposed eight crucial and easily adaptable technologies to beincluded in IoT system for self-management in diabetes care. Figure 2 depicts the IoT framework fordiabetes management. The model is developed using the recommendation of IoT healthcare in earliersections and recommended Global Agent for Diabetes Care.The proposed IoT framework can help in continuous health care in diabetes management. Thetechnology supported diabetes management is crucial in developing countries like India where doctorto patient ratio is highly skewed [21].Objective 3: The responses of the patients were tabulated in frequency table and percentage andcumulative percentage were calculated.
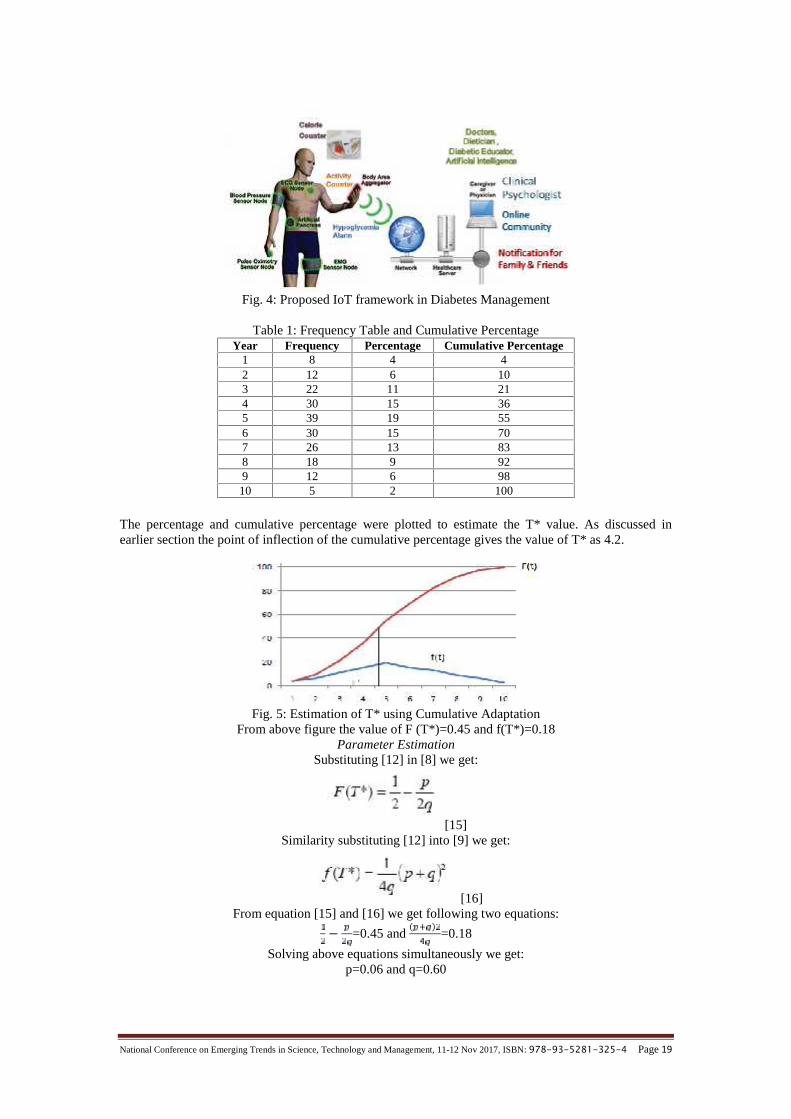
National Conference on Emerging Trends in Science, Technology and Management, 11-12 Nov 2017, ISBN: 978-93-5281-325-4 Page 19
Fig. 4: Proposed IoT framework in Diabetes Management
Table 1: Frequency Table and Cumulative PercentageYear Frequency Percentage Cumulative Percentage
1 8 4 42 12 6 103 22 11 214 30 15 365 39 19 556 30 15 707 26 13 838 18 9 929 12 6 9810 5 2 100
The percentage and cumulative percentage were plotted to estimate the T* value. As discussed inearlier section the point of inflection of the cumulative percentage gives the value of T* as 4.2.
Fig. 5: Estimation of T* using Cumulative AdaptationFrom above figure the value of F (T*)=0.45 and f(T*)=0.18
Parameter EstimationSubstituting [12] in [8] we get:
[15]Similarity substituting [12] into [9] we get:
[16]From equation [15] and [16] we get following two equations:− =0.45 and
( )=0.18
Solving above equations simultaneously we get:p=0.06 and q=0.60

National Conference on Emerging Trends in Science, Technology and Management, 11-12 Nov 2017, ISBN: 978-93-5281-325-4 Page 20
Table 2: Estimated Parameters for Bass ModelVariable Value
p 0.06q 0.6
q/p 10T1 4.98T* 6.98T2 8.97
Inference: The research classifies the people, who have adapted to the IoT less than five years aslaggards while those who have adapted between five and seven years as thelate majority. The patientsadapted between seven years and nine years are theearly majority, while before those periods are earlyadopters.These parameters show that there is alate adaptation because the diffusion graph is rightskewed.
7. CONCLUSIONS
Using SLR paper was able to gather evidence that IoT is useful in providing the continuous health carein diabetes management. It may be helpful in solving the problem of lack of resources and rising cost inchronic disease management like diabetes. The research also warns against the security issue asapossible reason to impede the advancement in the use of IoT in diabetes management. The researchproposes three layered IoT based framework for diabetes management. The paper gives a technologydiffusion model with graph being right skewed. Thus we can say that the adaptation of IoT inhealthcare is a recent phenomenon and it will take time to mature. The more work is needed in this areato provide insight for users, service providers, and policy makers.
REFERENCES
[1.] International Diabetes Federation,Diabetes Atlas,(6th ed) (2014) Available at www.idf.org AccessedJanuary 1, 2017
[2.] T. Nakagami, Q. Qiao, B. Carstensen, et al.The DECODE-DECODA Study Group. Age, body massindex and type 2 diabetes-associations modified by ethnicity, Diabetologia, 46 (2003), pp. 1063–1070
[3.] V. Mohan, S. Sandeep, R. Deepa, et al.Epidemiology of type 2 diabetes: Indian scenario, Indian J MedRes, 125 (2007), pp. 217–230
[4.] Kumpatla, S., Kothandan, H., Tharkar, S., & Viswanathan, V. (2013). The costs of treating long termdiabetic complications in a developing country: a study from India. JAPI, 61, 17.
[5.] Gubbi, J., Buyya, R., Marusic, S., & Palaniswami, M. (2013). Internet of Things (IoT): A vision,architectural elements, and future directions. Future Generation Computer Systems, 29(7), 1645-1660.
[6.] Chui, M., Löffler, M., & Roberts, R. (2010). The internet of things. McKinsey Quarterly, 2(2010), 1-9.[7.] Istepanian, R. S. H., Hu, S., Philip, N. Y., & Sungoor, A. (2011, August). The potential of Internet of
m-health Things “m-IoT” for non-invasive glucose level sensing. In 2011 Annual InternationalConference of the IEEE Engineering in Medicine and Biology Society (pp. 5264-5266). IEEE.
[8.] Ciemins, E., Coon, P., & Sorli, C. (2010). An analysis of data management tools for diabetes self-management: can smart phone technology keep up?. Journal of diabetes science and technology, 4(4),958-960.
[9.] Khan, R., Khan, S. U., Zaheer, R., & Khan, S. (2012, December). Future internet: the internet of thingsarchitecture, possible applications and key challenges. In Frontiers of Information Technology (FIT),2012 10th International Conference on (pp. 257-260). IEEE.
[10.] Blume, S. S. (1992). Insight and industry: on the dynamics of technological change in medicine. MITPress.
[11.] Doukas, C., & Maglogiannis, I. (2012, July). Bringing IoT and cloud computing towards pervasivehealthcare. In Innovative Mobile and Internet Services in Ubiquitous Computing (IMIS), 2012 SixthInternational Conference on (pp. 922-926). IEEE
[12.] Kulkarni, A., & Sathe, S. (2014). Healthcare applications of the Internet of Things: A Review.International Journal of Computer Science and Information Technologies, 5(5), 6229-32.
[13.] Fernandez, F., & Pallis, G. C. (2014, November). Opportunities and challenges of the Internet ofThings for healthcare: Systems engineering perspective. In Wireless Mobile Communication andHealthcare (Mobihealth), 2014 EAI 4th International Conference on (pp. 263-266). IEEE.
[14.] Fan, Y. J., Yin, Y. H., Da Xu, L., Zeng, Y., & Wu, F. (2014). IoT-based smart rehabilitation system.IEEE transactions on industrial informatics, 10(2), 1568-1577
[15.] Bass, Frank M. 2004. Comments on "A new product growth for model consumer durables."Management Science 50, 12 1833-1840.

National Conference on Emerging Trends in Science, Technology and Management, 11-12 Nov 2017, ISBN: 978-93-5281-325-4 Page 21
[16.] Brazionis, Laima, et al. "An evaluation of the Tele-health facilitation of diabetes and cardiovascularcare in remote Australian Indigenous communities:-protocol for the Tele-health eye and associatedmedical services network [TEAMSnet] project, a pre-post study design." BMC Health ServicesResearch 17.1 (2017): 13.
[17.] Khera, M. (2016). Think Like a Hacker Insights on the Latest Attack Vectors (and Security Controls)for Medical Device Applications. Journal of Diabetes Science and Technology, 1932296816677576.
[18.] Miranda, J., Cabral, J., Wagner, S. R., Fischer Pedersen, C., Ravelo, B., Memon, M., & Mathiesen, M.(2016). An Open Platform for Seamless Sensor Support in Healthcare for the Internet of Things.Sensors, 16(12), 2089.
[19.] Lanzola, G., Losiouk, E., Del Favero, S., Facchinetti, A., Galderisi, A., Quaglini, S., & Cobelli, C.(2016). Remote Blood Glucose Monitoring in mHealth Scenarios: A Review. Sensors, 16(12), 1983.
[20.] Abbas, Z., & Yoon, W. (2015). A survey on energy conserving mechanisms for the internet of things:Wireless networking aspects. Sensors, 15(10), 24818-24847.
[21.] Mullan, F. (2006). Doctors for the world: Indian physician emigration. Health affairs, 25(2), 380-393.[22.] Rigla, M. (2011). Smart telemedicine support for continuous glucose monitoring: the embryo of a
future global agent for diabetes care. Journal of diabetes science and technology, 5(1), 63-67.[23.] Salzsieder E, Albrecht G, Fischer U, Freyse EJ. Kinetic modeling of the glucoregulatory system to
improve insulin therapy. IEEE Trans Biomed Eng. 1985;32(10):846–55.[24.] Hernando ME, Gómez EJ, Corcoy R, del Pozo F. Evaluation of DIABNET, a decision support system
for therapy planning in gestational diabetes. Comput Methods Programs Biomed. 2000;62(3):235–48.[25.] Bellazzi R, Larizza C, Montani S, Riva A, Stefanelli M,d’Annunzio G, Lorini R, Gomez EJ, Hernando
E, Brugues E, Cermeno J, Corcoy R, de Leiva A, Cobelli C, Nucci G, Del Prato S, Maran A, Kilkki E,Tuominen J. A telemedicine support for diabetes management: the T-IDDM roject. Comput MethodsPrograms Biomed. 2002, 69(2):147–61.
[26.] Palerm CC, Zisser H, Bevier WC, Jovanovic L, Doyle FJ 3rd. Prandial insulin dosing using run-to-runcontrol: application of clinical data and medical expertise to define a suitable performance metric.Diabetes Care. 2007, 30(5):1131–6.
[27.] García-Sáez G, Alonso JM, Molero J, Rigla M, Martínez-Sarriegui I,Leiva A, Gómez EJ, HernandoEM. Mealtime blood glucose classifier based on fuzzy logic for DIABTel telemedicine system. ArtifIntell Med. 2009, 5651:295–304.
[28.] Pérez-Gandía C, Facchinetti A, Sparacino G, Cobelli C, Gómez EJ, Rigla M, de Leiva A, HernandoME. Artificial neural network algorithm for online glucose prediction from continuous glucosemonitoring. Diabetes Technol Ther. 2010;12(1):81–8.
National Conference on Emerging Trends in Science, Technology and Management, 11-12 Nov 2017, ISBN: 978-93-5281-325-4 Page 22
SYNTHESIS AND CNS ACTIVITY OF NEW INDOLEDERIVATIVES
Dr. Anand Pratap Singh, Assistant Professor,Department of Chemistry, Mahatma Gandhi Kashi Vidyapith Varanasi
Email: [email protected]
Abstract - Several new 5-(3'-Indolylmethyl)-1, 3, 4- oxadiazolyl-2-amino-chalkone were synthesized by thereaction of 2-Acetylamino-5-(3'-indolylmethyl)-1, 3, 4- oxadiazole in methanol and substituents in thepresence of 2% KOH solution. Indole was starting material. The structures of newly synthesizedcompounds were conformed to the help of elemental and spectral studies. Some of these synthesizedcompounds were screened for their cardiovascular/dilatory effect with CNS depressant activities.
Keywords- CNS depressant, inflammatory, ALD, cardiovascular, SMA.
1. INTRODUCTION
Compounds having indole nucleus are reported to exhibit a wide spectrum of biological activities.These derivatives also pass a variety of pharmacological properties viz. analgestic2, inflammatory3 andCNS depressant18 activities. In this paper we report the synthesis of indole derivatives havingsubstituted oxadiazole ring. With these modifications we hope to prepare indole derivatives, whichhave the potential or acting as drug associates cardiovascular/dilatory effect, CNS depressant activities.
2. MATERIAL AND MEHODS (EXPERIMENTAL)
Chemistry: The melting points were determined in open capillary tubes and are uncorrected. Thepurity of the compounds was checked by TLC (silica gel absorbent) using iodine vapour as visualizingagent. The structures of the desired products were ascertained by IR, 1H NMR spectral analytical data.IR Spectra were recorded on Perkin-Elmer-881 Spectrophotometer in KBr, 1H NMR spectra wererecorded in CDCl3 on Brucker DPX-300 MHz.The following steps of Scheme for the synthesis of the derivatives of indole were used:
1. Synthesis of Ethyl-3-indole-acetate [1].2. Synthesis of l-(3'-Acetylindolyl)- semicarbazide [2]3. Synthesis of 2-Amino-5-(3'-indolylmethyl)-1,3,4- oxadiazole [3]4. Synthesis of 2-Acetylamino-5-(3'-indolylmethyl)-1,3,4- oxadiazole [4]5. Synthesis of 5-(3'-Indolylmethyl)-1,3,4- oxadiazolyl-2-amino-chalkone [5]
Ethyl-3-indole acetate: 1Ethylchloro acetate (0.1 mole, 12.25 gms) and anhydrous Na2CO3
(4.0 gms) were added to the solution of indole (0.1 mole, 11.72 gms) in methanol (50 ml). The reactionmixture was refluxed for 12 hours, cooled and the excess of solvent was removed. The obtained solidwas washed with water and recrystallized from ethanol to furnish compound 1. m.p.42°C yield 65%(Found: C, 69.64; H, 6.54; N, 6.54. Calcd. for C12H13O2N: C, 70.94; H, 6.40; N, 6.90%). IR (KBr):3140 (N-H), 3006 (C-H aromatic), 2928 (C-H aliphatic), 1734 (C=O), 1575 cm-1 (C=C of aromaticring).l-(3'-Acetylindolyl)-semicarbazide: 2To a solution of compound 1 (0.075 mole, 15.20 gms) in ethanol (50 ml) semicarbazide hydrochloride(0.075 mole, 8.36 gms) was added and refluxed for about 12 hours in the presence of KOH. The excessof solvent was distilled off under reduced pressure, concentrated, cooled, poured onto crushed ice,filtered and recrystallized from ethanol-water.
m.p. 275°C yield 60% (Found: C, 57.08; H, 5.40; N, 24.05. Calcd. for C11H12O2N4: C, 56.89; H,5.17; N, 24.14%).
IR (KBr): 3155 (N–H), 3030 (C–H aromatic), 2920 (C–H aliphatic), 1700 (C=O), 1600 (C=C ofaromatic ring), 1225 (C–N), 1435 cm-1 (N–N).
lH NMR (CDCl3): 7.18 (s, 4H, Ar-H), 6.80 (d, 1H, CH), 10.1 (s, 1H, NH of indole,exchangeable with D2O), 3.32 (s, 2H, CH2, attached to indole nucleus), 8.0 (s, 1H, NH, sec. amide), 6.0(s, 3H, NH).
2-Amino-5-(3'-indolymethyI)-1,3,4-oxadiazole: 3A mixture of compound 2 (0.05 mole, 11.61 gms) and conc. H2SO4 (25 ml) was kept overnight at roomtemperature. This reaction mixture was poured into ice-cold water and neutralized with liquid ammoniaand filtered. The product obtained was washed with water and recrystallized from ethanol to getcompound 3.
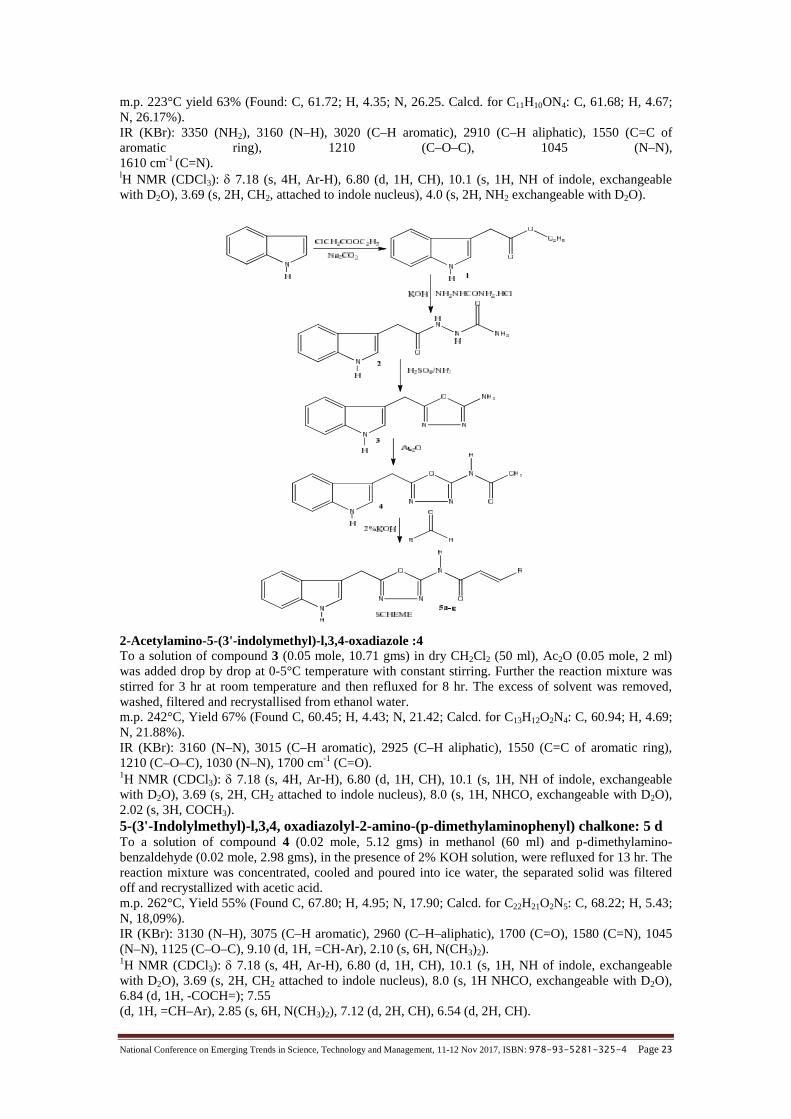
National Conference on Emerging Trends in Science, Technology and Management, 11-12 Nov 2017, ISBN: 978-93-5281-325-4 Page 23
m.p. 223°C yield 63% (Found: C, 61.72; H, 4.35; N, 26.25. Calcd. for C11H10ON4: C, 61.68; H, 4.67;N, 26.17%).IR (KBr): 3350 (NH2), 3160 (N–H), 3020 (C–H aromatic), 2910 (C–H aliphatic), 1550 (C=C ofaromatic ring), 1210 (C–O–C), 1045 (N–N),1610 cm-1 (C=N).lH NMR (CDCl3): 7.18 (s, 4H, Ar-H), 6.80 (d, 1H, CH), 10.1 (s, 1H, NH of indole, exchangeablewith D2O), 3.69 (s, 2H, CH2, attached to indole nucleus), 4.0 (s, 2H, NH2 exchangeable with D2O).
2-Acetylamino-5-(3'-indolymethyl)-l,3,4-oxadiazole :4To a solution of compound 3 (0.05 mole, 10.71 gms) in dry CH2Cl2 (50 ml), Ac2O (0.05 mole, 2 ml)was added drop by drop at 0-5°C temperature with constant stirring. Further the reaction mixture wasstirred for 3 hr at room temperature and then refluxed for 8 hr. The excess of solvent was removed,washed, filtered and recrystallised from ethanol water.m.p. 242°C, Yield 67% (Found C, 60.45; H, 4.43; N, 21.42; Calcd. for C13H12O2N4: C, 60.94; H, 4.69;N, 21.88%).IR (KBr): 3160 (N–N), 3015 (C–H aromatic), 2925 (C–H aliphatic), 1550 (C=C of aromatic ring),1210 (C–O–C), 1030 (N–N), 1700 cm-1 (C=O).1H NMR (CDCl3): 7.18 (s, 4H, Ar-H), 6.80 (d, 1H, CH), 10.1 (s, 1H, NH of indole, exchangeablewith D2O), 3.69 (s, 2H, CH2 attached to indole nucleus), 8.0 (s, 1H, NHCO, exchangeable with D2O),2.02 (s, 3H, COCH3).5-(3'-Indolylmethyl)-l,3,4, oxadiazolyl-2-amino-(p-dimethylaminophenyl) chalkone: 5 dTo a solution of compound 4 (0.02 mole, 5.12 gms) in methanol (60 ml) and p-dimethylamino-benzaldehyde (0.02 mole, 2.98 gms), in the presence of 2% KOH solution, were refluxed for 13 hr. Thereaction mixture was concentrated, cooled and poured into ice water, the separated solid was filteredoff and recrystallized with acetic acid.m.p. 262°C, Yield 55% (Found C, 67.80; H, 4.95; N, 17.90; Calcd. for C22H21O2N5: C, 68.22; H, 5.43;N, 18,09%).IR (KBr): 3130 (N–H), 3075 (C–H aromatic), 2960 (C–H–aliphatic), 1700 (C=O), 1580 (C=N), 1045(N–N), 1125 (C–O–C), 9.10 (d, 1H, =CH-Ar), 2.10 (s, 6H, N(CH3)2).1H NMR (CDCl3): 7.18 (s, 4H, Ar-H), 6.80 (d, 1H, CH), 10.1 (s, 1H, NH of indole, exchangeablewith D2O), 3.69 (s, 2H, CH2 attached to indole nucleus), 8.0 (s, 1H NHCO, exchangeable with D2O),6.84 (d, 1H, -COCH=); 7.55(d, 1H, =CH–Ar), 2.85 (s, 6H, N(CH3)2), 7.12 (d, 2H, CH), 6.54 (d, 2H, CH).

National Conference on Emerging Trends in Science, Technology and Management, 11-12 Nov 2017, ISBN: 978-93-5281-325-4 Page 24
The different other 5-(3'-indolylmethyl)-l, 3, 4-oxadiazolyl-2-amino-substituted chalkones 5a, 5b, 5c,5d, 5e were synthesized by using different aromatic aldehydes. Similarly, their physical and analyticaldata are given in Table I.Table I: Characterization of data of Compounds 5a-5e
Comp. R m.p. (oC) Yield%
Recrystalli-zationsolvent
Mol.
Formula
Found (Calcd.) %C H N
5a 229 56 Methanolwater
C20H16O2N4 69.92(69.77)
4.72(4.65)
16.05(16.28)
5b 222 60 DMF C21H18O2N4 70.50(70.37)
5.23(5.06)
15.23(15.63)
5c 240 64 Ethanolwater
C20H15O2N4
Cl63.01
(63.41)4.93
(3.99)14.43
(14.78)
5d 262 55 Acetic acid C22H21O2N5 67.80(68.22)
4.95(5.43)
17.90(18.09)
5e 260 54 Methanolwater
C20H15O2N4
Br56.92
(56.75)3.68
(3.57)13.05
(13.23)
3. BIOLOGICAL STUDY
The methods employed during the course of investigation are given below:The studies were carried out in Swiss Albino mice of either sex weighing between 15 to 20 g, each andexperiments were conducted at a controlled room temperature of 25+1°C in an air conditionedlaboratory. The compounds were administered i.p. as aqueous suspension in gum acacia.i) Acute ToxicityThe ALD50 was determined in mice using the method of Horn6. Doses of the compounds were given ingroups of 5 mice each in a geometrical progression starting with a dose of 464 mg/kg i.p. and mortalityin 24 hours recorded. The ALD50 with fiducial limits was read out from the table given in the samemethod.ii) Gross effectsThe method of Dua7 was used. After i.p. administration of the compounds in groups of 5 mice each theanimals were observed for gross behavioural effects. The animals were observed continuously for 3hours after administration of the compound, then every thirty minutes for next three hours and finallyafter 24 hours. CNS stimulation was judged by increased spontaneous motor activity (SMA),piloerection, exophthalmos, clonic and/or tonic convulsions, CNS depression by reduced SMA,sedation, ptosis, crouching, catalepsy and autonomic effects by piloerection, urination, defaecation,salivation, lachrymation etc. At ½ the ALD50 these effects were recorded using groups of 5 mice andeffect on the body temperature was also recorded with a telethermometer using YSI 402 physiologicalprobe. SMA observed by the actophotometer.Table II
Compd. Dose mg/kg i.v. Fall in blood pressure (mm Hg) ALD50 mg/kgi.p.
Effect on gross behaviour at 1/5th
ALD50 i.p.Intermediate Delayed5a 2 40 35 >1000 No effect5b 2 30 20 >1000 Depressant 10%5c 2 45 36 >1000 No effect5d 2 30 15 >1000 Depressant 21%5e 2 25 20 >1000 No effect
CH3
Cl
N(CH3)2
B r

National Conference on Emerging Trends in Science, Technology and Management, 11-12 Nov 2017, ISBN: 978-93-5281-325-4 Page 25
4. RESULT AND DISCSSION
The author had synthesised five compounds of 5-(3'-Indolylmethyl)-l, 3, 4, oxadiazolyl-2-amino-(p-dimethylaminophenyl) chalkone.The determination of the CNS activity of the synthesised compounds was performed on Albino mice,and the results obtained there from are recorded in table-III.All the compounds (indole derivatives) were found to exhibit dilatory effect activities oncardiovascular system (CVS). However, only two compounds (out of the total of five) showed the CNSdepressant activity. The compounds are listed as under 5b and 5d.The maximum CNS depressant activity of the order of 21% was observed by the compound5d. Interestingly, the same compound also showed the maximum dilatory effect in CVS.Discussion (S.A.R.)We have carefully examined the structures of the two compounds, associated with CNS depressantactivity (vide supra). It appears that the presence of methyl or dimethylamino group in the phenyl ringis necessary for the development of good or maximum CNS depressant activity. Compound which haveunsubstituted phenyl ring or carry a halo substituent, have been found to either lack or possess lowCNS depressant activity. Based on the above facts it is clear that ring activating substituents producemaximum or good CNS activity, while the presence of a ring deactivating group depresses the same.
REFERENCES[1.] Ekta Bansal, V.K. Srivastava and Ashok Kumar. Indian J. Chem., 39B, 357 (2000).[2.] S.P. Hiremath, K. Rudresh and A.R. Saundone. Indian J. Chem., 41B, 394 (2002).[3.] Agarwal R., Agarwal C. and Kumar P. Pharm. Res. Commun., 16, 83 (1984).[4.] Kaesling H.H. and Willette R.E. J. Med. Chem., 7, 94 (1964).[5.] Agarwal C, Agarwal R., Gupta P.N., Srivastava V.K. and Misra V.C., Acta. Pharma. Jugosl. 33, 183
(1983).[6.] Horn H.J., Biometrics, 12, 311 (1956).[7.] Dua P.R., "Testing natural procedure for acute toxicity and CNS effects" Proceedings of UNESCO CDRI
Workshop 18-77 Oct, (1982).[8.] Swinyard E.A., Brown W.C. and Goodman I.S., J. Pharmacol. Exp. Ther., 176, 139 (1952).[9.] Kumar S. and Joshi S.S. Ind. J. Appl. Chem. 26(5-6), 199-52 (1963).[10.] Srivastava V.K., Singh S., Gulati A., Shanker K., Ind. J. Chem., 26B, 652 (1987).[11.] Keigo Nishino, Noriko I., Jalhiko S. and Tsutomu, I., Yakuga ku Zasshi 85(8), 715 (1965). Chem. Abstr.
61: 11997e (1965).[12.] K. Benkli, S. Demirayak, N. Gundoglu-Karaburum, N. Kiraz, G. Iscan & U. Ucucu. Indian J. Chem.
43B, 174 (2004).[13.] B. Ziobro, B. Siemkiewick & P. Kowalski. J. Hetero. Chem., 41, 95 (2004).[14.] Jagmohan and Diksha Khatter. Indian J. Hetero. Chem. ,13, 319 (2004).[15.] Rani Preeti, Srivastava V.K. and Ashok Kumar. Indian Drugs, 39, 312 (2002).[16.] S. Battaglia, E. Boldrini, F. Da Settimo, G. Dondio C. La Matha, A.M. Marini, G. Primostore. Eur. J.
Med. Chem., 34, 93 (1999).[17.] A.K. Padny, S.K. Sahu, P.K. Panda, D.M. Kar and P.K. Mishra. Indian J. Chem. 43B, 971 (2004).[18.] K.S. Natraj, J.Venkateshwara rao and K.N. Jayaveera Int. J. Chem. Sci. 8(1),470-474(2010).
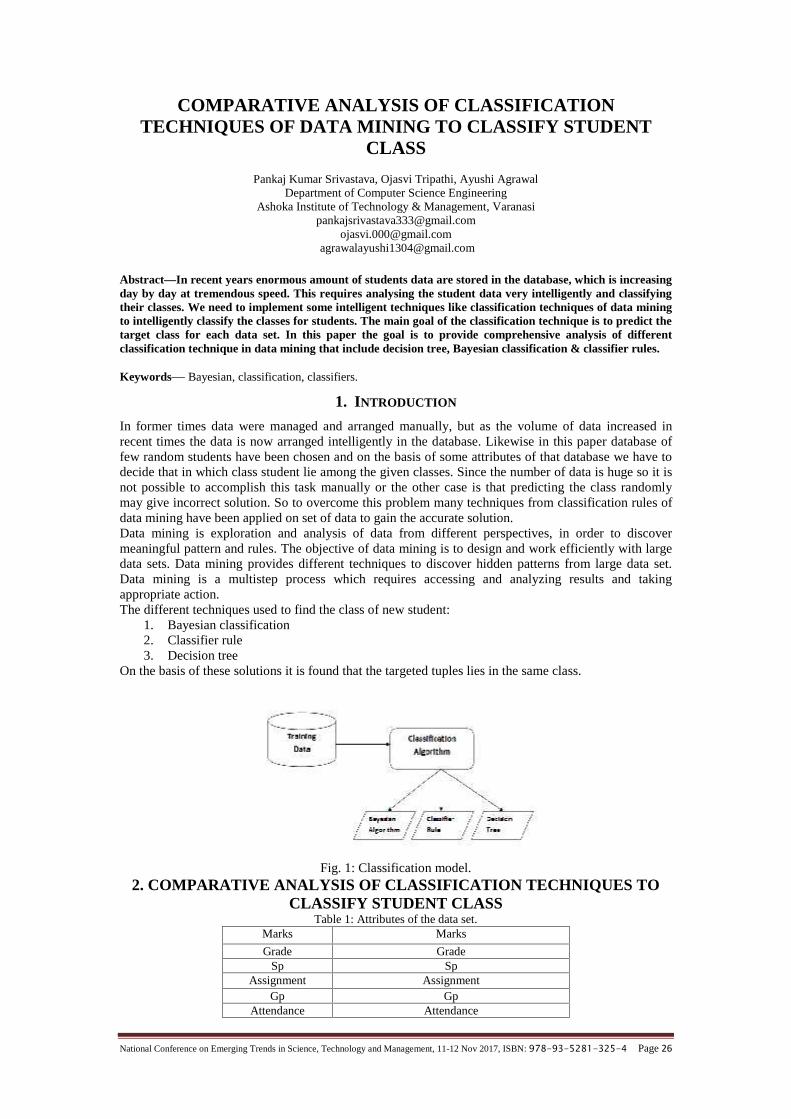
National Conference on Emerging Trends in Science, Technology and Management, 11-12 Nov 2017, ISBN: 978-93-5281-325-4 Page 26
COMPARATIVE ANALYSIS OF CLASSIFICATIONTECHNIQUES OF DATA MINING TO CLASSIFY STUDENT
CLASS
Pankaj Kumar Srivastava, Ojasvi Tripathi, Ayushi AgrawalDepartment of Computer Science Engineering
Ashoka Institute of Technology & Management, [email protected]
[email protected]@gmail.com
Abstract—In recent years enormous amount of students data are stored in the database, which is increasingday by day at tremendous speed. This requires analysing the student data very intelligently and classifyingtheir classes. We need to implement some intelligent techniques like classification techniques of data miningto intelligently classify the classes for students. The main goal of the classification technique is to predict thetarget class for each data set. In this paper the goal is to provide comprehensive analysis of differentclassification technique in data mining that include decision tree, Bayesian classification & classifier rules.
Keywords— Bayesian, classification, classifiers.
1. INTRODUCTION
In former times data were managed and arranged manually, but as the volume of data increased inrecent times the data is now arranged intelligently in the database. Likewise in this paper database offew random students have been chosen and on the basis of some attributes of that database we have todecide that in which class student lie among the given classes. Since the number of data is huge so it isnot possible to accomplish this task manually or the other case is that predicting the class randomlymay give incorrect solution. So to overcome this problem many techniques from classification rules ofdata mining have been applied on set of data to gain the accurate solution.Data mining is exploration and analysis of data from different perspectives, in order to discovermeaningful pattern and rules. The objective of data mining is to design and work efficiently with largedata sets. Data mining provides different techniques to discover hidden patterns from large data set.Data mining is a multistep process which requires accessing and analyzing results and takingappropriate action.The different techniques used to find the class of new student:
1. Bayesian classification2. Classifier rule3. Decision tree
On the basis of these solutions it is found that the targeted tuples lies in the same class.
Fig. 1: Classification model.2. COMPARATIVE ANALYSIS OF CLASSIFICATION TECHNIQUES TO
CLASSIFY STUDENT CLASSTable 1: Attributes of the data set.
Marks Marks
Grade GradeSp Sp
Assignment AssignmentGp Gp
Attendance Attendance

National Conference on Emerging Trends in Science, Technology and Management, 11-12 Nov 2017, ISBN: 978-93-5281-325-4 Page 27
Table 2: Training Data
S.No Marks Grade Sp Assignment Gp Attendance Lw Student Class1 First Good Good Yes Yes Good Yes First2 First Good Average Yes No Good Yes First3 First Good Average No No Average No First4 First Average Good No No Good Yes First5 First Average Average No Yes Good Yes First6 First Poor Average No No Average Yes First7 First Poor Average No No Poor No Second8 First Average Poor Yes Yes Average No First9 First Poor Poor No No Poor No Third
10 First Average Average Yes Yes Good No First11 Second Good Good Yes Yes Good Yes First12 Second Good Average Yes Yes Good Yes First13 Second Good Average Yes No Good No First14 Second Average Good Yes Yes Good No First15 Second Good Average Yes Yes Average Yes First16 second Good Average Yes Yes Poor Yes Second17 Second Average Average Yes Yes Good Yes Second18 Second Average Average Yes Yes Poor Yes Second19 Second Poor Average No Yes Good Yes Second20 Second Average Poor Yes NO Average Yes Second21 Second Poor Average No Yes Poor No Third22 Second Poor Poor Yes Yes Average Yes Third23 Second Poor Poor No No Average Yes Third24 Second Poor Poor Yes Yes Good Yes Third25 Second Poor Poor Yes Yes Poor Yes Third26 Second Poor Poor No No Poor Yes Fail27 Third Good Good Yes Yes Good Yes First28 Third Average Good Yes Yes Good Yes Second29 Third Good Average Yes Yes Good Yes Second30 Third Good Good Yes Yes Average Yes Second31 Third Good Good No No Good Yes Second32 Third Average Average Yes Yes Good Yes Second33 Third Good Average No Yes Average Yes Third34 Third Average Poor No No Average Yes Third35 Third Poor Average Yes No Average Yes Third36 Third Poor Average No Yes Poor Yes Fail37 Third Average Average No Yes Poor Yes Third38 Third Poor Poor No No Good No Third39 Third Poor Poor No Yes Poor Yes Fail40 Third Poor Poor No No Poor No Fail41 Fail Good Good Yes Yes Good Yes Second42 Fail Good Good Yes Yes Average Yes Second43 Fail Average Good Yes Yes Average Yes Third44 Fail Poor Poor Yes Yes Average No Fail45 Fail Good Poor No Yes Poor Yes Fail46 Fail Poor Poor No No Poor Yes Fail47 Fail Average Average Yes Yes Good Yes Second48 Fail Poor Good No No Poor No Fail
Test data: X = (Marks = first, Grade = good, Sp= good, Assignment=yes, Gp = no, Attendance =good,Lw = yes)
3. CLASSIFICATION ALGORITHMS
3.1. Decision Tree Induction
Decision tree induction is the learning of decision trees from class-labelled training tuples. A Decisiontree is a flowchart like tree structure, where each internal node denotes a test onAn attributes, each branch represents an outcome of the test, and each leaf node holds a class level. Thetop most nodes in a tree is the root node. For the above problem we define the Decision tree for findingthe type class. In this, marks give high information and become the splitting attribute at the root nodeof decision tree. Each internal node represent Attendance attribute and each leaf node represent a typein between First, second, third and fail.
Lw LwStudent Class: Class belonging to the student
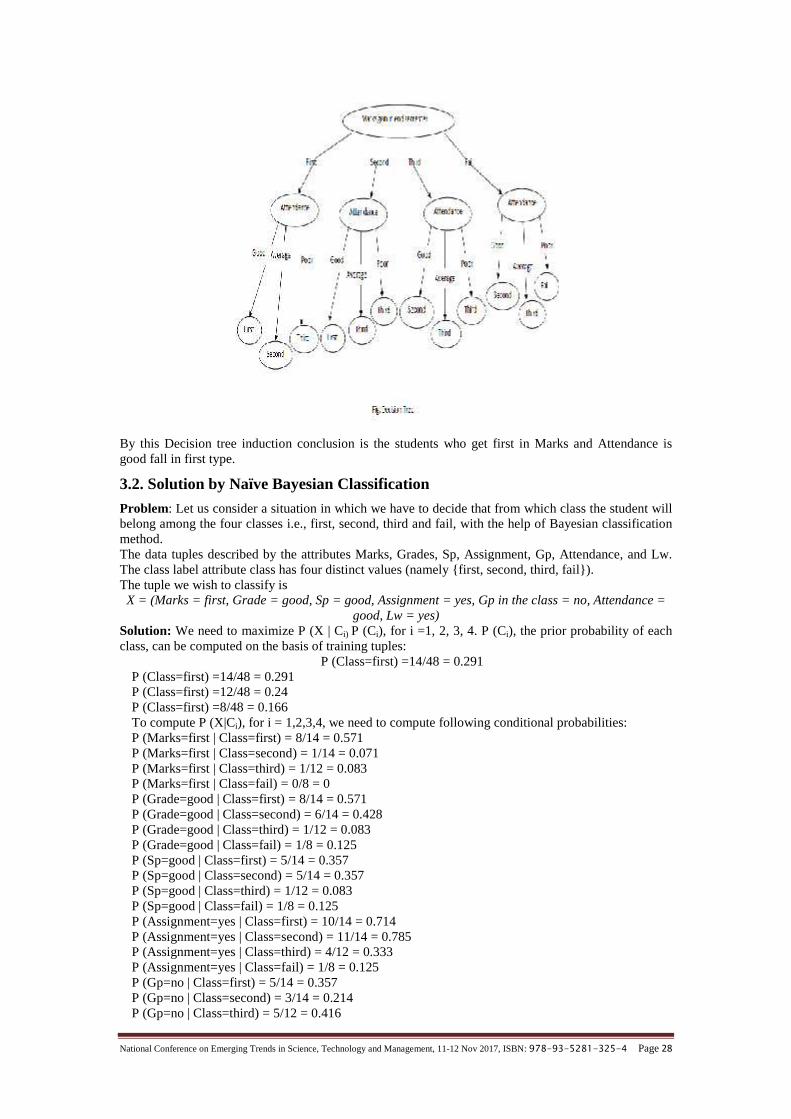
National Conference on Emerging Trends in Science, Technology and Management, 11-12 Nov 2017, ISBN: 978-93-5281-325-4 Page 28
By this Decision tree induction conclusion is the students who get first in Marks and Attendance isgood fall in first type.
3.2. Solution by Naïve Bayesian Classification
Problem: Let us consider a situation in which we have to decide that from which class the student willbelong among the four classes i.e., first, second, third and fail, with the help of Bayesian classificationmethod.The data tuples described by the attributes Marks, Grades, Sp, Assignment, Gp, Attendance, and Lw.The class label attribute class has four distinct values (namely first, second, third, fail).The tuple we wish to classify is
X = (Marks = first, Grade = good, Sp = good, Assignment = yes, Gp in the class = no, Attendance =good, Lw = yes)
Solution: We need to maximize P (X | Ci) P (Ci), for i =1, 2, 3, 4. P (Ci), the prior probability of eachclass, can be computed on the basis of training tuples:
P (Class=first) =14/48 = 0.291P (Class=first) =14/48 = 0.291P (Class=first) =12/48 = 0.24P (Class=first) =8/48 = 0.166To compute P (X|Ci), for i = 1,2,3,4, we need to compute following conditional probabilities:P (Marks=first | Class=first) = 8/14 = 0.571P (Marks=first | Class=second) = 1/14 = 0.071P (Marks=first | Class=third) = 1/12 = 0.083P (Marks=first | Class=fail) = 0/8 = 0P (Grade=good | Class=first) = 8/14 = 0.571P (Grade=good | Class=second) = 6/14 = 0.428P (Grade=good | Class=third) = 1/12 = 0.083P (Grade=good | Class=fail) = 1/8 = 0.125P (Sp=good | Class=first) = 5/14 = 0.357P (Sp=good | Class=second) = 5/14 = 0.357P (Sp=good | Class=third) = 1/12 = 0.083P (Sp=good | Class=fail) = 1/8 = 0.125P (Assignment=yes | Class=first) = 10/14 = 0.714P (Assignment=yes | Class=second) = 11/14 = 0.785P (Assignment=yes | Class=third) = 4/12 = 0.333P (Assignment=yes | Class=fail) = 1/8 = 0.125P (Gp=no | Class=first) = 5/14 = 0.357P (Gp=no | Class=second) = 3/14 = 0.214P (Gp=no | Class=third) = 5/12 = 0.416

National Conference on Emerging Trends in Science, Technology and Management, 11-12 Nov 2017, ISBN: 978-93-5281-325-4 Page 29
P (Gp=no | Class=fail) = 4/8 = 0.5P (Attendance=good | Class=first) = 10/14 = 0.714P (Attendance=good | Class=second) = 8/14 = 0.571P (Attendance=good | Class=third) = 2/12 = 0.166P (Attendance=good | Class=fail) = 0/8 = 0P (Lw=yes | Class=first) = 9/14 = 0.642P (Lw=yes | Class=second) = 13/14 = 0.928P (Lw=yes | Class=third) = 9/12 = 0.75
P (Lw=yes | Class=fail) = 5/8 = 0.625Using these probabilities, we obtainP(X | Class=first) = P (Marks=first | Class=first) * P (Grade=good | Class=first) * P (Sp=good |Class=first) * P (Assignment=yes | Class=first) * P (Gp=no | Class=first) * P (Attendance=good |Class=first) * P (Lw=yes | Class=first)P(X | Class=first) = 0.571 * 0.571 * 0.357 * 0.714 * 0.357 * 0.714 * 0.714 = 0.01366P(X | Class=second) = P (Marks=first | Class=second) * P (Grade=good | Class=second) * P(Sp=good | Class=second) * P (Assignment=yes | Class=second) * P (Gp=no | Class=second) * P(Attendance=good | Class=second) * P (Lw=yes | Class=second)P(X | Class=second) = 0.071 * 0.428 * 0.357 * 0.758 * 0.214 * 0.571 * 0.928 =0.00097P(X | Class=third) = P (Marks=first | Class=third) * P (Grade=good | Class=third) * P (Sp=good |Class=third) * P (Assignment=yes | Class=third) * P (Gp=no | Class=third) * P (Attendance=good |Class=third) * P (Lw=yes | Class=third)P(X | Class=third) = 0.083 * 0.083 * 0.083 * 0.333 * 0.416 * 0.166 * 0.75 = 0.00001P(X | Class=fail) = P (Marks=first | Class=fail) * P (Grade=good | Class=fail) * P (Sp=good |
Class=fail) * P (Assignment=yes | Class=fail) * P (Gp=no | Class=fail) * P (Attendance=good |Class=fail) * P (Lw=yes | Class=fail)
P(X | Class=fail) = 0 * 0.125 * 0.125 * 0.125 * 0.5 * 0 * 0.625 = 0Therefore, the naïve Bayesian classifier predicts class=first for tuple X.
3.3. Rule-Based Classification
Using IF-THEN Rules for classificationA rule-based classifier uses a set of IF-THEN Rules for classification. An IF-THEN rule is anexpression of form: “IF condition THEN conclusion”. Here “IF” part is rule antecedent and the“THEN” part is rule consequent. Both are logically ANDed.When both rule antecedent and rule consequent of rule R are satisfied then we result fall in particularclass. A rule are can be assessed by its coverage and accuracy.
Coverage(R) = Ncovers/|D|Accuracy(R) = Ncorrect/Ncovers
Where,N covers=number of tuples covered by R.|D|=Total number of tuples in a Data set.Ncorrect=numbers of tuples correctly classified by R.Rule coverage is the percentage of tuples that are covered by rule. Accuracy % tells accuracy of rulethat is correctly classified.For the above problem we define a ruleR: (Marks=First) ^ (Attendance=Good) => (Type=First)For this rule we find a Coverage(R) and Accuracy(R)
Coverage(R) = Ncovers/|D|=5/48=10.41%
Accuracy(R) = Ncorrect/Ncovers=5/5=100%
It can correctly classify a given tuples.We use rule based classification to predict the type of given tupleX = (Marks = First, Grades = Good, Sp = Good Assignment=Yes, Gp = No, Attendance = Good, Lw =Good)Tuple X satisfy the Given Rule R because Marks=First an Attendance=Good so for given tuple X typeare FIRST.
4. RESULT
Table 3: Comparison Result table

National Conference on Emerging Trends in Science, Technology and Management, 11-12 Nov 2017, ISBN: 978-93-5281-325-4 Page 30
5. CONCLUSION
By using some intelligent techniques of data mining such as Bayesian, Classifier and Decision treewhich fall in same categories known as classification techniques, we manipulate our Training data(Student Records) and by this we conclude that in all the three cases, result fall in same class type, i.e.First class.So it shows Solutions are easy to manipulate and accurate individually in all three cases.
REFERENCES
[1.] G.Kesavaraj, Dr.S.Sukumaran “A Study on Classification Techniques in Data Mining” IEEE – 31661[2.] Fabricio Voznika Leonardo Viana “DATA MINING CLASSIFICATION” Springer, 2001[3.] S.Neelamegam, Dr.E.Ramaraj “Classification algorithm in Data mining: An Overview” International
Journal of P2P Network Trends and Technology (IJPTT) – Volume 4 Issue 8- Sep 2013.[4.] Ramjeet Singh Yadav, A.K. Soni and Saurabh Pal. “Implementation of Data Mining Techniques to
Classify New Students into Their Classes: A Bayesian Approach.” International Journal of ComputerApplications, 85, no. 11 (January 2014): 16-19.
[5.] Everitt, B.S., Landau, S. and Leese, M. (2001). Cluster Analysis. London: Heinemann EducationalBooks Ltd.
[6.] Wright, M. (2001). Experiments with a Plateau-Rich Solution Space. Proceedings of the 4th MetaHeuristics International Conference, 317-320.
[7.] Susanto, S., Suharto, I. and Sukapto, P. (2002). Using Fuzzy Clustering Algorithm for Allocation ofStudents.” Transaction on Engineering and Technology Education, 1(2), 245-248.
[8.] M. SujathS. Prabhakar, Dr. G. Lavanya Devi “A Survey of Classification Techniques in Data Mining”International Journal of Innovations in Engineering and Technology (IJIET)
[9.] Vrushali Bhuyar “Comparative Analysis of Classification Techniques on Soil Data to Predict FertilityRate” International Journal of Emerging Trends & Technology in Computer Science (IJETTCS Volume3, Issue 2, March – April 2014.
[10.] Cole, R.M. (1998). Clustering with Genetic Algorithms. Master Thesis University of Western Australia.[11.] Jain A.K., Murty M.N., and Flynn P.J., “Data Clustering: A Review”, ACM Computing Surveys, 31 (3).
pp. 264323, 1999.[12.] Zukhri, Z., and Omar, K. (2006). Implementation of Genetic Algorithms to Cluster New Students into
Their Classes. Seminar Nasional Aplikasi Teknologi Informasi 2006 (SNATI 2006), 101-103.
Classificationtechniques
Features Given tuple fall in type class (result)
Decision treeinduction
The root node give the highestinformation about the class type
Each internal node represent a teston an attribute
Each leaf node represent a class
First Class
BayesianClassification
It is a statical classifier Formula used:- P(X/Ci)=∑P(Xk/Ci) k=1 to n Bayesian classifiers are also useful
in that they provide a theoreticaljustification for other classifier.
First Class
Classifier Rule Coverage(R)=Ncover/|D| Accuracy(R)=Ncorrect/Ncover On the basics of Coverage and
accuracy Class type is defined
First Class
National Conference on Emerging Trends in Science, Technology and Management, 11-12 Nov 2017, ISBN: 978-93-5281-325-4 Page 31
A REVIEW ON DIFFERENT CONTROL STRATEGIESFOR MAGNETIC LEVITATION SYSTEM
Brajesh Kumar SinghDepartment of Electrical Engineering
Madan Mohan Malaviya University of TechnologyGorakhpur, India
[email protected] Kumar
Department of Electrical EngineeringMadan Mohan Malaviya University of Technology
Gorakhpur, [email protected]
Abstract— A magnetic levitation (maglev) system is inherently nonlinear and open loop unstable system. Itis modelled as a SISO, second order nonlinear differential equation. Its Stabilization is very difficult withoutthe application of a proper control strategy. A controller is also required for the position tracking problemfor a maglev system. The paper presents the comprehensive literature review of different control strategieswhich were applied to the magnetic levitation system. Various control strategies have been developed by theresearchers based on different control concepts. The aim of the investigator is to provide a concise andcomparative literature review for the future researchers who will be interested in developing controltechniques for the magnetic levitation system.
Keywords— magnetic levitation, maglev, unstable system, nonlinear system.
1. INTRODUCTION
The magnetic levitation technology is widely used in high speed maglev passenger trains in which thevehicle moves without any physical contact with the ground. The vehicle moves more smoothly andmore quietly than the conventional wheeled transportation. There is a magnetic guideway whichcontrols the propulsion and lift of the levitated train. The maglev system hold the high speed record forthe trains. A detailed report based on historical notes and development of the magnetic levitationsystem is described in [1]. A comparison between maglev and wheeled transport is given in [2].Another application areas for maglev system are magnetic bearing, electromagnetic aircraft launchsystem, maglev wind turbine (it is 20% more efficient than the traditional wind turbine), maglev microrobot, vibration isolation of the sensitive machinery, high precision positioning platform etc. A detailedliterature on application of the maglev system is reported in [3].The magnetic levitation system is of two types one is levitation by attraction (when opposite poles oftwo magnets are facing each other) and other is levitation by repulsion(when same poles are facingeach other). The maglev system is highly unstable system so a controller is required to ensure itsstability. For controller design a prototype model is used. This model contains an electromagnet, alevitated object (a ferromagnetic ball) and an IR sensor (for position sensing of the levitated object). Itis a nonlinear system so the controller design is a very challenging task for the researchers. There aremany control methods available in the literature which are discussed in the section II. The conclusionand future directions are given in section III.
2. LITERATURE REVIEW
The controller design for a magnetic levitation system is a challenging task for the researchers due tothe nonlinearities present in the system. The control strategies available in the literature are feedbacklinearization, nonlinear contol techniques, fuzzy logic contol, artificial intelligence (AI) based control,adaptive, robust, traditional PI or PID control, Selftuning algorithm, fractional order control (FOC),linear matrix inequality (LMI) based method, antiwindup scheme for FOC, sliding mode control(SMC), backstepping contol, suboptimal control, linear quadratic regulator(LQR), linear quadraticguassian (LQG) based control methods.M. Ahsan et al. in [5] have presented different nonlinear design techniques which were applied to amaglev system for the position control of the levitated ball in the presence of external disturbances andparameter uncertainties associated with the system. Some nonlinear state feedback and robust designmethods were applied to the magnetic levitation system. A high gain observer based robust outputfeedback was developed to enhance the performance of the controller.A nonlinear controller based on backstepping desing approach is reported in [6]. Zi-Jiang Yang et al. in[7] have reported an robust and adaptive controller based on backstepping design method for a gravitybiased magnetic levitation system. The combined controller help to overcome the problem which are
National Conference on Emerging Trends in Science, Technology and Management, 11-12 Nov 2017, ISBN: 978-93-5281-325-4 Page 32
individually associated with both the control scheme. The controller shows excellent position trackingperformance. Some other nonlinear control design techniques are reported in [8-10].Charles Fallaha et al. in [11] have implemented a sliding mode controller (SMC) for a magneticlevitation system. A problem associated with the magnetic levitation system is that the system modelchanges due to the inductance variation of the electromagnetic coil. The results were obtainedsatisfactory even with the presence of such problem and the controller was found very effective androbust. An experimental comparison between sliding mode controller and the conventional controllerfor stabilization of maglev system has been carried out in [12]. Even though the additional parameter ofactuator saturation was considered in the conventional controller, the performance of the sliding modecontroller was found to be superior. A discrete-time SMC with multi-rate output feedback has beenproposed in [13], which performs well in the presence of nonlinearty. Variable structure control of amaglev system which is equivalent to SMC is given in [14].Vinodh Kuamr E et al. in [15] have reported a PID controller based on linear quadratic regulator (LQR)theory for the magneic levitation system. A new criteria of selecting weighing matrix of LQR has beendiscussed based on damping ratio and natural frequency of the closed loop system. The controller wasfound to be capable of disturbance rejection presented in the system. The PID controller has beencombined with the feed-forward network to nullify the gravitational bias presented in the system. Adiscrete-time LQR/H∞ controller for magnetic levitation system has been presented in [16]. Thediscrete-time model of the maglev system has been proposed.The fractional order controller is designed and validated in [17-19]. The controller design is based onstability analysis of the fractional order system. For fractional order system two parameters are requiredto be obtained to ensure closed loop stability. The integer order PID controller shows poor performanceas compared to fractional order controller. A fractional order controller with anti-windup (FOCAW)have been implemented in [20]. The anti-windup phenomenon was applied to remove error windupduring actuator saturation. Actuator saturation is presented due to the integral term of the PIDcontroller. The fractional parameters are tuned using stability margins (GM and PM) and sensitivitymargins. The benefits of FOCAW is that it reduces the oscillations upto 60% in transient response andthe control effort by 53%.Avadh Pati et al. in [21] has illustrated a suboptimal controller for stabilization of the maglev system.Oprimal control needs a costly reconstructive filter (or Kalman filter) to obtain the missing states.There are three state variables presented in the maglev system: position of the ball, velocity of the ball(which is missing) and the current in the electromagnetic coil. Suboptimal controller is obtained by themodel order reduction techniques. Its cost effectivness and easy hardware implementation make it agood choice as compared to optimal controller.Hai Huang et al. in [22] have proposed a PID controller, having two degree of freedom, for animproved maglev system. It consists of two electromagnets for pulling and pushing the ball, so thebalance range of the maglev system is increased as well as the system becomes more stable ascompared to one electromagnet maglev system. The superior robustness of the compensated system isalso obtained by the proper setting of the feedforward parameters.Arun Ghosh et al. in [23] have implemented a PID controller (two degree of freedom) for the magneticlevitation system. The transient performance of the compensated system can be enhanced due to thepresence of a feedforward gain in the proposed controller, but it is not possible with conventional onedegree of freedom PID controller. A comparative study between 2-DOF and 1-DOF control shows thatthe robustness is same theoretically for both the controller but experimentally the 2-DOF controllerpossess a superior robust behaviour if the feedforward parameter is properly selected.I.K. Ibraheem et al. in [24] have presented 2-DOF linear quadratic Gaussian (LQG) control scheme.The controller shows a perfect tracking of the reference input and is also able to reject the disturbancespresent at the output of the system. So the controller gives robust behaviour to the parameter variation.Artificial Intelligence (AI) based techniques are also used to design the control scheme for the maglevsystem. A PD fuzzy controller is designed in [25] for the magnetic levitation system to balance thelevitated ball. A neural network (NN) and feedback error learning (FEL) based controller is designed in[26]. NN and FEL were used as hybrid control to ensure the stability of the maglev system. Asimulated annealing (SA) based optimization based fuzzy controller for the maglev system is presentedin [27]. Use of NN in Model Reference Adaptive Control (MRAC) is proposed in [28]. Since theconventional MRAC is used for the control of linear plant then it cannot ensure the stability of thenonlinear maglev system. NN in MRAC is used to overcome this problem. Other literatures on controlconcepts based on AI is also available in [29].Walter Barie et al. in [30] have designed a feedback linearization based nonlinear controller. It iscompared with the linear state-space model which is designed for approximate linear model of the
National Conference on Emerging Trends in Science, Technology and Management, 11-12 Nov 2017, ISBN: 978-93-5281-325-4 Page 33
maglev system. This non-linear controller gives a better tracking performance than linear controltheory.Chin-Min Lin et al. in [31] have presented a self-tuning algorithm for tuning of the PID controller. Thecontroller consists of an adaptive proportional integral derivative (APID) controller and a fuzzycompensator. The APID controller is the main tracking controller and its parameters are tuned onlineby derived adaptation laws. This controller design is based on PSO (particle swarm optimization)technique. To increase learning speed the controller is adopted for obtaining optimal learning rate ofthe APID.Lukáš Rušar et al. in [32] have implemented predictive control for the magnetic levitation system. Inthis method of control, the state-space CARIMA mathematical model of the magnetic levitation systemis used for the prediction of output values and the calculation of the control signal is done by applying apredictor-corrector method.Rong-Jong Wai et al. in [33] have sucessfully investigated a real-time PID controller based on PSOtechnique for the maglev transportation system. The designed PSO-PID controller shows a goodcontrol performance, improved postion tracking performance and stabilization of the maglev system.K. Shafiq et al. in [34] have proposed a linear matrix inequality (LMI) based controller for referencetracking of a multi variable maglev system, which is able to overcome the problem of parameteruncertainities, sensor noise and disturbances due to external perturbations. The robustness of thecontroller for the disturbance rejection has been sucessfully achieved.Various other concepts are also available in the literature [35-40] for the postion control and thestabilization of the magnetic levitation system.
3. CONCLUSION AND FUTURE DIRECTIONS
Various control schemes regarding the stability and the reference-input tracking of the magneticlevitation system has been successfully investigated and reported in this paper. Every control schemeshas some pros and cons. For example, the optimal control design needs all the states of the system. Inmaglev model the velocity of the ball is not available for direct measurement. The proper estimation ofthe missing state (velocity of the ball) requires the use of a costly reconstructive filter. To overcomethis problem the suboptimal controller has been designed by using model order reduction techniques. Itis not appropriate to discuss the pros and cons of individual schemes in this paper. The controlconcepts, which were applied to the linear approximation model of the magnetic levitation system,have low balance range for the levitated ball. The balance range by using the nonlinear control designmay be comparatively good. But nonlinear control technique has its own complexity. The robustness ofthe maglev system against the external disturbances has been increased by proper selection of thefeedforward parameter with the applied control scheme. An adaptive controller may be a good choicefor the model with parameter uncertainty. The AI based techniques are very efficient but its real timeimplementation associated with the complexity such as data collection in neural networks and selectingthe proper membership function in fuzzy control scheme.In future, it is possible to implement such controllers whose control actions will be independent of themathematical modeling of the maglev system, because there are parameter uncertainties that areassociated with the modeling of the system. The actuator saturation, which is associated with theintegral term of the PID controller, is a challenging problem in the maglev system but there are notmuch work has been done to compensate this problem. So a better efficient way is possible in future forthe research. The extent of the model order reduction for designing suboptimal controller forstabilization and control of the maglev system is area of future research.
REFERENCES[1.] Thornton, R. "Magnetic levitation and propulsion, 1975." IEEE Transactions on Magnetics 11.4 (1975):
981-995.
[2.] Lee, Hyung-Woo, Ki-Chan Kim, and Ju Lee. "Review of maglev train technologies." IEEE transactionson magnetics 42.7 (2006): 1917-1925.
[3.] Yaghoubi, Hamid. "The most important maglev applications." Journal of Engineering 2013 (2013).
[4.] Barie, Walter, and John Chiasson. "Linear and nonlinear state-space controllers for magnetic levitation."International Journal of systems science 27.11 (1996): 1153-1163.
[5.] Ahsan, Muhammad, Nouman Masood, and Fawad Wali. "Control of a magnetic levitation system usingnon-linear robust design tools." Computer, Control & Communication (IC4), 2013 3rd InternationalConference on. IEEE, 2013.
[6.] Teodorescu, C-S., Noboru Sakamoto, and Sorin Olaru. "Controller design for sine wave tracking onmagnetic levitation system: A comparative simulation study." Control Applications (CCA), 2010 IEEEInternational Conference on. IEEE, 2010.

National Conference on Emerging Trends in Science, Technology and Management, 11-12 Nov 2017, ISBN: 978-93-5281-325-4 Page 34
[7.] Yang, Zi-Jiang, and Michitaka Tateishi. "Adaptive robust nonlinear control of a magnetic levitationsystem." Automatica 37.7 (2001): 1125-1131.
[8.] Morales, Rafael, Vicente Feliu, and Hebertt Sira-Ramirez. "Nonlinear control for magnetic levitationsystems based on fast online algebraic identification of the input gain." IEEE Transactions on ControlSystems Technology 19.4 (2011): 757-771.
[9.] Charara, Ali, Jerome De Miras, and Bernard Caron. "Nonlinear control of a magnetic levitation systemwithout premagnetization." IEEE Transactions on Control Systems Technology 4.5 (1996): 513-523.
[10.] Green, Scott A., and Kevin C. Craig. "Robust, digital, nonlinear control of magnetic-levitation systems."TRANSACTIONS-AMERICAN SOCIETY OF MECHANICAL ENGINEERS JOURNAL OFDYNAMIC SYSTEMS MEASUREMENT AND CONTROL 120 (1998): 488-495.
[11.] Fallaha, Charles, Hadi Kanaan, and Maarouf Saad. "Real time implementation of a sliding moderegulator for current-controlled magnetic levitation system." Intelligent Control, 2005. Proceedings ofthe 2005 IEEE International Symposium on, Mediterrean Conference on Control and Automation. IEEE,2005.
[12.] Cho, Dan, Yoshifumi Kato, and Darin Spilman. "Sliding mode and classical controllers in magneticlevitation systems." IEEE control systems 13.1 (1993): 42-48.
[13.] Oza, Harshal B., Vishvjit Thakar, and B. Bandyopadhyay. "Discrete time sliding mode control withapplication to magnetic levitation system." Variable Structure Systems (VSS), 2010 11th InternationalWorkshop on. IEEE, 2010.
[14.] Hassan, D. M. M., and Abdelfatah M. Mohamed. "Variable structure control of a magnetic levitationsystem." American Control Conference, 2001. Proceedings of the 2001. Vol. 5. IEEE, 2001.
[15.] Kumar, E. Vinodh, and Jovitha Jerome. "LQR based optimal tuning of PID controller for trajectorytracking of magnetic levitation system." Procedia Engineering 64 (2013): 254-264.
[16.] Li, Jen-Hsing. "Discrete-time LQR/H∞ control of magnetic levitation systems." Control & Automation(ICCA), 11th IEEE International Conference on. IEEE, 2014.
[17.] Muresan, Cristina I., et al. "Fractional order control of unstable processes: the magnetic levitation studycase." Nonlinear Dynamics 80.4 (2015): 1761-1772.
[18.] Folea, Silviu, et al. "Theoretical analysis and experimental validation of a simplified fractional ordercontroller for a magnetic levitation system." IEEE Transactions on Control Systems Technology 24.2(2016): 756-763.
[19.] Midhun, E. K., and Sunil Kumar TK. "LabVIEW based real time implementation of Fractional OrderPID controller for a magnetic levitation system." Power Electronics, Intelligent Control and EnergySystems (ICPEICES), IEEE International Conference on. IEEE, 2016.
[20.] Pandey, Sandeep, Prakash Dwivedi, and Anjali Junghare. "Anti-windup Fractional Order PIλ - PDµController Design for Unstable Process: A Magnetic Levitation Study Case Under Actuator Saturation."Arabian Journal for Science and Engineering: 1-15.
[21.] Pati, Avadh, and Richa Negi. "Suboptimal control of magnetic levitation (Maglev) system." Reliability,Infocom Technologies and Optimization (ICRITO)(Trends and Future Directions), 2014 3rdInternational Conference on. IEEE, 2014.
[22.] Huang, Hai, Haiping Du, and Weihua Li. "Stability enhancement of magnetic levitation ball system withtwo controlled electomagnets." Power Engineering Conference (AUPEC), 2015 AustralasianUniversities. IEEE, 2015.
[23.] Ghosh, Arun, et al. "Design and implementation of a 2-DOF PID compensation for magnetic levitationsystems." ISA transactions 53.4 (2014): 1216-1222.
[24.] Ibraheem, Ibraheem Kasim. "Design of a two-Degree-of-Freedom Controller for a Magnetic LevitationSystem Based on LQG Technique." Al-Nahrain Journal for Engineering Sciences 16.1 (2017): 67-77.
[25.] Sharkawy, Abdel Badie, and Ahmed A. Abo-Ismail. "INTELLIGENT CONTROL OF MAGNETICLEVITATION SYSTEM."
[26.] Aliasghary, M., et al. "Magnetic levitation control based-on neural network and feedback error learningapproach." Power and Energy Conference, 2008. PECon 2008. IEEE 2nd International. IEEE, 2008.
[27.] Dragos, Claudia-Adina, et al. "Simulated annealing-based optimization of fuzzy models for magneticlevitation systems." IFSA World Congress and NAFIPS Annual Meeting (IFSA/NAFIPS), 2013 Joint.IEEE, 2013.
[28.] Trisanto, Agus, et al. "The use of NNs in MRAC to control nonlinear magnetic levitation system."Circuits and Systems, 2005. ISCAS 2005. IEEE International Symposium on. IEEE, 2005.
[29.] Lairi, Mostafa, and Gerard Bloch. "A neural network with minimal structure for maglev systemmodeling and control." Intelligent Control/Intelligent Systems and Semiotics, 1999. Proceedings of the1999 IEEE International Symposium on. IEEE, 1999.
[30.] Barie, Walter, and John Chiasson. "Linear and nonlinear state-space controllers for magnetic levitation."International Journal of systems science 27.11 (1996): 1153-1163.

National Conference on Emerging Trends in Science, Technology and Management, 11-12 Nov 2017, ISBN: 978-93-5281-325-4 Page 35
[31.] Lin, Chih-Min, Ming-Hung Lin, and Chun-Wen Chen. "SoPC-based adaptive PID control system designfor magnetic levitation system." IEEE Systems journal 5.2 (2011): 278-287.
[32.] Rušar, Lukáš, Adam Krhovják, and Vladimír Bobál. "Predictive control of the magnetic levitationmodel." Process Control (PC), 2017 21st International Conference on. IEEE, 2017.
[33.] Wai, Rong-Jong, Jeng-Dao Lee, and Kun-Lun Chuang. "Real-time PID control strategy for maglevtransportation system via particle swarm optimization." IEEE Transactions on Industrial Electronics 58.2(2011): 629-646.
[34.] Shafiq, K., et al. "LMI based multi-objective state-feedback controller design for magnetic levitationsystem." Applied Sciences and Technology (IBCAST), 2009 6th International Bhurban Conference on.IEEE, 2009.
[35.] ElSinawi, A. H., and Shadi Emam. "Dual LQG-PID control of a highly nonlinear Magnetic Levitationsystem." Modeling, Simulation and Applied Optimization (ICMSAO), 2011 4th InternationalConference on. IEEE, 2011.
[36.] Zaheer, Asim, Neelma Naz, and Muhammad Salman. "Sampled-data output feedback tracking ofmagnetic levitation system." Industrial Electronics and Applications (ICIEA), 2013 8th IEEE Conferenceon. IEEE, 2013.
[37.] El Hajjaji, Ahmed, and M. Ouladsine. "Modeling and nonlinear control of magnetic levitation systems."IEEE Transactions on industrial Electronics 48.4 (2001): 831-838.
[38.] Munaro, C. J. "A design methodology of tracking controllers for magnetic levitation systems." ControlApplications, 2001.(CCA'01). Proceedings of the 2001 IEEE International Conference on. IEEE, 2001.
[39.] Kim, Young Chol, and Kook Hun Kim. "Gain scheduled control of magnetic suspension system."American Control Conference, 1994. Vol. 3. IEEE, 1994.
[40.] Shafiq, Muhammad, and Sohail Akhtar. "Inverse model based adaptive control of magnetic levitationsystem." Control Conference, 2004. 5th Asian. Vol. 3. IEEE, 2004.

National Conference on Emerging Trends in Science, Technology and Management, 11-12 Nov 2017, ISBN: 978-93-5281-325-4 Page 36
A STUDY AND REVIEW OF OPEN LOOP AND CLOSEDLOOP MODEL OF SPEED CONTROL OF BLDC
MOTORPriyanshi Kushwaha, Supriya Maurya, Sandeep Kumar Singh
Department of Electrical EngineeringAshoka Institute of Technology & Management, Varanasi
[email protected], [email protected], [email protected]
Abstract: In this paper a study and review of a DC Brushless motor which uses a permanent magnetexternal rotor, three phases of driving coils, one or more Hall Effect devices to sense the position of therotor, and the associated drive electronics. Brushless DC Motors are specifically used for variety ofindustrial applications like traction drive and electric vehicle application and heating ventilation systembecause of its higher efficiency, high torque and low volume. The performance of BLDC motor is analyzedusing Matlab with motor on no load. The torque characteristics of BLDC motor is very important factor indesigning BLDC motor drive system. After development of simple mathematical model of three phaseBLDC motor with trapezoidal waveforms of back emf, the motor is modelled by using MATLAB. Thespeed, phase current, back emf waveforms are also obtained using this model. In the presented model speedis regulated by PI controller. This paper presents a comparative study on control of six-switch Inverter fedBLDC motor drive with variable speed presented using MATLAB.
Keywords- Hall position sensors, Permanent Magnet Brushless DC motor, PI controller, closed loop speedControl
1. INTRODUCTION
BLDC motor has simple structure and lower cost than other AC motors therefore it is used in variable-speed control of AC motor drives. They have better speed versus torque characteristics, higherefficiency and better dynamic response as compared to brushed motors and also it delivers highertorque to the motor which makes it useful where space and weight are critical factor.The phase shift in emf waveform results from variation in shapes of the slots, skew and magnet ofBLDC Motor and all the above said factors are subjected for the design consideration. This presents aBLDCM Model with the trapezoidal and sinusoidal back-EMF waveform.BLDC Motor have many advantages over conventional DC motors like: Long operating life, Highdynamic response, High efficiency, Better speed vs. Torque characteristic, Noiseless operation, Higherspeed range and Higher Torque-Weight ratio. Due to high power to weight ratio, high torque, gooddynamic control for variable speed applications, absence of brushes and commutator make BrushlessDC (BLDC) motor best choice for high performance applications. Due to the absence of brushes andcommutator there is no Problem of mechanical wear of the moving parts. As well, better heatdissipation property and ability to operate at high speeds make them superior to the conventional dcmachine. However, the BLDC motor constitutes a more difficult problem than its brushed counterpartin terms of modelling and control system design due to its multi-input nature and coupled nonlineardynamics. Due to the simplicity in their control, Permanent-magnet brushless dc motors are moreaccepted and used in high-performance applications. In many of these applications, the production ofripple-free torque is of primary concern. There are three main sources of torque production in BLDCmotor.This paper explains introduction and principle of operation of the BLDC motor is explained.Mathematical modelling of three phase BLDC motor is presented and motor performance analysis ofBLDC motor such as speed/torque, input power, input current, efficiency etc. This paper also includesthe characteristics which have been drawn between load torques, current, back emf, speed etc. usingMATLAB package. Finally conclusion, future scope and references are added at the end.
2. PRINCIPLE OF OPERATION
A BLDC motor is a permanent magnet synchronous that uses position detectors and an inverter tocontrol the armature currents. The BLDC motor is sometimes referred to as an inside out dc motorbecause its armature is in the stator and the magnets are on the rotor and its operating characteristicsresemble those of a dc motor. Instead of using a mechanical commutator as in the conventional dcmotor, the BLDC motor employs electronic commutation which makes it a virtually maintenance freemotor. The BLDC motor cross section and phase energizing sequence is shown in figure 1.

National Conference on Emerging Trends in Science, Technology and Management, 11-12 Nov 2017, ISBN: 978-93-5281-325-4 Page 37
Fig.1: BLDC crosses section and phase energizing sequence
There are two main types of BLDC motors: trapezoidal type and sinusoidal type. In the trapezoidalmotor the back-emf induced in the stator windings has a trapezoidal shape and its phases must besupplied with quasi-square wave currents for ripple free operation. The sinusoidal motor on the otherhand has a sinusoidally shaped back – emf and requires sinusoidal phase currents for ripple free torqueoperation. The shape of the back – emf is determined by the shape of rotor magnets and the statorwinding distribution. The sinusoidal motor needs high resolution position sensors because the rotorposition must be known at every time instant for optimal operation.
Fig. 2: Back emf, phase current and rotor position
Table.1 switching sequence
Current commutation is done by six-step inverter as shown in figure3. The switches are shown asbipolar junction transistors but MOSFET switches are most common. Table1 shows the switchingsequence, the current direction and the position sensor signals.
3. CONTROL TECHNIQUE OF BLDC MOTOR
In resent BLDC motor is widely used in home appliances and commercial application. So speed controlof BLDC motor is very essential. Speed control in a BLDC motor involves changing the appliedvoltage the motor phases. This can be done using a sensored method based on the concept of pulsewidth modulation.
3.1. Open Loop Control Technique
An interesting property of brushless DC motors is that they will operate synchronously to a certainextent. This means that for a given load, applied voltage, and commutation rate the motor will maintainopen loop lock with the commutation rate provided that these three variables do not deviate from theideal by a significant amount. The ideal is determined by the motor voltage and torque constants. When
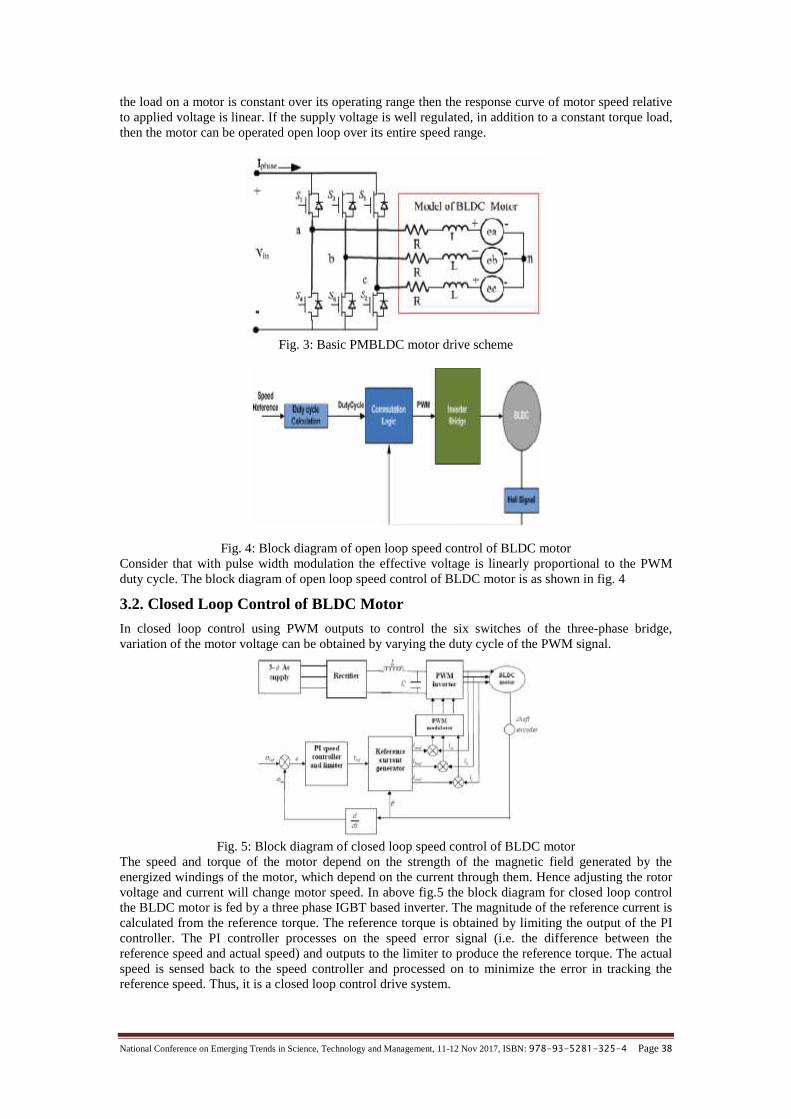
National Conference on Emerging Trends in Science, Technology and Management, 11-12 Nov 2017, ISBN: 978-93-5281-325-4 Page 38
the load on a motor is constant over its operating range then the response curve of motor speed relativeto applied voltage is linear. If the supply voltage is well regulated, in addition to a constant torque load,then the motor can be operated open loop over its entire speed range.
Fig. 3: Basic PMBLDC motor drive scheme
Fig. 4: Block diagram of open loop speed control of BLDC motorConsider that with pulse width modulation the effective voltage is linearly proportional to the PWMduty cycle. The block diagram of open loop speed control of BLDC motor is as shown in fig. 4
3.2. Closed Loop Control of BLDC Motor
In closed loop control using PWM outputs to control the six switches of the three-phase bridge,variation of the motor voltage can be obtained by varying the duty cycle of the PWM signal.
Fig. 5: Block diagram of closed loop speed control of BLDC motorThe speed and torque of the motor depend on the strength of the magnetic field generated by theenergized windings of the motor, which depend on the current through them. Hence adjusting the rotorvoltage and current will change motor speed. In above fig.5 the block diagram for closed loop controlthe BLDC motor is fed by a three phase IGBT based inverter. The magnitude of the reference current iscalculated from the reference torque. The reference torque is obtained by limiting the output of the PIcontroller. The PI controller processes on the speed error signal (i.e. the difference between thereference speed and actual speed) and outputs to the limiter to produce the reference torque. The actualspeed is sensed back to the speed controller and processed on to minimize the error in tracking thereference speed. Thus, it is a closed loop control drive system.
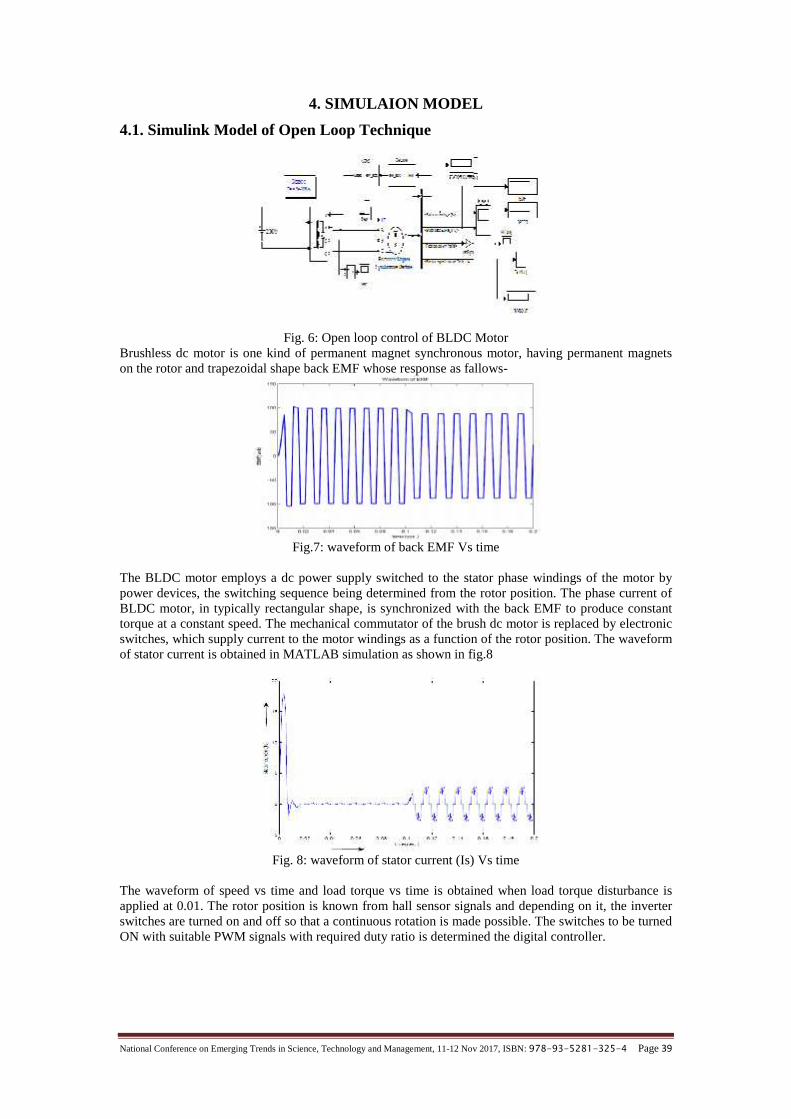
National Conference on Emerging Trends in Science, Technology and Management, 11-12 Nov 2017, ISBN: 978-93-5281-325-4 Page 39
4. SIMULAION MODEL
4.1. Simulink Model of Open Loop Technique
Fig. 6: Open loop control of BLDC MotorBrushless dc motor is one kind of permanent magnet synchronous motor, having permanent magnetson the rotor and trapezoidal shape back EMF whose response as fallows-
Fig.7: waveform of back EMF Vs time
The BLDC motor employs a dc power supply switched to the stator phase windings of the motor bypower devices, the switching sequence being determined from the rotor position. The phase current ofBLDC motor, in typically rectangular shape, is synchronized with the back EMF to produce constanttorque at a constant speed. The mechanical commutator of the brush dc motor is replaced by electronicswitches, which supply current to the motor windings as a function of the rotor position. The waveformof stator current is obtained in MATLAB simulation as shown in fig.8
Fig. 8: waveform of stator current (Is) Vs time
The waveform of speed vs time and load torque vs time is obtained when load torque disturbance isapplied at 0.01. The rotor position is known from hall sensor signals and depending on it, the inverterswitches are turned on and off so that a continuous rotation is made possible. The switches to be turnedON with suitable PWM signals with required duty ratio is determined the digital controller.
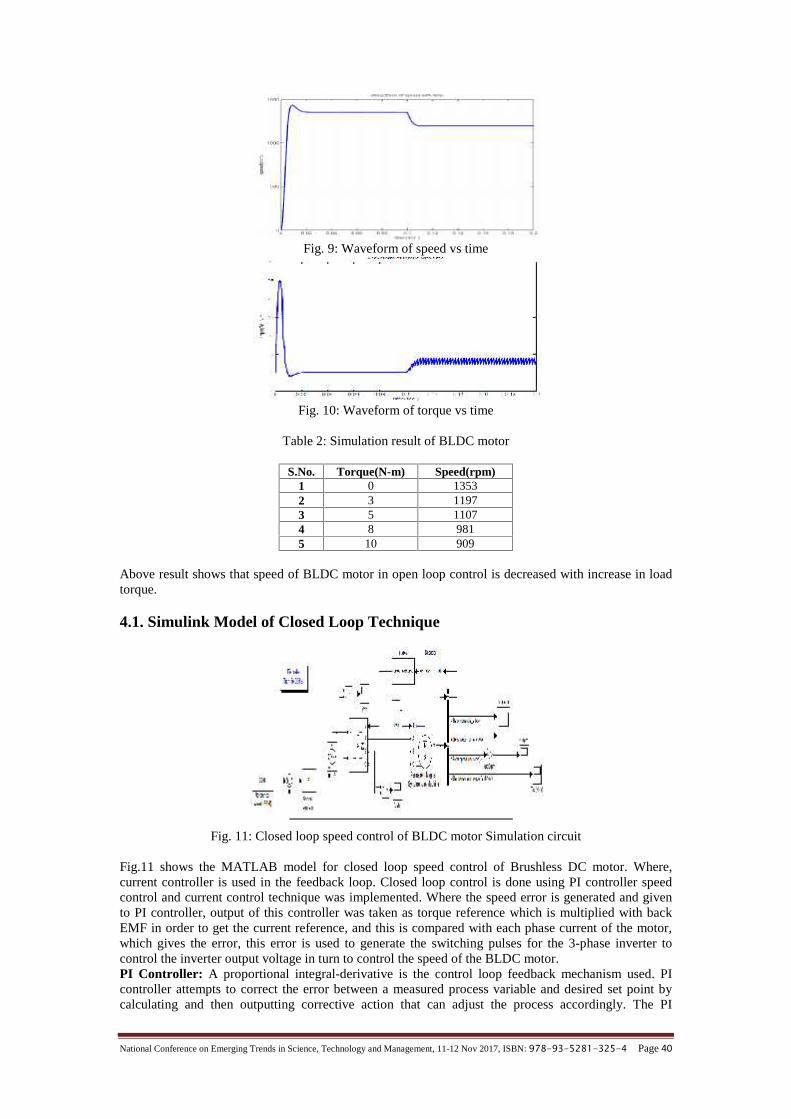
National Conference on Emerging Trends in Science, Technology and Management, 11-12 Nov 2017, ISBN: 978-93-5281-325-4 Page 40
Fig. 9: Waveform of speed vs time
Fig. 10: Waveform of torque vs time
Table 2: Simulation result of BLDC motor
S.No. Torque(N-m) Speed(rpm)1 0 13532 3 11973 5 11074 8 9815 10 909
Above result shows that speed of BLDC motor in open loop control is decreased with increase in loadtorque.
4.1. Simulink Model of Closed Loop Technique
Fig. 11: Closed loop speed control of BLDC motor Simulation circuit
Fig.11 shows the MATLAB model for closed loop speed control of Brushless DC motor. Where,current controller is used in the feedback loop. Closed loop control is done using PI controller speedcontrol and current control technique was implemented. Where the speed error is generated and givento PI controller, output of this controller was taken as torque reference which is multiplied with backEMF in order to get the current reference, and this is compared with each phase current of the motor,which gives the error, this error is used to generate the switching pulses for the 3-phase inverter tocontrol the inverter output voltage in turn to control the speed of the BLDC motor.PI Controller: A proportional integral-derivative is the control loop feedback mechanism used. PIcontroller attempts to correct the error between a measured process variable and desired set point bycalculating and then outputting corrective action that can adjust the process accordingly. The PI
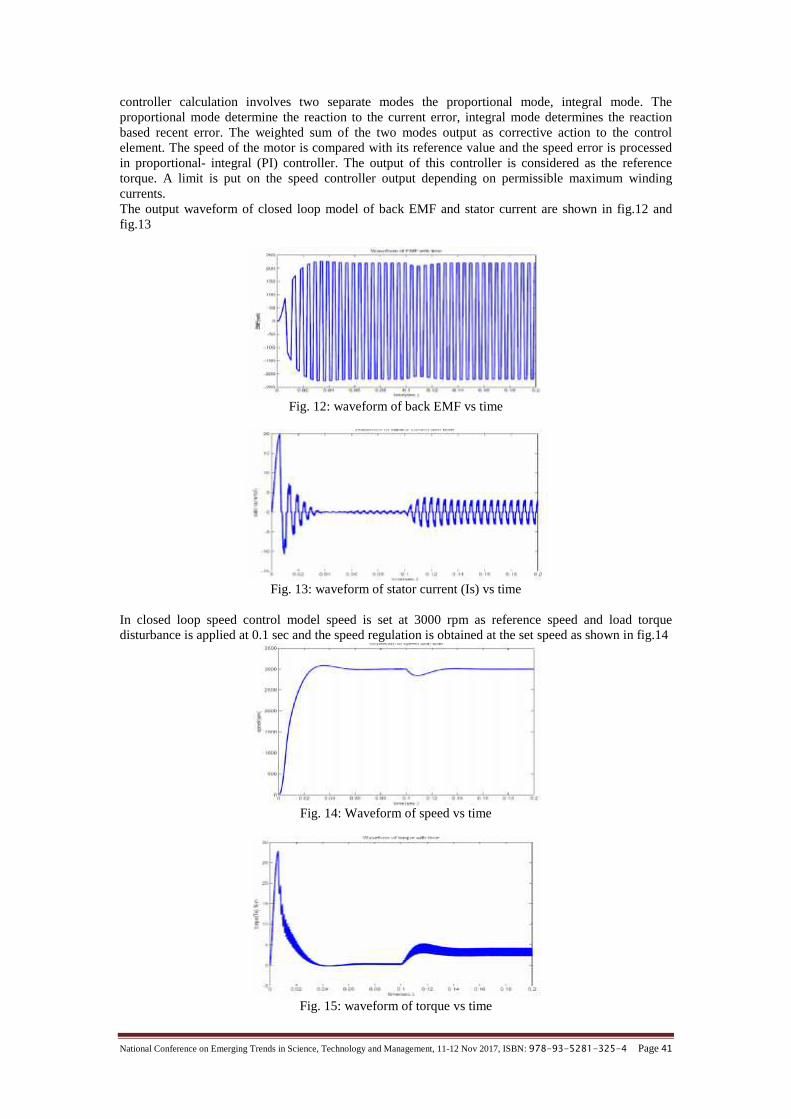
National Conference on Emerging Trends in Science, Technology and Management, 11-12 Nov 2017, ISBN: 978-93-5281-325-4 Page 41
controller calculation involves two separate modes the proportional mode, integral mode. Theproportional mode determine the reaction to the current error, integral mode determines the reactionbased recent error. The weighted sum of the two modes output as corrective action to the controlelement. The speed of the motor is compared with its reference value and the speed error is processedin proportional- integral (PI) controller. The output of this controller is considered as the referencetorque. A limit is put on the speed controller output depending on permissible maximum windingcurrents.The output waveform of closed loop model of back EMF and stator current are shown in fig.12 andfig.13
Fig. 12: waveform of back EMF vs time
Fig. 13: waveform of stator current (Is) vs time
In closed loop speed control model speed is set at 3000 rpm as reference speed and load torquedisturbance is applied at 0.1 sec and the speed regulation is obtained at the set speed as shown in fig.14
Fig. 14: Waveform of speed vs time
Fig. 15: waveform of torque vs time

National Conference on Emerging Trends in Science, Technology and Management, 11-12 Nov 2017, ISBN: 978-93-5281-325-4 Page 42
Table 3: Simulation result of BLDC motor
S.No. Torque(N-m) Speed(rpm)
1 0 3000
2 1 3000
3 2 3000
4 3 3000
5 4 3000
5. CONCLUSION & FUTURE SCOPE
The simulation of the Open loop and closed loop speed control of BLDC motor is done by usingMATLAB. The speed control is achieved through PI controller and has a simple operation, which iscost effective, as it requires only one current sensor for the measurement of DC link current. Theproblems of speed and torque regulation observed during the simulation of Open loop speed control hasbeen rectified by Closed loop speed control of BLDC motor i.e. the speed remains constant at a desiredspeed in closed loop control method.For the future development, Hardware development can be implemented. As well as differenttriggering techniques like spwm and nspwm can be implemented for the three phase bridge inverter.Sinusoidal Pulse width modulation (SPWM) generated by comparing amplitude of triangular wave(carrier) and sinusoidal reference wave (modulating) signal. By using spwm technique it can controlthe inverter output voltage as well as reduce harmonics. Nspwm is the advanced technique after spwmtechnique.
REFERENCES[1] M.V.Ramesh, S.Karmakshaiah and J.Amarnath, “Speed Torque characteristics of the BLDC motor in
either direction on load using ARM controller” ISSN vol.2, pp.37-48, 2011.[2] G.R.Arab Markdesh, S.I. Mousavi and A. Kargar, “Position Sensorless Direct Torque Control of BLDC
Motor” IEEE vol.3, 2008.[3] Ming-Fa Tsai, Tran Phu Quy and Chun-Shi Tseng, “Model Construction and Verification of a BLDC
Motor Using matlab simulink and FPGA Control” IEEE vol.1, pp.1797-18002, 2011.[4] G.R.P Lakshmi and S. Paramasivam, “Dcpic based power assisted steering usin brushless direct current
motor” American Journal of Applied Science, pp.1419-1426, 2013.[5] H.R. Hiziroglu, “On the Brushless DC Motors” ELECO, pp.35-39, 2009.[6] Alphonsa Roslin Paul, “Brushless DC Motor Control Using Digital PWM Techniques” ICSCCN vol.79,
pp. 733-738(2011).[7] M.R. Feyzi and M. Ebadpour, “A New Single Current Strategy for High-Performance Brushlees DC
Motor Drives” IEEE power electronic tranjection vol.1, pp.000419, 2011.[8] Padmraja Yedamale, “BLDC motor fundamentals” Microchip technology.[9] Vijay Bolloju, “PWM Control Methods Increases Efficiency, Reliability and Extend Battery Lifetime”
Bodo;s power systems, August-2007.[10] R. Civilian and D. Stupak. 1995. Disk drive employing multi-mode spindle drive system. US patent
5471353, Oct 3.[11] G.H. Jang and M.G. Kim. 2005. A Bipolar-Starting Spindle Motor at High Speed with Large Starting
Torque. IEEE Transactions on Magnetics. 41(2): 750- 755, Feb.
National Conference on Emerging Trends in Science, Technology and Management, 11-12 Nov 2017, ISBN: 978-93-5281-325-4 Page 43
ARTIFICIAL NEURAL NETWORK BASED DEEPLEARNING
Preeti Shahi, Shekhar YadavDepartment of Electrical Engineering
Madan Mohan Malaviya University of Technology, Gorakhpur, [email protected], [email protected]
Abstract - The artificial neural networks (ANNs) are huge parallel systems with large numbers ofinterconnected processing elements. This paper describes the biological neuron, the artificial computationalmodel and also the motivations behind the development of ANNs. It includes network architectures withcharacter recognition, learning processes and some of the most commonly used ANN models. It alsoincludes some successful applications of ANNs. To classify the more complex and real world data which isnot separable, more number of neural networks is needed and these are usually added in the hidden layers.Hence, this paper should serve as a comprehensive literature review for the researchers in future.
Keywords — Artificial Neural Networks (ANNs), Biological neuron, Character recognition, Deep Learning.
1. INTRODUCTION
The main aim of ANNs is to invent a machine which can sense, remember, learn and recognize like ahuman being [1]. ANN is an information processing model which is inspired by the way of processinginformation of systems, such as brain. It is composed of large numbers of highly interconnectedprocessing elements known as neurons which work in unison to solve specific problems. ANNs are theextremely simplified model of brain and act as function approximator which transforms inputs intooutputs to the best of its ability. It is the type of artificial intelligence that attempts to follow the way ahuman brain works. Most of the ANN structures used for many applications consider the behavior ofsingle neuron as the basic computing unit describing the neural information processing operations.Each computing unit (the artificial neuron in the neural network) is based on the concept of an idealneuron [2]. “Deep learning” is the application of Artificial Neural Networks (ANNs) that are composedof many layers. Deep learning is a creation of machines which inspire the human brain and ability tolearn. Our world is gradually evolving to become more technology reliant and one technology expectedto revolutionize the future is deep learning. In today’s world, from trivial jobs to sophisticated services,everything is using deep learning.
2. HISTORY OF ANNs
Study of human brain is thousands of years old. The first step regarding artificial neural networks camein 1943 when Warren McCulloch, a neurophysiologist and a young mathematician, Walter Pitts wrote apaper on how neurons might work. [3] They modeled simple neural network with the electrical circuits.Emphasizing this concept of neurons and how they work was a book written by Donald Hebb. [4] The“Organization of Behavior” was written in1949. It pointed out that neural pathways are strengthenedeach time that they are used. In 1951, Marvin Minsky [5] created the first ANN while working atPrinceton. In 1958, “The Computer and the Brain” was published, a year after John Von Neumann’sdeath. In that book, Von Neumann proposed many radical changes to the way in which researchers hadbeen modeling the brain. Mark I Perceptron was also created in 1958 at Cornell University by FrankRosenblatt. In 1960, Rosenblatt [6] published the book “Principles of Neurodynamics”, containingmuch of his research and ideas about modeling the brain. Despite the failure of the Mark I Perceptronto handle non-linearity separable data, it was not an inherent failure of the technology, but a matter ofscale. It was a two layer perceptron. In 1990, Hecht- Nielsen showed a three layer machine, capable ofsolving non-linear separation problems.Originally, the back-propagation algorithm was discovered by Werbos in 1974 and was rediscovered in1986 with the book “Learning Internal Representation by Error Propagation” by Rumelhant, Hintonand Williams [7]. The Back-propagation is a form of gradient descent algorithm used with artificialneural networks for minimization and curve- fitting. In 1987, the IEEE Annual International ANNConference was started for ANN researchers. In 1987, the International Neural Network Society(INNS) was formed, along with the INNS Neural Networking journal in 1988. Now, neural networksare used several applications. The fundamental idea behind the nature of neural networks is that, if itworks in nature, it must be able to work in the computers. The future of neural networking lies in thedevelopment of hardware. [8]

National Conference on Emerging Trends in Science, Technology and Management, 11-12 Nov 2017, ISBN: 978-93-5281-325-4 Page 44
3. ARCHITECTURES OF ANNs
Single-layered feed-forward network: Neurons are organized in the form of layers in a layered NN.A simple layered network has an input layer of source nodes that projects onto an output layer ofcomputation neurons.Multi-layered feed-forward network: In this, neural networks consist of multiple layers ofcomputational units, interconnected in a feed-forward manner. Each neuron in one layer is directlyconnected to the networks use various learning techniques, mainly back-propagation [9].
4. LEARNING PROCESSES
All learning rules used for adaptive NNs can be classified into two major categories-1. Supervised: It is that learning which incorporates an external teacher, so that each output unit
is told what its desired response to input signals ought to be. Global information’s are requiredduring the learning process. Error correction learning, reinforcement learning and stochasticlearning are included in the models of supervised learning.The main problem concerned by supervised learning is the problem of error convergence, i.e.,the minimization of error between the desired and computed unit values. Mainly, the aim is todetermine a set of weights which minimize the error. Least Mean Square (LMS) convergencemethod is the well known method which is commonly used in many learning paradigms.
2. Unsupervised: This learning does not use any external teacher and is based only on localinformation. It self-organizes data presented to the network and detects their emergentcollective properties. Hebbian learning and competitive learning are paradigms ofunsupervised learning [10].
5. RELATED WORK
Differential protection of generator and transformer: [11] this survey presents the use of ANN as apattern classifier for the combined differential protection of generator and transformer unit. The aim isto build a backup protection system to improve the overall reliability of the system. Two topologies ofthe network are finalized- one with half cycle data input and the other with full cycle data input. Aftercomparing the results, it is found that the ANN with half cycle data input is found more suitable thanothers in terms of accuracy, training speed, precision and speed in fault detection.Robot- Assisted Surgery (RAS) is the latest form of development in today’s minimally invasivesurgical technology. The robotic tools help the surgeons during the procedures with ease by translatingthe surgeon’s real-time hand movement. Region Proposal Networks are applied jointly with amultimodal object detection network for localization. This survey proposed an end-to-end deeplearning approach for fast tool detection and localization in RAS videos [12].Google devised a way to use deep learning to teach a neural network how to detect diabetic retinopathyfrom photos of patient’s eyes [13]. An artificial neural network performs like an artificial brain. Byshowing it a huge set of images of patients with and without retina damage, engineers can train thenetwork to distinguish between the diseased and non-diseased eyes. Diabetic retinopathy is one of thefirst diagnostic applications that Google has found for its deep learning computer vision team. One day,deep learning could change the way doctors diagnose patients.In recent years, the number of vehicles increases tremendously and hence the identification of vehicleis a significant task. Vehicle data recognition includes the vehicle color and number plate recognitionetc. color is the basic thing to identify the vehicle. In this, deep learning technique is used to spot thecolor of vehicle for each haze and haze free images. Convolutional Neural Network (CNN) is the risingtechnique within the field of deep learning. Using this methodology, vehicle color recognition is easy.In this dark channel prior method is applied for haze removal. After this, CNN approach is applied forfeature learning. Using support vector machines, color of the vehicle is classified. This system providesmore accurate results for hazy images and is more useful for traffic controlling, car parking, criminalvehicle detection etc.
6. DEEP LEARNING
Deep learning is a subset of machine learning in artificial intelligence that has networks which arecapable of learning unsupervised from data that is unstructured or unlabeled. Deep learning is all aboutmaking our model, create the features it needs to fulfill its task. It is also known as deep structurallearning or hierarchical learning. It is a part of neural networks that accepts the input signal and passeson a changed version of this signal to consecutive layer. There are many layers in between input andoutput layers and these layers are called hidden layers. There are much deep learning architectures-

National Conference on Emerging Trends in Science, Technology and Management, 11-12 Nov 2017, ISBN: 978-93-5281-325-4 Page 45
CNN, deep belief networks, continual neural networks etc. Deep learning has produced extremelypromising results for various tasks in natural language understanding [14].
7. CONCLUSION AND FUTURE SCOPE
This study describes that the advances in artificial neural networks and deep learning would make a bigdifference in many fields of technologies. It is an early example of a changing world. In coming future,deep learning would play its role in general purpose computer programs, models that require lessinvolvement from human engineers, in systematic reuse of previously learned features andarchitectures and in some new forms of learning etc.
REFERNCES[1.] Zurada, Jacek M. Introduction to artificial neural systems. Vol. 8. St. Paul: West, 1992.[2.] https://en.wikipedia.org/wiki/Artificial_neural_network[3.] Pitts, Walter. "The linear theory of neuron networks: The dynamic problem." Bulletin of Mathematical
Biology 5.1 (1943): 23-31.[4.] Hebb, Donald Olding. The organization of behavior: A neuropsychological theory. Psychology Press,
2005.[5.] Minsky, Marvin. "A framework for representing knowledge." (1975).[6.] Rosenblatt, Frank. "Principles of neurodynamics." (1962).[7.] Rumelhart, David E., Geoffrey E. Hinton, and Ronald J. Williams. Learning internal representations by
error propagation. No. ICS-8506. California Univ San Diego La Jolla Inst for Cognitive Science, 1985.[8.] https://en.wikibooks.org/wiki/Artificial_Neural_Networks/History[9.] Fausett, Laurene, and Laurene Fausett. Fundamentals of neural networks: architectures, algorithms, and
applications. No. 006.3. Prentice-Hall,, 1994.[10.] Shodhganga.inflibnet.ac.in/bitstream/10603/59883/9/09_chapter%202.pdf[11.] Balaga, H., D. N. Vishwakarma, and H. Nath. "Artificial Neural Network Based Backup Differential
Protection of Generator-Transformer Unit." System 1 (2015).[12.] Sarikaya, Duygu, Jason Corso, and Khurshid Guru. "Detection and localization of robotic tools in robot-
assisted surgery videos using deep neural networks for region proposal and detection." IEEETransactions on Medical Imaging (2017).
[13.] www.popsci.com/google-applied-technology-they-use-to-sort-photos-to-diagnose-diabetic-eye-problems.
[14.] Aarathi, K. S., and Anish Abraham. "Vehicle color recognition using deep learning for hazyimages." Inventive Communication and Computational Technologies (ICICCT), 2017 InternationalConference on. IEEE, 2017.
.
National Conference on Emerging Trends in Science, Technology and Management, 11-12 Nov 2017, ISBN: 978-93-5281-325-4 Page 46
A STUDY ON EFFECTIVENESS OF DIGITALMARKETING AND ITS IMPACT
Anukaran KhannaAssistant Professor, Department of Electronics & Communication, UCER, Allahabad.
Prateek KhannaAssistant Professor, Department of Business Administration, SIM, Allahabad.
S.N. SinghAssistant Professor, Department of Electrical Engineering, Ashoka, Varanasi.
Abstract - Marketers are faced with new challenges and opportunities within this digital age. Digitalmarketing is the utilization of electronic media by the marketers to promote the products or services intothe market. The main objective of digital marketing is attracting customers and allowing them to interactwith the brand through digital media. Digital marketing is the avenue of electronic communication which isused by the marketers to endorse the goods and the services towards the marketplace. The supreme purposeof the digital marketing is concerned with consumers and allows the customers to intermingle with theproduct by virtue of digital media. This work concentrates on the magnitude of digital promotion for bothcustomers and marketers. We scrutinize the result of digital marketing on the base of firm’s sales. 100respondents opinion are collected to get the clear picture about the present study.
Keywords - Digital Marketing, Consistent, Effectiveness, Interact, Promotion.
1. INTRODUCTION
Digital marketing is often referred to as 'online marketing', 'internet marketing' or 'web marketing'. Theterm digital marketing has grown in popularity over time, particularly in certain countries. In the USAonline marketing is still prevalent, in Italy is referred as web marketing but in the UK and worldwide,digital marketing has become the most common term, especially after the year 2013.Digital marketing is an umbrella term for the marketing of products or services using digitaltechnologies, mainly on the Internet, , but also including mobile phones, display advertising, , and anyother digital medium. Through digital media, consumers can access information any time and any placewhere they want. With the presence of digital media, consumers do not just rely on what the companysays about their brand but also they can follow what the media, friends, associations, peers, etc., aresaying as well. Digital marketing is a broad term that refers to various promotional techniques deployedto reach customers via digital technologies. Digital marketing embodies an extensive selection ofservice, product and brand marketing tactics which mainly use Internet as a core promotional mediumin addition to mobile and traditional TV and radio. Canon iMage Gateway helps consumers share theirdigital photos with friends online. L’Oréal’s brand Lancôme uses email newsletters to keep in touchwith customers and hence tries to strengthen customer brand loyalty (Merisavo et al., 2004). Magazinepublishers can activate and drive their customers into Internet with e-mails and SMS messages toimprove re-subscription rate (Merisavo et al., 2004).Marketers increasingly bring brands closer to consumers’ everyday life. The changing role ofcustomers as co-producers of value is becoming increasingly important (Prahalad and Ramaswamy,2004). Khan and Mahapatra (2009) remarked that technology plays a vital role in improving the qualityof services provided by the business units. According to Hoge (1993), electronic marketing (EM) is atransfer of goods or services from seller to buyer involving one or more electronic methods or media.E-Marketing began with the use of telegraphs in the nineteenth century. With the invention and massacceptance of the telephone, radio, television, and then cable television, electronic media has becomethe dominant marketing force. McDonald’s uses online channel to reinforce brand messages andrelationships. They have built online communities for children, such as the Happy Meal website witheducative and entertaining games to keep customers always close to themselves (Rowley 2004).Reinartz and Kumar (2003) found that the number of mailing efforts by the company is positivelylinked with company profitability over time. The primary advantages of social media marketing isreducing costs and enhancing the reach. The cost of a social media platform is typically lower thanother marketing platforms such as face-to-face sales or sales with a help of middlemen or distributors.In addition, social media marketing allows firms to reach customers that may not be accessible due totemporal and locational limitations of existing distribution channels. Generally, main advantage ofsocial media is that it can enable companies to increase reach and reduce costs (Watson et al. 2002;Sheth & Sharma 2005).According to Chaffey (2011), social media marketing involves “encouraging customer communicationson company’s own website or through its social presence”. Social media marketing is one importanttechnique in digital marketing as companies can use social media form to distribute their messages to
National Conference on Emerging Trends in Science, Technology and Management, 11-12 Nov 2017, ISBN: 978-93-5281-325-4 Page 47
their target audience without paying for the publishers or distributor that is characteristic for traditionalmarketing. Digital marketing, electronic marketing, e-marketing and Internet marketing are all similarterms which, simply put, refer to “marketing online whether via websites, online ads, opt-in emails,interactive kiosks, interactive TV or mobiles” (Chaffey & Smith, 2008). Giese and Gote (2000) findsthat customer information satisfaction (CIS) for digital marketing can be conceptualized as a sum ofaffective response of varying intensity that follows consumption and is stimulated by focal aspects ofsales activities, information systems (websites), digital products/services, customer support, after-salesservice and company culture.Waghmare (2012) pointed out that many countries in Asia are taking advantage of e-commerce throughopening up, which is essential for promoting competition and diffusion of Internet technologies. Ziaand Manish (2012) found that currently, shoppers in metropolitan India are being driven by e-commerce: these consumers are booking travels, buying consumer electronics and books online. DaveChaffey (2002) defines e-marketing as “application of digital technologies - online channels (web, e-mail, databases, plus mobile/wireless & digital TV) to contribute to marketing activities aimed atachieving profit acquisition and customers retention (within a multi-channel buying process andcustomer lifecycle) by improving customer knowledge (of their profiles, behavior, value and loyaltydrivers) and further delivering integrated communications and online services that match customers’individual needs. Chaffey's definition reflects the relationship marketing concept; it emphasizes that itshould not be technology that drives e-marketing, but the business model. All types of social mediaprovide an opportunity to present company itself or its products to dynamic communities andindividuals that may show interest (Roberts & Kraynak, 2008). According to Gurau (2008), onlinemarketing environment raises a series of opportunities and also challenges for social media marketingpractitioners.The way in which digital marketing has developed since the 1990s and 2000s has changed the waybrands and businesses utilize technology and digital marketing for their marketing. Digital marketingcampaigns are becoming more prevalent as well as efficient, as digital platforms are increasinglyincorporated into marketing plans and everyday life, and as people use digital devices instead of goingto physical shops.
2. OBJECTIVE
The main objective of this paper is to identify the effectiveness of digital marketing in the competitivemarket. The supportive objectives are following:a) To recognize the usefulness of digital marketing in the competitive market.b) To study the impact of digital marketing on consumers purchase.
3. THEORETICAL AND CONCEPTUAL FRAMEWORK: TRADITIONALMARKETING V/S DIGITAL MARKETING
Traditional marketing is the most recognizable form of marketing. Traditional marketing is non digitalway used to promote the product or services of business entity. On the other hand, digital marketing isthe marketing of products or services using digital channels to reach consumers. Some comparisons arepresented below:
Table 3.1: Comparison between Traditional and Digital Marketing
Traditional Marketing Digital Marketing
Communication is unidirectional. Communication is bidirectional.
Traditional marketing includes print,broadcast, direct mail, and telephone.
Digital marketing includes online advertising, email marketing, socialmedia, text messaging, affiliate marketing, search engine optimization, payper click.
Campaigning takes more time fordesigning, preparing, and launching.
There is always a fast way to develop an online campaign and carry outchanges along its development. With digital tools campaigning is easier.
It is difficult to measure theeffectiveness of a campaign.
It is easier to measure the effectiveness of a campaign through analytics.
Expensive and time-consumingprocess
Reasonably cheap and rapid way to promote the products or services
Success of traditional marketingstrategies can be celebrated if thefirm can reach large local audience.
Success of digital marketing strategies can be celebrated if the firm canreach some specific number of local audience.

National Conference on Emerging Trends in Science, Technology and Management, 11-12 Nov 2017, ISBN: 978-93-5281-325-4 Page 48
4. METHODOLOGY OF THE STUDY
Methodology comes from systematic and theoretical analysis of the methods to evaluate suitability ofone specific method to apply to a field of study. It typically encompasses concepts such as paradigm,theoretical model, phases and quantitative or qualitative techniques. This study is conducted based onboth primary and secondary data sources.
1. Primary Data: The research is done through observation and collection of data throughquestionnaires.
2. Secondary Data: Secondary data is collected from journals, books and magazines to developthe theory.
3. Sample Size: The sample size is determined as 100 respondent’s (Allahabad) opinion from thecustomers who presently purchasing products with a help of digital marketing.
5. ANALYSIS AND DISCUSSION
To show the relation between the various elements of digital marketing and increased sales, we havecollected data from one hundred respondents who are taking the various techniques or elements ofdigital marketing. Results are given below:
Table 5.1: Profile of Buyers
Attribute Category Number of Respondents Percentage of Respondents
Gender
Male 68 68%
Female 32 32%
Total 100 100%
Age
< 18 years 16 16%
19 – 30 Yrs 24 24%
31 – 45 Yrs 32 32%
Above 45 Yrs 28 28%
Total 100 100%
Profession
House Wife 12 12%
Employee 48 48%
Business 15 15%
Students 16 16%
Others 9 9%
Total 100 100%
Monthly Income(Rs)
<10000 15 15%
10001-20000 26 26%
20001- 40000 23 23%
Above 40000 36 36%
Total 100 100%
Table 5.2: Availability of Online Information about Product
Particulars Number of Respondents Percentage of Respondents
Excellent 56 56%
Good 28 28%
Average 14 14%
Poor 2 2%
Total 100 100%
National Conference on Emerging Trends in Science, Technology and Management, 11-12 Nov 2017, ISBN: 978-93-5281-325-4 Page 49
Table 5.3: Reasons for Choosing Online Shopping
Particulars Number of Respondents Percentage of Respondents
Wide Variety of Products 26 26%
Easy Buying Procedures 35 35%
Lower Prices 17 17%
Various Modes of Payments 16 16%
Others 6 6%
Total 100 100%
Table 5.4: Frequency of Online Purchasing
Particulars Number of Respondents Percentage of Respondents
Purchase once annually 11 11%
2-5 purchases annually 41 41%
6-10 purchases annually 35 35%
>11 purchases annually 13 13%
Total 100 100%
From the above results it can be concluded that, Digital marketing have a greater future in the presentmarket. Consumers are satisfied through purchasing digital marketing. People find it safe mode ofonline purchase. Ratio of male customers is very high in online shopping that is 68%. Most numbers ofrespondents that is 38% feels that online shopping have simple buying procedures; others feel that theycan have a broad variety of products, products with lower price, a variety mode of payments etc. 56%of respondents feel that availability of online information about Product & Services is outstanding.41% of the respondents purchase the products 2 to 5 times annually.
6. CONCLUSION
Digital channel in marketing has become essential part of strategy of many companies. Nowadays,even for small business owner there is a very cheap and efficient way to market his/her products orservices. Digital marketing has no boundaries.Digital marketing has turn out to be crucial part ofapproach of many companies. At the present time, still for tiny business proprietor at hand have anextremely inexpensive and competent method by using digital marketing to market their products orservices in the society. It has no restrictions. Company can utilize any devices such as tablets, smartphones, TV, laptops, media, social media, e- mail and lot other to support company and its productsand services. Digital marketing may achieve something more if it considers consumer desires as a peakpriority.
REFERENCES
[1.] Chaffey D, E-business & e-Commerce Management- Strategy, Implementation and Practice PearsonEducation, Paris, 2011, 72-79.
[2.] Chaffey D & Smith P, E-Marketing Excellence: Planning and Optimizing Your Digital Marketing, Routledge.Fourth Edition, 2008, 580-593.
[3.] Fournier, Susan. (1998). Consumers and Their Brands: Developing Relationship Theory in Consumer.[4.] Krishnamurthy, S. (2006). Introducing E-MARKPLAN: A practical methodology to plan e-marketing
activities. Business Horizons. 49 (1), 49, 51, 60.[5.] M. S. Khan and S. S. Mahapatra,(2009). Service quality evaluation in internet banking: an empirical study
inIndia. Int. J. Indian Culture and Business Management, vol. 2, no. 1, (2009), pp. 30-46.[6.] Mangles, C. a. (2003). Relationship marketing in online business-to-business Markets: a pilot investigation of
small UK manufacturing firms. European Journal of Marketing, Vol. 37 No. 5/6, pp. 753-773.[7.] Merisavo, M. and R. Mika. (2004). The Impact of Email Marketing on Brand Loyalty. Journal of Productand
Brand Management 13 (6): 498-505.[8.] Prahalad, C.K. and Ramaswamy V. (2005). The Future of Competition: Co-Creating Unique Value with
Customers. Boston, Massachusetts: Harvard Business School Press.[9.] Reinartz, Werner J. and V. Kumar. (2003). The Impact of Customer Relationship Characteristics on Profitable
Lifetime Duration. Journal of Marketing 67 (1): 77-79. Research. Journal of Consumer Research 24 (4): 343-73.
[10.] Waghmare GT, E-Commerce, A Business Review and Future Prospects in Indian Business. Internet,Marketing in India. Indian Streams Research Journal, 2(5), 2012, 1- 4.
National Conference on Emerging Trends in Science, Technology and Management, 11-12 Nov 2017, ISBN: 978-93-5281-325-4 Page 50
GOODS AND SERVICES TAX: BIGGEST INDIRECTTAX REFORM IN INDIA AFTER INDEPENDENCE
Dr. Ajay Bhushan PrasadHumanities & Management, Ashoka Institute of Technology & Management, Varanasi
Abstract - “When Nation is one Nationality is one why not one Tax and one Market Regime”. GST India’sbiggest tax reform launched at midnight, on 01 July 2017 by our honorable Prime Minister Mr. NarendraModi .PM Modi says ‘Good and simple tax’ will help poor. GST will bring revolution in Indian economy.GST is expected to boost our GDP by 2-3 %.What is GST? Goods and Services Tax (GST) is a value-added tax at each stage of the supply of goods andservices precisely on the amount of value addition achieved. It seeks to eliminate inefficiencies in the taxsystem that result in ‘tax on tax’, known as cascading of taxes. GST is a destination-based tax onconsumption, as per which the state’s share of taxes on inter-state commerce goes to the one that is home tothe final consumer, rather than to the exporting state. GST has two equal components of central and stateGST.What is input tax credit? To make sure that tax is levied only on the amount of value addition at each stageof the supply chain, credit for the taxes paid at the previous stage is granted. For example, a garmentmanufacturer gets credit for the taxes paid on the materials purchased while computing the final indirecttax liability on his product that is collected from the consumer. Similarly, a service provider, say, a telecomcompany, gets credits for the taxes paid on the goods and services used in his business.Who is liable to pay GST? Businesses and traders with annual sales above Rs20 lakhs are liable to pay GST.The threshold for paying GST is Rs10 lakhs in the case of northeastern and special category states. GST isapplicable on inter-state trade irrespective of this threshold. This paper will try to explore the detailsabout GST impact in India especially on economy and employment generation and also to see theopportunity, challenges, and regulatory environment and government initiatives to make it agrand success for economic growth of the country.
Keywords-GST, Cascading, Levied, Revolution.
1. INTRODUCTION
India’s biggest indirect tax reform has been taken place on July 01, 2017 that is known as GST. Thefull form of GST is goods and services tax. It’s a single window tax pay regime started in India. GSThas been hailed as India's 'biggest tax reform' since 1947. GST is one indirect tax for the whole nation,which will make India one unified common market. GST is a single tax on the supply of goods andservices, right from the manufacturer to the consumer. Credits of input taxes paid at each stage will beavailable in the subsequent stage of value addition, which makes GST essentially a tax only on valueaddition at each stage. The final consumer will thus bear only the GST charged by the last dealer in thesupply chain, with set-off benefits at all the previous stages. Currently, in India complicated indirecttax system is followed with imbrications of taxes imposed by union and states separately. GST willunify all the indirect taxes under an umbrella and will create a smooth national market. Experts say thatGST will help the economy to grow in more efficient manner by improving the tax collection as it willdisrupt all the tax barriers between states and integrate country via single tax rate. GST was firstintroduced by France in 1954 and now it is followed by 140 countries. Most of the countries followedunified GST while some countries like Brazil, Canada follow a dual GST system where tax is imposedby central and state both. In India also dual system of GST is proposed including CGST and SGSTAt the Central level, the following taxes are being subsumed in GST:
1. Central Excise Duty,2. Additional Excise Duty,3. Service Tax,4. Additional Customs Duty commonly known as Countervailing Duty, and5. Special Additional Duty of Customs.
At the State level, the following taxes are being subsumed in GST:1. Subsuming of State Value Added Tax/Sales Tax,2. Entertainment Tax (other than the tax levied by the local bodies), Central Sales Tax (levied by
the Centre and collected by the States).3. Octroi and Entry tax.4. Purchase Tax.5. Luxury tax.6. Taxes on lottery, betting and gambling.

National Conference on Emerging Trends in Science, Technology and Management, 11-12 Nov 2017, ISBN: 978-93-5281-325-4 Page 51
Fig. 1: GST model of IndiaTo understand the concurrent Dual GST model, we have to understand three different words.
1. CGST- Central Goods & Service Tax: CGST will be levied by Central Government on intrastate supply of Goods and/or services and it will be paid to the account of Central Government.
2. SGST- State Goods & Service Tax: SGST will be levied by State Government on intra-statesupply of goods and/or services and it will be paid to the account of State Government.
3. IGST- Integrated Goods & Service Tax: IGST will be levied by Central Government on intersupply of goods and/or and services and it will be paid to the account of Central Government.Additional tax to be levied by Central Government on Inter-state supply of goods.
Rates of GST: GST Council declares a four tier tax structure of 5%, 12%, 18% and 28% with lowerrates foe essential items and the higher rates for luxury and de-merits goods. With a view to keepinginflation under control, essential items like food will be taxed at zero rates.Benefits of GST: There are so many advantages of GST to the different stakeholders like Government,Consumers and Manufacturers etc. The benefits of the proposed GST to different parties are as under.At present tax is collected by the states where the products are manufacturing wherein GST tax will becollected by the state where the product gets consumption. So those states get additional income whereconsumption is more.Benefits to Customer: The most important impact of GST is that it will reduce the cost of a product orservice and customer gets direct advantages of it. Customers can get products or service on lower pricethan the current situation of VAT. It will increase the purchasing power and saving capacity ofcustomer. And finally customers can make additional investment from their savings.Benefits to Traders/Manufacturers: At present condition there is a situation of multiple taxes inVAT system. GST will overcome on all the Shortcomings of current system of VAT. Cost ofproduction will be reduced and manufacturers will be able to sell their products on lower/competitiverates. They can upward the graph of selling and profit also.Benefits to Government: Government also gets advantages from replacing VAT by GST. GST is avery easy indirect tax system. It is very easy to understand and also easy to implement. It will broadenthe current tax structure in India. Government can get more and more investment from consumerswhose savings increased by GST.The salient features of the Bill are as follows:
1. Conferring simultaneous power upon Parliament and the State Legislatures to make lawsgoverning goods and services tax;
2. Subsuming of various Central indirect taxes and levies such as Central Excise Duty, AdditionalExcise Duties, Service Tax, Additional Customs Duty commonly known as CountervailingDuty, and Special Additional Duty of Customs;
3. Subsuming of State Value Added Tax/Sales Tax, Entertainment Tax (other than the tax leviedby the local bodies), Central Sales Tax (levied by the Centre and collected by the States), Octroiand Entry tax, Purchase Tax, Luxury tax, and Taxes on lottery, betting and gambling;
4. Dispensing with the concept of ‘declared goods of special importance’ under the Constitution;5. Levy of Integrated Goods and Services Tax on inter-State transactions of goods and services;6. GST to be levied on all goods and services, except alcoholic liquor for human consumption.
Petroleum and petroleum products shall be subject to the levy of GST on a later date notified onthe recommendation of the Goods and Services Tax Council;
7. Compensation to the States for loss of revenue arising on account of implementation of theGoods and Services Tax for a period of five years;

National Conference on Emerging Trends in Science, Technology and Management, 11-12 Nov 2017, ISBN: 978-93-5281-325-4 Page 52
8. Creation of Goods and Services Tax Council to examine issues relating to goods and servicestax and make recommendations to the Union and the States on parameters like rates, taxes,cesses and surcharges to be subsumed, exemption list and threshold limits, Model GST laws,etc. The Council shall function under the Chairmanship of the Union Finance Minister and willhave all the State Governments as Members.
2. REVIEW OF LITERATURE
G. Sunitha and P. Satischandra broadly discussed about GST in their research paper titled “Goods andService Tax (GST) as a new path in Tax Reforms in Indian Economy” The authors have tried to explainthe concept of GST and different models of GST. They also focused on the impact of GST on Indianmarkets. According to them the current tax structure is the main hurdle for growth of Indianeconomy. New tax structure of GST will remove this hurdles and boosts Indian economy.Dr R Vasanthagopal concluded in “GST in India a Big Leap in the Indirect Taxation System” inInternational Journal of Trade, Economics and Finance, Vol. 2, No. 2, April 2011 that GST will bebooming Indian economy. According to him India is suffering from complicated tax system GST willgive a boost to the Indian economyGarg summarizes in the article “Basic Concepts and Features of Good and Services Tax in India”published in International Journal of scientific research and Management, 2(2), 542-549 about impact ofGST on Indian Tax structure and find out that GST will strengthen nation’s economy and developmentNeha and Manpreet Sharma describes about GST in their research paper titled “A study on Goods andService Tax in India” They tried to find out the benefits of GST and current status of GST in India.According to them we are moving towards GST due to faults in our current indirect taxstructure. Our current indirect tax structure is unable to increase the competitiveness of industries.Nitin Kumar write a research paper named “Goods and Service Tax in India -A Way Forward” in“Global Journal of Multidisciplinary Studies”, Vol 3, Issue6, May 2014 and he noted thatimplementation of GST in India will be a great move and it will be remove all the problems of currenttax structure in India.
3. GAPS IN RESEARCH
No systematic research was found in the area of GST .Therefore, it was thought to be justified andrelevant to conduct research on this topic. Researcher could not find any study on GST related taxregime. This necessitates the need for doing study on this topic .Therefore the proposed problem hasbeen chosen for extensive and detailed study.
4. PROBLEM-STATEMENT
“Goods and Services Tax: Biggest Indirect Tax Reform in India after Independence”.
5. OBJECTIVES OF THE RESEARCH
The design of this research is descriptive in nature. Necessary secondary data has been collected fromvarious research papers, magazines, articles, news papers, websites etc. The objectives of the paper are:
1. To understand the concept and necessity of GST.2. To study the features of GST.3. To examine the advantages of GST.4. To study the challenges against GST.
6. METHODOLOGY OF RESEARCH
The study is based on Secondary data collected from various referred books, National & internationalJournals, Government reports, publications from various websites which focused on various aspects ofGoods and Service tax.Scope of the Research: The study analyses the contents of GST and finds out the benefit of this newtax regime in India.Significance of the Research: The study is expected to be valuable contribution to the society,academicians and scholar which will help and guide towards the welfare of the nation. The study isquite rewarding in today’s scenario for each and every individual.Limitation of the Research: The findings of the study are subject to several limitations. First islimitation of interpretation and second is due to time constraint.Findings and Interpretation (Challenges of GST in Indian Context): At Present, lots ofspeculations are going regarding when the GST will actually be applicable in India. Looking Into thepolitical environment of India, it seems that a little more time will be required to ensure that

National Conference on Emerging Trends in Science, Technology and Management, 11-12 Nov 2017, ISBN: 978-93-5281-325-4 Page 53
everybody is satisfied. The states are confused as to whether the GST will hamper their revenues.Although the Central Government has assured the states about compensation in case the revenue fallsdown, still a little mistrust can be a severe draw back. The GST is a high-quality type of tax. However,for the successful implementation of the same, there are few challenges which have to face toimplement GST In India. Following are some of the factors that must be kept in mind about GST:
1. Firstly, it is really required that every one of the states actualize the GST together and that too atSimilar rates. Otherwise, it will be really cumbersome for businesses to comply with theprovisions of the law.
2. Further, GST will be very advantageous if the rates are same, because in that case taxes will notbe a factor in investment location decisions, and people will be able to focus on profitability.
3. For smooth working, it is important that the GST clearly sets out the taxable event. Presently,the CENVAT credit rules, the Point of Taxation Rules are amended/ introduced for this purposeonly.
4. The GST is a goal based tax, not the origin one. In such circumstances, it should be clearlyidentifiable as to where the goods are going. This shall be difficult in case of services, because itis not easy to Identify where a service is provided, thus this should be properly dealt with.
7. CONCLUDING REMARKS
There are various challenges in the way of Goods & Service Tax, but its advantages are more than itsdisadvantages. It will also give India a world class and a smart tax system. It requires rational use andeffective implementation of GST in a nation like India. The main aim behind GST is to replace VAT.GST is a comprehensive indirect tax that subsumes all types of indirect taxes of central and stategovernments in it. We can say that GST will provide relief to Consumers, Manufacturers andGovernments and whole nation.
BIBLIOGRAPHY & REFERENCES[1.] Empowered Committee of State Finance Ministers (2009). First Discussion Paper on GST, Government
Of India, New Delhi[2.] Report of Task Force on Implementation of FRBM Act, Government of India, New Delhi[3.] Thirteenth Finance Commission (2009). Report of Task Force on Goods & Service Tax[4.] Vasanthagopal, R., GST in India: A Big Leap in the Indirect Taxation System. International Journal of
Trade, Economics and Finance, 2(2), 144–147, 2011.[5.] Saravanan Venkadasalam, Implementation of Goods and Service Tax (GST): An Analysis on ASEAN
States using Least Squares Dummy Variable Model (LSDVM) International Conference on Economics,Education and Humanities (ICEEH'14) Dec. 10-11, 2014 Bali (Indonesia), Pg No. 7-9
[6.] Nishita Gupta, Goods and Services Tax: Its implementation on Indian economy, CASIRJ Volume 5Issue 3 [Year - 2014] ISSN 2319 – 9202, Pg. No.126-133
[7.] Neha & Sharma Manpreet, A Study on Goods and Services Tax in India, Research journal of socialScience & management ISSN 2251-1571. Volume: 03, Number: 10, February-2014
[8.] Dr. Shaik Shakir, Dr. Sameera S.A, &Mr. Firoz Sk.C., Does Goods and Services Tax (GST) Leads toIndian Economic Development? , IOSR Journal of Business and Management e-ISSN: 2278-487X,pISSN: 2319-7668. Volume 17, Issue12.Ver.III (Dec.2015), PP01-05
[9.] Raghuram G., Deepa K.S , Goods and Services Tax: The Introduction Process, W.P. No. 2015-03-01Panda Aurobinda and Patel Atul, The Impact of GST (Goods and Services Tax) on the Indian TaxScene, SSRN Electronic Journal 1868621
[10.] Khan, M., & Shadab, N., Goods and Services Tax (GST) in India: prospect for states. BudgetaryResearch Review, 4(1), 38–64.n.d. http://www.indiataxes.com/Information/VAT/Introduction.htm
[11.] Dr. R. Vasanthagopal (2011), “GST in India: A Big Leap in the Indirect Taxation the PNGTaxation System”, International Journal of Trade, Economics and Finance, Vol. 2, No. 2, April 2011.
[12.] Agogo Mawuli (2014): “Goods and Service Tax- An Appraisal “Paper presented at the PNG TaxationResearch and Review Symposium, Holiday Inn, Port Moresby,29-30.
[13.] www.goodsandservicetax.com
National Conference on Emerging Trends in Science, Technology and Management, 11-12 Nov 2017, ISBN: 978-93-5281-325-4 Page 54
A STUDY AND REVIEW OF SWITCHING LOSSES INMETAL OXIDE SEMICONDUCTOR FIELD EFFECT
TRANSISTORKamal Singh1, Dr. Kuldeep Sahay2, Sandeep Kumar Singh3
Department of Electrical EngineeringInstitute of Engineering & Technology Lucknow1, 2
Ashoka Institute of Technology & Management Varanasi3
[email protected], [email protected], [email protected]
Abstract - In this paper a study and review of switching losses in metal oxide semiconductor field effecttransistor is presented. The objective of this paper is to bring awareness of the switching losses under theinfluence of a variety of factors such as load current, switching speed etc. It is very essential to understandthe switching losses and their impact on the system under operating conditions. The different types ofswitching losses models are presented in this paper for MOSFET in which different methodologies foranalysis of power switching losses are evaluated. The switching losses can be minimised by separating thesource connection between the power path and the driver path of MOSFET. Thus, the paper provideshelpful study of switching losses in in MOSFET.
Keywords - Dc-dc converter, SEPIC converter, Power Semiconductor Devices.
1. INTRODUCTION
The power MOSFET is one of two predominately used, fully controlled semiconductor devices inpower electronics. As such, its modeling is of prime importance for the construction of any powerelectronic converter. Obtaining a reliable and accurate result for their losses during conduction andswitching is an important step in the goal for performance evaluation of a given circuit. High efficiencybecomes a necessary requirement in switching mode power supply (SMPS) design. To achieve thisrequirement, a lot of power semiconductor researchers developed fast switching devices i.e., theparasitic capacitance of the devices are minimized, with the low conduction channel resistance to saveboth switching losses and conduction loss. These fast switching devices trigger switching transientovershoot. It creates critical SMPS design issue on the PCB layout, and the gate signal oscillation. Toovercome switching transient overshoot, designers usually slows down devices switching speed byincreasing the gate resistor value with appropriate snubber circuit for damping overshoot, but it willsuffer relatively high switching losses. There always is a tradeoff between the efficiency and the easeof use for the fast switching devices in standard through whole package. The fast switching devicesturn-on and turn-off controls are the key concern when it works with the parasitic inductors generatedby the PCB layout and the device package. Especially, the package source parasitic inductors are thecritical factor on the devices control. Fast switching MOSFET separates the source connection into twocurrent paths: one for a power connection and another for the driver connection. It allows the devicekeeping the switching speed without sacrificing the turn-on and turn-off controls ability [1, 8].Megawatt power applications require efficient and high power-density converters that are capable ofoperating at elevated temperatures. The performance of Si-based power transistors is limited due to lowjunction operating temperatures and low blocking voltage. With the improved performance availablefrom wide band-gap semiconductor materials such as SiC, devices composed of such materials willmake the present power converter constraints less of a burden. SiC switching devices have been studiedand developed in the power electronics industry throughout the last decade. Some commercial powersupplies using SiC diodes are already available in the market [2, 10-11]. Electronic power processingtechnology has evolved around two fundamentally different circuit schemes: duty cycle modulation,commonly known as Pulse Width Modulation (PWM), and resonance. The PWM technique processespower by interrupting the power flow and controlling the duty cycle, thus, resulting in pulsating currentand voltage waveforms. The resonant technique processes power in a sinusoidal form. Due to circuitsimplicity and ease of control, the PWM technique has been used predominantly in today's powerelectronics industries, particularly, in low-power power supply applications, and is quickly becoming amature technology. Resonant technology, although well established in high-power SCR motor drivesand uninterrupted power supplies, has not been widely used in low-power dc/dc converter applicationsdue to its circuit complexity [3-4]. The switching loss of power MOSFETs becomes a dominant factorin the total power loss of power electronics converters when the switching frequency is increased toimprove dynamic performance and reduce size. A simple yet reasonably accurate method of estimatingpower MOSFET switching losses using device datasheet information is highly desirable for predictingmaximum junction temperatures and overall power converter efficiencies. However, the complex
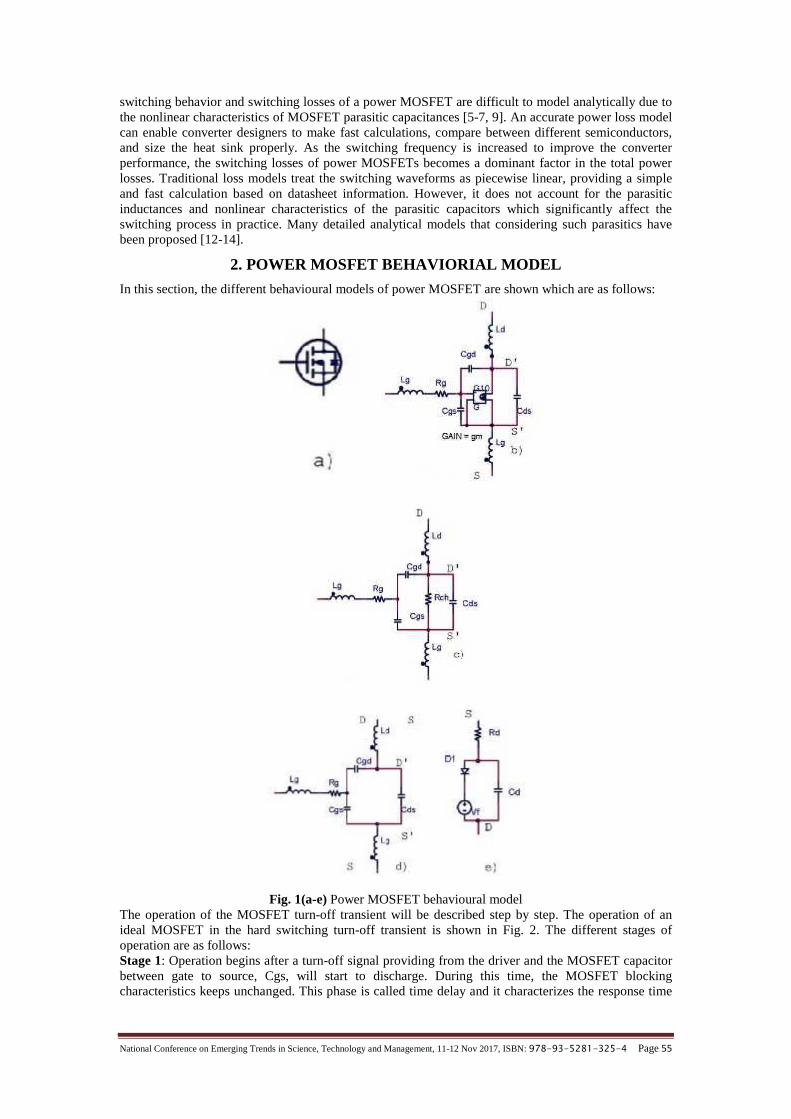
National Conference on Emerging Trends in Science, Technology and Management, 11-12 Nov 2017, ISBN: 978-93-5281-325-4 Page 55
switching behavior and switching losses of a power MOSFET are difficult to model analytically due tothe nonlinear characteristics of MOSFET parasitic capacitances [5-7, 9]. An accurate power loss modelcan enable converter designers to make fast calculations, compare between different semiconductors,and size the heat sink properly. As the switching frequency is increased to improve the converterperformance, the switching losses of power MOSFETs becomes a dominant factor in the total powerlosses. Traditional loss models treat the switching waveforms as piecewise linear, providing a simpleand fast calculation based on datasheet information. However, it does not account for the parasiticinductances and nonlinear characteristics of the parasitic capacitors which significantly affect theswitching process in practice. Many detailed analytical models that considering such parasitics havebeen proposed [12-14].
2. POWER MOSFET BEHAVIORIAL MODEL
In this section, the different behavioural models of power MOSFET are shown which are as follows:
Fig. 1(a-e) Power MOSFET behavioural modelThe operation of the MOSFET turn-off transient will be described step by step. The operation of anideal MOSFET in the hard switching turn-off transient is shown in Fig. 2. The different stages ofoperation are as follows:Stage 1: Operation begins after a turn-off signal providing from the driver and the MOSFET capacitorbetween gate to source, Cgs, will start to discharge. During this time, the MOSFET blockingcharacteristics keeps unchanged. This phase is called time delay and it characterizes the response time
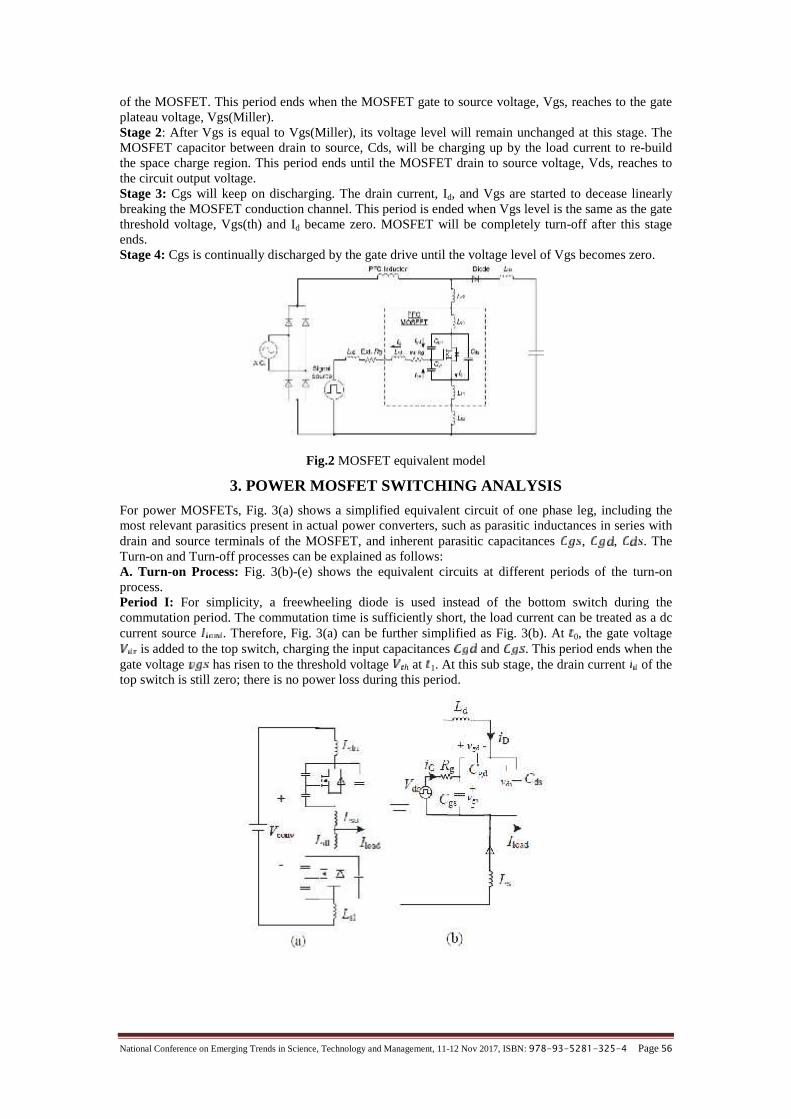
National Conference on Emerging Trends in Science, Technology and Management, 11-12 Nov 2017, ISBN: 978-93-5281-325-4 Page 56
of the MOSFET. This period ends when the MOSFET gate to source voltage, Vgs, reaches to the gateplateau voltage, Vgs(Miller).Stage 2: After Vgs is equal to Vgs(Miller), its voltage level will remain unchanged at this stage. TheMOSFET capacitor between drain to source, Cds, will be charging up by the load current to re-buildthe space charge region. This period ends until the MOSFET drain to source voltage, Vds, reaches tothe circuit output voltage.Stage 3: Cgs will keep on discharging. The drain current, Id, and Vgs are started to decease linearlybreaking the MOSFET conduction channel. This period is ended when Vgs level is the same as the gatethreshold voltage, Vgs(th) and Id became zero. MOSFET will be completely turn-off after this stageends.Stage 4: Cgs is continually discharged by the gate drive until the voltage level of Vgs becomes zero.
Fig.2 MOSFET equivalent model
3. POWER MOSFET SWITCHING ANALYSIS
For power MOSFETs, Fig. 3(a) shows a simplified equivalent circuit of one phase leg, including themost relevant parasitics present in actual power converters, such as parasitic inductances in series withdrain and source terminals of the MOSFET, and inherent parasitic capacitances , , . TheTurn-on and Turn-off processes can be explained as follows:A. Turn-on Process: Fig. 3(b)-(e) shows the equivalent circuits at different periods of the turn-onprocess.Period I: For simplicity, a freewheeling diode is used instead of the bottom switch during thecommutation period. The commutation time is sufficiently short, the load current can be treated as a dccurrent source . Therefore, Fig. 3(a) can be further simplified as Fig. 3(b). At 0, the gate voltage
is added to the top switch, charging the input capacitances and . This period ends when thegate voltage has risen to the threshold voltage ℎ at 1. At this sub stage, the drain current of thetop switch is still zero; there is no power loss during this period.
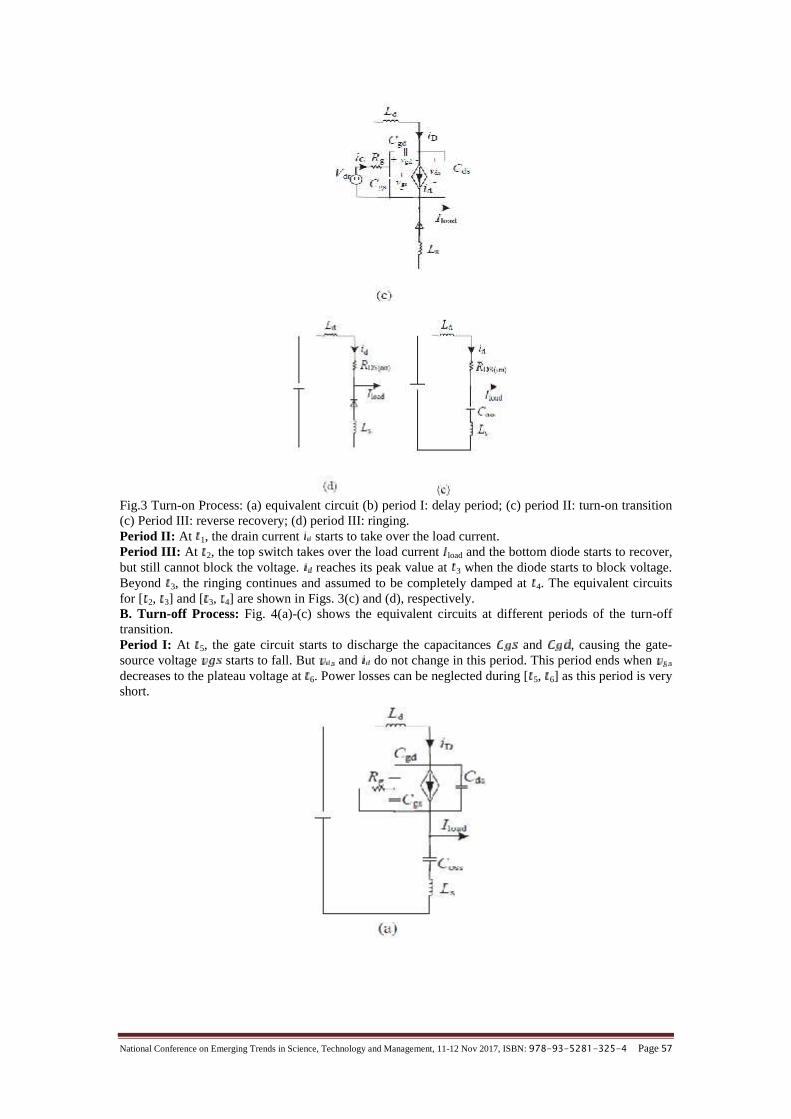
National Conference on Emerging Trends in Science, Technology and Management, 11-12 Nov 2017, ISBN: 978-93-5281-325-4 Page 57
Fig.3 Turn-on Process: (a) equivalent circuit (b) period I: delay period; (c) period II: turn-on transition(c) Period III: reverse recovery; (d) period III: ringing.Period II: At 1, the drain current starts to take over the load current.Period III: At 2, the top switch takes over the load current load and the bottom diode starts to recover,but still cannot block the voltage. reaches its peak value at 3 when the diode starts to block voltage.Beyond 3, the ringing continues and assumed to be completely damped at 4. The equivalent circuitsfor [ 2, 3] and [ 3, 4] are shown in Figs. 3(c) and (d), respectively.B. Turn-off Process: Fig. 4(a)-(c) shows the equivalent circuits at different periods of the turn-offtransition.Period I: At 5, the gate circuit starts to discharge the capacitances and , causing the gate-source voltage starts to fall. But and do not change in this period. This period ends whendecreases to the plateau voltage at 6. Power losses can be neglected during [ 5, 6] as this period is veryshort.
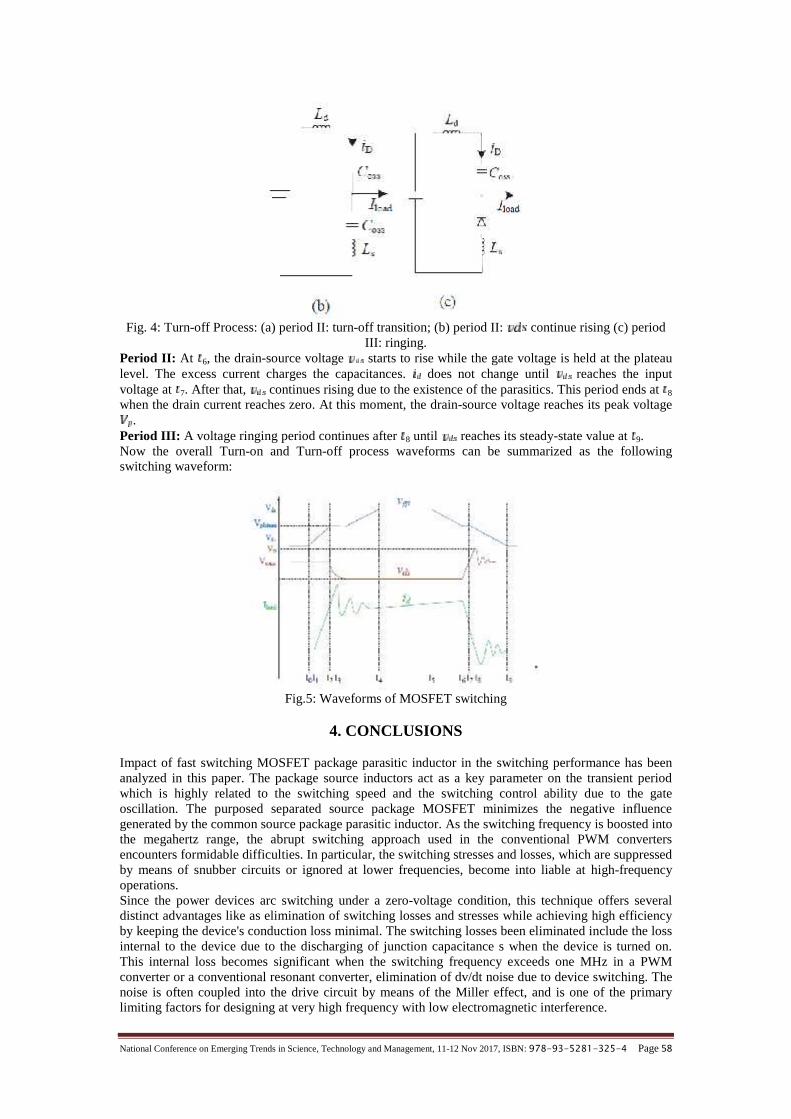
National Conference on Emerging Trends in Science, Technology and Management, 11-12 Nov 2017, ISBN: 978-93-5281-325-4 Page 58
Fig. 4: Turn-off Process: (a) period II: turn-off transition; (b) period II: continue rising (c) periodIII: ringing.
Period II: At 6, the drain-source voltage starts to rise while the gate voltage is held at the plateaulevel. The excess current charges the capacitances. does not change until reaches the inputvoltage at 7. After that, continues rising due to the existence of the parasitics. This period ends at 8
when the drain current reaches zero. At this moment, the drain-source voltage reaches its peak voltage.
Period III: A voltage ringing period continues after 8 until reaches its steady-state value at 9.Now the overall Turn-on and Turn-off process waveforms can be summarized as the followingswitching waveform:
Fig.5: Waveforms of MOSFET switching
4. CONCLUSIONS
Impact of fast switching MOSFET package parasitic inductor in the switching performance has beenanalyzed in this paper. The package source inductors act as a key parameter on the transient periodwhich is highly related to the switching speed and the switching control ability due to the gateoscillation. The purposed separated source package MOSFET minimizes the negative influencegenerated by the common source package parasitic inductor. As the switching frequency is boosted intothe megahertz range, the abrupt switching approach used in the conventional PWM convertersencounters formidable difficulties. In particular, the switching stresses and losses, which are suppressedby means of snubber circuits or ignored at lower frequencies, become into liable at high-frequencyoperations.Since the power devices arc switching under a zero-voltage condition, this technique offers severaldistinct advantages like as elimination of switching losses and stresses while achieving high efficiencyby keeping the device's conduction loss minimal. The switching losses been eliminated include the lossinternal to the device due to the discharging of junction capacitance s when the device is turned on.This internal loss becomes significant when the switching frequency exceeds one MHz in a PWMconverter or a conventional resonant converter, elimination of dv/dt noise due to device switching. Thenoise is often coupled into the drive circuit by means of the Miller effect, and is one of the primarylimiting factors for designing at very high frequency with low electromagnetic interference.

National Conference on Emerging Trends in Science, Technology and Management, 11-12 Nov 2017, ISBN: 978-93-5281-325-4 Page 59
REFERENCES
[1] K. K. M. Siu, M. K. H. Cheung and F. P. Stückler, "Performance analysis of package parasiticinductances for fast switching MOSFET in converter," 2014 International Power Electronics andApplication Conference and Exposition, Shanghai, 2014, pp. 314-319.
[2] Hsin-Ju Chen, G. L. Kusic and G. F. Reed, "Comparative PSCAD and Matlab/Simulink simulationmodels of power losses for SiC MOSFET and Si IGBT devices," 2012 IEEE Power and EnergyConference at Illinois, Champaign, IL, 2012, pp. 1-5.
[3] K. H. Liu and F. C. Lee, "Zero-voltage switching technique in DC/DC converters," 1986 17th AnnualIEEE Power Electronics Specialists Conference, Vancouver, Canada, 1986, pp. 58-70.
[4] S. Sathyan, H. M. Suryawanshi, B. Singh, C. Chakraborty, V. Verma and M. S. Ballal, "ZVS–ZCS HighVoltage Gain Integrated Boost Converter for DC Microgrid," in IEEE Transactions on IndustrialElectronics, vol. 63, no. 11, pp. 6898-6908, Nov. 2016.
[5] Y. Xiong, S. Sun, H. Jia, P. Shea and Z. John Shen, "New Physical Insights on Power MOSFETSwitching Losses," in IEEE Transactions on Power Electronics, vol. 24, no. 2, pp. 525-531, Feb. 2009.
[6] X. Li, L. Zhang, S. Guo, Y. Lei, A. Q. Huang and B. Zhang, "Understanding switching losses in SiCMOSFET: Toward lossless switching," 2015 IEEE 3rd Workshop on Wide Bandgap Power Devices andApplications (WiPDA), Blacksburg, VA, 2015, pp. 257-262.
[7] L. E. A. Lirio, M. D. Bellar, J. A. M. Neto, M. S. d. Reis and M. Aredes, "Switching losses analysis insic power mosfet," 2015 IEEE 13th Brazilian Power Electronics Conference and 1st Southern PowerElectronics Conference (COBEP/SPEC), Fortaleza, 2015, pp. 1-6.
[8] V. Dimitrov, P. Goranov and D. Hvarchilkov, "An analytical approach to model the switching losses of apower MOSFET," 2016 IEEE International Power Electronics and Motion Control Conference(PEMC), Varna, 2016, pp. 928-933.
[9] Z. J. Shen, Y. Xiong, X. Cheng, Y. Fu and P. Kumar, "Power MOSFET Switching Loss Analysis: ANew Insight," Conference Record of the 2006 IEEE Industry Applications Conference Forty-First IASAnnual Meeting, Tampa, FL, 2006, pp. 1438-1442.
[10] J. Fu, Z. Zhang, Y. F. Liu and P. C. Sen, "MOSFET Switching Loss Model and Optimal Design of aCurrent Source Driver Considering the Current Diversion Problem," in IEEE Transactions on PowerElectronics, vol. 27, no. 2, pp. 998-1012, Feb. 2012.
[11] A. Van den Bossche, R. Stoyanov, N. Dukov, V. Valchev and A. Marinov, "Analytical simulation andexperimental comparison of the losses in resonant DC/DC converter with Si and SiC switches," 2016IEEE International Power Electronics and Motion Control Conference (PEMC), Varna, 2016, pp. 934-939.
[12] L. Jin, S. Norrga and O. Wallmark, "Analysis of power losses in power MOSFET based stackedpolyphase bridges converters," 2016 IEEE 8th International Power Electronics and Motion ControlConference (IPEMC-ECCE Asia), Hefei, 2016, pp. 3050-3055.
[13] P. Grzejszczak and R. Barlik, "Switching losses in a new high-voltage MOSFETs," 2016 Progress inApplied Electrical Engineering (PAEE), Koscielisko-Zakopane, 2016, pp. 1-6.
[14] A. P. Arribas, M. Krishnamurthy and K. Shenai, "Accurate characterization of switching losses in high-speed, high-voltage Power MOSFETs," 2015 IEEE International Workshop on Integrated PowerPackaging (IWIPP), Chicago, IL, 2015, pp. 95-98.
National Conference on Emerging Trends in Science, Technology and Management, 11-12 Nov 2017, ISBN: 978-93-5281-325-4 Page 60
A THEORETICAL APPROACH FOR THEADVANCEMENT IN SEPIC DC-DC CONVERTER
Kamal Singh1, Dr. Kuldeep Sahay2, Sandeep Kumar Singh3
Department of Electrical EngineeringInstitute of Engineering & Technology Lucknow1, 2
Ashoka Institute of Technology & Management Varanasi3
[email protected], [email protected], [email protected]
Abstract: A theoretical approach for the advancement in SEPIC dc-dc converter presents the use ofsnubber circuit for the improvement of SEPIC converter. SEPIC converter is a type of dc-dc converter thatcan be used as step up or step down converter providing better efficiency. Snubber circuit may be activetype or passive type i.e. combinations of inductors, capacitors, diodes etc. The different types of snubbercircuits are used for the enhancement of converter which reduces the switching losses during the turn-onand turn-off of the power semiconductor device used in SEPIC converter. A theoretical study of thismodification is done in this paper which shows the snubber circuit is very useful for the reduction of reverserecovery losses providing the improvement in SEPIC converter.
Keywords - Dc-dc converter, SEPIC converter, Snubber circuit.
1. INTRODUCTION
The most common technology in all the electronic converters is switched mode power converters.Switched mode power converters convert the voltage input to another voltage signal by storing theinput energy and them releasing that energy to the output at a different voltage as per switchingoperation. The power is modified by controlling the timing that the switches are on and off. Due to thefact of switching at high frequency in a very efficient way, the switched mode conversion has aparticular interest. Although to achieve high power efficiency in low power level electronic technology,a much greater emphasis is required. Thus for this converters are used in order to change the supplyvoltage according to performance requirements for power efficiency reasons. The magnetic couplingallows increasing the static gain with a reduced switch voltage which gives low switch voltage and highefficiency for low input voltage and high output voltage applications [1]. Ac-dc conversion of electricpower is widely used in different applications like as in adjustable-speed drives, switch-mode powersupplies, uninterrupted power supplies, and utility interface with nonconventional energy sources suchas solar Photovoltaic etc., battery energy storage systems, in process technology such as electroplating,welding units, etc., battery charging for electric vehicles, and power supplies for telecommunicationsystems, measurement and test equipments. Using the coupled inductors, an appropriate couplingcapacitor is required to prevent big input and output ripple currents. This modified topology provideshigher static gain than the ordinary SEPIC converter and also predicts the ripple and the appropriatesize of the coupling capacitor [2-5]. Conventionally ac-dc converters are developed using diodes andthyristors to provide controlled and uncontrolled dc power with unidirectional and bidirectional powerflow. The splitting of this secondary inductor into two windings reduces the voltage stresses on themain switch and diodes. The additional diode helps to circulate the leakage inductance energy to theload in a non-oscillatory manner. The transistor turns on/off with soft switching. The voltage stress onboth the transistor and diodes is less than the output voltage [6-11]. A general boost converter is notsuitable for high step-up applications limited voltage step-up ratio. The solution is obtained bycombining a boost converter with SEPIC converter. This new integrated boost-SEPIC (IBS) converternow provides additional step-up ratio with the help of an isolated SEPIC converter. Since the boostconverter and the SEPIC converter share a boost inductor and a switch, its structure is simple [12-17].
2. DC TO DC CONVERTERS
Dc-dc converters are widely used in regulated switched mode dc power supplies and in dc motor driveapplications. The input to these converters is often an unregulated dc voltage, which is obtained byrectifying the line voltage and it will therefore fluctuate due to changes in the line voltage magnitude.Switched mode dc-dc converters are used to convert the unregulated dc input into a controlled dcoutput at a desired voltage level. Dc-dc converters are the basic converters in switched mode powersupplies. There are different kinds of dc-dc converters used for several years for different applications.Some of the applications require high voltages while some require low voltages.
Buck converters Boost converters

National Conference on Emerging Trends in Science, Technology and Management, 11-12 Nov 2017, ISBN: 978-93-5281-325-4 Page 61
Buck-boost converters Cuk converters SEPIC converters
From above types of converters, only the buck and the boost converters are basic converters. Buck-boost converter is the combination of the two basic converters. The buck converters are used forstepping down the voltage whereas the boost converters are used for stepping up. Buck-boost converteris used for both step up and down conversion. Cuk and SEPIC converters are also used for both step upand down conversion.
5. SEPIC Converter
Single-ended primary-inductor converter (SEPIC) is a type of converter that allows the electricalpotential i.e. voltage at its output to be greater than or less than to that at its input. The output of theSEPIC converter is controlled by the duty cycle of the switch. The SEPIC converter exchanges energybetween the capacitors and inductors in order to convert from one voltage to another. The amount ofenergy exchanged is controlled by switch S. The energy to increase the current IL1 comes from theinput source. The power circuit of the SEPIC converter is presented in Fig. 1.
Fig. 1 Circuit diagram of SEPIC converterWhen the switch is on then switch acts like a short circuit, and the instantaneous voltage VCS isapproximately Vi, the voltage VL2 is approximately –Vi. Therefore, the capacitor CS supplies the energyto increase the magnitude of the current in IL2 and thus increase the energy stored in L2.When switch S is turned off, the current ICS becomes the same as the current IL1, since inductors do notallow instantaneous changes in current. The power is delivered to the load from both L2 and L1. CS,however is being charged by L1 during this off cycle, and will in turn recharge L2 during the on cycle.
The advantages of SEPIC converter:
The output voltage can be less than or greater than the input voltage. having non-inverted output i.e. the output voltage is of the same polarity as the input voltage. The output stage rectifier diode is used as a reverse blocking diode. the isolation between its input and output i.e. provided by a capacitor in series.
The disadvantages of SEPIC converter:
circuit complexity because two inductors and two capacitors are needed. There are two energy storage and transferring stages in this converter, which cause an extra
conduction loss in the switch.
APPLICATION OF DC-DC CONVERTERS
The different types of applications of the dc-dc converters are given below: Used in high performance dc drive systems like electric traction, electric vehicles and machine
tools. Used in radar and ignition systems. Used as photo voltaic arrays, fuel cells or wind turbines. Used in drivers where the breaking of dc motor is desired like transportation system with frequent
stops. In the utility ac grid as backup source of energy like battery pack. In uninterrupted power supplies to adjust the level of a rectified grid voltage to that of back up
source. In solar systems and in high brightness light emitting diodes.
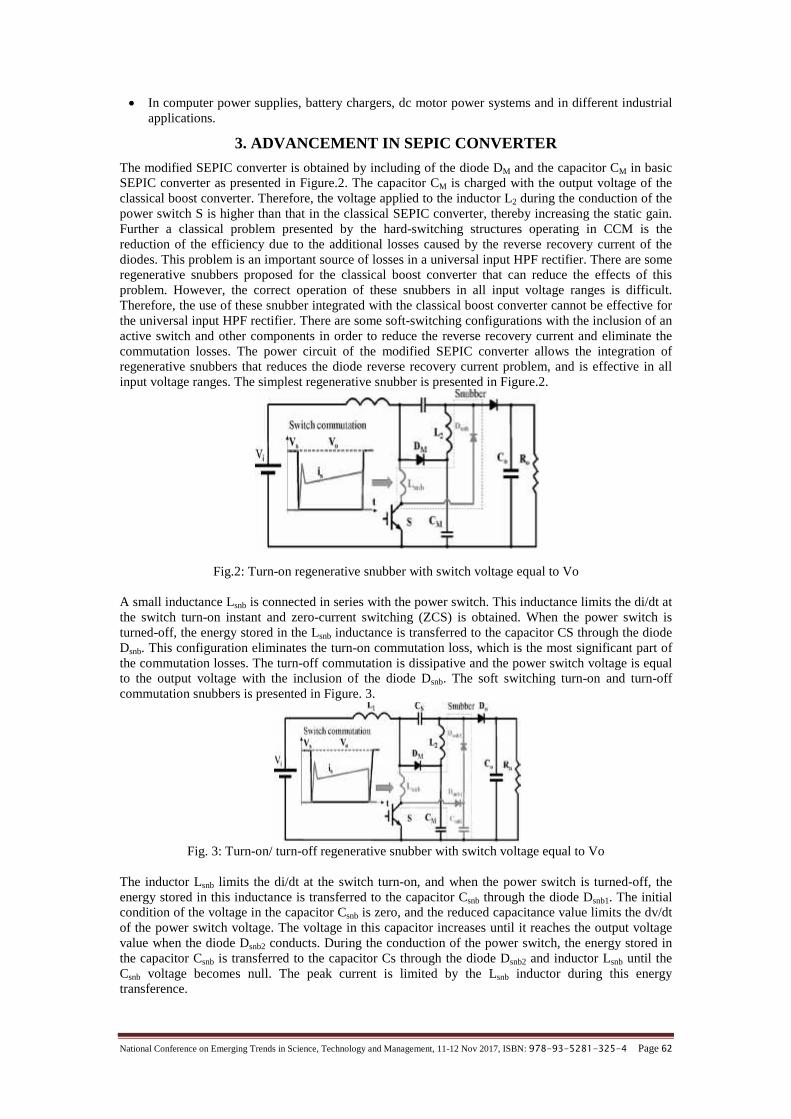
National Conference on Emerging Trends in Science, Technology and Management, 11-12 Nov 2017, ISBN: 978-93-5281-325-4 Page 62
In computer power supplies, battery chargers, dc motor power systems and in different industrialapplications.
3. ADVANCEMENT IN SEPIC CONVERTER
The modified SEPIC converter is obtained by including of the diode DM and the capacitor CM in basicSEPIC converter as presented in Figure.2. The capacitor CM is charged with the output voltage of theclassical boost converter. Therefore, the voltage applied to the inductor L2 during the conduction of thepower switch S is higher than that in the classical SEPIC converter, thereby increasing the static gain.Further a classical problem presented by the hard-switching structures operating in CCM is thereduction of the efficiency due to the additional losses caused by the reverse recovery current of thediodes. This problem is an important source of losses in a universal input HPF rectifier. There are someregenerative snubbers proposed for the classical boost converter that can reduce the effects of thisproblem. However, the correct operation of these snubbers in all input voltage ranges is difficult.Therefore, the use of these snubber integrated with the classical boost converter cannot be effective forthe universal input HPF rectifier. There are some soft-switching configurations with the inclusion of anactive switch and other components in order to reduce the reverse recovery current and eliminate thecommutation losses. The power circuit of the modified SEPIC converter allows the integration ofregenerative snubbers that reduces the diode reverse recovery current problem, and is effective in allinput voltage ranges. The simplest regenerative snubber is presented in Figure.2.
Fig.2: Turn-on regenerative snubber with switch voltage equal to Vo
A small inductance Lsnb is connected in series with the power switch. This inductance limits the di/dt atthe switch turn-on instant and zero-current switching (ZCS) is obtained. When the power switch isturned-off, the energy stored in the Lsnb inductance is transferred to the capacitor CS through the diodeDsnb. This configuration eliminates the turn-on commutation loss, which is the most significant part ofthe commutation losses. The turn-off commutation is dissipative and the power switch voltage is equalto the output voltage with the inclusion of the diode Dsnb. The soft switching turn-on and turn-offcommutation snubbers is presented in Figure. 3.
Fig. 3: Turn-on/ turn-off regenerative snubber with switch voltage equal to Vo
The inductor Lsnb limits the di/dt at the switch turn-on, and when the power switch is turned-off, theenergy stored in this inductance is transferred to the capacitor Csnb through the diode Dsnb1. The initialcondition of the voltage in the capacitor Csnb is zero, and the reduced capacitance value limits the dv/dtof the power switch voltage. The voltage in this capacitor increases until it reaches the output voltagevalue when the diode Dsnb2 conducts. During the conduction of the power switch, the energy stored inthe capacitor Csnb is transferred to the capacitor Cs through the diode Dsnb2 and inductor Lsnb until theCsnb voltage becomes null. The peak current is limited by the Lsnb inductor during this energytransference.

National Conference on Emerging Trends in Science, Technology and Management, 11-12 Nov 2017, ISBN: 978-93-5281-325-4 Page 63
4. CONCLUSIONS
The advancement in SEPIC dc-dc converter can be done with the use of snubber circuit. A theoreticalapproach for this improvement of SEPIC converter is presented in this paper which is very useful forhigh power factor rectifiers. Ac-dc conversion of electric power is widely used in different applicationslike as in adjustable-speed drives, switch-mode power supplies, uninterrupted power supplies, andutility interface with nonconventional energy sources such as solar Photovoltaic etc., battery energystorage systems, in process technology such as electroplating, welding units, etc., battery charging forelectric vehicles, and power supplies for telecommunication systems, measurement and testequipment’s. In the present time, SEPIC converters are widely used in various industrial andcommercial applications. These converters provide well controlled and regulated dc to dc conversion.These converters provide comfortable and flexible operation of the system. SEPIC converter basedproducts operate from batteries which benefits most from the wide ranging step down and step upoperating modes of the SEPIC topology. There is the requirement of large conversion rate in convertersfor many industrial applications.
REFERENCES
[1.] Gules, R., Santos, W.M., Annunziato, R.C., Romaneli, E.F.R. & Andrea, C.Q.(2011). A modified SEPICconverter with high static gain for renewable applications. Power Electronics Conference. 162 – 167.
[2.] Capua, G.D. & Femia, N.(2014). A Critical Investigation of Coupled Inductors SEPIC Design Issues.IEEE Transactions On Industrial Electronics. 61.
[3.] Axelrod, B. & Berkovich, Y.(2011). New coupled-inductor SEPIC converter with very high conversionratio and reduced voltage stress on the switches. Tele -communications Energy Conference. 1 – 7.
[4.] Veerachary, M.(2005). Power tracking for nonlinear PV sources with coupled inductor SEPIC converter.Aerospace and Electronic Systems, IEEE Transactions. 41, 1019 – 1029.
[5.] Hsiu, L., Kerwin, W., Witulski, A.F., Carlsten, R. & Ghotbi, R.(1992). A coupled-inductor, zero-voltage-switched dual-SEPIC converter with low output ripple and noise. Telecommunications EnergyConference. 186 – 193.
[6.] Axelrod, B. & Berkovich, Y.(2011). New coupled-inductor SEPIC converter with very high conversionratio and reduced voltage stress on the switches. Telecommunications Energy Conference.1 – 7.
[7.] Spiazzi, G. and Rossetto, L.(1994). High-quality rectifier based on coupled-inductor SEPIC topology.Power Electronics Specialists Conference. 336 – 341.
[8.] Adar, Rahav, G. & Ben-Yaakov, S.(1996). Behavioural average model of SEPIC converters withcoupled inductors. Electronics Letters. 32, 1525-1526.
[9.] Kamnarn, U. & Chunkag, V.(2005). Analysis and design of a parallel and source splitting configurationusing SEPIC modules based on power balance control technique. International Conference on IndustrialTechnology. 1415 – 1420.
[10.] Tuofu, L., Zhengshi, W., Jinyong, P., Zhenli, L. & Hao, M.(2013). Improved high step-up DC-DCconverter based on active clamp coupled inductor with voltage double cells. Industrial ElectronicsSociety, Annual Conference. 864 – 869.
[11.] Bonfa, V.A., Menegaz, P.J.M., Vieira, J.L.F. & Simonetti, D.S.L.(2002). Multiple alternatives ofregenerative snubber applied to SEPIC and Cuk converters. Industrial Electronics Society, AnnualConference. 1, 123 – 128.
[12.] Park, K.B., Seong, H.W., Kim, H.S., Moon, G.W. & Youn, M.J.(2008). Integrated boost- SEPICconverter for high step-up applications. Power Electronics Specialists Conference. 944 – 950.
[13.] Sarwan, S. & Rahim, N.A.(2011). Simulation of integrated SEPIC converter with multiplier cell forstandalone PV application. Clean Energy and Technology IEEE Conference. 213 – 218.
[14.] Dreher, J.R., Andrade, A.M.S.S., Schuch, L. & Martins, M.L.(2013). Extended methodology tosynthesize high step-up integrated DC-DC converters. European Conference on Power Electronics andApplications. 15, 1 – 10.
[15.] Sarwan, S. & Rahim, N.A.(2011). Simulation of integrated SEPIC converter with multiplier cell forstandalone PV application. IEEE First Conference on Clean Energy and Technology. 213 – 218.
[16.] Almeida, P.S., Soares, G.M., Pinto, D.P. & Braga, H.A.C.(2012). Integrated SEPIC buck-boostconverter as an off-line LED driver without electrolytic capacitors. Annual Conference on IEEEIndustrial Electronics Society. 38, 4551 – 4556.
[17.] Park, K.B., Moon, G.W. & Youn, M.J.(2010). Nonisolated High Step-up Boost Converter IntegratedWith SEPIC Converter. IEEE Transactions On Power Electronics. 25.
National Conference on Emerging Trends in Science, Technology and Management, 11-12 Nov 2017, ISBN: 978-93-5281-325-4 Page 64
REVIEW OF ARTIFICIAL INTELLIGENT BASEDMPPT FOR PV SYSTEMS
Saurabh Kumar, Shekhar YadavDepartment of Electrical Engineering
Madan Mohan Malaviya University of Technology, Gorakhpur, [email protected], [email protected]
Abstract - In the recent years, our main focus is to utilize the conventional source of energy (i.e.) Solar Cell.But due to its higher cost and maintenance researchers are trying to apply the power electronic devices toseek the higher efficiency power output and its better utilization. PV system should be traced at a pointcalled Maximum Power point to utilize the maximum power. As each and every technique has its ownmerits and demerit. So its proper review is necessary. In this paper, we compare the different artificialintelligent based maximum power point tracking methods. This paper will serve as a convenient literaturefor future researcher who will work on Artificial Intelligent based Maximum Power Point Tracking of PVcell.
Keywords— Photovoltaic system, MPPT, Fuzzy Logic Control, NN.
1. INTRODUCTION
The emerging economy of India is having world’s third largest producer of energy and fourth largestconsumer of electricity. The expected generation is 330 GW by July 2017. The two sources of energyare renewable and non-renewable, out of which renewable energy source generates only 30.8% of totalenergy. As the sun is the only ultimate source of energy on earth so to utilize the sun rays as the energywe use the photovoltaic (PV) cell which directly converts the solar radiation into electrical energy.Two words ‘Photo’ & ‘Voltaic’ combines together to form photovoltaic (PV) which means productionof electricity. The whole process of conversion of solar energy to electricity is carried out by PV arrayand power electronic devices which act as a converter to the whole system. As with increase indemand for electricity the cost of its generation, distribution and consumption are rising. Due to thisreason now a day’s people are trending towards the other energy sources i.e. solar energy.Due to the nonlinear characteristics of PV cell its dynamic and system behavior is greatly affected. Theoutput depends on the environmental conditions. The major disadvantage of PV cell is its powergeneration is not constant throughout the changing climate conditions. The output of PV array isgreatly affected due to the fluctuations in sun rays and uncertainty of PV array power generation. Asthere are large variations in the power density received at Earth’s surface during day to night andchange in seasons also. Due to this we need technologies that are outfitted with controller, converterand filters. With the equipped arrangements of PV system its cost of generation per unit also increasesand is not compatible to the consumers with the prices of grid electricity. Then also customers preferbuying the grid electricity due to its cheap cost. Average efficiency of PV array is only around 20%.The power depends on the two curves i.e. Voltage-Current (V-I) and Voltage-Power (V-P). The abovecurves are nonlinear in nature and they vary with the alteration in solar irradiance and temperature. Toenhance the performance of PV system it is essential to make the system operate near the MPP. The PVsystem must be operational with accurate MPPT technique and a controller. The point where it extractsthe maximum power on the curve is called the maximum power point (MPP). A complete mechanismis to be made to drag the operating point of PV system to MPP which must be ready with MPPTalgorithm next to DC/DC converter in the system. The work of MPPT technique is to determine thereference operating voltage and then after DC/DC converter makes the system work at that point. [1].
2. LITERARTURE REVIEW
Most of the MPPT techniques have been mentioned in the literature [2]-[7]. It’s been a commonquestion for researchers to select the appropriate technique foe particular application. Latest techniquessuch as Fuzzy logic, Genetic Algorithm, Artificial Neural Network (ANN), Particle SwarmOptimization (PSO), etc are been reviewed in this paper [8]. This paper includes a review of ArtificialIntelligent based MPPT techniques and its comparison is being done on the basis of theirimplementation, advantages, disadvantages, complexity of control variables etc.Latest application of solar has been invented. These are light based sensors used to track sun systemusing fuzzy controller [9]. Interconnection of domestic apparatus to electrical grid or PV array [10][11].Current estimation based on solar radiation [12]. Hybrid systems which are using solar energyintegrated with genetic algorithm [13].With the MPPT techniques classification from the surveyed papers [14] [15], control strategies can bedefined in three ways: Indirect control, Direct control and Probalistic control. The Indirect control has
National Conference on Emerging Trends in Science, Technology and Management, 11-12 Nov 2017, ISBN: 978-93-5281-325-4 Page 65
the feature that its MPPT is calculated by the PV generators data, solar irradiance, and mathematicalexpressions. It is calculated for only specified PV generators. They fail to track the MPP exactly. Theyare also known as “quasi seeking method”. Direct control has the advantage they offer the actual MPPfrom the PV generator data. They stand for any solar irradiance and temperature. They are also knownas “true seeking methods” [16].Trishan Esram et al. [17] have discussed many algorithm and methods to trace MPP for PV panel. Itcompares each technique and according to application each technique is being mentioned. It showedthat 19 methods have been introduced in the literature.
2.1. Fuzzy Logic based MPPT controllers
Chao et al. [18] have developed a MPPT controller based on fuzzy logic. Its implementation requirestwo stages DC-DC boost converter. Tracking the MPPT is done during its first stage and supply the DCbus with the required voltage for grid connection is done during its second stage.El Khateb et al. [19] proposed a new MPPT controller with SEPIC converter. Its experimentalvalidation is carried out by SEPIC DC-DC and 1-phase DC-AC converter.Larbes et al. [20] have developed a fuzzy logic based MPPT controller. In which its membership wasoptimized using Genetic Algorithm. The implementation of algorithm was done using FPGA andcompared with different MPPT algorithms.Boukenoui et al. [21] have developed a algorithm with two stage implementation. In first stagescanning and storing algorithm is used to locate the identified MPP is tracked. MPPT controller withfuzzy logic is implemented by using three membership functions to reduce the complexity of thesystem.
2.2. Artificial Neural Network based MPPT controllers
Kulaksiz et al. [22] have proposed Artificial Neural Network (ANN) based MPPT controller. The ANNwas trained using the database which was obtained experimentally. After, this Genetic algorithm (GA)was applied to track the ideal size of the ANN structure.Mancilla-David et al. [23] have proposed a low cost MPPT algorithm with irradiance sensor. Thedatabase for training the ANN was obtained using a mathematical model of PV cell. The ANN aftertraining provides the required value of voltage and irradiation.Jiang et al. [24] have proposed a hybrid MPPT controller with combination of ANN and Perturb &Observe (P&O). ANN is used here to predict the region of MPP and P&O is applied to trace the MPP.ANN is used to predict the MPP voltage.
2.3. Genetic Algorithms based MPPT controllers
Shaiek et al. [25] have proposed GA based MPPT controller. GA was directly used to track the MPP.Duty cycles limit is being set and then GA is applied till MPP is reached.Daraban et al. [26] have proposed MPPT technique which uses P&O algorithm in GA structure. Eachone has its different function. They carry information of reference voltage, direction & the step value. .By controlling the PV output voltage GA is directly applied.
2.4. Particle Swarm Optimization based MPPT controllers
Liu et al. [27] have proposed a MPPT algorithm based on modified PSO. Parameter is not defined as ofstandard PSO. Here they are defined by linearly varying function with respect to sampling time for risein convergence. Ishaque et al. [28] have introduced various improvements to standard MPPT PSOalgorithm with the use of Hill Climbing which makes the better accuracy of tracking of MPP. Lian etal. [29] have introduced a hybrid MPPT algorithm which was combination of P&O & PSO methods. Instarting P&O is used to track local maximum. From this point PSO is applied to locate the exact MPP.Sundareswaran et al. [30] have proposed an algorithm which was combination of PSO & PSOtechniques. In starting PSO is used to track the MPP & then P&O is used for further MPP tracking.Mirhassani et al. [31] have proposed a PSO algorithm which was implemented using variable samplingtime to increase the speed of tracking. Selection of sampling time is based on current behavior ofconverter. Seyedmahmoudian et al. [32] have proposed a hybrid MPPT technique combination of PSO& Differential equation (DE). It shows advantage in tracking under the partial shading condition.Implementation of PSO is done using indirect control. Reduction in time which was wasted during theexploring phase is done with the help of adaptive sampling time strategy.Miyatake et al. [33] have presented the division of PV array into small number of arrays which madeeach array have its own converter for controlling. Due to this power loss is more as increase in PVmodule makes the characteristics uneven isolation. As of two arrays one is more illuminated than the

National Conference on Emerging Trends in Science, Technology and Management, 11-12 Nov 2017, ISBN: 978-93-5281-325-4 Page 66
other the current generation by the first one will be more than the second. This excess current passesthrough bypass diode in presence of two MPPs. Besides the above mentioned techniques there aresome more techniques based on artificial bee colony algorithm [34], Ant colony optimization [35],Cuckoo search [36] & Colony of flashing fireflies algorithm [37]. AI based MPPT techniques byvarious researchers are summarized in this paper. On a general criterion it is not possible to explain allthe methods in detail as their system and climatic conditions all are different [38].
3. CONCLUSION
Availability of solar energy has reduced environmental hazards and energy demand. The huge changesthat are being involved in enhancing the MPPT algorithms have also increased the domestic generationusing solar array. AI based MPP trackers using FLC, ANN, GA etc are being reviewed in this paper onthe basis of available literature. As we are comparing only with the theoretical literature we have, so itis not possible to show the exact difference between them as with the experiment data. Differentalgorithms work with different system such as their arrangement or the control strategy is totallydifferent from any other used before. According to different applications of PV array differentalgorithms are being preferred. For higher temperature and isolation levels, FLC works better than anyother for extraction of power. Converters such as buck, boost, buck-boost, cuk are used in the MPPTcontrollers. As there is a very large development in the accuracy of MPPT techniques they can help inpower generation at domestic level. Each MPPT technique has its own pros and cons. The concludingdiscussion for AI based MPPT technique can be served better from the discussion above.
4. FUTURE SCOPE
In future there can be a change in design of MPPT controller so that it can help in tracking morenumber of input parameters which are altering with respect to time. For getting more accurate MPPTpoint the mathematical algorithm such as Z- infinity can be implemented. Future work can also be doneconsidering the low switching frequency for the DC/DC converter. In case of grid-inverter system ifgrid fails the generation also stops and consumer are not able to get the electricity even if PVgeneration is going on, work must be carried on this to solve this major problem.
REFERNCES[1.] Subudhi, Bidyadhar, and Raseswari Pradhan. "A comparative study on maximum power point tracking
techniques for photovoltaic power systems." IEEE transactions on Sustainable Energy 4.1 (2013): 89-98.
[2.] Mastromauro, Rosa A., Marco Liserre, and Antonio Dell'Aquila. "Control issues in single-stagephotovoltaic systems: MPPT, current and voltage control." IEEE Transactions on IndustrialInformatics 8.2 (2012): 241-254.
[3.] Subudhi, Bidyadhar, and Raseswari Pradhan. "Characteristics evaluation and parameter extraction of asolar array based on experimental analysis." Power Electronics and Drive Systems (PEDS), 2011 IEEENinth International Conference on. IEEE, 2011.
[4.] Usta, M. A., O. Akyaszi, and I. H. Atlas. "Design and performance of solar tracking system with fuzzylogic Controller." Sixth International Advanced Technologies Symposium (IATS’11), Elazig, Turkey,May16-18. 2011.
[5.] Iqbal, A., H. Abu-Rub, and Sk M. Ahmed. "Adaptive neuro-fuzzy inference system based maximumpower point tracking of a solar PV module." Energy Conference and Exhibition (EnergyCon), 2010IEEE International. IEEE, 2010.
[6.] Femia, N., et al. "Optimized one-cycle control in photovoltaic grid connected applications." IEEETransactions on Aerospace and Electronic Systems 42.3 (2006).
[7.] Pongratananukul, Nattorn. "Analysis and simulation tools for solar array power systems." (2005).[8.] Kermadi, Mostefa, and El Madjid Berkouk. "Artificial intelligence-based maximum power point
tracking controllers for Photovoltaic systems: Comparative study." Renewable and Sustainable EnergyReviews 69 (2017): 369-386.
[9.] Usta, M. A., O. Akyaszi, and I. H. Atlas. "Design and performance of solar tracking system with fuzzylogic Controller." Sixth International Advanced Technologies Symposium (IATS’11), Elazig, Turkey,May16-18. 2011.
[10.] Khatib, Tamer TN, et al. "An efficient maximum power point tracking controller for photovoltaicsystems using new boost converter design and improved control algorithm." WSEAS Transactions onpower systems 5.2 (2010): 53-63.
[11.] López-Lapeña, Oscar, Maria Teresa Penella, and Manel Gasulla. "A new MPPT method for low-powersolar energy harvesting." IEEE Transactions on Industrial Electronics 57.9 (2010): 3129-3138.
[12.] Amrouche, B., M. Belhamel, and A. Guessoum. "Artificial intelligence based P&O MPPT method forphotovoltaic systems." Revue des Energies Renouvelables ICRESD-07 Tlemcen (2007): 11-16.
[13.] Rodriguez, Cuauhtemoc, and Gehan AJ Amaratunga. "Analytic solution to the photovoltaic maximumpower point problem." IEEE Transactions on Circuits and Systems I: Regular Papers 54.9 (2007): 2054-2060.

National Conference on Emerging Trends in Science, Technology and Management, 11-12 Nov 2017, ISBN: 978-93-5281-325-4 Page 67
[14.] Mastromauro, Rosa A., Marco Liserre, and Antonio Dell'Aquila. "Control issues in single-stagephotovoltaic systems: MPPT, current and voltage control." IEEE Transactions on IndustrialInformatics 8.2 (2012): 241-254.
[15.] Subudhi, Bidyadhar, and Raseswari Pradhan. "Characteristics evaluation and parameter extraction of asolar array based on experimental analysis." Power Electronics and Drive Systems (PEDS), 2011 IEEENinth International Conference on. IEEE, 2011.
[16.] Salas, V., et al. "Review of the maximum power point tracking algorithms for stand-alone photovoltaicsystems." Solar energy materials and solar cells 90.11 (2006): 1555-1578.
[17.] Esram, Trishan, and Patrick L. Chapman. "Comparison of photovoltaic array maximum power pointtracking techniques." IEEE Transactions on energy conversion 22.2 (2007): 439-449.
[18.] Chao, Paul C-P., Wei-Dar Chen, and Chih-Kuo Chang. "Maximum power tracking of a genericphotovoltaic system via a fuzzy controller and a two-stage DC–DC converter." Microsystemtechnologies 18.9-10 (2012): 1267-1281.
[19.] El Khateb, Ahmad, et al. "Fuzzy-logic-controller-based SEPIC converter for maximum power pointtracking." IEEE Transactions on Industry Applications 50.4 (2014): 2349-2358.
[20.] Chekired, F., et al. "Intelligent maximum power point trackers for photovoltaic applications using FPGAchip: A comparative study." Solar Energy 101 (2014): 83-99.
[21.] Boukenoui, R., et al. "A new intelligent MPPT method for stand-alone photovoltaic systems operatingunder fast transient variations of shading patterns." Solar Energy 124 (2016): 124-142.
[22.] Kulaksız, Ahmet Afşin, and Ramazan Akkaya. "A genetic algorithm optimized ANN-based MPPTalgorithm for a stand-alone PV system with induction motor drive." Solar Energy 86.9 (2012): 2366-2375.
[23.] Mancilla-David, Fernando, et al. "A neural network-based low-cost solar irradiance sensor." IEEETransactions on Instrumentation and Measurement 63.3 (2014): 583-591.
[24.] Jiang, Lian Lian, et al. "A hybrid maximum power point tracking for partially shaded photovoltaicsystems in the tropics." Renewable Energy 76 (2015): 53-65.
[25.] Shaiek, Yousra, et al. "Comparison between conventional methods and GA approach for maximumpower point tracking of shaded solar PV generators." Solar energy 90 (2013): 107-122.
[26.] Daraban, Stefan, Dorin Petreus, and Cristina Morel. "A novel MPPT (maximum power point tracking)algorithm based on a modified genetic algorithm specialized on tracking the global maximum powerpoint in photovoltaic systems affected by partial shading." Energy 74 (2014): 374-388.
[27.] Liu, Yi-Hwa, et al. "A particle swarm optimization-based maximum power point tracking algorithm forPV systems operating under partially shaded conditions." IEEE Transactions on Energy Conversion 27.4(2012): 1027-1035.
[28.] Ishaque, Kashif, et al. "An improved particle swarm optimization (PSO)–based MPPT for PV withreduced steady-state oscillation." IEEE transactions on Power Electronics 27.8 (2012): 3627-3638.
[29.] Lian, K. L., J. H. Jhang, and I. S. Tian. "A maximum power point tracking method based on perturb-and-observe combined with particle swarm optimization." IEEE journal of photovoltaics 4.2 (2014): 626-633.
[30.] Sundareswaran, K., and S. Palani. "Application of a combined particle swarm optimization and perturband observe method for MPPT in PV systems under partial shading conditions." Renewable Energy 75(2015): 308-317.
[31.] Mirhassani, Seyed Mohsen, et al. "An improved particle swarm optimization based maximum powerpoint tracking strategy with variable sampling time." International Journal of Electrical Power &Energy Systems 64 (2015): 761-770.
[32.] Seyedmahmoudian, Mohammadmehdi, et al. "Simulation and hardware implementation of newmaximum power point tracking technique for partially shaded PV system using hybrid DEPSOmethod." IEEE transactions on sustainable energy 6.3 (2015): 850-862.
[33.] Miyatake, Masafumi, et al. "A Novel maximum power point tracker controlling several convertersconnected to photovoltaic arrays with particle swarm optimization technique." power electronics andapplications, 2007 European conference on. IEEE, 2007.
[34.] Soufyane Benyoucef, Abou, et al. "Artificial bee colony based algorithm for maximum power pointtracking (MPPT) for PV systems operating under partial shaded conditions." Applied Soft Computing 32(2015): 38-48.
[35.] Jiang, Lian Lian, Douglas L. Maskell, and Jagdish C. Patra. "A novel ant colony optimization-basedmaximum power point tracking for photovoltaic systems under partially shaded conditions." Energy andBuildings 58 (2013): 227-236.
[36.] Ahmed, Jubaer, and Zainal Salam. "A Maximum Power Point Tracking (MPPT) for PV system usingCuckoo Search with partial shading capability." Applied Energy 119 (2014): 118-130.
[37.] Sundareswaran, Kinattingal, Sankar Peddapati, and Sankaran Palani. "MPPT of PV systems under partialshaded conditions through a colony of flashing fireflies." IEEE Transactions on Energy Conversion 29.2(2014): 463-472.
[38.] Kermadi, Mostefa, and El Madjid Berkouk. "Artificial intelligence-based maximum power pointtracking controllers for Photovoltaic systems: Comparative study." Renewable and Sustainable EnergyReviews 69 (2017): 369-386.

National Conference on Emerging Trends in Science, Technology and Management, 11-12 Nov 2017, ISBN: 978-93-5281-325-4 Page 68
MODES OF DRUG DELIVERY SYSTEM TO BRAINSutrishna Sen, Parmar Keshri Nandan
Department of BiotechnologyAshoka Institute of Technology and Management
[email protected], [email protected]
Abstract - With the advent of new technologies and researches in the field of medicines and therapy, morefocus is being given on cost effective and easy treatment of various diseases. It is not always necessary toreplace an old drug with a new one for better results, rather the modern approach is to modify the old drugin such a way that the therapeutic effect is increased and to carry out this, we have to concentrate on theformulations of the drug being used, the biochemical properties of the components of the drug and the routeinside the body which takes the drug to the target site. So the composition of the drug must be carefullydecided and the route must be designed in such a way that the properties of the drug remain unaltered andthe desired therapeutic benefit is obtained. The routes discovered in turn depend on the organ or body partbeing targeted, among which targeting brain is most difficult because of the natural protection system thatsafeguards this organ. This is the main reason why curing the brain or nervous system related diseases isstill challenging. Researchers are working hard in this area to provide better treatment options for neuraldisorders and other diseases including brain tumor. This review work is focused on drug delivery systemsassociated with brain. Recently use of nanobiotechnology for drug delivery to brain is gathering muchattention, although more new approaches like shuttle vectors are also being used for the same.
Key words: Therapeutic effect, Drug delivery, Nanobiotechnology, Shuttle vectors
1. INTRODUCTION
The process of administration of pharmaceutical compounds in humans or animals with an objective ofsingle or multiple therapeutic effects is called drug delivery. Various types of delivery systems havebeen discovered and various routes have been chosen for the effective and controlled delivery of thedrug, the selection of the system and route being dependent on the target cell or organ or body part,desired therapeutic benefit and the type of biochemical compound which is the drug itself. A commonexample of drug delivery can be immunization-in which protein drugs are often introduced into bodyby injection. One thing that must be kept in mind during and after the process of delivery is that thewhole operation must be safe and shouldn't involve any unwanted or harmful side effect. Nowadays themost challenging area in this field is the delivery of drug to brain-the obstacles being Blood BrainBarrier (BBB), blood cerebrospinal fluid barrier and blood tumor barrier. The drugs targeted to thebrain either fail to reach the target site properly or lack adequate absorption due to these natural barrierswhich safeguards the brain as reported by Chatterjee in 'Nose to brain drug delivery : A recent update.Gaurav Tiwari et al. reported that nasal and pulmonary routes for the drug delivery have been proved tobe better than the conventional or oral routes for peptide or protein drugs to be administered in humans.Several researches are going on in this area and new ideas are being proposed.
2. DRUG DELIVERY TO BRAIN
For the delivery of a drug molecule to brain, several routes have been proposed and severalformulations have been decided for the same too. Intraventricular or intrathecal drug delivery andintranasal or naso-mucosal drug delivery routes are used normally. The delivery systems includecolloidal drug carriers like micelles and liposomal carriers and most extensively used nanoparticles.
Fig. 1: Different types of nanocarriers used for drug deliveryNaso-mucosal route has been the preferred route for a variety of reasons. It does not imply that it doesnot have any disadvantage. The things to be pondered upon include-
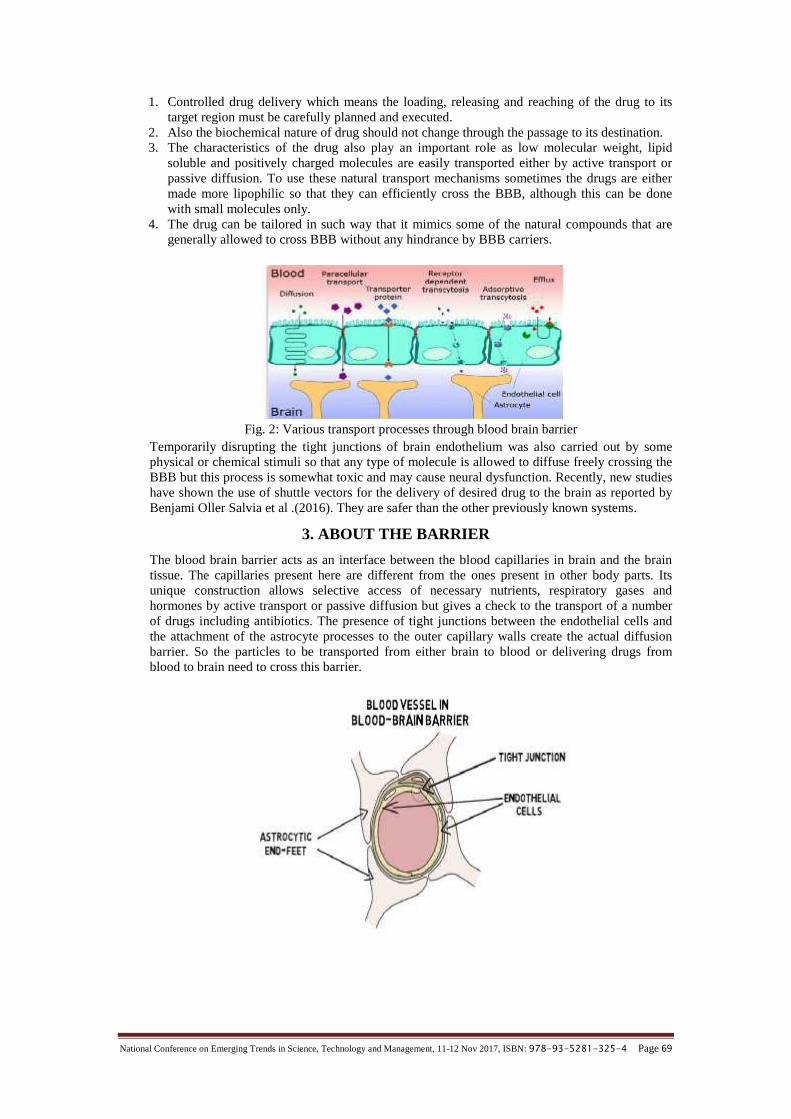
National Conference on Emerging Trends in Science, Technology and Management, 11-12 Nov 2017, ISBN: 978-93-5281-325-4 Page 69
1. Controlled drug delivery which means the loading, releasing and reaching of the drug to itstarget region must be carefully planned and executed.
2. Also the biochemical nature of drug should not change through the passage to its destination.3. The characteristics of the drug also play an important role as low molecular weight, lipid
soluble and positively charged molecules are easily transported either by active transport orpassive diffusion. To use these natural transport mechanisms sometimes the drugs are eithermade more lipophilic so that they can efficiently cross the BBB, although this can be donewith small molecules only.
4. The drug can be tailored in such way that it mimics some of the natural compounds that aregenerally allowed to cross BBB without any hindrance by BBB carriers.
Fig. 2: Various transport processes through blood brain barrierTemporarily disrupting the tight junctions of brain endothelium was also carried out by somephysical or chemical stimuli so that any type of molecule is allowed to diffuse freely crossing theBBB but this process is somewhat toxic and may cause neural dysfunction. Recently, new studieshave shown the use of shuttle vectors for the delivery of desired drug to the brain as reported byBenjami Oller Salvia et al .(2016). They are safer than the other previously known systems.
3. ABOUT THE BARRIER
The blood brain barrier acts as an interface between the blood capillaries in brain and the braintissue. The capillaries present here are different from the ones present in other body parts. Itsunique construction allows selective access of necessary nutrients, respiratory gases andhormones by active transport or passive diffusion but gives a check to the transport of a numberof drugs including antibiotics. The presence of tight junctions between the endothelial cells andthe attachment of the astrocyte processes to the outer capillary walls create the actual diffusionbarrier. So the particles to be transported from either brain to blood or delivering drugs fromblood to brain need to cross this barrier.

National Conference on Emerging Trends in Science, Technology and Management, 11-12 Nov 2017, ISBN: 978-93-5281-325-4 Page 70
Fig 3: Schematic illustration of the capillaries in brainThe tight junctions between capillary endothelial cells in the brain and between the epithelial cells inthe choroid plexus form the blood brain barrier. Water CO2 and O2 penetrate the brain with ease, as dothe lipid-soluble free forms of steroid hormones, whereas their protein bound forms and in general, allproteins and polypeptides do not. A variety of drugs and peptides actually cross the cerebral capillariesbut are promptly transported back into the blood by a multidrug nonspecific transporter in the apicalmembranes of endothelial cells called as P-glycoprotein (A member of ATP binding cassettes).However, Blood Brain Barrier is deficient at four sites:
[1.] The posterior pituitary and the adjacent part of the median eminence.[2.] The area postrema (chemoreceptor trigger zone) of medulla.[3.] Organum vasculosum of the lamina terminalis (OVLT).[4.] Subfornical organ (SFO).
These areas are referred as circumventricular organs. Since these areas are deficient in blood brainbarrier so any drug reaching the systemic circulation can also reach to these areas and unintentionallycause some harmful effect in these sites.
4. FACTORS AFFECTING DRUG DELIVERY TO BRAIN
There are so many factors which affect the delivery of drug to the brain apart from the ones alreadymentioned above. These factors can be categorized as the following:Patient related: The physical and physiological state of the patient is the primary thing on which drugdelivery will depend, for example:
1. On the basis of age: Whether the patient is in neonatal stage or is a child or from old age group2. On the basis of gender: The drug to be delivered also varies on gender basis and for male and
female it may have some differences in action and effect.3. Condition of patient: The immunological state of the patient is another major determinant, -if
the patient is in a disease free stable state or in some diseased state which makes him/herphysically unstable.
4. Personalized medicine: This is a modern approach popular in many of the western countriesfor providing better treatment options to people. Each person or individual is treated in a uniqueway after examining their medical history, genetic makeup and getting every tiny detail aboutthe person’s health. This helps the doctor in giving each individual a different line of treatmentwhich will be best in curing the problem for that person.
Drug related: There are some drug related factors which determine the capability of the drug like lipidsolubility which is necessary to cross the blood brain barrier, the pka of the drug, which will determinethe pH in which the drug can act most effectively.
5. CHALLENGES
Despite of the advancements and introduction of new techniques and methods, drug delivery to brain isstill a challenging area. The routes and techniques devised so far have some major limitations. Forexample, the naso-mucosal route has its own limitations as cited by Chatterjee (2017), that the lowabsorption or hindered absorption of drug and less retention time in the area of application aredisadvantageous. Also there is always the chance of unwanted irritation and infection due to thecomponents present in the drug, there may be uneven distribution of the drug in various parts of brainor CNS, the physical well being of the patient is another determinant as blockage in the nasal passagedue to cold can cause problems and the patient may find it difficult to apply the drug at right place,-these are some of the limitations associated with the nasal route.

National Conference on Emerging Trends in Science, Technology and Management, 11-12 Nov 2017, ISBN: 978-93-5281-325-4 Page 71
Although the shuttle vectors have made possible some better alternatives as reported by Benjami OllerSalvia et al. (2016), but they need to be more selective, stable and with better transport abilities to crossthe endothelial boundary more effectively.The matter of drug toxicity is also to be kept in mind which means apart from its therapeutic effect if itis also causing any undesired harm. Moreover drug safety issues are something to be concerned aboutwhich means how safe and wider applicability the drug has because brain is a delicate organ and anyunwanted negative impact can risk the patient’s well being.
6. FUTURE SCOPE
Nasal drug delivery to brain with the help of nanoparticle carriers has provided a promising alternativefor drug delivery to brain. A lot more work has to be done in this field in devising new formulationsthat would cause less toxicity, better absorption of the drug and also in understanding the route fromthe area of application or introduction of the drug to its target site.
7. CONCLUSION
Despite being a usable alternative pathway for drug delivery, nasal administration of drug needs moreimprovements and researches. Other alternatives can be associating the drug with some naturalmolecules that are allowed to cross the barrier without disruption, or the properties of the drugmolecule can be modified in such a way that it can bind to the carriers more easily and so can betransported more easily.
REFERENCES
[1.] Chatterjee B (2017) Nose to brain drug delivery: A recent update. Journal of Formulation Science andBioavailability.
[2.] Benjami Oller-Salvia et al. (2016) Blood brain barrier shuttle peptides: an emerging paradigm for braindelivery.Royal Society of Chemistry.
[3.] Patel JP, Frey BN (2015) Disruption in the blood brain barrier: the missing link between brain and bodyinflammation in bipolar disorder Neural Plasticity.
[5.] Rankovic Z (2015) CNS Drug Design: Balancing physicochemical properties for optimal brain exposure.Journal of Medicinal Chemistry.
[6.] Illum L (2003) Nasal Drug delivery possibilities, problems and solutions. Journal of Controlled Release.[7.] Ozsoy Y, Gungor S, Cevher E (2009) Nasal delivery of high molecular weight drug molecules.[8.] Pardridge WM (2016) CSF, Blood-brain barrier, and brain drug delivery. Expert opinion on drug delivery.[9.] BickerJ, AlvesG, Fortuna A, Falcao A (2014) Blood brain barrier models and their relevance for a
successful development of CNS drug delivery systems: A Review. European Journal of Pharmaceuticalsand Biopharmaceuticals.
[10.] Boche M, Pokharkar V (2016) Quetiapine Nanoemulsion for intranasal drug delivery: Evaluation of braintargeting efficiency.
[11.] Pardeshi CV, Belgamwar VS (2013) Direct nose to brain drug delivery via integrating nerve pathwaysbypassing the blood brain barrier: an excellent platform for brain targeting.
[12.] Gartziandia O, et al. (2016) Nanoparticle transport across in-vitro olfactory cell monolayers. InternationalJournal of Pharmaceutics.
[13.] Upadhyay RK (2014) Drug delivery systems, CNS protection and the blood brain barrier.
National Conference on Emerging Trends in Science, Technology and Management, 11-12 Nov 2017, ISBN: 978-93-5281-325-4 Page 72
EFFECT OF DIGI MARKETING ON GEN NEXTCUSTOMERS: A STUDY ON MILLENIALS 1980-2017
Anshuman RanaTeaching Associate (Communications), Indian Institute of Management (IIM) Ahmedabad.
PhD Research Scholar, Centre for Diaspora Studies, Central University of Gujarat.Gandhinagar, Gujarat, India.
E-mail: [email protected] Singh
PhD Research Scholar, Centre for Diaspora Studies, Central University of Gujarat,Gandhinagar, Gujarat, India.
E-mail: [email protected]
Abstract—This research paper discusses social media marketing or social networking as a new tool ininformation management. India’s dream project is ‘Digital India’ i.e. to provide consumers Power toempower and get everything in one touch. Digital advertising hence has become a new sensation whichdrags consumers into world of advertisements. In this digital age, we have opportunity to change lives ofpeople which was hard to imagine couple of years back. The main aim of this study is identifying consumerbehavior and impact of digital advertising on Millennials. This study is based on primary data collectedfrom 50 women candidates in Ahmedabad city with focused group discussion and interview method. Now-adays, women balance both home and work and, they have less time to make purchase decision. Digitaladvertising on social media helps them to take decision regarding purchase of goods and services.
Keywords—Digital Advertising, Women customers, Impact and attitude.
1. INTRODUCTION
Emergence of social media has brought subsequent change in the trend of consumption and consumerbehavior. The development of Internet and increased use of mobile phones and interactive contentsprovided by social media sites such as Twitter, Facebook and Instagram have affected the buyingpattern of consumers on a large scale. Digital India campaign has given Power to Empower and everycitizen is blessed to search any content globally. There is positive impact on people living in rural aswell as urban areas and it benefit both young and old. Social media has made access in probablyeveryone’s life. Today advertising has transformed to digital advertising to reach all kind of customersand it is in fact a viral trend. In 2016 India has become the second largest internet users throughout theworld. Everyone is rushing towards digital advertising. People prefer more online sites like Myntra,Amazon, Flipkart or Snapdeal and they have become a billion Industry. Digital Marketing hasinfluenced the people to buy and sell online. Past 10 years has seen tremendous growth in digitaladvertising. Companies are spending more and more in Digital advertising as they are getting betterbenefits than compared to traditional advertising. Traditional advertising consists of mobile, televisionor radio advertising and modern advertising or digital advertising comes under the umbrella ofadvertising done on YouTube, email and social media platforms. The trend is to drag customersthrough medium of internet. Now-a-days getting feedback from customers is also speedy. Digitaladvertising has transformed the lives of consumers completely.
2. STATEMENT OF PROBLEM
In the era of Globalization Internet has become powerful medium of advertisement. Digi Advertisinghas emerged as new form of communication which is focused to persuade audience to purchaseproducts and services. Advertising on Internet is considered today important for economic growth. Butin our argument, this economic boom has certain social cost which exerts psychological pressures onthe mind of consumers. This is the foremost reason which led us to carry out this study to identify theeffect of Digi advertising on Gen Next customers.
2.1. Objectives
To Study the impact of digital advertising among millennials. To study the socio-economic profile of millennials. To identify consumers’ attitude and perception towards digital advertising.
3. REVIEW OF LITERATURE
This study aims to understand the differences between attitudes towards the mobile ads and socialmedia ads and now the recent form of digital advertisements. In “Attitudes towards Digital

National Conference on Emerging Trends in Science, Technology and Management, 11-12 Nov 2017, ISBN: 978-93-5281-325-4 Page 73
Advertisement by Gokhan Aydin that overall attitudes are negative towards both the mobile applicationadvertisement and social media advertisement. The study has concluded that among precursors ofattitudes, the perceived entertainment of the advertisements appeared to have strongest effect onattitude and credibility appeared to be second important factor.Millennials are the people who were born in late 1970-1990. They are also known as echo boomerswho are considered as stereotyped as ethnically diverse children of the computer age, they arecomfortable with digital communications and are untroubled by the generation gap1.Afrina Yasmin and Kaniz Fatema (2015) have made a study on the Effectiveness of Digital Marketingin the Challenging Age: An Empirical Study. The main objective of digital marketing is to attract thecustomers and allow them to interact with the brand through digital media. The study has explained theforms and advantages of digital marketing and its impact on sales. Companies now-a-days createinnovative customer experiences and specific strategies to drive the digital marketing performance.
4. RESEARCH METHODOLOGY
The data has been collected from 50 women consumers in Ahmedabad city of Gujarat State. Gujarat ishighly developing State of India. The observations of women consumers have been collected throughthe help of questionnaire, focused group discussions and interview method. Secondary data for thestudy have been collected from various publications in journals, magazines, books and websites. Thisstudy has been conducted in the month of September 2017.
5. ANALYSIS AND INTERPRETATION
Table 1 shows the classification of the respondents based on their age, educationalqualification, marital status, occupation and monthly income.
PARTICULARS NUMBER OF REPSONDENTS Age 18 to 20 years Age 21 to 23 years Above 23 years
241214
Educational Qualification Graduate Post Graduate Research Scholars Professionals
810824
Marital Status Married Unmarried
2327
Occupation Self Employed Housewife Private employees Govt Job
144810
Residential Area Rural Urban
3614
Total 501Times of India report
48 percent of respondents are between 18 to 24 years. 48 percent of respondents are professionals and54 percent of respondents are married. 28 percent of the total respondents are self-employed, and 76percent are living in the urban areas.
Digital advertising sites No. of RespondentsTraditional advertising
Mobile Advertising 21Television Advertising 30
Radio Advertising 6Internet channel Advertising
E-mail Advertising 38Content Advertising 9
Social Media Advertising 50Display Advertising 44Search Advertising 6
Website Advertising 12
National Conference on Emerging Trends in Science, Technology and Management, 11-12 Nov 2017, ISBN: 978-93-5281-325-4 Page 74
During computation of data it was found that 44 percent of respondents are using internet throughmobile phone and rest are using medium like tablets and laptops. 58 percent of the total respondent’saccess internet whenever they have time and 46 percent of the respondents have been using internet forabove 6 or more years. 50 percent of the respondents use internet on daily basis and 28 percent areusing for the purpose of seeking personal information, work, education, entertainment and shoppingand 50 percent of respondents use Google Chrome for browsing.It was found that 100 percent of users are attracted to social media advertising, 85 to displayadvertising and 75 to email advertisement. 60 percent of respondents even consider televisionadvertisement to be effective and 42 percent are attracted to mobile advertisement and rest 18 and 24percent are attracted to content of radio and website advertising.Through interview and focused group discussions it was found that Digi advertisements are more ableto capture attention of customer very quickly, they give demo of the product through advertisement,have wide reach, can identify the product and are visually appealing, helps consumers in effortlessdecision-making process, choosing of alternatives becomes much more easier and quality assurance inalso given.It was found that respondents found Digi Advertisement to be very essential as they had easy access ofinformation, could give feedback about the products. Could identify the branded products? Theadvertisements were more attractive. Could view product advertisement and specification, decisionmaking process was much easier and they were able to evaluate post purchase behavior. DigitalAdvertisement made consumers aware of discount sale too.It is noteworthy to find out that respondents consider digital advertising as innovative, transparent, andconvenient, they get quality of information and they get clear product information and buildtrustworthiness. From the computed data it was found those age groups of 18 to 20 years have highlevel of impact towards digital advertising. The level of impact of digital advertising does not differamong the respondents of different age groups. Hence the null hypothesis is accepted. The Millennialshave highest impact towards digital advertising i.e. 36 percent and they differ significantly on the basisof educational qualification hence null hypothesis is rejected. The equations are an exception toSuggestions Trustworthiness about quality of information should be increased. Product information should be more reliable for consumers to make decisions. Social media should not promote fake or duplicate products. Content advertising should be reached to consumers. Display advertising annoys the consumers during surfing the internet.
6. CONCLUSION
From the above research study, the women customers are now shifting they’re in view towards digitaladvertisement and they think it is very essential for them to make correct decision with the assist ofdigital advertisement. Digital advertisement gives detail knowledge about product information, demo,offers and discount and it also provide information and offer about previous search make in onlineshopping sites that motives customer to buy product/services. Now-a-days, women are balancing bothhome and work life there are less space for them to spend time to make purchases decisions.
REFERENCES[1.] Gokhan Aydin “Attitudes towards Digital Advertisements: Testing Differences between Social Media
Ads and Mobile Ads”, International Journal of Research in Business Studies and Management, Volume3, Issue 2, February 2016, pp,1-11.
[2.] Afrina Yasmin, Sadia Tasneem and Kaniz Fatema “Effectiveness of Digital Marketing in theChallenging Age: An Empirical Study”, International Journal of Management Science and BusinessAdministration, Vol 1. No 5. , April 2015., ISSN 1849-5419 (print), pp. 69-80.

National Conference on Emerging Trends in Science, Technology and Management, 11-12 Nov 2017, ISBN: 978-93-5281-325-4 Page 75
IMMUNOTHERAPY AND RECENT ADVANCEMENTSIN CANCER TREATMENT
Rashi SrivastavaDepartment of Biotechnology
Ashoka Institute of Technology and ManagementVaranasi, India
[email protected]. Pushpa Maurya
Department of BiotechnologyAshoka Institute of Technology and Management, Varanasi, India
Abstract—Cancer starts when cells grow out of control and crowd out normal cells (An uncontrolled growthand proliferation of the cells of body). This makes it hard for the body to work the way it should. Cancercan be treated very well in fact, more people than ever before lead full lives after cancertreatment.Immunotherapy harnessed the patient’s immune system to kill cancerous cell. CancerImmunotherapy is a promising method for the treatment of malignant neoplasm. For its furtherdevelopment and enhancement of its effectiveness it is important to understand the mechanisms of action ofeach type of immunotherapeutic agent as well as the ways tumors evade the surveillance of the immunesystem.This review gives deep information about types of immunotherapy and technological needs. It alsoinclude brief knowledge about strategies for cancer immunotherapy, vaccines and antigen selection,immune checkpoint blockade therapy, relation between drugs and immunotherapy and side effects ofimmunotherapy. We had written this paper for human welfare and for making them aware of myths whichare related with cancer immunotherapy. Combinations of the methods of activation of specific and non-specific immunity can be considered to be a promising direction in the development of tumorimmunotherapy. This approach helps not only effectively to destroy tumor cells in the body, includingmetastases, but can also considerably reduce the risk of recurrence of the disease, as a result of thedevelopment of Immunological memory.
IndexTerms — Cancer, tumor, immunotherapy, antibodies, virus, t-cells.
1. INTRODUCTION
Immunotherapy has great potential to treat cancer and prevent future relapse by activating the immunesystem to recognize and kill cancer cells. Despite their promise, much moreresearch is needed tounderstand how and why certain cancers fail to respond to immunotherapy and to predict whichtherapeutic strategies, or combinations thereof, are most appropriate for each patient. Cancerimmunotherapy harnesses the patient’simmune system to kill tumor cellsand prevent future relapse.Although the genetic signaturesof individual tumors can now be determined rapidly, which can helpidentifysmall-molecule targets for specifically killing these cells, successful Immunotherapydepends onthe host immune cells,the tumormicroenvironment, and many other featuresthat are not necessarilydirectly reflected inthe tumor’s genetic signature. New enabling technologies are needed to support,facilitate, and acceleratethe clinical translation of immunotherapy.
2. THETECHNOLOGICAL NEEDS
A. Rapid characterization of the tumor and itsImmune microenvironment at the timeofdiagnosis: Revealing the type of immune defense mechanisms that the tumor has createdwillhelp predict how the tumor willrespond to immunotherapy and thus helpguide patient-specifictherapeutic strategies.
B. New tools for treatment: New methods totarget specific tissues, cells, and intracellularprocessesin precise ways will allowfine-tuning of desired immune responses, improve the efficacy ofexisting and newimmunotherapies, and reduce toxicity andside effects. A wide variety oftechnologiesare being explored that enable cellular therapies, vaccines, antibodies, and smallmoleculesin clinical oncology.
C. Comprehensive assays for patient monitoring: Sensitive, accurate, and informationrichassaysthat determine the presence ofcancer byproducts and host immune responseswill allow cliniciansto more effectivelydetermine therapeutic response andallow treatment strategies to be fine-tunedand adapted during and after treatment.Reliable and ultrasensitive assays that detectthepresence of micrometastases (e.g.,circulating tumor cells, exosomes, and DNA)will allow routineand frequent testing aftertreatment and during remission, becausemetastatic relapse is the maincause of cancermortality. Inexpensive, noninvasive, and easy-to-use assays will allow morefrequent monitoringafter therapy as well as more frequentcancer screening for the generalpopulation. In the biomedical sector, theyhave devised imaging technologies for earlycancer

National Conference on Emerging Trends in Science, Technology and Management, 11-12 Nov 2017, ISBN: 978-93-5281-325-4 Page 76
diagnosis, polymers todeliver drugsto specific tissues, and diagnostics that canrapidly detectminute levels of a specificprotein.
3. STRATEGIES FOR CANCER IMMUNOTHERAPY
With traditional preventive vaccines against viral diseases like polio or influenza, the live or attenuatedvirus is injected with an adjuvant, or danger signal, which activates local dendritic cells (DCs) to takeup and process the viral antigens, mature and migrate to the draining lymph node (LN) via lymphaticvessels, present various peptide antigens on MHC molecules, and engage with and activate T cellsspecific forthese antigenic epitopes. The T cells, in turn, expand into short-lived effector and longlivedmemory populations, poised to rapidly respond on later antigen re-encounter. The vast success of suchvaccines depends in part on the foreign nature of the viral antigens to which the host immune system iscompletely naïve before vaccination. Preventive vaccines for cancers caused by chronic viralinfections, such as cervical and hepatocellular carcinoma (caused by human papilloma virus andhepatitis B virus, respectively), work this way: by preventing the viral infection from taking hold andbecoming chronic in the first place, they indirectly prevent those cancers [1, 2]. On the other hand,therapeutic cancer vaccination faces a number of challenges compared with preventive vaccines againstinfectious agents, due to the complex co-evolution of the tumor and the host immune response. Ofcourse, cancer cells are mutated “self,” and although the immune system can recognize the abundantmutated proteins common in cancer cells, often those with the highest avidity Tcell receptors (TCRs)have been deleted or compromised by central and peripheral tolerance mechanisms. Furthermore, thosetumors that do become recognized by the host immune system can build up a number of defensemechanisms that suppress effector functions of T cells and natural killer (NK) cells.
4. ONCOLYTIC VIRUS THERAPY
Oncolytic virus therapy uses genetically modified viruses to kill cancer cells. First, the doctor injects avirus into the tumor. The virus enters the cancer cells and makes copies ofitself. As a result, the cellsburst and die. As the cells die, they release specific substances called antigens. This triggers thepatient’s immune system to target all the cancer cells in the body that have those same antigens. Thevirus does not enter healthy cells.In October 2015, the U.S. Food and Drug Administration approvedthe first oncolytic virus therapy to treat melanoma. The virus used in the treatment is called talimogenelaherparepvec (Imlygic), or T-VEC. The virus is a genetically modified version of the herpes simplexvirus that causes cold sores [3]. The doctor can inject T-VEC directly into areas of melanoma that asurgeon cannot remove. Patients receive a series of injections until there are no areas of melanoma left.
4.1. T-Cell Therapy
T-cells are immune cells that fight infection. In T-cell therapy, some T cells are removed from apatient’s blood. Then, the cells are changed in a laboratory so they have specific proteins calledreceptors. The receptors allow those T cells to recognize the cancer cells. The changed T cells aregrown in large numbers in the laboratory and returned to the patient’s body. Once there, they seek outand destroy cancer cells. This type of therapy is called chimeric antigen receptor (CAR) T-cell therapy[3]. For gene-modified T-cell therapy, circulating T cells are isolated by apheresis and transduced witha specific CAR, composed of an intracellular antibody binding domain specific for tumor cell markersor fused to a cytoplasmic domain based on native TCRs, or with a TCR specific for defined tumorantigens before being transferred back to the patient. Such engineered T-cells were developed toovercome immune tolerance and to include mutated tumor-specific T-cells, which are otherwise notpresent in patients. CAR- and TCR-engineered T-cells are currently receiving extensive attention withthe recent denomination of “breakthrough status” from the FDA. Most T-cell therapies explored inclinical trials currently focus on leukemia and melanoma patients and include αβ T-cells, but other T-cells, including γδ and NK T-cells, are being investigated as well. Challenges in T-cell therapies

National Conference on Emerging Trends in Science, Technology and Management, 11-12 Nov 2017, ISBN: 978-93-5281-325-4 Page 77
include all of the technical and manufacturing challenges inherent to any cell therapy, as well asthesame issues described above related to vaccine therapies. When the domain recognized is specific toa particular cell type from which cancer cells derive, then the therapy can kill both cancer and normalcells. Such is the case with CAR T-cell therapies targeting CD19 in acute lymphoblastic leukemia, areceptor that is present on both leukemic cells and normal B cells [4]. Ongoing advances in designingCARs include modifications in their extracellular domain to recognize tumor cells and in theircytoplasmic domain to enhance both efficacy through potent signaling and safety through inclusion ofregulatory domains [4]. Engineering technologies have been developed to enhance T-cell therapies. T-cells harbor free thiols on their surface, which can be exploited for nanocarrier conjugation
5. VACCINES AND ANTIGEN SELECTION
Characterizing the antigenic repertoire for each tumor is a major challenge for developing personalizedvaccines. Most tumors are very heterogeneous in nature, due to high rates of mutation from genomicinstability along with numerous environmental selection pressures, including those resulting from thepatient’s past treatments and immune history. Most known and defined tumor antigens are self-antigens, which include (i) tissue differentiation antigens such as TRP-2, gp100, and Melan-A, whichare present in all melanocytes and thus in melanoma cells; (ii) over expressed antigens such assurviving, which is expressed in a number of cancers at a much higher level than in noncancerous cells;and (iii) cancer-testis antigens such as NY-ESO-1, which is expressed in a number of cancer cells but isnormally expressed only in germ-line cells and not normal somatic cells. However, all of these self-antigens carryrisks of off-target effects because other non-tumor cells can express them; for example,vaccination against TRP-2 in melanoma frequently results in vitiligo, i.e., autoimmunityof normalmelanocytes in the skin [5,6]. The selection of antigens for tumor immunotherapy is furthercomplicated by the tumor’s response to therapy. Antigen-specific immunotherapy places selectivepressure on the tumor, which in turn can down-regulate expression of those antigens (or even of MHCI) during immunotherapy. To avoid antigen selection, vaccines can contain multiple defined epitopesthat induce broader T-cell immunity; several multipeptide vaccines have already shown promisingclinical results [7, 8]. Furthermore, because central tolerance mechanisms often destroy those T cellswith the highest avidity to such self antigens, vaccine-induced effectors CD8+ T-cell responses againstself tumor antigens are oftenweak at best [8] As an alternative, neoantigens represent a new class ofunique tumor-specific antigensthat lack tolerance against them and that canbe recognized by tumor-infiltrating CD4+ helper [9] and CD8+ cytotoxic T cells [10–12]. Neoantigens arise from somaticmutationsthat make up the tumor mutanome (orcancer genome) and can be identified in tumorbiopsiesby cancer exome sequencingand bioinformatics analysis [13]. These neoantigensequences can then besynthesizedand incorporated in the design of patientspecificvaccines [11, 14]. On the otherhand,identifying neoantigens and developing theminto personalized vaccines is expensive andtime-consuming, and such vaccines muststill overcome the various mechanisms ofimmune suppression thatcoevolve with the tumor.Many therapeutic cancer vaccines in currenttrials include tumor-associatedantigensin the form of short peptides containingepitopes that bind to MHC I, which primeCD8+ T cellsto become cytotoxic and arecodelivered with different adjuvant formulations.More recently, longsynthetic peptides(LSPs) are being developed; these compriseboth MHC I and MHC II epitopes toadditionallyprime CD4+ T helper cells and yieldbroader, more effective immunity. For example, LSPsof HPV16 proteins E6 and E7 were included in the design of cancer vaccinetrials for cervical cancer.Such studies have shown promise and clinical trials arenow underway. Some vaccine strategies avoidthe need todefine or isolate tumor antigens altogether.One such strategy involves the deliveryofoncolytic viruses, which are viruses’ designedto specifically, infect tumor cells and leadtoimmunogenic cell death and subsequent releaseof both the (viral) antigens, which areexpressed onlyin the tumor cells, as well asantigens enriched in tumor cells [15]. In thisway, the immune responses tothe viral proteincreates immunity that can spread totumor-specific antigens even in tumor cellsthat havenot been infected by the virus. Suchstrategies are being pursued in preclinicalstudies and in clinicaltrials for a variety of tumor types [16]. Engineers are contributing to vaccine designthroughdevelopment of nanomaterialsand other biomolecular complexes to targetDCs in specific locations aswell as to directantigen processing within the cell to inducestrong CD8+ T-cell immunity, leadingtogeneration of abundant cytotoxic T lymphocyte(CTL) responses. They are also usingsuchnanomaterials to blunt immune suppressivemechanisms in the tumor, for example, bytargetingmyeloid-derived suppressor cells(MDSCs) [16], which down-regulate the activityof CTLs and providea mechanism oftumor tolerance.Vaccines have traditionally been deliveredas intramuscular depots, atleast in prophylacticvaccines for infectious diseases.However, considerable work in cancer vaccineshasfocused on targeting immatureDCs that are resident in the LN, because theLN serves as an anatomicalsite for T-cellpriming by DCs. Although vaccines may be injected within the LN with beneficialeffect

National Conference on Emerging Trends in Science, Technology and Management, 11-12 Nov 2017, ISBN: 978-93-5281-325-4 Page 78
[17], this is technically challengingand may damage the LN. As an alternative, nanocarriers can bedesigned in such a way totarget DCs directly in LNs, both skin-drainingand tumor-draining LNs,depending on their size: larger particles (>200 nm) are hinderedby the interstitial space after injectionand thusassociate more with skin-resident DCs thatthenmigrate to draining LNs, whereassmallerparticles (10–100 nm) flow directly into lymphaticvessels and drain directly into the LN[18,19],where they are taken up by LNresidentDCs. Free proteins and peptides are less efficient in LNtargeting because of lowerretention in the LN.
6. IMMUNE CHECKPOINT BLOCKADE THERAPY
In addition to vaccines and cellular therapies, immune checkpoint blockade therapy has ledto excitingrecent clinical advances in cancerimmunotherapy. It works by blockinginhibitory pathways that wouldnormally dampen the activity of effector T cells suchas cytotoxic T-lymphocyte-associated protein4(CTLA-4), which interferes with costimulation [21] and programmed cell death protein1 (PD-1), whichdampens signaling mediatedby the TCR [20] and negatively regulates antigenresponsiveness [21].Ipilimumab, an anti CTLA-4 monoclonal antibody, was the firstimmune checkpoint inhibitor to beapprovedin 2011; two blocking antibodies against PD-1(Nivolumab and Pembrolizumab) wereapprovedin 2014 for use in melanoma patients, and other antibodies for checkpoint blockadeare in thepipeline. Other T-cell inhibitoryreceptors that are being explored as immunotherapytargets include T-cell immunoglobulindomain and mucin domain-3 (TIM-3), lymphocyte activation gene 3 (LAG-3), V-domainimmunoglobulin suppressor of T-cell activation (VISTA), and B- and T-lymphocyte attenuator(BTLA). Furthermore, in addition to blocking checkpoint molecules onT cells, blocking of theirinhibitory ligands (e.g., PD-L1) on tumor cells, stromal cells, and tumor-associated macrophages andDCsis also being pursued.Challenges for improving checkpoint, blockade immunotherapy derive fromthekey underlying function of these pathwaysin maintaining immune regulation, becauseblockade ofthese regulatory pathways is not antigen specific. As such, patients undergoingcheckpoint blockadeimmunotherapy are prone to developing autoimmune reactions,such as dermatitis, enterocolitis, anduveitis with CTLA-4 therapy.To date, engineering approaches to thesechallenges are lacking, but theopportunities are abundant. Furthermore, patient-derived tissue engineered models that faithfullyrecapitulate the tumor immune microenvironment could be used to screen potential checkpointblockade therapies and their combinations with drugs targeting the immune suppressive pathways inthe tumor stroma. To date, although a plethora of in vitro patient-derived tumor models have beendeveloped, very few address the immune compartment [22].
7. DRUGS AND IMMUNOTHERAPY
Immunosuppressive drugs or immunosuppressive agents or antirejection medications are drugs thatinhibit or prevent activity of the immune system. They are used in immunosuppressive therapy to [23]: Prevent the rejection of transplanted organs and tissues (e.g., bone marrow, heart, kidney, liver)
Treat autoimmune diseases or diseases that are most likely of autoimmune origin(e.g., rheumatoid arthritis, Behcet's Disease, pemphigus, and ulcerative colitis).
Treat some other non-autoimmune inflammatory diseases (e.g., long termallergic asthma control), ankylosing spondylitis.
Immunosuppressive drugs can be classified into four groups:
A. Glucocorticoids: In pharmacologic (supraphysiologic) doses, glucocorticoids, suchas prednisone, dexamethasone, and hydrocortisone are used to suppressvarious allergic, inflammatory, and autoimmune disorders. They are also administered asposttransplantory immunosuppressants to prevent the acute transplant rejection and graft-versus-host disease. Nevertheless, they do not prevent an infection and also inhibit later reparativeprocesses.
B. Cytostatics: Cytostatics inhibit cell division in immunotherapy, they are used in smaller dosesthan in the treatment of malignant diseases. They affect the proliferation of both T cells and Bcells. Due to their highest effectiveness, purine analogs are most frequently administered.
C. Antibodies: Antibodies are sometimes used as a quick and potent immunosuppressive therapy toprevent the acute rejection reactions as well as a targeted treatment of lymphoproliferative orautoimmune disorders (e.g., anti-CD20 monoclonals). Polyclonal antibodies: Heterologous polyclonal antibodies are obtained from the serum of
animals (e.g., rabbit, horse), and injected with the patient's thymocytes or lymphocytes.However, they are added primarily to other immunosuppressives to diminish their dosage andtoxicity. They also allow transition to ciclosporin therapy.Polyclonal antibodies inhibit T

National Conference on Emerging Trends in Science, Technology and Management, 11-12 Nov 2017, ISBN: 978-93-5281-325-4 Page 79
lymphocytes and cause their lysis. In this way, polyclonal antibodies inhibit cell-mediatedimmune reactions.
Monoclonal antibodies: Monoclonal antibodies are directed towards exactly definedantigens. Therefore, they cause fewer side-effects. Especially significant are the IL-2 receptor-(CD25-) and CD3-directed antibodies. They are used to prevent the rejection of transplantedorgans, but also to track changes in the lymphocyte subpopulations. It is reasonable to expectsimilar new drugs in the future.
T-cell receptor directed antibodies: Muromonab-CD3 is a murine anti-CD3 monoclonalantibody of the IgG2a type that prevents T-cell activation and proliferation by binding the T-cell receptor complex present on all differentiated T cells. As it acts more specifically thanpolyclonal antibodies it is also used prophylactically in transplantations.
IL-2 receptor directed antibodies: Interleukin-2 is an important immune system regulatornecessary for the clone expansion and survival of activated lymphocytes T. Its effects aremediated by the trimer cell surface receptor IL-2a, consisting of the α, β, and γ chains. The IL-2a (CD25, T-cell activation antigen, TAC) is expressed only by the already-activated Tlymphocytes.
D. Drugs acting on immunophilins: Ciclosporin (Novartis' Sandimmune) is a calcineurin inhibitor(CNI). It is a cyclic fungal peptide; composed of 11 amino acids.Ciclosporin is thought to bind tothe cytosolic protein cyclophilin (an immunophilin) of immunocompetent lymphocytes,especially T-lymphocytes. This complex of ciclosporin and cyclophilin inhibits the phosphatasecalcineurin, which under normal circumstances induces the transcription of interleukin-2.Ciclosporin is used in the treatment of acute rejection reactions, but has been increasinglysubstituted with newer and less nephrotoxic, immunosuppressants. Tacrolimus (trade names Prograf, Astagraf XL, Envarsus XR) is a product of the
bacterium Streptomyces tsukubaensis. It is a macrolide lactone and acts byinhibiting calcineurin.The drug is used primarily in liver and kidney transplantations,although in some clinics it is used in heart, lung, and heart/lung transplantations.
Sirolimus (rapamycin, trade name Rapamune) is a macrolide lactone, produced bythe actinomycete bacterium Streptomyces hygroscopicus. It is used to prevent rejectionreactions.
Everolimus is an analog of sirolimus and also is an mTOR inhibitor.
8. SIDE EFFECTS OF IMMUNOTHERAPY
Mouth sores: Immunotherapy can damage the cells inside the mouth and throat. This causes painfulsores in these areas, a condition called mucositis. These sores can get infected. Mouth sores usuallyhappen 5 to 14 days after a treatment. Eating a healthy diet and keeping your mouth and teeth clean canlower your risk of mouth sores. They usually go away completely when treatment ends.Skin reactions: Skin redness, blistering, and dryness are common reactions to immunotherapy. Skin onthe fingertips may crack. Skin may also become more sensitive to sunlight. A lot of scratching canbreak the skin, making it more prone to infections. Inflammation around the nails can make grooming,dressing, and other activities painful or difficult.Flu-like symptoms: Fatigue (feeling tired), fever, chills, weakness, nausea (feeling sick to yourstomach), vomiting (throwing up), dizziness, and body aches are all common side effects ofimmunotherapy. They are especially common in non-specific immunotherapies and oncolytic virustherapy. It is very important to stay hydrated when experiencing these symptoms, and seek medicalattention if you are unable to keep any liquids down.Other potential side effects you may experience include: High or low blood pressure Muscle aches Shortness of breath (trouble breathing) Swelling of legs (edema) Sinus congestion Headaches Weight gain from retaining fluid Diarrhea Hormone changes

National Conference on Emerging Trends in Science, Technology and Management, 11-12 Nov 2017, ISBN: 978-93-5281-325-4 Page 80
9. PROSPECTS IN CANCER IMMUNOTHERAPY
Recent developments and clinical trials have shown that immunotherapy may be promising andeffective for patients with cancers. Due to the multistep nature of cancer development, numerousgenetic clones of cancer cells, and tumor antigen heterogeneities, effective therapies for cancer patientsmay require highly personalized treatments. Thus, cancer vaccines may be used in the prevention andtreatment of patients with virus-induced cancers such as HPV-induced cervical cancer [24]. Infectionwith Hepatitis B virus (HBV) and Hepatitis C (HCV) virus appeared to be one of the factorscontributing to hepatocellular carcinoma (HCC) development. It has been reported that chronic HBVinfection is responsible for HCC development in >50% of cases and viral proteins may play a criticalrole in liver cancer [25]. Thus, HBV viral proteins may be used for the development of preventivevaccines for liver cancers. An association between JC virus (JCV) and colorectal cancers (CRC) isknown [26]. JCV encodes a gene expressing T-antigen, which is detected in the majority of CRCpatients with positive family history [26]. These results indicate that T-antigen may be used in thedevelopment of cancer vaccines for CRC. The Epstein Barr virus (EBV) has been shown to causedifferent types of lymphoma and nasopharyngeal cancer [27]. EBV encoding viral proteins such asLMP1 may serve as important targets for cancer vaccines. Studies have shown that EBV vaccinesappear to be most promising for the prevention and treatment of EBV-related cancers [28]. Otherviruses such as human T cell lymphoma virus-1 (HTLV-1) also play a role in cancer development.HTLV-1 is responsible for the development of adult T cell leukemia (ATL) [28]. HTLV-1 viralproteins may be used in the development of cancer vaccines for ATL. Mouse model studies havereported that a live attenuated measles vaccine virus Hu-191 strain (MV) could effectively suppress thegrowth of mouse lung carcinoma, suggesting that this approach may be promising in the treatment ofhuman advanced lung cancer [30]. Clinical trials have demonstrated that adoptive cell therapy withantitumor TILs could effectively induce tumor regression in approximately 50–75% of patients withmetastatic melanoma [29]. Thus, adoptive cell transfer therapy with antitumor TILs may be extended totreat patients with other forms of cancers such as breast, renal, and lung cancers. Recent studies haveshown that TILs generated from liver and lung metastases from patients with GI cancers had similarproportions of CD8+ T cells, T cell differentiation stage, expression of costimulatory molecules, andexpansion scale for clinical application to those derived from patients with metastatic melanoma [31,32]. It is expected that adoptive cell therapy with antitumor TILs can be successfully used in thetreatment of patients with various forms of cancers. Genetically engineered T cells with T cell receptorgenes and chimeric antigen receptors have been shown to be effective in the treatment of cancerpatients [31, 32]. Thus far, limited genetically engineered T cells, which are reactive to only severaltumor antigens (such as gp100, MART-1 and NY-ESO-1) and one CAR binding to CD19, are availablefor cancer treatment [31,32]. Since more than 2,000 tumor antigens have been identified from variouscancers, it is anticipated that more genetically engineered T cells will be used in the effective treatmentof cancer patients in the near future. Combination therapies usually are the most promising andeffective in the treatment of human diseases [30]. Adoptive cell therapy with antitumor TILs incombination with nonmyeloablative chemotherapy and total body irradiation can induce tumorregression in 72% of patients with metastatic melanoma, whereas TIL adoptive immunotherapy incombination with nonmyeloablative chemotherapy can induce tumor regression in only 52% of treatedpatients [29]. Therefore, combination therapies will be superior choices for cancer immunotherapy inthe future.
REFERENCES[1] Van der Burg SH, Melief CJ (2011). Therapeutic vaccination against human papilloma virus induced
malignancies. Curr Opin Immunol 23(2):252–257[2] Melero I, et al. (2014). Therapeutic vaccines for cancer: An overview of clinical trials. Nat Rev Clin Oncol
11(9):509–524[3] Stephan MT, Stephan SB, Bak P, Chen J, Irvine DJ (2012). Synapsedirected delivery of
immunomodulators using T-cell-conjugated nanoparticles. Biomaterials 33(23):5776–5787.[4] Understanding immunotherapy(Cancer.Net)[5] Bronte V, et al. (2000). Genetic vaccination with “self” tyrosinaserelatedprotein 2 causes melanoma
eradication but not vitiligo.Cancer Res 60(2):253–258.[6] Overwijk WW, et al. (2003). Tumor regression and autoimmunityafter reversal of a functionally tolerant
state of self-reactive CD8+T cells. J Exp Med 198(4):569–580[7] Suzuki H, et al. (2013). Multiple therapeutic peptide vaccinesconsisting of combined novel cancer testis
antigens and antiangiogenicpeptides for patients with non-small cell lung cancer.J Transl Med 11(1):97.[8] Pedersen SR, Sørensen MR, Buus S, Christensen JP, Thomsen AR(2013). Comparison of vaccine-induced
effector CD8 T cell responsesdirected against self- and non-self-tumor antigens.

National Conference on Emerging Trends in Science, Technology and Management, 11-12 Nov 2017, ISBN: 978-93-5281-325-4 Page 81
[9] Linnemann C, et al. (2015). High-throughput epitope discoveryreveals frequent recognition of neo-antigens by CD4+ T cells inhuman melanoma. Nat Med 21(1):81–85.
[10] Matsushita H, et al. (2012). Cancer exome analysis reveals a T-celldependentmechanism of cancerimmunoediting. Nature 482(7385)
[11] Gubin MM, et al. (2014). Checkpoint blockade cancerimmunotherapy targets tumour-specific mutantantigens. Nature515 (7528):577–581.
[12] Rooney MS, Shukla SA, Wu CJ, Getz G, Hacohen N (2015). Molecular and genetic properties oftumorsassociated with localimmune cytolytic activity. Cell 160(1-2):48.
[13] Schumacher TN, Schreiber RD (2015). Neoantigens in cancerimmunotherapy. Science 348(6230):69–74.[14] Swartz MA, Hirosue S, Hubbell JA (2012). Engineeringapproaches to immunotherapy. Sci Transl Med
4(148):148rv9.[15] Castle JC, et al. (2012). Exploiting the mutanome for tumorvaccination. Cancer Res 72(5):1081–1091.[16] Jeanbart L, Kourtis IC, van der Vlies AJ, Swartz MA, Hubbell JA(2015) 6-Thioguanine-loaded polymeric
micelles deplete myeloidderivedsuppressor cells and enhance the efficacy of T cellimmunotherapy intumor-bearing mice. Cancer ImmunolImmunother 64(8):1033–1046.
[17] Jewell CM, López SCB, Irvine DJ (2011). In situ engineering of thelymph node microenvironment viaintranodal injection of adjuvantrelea usingpolymer particles. Proc Natl Acad Sci USA 108(38):15745.
[18] Manolova V, et al. (2008). Nanoparticles target distinct dendriticcell populations according to their size.Eur J Immunol 38(5):1404–1413.
[19] Sharma P, Allison JP (2015). The future of immune checkpointtherapy. Science 348(6230):56–61.[20] Honda T, et al. (2014). Tuning of antigen sensitivity by T cellreceptor-dependent negative feedback
controls T cell effectorfunction in inflamed tissues. Immunity 40(2):235–247.[21] Hirt C, et al. (2014). “In vitro” 3D models of tumor-immunesystem interaction. Adv Drug Deliv Rev 79-
80:145–154.[22] Newer Immunosuppressive Drugs;A Review -Gummert et al. – J Am Soc Nephrol 10:1366–1380, 1999.
Free full text at JASN. Accessed on 21 August 2005.AndPrinciples and Practice of MonitoringImmunosuppressive Drugs. W.V.Armstrong, J Lab Med, 2002, 26 (1/2): 27–36. PDF. Accessed on 21August 2005.
[23] E. J. Crosbie and H. C. Kitchener, “Cervarix—a bivalent L1 virus-like particle vaccine for prevention ofhuman papillomavirus type 16- and 18-associated cervical Cancer,” Expert Opinion on BiologicalTherapy, vol. 7, no. 3, pp. 391, 2007.
[24] E. Hanna and G. Bachmann, “HPV vaccination with Gardasil: a breakthrough in women’s health,” ExpertOpinion on Biological Therapy, vol. 6, no. 11, pp. 1223–1227, 2006.
[25] M. Ringelhan, M. Heikenwalder, and U. Protzer, “Direct effects of hepatitis B virus-encoded proteins andchronic infection in liver Cancer development,” Digestive Diseases, vol. 31, p. 138, 2013.
[26] T. R. Coelho, L. Almeida, and P. A. Lazo, “JC virus in the pathogenesis of colorectal Cancer, anetiological agent or another component in a multistep process?” Virology Journal, vol. 7, article no. 42,2010 & X. Mou, L. Chen, F. Liu et al., “Prevalence of JC virus in Chinese patients with colorectalCancer,” PloS One, vol. 7, Article ID 35900, 2012.
[27] A. Merlo, R. Turrini, R. Dolcetti et al., “The interplay between Epstein-Barr virus and the immune system:a rationale for adoptive cell therapy of EBV-related disorders,” Haematologica, vol. 95, no. 10, pp. 1769–1777, 2010
[28] J. A. Kanakry and R. F. Ambinder, “EBV-related lymphomas: new approaches to treatment,” CurrentTreatment Options in Oncology, vol. 14, p. 224, 2013 &R. C. Gallo, “Research and discovery of the firsthuman Cancer virus, HTLV-1,” Best Practice and Research: Clinical Haematology, vol. 24, no. 4, pp.559–565, 2011.
[29] ] S. A. Rosenberg and M. E. Dudley, “Adoptive cell therapy for the treatment of patients with metastaticmelanoma,” Current Opinion in Immunology, vol. 21, no. 2, pp. 233–240, 2009 &M. E. Dudley, J. C.Yang, R. Sherry et al., “Adoptive cell therapy for patients with metastatic melanoma: evaluation ofintensive myeloablative chemoradiation preparative regimens,” Journal of Clinical Oncology, vol. 26, no.32, pp. 5233–5239, 2008.
[30] J. A. Kanakry and R. F. Ambinder, “EBV-related lymphomas: new approaches to treatment,” CurrentTreatment Options in Oncology, vol. 14, p. 224, 2013.
[31] L. A. Johnson, R. A. Morgan, M. E. Dudley et al., “Gene therapy with human and mouse T-cell receptorsmediates Cancer regression and targets normal tissues expressing cognate antigen,” Blood, vol. 114, no. 3,pp. 535–546, 2009& P. F. Robbins, R. A. Morgan, S. A. Feldman et al., “Tumor regression in patients withmetastatic synovial cell sarcoma and melanoma using genetically engineered lymphocytes reactive withNY-ESO-1,” Journal of Clinical Oncology, vol. 29, no. 7, pp. 917–924, 2011
[32] H. Abken, P. Koehler, P. Schmidt, A. A. Hombach, and M. Hallek, “Engineered T cells for the adoptivetherapy of b-cell chronic lymphocytic leukaemia,” Advances in Hematology, vol. 2012, Article ID 595060,13 pages, 2012.
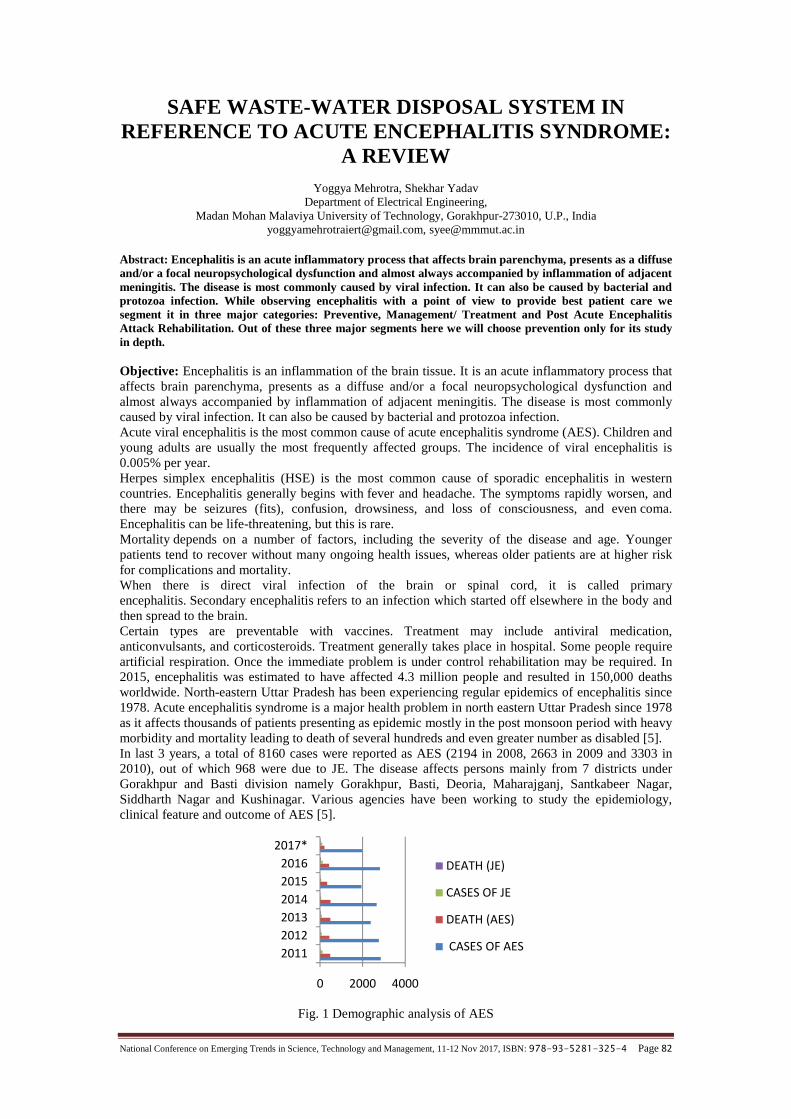
National Conference on Emerging Trends in Science, Technology and Management, 11-12 Nov 2017, ISBN: 978-93-5281-325-4 Page 82
SAFE WASTE-WATER DISPOSAL SYSTEM INREFERENCE TO ACUTE ENCEPHALITIS SYNDROME:
A REVIEWYoggya Mehrotra, Shekhar Yadav
Department of Electrical Engineering,Madan Mohan Malaviya University of Technology, Gorakhpur-273010, U.P., India
[email protected], [email protected]
Abstract: Encephalitis is an acute inflammatory process that affects brain parenchyma, presents as a diffuseand/or a focal neuropsychological dysfunction and almost always accompanied by inflammation of adjacentmeningitis. The disease is most commonly caused by viral infection. It can also be caused by bacterial andprotozoa infection. While observing encephalitis with a point of view to provide best patient care wesegment it in three major categories: Preventive, Management/ Treatment and Post Acute EncephalitisAttack Rehabilitation. Out of these three major segments here we will choose prevention only for its studyin depth.
Objective: Encephalitis is an inflammation of the brain tissue. It is an acute inflammatory process thataffects brain parenchyma, presents as a diffuse and/or a focal neuropsychological dysfunction andalmost always accompanied by inflammation of adjacent meningitis. The disease is most commonlycaused by viral infection. It can also be caused by bacterial and protozoa infection.Acute viral encephalitis is the most common cause of acute encephalitis syndrome (AES). Children andyoung adults are usually the most frequently affected groups. The incidence of viral encephalitis is0.005% per year.Herpes simplex encephalitis (HSE) is the most common cause of sporadic encephalitis in westerncountries. Encephalitis generally begins with fever and headache. The symptoms rapidly worsen, andthere may be seizures (fits), confusion, drowsiness, and loss of consciousness, and even coma.Encephalitis can be life-threatening, but this is rare.Mortality depends on a number of factors, including the severity of the disease and age. Youngerpatients tend to recover without many ongoing health issues, whereas older patients are at higher riskfor complications and mortality.When there is direct viral infection of the brain or spinal cord, it is called primaryencephalitis. Secondary encephalitis refers to an infection which started off elsewhere in the body andthen spread to the brain.Certain types are preventable with vaccines. Treatment may include antiviral medication,anticonvulsants, and corticosteroids. Treatment generally takes place in hospital. Some people requireartificial respiration. Once the immediate problem is under control rehabilitation may be required. In2015, encephalitis was estimated to have affected 4.3 million people and resulted in 150,000 deathsworldwide. North-eastern Uttar Pradesh has been experiencing regular epidemics of encephalitis since1978. Acute encephalitis syndrome is a major health problem in north eastern Uttar Pradesh since 1978as it affects thousands of patients presenting as epidemic mostly in the post monsoon period with heavymorbidity and mortality leading to death of several hundreds and even greater number as disabled [5].In last 3 years, a total of 8160 cases were reported as AES (2194 in 2008, 2663 in 2009 and 3303 in2010), out of which 968 were due to JE. The disease affects persons mainly from 7 districts underGorakhpur and Basti division namely Gorakhpur, Basti, Deoria, Maharajganj, Santkabeer Nagar,Siddharth Nagar and Kushinagar. Various agencies have been working to study the epidemiology,clinical feature and outcome of AES [5].
Fig. 1 Demographic analysis of AES
0 2000 4000
201120122013201420152016
2017*DEATH (JE)
CASES OF JE
DEATH (AES)
CASES OF AES

National Conference on Emerging Trends in Science, Technology and Management, 11-12 Nov 2017, ISBN: 978-93-5281-325-4 Page 83
While observing encephalitis with a point of view to provide best patient care we segment it in threemajor categories: Preventive, Management/Treatment and Post Acute Encephalitis AttackRehabilitation. Out of these three major segments here we will choose prevention only for its study indepth. Our objective is aimed at to collect demographic data of the endemic areas by visiting theepidemic prone areas of northern Uttar Pradesh OPDs and wards of the hospitals and medical collegewhere most of the cases are reported. Analyze the data and point out a specific reason of epidemic andso its prevention. [4]. Materials and Methods: We are focusing on prevention of AES, so we willidentify the causes of AES to further classify it [4].JAPANESE ENCEPHALITIS (JE): Japanese Encephalitis is a viral disease. It is transmitted byinfective bites of female mosquitoes mainly belonging to Culex tritaeniorhynchus, Culex vishnui andCulex pseudovishnui group. However, some other mosquito species also play a role in transmissionunder specific conditions. JE virus is primarily zoonotic in its natural cycle and man is an accidentalhost.JE virus is neurotorpic and arbovirus and primarily affects central nervous system [1, 6, 10].SIGN AND SYMPTOMS: JE virus infection presents classical symptoms similar to any other viruscausing encephalitis. JE virus infection may result in febrile illness of variable severity associated withneurological symptoms ranging from headache to meningitis or encephalitis. Symptoms can includeheadache, fever, meningeal signs, stupor, disorientation, coma, tremors, paralysis (generalized),hypertonia, loss of coordination, etc. Prodromal stage may be abrupt (1-6 hours), acute (6-24 hours) ormore commonly subacute (2-5 days). In acute encephalitic stage, symptoms noted in prodromal phaseconvulsions, alteration of sensorium, behavioral changes, motor paralysis and involuntary movementsupervene and focal neurological deficit is common.Usually lasts for a week but may prolong due to complications. Amongst patients who survive, somelead to full recovery through steady improvement and some suffer with stabilization of neurologicaldeficit. Convalescent phase is prolonged and vary from a few weeks to several months. Clinically it isdifficult to differentiate between JE and other viral encephalitis. JE virus infection presents classicalsymptoms similar to any other virus causing encephalitis [1].SCRUB TYPHUS: Scrub typhus is related to rickettsial diseases O. tsutsugamushi is transmitted bytrombiculid mite larvae (chiggers), which feed on forest and rural rodents, including rats, voles, andfield mice. Human infection also follows a chigger bite. The mites are both the vector and the naturalreservoir for O. tsutsugamushi. Scrub typhus is endemic in an area of Asia-Pacific bounded by Japan,Korea, China, India, and northern Australia [2].SIGN AND SYMPTOMS: After an incubation period of 6 to 21 days (mean 10 to 12 days), fever,chills, headache, and generalized lymphadenopathy start suddenly. At onset of fever, an eschar oftendevelops at the site of the chigger bite. The typical lesion of scrub typhus, common in whites but rare inAsians, begins as a red, indurated lesion about 1 cm in diameter; it eventually vesiculates, ruptures, andbecomes covered with a black scab. Regional lymph nodes enlarge. Fever rises during the 1st week;often to 40 to 40.5° C. Headache is severe and common, as is conjunctival injection. A macular rashdevelops on the trunk during the 5th to 8th day of fever, often extending to the arms and legs. It maydisappear rapidly or become maculopapular and intensely colored. Cough is present during the 1stweek of fever, and pneumonitis may develop during the 2nd week.In severe cases, pulse rate increases; BP drops; and delirium, stupor, and muscular twitching develop.Splenomegaly may be present, and interstitial myocarditis is more common than in other rickettsialdiseases. In untreated patients, high fever may persist ≥ 2 week, then falls gradually over several days.With therapy, effervescence usually begins within 36 h. Recovery is prompt and uneventful [2].WATER BORNE: Water is a liquid that can cure various types of diseases. The harmful substancesthat are most harmful to people that are present in water. The water available solvent reaches to anyoneat any time. Water contamination is harmful to the people those who are having low immunity power.This may feel you sick and causes various diseases.Water-borne disease can be acquired during water-related recreational activities such as swimming,boating or other water sports. Many epidemiological studies conducted at both marine and freshwaterbathing beaches have shown that there is a significant increase in incidence of illness, includinggastrointestinal, respiratory, ear and ocular and skin or wound infection among those who engage inwater-based recreational activities. Viruses are believed to be a significant cause of recreationallyassociated water-borne disease.However, they have been difficult to document because of the wide variety of illnesses that they causeand the limitations in previous detection methods. Noroviruses are believed to be the single largestcause of outbreaks, which have been documented in the published literature 45% (n = 25), followed byadenovirus (24%), echovirus (18%), hepatitis A virus (7%) and coxsackieviruses (5%). Just under halfof the outbreaks occurred in swimming pools (49%), while the second largest outbreak occurred inlakes or ponds (40%) [3, 10].
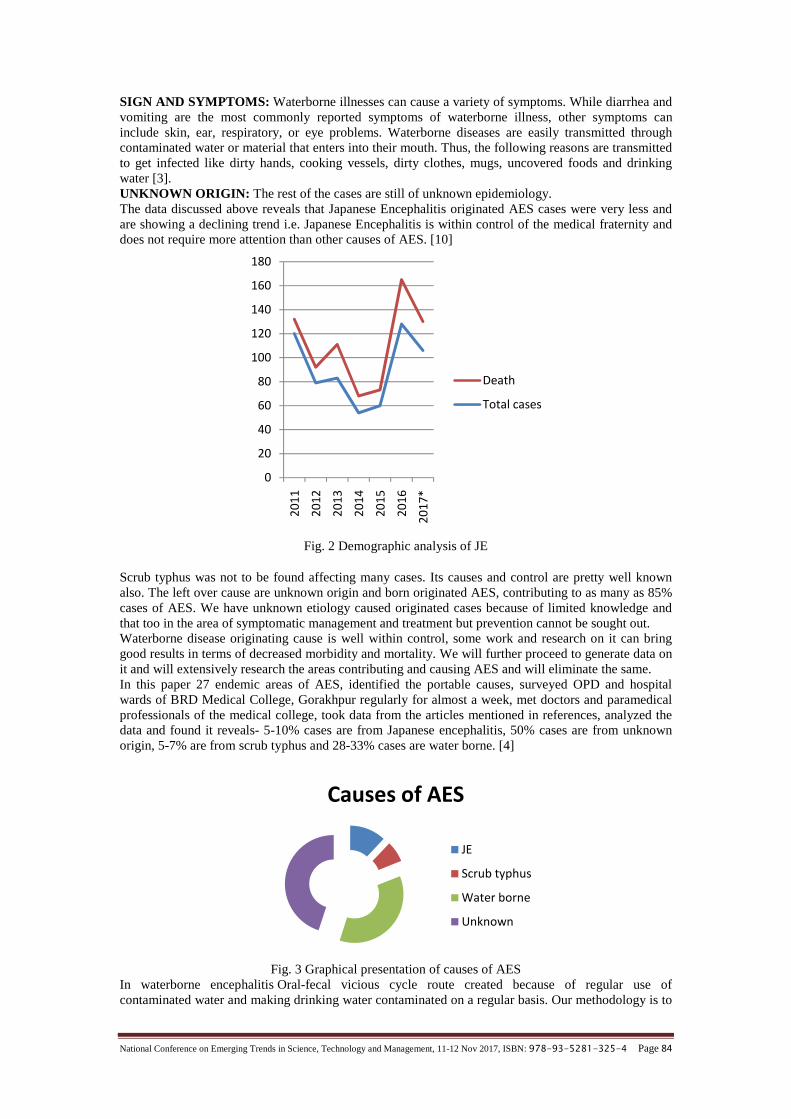
National Conference on Emerging Trends in Science, Technology and Management, 11-12 Nov 2017, ISBN: 978-93-5281-325-4 Page 84
SIGN AND SYMPTOMS: Waterborne illnesses can cause a variety of symptoms. While diarrhea andvomiting are the most commonly reported symptoms of waterborne illness, other symptoms caninclude skin, ear, respiratory, or eye problems. Waterborne diseases are easily transmitted throughcontaminated water or material that enters into their mouth. Thus, the following reasons are transmittedto get infected like dirty hands, cooking vessels, dirty clothes, mugs, uncovered foods and drinkingwater [3].UNKNOWN ORIGIN: The rest of the cases are still of unknown epidemiology.The data discussed above reveals that Japanese Encephalitis originated AES cases were very less andare showing a declining trend i.e. Japanese Encephalitis is within control of the medical fraternity anddoes not require more attention than other causes of AES. [10]
Fig. 2 Demographic analysis of JE
Scrub typhus was not to be found affecting many cases. Its causes and control are pretty well knownalso. The left over cause are unknown origin and born originated AES, contributing to as many as 85%cases of AES. We have unknown etiology caused originated cases because of limited knowledge andthat too in the area of symptomatic management and treatment but prevention cannot be sought out.Waterborne disease originating cause is well within control, some work and research on it can bringgood results in terms of decreased morbidity and mortality. We will further proceed to generate data onit and will extensively research the areas contributing and causing AES and will eliminate the same.In this paper 27 endemic areas of AES, identified the portable causes, surveyed OPD and hospitalwards of BRD Medical College, Gorakhpur regularly for almost a week, met doctors and paramedicalprofessionals of the medical college, took data from the articles mentioned in references, analyzed thedata and found it reveals- 5-10% cases are from Japanese encephalitis, 50% cases are from unknownorigin, 5-7% are from scrub typhus and 28-33% cases are water borne. [4]
Fig. 3 Graphical presentation of causes of AESIn waterborne encephalitis Oral-fecal vicious cycle route created because of regular use ofcontaminated water and making drinking water contaminated on a regular basis. Our methodology is to
0
20
40
60
80
100
120
140
160
180
2011
2012
2013
2014
2015
2016
2017
*
Death
Total cases
Causes of AES
JE
Scrub typhus
Water borne
Unknown

National Conference on Emerging Trends in Science, Technology and Management, 11-12 Nov 2017, ISBN: 978-93-5281-325-4 Page 85
break the oral fecal vicious cycle and these 30% cases of encephalitis to negligible level for that wewill observe the source of drinking water in the epidemic areas of encephalitis at the same time we willalso focus how faeces get mixed with drinking water and makes it contaminated.Result: After a vigorous survey of the endemic areas of AES we observed that the affected populationtakes drinking water from river, pond, hand pumps and water supply wherever available.Although, the cases were seen throughout the year but the incidence was peaked in the month ofSeptember (39%) and in the month of October 70 (35%), suggesting the seasonal occurrence of thedisease. [5]
Fig. 4 Showing Month Wise Percentage Distribution of AES Cases
We visited almost 30 sources of drinking water in the epidemic area of encephalitis and found thatmost commonly used source is a hand pump. At the same time we studied the regular habit of people ofthe area how they defecate and maintain poor hygiene and here we found cause of the above said oralfecal vicious cycle and it was nothing but use of same source of drinking water and washing of faecesand kitchen utensils.Here we found that the possibility of formation of oral fecal vicious cycle. At the same time weobserved the usage of soil instead of a soap or detergent for cleaning their hands covered with faeces.The prevention has a social dimension as well, which we will not discuss here. We will discuss a welldefined scientific approach to meet our objective to reduce a stipulated amount of waterborneoriginated oral fecal vicious cycle and so drop in morbidity and mortality in AES endemic areas. Weobserve that 60% of affected population usage hand pump as source of water for all their needs andbecause water table is high in eastern Uttar Pradesh which is known as cut area, so almost all handpumps are drilled up to 30-40ft only and this is the cause of mixing of contaminated water to the sourceof water and creating the oral fecal vicious cycle. We suggest drilling hand pumps up to not less than200fts to not let this oral fecal vicious cycle created and control water borne disease like AES. As resultof morbidity of AES, there is 20-25% mortality reported, 30-50% of the cases become permanentlydisabled with behavioral changes and unfortunately they have to rely on life support systems lifelong.The rest 35-40% get good recovery if they get medical treatment in early phase of their infection. [7-9]
Fig. 5 Showing Month Wise Percentage Distribution of AES Cases
05
10152025303540
MONTHLYDISTRIBUTION OF AES
National Conference on Emerging Trends in Science, Technology and Management, 11-12 Nov 2017, ISBN: 978-93-5281-325-4 Page 85
break the oral fecal vicious cycle and these 30% cases of encephalitis to negligible level for that wewill observe the source of drinking water in the epidemic areas of encephalitis at the same time we willalso focus how faeces get mixed with drinking water and makes it contaminated.Result: After a vigorous survey of the endemic areas of AES we observed that the affected populationtakes drinking water from river, pond, hand pumps and water supply wherever available.Although, the cases were seen throughout the year but the incidence was peaked in the month ofSeptember (39%) and in the month of October 70 (35%), suggesting the seasonal occurrence of thedisease. [5]
Fig. 4 Showing Month Wise Percentage Distribution of AES Cases
We visited almost 30 sources of drinking water in the epidemic area of encephalitis and found thatmost commonly used source is a hand pump. At the same time we studied the regular habit of people ofthe area how they defecate and maintain poor hygiene and here we found cause of the above said oralfecal vicious cycle and it was nothing but use of same source of drinking water and washing of faecesand kitchen utensils.Here we found that the possibility of formation of oral fecal vicious cycle. At the same time weobserved the usage of soil instead of a soap or detergent for cleaning their hands covered with faeces.The prevention has a social dimension as well, which we will not discuss here. We will discuss a welldefined scientific approach to meet our objective to reduce a stipulated amount of waterborneoriginated oral fecal vicious cycle and so drop in morbidity and mortality in AES endemic areas. Weobserve that 60% of affected population usage hand pump as source of water for all their needs andbecause water table is high in eastern Uttar Pradesh which is known as cut area, so almost all handpumps are drilled up to 30-40ft only and this is the cause of mixing of contaminated water to the sourceof water and creating the oral fecal vicious cycle. We suggest drilling hand pumps up to not less than200fts to not let this oral fecal vicious cycle created and control water borne disease like AES. As resultof morbidity of AES, there is 20-25% mortality reported, 30-50% of the cases become permanentlydisabled with behavioral changes and unfortunately they have to rely on life support systems lifelong.The rest 35-40% get good recovery if they get medical treatment in early phase of their infection. [7-9]
Fig. 5 Showing Month Wise Percentage Distribution of AES Cases
05
10152025303540
JAN
UAR
YFE
BRU
ARY
MAR
CHAP
RIL
MAY
JUN
EJU
LYAU
GUST
SEPT
EMBE
RO
CTO
BER
NO
VEM
BER
DECE
MBE
R
MONTHLYDISTRIBUTION OF AES
TOTAL CASESDISABLEDSURVIVORS
DEATH
RECOVERED
National Conference on Emerging Trends in Science, Technology and Management, 11-12 Nov 2017, ISBN: 978-93-5281-325-4 Page 85
break the oral fecal vicious cycle and these 30% cases of encephalitis to negligible level for that wewill observe the source of drinking water in the epidemic areas of encephalitis at the same time we willalso focus how faeces get mixed with drinking water and makes it contaminated.Result: After a vigorous survey of the endemic areas of AES we observed that the affected populationtakes drinking water from river, pond, hand pumps and water supply wherever available.Although, the cases were seen throughout the year but the incidence was peaked in the month ofSeptember (39%) and in the month of October 70 (35%), suggesting the seasonal occurrence of thedisease. [5]
Fig. 4 Showing Month Wise Percentage Distribution of AES Cases
We visited almost 30 sources of drinking water in the epidemic area of encephalitis and found thatmost commonly used source is a hand pump. At the same time we studied the regular habit of people ofthe area how they defecate and maintain poor hygiene and here we found cause of the above said oralfecal vicious cycle and it was nothing but use of same source of drinking water and washing of faecesand kitchen utensils.Here we found that the possibility of formation of oral fecal vicious cycle. At the same time weobserved the usage of soil instead of a soap or detergent for cleaning their hands covered with faeces.The prevention has a social dimension as well, which we will not discuss here. We will discuss a welldefined scientific approach to meet our objective to reduce a stipulated amount of waterborneoriginated oral fecal vicious cycle and so drop in morbidity and mortality in AES endemic areas. Weobserve that 60% of affected population usage hand pump as source of water for all their needs andbecause water table is high in eastern Uttar Pradesh which is known as cut area, so almost all handpumps are drilled up to 30-40ft only and this is the cause of mixing of contaminated water to the sourceof water and creating the oral fecal vicious cycle. We suggest drilling hand pumps up to not less than200fts to not let this oral fecal vicious cycle created and control water borne disease like AES. As resultof morbidity of AES, there is 20-25% mortality reported, 30-50% of the cases become permanentlydisabled with behavioral changes and unfortunately they have to rely on life support systems lifelong.The rest 35-40% get good recovery if they get medical treatment in early phase of their infection. [7-9]
Fig. 5 Showing Month Wise Percentage Distribution of AES Cases

National Conference on Emerging Trends in Science, Technology and Management, 11-12 Nov 2017, ISBN: 978-93-5281-325-4 Page 86
CONCLUSIONWe had developed a simple design of the area of the hand pump which is the major source of drinkingwater and the above mentioned activities which will help us to break the oral-fecal vicious cycle andwill bring down the percentage of encephalitis due to contaminated water consumption.The developed design of the drainage system, surrounding every hand pump, So as to not let the oralfecal vicious cycle is hand-pump with shallow drilling of about 30-40fts should be marked red –“WATER NOT FOR DRINKING”.New hand-pumps with 200 to 500fts depth drilling should be installed with proper drainage to avoidestablishing an oral-fecal vicious cycle.
REFERENCES
[1.] http://nvbdcp.gov.in/je-new.html[2.] http://www.msdmanuals.com/professional/infectious-diseases/rickettsiae-and-related
organisms/scrub-typhus[3.] http://onlinelibrary.wiley.com/doi/10.1111/j.1365-2672.2009.04367.x/full[4.] Additional director medical health, health department BRD medical college, Gorakhpur.[5.] Rakesh kumar, Mridul Bhushan, P.Nigam, ''Pattern Of Infections In Adult Patients Presenting
As Acute Encephalitis Syndrome (Aes) ",International Journal of Medical Science andEducation , Pg 218-227 Vol.1; Issue: 4; Oct-Dec 2014
[6.] Dillon GPS. Guidelines for clinical management of Japanese Encephalitis.Directorate ofNVBDCP; 2007;
[7.] Panagariya A, Jam RS, Gupta S, Garg A, Sureka RK, Mathur V. Herpes simplex encephalitisin North West India. Neurol India. 2001 ; 49: 360-365.
[8.] Jain P at al. Epidemiology & aetiology of AES in north India. Jpn J Infect dis 2014; 167:197-203.
[9.] Joshi M. V., Geevarghese G., Mishra A. C., Epidemiology of Japanese encephalitis inIndia:1954-2004, NIV Commemorative Compendium 2004, 308-334.
[10.] http://nvbdcp.gov.in/Doc/je-aes.
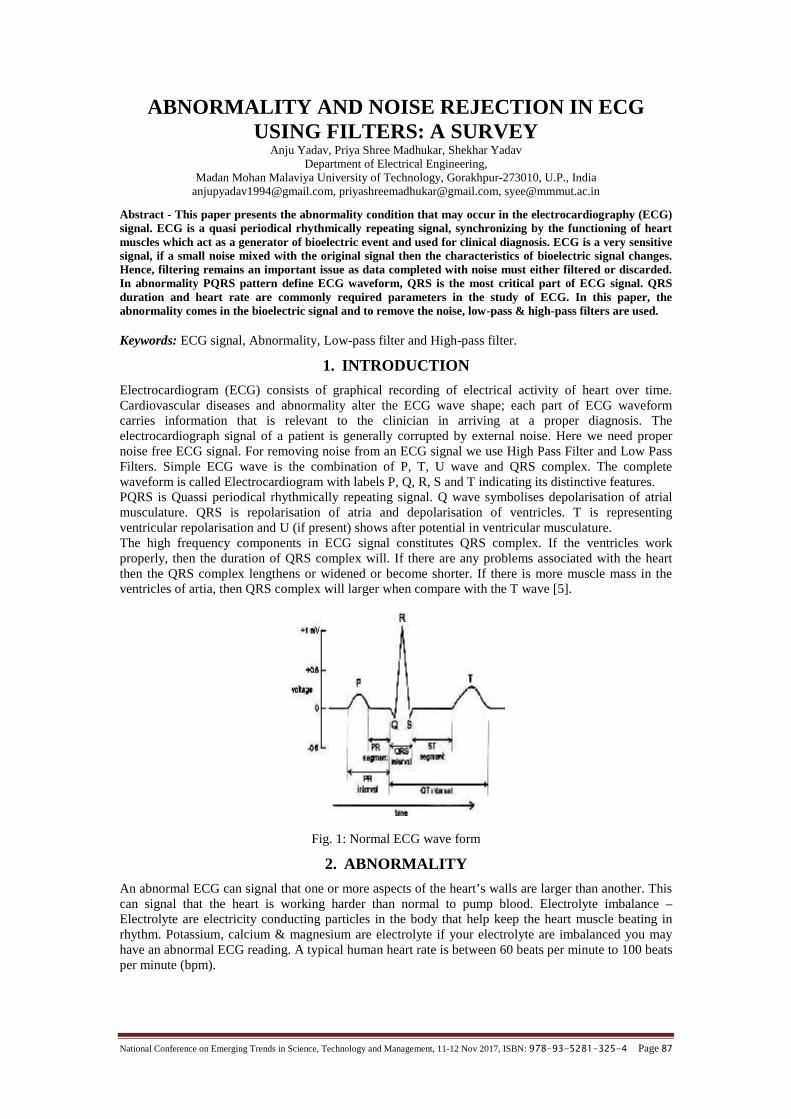
National Conference on Emerging Trends in Science, Technology and Management, 11-12 Nov 2017, ISBN: 978-93-5281-325-4 Page 87
ABNORMALITY AND NOISE REJECTION IN ECGUSING FILTERS: A SURVEY
Anju Yadav, Priya Shree Madhukar, Shekhar YadavDepartment of Electrical Engineering,
Madan Mohan Malaviya University of Technology, Gorakhpur-273010, U.P., [email protected], [email protected], [email protected]
Abstract - This paper presents the abnormality condition that may occur in the electrocardiography (ECG)signal. ECG is a quasi periodical rhythmically repeating signal, synchronizing by the functioning of heartmuscles which act as a generator of bioelectric event and used for clinical diagnosis. ECG is a very sensitivesignal, if a small noise mixed with the original signal then the characteristics of bioelectric signal changes.Hence, filtering remains an important issue as data completed with noise must either filtered or discarded.In abnormality PQRS pattern define ECG waveform, QRS is the most critical part of ECG signal. QRSduration and heart rate are commonly required parameters in the study of ECG. In this paper, theabnormality comes in the bioelectric signal and to remove the noise, low-pass & high-pass filters are used.
Keywords: ECG signal, Abnormality, Low-pass filter and High-pass filter.
1. INTRODUCTION
Electrocardiogram (ECG) consists of graphical recording of electrical activity of heart over time.Cardiovascular diseases and abnormality alter the ECG wave shape; each part of ECG waveformcarries information that is relevant to the clinician in arriving at a proper diagnosis. Theelectrocardiograph signal of a patient is generally corrupted by external noise. Here we need propernoise free ECG signal. For removing noise from an ECG signal we use High Pass Filter and Low PassFilters. Simple ECG wave is the combination of P, T, U wave and QRS complex. The completewaveform is called Electrocardiogram with labels P, Q, R, S and T indicating its distinctive features.PQRS is Quassi periodical rhythmically repeating signal. Q wave symbolises depolarisation of atrialmusculature. QRS is repolarisation of atria and depolarisation of ventricles. T is representingventricular repolarisation and U (if present) shows after potential in ventricular musculature.The high frequency components in ECG signal constitutes QRS complex. If the ventricles workproperly, then the duration of QRS complex will. If there are any problems associated with the heartthen the QRS complex lengthens or widened or become shorter. If there is more muscle mass in theventricles of artia, then QRS complex will larger when compare with the T wave [5].
Fig. 1: Normal ECG wave form
2. ABNORMALITY
An abnormal ECG can signal that one or more aspects of the heart’s walls are larger than another. Thiscan signal that the heart is working harder than normal to pump blood. Electrolyte imbalance –Electrolyte are electricity conducting particles in the body that help keep the heart muscle beating inrhythm. Potassium, calcium & magnesium are electrolyte if your electrolyte are imbalanced you mayhave an abnormal ECG reading. A typical human heart rate is between 60 beats per minute to 100 beatsper minute (bpm).

National Conference on Emerging Trends in Science, Technology and Management, 11-12 Nov 2017, ISBN: 978-93-5281-325-4 Page 88
Table 1: Various abnormalities and their characteristics feature [8].
S. No. Name of Abnormality Characteristic Features
1. Dextrocardia Inverted P-wave2. Tachycardia R-R interval<0.6s
3. Bradycardia R-R interval>1s
4. Hyperkalemia Tall T-wave and absence of P-wave5. Myocardial Ischaemia Inverted T-wave
6. Hypercalcaemia QRS interval <0.1s
7. Sinoatrial block Complete drop out of a cardiac cycle
8. Sudden cardiac death Irregular ECG
2.1. PARAMETERS
Parameters used in QRS complex analysis are QRS duration, R-R interval and heart rate of the signal.Parameters describes below are:
1. QRS Duration: The duration of QRS complex of ECG is found by dividing number ofsamples between QRS complex and sampling frequency of signal. By knowing the durationwe can find signal is normal or abnormal [6-7].
Table 2: Values of QRS complex duration, RR interval and heart rate of test and normal signals [5].
3. FILTERS USED IN ABNORMALITY
Most type of interferences that affect ECG. Signal may be removed by filters. The filtering methodsdepends o the type of abnormality in ECG signal. In some signals the abnormality level is high and it isnot possible to recognize, it is important to gain a good understanding of the abnormality processesinvolved before one attempt to filter or pre-process a signal [8-10]. The ECG signal is very sensitive innature and even if abnormality mixed with original signal the characteristics of the signal changes. Datacorrupted with noise must either filtered or discarded, filtering is an important issue for designconsideration of real time monitoring system.The basic steps used for filtering is described in the flowchart shown below [3].
Fig 3.1: Block Diagram of QRS detection
Signal RR interval Heart rate (beats/sec) QRS duration (sec) ConditionNormal 0.791 75.84 0.094 StandardSignal A 0.877 68.41 0.093 Normal
Signal B 0.911 65.83 0.088 NormalSignal C 1.059 56.65 0.238 AbnormalSignal D 0.80 75.00 0.080 NormalSignal E 0.516 116.07 0.197 Abnormal
Signal F 0.78 76.90 0.083 NormalSignal G 0.45 133.33 0.162 Abnormal
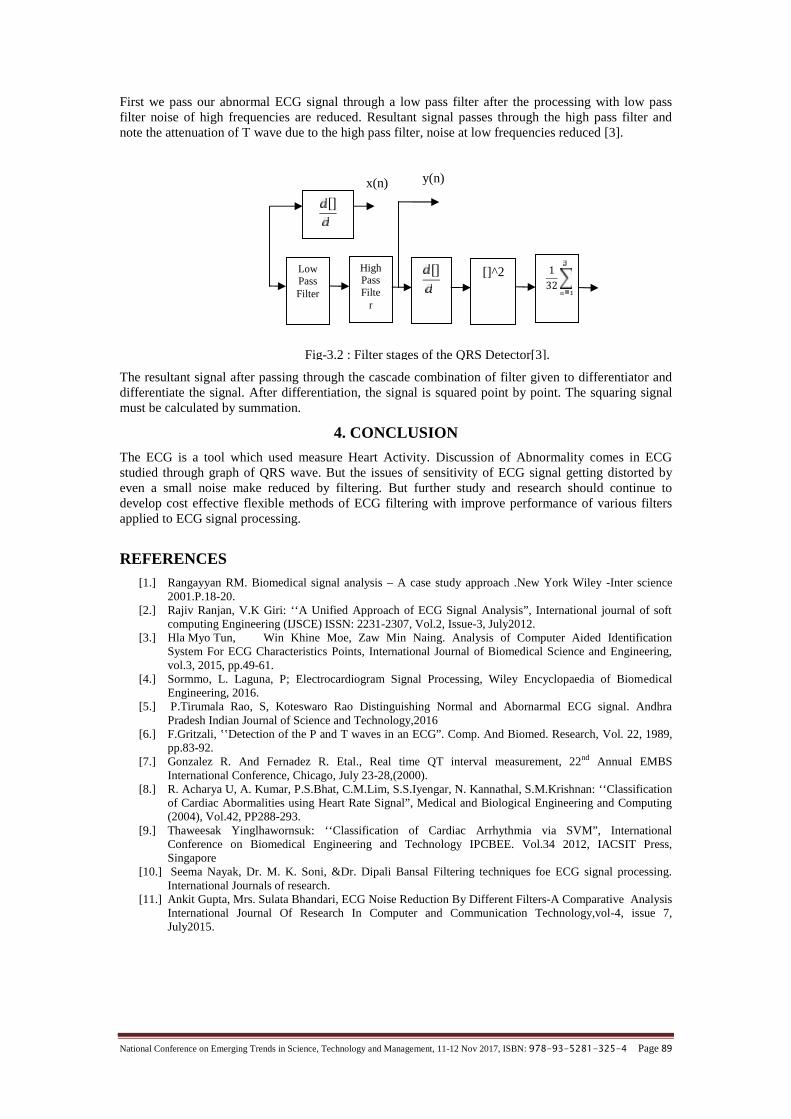
National Conference on Emerging Trends in Science, Technology and Management, 11-12 Nov 2017, ISBN: 978-93-5281-325-4 Page 89
First we pass our abnormal ECG signal through a low pass filter after the processing with low passfilter noise of high frequencies are reduced. Resultant signal passes through the high pass filter andnote the attenuation of T wave due to the high pass filter, noise at low frequencies reduced [3].
The resultant signal after passing through the cascade combination of filter given to differentiator anddifferentiate the signal. After differentiation, the signal is squared point by point. The squaring signalmust be calculated by summation.
4. CONCLUSION
The ECG is a tool which used measure Heart Activity. Discussion of Abnormality comes in ECGstudied through graph of QRS wave. But the issues of sensitivity of ECG signal getting distorted byeven a small noise make reduced by filtering. But further study and research should continue todevelop cost effective flexible methods of ECG filtering with improve performance of various filtersapplied to ECG signal processing.
REFERENCES[1.] Rangayyan RM. Biomedical signal analysis – A case study approach .New York Wiley -Inter science
2001.P.18-20.[2.] Rajiv Ranjan, V.K Giri: ʻʻA Unified Approach of ECG Signal Analysis”, International journal of soft
computing Engineering (IJSCE) ISSN: 2231-2307, Vol.2, Issue-3, July2012.[3.] Hla Myo Tun, Win Khine Moe, Zaw Min Naing. Analysis of Computer Aided Identification
System For ECG Characteristics Points, International Journal of Biomedical Science and Engineering,vol.3, 2015, pp.49-61.
[4.] Sormmo, L. Laguna, P; Electrocardiogram Signal Processing, Wiley Encyclopaedia of BiomedicalEngineering, 2016.
[5.] P.Tirumala Rao, S, Koteswaro Rao Distinguishing Normal and Abornarmal ECG signal. AndhraPradesh Indian Journal of Science and Technology,2016
[6.] F.Gritzali, ʽʽDetection of the P and T waves in an ECG”. Comp. And Biomed. Research, Vol. 22, 1989,pp.83-92.
[7.] Gonzalez R. And Fernadez R. Etal., Real time QT interval measurement, 22nd Annual EMBSInternational Conference, Chicago, July 23-28,(2000).
[8.] R. Acharya U, A. Kumar, P.S.Bhat, C.M.Lim, S.S.Iyengar, N. Kannathal, S.M.Krishnan: ʻʻClassificationof Cardiac Abormalities using Heart Rate Signal”, Medical and Biological Engineering and Computing(2004), Vol.42, PP288-293.
[9.] Thaweesak Yinglhawornsuk: ʻʻClassification of Cardiac Arrhythmia via SVM”, InternationalConference on Biomedical Engineering and Technology IPCBEE. Vol.34 2012, IACSIT Press,Singapore
[10.] Seema Nayak, Dr. M. K. Soni, &Dr. Dipali Bansal Filtering techniques foe ECG signal processing.International Journals of research.
[11.] Ankit Gupta, Mrs. Sulata Bhandari, ECG Noise Reduction By Different Filters-A Comparative AnalysisInternational Journal Of Research In Computer and Communication Technology,vol-4, issue 7,July2015.
LowPassFilter
HighPassFilte
r
[] []^2 132
[] x(n) y(n)
Fig-3.2 : Filter stages of the QRS Detector[3].
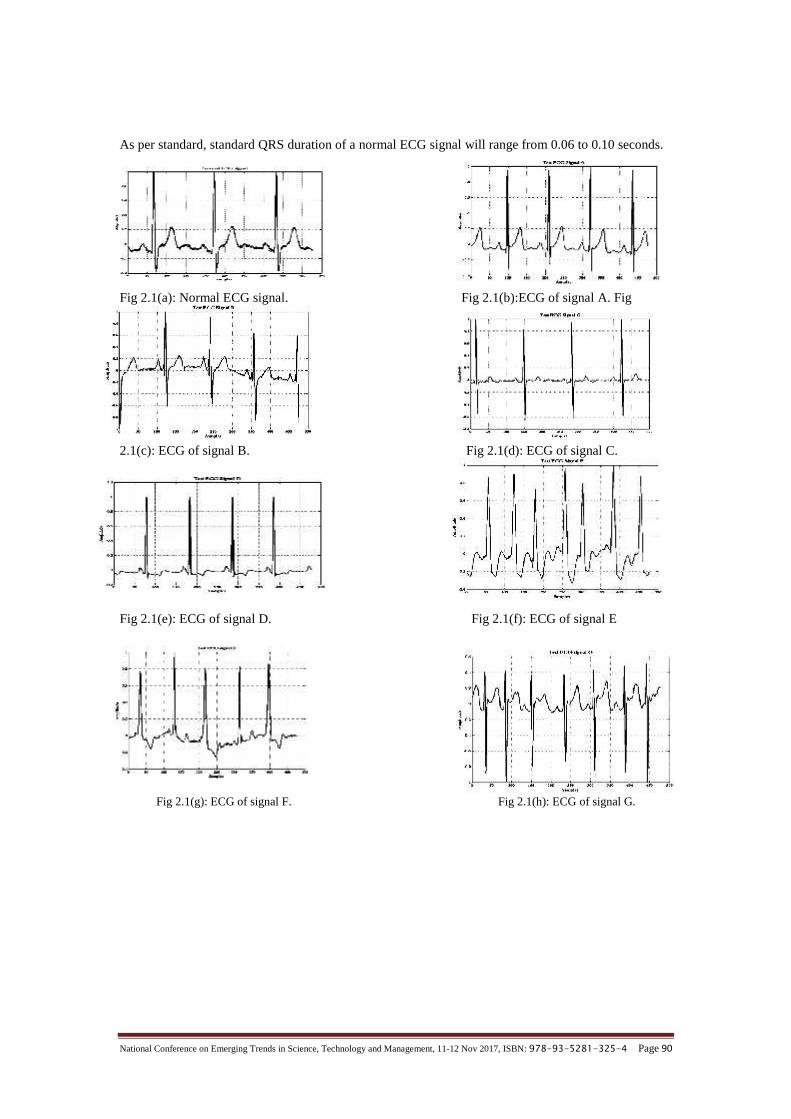
National Conference on Emerging Trends in Science, Technology and Management, 11-12 Nov 2017, ISBN: 978-93-5281-325-4 Page 90
As per standard, standard QRS duration of a normal ECG signal will range from 0.06 to 0.10 seconds.
Fig 2.1(a): Normal ECG signal. Fig 2.1(b):ECG of signal A. Fig
2.1(c): ECG of signal B. Fig 2.1(d): ECG of signal C.
Fig 2.1(e): ECG of signal D. Fig 2.1(f): ECG of signal E
Fig 2.1(g): ECG of signal F. Fig 2.1(h): ECG of signal G.
National Conference on Emerging Trends in Science, Technology and Management, 11-12 Nov 2017, ISBN: 978-93-5281-325-4 Page 91
DELIGNIFICATION OF PINE NEEDLE AND SORGHUMSTOVER BY TREATMENT WITH PARA FORMIC
ACID/PARA ACETIC ACID (PFA/PAA)Vaishnavi Sinha, Parmar Keshri Nandan
B.Tech Biotechnology, final year, Assistant ProfessorDepartment of Biotechnology
Ashoka Institute of Technology and ManagementVaranasi, Uttar Pradesh-221007
[email protected], [email protected]
Abstract - Sorghum Stover and Pine Needle (Lignocellulosic agricultural Waste) is a potential source ofsubstrate in Ethanol Industries. It contains 10-30% and 27.7% of total lignin content. Extraction of Ligninfrom these agricultural wastes involves treatment with 85% of Organic acid and 80% formic acid inPulping step. Further treatment with Para formic acid/ Para acetic acid (PFA/PAA), lignin bonded withcellulose and hemi-cellulose get extremely weaker. Then, pulp after this treatment is go through bleachingprocess ( using 14ml 35% hydrogen peroxide) and Isolation of lignin by Distilled water. Recently, lignin hasmany applications in cement industry, water treatment formulation and textile dyes. This study proposed adelignification process from this potential lignocellulosic substrate using PFA/PAA; also increases thecellulosic content in de-lignified Fibers which is further used in ethanol production.
Keywords: Delignification, Lignocellulosic substrates.
1. INTRODUCTION
Lignin is a class of complex organic polymers that form important structural materials in the supporttissues of vascular plants and some algae. Lignins are particularly important in the formation of cellwalls, especially in wood and bark, because they lend rigidity and do not rot easily. Chemically, ligninsare cross-linked phenolic polymers.Lignocellulosic Biomass contains cellulose, hemicellulose and lignin content. Pine Needle andSorghum Stover can provide an abundant alternative source of fermentable sugar in the process ofEthanol Production (Wilfred Vermerris, Ana Saballos, and Gebisa Ejeta at. April 7, 2007). It contains10-30% (Sorghum Stover) and 27.7% (Pine Needle) total Lignin content (Kim & Day at. 2011). Ligninis one of the important chemical constituents of lignocellulosic materials and it is one of the mostabundant biopolymers in nature. Despite extensive investigation, the complex and irregular structure oflignin is not fully understood. The physical property and the chemical characteristics of lignin vary notonly between different wood species & plant species, but also according to the method of isolation.Moreover, the molecular structure and function groups differ for the various type of lignin.The removal of lignin from wood is a key operation in the manufacturing of high-value paper products.Although most lignin is removed from wood during pulping, the last vestiges must be removed using aseries of oxidation bleaching reactions. But in this work, we isolate lignin from Agriculturallignocellulosic waste (Sorghum Stover and Pine Needle). Historically, this was accomplished usinghypochlorous acid or chlorine. (Reeves, D. W. The principles of bleaching. Tappi/Bleach PlantOperations Short Course, 1992). Recently, environmental concerns have lead to the development ofalternative bleaching agents, including chlorine dioxide, ozone, and hydrogen peroxide. (Mcdonough,T. Recent advances in bleached chemical pulp manufacturing technology. Tappi or., 1995, 78(March)).Delignification of Sorghum Stover and Pine Needle is followed by Para Acetic Acid/ Para Formic AcidTreatment (PFA/PAA) which help in to remove the cooking liquor (i.e. lignin + hemicelluloses mixedwith formic acid) from cellulose. And in this work, Bleaching process is done by using hydrogenperoxide solution.Vanillin, bio-based Polymer and thermoplastic polymer are produced by lignin. (Maxence Fache,Bernard Boutevin at. 2016 & Cui C, Sadeghifar H, Sen S, Argyropoulos DS (2013). Lignin has variousapplications in cement industry, water treatment formulation and textile industry.
2. MATERIAL AND METHODS
2.1. PulpingTake 5g of Pine needle and 5g of Sorghum Stover of lignocellulosic biomass and cut it into a smallsize. Place the cut size of biomass in the 250ml of conical flask. Add the mixture of 85% organic acid

National Conference on Emerging Trends in Science, Technology and Management, 11-12 Nov 2017, ISBN: 978-93-5281-325-4 Page 92
in flask (ratio of Formic acid/ Acetic acid mixture of 70:30 by volume). Now flask was allowed to boilin Hot Plate for 2 hours.When the mixture gets boiled then after 2 hour, cool the mixture at room temperature. Now the liquidwas filtered using muslin cloth and buncher funnel by squeezing the fiber. After squeezing, the fiberswere further washed with 80% formic acid. Then it was followed washing by Hot Distilled water.
2.2. PFA/PAA Treatment
After pulping step, Pulp was further delignified by treating them with a mixture of Para Acetic Acid/Para Formic Acid Solution (prepared by adding solution 8ml, 35% hydrogen peroxide with 85%formic/acetic acid mixture) & placed it in a hot water bath at 80⁰C for 2 hours. Now, the delignifiedfibers are filtered by using buncher funnel and muslin cloth to separate cooking liquor (i.e. lignin+hemicellulose mixed with formic acid) from cellulose. Further the delignified fibers were washed withhot distilled water
2.3. Bleaching
Delignified fibers is subjected to bleaching by treating with 14ml 35% H₂O₂ solution (pH 11-12) in hotwater bath at 80⁰c for 2 hours. Now the pulp is washed with distilled water to remove residual lignin.Above process is repeated again to remove lignin completely.
2.4. Isolation of Lignin
Spent liquor was heated at 105⁰C after pulping & delignification process. Lignin dissolved in formicacid is precipitate by adding distilled water (five times more than volume of concentrated liquor). Now,the precipitate was filtered by Buncher funnel. Further precipitate of lignin was washed with distilledwater & vacuum dried over P₂O₅.
3. RESULT AND DISCUSSION
Lignin was isolated from the agriculture waste such as Pine needle and Sorghum Stover using ParaFormic Acid/ Para Acetic Acid (PFA/PAA) resulted in the removal of cooking liquor i.e. mixture oflignin and hemicelluloses with formic acid from cellulosic fibers. Hydrogen peroxide was used inBleaching process to remove residual lignin content from fiber. Finally, lignin was isolated frombiomasses as shown in Fig 3.4. Isolation of Lignin. This lignin has various applications in chemical,cement and textile industries.
Vanillin is currently one of the only molecular phenolic compounds manufactured on an industrialscale from biomass. It has thus the potential to become a key-intermediate for the synthesis of bio-based polymers, for which aromatic monomers are needed to reach good thermo-mechanical properties.Vanillin is uses in building block of chemical industry. And most interesting part of this Vanillin is, itis produced by lignin that is isolated from biomass.Current research trends in lignin-based materials for engineering applications, including strategies formodification of lignin, fabrication of thermoset/thermoplastic/biodegradable/rubber/foam composites,and the use of lignin as a compatibilizer are presented. This study will increase the interest ofresearchers all around the globe in lignin-based polymer composites and the development of new ideasin this field.
REFERENCES
[1.] Martone, Pt; Estevez, Jm; Lu, F; Ruel, K; Denny, Mw; Somerville, C; Ralph, J ."Discovery of Lignin inSeaweed Reveals Convergent Evolution of Cell-Wall Architecture.” Current Biology. Jan 2009, 19 (2):169–75.
[2.] Reeves, D. W. The principles of bleaching. Tappi/Bleach Plant Operations Short Course, 1992 1-12.[3.] Mcdonough, T. Recent advances in bleached chemical pulp manufacturing technology. Tappi or., 1995,
78.[4.] Santiago, D., Rodriguez, A., Hamilton, J., Senior, D.J., Szwec, J., Ragauskas, A.J. "Applications of Endo-
(1,4)-p-D-Xylanase in the Pulp and Paper Industry" in Industrial Biotechnological Polymers, Ed. Gebelein,C.G., Carraher, C.E., Jr.,Technomic Publishing Company, Inc., Lancaster, PA (1995).
[5.] Gellerstedt, G. and Lindfors, E. On the structure and reactivity of residual lignin in kraft pulp fibers.International Pulp Bleaching Conference, Stockholm, Vol. 1(1991), 73-88.
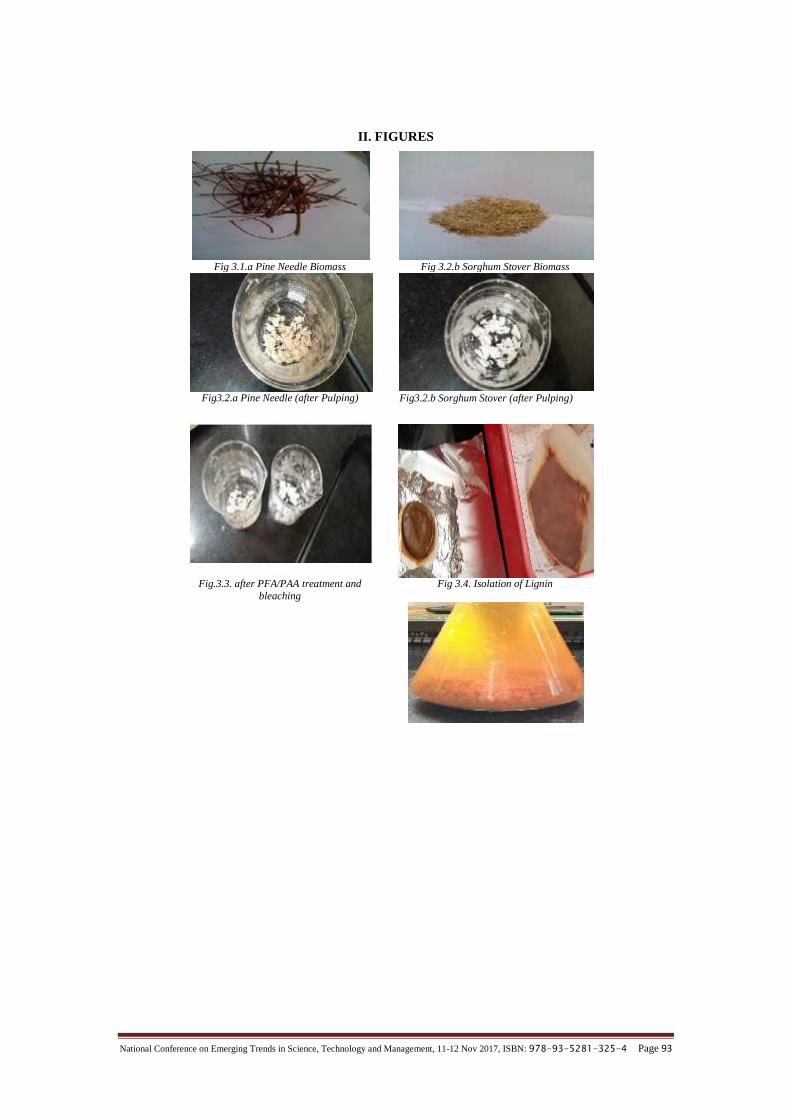
National Conference on Emerging Trends in Science, Technology and Management, 11-12 Nov 2017, ISBN: 978-93-5281-325-4 Page 93
II. FIGURES
Fig 3.1.a Pine Needle Biomass Fig 3.2.b Sorghum Stover Biomass
Fig3.2.a Pine Needle (after Pulping) Fig3.2.b Sorghum Stover (after Pulping)
Fig.3.3. after PFA/PAA treatment andbleaching
Fig 3.4. Isolation of Lignin

National Conference on Emerging Trends in Science, Technology and Management, 11-12 Nov 2017, ISBN: 978-93-5281-325-4 Page 94
SOLAR-WIND-BIOMASS HYBRID POWERGENERATION PLANT–A REVIEW
AbhishekAnguria,Department of Electrical Engineering,
Ashoka Institute of Technology & Management, Paharia, Varanasi, [email protected]
Mr. Somendra BanerjeeDepartment of Electrical Engineering,
Ashoka Institute of Technology & Management, Paharia, Varanasi, [email protected]
Dr. Sarika ShrivastavaAshoka Institute of Technology & Management, Paharia, Varanasi, India
Abstract - Increasing electricity demands, environmental concerns, and hike in fuel prices are the mainfactors which motivate the use of renewable energy in India. This paper includes the study of combinedbiomass, wind and solar hybrid system for generation of electric power. This system will help to conquerfrom global warming effect. In the hybrid system energy has a more consistency, can be cost effective andalso improves the quality of life in rural areas. The aim of hybrid power system is to increase the systemefficiency. In this work the researchers will introduce biomass, wind and solar energy for generation ofelectricity. Solar energy is available free of cost and installation cost of solar power plant is high but itsoperating cost is negligible. This paper discusses the renewable biomass, wind and solar PV combinedpower generation system in village or cities to overcome those problems which occurred when they operatestandalone.
Keywords – Review study: solar, wind and biomass, hybrid system, advantages and disadvantages, conclusion.
1. INTRODUCTION
Energy play very important role for the progress of a nation and it has to be conserved in a mostefficient manner. Energy should be produced in a most environment-friendly way from all varieties offuels as well as should be conserved efficiently. The use of Renewable Energy technology has beensteadily increasing so as to meet demand. However, there are some drawbacks associated withrenewable energy systems such as poor reliability and lean nature. The installation and distributioncosts are considerably higher for remote areas. Due to increase in demand of electric power we haveneed for the growth of non-conventional methods for generation of electric power [1,2].
2. AVAILABILITY OF RESOURCES
As materials used for these methods are easy available, cost of electricity will be lesser.Several different sources of energy are being thought of, including the nuclear, geothermal, wind, tidal,solar, biomass and the biogas based. Presently, standalone solar PV systems, biomass and wind energysystems have been promoted around the globe on a relatively larger scale. In solar plants, solar panelsare too costly, energy only produced during day time and in sunny weather. Similarly, biomass plantsmay save on carbon dioxide emissions, but it increases methane gases, high ash content, and heatrelease into environment and in wind power plant the installation cost are very high and operationdependent on wind. So to get optimal generation conditions, researcher could use the combinedoperation of the wind, biomass and solar power plant [3,4].
3. HYBRID POWER PLANT
A combination of different cooperating energy systems (which are complementary in nature) based onrenewable energies, working with some back up sources, is known as a Combined (Hybrid) powersystem. Solar energy can be considered as uncontrolled source. The sources are uncontrolled becausetheir availability is totally dependent on the climate condition. Wind power generation is alsoconsidered as uncontrolled source and dependent on the climate condition. Controlled sources are thesources, whose power production can be controlled. Biomass, biogas etc can be considered ascontrolled source of energy. It is perfect for electrification of remote areas in India. The new form ofpower generation is usually a type which is able to modulate power out function of demand. India isprepared to offer reliable off-grid and hybrid solutions energy needs for small area especially ruralareas where powering critical loads are often an analysis [5, 6].

National Conference on Emerging Trends in Science, Technology and Management, 11-12 Nov 2017, ISBN: 978-93-5281-325-4 Page 95
4. SOLAR ENERGY AND ITS POTENTIAL
Solar energy is, simply, energy provided by the sun. Electricity can be produced directly fromphotovoltaic, PV cells (Photovoltaic literally means “light” and “electric”). These cells are made frommaterials which exhibit the photovoltaic effect. In use, solar energy produced no emissions. Themajority of solar PV installations in Australia are grid connected systems. It is an important source ofrenewable energy and its technologies are broadly characterized as either passive solar or active solardepending on how they capture and distribute solar energy or convert it into solar power. The UnitedNations Development Program in its 2000 World Energy Assessment found that annual potential ofsolar energy was 1575 to 49837 exa-joules (EJ). This is several times larger than the world energyconsumption which was 559.8 EJ in 2012.In 2011, the International Energy Agency said that "the development of affordable, inexhaustible andclean solar energy technologies will have huge longer-term benefits” [7].The Earth receives 174 petawatts (PW) of incoming solar radiation (insolation) at theupper atmosphere. Approximately 30% is reflected back to space while the rest is absorbed by clouds,oceans and land masses. Most of the world's population lives in areas with insolation levels of 150-300watts/m², or 3.5-7.0 KWh/m² per day. Solar radiation is absorbed by the Earth's land surface, oceanswhich cover about 71% of the globe and atmosphere. The total solar energy absorbed by Earth'satmosphere, oceans and land masses is approximately 3,850,000 exajoules (EJ) per year. The amountof solar energy reaching the surface of the planet is so vast that in one year it is about twice as much aswill ever be obtained from all of the Earth's non-renewable resources of coal, oil, natural gas, andmined uranium combined [8].
5. ADVANTAGES OF SOLAR ENERGY
1. Renewable energy source.2. Reduces electricity bills.3. Low maintenance costs.4. Technology development.
6. SOLAR ENERGY DISADVANTAGES
High initial cost is:1. Weather dependent.2. Solar energy storage is expensive.3. Uses a lot of space.
7. WIND ENERGY
Wind is a form of solar energy. Winds are caused by the uneven heating of the atmosphere by the sun,the irregularities of the earth's surface, and rotation of the earth. Wind power systems convert thekinetic energy of the wind into other forms of energy such as electricity. Wind farms consist of manyindividual wind turbines which are connected to the electric power transmission network [9]. Windpower is an inexpensive source of electric power, competitive with or in many places cheaper than coalor gas plants. Wind power gives variable power which is very consistent from year to year but whichhas significant variation over shorter time scales. It is therefore used in conjunction with other electricpower sources to give a reliable supply [10, 11].
8. ADVANTAGES OF WIND ENERGY [12]
A. Wind energy is an inexhaustible source of energy and is virtually a limitless resource.B. Energy is generated without polluting environment.C. This source of energy has tremendous potential to generate energy on large scale.D. Windmill generators don’t emit any emissions that can lead to acid rain or greenhouse effect.E. In remote areas, wind turbines can be used as great resource to generate energy.F. In combination with solar energy they can be used to provide reliable as well as steady supply
of electricity.
9. DISADVANTAGES OF WIND ENERGY [12]
A. Wind energy requires expensive storage during peak production time.B. It is unreliable energy source as winds are uncertain and unpredictable.C. Requires large open areas for setting up wind farms.

National Conference on Emerging Trends in Science, Technology and Management, 11-12 Nov 2017, ISBN: 978-93-5281-325-4 Page 96
D. Wind energy can be harnessed only in those areas where wind is strong enough and weather iswindy for most parts of the year.
E. Maintenance cost of wind turbines is high as they have mechanical parts which undergo wearand tear over the time.
10. BIOMASS ENERGY
Biomass is a renewable energy resource from organic material. The biomass resource can be convertedinto more convenient gaseous form by taking various forms, such as wood waste, agricultural residue,animal waste, energy crops and etc [13].Biomass is an industry term for getting energy by burning wood, and other organic matter. Biomassmost often refers to plants or plant-based materials that are not used for food or feed, and arespecifically called lignocellulosic biomass. As an energy source, biomass can either be used directly viacombustion to produce heat, or indirectly after converting it to various forms of biofuel [14].Conversion of biomass to biofuel can be achieved by different methods which are broadly classifiedinto: thermal, chemical, and biochemical methods. Even today, biomass is the only source of fuel fordomestic use in many developing countries. Biomass is all biologically-produced matter based incarbon, hydrogen and oxygen [15]. The estimated biomass production in the world is 104.9 petagrams(104.9 × 10¹⁵ gram about 105 billion metric tons) of carbon per year, about half in the ocean and halfon land. Wood remains the largest biomass energy source today; examples include forest residues (suchas dead trees, branches and tree stumps), yard clippings, wood chips and even municipal solid waste.Harvested wood may be used directly as a fuel or collected from wood waste streams to be processedinto pellet fuel or other forms of fuels. The largest source of energy from wood is pulping liquor or"black liquor," a waste product from processes of the pulp, paper and paperboard industry [16, 17].Based on the source of biomass, biofuels are classified broadly into two major categories. First-generation biofuels are derived from sources such as sugarcane and corn starch. Second-generationbiofuels, on the other hand, utilize non-food-based biomass sources such as agriculture and municipalwaste. These biofuels mostly consist of lignocellulosic biomass, which is not edible and is a low-valuewaste for many industries. Despite being the favored alternative, economical production of second-generation biofuel is not yet achieved due to technological issues [18].
11. BIOMASS FUELS
Biomass fuels are organic materials produced in a renewable manner. Municipal solid waste (MSW) isalso a source of biomass fuel. Biomass Power Plant needs woody fuels, forestry residues, mill residues,agricultural residues, urban wood and yard wastes, dedicated biomass crops, chemical recovery fuels,animal wastes, dry animal manure, wet animal manure etc to produce hot steam in boiler [19].
12. BIOMASS BOILER
Biomass boilers are very similar to conventional gas boilers that provided with space heating and hotwater for the entire home, but instead of using gas (or oil) to produce the heat, theycombust sustainably sourced wood pellets.Biomass boilers are normally substantially bigger than their fossil fuel burning boilers though, for anumber of reasons. Firstly since they are burning wood pellets as opposed to gas, the boiler needs to belarger to hold the larger volume of fuel [20].Every four weeks or so, the biomass boiler will need to be emptied of the ash. This can be put straightonto a compost heap to help fertilize the soil. Biomass boilers are designed to work all year round.They can be coupled with solar heating or an electric shower, providing hot water for washing only,during the warmer summer months [21].
13. ADVANTAGE OF BIOMASS POWER GENERATION
A. It’s a renewable form of energy.B. It’s carbon neutral.C. Widely available.D. It’s cheaper compared to fossil fuels.E. Minimizes overdependence on traditional electricity.F. Reduces amount of waste in landfills.

National Conference on Emerging Trends in Science, Technology and Management, 11-12 Nov 2017, ISBN: 978-93-5281-325-4 Page 97
Fig. Biomass Boiler Efficiency
14. DISADVANTAGES OF BIOMASS POWER GENERATION
While the upsides to biomass energy are plenty, it’s not exactly a perfect source of energy. Here are thedownsides to biomass energy:
A. Not entirely clean.B. Risk of deforestation.C. Requirea great deal of water.
15. DESIGN OF SOLAR-WIND-BIOMASS HYBRID POWER PLANT
Here is the combination of solar power, wind power and biomass to make hybrid power generationsystem. All three systems generate electrical energy at output. In India wind and solar energy sourcesare available all over the year at free of cost. Whereas tidal and wave are coastal area. To meet thedemand and for the sake of continuity of power supply, storing of energy is necessary. The term hybridpower system is used to describe any power system combine two or more energy conversion devices,or two or more fuels for the same device, that when integrated, overcome limitations inherent in either.
16. WORKING OF THE SYSTEM
A steam turbine is connected to from biomass boiler. When the hot steam is expand through boilerpipes and nozzle into the turbine and then nozzle increases the pressure of hot steam and rotates thesteam turbine.This steam turbine is coupled with an alternator which converts the mechanical energy of steam turbineinto electrical energy and then a voltage regulator is connected in series with it to regulate the powersupply. The electrical power generates from biomass system is AC in nature, so also an AC filter isconnected in series with voltage regulator to remove ripples and harmonics.And also the output of biomass alternator is connected to AC to DC Converter which converts ACsupply into DC and this DC supply can be stored in the same battery banks which will be used in solarpower system.In Solar Power generation system, solar panels are used to convert the light energy of sun into electricalenergy directly. This electrical energy is DC in nature, so we need bank of batteries to store thiselectrical power. An inverter is used to convert this stored DC electrical energy into an AC electricalenergy. A voltage regulator is used to regulate the supply voltage and an AC filter is used to removeripples and harmonics from it.In Wind Power generation system, wind turbines are installed at the top of strong iron tower. Theheight of tower should be high and installed in large fields where the wind is easily available and alsospeed of wind is quite good. When the wind blows the shaft of wind turbine rotates and this shaft iscoupled with an alternator. Therefore, the kinetic energy of wind is converted into mechanical energyand this mechanical energy drives an alternator in which mechanical energy is further converted intoelectrical energy. The generated electrical energy is AC in nature. So a voltage regulator is needed toregulate the supply voltage and an AC filter is used to removes harmonics and ripples from linevoltage. And also a part of generated AC electrical energy is converted into DC by AC to DC converterand stored in same battery banks which are used in solar power system.In whole system, a single AC filter is used which receives the electrical power from all three systemand after removing harmonics and ripples, the electrical power is supplied to the AC load.

National Conference on Emerging Trends in Science, Technology and Management, 11-12 Nov 2017, ISBN: 978-93-5281-325-4 Page 98
And also the battery bank is connected to DC voltage regulator which regulates DC voltage and a DCfilter is connected to remove DC ripples and DC harmonics. Thus the battery banks can supply DCpower to DC loads directly.
Fig.Arrangement of Solar-Wind-Biomass Power Plant System
17. SOLAR POWER PLANT COST IN INDIA & ESTIMATED GENERATEDkWh AND EFFICIENCY
The capital cost of solar power plant technology is available at Rs 3.50 crore per MW now-a-days.On average in India weather conditions a 1 kW solar panel produces 5 kWh per day or 1200 kWh to1800 kWh of electricity a year. The efficiency is around 20% [22].
18. GROWTH OF SOLAR POWER IN INDIA
State MW as of 31-Mar-2015
MW as of 31-Mar-2016
MW as of 31-Jan-2017
MW as of 31-Aug-2017
Rajasthan 942 1269 1317 2219Punjab 185 405 592
Uttar Pradesh 71 143 269Uttarakhand 5 41 45
Haryana 13 15 73Delhi 5 14 39J & K 0 1 1
Chandigarh 4.50 6.81 16.20Himachal Pradesh 0 0.20 0.33Northern Regions 2353.93
Gujarat 1000 1119 1159 1384Maharashtra 360 385 430Chhattisgarh 7.60 93.58 135
Madhya Pradesh 558.58 776.37 850.35 1352Daman & Diu 0 4 4
Southern Region 2580.37Tamil Nadu 142.58 1061.8 1591 1804
Andhra Pradesh 137.85 572.97 979.65 2153Telangana 167 527.84 1073.41 2792
Kerala 0.03 13.05 15.86
State MW as of 31-Mar-2015
MW as of 31-Mar-2016
MW as of 31-Jan-2017
MW as of 31-Aug-2017
Karnataka 77.22 145.46 341.93 1649Western Region 4001.85
Bihar 0 5.10 95.91Odisha 31.76 66.92 77.64
Jharkhand 16 16.19 17.51West Bengal 7.21 7.77 23.07
Eastern Region 241.14

National Conference on Emerging Trends in Science, Technology and Management, 11-12 Nov 2017, ISBN: 978-93-5281-325-4 Page 99
Assam 0 0 11.18Tripura 5 5 5.02
Arunachal Pradesh 0.03 0.27 0.27North Eastern
Region 17.09
Andaman & Nicobar 5.10 5.10 5.40Lakshadweep 0.75 0.75 0.75
Others 0.00 58.31 61.70Islands and Others 67.85
Total 3743.97 6762.85 9235.24 16200* Above installed solar power capacity by state as of 31 August 2017 [23, 24].
19. WIND POWER PLANT COST IN INDIA & ESTIMATED GENERATEDkWh AND EFFICIENCY
The capital cost of wind power plant is slightly higher than fossil fuel power plant but much lower thana solar power plant.Now-a-days, for a wind farm, the capital cost ranges between Rs 4.50 crore to Rs 6.80 crore per MW,depending upon the type of turbine, technology, size and location.The running cost of a wind farm is very low as fuel cost is zero and operations and maintenance costsare also very low.Industry estimates project an annual output of 30% to 40%, but the real world experiences shows thatannual outputs of 15% to 30% of capacity are more typical [25].With a 25% Capacity Factor for 1 MW turbine,KWh = 1 MW × 365 days × 24 hours × 25%KWh = 2190 MWhKWh = 21,90,000 kWh in a year
20. WIND POWER CAPACITY IN DIFFERENT STATES IN INDIA
S. No. State Capacity (in MW)1 Tamil Nadu 7684.31 MW2 Maharashtra 4664.08 MW3 Gujarat 4227.31 MW4 Rajasthan 4123.35 MW5 Karnataka 3082.45 MW6 Madhya Pradesh 2288.60 MW7 Andhra Pradesh 1866.35 MW8 Telangana 98.70 MW9 Kerala 43.50 MW10 Others 4.30 MW
Total Capacity 28082.95 MW* Above installed wind capacity by state as of 31 March 2017 [26, 27].
21. BIOMASS POWER PLANT COST IN INDIA AND EFFICIENCY
The capital cost of installation of biomass power plant project in India till 2017 is in the ranges of Rs4.50 crore to Rs 5.0 crore per MW, depending upon technical, financial and operating parameters.Costs of generation are expected to vary from Rs 3.25 to Rs 3.75 per KWh, depending upon the plantload factor.The amount of biomass needed in kilograms per hour to generate 1 MW of electrical power is 20.4 MJper Kg. The overall conversion efficiency for 1 MW biomass power plant is 15% and conversionefficiency for 2 MW biomass power plant is 20% and conversion efficiency for 20 MW biomass powerplant is 21% and conversion efficiency for 80 MW biomass power plant is 22%. And the plant set upcost is gradually decreased for higher MW’s production biomass power plant [28].
22. BIOMASS POWER PLANT CAPACITY IN DIFFERENT STATES ININDIA
S. No. State Capacity (in MW)1 Andhra Pradesh 380.75 MW2 Bihar 43.42 MW

National Conference on Emerging Trends in Science, Technology and Management, 11-12 Nov 2017, ISBN: 978-93-5281-325-4 Page 100
S. No. State Capacity (in MW)3 Chhattisgarh 279.9 MW4 Gujarat 56.3 MW5 Haryana 45.3 MW6 Karnataka 872.18 MW7 Madhya Pradesh 35 MW8 Maharashtra 1220.78 MW9 Odisha 20 MW
10 Punjab 155.5 MW11 Rajasthan 108.3 MW12 Tamil Nadu 626.9 MW13 Uttarakhand 50 MW14 Uttar Pradesh 842 MW15 West Bengal 26 MW
Total Capacity 4831.33 MWAbove installed biomass power projects as on 01 January 2017 [29].
23. TOTAL INSTALLATION COST OF SOLAR-BIOMASS-WIND HYBRIDPOWER GENERATION PLANT
Solar power plant = Rs 3.50 crore per MWWind power plant = Rs 5.0 crore per MWBiomass power plant = Rs 5.0 crore per MWTotal cost = Rs 10.0 croreapprox for a MW (combined)
24. TABLE FOR HIGHER HEATING VALUES AND LOWER HEATINGVALUES (in MJ/Kg) FOR BIOMASS FUEL [30]
Fuel Types Higher HeatingValue (MJ/Kg)
Lower Heating Value(MJ/Kg)
1. Agricultural ResiduesCorn stalks/Stover 17.6-20.5 16.8-18.1Sugarcane bagasse 15.6-19.4 15-17.9
Wheat straw 16.1-18.9 15.1-17.72. Herbaceous Crops
Miscanthus 18.1-19.6 17.8-18.1Switchgrass 18-19.1 16.8-18.6
Bamboo 19-19.8 -3. Woody Crops
Black locust 19.5-19.9 18.5Eucalyptus 19-19.6 18
Hybrid poplar 19-19.7 17.74. Forest Residues
Hardwood wood 18.6-20.7 -Softwood wood 18.6-21.1 17.5-20.8
25. COMPARISON OF THREE HYBRID POWER PLANTS OVER TWOHYBRID POWER PLANTS
The reliability of three hybrid power plant is more than two hybrid power plant because solar powerdepends upon sun rays and wind power is depends upon wind condition i.e. both are dependent butbiomass is independent of such factors as it does not needs sun rays and wind flow etc.The durability of three hybrid power plant is more than two hybrid power plant because if any oneplant is under maintenance or need to repair some parts then one of the plants can operate to generateelectricity to maintain continuous power supply.The efficiency of three hybrid power plant is more than two hybrid power plant because at a time twoor all three plants can operate simultaneously in a fault condition to share equal loads on each tomaintain power supply like normal conditions.

National Conference on Emerging Trends in Science, Technology and Management, 11-12 Nov 2017, ISBN: 978-93-5281-325-4 Page 101
The hybrid solar and wind power plants are weather dependent, but combination of this two hybridpower plant with biomass energy makes it independent of weather conditions because biomass powerplant does not needs sun rays and wind flow.The installationcost of three hybrid power plant is more than two hybrid power plant because of oneadditional power plant i.e. biomass power plant.
Parameters Two Hybrid Plant Three Hybrid Plant
Reliability Average Good
Durability Good More than two hybrid plantsEfficiency Good More than two hybrid plants
Weather Dependent Yes Yes, but less than two hybrid plantsPlant life Cycle Good More than two hybrid plantsInstallation Cost High More than two hybrid plants
26. CONCLUSION
From the review it is concluded that-(i). Biomass based hybrid systems are environmental friendly and sustainable.(ii). Biomass, solar and wind resources are easily available anywhere in India.(iii).The availability of solar energy and wind energy is free of cost.(iv).The biomass resources is easily available at very low cost in India.(v). Hybrid Systems have proved to be the best option to deliver “high quality’ continuous energyservices to rural areas at the lowest economic cost and with maximum social and environmentalbenefits.(vi). By using these renewable resources, the dependency on conventional power plants is less and savein fossil fuel i.e coal, diesel, gas etc.(vii).By using this hybrid power scheme, there is reduction in electricity bill amount.
REFERENCES
[1] Er. PankajBodhwall&PoonamRahira. “A Hybrid solar-wind power generation system, Desigining&Specifications”, IJEEE, Vol-08, 2016
[2] Sandeep Kumar, Vijay Kumar Garg, “ A Hybrid model of solar-wind power generation system”, IJAREEIEAugust 2013
[3] A. Traca de Almedia, A. Martins, H.Jesus& J. Climaco, “Source Reliability in a Combined Wind-Solar-Hydro System”, IEEE Transactions on a Power Appratus and System Vol. PAS – 102, No. 6, June 2013.
[4] W. D. Kellogg, M. H. Nehrir, V. Gerez and G. Venkataramanan, “Geneartion Unit Sizing and Cost Analysisfor Stand-Alone Wind, Photovoltaic, and Hybrid Wind/PV systems,” IEEE Trans. On Energy Conversion,vol. 13, No. 1, Mar. 1998.
[5] M. S. Islam and T. Mondal, (2013) “Potentiality of Biomass Energy for Electricity Generation inBangladesh.” Asian Journal of Applied Science and Engineering, vol. 2, no. 2, pp.103-110
[6] National Renewable Energy Laboratory [Online] Available:http://www.nrel.gov/international/tools/HOMER/homer.html
[7] Ministry of New and Renewable Energy Guidelines for generation based incentive, grid interactive solarthermal power generation projects (2008).
[8] Al-AshwalAM, Moghram IS. Proportion assessment of combined PV–wind generating systems. RenewEnergy 1997; 10(1):43–51.
[9] Perez-Navarro A, Alfonso DAC, Ibanez F, Segura CSI. Hybrid biomass-wind power plant for reliable energygeneration. Renew Energy2010;35(7): 1436–43.
[10] www.wikipedia.org/hybrid-solar-wind- plant.html[11] G.D. Rai, “Non-Conventional Energy Sources” Publication Khanna. Edition 2011.[12] www.hybrid-power-plant-advantages-disadvantages.html[13] www.mnes.nic.inwww.mnes.nic.ins[14] http://en.wikipedia.org/wiki/Biomass[15] www.claverton-energy.com/owing-and-opearting-costs-of-waste-and-biomass-power-plants.html[16] M. Ahiduzzaman, (2007) “Rice Husk Energy Technologies in Bangladesh” Agricultural Engineering
International: the CIGR Ejournal. Invited Overview No. 1. Vol. IX[17] M. S. Islam and T. Mondal, (2013) “Potentiality of Biomass Energy for Electricity Generation in
Bangladesh.” Asian Journal of Applied Science and Engineering, vol. 2[18] HuaGuanghui and Weiguo He 2011 “The status of biomass power generation and its solution in our country”
InternationalConference on Advanced Power System Automation and Protection (APAP), pp. 157-161.
[19] www.biomassenergy.com[20] www.wikipedia.org/wiki/solar-wind-biomass-hybrid-power-plant

National Conference on Emerging Trends in Science, Technology and Management, 11-12 Nov 2017, ISBN: 978-93-5281-325-4 Page 102
[21] ZelalemGirma “Hybrid renewable energy design for rural electrification in Ethiopia” Journal of energyTechnologies and Policy www.iiste.org Vol. 3, No. 13, 2013.
[22] www.solarmango.com/ask[23] www.solarpowerenergy.co.in[24] India to reach 20 GW of installed solar capacity by FY18-end: report/wiki/recent. Retrieved 2017-09-19[25] www.windpowerenergy.com[26] State wise wind power installed capacity as of 31 March 2017/wiki/recent. Retrieved 11 August 2017.[27] Installed capacity of wind power projects in India/wiki/recent. Retrieved 11 August 2017.[28] JanardhanKavali 2013, “Hybrid Solar PV and Biomass system for rural electrification”, ICGSEE-2013, vol.5,
no.2, pp. 802-810.[29] J.D. Nixon, P.K. Dey and P.A. Davies “The Feasibility of hybrid Solar –Biomass Power Plants in India”.[30] C.M. IftekharHussain, Aidan Duffy, Brian Ncrton “ A Comparative Technological Review of Hybrid CSP-
Biomass CHP Systems in Europe” Proceedings of SEEP 2015, 14 August 2015, Paisley
National Conference on Emerging Trends in Science, Technology and Management, 11-12 Nov 2017, ISBN: 978-93-5281-325-4 Page 103
IMPACT OF BAGASSE COGENERATION IN THESUGARCANE INDUSTRIES OF UTTAR PRADESH: A
HOLISTIC REVIEWVijay Kumar Verma1, Sharmila Singh2
1 Assistant Professor, Rajkiya Engineering College Ambedkarnager, Uttar Pradesh, 224122.2 Assistant Professor, Ashoka Institute of technology & management Varanasi, 221007 Uttar Pradesh.
Abstract - To meet the India’s projected power demand over the next 25 years, over 300,000 MW of newgenerating capacity will need to be installed. Cogeneration, the combined generation of steam and electricityis an efficient and cost-effective means to save energy and reduce pollution. India is one of the largestconsumers and producers of sugar in the world and is the world’s second largest producer next to Brazil ofthe sugarcane. Cane industry is a large employment generator right from cultivation, harvesting,transportation to sugar processing in India. India has more than 500 sugar manufacturing units whichmanufacture sugar from sugarcane. In the past two decades after the introduction of cogeneration, most ofthe sugar units have opted for it and the installed capacity is 3300 MW.Country has made impressivegrowth in the bagasse cogeneration. However, sustaining the growth is the real challenge.This article provides an overview of the historical growth, technological and current status of bagassecogeneration, bagasse contribution towards sugarcane industries development and fiscal support extendedby the Government of India as well as state governments to bagasse cogeneration. India produces nearly 42MMT (Million Metric Tonne) of bagasse, which is mostly used as a captive boiler fuel other than its minoruse as a raw material in the paper industry. Sugar mills in the country especially in the private sector haveinvested in advanced cogeneration systems by employing high-pressure boilers and condensing cumextraction turbines.
Keywords: Bagasse Cogeneration, Cogeneration Status, fiscal support by the Government, UPSugar Mills.
1. INTRODUCTION
Biomass has always been an important energy source for the country considering the benefits it offers.It is renewable, widely available, carbon-neutral and has the potential to provide significantemployment in the rural areas. Biomass is also capable of providing firm energy. About 32% of thetotal primary energy use in the country is still derived from biomass and more than 70% of thecountry’s population depends upon it for its energy needs. Ministry of New and Renewable Energy hasrealised the potential and role of biomass energy in the Indian context and hence has initiated a numberof programmes for promotion of efficient technologies for its use in various sectors of the economy toensure derivation of maximum benefits Biomass power generation in India is an industry that attractsinvestments of over Rs.600 crores every year, generating more than 5000 million units of electricityand yearly employment of more than 10 million man-days in the rural areas. For efficient utilization ofbiomass, bagasse based cogeneration in sugar mills and biomass power generation have been taken upunder biomass power and cogenerationprogramme. Biomass power & cogeneration programme isimplemented with the main objective of promoting technologies for optimum use of country’s biomassresources for grid power generation. Biomass materials used for power generation include bagasse,rice husk, straw, cotton stalk, coconut shells, soya husk, de-oiled cakes, coffee waste, jute wastes, andgroundnut shells, saw dust etc.The Potential current availability of biomass in India is estimated at about 500 million metric tons peryear. Studies sponsored by the Ministry has estimated surplus biomass availability at about 120 – 150million metric tones per annum covering agricultural and forestry residues corresponding to a potentialof about 18,000 MW. This apart, about 7000 MW additional power could be generated throughbagasse based cogeneration in the country’s 550 Sugar mills, if these sugar mills were to adopttechnically and economically optimal levels of cogeneration for extracting power from the bagasseproduced by them.The concept of simultaneous generation of electricity and thermal energy is called cogeneration. Itproduces two forms of energy from a single fuel source. One of the forms of energy must always beheat and the other may be electrical or mechanical energy. One of the common examples where thistechnology is used is sugar production. Almost all sugar mills in India are traditionally usingcogeneration by using bagasse as a fuel. Sugar production process releases a valuable by-productknown as Bagasse. Basically it is a fibrous material that remains behind after the crushing of sugarcane. Bagasse has good calorific value and burns very easily. Sugar industry requires electricity and

National Conference on Emerging Trends in Science, Technology and Management, 11-12 Nov 2017, ISBN: 978-93-5281-325-4 Page 104
steam in the production process. Here bagasse is being burnt in boilers to produce steam for its use inthe process and turbine generator for power generation. After self-consumption, the surplus electricitywill be available for sale to the grid.
1.1. Promotional policy for the cogeneration and other biomass based powerprojects by the Government
1. Indian Renewable Energy Development Agency (IREDA) provides loan for setting up biomasspower and bagasse cogeneration projects.
2. For private sector, a onetime subsidy will be released after commissioning of project afterassessment of performance of the plant.
3. The Ministry of New & Renewable Energy (MNRE) GoI has been supporting the Cogenerationpower projects by giving back ended subsidy. The 50 % subsidy will be released for sugarfactories developing Cogeneration power projects in cooperative sector / public sector /governmentunder taking/ SPV company (Urja Ankur Trust) through BOOT model after issuance of purchaseorders for larger equipment’s like boiler, turbine etc. The remaining 50 % subsidy could be availedafter commissioning of the project and demonstrating its continuous operation for 90 days (3months) from which 72 hours the plant should run with 80% PLF.
Eligibility of cogeneration power plants under the REC mechanism: If sugar mill has a biomasscogeneration based power plant, they are eligible to earn RECs subject to these power plants are gridconnected and have PPA with DISCOM at APPC price (As per the CERC guidelines, the powerproducer has to sign a PPA with the state utilities at a price equal to the Average Power PurchaseCost price. The APPC price for a state for a particular time period is determined by the State ElectricityRegulatory Commissions). Grid connected cogeneration power plants that provide electricity forcaptive uses are also eligible to earn RECs.As per the news by Press Information Bureau, Ministry ofNew and Renewable Energy (MNRE) provides financial incentives for surplus electricity generated byutilizing optimum cogeneration by the sugar mills. By the end of August 2013, a total of 213 sugarmills have installed bagasse optimum cogeneration plants with a total installed capacity of about 2,332MW under the scheme on biomass based cogeneration to generate electricity and its subsequent sale.Sugar industry has been traditionally practicing cogeneration by using bagasse as a fuel. With theadvancement in the technology for generation and utilization of steam at high temperature andpressure, sugar industry can produce electricity and steam for their own requirements. It can alsoproduce significant surplus electricity for sale to the grid using same quantity of bagasse. For example,if steam generation temperature/pressure is raised from 400oC/33 bar to 485oC/66 bar, more than 80KWh of additional electricity can be produced for each ton of cane crushed. The sale of surplus powergenerated through optimum cogeneration would help a sugar mill to improve its viability, apart fromadding to the power generation capacity of the country.
2. CENTRAL FINANCIAL ASSISTANCE AND FISCAL INCENTIVES
CFA for Biomass Power Project and Bagasse Cogeneration Projects byPrivate/Joint/Coop./Public Sector Sugar Mills
Special Category States(Ne Region,Sikkim, J&K, HP& Uttaranchal)
Other States
Project Type Capital Subsidy Capital Subsidy
Biomass Power projects Rs.25 lakh X(CMW)(Maximum support of Rs. 1.5Crores per project)
Rs.20 lakh X(CMW)(Maximum support ofRs. 1.5 Crores per project)
Bagasse Co-generation byPrivate sugar mills
Rs.18 lakh X(C MW)(Maximum support of Rs. 1.5 Crores perproject)
Rs.15 lakh X (C MW)(Maximum support of Rs. 1.5Crores per project)
Bagasse Co-generationprojects by cooperative/publicsector sugar mills40 bar & above60 bar & above80 bar & above
Rs. 40 lakh *Rs.50 lakh *Rs.60 lakh *Per MW of surplus power@
(maximum support Rs. 6.0 crore perproject)
Rs.40 lakh *Rs.50 lakh *Rs.60 lakh *Per MW of surplus power@
(maximum support Rs. 6.0crore per project)
*For new sugar mills, which are yet to start production and existing sugar mills employing backpressureroute/seasonal/incidental cogeneration, which exports surplus power to the grid, subsidies shall be one-half of thelevel mentioned above.

National Conference on Emerging Trends in Science, Technology and Management, 11-12 Nov 2017, ISBN: 978-93-5281-325-4 Page 105
@ Power generated in a sugar mill (-) power used for captive purpose i.e. net power fed to the grid during seasonby a sugar mill.Note: CFA and Fiscal Incentives are subject to change.
CFA for Bagasse Cogeneration Project in cooperative/ public sector sugar millsimplemented by IPPs/State Government Undertakings or State GovernmentJoint Venture Company / Special Purpose Vehicle (Urja Ankur Trust) throughBOOT/BOLT model
Project Type Minimum Configuration Capital Subsidy
Single coop. mill throughBOOT/BOLT Model
60 bar & above80 bar & above
Rs.40 L/MW of surplus power *Rs.50 L/MW of surplus power*(maximumsupport Rs.6.0 crore/ sugar mill)
* Power generated in a sugar mill (-) power used for captive purpose i.e. Net power fed to the gridduring season by a sugar mill.
CFA for Bagasse Cogeneration Project in existing cooperative sector sugar millsemploying boiler modifications
Project Type Minimum Configuration Capital Subsidy
Existing CooperativeSugar Mill
40 bar & above60 bar & above80 bar & above
Rs.20 L/MW of surplus power *Rs.25 L/MW of surplus power*Rs.30 L/MW of surplus power*
* Power generated in a sugar mill (-) power used for captive purpose i.e. Net power fed to the grid during seasonby a sugar mill. CFA will be provided to the sugar mills who have not received CFA earlier from MNRE underany of its scheme.
Note: CFA and Fiscal Incentives are subject to change.
Fiscal Incentives for Biomass Power Generation
Item Description
Income Tax Holiday Ten years tax holidays.
Customs / Excise Duty Concessional customs and excise duty exemption for machinery and componentsfor initial setting up of Biomass power projects.
General Sales Tax Exemption is available in certain States
3. STATE-WISE/YEAR-WISE LIST OF COMMISSINED BIOMASSPOWER/COGENERATION PROJECTS (AS ON 30.03.2016)
(IN MW)
S.No. StateUpto
31.03.2012 2012-13 2013-14 2014-15 2015-16 Total
1 Andhra Pradesh 363.25 17.5 380.75
2 Bihar 15.5 27.92 43.42
3 Chattisgarh 249.9 15 15 279.9
4 Gujarat 20.5 10 13.4 12.4 56.3
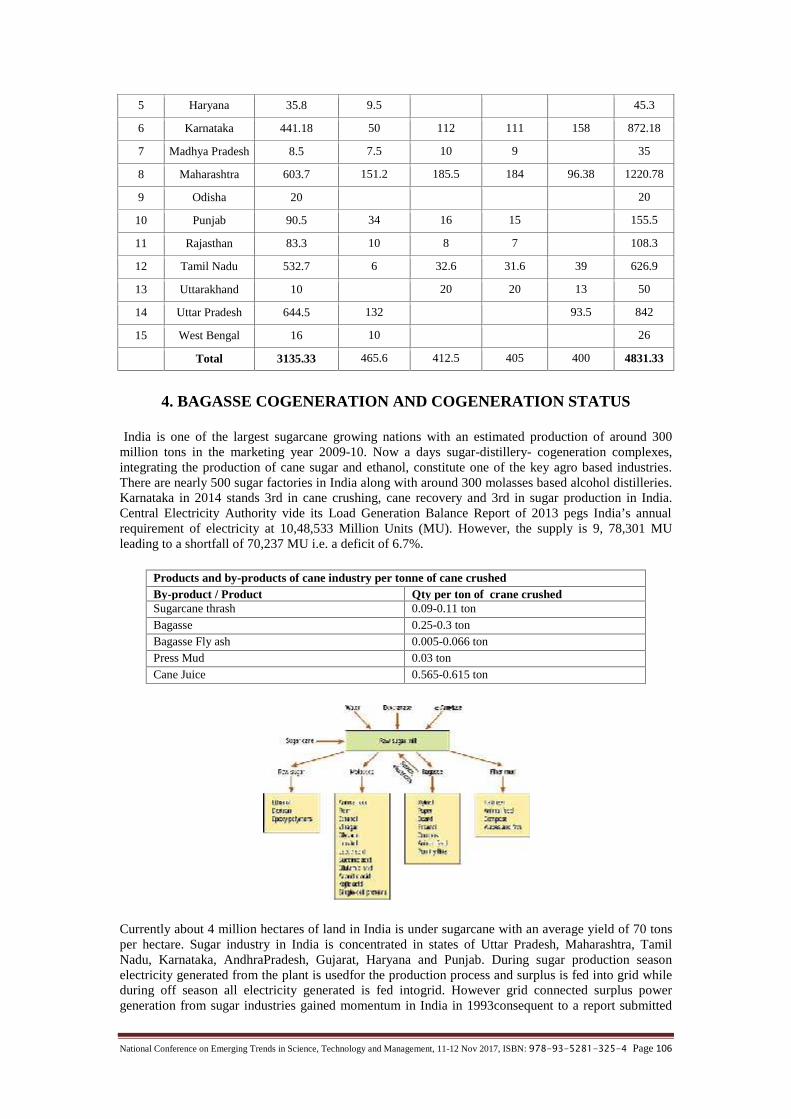
National Conference on Emerging Trends in Science, Technology and Management, 11-12 Nov 2017, ISBN: 978-93-5281-325-4 Page 106
5 Haryana 35.8 9.5 45.3
6 Karnataka 441.18 50 112 111 158 872.18
7 Madhya Pradesh 8.5 7.5 10 9 35
8 Maharashtra 603.7 151.2 185.5 184 96.38 1220.78
9 Odisha 20 20
10 Punjab 90.5 34 16 15 155.5
11 Rajasthan 83.3 10 8 7 108.3
12 Tamil Nadu 532.7 6 32.6 31.6 39 626.9
13 Uttarakhand 10 20 20 13 50
14 Uttar Pradesh 644.5 132 93.5 842
15 West Bengal 16 10 26
Total 3135.33 465.6 412.5 405 400 4831.33
4. BAGASSE COGENERATION AND COGENERATION STATUS
India is one of the largest sugarcane growing nations with an estimated production of around 300million tons in the marketing year 2009-10. Now a days sugar-distillery- cogeneration complexes,integrating the production of cane sugar and ethanol, constitute one of the key agro based industries.There are nearly 500 sugar factories in India along with around 300 molasses based alcohol distilleries.Karnataka in 2014 stands 3rd in cane crushing, cane recovery and 3rd in sugar production in India.Central Electricity Authority vide its Load Generation Balance Report of 2013 pegs India’s annualrequirement of electricity at 10,48,533 Million Units (MU). However, the supply is 9, 78,301 MUleading to a shortfall of 70,237 MU i.e. a deficit of 6.7%.
Products and by-products of cane industry per tonne of cane crushedBy-product / Product Qty per ton of crane crushedSugarcane thrash 0.09-0.11 tonBagasse 0.25-0.3 tonBagasse Fly ash 0.005-0.066 tonPress Mud 0.03 tonCane Juice 0.565-0.615 ton
Currently about 4 million hectares of land in India is under sugarcane with an average yield of 70 tonsper hectare. Sugar industry in India is concentrated in states of Uttar Pradesh, Maharashtra, TamilNadu, Karnataka, AndhraPradesh, Gujarat, Haryana and Punjab. During sugar production seasonelectricity generated from the plant is usedfor the production process and surplus is fed into grid whileduring off season all electricity generated is fed intogrid. However grid connected surplus powergeneration from sugar industries gained momentum in India in 1993consequent to a report submitted

National Conference on Emerging Trends in Science, Technology and Management, 11-12 Nov 2017, ISBN: 978-93-5281-325-4 Page 107
by a committee constituted by MNSE (Now known as MNRE). Bagassecogeneration is a now a wellunderstood and matured technology in the country. State wise status of bagassecogeneration in India ason 31.03.2013 is given below in table.
5. CONCLUSION
Thus sugar mills have been able to export power in the season as well as in the off-season by usingbagasse or any other locally available biomass and to some extent coal. Off-season operation has beenmore lucrative by exporting power which otherwise earlier was non-existent except some operation andmaintenance work. High technology has made these sugar mills efficient by improving the economicviability of the mills in terms of higher production of units of electricity per unit of bagasse.
ACKNOWLEDGEMENT
The author would like to thank the officials of various sugar units of Uttar Pradesh for sharing theirexperience.
REFERENCES[1.] Advancing Cogeneration in the Indian Sugar Industry - Three Mills in Tamil Nadu and[2.] Maharashtra, U.S. Agency for International Development, Report No. 93-02, May 1993.[3.] Electric Power Generation Markets in India and Pakistan, U.S. Agency for International Development,
Office of Energy and Infrastructure, Bureau for Research and Development, February, 1993.[4.] Indian Sugar Mills Association, Directorate of Economic and Statistical Advisor, Government[5.] of India.Indian Sugar Mills Association data as reported by the American Embassy (New Delhi, India)
to the U.S. Department of Agriculture (various 1994-1995 reports).[6.] Eleventh plan (2007-12) power capacity addition through grid interactive renewable accessed from
http://data.gov.in/dataset/eleventh-plan-power-capacity-addition-through-grid-interactive-renewablepoweron 1.12.2013.
[7.] Energy Statistics 2013, Ministry of Statistics and Programme Implementation Government of India,New Delhi.
[8.] KPMG Report, the Indian Sugar Industry Sector Roadmap 2017, 2007[9.] MNRE website data on installed capacity retrieved from http://www.mnre.gov.in/mission-and-vision-
2/achievements/ on 18.12.13.[10.] MNRE Press Release dated 30.08.2013 accessed from
http://pib.nic.in/newsite/erelease.aspx?relid=98949 on 03.12.2013[11.] MNRE website www.mnre.gov.in/schemes/grid-connected/biomass-powercogen/ accessed on[12.] 03.12.2013.[13.] MNRE Annual Report 2012–2013, New Delhi, India retrieved from
http://mnre.gov.in/filemanager/annual-report/2012-2013/EN/chapter3.html.
[14.] Tewari, P.K., Batra, V.S., Balakrishnan, M., 2007. Water management initiatives in sugarcanemolasses based distilleries in India, Resources Conservation and Recycling 52, 351-367.
[15.] Singh, P., Suman, A., Tiwari, P., Arya, N., Gaur, A., Shrivastava, A.K., 2008. “Biological pretreatmentof sugarcane trash for its conversion to fermentable sugars”, World Journal of Microbiology andBiotechnology 24, 667-673.
[16.] Pessoa, J.A., Manchilha de, I.M., Sato, S., (1997) “Evaluation of sugar cane hemicelluloseshydrolyzate for cultivation of yeasts and filamentous fungi”, Journal of Industrial Microbiology andBiotechnology 18, 360-363.
[17.] Babu, B.V., Ramakrishna, V., (1998) “Optimum utilisation of waste oil for improved thermalefficiency of bagasse” Journal of Indian Association for Environmental Management 25, 59-65.
[18.] Umamaheswaran, K., Batra, V.S., (2008), “Physico-chemical characterization of Indian biomassashes”, Fuel 87, 628-638.
[19.] Iyer, P.V.R., Rao, T.R., Grover, P.D., (2002), “Biomass Thermo-Chemical Characterization, third ed.IIT (Indian Institute of Technology), New Delhi.
[20.] Larson, E.D., Williams, R.H., Leal, M.R.L.V., (2001), “A reviewof biomass integrated-gasifier/ gasturbine combined cycle technology and its application in sugarcane industries, with an analysis forCuba”, Energy for Sustainable Development 1, 54-76.
[21.] UNDP (2007) http:// www. undp. org/ gef/ documents/ writeups doc/cc/Brazilbiomass doc (accessedon 20 March 2015).
[22.] Gabra, M., Pettersson, E., Backman, R., Kjellström, B., (2001), “Evaluation of cyclone gasifierperformance for gasification of sugar cane residue-Part 2: gasification of cane trash”, Biomass andBioenergy 21, 371-380.
[23.] Leal, M.R.L.V., (2009), “From 1st Generation Biofuels to an Integrated System Production Model
Biofuels 2009 esustainable Development of Biofuels. 3rd
MoEN, IEA Joint Forum Bangkok, Thailand,

National Conference on Emerging Trends in Science, Technology and Management, 11-12 Nov 2017, ISBN: 978-93-5281-325-4 Page 108
September 7-8, 2009, http://www.iea.org/ work/ 2009/ bangkok/ 33 Regis.pdf (accessed on 20February 2015).
[24.] Biopact, (2007) http:// news. mongabay. com/ bioenergy/ 2007/05 /dedini-achieves-breakthrough-cellulosic.html (accessed on 18 March 2015).
[25.] Johnson, T., Johnson, B., Scott-Kerr, C., Kiviaho, J., 2010. Bioethanol e Status Report on BioethanolProduction from Wood and Other Lignocellulosic Feedstocks.http://www.beca.co.nz/projects/industrial/pulp_and_paper/w/media/ Publications/ Conference Papers/Technical Bioehanol.ashx (accessed on 18 March).
National Conference on Emerging Trends in Science, Technology and Management, 11-12 Nov 2017, ISBN: 978-93-5281-325-4 Page 109
FUEL CELL AND MICRO WIND TURBINE SYSTEMBASED HYBRID POWER GENERATION–A REVIEW
Preeti Patel,Department of Electrical Engineering,
Ashoka Institute of Technology & Management, Paharia, Varanasi, IndiaEmail ID: [email protected]
AbhishekAnguria,Department of Electrical Engineering,
Ashoka Institute of Technology & Management, Paharia, Varanasi, IndiaEmail ID: [email protected]
Mr. Manu Kumar Singh,Assistant Professor,
Department of Electrical Engineering,Ashoka Institute of Technology & Management, Paharia, Varanasi, India
Email ID:[email protected]
Abstract - A hybrid power generation system is a combination of two or more power generation sources tobest make use of their individual operating characteristics and to obtain efficiencies greater than that couldbe obtained from a single power source. These hybrid power sources can be a combination of a fuel cell andmicro wind turbine based system with different combinations of fuel cells and renewable energy sources fora home or remote location area. A micro wind turbine is a wind turbine used for micro-generation, asopposed to large commercial wind turbines, such as those found in wind farm. In the hybrid system energyhas a more consistency, can be cost effective and also improves the quality of life in rural areas. The aim ofhybrid power system is to increase the system efficiency and the use of renewable energy based hybridpower system. The wind energy is free of cost and operating cost is negligible and the installation cost of fuelcell based power generation system for a small system like home or a colony is very low. This paperdiscusses the renewable energy i.e. fuel cell power generation and micro wind turbine power generationcombined system. This paper presented a power estimation model in a wind/hydrogen/fuel-cell/invertersystem for green energy generation. An abundant amount of energy is in motion in the form of wind causedby differential heating of the earth’s surface and its rotation. This energy source can be tapped in apollutant-free generation process through a wind turbine, and then used to produce hydrogen from theelectrolysis of water in an electrolyzer. Hydrogen produced and stored is re-convertible to electrical powerthrough a fuel-cell/inverter arrangement.
Keywords – Review study: Fuel cell and micro wind turbine, hybrid system, advantages anddisadvantages, conclusion.
1. INTRODUCTION
Green energy in recent times has become the most interesting focus of power provision by severalnations of the world, and will continue to be so especially for the non-depleting renewable energysources such as solar, wind, and tidal. The spread of this development is increasing daily and graduallyinfluencing the demand and choice of energy usage in most developing countries. Apart fromhydropower systems being used in most African countries, solar power development is more visibleamong other renewable sources due to the abundant energy from the sun. However, the heating effectof the sun has also created wind in some areas which can be tapped if maximum energy is to bederived. Although wind is an erratic source of energy; it is a very feasible source of energy ifsupplemented with other sources to form a hybrid system. Recently, greater focus has been placed onthe use of new technologies such as fuel cell and the potential power ofwater pumped to a height.Excess power produced from a solar or wind system can be used to pump water to a height which inturn can be used to generate electricity from hydro-turbines. On the other hand, fuel cell employs atechnology that produces a direct current (DC) voltage from the combination of hydrogen and oxygen.This combination is very efficient as a source of energy and only produces pure water as a byproduct.Of course, oxygen is naturally available but hydrogen can be produced through a process known aselectrolysis. Hence, excess power generated from solar or wind sources can be used to producehydrogen which can be stored for power generation at down times. To derive the required alternatingcurrent (AC) power from the fuel cell however, a power converting unit most be used. This converter isgenerally referred to as an inverter. An inverter is an electronic device that converts DC powerto ACpower and comes in different power ratings. The rating of an inverter selected for use basically dependson theamount of load it is to carry. In this paper the authors present a model of fuel cell and micro windturbine system based hybrid power generation system [1].

National Conference on Emerging Trends in Science, Technology and Management, 11-12 Nov 2017, ISBN: 978-93-5281-325-4 Page 110
2. HYBRID POWER PLANT
Hybrid power system, as the name implies, combine two or more modes of electricity generationtogether, usually using renewable technologies such as solar photovoltaic, wind turbine and fuel cellsystem. Hybrid power systems provide a high level of energy security through the mix of generationmethods and often will incorporate a storage system (battery, fuel cell) or small fossil fueled generatorto ensure maximum supply reliability and security. Hybrid powers are combinations between differenttechnologies to produce power. Hybrid power systems deliver alternating current of fixed frequencyarea an emerging technology for supplying electric power in remote location [2].
3. ADVANTAGES OF HYBRID POWER GENERATION PLANT
A. Fuel saving.B. Saving in maintenance.C. Silent system.D. Better utilization of renewable energy.E. Best for remote area power system.F. Two or more than two different energy sources provide a diversity of supply, reducing the
risk of power outages.G. Can be used for 24 hours power generation.H. Operational in all weather.I. Green energy.
4. DISADVANTAGES OF HYBRID POWER GENERATION PLANT
A. Control more complicated.B. Large initial project.C. Independent system requires more maintenance.
5. MICRO WIND TURBINE SYSTEM
A small wind turbine or micro wind turbine is a wind turbine used for micro-generation, as opposed tolarge commercial wind turbines, such as those found in wind farms, with greater individual poweroutput. The smaller turbines may be as small as a 50 Watt auxiliary power generator for a boat, caravanor miniature refrigeration unit. Regular winds turbines are designed for large electricity productionhence occupy large areas of land. These cannot operate in places where the wind speed is below 10m/s.Regular wind turbines can only operate given wind-speeds between 10m/s and 25m/s. On the otherhand, Micro wind turbines have been designed to operate with low wind speeds (above 2 m/s). Further,these do not require large land areas. These are installable in smaller places due to their small size andmodular construction. Smaller places like apartment-balconies, building-terraces and of course thesmall farm houses. The size of Micro wind turbines can be adapted to the available space and thepower output required. The design simplicity and components used make the installation andmaintenance very easy for anyone. The simplicity allows very low manufacturing cost, in turn lowretail price. By using different shapes and configurations, Micro wind turbines can adapt to theimmediate surroundings. Only Micro wind turbines can work in wind speeds as low as 1m/s. Theirlight weight, small size, and flexible configuration allow them to be installed in both urban and ruralenvironments, for individual or corporate use. Micro wind turbines give Green warriors and Eco-conscious users a new option in their environmental resurgence crusade for efficient renewable energy[3].
6. VERTICAL AXIS WIND TURBINES
Small wind turbines can have either horizontal or vertical axis, the latter being of particular interest forthe application on buildings. Unlike classic horizontal axis generators, which need to be always alignedto the wind direction, generators with vertical axis rotors (Vertical axis wind turbines, VAWT), thanksto the helical blade profile or the presence of arms, are able to capture incoming wind from anydirection, and therefore do not need to be oriented; they can also take advantage from turbulences(Table I). The wind speed necessary for starting is 2-3 m/s and the noise is almost zerofor normalwinds and even for low winds. For small powers up to 1.5 kW, you can install the system directly tothe building.The main advantage of this arrangement is that the wind turbine does not need to be pointed towardsthe wind. This is an advantage on sites where the wind direction is highly variable, or is perturbed byturbulence. With a vertical axis, the generator and other primary components can be placed near the
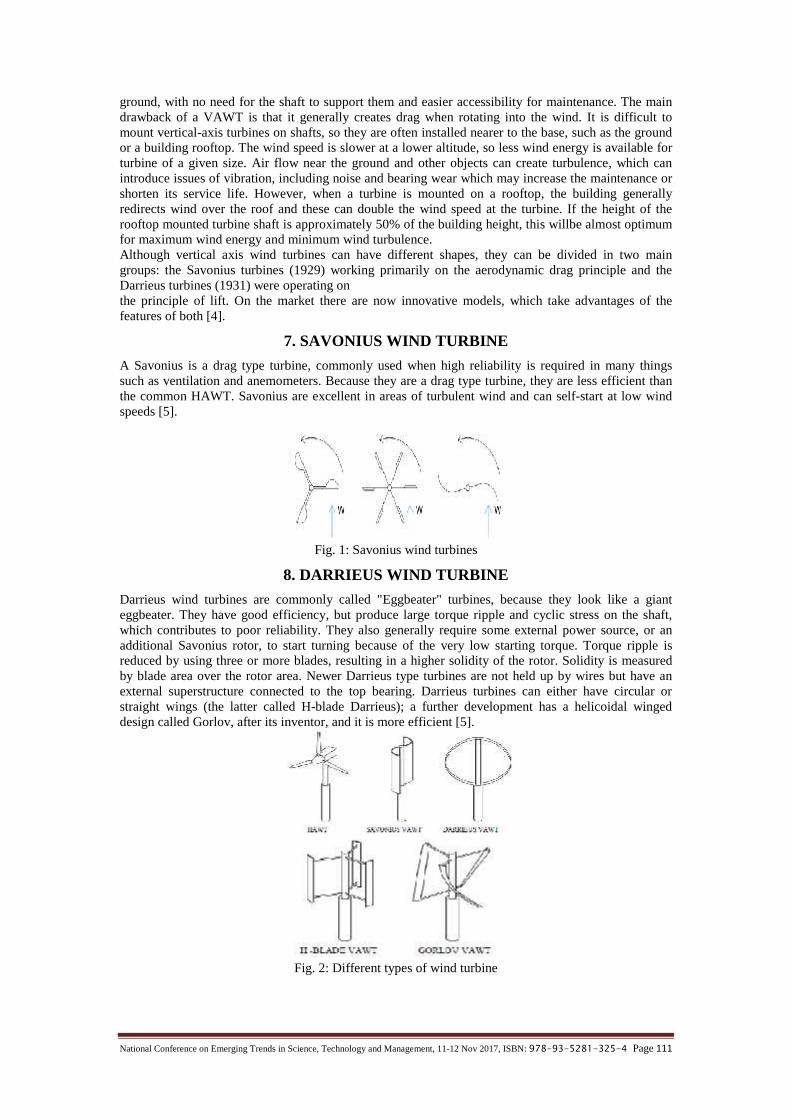
National Conference on Emerging Trends in Science, Technology and Management, 11-12 Nov 2017, ISBN: 978-93-5281-325-4 Page 111
ground, with no need for the shaft to support them and easier accessibility for maintenance. The maindrawback of a VAWT is that it generally creates drag when rotating into the wind. It is difficult tomount vertical-axis turbines on shafts, so they are often installed nearer to the base, such as the groundor a building rooftop. The wind speed is slower at a lower altitude, so less wind energy is available forturbine of a given size. Air flow near the ground and other objects can create turbulence, which canintroduce issues of vibration, including noise and bearing wear which may increase the maintenance orshorten its service life. However, when a turbine is mounted on a rooftop, the building generallyredirects wind over the roof and these can double the wind speed at the turbine. If the height of therooftop mounted turbine shaft is approximately 50% of the building height, this willbe almost optimumfor maximum wind energy and minimum wind turbulence.Although vertical axis wind turbines can have different shapes, they can be divided in two maingroups: the Savonius turbines (1929) working primarily on the aerodynamic drag principle and theDarrieus turbines (1931) were operating onthe principle of lift. On the market there are now innovative models, which take advantages of thefeatures of both [4].
7. SAVONIUS WIND TURBINE
A Savonius is a drag type turbine, commonly used when high reliability is required in many thingssuch as ventilation and anemometers. Because they are a drag type turbine, they are less efficient thanthe common HAWT. Savonius are excellent in areas of turbulent wind and can self-start at low windspeeds [5].
Fig. 1: Savonius wind turbines
8. DARRIEUS WIND TURBINE
Darrieus wind turbines are commonly called "Eggbeater" turbines, because they look like a gianteggbeater. They have good efficiency, but produce large torque ripple and cyclic stress on the shaft,which contributes to poor reliability. They also generally require some external power source, or anadditional Savonius rotor, to start turning because of the very low starting torque. Torque ripple isreduced by using three or more blades, resulting in a higher solidity of the rotor. Solidity is measuredby blade area over the rotor area. Newer Darrieus type turbines are not held up by wires but have anexternal superstructure connected to the top bearing. Darrieus turbines can either have circular orstraight wings (the latter called H-blade Darrieus); a further development has a helicoidal wingeddesign called Gorlov, after its inventor, and it is more efficient [5].
Fig. 2: Different types of wind turbine

National Conference on Emerging Trends in Science, Technology and Management, 11-12 Nov 2017, ISBN: 978-93-5281-325-4 Page 112
9. ADVANTAGES OF MICRO WIND TURBINE
A. A micro wind turbine is a stable and passive investment.B. A micro wind turbine compliments solar power.C. A micro wind turbine actually does help the environment.D. Zero fuel cost.E. Does not produce carbon dioxide and so does not contribute towards the greenhouse effect
and global warming.F. Does not produce sulfur dioxide or oxides of nitrogen and so does not contribute towards acid
rain.G. Domestic micro wind turbines provide free electricity when the wind is blowing.H. Micro wind turbines can work at very low wind speed.I. Comfort and easy to use.
10. DISADVANTAGES OF MICRO WIND TURBINE
A. Cannot generate large quantities of electricity in one place.B. Wind is not very predictable.C. A micro wind turbine needs micro siting.
11. FUEL CELL
Fuel cell technology is relatively new and in the initial stages of development. The principle of the fuelcell was discovered in 1838 by the German scientist Christian Friedrich. Based on his work, the firstfuel cell was demonstrated by Sir William Grove in February 1839.A fuel cell is an electromechanical energy conversion device that converts chemical energy of a fueldirectly into electrical energy. It is known as a cell because of some similarities with a primary cell.Like a conventional primary cell it also has two electrodes and an electrolyte between them andproduces DC power.Fuel cell system operates on pure hydrogen and air to produce electricity with water and heat as the bi-product. Fuel cells are modular in construction and their efficiency is independent of size.Fuel cells can be used in domestic applications, homes, and industries and in transport [6].
Fig. 3: Diagram of Fuel Cell
Fuel cell can be renewable or non-renewable resources. A fuel cell is an electromechanical device thatgenerates electricity from hydrogen. Hydrogen can obtained from various sources such as non-renewable fossil fuels (natural gas, coal, petroleum, etc.) or renewable resourced such as water oranaerobic digester gas (ADG). There are a few solar and wind powered electrolyzers that generatehydrogen from water, which is renewable. Fuel cells that use alcohol, methane from waste digestionand hydrogen from wind or solar conversion of water are renewable. Fuel cells that use hydrogen ormethane from oil and gas production and alcohol from industries processed are non-renewable [6].Fuel cells can be manufactured as large or small as necessary for the particular power application.Presently, there are micro fuel cells that are the size of a pencil eraser and generate few milli-watts ofpower while there are others large enough to provide large amount of power [7].
12. ADVANTAGES OF FUEL CELLS
A. Hydrogen is most abundant element.B. Hydrogen has the highest energy content.C. Hydrogen is non-polluting.D. Hydrogen is a renewable fuel source.E. Fuel cells have a higher efficiency than diesel or gas engines.

National Conference on Emerging Trends in Science, Technology and Management, 11-12 Nov 2017, ISBN: 978-93-5281-325-4 Page 113
F. Fuel cells operate silently, compared to internal combustion engines. They are thereforeideally suited for use within buildings such as hospitals.
G. Fuel cells can eliminate pollution caused by burning fossil fuels for hydrogen fuelled fuelcells, the only bi-product at point of use is water.
H. If the hydrogen comes from the electrolysis of water driven by renewable energy, then usingfuel cells eliminates greenhouse gases over the whole cycle.
I. Fuel cells do not need conventional fuels such as oil or gas and can therefore reduceeconomic dependence on oil producing countries, creating greater energy security for the usernation.
J. Since hydrogen can be produced anywhere where there is water and a source of power,generation of the fuel can be distributed and does not have to be grid-dependent.
K. The maintenance of fuel cells is simple.L. Unlike batteries, fuel cells have no “memory effect” when they are getting refueled.
13. DISADVANTAGES OF FUEL CELL
A. Hydrogen is currently very expensive, not because it is rare but because it’s difficult togenerate, handle and store.
B. It can be stored at moderate temperatures and pressures in a tank containing a metal-hydrideabsorber or carbon absorber, though these are currently very expensive.
C. In some cases fossil fuels are still needed.D. Costly to produce.E. Highly flammable.
14. DESIGN OF HYBRID FUEL CELL AND MICRO WIND TURBINESYSTEM
Here is the combination of fuel cell and micro wind turbine based system to make a hybrid powergeneration system. Both two systems generate electrical energy at output. In India micro wind turbinesystem are latest technology and fuel cellsis one of the latest technologies. To meet the demand and forthe sake of continuity of power supply, storing of energy is necessary. The term hybrid power system isused to describe any power system combine two or more energy conversion devices, or two or morefuels for the same device, that when integrated, overcome limitations inherent in either.
15. WORKING OF THE SYSTEM
Wind energy generates AC power as well as fuel cell produces DC power. Here, researchers make asystem by which AC and DC both type of power can be obtained.When the air flow the blades of micro wind turbine will rotate and a shaft of alternator is mounted withturbine. Therefore, AC power will generate and a AC voltage regulator is connected to maintain thesupply voltage obtained from wind energy. And a AC to DC converter is connected to convert ACnature of supply into DC nature to charge the battery bank for further use in case when the wind willnot blowing.A Hydrogen tank is need for refueling the fuel in fuel cells. Fuel cell produces DC power. This DCpower will store in a large battery bank. An inverter will use to convert DC supply into AC supply andfed to same AC voltage regulator to reduce ripples and harmonics. This AC supply will be used inhome appliances and for AC loads.Here DC power produces from fuel cell is also directly converted from DC to AC without storingpower in battery.Also, DC power obtained from fuel cells will be directly use as in DC nature for DC loads as shown infigure above.And also, the DC power stored in battery banks will be used for supply power to DC loads.A DC voltage regulator will use to regulate the DC supply voltage and DC filter will use to reduceripples and harmonics from DC supply.

National Conference on Emerging Trends in Science, Technology and Management, 11-12 Nov 2017, ISBN: 978-93-5281-325-4 Page 114
Fig. 4: Arrangement of Fuel Cell and Micro Wind Turbine Based Hybrid System
16. CHARACTERISTICS AND EFFICIENCY OF VARIOUS FUEL CELLS [7]
S.No Fuel Cell Op. Temp Fuel Efficiency1 PEMFC 40-60°C H2 48%-58%2 AFC 90°C H2 64%3 PAFC 150-200°C H2 42%4 MCFC 600-700°C H2 and CO 50%5 SOFC 600-1000°C H2 and CO 60%-65%
17. INSTALLATION COST OF FUEL CELL AND MICRO WIND TURBINESYSTEM
Cost of fuel cell per kW = Rs 10,000 (Approx) [8]Cost of micro wind turbine system per kW = Rs 50,000 (Approx) [9]Cost of combined system per kW=Rs 80,000 (additional cost included of battery, filter, regulator andinverter)
18. CONCLUSION
From the review it is concluded that-A. Hybrid Systems have proved to be the best option to deliver “high quality’ continuous energy
services to rural areas at the lowest economic cost and with maximum social andenvironmental benefits.
B. By using these renewable resources, the dependency on conventional power plant is less andsaves in fossil fuel i.e coal, diesel, gas etc.
C. By using this hybrid power scheme, there is reduction in electricity bill amount.D. The availability of wind energy is free of cost.E. This hybrid system can be used anywhere for homes, hospitals, industries etc.F. This system is free from pollution.G. The size of micro wind turbine is compact and size of fuel cell is also compact.H. The efficiency of this hybrid system is high because of higher efficiency of fuel cell energy.
REFERENCES
[1] Thresher R., Robinson M. and Veers P., “Wind Energy Technology: Current Status and R&D Future”,National Renewable Energy Laboratory Conference Paper, NREL/CP-500-43374, 2008.
[2] www.hybridpower.wiki.co.in[3] Steve C. and Steve G., “Economic Analysis of an Integrated Wind-Hydrogen Energy System for a Small
Alaska Community”, A Technical Report Task 4,5,6 under the project: A compilation and Review ofproposed Alaska Development Projects. www.iser.uaa.alaska.edu, 2008.
[4] Narayanan Komerath „Prediction and Validation of a Micro Wind Turbine for Rural Family Use.[5] Non-Conventional Energy Resources S. Chand & Company PVT. LTD. Page No. 134-162.[6] www.cleanenergystates.org_fuel_cells_briefing_papers_for_states[7] Non-Conventional Energy Resources S. Chand & Company PVT. LTD. Page No. 107-123.[8] www.cost-of-fuel-cell-energy-per-kw.html[9] www.cost-of-micro-wind-turbine-per-kw.html
National Conference on Emerging Trends in Science, Technology and Management, 11-12 Nov 2017, ISBN: 978-93-5281-325-4 Page 115
ENHANCED TRAVELING SALESMAN PROBLEMSOLVING BY GENETIC ALGORITHM TECHNIQUE
WITH HYBRID HEURISTICDharm Raj Singh,
Rohit Kumar SinghDepartment of Computer Applications Jagatpur P. G. College Varanasi-221302
Email: [email protected] Kumar Singh,
DST-Centre for Interdisciplinary Mathematical Sciences (DST-CIMS), Banaras Hindu University,Varanasi-221005, India, Email: [email protected]
Tarkeshwar SinghDepartment of Mathematics,
BITS Pilani, K K Birla Goa Campus, Email: [email protected]
Abstract — This paper proposes Genetic Algorithm (GA) with hybrid Mutation operator, to solve theTraveling Salesman Problem (TSP). Hybrid Mutation operator has been developed to find the minimumcost in the known Travelling Salesman problem (TSP). In Genetic Algorithm (GA), we first initializesuboptimal solution with the help of Nearest Neighbor tour construction. Algorithm constructs anoffspring from a pair of parents using better edges on the basis of their values that may be present in theparents' The results of the proposed hybrid Mutation algorithm are compared with others GA algorithmswhich use different crossover operations, hybrid Mutation algorithm, achieve a better solution for TSP.
Keywords— Genetic Algorithms, Travelling Salesman problem, Inversion Mutation.
1. INTRODUCTION
Traveling Salesman ProblemThe traveling salesman problem (TSP) is a optimization problem. The objective of salesman is to find aclosed tour with minimum cost of visiting all of the cities exactly once and back to the starting city.This problem modeled using weighted graph in graph theory. Given a weighted graph G = (V, E, w),where V is set of vertices represent cities, E is set of edges represent roads/links between two cities andw is weight (travel cost/distance) between each pair of vertices. A closed tour/path, in which all thevertices are distinct, is known as Hamiltonian cycle. Finding Hamiltonian cycle with minimum cost inthe weighted graph is the desired solution of TSP.The cost between each cities is represented by matrix, known as cost matrix C = (cij), i, j = 1, 2, · · · , n.In cost matrix C the (i, j)th entry cij, represents the cost of travel from ith city to jth city. The total cost oftour is given by
1
( , 1) ( ,1).n
i
CP c i i c n
(1)
In case, if cost is represented by Euclidean distance between the cities then this is called as EuclideanTSP. For coordinate (xi, yi) and (xj, yj) of the cities, cost is given by
2 2
ij i j i jc x x y y . (2)
In graph theoretic framework, the TSP problem is equivalent to find the Hamiltonian cycle havingminimum cost in weighted graph [1].
Mathematical formulation for TSPA traveling salesman travel starting from his start city, visiting each city only once and returning to hisstart city so that the total travel cost (distance or time) is minimum. Suppose there are n cities and costcij (distance or time) from ith city to city jth. If the cost (distance) c between the cities are independent ofdirection (i.e. graph G is undirected), then the TSP is called the symmetric traveling salesman problem(STSP), that is cost of every pair of city cij=cji in symmetric TSP.
Let the decision variables
1, if salesman travels from city to city
0, otherwise
th thi jijx (3)
The objective function is
National Conference on Emerging Trends in Science, Technology and Management, 11-12 Nov 2017, ISBN: 978-93-5281-325-4 Page 116
1 1
m i nn n
i j i ji j
z c x
(4)
Science, each city can be visited only once, we have
1
1, 1, 2 , ... , ;n
iji
x j n i j
(5)
Again, since the salesman has to leave each city except city ,n we have
1
1, 1, 2, ..., ;n
ijj
x i n i j
(6)
,
1,2 2n
iji j s
x s s n
(7)
Where 0,1ijx is a binary variable indicating if variable 1,ijx a salesmen select an edge on the
tour for travel, if variable 0,ijx a salesmen does not select an edge on the tour for travel, Equation
(4) describes the total cost to be minimized. Equation (5) describes that a salesman only can enter thecity j for one time, Equation (6) describes that a salesman only can departure from the city i for one
time, i.e. Equation (5) and (6) describes that a salesman visits each city only once, Equation (7)
describes that no loop in any city subset should be formed by the salesman, s means the number of
elements included in the set .s
Literature Review
The TSP is one of the classical problems in discrete optimization. In this problem objective is to findthe shortest closed path such that a visitor visits, every city only once and return back to start city. TSPbelongs to a family of NP-complete problems [2] whose computational complexity increasesexponentially by increasing the number of cities. The TSP belongs to a class of NP-hard discreteoptimization problem. There are many approaches have been developed, such as Simulated Annealing[8, 9], Ant Colony Optimization [10, 11, 12], Particle Swarm Optimization and Memetic Algorithm(MA) [13], weed optimization [14, 15, 16], harmonic search [17, 18], Neural networks [4] and GeneticAlgorithms [19, 20, 21],
The rest of paper is organized as follows. Section II, describes the Genetic Algorithm and gives anoverview of genetic algorithm for solution. Section III, describes proposed hybrid methods. In SectionIV, presents experimental results followed by conclusion in section V.
2. GENETIC ALGORITHM (GA)
Genetic Algorithm is an optimization and search technique based on the principles of natural selectionand natural genetics. They combine survival of the fittest concept of natural evolution. GeneticAlgorithm was developed by John Holland [6]. Genetic algorithm maintains a population ofchromosomes; in the population each chromosome represents a solution to the problem. Eachchromosome is evaluated to give some measure of its fitness. A set of chromosomes undergotransformations by means of genetic operations which generate new chromosomes.Three genetic operators namely selection, crossover and utation work on these chromosomes tolead them to the optimum point. Each chromosome is evaluated to give some measure of its fitness. Aselection method is employed to select the chromosomes according to their fitness values. The selectedchromosomes reproduce to create the next generation. A set of chromosomes undergoes transformationby means of genetic operations which generate new chromosomes. There are two types oftransformation: crossover, which generate new chromosomes by combining from two chromosomes,and mutation, which creates new chromosome by making changes in single individual. Newchromosome called child are then evaluated, forming new population by selecting fit chromosomesfrom parent and child population. After several generations, the algorithm gives the best individual,which represents an optimal or suboptimal solution to the problem [5].One general principle for developing an implementation of a genetic algorithm for a particular realworld problem is to make a good balance between exploration and exploitation of the search space. Toachieve this all the components of the genetic algorithms must be examined carefully. Additionalheuristic should be incorporated in the algorithm to enhance the performance [5].Generate initial population P Nearest Neighbor tour
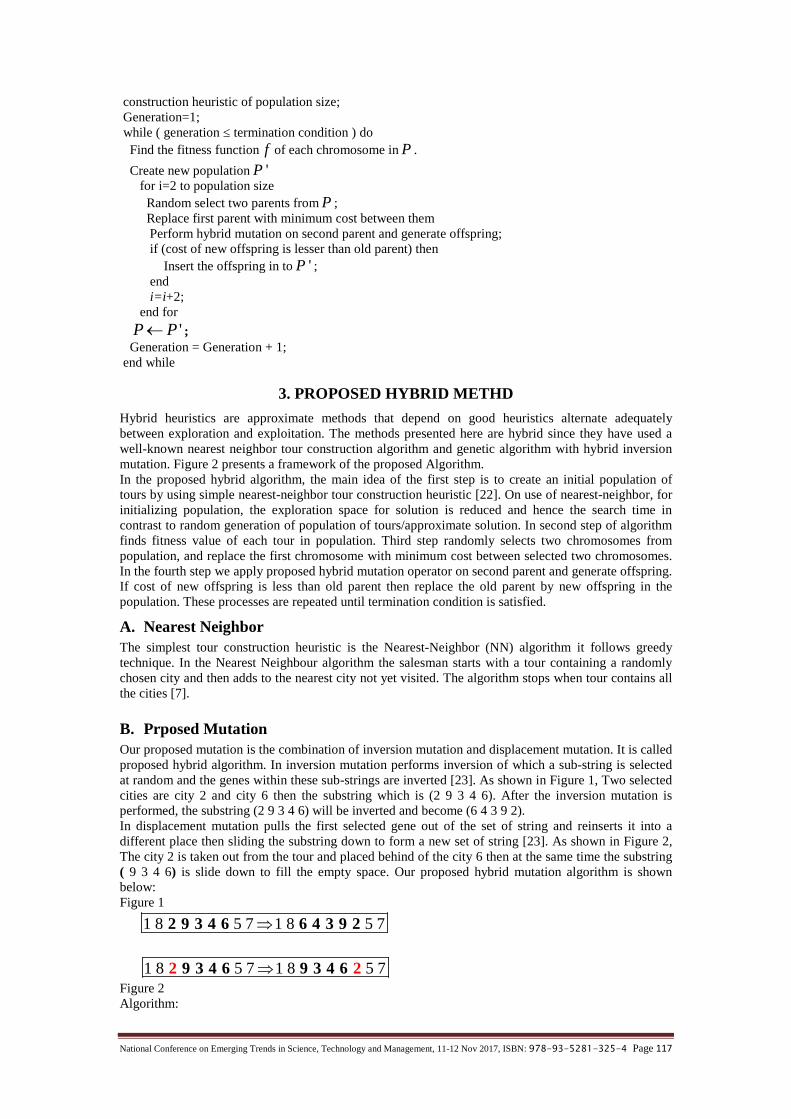
National Conference on Emerging Trends in Science, Technology and Management, 11-12 Nov 2017, ISBN: 978-93-5281-325-4 Page 117
construction heuristic of population size;Generation=1;while ( generation ≤ termination condition ) doFind the fitness function f of each chromosome in P .
Create new population 'Pfor i=2 to population size
Random select two parents from P ;Replace first parent with minimum cost between themPerform hybrid mutation on second parent and generate offspring;if (cost of new offspring is lesser than old parent) then
Insert the offspring in to 'P ;endi=i+2;
end for
'P P ;Generation = Generation + 1;
end while
3. PROPOSED HYBRID METHD
Hybrid heuristics are approximate methods that depend on good heuristics alternate adequatelybetween exploration and exploitation. The methods presented here are hybrid since they have used awell-known nearest neighbor tour construction algorithm and genetic algorithm with hybrid inversionmutation. Figure 2 presents a framework of the proposed Algorithm.In the proposed hybrid algorithm, the main idea of the first step is to create an initial population oftours by using simple nearest-neighbor tour construction heuristic [22]. On use of nearest-neighbor, forinitializing population, the exploration space for solution is reduced and hence the search time incontrast to random generation of population of tours/approximate solution. In second step of algorithmfinds fitness value of each tour in population. Third step randomly selects two chromosomes frompopulation, and replace the first chromosome with minimum cost between selected two chromosomes.In the fourth step we apply proposed hybrid mutation operator on second parent and generate offspring.If cost of new offspring is less than old parent then replace the old parent by new offspring in thepopulation. These processes are repeated until termination condition is satisfied.
A. Nearest NeighborThe simplest tour construction heuristic is the Nearest-Neighbor (NN) algorithm it follows greedytechnique. In the Nearest Neighbour algorithm the salesman starts with a tour containing a randomlychosen city and then adds to the nearest city not yet visited. The algorithm stops when tour contains allthe cities [7].
B. Prposed MutationOur proposed mutation is the combination of inversion mutation and displacement mutation. It is calledproposed hybrid algorithm. In inversion mutation performs inversion of which a sub-string is selectedat random and the genes within these sub-strings are inverted [23]. As shown in Figure 1, Two selectedcities are city 2 and city 6 then the substring which is (2 9 3 4 6). After the inversion mutation isperformed, the substring (2 9 3 4 6) will be inverted and become (6 4 3 9 2).In displacement mutation pulls the first selected gene out of the set of string and reinserts it into adifferent place then sliding the substring down to form a new set of string [23]. As shown in Figure 2,The city 2 is taken out from the tour and placed behind of the city 6 then at the same time the substring( 9 3 4 6) is slide down to fill the empty space. Our proposed hybrid mutation algorithm is shownbelow:Figure 1
1 8 5 7 1 8 5 72 9 3 4 6 6 4 3 9 2
1 8 5 7 1 8 5 72 29 3 4 6 9 3 4 6Figure 2Algorithm:

National Conference on Emerging Trends in Science, Technology and Management, 11-12 Nov 2017, ISBN: 978-93-5281-325-4 Page 118
Choose two inversion points I and J such that 1≤I≤J≤n;k1= select a random number between 1 to I;x=selected Parent (tour);t=x;Apply Inverse mutation from city I to the city J in t;k1= select a random number between 1 to I;k2= select a random number between J to n;k3= select a random number between 1 to 2;if (k3==1)Apply displacement mutation from city k1 to the city I in t;elseApply displacement mutation from city k2 to the city n in t;end
if (cost of new generated tour t is lesser than old tour x) thenReplace the old tour by new tour;
end
4. EXPERIMENTAL RESULTS
C. Experimental SetupFor comparison of the performance of our method with other state of the art method that use Input Data(coordinates of each city (X, Y)) are shown in Table 1 [23].
Table 1 X, Y coordinate of cities
City X Y1 0 32 1 53 4 54 5 25 4 06 1 07 3 78 6 29 8 410 7 611 10 012 9 213 5 314 4 615 6 116 11 217 7 418 8 319 2 920 3 10
D. Experimental Result
The comparative results are shown Table 2. The best performance of the algorithm for particularinstance has shown in bold. The results show that using GA with Order Crossover Operator (OX),Sequential Constructive Crossover (SCX), Modified Sequential Constructive Crossover (MSCX) andproposed method in Table 2. It can be seen that from Table2 and Figure 5, results at number of cities 5to number of cities 10 is the same solution (with different starting city), but the results at number of 15to 20 show that using GA with MOX gives solutions (short paths) better than using OX crossoverwhenever MSCX achieve good results better than the others compared GAs (OX, MOX, and SCX).But our proposed method obtained better results than the others compared GAs (OX, MOX, SCX andMSCX). This means that when number of cities increases the number of solutions, population size andnumber of iterations increase. From Table2 it can be seen that solution at number of city 19 usingproposed method is obtained the best solution (short path) 39.7577. From last column of the Table 2, itis clear that our proposed method gives better performance for all instances with respect to allperformance parameter.
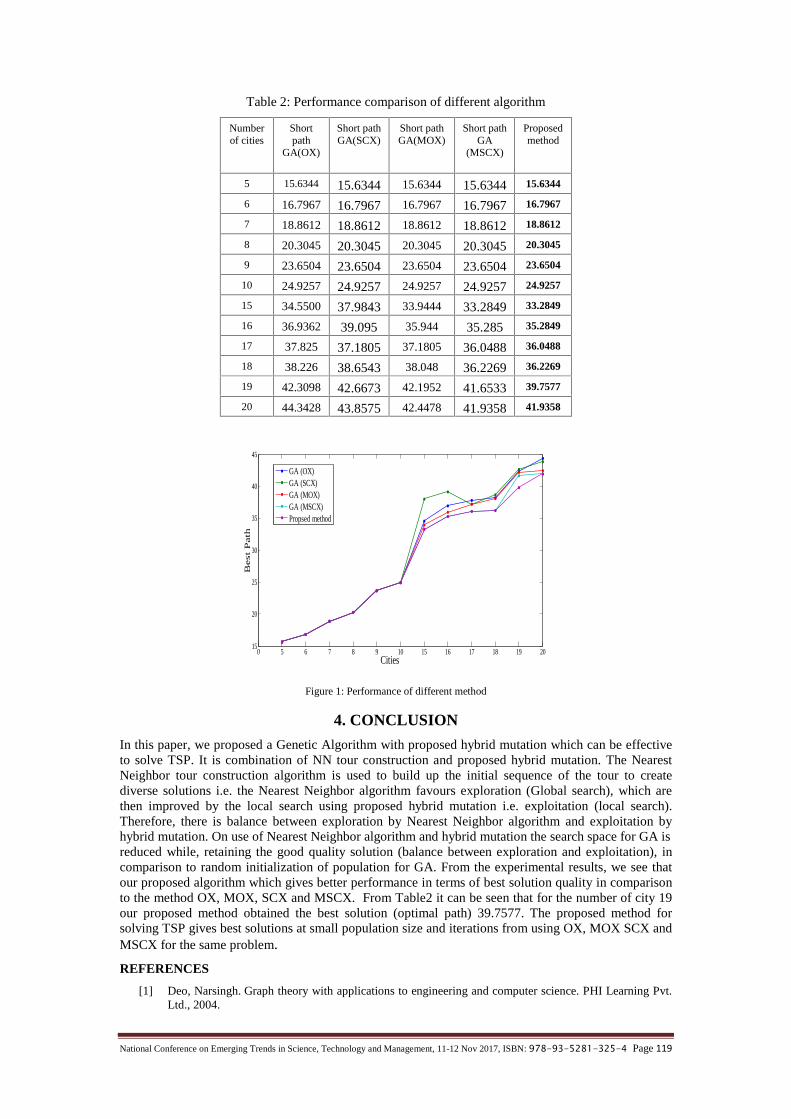
National Conference on Emerging Trends in Science, Technology and Management, 11-12 Nov 2017, ISBN: 978-93-5281-325-4 Page 119
Table 2: Performance comparison of different algorithm
Numberof cities
Shortpath
GA(OX)
Short pathGA(SCX)
Short pathGA(MOX)
Short pathGA
(MSCX)
Proposedmethod
5 15.6344 15.6344 15.6344 15.6344 15.6344
6 16.7967 16.7967 16.7967 16.7967 16.7967
7 18.8612 18.8612 18.8612 18.8612 18.8612
8 20.3045 20.3045 20.3045 20.3045 20.3045
9 23.6504 23.6504 23.6504 23.6504 23.6504
10 24.9257 24.9257 24.9257 24.9257 24.9257
15 34.5500 37.9843 33.9444 33.2849 33.2849
16 36.9362 39.095 35.944 35.285 35.2849
17 37.825 37.1805 37.1805 36.0488 36.0488
18 38.226 38.6543 38.048 36.2269 36.2269
19 42.3098 42.6673 42.1952 41.6533 39.7577
20 44.3428 43.8575 42.4478 41.9358 41.9358
Figure 1: Performance of different method
4. CONCLUSION
In this paper, we proposed a Genetic Algorithm with proposed hybrid mutation which can be effectiveto solve TSP. It is combination of NN tour construction and proposed hybrid mutation. The NearestNeighbor tour construction algorithm is used to build up the initial sequence of the tour to creatediverse solutions i.e. the Nearest Neighbor algorithm favours exploration (Global search), which arethen improved by the local search using proposed hybrid mutation i.e. exploitation (local search).Therefore, there is balance between exploration by Nearest Neighbor algorithm and exploitation byhybrid mutation. On use of Nearest Neighbor algorithm and hybrid mutation the search space for GA isreduced while, retaining the good quality solution (balance between exploration and exploitation), incomparison to random initialization of population for GA. From the experimental results, we see thatour proposed algorithm which gives better performance in terms of best solution quality in comparisonto the method OX, MOX, SCX and MSCX. From Table2 it can be seen that for the number of city 19our proposed method obtained the best solution (optimal path) 39.7577. The proposed method forsolving TSP gives best solutions at small population size and iterations from using OX, MOX SCX andMSCX for the same problem.
REFERENCES
[1] Deo, Narsingh. Graph theory with applications to engineering and computer science. PHI Learning Pvt.Ltd., 2004.
0 5 6 7 8 9 10 15 16 17 18 19 2015
20
25
30
35
40
45
Cities
Best
Path
GA (OX)GA (SCX)GA (MOX)GA (MSCX)Propsed method

National Conference on Emerging Trends in Science, Technology and Management, 11-12 Nov 2017, ISBN: 978-93-5281-325-4 Page 120
[2] Combinatorial Optimization, Wiley, New York, 1985.[3] C.H. Papadimitriou, Euclidean traveling salesman problem is NP-complete, Theoretical Computer
Science 4 (1978) 237–244.[4] M.K. Mehmet Ali, F. Kamoun, Neural networks for shortest tour computation and routing in computer
networks, IEEE Transactions on Neural Network 4 (5) (1993) 941–953.[5] Sivanandam, S. N., Deepa. SN (2008) "Introduction to Genetic Algorithms." Springer Berlin Heidelberg
New York.[6] Holland, J. H. "1975, Adaptation in Natural and Artificial Systems, University of Michigan Press, Ann
Arbor."[7] Gutin, Gregory, and Abraham P. Punnen, eds. The traveling salesman problem and its variations. Vol.
12. Springer, 2002.[8] Chen, Yong, and Pan Zhang. "Optimized annealing of traveling salesman problem from the nth-nearest-
neighbor distribution." Physica A: Statistical Mechanics and its Applications 371.2 (2006): 627-632.[9] Jeong, Chang-Sung, and Myung-Ho Kim. "Fast parallel simulated annealing for traveling salesman
problem on SIMD machines with linear interconnections."Parallel computing 17.2 (1991): 221-228.[10] Min, He, Pan Dazhi, and Yang Song. "An improved hybrid ant colony algorithm and its application in
solving TSP." Information Technology and Artificial Intelligence Conference (ITAIC), 2014 IEEE 7thJoint International. IEEE, 2014.
[11] Deng, Wu, et al. "A novel two-stage hybrid swarm intelligence optimization algorithm andapplication." Soft Computing 16.10 (2012): 1707-1722.
[12] Yun, Ho-Yoeng, Suk-Jae Jeong, and Kyung-Sup Kim. "Advanced harmony search with ant colonyoptimization for solving the traveling salesman problem." Journal of Applied Mathematics 2013 (2013).
[13] Zhao, Huan, et al. "Constrained optimization of combustion at a coal-fired utility boiler using hybridparticle swarm optimization with invasive weed."Energy and Environment Technology, 2009.ICEET'09. International Conference on. Vol. 1. IEEE, 2009.
[14] Zhou, Yongquan, et al. "A discrete invasive weed optimization algorithm for solving traveling salesmanproblem." Neurocomputing 151 (2015): 1227-1236.
[15] Huan Chen, Yongquan Zhou, Sucai He, Xinxin Ouyang, Peigang Guo, Invasive weed optimizationalgorithm for solving permutation flow-shop scheduling problem, J. Comput. Theor. Nanosci 10 (2013)708–713.
[16] Gourab Ghosh Roy, Swagatam Das, Prithwish Chakraborty, Design of nonuniform circular antennaarrays using a modified invasive weed optimization algorithm, IEEE T. Antennas Propag 59 (2011) 110–118.
[17] Lee, Kang Seok, and Zong Woo Geem. "A new meta-heuristic algorithm for continuous engineeringoptimization: harmony search theory and practice."Computer methods in applied mechanics andengineering 194.36 (2005): 3902-3933.
[18] Yun, Ho-Yoeng, Suk-Jae Jeong, and Kyung-Sup Kim. "Advanced harmony search with ant colonyoptimization for solving the traveling salesman problem." Journal of Applied Mathematics 2013 (2013).
[19] Albayrak, Murat, and Novruz Allahverdi. "Development a new mutation operator to solve the travelingsalesman problem by aid of genetic algorithms." Expert Systems with Applications 38.3 (2011): 1313-1320.
[20] Al-Dulaimi, B. F., & Ali, H. A. (2008). Enhanced traveling salesman problem solving by geneticalgorithm technique (TSPGA). World Academy of Science, Engineering and Technology, 38, 296-302.
[21] Abdel-Moetty, S. M., & Heakil, A. O. (2012). Enhanced Traveling Salesman Problem Solving usingGenetic Algorithm Technique with modified Sequential Constructive Crossover Operator. InternationalJournal of Computer Science and Network Security (IJCSNS), 12(6), 134.
[22] G. Reinelt, “The Traveling Salesman: Computational Solutions for TSP Applications”, Vol. 840 ofLecture Notes in Computer Science, Springer-Verlag, 1994.
[23] Chieng, H. H., & Wahid, N. (2014). A Performance Comparison of Genetic Algorithm’s MutationOperators in n-Cities Open Loop Travelling Salesman Problem. In Recent Advances on Soft Computingand Data Mining (pp. 89-97). Springer, Cham.
National Conference on Emerging Trends in Science, Technology and Management, 11-12 Nov 2017, ISBN: 978-93-5281-325-4 Page 121
ROLE OF NATURAL FLAVONOIDS IN DELAYINGCATARACT PROGRESSION
Tanu Chaubey, Anurag MishraDepartment of Pharmacy, Ashoka Institute of Technology and Management, Varanasi
ABSTRACT - Current evidence supports the view that cataractogenesis is multifactorial process. ACataract is a clouding of the lens inside the eye which leads to decrease in vision. Visual loss occurs due tothe opacification of the lens which obstruct light from passing and being focused on to the retina at the backof the eye. It is most common cause of blindness and is commonly treated with surgery. Cataract may bepartial or complete, stationary or progressive, hard or soft. In pathogenesis of cataract, multiple factor suchas trauma, genetic factor and environmental toxins are involved. The occurance of cataract is also relatedwith the age progression, diabetes, exposure of certain chemicals, and to UV light, and other from radiation.Currently, the only treatment for cataract is to remove the opaque lens, and hence, because of its costlyoperation, many approaches are explored to inquest other preventive or treatment regimens to delaycataractogenesis. In maintenance of transparency and protection of lens oxidative damage, is afforded byantioxidant system that consist of enzymatic and non-enzymatic activity. Flavonoids are the naturalantioxidant compound, can prevent oxidative damage and experimental cataract progression. Flavonoidshave been shown to posses many properties including inhibition of number of enzymes involved inctaractogenesis such as aldose reductase and many other enzymes naming xanthine oxidase, Lipoxygenaseand Cyclooxygenase. Flavonoids naming quercitrin and quercitrin-2-acetate found in honey and is potentinhibitor of aldose reductase. These flavonoids decrease the accumulation of sorbitol and fructose in the lensand delayed the diabetic cataractogenesis. There is an urgent need for inexpensive, non-surgical approachesto the treatment of cataract. Recently considerable attention has been devoted to the search forphytochemical therapeutics. Several pharmacological actions of natural flavonoids may operate in theprevention of cataract since flavonoids are capable of affecting multiple mechanism responsible fordevelopment of cataract.
1. INTRODUCTION
The pigments that color most flowers, fruits, and seeds are flavonoids. These secondary metabolites,widely distributed in plants, are classified in six major subgroups: chalcones, flavones, flavonols,flavandiols, anthocyanins, and proantho- cyanidins or condensed tannins. Flavonoids consist of a largegroup of polyphenolic compounds having a benzo- -pyrone structure and are ubiquitously present inplants. They are synthesized by phenylpropanoid pathway. Available reports tend to show thatsecondary metabolites of phenolic nature including flavonoids are responsible for the variety ofpharmacological activities [1,2,3]. Their activities are structure dependent. The chemical nature offlavonoids depends on their structural class, degree of hydroxylation, other substitutions andconjugations, and degree of polymerization [4]. Recent interest in these substances has been stimulatedby the potential health benefits arising fromthe antioxidant activities of these polyphenolic compounds.Functional hydroxyl groups in flavonoids mediate their antioxidant effects by scavenging free radical[5, 6]. Flavonoids have ability to induce human protective enzyme systems. [3, 7-9]. Flavonoids areplant secondary metabolites, derivatives of 2-phenyl-benzyl-γ-pyrone, present ubiquitously throughoutthe plant kingdom. Over 9,000 compounds of this group are known [10,11]. Their biosynthesispathway (part of the phenylpropanoid pathway) begins with the condensation of one p-coumaroyl-CoAmolecule with three molecules of malonyl-CoA to yield chalcone (4',2',4',6'-tetrahydroxychalcone),catalyzed by chalcone synthase (CHS). The next step is isomerization of chalcone to flavanone bychalcone isomerase (CHI). From this step onwards, the pathway branches to several different flavonoidclasses, including aurones, dihydrochalcones, flavanonols (dihydroflavonols), isoflavones, flavones,flavonols, leucoanthocyanidins, anthocyanins and proanthocyanidins. Chronic inflammation is beingshown to be increasingly involved in the onset and development of several pathological disturbancessuch as arteriosclerosis, obesity, diabetes, neurodegenerative diseases and even cancer. Treatment forchronic inflammatory disorders has not been solved, and there is an urgent need to find new and safeanti-inflammatory compounds. Flavonoids belong to a group of natural substances occurring normallyin the diet that exhibit a variety of beneficial effects on health. The anti-inflammatory properties offlavonoids have been studied recently, in order to establish and characterize their potential utility astherapeutic agents in the treatment of inflammatory diseases. Several mechanisms of action have beenproposed to explain in vivo flavonoid anti-inflammatory actions, such as antioxidant activity,inhibition of eicosanoid generating enzymes or the modulation of the production of proinflammatorymolecules [10]Cataract is defined as opacity within the clear natural crystalline lens of the eye, which graduallyresults in vision deterioration. The World Health Organization (WHO) estimated that in 1990, out of
National Conference on Emerging Trends in Science, Technology and Management, 11-12 Nov 2017, ISBN: 978-93-5281-325-4 Page 122
the 38 million blind people worldwide, cataract accounted for 41.8% -almost 16 million people. With aprojected increase in the geriatric population, WHO has estimated that there will be 54 million blindpeople aged 60 years or older by the year 2020. Accordingly, cataract surgery will continue to weighheavily on health care budgets in the developed nations. In the United States, cataract-relatedexpenditure is estimated to be over $3.4 billion annually. In the developing world, the number of newcataract cases supersedes the rate of surgical removal. In Africa alone, only about 10% of the 500,000new cases of cataract blindness each year are likely to have their sight restored surgically. It isestimated that if onset of cataract could be delayed by 10 years, the annual number of cataract surgeriesperformed would be reduced by almost a half. This calls to question the risk factors of thismultifactorial disease, which have been a litany of genetic, environmental, socioeconomic, andbiochemical factors working in an interlaced fashion. [12, 13, 14, 15]The lens is composed of specialized proteins (called crystallins), whose optical properties aredependent on the fine arrangement of their three-dimensional structure and hydration. Membraneprotein channels maintain osmotic and ionic balance across the lens, while the lens cytoskeletonprovides for the specific shape of the lens cells, especially the fibre cells of the nucleus Protein-boundsulfhydryl (SH)-groups of the crystallins are protected against oxidation and cross-linking by highconcentrations of reduced glutathione -‘mother of all antioxidants’. Their molecular compositions, aswell as tertiary and quaternary structures provide a high spatial and timely stability (heat-shockproteins) principally of the larger crystallins, which are able to absorb radiation energy (shortwavevisible light, ultraviolet and infrared radiation) over longer time periods without basically changingtheir optical qualities. This provides substantial protective function also for the activity of variousenzymes of the carbohydrate metabolism [12].However, as ageing takes place, oxidative stress occurs which reflects an imbalance between thesystemic manifestation of reactive oxygen species and a biological system’s ability to readily detoxifythe reactive intermediates or to repair the resulting damage. Disturbances in the normal redox state ofcells can cause toxic effects through the production of peroxides and free radicals that damage allcomponents of the cell, including proteins, lipids, and DNA [16]. It is extensively recognized thatoxidative stress is a significant factor in the genesis of senile cataract (the commonest cataract type),both in experimental animals [17] and in cultured lens models [18]. The oxidative processes upsurgewith age in the human lens, and concentration of proteins found is significantly higher in opaquelenses [19]. This leads to break down and aggregation of protein, and culminates in damage to fibercell membranes [20]. Advanced that in the ageing eye, barriers develop that prevent glutathione andother protective antioxidants from reaching the nucleus in the lens, thus making it susceptible tooxidation.In addition, ageing generally reduces the metabolic efficiency of the lens thus increasing itspredisposition to noxious factors. Ageing provides the grounds where ‘cataract noxae’ can act andinteract to induce the formation of a variety of cataracts, many of which are associated with highprotein-related light scattering and discoloration. Resulting from ageing, the glucose metabolicpathway functions rather an aerobically with low energetic efficiency making protein synthesis,transport and membrane synthesis problematic. In addition, the syncytial metabolic function of thedenucleated fiber cells has to be maintained by the epithelium and the small group of fiber cells,which still have their metabolic armamentarium. This results in a steep inside-out metabolic gradient,which is complicated by the fact that the lens behaves like an overhaul system, shutting off damagedgroups of fiber cells -leading to wedge or sectorial cataract formation. All epithelial cells of the lensare subjected to light and radiation stress leading to alterations of the genetic code. Because defectivecells cannot be extruded, these are either degraded (by apoptosis or necrosis), or they are moved tothe posterior capsular area, where they contribute to the formation of posterior sub capsular cataracts(PSC) [12].The enzyme aldose reductase catalyzes the reduction of glucose to sorbitol through the polyol pathway,a process linked to the development of diabetic cataract. Extensive research has focused on theprincipal role of the AR pathway as the catalytic factor in diabetic cataract formation. It has beenshown that the intracellular accumulation of sorbitol leads to osmotic changes resulting in hydropiclens fibers that degenerate and form sugar cataracts [21]. In the lens, sorbitol is produced at a rapid ratethan it is converted to fructose by the enzyme sorbitol dehydrogenase. In addition, the polar characterof sorbitol prevents its intracellular removal through diffusion. The increased accumulation of sorbitolcreates a hyperosmotic effect that results in an inflow of fluid to annul the osmotic gradient. Animalstudies have shown that AR-mediated intracellular accumulation of polyols leads to a collapse andliquefaction of lens fibers, which ultimately results in the formation of lens opacities [22,23]. Thesefindings have led to the “Osmotic Hypothesis” of sugar cataract formation. Oxidative stress andosmotic imbalance can also result from nutritional and trace metals deficiencies, smoking, toxic
National Conference on Emerging Trends in Science, Technology and Management, 11-12 Nov 2017, ISBN: 978-93-5281-325-4 Page 123
substances including drugs abuses, alcohol etc., radiation (ultraviolet, electromagnetic waves etc.)leading to cataract formation. The exact pathophysiology of the above risk factors are however, clearlynot understood [12, 24].
2. ANTICATARACT ACTIVITY OF FLAVONOIDS
Rhamnocitrin, a flavonoid, possess strong antioxidant effects; can be used effectively to manage thecataract. Anticataract activity of rhamnocitrin isolated from Bauhinia variegate (Leguminosae) stembark, was studied in ovine and chick embryo lens model. It showed a significant protection againstcloudiness in lenses induced by hydrogen peroxide and hydrocortisone in a dose dependent manner.The findings suggest that rhamnocitrin possess significant anticataract activity and act most likely dueto its antioxidant property [25].A number of compounds, both natural and synthetic, have been found to inhibit aldose reductase. Theseso-called aldose reductase inhibitors (ARIs) bind to aldose reductase, inhibiting polyol production. As agroup, flavonoids are among the most potent naturally occurring ARIs [26]. A group of researchersexamined the effect of an orally administered ARI in inhibiting polyol accumulation. They reported thearrest of cataracts in galactosemic rats by oral feeding of a synthetic ARI. Building on this research,another group studied the effect of a flavonoid ARI, quercetrin (a glycoside of quercetin). Rats weredivided into two groups, one receiving lab chow only, while the experimental group was fed quercetrinin rat chow plus an additional 70 mg oral quercetrin daily in aqueous suspension. Three days afterbeginning flavonoid supplementation diabetes was chemically induced and three days later lenses wereassessed for sorbitol and fructose. The flavonoid group demonstrated a 50-percent inhibition of sorbitoland fructose accumulation. The control group developed cataracts by the tenth day, whereas the groupreceiving quercetrin, although their blood sugar was comparable (average 380 mg/100 mL), had notdeveloped cataracts by the 25th day. A French study examining the effect of oral doses of quercetin didnot find an inhibition of cataract formation in diabetic animals. In the positive study quercetrin ratherthan quercetin was used, the former administered in a water suspension which was undoubtedly moreabsorbable. The latter study was in French with only the abstract available so a dosage comparison wasnot possible [26].An in vitro experiment to determine which aspects of flavonoids conferred the most ARI activity, andultimately which flavonoids were the most potent in that respect. Their earlier more limited researchhad found quercetin, quercetrin and myricitrin to possess the most potent ARI activity. In the morerecent experiment 44 flavonoids and their derivatives were examined for the ability to inhibit aldosereductase and polyol accumulation in rat lenses incubated in the sugar xylose. All flavonoids testedexhibited some inhibitory activity. The two most potent inhibitors were derivatives of quercetin,quercetrin and quercetrin-2-acetate, the latter the most potent ARI inhibitor known. Although inhibitionwas also noted by isoflavones, catechins, coumarins, and anthocyanins, they were found to be muchless potent than flavones. When dissolved, flavones easily convert to their corresponding chalcone bythe opening of the center or B-ring of the flavone structure. Because this may occur in vivo as well, theresearchers tested hesperidin and hesperidin chalcone and found their inhibitory potencies were nearlyidentical. The chalcones, being more water-soluble and thus more absorbable, may represent a morelogical means of oral administration. In the final analysis, the pentahydroxy (five OH groups) flavonesconferred the most potent effect [26].The glucoside of isorhamnetin (methylated quercetin), isolated as a bioactive flavonoid from the leavesof Cochlospermum religiosum [27] and flavonoid fraction isolated from fresh leaves of Vitex negundo[28] protected enucleated rat eye lenses against selenite-induced cataract in an in vitro culture model.The flavonoid venoruton, a mixture of mono-, di-, tri- and tetrahydroxyethylrutosides, significantlyreduced the degree of opacification and the leakage of lactate dehydrogenase in rat lens organ culturesimulating diabetic conditions [29].As early as in 1977, the effect of quercetin rhamnoside (quercitrin) on the development of cataract inthe rodent Octodon degus made diabetic by a single intraperitoneal dose of streptozotocin. The controldiabetic animals not receiving quercitrin developed nuclear opacity by about the tenth day after theonset of hyperglycemia. In contrast, the diabetic animals treated with quercitrin did not developcataracts even 25 days after the onset of diabetes, although they had a blood glucose concentrationsimilar to that of the control diabetic group [26]. In similar study streptozotocin diabetic rats, high-isoflavone soy protein markedly decreased the death rate and incidence of cataracts in the diabeticanimals [30]. At the same time, reduced serum glucose and methylglyoxal were recorded in the treatedrats. Lower incidence of cataract in streptozotocin diabetic rats treated with flavangenol, a complexmixture of bioflavaonoids with oligomeric proanthocyanidin as main constituents [31]. The rat selenitecataract model was extensively used to study the anticataract action of flavonoids [32,42]. The resultsshowed that ethanol extract of propolis, rich in flavonoids and quercetin prevented cataract formation
National Conference on Emerging Trends in Science, Technology and Management, 11-12 Nov 2017, ISBN: 978-93-5281-325-4 Page 124
to the extent of 70 and 40%, respectively[34,35]. Standardized extract of Ginkgo biloba did not affectcataract formation [34, 35]. The flavonoid fraction from Emilia sonchifolia was reported to decreasethe rate of maturation of selenite cataract more efficiently than quercetin. Activities of superoxidedismutase, catalase and reduced glutathione were found to be increased in the group treated with Emiliasonchifolia, while thiobarbituric acid reacting substances were decreased compared with the seleniteinduced group [36]. Rutin (quercetin rutinoside) was reported to prevent selenite-inducedcataractogenesis in rat pups. At the end of a 30-day study period, all the rat pups that had received onlyselenite were found to have developed a dense nuclear opacity in the lens of each eye, whereas only33.3% of pups that had received selenite and been treated with an intraperitoneal dose of rutin hydratewere found to have mild lenticular opacification in each eye. The other 66.7% of pups in that group hadclear lenses in both eyes, as in normal pups. The mean activities of catalase, superoxide dismutase,glutathione peroxidase, glutathione transferase, and glutathione reductase were found to besignificantly lower in the lenses of cataract-untreated rat pups than in normal control rat lenses.However, in lenses treated with rutin hydrate, the mean activities of antioxidant enzymes weresignificantly higher than the values in rat pups with untreated cataracts [37]. Onion is a flavonoid-richfoodstuff and the major flavonoids contained have been identified as quercetin, quercetin-4‘-glucosideand quercetin-3,4‘-diglucoside [38,39]. The instillation of fresh juice of crude onion into the rat eyeswas found to prevent selenite-induced cataract formation by 75%. This effect was associated withhigher mean total antioxidant level as well as higher means activities of superoxide dismutase andglutathione peroxidase in the lenses of rats receiving fresh juice of crude onion and subcutaneousinjection of sodium-selenite, compared with those rats which received only sodium-selenite injection.The onion juice, as a flavonoid-rich source, was postulated to provide an additional support to theantioxidant agents, leading to the elevation of total antioxidant levels and superoxide dismutase andglutathione peroxidase activities in the rat lens, in spite of exposure to sodium-selenite [40]. Flavonoidfractions isolated from natural sources including green and black tea [41,33], Ginkgo biloba [41], grapeseeds [43], Emilia sonchifolia [36], Vitex negundo [28] and broccoli [44] were shown to haveanticataract activity in selenite-induced experimental cataract in rats. In addition, Ginkgo bilobaextracts were found to protect rats against radiation-induced cataract [45]. Among others, damage tothe lens epithelium is considered a possible cause of cataract formation. Catechin was found to inhibitapoptotic cell death in the lens epithelium of rats after cataract induction with N-methyl-N-nitrosourea[46]. Grape seed extract rich in flavonoids reduced hydrogen-peroxide induced apoptosis of human lensepithelial cells and depressed H2O2-induced activation and translocation of NF-кB [47]. Similarly, theflavonoid fisetin was found to protect human lens epithelial cells from UVB induced oxidative stressby inhibiting the generation of reactive oxygen species and modulating the activation of NF-кB andMAPK pathways [48].Oral administration of a flavonoid gossypin, an aldose reductase inhibitor, effectively delayed the onsetof cataract formation in the galactosemic rats. It also produced a significant decrease in theaccumulation of lens galactitol in these animals. These observations confirm the earlier reports that thelens aldose reductase plays a key role in the initiation of the cataractous process during galactosemiaand suggest that flavonoids may be useful against the ophthalmic manifestations initiated by theaccumulation of polyols in the lens.Fisetin inhibits the UVB-induced generation of reactive oxygen species in human lens epithelial cells.Fisetin, a flavonoid compound with high trolox equivalent antioxidative capacity (TEAC) values, ishydrophobic and readily passes through cell membranes and accumulates intracellularly, resulting in agood antioxidant activity [49].Galactosemic cataracts are characterized by electrolyte disturbances resulting in osmotic imbalanceand loss of transparency. The defensive role of quercetin, a bioflavonoid, against the alterations ofcalcium (Ca2+), sodium (Na+), and potassium (K+) concentrations in galactose-induced cataract in arodent model. The experimental study was conducted on weanling male Wistar rats. Aldose reductaseactivity and protein content and concentrations of Ca2+, Na+, and K+ were determined in normal andcataractous lenses. Treatment with quercetin resulted in a significant decrease in Na+ and Ca2+ andaldose reductase levels and an increase in K+ and protein levels in galactosemic cataractous lenses.These results imply that inclusion of quercetin contributes to lens transparency through themaintenance of characteristic osmotic ion equilibrium and protein levels of the lens [50].The onion, (Allium cepa), is a staple food with a high content of flavonoids. The aim of the study wasto assess whether topical instillation of fresh onion juice could prevent cataract formation in selenite-induced experimental cataractogenesis in rat model, and the status of total antioxidant level, andactivities of the enzymes glutathione peroxidase and superoxide dismutase (SOD), as a marker ofoxidative stress in explanted rat lenses [38].

National Conference on Emerging Trends in Science, Technology and Management, 11-12 Nov 2017, ISBN: 978-93-5281-325-4 Page 125
Diabetes mellitus is a common endocrine disorder characterised by hyperglycaemia and predisposes tochronic complications affecting the eyes, blood vessels, nerves and kidneys. Hyperglycaemia has animportant role in the pathogenesis of diabetic complications by increasing protein glycation and thegradual build-up of advanced glycation endproducts (AGEs) in body tissues. These AGE form on intra-and extracellular proteins, lipids, nucleic acids and possess complex structures that generate proteinfluorescence and cross-linking. Protein glycation and AGE are accompanied by increased free radicalactivity that contributes towards the biomolecular damage in diabetes. There is considerable interest inreceptors for AGEs (RAGE) found on many cell types, particularly those affected in diabetes. Recentstudies suggest that interaction of AGEs with RAGE alter intracellular signalling, gene expression,release of pro-inflammatory molecules and free radicals that contribute towards the pathology ofdiabetic complications. The role of AGEs in the pathogenesis of retinopathy, cataract, atherosclerosis,neuropathy, nephropathy, diabetic embryopathy and impaired wound healing are considered. There isconsiderable interest in anti-glycation compounds because of their therapeutic potential l[26].Both fisetin and α-lipoic acid had a protective effect on cataract development in a streptozotocin-induced experimental cataract model. The protective effect of fisetin appears as though more effectivethan α-lipoic acid[48].
3. OTHER PLANT CONSTITUENTS USED IN TREATMENT OF CATRACT
Curcumin and turmeric treatment appear to have countered the hyperglycemia-induced oxidativestress, because there was a reversal of changes with respect to lipid peroxidation, reduced glutathione,protein carbonyl content and activities of antioxidant enzymes in a significant manner. Also, treatmentwith turmeric or curcumin appears to have minimized osmotic stress, as assessed by polyol pathwayenzymes. Most important, aggregation and insolubilization of lens proteins due to hyperglycemia wasprevented by turmeric and curcumin. Turmeric was more effective than its corresponding levels ofcurcumin [51].The N-acetylated form of natural dipeptide L-carnosine appears to be suitable and physiologicallyacceptable for nonsurgical treatment for senile cataracts [52].An aqueous extract of Pterocarpus marsupium Linn bark, Ocimum sanctum Linn leaves and alcoholicextract of Trigonella foenum-graecum Linn seeds. Administration of all the three plant extracts exerteda favorable effect on body weight and blood glucose. On the course of cataract development, PMfollowed by FG exerted anti-cataract effect evident from decreased opacity index while OS failed toproduce any anti-cataract effect in spite of significant antihyperglycemic activity [53].
4. CONCLUSION
A cataract is the clouding of the lens inside the eye which leads to decrease in vision. Visual lossoccurs due to the opacification of the lens. It is the most common cause of the blindness. Cataract maybe partial or complete, stationary or progressive, hard or soft. In pathogenesis of cataract, multiplefactor such as trauma, genetic factor and environmental toxins are involved. The occurance of cataractis also related with the age progression, diabetes, exposure of certain chemicals, and to UV light, andother from radiation. Currently, the only treatment for cataract is to remove the opaque lens, and hence,because of its costly operation, many approaches are explored to inquest other preventive or treatmentregimens to delay cataractogenesis.In maintenance of transparency and protection of lens oxidative damage, is afforded by antioxidantsystem that consist of enzymatic and non-enzymatic activity. Cataract formation is associated with aprogressive decrease in lenticular GSH and therefore suggested that GSH plays an important role inlenticular function by the protecting sulfhydryl groups from oxidation. Antioxidant enzymescatalytically remove free radicals and reactive oxygen species. Due to the activity of anti oxidantenzymes defence mechanism, markers of oxidative stress for instance, SOD, Catalase, GSH andTBAR’s are present in all eye tissues for removal of free radicals.Flavonoids are the natural antioxidant compound, can prevent oxidative damage and experimentalcataract progression Onion, ginger and Honey are majorly rich in flavonoids. Flavonoids have beenshown to posses many properties including inhibition of number of enzymes involved inctaractogenesis such as aldose reductase and many other enzymes naming xanthine oxidase,Lipoxygenase and Cyclooxygenase.Flavonoids naming quercitrin and quercitrin-2’’-acetate found in honey and is potent inhibitor of aldosereductase. These flavonoids decrease the accumulation of sorbitol and fructose in the lens and delayedthe diabetic cataractogenesis.Presently, surgical extraction remains the only cataract cure. Cataract surgery has become the mostfrequent surgical procedure in people aged 65 years or older causing a considerable financial burden to

National Conference on Emerging Trends in Science, Technology and Management, 11-12 Nov 2017, ISBN: 978-93-5281-325-4 Page 126
the health care system. Hence, there is an urgent need for inexpensive, non-surgical approaches to thetreatment of cataract since a delay of 10 years in the onset of cataract by any means would be expectedto halve the number of cataract extractions.
REFERENCES
[1.] Kumar.S and Pandey.A.K, “ Chemistry and Biological activities of flavonoids: An Overview, Thescientific world journal, 2013.
[2.] M. F. Mahomoodally etal, “Antimicrobial activities and phytochemical profiles of endemic medicinalplants of Mauritius,” Pharmaceutical Biology, vol. 43, no. 3, pp. 237–242, 2005.
[3.] A. K. Pandey, “Anti-staphylococcal activity of a pan-tropical aggressive and obnoxious weedParihenium histerophorus: an in vitro study,” National Academy Science Letters, vol. 30, no. 11-12,pp. 383–386, 2007.
[4.] E. H. Kelly, etal, “Flavonoid antioxidants: chemistry, metabolism and structure-activity relationships”,Journal of Nutritional Biochemistry, vol. 13, no. 10, pp.572–584, 2002.
[5.] S. Kumar, etal, “Antioxidant mediated protective effect of Parthenium hysterophorus against oxidativedamage using in vitro models,” BMC Complementary and Alternative Medicine, vol. 13, article 120,2013.
[6.] S. Kumar and A. K. Pandey, “Phenolic content, reducing power and membrane protective activities ofSolanum xanthocarpum root extracts,” Vegetos, vol. 26, pp: 301–307, 2013.
[7.] S. Kumar,etal, “Calotropis procera root extract has capability to combat free radical mediateddamage,” ISRN Pharmacology, vol. 2013, 2013.
[8.] N. C. Cook and S. Samman, “Review: flavonoids-chemistry, metabolism, cardioprotective effects anddietary sources,” Journal of Nutritional Biochemistry, vol. 7, no. 2, pp: 66–76, 1996.
[9.] C. A. Rice-Evans, etal, “The relative antioxidant activities of plantderived polyphenolic flavonoids,”Free Radical Research, vol. 22, no. 4, pp: 375–383, 1995.
[10.] Mierziak.J, etal,, “Flavonoids as important molecules of plant interactions with enviorment”,Molecules, 2014.
[11.] Buer.C.S, etal, “Flavonoid new roles for old molecules”, ,Integr. Plant Biol., vol. 52, pp: 98-111, 2010.[12.] Andrews Nartey, “The pathophysiology of cataract and major interventions to retarding its
progression: A mini review”, Med Carve, vol.-6, issue- 3, 2017.[13.] Thylefors B, etal, “ Global data on blindness”, Bull World Health Organ, vol.-73, issue-1, pp:115-121,
1995.[14.] West. S.K and Valmadrid C.T, “ Epidemiology of risk factors for age related cataract”, Surv
Ophthalmol, vol.-39, issue-4, pp.- 323-334, 1995.[15.] Livingston PM,etal, “The epidemiology of cataract: a review of the literature”, Ophthalmic Epidemiol,
vol.-2, issue-3, pp: 151-164, 1995.[16.] Lou M.F, “Redox regulation in the lens”, Prog Retin Eye Res , vol.-22, issue-5, pp.- 657-682, 2003.[17.] Truscott R.J, “ Age-related nuclear cataract-oxidation is the key”, Exp Eye Res , vol.-80, issue-5, pp:
709-725, 2005.[18.] Gupta SK, etal, “ Lycopene attenuates oxidative stress induced experimental cataract development: An
in vitro and in vivo study”, Nutrition, vol.- 19, issue-9, pp: 794-799, 2003.[19.] Boscia F, etal, “Protein oxidation and lens opacity in humans”, Invest Ophthalmol Vis Sci, vol.-41,
issue-9, pp: 2461-2465, 2000.[20.] Harvey S and David Z (2000) Editors, New York: Time Health Guide; [Updated and reviewed on
2010 June 23, Cataract-Risk factors.[21.] Kinoshita J.H, “ Mechanisms initiating cataract formation. Proctor lecture”,Invest Ophthalmol, vol.-13,
issue-10, pp: 713-724,1974.[22.] Kinoshita JH, etal, “Aldose reductase in diabetic complications of the eye”, Metabolism, vol.-28, issue-
4 Suppl, pp: 462-469, 1979.[23.] Kador P.F and Kinoshita J.H, “ Diabetic and galactosaemic cataracts”, Ciba Found Symp, vol.- 106,
pp: 110-131, 1984.[24.] Stefek. M., “ Natural Flavonoids as potential multifactorial agents in prevention of diabetic cataract”,
Inter disciplinary toxicology,vol.-4, issue- 2, 2011.[25.] Bokade S.H, etal, “Anticataract activity of Rhamnocitrin isolated from Bauhinia variegata stem bark”,
Oriental pharmacy and experimental medicine, vol.-12, issue-3, pp: 227-232, 2012.[26.] Varma S.D and Kinoshita J.H, “ Inhibition of lens aldose reductase by flavonoids –Their possible role
in the prevention of diabetic cataract”, Biochemical Pharmacology, vol.-25, issue-22, pp:2505-2513,1976.
[27.] Gayathri Devi V, etal, “Isorhamnetin-3-glucoside alleviates oxidative stress and opacifi cation inselenite cataract in vitro”, Toxicol in Vitro, vol.-24, pp: 1662–1669, 2010.
[28.] Rooban BN, etal,, “Vitex negundo attenuates calpain activation and cataractogenesis in seleniteModels”, Exp Eye Res, vol.- 88, pp: 575–582, 2009.
[29.] Kilic F, etal , “ Modelling cortical cataractogenesis. XVIII. In vitro diabetic cataract reduction byvenoruton. A flavonoid which prevents lens opacifi catio”, Acta Ophthalmol Scand , vol.-74, pp: 372–378, 1996

National Conference on Emerging Trends in Science, Technology and Management, 11-12 Nov 2017, ISBN: 978-93-5281-325-4 Page 127
[30.] Lu M-P, etal,“ Dietary soy isofl avones increase insulin secretion and prevent the development ofdiabetic cataracts in streptozotocin-induced diabetic rats”, Nutr Res, vol.-28, pp: 464–471, 2008.
[31.] Nakano M, etal, “Inhibitory eff ect of astraxanthin combined with Flavangenol on oxidative stressbiomarkers in streptozotocin-induced diabetic rats”, Int J Vitam Nutr Res , vol.-78, pp: 175–182, 2008.
[32.] Kyselova Z, “Diff erent experimental approaches in modelling cataractogenesis: An overview ofselenite-induced nuclear cataract in rats”, Interdisc Toxicol, vol.- 3, pp: 3–14, 2010.
[33.] Gupta SK, etal, “Advances in pharmacological strategies for the prevention of cataract development”,Indian J Ophthalmol, vol.-57, pp: 175–183, 2009
[34.] Orhan H, etal, “ Eff ects of some probable antioxidants on selenite-induced cataract formation andoxidative stress-related parameters in rats”,Toxicology, vol.-139, pp: 219–232, 1999.
[35.] Scheller S, etal, “Free radical scavenging by ethanol extract of propolis”, Int J Radiat Biol, vol.-57,pp: 461–465, 1990.
[36.] Lija Y, etal, “ Modulation of selenite cataract by the fl avonoid fraction of emilia sonchifolia inexperimental animal models”, Phytother Res, vol.-20, pp: 1091–1095,2006
[37.] Isai M, etal, “ Prevention of selenite- induced cataractogenesis by rutin in Wistar rats”, Mol Vis, vol.-15, pp: 2570–2577, 2009
[38.] Fossen T, etal, “Flavonoids from red onion (Allium cepa)” ,Phytochemistry, vol.-47, pp: 281–285,1998
[39.] Miean K.H and Mohamed S, “Flavonoid (myricetin, quercetin, kaempferol, luteolin and apigenin)content of edible tropical plants”, J Agr Food Chem, vol.-49, pp: 3106–1312, 2001
[40.] Javadzadeh A, etal, “Preventive eff ect of onion juice on selenite- induced experimental cataract”,Indian J Ophthalmol , vol.-57, pp: 185–189, 2009.
[41.] Thiagarajan G, etal, “ Molecular and cellular assessment of Ginkgo biloba extract as a possibleophthalmic drug” , Exp Eye Res,vol.- 75, pp: 421–430, 2002
[42.] Gupta S.K, etal, “ Green tea (Camellia sinensis) protects against selenite-induced oxidative stress inexperimental cataractogenesis”,Ophthalmic Res ,vol.-34, pp: 258–263,2002.
[43.] Durukan AH, etal, “Ingestion of IH636 grape seed proanthocyanidin extract to prevent selenite-induced oxidative stress in experimental cataract”, J Cataract Refract Surg vol.- 32, pp: 1041–1045,2006
[44.] Vibin M, etal, “ Broccoli regulates protein alterations and cataractogenesis in selenite Models”, CurrEye Res, vol.- 35, pp: 99–107, 2010.
[45.] Ertekin M.V, etal, “Effects of oral ginkgo biloba supplementation on cataract formation and oxidativestress occurring in lenses of rats exposed to total cranium radiotherapy”,Jpn J Ophthalmol , vol- 48,pp: 499–502, 2004
[46.] Lee S.M, etal, “Protective eff ect of catechin on apoptosis of the lens epithelium in rats with N-methyl-N-nitrosoureainduced cataracts”, Korean J Ophthalmol vol.-24, pp: 101–107, 2010
[47.] Jia Z, etal, “ Grape seed proanthocyanidin extract protects human lens epithelial cells from oxidativestress via reducing NF-кB and MAPK protein expression”, Mol Vis, vol.-17, pp: 210–217,2011
[48.] Yao K, etal, “The fl avonoid fisetin inhibits UV radiation-induced oxidative stress and the activation ofNF-kappaB and MAPK signaling in human lens epithelial cells”,Mol Vis, vol.- 14, pp: 1865–1871,2008.
[49.] Kan E, etal, “ Effects of two antioxidants; a lipoic acid and fistin against diabetic cataract in mice,International ophthalmology, vol.- 35, issue-1, pp: 115-120, 2015.
[50.] Ramana B.V, etal, “ Defencive role of Quercetin against imbalance of calcium, sodium, and potassiumin galactosemic cataract”, Biological trace element research, vol.-119, issue-1, pp:35-41, 2007.
[51.] Suryanarayana P., etal, “Curcumin and Turmeric delay Streptozotocin induced diabetic cataract inrats”, Investigative ophthalmology and visual science, vol.- 46, pp:2092-2099, 2015.
[52.] Babizhayev M.A, etal, “N-Acetylcarnosine, a natural histidine-containing dipeptide, as a potentophthalmic drug in treatment of human cataracts”, Peptides, vol.-22, issue-6, pp: 979-994, 2001.
[53.] Vats V, etal, “Anti-cataract activity of Pterocarpus marsupium bark and Trigonella foenum-graecum seeds extract in alloxan diabetic rats”, Journal of Ethnopharmacology, vol.-93, issue 2-3, pp:289-294, 2004.
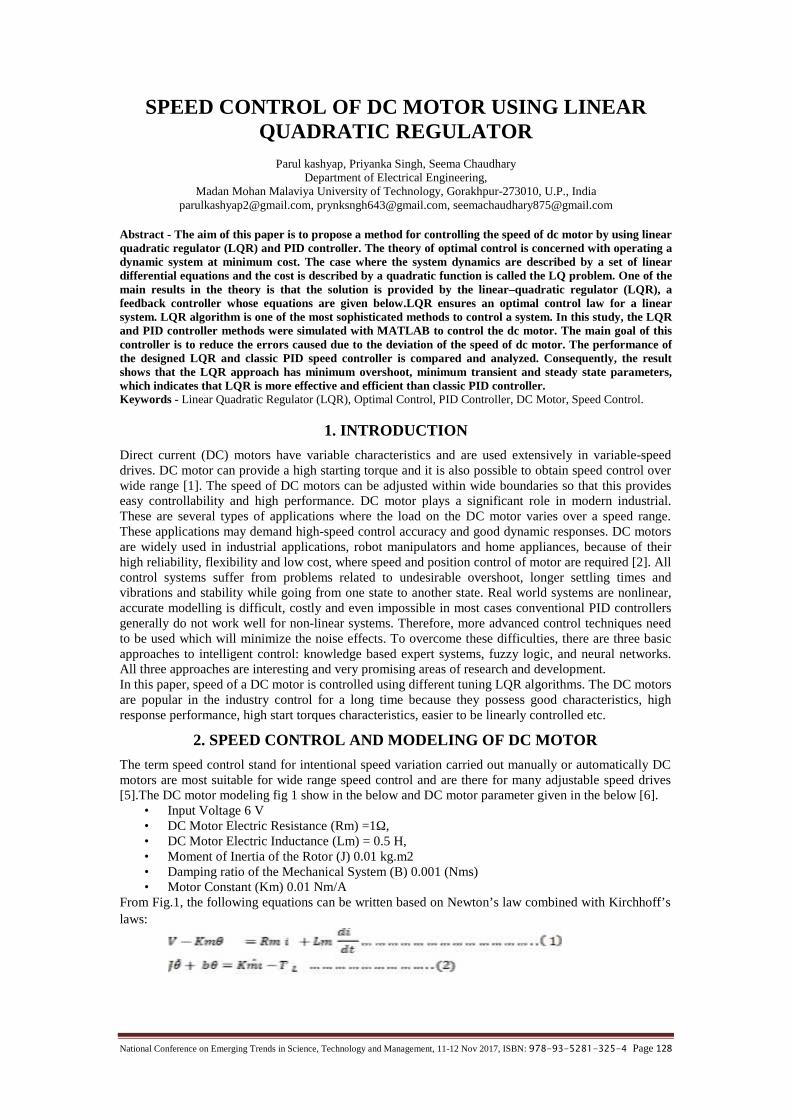
National Conference on Emerging Trends in Science, Technology and Management, 11-12 Nov 2017, ISBN: 978-93-5281-325-4 Page 128
SPEED CONTROL OF DC MOTOR USING LINEARQUADRATIC REGULATOR
Parul kashyap, Priyanka Singh, Seema ChaudharyDepartment of Electrical Engineering,
Madan Mohan Malaviya University of Technology, Gorakhpur-273010, U.P., [email protected], [email protected], [email protected]
Abstract - The aim of this paper is to propose a method for controlling the speed of dc motor by using linearquadratic regulator (LQR) and PID controller. The theory of optimal control is concerned with operating adynamic system at minimum cost. The case where the system dynamics are described by a set of lineardifferential equations and the cost is described by a quadratic function is called the LQ problem. One of themain results in the theory is that the solution is provided by the linear–quadratic regulator (LQR), afeedback controller whose equations are given below.LQR ensures an optimal control law for a linearsystem. LQR algorithm is one of the most sophisticated methods to control a system. In this study, the LQRand PID controller methods were simulated with MATLAB to control the dc motor. The main goal of thiscontroller is to reduce the errors caused due to the deviation of the speed of dc motor. The performance ofthe designed LQR and classic PID speed controller is compared and analyzed. Consequently, the resultshows that the LQR approach has minimum overshoot, minimum transient and steady state parameters,which indicates that LQR is more effective and efficient than classic PID controller.Keywords - Linear Quadratic Regulator (LQR), Optimal Control, PID Controller, DC Motor, Speed Control.
1. INTRODUCTION
Direct current (DC) motors have variable characteristics and are used extensively in variable-speeddrives. DC motor can provide a high starting torque and it is also possible to obtain speed control overwide range [1]. The speed of DC motors can be adjusted within wide boundaries so that this provideseasy controllability and high performance. DC motor plays a significant role in modern industrial.These are several types of applications where the load on the DC motor varies over a speed range.These applications may demand high-speed control accuracy and good dynamic responses. DC motorsare widely used in industrial applications, robot manipulators and home appliances, because of theirhigh reliability, flexibility and low cost, where speed and position control of motor are required [2]. Allcontrol systems suffer from problems related to undesirable overshoot, longer settling times andvibrations and stability while going from one state to another state. Real world systems are nonlinear,accurate modelling is difficult, costly and even impossible in most cases conventional PID controllersgenerally do not work well for non-linear systems. Therefore, more advanced control techniques needto be used which will minimize the noise effects. To overcome these difficulties, there are three basicapproaches to intelligent control: knowledge based expert systems, fuzzy logic, and neural networks.All three approaches are interesting and very promising areas of research and development.In this paper, speed of a DC motor is controlled using different tuning LQR algorithms. The DC motorsare popular in the industry control for a long time because they possess good characteristics, highresponse performance, high start torques characteristics, easier to be linearly controlled etc.
2. SPEED CONTROL AND MODELING OF DC MOTOR
The term speed control stand for intentional speed variation carried out manually or automatically DCmotors are most suitable for wide range speed control and are there for many adjustable speed drives[5].The DC motor modeling fig 1 show in the below and DC motor parameter given in the below [6].
• Input Voltage 6 V• DC Motor Electric Resistance (Rm) =1Ω,• DC Motor Electric Inductance (Lm) = 0.5 H,• Moment of Inertia of the Rotor (J) 0.01 kg.m2• Damping ratio of the Mechanical System (B) 0.001 (Nms)• Motor Constant (Km) 0.01 Nm/A
From Fig.1, the following equations can be written based on Newton’s law combined with Kirchhoff’slaws:

National Conference on Emerging Trends in Science, Technology and Management, 11-12 Nov 2017, ISBN: 978-93-5281-325-4 Page 129
Fig 1: DC motor modelling
Because the back EMF eb is proportional to speed ω directly, then The dc motor torque is relatedto the armature current (I), by a constant factor . The back emf ( ) is related to the rotationalspeed by the following equations:
Assuming that, (motor torque constant) = (electromotive force constant of dc motor), Using LaplaceTransforms:
By eliminating I(S) between the two above equations, where the rotational speed is considered theoutput and the armature voltage is considered the input. Assuming (load torque) =0, even though it willnot affects the transfer function.
3. PROPORTIONAL INTEGRAL AND DERIVATIVE CONTROLLER
The combination of proportional, integral and derivative control action is called PID control action.PID controllers are commonly used to regulate the time-domain behavior of many different types ofdynamic plants. These controllers are extremely popular because they can usually provide good closed-loop response characteristics. Consider the feedback system architecture that is shown in Fig. 1 whereit can be assumed that the plant is a DC motor whose speed must be accurately regulated [7]. PIDcontrol scheme is extensively used in control systems for various control applications. Thecombination of proportional, integral and derivative control action is called PID control action and thecontroller is called three action controllers. Although PD control deals neatly with the overshoot andrising problems associated with proportional control it does not reduce the problem with the steady-state error. Hence, PID controllers are used to reduce the steady-state error apart having the advantagesof PD controllers.
Fig. 2: PID Controller
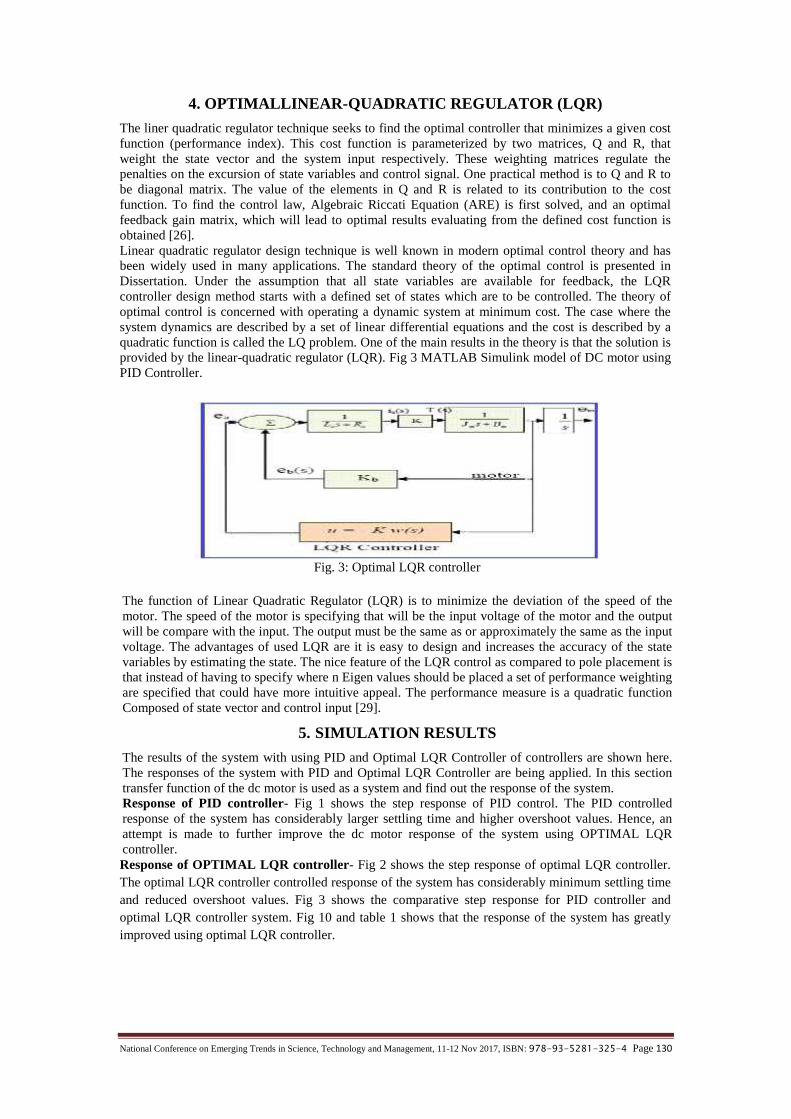
National Conference on Emerging Trends in Science, Technology and Management, 11-12 Nov 2017, ISBN: 978-93-5281-325-4 Page 130
4. OPTIMALLINEAR-QUADRATIC REGULATOR (LQR)
The liner quadratic regulator technique seeks to find the optimal controller that minimizes a given costfunction (performance index). This cost function is parameterized by two matrices, Q and R, thatweight the state vector and the system input respectively. These weighting matrices regulate thepenalties on the excursion of state variables and control signal. One practical method is to Q and R tobe diagonal matrix. The value of the elements in Q and R is related to its contribution to the costfunction. To find the control law, Algebraic Riccati Equation (ARE) is first solved, and an optimalfeedback gain matrix, which will lead to optimal results evaluating from the defined cost function isobtained [26].Linear quadratic regulator design technique is well known in modern optimal control theory and hasbeen widely used in many applications. The standard theory of the optimal control is presented inDissertation. Under the assumption that all state variables are available for feedback, the LQRcontroller design method starts with a defined set of states which are to be controlled. The theory ofoptimal control is concerned with operating a dynamic system at minimum cost. The case where thesystem dynamics are described by a set of linear differential equations and the cost is described by aquadratic function is called the LQ problem. One of the main results in the theory is that the solution isprovided by the linear-quadratic regulator (LQR). Fig 3 MATLAB Simulink model of DC motor usingPID Controller.
Fig. 3: Optimal LQR controller
The function of Linear Quadratic Regulator (LQR) is to minimize the deviation of the speed of themotor. The speed of the motor is specifying that will be the input voltage of the motor and the outputwill be compare with the input. The output must be the same as or approximately the same as the inputvoltage. The advantages of used LQR are it is easy to design and increases the accuracy of the statevariables by estimating the state. The nice feature of the LQR control as compared to pole placement isthat instead of having to specify where n Eigen values should be placed a set of performance weightingare specified that could have more intuitive appeal. The performance measure is a quadratic functionComposed of state vector and control input [29].
5. SIMULATION RESULTS
The results of the system with using PID and Optimal LQR Controller of controllers are shown here.The responses of the system with PID and Optimal LQR Controller are being applied. In this sectiontransfer function of the dc motor is used as a system and find out the response of the system.Response of PID controller- Fig 1 shows the step response of PID control. The PID controlledresponse of the system has considerably larger settling time and higher overshoot values. Hence, anattempt is made to further improve the dc motor response of the system using OPTIMAL LQRcontroller.Response of OPTIMAL LQR controller- Fig 2 shows the step response of optimal LQR controller.The optimal LQR controller controlled response of the system has considerably minimum settling timeand reduced overshoot values. Fig 3 shows the comparative step response for PID controller andoptimal LQR controller system. Fig 10 and table 1 shows that the response of the system has greatlyimproved using optimal LQR controller.
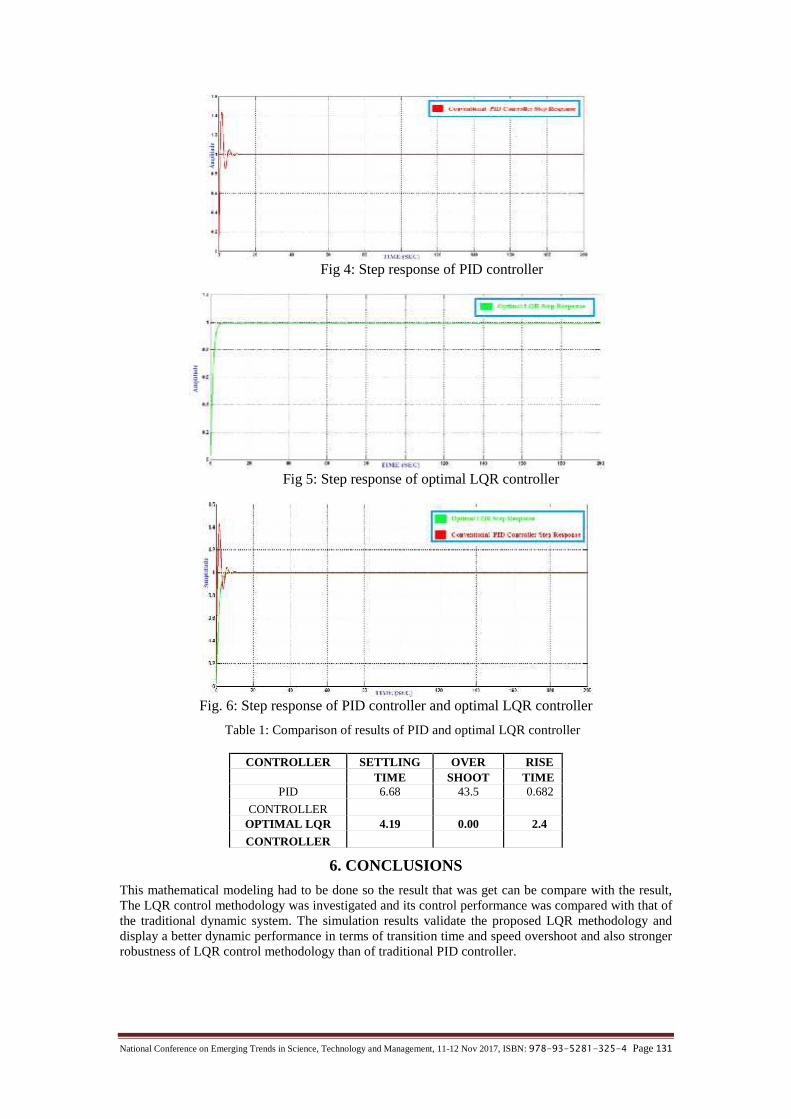
National Conference on Emerging Trends in Science, Technology and Management, 11-12 Nov 2017, ISBN: 978-93-5281-325-4 Page 131
Fig 4: Step response of PID controller
Fig 5: Step response of optimal LQR controller
Fig. 6: Step response of PID controller and optimal LQR controller
Table 1: Comparison of results of PID and optimal LQR controller
CONTROLLER SETTLING OVER RISETIME SHOOT TIME
PID 6.68 43.5 0.682
CONTROLLEROPTIMAL LQR 4.19 0.00 2.4
CONTROLLER
6. CONCLUSIONS
This mathematical modeling had to be done so the result that was get can be compare with the result,The LQR control methodology was investigated and its control performance was compared with that ofthe traditional dynamic system. The simulation results validate the proposed LQR methodology anddisplay a better dynamic performance in terms of transition time and speed overshoot and also strongerrobustness of LQR control methodology than of traditional PID controller.

National Conference on Emerging Trends in Science, Technology and Management, 11-12 Nov 2017, ISBN: 978-93-5281-325-4 Page 132
REFERENCES[1.] Shashi Bhushan Kumar, Mohammed Hasmat Ali, Anshu Sinha, “Design and Simulation of Speed
Control of DC Motor by Fuzzy Logic Technique with Matlab/Simulink”, International Journal ofScientific and Research Publications, Volume 4, Issue 7, July 2014.
[2.] Md Akram Ahmad, Pankaj Rai, “Speed control of a DC motor using Controllers” Automation,Control and Intelligent Systems, November 19, 2014.
[3.] Rekha kushwah#1, Sulochana Wadhwani *2,“Speed Control of Separately Excited Dc Motor UsingFuzzy Logic Controller”, International Journal of Engineering Trends and Technology (IJETT) -Volume4 Issue6- June 2013.
[4.] Liu Fan, Er Meng Joo” Design for Auto-tuning PID Controller Based on Genetic Algorithms” NanyangTechnological University Singapore IEEE Trans on ICIEA 2009.
[5.] K.H. Ang, G. Chong and Y. Li, “PID control system analysis, design and technology,” IEEE transactionon Control System Technology, Vol.13, No.4, 2005, pp. 559-576.
[6.] Dr.Ch.Chengaiah1, K.Venkateswarlu, “Comparative Study On Dc Motor Speed Control Using VariousControllers” International Journal of Advanced Research in Electrical, Electronics and InstrumentationEngineering Vol. 3, Issue 1, Januar 2014.
[7.] Aditya Pratap Singh, “Speed Control of DC Motor using Pid Controller Based on Matlab” InnovativeSystems Design and Engineering, Vol.4, No.6, 2013.
[8.] Pratap Vikhe1, Neelam Punjabi1, Chandrakant Kadu2, “Real Time DC Motor Speed Control using PIDController in LabVIEW” International Journal of Advanced Research in Electrical, Electronics andInstrumentation Engineering Vol. 3, Issue 9, September 2014.
[9.] Saurabh Dubey 1, Dr. S.K. Srivastava2,“A PID Controlled Real Time Analysis of dc motor".
National Conference on Emerging Trends in Science, Technology and Management, 11-12 Nov 2017, ISBN: 978-93-5281-325-4 Page 133
A COMPARATIVE STUDY OF OFDM AND CDMATOOLS TO ENHANCE THE PERFORMANCE OF
POWER LINE COMMUNICATIONVirendra Pratap Yadav
Assistant ProfessorDepartment of Electronics and Communication Engineering
SEAT College of Engineering & Management, Varanasi, Uttar Pradesh, IndiaMr. S.N Singh
Associate ProfessorDepartment of Electrical and Electronics Engineering
Ashoka Institute of Technology & Management, Varanasi, Uttar Pradesh, India
Abstract-This paper is mainly contributed towards the enhancement of the performance of power linechannel so as to achieve a better rate, security, reliability and uninterrupted services. This is done bycomparing the performance of power line communication using OFDM and CDMA tools. To compare theperformance of power line communication, Bit Error Rate is determined using OFDM (BPSK, QPSK andQAM) and CDMA technology and reach out to the best possible selection of technology as per requirementof application and conditions.
Keywords – Power Line Communication, Power Line Channel, OFDM, CDMA.
1. INTRODUCTION
The Power Line Communication has been emanated in the early 1900’s and at that time it was mainlyconcern about transmission of power to various different utilities and as the year goes by these powerlines have started finding its usage for the transmission of voice and data. The main reasons responsiblefor its origin was that the communication over telephone was very poor therefore the engineers at theoperating power plants makes use of Power Lines for management of operation with colleagues. Butthe communication was very slow and also susceptible to distortion and noise to a large extent till theintroduction of digital techniques.The other reason for the power lines to find its application for data communication is its alreadyestablished infrastructure and having the capability to switch the devices On/Off, especially thosedevices which consume a large amount of power such as air conditioners, water heater etc. Theadvantage of this is to ensure a better management of energy which is more often called as DemandSide Energy Management. [1, 5]The communication over Power Line usually alters in data rate in-accordance with the application andhence to differentiate the communication they had been categorized in frequency i.e. they utilizedifferent frequency bands. Therefore the Power Line Communication is categorized as UltraNarrowband, Narrowband and Broadband.The first deployment regarding the ultra-narrowband power line communication technology involvesfour frequency bands defined as [1]
1. 3 to 95 kHz: reserved exclusively to power utilities.2. 95 to 125 kHz: any application3. 125 to 140 kHz: in home networking systems with mandated carrier sense multiple accesses
with collision avoidance protocol.4. 140 to 148.5 kHz: alarm and security.
CENELEC mandates a CSMA/CA mechanism in the C-band and stations that wish to transmit mustuse 132.5 kHz frequency to inform that the channel is in use [7, 8]Over the last few decades, several industry alliances came into the market especially to set atechnology standard mostly for in-home PLC e.g. Home-plug Power Line Alliance, Universal PowerLine Association, High Definition Power Line Communication Alliance and Home Grid Forum.However none of these technologies are interoperable with each other. BB-PLC was acting as acomplementary for Wi-Fi but still it had not achieved a significant share in the market. [1, 6]
2. PROPOSED MODEL FOR PLC
A. Time – Domain Multipath Model: The Power Line channel model has been described consideringthat it is predominantly affected by multipath effects. The multipath nature of Power Line channelsarises due to the presence of several branches at which impedance mismatch causes multiplereflections. [2, 4]
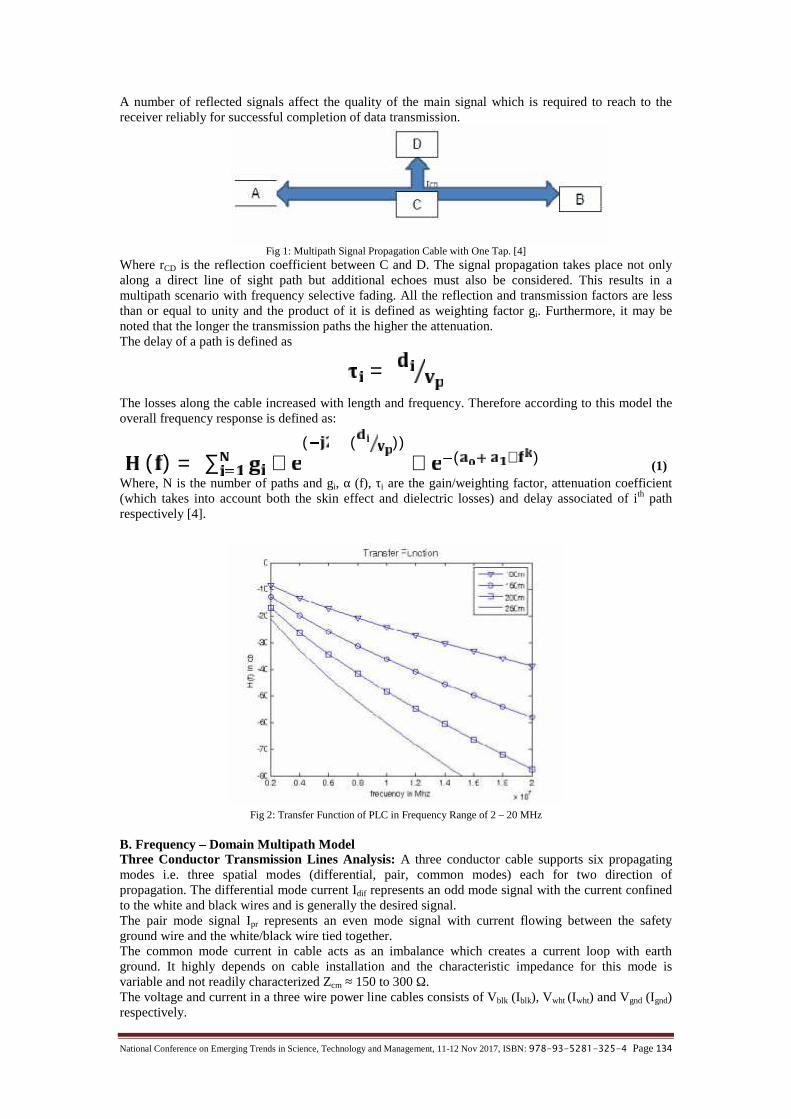
National Conference on Emerging Trends in Science, Technology and Management, 11-12 Nov 2017, ISBN: 978-93-5281-325-4 Page 134
A number of reflected signals affect the quality of the main signal which is required to reach to thereceiver reliably for successful completion of data transmission.
Fig 1: Multipath Signal Propagation Cable with One Tap. [4]Where rCD is the reflection coefficient between C and D. The signal propagation takes place not onlyalong a direct line of sight path but additional echoes must also be considered. This results in amultipath scenario with frequency selective fading. All the reflection and transmission factors are lessthan or equal to unity and the product of it is defined as weighting factor gi. Furthermore, it may benoted that the longer the transmission paths the higher the attenuation.The delay of a path is defined as =The losses along the cable increased with length and frequency. Therefore according to this model theoverall frequency response is defined as:( ) = ∑ ∗ ( ( )) ∗ ( ∗ )
(1)Where, N is the number of paths and gi, α (f), τi are the gain/weighting factor, attenuation coefficient(which takes into account both the skin effect and dielectric losses) and delay associated of ith pathrespectively [4].
Fig 2: Transfer Function of PLC in Frequency Range of 2 – 20 MHz
B. Frequency – Domain Multipath ModelThree Conductor Transmission Lines Analysis: A three conductor cable supports six propagatingmodes i.e. three spatial modes (differential, pair, common modes) each for two direction ofpropagation. The differential mode current Idif represents an odd mode signal with the current confinedto the white and black wires and is generally the desired signal.The pair mode signal Ipr represents an even mode signal with current flowing between the safetyground wire and the white/black wire tied together.The common mode current in cable acts as an imbalance which creates a current loop with earthground. It highly depends on cable installation and the characteristic impedance for this mode isvariable and not readily characterized Zcm ≈ 150 to 300 Ω.The voltage and current in a three wire power line cables consists of Vblk (Iblk), Vwht (Iwht) and Vgnd (Ignd)respectively.

National Conference on Emerging Trends in Science, Technology and Management, 11-12 Nov 2017, ISBN: 978-93-5281-325-4 Page 135
The propagating voltages are V = (V , V , V ) and V = (V , V , V ) correspondingly thecurrent relationship is given byI = (I , I , I ) and I = (I , I , I ) represents differential , pairand common-mode currents for waves propagating in forward and backward direction . [3]The propagating voltages and current is related to each other by a diagonal matrix of characteristicimpedance Zo. = = = (2)
Similarly the voltage and current in the reverse direction are related as follows= = − − − = − (3)
Therefore the overall voltage and current along a line consist of the transmitted as well as the reflectedsignals. = +Or, = ( ) − ( )( − ) ( − ) − = (4)
And = +Or,
= −( ) ( ) −( ) ( ) ( − ) = (5)
Where A and B are related asA-1 = BT or B-1 = AT
And the parameter ε ≈ 0.05 – 0.3 and it describes an asymmetry between black and white wires relativeto the ground conductor whereas the factor ≈ 0.5 -0.15 and it represents the shielding produced by theground conductor.The forward and reverse voltage (similarly current) are related to each other by a factor called asreflection coefficient and the relation is given by = (6)And the reflection coefficient can further be defined in terms of an arbitrary linear network described asZterm which is given by = ( + )( − ) (7)Where A and B are modal matrices as define in [3], Equations (3) and (4)], Yterm is defined as= ( ) = + (8)On substituting this in the above equation, we get= −( + ) (9)
Moreover reflection coefficient is related to resistance under bonding and fault conditions and isdescribed below and these are mainly resulted due to multiple numbers of shunt branches as depicted inthe basic topological diagram.The differential mode reflection coefficients for each case are− ( ) = + ∗
(10)
− ( ) = + ∗( ) ∗ + ∗( ) ∗ (11)
− ( ) = + ∗( ) ∗ + ∗( ) ∗ (12)
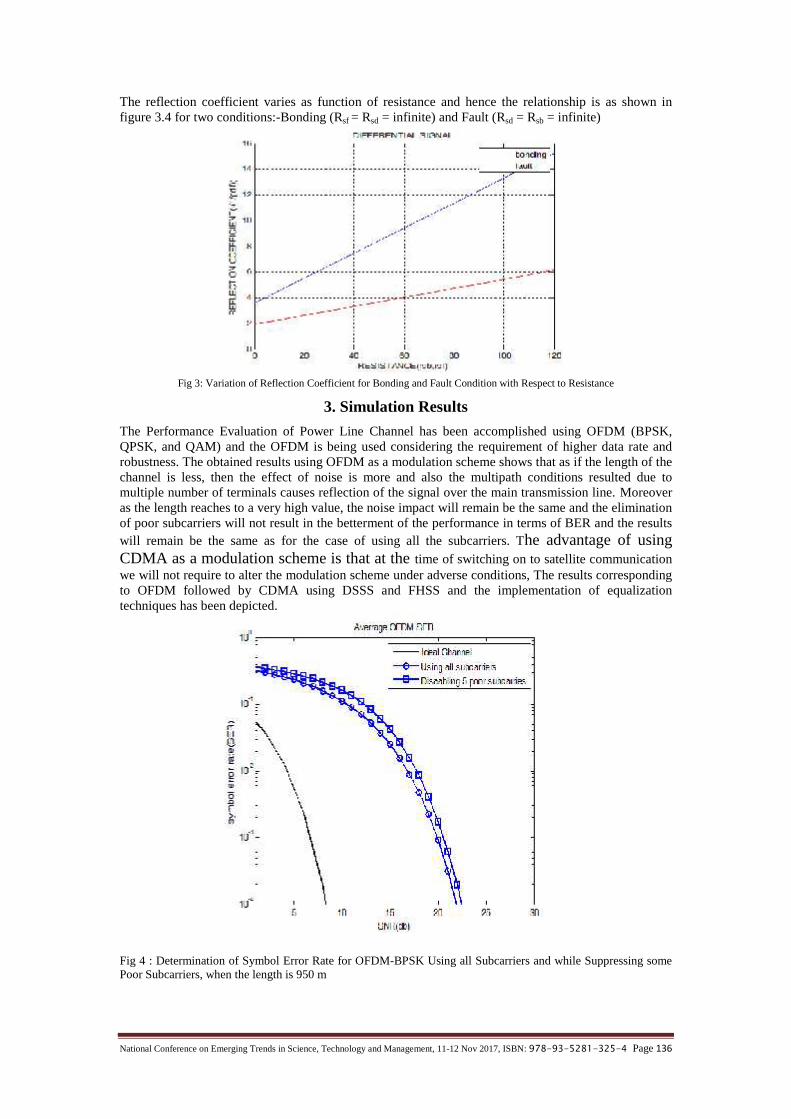
National Conference on Emerging Trends in Science, Technology and Management, 11-12 Nov 2017, ISBN: 978-93-5281-325-4 Page 136
The reflection coefficient varies as function of resistance and hence the relationship is as shown infigure 3.4 for two conditions:-Bonding (Rsf = Rsd = infinite) and Fault (Rsd = Rsb = infinite)
Fig 3: Variation of Reflection Coefficient for Bonding and Fault Condition with Respect to Resistance
3. Simulation Results
The Performance Evaluation of Power Line Channel has been accomplished using OFDM (BPSK,QPSK, and QAM) and the OFDM is being used considering the requirement of higher data rate androbustness. The obtained results using OFDM as a modulation scheme shows that as if the length of thechannel is less, then the effect of noise is more and also the multipath conditions resulted due tomultiple number of terminals causes reflection of the signal over the main transmission line. Moreoveras the length reaches to a very high value, the noise impact will remain be the same and the eliminationof poor subcarriers will not result in the betterment of the performance in terms of BER and the resultswill remain be the same as for the case of using all the subcarriers. The advantage of usingCDMA as a modulation scheme is that at the time of switching on to satellite communicationwe will not require to alter the modulation scheme under adverse conditions, The results correspondingto OFDM followed by CDMA using DSSS and FHSS and the implementation of equalizationtechniques has been depicted.
Fig 4 : Determination of Symbol Error Rate for OFDM-BPSK Using all Subcarriers and while Suppressing somePoor Subcarriers, when the length is 950 m
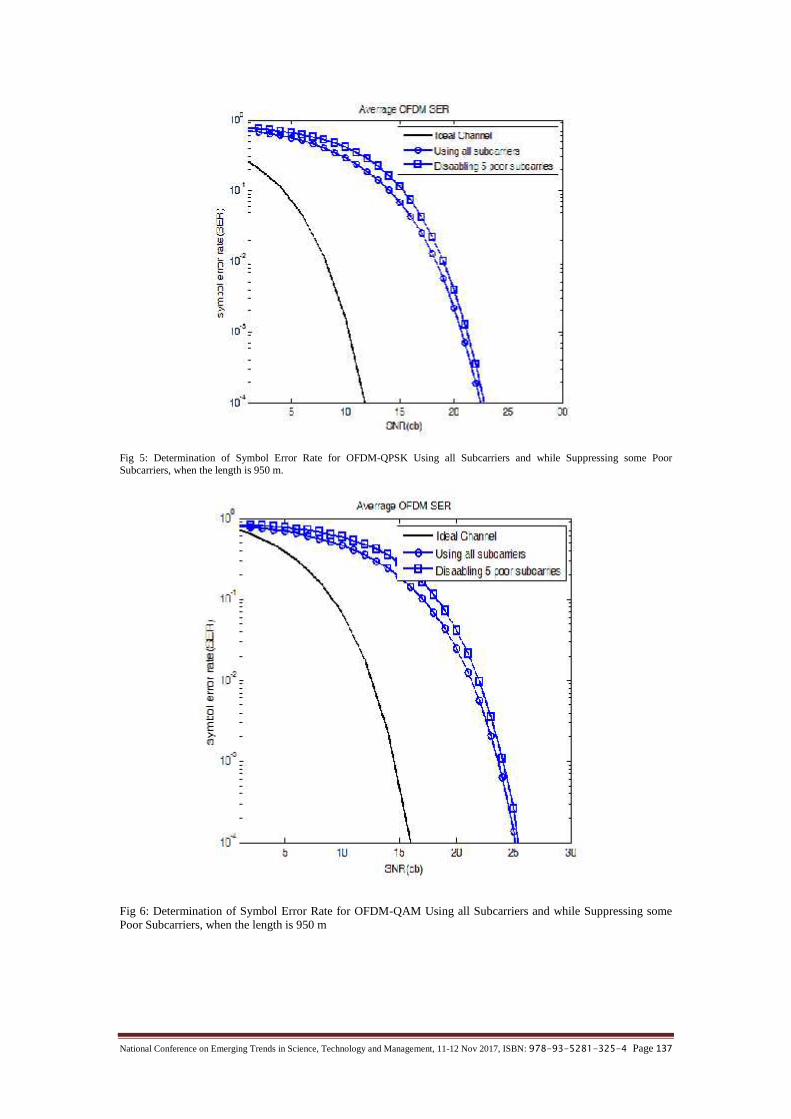
National Conference on Emerging Trends in Science, Technology and Management, 11-12 Nov 2017, ISBN: 978-93-5281-325-4 Page 137
Fig 5: Determination of Symbol Error Rate for OFDM-QPSK Using all Subcarriers and while Suppressing some PoorSubcarriers, when the length is 950 m.
Fig 6: Determination of Symbol Error Rate for OFDM-QAM Using all Subcarriers and while Suppressing somePoor Subcarriers, when the length is 950 m
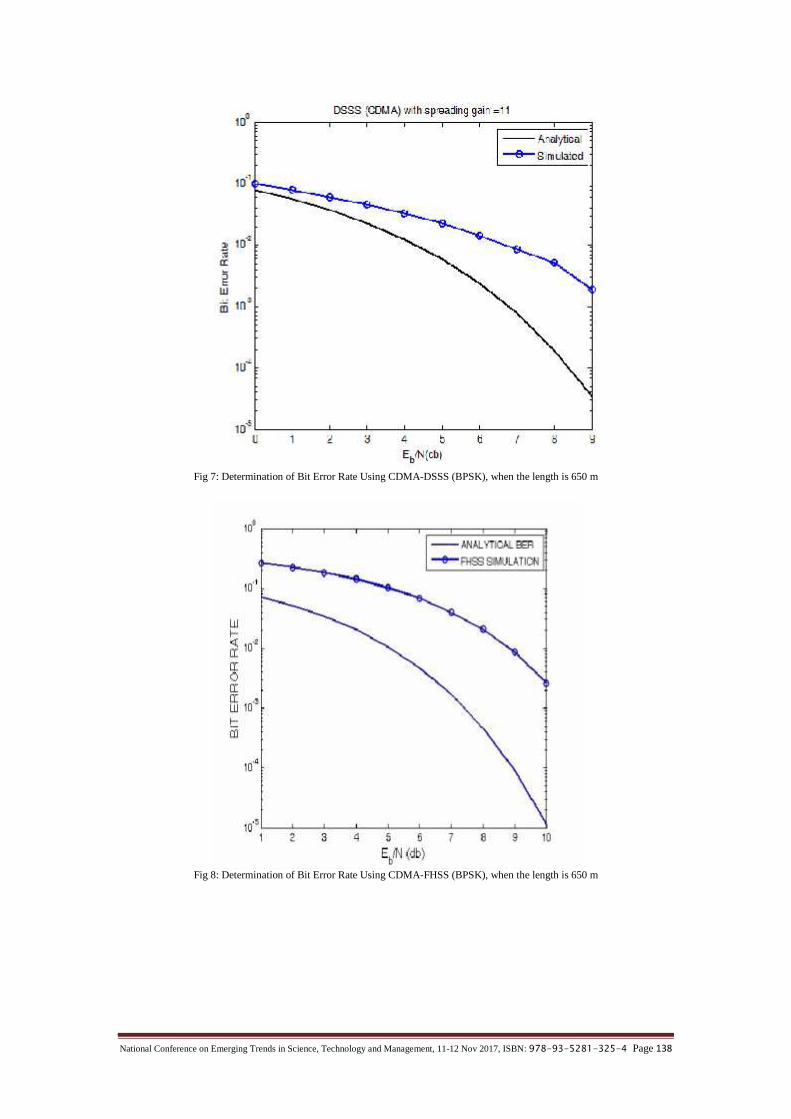
National Conference on Emerging Trends in Science, Technology and Management, 11-12 Nov 2017, ISBN: 978-93-5281-325-4 Page 138
Fig 7: Determination of Bit Error Rate Using CDMA-DSSS (BPSK), when the length is 650 m
Fig 8: Determination of Bit Error Rate Using CDMA-FHSS (BPSK), when the length is 650 m
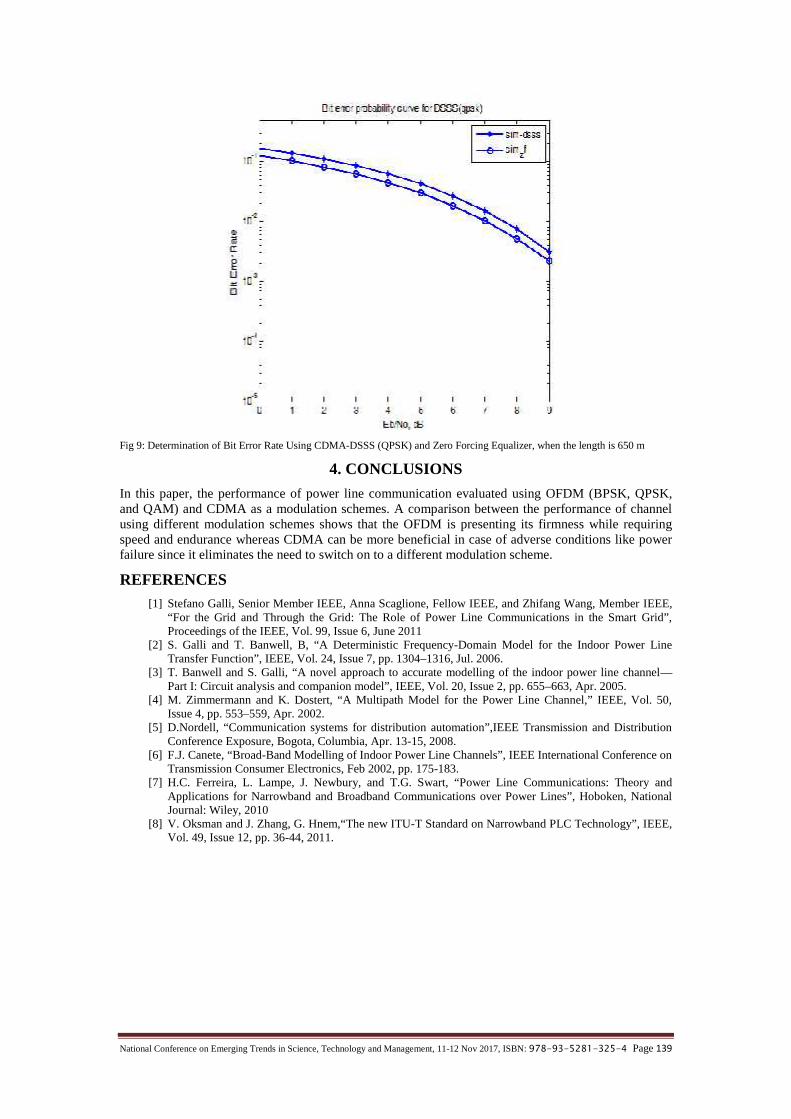
National Conference on Emerging Trends in Science, Technology and Management, 11-12 Nov 2017, ISBN: 978-93-5281-325-4 Page 139
Fig 9: Determination of Bit Error Rate Using CDMA-DSSS (QPSK) and Zero Forcing Equalizer, when the length is 650 m
4. CONCLUSIONS
In this paper, the performance of power line communication evaluated using OFDM (BPSK, QPSK,and QAM) and CDMA as a modulation schemes. A comparison between the performance of channelusing different modulation schemes shows that the OFDM is presenting its firmness while requiringspeed and endurance whereas CDMA can be more beneficial in case of adverse conditions like powerfailure since it eliminates the need to switch on to a different modulation scheme.
REFERENCES[1] Stefano Galli, Senior Member IEEE, Anna Scaglione, Fellow IEEE, and Zhifang Wang, Member IEEE,
“For the Grid and Through the Grid: The Role of Power Line Communications in the Smart Grid”,Proceedings of the IEEE, Vol. 99, Issue 6, June 2011
[2] S. Galli and T. Banwell, B, “A Deterministic Frequency-Domain Model for the Indoor Power LineTransfer Function”, IEEE, Vol. 24, Issue 7, pp. 1304–1316, Jul. 2006.
[3] T. Banwell and S. Galli, “A novel approach to accurate modelling of the indoor power line channel—Part I: Circuit analysis and companion model”, IEEE, Vol. 20, Issue 2, pp. 655–663, Apr. 2005.
[4] M. Zimmermann and K. Dostert, “A Multipath Model for the Power Line Channel,” IEEE, Vol. 50,Issue 4, pp. 553–559, Apr. 2002.
[5] D.Nordell, “Communication systems for distribution automation”,IEEE Transmission and DistributionConference Exposure, Bogota, Columbia, Apr. 13-15, 2008.
[6] F.J. Canete, “Broad-Band Modelling of Indoor Power Line Channels”, IEEE International Conference onTransmission Consumer Electronics, Feb 2002, pp. 175-183.
[7] H.C. Ferreira, L. Lampe, J. Newbury, and T.G. Swart, “Power Line Communications: Theory andApplications for Narrowband and Broadband Communications over Power Lines”, Hoboken, NationalJournal: Wiley, 2010
[8] V. Oksman and J. Zhang, G. Hnem,“The new ITU-T Standard on Narrowband PLC Technology”, IEEE,Vol. 49, Issue 12, pp. 36-44, 2011.
National Conference on Emerging Trends in Science, Technology and Management, 11-12 Nov 2017, ISBN: 978-93-5281-325-4 Page 140
EFFECT OF FLEXIBLE AC TRANSMISSION SYSTEM(FACTS) ON POWER SYSTEM STABILITY AND THEIR
RELATIONS.N.Singh
Associate Professor, Department of Electrical Engineering, Ashoka Institute of Technology & Management,Varanasi, Uttar Pradesh, India
Manu SinghAssociate Professor, Department of Electrical Engineering, Ashoka Institute of Technology & Management,
Varanasi, Uttar Pradesh, IndiaAnand Vardhan Pandey
Assistant Professor, Department of Electrical Engineering, Ashoka Institute of Technology &Management, Varanasi, Uttar Pradesh, India
ABSTRACT - Secure and reliable operation of the electric power system is fundamental to economy, socialsecurity and quality of modern life, because electricity has become a basic necessity in modern society. Inthe last two decades power demand has increased exponentially while growth of power generation andtransmission is partial due to limited resources and environmental restrictions. With the increasingcomplexities in power system it becomes more significant to provide stable, secure, controlled and highquality electric power. Hence, there is requirement of improved utilization of available power systemcapacities by installing new devices such as Flexible AC Transmission systems. The thought behind theFACTS concept is to facilitate the transmission system to be an active element in increasing the flexibility ofpower transfer requirements and in securing stability of integrated power system. FACTS are devices whichallow the flexible and dynamic control of power systems. In this paper the advantage of utilizing FACTSdevices with the purpose of improving the operation of an electrical power system is discussed. Performanceassessment of different FACTS controllers has also been discussed.Keywords - Flexible AC Transmission Systems, Power System, power transfer, FACTS controllers.
1. INTRODUCTION
Secure and reliable operation of the electric power system is fundamental to economy, social securityand quality of modern life, because electricity has become a basic necessity in modern society. Powerquality is an issue that is becoming increasingly essential to consumers at all levels of usage. Sensitiveequipment and non-linear loads are commonplace in both the industrial and the domestic environment;because of this a heightened awareness of power quality is developing. The power quality get disturbeddue to: power electronic devices, arcing devices, load switching, large motor starting, embeddedgeneration, sensitive equipment, storm and environment related damage, network equipment anddesign. The solution to enhance the energy quality (PQ-Power Quality) at the load side is of greatimportant when the production processes get more complex and require a better liability level, whichincludes aims like to provide energy without disruption, without harmonic distortion and with tensionregulation between very narrow margins.The challenges to the industry are: (1) produce, transmit and use energy in an environmentallyresponsible manner, (2) reduce costs by improving operating efficiency and business practices, and (3)improve the reliability and quality of power supply. Power electronics based equipments, calledFlexible AC Transmission Systems (FACTS), provide solutions to the new operating challenges byimproving utilization of the existing power system through the application of advanced controltechnologies. FACTS technologies allows improved transmission system operation with minimalinfrastructure investment, environmental impact, and implementation time compared to theconstruction of new transmission lines. Flexible Alternating Current Transmission System (FACTS) isa static equipment used for the AC transmission of electrical energy. It is meant to enhancecontrollability and increase power transfer capability. It is generally a power electronics based device.FACTS is defined by the IEEE as "a power electronic based system and other static equipment thatprovide control of one or more AC transmission system and increase the capacity of power transfer.There are different classifications for the FACTS devices:Depending on the type of connection to the network:FACTS devices can differentiate four categories: serial controllers, derivation controllers, serial toserial controllers and serial-derivation controllersDepending on technological features: the FACTS devices can divided into two generations-firstgeneration: used thyristors with ignition controlled by gate(SCR) and second generation:semiconductors with ignition and extinction controlled by gate (GTO´s , MCTS , IGBTS , IGCTS ,etc).

National Conference on Emerging Trends in Science, Technology and Management, 11-12 Nov 2017, ISBN: 978-93-5281-325-4 Page 141
The main difference between first and second generation devices is the capacity to generate reactivepower and to interchange active power. The first generation FACTS devices work like passiveelements using impedance or tap changer transformers controlled by thyristors. The second generationFACTS devices work like angle and module controlled voltage sources and without inertia, based inconverters, employing electronic tension sources.
2. IMPACT OF FACTS IN POWER SYSTM STABILITY
Most of the electronic devices used today are extremely sensitive to the quality of the electric power;the quality of electric power available to the end user is a matter of concern. Power quality becomesone of the critical issues both to utility and consumers. Generally, good power quality means that thesystem supplies and maintains load voltage as a pure, sinusoidal waveform at specified frequency andvoltage to all the power consumers in the power system. The possible causes of power quality problemscan generally be classified into one of the following phenomena:
• Voltage sag• Overvoltage• Momentary interruption• Transient• Harmonic distortion• Electrical noise
Fig.1 Power Quality ProblemsWhen the voltage magnitude varies due to fast load changes, power flow to the equipment willnormally vary, which may cause stability problem in the system. The harmful thing is, if the variationis large enough or is within a certain critical frequency range, the equipment performance can beaffected, like motors, electronic devices, and process controllers. The primary generators of voltagefluctuation are arc furnaces, welders, alternators, and motors. The source of power quality problemsmay originate in the following parts of electric power system shown in Fig. 2
• Generators and associated equipment• Transmission lines and associated equipment• Distribution subsystem• Loads
The FACTS devices are installed on electric power (high voltage AC) transmission lines to stabilizeand regulate power flow for the dynamic control of voltage impedance and phase angle. Power linesprotected by FACTS devices can support greater current because anomalies—frequency excursions,voltage drop, phase mismatch, malformed wave shape, power spikes, etc.—that would otherwise causebreakers to trip are removed or greatly reduced by FACTS conditioning.A FACTS device can also limit the amount of current that flows on a line by effectively increasing theline’s impedance. This enables a much greater degree of flow control than provided by a switch orbreaker. In particular, when current applied to a FACTS-protected line is greater than the device willallow, the power merely flows elsewhere rather than tripping a breaker, and power continues to flow onthe protected line.Essentially, lines can be run closer to their theoretical. Capacities when they are protected by FACTSdevices. For a large line, that can mean substantial additional power. High voltage, high-power FACTSdevices are building-sized and expensive, but they are lower cost and have less impact per added unitof electric power than new transmission lines. This is the essential benefit of operating standaloneFACTS devices on individual lines.
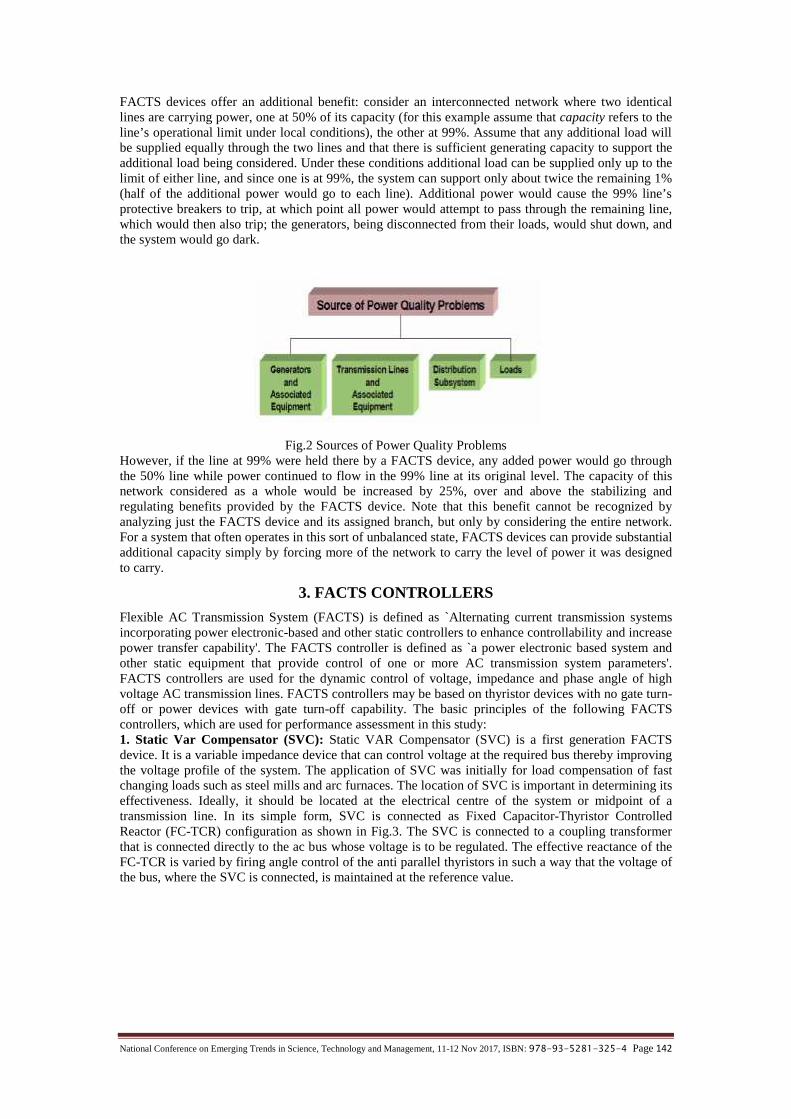
National Conference on Emerging Trends in Science, Technology and Management, 11-12 Nov 2017, ISBN: 978-93-5281-325-4 Page 142
FACTS devices offer an additional benefit: consider an interconnected network where two identicallines are carrying power, one at 50% of its capacity (for this example assume that capacity refers to theline’s operational limit under local conditions), the other at 99%. Assume that any additional load willbe supplied equally through the two lines and that there is sufficient generating capacity to support theadditional load being considered. Under these conditions additional load can be supplied only up to thelimit of either line, and since one is at 99%, the system can support only about twice the remaining 1%(half of the additional power would go to each line). Additional power would cause the 99% line’sprotective breakers to trip, at which point all power would attempt to pass through the remaining line,which would then also trip; the generators, being disconnected from their loads, would shut down, andthe system would go dark.
Fig.2 Sources of Power Quality ProblemsHowever, if the line at 99% were held there by a FACTS device, any added power would go throughthe 50% line while power continued to flow in the 99% line at its original level. The capacity of thisnetwork considered as a whole would be increased by 25%, over and above the stabilizing andregulating benefits provided by the FACTS device. Note that this benefit cannot be recognized byanalyzing just the FACTS device and its assigned branch, but only by considering the entire network.For a system that often operates in this sort of unbalanced state, FACTS devices can provide substantialadditional capacity simply by forcing more of the network to carry the level of power it was designedto carry.
3. FACTS CONTROLLERS
Flexible AC Transmission System (FACTS) is defined as `Alternating current transmission systemsincorporating power electronic-based and other static controllers to enhance controllability and increasepower transfer capability'. The FACTS controller is defined as `a power electronic based system andother static equipment that provide control of one or more AC transmission system parameters'.FACTS controllers are used for the dynamic control of voltage, impedance and phase angle of highvoltage AC transmission lines. FACTS controllers may be based on thyristor devices with no gate turn-off or power devices with gate turn-off capability. The basic principles of the following FACTScontrollers, which are used for performance assessment in this study:1. Static Var Compensator (SVC): Static VAR Compensator (SVC) is a first generation FACTSdevice. It is a variable impedance device that can control voltage at the required bus thereby improvingthe voltage profile of the system. The application of SVC was initially for load compensation of fastchanging loads such as steel mills and arc furnaces. The location of SVC is important in determining itseffectiveness. Ideally, it should be located at the electrical centre of the system or midpoint of atransmission line. In its simple form, SVC is connected as Fixed Capacitor-Thyristor ControlledReactor (FC-TCR) configuration as shown in Fig.3. The SVC is connected to a coupling transformerthat is connected directly to the ac bus whose voltage is to be regulated. The effective reactance of theFC-TCR is varied by firing angle control of the anti parallel thyristors in such a way that the voltage ofthe bus, where the SVC is connected, is maintained at the reference value.
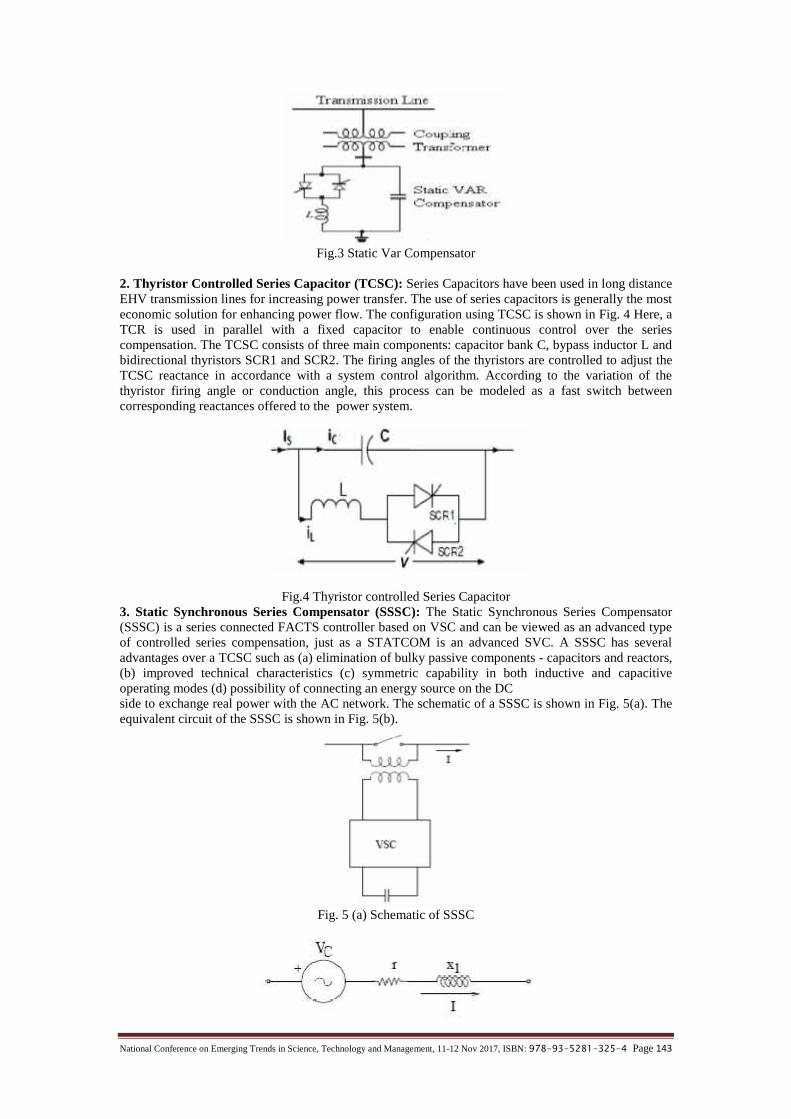
National Conference on Emerging Trends in Science, Technology and Management, 11-12 Nov 2017, ISBN: 978-93-5281-325-4 Page 143
Fig.3 Static Var Compensator
2. Thyristor Controlled Series Capacitor (TCSC): Series Capacitors have been used in long distanceEHV transmission lines for increasing power transfer. The use of series capacitors is generally the mosteconomic solution for enhancing power flow. The configuration using TCSC is shown in Fig. 4 Here, aTCR is used in parallel with a fixed capacitor to enable continuous control over the seriescompensation. The TCSC consists of three main components: capacitor bank C, bypass inductor L andbidirectional thyristors SCR1 and SCR2. The firing angles of the thyristors are controlled to adjust theTCSC reactance in accordance with a system control algorithm. According to the variation of thethyristor firing angle or conduction angle, this process can be modeled as a fast switch betweencorresponding reactances offered to the power system.
Fig.4 Thyristor controlled Series Capacitor3. Static Synchronous Series Compensator (SSSC): The Static Synchronous Series Compensator(SSSC) is a series connected FACTS controller based on VSC and can be viewed as an advanced typeof controlled series compensation, just as a STATCOM is an advanced SVC. A SSSC has severaladvantages over a TCSC such as (a) elimination of bulky passive components - capacitors and reactors,(b) improved technical characteristics (c) symmetric capability in both inductive and capacitiveoperating modes (d) possibility of connecting an energy source on the DCside to exchange real power with the AC network. The schematic of a SSSC is shown in Fig. 5(a). Theequivalent circuit of the SSSC is shown in Fig. 5(b).
Fig. 5 (a) Schematic of SSSC

National Conference on Emerging Trends in Science, Technology and Management, 11-12 Nov 2017, ISBN: 978-93-5281-325-4 Page 144
Fig. 5 (b) Equivalent Circuit
The magnitude of Vc can be controlled to regulate power flow.
4. POWER SYSTEM MODELConsider a two-area power system (Area-1 & Area-2) with series and shunt FACTS devices, connected by a singlecircuit long transmission line as shown in Fig. 6 and Fig. 7
Fig.7 Two Area Powers System with Series FACTS Devices
Fig.7 Two Area Powers System with Shunt FACTS Devices
5. RESULTS AND DISCUSSION
The two area system shown in Fig. 6 and Fig. 7 is considered in this paper. The system is simulated inMATLAB / Simulink platform and corresponding graphs are shown in Fig. 8 - 10.
Fig. 8 Variation of voltage with SVC

National Conference on Emerging Trends in Science, Technology and Management, 11-12 Nov 2017, ISBN: 978-93-5281-325-4 Page 145
Fig. 9 Variation of Power with TCSC
Fig. 10: Variation of Power with SSSCFrom the above results it can be concluded that TCSC is the effective device for stability enhancement.The comparison of various FACTS devices are made in Table 1.Table 1: Comparison between various FACT Devices
FACTS Device Power System Stability Settling Time (Sec)SSSC YES 12.0SVC YES 4.0
TCSC YES 1.0
6. CONCLUSION
Performance comparison of different FACTS controllers has been reviewed and it is found that TCSCis best among all the three for which settling time is found to be around 1.0 second. A brief review ofFACTS applications to optimal power flow and deregulated electricity market has been presented.
REFERENCES
[1.] E. Acha, C. R. Fuerte-Esquivel, and H. Ambriz-Perez, “Advanced SVC model for Newton-RaphsonLoad Flow and Newton Optimal Power Flow Studies”, IEEE Trans. PWRS, 15(1)(2000), pp. 129–136.
[2.] N. G. Hingorani and L. Gyugyi, Understanding FACTS: Concepts and Technology of Flexible ACTransmission Systems. New York: IEEE Press, 2000.
[3.] K.R. Padiyar, 2002, “Power System Dynamic Stability and Control,” Second Edition, BS Publications,Hyderabad.
[4.] A.D. Del Rosso, C.A. Canizares, V.M. Dona, 2003, “A Study of TCSC Controller Design for PowerSystem Stability Improvement,” IEEE Transactions on Power Systems, 18(4), pp. 1487-1496.

National Conference on Emerging Trends in Science, Technology and Management, 11-12 Nov 2017, ISBN: 978-93-5281-325-4 Page 146
[5.] N. Mithulananthan, C.A. Canizares, J. Reeve, Graham J.Rogers, 2003, “Comparison of PSS, SVC andSTATCOM Controllers for Damping Power System Oscillations,” IEEE Transactions on PowerSystems, 18(2), pp. 786-792.
[6.] E. Acha, C. R. Fuerte-Esquivel, and H. Ambriz-Perez et al., FACTS: Modeling and Simulation in PowerNetworks, London, U.K.: Wiley, 2004.
[7.] E. Acha “FACTS: A Modern Tool For Flexible Power Systems Interconnections”. 9th SpanishPortuguese Congress on Electrical Engineering (9CHLIE), Marbella, Spain, June 2005.
[8.] Prechanon Kumkratug, Panthep Laohachai, 2007, “Direct Method of Transient Stability Assessment of aPower System with a SSSC,” Journal of Computers, 2(8), pp. 77- 82.
[9.] S.V. Ravi Kumar, S. Siva Nagaraju, 2007, “Transient Stability Improvement using UPFC and SVC,”ARPN Journal of Engineering and Applied Sciences, 2(3), pp. 38-45.
[10.]Kazemi, F. Mahamnia, 2008, “Improving of Transient Stability of Power Systems by SupplementaryControllers of UPFC using Different Fault Conditions,” WSEAS Transactions on Power Systems, 3(7),pp. 547-556.

National Conference on Emerging Trends in Science, Technology and Management, 11-12 Nov 2017, ISBN: 978-93-5281-325-4 Page 147
COMPARISONS OF PERFORMANCES OF FACTSCONTROLLERS IN POWER SYSTEMS
Bindeshwar Singh, Rajat Shukla, Piyush DixitKamla Nehru Institute of Technology (KNIT), Sultanpur, Uttar Pradesh, India
Email: [email protected], [email protected], [email protected]
Abstract– Development of electrical power supplies began more than one hundred years ago. At thebeginning, there were only small DC networks within narrow local boundaries, which were able to cover thedirect needs of industrial plants by means of hydro energy. With an increasing demand on energy and theconstruction of large generation units, typically built at remote locations from the load centers , thetechnology changed from DC to AC. Power to be transmitted, voltage levels and transmission distancesincreased. DC transmission and FACTS (Flexible AC Transmission Systems) has developed to a viabletechnique with high power ratings since the 60s. From the first small DC and AC "mini networks", thereare now systems transmitting 3 - 4 GW over large distances with only one bipolar DC transmission: 1.000 -2.000 km or more are feasible with overhead lines. With submarine cables, transmission levels of up to 600 –800 MW over distances of nearly 300 km have already been attained, and cable transmission lengths of upto 1.300 km are in the planning stage. As a multi terminal system, HVDC can also be connected at severalpoints with the surrounding three-phase network. FACTS is applicable in parallel connection or in series orin a combination of both. The rating of shunt connected FACTS controllers is up to 800 Mvar, seriesFACTS controllers are implemented on 550 and 735 kV level to increase the line transmission capacity up toseveral GW. This paper presents the comparisons of performances of FACTS controllers in power system.This article is useful for researchers, scientific and industrial persons regarding FACTS controllers inpower system.
Keywords - Flexible Alternating Current Transmission Systems (FACTS), FACTS Controllers, Power Systems,Power System Performances, Active Power Flow, Reactive Power Flow.
NomenclaturesAbbreviation Meaning
D-STATCOM Distributed static synchronous compensatorETO Emitter Turn-OffGTO Gate turn off
GUPFC Generalized unified power flow controllerGIPFC Generalized interline power flow controllersHVDC High-voltage dc transmissionHPFC Hybrid power flow controllersIGCT Integrated Gate-Commutated ThyristorsIPFC Interline power flow controllersMOV Metal Oxide VaristorOPF Optimal power flowPF Power factor
PSS Power system stabilizerTCSC Thyristor controlled series compensator
TC-PAR Thyristor controlled phase angle regulatorUPFC Unified power flow controllerSSSC Static synchronous series compensatorSCCL Short-circuit current limiterSVC Static VAR compensator
STATCOM Static synchronous compensatorSymbols
f Supply frequency (f = 50 Hz)δ Power Angle
1. INTRODUCTION
Most of the problems are associated with the low frequency oscillation in interconnected powersystems, especially in the deregulated paradigm. Small magnitude and low frequency oscillation oftenremained for a long time. To provide fast damping for the system and thus improve the dynamicperformance, a supplementary control signal in the excitation system and/or the governor system of agenerating unit can be used. As the most cost effective damping controller, PSS has been widelyapplied to suppress the low frequency oscillation and enhance the system dynamic stability.
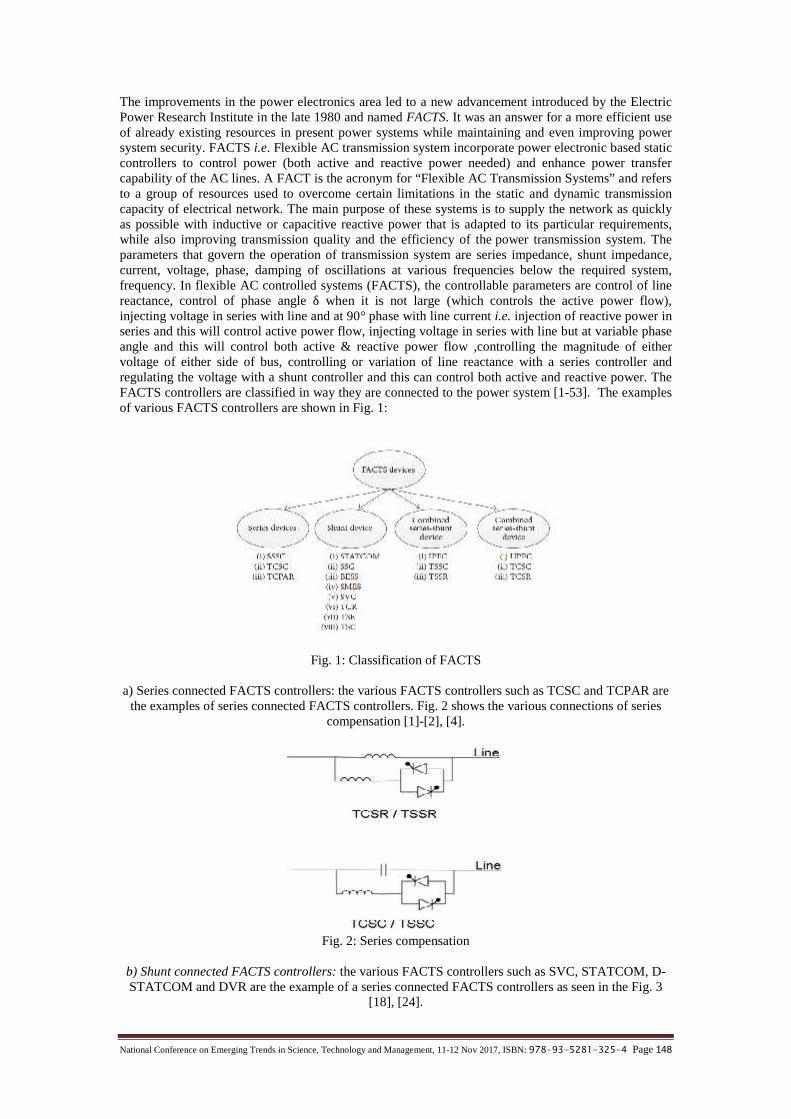
National Conference on Emerging Trends in Science, Technology and Management, 11-12 Nov 2017, ISBN: 978-93-5281-325-4 Page 148
The improvements in the power electronics area led to a new advancement introduced by the ElectricPower Research Institute in the late 1980 and named FACTS. It was an answer for a more efficient useof already existing resources in present power systems while maintaining and even improving powersystem security. FACTS i.e. Flexible AC transmission system incorporate power electronic based staticcontrollers to control power (both active and reactive power needed) and enhance power transfercapability of the AC lines. A FACT is the acronym for “Flexible AC Transmission Systems” and refersto a group of resources used to overcome certain limitations in the static and dynamic transmissioncapacity of electrical network. The main purpose of these systems is to supply the network as quicklyas possible with inductive or capacitive reactive power that is adapted to its particular requirements,while also improving transmission quality and the efficiency of the power transmission system. Theparameters that govern the operation of transmission system are series impedance, shunt impedance,current, voltage, phase, damping of oscillations at various frequencies below the required system,frequency. In flexible AC controlled systems (FACTS), the controllable parameters are control of linereactance, control of phase angle δ when it is not large (which controls the active power flow),injecting voltage in series with line and at 90° phase with line current i.e. injection of reactive power inseries and this will control active power flow, injecting voltage in series with line but at variable phaseangle and this will control both active & reactive power flow ,controlling the magnitude of eithervoltage of either side of bus, controlling or variation of line reactance with a series controller andregulating the voltage with a shunt controller and this can control both active and reactive power. TheFACTS controllers are classified in way they are connected to the power system [1-53]. The examplesof various FACTS controllers are shown in Fig. 1:
Fig. 1: Classification of FACTS
a) Series connected FACTS controllers: the various FACTS controllers such as TCSC and TCPAR arethe examples of series connected FACTS controllers. Fig. 2 shows the various connections of series
compensation [1]-[2], [4].
Fig. 2: Series compensation
b) Shunt connected FACTS controllers: the various FACTS controllers such as SVC, STATCOM, D-STATCOM and DVR are the example of a series connected FACTS controllers as seen in the Fig. 3
[18], [24].
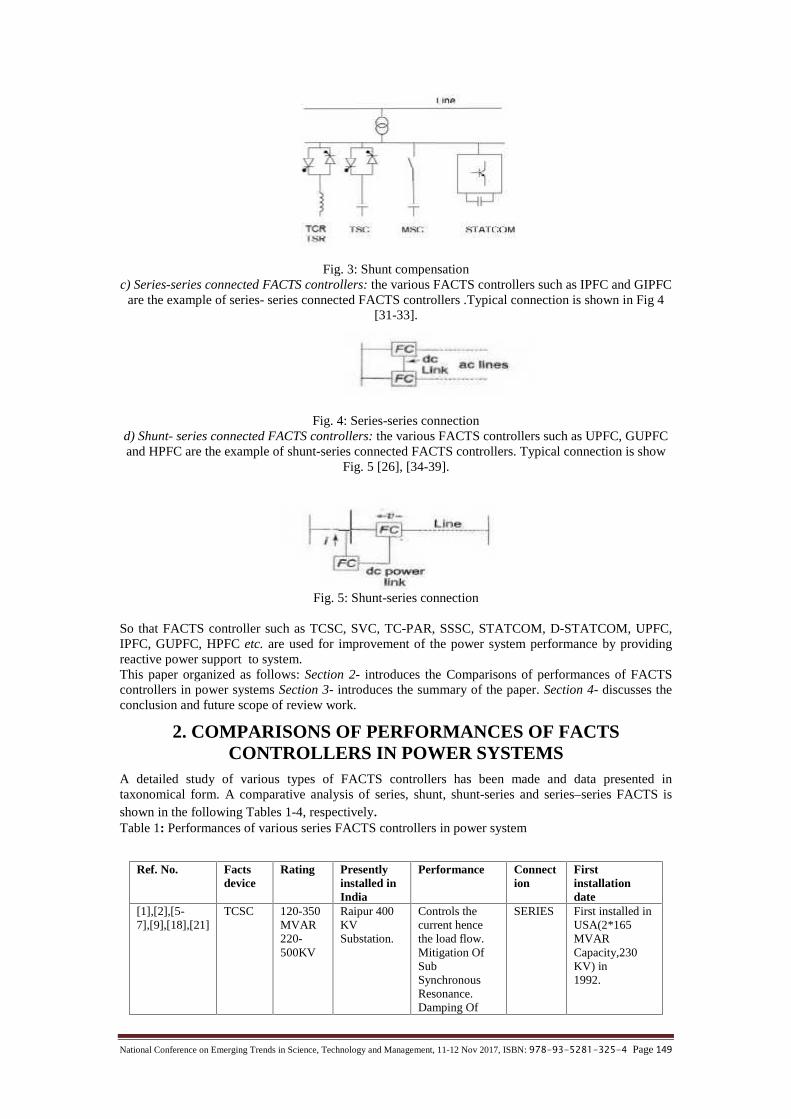
National Conference on Emerging Trends in Science, Technology and Management, 11-12 Nov 2017, ISBN: 978-93-5281-325-4 Page 149
Fig. 3: Shunt compensationc) Series-series connected FACTS controllers: the various FACTS controllers such as IPFC and GIPFC
are the example of series- series connected FACTS controllers .Typical connection is shown in Fig 4[31-33].
Fig. 4: Series-series connectiond) Shunt- series connected FACTS controllers: the various FACTS controllers such as UPFC, GUPFCand HPFC are the example of shunt-series connected FACTS controllers. Typical connection is show
Fig. 5 [26], [34-39].
Fig. 5: Shunt-series connection
So that FACTS controller such as TCSC, SVC, TC-PAR, SSSC, STATCOM, D-STATCOM, UPFC,IPFC, GUPFC, HPFC etc. are used for improvement of the power system performance by providingreactive power support to system.This paper organized as follows: Section 2- introduces the Comparisons of performances of FACTScontrollers in power systems Section 3- introduces the summary of the paper. Section 4- discusses theconclusion and future scope of review work.
2. COMPARISONS OF PERFORMANCES OF FACTSCONTROLLERS IN POWER SYSTEMS
A detailed study of various types of FACTS controllers has been made and data presented intaxonomical form. A comparative analysis of series, shunt, shunt-series and series–series FACTS isshown in the following Tables 1-4, respectively.Table 1: Performances of various series FACTS controllers in power system
Ref. No. Factsdevice
Rating Presentlyinstalled inIndia
Performance Connection
Firstinstallationdate
[1],[2],[5-7],[9],[18],[21]
TCSC 120-350MVAR220-500KV
Raipur 400KVSubstation.
Controls thecurrent hencethe load flow.Mitigation OfSubSynchronousResonance.Damping Of
SERIES First installed inUSA(2*165MVARCapacity,230KV) in1992.

National Conference on Emerging Trends in Science, Technology and Management, 11-12 Nov 2017, ISBN: 978-93-5281-325-4 Page 150
Oscillations[2-4],[10] ,[25][50]
SSSC 220KV No Active andreactive powercontrol.Maintain highX/R ratio.Power factorcorrection.
SERIES Proposed inSPAIN,EUROPE andyet to beinstalled.
[2],[11-13],[15,[50]]
TCSR Blocksup to4KV to 9KV andconductcurrentup to6000A
No Limits the faultcurrent.Controls theinductivereactance.
SERIES -
[17] TCPAR 250MVA
No Phase shiftDoesn’t injectany activepower butcontrols activepower flow.
SERIES -
[2],[45] TSSR 120-350MVAR220-500KV
No Provide variableimpedance .Controls thefault level.
SERIES -
[1],[50] TSSC 100-150MVA
No Active andreactive control.Power factorcorrection.Maintain highX/R ratio
SERIES -
Table 2: Performances of various shunt FACTS controllers in power system
Ref. No. Factsdevice
Rating Presentlyinstalled inIndia
Performance Connection Firstinstallationdate
[18-26],[28],[49],[50]
SVC 50 TO 300MVAR at230 KV.270
MVAR at500 KV.
1988Madurai(45MVAR,132KV)1988Trichur(45MVAR,132KV)
Regulatetransmissionvoltage.To improvepowerquality.
SHUNT 1981 CHINA(120MVAR,500KV)
[2],[24-28],[30],[50]
STATCOM -41 TO 133MVAR AT115 KV.50 MVAAT 500KV.
No VoltagestabilizationandReactivecompensation.
SHUNT 1991 JAPAN(+/- 80 MVAR ,154 KV)
[26],[52],[50] DSTATCOM
±250KVAr
No Reducevoltage sags,surges andflicker.Reducespower loss indistributedsystems.
SHUNT ±250 kVAr D-STATCOM wasdesigned andinstalledfor theKhoshnoodisubstation inTehran
[44] DVR Usedbelow 400KV
No Providevoltage sagmitigation.Provide
voltage swellmitigation.
SHUNT -

National Conference on Emerging Trends in Science, Technology and Management, 11-12 Nov 2017, ISBN: 978-93-5281-325-4 Page 151
Table 3: Performances of various shunt-series FACTS controllers in power system
Ref. No. Factsdevice
Rating Presentlyinstalledin India
Performance Connection Firstinstallationdate
[2],[26],[34-39],[46],[48]
UPFC +/-320 MVA at138KV.
No Dynamic voltagesupport.
SHUNT-SERIES
1998 USA(320 MVA ,138 KV)
[40-42], HPFC 400 MVA No Use SVC,TCSC alongwith VSCS andCSCS.Simultaneouslycontrol real andreactive power.
SHUNT -SERIES Future trend
Table 4: Performances of various series-series FACTS controllers in power system
Ref. No. Factsdevice
Rating Presentlyinstalled inIndia
Performance Connection Firstinstallationdate
[31],[33],[35] IPFC Up to 900MW
No Independentcontrol of reactivepower.Consist of twoseries SSSC’s.Decrease chancesof overloadingof transmissionline.Equalize powerflow among lines
SERIES-SERIES -
[32,[43],[53] GIPFC +/-200MVA AT220KV
No Controllability ofeach line in multiline system.
SERIES-SERIESFuturetrend
3. SUMMARY
Table 1-4 shows the parameters controlled by the different FACTS controllers, a general idea ofratings of FACTS controllers could be seen from the Tables. We can differentiate between any kinds ofFACTS on the basis of Tables 1-4. Also an idea about development of FACTS could be depicted. FirstGeneration Facts include TCPS and SVC which were developed and installed in late 90’S and early2000. Following table shows the list of installed TCSC till 2007. Table 5 shows the list of TCSCinstallations.Table 5: List of TCSC installations
S.N. Year Country Voltage(KV)
1 1992 USA 230
2 1993 USA 500
3 1998 Sweden 400
4 1999 Brazil 500
5 2002 China 500
6 2004 India 400
7 2004 China 220
Second generation FACTS include STATCOM, IPFC, UPFC, GIPFC, and GUPFC were developed inlate 2000. The performance of these second generation FACTS are far better than the first generationFACTS controllers as seen from the above discussion. The latest generation of FACTS controllers,namely the IPFC, is the combination of multiple series compensators, which are very effective incontrolling power flows in transmission lines. IPFC and the GUPFC are two innovative configurationsof the convertible static compensator of FACTS. Table 6 shows the list of STATCOM installations.

National Conference on Emerging Trends in Science, Technology and Management, 11-12 Nov 2017, ISBN: 978-93-5281-325-4 Page 152
Table 6: List of STATCOM installations
S.N. YearInstalled
Country Capacity Voltagelevel
Purpose Place
1 1991 Japan ± 80 MVA 154 Power system andvoltage stabilization
Inumayasubstation
2 1992 Japan 50 MVA 500 Reactive compensation Shin ShinSubstation
Nagona3 1995 USA ± 100 MVA 161 To regulate bus voltage Sullivan
substation inTVA
power system4 2001 UK 0 to +225 MVA 400 Dynamic reactive
compensationEast Claydon
400 kVSubstation
5 2001 USA -41 to +133MVA
115 dynamic reactivecompensation duringcritical contingencies
VELCOEssex
substation
6 2003 USA ± 100 MVA 138 dynamic var controlduring peak load
conditions
SDG&ETalega
substation
FACTS controllers can be used for various applications to enhance power system performance. One ofthe greatest advantages of using FACTS controllers is that it can be used in all the three states of thepower system, namely: (1) Steady state, (2) Transient and (3) Post transient steady state. However, theconventional controllers find little application during system transient or contingency condition.a) Steady state application: Various steady state applications of FACTS controllers includes voltagecontrol (low and high), increase of thermal loading, post-contingency voltage control, loop flowscontrol, reduction in short circuit level and power flow control. SVC and STATCOM can be used forvoltage control while TCSC is more suited for loop flow control and for power flow control.b) Dynamic application: Dynamic application of FACTS controllers includes transient stabilityimprovement, oscillation damping (dynamic stability) and voltage stability enhancement. One of themost important capabilities expected of FACTS applications is to be able to reduce the impact of theprimary disturbance.c) Transient stability enhancement: Transient instability is caused by large disturbances such astripping of a major transmission line or a generator and the problem can be seen from the first swing ofthe angle. FACTS controllers can resolve the problem by providing fast and rapid response during thefirst swing to control voltage and power flow in the system.d) Oscillation damping: Electromechanical oscillations have been observed in many power systemsworldwide and may lead to partial power interruption if not controlled. Initially PSS was used foroscillation damping in power system. Now this function can be more effectively handled by properplacement and setting of SVC, STATCOM and TCSC.e) Dynamic voltage control: Shunt FACTS controllers like SVC and STATCOM as well as UPFC canbe utilized for dynamic control of voltage during system contingency and save the system from voltagecollapse and blackout.f) Power system interconnection: Interconnection of power systems is becoming increasinglywidespread as part of power exchange between countries as well as regions within countries in manyparts of the world. There are numerous examples of interconnection of remotely separated regionswithin one country. Such are found in the Nordic countries, Argentina and Brazil. In cases of longdistance AC transmission, as in interconnected power systems, care has to be taken for safeguarding ofsynchronism as well as stable system voltages, particularly in conjunction with system faults. Withseries compensation, bulk AC power transmission over distances of more than 1,000 km are a realitytoday and has been used in Brazil north-south interconnection. With the advent of TCSC, furtherpotential as well as flexibility is added to AC power transmission.
4. CONCLUSIONS AND FUTURE SCOPE OF THE WORK
With the history of more than three decades and widespread research and development, FACTScontrollers are now considered a proven and mature technology. The operational flexibility andcontrollability that FACTS has to offer will be one of the most important tools for the system operator

National Conference on Emerging Trends in Science, Technology and Management, 11-12 Nov 2017, ISBN: 978-93-5281-325-4 Page 153
in the changing utility environment. In view of the various power system limits, FACTS provides themost reliable and efficient solution. In the starting to appear deregulated power systems, FACTScontrollers will supply some advantages at existing or improved levels of reliability such as balancingthe power flow in parallel networks over a wide range of operating conditions, mitigating inter-areapower oscillations, all alleviating unwanted loop flow and intensification the power transfer capacity ofexisting transmission corridors.The major conclusions made from this review article are as follows: It make the use of power electronic base converters which increases power system stability,
reliability, security, fault overloading capacity and voltage profile. It reduces environmental pollution, active power losses, fault severity. The response of fact controllers is fast as compared to mechanically switched controllers. Although installation cost is high but in long run it results in profit. FACTS controllers could be installed on the existing transmission lines without constructing
new ones.
4.1. FACTS Controllers Technology Development
Recent development in power electronic devices is given below: A relatively new device called the Insulated Gate Bipolar Transistor has been developed with
small gate consumption and small turn-on and turn-off times. Larger controllers are nowbecoming available with typical ratings on the market being 3.3 kV/1.2 kA (Eupec), 4.5 kV/2kA (Fuji), and 5.2 kV/2 kA (ABB)[51,52] .
The ratings of IGCT reach 5.5 kV/1.8 kA for reverse conducting IGCTs and 4.5 kV/4 kA forasymmetrical IGCTs. Currently, typical ratings of IGCTs on the market are 5.5 kV/2.3 kA(ABB) and 6 kV/6 kA (Mitsubishi) Injection Enhanced Gate Transistor is a newly developedMOS device that does not require snubber circuits and it has smaller gate power and higherturn-on and turn-off capacity compared with GTO.
Based on integration of the GTO and the power MOSFET, the Emitter Turn-Off (ETO) thyristoris presented as a promising semiconductor device for high switching frequency and high poweroperation. The ETO has 5 kA snubberless turn off capability and much faster switching speedthan that of GTO.
With the help of such power electronic controllers, FACTS of large ratings beyond 500 MVA could beeasily constructed and could connect systems with voltages greater than 750 KV.The power flow control using distributed FACTS controllers can be achieved by introducing adistributed series impedance concept which can be further extended to realize a distributed static seriescompensator [53]. Major advancements have been made in the field of power electronics and it is mucheasier to realize FACTS controllers. Some of them are as follows: In series compensation, a capacitor is used to compensate for the lines impedance. However,
during transient conditions, the short-circuit currents cause high voltages across the capacitor,which must be limited to specified values. In the past, this limitation was accomplished byarresters (MOV) in combination with a spark gap. Both the (mechanical) gap function and theMOV can now be replaced by an innovative solution with special high power light-triggeredthyristors [1].
An example of cost saving: the cost savings for each fault on one of the 3 lines at the 500 kVTPSC installation at Vincent Substation, USA. In case of faults nearby the substations all 3lines are involved in the fault strategy. Then the savings sum up to 270.000 US$ per event.
If the short-circuit current rating of the equipment in the system is exceeded, the equipmentmust be upgraded or replaced, which is a very cost- and time-intensive procedure. Bycombining the TPSC with an external reactor, whose design is determined by the allowedshort circuit current level, this device can also be used very effectively as a short-circuitcurrent limiter (SCCL) as seen in Fig. 6. This new device operates with zero impedance insteady-state conditions, and in case of a short circuit it is switched within a few ms to thelimiting-reactor impedance.

National Conference on Emerging Trends in Science, Technology and Management, 11-12 Nov 2017, ISBN: 978-93-5281-325-4 Page 154
Fig. 6: SCCL (Short-circuit current limiter)
REFERENCES[1] Kirschner, L.; Bohn, J.; Sadek, K.: Thyristor protected series capacitor - Part 1 Design aspects. IEEE -
T&D Conference 2002, Sao Paulo, Brazil.[2] Hingorani, N. G.: Flexible AC transmission. IEEE Spectrum, pp. 40-45, April 1993.[3] Kalyan K. Sen, “SSSC-Static Synchronous Series Compensator: Theory, Modeling, and Applications”,
IEEE Transaction Power Delivery, Vol. 13, No. 1, January 1998.[4] R. Thirumalaivasan, M. Janaki, Nagesh Prabhu, “Damping of SSR Using Sub synchronous Current
Suppressor with SSSC”, IEEE Transactions on Power Systems, Vol. 28, No. 1, February 2013.[5] V.K. Tayal, J.S. Lather, ”Reduced order H∞ TCSC controller & PSO optimized fuzzy PSS design in
mitigating small signal oscillations in a wide range” International Journal of Electrical Power & EnergySystems, Volume 68, June 2015,Pages 123–131.
[6] Madhura Gad, Prachi Shinde, Prof. S.U.Kulkarni, “Optimal Location of TCSC by Sensitivity Methods”International Journal of Computational Engineering Research, Volume2 Issue 6. 2012.
[7] G. I Rashed, H. I. Shaheen, and S. T. Cheng, “Optimal Location and Parameter Setting of TCSC byBoth Genetic Algorithm and Particle Swarm Optimization” 2007, IEEE Second conf. on IndustrialElectronics and Applications, China.
[8] Aswathi Krishna D. , M.R.Sindhu “Application of Static Synchronous Series Compensator (SSSC) toEnhance Power Transfer Capability in IEEE Standard Transmission System”. I J C T A, 8(5), 2015, pp.2029-2036.
[9] X. Zhou and J. Liang, “Non-linear Adaptive Control of the TCSC to Improve the Performances of PowerSystems,” IEEE Proceedings on Generation, Transmission, and Distribution, Vol.146, No.3, May, 1999,pp. 301-305.
[10] Swasti R. Khuntia, Sidhartha Panda, “ANFIS approach for SSSC controller design for the improvementof transient stability performance” Mathematical and Computer Modeling in Power Control andOptimization, Volume 57, Issues 1–2, January 2013, Pages 289–300.
[11] Mohamed Shawky El Moursi, Jim. L. Kirtley, Mohamed Abdel-Rahman, “Application of Series VoltageBoosting Schemes for Enhanced Fault Ride through Performance of Fixed Speed Wind Turbines”, IEEEtransactions on Power Delivery, Vol. 29, No. 1, February 2014.
[12] O. Mendrock, “Short-circuit current limitation by series reactors," 2009.[13] S. Choi, T. Wang, and D. Vilathgamuwa, “A series compensator with fault current limiting function,"
Power Delivery, IEEE Transactions on, vol. 20, no. 3, pp. 2248-2256, July 2005.[14] A. Abramovitz and K. Smedley, “Survey of solid-state fault current limiters," Power Electronics, IEEE
Transactions on, vol. 27, no. 6, pp. 2770-2782, June 2012.[15] Z.Lu, D.Jiang, and Z.Wu, “A new topology of fault-current limiter and its parameters optimization" in
Power Electronics Specialist Conference, 2003, PESC '03, 2003 IEEE 34th Annual, vol. 1, June 2003,pp. 462-465 vol.1.
[16] J. Mulcahy, T. L. Ma, “The SPLC A New Technology for Arc Stabilization and Flicker Reduction onAC Electric Arc Furnaces”, Toronto, Ontario, Canada IEEE Guide for Application of Shunt PowerCapacitors, IEEE Standard1036-1992, 1992.
[17] Flavio G. M. Lima, Francisco D. Galiana, Ivana Kockar, and Jorge Munoz, “Phase Shifter Placement inLarge Scale Systems Via Mixed Integer Linear Programming,” IEEE Trans. on Power Systems, Vol. 18,No.3, Aug., 2003.
[18] Kazemi, and B. Badrzadeh, “Modeling and Simulation of SVC and TCSC to Study Their Limits onMaximum Loadability Point,” Electrical Power & Energy Systems, Vol.26, pp.619-626, 2004.
[19] M.A. Abido, Y.L. Abdel-Magid, “Coordinated design of a PSS and an SVC-based controller to enhancepower system stability” International Journal of Electrical Power & Energy Systems, Volume 25, Issue9, November 2003, Pages 695–704.
[20] FadelaBenzergua, AbdelkaderChaker, MounirKhiat, and NaimaKhalfallah, “Optimal Placement of StaticVAR Compensator in Algerian Network,” Information Technology Journal, Vol.6, No.7, pp.1095-1099,2007.
[21] Ping Lam So, Yun Chung Chu, and Tao Yu, “Coordinated Control of TCSC and SVC for systemDamping Enhancement,” International Journal of Control Automation and Systems, Vol.3, No.2,(special edition), pp.322-333, June 2005.

National Conference on Emerging Trends in Science, Technology and Management, 11-12 Nov 2017, ISBN: 978-93-5281-325-4 Page 155
[22] Claudio A. Canizares, and Zeno T. Faur, “Analysis of SVC and TCSC Controllers in Voltage Collapse,”IEEE Trans on Power Systems, Vol.14, No.1, Feb., 1999.
[23] M. K. Verma, and S. C. Srivastava, “Optimal Placement of SVC for Static and Dynamic VoltageSecurity Enhancement,” International Journal of Emerging Electric Power Systems, Vol.2, issue-2, 2005.
[24] Mehrdad Ahmadi Kamarposhti and MostafaAlinezhad “Comparison of SVC and STATCOM in StaticVoltage Stability Margin Enhancement,” World Academy of Science Engineering and Technology, pp.860-865, 2009.
[25] Shravana Musunuri, Gholamreza Dehnavi “Comparison of STATCOM, SVC, TCSC, and SSSCPerformance in Steady State Voltage Stability Improvement,” North American Power Symposium(NAPS), 26-28 Sept., pp. 1-7, 2010.
[26] Mehrdad Ahmadi Kamarposhti, MostafaAlinezhad, Hamid Lesani, Nemat Talebi “Comparison of SVC,STATCOM, TCSC, and UPFC Controllers for Static Voltage Stability Evaluated by Continuation PowerFlow Method,” IEEE Electrical Power & Energy Conference, 2008.
[27] A. Kazemi, V. Vahidinasab, A. Mosallanejad “Study of STATCOM and UPFC Controllers for VoltageStability Evaluated by Saddle-Node Bifurcation Analysis,” First International Power and EnergyConference PE Con, Putrajaya, Malaysia, November 28-29, pp. 191-195, 2006.
[28] Tariq Masood, R.K. Aggarwal, S.A. Qureshi, and R.A.JKhan “STATCOM Model against SVC ControlModel Performance Analyses Technique by Matlab ”International Conference on Renewable Energy andPower Quality (ICREPQ’10) Granada (Spain), 23rd to25th March, 2010.
[29] Sidhartha Panda, N.P.Padhy, R.N.Patel “Genetically Optimized TCSC Controller for Transient StabilityImprovement” International Journal of Computer and Information Engineering 1:1 2007.
[30] Kameswara Rao , G.Ravi kumar , Shaik Abdul Gafoorand ,S.S.Tulasi Ram ”Fault Analysis of DoubleLine Transmission System with STATCOM Controller Using Neuro‐Wavelet Based Technique“International Journal of Engineering and Technology Volume 2 No. 6, June,2012.
[31] Wei, X.; Chow, J.H.; Fardanesh, B. and Edris, A.A. (2004).A Dispatch Strategy for an Interline PowerFlow Controller Operating at Rated Capacity. Proc. PSCE 2004– Power Systems Conference &Exposition, IEEE PES, N.Y
[32] Vasquez-Arnez, R.L. and Zanetta Jr, L.C. (2005b). Multi-Line Power Flow Control: An Evaluation ofthe GIPFC (Generalized Interline Power Flow Controller). Proc.6th International Conf. on PowerSystems Transients– IPST’05, Montreal.
[33] Diez-Valencia, V.; Annakkage, U.D.; Gole, A.M.; Demchenko, P. and Jacobson D. (2002). InterlinePower Flow Controller (IPFC) Steady State Operation. Proc. Canadian Conference on Electrical andComputer Engineering, IEEE CCECE 2002, Vol. 1, pp. 280-284.
[34] K.S.Smith, L.Ran, J-Penrnan, " Dynamic Modeling of a Unified Power FIowContro11ery7 IEEproceedings-Generation, Transmission and Distribution, VOL 144, No. 1, January 1997, pp. 7-12.
[35] Laszlo Gyugyi, Kalyan K. Sen, Colin D. Schauder, “ The Interline Power Flow Controller Concept : ANew Approach to the Power Flow Management, ” IEEE Trans. on Power Delivery, Vol.14, no. 3, pp1115 – 1123, July 1999.
[36] L-Gyugyi, “Unified power-flow concept for flexible a transmission systems, "IEE Proceedings-C, Vol.139, No.4, July 1992, pp. 323-33.
[37] Manzar Rahman, M-Ahmed, R-Gutmna, RJ.09Keefe, R.Nelson, J.Bian, " UPFC application on the AEPsystem: Planning Considerations," IEEE Transactions on Power Systems, Vol. 12, No.4. November1997, pp. 1695-17Q.
[38] H.F-Wang. "Damping Function of a Unified Power Row Controller" IEE proceedings-Generation,Transmission and Distribution” Vol. 1 46, No. 1. January1999, pp. 8 1-87.
[39] S.Limyingcharoen, U.D.Annakage, N.C. Pahalawaththa "Effects of Unified power flow Controller' IEEproceedings-Generation, Transmission and Distribution, Vol. 145, No.2, March 1998, pp. 182-188.1161.
[40] Jovan Z. Bebic, Peter W. Lehn, M. R. Iravani, “The Hybrid Power Flow Controller - A New Concept forFlexible AC Transmission”, IEEE Power Engineering Society General Meeting, DOI-10.1109/PES.2006.1708944, Oct. 2006.
[41] V. K. Sood, S. D. Sivadas, “Simulation of Hybrid Power Flow Controller”, IEEE Power Electronics,Drives and Energy Systems (PEDES), DOI-10.1109/PEDES.2010.5712553, pp 1-5, Dec. 2010.
[42] Noel Richard Merritt, Dheeman Chatterjee, “Performance Improvement of Power Systems UsingHybrid Power Flow Controller”, International Conference on Power and Energy Systems (ICPS),DOI-10.1109/ICPES.2011.6156628, pp1-6, Feb. 2012.
[43] M. Mohaddes, D. P. Brandt, M.M. Rashwan, K. Sadek, “Application of the Grid Power Flow Controllerin a Back-to-Back Configuration”, [CIGRE Report B4-307, Session 2004].
[44] N. Woodley, L. Morgan, and A. Sundaram, “Experience with an inverter-based dynamic voltagerestorer," Power Delivery, IEEE Transactions on, vol. 14, no. 3, pp. 1181-1186, July 1999.
[45] Montafio J.C., A. Lopez and M. Castilla, 1993. Effects of voltage Waveform Distortion in TCR-TypeCompensators. IEEE Trans. on Industrial Electronics, 40 (1): 373-381.
[46] S.M. Alamelu, and R. P. Kumudhini Devi, “Novel Optimal Placement UPFC Based on SensitivityAnalysis and Evolutionary Programming ,” Journal of Engineering and Applied Sciences, Vol.3, No.1,pp.59- 63, 2008.
[47] Vijayakumar, 2Dr. R. P. Kumudini devi , “A new method for optimal location of facts controllers usinggenetic algorithm” ,Journal of Theoretical and Applied Information Technology,2005-2007JATIT.

National Conference on Emerging Trends in Science, Technology and Management, 11-12 Nov 2017, ISBN: 978-93-5281-325-4 Page 156
[48] VSN. Narasimha Raju1 B.N.CH.V.Chakravarthi2 Sai Sesha.M3, “Improvement of Power SystemStability Using IPFC and UPFC Controllers”, International Journal of Engineering and InnovativeTechnology (IJEIT) Volume 3, Issue 2, August 2013.
[49] Lee S.Y., S.Bhattacharya, T.Lejonberg, A.Hammad and S.Lefebvre, 1992.Detailed modeling of staticVAR compensators using the Electromagnetic Transients Program (EMTP). IEEE Trans. on powerDelivery, 7(2): 836-847.
[50] Bindeshwar Singh, N. K. Sharma and A. N. Tiwari, “A Comprehensive Survey of Coordinated ControlTechniques of FACTS Controllers in Multi- Machine Power System Environments”, 16th NATIONALPOWER SYSTEMS CONFERENCE, 15th-17th DECEMBER, 2010.
[51] D. Sullivan, R. Pape, J. Birsa, M. Riggle, M. Takeda, H. Teramoto, Y. Kono, K. Temma, S. Yasuda, K.Wofford, P. Attaway, and J. Lawson, "Managing fault-induced delayed voltage recovery in MetroAtlanta with the Barrow County SVC," in 2009 IEEE/PES Power Systems Conference and Exposition,PSCE 2009, Seattle, WA, 2009.
[52] Y. H. Liu, R. H. Zhang, J. Arrillaga, and N. R. Watson, “An Overview of Self-Commutating Convertersand Their Application in Transmission and Distribution”, Transmission and Distribution Conference andExhibition: Asia and Pacific, Dalian, China, 2005.
[53] D. Divan, and H. Johal, “Distributed FACTS—A New Concept for Realizing Grid Power FlowControl”, IEEE Trans. Power Electr., 22(6) (2007), 2253 – 2260.
National Conference on Emerging Trends in Science, Technology and Management, 11-12 Nov 2017, ISBN: 978-93-5281-325-4 Page 157
CENTRAL GOVERNMENT EFFORTS FOR THEDEVELOPMENT OF VARANASI AND ITS IMPACT ONTOURISM INDUSTRY: MANAGEMENT PERSPECTIVE
Priya singhResearch scholar, Dept. of History
Faculty of Arts, Banaras Hindu UniversityE-mail: [email protected]
Abstract - The travel and tourism industry has emerged as one of the largest and fastest growing economicsectors globally. Its contribution to the global Gross Domestic Product and employment has increasedsignificantly. The Indian tourism industry has emerged as one of the key drivers of growth among theservices sector in India. Tourism in India is a sun rise industry, an employment generator, a significantsource of foreign exchange for the country and an economic activity that helps local and host communities.Rising income levels and changing lifestyles, development of diverse tourism offerings and policy andregulatory support by the government are playing a pivotal role in shaping the travel and tourism sector inIndia. However, the sector is facing challenges such as lack of good quality tourism infrastructure, globalconcerns regarding health and safety of tourists, disparate passenger/road tax structures across variousstates and shortfall of adequately trained and skilled manpower. Concerted efforts by all stakeholders suchas the central and state governments, private sector and the community at large are pertinent forsustainable development and maintenance of the travel and tourism sector in the country.
Key words: Infrastructure, inclusive growth, Skill development.
1. INTRODUCTION
The travel and tourism industry has emerged as one of the largest and fastest growing economic sectorsglobally. According to the UNWTO (2013), tourism’s total contribution to worldwide GDP isestimated at 9 per cent. Tourism exports in 2012 amounted to USD 1.3 trillion accounting for 6 percent of the world’s exports. New tourist destinations, especially those in the emerging markets havestarted gaining prominence with traditional markets reaching maturity. Asia Pacific recorded thehighest growth in the number of international tourist arrivals in 2012 at 7 per cent followed by Africa at6 per cent. Increasingly, travel and tourism is emerging as an important category of services exportsworldwide.
2. TOURISM INDUSTRY IN VARANASI
The travel and tourism sector holds strategic importance in the Indian economy providing several socioeconomic benefits. Provision of employment, income and foreign exchange, development or expansionof other industries such as agriculture, construction, handicrafts etc. are some of the importanteconomic benefits provided by the tourism sector. In addition, investments in infrastructural facilitiessuch as transportation, accommodation and other tourism related services lead to an overalldevelopment of infrastructure in the economy. According to the World Economic Forum’s Travel andTourism Competitiveness Report 2013, India ranks 11th in the Asia pacific region and 65th globallyout of 140 economies ranked on travel and tourism Competitiveness Index. India has been witnessingsteady growth in its travel and tourism sector over the past few years in Varanasi is one of thesignificant attractions.PM Modi’s efforts and its impact on tourism: Varanasi, the Lok Sabha constituency represented byPrime Minister Narendra Modi since May 2014 is a spiritual and heritage city of India. There are lotsof myth and stories about the evolution and existence of the city. People from all over the world cometo Varanasi for various purposes. This city has lots of potential for the tourism sector. But its potentialis not addressed and explored for this sector significantly before the herculean effort of Prime MinisterNarendra Modi. The constituency has succeeded in wooing Central ministry projects of varied size andscale — from cow conservation of the ministry of agriculture to the building of a multi-modal terminalfor cargo ships under the ministry of shipping; from laying underground cabling in the temple and ghatareas under the Union power ministry's mega project to the National Highways Authority of India(NHAI) picking up a 2003 state government road project with a fresh deadline of May 2017.The list of projects driven from Delhi is long. The ministry of textiles, for example, has begun work ona five-storey (13,799 sq m) office complex that will eventually turn into a one-stop shop for all textilestakeholders — weavers, exporters and marketing agencies.Then, the ministry of tourism in collaboration with the Inland Waterways Authority of India, an agencyunder the ministry of shipping, has facilitated a luxury cruise service up to the city of Varanasi (starting

National Conference on Emerging Trends in Science, Technology and Management, 11-12 Nov 2017, ISBN: 978-93-5281-325-4 Page 158
from Patna). Even the ministry of railways is well on track in doling out projects for the PM'sconstituency.Apart from undertaking a 25% expansion of the existing diesel locomotive works at Varanasi at a costof Rs 266 crore, Indian Railways last year set up what it calls the Malaviya Chair in IIT-BHU, inmemory of the institute's founder and Bharat Ratna Madan Mohan Malaviya. The objective is toresearch on and develop new materials for railway wheels, bushings, exhaust fans and the like withbetter longevity. The project costs, however, vary from one ministry to another. In terms of size, theministry of road transport and highways is by far the topper. Nitin Gadkari's ministry is executingseven road projects connecting Varanasi, the total project cost being Rs 7,100 crore. Piyush Goyal'sministry of power has earmarked Rs 572 crore for Varanasi alone (out of Rs 1,067 crore for UttarPradesh) under the Integrated Power Development Scheme (IPDS). The Central fund under thisscheme is being used for underground cabling in areas around the temples and ghats, to upgrade theelectrical assets at sub-centres, lines and distribution transformers, and to also install roof-top solarpanels in government buildings in the city.Swachha Bharat Abhiyan/Clean India Campaign: Swachh Bharat Abhiyan is a national levelcampaign by the Government of India, covering 4041 statutory towns to clean the streets, roads andinfrastructure of the country. This campaign was officially launched on 2 October 2014 at Rajghat,New Delhi, where Prime Minister Narendra Modi himself cleaned the road. The mission was started byNarendra Modi, the Prime Minister of India, nominating nine famous personalities for this campaign,and they take up the challenge and nominate nine more people and so on. It has been carried forwardsince then with famous people from all walks of life joining it.The importance of a clean India is increasingly felt for boosting tourism, which is a key factor ineconomic development and employment generation. One aspect that has impacted tourism in ourcountry, both international and domestic, relates to hygiene. This factor has become a major one forfull realization of our tourism potential. Cleanliness and proper hygiene are universally regarded asindispensable existential norms that must inform and permeate all our actions. Adequate personal andenvironmental cleanliness has a major impact on the image of India and the tourism sector, where thefirst impression of a visitor is often his last.Some of the significant impacts are:
1. Clean India campaign promotes more number of tourists.2. It increases the economic growth of the city.3. Self responsibility to follow rules of tourist sites.4. It develops the infrastructure and transportation of the city.5. It improves destination image.6. Aware of cleanliness methods7. Strong support from ruling political party.8. More budget allocation for Clean India campaign
Skill India Programme: The idea is to raise confidence, improve productivity and give directionthrough proper skill development. Skill development will enable the youths to get blue-collar jobs.Development of skills, at young age, right at the school level, is very essential to channelise them forproper job opportunities. There should be a balanced growth in all the sectors and all jobs should betreated with equal importance. Every job aspirant would be given training in soft skills to lead a properand civilized life. Skill development would reach the rural and remote areas also. Corporateeducational institutions, non-government organizations, government, academic institutions, and societywould help in the development of skills of the youth so that better results are achieved in the shortestpossible time. Tourism is a smokeless industry which provides job opportunity to unskilled people also.But with the help of skill India programme many people become skilled according to the requirementof tourism industry and earning more money. This programme helped in bringing large number ofpeople to this industry in Varanasi which ultimately enhanced the quality services of the industry.Clean Ganga Campaign: Clean Ganga campaign is great campaign having large impact on thetourism of Varanasi. Ganges is a spiritual river and people having great faith in it. Not only out bondtourism but in bond tourism also crucial as far as revenue is concern. Not only government differentNGO’s also motivated by the spirit of PM Modi for cleaning Ganga. Jhatkaa and the Sankat MochanFoundation reached out to spread the ‘Clean Ganga’ message through person-to-person contact, SMS,interactive voice response (IVR), missed calls, email, cutting-edge web tools, and social networks.They worked on the streets, ghats, and colleges of Varanasi, including the Banaras Hindu University(BHU). Jhatkaa set up a missed call number that got 5,000 responses, a petition that got hundreds ofsignatures, distributed 8,000 fliers, and appeared in dozens of media stories on the issue.HRIDAY Yojana (Heritage City Development and Augmentation Yojana): The Ministry ofHousing and Urban Affairs, Government of India, launched the National Heritage City Development

National Conference on Emerging Trends in Science, Technology and Management, 11-12 Nov 2017, ISBN: 978-93-5281-325-4 Page 159
and Augmentation Yojana (HRIDAY) scheme on 21st January, 2015, with a focus on holisticdevelopment of heritage cities. The scheme aims to preserve and revitalise soul of the heritage city toreflect the city’s unique character by encouraging aesthetically appealing, accessible, informative &secured environment. With a duration of 4 years (Completing in November, 2018) and a total outlay ofINR 500 Crores, the Scheme is being implemented in 12 identified Cities namely, Ajmer, Amaravati,Amritsar, Badami, Dwarka, Gaya, Kanchipuram, Mathura, Puri, Varanasi, Velankanni and Warangal.The scheme is implemented in a mission mode.The scheme will be completely funded by union government to create infrastructure and createfacilities around the heritage sites to attract more tourists. Varanasi will have great impact of thisscheme.Sansad Adarsh Gram Yojana: It is a rural development programme broadly focusing upon thedevelopment in the villages which includes social development, cultural development and spreadmotivation among the people on social mobilization of the village community. The programme waslaunched by the Prime Minister of India, Narendra Modi on the birth anniversary of JayaprakashNarayan, on 11 October 2014.Key objectives of the Yojana include:
1. The development of model villages, called Adarsh Grams, through the implementation ofexisting schemes, and certain new initiatives to be designed for the local context, which mayvary from village to village.
2. Creating models of local development which can be replicated in other villages.This initiative of PM Modi will definitely enhance the potential of Ethnic Tourism in Varanasi.Start Up India/ Stand Up India Programme: Startup India campaign is based on an action planaimed at promoting bank financing for start-up ventures to boost entrepreneurship and encourage startups with jobs creation. The campaign was first announced by Prime Minister Narendra Modi in his 15August 2015 address from the Red Fort. The Standup India initiative is also aimed at promotingentrepreneurship among SCs/STs, women communities. Rural India's version of Startup India wasnamed the Deen Dayal Upadhyay Swaniyojan Yojana. To endorse the campaign, the first magazine forstart ups in India, The Cofounder, was launched in 2016. Such kind of programme was very muchawaited for the development of tourism industry.
2. Conclusion
The travel and tourism industry has emerged as one of the largest and fastest growing economic sectorsglobally. Its contribution to the global Gross Domestic Product and employment has increasedsignificantly. The Indian tourism industry has emerged as one of the key drivers of growth among theservices sector in India. Tourism in India is a sun rise industry, an employment generator, a significantsource of foreign exchange for the country and an economic activity that helps local and hostcommunities. India is a tourism product which is unparalleled in its beauty, uniqueness, rich cultureand history has been aggressively pursuing the promotion of tourism both internationally as well as inthe domestic market. With increasing tourist inflows over the past few years, it is a significantcontributor to Indian economy as well. Rising income levels and changing lifestyles, development ofdiverse tourism offerings and policy and regulatory support by the government are playing a pivotalrole in shaping the travel and tourism sector in India. Earlier, the sector was facing challenges such aslack of good quality tourism infrastructure, global concerns regarding health and safety of tourists,disparate passenger/road tax structures across various states and shortfall of adequately trained andskilled manpower.But in the capable leadership of Prime Minister Narendra Modi several plans and programmes havebeen devised for tackling these challenges, successful implementation would be critical to accelerategrowth. Concerted efforts by all stakeholders such as the central and state governments, private sectorand the community at large are pertinent for sustainable development and maintenance of the travel andtourism sector in the country.
REFERENCES[1.] Sarngadharan, M., & Retnakumari, N. (2005). Hospitality and Tourism: A Case Study of Kerala. In
Biju, M.R (Ed.), Tourism (214-221). New Delhi: New Century Publications.[2.] Sasikumar, K., & Santhosh, V. S. (2010). Kerala Tour – A Truly Memorable Travel Experience t o All.
Conference Souvenir Momorabilia, XXXIIIA A.[3.] Saurabh Rishi & Sai Giridhar, B. (2007). Himachal Tourism: A SWOT Analysis. International
Marketing Conference on Marketing & Society, IIMK, 17-19.[4.] Siby Zacharias., James Manalel., Jose, M.C., & Afsal Salam (2008). Back Water Tourism in Kerala:
Challenges and Opportunities. Paper Presented at Conference on Tourism in India – Challenges Ahead,IIMK.

National Conference on Emerging Trends in Science, Technology and Management, 11-12 Nov 2017, ISBN: 978-93-5281-325-4 Page 160
[5.] Silpa., & Rajithakumar (2005). Human Resource Development in Tourism industry: Thrust Areas. InBiju, M.R (Ed.), Tourism, (150-171). New Delhi: New century Publications.
National Conference on Emerging Trends in Science, Technology and Management, 11-12 Nov 2017, ISBN: 978-93-5281-325-4 Page 161
APPLICATION OF EMD AND PDD ON MECHANICALFAULT ANALYSIS OF AN INDUCTION MOTOR
Sudhir Agrawal,Department of Electrical Engineering, MMMUT, Gorakhpur, India
Email:[email protected] Prakash,
Department of Electronics Engineering, Buddha Institute of Technology, Gorakhpur, India Email:[email protected]
Dr. V. K. Giri,Electrical Engineering, Madan Mohan Malaviya University of Technology, Gorakhpur-273010, India Email:
Abstract-- According to the non-stationary characteristics of roller bearing fault vibration signals, a rollerbearing fault diagnosis method based on empirical mode decomposition (EMD) energy entropy has beenutilize as performance index in this paper. Firstly, original acceleration vibration signals are decomposedinto a finite number of stationary intrinsic mode functions (IMFs), and then the concept of EMD energyentropy is proposed. The analysis results from EMD energy entropy of different vibration signals show thatthe energy of vibration signal will change in different frequency bands when bearing fault occurs.Therefore, to identify roller bearing fault patterns, energy feature extracted from a number of IMFs thatcontained the most dominant fault information. Further in order to verify the bearing fault the probabilitydensity distribution (PDD) is checked of each healthy and faulty IMFs. The result shows that the proposedmethod can diagnose faulty bearing.
Keywords—EMD, Entropy, IMF, PDD, Vibration Signal.
1. INTRODUCTION
The Rolling element bearings are among the most common components to be found in industrialrotating machinery. They are found in industries from agriculture to aerospace, in equipment as diverseas paper mill rollers to the Space Shuttle Main Engine Turbo machinery. For proper operation of themachines these parts have to remain in good working condition. These are the load carrying membersand key to effective functioning of any. It has been reported in the literature that two-third of the motorfailure are initiated due to the malfunctioning of the bearings. Various faults occurring in bearings ofthe machines while in operation can degrade performance, and may cause severe damage to the wholework lineup. Consequently, monitoring of the operative conditions of the induction motors provide anoverall economy improvement by reducing operational and maintenance costs besides improving thesafety level. The fault occurs in bearing is categorize under the mechanical fault [1-2]. There has beenmuch written on the subject of bearing vibration monitoring over the last twenty five years. A reviewcompleted over twenty years ago provided comprehensive discussion on bearings, their rotationalfrequencies, modes of failures, resonance frequencies and various vibration analysis techniques [3-4].The more common techniques which were used at that time included time, frequency and time-frequency domain techniques. These comprised techniques such as RMS, crest factor, probabilitydensity functions, correlation functions, band pass filtering prior to analysis, power and cross powerspectral density functions, transfer and coherence functions as well as cepstrum analysis, narrow bandenvelope analysis and shock pulse methods[5,6,7]. It is interesting to note that these are the techniqueswhich have continued to be used and have been further developed over the past two decades forbearing fault detection and diagnosis. A large number of vibration signal processing techniques forbearing condition monitoring have been published in the literature across the full range of rotatingMachinery [8-9]. Condition monitoring can be divided up into three main areas, detection, diagnosisand prognosis. Detection can often be as simple as determining that a serious change has occurred inthe mechanical condition of the machine. Diagnosis in effect determines the location and type of thefault, while prognosis involves estimation of the remaining life of the damaged bearing. Over the pastdecade, the understanding of signal processing techniques and their application to bearing faultdetection has increased tremendously. The amount of information which can be gained from thevibration measured on rotating machinery is immense. It would be anticipated that the general use ofadvanced signal processing techniques will become more widespread in the future.Recently, a new signal analysis method, namely empirical mode decomposition (EMD, as defined inSection II) developed by Huang et al., has been based on the local characteristic time scale of the signaland can decompose the complicated signal into a number of intrinsic mode functions (IMFs, as definedin Section II) [10]. By analysing each resulting IMF component that involves the local characteristic ofthe signal, the characteristic information of the original signal could be extracted more accurately and

National Conference on Emerging Trends in Science, Technology and Management, 11-12 Nov 2017, ISBN: 978-93-5281-325-4 Page 162
effectively. In addition, the frequency components involved in each IMF not only relates to samplingfrequency but also changes with the signal itself; therefore, EMD is a self-adaptive signal processingmethod that can be applied to nonlinear and non-stationary process perfectly, and which has overcomethe limitation of the Fourier transform and has high SNR as well.In this paper, EMD is applied to the roller bearing fault diagnosis. First, the original accelerationvibration signal is decomposed by EMD and some IMF components are obtained, then the concept ofEMD energy entropy is introduced, which can reflect the real work condition and the fault pattern ofthe roller bearing. The EMD energy entropies of different vibration signals illustrate that the energy ofacceleration vibration signal in different frequency bands will change when bearing fault occurs.The paper is organized as follows. Section II is given as description of data used in this paper. SectionIII is dedicated to the EMD method. In Section IV, the concept of EMD energy entropy is proposedand the EMD energy entropies of different vibration signals are calculated, which illustrates that theenergy of acceleration vibration signal in different frequency bands changes when bearing fault occurs.Ins Section V concept of power density distribution is discussed. And finally the conclusion of thispaper is given in Section VI.
2. DATA DESCRIPTION
In this paper vibration signals provided by the CWRU (Case Western Reserve University) bearing datacenter [11], collected a 2 HP motor fixed in a test stand is used for investigation. Vibration data isacquired using accelerometers, which are attached in to the housing with magnetic basis. Digital dataus sampled at 12,000 samples per second and recorded using 16 channel DAT recorders. Motorbearings were seeded with faults using electro-discharge machining (EDM). In this paper, two set ofdata were obtain from experiment system:
1. Under Healthy Condition.2. Under Damaged Condition.
EMD method
The EMD method is developed from the simple assumption that any signal consists of different simpleintrinsic modes of oscillations. Each linear or nonlinear mode will have the same number of extremaand zero-crossings. There is only one extremum between successive zero-crossings. Each mode shouldbe independent of the others. In this way, each signal could be decomposed into a number of intrinsicmode functions (IMFs), each of which must satisfy the following definition [12].
1. In the whole data set, the number of extrema and the number of zero-crossings must either beequal or differ at most by one.
2. At any point, the mean value of the envelope defined by local maxima and the envelopedefined by the local minima is zero.
An IMF represents a simple oscillatory mode compared with the simple harmonic function. With thedefinition, any signal ( )x t can be decomposed as follows [13]:
I. Identify all the local extrema, then connect all the local maxima by a cubic spline line as theupper envelope.
II. Repeat the procedure for the local minima to produce the lower envelope. The upper andlower envelopes should cover all the data between them.
III. The mean of upper and low envelope value is designated as 1m , and the difference between
the signal ( )x t and 1m is the first component, 1h , i.e.
1 1( ) (i)x t m h Ideally, if h1 is an IMF, then h1 is the first component of x(t).
IV. If h1 is not an IMF, h1 is treated as the original signal and (i)–(iii) are repeated; then
1 11 11- = (ii)h m h
After repeated sifting, i.e. up to k times, 1kh becomes an IMF that is
1 11 1 ; (iii)k kkh m h then, it is designated as:
1 1 (iv)kc hThe first IMF component from the original data. 1c should contain the finest scale or the shortest
period component of the signal.

National Conference on Emerging Trends in Science, Technology and Management, 11-12 Nov 2017, ISBN: 978-93-5281-325-4 Page 163
V. Separating 1c from ( )x t we get
1 1( ) (v)r x t c
1r is treated as the original data, and by repeating the above processes, the second IMF component
2c of ( )x t could be obtained. Let us repeat the process as described above for n times, then n -
IMFs of signal ( )x t could be obtained. Then,
1 2 2
1
(vi)
n n n
r c r
r c r
The decomposition process can be stopped when rn becomes a monotonic function from whichno more
IMF can be extracted. By summing up Eqs. (v) and (vi), we finally obtain
1
( ) (vii)n
j nj
x t c r
Thus, one can achieve a decomposition of the signal into n -empirical modes, and a residue nr ,
which is the mean trend of ( )x t The IMFs IMF1,IMF2,............IMFn include different frequency bands
ranging from high to low. The frequency components contained in each frequency band are different
and they change with the variation of signal ( )x t , while nr represents the central tendency of signal
( )x t [14].
Fig. 1 and Fig. 2 shows the vibration acceleration signal of the roller bearing without fault andwith fault. The decomposed results are given in Fig. 3 and Fig. 4, which has 12 IMFs in commonbut only five of them are shown in the figures because of limited space. It can be seen from thefigures that the signal is decomposed into some IMFs with different time scales by which thecharacteristics of the signal can be presented in different resolution ratio.
Fig. 1. The Vibration acceleration Signal of Healthy Bearing
Fig. 2. The Vibration acceleration of Damaged Bearing
Emd energy entropyWhile the roller bearing with different faults is operating, the corresponding resonance frequencycomponents are produced in the vibration signals, and here the energy of fault vibration signal changeswith the frequency distribution. To illustrate this change case as mentioned above, the EMD energyentropy is proposed in this paper.
If n IMFs and a residue nr are obtained by using the EMD method to decompose the roller bearing
vibration signal ( )x t where the energy of the n IMFs is1 2; ; ... ; ,nE E E respectively; then, due to
the orthogonality of the EMD decomposition, the sum of the energy of the n IMFs should be equal to
the total energy of the original signal when the residue nr is ignored. As the IMFs include different
0 0.05 0.1 0.15 0.2 0.25-4
-3
-2
-1
0
1
2
3
Time (Sec)
Am
pli
tud
e
0 0.05 0.1 0.15 0.2 0.25-6
-4
-2
0
2
4
6
Time (Sec)
Am
pli
tud
e
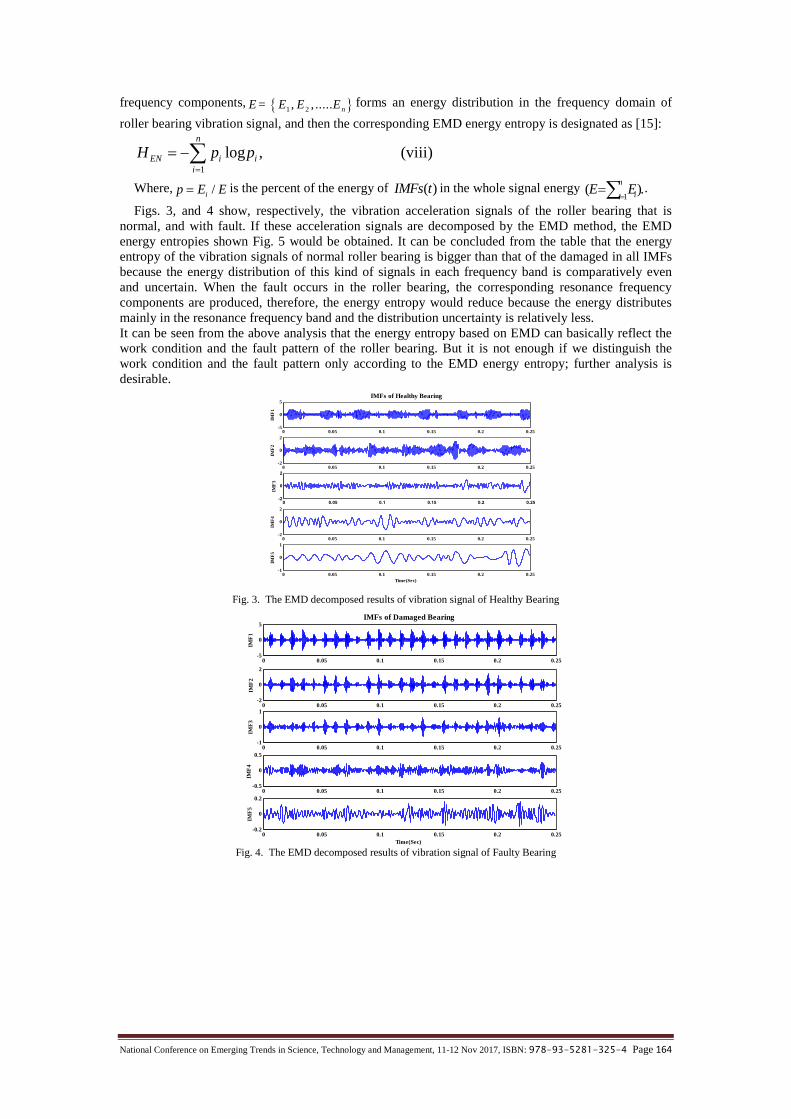
National Conference on Emerging Trends in Science, Technology and Management, 11-12 Nov 2017, ISBN: 978-93-5281-325-4 Page 164
frequency components, 1 2= , , ..... nE E E E forms an energy distribution in the frequency domain of
roller bearing vibration signal, and then the corresponding EMD energy entropy is designated as [15]:
1
log , (viii)n
EN i ii
H p p
Where, /ip E E is the percent of the energy of ( )IMFs t in the whole signal energy
1( ).
n
iiE E
.
Figs. 3, and 4 show, respectively, the vibration acceleration signals of the roller bearing that isnormal, and with fault. If these acceleration signals are decomposed by the EMD method, the EMDenergy entropies shown Fig. 5 would be obtained. It can be concluded from the table that the energyentropy of the vibration signals of normal roller bearing is bigger than that of the damaged in all IMFsbecause the energy distribution of this kind of signals in each frequency band is comparatively evenand uncertain. When the fault occurs in the roller bearing, the corresponding resonance frequencycomponents are produced, therefore, the energy entropy would reduce because the energy distributesmainly in the resonance frequency band and the distribution uncertainty is relatively less.It can be seen from the above analysis that the energy entropy based on EMD can basically reflect thework condition and the fault pattern of the roller bearing. But it is not enough if we distinguish thework condition and the fault pattern only according to the EMD energy entropy; further analysis isdesirable.
Fig. 3. The EMD decomposed results of vibration signal of Healthy Bearing
Fig. 4. The EMD decomposed results of vibration signal of Faulty Bearing
0 0.05 0.1 0.15 0.2 0.25-5
0
5
IMF
1
IMFs of Healthy Bearing
0 0.05 0.1 0.15 0.2 0.25-2
0
2
IMF
2
0 0.05 0.1 0.15 0.2 0.25-2
0
2
IMF
3
0 0.05 0.1 0.15 0.2 0.25-2
0
2
IMF
4
0 0.05 0.1 0.15 0.2 0.25-1
0
1
IMF
5
Time(Sec)
0 0.05 0.1 0.15 0.2 0.25-5
0
5
IMF
1
IMFs of Damaged Bearing
0 0.05 0.1 0.15 0.2 0.25-2
0
2
IMF
2
0 0.05 0.1 0.15 0.2 0.25-1
0
1
IMF
3
0 0.05 0.1 0.15 0.2 0.25-0.5
0
0.5
IMF
4
0 0.05 0.1 0.15 0.2 0.25-0.2
0
0.2
IMF
5
Time(Sec)
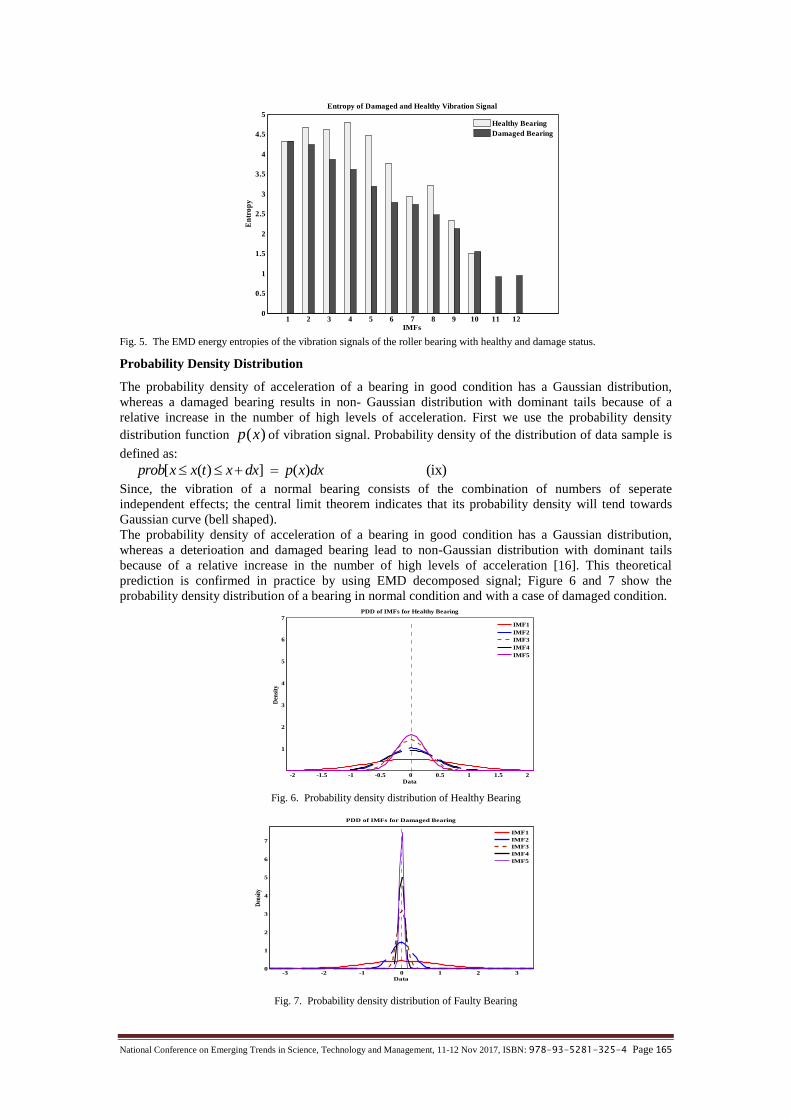
National Conference on Emerging Trends in Science, Technology and Management, 11-12 Nov 2017, ISBN: 978-93-5281-325-4 Page 165
Fig. 5. The EMD energy entropies of the vibration signals of the roller bearing with healthy and damage status.
Probability Density Distribution
The probability density of acceleration of a bearing in good condition has a Gaussian distribution,whereas a damaged bearing results in non- Gaussian distribution with dominant tails because of arelative increase in the number of high levels of acceleration. First we use the probability densitydistribution function ( )p x of vibration signal. Probability density of the distribution of data sample is
defined as:[ ( ) ] ( ) (ix)prob x x t x dx p x dx
Since, the vibration of a normal bearing consists of the combination of numbers of seperateindependent effects; the central limit theorem indicates that its probability density will tend towardsGaussian curve (bell shaped).The probability density of acceleration of a bearing in good condition has a Gaussian distribution,whereas a deterioation and damaged bearing lead to non-Gaussian distribution with dominant tailsbecause of a relative increase in the number of high levels of acceleration [16]. This theoreticalprediction is confirmed in practice by using EMD decomposed signal; Figure 6 and 7 show theprobability density distribution of a bearing in normal condition and with a case of damaged condition.
Fig. 6. Probability density distribution of Healthy Bearing
Fig. 7. Probability density distribution of Faulty Bearing
1 2 3 4 5 6 7 8 9 10 11 120
0.5
1
1.5
2
2.5
3
3.5
4
4.5
5
IMFs
Ent
ropy
Entropy of Damaged and Healthy Vibration Signal
Healthy BearingDamaged Bearing
-2 -1.5 -1 -0.5 0 0.5 1 1.5 2
1
2
3
4
5
6
7
Data
Den
sity
PDD of IMFs for Healthy Bearing
IMF1IMF2IMF3IMF4IMF5
-3 -2 -1 0 1 2 30
1
2
3
4
5
6
7
Data
Dens
ity
PDD of IMFs for Damaged Bearing
IMF1IMF2IMF3IMF4IMF5

National Conference on Emerging Trends in Science, Technology and Management, 11-12 Nov 2017, ISBN: 978-93-5281-325-4 Page 166
3. CONCLUSION
EMD and PDD analysis has been carried out in this paper. First, EMD was utilized to preprocessdifferent types of vibration signals. Then PDD was used on the preprocessed data in order to determinethe work condition of roller bearing. When the work condition of roller bearing changes, the EMDenergy entropy varies as well, this indicates that the energy of each frequency component changeswhen the roller bearing with a different fault is operating. Therefore, the energy of each IMFcomponent is verified by the PDD to identify the work condition of the roller bearing.
ACKNOWLEDGMENT
This work is supported by Technical Education Quality Improvement Programme–II (TEQIP- II), aprogram of the government of India. The authors would like to thank the Case Western ReserveUniversity for providing free access to the bearing vibration experimental data from their website.
REFERENCES[1.] R. Mehrjou, N. Mariun, and M. H. Marhaban, “Rotor fault condition monitoring techniques for squirrel-
cage induction machine — A review,” Mech. Syst. Signal Process., vol. 25, no. 8, pp. 2827–2848, 2011.[2.] K. S. J. Ã, D. Lin, and D. Banjevic, “A review on machinery diagnostics and prognostics implementing
condition-based maintenance,” vol. 20, pp. 1483–1510, 2006.[3.] M. Tsypkin, “Induction Motor Condition Monitoring : Vibration Analysis Technique - a Practical
Implementation,” History, pp. 406–411, 2011.[4.] J. T. Davis and R. a. Bryant, “NEMA induction motor vibration measurement: a comparison of methods
with analysis,” Ind. Appl. Soc. 40th Annu. Pet. Chem. Ind. Conf., pp. 205–209, 1993.[5.] G. Dalpiaz and a. Rivola, “Condition Monitoring and Diagnostics in Automatic Machines: Comparison
of Vibration Analysis Techniques,” Mech. Syst. Signal Process., vol. 11, no. 1, pp. 53–73, Jan. 1997.[6.] R. Randall and J. Antoni, “Rolling element bearing diagnostics—A tutorial,” Mech. Syst. Signal
Process., vol. 25, pp. 485–520, 2011.[7.] R. B. W. Heng and M. J. M. Nor, “Statistical Analysis of Sound and Vibration Signals for Monitoring
Rolling Element Bearing Condition,” Science (80-. )., vol. 53, no. 1, 1998.[8.] S. A. S. Al Kazzaz and G. . Singh, “Experimental investigations on induction machine condition
monitoring and fault diagnosis using digital signal processing techniques,” Electr. Power Syst. Res., vol.65, no. 3, pp. 197–221, Jun. 2003.
[9.] N. Tandon and A. Choudhury, “A review of vibration and acoustic measurement methods for thedetection of defects in rolling element bearings,” vol. 32, no. 1999, pp. 469–480, 2000.
[10.] N.E. Huang, “The empirical mode decomposition and the Hilbert spectrum for nonlinear and non-stationary time series analysis,” Proceedings of the Royal Society of London Series A 454, pp. 903–995,1998.
[11.] Case Western Reserve University, Bearing data center [online],Available:URL:http://www.eecs.cwru.edu/laboratory/bearing/download. html, 2011.
[12.] N.E. Huang, Z. Shen, S.R. Long, “A new view of nonlinear water waves: the Hilbert spectrum,” AnnualReviews of Fluid Mechanics, vol. 3,pp. 417–457, 1999.
[13.] P.W. Tse, Y.H. Peng, R. Yam, Wavelet analysis and envelope detection for rolling element bearing forrolling element bearing fault diagnosis-their affectivities and flexibilities, Journal of Vibration andAcoustic, vol. 123, pp. 303–310, 2001.
[14.] Y. Y. Ã and C. Junsheng, “ARTICLE IN PRESS A roller bearing fault diagnosis method based on EMDenergy entropy and ANN,” vol. 294, pp. 269–277, 2006.
[15.] M. Tsypkin, “Induction Motor Condition Monitoring : Vibration Analysis Technique - a PracticalImplementation,” History, pp. 406–411, 2011.
[16.] R. A. Collacott, Mechanical fault diagnosis and condition monitoring, London: Chapman and Hall ,1977.
National Conference on Emerging Trends in Science, Technology and Management, 11-12 Nov 2017, ISBN: 978-93-5281-325-4 Page 167
MECHANICAL FAULT IDENTIFICATION OF ANINDUCTION MOTOR USING VIBRATION SIGNAL
Sudhir AgrawalDepartment of Electrical Engineering, MMMUT, Gorakhpur, India
Email:[email protected] Pudel
Department of Electronics Engineering, Buddha Institute of Technology, Gorakhpur, IndiaDr. V. K. Giri
Electrical Engineering, Madan Mohan Malaviya University of Technology, Gorakhpur-273010, India Email:[email protected]
1. INTRODUCTIONIn induction motor ball bearings are among the most important part which need to monitor. Accordingto the motor Reliability working group and investigation carried by the Electric Power ResearchInstitute, the most common failure mode of an induction motor is bearing failure followed by statorwinding failures, and rotor failures. Therefore, proper monitoring of bearing condition is highly costeffective in reducing capital cost.Vibration monitoring is the most widely used and reliable method to detect, and distinguish defects inball bearings. In most machine fault diagnosis and prognosis system, the vibration of the inductionmachine bearings is directly measured by an accelerometer and conducted typically following phases:data acquisition, feature extraction and fault detection or identification.When localized damage in a bearing surface strikes another surface, impact vibrations are generated.The signature of a damaged bearing consists of exponentially decaying ringing that occurs periodicallyat the characteristic defect frequency [1]. For a particular bearing geometry, inner raceway, outerraceway and rolling element fault generate vibration spectra with unique frequency components. Thesefrequencies known as defect frequencies are function of the running speed of the motor and the pitchdiameter to ball diameter ratio of the bearing. The difficulty in the detection of the defect lies in the factthat, the signature of a defective bearing is spread across a wide frequency band and hence can beeasily masked by noise and low frequency effects. Fourier transform (FT) was used to perform suchanalysis [2]-[4]. If the level of random vibration and noise are high, the result may mislead about actualcondition of the bearings so that noise and random vibration may be suppressed from the vibrationsignal using signal processing technique such as filtering, averaging, correlation, convolution, etc.Advance signal processing methods, including wavelet transform (WT) and Hilbert transformation(HT), have been presented to extract vibration features in recent years [5]-[9]. When a local fault existsin a ball bearing, the surface is locally affected and the vibration signals exhibit modulation [10].Therefore, it is necessary to implement filtering and demodulation so as to obtain fault sensitivefeatures from the raw signals. At present, the Hilbert transform has been widely used as a demodulationmethod in vibration-based fault diagnosis [11]-[12]. It has a quick algorithm and can extract theenvelope of the vibration signal. In addition, WT which can provide the useful information fromvibration signal in time domain with different bands of frequencies [12]-[14], which can be treated asband-pass filters. Further we can calculate the energy of each signal components and select the higherenergy signal component for the envelope detection.This paper is organized as follows. In section 2nd, wavelet and Hilbert transforms are brieflyintroduced. Section 3rd a method is proposed for detection of bearing fault. In section 4th, the realvibration data of induction machine bearing is used and evaluate the proposed method.
2. THEORETICAL BACKGROUND
Time Domain AnalysisTime-domain analysis is a useful feature extraction tool for condition monitoring and fault diagnosis ofelectrical motors. Many techniques can be used for time-domain analysis [15]. RMS value, Kurtosisand Skewness values is good indicator of faulty and healthy condition of mechanical fault in inductionmachine. The RMS level increase in fault severity level, the Skewness is found as the consistentparameter with respect to fault severity, and the Kurtosis value increases significantly up to low levelball defect however it decreases back to value corresponding to healthy case. Fig. 1(a-b) Shows themeasured vibration signal of a bearing and the Table I shows calculated time domain parameter whichis significantly high for the faulty to healthy condition.
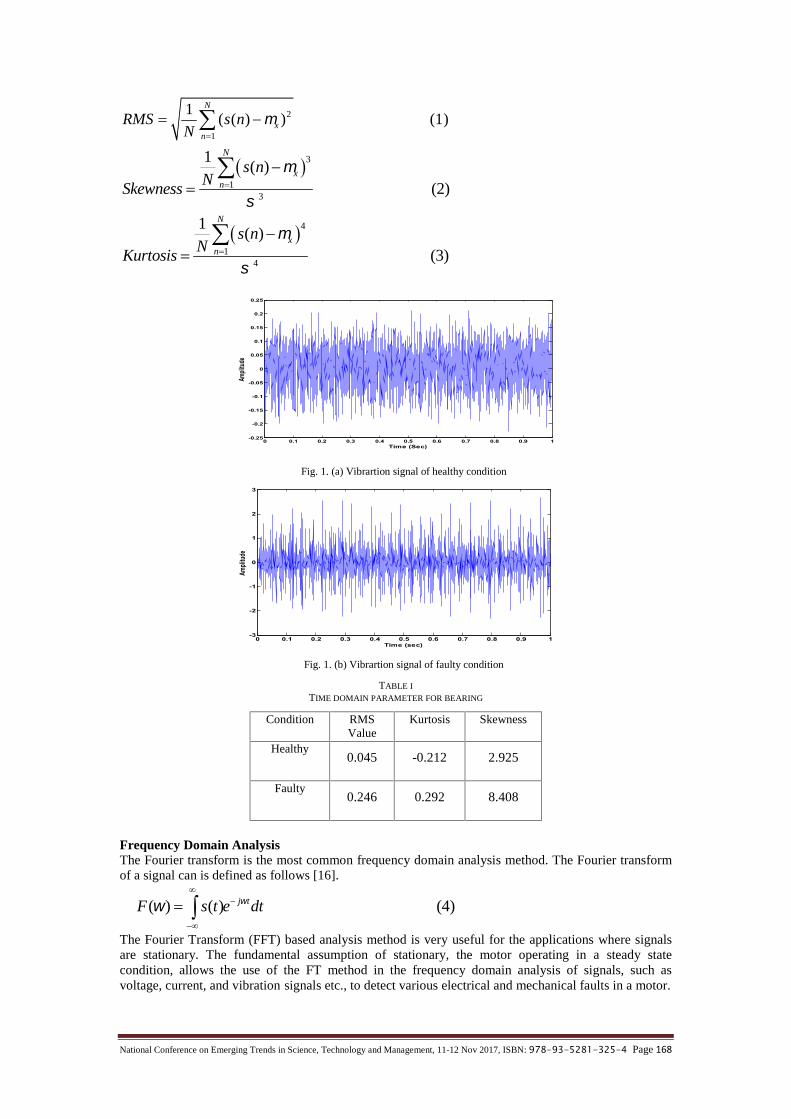
National Conference on Emerging Trends in Science, Technology and Management, 11-12 Nov 2017, ISBN: 978-93-5281-325-4 Page 168
2
1
1( ( ) ) (1)
N
xn
RMS s nN
31
3
1( )
(2)
N
xn
s nN
Skewness
41
4
1( )
(3)
N
xn
s nN
Kurtosis
Fig. 1. (a) Vibrartion signal of healthy condition
Fig. 1. (b) Vibrartion signal of faulty condition
TABLE I
TIME DOMAIN PARAMETER FOR BEARING
Condition RMSValue
Kurtosis Skewness
Healthy0.045 -0.212 2.925
Faulty0.246 0.292 8.408
Frequency Domain AnalysisThe Fourier transform is the most common frequency domain analysis method. The Fourier transformof a signal can is defined as follows [16].
( ) ( ) (4)j tF s t e dt
The Fourier Transform (FFT) based analysis method is very useful for the applications where signalsare stationary. The fundamental assumption of stationary, the motor operating in a steady statecondition, allows the use of the FT method in the frequency domain analysis of signals, such asvoltage, current, and vibration signals etc., to detect various electrical and mechanical faults in a motor.
0 0.1 0.2 0.3 0.4 0.5 0.6 0.7 0.8 0.9 1-0.25
-0.2
-0.15
-0.1
-0.05
0
0.05
0.1
0.15
0.2
0.25
Time (Sec)
Ampli
tude
0 0.1 0.2 0.3 0.4 0.5 0.6 0.7 0.8 0.9 1-3
-2
-1
0
1
2
3
Time (sec)
Ampli
tude
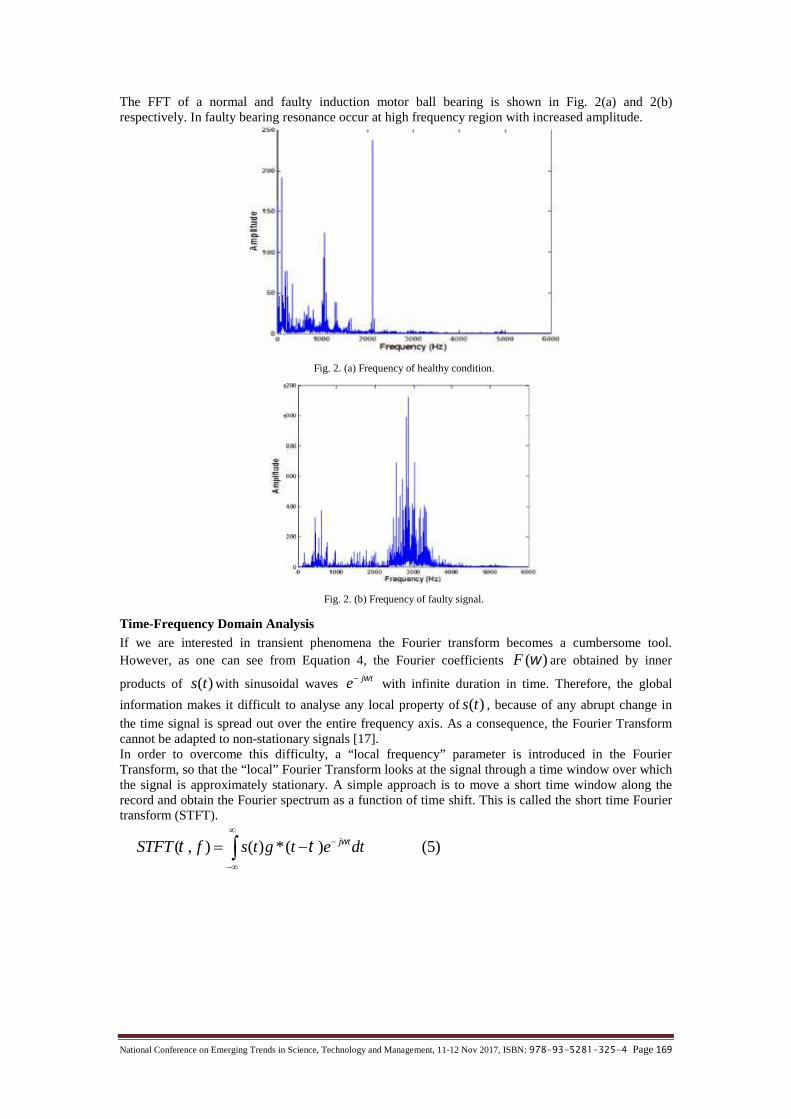
National Conference on Emerging Trends in Science, Technology and Management, 11-12 Nov 2017, ISBN: 978-93-5281-325-4 Page 169
The FFT of a normal and faulty induction motor ball bearing is shown in Fig. 2(a) and 2(b)respectively. In faulty bearing resonance occur at high frequency region with increased amplitude.
Fig. 2. (a) Frequency of healthy condition.
Fig. 2. (b) Frequency of faulty signal.
Time-Frequency Domain AnalysisIf we are interested in transient phenomena the Fourier transform becomes a cumbersome tool.However, as one can see from Equation 4, the Fourier coefficients ( )F are obtained by inner
products of ( )s t with sinusoidal waves j te with infinite duration in time. Therefore, the global
information makes it difficult to analyse any local property of ( )s t , because of any abrupt change in
the time signal is spread out over the entire frequency axis. As a consequence, the Fourier Transformcannot be adapted to non-stationary signals [17].In order to overcome this difficulty, a “local frequency” parameter is introduced in the FourierTransform, so that the “local” Fourier Transform looks at the signal through a time window over whichthe signal is approximately stationary. A simple approach is to move a short time window along therecord and obtain the Fourier spectrum as a function of time shift. This is called the short time Fouriertransform (STFT).
( , ) ( ) *( ) (5)j tSTFT f s t g t e dt
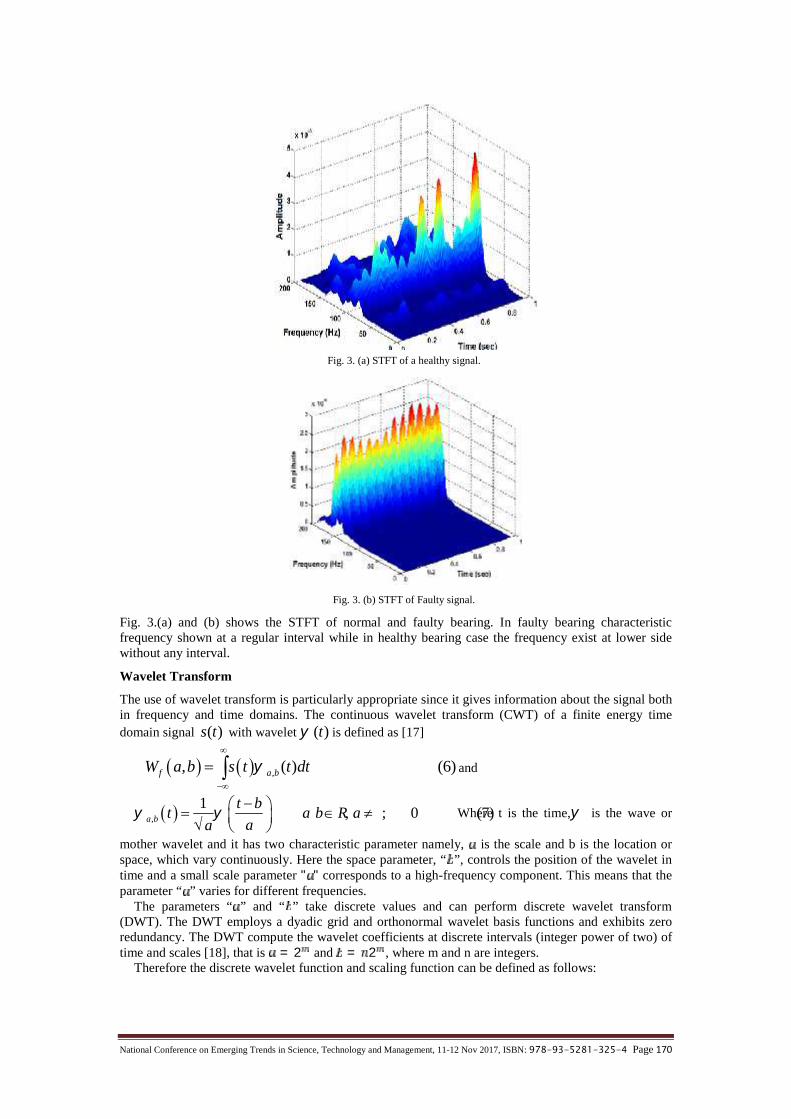
National Conference on Emerging Trends in Science, Technology and Management, 11-12 Nov 2017, ISBN: 978-93-5281-325-4 Page 170
Fig. 3. (a) STFT of a healthy signal.
Fig. 3. (b) STFT of Faulty signal.
Fig. 3.(a) and (b) shows the STFT of normal and faulty bearing. In faulty bearing characteristicfrequency shown at a regular interval while in healthy bearing case the frequency exist at lower sidewithout any interval.
Wavelet Transform
The use of wavelet transform is particularly appropriate since it gives information about the signal bothin frequency and time domains. The continuous wavelet transform (CWT) of a finite energy timedomain signal ( )s t with wavelet ( )t is defined as [17]
, , ( ) (6)f a bW a b s t t dt
and
,
1 , ; 0 (7)a b
t bt a b R a
aa
Where t is the time, is the wave or
mother wavelet and it has two characteristic parameter namely, is the scale and b is the location orspace, which vary continuously. Here the space parameter, “ ”, controls the position of the wavelet intime and a small scale parameter " " corresponds to a high-frequency component. This means that theparameter “ ” varies for different frequencies.
The parameters “ ” and “ ” take discrete values and can perform discrete wavelet transform(DWT). The DWT employs a dyadic grid and orthonormal wavelet basis functions and exhibits zeroredundancy. The DWT compute the wavelet coefficients at discrete intervals (integer power of two) oftime and scales [18], that is = 2 and = 2 , where m and n are integers.
Therefore the discrete wavelet function and scaling function can be defined as follows:
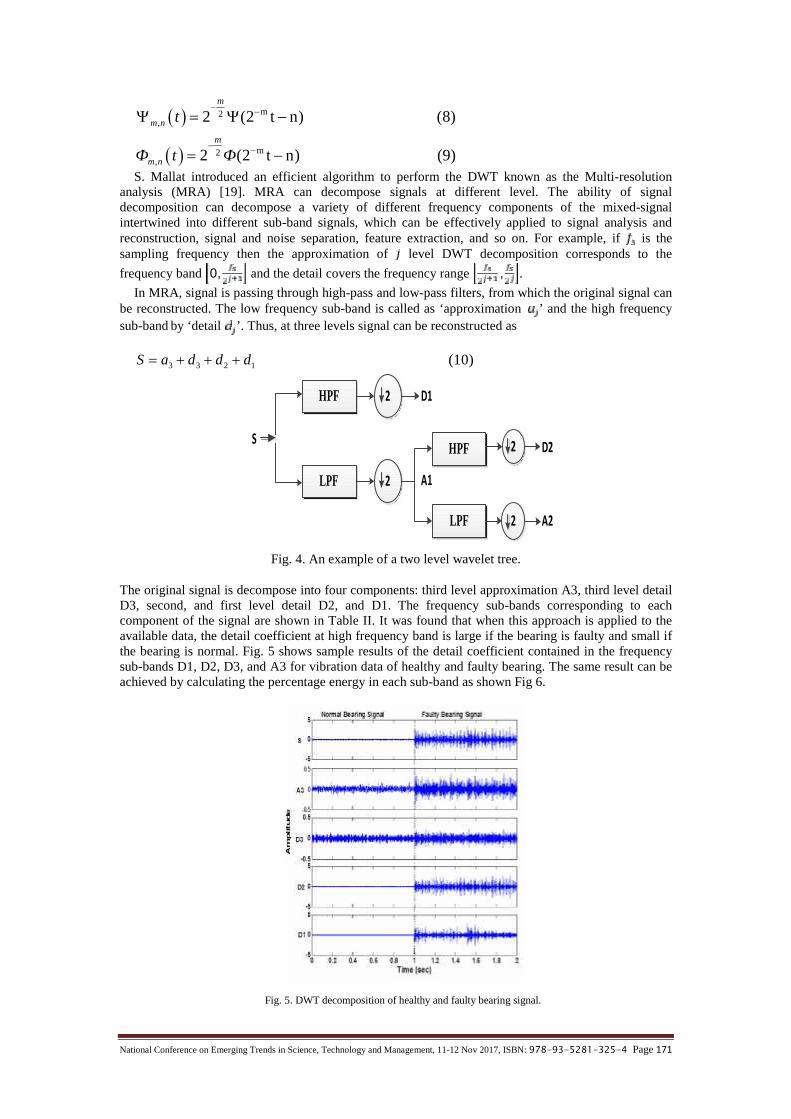
National Conference on Emerging Trends in Science, Technology and Management, 11-12 Nov 2017, ISBN: 978-93-5281-325-4 Page 171
m2,
m2,
2 (2 t n) (8)
2 (2 t n) (9)
m
m n
m
m n
t
Ф t Ф
S. Mallat introduced an efficient algorithm to perform the DWT known as the Multi-resolution
analysis (MRA) [19]. MRA can decompose signals at different level. The ability of signaldecomposition can decompose a variety of different frequency components of the mixed-signalintertwined into different sub-band signals, which can be effectively applied to signal analysis andreconstruction, signal and noise separation, feature extraction, and so on. For example, if is thesampling frequency then the approximation of level DWT decomposition corresponds to the
frequency band 0, and the detail covers the frequency range , .
In MRA, signal is passing through high-pass and low-pass filters, from which the original signal canbe reconstructed. The low frequency sub-band is called as ‘approximation ’ and the high frequencysub-band by ‘detail ’. Thus, at three levels signal can be reconstructed as
3 3 2 1 (10)S a d d d
HPF
LPF
HPF
LPF
2
2
2
2
S
D1
A1
D2
A2
Fig. 4. An example of a two level wavelet tree.
The original signal is decompose into four components: third level approximation A3, third level detailD3, second, and first level detail D2, and D1. The frequency sub-bands corresponding to eachcomponent of the signal are shown in Table II. It was found that when this approach is applied to theavailable data, the detail coefficient at high frequency band is large if the bearing is faulty and small ifthe bearing is normal. Fig. 5 shows sample results of the detail coefficient contained in the frequencysub-bands D1, D2, D3, and A3 for vibration data of healthy and faulty bearing. The same result can beachieved by calculating the percentage energy in each sub-band as shown Fig 6.
Fig. 5. DWT decomposition of healthy and faulty bearing signal.
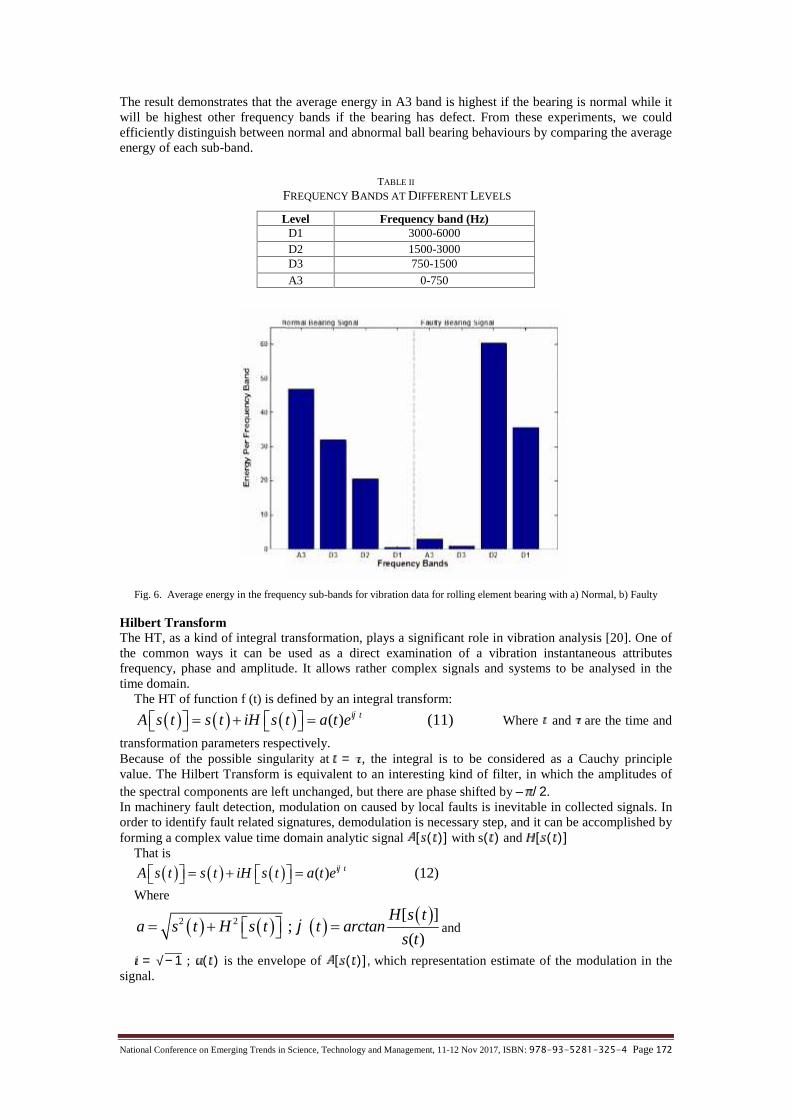
National Conference on Emerging Trends in Science, Technology and Management, 11-12 Nov 2017, ISBN: 978-93-5281-325-4 Page 172
The result demonstrates that the average energy in A3 band is highest if the bearing is normal while itwill be highest other frequency bands if the bearing has defect. From these experiments, we couldefficiently distinguish between normal and abnormal ball bearing behaviours by comparing the averageenergy of each sub-band.
TABLE II
FREQUENCY BANDS AT DIFFERENT LEVELS
Level Frequency band (Hz)D1 3000-6000D2 1500-3000D3 750-1500
A3 0-750
Fig. 6. Average energy in the frequency sub-bands for vibration data for rolling element bearing with a) Normal, b) Faulty
Hilbert TransformThe HT, as a kind of integral transformation, plays a significant role in vibration analysis [20]. One ofthe common ways it can be used as a direct examination of a vibration instantaneous attributesfrequency, phase and amplitude. It allows rather complex signals and systems to be analysed in thetime domain.
The HT of function f (t) is defined by an integral transform:
( ) (11)i tA s t s t iH s t a t e Where and are the time and
transformation parameters respectively.Because of the possible singularity at = , the integral is to be considered as a Cauchy principlevalue. The Hilbert Transform is equivalent to an interesting kind of filter, in which the amplitudes ofthe spectral components are left unchanged, but there are phase shifted by – /2.In machinery fault detection, modulation on caused by local faults is inevitable in collected signals. Inorder to identify fault related signatures, demodulation is necessary step, and it can be accomplished byforming a complex value time domain analytic signal [ ( )] with s( ) and [ ( )]
That is
(12( )) i tA s t s t iH s t a t e Where
2 2 [ ] ;
( )
H s ta t H s t t a
ss rctan
t and= √−1 ; ( ) is the envelope of [ ( )], which representation estimate of the modulation in the
signal.
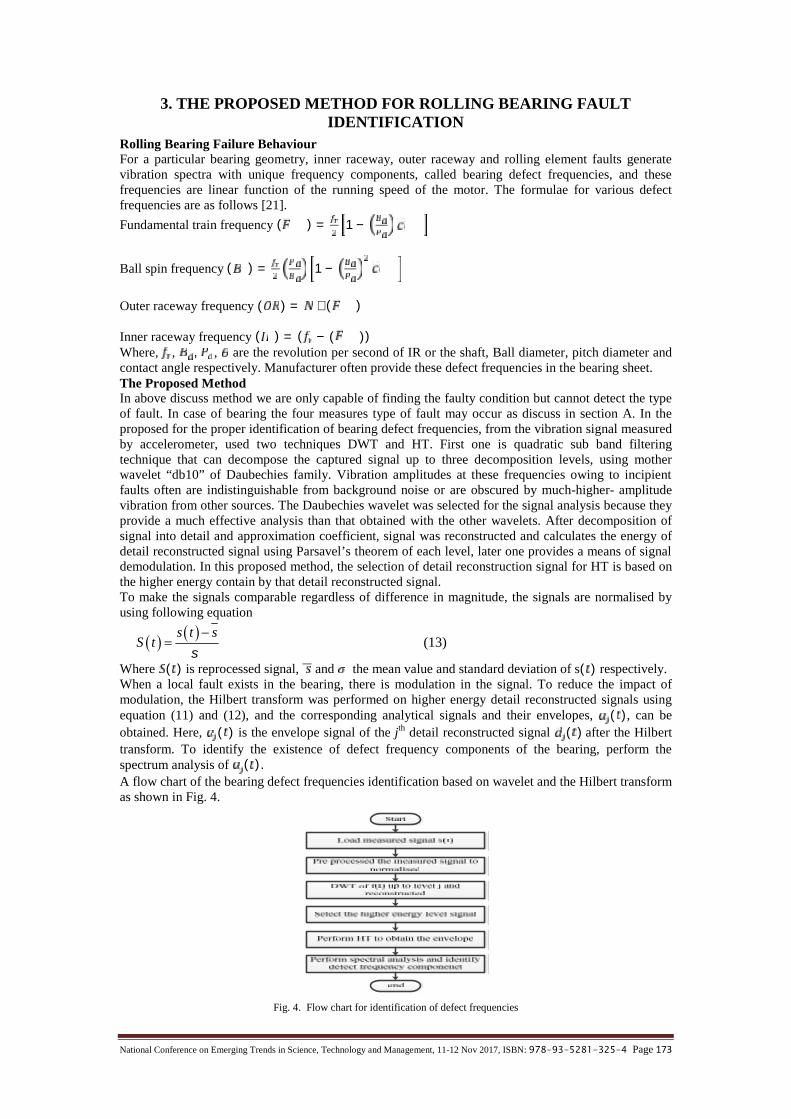
National Conference on Emerging Trends in Science, Technology and Management, 11-12 Nov 2017, ISBN: 978-93-5281-325-4 Page 173
3. THE PROPOSED METHOD FOR ROLLING BEARING FAULTIDENTIFICATION
Rolling Bearing Failure BehaviourFor a particular bearing geometry, inner raceway, outer raceway and rolling element faults generatevibration spectra with unique frequency components, called bearing defect frequencies, and thesefrequencies are linear function of the running speed of the motor. The formulae for various defectfrequencies are as follows [21].
Fundamental train frequency ( ) = 1 −Ball spin frequency ( ) = 1 −Outer raceway frequency ( ) = ∗ ( )Inner raceway frequency ( ) = ( − ( ))Where, , , , are the revolution per second of IR or the shaft, Ball diameter, pitch diameter andcontact angle respectively. Manufacturer often provide these defect frequencies in the bearing sheet.The Proposed MethodIn above discuss method we are only capable of finding the faulty condition but cannot detect the typeof fault. In case of bearing the four measures type of fault may occur as discuss in section A. In theproposed for the proper identification of bearing defect frequencies, from the vibration signal measuredby accelerometer, used two techniques DWT and HT. First one is quadratic sub band filteringtechnique that can decompose the captured signal up to three decomposition levels, using motherwavelet “db10” of Daubechies family. Vibration amplitudes at these frequencies owing to incipientfaults often are indistinguishable from background noise or are obscured by much-higher- amplitudevibration from other sources. The Daubechies wavelet was selected for the signal analysis because theyprovide a much effective analysis than that obtained with the other wavelets. After decomposition ofsignal into detail and approximation coefficient, signal was reconstructed and calculates the energy ofdetail reconstructed signal using Parsavel’s theorem of each level, later one provides a means of signaldemodulation. In this proposed method, the selection of detail reconstruction signal for HT is based onthe higher energy contain by that detail reconstructed signal.To make the signals comparable regardless of difference in magnitude, the signals are normalised byusing following equation
(13)
s tS t
s
Where ( ) is reprocessed signal, and the mean value and standard deviation of s( ) respectively.When a local fault exists in the bearing, there is modulation in the signal. To reduce the impact ofmodulation, the Hilbert transform was performed on higher energy detail reconstructed signals usingequation (11) and (12), and the corresponding analytical signals and their envelopes, ( ), can beobtained. Here, ( ) is the envelope signal of the jth detail reconstructed signal ( ) after the Hilberttransform. To identify the existence of defect frequency components of the bearing, perform thespectrum analysis of ( ).A flow chart of the bearing defect frequencies identification based on wavelet and the Hilbert transformas shown in Fig. 4.
Fig. 4. Flow chart for identification of defect frequencies

National Conference on Emerging Trends in Science, Technology and Management, 11-12 Nov 2017, ISBN: 978-93-5281-325-4 Page 174
4. RESULT AND DISCUSSION
Description of ExperimentVibration signals provided by the CWRU (Case Western Reserve University) bearing data center [22],collected a 2 HP motor fixed in a test stand is used for investigation. Vibration data is acquired usingaccelerometers, which are attached in to the housing with magnetic basis. Digital data us sampled at12,000 samples per second and recorded using 16 channel DAT recorders. Motor bearings were seededwith faults using electro-discharge machining (EDM). In this paper, two set of data were obtain fromexperiment system:
1. Under normal condition.2. With inner raceway fault.
The selected fault is 0.5334 mm in diameter on full load and speed during the experiment near to 1754rpm. The time domain vibration signals considered for the analysis are collected for four differentcondition of the bearing at full load is shown in Fig. 5.
Experimental ResultListed in Table III, IV shows the specification and the main defect frequencies based on geometricstructure of the bearing respectively . The vibration data analyzed for this case is for a faulty bearinglocated at the drive end side at full load. In order to evaluate the proposed method, FFT is taken of rawsignal with inner race defect is shown in Fig. 2(b) and find that, it is very difficult to identify the defectfrequency so that, the proposed method applied to the bearing vibration data and result shown in Fig. 7and Fig. 8. The location of the frequencies peaks can be used to distinguish between healthy and faultybehaviors.The shaft rotating frequency is about 29 Hz on full load so that at normal condition the only peaks existat multiple integral of shaft rotation frequency as shown in Fig. 7.From Fig. 8, it can be seen that the dominating frequency are 158 Hz and its multiple integral which isidentified as the IR. Such a frequency indicates the existence of a localized defect on inner raceway.
TABLE III: BALL BEARING SPECIFICATION
Specification Value
Number of rolling element, N 9
Diameter of rolling element, Bd 7.940 mm
Pitch diameter of bearing, Pd 39.039 mm
Contact angle, θ 0
TABLE IV: CHARACTERISTICS OF BALL BEARING
Defect Frequencies Value
Running speed frequency, ( ) 29.23 Hz
Fundamental train frequency, ( ) 11.64 Hz
Ball spin frequency, ( ) 68.89 Hz
Outer raceway frequency, ( ) 104.76 Hz
Inner raceway frequency, ( ) 158.34 Hz
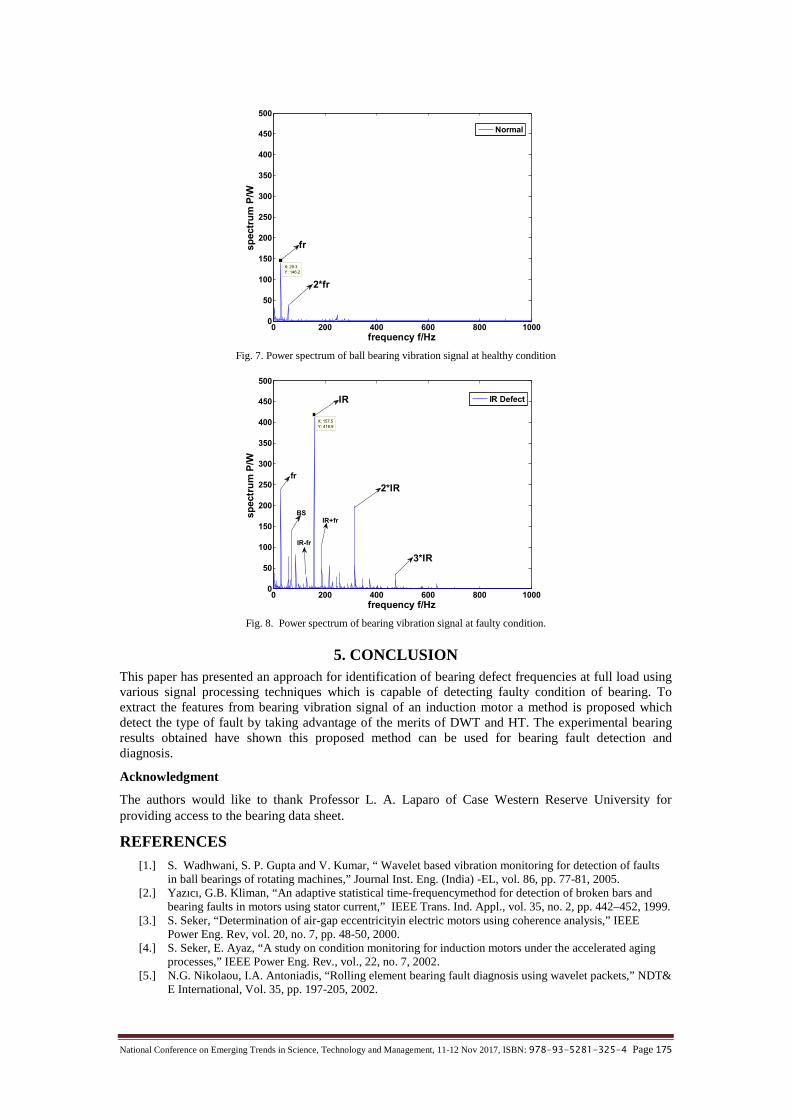
National Conference on Emerging Trends in Science, Technology and Management, 11-12 Nov 2017, ISBN: 978-93-5281-325-4 Page 175
Fig. 7. Power spectrum of ball bearing vibration signal at healthy condition
Fig. 8. Power spectrum of bearing vibration signal at faulty condition.
5. CONCLUSIONThis paper has presented an approach for identification of bearing defect frequencies at full load usingvarious signal processing techniques which is capable of detecting faulty condition of bearing. Toextract the features from bearing vibration signal of an induction motor a method is proposed whichdetect the type of fault by taking advantage of the merits of DWT and HT. The experimental bearingresults obtained have shown this proposed method can be used for bearing fault detection anddiagnosis.
Acknowledgment
The authors would like to thank Professor L. A. Laparo of Case Western Reserve University forproviding access to the bearing data sheet.
REFERENCES[1.] S. Wadhwani, S. P. Gupta and V. Kumar, “ Wavelet based vibration monitoring for detection of faults
in ball bearings of rotating machines,” Journal Inst. Eng. (India) -EL, vol. 86, pp. 77-81, 2005.[2.] Yazıcı, G.B. Kliman, “An adaptive statistical time-frequencymethod for detection of broken bars and
bearing faults in motors using stator current,” IEEE Trans. Ind. Appl., vol. 35, no. 2, pp. 442–452, 1999.[3.] S. Seker, “Determination of air-gap eccentricityin electric motors using coherence analysis,” IEEE
Power Eng. Rev, vol. 20, no. 7, pp. 48-50, 2000.[4.] S. Seker, E. Ayaz, “A study on condition monitoring for induction motors under the accelerated aging
processes,” IEEE Power Eng. Rev., vol., 22, no. 7, 2002.[5.] N.G. Nikolaou, I.A. Antoniadis, “Rolling element bearing fault diagnosis using wavelet packets,” NDT&
E International, Vol. 35, pp. 197-205, 2002.
0 200 400 600 800 10000
50
100
150
200
250
300
350
400
450
500
X: 29.3Y: 146.2
frequency f/Hz
spec
trum
P/W
Normal
fr
2*fr
0 200 400 600 800 10000
50
100
150
200
250
300
350
400
450
500
X: 157.5Y: 418.9
frequency f/Hz
spec
trum
P/W
IR DefectIR
2*IR
3*IR
fr
BSIR+fr
IR-fr

National Conference on Emerging Trends in Science, Technology and Management, 11-12 Nov 2017, ISBN: 978-93-5281-325-4 Page 176
[6.] Michael Feldman, “Hilbert transform in vibration analysis- A tutorial review”, Mechanical Systems andSignal Processing, vol. 25, pp. 735-802, 2011.
[7.] G.K. Singh, Saleh Al Kazzaz Sa’ad Ahmed, “Vibration signal analysis using wavelet transform forisolation and identification of electrical faults in induction machine”, Electric Power Systems Research,vol. 68, pp. 119-136, 2004.
[8.] Serhat Seker, Emine Ayaz, “Feature extraction related to bearing damage in electric motors bywaveletanalysis”, Electric Power Systems Research, vol. 65, pp. 197-221, 2003.
[9.] Hasan Ocak, Kenneth A. Loparo, “Estimation of the running speed and bearing defect frequencies of aninduction motor from vibration data”, Mechanical Systems and Signal Processing, vol. 18, pp. 515-533,2004.
[10.] Antoni, and R.B. Randall, “Differential diagnosis of gear and bearing faults”, Journal of Vibration andAcoustics, vol.124, no.2, pp.65-171, 2002.
[11.] Wang, Q. Miao, X. Fan, and H.Z. Huang, “Rolling element bearing fault detection using an improvedcombination of Hilbert and wavelet transforms.” Journal of Mechanical Science and Technology, vol.23,no.12, pp. 3292-3301, 2009.
[12.] Y. Qin, S. Qin, and Y. Mao, “Reasearch on iterated Hilbert transform and its application in mechanicalfaults diagnosis,” Mechanical Sustem and Signal Processing, vol.22, no.8, pp. 1967-1980, 2008.
[13.] D. Wang, Q. Miao, and R. Kang, “Robust health evaluation of gearbox subject to tooth failurewith wavelet decomposition,” Journal of Sound and Vibration, vol.324, no.3-5, pp. 1141-1157, 2009.
[14.] G. Niu, A. Widodo, J.D. Son, B.S. Yang, D.H. Hwang, and D.S. Kang, “Decision-level fusion based onwavelet decomposition for induction motor fault diagnosis using transient current signal,” ExpertSystems with Applications, vol.35, no.3, pp. 918-928, 2008.
[15.] N. Tandon and A. Choudhury, “A review of vibration and acoustic measurement methods for thedetection of defects in rolling element bearings,” Tribology International, vol. 32, no. 8, pp. 469-480,1999.
[16.] R. Bracewell, “The Fourier transform and its application,” 3rd edition. New York: McGraw-Hill, 1999.[17.] F. Al-Badour, M. Sunar, L. Cheded,” Vibration analysis of rotating machinery using time-frequency
analysis and wavelet technique”, Mechanical System and Signal Processing, vol. 25, pp. 2083-2101,2011.
[18.] Michael Feldman, “Time-varying vibration decomposition and analysis based on the Hilbert transform,”Journal of Sound and Vibration, vol. 295, pp. 518-530, 2006.
[19.] A. Mertins, Signal analysis: wavelets filter banks, time-frequency transforms and applications. JohnWiley & sons Ltd; 1999.
[20.] S. Mallat, Awavelet Tour of Signal Processing, Academic Press, New York, 1997.[21.] V. Wowk, “Machinery Vibration, Measurement and Analysis, McGraw-Hill, New York, 1991.[22.] Case Western Reserve University, Bearing data center [online],
Available:URL:http://www.eecs.cwru.edu/laboratory/bearing/download.htm, 2011.

National Conference on Emerging Trends in Science, Technology and Management, 11-12 Nov 2017, ISBN: 978-93-5281-325-4 Page 177
THE STEM CELLS THERAPY: GATEWAY TO THEWORLD REGENERATIVE MEDICINES AND
THERAPEUTICSPooja Verma, Arjun Kumar, Saba Khan
Department of BiotechnologyAshoka Institute of Technology & Management, Varanasi, Uttar Pradesh
Abstract - Stem cells are a population of immature tissue precursor cells capable of self-renewal andprovision of de novo and/or replacement cells for many tissues.[1] Basic and clinical research accomplishedduring the last few years on embryonic, fetal, amniotic, umbilical cord blood, and adult stem cells hasconstituted a revolution in regenerative medicine and cancer therapies by providing the possibility ofgenerating multiple therapeutically useful cell types. The concept of regenerative medicine using the body’sown stem cells and growth factors to repair tissues become a reality as new basic science works and initialclinical experiences have “teamed-up” in an effort to develop alternative therapeutic strategies to treat thediseases.[1] Now, more sophisticated pre-transplantation manipulations and material carriers dramaticallyimprove the survival, engraftment, and fate control of transplanted stem cells and their ultimate clinicalutility. This article focuses on a subgroup of these applications — the use of embryonic pluripotent or adultmultipotent stem cells to create human tissues ex vivo for transplantation into patients with medicalconditions caused by the degeneration or injury of cells, tissues, and organs.
1. WHY ONLY STEM CELLS?
From fertilization to the birth of an organism development is acutely controlled by the process ofsequential changes. The hallmarks of this process are the conversion of groups of multipotent cells tocells that form differentiated, highly specialized, and very narrowly functioning tissues. The structuresand functions of heart, lung, liver, kidney, skeletal muscles, bones, etc., are all uniquely different, andeach is connected to the other by neural and vascular networks for their cooperative and coordinatedfunctioning. For emphasis, it is also quite obvious that the individual genetic information specificallydetermines the timing, the structure, and the functioning of these groups of cells within theirdifferentiated tissues and organs [4,5,6,7,8,9,10].Stem cell biology have provoked great interest and hold high therapeutic promise based on thepossibility of stimulating their ex vivo and in vivo expansion and differentiation into functionalprogeny that could regenerate the injured tissues/organs in humans.3 Intense research on stem cellsduring the last decades has provided important information on developmental, morphological, andphysiological processes that govern tissue and organ formation, maintenance, regeneration, and repairafter injuries [3-4].In addition to stem cells from embryos, fetal tissues, amniotic membrane, and umbilical cord (UC), themultipotent adult stem cells with a self-renewal capacity and multilineage differentiation potential havebeen identified within specific niches in most human tissues/organs.[3] Among them bone marrow(BM), heart, brain, adipose tissues, muscles, skin, eyes, kidneys, lungs, liver, gastrointestinal tract,pancreas, breast, ovaries, prostate, and testis are included.All the stem cells e.g. embryonic, fetal, adult, mesynchemal and induced pluripotent exhibit commonproperties including- self-renewal capacity and potential to generate differentiated cell progenitorswhich may of different lineages under simplified culture conditions in vitro and after transplantation inthe host in vivo.Figure 1: Scheme showing the potential therapeutic applications of embryonic and tissue-specific adult stem cellsin cellular and gene therapies. The pluripotent ESC types derived from blastocyst stage during embryonicdevelopment and multipotent tissue-resident adult stem cells arising from endodermal, mesodermal, andectodermal germ layers are shown. The pathological disorders and diseases that might benefit the embryonic andtissue-resident adult stem cell-based therapies are indicated. Abbreviations: BASCs, bronchioalveolar stem cells;bESCs, bulge epithelial stem cells; CESCs, corneal epithelial stem cells; CSCs, cardiac stem cells; eNCSCs,epidermal neural crest stem cells; ESCs, embryonic stem cells; EPC, endothelial progenitor cell; HOCs, hepaticoval cells; HSCs, hematopoetic stem cells; KSCs, keratinocyte stem cells; MSCs, mesenchymal stem cells; NSCs,neuronal stem cells; PSCs, pancreatic stem cells; RSCs, retinal stem cells; SKPs, skin-derived precursors [3].
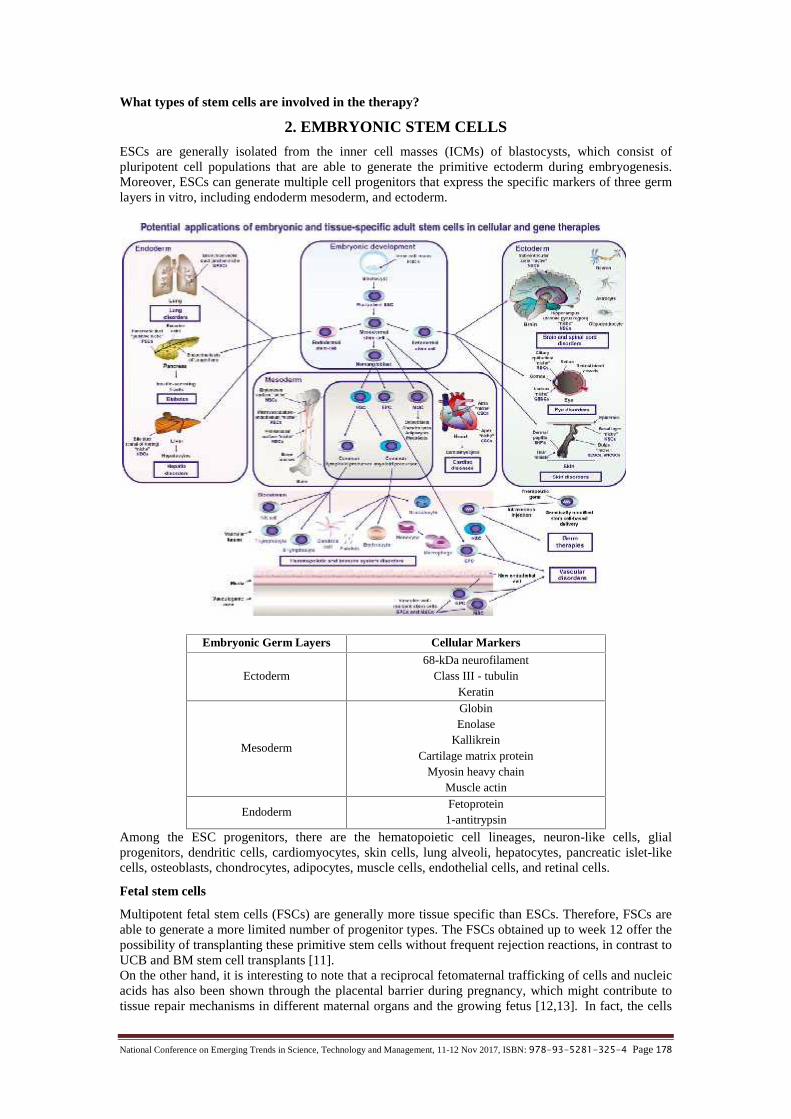
National Conference on Emerging Trends in Science, Technology and Management, 11-12 Nov 2017, ISBN: 978-93-5281-325-4 Page 178
What types of stem cells are involved in the therapy?
2. EMBRYONIC STEM CELLS
ESCs are generally isolated from the inner cell masses (ICMs) of blastocysts, which consist ofpluripotent cell populations that are able to generate the primitive ectoderm during embryogenesis.Moreover, ESCs can generate multiple cell progenitors that express the specific markers of three germlayers in vitro, including endoderm mesoderm, and ectoderm.
Embryonic Germ Layers Cellular Markers
Ectoderm68-kDa neurofilament
Class III - tubulinKeratin
Mesoderm
GlobinEnolase
KallikreinCartilage matrix protein
Myosin heavy chainMuscle actin
EndodermFetoprotein1-antitrypsin
Among the ESC progenitors, there are the hematopoietic cell lineages, neuron-like cells, glialprogenitors, dendritic cells, cardiomyocytes, skin cells, lung alveoli, hepatocytes, pancreatic islet-likecells, osteoblasts, chondrocytes, adipocytes, muscle cells, endothelial cells, and retinal cells.
Fetal stem cells
Multipotent fetal stem cells (FSCs) are generally more tissue specific than ESCs. Therefore, FSCs areable to generate a more limited number of progenitor types. The FSCs obtained up to week 12 offer thepossibility of transplanting these primitive stem cells without frequent rejection reactions, in contrast toUCB and BM stem cell transplants [11].On the other hand, it is interesting to note that a reciprocal fetomaternal trafficking of cells and nucleicacids has also been shown through the placental barrier during pregnancy, which might contribute totissue repair mechanisms in different maternal organs and the growing fetus [12,13]. In fact, the cells
National Conference on Emerging Trends in Science, Technology and Management, 11-12 Nov 2017, ISBN: 978-93-5281-325-4 Page 179
from the growing fetus appear to be able to cross over the placenta and enter the mother’s bloodstreamand vice versa; the maternal cells can also pass into fetal circulation and persist into adult life, aphenomenon known as microchimerism. Hence, the fetal cells that are transferred to the mother duringgestation can migrate to different damaged peripheral tissues, such as the liver and skin, or can crossthe blood-brain barrier to enter damaged areas of the brain, where they actively contribute to themother’s tissue repair by generating mature cell progenitors [12-14].This reflects the high plasticity and migratory potential of FSCs, which represent major advantages fortheir use in transplantation. One of the particular therapeutic advantages of FSCs as compared withESCs is the fact that FSCs do not form teratomas in vivo [11].
Induced pluripotent stem cells
The term pluripotency has been assigned to a variety of cell types with a wide range of functionalcapacities. Pluripotent describes a cell that can give rise to an entire organism, generating every celltype within that organism. The limited numbers of stem cell lines that were approved for researchlacked the diversity necessary to address some of the most compelling questions, particularly thoserelated to modeling and treating disease [15].Despite the many hindrances to the study and derivation of human ES cells over the past decade, in2006 Takahashi and Yamanaka announced the successful derivation of iPS cells from adult mousefibroblast through the ectopic co-expression of only four genes [16]. Those four factors that weresufficient to reprogram adult fibroblasts into iPS cells: OCT4 (also known as POU5F1), SOX2,Krüppel-like factor 4 (KLF4) and c-MYC [17-18].Yamanaka’s intention was to derive an alternative source of pluripotent stem cells with the same rangeof functions as ES cells but offering even greater potential for clinical use. This historic contributioninspired an astonishing flurry of follow-on studies, with successful reprogramming quickly translatedto human fibroblasts [17-18] and then to a wide variety of other cell types, including pancreatic βcells16, neural stem cells [19-20] mature β cells, [21] stomach and liver cells, [22] melanocytes, [23]adipose stem cells [24] and keratinocytes,[25] demonstrating the seemingly universal capacity to altercellular identity.In landmark study from Jaenisch’s research group, Wernig and colleagues derived dopaminergicneurons from iPS cells that, when implanted into the brain, became functionally integrated andimproved the condition of a rat model of Parkinson’s disease [26].The successful implantation and functional recovery in this model is evidence of the therapeutic valueof pluripotent stem cells for cell-replacement therapy in the brain is one of the most promising areas forthe future of iPS-cell applications.
Mesynchemal stem cells
MSCs, also called mesenchymal stromal cells, are a subset of non-hematopoietic adult stem cells thatoriginate from the mesoderm. They possess self-renewal ability and multilineage differentiation intonot only mesoderm lineages, such as chondrocytes, osteocytes and adipocytes, but also ectodermiccells and endodermic cells.BM-MSC also exerts strong therapeutic effects in the musculoskeletal system. They have been shownto be effective in the regeneration of periodontal tissue defects, diabetic critical limb ischemia, bonedamage caused by osteonecrosis and burn-induced skin defects [27-28].Shimizu’s group standardized transdifferentiation of MSCs into keratinocytes in culture andinvestigated whether MSCs could migrate and engraft into wounded skin in murine model. They foundthat intravenously injected MSCs transdifferentiated into keratinocytes, endothelial cells and pericytesat the wound site, thereby accelerating the repair process [29].Similarly, transplantation of human MSCs in hyperglycaemic NOD/SCID mice resulted in homing toislets associated with an increase in pancreatic islets and mouse insulin production [30]. No humaninsulin was detected in blood, and the reduction in blood glucose levels was mainly a result ofstimulation of islets cells,[30-31] similar to that observed for neural stem cells in mice, as well asinhibition of T-cell responses against the new cells [32]. These studies bring to light the potential ofMSCs to migrate to injury site and modify the microenvironment, thereby modulating the immuneresponse and facilitating tissue repair by stimulating endogenous stem/progenitor cells [35].
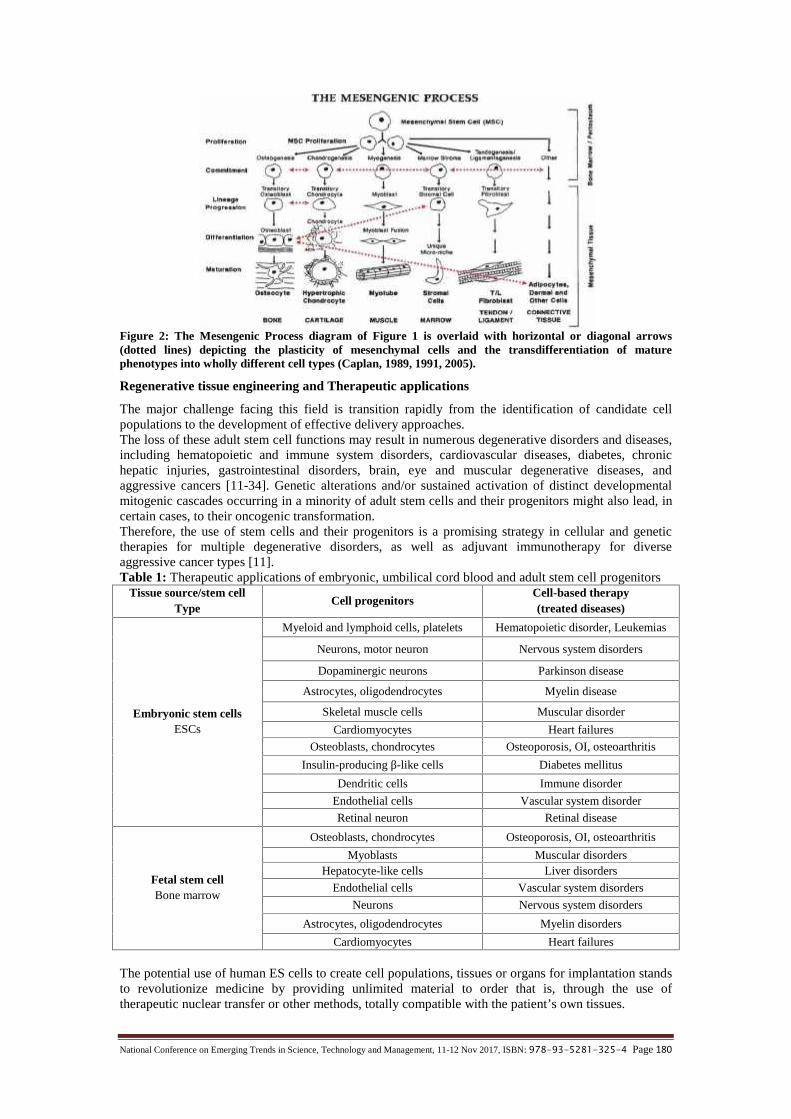
National Conference on Emerging Trends in Science, Technology and Management, 11-12 Nov 2017, ISBN: 978-93-5281-325-4 Page 180
Figure 2: The Mesengenic Process diagram of Figure 1 is overlaid with horizontal or diagonal arrows(dotted lines) depicting the plasticity of mesenchymal cells and the transdifferentiation of maturephenotypes into wholly different cell types (Caplan, 1989, 1991, 2005).
Regenerative tissue engineering and Therapeutic applications
The major challenge facing this field is transition rapidly from the identification of candidate cellpopulations to the development of effective delivery approaches.The loss of these adult stem cell functions may result in numerous degenerative disorders and diseases,including hematopoietic and immune system disorders, cardiovascular diseases, diabetes, chronichepatic injuries, gastrointestinal disorders, brain, eye and muscular degenerative diseases, andaggressive cancers [11-34]. Genetic alterations and/or sustained activation of distinct developmentalmitogenic cascades occurring in a minority of adult stem cells and their progenitors might also lead, incertain cases, to their oncogenic transformation.Therefore, the use of stem cells and their progenitors is a promising strategy in cellular and genetictherapies for multiple degenerative disorders, as well as adjuvant immunotherapy for diverseaggressive cancer types [11].Table 1: Therapeutic applications of embryonic, umbilical cord blood and adult stem cell progenitors
Tissue source/stem cellType
Cell progenitorsCell-based therapy(treated diseases)
Embryonic stem cellsESCs
Myeloid and lymphoid cells, platelets Hematopoietic disorder, Leukemias
Neurons, motor neuron Nervous system disorders
Dopaminergic neurons Parkinson disease
Astrocytes, oligodendrocytes Myelin disease
Skeletal muscle cells Muscular disorder
Cardiomyocytes Heart failures
Osteoblasts, chondrocytes Osteoporosis, OI, osteoarthritis
Insulin-producing β-like cells Diabetes mellitus
Dendritic cells Immune disorder
Endothelial cells Vascular system disorder
Retinal neuron Retinal disease
Fetal stem cellBone marrow
Osteoblasts, chondrocytes Osteoporosis, OI, osteoarthritis
Myoblasts Muscular disordersHepatocyte-like cells Liver disorders
Endothelial cells Vascular system disorders
Neurons Nervous system disorders
Astrocytes, oligodendrocytes Myelin disorders
Cardiomyocytes Heart failures
The potential use of human ES cells to create cell populations, tissues or organs for implantation standsto revolutionize medicine by providing unlimited material to order that is, through the use oftherapeutic nuclear transfer or other methods, totally compatible with the patient’s own tissues.

National Conference on Emerging Trends in Science, Technology and Management, 11-12 Nov 2017, ISBN: 978-93-5281-325-4 Page 181
3. ETHICAL ISSUES
The successful isolation of stem cells from the inner cell mass of early embryos has provided apowerful tool for biological research. ES cells can give rise to almost all cell lineages and are the mostpromising cells for regenerative medicine. The ethical issues related to their isolation have promotedthe development of stem cells, which share many properties with ES cells without ethical concerns.Due to the limitation of using ES and iPS cells in the clinic, great interest has developed inmesenchymal stem cells (MSCs), which are free of both ethical concerns and teratoma formation.Despite heady progress, crucial challenges must be met for the field to realize its full potential. There isas yet no consensus on the most consistent protocol or the optimal protocol for deriving the mostreliable and, ultimately, the safest stem cells. Increasing the reprogramming efficiency and effectingreprogramming without genetically modifying the cells are goals that have been achieved. To developindividual specific regenerative medicines there must be some key point should be consider forresearch. First, the therapeutic mechanism of action needs to be defined.
Second, wide-ranging toxicology studies are needed to enhance our confidence in the use ofcellular therapies. Although these therapies are generally considered safe, data on the long-term effects of cell transplant are still lacking. The possibility of tumorigenicity has beenraised in a number of studies. For allogeneic transplant, these issues become even moreimportant.
Third, the issues of heterogeneity and phenotypic changes associated with expansion of stemcell must be addressed more satisfactorily before we can understand the full therapeuticpotential of these cells.
REFERENCES[1.] Bodo E. Strauer, MD; Ran Kornowski, MD; Stem Cell Therapy in Perspective; Circulation (2003)[2.] Arnold I. Caplan; Adult Mesenchymal Stem Cells for Tissue Engineering Versus Regenerative
Medicine; Journal Of Cellular Physiology (2007)[3.] Mimeault, M. & Batra, S.K; Recent advances on the significance of stem cells in tissue regeneration and
cancer therapies; Stem Cells (2006)[4.] Peault, B. et al; Stem and progenitor cells in skeletal muscle development, maintenance, and therapy;
Mol. Ther. (2007)[5.] Guettier C. Which stem cells for adult liver? Ann Pathol (2005).[6.] Leri A, Kajstura J, Anversa P et al; Cardiac stem cells and mechanisms of myocardial regeneration;
Physiol Rev (2005).[7.] Perillo A, Bonanno G, Pierelli L et al; Stem cells in gynecology and obstetrics; Panminerva Med (2004).[8.] Bonner-Weir S, Weir GC; New sources of pancreatic beta-cells; Nat Biotechnol (2005).[9.] Erices AA, Allers CI, Conget PA et al; Human cord blood-derived mesenchymal stem cells home and
survive in the marrow of immunodeficient mice after systemic infusion.; Cell Transplant (2003).[10.] Cohen Y, Nagler A; Umbilical cord blood transplantation—how, when and for whom?; Blood Rev
(2004).[11.] Murielle Mimeault, Surinder K. Batra; Concise Review: Recent Advances on the Significance of Stem
Cells in Tissue Regeneration and Cancer Therapies; Stem Cells (2006).[12.] Bianchi DW, Romero R; Biological implications of bi-directional fetomaternal cell traffic: A summary
of a National Institute of Child Health and Human Development-sponsored conference. J Matern FetalNeonatal Med (2003).
[13.] Tan XW, Liao H, Sun L et al. Fetal microchimerism in the maternal mouse brain: A novel population offetal progenitor or stem cells able to cross the blood-brain barrier? Stem Cells (2005).
[14.] Khosrotehrani K, Bianchi DW; Multi-lineage potential of fetal cells in maternal tissue: A legacy inreverse; J Cell Sci (2005).
[15.] Mosher JT, et al; Lack of population diversity in commonly used human embryonic stem-cell lines; NEngl J Med (2010).
[16.] Takahashi K, Yamanaka S; Induction of pluripotent stem cells from mouse embryonic and adultfibroblast cultures by defined factors; Cell (2006).
[17.] Park IH, et al; Reprogramming of human somatic cells to pluripotency with defined factors; Nature(2008).
[18.] Yu J, et al; Induced pluripotent stem cell lines derived from human somatic cells; Science. (2007)

National Conference on Emerging Trends in Science, Technology and Management, 11-12 Nov 2017, ISBN: 978-93-5281-325-4 Page 182
[19.] Eminli S, Utikal J, Arnold K, Jaenisch R, Hochedlinger K; Reprogramming of neural progenitor cellsinto induced pluripotent stem cells in the absence of exogenous Sox2 expression; Stem cells. (2008)
[20.] Kim JB, et al; Pluripotent stem cells induced from adult neural stem cells by reprogramming with twofactors. Nature; (2008)
[21.] Hanna J, et al; Direct reprogramming of terminally differentiated mature B lymphocytes to pluripotency;Cell (2008)
[22.] Aoi T, et al; Generation of pluripotent stem cells from adult mouse liver and stomach cells; Science.(2008)
[23.] Utikal J, Maherali N, Kulalert W, Hochedlinger K; Sox2 is dispensable for the reprogramming ofmelanocytes and melanoma cells into induced pluripotent stem cells; J Cell Sci. (2009)
[24.] Sun N, et al; Feeder-free derivation of induced pluripotent stem cells from adult human adipose stemcells; Proc Natl Acad Sci U S A (2009)
[25.] Maherali N, et al; A high-efficiency system for the generation and study of human induced pluripotentstem cells; Cell Stem Cell (2008)
[26.] Wernig M, et al; Neurons derived from reprogrammed fibroblasts functionally integrate into the fetalbrain and improve symptoms of rats with Parkinson’s disease; Proc Natl Acad Sci U S A (2008)
[27.] da Silva Meirelles L, Caplan AI, Nardi NB; In search of the in vivo identity of mesenchymal stem cells.Stem Cells (2008)
[28.] Quirici N, Soligo D, Bossolasco P, et al; Isolation of bone marrow mesenchymal stem cells by anti-nervegrowth factor receptor antibodies; Exp Hematol (2002)
[29.] Sasaki M, Abe R, Fujita Y, et al; Mesenchymal stem cells are recruited into wounded skin andcontribute to wound repair by transdifferentiation into multiple skin cell type; J Immunol; (2008)
[30.] Lee RH, Seo MJ, Reger RL, et al; Multipotent stromal cells from human marrow home to and promoterepair of pancreatic islets and renal glomeruli in diabetic NOD/SCID mice; Proc Natl Acad Sci USA;(2006)
[31.] Boumaza I, Srinivasan S, Witt WT, et al; Autologous bone marrow-derived rat mesenchymal stem cellspromote PDX-1 and insulin expression in the islets, alter T cell cytokine pattern and preserve regulatoryT cells in the periphery and induce sustained normoglycemia; J Autoimmun; (2009)
[32.] Urbán VS, Kiss J, Kovács J, et al; Mesenchymal stem cells cooperate with bone marrow cells in therapyof diabetes. Stem Cells; (2008)
[33.] Neeraj Kumar Satija, Vimal Kishor Singh, Yogesh Kumar Verma, Pallavi Gupta, Shilpa Sharma, FarhatAfrin, Menka Sharma, Pratibha Sharma, R. P. Tripathi , G. U. Gurudutta; Mesenchymal stem cell-basedtherapy: a new paradigm in regenerative medicine; J. Cell. Mol. (2009)
[34.] M Mimeault, R Hauke and SK Batra; Stem Cells: A Revolution in Therapeutics— Recent Advances inStem Cell Biology and Their Therapeutic Applications in Regenerative Medicine and Cancer Therapies;Clinical Pharmacology & Therapeutics (2007)
[35.] Anne E. Bishop, Lee D. K. Buttery and Julia M. Polak; Embryonic stem cells; Journal of Pathology(2002)
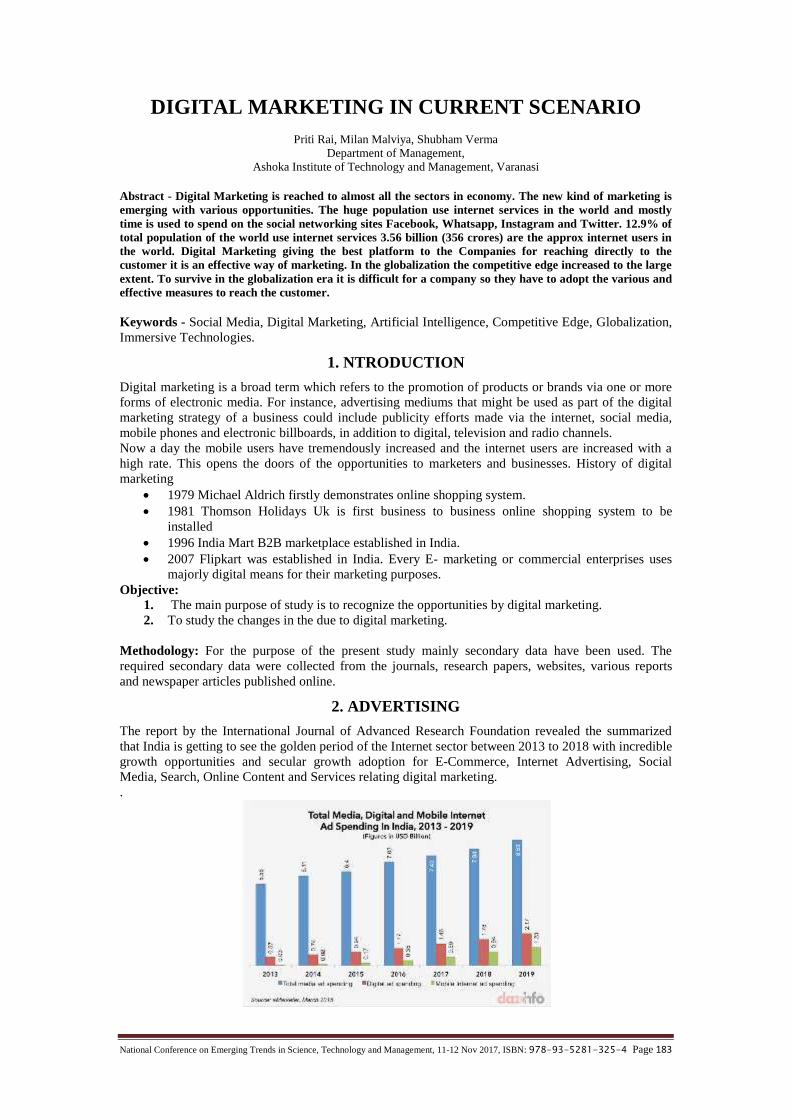
National Conference on Emerging Trends in Science, Technology and Management, 11-12 Nov 2017, ISBN: 978-93-5281-325-4 Page 183
DIGITAL MARKETING IN CURRENT SCENARIOPriti Rai, Milan Malviya, Shubham Verma
Department of Management,Ashoka Institute of Technology and Management, Varanasi
Abstract - Digital Marketing is reached to almost all the sectors in economy. The new kind of marketing isemerging with various opportunities. The huge population use internet services in the world and mostlytime is used to spend on the social networking sites Facebook, Whatsapp, Instagram and Twitter. 12.9% oftotal population of the world use internet services 3.56 billion (356 crores) are the approx internet users inthe world. Digital Marketing giving the best platform to the Companies for reaching directly to thecustomer it is an effective way of marketing. In the globalization the competitive edge increased to the largeextent. To survive in the globalization era it is difficult for a company so they have to adopt the various andeffective measures to reach the customer.
Keywords - Social Media, Digital Marketing, Artificial Intelligence, Competitive Edge, Globalization,Immersive Technologies.
1. NTRODUCTION
Digital marketing is a broad term which refers to the promotion of products or brands via one or moreforms of electronic media. For instance, advertising mediums that might be used as part of the digitalmarketing strategy of a business could include publicity efforts made via the internet, social media,mobile phones and electronic billboards, in addition to digital, television and radio channels.Now a day the mobile users have tremendously increased and the internet users are increased with ahigh rate. This opens the doors of the opportunities to marketers and businesses. History of digitalmarketing 1979 Michael Aldrich firstly demonstrates online shopping system. 1981 Thomson Holidays Uk is first business to business online shopping system to be
installed 1996 India Mart B2B marketplace established in India. 2007 Flipkart was established in India. Every E- marketing or commercial enterprises uses
majorly digital means for their marketing purposes.Objective:
1. The main purpose of study is to recognize the opportunities by digital marketing.2. To study the changes in the due to digital marketing.
Methodology: For the purpose of the present study mainly secondary data have been used. Therequired secondary data were collected from the journals, research papers, websites, various reportsand newspaper articles published online.
2. ADVERTISING
The report by the International Journal of Advanced Research Foundation revealed the summarizedthat India is getting to see the golden period of the Internet sector between 2013 to 2018 with incrediblegrowth opportunities and secular growth adoption for E-Commerce, Internet Advertising, SocialMedia, Search, Online Content and Services relating digital marketing..

National Conference on Emerging Trends in Science, Technology and Management, 11-12 Nov 2017, ISBN: 978-93-5281-325-4 Page 184
The following survey from people indicates the size of Digital Marketing industry in India: 34% of the companies already had an integrated digital marketing strategy in 2016 72% marketers believe that traditional model of marketing is no longer sufficient and this will
make the company revenue to be increased by 30% by the end of 2017
3. MOBILE PHONE USERS IN THE WORLD
In the report of 2017 reveals that in 2016 24.33% of the population accessed the internet from theirmobile and it is expected to grow to 37.36% in 2021. This report also reveals that 73.60% of India’spopulation that is 92 cr. is using mobiles and it is expected that it will rise to 80% that is 100 cr. in theyear 2020.The following is the figure which shows the number of mobile users in world in subsequent years.
This report says that users are tremendously rising in the some years. 4.61 billions (461 cr.) are themobile phone users that will rise up to 5.07(507crores) in 2019. It is the big opportunities for marketersto increase their profits.
4. TYPES OF DIGITAL MARKETING
There are several types of digital marketingA. E-mail MarketingB. Social Media MarketingC. Search Engine OptimizerD. Blog MarketingE. Pa y Per Click Advertising
E-MAIL MARKETING
E-mail marketers of some of the most successful marketing agencies claim a return of $40 for everydollar they invested. From the digital marketing overview, it was discovered that well targeted emailmarketing will be one of the most effective ways of ensuring conversions in 2017.
SOCIAL MEDIA MARKETING
Aside from content amplification and lead generation, Gartner notes that social media is being heavilyused for advertising, advocacy, and customer support. According to the report:

National Conference on Emerging Trends in Science, Technology and Management, 11-12 Nov 2017, ISBN: 978-93-5281-325-4 Page 185
80 percent of social media marketers have or are planning to have social advertising programswithin the next year.
Roughly 60 percent of marketers plan to have an advocacy program in place within the nextyear.
65 percent of marketers say they’re handling customer service interactions on social me.
SEARCH ENGINE OPTIMIZER
Search Engine Optimizer or SEO for short is possible for popular search engine to index a website andboost it up to the top of the result page. Relevant content creation is the most effective SEO tactic for 72 percent of marketers. According to a survey by Clutch, 86 percent of marketers say that they use both paid and
organic marketing efforts. 13 percent of social media marketers surveyed by Clutch only use organic social media, while
1 percent only use paid.
BLOG MARKETING
Blog Marketing is any process that publicizes or advertises a website, business, brand or service via themedium of blogs. This includes To raise the visibility of our company. To increase the sale growth and profit. To make a contribution to our industry.
PAY PER CLICK ADVERTISINGPay per Click Advertising say PPC is a model of internet marketing in which advertisers pay a fee eachtime one of their ads is clicked. Essentially, it’s a way of buying visits to your site, rather thanattempting to “earn” those visits originally.
5. CHALLENGES OF DIGITAL MARKETING
Given the trends mentioned above, marketers face a variety of challenges, the biggest of which knowswhether or not any of their digital efforts are effective. Contributing to the confusion is a lack ofresources, knowledge, and time; the difficulty of converting leads into customers; and diminishingorganic reachA. Lack of Resources, Knowledge and Time: According to Infusion soft’s small business marketing trends
report, 49 percent of small business owners manage their marketing efforts alone. Amidst jugglingsales, finance, and operations, marketing is normally relegated to the backburner; 19.4 percent ofmarketers claim that they don’t have enough time or resources for marketing, while 10 percent ofmarketers admit that understanding tactics and trends is their biggest challenge. Notably, 17percent of business owners had no plan to do digital marketing in 2017 because of a lack ofresources.
B. Converting Leads in to customer: While driving sales remains one of the top priorities for digitalmarketers, converting leads into customers remains a challenge for many smallbusinesses. Marketers have cited their main marketing objectives as driving sales, followed bykeeping and retaining current customers, and building brand awareness. The problem is that withnearly every digital channel, marketers are having trouble marrying channels with conversions.Social media and mobile are especially notable for their lower than average conversion rates.Gartner (research available to clients) indicates that while social is good for driving traffic, it isless conducive for driving conversions. As the highest of all social network conversion rates, those

National Conference on Emerging Trends in Science, Technology and Management, 11-12 Nov 2017, ISBN: 978-93-5281-325-4 Page 186
for Face book ads range from a high of 1.6 percent in the Legal sector, to a low of 0.47 percent foremployment and job training. Mobile shows a similar story global conversion rates on traditionalmedia are roughly 3.5 percent, compared to only 1.27 percent on mobile and 2.98 percent ontablet. This can be attributed in part to the fact that users are spending 90 percent of their time inmobile apps as opposed to surfing the mobile web.
C. Diminishing organic reach: While social media is clearly the preferred digital marketing tactic forsmall business marketers, its biggest challenge is diminishing organic reach. This means thatmarketers must spend more money on social in order to reach the same audience that they wouldhave previously been able to reach organically.
Face book is the preferred social media channel for the majority of small business marketers. It’s alsothe social media channel notorious for decreasing organic reach thanks to constantly shiftingalgorithms.In 2012, organic reach for Face book was roughly 16 percent, dropping to 6.5 percent in 2014. In 2017,it can be as low as 2 percent. Other social networks have followed similar patterns. As a result, 59percent of marketers surveyed by Clutch agree that paid marketing on social media is more effectivethan organic.
6. OPPORTUNITIES OF DIGITAL MARKETING
There are some of the opportunities of Digital MarketingA. Content Marketing Will Evolve: All about blogging, eBooks, and other content types, content
marketing will continue to succeed and become more creative with visual content to break throughthe noise. A great promotional tool for businesses, it is the perfect opportunity for the marketers tomake it even bigger. In this year, we will likely to see interactive content - one of the biggest goalsthat help you stand out from the crowd and drives as much as engagement as possible. Also, try tofocus on the practical as well. Evergreen content offers value to the audience, generating longerlasting results. So, shift your focus to driving growth in existing audiences to make certainconsistent management until conversion.
B. Use of Plenty of Big Data: Of course, everybody does, but you can use different types of data toget more attention of your target audience. Make 2017 a success by analyzing your own dataproductivity and Return on Investment. As customers play a great role in the success of a brand,Big Data makes it possible for the companies to advance customer experience. Your customersexpect attention, if you are listening to their queries, then you are providing them an enrichedshopping experience. It also offers great opportunities to learn more about the consumers, allowingthem to personalize their products and services to gain their confidence.
C. Digital Workforces to Scale Business Processes: Latest digital technologies are all around us andfaster than ever. If the organizations use them effectively, it will generate a significant competitiveadvantage. This will give the employees new digital skills to adapt and render them with the mostrelevant platforms, tools, and motivations.
D. Artificial Intelligence Making Amazing Strides: One area that will continue to profferopportunities for transforming customer service, Artificial Intelligence is deemed to bring hugeshifts in how individuals notice and interact with technology.
E. Social Media Grow Exponentially: Customer preferences, features, and brand opportunities willcontinue to surprise us. There will be changes this year and beyond. As social becomes moreassociated, it is time for the marketers to keep their eyes on the strategies to remain ahead of thecompetitors. Snap chat is one of the most efficient channels for brand to connect with customers inunique ways. It offers a chance to use Geofilters in an efficient way to reap the benefits of anetwork.
F. People-Based Marketing Is In Demand: Organizations are turning to people-based marketingwhere ads are based on data that generates relevancy to potential customers. The performance isreal: Advertisers and marketers are holding addressable media for superb reason.
7. CONCLUSIONS
As Digital Marketing is the best way to advertisement of products, it also generates a portion of profitto the marketers. This is the effective way of promotion and reaching to all customers at a time and at apoint. With the use of this the maximum number of customer will be cover and hence it will increasethe profit.
REFERENCES
[1.] Times of India, Internet, and Business standard.
National Conference on Emerging Trends in Science, Technology and Management, 11-12 Nov 2017, ISBN: 978-93-5281-325-4 Page 187
OVERVIEW AND POST DAMAGE ANALYSIS OFNEPAL EARTHQUAKE 2015Anjani Kumar Shukla, Vipin Kumar Singhal, P.R. Maiti
Department of Civil Engineering, Indian Institute of Technology, BHU, Varanasi-221005, [email protected]
Abstract - Damage analysis is one of the primary activities to be done after an earthquake so as to enhancethe seismic building design technologies and prevent similar type of failure in future during earthquakes.This paper presents an overview of Nepal earthquake and damage analysis of some landmark buildings thatgot collapsed or partially damaged during the Nepal earthquake occurred on 25th April 2015. Over 250,000buildings got damaged and more than 9000 people got injured in this earthquake of 7.8MW magnitude onmoment magnitude scale having maximum intensity of IX on modified Mercalli scale. Damage analysis of abuilding consist of type of damage and most probable reason of damage/failure. Some data has beencollected and their damage patterns are observed. Significance of damaged building its assessment has beencarried out. Modeled damage assessment data and actual damage assessment data were found similarity.Seven major buildings were considered for damage assessment. Based on observations made in this studyfurther improvements in seismic building design technologies can be made.Keywords: Nepal Earthquake, Earthquake magnitude, Damage analysis, Damage Assessment.
1. INTRODUCTION
Damage analysis of buildings damaged in an earthquake is one of the preliminary activity to be done sothat preventive measures can be taken in future to prevent similar type of failure in buildings due toearthquake. A massive earthquake known as ‘Gorkha Earthquake’ with a moment magnitude 7.8MW
and surface wave magnitude 8.1MS struck Nepal at 06:11 GMT, 25 April 2015 having its epicenter invillage Barpak, Gorkha district, Nepal. The hypo central depth of the earthquake was approximately 15km, which is a shallow type earthquake making it more severe one. The maximum intensity value ofthe earthquake was observed to be IX (damage considerable in specially designed structures; well-designed frame structures thrown out of plumb. Damage great in substantial buildings, with partialcollapse. Buildings shifted off foundations) on modified Mercalli scale [10]. More than 8,000 peoplewere killed, over 19,000 were injured and about 250,000 buildings were damaged including someUNESCO’s world heritage sites. The earthquake triggered many landslides and an avalanche on MountEverest. The earthquake had its effect on India, China, Bangladesh, Pakistan and Bhutan. More than100 aftershocks with a magnitude greater than 4MW occurred as a result of the earthquake out of whicha major aftershock of magnitude 6.7MW occurred on April 26, 2015 having its epicenter 17 km south ofKodari, Nepal.Another second earthquake of magnitude 7.3MW occurred on 12 May 2015 with its epicenter near theChinese border between Dolakha and Sindhupalchowk districts.Using the estimate = . .Where M0 is seismic moment, estimated radiated seismic energy (ES) was found to be 8.912 x 10¹² kJwhich is an enormous amount of energy, approximately equal to energy released by 3,142,443 tons ofTNT.Nepal Earthquake is one of the most devastating earthquake in Nepal’s history after Nepal-Biharearthquake in 1934. The earthquake occurred due to thrust fault in Himalayan seismic zone. In thispaper, damage analysis of some buildings has been done damaged during Nepal earthquake occurredon April 25, 2015. This analysis consists of type of damage pattern, most probable reason of damage/failure and information about the structure. For understanding the damage done to the building,knowledge of magnitude scales and intensity scales is necessary which is used for measuring theimpact of earthquake.
2. MAGNITUDE SCALE
Magnitude of an earthquake refers to the amount of energy released due to failure of the earth surface.Seismometers are used to measure the motion of the ground i.e. amplitude of the earthquake. There aremainly four scales used worldwide to measure the magnitude of an earthquake. These scales are - Local magnitude scale (ML) – It is a quantitative logarithmic scale that describes the relative sizes
of two earthquakes and denoted by ML. The earthquake having local magnitude scale reading higherby 1 of the lesser earthquake releases 31.6 times more energy and has an amplitude 10 times of thelesser earthquake. According to local magnitude scale magnitude of an earthquake is given byM = log ( )
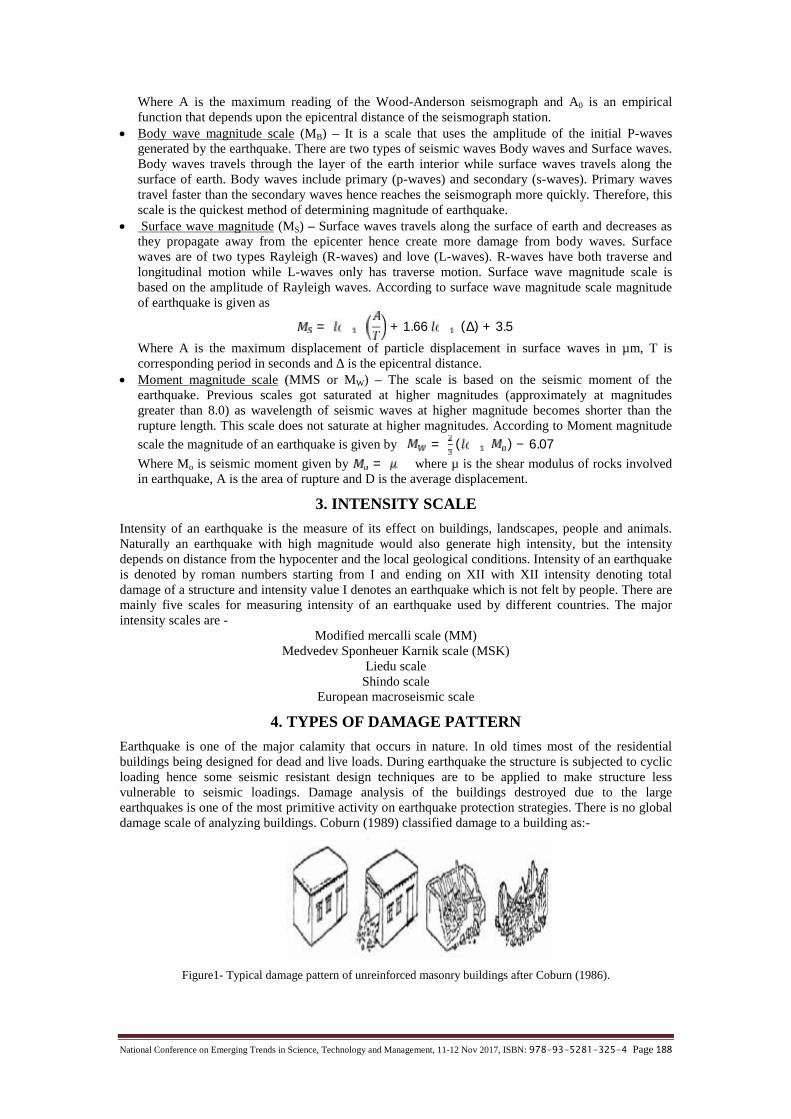
National Conference on Emerging Trends in Science, Technology and Management, 11-12 Nov 2017, ISBN: 978-93-5281-325-4 Page 188
Where A is the maximum reading of the Wood-Anderson seismograph and A0 is an empiricalfunction that depends upon the epicentral distance of the seismograph station.
Body wave magnitude scale (MB) – It is a scale that uses the amplitude of the initial P-wavesgenerated by the earthquake. There are two types of seismic waves Body waves and Surface waves.Body waves travels through the layer of the earth interior while surface waves travels along thesurface of earth. Body waves include primary (p-waves) and secondary (s-waves). Primary wavestravel faster than the secondary waves hence reaches the seismograph more quickly. Therefore, thisscale is the quickest method of determining magnitude of earthquake.
Surface wave magnitude (MS) – Surface waves travels along the surface of earth and decreases asthey propagate away from the epicenter hence create more damage from body waves. Surfacewaves are of two types Rayleigh (R-waves) and love (L-waves). R-waves have both traverse andlongitudinal motion while L-waves only has traverse motion. Surface wave magnitude scale isbased on the amplitude of Rayleigh waves. According to surface wave magnitude scale magnitudeof earthquake is given as = + 1.66 (∆) + 3.5Where A is the maximum displacement of particle displacement in surface waves in µm, T iscorresponding period in seconds and ∆ is the epicentral distance.
Moment magnitude scale (MMS or MW) – The scale is based on the seismic moment of theearthquake. Previous scales got saturated at higher magnitudes (approximately at magnitudesgreater than 8.0) as wavelength of seismic waves at higher magnitude becomes shorter than therupture length. This scale does not saturate at higher magnitudes. According to Moment magnitude
scale the magnitude of an earthquake is given by = ( ) − 6.07Where Mo is seismic moment given by = where µ is the shear modulus of rocks involvedin earthquake, A is the area of rupture and D is the average displacement.
3. INTENSITY SCALE
Intensity of an earthquake is the measure of its effect on buildings, landscapes, people and animals.Naturally an earthquake with high magnitude would also generate high intensity, but the intensitydepends on distance from the hypocenter and the local geological conditions. Intensity of an earthquakeis denoted by roman numbers starting from I and ending on XII with XII intensity denoting totaldamage of a structure and intensity value I denotes an earthquake which is not felt by people. There aremainly five scales for measuring intensity of an earthquake used by different countries. The majorintensity scales are -
Modified mercalli scale (MM)Medvedev Sponheuer Karnik scale (MSK)
Liedu scaleShindo scale
European macroseismic scale
4. TYPES OF DAMAGE PATTERN
Earthquake is one of the major calamity that occurs in nature. In old times most of the residentialbuildings being designed for dead and live loads. During earthquake the structure is subjected to cyclicloading hence some seismic resistant design techniques are to be applied to make structure lessvulnerable to seismic loadings. Damage analysis of the buildings destroyed due to the largeearthquakes is one of the most primitive activity on earthquake protection strategies. There is no globaldamage scale of analyzing buildings. Coburn (1989) classified damage to a building as:-
Figure1- Typical damage pattern of unreinforced masonry buildings after Coburn (1986).

National Conference on Emerging Trends in Science, Technology and Management, 11-12 Nov 2017, ISBN: 978-93-5281-325-4 Page 189
Cracks in walls First floor collapse Second floor collapse Total collapse
Figure2- Damage pattern of wooden frame buildings
Fall of pieces Ground floor failure Mid floor failure Upper floor failure Pancake failure Multiple fractures
Figure 3- Typical damage pattern of reinforced concrete with moment-resting concrete frame buildings
According to Earthquake engineering research institute, damage in a reinforced concrete buildings dueto earthquake can be classified into six levels as:
Level D0:- No damage.Level D1:- Slight Damage.
Level D2:- Medium damage.Level D3:- Severe damage.
Level D4:- Very heavy damage.Level D5:- Collapse of building.
5. DAMAGE ANALYSIS OF BUILDING COLLAPSED DURING NEPALEARTHQUAKE 2015
Hotel Budget Multiplex private limited (marked as 1 in Figure4) got collapsed during the earthquake. Itwas a nine storied masonry structure. The roof and columns of the building were made up of steelReinforced concrete. Major cracks were developed before collapsing of the structure. The building gotcollapsed due to differential settlement of the earth below structure due to liquefaction by earthquake.The building got tilted towards north and collapsed. The building had multiple fracture failure. Thestructure was totally destroyed and irreparable. The damage comes under Level D5 damage.There was a three storey building (marked as 2 in photograph) beside this collapsed structure. Middlepart of a column of the three storied masonry building got collapsed and a part of the front wall fell off.Major cracks developed in walls within the structure and can be repaired.
Figure 4:- Multiple fracture type of failure ofHotel Budget Multiplex at Gaa Hiti Road, Thamel, Kathmandu,Nepal
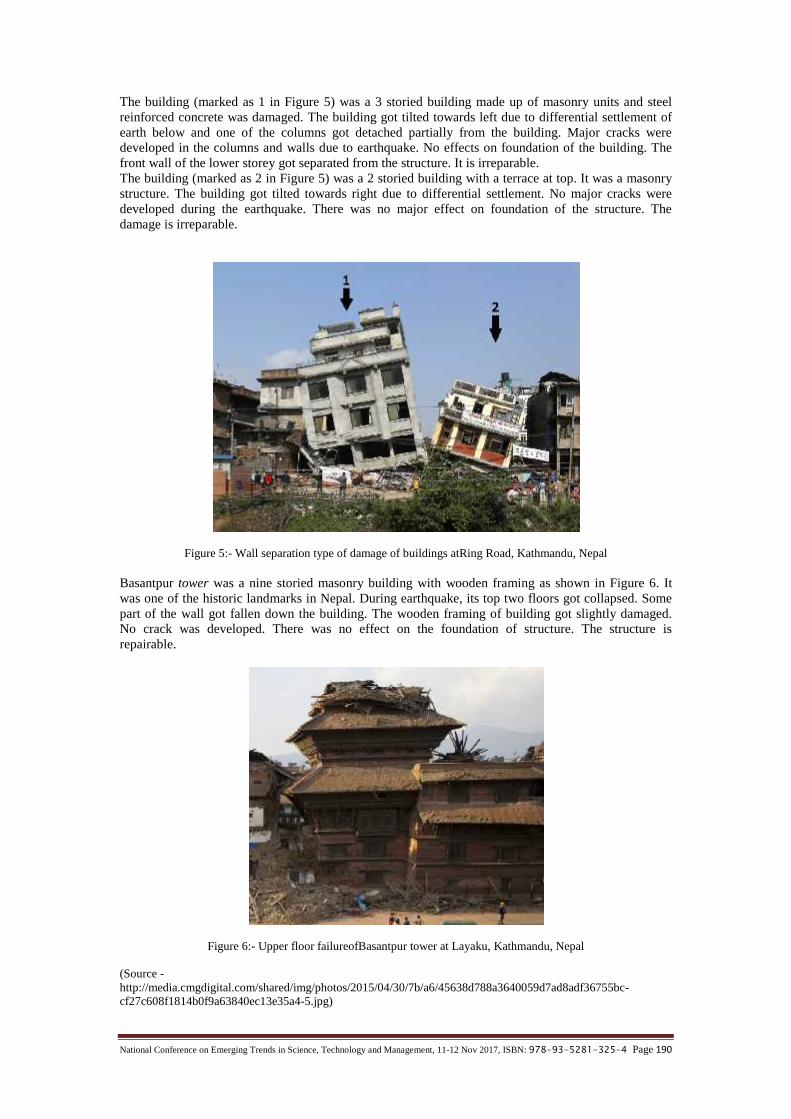
National Conference on Emerging Trends in Science, Technology and Management, 11-12 Nov 2017, ISBN: 978-93-5281-325-4 Page 190
The building (marked as 1 in Figure 5) was a 3 storied building made up of masonry units and steelreinforced concrete was damaged. The building got tilted towards left due to differential settlement ofearth below and one of the columns got detached partially from the building. Major cracks weredeveloped in the columns and walls due to earthquake. No effects on foundation of the building. Thefront wall of the lower storey got separated from the structure. It is irreparable.The building (marked as 2 in Figure 5) was a 2 storied building with a terrace at top. It was a masonrystructure. The building got tilted towards right due to differential settlement. No major cracks weredeveloped during the earthquake. There was no major effect on foundation of the structure. Thedamage is irreparable.
Figure 5:- Wall separation type of damage of buildings atRing Road, Kathmandu, Nepal
Basantpur tower was a nine storied masonry building with wooden framing as shown in Figure 6. Itwas one of the historic landmarks in Nepal. During earthquake, its top two floors got collapsed. Somepart of the wall got fallen down the building. The wooden framing of building got slightly damaged.No crack was developed. There was no effect on the foundation of structure. The structure isrepairable.
Figure 6:- Upper floor failureofBasantpur tower at Layaku, Kathmandu, Nepal
(Source -http://media.cmgdigital.com/shared/img/photos/2015/04/30/7b/a6/45638d788a3640059d7ad8adf36755bc-cf27c608f1814b0f9a63840ec13e35a4-5.jpg)
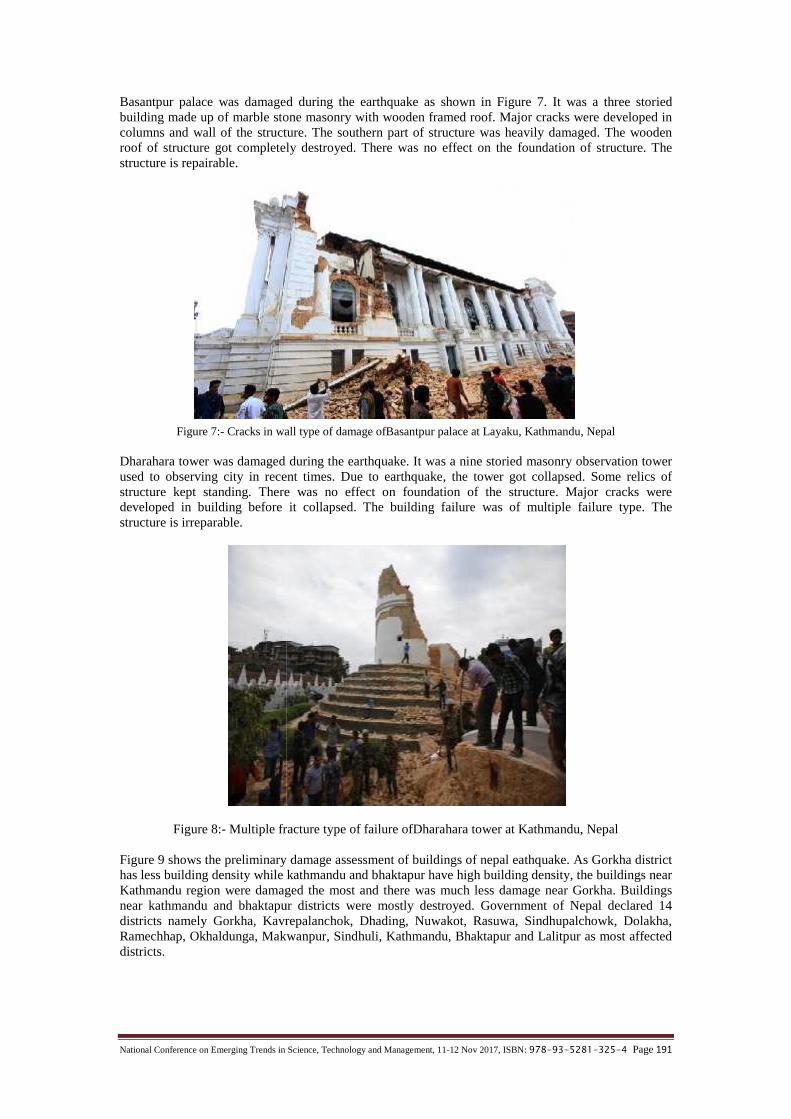
National Conference on Emerging Trends in Science, Technology and Management, 11-12 Nov 2017, ISBN: 978-93-5281-325-4 Page 191
Basantpur palace was damaged during the earthquake as shown in Figure 7. It was a three storiedbuilding made up of marble stone masonry with wooden framed roof. Major cracks were developed incolumns and wall of the structure. The southern part of structure was heavily damaged. The woodenroof of structure got completely destroyed. There was no effect on the foundation of structure. Thestructure is repairable.
Figure 7:- Cracks in wall type of damage ofBasantpur palace at Layaku, Kathmandu, Nepal
Dharahara tower was damaged during the earthquake. It was a nine storied masonry observation towerused to observing city in recent times. Due to earthquake, the tower got collapsed. Some relics ofstructure kept standing. There was no effect on foundation of the structure. Major cracks weredeveloped in building before it collapsed. The building failure was of multiple failure type. Thestructure is irreparable.
Figure 8:- Multiple fracture type of failure ofDharahara tower at Kathmandu, Nepal
Figure 9 shows the preliminary damage assessment of buildings of nepal eathquake. As Gorkha districthas less building density while kathmandu and bhaktapur have high building density, the buildings nearKathmandu region were damaged the most and there was much less damage near Gorkha. Buildingsnear kathmandu and bhaktapur districts were mostly destroyed. Government of Nepal declared 14districts namely Gorkha, Kavrepalanchok, Dhading, Nuwakot, Rasuwa, Sindhupalchowk, Dolakha,Ramechhap, Okhaldunga, Makwanpur, Sindhuli, Kathmandu, Bhaktapur and Lalitpur as most affecteddistricts.

National Conference on Emerging Trends in Science, Technology and Management, 11-12 Nov 2017, ISBN: 978-93-5281-325-4 Page 192
Fig 9:- PRELIMINARY DAMAGE ASSESSMENT (07 May 2015)
Figure 10:- Modeled Building Damage (Source – Pacific Disaster Center)
Figure 10 depicts the modeled building damage map from Mid-Nepal earthquake. This map does notrepresent the actual building damage scenario. However, it depicts the building damaged as developedby software. It can be observed that number of buildings damaged in region near Kathmandu andBhaktapur are high due to their high building population as compared to intensity near Gorkha districtwhile percentage of buildings damaged is more in other regions of Nepal.
Figure 11:- Nepal Earthquake Shaking Intensity(Source – U.S. Geological Survey)
Figure 12:- Peak Ground Velocity due to NepalEarthquake (Source – U.S. Geological Survey)
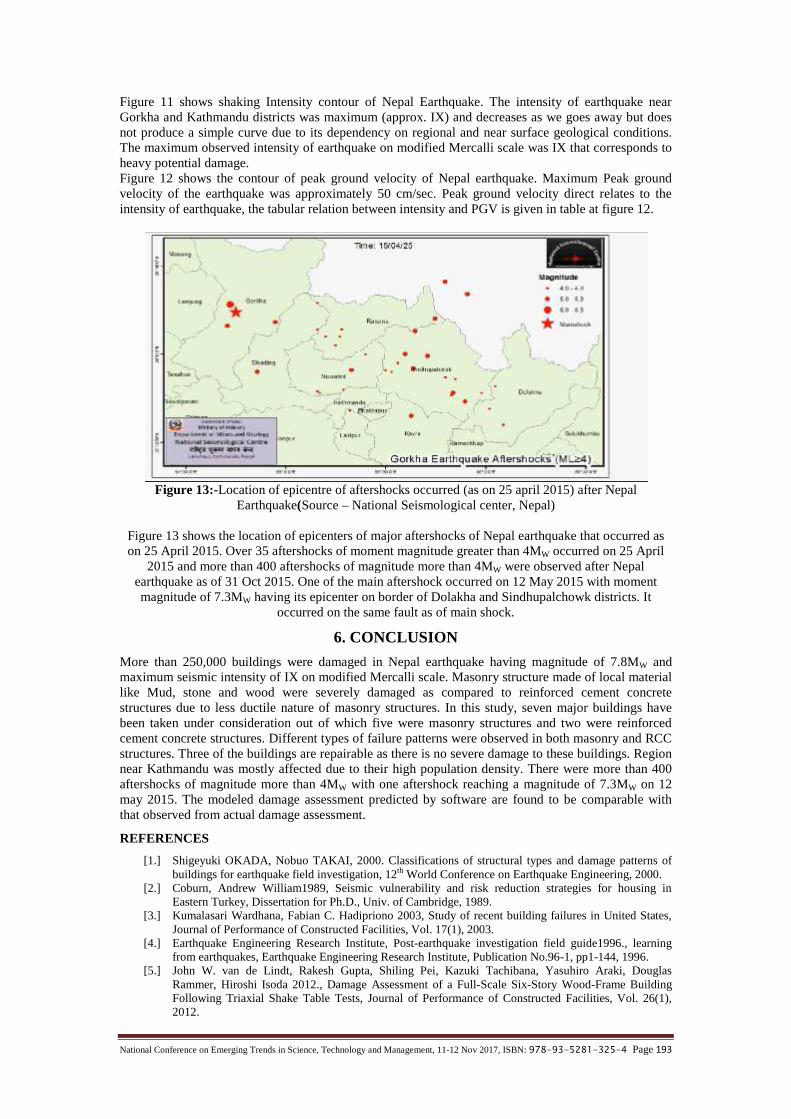
National Conference on Emerging Trends in Science, Technology and Management, 11-12 Nov 2017, ISBN: 978-93-5281-325-4 Page 193
Figure 11 shows shaking Intensity contour of Nepal Earthquake. The intensity of earthquake nearGorkha and Kathmandu districts was maximum (approx. IX) and decreases as we goes away but doesnot produce a simple curve due to its dependency on regional and near surface geological conditions.The maximum observed intensity of earthquake on modified Mercalli scale was IX that corresponds toheavy potential damage.Figure 12 shows the contour of peak ground velocity of Nepal earthquake. Maximum Peak groundvelocity of the earthquake was approximately 50 cm/sec. Peak ground velocity direct relates to theintensity of earthquake, the tabular relation between intensity and PGV is given in table at figure 12.
Figure 13:-Location of epicentre of aftershocks occurred (as on 25 april 2015) after NepalEarthquake(Source – National Seismological center, Nepal)
Figure 13 shows the location of epicenters of major aftershocks of Nepal earthquake that occurred ason 25 April 2015. Over 35 aftershocks of moment magnitude greater than 4MW occurred on 25 April
2015 and more than 400 aftershocks of magnitude more than 4MW were observed after Nepalearthquake as of 31 Oct 2015. One of the main aftershock occurred on 12 May 2015 with momentmagnitude of 7.3MW having its epicenter on border of Dolakha and Sindhupalchowk districts. It
occurred on the same fault as of main shock.
6. CONCLUSION
More than 250,000 buildings were damaged in Nepal earthquake having magnitude of 7.8MW andmaximum seismic intensity of IX on modified Mercalli scale. Masonry structure made of local materiallike Mud, stone and wood were severely damaged as compared to reinforced cement concretestructures due to less ductile nature of masonry structures. In this study, seven major buildings havebeen taken under consideration out of which five were masonry structures and two were reinforcedcement concrete structures. Different types of failure patterns were observed in both masonry and RCCstructures. Three of the buildings are repairable as there is no severe damage to these buildings. Regionnear Kathmandu was mostly affected due to their high population density. There were more than 400aftershocks of magnitude more than 4MW with one aftershock reaching a magnitude of 7.3MW on 12may 2015. The modeled damage assessment predicted by software are found to be comparable withthat observed from actual damage assessment.
REFERENCES
[1.] Shigeyuki OKADA, Nobuo TAKAI, 2000. Classifications of structural types and damage patterns ofbuildings for earthquake field investigation, 12th World Conference on Earthquake Engineering, 2000.
[2.] Coburn, Andrew William1989, Seismic vulnerability and risk reduction strategies for housing inEastern Turkey, Dissertation for Ph.D., Univ. of Cambridge, 1989.
[3.] Kumalasari Wardhana, Fabian C. Hadipriono 2003, Study of recent building failures in United States,Journal of Performance of Constructed Facilities, Vol. 17(1), 2003.
[4.] Earthquake Engineering Research Institute, Post-earthquake investigation field guide1996., learningfrom earthquakes, Earthquake Engineering Research Institute, Publication No.96-1, pp1-144, 1996.
[5.] John W. van de Lindt, Rakesh Gupta, Shiling Pei, Kazuki Tachibana, Yasuhiro Araki, DouglasRammer, Hiroshi Isoda 2012., Damage Assessment of a Full-Scale Six-Story Wood-Frame BuildingFollowing Triaxial Shake Table Tests, Journal of Performance of Constructed Facilities, Vol. 26(1),2012.

National Conference on Emerging Trends in Science, Technology and Management, 11-12 Nov 2017, ISBN: 978-93-5281-325-4 Page 194
[6.] Patrick J. Barosh 2013, Use of Seismic Intensity Data to Predict the Effects of Earthquakes andUnderground Nuclear Explosions in Various Geological Settings, Geological Survey bulletin 1279.
[7.] Pacific Disaster Center. Retrieved from http://www.pdc.org[8.] National Seismological center. Nepal. Retrieved from http://www.seismonepal.gov.np[9.] U.S. Geological Survey. Retrieved from http://earthquake.usgs.gov[10.] Earthquake Engineering Research Institute. Retrieved from
http://earthquake.usgs.gov/learn/topics/mercalli.php
National Conference on Emerging Trends in Science, Technology and Management, 11-12 Nov 2017, ISBN: 978-93-5281-325-4 Page 195
WORK LIFE BALANCE FOR WORKING MOTHERS ININDIA
Mrs. Sharmila SinghDepartment of Management
Ashoka Institute of Technology & Management, [email protected]
Mr. Vijay Kumar Verma (Assistant Professor)Rajkiya Engineering College Ambedkarnagar Uttar Pradesh-224122
[email protected] Jaiswal, Sanjoli Jaiswal
Department of Management, Ashoka Institute of Technology & Management, [email protected],
Abstract – Many studies have focused on working women’s but in this thesis I explore the way in whichworking mothers balance between paid work and family responsibilities. There has been a growinguneasiness over work family issues and the perception of balancing these two domains due to an increasingnumber of women entering the world of professional engagement. Clear cut segregation between work andhome is made with men being less involved in house hold tasks. For working mothers a healthy work lifebalance assumes great significance particularly in the current context in which both, the family and thework place have posed several challenges and problem for women. The influence such as child care support,educational attainment, age of youngest child, number of hour worked, conflict at work, and high work loadon the perceived work-life balance of working mothers. The challenging aspects of the work environmenthave utilized huge pressure on working mothers as they need to manage with virtually two full time jobs-one at the office and the other at home. So, today’s mothers are struggling continuously for work lifebalance. Several studies have been conducted on work- family issue in different countries, there is a need toanalysis how working mothers balance work family issues in India.
Keywords - Concerns Related to the “Self”, Concerns Related to the “Family”, Concerns Related to the“Society”, Concerns Related to the “Organization”
1. INTRODUCTION
Times are changing from traditional where the husband earns, and wife stayed at home to the modernwhen the husband earns and wife earns too. But wife still cooks, washes and run the houses. Althoughwomen’s have started scattering her wings in all sphere of life but the traditional concept of the womenat the homemaker has not gone away from people’s mind. Work life balance is a phenomenon thatoccurs to those who are usefully employed and have to manage their personal life. We are all engagedin number of roles everyday and we hold a number of roles throughout our life. Life struggle occurswhen we are unable to give our “many role” required time and energy as a result of which participationin one role is made increasingly difficult by participation in another. So, there is a need of balanceworking life. Work-life balance is generally related to working time, flexibility, welfare, socialsecurity, family, fertility, migration, demographic change, consumption, leisure time and so on.
2. CONCERNS RELATED TO THE “SELF”1. Strong Maternal Nature: In a vast majority of the cases, what made is especially harder for aworking mothers in India is her own strong “maternal nature”; which induces her to quit the workforceand be with her children full time, or explore flexible work opportunities which enable her to be thekind of mother she hopes to be these decisions obviously came with some trade-off’s with respect toher professional growth and objectives. And these very choices and decision are the cause for thefelling of hesitation, blame, disappointment and a varying sense of self-esteem. From what I’ve seenthe manifestation of this maternal nature is very specific to your country/culture. And so the Indianmother has her own emotional concerns and boundaries- which are very personnel and subjective toher.
2. Physiological Conditioning of Women: For many Indian working mothers, the every day conflictthey had to fight was related to there own physiological conditioning – which is totally and directlyinfluenced by the living environment one is the part of f. So if you’re maternities/ spouse/inlaws/community you’re a part of continuously make the point that your first duty as a women is that ofanother ; and that the primary duty of a mother is toward your child; then at some point- the mothergives-in; emotionally, passionately and professionally .

National Conference on Emerging Trends in Science, Technology and Management, 11-12 Nov 2017, ISBN: 978-93-5281-325-4 Page 196
3. Passion to Work: In many circumstances, a lot of women themselves did not have any passion towork; or it is very low. The truth is that Indian women who have assembled significant long termsprofession had a burning passion to work, and they found ways to make it work. Sure there wereprofession breaks; but over a period of time they did manage to build a successful career because ofthis desire, effort, hard work, sincerity, flexibility and commitment.
3. CONCERNS RELATED TO THE “FAMILY”
1. Nurture: Interestingly, the first note- worthy thought I made was around how a women’s nurturemade all the difference in her own definition of what is expected of a “mother” her own self-worth andher role at home and in society. All of this concludes whether or not see carry on to work afterbecoming a mother. In many instance, the influence of your upbringing can drastically alter your careerpath once you become a mother. And in many cases, they accept their primary role and identity of amother, and only a mother; and completely give up their qualified identity.2. Increase of “Nuclear Families”: The other reality of India today is the increasing growth of nuclearfamilies. In such a set-up, it is vital for one of the parent to play a dynamic role during the early age ofchild growth and development. In majority of cases, again it is the mother who takes a career break.And after the break, it definitely takes time for your career to build and flourish. This comes at a priceof both career growth and financial incomes.3. No Role Model for “Working Mother”: This is probably the most important issue, but lessacknowledged. Typically, we all know what to expect from a “full time mother” and there are countlessrole models for how/ what she should be and do. The best example for a vast majority of people are ourown mother.4. Uneven Partnership At Home: In several Indian homes, there are “uneven partnership”. After along tiring day once she returns at home- she is still expected to cook, clean, and take care of home-work and attend to the other demands of the husband/ children and sustain the house. Over a period oftime – all this adds to the stress levels, and can finish working mothers that they start under-performingat work, or they re-calibrate their own beliefs of themselves.5. Expectations of Family: Again, not much explanation required but the “Indian family” is animportant and integral part of our lives. As per Indian culture mothers are expected to live up to someexpectations from the family. Be it in terms of kind of professions she can select and choose, the kindof work hours she can clock-in, the kind of things she has to do at home etc. all these expectationsdon`t really make it easy for a working mother. After a point, I know so many working mothers whojust give up these every day fights and just choose stay silent.
3. CONCERNS RELATED TO “SOCIETY”1. The Society and Years we live In: We call these years the “Kalyug”. There`s evil everywhere lies,theft, dishonest, hijacking, stealing, child sex, abuse etc. all are the part of everyday news. These areindeed not safe times. Simple things like travelling in bus or any public transport is unsafe.2. This Well-Known Male “EGO”: I don`t need to say anything here. The well-known male “EGO”is real and prevailing- at home, at the workforce, and in the world at large – this thing makes tough fora women, and more so for a working mothers.
4. CONCERNS RELATED TO THE “ORGANIZATION”1. Inadequate Organizational Support: Most working mother’s goes through a phase of transitionwhen their children are small and yet to start formal education. During this stage, the most importantfactor that can make a difference is flexibility at work place. While several organization provide somelevel of flexibility to women and it is high on the urgency list for several others. There is a considerabletime lag between policy and action.2. Limited Mentorship: Having a “real mentor” can make an ocean of change in the life and career ofworking mothers. However, the sad actuality of today is that many working mothers have never reallyhad mentors; and so they don’t know what it mean to have one or what difference a mentor can makein your life.
5. CONCLUSION
It is true for Indian workforce and workplaces, where women are often forced to leave their jobs aftermarriage or after pregnancy in order to take care of their households. The huge gap between womenand men at workplaces is not hidden secret. In India, the gender gap at workplace is recognizable anddissimilar to what many might want to believe the number of working women is lesser in urban areas

National Conference on Emerging Trends in Science, Technology and Management, 11-12 Nov 2017, ISBN: 978-93-5281-325-4 Page 197
in comparison to rural areas. Work-family structure can be influenced by the context in which the workand the family domains function in a particular environment.In the Global Gender gap report 2016 by World Economic Forum (WEF), India standpoint at 87th rankin the global index. In terms of economics participation and opportunity, India is graded far away at136 among the 146 countries surveyed.In the report, India is also grouped among countries’ which have made crucial investments in women’seducation but have generally not removed difficulties to women’s participation in the workforce andare thus not seeing return on their investments in terms of expansion of one half of their nation’shuman capital. The report says that India has much to gain from women’s increased contribution inworkforce.Women, comprising almost half of India’s workforce, have the potential to contribute toward theconversion of the country. But for this to work, the workplace strategies need to be moreaccommodating toward working mothers. Thus, they are observed as struggling with their personal andprofessional lives in order to achieve an equilibrium between these two spheres. As the result of theprevalence of gendered work structure, women’s are not able to achieve parity despite being educatedand employed. In addition, domestic duties and responsibility still remain a primary role of women,irrespective of their employment status.
REFERENCES
[1.] Cooke, F L (2007). Husband’s Career First: Regenerating Career and Family Commitment amongMigrant Chinese Academic Couples in Britain. Work, Employment and Society
[2.] Gayatri Pradhan ISBN 978-81-7791-221-0 © 2016, Copyright Reserved The Institute for Social andEconomic Change, Bangalore E-mail: [email protected].
[3.] Behson S.J. (2002), which dominates? The relative importance of work–family organizational supportand general organizational context on employee outcomes. Journal of Vocational Behavior, Vol.61: 53-72.
[4.] Working mothers and their perceived work-‐ life balance Ignacio Levy Kea Tijdens, Bram Peper[5.] Shobha Sundaresan https://www.slideshare.net/sayanti82/career-women-and-work-life-balance[6.] Achanta, Raja (2004). The Work- life Balance. HRM Review March 2004, the ICFAI University Press.[7.] Moshe Sharabi, (2017) "Work, family and other life domains centrality among managers and workers
according to gender", International Journal of Social Economics, Vol. 44 Issue: 10, pp.1307-1321,https://doi.org/10.1108/IJSE-02-2016-0056, https://doi.org/10.1108/IJSE-02-2016-0056
[8.] Work, family and other life domains centrality among managers and workers according to gender (PDFDownload Available). Available from:https://www.researchgate.net/publication/319130130_Work_family_and_other_life_domains_centrality_among_managers_and_workers_according_to_gender [accessed Oct 30 2017].
[9.] https://currentaffairs.gktoday.in/india-ranks-87th-wefs-global-gender-gap-report-2016-10201636685.html
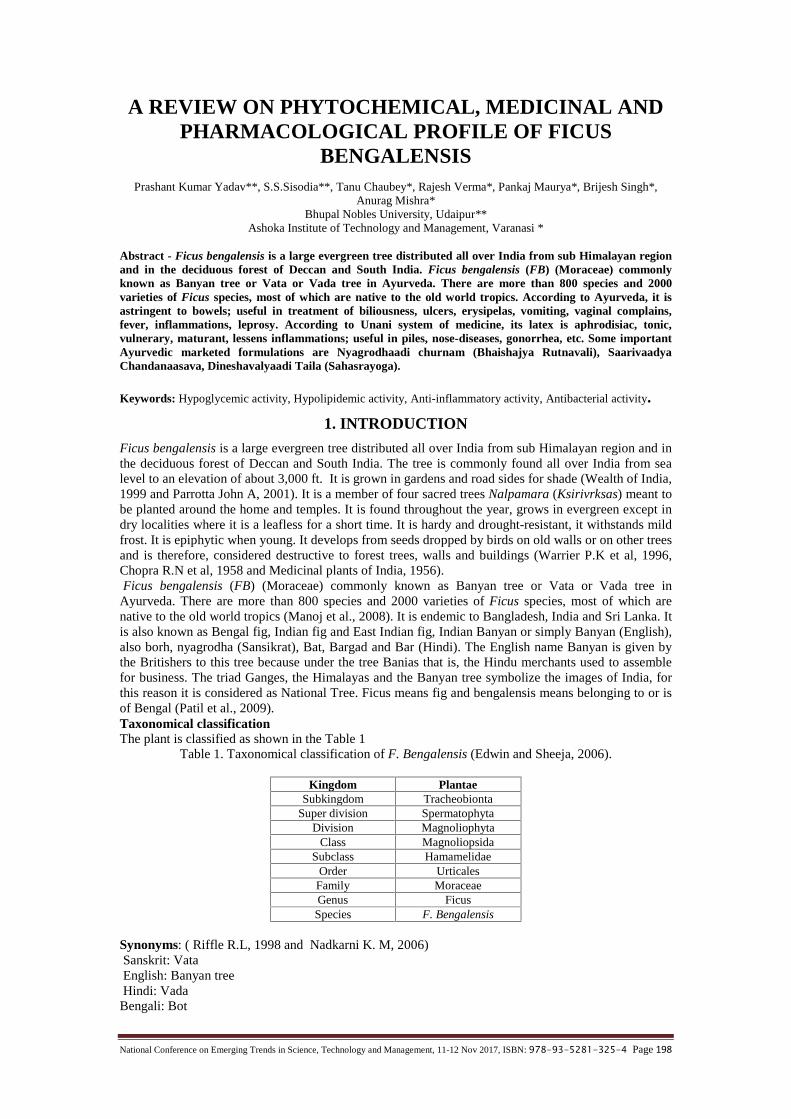
National Conference on Emerging Trends in Science, Technology and Management, 11-12 Nov 2017, ISBN: 978-93-5281-325-4 Page 198
A REVIEW ON PHYTOCHEMICAL, MEDICINAL ANDPHARMACOLOGICAL PROFILE OF FICUS
BENGALENSISPrashant Kumar Yadav**, S.S.Sisodia**, Tanu Chaubey*, Rajesh Verma*, Pankaj Maurya*, Brijesh Singh*,
Anurag Mishra*Bhupal Nobles University, Udaipur**
Ashoka Institute of Technology and Management, Varanasi *
Abstract - Ficus bengalensis is a large evergreen tree distributed all over India from sub Himalayan regionand in the deciduous forest of Deccan and South India. Ficus bengalensis (FB) (Moraceae) commonlyknown as Banyan tree or Vata or Vada tree in Ayurveda. There are more than 800 species and 2000varieties of Ficus species, most of which are native to the old world tropics. According to Ayurveda, it isastringent to bowels; useful in treatment of biliousness, ulcers, erysipelas, vomiting, vaginal complains,fever, inflammations, leprosy. According to Unani system of medicine, its latex is aphrodisiac, tonic,vulnerary, maturant, lessens inflammations; useful in piles, nose-diseases, gonorrhea, etc. Some importantAyurvedic marketed formulations are Nyagrodhaadi churnam (Bhaishajya Rutnavali), SaarivaadyaChandanaasava, Dineshavalyaadi Taila (Sahasrayoga).
Keywords: Hypoglycemic activity, Hypolipidemic activity, Anti-inflammatory activity, Antibacterial activity.
1. INTRODUCTION
Ficus bengalensis is a large evergreen tree distributed all over India from sub Himalayan region and inthe deciduous forest of Deccan and South India. The tree is commonly found all over India from sealevel to an elevation of about 3,000 ft. It is grown in gardens and road sides for shade (Wealth of India,1999 and Parrotta John A, 2001). It is a member of four sacred trees Nalpamara (Ksirivrksas) meant tobe planted around the home and temples. It is found throughout the year, grows in evergreen except indry localities where it is a leafless for a short time. It is hardy and drought-resistant, it withstands mildfrost. It is epiphytic when young. It develops from seeds dropped by birds on old walls or on other treesand is therefore, considered destructive to forest trees, walls and buildings (Warrier P.K et al, 1996,Chopra R.N et al, 1958 and Medicinal plants of India, 1956).Ficus bengalensis (FB) (Moraceae) commonly known as Banyan tree or Vata or Vada tree in
Ayurveda. There are more than 800 species and 2000 varieties of Ficus species, most of which arenative to the old world tropics (Manoj et al., 2008). It is endemic to Bangladesh, India and Sri Lanka. Itis also known as Bengal fig, Indian fig and East Indian fig, Indian Banyan or simply Banyan (English),also borh, nyagrodha (Sansikrat), Bat, Bargad and Bar (Hindi). The English name Banyan is given bythe Britishers to this tree because under the tree Banias that is, the Hindu merchants used to assemblefor business. The triad Ganges, the Himalayas and the Banyan tree symbolize the images of India, forthis reason it is considered as National Tree. Ficus means fig and bengalensis means belonging to or isof Bengal (Patil et al., 2009).Taxonomical classificationThe plant is classified as shown in the Table 1
Table 1. Taxonomical classification of F. Bengalensis (Edwin and Sheeja, 2006).
Kingdom PlantaeSubkingdom Tracheobionta
Super division SpermatophytaDivision Magnoliophyta
Class MagnoliopsidaSubclass Hamamelidae
Order UrticalesFamily MoraceaeGenus FicusSpecies F. Bengalensis
Synonyms: ( Riffle R.L, 1998 and Nadkarni K. M, 2006)Sanskrit: VataEnglish: Banyan treeHindi: Vada
Bengali: Bot
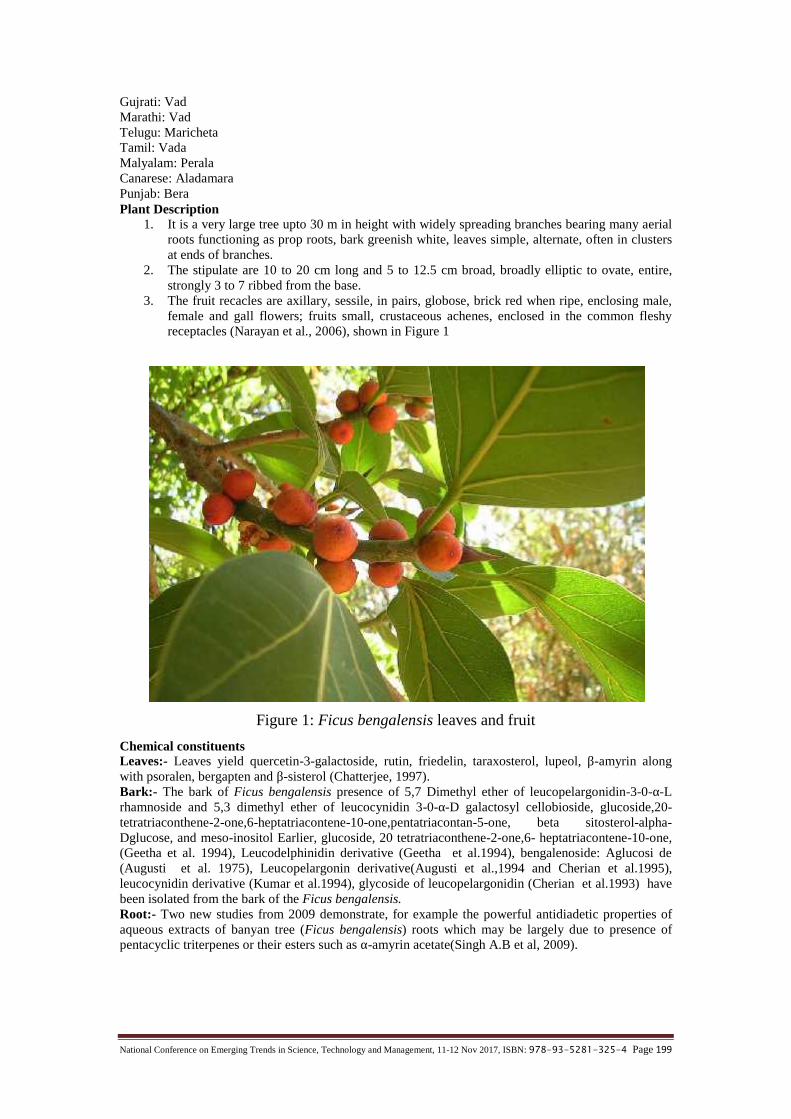
National Conference on Emerging Trends in Science, Technology and Management, 11-12 Nov 2017, ISBN: 978-93-5281-325-4 Page 199
Gujrati: VadMarathi: VadTelugu: MarichetaTamil: VadaMalyalam: PeralaCanarese: AladamaraPunjab: BeraPlant Description
1. It is a very large tree upto 30 m in height with widely spreading branches bearing many aerialroots functioning as prop roots, bark greenish white, leaves simple, alternate, often in clustersat ends of branches.
2. The stipulate are 10 to 20 cm long and 5 to 12.5 cm broad, broadly elliptic to ovate, entire,strongly 3 to 7 ribbed from the base.
3. The fruit recacles are axillary, sessile, in pairs, globose, brick red when ripe, enclosing male,female and gall flowers; fruits small, crustaceous achenes, enclosed in the common fleshyreceptacles (Narayan et al., 2006), shown in Figure 1
Figure 1: Ficus bengalensis leaves and fruit
Chemical constituentsLeaves:- Leaves yield quercetin-3-galactoside, rutin, friedelin, taraxosterol, lupeol, β-amyrin alongwith psoralen, bergapten and β-sisterol (Chatterjee, 1997).Bark:- The bark of Ficus bengalensis presence of 5,7 Dimethyl ether of leucopelargonidin-3-0-α-Lrhamnoside and 5,3 dimethyl ether of leucocynidin 3-0-α-D galactosyl cellobioside, glucoside,20-tetratriaconthene-2-one,6-heptatriacontene-10-one,pentatriacontan-5-one, beta sitosterol-alpha-Dglucose, and meso-inositol Earlier, glucoside, 20 tetratriaconthene-2-one,6- heptatriacontene-10-one,(Geetha et al. 1994), Leucodelphinidin derivative (Geetha et al.1994), bengalenoside: Aglucosi de(Augusti et al. 1975), Leucopelargonin derivative(Augusti et al.,1994 and Cherian et al.1995),leucocynidin derivative (Kumar et al.1994), glycoside of leucopelargonidin (Cherian et al.1993) havebeen isolated from the bark of the Ficus bengalensis.Root:- Two new studies from 2009 demonstrate, for example the powerful antidiadetic properties ofaqueous extracts of banyan tree (Ficus bengalensis) roots which may be largely due to presence ofpentacyclic triterpenes or their esters such as α-amyrin acetate(Singh A.B et al, 2009).
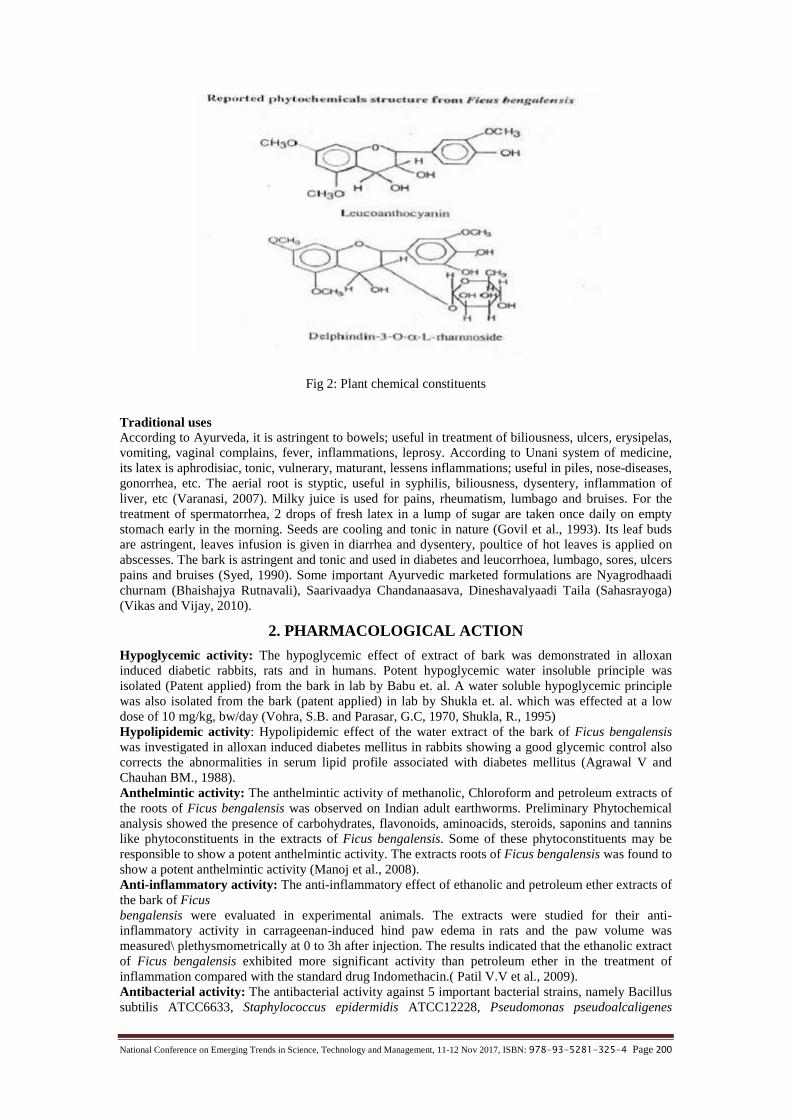
National Conference on Emerging Trends in Science, Technology and Management, 11-12 Nov 2017, ISBN: 978-93-5281-325-4 Page 200
Fig 2: Plant chemical constituents
Traditional usesAccording to Ayurveda, it is astringent to bowels; useful in treatment of biliousness, ulcers, erysipelas,vomiting, vaginal complains, fever, inflammations, leprosy. According to Unani system of medicine,its latex is aphrodisiac, tonic, vulnerary, maturant, lessens inflammations; useful in piles, nose-diseases,gonorrhea, etc. The aerial root is styptic, useful in syphilis, biliousness, dysentery, inflammation ofliver, etc (Varanasi, 2007). Milky juice is used for pains, rheumatism, lumbago and bruises. For thetreatment of spermatorrhea, 2 drops of fresh latex in a lump of sugar are taken once daily on emptystomach early in the morning. Seeds are cooling and tonic in nature (Govil et al., 1993). Its leaf budsare astringent, leaves infusion is given in diarrhea and dysentery, poultice of hot leaves is applied onabscesses. The bark is astringent and tonic and used in diabetes and leucorrhoea, lumbago, sores, ulcerspains and bruises (Syed, 1990). Some important Ayurvedic marketed formulations are Nyagrodhaadichurnam (Bhaishajya Rutnavali), Saarivaadya Chandanaasava, Dineshavalyaadi Taila (Sahasrayoga)(Vikas and Vijay, 2010).
2. PHARMACOLOGICAL ACTION
Hypoglycemic activity: The hypoglycemic effect of extract of bark was demonstrated in alloxaninduced diabetic rabbits, rats and in humans. Potent hypoglycemic water insoluble principle wasisolated (Patent applied) from the bark in lab by Babu et. al. A water soluble hypoglycemic principlewas also isolated from the bark (patent applied) in lab by Shukla et. al. which was effected at a lowdose of 10 mg/kg, bw/day (Vohra, S.B. and Parasar, G.C, 1970, Shukla, R., 1995)Hypolipidemic activity: Hypolipidemic effect of the water extract of the bark of Ficus bengalensiswas investigated in alloxan induced diabetes mellitus in rabbits showing a good glycemic control alsocorrects the abnormalities in serum lipid profile associated with diabetes mellitus (Agrawal V andChauhan BM., 1988).Anthelmintic activity: The anthelmintic activity of methanolic, Chloroform and petroleum extracts ofthe roots of Ficus bengalensis was observed on Indian adult earthworms. Preliminary Phytochemicalanalysis showed the presence of carbohydrates, flavonoids, aminoacids, steroids, saponins and tanninslike phytoconstituents in the extracts of Ficus bengalensis. Some of these phytoconstituents may beresponsible to show a potent anthelmintic activity. The extracts roots of Ficus bengalensis was found toshow a potent anthelmintic activity (Manoj et al., 2008).Anti-inflammatory activity: The anti-inflammatory effect of ethanolic and petroleum ether extracts ofthe bark of Ficusbengalensis were evaluated in experimental animals. The extracts were studied for their anti-inflammatory activity in carrageenan-induced hind paw edema in rats and the paw volume wasmeasured\ plethysmometrically at 0 to 3h after injection. The results indicated that the ethanolic extractof Ficus bengalensis exhibited more significant activity than petroleum ether in the treatment ofinflammation compared with the standard drug Indomethacin.( Patil V.V et al., 2009).Antibacterial activity: The antibacterial activity against 5 important bacterial strains, namely Bacillussubtilis ATCC6633, Staphylococcus epidermidis ATCC12228, Pseudomonas pseudoalcaligenes

National Conference on Emerging Trends in Science, Technology and Management, 11-12 Nov 2017, ISBN: 978-93-5281-325-4 Page 201
ATCC17440, Proteus vulgaris NCTC8313 and Salmonella typhimurium ATCC23564. Theantibacterial activity of aqueous and methanol extracts was determined by agar disk diffusion and agarwell diffusion method. The methanol extracts were more active than the aqueous extracts for all plantsstudied. The plant extracts were more active against Gram-positive bacteria than against Gram-negativebacteria. The most susceptible bacteria were B. subtilis, followed by S. epidermidis, while the mostresistant bacteria were P. vulgaris, followed by S. typhimurium (Parekh J et al., 2005)Analgesic and antipyretic activity: Analgesic activity using hot-plate and tail-immersion method andAntipyretic activity using Brewer’s yeast-induced pyrexia in rats was carried out by the bark of Ficusbengalensis in laboratory.Antidiarrhoeal activity: The extracts of Ficus bengalensis Linn (hanging roots) showed significantinhibitory activity against castor oil induced diarrhea and PGE2 induced enter pooling in rats. Theextract also showed significant reduction in gastrointestinal motility in charcoal meal tests in rats. Theresults showed its medicinal use as antidiarrhoeal agent (Pulok et al., 1998).Antioxidant activity: The antioxidant potential of various central medicinal plants has been exploredand it was found that the aerial roots of Ficus bengalensis have maximum antioxidant activity.Phytochemical assay showed the presence of flavonoids and tannins that might be responsible for theantioxidant activity of Ficus bengalensis (Savita and Huma, 2010).Immunomodulatory activity: The aqueous extract of the aerial roots of Ficus bengalensis wasevaluated for its effect on both specific and nonspecific immunity. This extract exhibited a significantincrease in percentage phagocytosis by human neutrophils in the in-vitro tests. It exhibited promisingimmunostimulant activity at doses of 50, 100, 200 and 400 mg/kg body weight in sheep red blood cells(SRBC), induced hypersensitivity reaction and hemagglutination reaction in rats. The aqueous extractwas found to stimulate the cell mediated and antibody mediated immune responses (Tabassum et al.,2008).Antistress and antiallergic activityVarious extracts of Ficus bengalensis for its antiallergic and antistress potential in asthma by milk-induced leukocytosis (antistress effect) and milk-induced eosinophilia (antiallergic effect) wasscreened. Aqueous, ethanolic and ethyl acetate extracts showed significant decrease in leukocytes andeosinophils while petroleum ether and chloroform extracts were inactive. This shows the application ofpolar constituents of Ficus bengalensis bark as antistress and antiallergic agents in asthma (Taur et al.,2007).Antidiabetic and ameliorative activity: The aqueous extract of Ficus bengalensis at a dose of500mg/kg/day exhibits significant antidiabetic and amelioferative activity as evidenced by histologicalstudies in normal and Ficus bengalensis treated streptozotocin induced diabetic rats. On the basis ofour findings, it could be used as an Antidiabetic and Ameliorative agent for better management ofdiabetes mellitus (Mahalingam G and Krishnan K, 2008).Wound healing activity: Since ancient times various herbs and medicinal plants have been ofmedicinal importance for treatment of different ailments. One of these is wound healing activity.Wound healing process holds various steps which involve coagulation, inflammation, formation ofgranulation exhibited antitumor activity in the potato disc bioassay. None of the tested extracts showedany marked inhibition on the uptake of calcium into rat pituitary cells GH4C1. The results of thispreliminary investigation support the traditional use of these plants in folk medicine for respiratorydisorders and certain skin diseases (Mousa et al., 1994).Antitumor: Fruit extracts exhibited anti-tumor activity in the potato disc bioassay. None of the testedextracts showed any marked inhibition on the uptake of calcium in to rat pituitary cells GH4C1.Theextracts of the four tested Ficus species had significant antibacterial activity, but no antifungal activity.The results of this preliminary investigation support the traditional use of these plants in folk medicinefor respiratory disorders and certain skin diseases. (Mousa et al., 1994).Antiatherogenic activity: One month treatment of alloxan diabetic dogs with a glycoside, viz.leucopelargonin derivative (100 mg/kg/day) isolated from the bark of Ficus bengalensis decreasedfasting blood sugar and glycosylated hemoglobin by 34 and 28%, respectively. Body weight wasmaintained in both the treated groups while the same was decreased significantly by 10% in the controlgroup. In cholesterol diet fed rats, as the atherogenic index and the hepatic bile acid level and the faecalexcretion of bile acids and neutral sterols increased, the HMGCoA reductase and lipogenic enzymeactivities in liver and lipoprotein lipase activity in heart and adipose tissue and plasma Lecithin-Cholesterol Acyltransferase LCAT activity and the incorporation of labeled acetate into free and estercholesterol in liver decreased significantly (Daniel et al., 2003).

National Conference on Emerging Trends in Science, Technology and Management, 11-12 Nov 2017, ISBN: 978-93-5281-325-4 Page 202
REFERENCES[1.] Agrawal V. Chauhan BM a study on composition and Hypolipidemic effect of dietary fibre from some
plant foods Plant foods hum Nutr:38(2):189-97,(1988).[2.] Augusti K T, Daniel RS, Cherian S, Sheela CG, Nair CR Effect of Leucopelargonin derivative from
Ficus bengalensis Linn on diabetic dogs Indian J Med Res:82-86 (1994).[3.] Augusti KT Hypoglycemic action of bengalenoside: Aglucoside isolated from Ficus Bengalensis Linn,
in normal and Alloxan diabetic rabbits. Indian J Physiol Pharmacol: 19:218-20, (1975).[4.] Chatterjee A. The treaties of Indian medicinal plants: Vol.I pp. 39,( 1997).[5.] Cherian S, Sheela and Augusti K T Insulin sparing action of Leucopelargonin derivative isolated from
Ficus bengalensis Linn Indian Journal of Experimental Biology;33:608- 611,(1995).[6.] Daniel RS, Devi KS, Augusti KT, Sudhakaran NCR (2003). Mechanism of action of antiatherogenic
and related effects of Ficus bengalensis flavonoids in experimental animals. Ind. J. Exp. Biol., 41(4):296-303.
[7.] Dhur and sons Pvt. Ltd. Calcutta:pp.673- 675(1958).[8.] Edwin JE, Sheeja JE (2006). Medicinal Plants. New Delhi, Bangalore, India, CBS Publishers and
Distributors, p. 135.[9.] Ephraim Philip Lensky and Helena Maaria Paavilainen, (2010),Traditional herbal medicines for modern
times, CRC press, page no.293.[10.]Geetha BS, Mathew BC, Augusti KT, Hypoglycemic effects of Leucodelphinidin derivative isolated
from Ficus bengalensis Indian J Physiol. Pharmacol.: 38(3):220, (1994).[11.]Govil JN, Singh VK, Shameema H (1993). Glimpses in Plant Research Vol. X. Medicinal Plants: New
Vistas of Research (part 1). New Dehli, India, Today & Tomorrow’s Printers and Publishers, p. 69[12.]Kumar RV, Augusti KT, Insulin sparing action of a leucocynidin derivative isolated from Ficus
bengalensis Linn Indian Journal of Biochemistry and Biophysics: 31:73-76,(1994).[13.]Mahalingam G, Krishnan K antidiabetic and amelioferative potential of Ficus bengalensis[14.]Manoj A, Urmila A, Bhagyashri W, Meenakshi V, Akshaya W, Kishore NG (2008). Anthelmintic
activity of Ficus bengalensis. Int. J. Green Pharm., 2(3): 170-172.[15.]Manoj A, Urmila A, Bhagyashri W, Meenakshi V, Akshaya W, Kishore NG (2008). Anthelmintic
activity of Ficus bengalensis. Int. J. Green Pharm., 2(3): 170-172.[16.]Medicinal plants of India, ICMR, New Delhi, vol.I, pp.415-416(1956).[17.]Mousa O, Vuorela P, Kiviranta J, Wahab SA, Hiltohen R, Vuorela H Bioactivity of certain
EgyptianFicus species J Ethnopharmacol:41:71- 6,(1994).[18.]Nadkarni K. M., (2006). Indian Plants and Drugs (with their medicinal properties and uses). 5th
edition., Asiatic Publishing House, 408, 409-410.[19.]Narayan DP, Purohit SS, Arun KS, Tarun K (2006). A Handbook of Medicinal Plants: A Complete
Source Book, India. Agrobios, p. 237[20.]Parekh J., Darshana J. and Sumitra. C. (2005). Efficacy of aqueous and methanol extracts of some
medicinal plants for potential antibacterial activity, Turk. J. Biol., 29:203-211.[21.]Parrotta John A, Healing Plants of Peninsular India. USA: CABI publishing; p. 517(2001).[22.]Patil VV, Pimprikar RB, Patil VR (2009). Pharmacognostical studies and evaluation of anti-
inflammatory activity of Ficus bengalensis. J. Young Pharm., 1: 49-53.[23.]Pulok KM, Kakali S, Murugesan T, Mandal SC, Pal M, Saha BP (1998). Screening of anti-diarrheal
profile of some plant extracts of a specific region of West Bengal, Indian. J. Ethnopharmacol., 60: 85-89.
[24.]Riffle R.L. (1998). The Tropical Look. Timber Press, Inc., Portland, Oregon.[25.]Savita D, Huma A (2010). Antioxidant potential of some Medicinal Plants of Central India. J. Can.
Ther., 1: 87-90[26.]Shukla, R. Investigations on the hypoglycaemic activity of Ficus bengalensis, PhD Thesis, Delhi
University, Delhi. 26b. Patent applied by P.S. Murthy, R. Shukla, Kiran Anand and K.M. Prabhu forwater soluble active hypoglycaemic compound isolated from Ficus bengalensis,(1995).
[27.]Syed RB (1990). Medicinal and Poisonous Plants of Pakistan. Karachi, Pakistan, Printas Karachi, p.201.
[28.]Tabassum K, Pratima T, Gabhe SY (2008). Immunological Studies onthe Aerial Roots of the IndianBanyan. Ind. J. Pharm. Sci., 70(3): 287–291.
[29.]Taur DJ, Nirmal SA, Patil RY, Kharya MD (2007). Antistress and Antiallergic effects of Ficusbengalensis bark in asthma. Nat. Prod. Res., 21(14): 1266-1270.
[30.]The Wealth of India, Volume-(F-G). In: A Dictionary of Indian Raw Materials and industrial products.Vol. 4. New Delhi: Council of Scientific and Industrial Research: p. 24- 26(1999).
[31.]Varanasi SN (2007). A Medico-historical review of Nyagrŏdha (Ficus bengalensis). Bull. Ind. Inst.Hist. Med., 37(2): 167-178.
[32.]Vikas VP, Vijay RP (2010). Ficus bengalensis. An Overview. Int. J. Pharm. Biol. Sci., 1(2): 1-11.[33.]Vohra, S.B. and Parasar, G.C. Antidiabetic studies on Ficus bengalensis Linn. Ind. J. Pharmacy: 32, 68-
69,(1970).[34.]Warrier P.K. Indian medicinal plants-A compendium of 500 species, Orient Longman Ltd,
Chennai,vol.III,PP.33-35(1996).

National Conference on Emerging Trends in Science, Technology and Management, 11-12 Nov 2017, ISBN: 978-93-5281-325-4 Page 203
BIOREMEDIATION OF HEAVY METALSPragya Pandey2*, Arjun Kumar3, Arifa Siddiqui1
Department of Biotechnology, Ashoka Institute of Technology and Management,Varanasi*[email protected]
Abstract - Inclusion of heavy metals in ecosystem has created an alarming situation to the human life andbiota. Bioremediation is the most prudent and promising technology available for the removal of heavymetals and preventing from further threats. Monerans play a key role in digesting the chemical compositionof heavy metals such as pseudomonas putida (removal of toluene), deinococcus radiodurans (exhaustsmercury and toulene from radioactive waste), pseudomonas aeruoginosa (removal ofcadmium),Aneurinibacillus & Aneurinilyticus (removes upto 50-53% arsenate and arsenite), Paracoccusdenitrificans (ammonium oxidation) etc. Plants can also be economically used in phytoremediation likeBrassica juncea (Indian mustard) removes upto 28% of lead, 48% of selenium and radioactive cesium137,Helianthus annuus can absorb heavy metal such as lead, cadmium, copper, manganese, Sorghastrum nutans(Indian grass) detoxify metals present in agro waste residues.On the whole it can be concluded thatphytoremediation is more economically beneficial as compared to other methods.
Keywords: Bioremediation, phytoremediation, Indian grass, agro waste, radioactive waste
1. INTRODUCTION
In recent years India is facing a rapid increase in industrialisation which has further led to accumulationof toxic heavy metals in environment. The unwholesomeness of heavy metals has crossed its thresholdlevel in ecosystem. It has put a great impact on various forms of ecosystem as well as affected properfunctioning of food web. Heavy metals such as arsenic, lead, cadmium, mercury, chromium, zinc,copper, nickel, uranium, etc are highly toxic even in very low concentrations. The situation has arisendue to consistent and uncontrolled mining of natural resources as well as anthropogenic activities.These heavy metals has the capability to alter the chemical and biological properties of soil, water andair as well. Every one of us is being exposed to contamination from past and present industrialpractices, emissions in natural resources (air, water and soil) even in the most remote regions. The riskto human and environmental health is rising and there is evidence that this cocktail of pollutants is acontributor to the global epidemic of cancer, and other degenerative diseases. The challenge is todevelop innovative and cost-effective solutions to decontaminate polluted environments, to make themsafe for human habitation and consumption, and to protect the functioning of the ecosystems whichsupport life.
2. SOURCES OF HEAVY METALS
Industrial sites have always been a source of heavy metals due to improper disposal of industrial wastewhich often consist of radioactive elements.Table 1: SOURCES: Gautam SP, CPCB, New Delhi.
HeavyMetals
Sources
Mercury Thermal power plants, flourescent lamps, hospital wasteArsenic Geogenic processes, smelting operations, thermal power plant, fuel burningLead Lead acid batteries, paints, E-waste, coal based thermal power plant, ceramics, bangle industryCadmium Zinc smelting, waste batteries, e-waste, paint, sludge, incinerations & fuel combustionChromium Mining, industrial coolants, chromium salts manufacturing, leather tanningCopper Mining, electroplating, smelting operationsNickel Smelting, electroplating
Besides the industrial sources of heavy metals, listed in table 1, lead exposure also occurs throughgasoline additives, food can solder, ceramic glazes, drinking water system, cosmetics, folk remedies,and battery/plastic recycling industry1. According to some work done at the DPSAR university, NewDelhi many brands of cosmetics like talcum powder, lipsticks, shampoos, ‘kajal’ and hair colourscontain heavy metals. (SS Agarwal).
3. INDIA DEALING WITH HEAVY METALS
There are many states in country which is densely dealing with toxicity of heavy metals and possess themain industrial sites.

National Conference on Emerging Trends in Science, Technology and Management, 11-12 Nov 2017, ISBN: 978-93-5281-325-4 Page 204
Data of CPCB show that Gujarat, Maharashtra and Andhra Pradesh contribute to 80% of hazardouswaste (including heavy metals) in India. According to press release of 2011 form Ministry ofEnvironment and Forest, Govt. of India , the states mentioned in the following table 2 is severelyfacing contagiousness of heavy metals.Table 2: Major heavy metals contaminated sites in India
Chromium Lead Mercury Arsenic CopperRanipet, TamilNadu
Ratlam, MadhyaPradesh
Kodaikanal,Tamil Nadu
Tuticorin,TamilNadu
Tuticorin, TamilNadu
Kanpur, UttarPradesh
Bandalamottu Mines,Andhra Pradesh
Ganjam,Orissa
WestBengal
Singbhum Mines,Jharkhand
Vadodara, Gujarat Vadodara, Gujarat Singrauli,MadhyaPradesh
Ballia andotherdistricts,UP
Malanjkahnd,Madhya Pradesh
Talcher, Orissa Korba, Chattisgarh
4. IMPLEMENTATION OF BIOREMEDIATION
In current scenario of country bioremediation can act as the best medicine for such degradativesituation. Bioremediation is a general concept that includes all those processes and actions that takeplace in order to biotransform an environment, already altered by contaminants, to its original status.Adhikari et al., (2004) also defined as bioremediation is the process of cleaning up hazardous wasteswith microorganisms or plants and is the safest method of clearing soil of pollutants. Bioremediationuses primarily microorganisms or microbial processes to degrade and transform environmentalcontaminants into harmless or less toxic forms (Garbisu and Alkorta,2003) Remediation methods ingeneral use include isolation, immobilization, toxicity reduction, physical separation andextraction..Bioremediation can be further implemented in two strategies: in situ and ex situbioremediation.Conventional methods for remediation:Solidification: It involves a process in which the contaminated matrix is stabilized, fixated orencapsulated into a solid material by the addition of a chemical compound such as cement. Althoughthe metal contaminants are chemically and/or physically bound to the matrix, they are not destroyed(Alloway, et al. 1990). They are contained in such as way that leaching into the environment isprevented or reduced (Roane, et. al 1996).Removal: It is the process of physically removing the metal contaminated soil from the current site anddiscarding the waste into a designated contaminated site. The removal of the contaminated soil is notcost effective and environmentally safe (Grimski, et al. 1996).Spray irrigation: Spray irrigation is typically used for shallow contaminated soils, and injection wellsare used for deeper contaminated soils.
5. ROLE OF MICROBES IN REMEDIATION
The bioremediation processes may be conducted by the autochthonous microorganisms, whichnaturally inhabit the soil/water environment undergoing purification, or by other microorganisms, thatderive from different environments. There are a number of microorganisms that can be used to removemetal from environment, such bacteria, fungi, yeast and algae (White et al., 1997 andVieiraandVolesky,2000).Microorganism can be further divided into following groups on the basis of adaptability and theiractivity towards hazardous metals: (source: M.Vidali 2001)Aerobic: In the presence of oxygen. Examples of aerobic bacteria recognized for their degradativeabilities are Pseudomonas, Alcaligenes, Sphingomonas, Rhodococcus, and Mycobacterium. Thesemicrobes have often been reported to degrade pesticides and hydrocarbons, both alkanes andpolyaromatic compounds. Many of these bacteria use the contaminant as the sole source of carbon andenergy.Anaerobic: In the absence of oxygen. Anaerobic bacteria are not as frequently used as aerobicbacteria. There is an increasing interest in anaerobic bacteria used for bioremediation ofpolychlorinated biphenyls (PCBs) in river sediments, dechlorination of the solvent trichloroethylene(TCE), and chloroform.
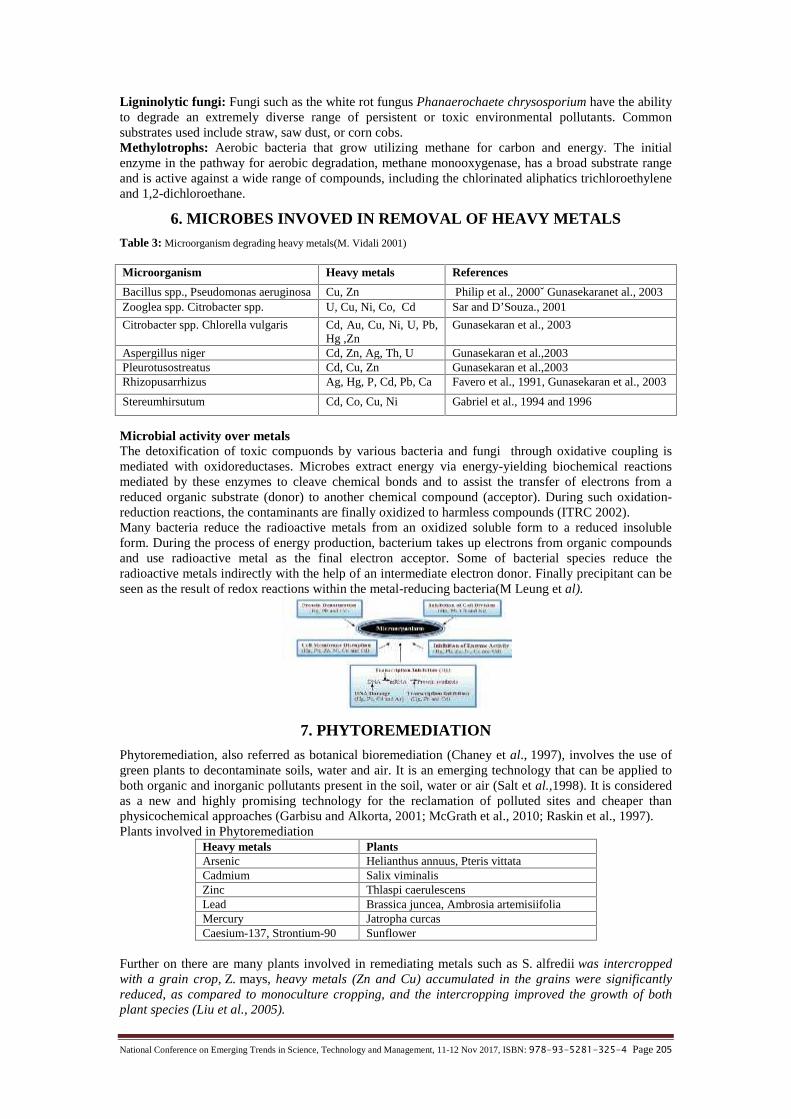
National Conference on Emerging Trends in Science, Technology and Management, 11-12 Nov 2017, ISBN: 978-93-5281-325-4 Page 205
Ligninolytic fungi: Fungi such as the white rot fungus Phanaerochaete chrysosporium have the abilityto degrade an extremely diverse range of persistent or toxic environmental pollutants. Commonsubstrates used include straw, saw dust, or corn cobs.Methylotrophs: Aerobic bacteria that grow utilizing methane for carbon and energy. The initialenzyme in the pathway for aerobic degradation, methane monooxygenase, has a broad substrate rangeand is active against a wide range of compounds, including the chlorinated aliphatics trichloroethyleneand 1,2-dichloroethane.
6. MICROBES INVOVED IN REMOVAL OF HEAVY METALSTable 3: Microorganism degrading heavy metals(M. Vidali 2001)
Microorganism Heavy metals References
Bacillus spp., Pseudomonas aeruginosa Cu, Zn Philip et al., 2000ˇ Gunasekaranet al., 2003Zooglea spp. Citrobacter spp. U, Cu, Ni, Co, Cd Sar and D’Souza., 2001Citrobacter spp. Chlorella vulgaris Cd, Au, Cu, Ni, U, Pb,
Hg ,ZnGunasekaran et al., 2003
Aspergillus niger Cd, Zn, Ag, Th, U Gunasekaran et al.,2003Pleurotusostreatus Cd, Cu, Zn Gunasekaran et al.,2003Rhizopusarrhizus Ag, Hg, P, Cd, Pb, Ca Favero et al., 1991, Gunasekaran et al., 2003
Stereumhirsutum Cd, Co, Cu, Ni Gabriel et al., 1994 and 1996
Microbial activity over metalsThe detoxification of toxic compuonds by various bacteria and fungi through oxidative coupling ismediated with oxidoreductases. Microbes extract energy via energy-yielding biochemical reactionsmediated by these enzymes to cleave chemical bonds and to assist the transfer of electrons from areduced organic substrate (donor) to another chemical compound (acceptor). During such oxidation-reduction reactions, the contaminants are finally oxidized to harmless compounds (ITRC 2002).Many bacteria reduce the radioactive metals from an oxidized soluble form to a reduced insolubleform. During the process of energy production, bacterium takes up electrons from organic compoundsand use radioactive metal as the final electron acceptor. Some of bacterial species reduce theradioactive metals indirectly with the help of an intermediate electron donor. Finally precipitant can beseen as the result of redox reactions within the metal-reducing bacteria(M Leung et al).
7. PHYTOREMEDIATION
Phytoremediation, also referred as botanical bioremediation (Chaney et al., 1997), involves the use ofgreen plants to decontaminate soils, water and air. It is an emerging technology that can be applied toboth organic and inorganic pollutants present in the soil, water or air (Salt et al.,1998). It is consideredas a new and highly promising technology for the reclamation of polluted sites and cheaper thanphysicochemical approaches (Garbisu and Alkorta, 2001; McGrath et al., 2010; Raskin et al., 1997).Plants involved in Phytoremediation
Heavy metals PlantsArsenic Helianthus annuus, Pteris vittataCadmium Salix viminalisZinc Thlaspi caerulescensLead Brassica juncea, Ambrosia artemisiifoliaMercury Jatropha curcasCaesium-137, Strontium-90 Sunflower
Further on there are many plants involved in remediating metals such as S. alfredii was intercroppedwith a grain crop, Z. mays, heavy metals (Zn and Cu) accumulated in the grains were significantlyreduced, as compared to monoculture cropping, and the intercropping improved the growth of bothplant species (Liu et al., 2005).
National Conference on Emerging Trends in Science, Technology and Management, 11-12 Nov 2017, ISBN: 978-93-5281-325-4 Page 206
8. MECHANISM OF PHYTOREMEDIATION
Sources: A State-of-the-Art report on Bioremediation, its Applications to Contaminated Sites in India,Ministry of Environment & Forests, Government of India. Phytoremediation can be further carried byfollowing methods:Phytosequestration: The three mechanisms of phytosequestration that reduce the mobility of thecontaminant and prevent migration to soil, water and air are as follows: Phytochemical complex in theroot zone: Phytochemicals can be exuded into the rhizosphere, leading to the precipitation orimmobilization of target contaminants in the root zone. This mechanism of phytosequestration mayreduce the fraction of the contaminant that is bioavailable. Transport protein inhibition on the rootmembrane: Transport proteins associated with the exterior root membrane can irreversibly bind andstabilize contaminants on the root surfaces, preventing contaminants from entering the plant. Vacuolarstorage in the root cells: Transport proteins are also present that facilitate transfer of contaminantsbetween cells. However, plant cells contain a compartment (the “vacuole”) that acts, in part, as astorage and waste receptacle for the plant. Contaminants can be sequestered into the vacuoles of rootcells, preventing further translocation to the xylem.Phytodegradation: Specifically, phytodegradation, also called “phytotransformation,” refers to theuptake of contaminants with the subsequent breakdown, mineralization, or metabolization by the plantitself through various internal enzymatic reactions and metabolic processes. Depending on factors suchas the concentration and composition, plant species, and soil conditions, contaminants may be able topass through the rhizosphere only partially or negligibly impeded by phytosequestration and/orrhizodegradation. In this case, the contaminant may then be subject to biological processes occurringwithin the plant itself, assuming it is dissolved in the transpiration stream and can be phytoextracted.Phytovolatilization: Phytovolatilization is the volatilization of contaminants from the plant either fromthe leaf stomata or from plant stems. Phytovolatilization occurs as growing trees and other plants takeup water and the contaminants. Some of these contaminants can pass through the plants to the leavesand volatilize into the atmosphere at comparatively low concentrations. Mercury has been shown tomove through a plant and into the air in a plant that was genetically altered to allow it to do so. Thethought behind this media switching is that elemental Hg in the air poses less risk than other Hg formsin the soil. This method is a specialized form of phytoextraction, that can be used only for thosecontaminants that are highly volatile. Mercury or selenium, once taken up by the plant roots, can beconverted into non-toxic forms and volatilized into the atmosphere from the roots, shoots, or leaves.For example, Se can be taken up by Brassica and other wetland plants, and converted into nontoxicforms which are volatilized by the plantsPhytostabilisation: Phytostabilization refers to the holding of contaminated soils and sediments inplace by vegetation, and to immobilizing toxic contaminants in soils. Phytostabilization is especiallyapplicable for metal contaminants at waste sites where the best alternative is often to hold contaminantsin place. Metals do not ultimately degrade, so capturing them in situ is the best alternative at sites withlow contamination levels (below risk thresholds) or vast contaminated areas where a large-scaleremoval action or other in situ remediation is not feasible.Rhizofiltration: Rhizofiltration can be defined as the use of plant roots to absorb, concentrate, and/orprecipitate hazardous compounds, particularly heavy metals or radionuclides, from aqueous solutions. .Rhizofiltration is effective in cases where wetlands can be created and all of the contaminated water isallowed to come in contact with roots. Contaminants should be those that sorb strongly to roots, such aslead, chromium (III), uranium, and arsenic (V). Roots of plants are capable of sorbing large quantitiesof lead and chromium from soil water or from water that is passed through the root zone of denselygrowing vegetation. Shallow lagoons have been engineered as wetlands and maintained as facultativemicrobial systems with low dissolved oxygen in the sediment. Groundwater or wastewater is pumpedthrough the system for the removal of contaminants by rhizofiltration. Wetlands have been used withgreat success in treating metals for many years. Long-term utilization of wetland plants and sulfate-reducing conditions result in an increase in pH and a decrease in toxic metals concentrations fortreatment of acid mine drainage.
9. CONCLUSION
Bioremediation has played a key role and saviour from further threats. Among all methods ofbioremediation, phytoremediation has found to be more economically profitable because inclusion ofmicrobes is costly and such process requires immense space and is facing problems of land scarcity.India has always been a mega diversified country. Being an agro based country, plants can be wellsuited for controlling virulence of heavy metals. There is less difficulty in bioavailability of resources.But somehow it is disadvantageous in the case where the toxicity of metals can easily enter food chain

National Conference on Emerging Trends in Science, Technology and Management, 11-12 Nov 2017, ISBN: 978-93-5281-325-4 Page 207
through plants when heavy metals are transferred in food crops. Such conditions can be avoided bykeeping food crops apart from crops used in remediation.
REFERENCES
1. Gautam SP, CPCB, New Delh,2011“Hazardous Metals and Minerals Pollution in India: Sources,Toxicity and Management”.
2. Gautam SP, CPCB, New Dellhi, RC Murty*,” Indian Institute of Toxicology Research, personalcommunication”.
3. Garbisu and Alkorta,2003” Basic concepts on heavy metal soil bioremediation”, The European Journalof Mineral Processing and Environmental Protection Vol.3, No.1, 1303-0868, 2003, pp. 58-66.
4. Mandal , T. J. Purakayastha , S. Ramana, S. Neenu , Debarati Bhaduri, K. Chakraborty , M. C. Mannaand A. Subba Rao,2014” Status on Phytoremediation of Heavy Metals in India- A Review” DOI:10.5958/0976-4038.2014.00609.5.
5. Chandrakant S Karigar. Shwetha s Rao ,2011”Role of Microbial Enzymes in the Bioremediation ofPollutants: A Review”.
M. Leung, “Bioremediation: techniques for cleaning up a mess,” Journal of Biotechnology, vol. 2, pp. 18–22,2004. View at Google Scholar.
Mohammad Iqbal Lone,Zhen-li He, Peter J. Stoffella, and Xiao-e Yang,2008” Phytoremediation of heavymetal polluted soils and water: Progresses and perspectives” doi: 10.1631/jzus.B0710633
M. Vidali, “Bioremediation. An overview,” Pure and Applied Chemistry, Myung vol. 73, no. 7, pp. 1163–1172, 2001. View at Google Scholar · View at Scopus
Chae Jung* and Iain Heavy metal contamination of soils and plants in the vicinity of a lead-zinc mine, KoreaThornton”.
Adhikari, T., Kumar, A., Singh, M .V., Subba Rao, A., 2010. Phytoaccumulation of lead by selected wetlandplant species. Communications of Soil Science and Plant Analysis 41, 2623-2632.

National Conference on Emerging Trends in Science, Technology and Management, 11-12 Nov 2017, ISBN: 978-93-5281-325-4 Page 208
BIOSENSORS IN ENVIRONMENTAL MONITORINGSaba Khan2*, Garima Rai1, Pragya Rai3
Department of Biotechnology, Ashoka Institute of Technology and Management, Varanasi, India*[email protected]
Abstract - A biosensor is an analytical device for the detection of a substance that combines a biologicalcomponent with a physical component with a transducer. Biosensors are constructed in such a way that theproduced signal is proportional to the concentration of a chemical to which the biological element can react.Increased concentration in the environment has created a need for reliable monitoring of these substancesin air, soil, and especially water. For the environmental monitoring, the aim of a biosensor is the detection ofan environmental signal usually the presence of chemical and toxic compounds.With high specificity,sensitivity and fast time response, biosensors provide an exceptional analytical system for the monitoring ofenvironmental pollutants. Among toxic compounds determination of heavy metals, phenolic compounds,mercury, organophosphorous and carbamate pesticides is the major concern, considering their extensivecontribution in increased pollutant level.With further advancement in the miniaturization, geneticengineering, nanotechnology and due to diverse effect of the pollutant on the biological system, a number ofadvance biosensors have been developed and are still in progress.The intention of this article is to reflect the advances and describe the trends on biosensors forenvironmental application.
Keywords-biosensors, sensing elements, enzymes, transducer, pollutant, heavy metals
1. INTRODUCTION
Biosensors are generally defined as an analytical device, incorporating a biological or biologicallyderived sensing element either intimately associated with or integrated within aphysicochemicaltransducer (Turner, 1989).Biosensors typically consist of a biological sensing element(e.g. enzyme, receptor, antibody microorganism or DNA) in intimate contact with a chemical orphysical transducer (e.g. electrochemical, optical,piezoelectric transducers,mass or thermal).The main component of biosensor are bioreceptors, biotransducer component, and electronic systemwhich include a signal amplifier, processor, and display. Transducers and electronics can be combined,e.g., inCMOS-based microsensor systems.The bioreceptor, uses biomolecules from organisms orreceptors modeled after biological systems to interact with the analyte of interest. This interaction ismeasured by the biotransducer which outputs a measurable signal proportional to the presence of thetarget analyte in the sample.Bioreceptors use in biosensors are- Antibody/antigen
Artificial binding proteins
Enzymes
Affinity binding receptors
Organelles
Cells Nucleic acid
Types of BiosensorBiosensors can be classified by their biotransducer type. The most common types of biotransducersused in biosensors are-
1) Electrochemical Biosensors2) Optical Biosensors3) Electronic Biosensors4) Piezoelectric Biosensors5) Gravimetric Biosensors6) Pyroelectric Biosensors
Applications of Biosensors-The applications of different types of biosensors are: Food analysis
Study of Biomolecules and their interactions
Drug development, crime detection
National Conference on Emerging Trends in Science, Technology and Management, 11-12 Nov 2017, ISBN: 978-93-5281-325-4 Page 209
Medical diagnosis (glucose monitoring, DNA biosensors)
Environmental field monitoring
Industrial process control
Manufacturing of pharmaceuticals and replacement of organs
2. ENVIRONMENTAL MONITORING
The environment around us consists of basically three phases: water, air and soil. Water, a basicrequirement for any population, can be polluted by natural or man-made chemicals causing changes toaqueous flora and fauna. Soil pollution, like water pollution can lead to contamination of aquifersystems.In recent years, a growing number of initiatives and legislative actions for environmental pollutioncontrol, with particular emphasis on water quality control, have been adopted inparallel with increasingscientific and social concern in this area. The need for disposable systems or tools for environmentalmonitoring has encouraged the development of newtechnologies and more suitable methodologies, the ability to monitor the increasing number of analysesof environmental relevance as quickly and as cheaply as possible, and even the possibility of allowingon-site field monitoring. In this respect, biosensors have demonstrated a great potential in recent yearsand thus arise as proposed analytical tools for effective monitoringin these programs. The main advantages offered by biosensors over conventional analytical techniquesare thepossibility of portability, of miniaturisation and working on-site, and the ability to measurepollutants in complex matrices with minimal sample preparation. Although many of the systemsdeveloped cannot compete with conventional analytical methods in terms of accuracy andreproducibility, they can be used by regulatory authorities and by industry to provide enoughinformation for routine testing and screening of samples.
3. APPLICATION IN ENVIRONMENTAL MONITORING
1)Biosensors for Monitoring Pesticides:Pesticides can be classified into three different groups:insecticides, herbicides and fungicides. Insecticides are usually organophosphorus compounds (e.g.parathion), organochlorine compounds (e.g. DDT) or carbamates (e.g. carbofuran). Pesticides,depending on their water solubility can eitherremain in the soil to be broken down by the action ofcertain organisms (Lewis, 1992), or washed off, eventually washing into rivers and sometimes watersupplies.Many pesticide biosensors are based on the inhibition of the enzyme cholinesterase byorganophosphorous compounds. A biosensor for the detection of organophosphate and carbamateinsecticides was based on the action of two enzymes, acetylcholinesterase and choline oxidase (Martyet al., 1992). Acetylcholinesterase acts on acetylcholine to form choline, while choline oxidase oxidisescholine to betain with the concurrent production of hydrogen peroxide. The inhibition ofacetylcholinesterase by pesticides is measured as decreased formation of hydrogen peroxide asmonitored amperometrically at 700mV Vs Ag/AgC1 reference. The limit of detection was 10nmparaoxon, with wet stability being two months at 4°C.An immunosensor for the herbicide atrazine has been described by Scheper & Muller (1994).Polyclonal sheep antibodies were used to bind atrazine and alkaline phosphate labeled anti-antibodieswere used to bind atrazine antibodies. After washing, enzyme substrate was added. The amount ofbound antibody could be determined since the substrate was cleaved by the enzyme resulting in afluorescing product. The fluorophor was excited at 365nm and the fluorescence measured at 450nm,atrazine levels as low as 10-2 pmol/ml could be detected.2)BOD Measurement: Biochemical oxygen demand (BOD or BOD5) is a parameter widely usedtoindicate the amount of biodegradable organic material in water. Its determination is time consuming,and consequently it is not suitable for online process monitoring. Fast determination of BOD could beachieved with biosensor-based methods. Most BOD sensors rely on the measurement of the bacterialrespiration rate in close proximity to a transducer, commonly of theClark type. With this system thereal time analysis of multiple samples was possible. These handy devices have been marketed primarilyfor food and pharmaceutical industries. Moreover, an optical biosensor for parallel multi-sampledetermination of biochemical oxygen demand in wastewater samples has been developed by Kwok etal. The biosensor monitors the dissolvedoxygen concentration in artificial wastewater through anoxygen sensing film immobilized on the bottom of glass sample vials. Then, the microbial sampleswere immobilized on this film and the BOD value was determined from the rate of oxygen
National Conference on Emerging Trends in Science, Technology and Management, 11-12 Nov 2017, ISBN: 978-93-5281-325-4 Page 210
consumption by the microorganisms in the first 20 minutes n Escherichia coli ElectrochemicalWastewater Zinc, cobalt and copper.3)Biosensors for Monitoring Polluting Gases:Increasing regulations concerning control ofenvironmentally relevant gases such as NOx, SOx, CO2, methane and ozone have provided a need forreliable monitoring of air pollution. One paper by Suzuki et al. (199t), described a disposableamperometric carbon dioxide sensor using immobilised S-17 autotrophic bacteria. The bacteria wereimmobilised in an alginate gel behind a gas permeable membrane, using an oxygen electrode as atransducer. As the bacteria metabolised any CO 2 present, using 02 in the process, there was aconcurrent decrease in the oxygen levels in the gel. The response time was between one to threeminutes and the sensor could detect between 0.5mM and 3.5mM CO 2 in aqueous solution.4)Heavy Metal Measurement:Heavy metals are currently the cause of some of the most seriouspollution problems. Even in small concentrations, they are a threat to the environment and humanhealth because they are non-biodegradable. People are constantly been exposed to heavy metals in theenvironment. The dangers associated with heavy metals are due to the ubiquitous presence of theseelements in the biosphere, their bioavailability from both natural and anthropogenic sources, and theirhigh toxicity. Thus, there are several cases described in the literature where exposure of populations tothese pollutants has resulted in severe damage to their health, including a significant amount of deaths.Many of the bacterial biosensors developed for analysis of heavy metals in environmental samples,make use of specific genes responsible for bacterial resistance to these elements, such as biologicalreceptors. Bacterial strains resistant to a number of metals such as zinc, copper, tin, silver, mercury andcobalt have been isolated aspossible biological receptors.
4. RECENT ADVANCES IN BIOSENSORS
Imperative utilization of biosensors has acquired paramount importance in the field of drug discovery,biomedicine, food safety standards, defense, security, and environmental monitoring. This has led tothe invention of precise and powerful analytical tools using biological sensing element asbiosensor.Recent advances in biological techniques and instrumentation involving fluorescence tag tonanomaterials have increased the sensitive limit of biosensors. Use of aptamers or nucleotides,affibodies, peptide arrays, and molecule imprinted polymers provide tools to develop innovativebiosensors over classical methods. Integrated approaches provided a better perspective for developingspecific and sensitive biosensors with high regenerative potentials.Some Advanced Biosensors are1)Nanomaterials-Based Biosensors:Wide range of nanomaterials ranging from gold, silver, silicon, andcopper nanoparticles, carbon-based materials, such as graphite, grapheme, and carbon nanotubes, areused for developing biosensor.In addition, nanoparticle-based materials provide great sensitivity and specificity for developingelectrochemical and other types of biosensors. Among the metallic nanoparticles, gold nanoparticleshave potential use because of their stability against oxidation (Hutter and Maysinger, 2013) and almosthave no toxicity, while other nanoparticles like silver which oxidize and have toxic manifestation, ifused for internally in medicine such as drug delivery. Use of cantilever size (milli-, micro-, and nano-cantilevers) biosensors are even critically analyzed due to their application potential in various fields.2) Quantum Dots Based Optical Biosensors:Semiconductor quantum dots (Qdots) are one of the mostpromising optical imaging agents for in vitro (biosensors and chemical sensors) and in vivo(noninvasive imaging of deep tissues) diagnosis of diseases due to their ultra-stability and excellentquantum confinement effects. The surface modification and decoration of Qdots have inspired thedevelopment of novel multimodal probes based biosensors through linking with peptides, nucleic acids,or targeting ligands. Since the fluorescence intensity of Qdots is highly stable and sensitive.Qdots havebeen widely investigated for possibilities of sensing pH, ions, organic compounds, and biomolecules(nucleic acids, protein, and enzymes), as well as other molecules of biological interests.3)Nanoparticle-Based Electrochemical Sensors:An electrochemical sensor for copper (Cu2+) ions wasaccomplished with detection limit of less than 1 pM [47]. Electrodes were initially established withgold nanoparticles, and then the gold colloid surface was subsequently functionalized with cysteine forsensing Cu2+ ions. Single-walled carbon nanotubes (SWNTs) impregnating porous fibrous materials(e.g., fabrics and papers) were employed to render biosensors high performance.A paper-based sensorwas successfully employed to detect microcystin-LR (MC-LR) in Tai lake sample, with detection limitof 0.6 ppb and at least 28 times quicker response period in comparison to that obtained by an enzyme-linked immunosorbent assay. This nanoparticle-based electrochemical sensing technology facilitatesthe preparation of several other sensitive environmental sensors.Such nanoparticle-based

National Conference on Emerging Trends in Science, Technology and Management, 11-12 Nov 2017, ISBN: 978-93-5281-325-4 Page 211
electrochemical sensing technology would improve prominent tool performance for detecting variouspathogens and their potential toxins as well as for on-site monitoring of environmental pollutants.4) Magnetic-Relaxation Sensors:Magnetic-relaxation sensors have been established based on theswitching events between target analyte-induced aggregation and disaggregation of magneticnanoparticles (MNPs).Magnetic-relaxation switches-based sensing technology is used for detectinganalytes, especially environmental toxins in various matrices. In relevance to radiofrequency,magnetic-relaxation switches-based assays enable sensing such complex and nonoptical matrices (e.g.,multicomponent environmental samples, blood, or culture media).In addition, magnetic-relaxationswitches-based methodologies provide advantages over similar detection tests in vitro. Specific andhighly sensitive assays with the use of MRS sensors were able to quantitatively determine bacterialpathogens in environmental samples.Due to advantage of magnetic-relaxation switches-based assay, itis regarded as a potential platform for rapid monitoring of hazardous pollutants in complexenvironmental samples and may extend its use of choices in wider fields.5) Carbon Nanotube Based Biosensors:The unique chemical and physical properties of carbonnanotubes have introduced many new and improved sensing devices. Early cancer detection in in vitrosystems is one of the most recent, attractive, and breakthrough inventions from carbon nanotube basedbiosensors. Carbon nanotubes have been widely investigated for promising applications indehydrogenase, peroxidase and catalase, DNA, glucose, and enzyme sensors. Carbon nanotube-basedelectrochemical transduction demonstrates substantial improvements in the activity of amperometricenzyme electrodes, immunosensors, and nucleic-acid sensing biosensors.6) MEMS/NEMS Based Biosensors:The growing need for miniaturization of biosensors has resulted inincreased interests in microelectromechanical systems (MEMS), nanoelectromechanical systems(NEMS), and microfluidic or lab-on-a-chip systems based biosensors. The different methods that havebeen used in MEMS based biosensors include optical, mechanical, magnetic, and electrochemicaldetections. Organic dyes, semiconductor quantum dots, and other optical fluorescence probes havebeen used in optical detection methods, while conjugation of magnetic, paramagnetic or ferromagneticnanoparticles has been used in magnetic MEMS biosensors.Such miniaturized systems offer moreaccurate, specific, sensitive, cost-effective, and high performance biosensor devices.7) Graphene Based Biosensors: Graphene based biosensors have attracted significant scientific andtechnological interests due to the outstanding characteristics of graphene, such as low production cost,large specific surface area, good biocompatibility, high electrical conductivity, and excellentelectrochemical stability. The 2D structure of graphene favors π-electron conjugation and makes itssurface available to other chemical species. Therefore, graphene is emerging as a preferred choice forthe fabrication of various biosensor devices in tissue engineering.Some types of graphene based biosensor- Graphene Based Glucose Biosensor
Graphene Quantum Dots Based Biosensors
Graphene-Based Cholesterol Biosensor
Graphene-Based Hydrogen Peroxide Biosensor
Nonenzymatic Biosensors using graphene electrodes8)Silica, Quartz/Crystal and Glass Biosensors:Recent methods in the development of biosensorsresulted in the use of silica, quartz or crystal and glass materials due to their unique properties. Amongthese, silicon nanomaterials have greater potential for technological advances in biosensor applicationsdue to their biocompatibility, abundance, electronic, optical, and mechanical properties. Furthermore,silicon nanomaterials have no toxicity which is an important prerequisite of biomedical and biologicalapplications. Silicon nanomaterials (Peng et al., 2014; Shen et al., 2014) offer wide range ofapplications ranging from bioimaging, biosensing and cancer therapy.The wire- and electrode-lessquartz–crystal-microbalance biosensors provide another platform for analyzing the interactionsbetween biomolecules with high sensitivity. Considering the unique features of silica or quartz or glassmaterials, several new biosensors were developed with high-end technology for improvingbioinstrumentation to biomedicine technology yet cost-effectiveness and biosafety requires attention(Ogi, 2013; Turner, 2013; Peng et al., 2014; Shen et al., 2014).9) Genetically Encoded or Synthetic Fluorescent Biosensors:Development of tagged biosensor usinggenetically encoded or synthetic fluorescence paved way to understand the biological process includingvarious molecular pathways inside the cell (Kunzelmann et al., 2014).More recently, fluorescentbiosensors were developed for analyzing motor proteins using single molecule detection with specificanalyte concentration.Considering the advent of in vivo imaging with small molecule biosensors, abetter understanding of cellular activity and many other molecules ranging from DNA, RNA, andmiRNA have been identified (Khimji et al., 2013; Turner, 2013; Johnson and Mutharasan, 2014). Now

National Conference on Emerging Trends in Science, Technology and Management, 11-12 Nov 2017, ISBN: 978-93-5281-325-4 Page 212
the transformation in this field requires whole genome approach using better optical based geneticbiosensors. It is also now widely accepted that optical-based biosensors with a combination offluorescence and small molecules/nanomaterials have achieved greater success in terms of applicationsand sensitivity.10)Microbial Biosensors through Synthetic Biology and Genetic/Protein Engineering: More recenttrend in environmental monitoring and bioremediation is to utilize state-of-the-art innovativetechnologies based on genetic/protein engineering and synthetic biology to program microorganismswith specific signal outputs, sensitivity, and selectivity. For example, live cell having enzyme activityto degrade xenobiotic compounds will have wider applications in bioremediation (Park et al., 2013).Similarly, microbial fuel-based biosensors have been developed with aim to monitor biochemicaloxygen demand and toxicity in the environment.Interestingly, the applications of microbial biosensorsare diverse ranging from environmental monitoring to energy production. Innovative strategies willprovide novel biosensors with high sensitivity than selectivity from microbial origin from eukaryotes toengineered prokaryotes. In future, these microbial biosensors (Du et al., 2007; Sun et al., 2015) willhave wider applications in monitoring environmental metal pollution and sustainable energyproduction.Different Research Areas Using Biosensors
Research Researchgroup/ country Development of biosensor for detection of bacteria Technical university of Madrid, Spain Development of prostate cancer detection method using
photonic crystal biosensorThe University of Texas at San Antonio, US
Development of rapid test for zika virus diagnosis Washington University, USA 10-minute test uses drops of blood or saliva for early
detection of cancersRam Group's Israeli bio-sensor division
Development of a new, rapid biosensor for the earlydetection of the human influenza A (H1N1) virus.
Tokyo Medical and Dental University, Japan
Develop new antibody-linked biosensor to track drugconcentration in the blood
The lab of Kai Johnsson at EPFL
Development of improved method for using graphene-basedtransistors to detect harmful genes
Developers of India and japan
Development of biosensor system that can detect differentantibiotics in human blood
The University of Freiburg
5. FUTURE PERSPECTIVES
The demand and need for using biosensor is increasing for rapid analysis with cost-effectivenessrequire bio-fabrication that will pave way to identify cellular to whole animal activity with a detectionlimit of high accuracy for single molecules. There has been a growing interest in biosensor research indifferent area. However, the progress has remained limited. Even though numerous optical,electrochemical, magnetic, acoustic, thermometric, and piezoelectric sensors have been reportedshowing great sensitivity and sensibility.Of considerable interest, we summarize recent progress in environmental sensor-based research with“individual or combinatorial” uses of fluorescent nanoparticles and magnetic nanomaterials asenvironmental monitoring tool, and the utility of newly developed nanoparticles for detection ofvarious environmental pollutants. Applications of nanoparticle-based sensors in widespreadsurveillance of environmental toxicants are due to their sensitivity, selectivity, speediness, andaffordability. The detection of environmental pollutants with fewer steps is possible with nanoparticle-based sensors (e.g., optical and magnetic resonance sensors).Overall, better combination of biosensing and bio-fabrication with synthetic biology approaches usingeither electrochemical or optic or bio-electronic principles or a combination of all these will be the keyfor successful development of powerful biosensors for modern era.
6. CONCLUSIONS
The vast majority of biosensors for environmental analysis have not yet made significant commercialimpact. If biosensors are to be made commercially viable, they need to be at least as sensitive asconventional techniques, cheaper and easier to operate. Conventional analytical techniques such as gaschromatography and high pressure liquid chromatography have the advantage of being able to identifya range of pollutants, while biosensors can usually only detect at most one class of compounds. Forenvironmental monitoring biosensors would be applicable to situations where the polluting compound

National Conference on Emerging Trends in Science, Technology and Management, 11-12 Nov 2017, ISBN: 978-93-5281-325-4 Page 213
was known, or had been identified. The health and safety of workers applying pesticides or indeed anyother chemical could be protected by providing them with biosensors for monitoring the levels ofpesticides or chemicals in the air around them. Biosensors could contribute towards monitoring theprogress of clean-up operations after environmental spillages of certain chemicals. It is clear that thefield of environmental monitoring presents a number of niche opportunities, which biosensors couldprofitably exploit.
REFERENCES[1.] Lewis, Lord of Newnham (1992) (chairman). Commission on Environmental Pollution, 16th Report.
HMSO, London.[2.] Marty, J.L., Sode, K. & Karube, I. (1992). Biosensor for detection of organophosphate and carbamate
insecticides. Electroanalysis, 4, 249-252.[3.] Scheper, T.H. & Muller, C. (1994). Optical sensors for biotechnological applications. Biosensors &
Bioelectronics, 9, 73-83.[4.] Turner, A.P.F. (1989). Current trends in biosensor research and development. Sensors & Actuators, 17,
433-450.[5.] A.P. F. Turner, “Biosensors: sense and sensibility,” Chemical Society Reviews, vol. 42, no. 8, pp. 3184–
3196, 2013. View at Publisher · View at Google Scholar · View at Scopus[6.] Kunzelmann S., Solscheid C., Webb M. R. (2014). Fluorescent biosensors: design and application to
motor proteins. EXS 105, 25–47.10.1007/978-3-0348-0856-9_2 [PubMed] [Cross Ref][7.] Khimji I., Kelly E. Y., Helwa Y., Hoang M., Liu J. (2013). Visual optical biosensors based on DNA-
functionalized polyacrylamide hydrogels. Methods 64, 292–298.10.1016/j.ymeth.2013.08.021 [PubMed][Cross Ref]
[8.] Johnson B. N., Mutharasan R. (2014). Biosensor-based microRNA detection: techniques, design,performance, and challenges. Analyst 139, 1576–1588.10.1039/c3an01677c [PubMed] [Cross Ref]
[9.] Hutter E., Maysinger D. (2013). Gold-nanoparticle-based biosensors for detection of enzyme activity.Trends Pharmacol. Sci. 34, 497–507.10.1016/j.tips.2013.07.002 [PubMed] [Cross Ref]
[10.]Ogi H. (2013). Wireless-electrodeless quartz-crystal-microbalance biosensors for studying interactionsamong biomolecules: a review. Proc. Jpn. Acad. Ser. B Phys. Biol. Sci. 89, 401–417.10.2183/pjab.89.401 [PMC free article] [PubMed] [Cross Ref]
[11.]Park K., Jung J., Son J., Kim S. H., Chung B. H. (2013). Anchoring foreign substances on live cellsurfaces using Sortase A specific binding peptide. Chem. Commun. (Camb) 49, 9585–9587.10.1039/c3cc44753g [PubMed] [Cross Ref]
[12.]Wang, J., Lin, Y. & Chen, Q. (1993). Organic phase biosensors based on the entrapment of enzymeswithin poly (ester-sulfonic acid) coatings. Electroanalysis, 5, 23-28.
[13.]Skladal, P. & Mascini, M. (1992). Sensitive detection of pesticides using amperometric sensors based oncobalt phthalocyanine-modified composite electrodes and immobilised cholinesterases. Biosensors &Bioelectronics, 7, 335-343.
[14.]Smit, M.H. & Rechnitz, G.A. (1993). Toxin detection using a tyrosinase coupled oxygen electrode.Analytical Chemistry, 65,380-385.
[15.]Suzuki, H., Tamiya, E. & Karube, I, (1991). Disposable amperometric carbon dioxide sensor employingbacteria and a minature oxygen electrode. Electroanalysis, 3, 53-57.
[16.]Peng F., Su Y., Zhong Y., Fan C., Lee S. T., He Y. (2014). Silicon nanomaterials platform forbioimaging, biosensing, and cancer therapy. Acc. Chem. Res. 47, 612–623.10.1021/ar400221g[PubMed] [Cross Ref]

National Conference on Emerging Trends in Science, Technology and Management, 11-12 Nov 2017, ISBN: 978-93-5281-325-4 Page 214
ICI REDUCTION EFFICIENTLYUSING WINDOW FUNCTIONS AND THEIR
COMPARISON
Deepak Kumar Singh1, Kumar Arvind2
Assistant ProfessorDepartment of Electronics & Communication EngineeringAshoka Institute of Technology and Management, Varanasi
1E-mail: [email protected]: [email protected]
Abstract— In Orthogonal Frequency Division Multiplexing (OFDM) multi carrier modulation techniqueis used for high data rate stream transmission. These carriers are orthogonal to each other. The guardbands are not used in Orthogonal Frequency Division Multiplexing (OFDM) system. With the help ofOFDM technique the spectrum of users can overlap and enhance the spectrum efficiency of the system. Inthis paper we are used Kaiser, Hamming, Hann, Blackman and Gaussian window functions. With the helpof these window functions we are comparing their ICI and power of desired receive signal. So that weenhance the quality of OFDM modulated transmission system.
Ketwords— Frequency Spectrum, SIR, Power of Desired Signal, Fading and AWGN, OFDM, ICI.
1. INTRODUCTION
Orthogonal Frequency Division Multiplexing (OFDM) is a multi-carrier modulation technique, inwhich a single high rate data-stream is first divided into multiple low rate data streams and is thenmodulated using sub-carriers which are orthogonal to each other [3]. Major advantages of OFDM areits multi-path delay spread tolerance and efficient spectral usage by allowing overlapping in thefrequency domain. Also another significant advantage is that the modulation and demodulation can bedone in computationally efficient way using IFFT and FFT operations [4]. In addition to above, OFDMhas several favorable properties like high spectral efficiency, robustness to channel fading, immunity toimpulse interference, uniform average spectral density, capacity to handle very strong echoes and non-linear distortion [5, 6]. Hence in multi-carrier modulation, the most commonly used technique isOrthogonal Frequency Division Multiplexing (OFDM) which has recently become very popular inwireless communication. OFDM is a promising modulation technique which can be used in many newbroadband communication systems.One of the major limitations of OFDM systems is Inter Carrier Interference (ICI). OFDM system isexposed to the risk of being attacked or harmed by frequency-offset errors between the transmitted &received signals, which may due to Doppler shift in the channel or by difference between theTransmitters and receiver local oscillator frequencies. Hence subcarriers will be no more orthogonal toeach other which results in inter-carrier interference (ICI). If ICI should be properly compensatedotherwise it will results in power leakage among the subcarriers and orthogonality between them willbe lost which results in degradation of system performance.
2. WINDOW FUNCTION BASED OFDMAA. OFDM Signal on Continuous Time AxisIn OFDM each sub-carrier is modulated independently with complex modulation symbol vector. Letus consider an OFDM signal consists of N subcarriers spaced by f Hz. The kth subcarriers for symbolduration [0, T] is expressed as,( ) = ∆ 1If there are N different users i.e. N sub-carriers OFDM system, nth signal block is represented as,
( ) = 1√ , ( − ) 2Where Sn,k is the constellation vector of kth sub-carrier in nth block.
Entire continuous time signal,
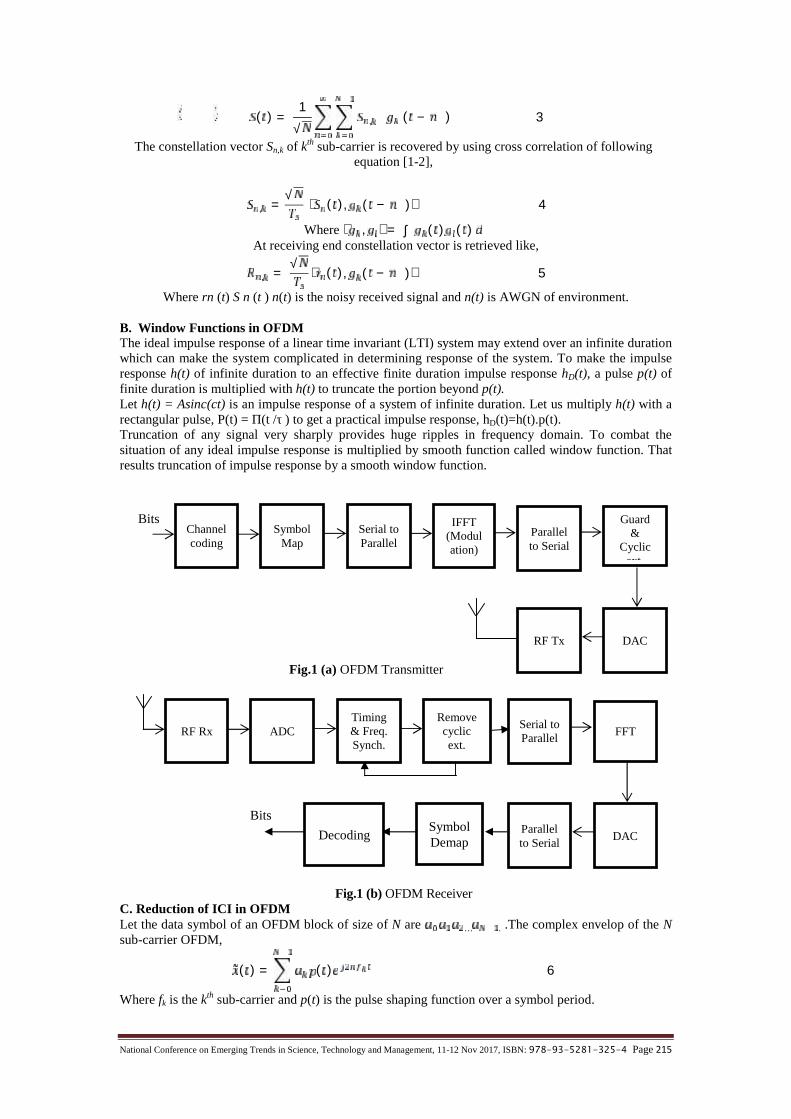
National Conference on Emerging Trends in Science, Technology and Management, 11-12 Nov 2017, ISBN: 978-93-5281-325-4 Page 215
( ) = 1√ , ( − ) 3The constellation vector Sn,k of kth sub-carrier is recovered by using cross correlation of following
equation [1-2],
, = √ ⟨ ( ), ( − )⟩ 4Where ⟨ , ⟩ = ∫ ( ) ( )
At receiving end constellation vector is retrieved like,
, = √ ⟨ ( ), ( − )⟩ 5Where rn (t) S n (t ) n(t) is the noisy received signal and n(t) is AWGN of environment.
B. Window Functions in OFDMThe ideal impulse response of a linear time invariant (LTI) system may extend over an infinite durationwhich can make the system complicated in determining response of the system. To make the impulseresponse h(t) of infinite duration to an effective finite duration impulse response hD(t), a pulse p(t) offinite duration is multiplied with h(t) to truncate the portion beyond p(t).Let h(t) = Asinc(ct) is an impulse response of a system of infinite duration. Let us multiply h(t) with arectangular pulse, P(t) = Π(t /τ ) to get a practical impulse response, hD(t)=h(t).p(t).Truncation of any signal very sharply provides huge ripples in frequency domain. To combat thesituation of any ideal impulse response is multiplied by smooth function called window function. Thatresults truncation of impulse response by a smooth window function.
Fig.1 (b) OFDM ReceiverC. Reduction of ICI in OFDMLet the data symbol of an OFDM block of size of N are … . .The complex envelop of the Nsub-carrier OFDM, ( ) = ( ) 6Where fk is the kth sub-carrier and p(t) is the pulse shaping function over a symbol period.
DACRF Tx
Parallelto Serial
Guard&
Cyclicext.
Serial toParallel
IFFT(Modulation)
SymbolMap
BitsChannelcoding
Fig.1 (a) OFDM Transmitter
DACParallelto Serial
Serial toParallel
FFTTiming& Freq.Synch.
Removecyclicext.
ADCRF Rx
SymbolDemapDecoding
Bits

National Conference on Emerging Trends in Science, Technology and Management, 11-12 Nov 2017, ISBN: 978-93-5281-325-4 Page 216
The final modulated block,( ) = ( ) 7Where fc is the carrier frequency. If the data symbol are uncorrelated,, ∗ = 1;0; =≠ 8
Considering received signal frequency offset of f ′ and a phase error of Φ the received signal aftercoherent demodulation with carrier fc,( ) = ( ) ф 9Now nth sub-channel coherent demodulator gives [41],= ( )= ( ) ( ф)= ф (− ) + ф ( − − ), 10
Where ( ) ↔ ( )The first part of the equation is desired signal and the second part is ICI signal.
Now power of desired signal,= ф (− ) = | | | ( )| 11and that of ICI power,= ф ( − − ),
= ( − + ) ( − +,, )= | ( − + )|, 12
Since data symbols are uncorrelated.= | | | ( )|∑ | ( − + )|, 13Various Window functions used
3. RESULTS
This section will analyze the performance of OFDM system where window function based symbols areused as the base band signal. Three different window functions named Kaiser, Hamming, Gaussian,Blackman and Hann are used for comparison. We plot the power of desired signal, power of ICI signaland signal to interference ratio (SIR) against the frequency offset for each window function case.
0 2 4 6 8
x 10-8
0.90.95
1kaiser window
0 2 4 6 8
x 10-8
00.5
1hann window
0 2 4 6 8
x 10-8
00.5
1blackman window
0 2 4 6 8
x 10-8
00.5
1hamming window
0 2 4 6 8
x 10-8
00.5
1gaussian window
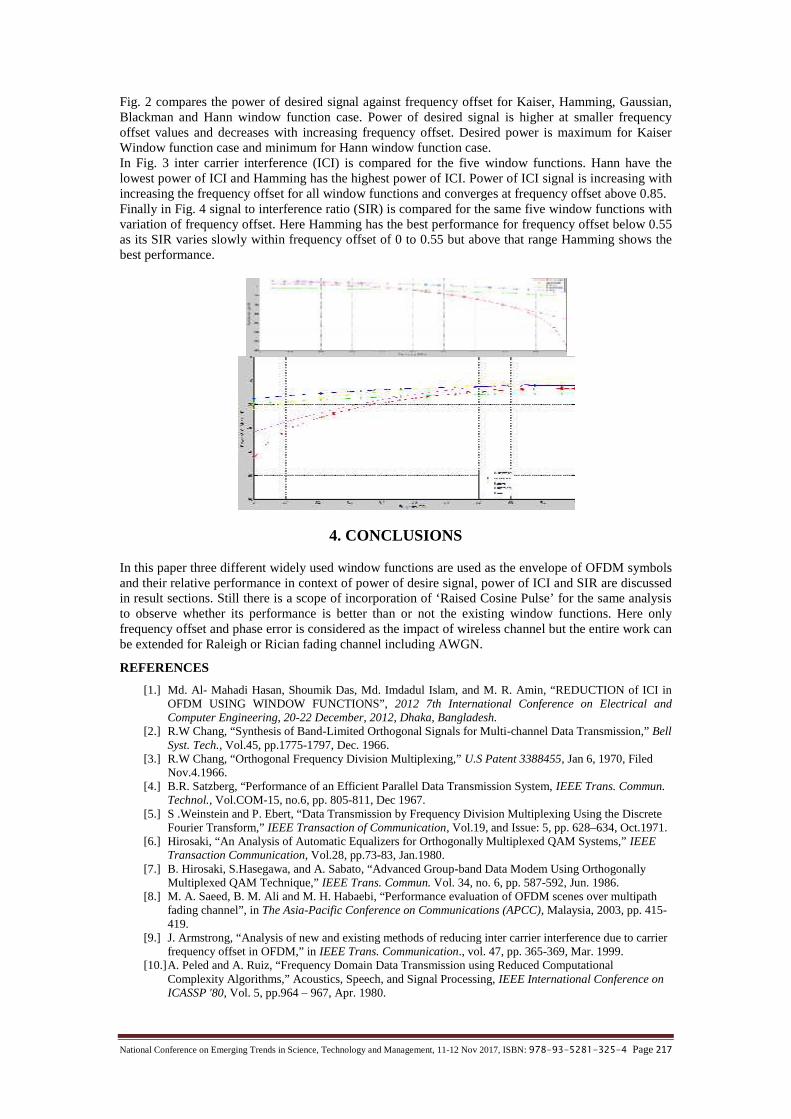
National Conference on Emerging Trends in Science, Technology and Management, 11-12 Nov 2017, ISBN: 978-93-5281-325-4 Page 217
Fig. 2 compares the power of desired signal against frequency offset for Kaiser, Hamming, Gaussian,Blackman and Hann window function case. Power of desired signal is higher at smaller frequencyoffset values and decreases with increasing frequency offset. Desired power is maximum for KaiserWindow function case and minimum for Hann window function case.In Fig. 3 inter carrier interference (ICI) is compared for the five window functions. Hann have thelowest power of ICI and Hamming has the highest power of ICI. Power of ICI signal is increasing withincreasing the frequency offset for all window functions and converges at frequency offset above 0.85.Finally in Fig. 4 signal to interference ratio (SIR) is compared for the same five window functions withvariation of frequency offset. Here Hamming has the best performance for frequency offset below 0.55as its SIR varies slowly within frequency offset of 0 to 0.55 but above that range Hamming shows thebest performance.
4. CONCLUSIONS
In this paper three different widely used window functions are used as the envelope of OFDM symbolsand their relative performance in context of power of desire signal, power of ICI and SIR are discussedin result sections. Still there is a scope of incorporation of ‘Raised Cosine Pulse’ for the same analysisto observe whether its performance is better than or not the existing window functions. Here onlyfrequency offset and phase error is considered as the impact of wireless channel but the entire work canbe extended for Raleigh or Rician fading channel including AWGN.
REFERENCES
[1.] Md. Al- Mahadi Hasan, Shoumik Das, Md. Imdadul Islam, and M. R. Amin, “REDUCTION of ICI inOFDM USING WINDOW FUNCTIONS”, 2012 7th International Conference on Electrical andComputer Engineering, 20-22 December, 2012, Dhaka, Bangladesh.
[2.] R.W Chang, “Synthesis of Band-Limited Orthogonal Signals for Multi-channel Data Transmission,” BellSyst. Tech., Vol.45, pp.1775-1797, Dec. 1966.
[3.] R.W Chang, “Orthogonal Frequency Division Multiplexing,” U.S Patent 3388455, Jan 6, 1970, FiledNov.4.1966.
[4.] B.R. Satzberg, “Performance of an Efficient Parallel Data Transmission System, IEEE Trans. Commun.Technol., Vol.COM-15, no.6, pp. 805-811, Dec 1967.
[5.] S .Weinstein and P. Ebert, “Data Transmission by Frequency Division Multiplexing Using the DiscreteFourier Transform,” IEEE Transaction of Communication, Vol.19, and Issue: 5, pp. 628–634, Oct.1971.
[6.] Hirosaki, “An Analysis of Automatic Equalizers for Orthogonally Multiplexed QAM Systems,” IEEETransaction Communication, Vol.28, pp.73-83, Jan.1980.
[7.] B. Hirosaki, S.Hasegawa, and A. Sabato, “Advanced Group-band Data Modem Using OrthogonallyMultiplexed QAM Technique,” IEEE Trans. Commun. Vol. 34, no. 6, pp. 587-592, Jun. 1986.
[8.] M. A. Saeed, B. M. Ali and M. H. Habaebi, “Performance evaluation of OFDM scenes over multipathfading channel”, in The Asia-Pacific Conference on Communications (APCC), Malaysia, 2003, pp. 415-419.
[9.] J. Armstrong, “Analysis of new and existing methods of reducing inter carrier interference due to carrierfrequency offset in OFDM,” in IEEE Trans. Communication., vol. 47, pp. 365-369, Mar. 1999.
[10.]A. Peled and A. Ruiz, “Frequency Domain Data Transmission using Reduced ComputationalComplexity Algorithms,” Acoustics, Speech, and Signal Processing, IEEE International Conference onICASSP '80, Vol. 5, pp.964 – 967, Apr. 1980.

National Conference on Emerging Trends in Science, Technology and Management, 11-12 Nov 2017, ISBN: 978-93-5281-325-4 Page 218
[11.]M.S Zimmerman and A.L Kirsch, “The AN/GSC-10 (KATHRYN) Variable rate data modem for HFradio,” IEEE Trans. Commun. Technol., Vol.15, no.2, pp. 197-205, Apr. 1967.
[12.]W.E. Keasler, Jr., “Reliable Data Communications over the Voice band-width Telephone UsingOrthogonal Frequency Division Multiplexing,” Ph.D. dissertation, Univ. Illinois, Urbana, Il, 1982.
[13.]L. J. Cimini, “Analysis and Simulation of a Digital Mobile Channel using Orthogonal FrequencyDivision multiplexing,” IEEE Transaction Communications, Vol.33, pp. 665-675. July 1985.

National Conference on Emerging Trends in Science, Technology and Management, 11-12 Nov 2017, ISBN: 978-93-5281-325-4 Page 219
EDIBLE VACCINE: A BOON IN VACCINETECHNOLOGY
Prashansa Samdarshi1, Saba Khan2*, Reetika Nagar3
Department of BiotechnologyAshoka Institute of Technology & Management, Varanasi
*[email protected]@gmail.com
Abstract: The lethality of infectious diseases has decreased due to the implementation of crucial sanitaryprocedures such as vaccination. However,the resurgence of pathogenic diseases in different parts of theworld has revealed the importance of identifying novel,rapid and concrete solutions for control andprevention.Children’s Vaccine Initiative(CVI) focused attention on the need to exploit technologies thatwould make vaccines-both their production and use-less expensive and more reliable especially for thedeveloping world.The Initiative emphasized the importance of edible vaccines because they eliminate theneeds for needles and syringes with their accompanying costs and risks.Edible vaccines may also inducemucosal immunities,creating a barrier in the gut,lungs and urogenital tract that can block infection beforethe body must rely on systemic response.The term “Edible Vaccines” refers to the use of edible parts of aplant that has been genetically modified to produce specific components of a particular pathogen togenerate protection against a disease. Genetic Engineering techniques are used to create an edible vaccineby introducing the information necessary to produce an antigenic protein into the plant of interest.Bananas, potatoes and tomatoes are particularly appealing as vaccines because they are widely grown inmany parts of the world, are inexpensive, can be easily transformed and propagated and are well-liked bychildren and infants.
Keywords: Edible vaccines, genetic engineering, bananas, GMOs.
1. INTRODUCTION
According to WHO, various diseases are responsible for 80% ofillness worldwide and cause more than20 million deaths annually. Vaccines have proved to be an aid for the prevention of infectious diseases.In spiteof the global immunization agenda for children against the sixdevastating diseases namely-diphtheria,pertussis(whooping cough),polio,measles,tetanus and tuberculosis,20% of infants still remainun-immunized which lead to approximately two million unnecessary deaths per annum,particularly in the far flungand poor parts of the world[1].Vaccines are an invaluable contribution in the field ofbiotechnology as theyprovide protection against various diseases.Conventional vaccines are made up of live/attenuatedvaccine andkilled vaccine. Newer approaches have also been made with regardto the use of purifiedantigen vaccines and recombinant vaccines.Despite the successful immunization program, the mortalityratesare increasing every year[2].Edible vaccines are Genetically Modified (GM) crops that provide extra added “immunity” for certaindiseases such as Hepatitis B, diarrhea, pneumonia, STDs, HIV etc. and comprise of antigenic proteinsand do not contain pathogenic genes. Edible vaccines hold great promise as a cost-effective, easy-to-administer, easy-to-store, fail-safe and socio-culturally readily acceptable vaccine delivery system,especially for the poor developing countries [3].At present edible vaccines are produced for several human and animal diseases (measles, cholera, footand mouth disease and hepatitisB, C and E). They can also be used to prevent exceptional diseases likedengue, hookworm, rabies, etc. in collaboration with othervaccination programs accrediting multipleantigen delivery.Various foods under consideration for use in edible vaccines include banana, potato,tomato, lettuce, rice, etc[4].
2. CONCEPT OF EDIBLE VACCINES
Edible vaccines are produced by the introduction of selected desired genes into plants and theninducing these alteredplants to manufacture the encoded proteins. This process is known as“transformation” and the altered plants are called “transgenic plants”. Like conventional subunitvaccines, edible vaccines are composed of antigenic proteins andare devoid of pathogenic genes. Thus,they have no wayof initiating infection, promising its safety, especially inimmunocompromisedpatients. Conventional subunit vaccinesare expensive and technology-concerted, need purification,require refrigeration and produce poor mucosal response.In contrast, edible vaccines would enhance compliance, especially in children, and because of oraladministration, would eliminate the need for trained medical personnel. Theirproduction is highlyefficient and can be easily scaled up.

National Conference on Emerging Trends in Science, Technology and Management, 11-12 Nov 2017, ISBN: 978-93-5281-325-4 Page 220
For example, hepatitis-B antigen required to vaccinate wholeof China annually, could be grown on a40-acre plot and allbabies in the world each year on just 200 acres of land [5]. Regardless of howvaccinesfor infectious diseases are delivered they all have the same aim: priming the immune system toswiftlydestroy specific disease-causing agents,or pathogens, before the agents can multiply enough tocausesymptoms. Classically, this priming has been achieved by presentingthe immune system withwhole viruses or bacteriathat have been killed or made too weak to proliferate much.On detecting the presence of a foreign organism in a vaccine, the immune system behaves as if thebody were underattack by a fully potent antagonist. It mobilizes its variousforces to root out anddestroy the apparent invader—targetingthe campaign to specific antigens (proteins recognizedasforeign). The acute response soon abates, but it leaves behindsentries, known as “memory” cells, thatremain onalert, ready to unleash whole armies of defenders if the realpathogen ever finds its way intothe body [2].
3. TRANSGENIC PLANTS USED FOR DELIVERY OF EDIBLE VACCINES
Banana trees and tomato plants growing at theBoyce Thompson Institute for Plant Research at CornellUniversityhave been genetically engineered to produce vaccines intheir fruit. Bananas can be mostefficiently used as vaccines becausethey grow widely in many parts of the developing world,can beeaten raw and are liked by most children.Other foods under study as alternatives to injectablevaccinesinclude potatoes and tomatoes, as well aslettuce, rice, wheat, soybean and corn [2].Table 1: Some very important plants which are used as Edible Vaccines [20]
Plant/Fruit
Main Features Advantage Disadvantage
Potato It has been used as a vehicle fordiabetes related proteins,vaccine against a strain ofE.coli,cholera vaccine andvaccine against Norwalk virus.
Dominated clinical trials. Easily manipulated/transformed Easily propagated from its “eyes” Stored for long periods without
refrigeration Cooking of the potatoes does not
always destroy the full complimentof an antigen
Needs cooking whichcan denature antigenand decreaseimmunogenicity
Banana Bananas are sterile so the genesdon’t pass from one banana toanother which is the mainreason why bananas are a goodchoice for edible vaccines.
Does not need cooking Proteins not destroyed even if
cooked Inexpensive Grown widely in developing
countries They grow quickly They have high content of Vitamin
A which may boost immuneresponse
Trees take 2-3 years tomature
Transformed trees takeabout 12 months to bearfruit
Spoils rapidly afterripening
Contains very littleprotein,so unlikely toproduce large amountof recombinant proteins
Tomato A possible edible vaccineagainst HIV/AIDS, HepatitisB,rabies,norovirus,Alzheimer’s,SARS,anthrax and respiratory syncytialvirus.It was the first time whenforeign gene had beenintroduced into theplastids(chloroplasts).
Grow quickly Cultivated broadly High content of Vitamin A may
boost immune response Overcome the spoilage problem by
freeze-drying technology Heat-stable,antigen-containing
powders,made into capsules Different batches blended to give
uniform doses of antigen Cuts down the likelihood of
passing infections Do not need special facilities for
storage and transportation They taste good
Spoils easily
Table 2: Some common plants undergoing usage as vehicles for protein [20]Target species for vaccines Plant used for expression Route of administrationEnterotoxigenic E.coli TOBACCO OralEnterotoxigenic E.coli POTATO Oral

National Conference on Emerging Trends in Science, Technology and Management, 11-12 Nov 2017, ISBN: 978-93-5281-325-4 Page 221
Enterotoxigenic E.coli MAIZE OralVibrio cholera POTATO OralHepatitis-B virus POTATO OralHepatitis-B virus LUPIN OralHepatitis-B virus LETTUCE OralNorwalk virus TOBACCO OralNorwalk virus POTATO OralRabies virus TOMATO -Human cytomegalovirus TOBACCO -
4. ADVANTAGES
The advantages would be enormous.Edible vaccines are widely accepted as they are orally administered unliketraditional vaccines that areinjectable. Thus, they eliminate the requirement of trained medical personnel and therisk of contamination is reduced as they do not need premisesand manufacturing area to be sterilized [6]. Ediblevaccines are comparatively cost effective, as they do not require cold chain storage like traditional vaccines [7].Edible vaccines offer greater storage opportunities as the seeds of transgenic plants contain lesser moisture contentand can be easily dried. In addition, plants with oil or their aqueous extracts possess more storage opportunities[8]. Edible vaccines promote opportunity for second-generation vaccines by integrating numerousantigens, which approach M cells simultaneously. Edible vaccines are safe as they do not contain heat-killed pathogens, hence do not present any risk of proteins to reform into infectious organism. Ediblevaccine production process can be scaled up rapidly by breeding [9]. The plants could begrown locally,and cheaply, using the standard growingmethods of a given region. Because many food plants canberegenerated readily, the crops could potentially be producedindefinitely without the growers havingto purchase moreseeds or plants year after year. Homegrown vaccines wouldalso avoid the logisticaland economic problems posed byhaving to transport traditional preparations over long distances,keeping them cold enroute and at their destination. The research has also fueled speculationthat certainfood vaccines might help suppress autoimmunity—in which the body’s defenses mistakenlyattacknormal, uninfected tissues. Among the autoimmune disordersthat might be prevented or eased areType I diabetes (thekind that commonly arises during childhood), multiple sclerosis and rheumatoidarthritis [2].
5. DISADVANTAGESEdible vaccines are dependent on plant stability as certain foods cannot be eaten raw (e.g. potato) and needscooking that cause denaturation or weaken the protein present in it [10]. Since edible vaccines are plant basedvaccines, they are prone to get microbial infestation. Edible vaccine function can be vulnerable due tovast differences in the glycosylation pattern of plants andhumans[9].There are chances of developmentofimmune tolerance to vaccine peptide or protein.Consistency of dosage from fruit-to-fruit,plant-to-plant and generation-to-generation is not the same.Selection of best plant and evaluation of dosagerequirement are both a tedious process.
6. DEVELOPING AN EDIBLE VACCINE
Plant-based vaccine production mainly involves the integration of transgene into the plant cells. Thetarget sequence of the selected antigen is integrated with the vector before being transferred into theexpression system. The transgene can then be expressed in the plants either through a stabletransformation system or through transient transformation system, depending on the location where thetransgene has been inserted in the cells. Stable transformation system can be achieved through nuclearor plastid integration [12]. It is called stable or permanent due to the permanent changes occurring inrecipient cell genetics as the target transgene is integrated into the genome of host plant cells [13]. Thisis done by several techniques such as; agrobacterium gene transfer, biolistic method andelectroporation.Agrobacterium gene transfer method-In this method, the suitable gene (recombinant DNA) is incorporatedinto the T‐region of a disarmed Ti plasmid of Agrobacterium; a plant pathogen, which is co-cultured with the plantcells, or tissues that needs to be transformed (Figure 1). This approach is slow with lower yield however; it showedsatisfactory results in dicotyledonous plants like potato, tomato and tobacco. Researches in some fields haveproven this approach convenient in expressing the desirable traits by selected genes in several experimentalanimals and plants [14,15].Biolistic method-Biolistic method is used as a method of transformation of plants, includingmonocotyledonous plants. The gene containing DNA coated metal (gold, tungsten) particles are fired atthe plant cells using a gene gun [16].Plant cells that can take up the DNA are allowed to grow in newplants and are cloned to produce large number of genetically identical crop. This method is quite

National Conference on Emerging Trends in Science, Technology and Management, 11-12 Nov 2017, ISBN: 978-93-5281-325-4 Page 222
attractive since the DNA can be delivered into cells of plants which make the gene transferindependent. Biolistic method can be used to achieve two types of antigen expression in the transgenicplants: nuclear and chloroplast transformation. Nuclear transformation is done by integrating thedesired gene into the nucleus of the plant cells via non homologous recombination [17, 18].Electroporation-In this method DNA is inserted into the cells after which they are exposed to highvoltage electrical pulse which is believed to produce transient pores within the plasmalemma.Thisapproach requires the additional effort of weakening the cell wall as it acts as an effective barrieragainst entry of DNA into cell cytoplasm, hence, it requires mild enzymatic treatment [9].
7. MECHANISMSince almost all human pathogens invade at mucosal surfaces via urogenital, respiratory and gastrointestinal tractsas their leading path of entry into the body. Thus, foremost and prime line of the defense mechanism is mucosalimmunity [19]. The most efficient path of mucosal immunization is oral route because oral vaccines are able toproduce mucosal immunity, antibody mediated immune response and cell mediated immune response. As anadvantage orally administered antigen containing plant vaccine do not get hydrolysed by gastric enzymes due totough outer wall of the plant cell. Transgenic plants containing antigens act by the process of bio-encapsulationand are finally hydrolysed and released in the intestines. The released antigens are taken up by M cells in theintestinal lining that are placed on Payer’s patches and gut-associated lymphoid tissue (GALT). These are furtherpassed on to macrophages and locallymphocyte populations, producing serum IgG, IgE responses, local IgAresponse and memory cells, that rapidly counterbalance the attack by the real infectious agent [2].
8. FUTURE PROSPECTS
The future of edible vaccines may be affected by resistanceto GM foods, which was reflected whenZambia refused GMmaize in food aid from the United States despite the threat offamine.Transgeniccontamination is unavoidable. Besidespollen, transgenes may spread horizontally by suckinginsects,transfer to soil microbes during plant wounding/breakdownof roots/rootlets and may pollutesurface and ground water.Increase in global area utilized in cultivating transgeniccrops from 1.7 to 44.2 million hectares from1996 to 2000 andthe number of countries growing them from 6 to 13 reflectsthe growing acceptance oftransgenic crops in both industrial and developing countries. At least 350 geneticallyengineeredpharmaceutical products are currently under development inthe United States and Canada.Edible vaccines offer majoreconomic and technical benefits in the event of bioterrorism,as theirproduction can be easily scaled up for millions ofdoses within a limited period of time[3].
9. CONCLUSION
Edible vaccines would enhance compliance, especially in children and because of oral administration,would eliminate the need of trained medical personnel.Their production is highly efficient and can beeasily scaled up.If the technology is properly nurtured and given the right direction,it may usher into anew era where we will be asked to take “food” rather than “drugs” when we are ill.
REFERENCES1. Jogdand S N. Medical Biotechnology. Himalaya publishing house. Mumbai, 2000.2. Langridge W. Edible vaccines. Scientific Am 2000, 283:66‐71.3. Goyal R, Sharma R, Lal P, Ramachandran V. Edible vaccines: Current status and future. Indian Journal of
Medical Microbiology. 2007; 25:93.4. Giddings G, Allison G, Brooks D, Carter A. Transgenic plants as factories for biopharmaceuticals. Nat
Biotechnol. 2000; 18:1151-1155.5. Available from: http://www.molecularfarming.com/plantderived-vaccines.html.6. Streatfield SJ, Jilka JM, Hood EE, Turner DD, Bailey MR, Mayor JM, et al. Plant-based vaccines: unique
advantages. Vaccine. 2001; 19: 2742–2748.7. Nochi T, Takagi H, Yuki Y, Yang L, Masumura T, Mejima M, et al. Rice-based mucosal vaccine as a
global strategy for cold-chain- and needle-free vaccination. Proc Natl Acad Sci U S A. 2007; 104: 10986-10991.
8. Pascual DW. Vaccines are for dinner. Proc Natl Acad Sci U S A. 2007; 104: 10757-10758.9. Jan N, Shafi F, Hameed OB, Muzaffar K, Dar SM, Majid I et al. An Overview on Edible Vaccines and
Immunization. Austin Journal of Nutrition and Food sciences. 2016; 4:1078.10. Moss WJ, Cutts F, Griffin DE. Implications of the human immunodeficiency virus epidemic for control
and eradication of measles. Clin Infect Dis. 1999; 29: 106-112.11. Neeraj M,Prem NG,Kapil K,Amit KG,SueshPV, et al.Edible vaccines : A new approach to oral
immunization.2008;283-294.12. Altpeter F, Baisakh N, Beachy R et al. Particle bombardment and the genetic enhancement of crops:
myths and realities. Molecular Breeding. 2005; 15:305-327.

National Conference on Emerging Trends in Science, Technology and Management, 11-12 Nov 2017, ISBN: 978-93-5281-325-4 Page 223
13. Ma H, Chen G. Gene transfer technique. Nature and Science. 2005; 3:25-31.14. Mercenier A, Wiedermann U, Breiteneder H. Edible genetically modified microorganisms and plants for
improved health. Curr Opin Biotechnol. 2001; 12: 510-515.15. Chikwamba R, Cunnic J, Hathway D, McMurary J, Mason H. A functional antigen in a practical crop:
LT-B producing maize protects mice against E.coli heat liable enterotoxin (LT) andchorea toxin (CT).Transl Res. 2002; 11: 479- 493.
16. Taylor NJ, Fauquet CM. Microparticle bombardment as a tool in plant science and agriculturalbiotechnology. DNA Cell Biology. 2002; 21:963‐977.
17. Gómez E, Zoth SC, Berinstein A. Plant-based vaccines for potential human application. Human Vaccines.2009; 5:738-744.
18. Streatfield SJ. Plant-based vaccines for animal health. Revue scientifique et technique (InternationalOffice of Epizootics). 2005; 24:189-199.
19. Arakawa T, Yu J, Chong DK, Hough J, Engen PC, Langridge WH. A plant based cholera toxin Bsubunit-insulin fusion protein protects against the development of autoimmune diabetes. Nat Biotechnol.1998: 16; 934-938.
20. A review of the Progression of Transgenic Plants Used to Produce Plantibodies For Human Usage,Journal of Young Investigators .2001,Volume IV

National Conference on Emerging Trends in Science, Technology and Management, 11-12 Nov 2017, ISBN: 978-93-5281-325-4 Page 224
ENHANCED ANALOG PERFORMANCE OF DOUBLEMATERIAL GATE OXIDE SIGE-ON- INSULATOR
DOUBLE GATE MOSFETSaurabh Verma
Department of Electronic and CommunicationAshoka Institute of Technology and
Management, Varanasi-221007, [email protected]
Amrish KumarDepartment of Electronic and CommunicationMotilal Nehru National Institute of Technology
Allahabad-211004, [email protected]
Abstract - In this paper a double material gate oxide (DMGO) silicon-germanium on insulator (SGOI)double gate (DG) using charge plasma is analyzed. The basic purpose of this device is to enhance channelpotential and electric field to enhance transconductance (gm) and transconductance generation factors(TGF).Using calibrated two dimensional simulations, it is demonstrated that DMGO-SGOI MOSFETexhibits high transconductance and transconductance generation factor.
Keywords - Charge plasma, Transconductance generation factor (TGF), DMGO-SGOI (double material gateoxide silicon-germanium on insulator).
1. INTRODUCTION
Now a day the basic building blocks of Billion-transistor very large-scale integrated chips areSILICON MOSFETS. Its Channel length is an important parameter to resolve both speed and density,decrease in channel length offer increase in speed but also increase the short channel (SCs) effectbeside with this the major issue faced by conventional doped devices is random dopant fluctuations(RDF).which degrade the performance of device in term of threshold voltage and Ion/ Ioff ratio.The charge plasma based double material gate oxide (DMGO) [1] silicon-germanium on insulator(SGOI) [2] double gate MOSFET is one of the emerging devices. Here two different materials are usedfor gate oxide in order to enhance potential and electric field profiles .SiGe [3] material is used as achannel material for enhancement of drive current and mobility. In this paper various parameters ofdopingless DMGO-SGOI MOSFET has been analyzed at different length ratio of SiO2 and HfO2 . Asthe arrangement of gate oxide in dopingless DMGO-SOI MOSFET which is half SiO2 and half Hfo2,this will led to undesirable phenomena called interface trapping. So in order to remove this interfacetrapping problem [4] ,a new device is proposed called double material gate oxide with gate stackingarrangement. The problem face due to random dopant fluctuations (RDF) can be remove by usingdopingless device.Here by using 2-D simulation various performance parameters have been calculated for this proposeddevice and compared with Dopingless DMGO-SGOI MOSFET.
2. DOPINGLESS DMGO-SGOI AND DOPINGLESS DMGO-GATE STACKSTRUCTURE AND SIMULATION
The 2-D simulated DMGO-SOI and DMGO-gate stack are shown in Fig.1(a) and Fig.1 (b)repectively.In first the devices SiGe channel is surrounded above and below by two different gate oxidematerial,SiO2 at the source side and HfO2 at the drain side , with equal length of each i.e. 1:1 ratio andphysical thickness of 0.9nm.In later device SiGe [5]-[6] channel is surrounded by only SiO2 on both theside and further SiO2 is surrounded by Hf02 with effective thickness of 1nm.By taking SiO2thickness0.8nm and by using gate stacking concept i.e. Effective thickness = tSiO2+ (εSiO2/ εHfO2 )x tHfO2
thickness of Hfo2 is calculated as 1.2nm.Gate metal work function of 4.6eV is used. Length of SiGechannel is considered to be 20 nm and vertically placed source and drain extension are of 40nm.Thesource ,drain and channel are formed with intrinsic silicon with ni=1015cm-3.The concept of dopinglessis taken from Kumar and Nadda [7]. In order to induce charge plasma, the work function of source anddrain is taken as 3.9eV and silicon body thickness is considered as 10nm.

National Conference on Emerging Trends in Science, Technology and Management, 11-12 Nov 2017, ISBN: 978-93-5281-325-4 Page 225
(a)
(b)Fig.1. Cross sectional view of (a) Dopingless DMGO-SGOI MOSFET. (b) Dopingless DMGO-gate
stack MOSFET
According to ITRS (International Technology Roadmap of Semiconductor) the drain bias has fixed to0.7V. 2-D Atlas simulation is done by using inversion layer Lombardi constant voltage andtemperature (CVT) mobility models. The Shockley-Read-Hall (SRH) generation and recombinationparameters simulate the leakage currents [8]. In order to get results close to the exact values, modelFermi-Dirac uses a Rational Chebyshev approximation. Both the devices are simulated and verified.
3. RESULTS AND DISCUSSIONS
The electric field and surface potential along the channel for dopingless DMGO-SOI MOSFET withVDS = 0.7 and VGS = 0-0.7 is shown in figure.2.In all figures, the position along the channel (from thesource to the drain) is plotted in x-axis direction. Due to difference in permittivity for two gate oxidematerials in DMGO-SGOI device results in additional peak in channel region which influence thetransport mechanism.In Fig.2 (a) Electric field is obtained for different length ratio of SiO2:HfO2 for DMGO-SGOIMOSFET i.e. 1:2, 1:1, 2:1 (5nm:15nm, 10nm:10nm, 15nm:5nm) and their effect on deviceperformance is analysed. In Fig.2 (a) we can see that, the peak position of electric field is shiftedtowards source side for 1:2, drain side for 2:1 and in middle for 1:1 ratio. Hence all other results areobtained for 1:1 ratio only.Fig.2 (b) shows surface potential, which can be adjusted by varying workfunction of the gate metal and doping concentration which further control the threshold voltage.Subthreshold leakage current reduces because of increase in surface potential.Fig.2(c) showscomparison of electric field profile for DMGO-SGOI and DMGO-gate stack MOSFET.Fig.2 (d) showscomparison of potential profile for DMGO-SGOI and DMGO-Gate Stack MOSFET.
0.03 0.04 0.05 0.06 0.07 0.080
100
200
300
400
500
600
700
800
Elec
tric
Field
(1
0^3 V
/cm)
Channel Position(m)
SiO2:HfO2=1:1 SiO2:HfO2=1:2 SiO2:HfO2=2:1
Vds=0.7V
(a)
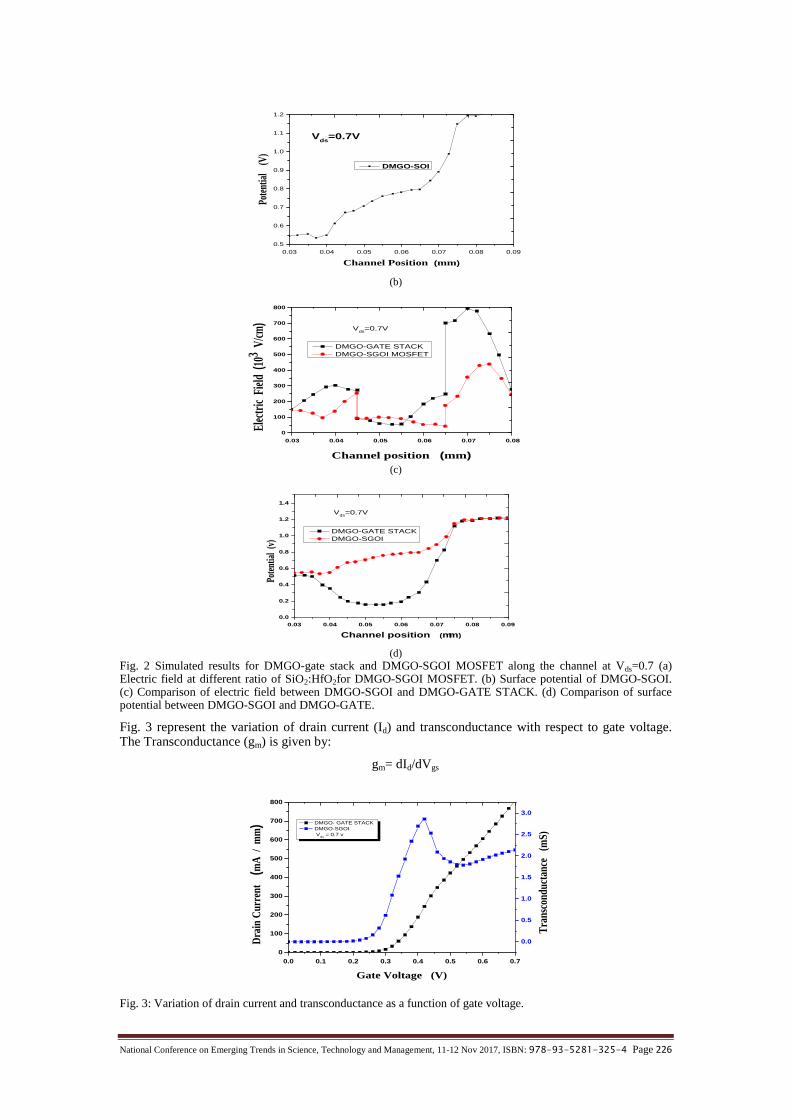
National Conference on Emerging Trends in Science, Technology and Management, 11-12 Nov 2017, ISBN: 978-93-5281-325-4 Page 226
0.03 0.04 0.05 0.06 0.07 0.08 0.090.5
0.6
0.7
0.8
0.9
1.0
1.1
1.2
Poten
tial
(V)
Channel Position (mm)
DMGO-SOI
Vds=0.7V
(b)
0.03 0.04 0.05 0.06 0.07 0.080
100
200
300
400
500
600
700
800
Elec
tric
Field
(103
V/cm
)
Channel position (mm)
DMGO-GATE STACK DMGO-SGOI MOSFET
Vds=0.7V
(c)
0.03 0.04 0.05 0.06 0.07 0.08 0.090.0
0.2
0.4
0.6
0.8
1.0
1.2
1.4
Poten
tial (
v)
Channel position (m)
DMGO-GATE STACK DMGO-SGOI
Vds=0.7V
(d)Fig. 2 Simulated results for DMGO-gate stack and DMGO-SGOI MOSFET along the channel at Vds=0.7 (a)Electric field at different ratio of SiO2:HfO2for DMGO-SGOI MOSFET. (b) Surface potential of DMGO-SGOI.(c) Comparison of electric field between DMGO-SGOI and DMGO-GATE STACK. (d) Comparison of surfacepotential between DMGO-SGOI and DMGO-GATE.
Fig. 3 represent the variation of drain current (Id) and transconductance with respect to gate voltage.The Transconductance (gm) is given by:
gm= dId/dVgs
0.0 0.1 0.2 0.3 0.4 0.5 0.6 0.70
100
200
300
400
500
600
700
800
DMGO- GATE STACK DMGO-SGOI
Vds = 0.7 v
Gate Voltage (V)
Dra
in C
urre
nt(m
A /
mm
)
0.0
0.5
1.0
1.5
2.0
2.5
3.0
Tran
scon
duct
ance
(m
S)
Fig. 3: Variation of drain current and transconductance as a function of gate voltage.
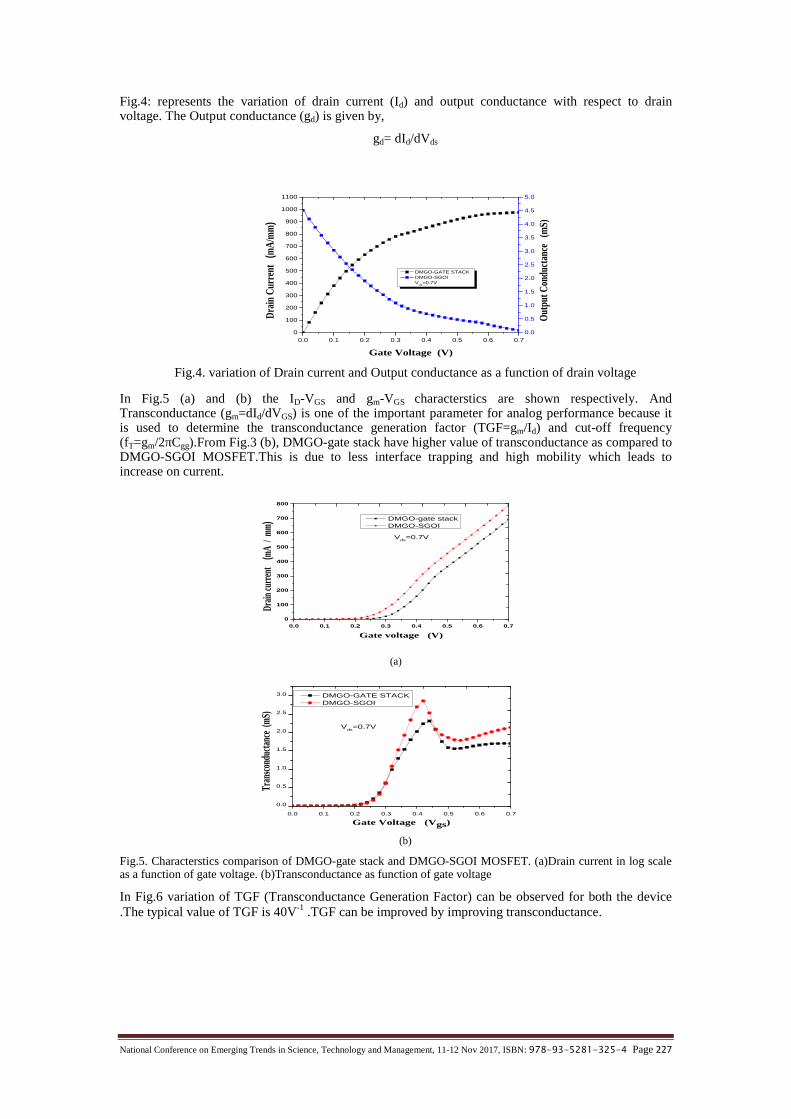
National Conference on Emerging Trends in Science, Technology and Management, 11-12 Nov 2017, ISBN: 978-93-5281-325-4 Page 227
Fig.4: represents the variation of drain current (Id) and output conductance with respect to drainvoltage. The Output conductance (gd) is given by,
gd= dId/dVds
0.0 0.1 0.2 0.3 0.4 0.5 0.6 0.70
100
200
300
400
500
600
700
800
900
1000
1100
DMGO-GATE STACK DMGO-SGOI
Vds=0.7V
Gate Voltage (V)
Drai
n Cu
rren
t(m
A/m
m)
0.0
0.5
1.0
1.5
2.0
2.5
3.0
3.5
4.0
4.5
5.0
Out
put C
ondu
ctan
ce
(mS)
Fig.4. variation of Drain current and Output conductance as a function of drain voltage
In Fig.5 (a) and (b) the ID-VGS and gm-VGS characterstics are shown respectively. AndTransconductance (gm=dId/dVGS) is one of the important parameter for analog performance because itis used to determine the transconductance generation factor (TGF=gm/Id) and cut-off frequency(fT=gm/2πCgg).From Fig.3 (b), DMGO-gate stack have higher value of transconductance as compared toDMGO-SGOI MOSFET.This is due to less interface trapping and high mobility which leads toincrease on current.
0.0 0.1 0.2 0.3 0.4 0.5 0.6 0.70
100
200
300
400
500
600
700
800
Drain
curr
ent
(mA
/ mm
)
Gate voltage (V)
DMGO-gate stack DMGO-SGOI
Vds=0.7V
(a)
0.0 0.1 0.2 0.3 0.4 0.5 0.6 0.7
0.0
0.5
1.0
1.5
2.0
2.5
3.0
Tran
scond
uctan
ce (m
S)
Gate Voltage (Vgs)
DMGO-GATE STACK DMGO-SGOI
Vds=0.7V
(b)
Fig.5. Characterstics comparison of DMGO-gate stack and DMGO-SGOI MOSFET. (a)Drain current in log scaleas a function of gate voltage. (b)Transconductance as function of gate voltage
In Fig.6 variation of TGF (Transconductance Generation Factor) can be observed for both the device.The typical value of TGF is 40V-1 .TGF can be improved by improving transconductance.

National Conference on Emerging Trends in Science, Technology and Management, 11-12 Nov 2017, ISBN: 978-93-5281-325-4 Page 228
0.0 0.1 0.2 0.3 0.4 0.5 0.6 0.7
0.0
0.5
1.0
1.5
2.0
2.5
3.0
Tran
scon
duct
ance
(m
S)Gate Voltage(Vgs)
DMGO-GATE STACK DMGO-SGOI
Vds=0.7V
Fig.6.TGF (Transconductance Generation Factor) comparison.Table 1
ParametersDifferent ratio of SiO2:HfO2
1:1 1:2 2:1
Ion(A) 1.5X10⁻³ 1.55X10⁻³ 1.47X10⁻³
Ioff(A)2.5X10⁻¹⁰ 2.2X10⁻¹⁰
3.13X10⁻¹⁰
Ion/Ioff 5.87X10⁶ 6.8X10⁶ 4.71X10⁶
Subthersholdswing(mV/d)
62.6 62.2 63.7
DIBL(mV/V) 1.74 0.50 5.5
Table 1 shows the variation in parameters with respect to different ratio of gate oxide in DMGO-SGOIMOSFET. From the table we can see that for 1:2 ratio device gives better performance.
4. CONCLUSION
In order to reduce interface trap charge charge plasma based doping less Double Material Gate Oxidewith Gate Stack is employed. From the simulation results it is clear that there is significantimprovement in leakage current, gm and TGF as compared to DMGO-SGOI MOSFET.
REFERENCES[1.] K. P. Pradhan; D. Singh; S. K. Mohapatra; P. K Sahu “Double material gate oxide (DMGO) SiGe-on-
insulator (SGOI) MOSFET: A proposal and analysis” 2015 IEEE International Conference on ElectronDevices and Solid-State Circuits (EDSSC) pp. 575 – 577.
[2.] C.Le Royer; A. Villalon; S. Martinie; P. Nguyen; S. Barraud; F. Glowacki; S. Cristoloveanu; M. Vinet“Experimental investigations of SiGe channels for enhancing the SGOItunnel FETs performance”EUROSOI-ULIS 2015: Joint International EUROSOI Workshop and International Conference onUltimate Integration on Silicon, 2015 ,PP.69 – 72.
[3.] Jin Cho; Frank Geelhaar; Uzma Rana; Laks Vanamurthy; Ryan Sporer; Francis Benistant “TCADanalysis of SiGe channel FinFET devices” 2017 International Conference on Simulation ofSemiconductor Processes and Devices (SISPAD) ,2017,pp 357 – 360.
[4.] N. Zhan; M. C. Poon; Hei Wong; K. L. Ng; C. W. Kok; V. Filip “Dielectric breakdown characteristicsand interface trapping of hafnium oxide films ” 24th International Conference on Microelectronics(IEEE Cat. No.04TH8716) , Vol: 2, pp 629 – 632, 2004.
[5.] Zhiyuan Cheng; A. J. Pitera; M. L. Lee; Jongwan Jung; J. L. Hoyt; D. A. Antoniadis; E. A. Fitzgerald“Fully depleted strained-SOI n- and p-MOSFETs on bonded SGOI substrates and study of theSiGe/BOX interface”IEEE Electron Device Letters , Vol 25, 2004, pp 147 – 149.
[6.] Grace Huiqi Wang; Eng-Huat Toh; Anyan Du; Guo-Qiang Lo; Ganesh Samudra; Yee-Chia Yeo“Strained Silicon–Germanium-On-Insulator n-MOSFET With Embedded Silicon Source-and-DrainStressors” IEEE Electron Device Letters, Vol 29, Issue:1, 2008 , pp 77 – 79.

National Conference on Emerging Trends in Science, Technology and Management, 11-12 Nov 2017, ISBN: 978-93-5281-325-4 Page 229
[7.] Kanika Nadda; M. Jagadesh Kumar ,”A novel Doping-less Bipolar Transistor with Schottky Collector”2011 International Semiconductor Device Research Symposium (ISDRS), 2011,pp 1-2.
[8.] M. Y. Ghannam; R. P. Mertens; S. C. Jain; J. F. Nijs; R. Van Overstraeten,” Band-Tail Shockley-Read-Hall Recombination in Heavily Doped Silicon”, ESSDERC '88: 18th European Solid State DeviceResearch Conference, 1988,pp c4-275 - c4-280.
National Conference on Emerging Trends in Science, Technology and Management, 11-12 Nov 2017, ISBN: 978-93-5281-325-4 Page 230
A PROTOTYPE CONTROL SYSTEM FOR WEARABLEDOPAMINE REGULATION
1 Sandeep Kumar, 2Shaheen AfrozDepartment of Electronics & communication Engineering
Ashoka Institute of Technology & Management, Varanasi, [email protected], [email protected]
Abstract -- In this paper, we have proposed a prototype closed loop control system to regulate dopaminelevel. For an “artificial Substantia Nigra” to become feasible for ambulatory use, a robust and preciseclinical device is important. The key feature of this system is its four different types of subsystems: sensingsubsystem, pumping subsystem, controller subsystem and power supply subsystem. Each subsystem is vitalin developing a complete feasible implantable system to regulate the dopamine level. Through this paper, aproportional derivative (PD) control strategy is proposed for dopamine secretion by the substantia nigra.Further scope still persists on hardware and control algorithm to make it clinically viable.
Keywords —Clinical device, closed loop control, dopamine, substantia nigra
1. INTRODUCTION
Parkinson’s disease (PD) also known as paralysis agitans and shaking palsy is a representativedegenerative disease that occurs due to a deficiency of nerve cells, called dopamine neurons,distributed in the substantia nigra of the brain [1]. It is the second most common neurodegenerativedisorder. PD is a chronic, progressive disorder of basal ganglia characterized by cardinal features ofrigidity (muscle stiffness), bradykinesia (slowness of movement), tremors (shaking), gait and posturalinstability. Low fluctuating dopamine level is the contributing factor to the development of depression,anxiety, sexual dysfunction, urinal retention [2].A common therapy is dopamine infusion at specified time. Taking dopamine itself does not help,because it cannot enter the brain. Levodopa, the most effective Parkinson’s drug is absorbed by thenerve cells in the brain and turned into dopamine. 100mg Levodopa is combined with 25 mg carbidopato create sinemet. Carbidopa prevents the levodopa from being destroyed by enzymes in digestivetracts; it also reduces levodopa side effects, such as nausea, vomiting, fatigue and dizziness[3][4].Sinemet pumps are portable device that inject combination of L-dopa and carbidopa at constantrate. However, most of these pumps work on an “open loop” system where the rate of delivery is set bythe clinician on the basis of past experience, mathematical computation, or by trial and error. The fluidis delivered at set rate until the setting is changed [5]. There are many disadvantages of this method,thus, this method cannot control dopamine level efficiently and effectively.This paper is concerned with developing a real-time continuous dopamine monitoring system (CDMS)which can inject the desired amount of sinemet automatically. An implantable automated dopaminedelivery system consists of dopamine sensor which provides frequent measurement, sinemet pump, anddata transmitter to send the data to pump by frequency telemetry. The most component such assinemet reservoir, pump, and transmitter are all externally attached to the body, which may cause someinconveniences, the degree of inconvenience may vary from person to person.
2. SYSTEM DESCRIPTION
We are proposing an artificial substantia nigra here, dopamine level is measured by an intravenouscontinuous dopamine monitor (CDM) and sinemet is delivered by a continuous intravenous sinemetinfusion (CISI) pump. An intelligent control algorithm calculates the appropriate sinemet dosage forthe current conditions to achieve the optimal regulation of dopamine. The sinemet injected each timewill be calculated according to a dynamic model. There is substantial time delay between sinemetdelivery and the appearance of dopamine in central nervous system with the use of intravenous sinemetdelivery. This time delay limits the desired control performance.The complete system (Fig.1) is integration of four subsystems: sensing subsystem, pumping subsystem,controller subsystem and power supply subsystem. The most important and critical part of artificialsubstantia nigra are implantable intravenous dopamine sensor in sensing subsystem, sinemet pump inpumping subsystem and microcontroller in controller subsystem.Other than essential components, it also consists of reservoir for sinemet, charger, battery, powersupply unit, and radio frequency (RF) transmitter as depicted in Fig. 2. Through an intelligent controlalgorithm developed, the appropriate dosage of sinemet to be injected into the body is calculated and
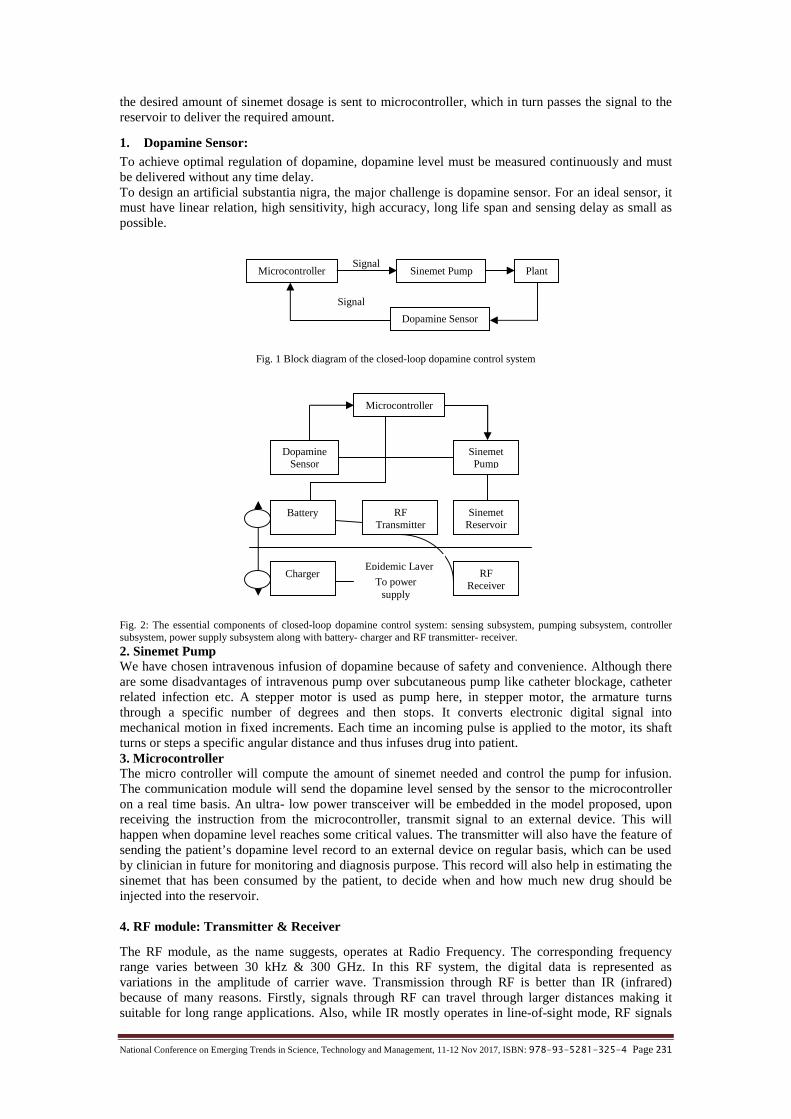
National Conference on Emerging Trends in Science, Technology and Management, 11-12 Nov 2017, ISBN: 978-93-5281-325-4 Page 231
the desired amount of sinemet dosage is sent to microcontroller, which in turn passes the signal to thereservoir to deliver the required amount.
1. Dopamine Sensor:To achieve optimal regulation of dopamine, dopamine level must be measured continuously and mustbe delivered without any time delay.To design an artificial substantia nigra, the major challenge is dopamine sensor. For an ideal sensor, itmust have linear relation, high sensitivity, high accuracy, long life span and sensing delay as small aspossible.
Fig. 1 Block diagram of the closed-loop dopamine control system
Fig. 2: The essential components of closed-loop dopamine control system: sensing subsystem, pumping subsystem, controllersubsystem, power supply subsystem along with battery- charger and RF transmitter- receiver.2. Sinemet PumpWe have chosen intravenous infusion of dopamine because of safety and convenience. Although thereare some disadvantages of intravenous pump over subcutaneous pump like catheter blockage, catheterrelated infection etc. A stepper motor is used as pump here, in stepper motor, the armature turnsthrough a specific number of degrees and then stops. It converts electronic digital signal intomechanical motion in fixed increments. Each time an incoming pulse is applied to the motor, its shaftturns or steps a specific angular distance and thus infuses drug into patient.3. MicrocontrollerThe micro controller will compute the amount of sinemet needed and control the pump for infusion.The communication module will send the dopamine level sensed by the sensor to the microcontrolleron a real time basis. An ultra- low power transceiver will be embedded in the model proposed, uponreceiving the instruction from the microcontroller, transmit signal to an external device. This willhappen when dopamine level reaches some critical values. The transmitter will also have the feature ofsending the patient’s dopamine level record to an external device on regular basis, which can be usedby clinician in future for monitoring and diagnosis purpose. This record will also help in estimating thesinemet that has been consumed by the patient, to decide when and how much new drug should beinjected into the reservoir.
4. RF module: Transmitter & Receiver
The RF module, as the name suggests, operates at Radio Frequency. The corresponding frequencyrange varies between 30 kHz & 300 GHz. In this RF system, the digital data is represented asvariations in the amplitude of carrier wave. Transmission through RF is better than IR (infrared)because of many reasons. Firstly, signals through RF can travel through larger distances making itsuitable for long range applications. Also, while IR mostly operates in line-of-sight mode, RF signals
Microcontrollerrer
PlantSinemet Pump
Dopamine SensorSsensor
Signalaaaaaala
Signalaaa
aaala
Microcontrollerrer
DopamineSensor
SinemetPump
SinemetReservoir
RFTransmitter
Battery
Charger RFReceiverTo power
supply
Epidemic Layer
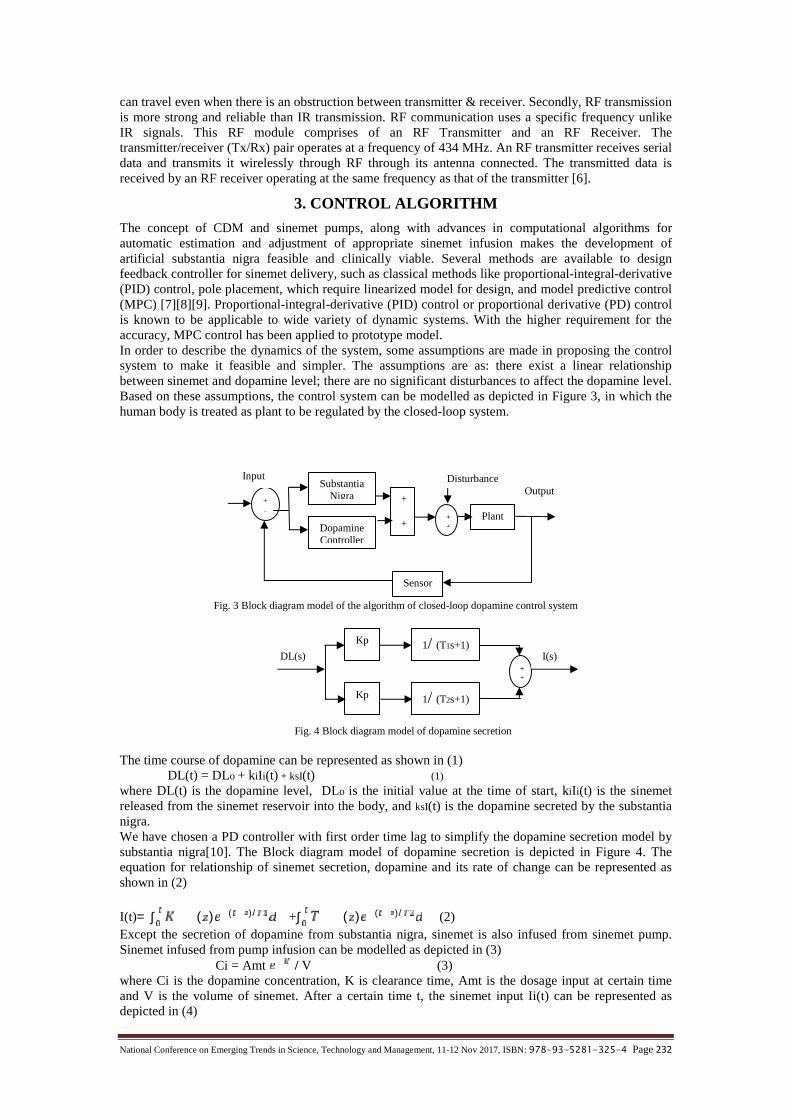
National Conference on Emerging Trends in Science, Technology and Management, 11-12 Nov 2017, ISBN: 978-93-5281-325-4 Page 232
can travel even when there is an obstruction between transmitter & receiver. Secondly, RF transmissionis more strong and reliable than IR transmission. RF communication uses a specific frequency unlikeIR signals. This RF module comprises of an RF Transmitter and an RF Receiver. Thetransmitter/receiver (Tx/Rx) pair operates at a frequency of 434 MHz. An RF transmitter receives serialdata and transmits it wirelessly through RF through its antenna connected. The transmitted data isreceived by an RF receiver operating at the same frequency as that of the transmitter [6].
3. CONTROL ALGORITHM
The concept of CDM and sinemet pumps, along with advances in computational algorithms forautomatic estimation and adjustment of appropriate sinemet infusion makes the development ofartificial substantia nigra feasible and clinically viable. Several methods are available to designfeedback controller for sinemet delivery, such as classical methods like proportional-integral-derivative(PID) control, pole placement, which require linearized model for design, and model predictive control(MPC) [7][8][9]. Proportional-integral-derivative (PID) control or proportional derivative (PD) controlis known to be applicable to wide variety of dynamic systems. With the higher requirement for theaccuracy, MPC control has been applied to prototype model.In order to describe the dynamics of the system, some assumptions are made in proposing the controlsystem to make it feasible and simpler. The assumptions are as: there exist a linear relationshipbetween sinemet and dopamine level; there are no significant disturbances to affect the dopamine level.Based on these assumptions, the control system can be modelled as depicted in Figure 3, in which thehuman body is treated as plant to be regulated by the closed-loop system.
Fig. 3 Block diagram model of the algorithm of closed-loop dopamine control system
Fig. 4 Block diagram model of dopamine secretion
The time course of dopamine can be represented as shown in (1)DL(t) = DLo + kiIi(t) + ksI(t) (1)
where DL(t) is the dopamine level, DLo is the initial value at the time of start, kiIi(t) is the sinemetreleased from the sinemet reservoir into the body, and ksI(t) is the dopamine secreted by the substantianigra.We have chosen a PD controller with first order time lag to simplify the dopamine secretion model bysubstantia nigra[10]. The Block diagram model of dopamine secretion is depicted in Figure 4. Theequation for relationship of sinemet secretion, dopamine and its rate of change can be represented asshown in (2)
I(t)= ∫ ( ) ( )/ +∫ ( ) ( )/ (2)Except the secretion of dopamine from substantia nigra, sinemet is also infused from sinemet pump.Sinemet infused from pump infusion can be modelled as depicted in (3)
Ci = Amt / V (3)where Ci is the dopamine concentration, K is clearance time, Amt is the dosage input at certain timeand V is the volume of sinemet. After a certain time t, the sinemet input Ii(t) can be represented asdepicted in (4)
SubstantiaNigra
DopamineController
Plant
+
+++
+==
Sensor
+
--
DisturbanceOutput
Input
++
+==
1/ (T1s+1)
1/ (T2s+1)
Kp
Kp
I(s)
9
DL(s)
9

National Conference on Emerging Trends in Science, Technology and Management, 11-12 Nov 2017, ISBN: 978-93-5281-325-4 Page 233
Ii(t) = ∫ = ∫ Amt / V dz (4)However, sinemet pump delivers small dose of sinemet each time, hence, equation (4) has to bemodified. If sinemet infused in one sampling cycle, which is suppose n seconds, then equation (4) canbe rewritten as depicted in (5)
Ii (t) = ∫ ∑ ( / ) ( )dz (5)where ki is a dynamic amount of sinemet infused into the body proportional to the dopamine level asdepicted in (6), (z-k+1) represents the delay.
Ki =
where DLd is the desired dopamine level, and DLr is the dopamine reading obtained from dopaminesensor.
Fig. 5 Illustration of the Parkinson disease [11]
4. SIMULATION RESULTSimulations are carried out to identify the performance of proposed model. The assumption made isthat neither any external disturbance nor any artifacts are acting on the system. A varying gain from 0.5to 2.0 in model of dopamine secretion by artificial substantia nigra is used. The dopamine unit used ispg/mL and time is in minute. The simulation results shown in Fig. 6 demonstrate that gain of 0.5 ishaving higher overshoot as compared to that with gain of 2.0.
5. CONCLUSION AND FUTURE WORK
In this paper a proportional derivative (PD) approach has been proposed in order to estimate theoptimal sinemet infusion rates. Since, the controller is of closed loop type, the infusion of sinemet isdone automatically, not requiring any pre evaluation of dopamine content. The proposed systemassumes that patient is continuously attached to infusion pump and dopamine concentration ismonitored at all time. Therefore, this type of controller is beneficial for patients with severeparkinsionism.There are in general two kinds of control strategies: proportional integral and derivative (PID) controlwhich is widely used in controller design, and model predictive control (MPC) which is popular forshowing better and accurate prediction. In our future work, an improved mathematical model withsimulation result will be employed to design a controller.Other than improvement on control algorithms, some other factors must also be considered in futurelike, dopamine sensor’s stability, accuracy, precision, calibration, time delays of absorption of sinemet,effect of disturbances, etc. Though, there have been many progresses in the field of biomedicalengineering, a clinical feasible and viable solution is yet to be found.
REFERENCES[1.] Koller, W.C., “Falls and Parkinson’s disease,” Clin Neuropharmacol, vol. 12, 1989 pp. 98–105.[2.] http://www.medicalnewstoday.com/info/parkinsons-disease/
0, if DLr ≥ 30 pg/mL
(DLd – DLr).Ks, otherwise (6)
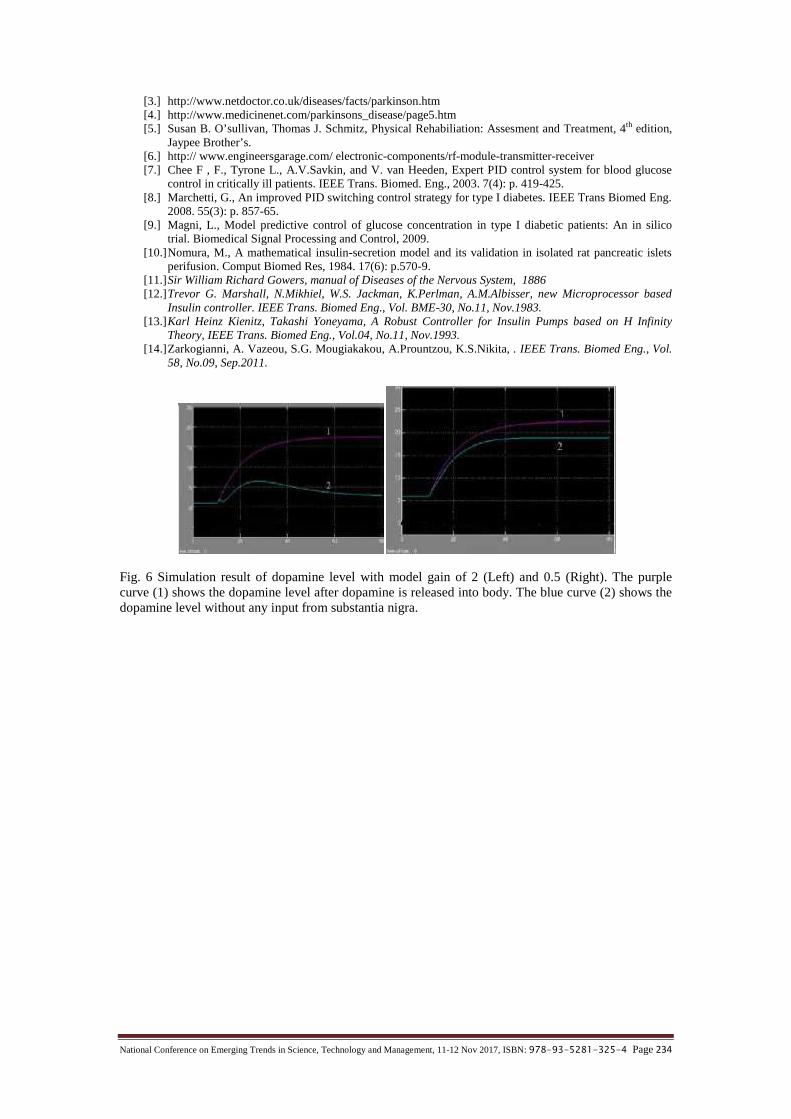
National Conference on Emerging Trends in Science, Technology and Management, 11-12 Nov 2017, ISBN: 978-93-5281-325-4 Page 234
[3.] http://www.netdoctor.co.uk/diseases/facts/parkinson.htm[4.] http://www.medicinenet.com/parkinsons_disease/page5.htm[5.] Susan B. O’sullivan, Thomas J. Schmitz, Physical Rehabiliation: Assesment and Treatment, 4th edition,
Jaypee Brother’s.[6.] http:// www.engineersgarage.com/ electronic-components/rf-module-transmitter-receiver[7.] Chee F , F., Tyrone L., A.V.Savkin, and V. van Heeden, Expert PID control system for blood glucose
control in critically ill patients. IEEE Trans. Biomed. Eng., 2003. 7(4): p. 419-425.[8.] Marchetti, G., An improved PID switching control strategy for type I diabetes. IEEE Trans Biomed Eng.
2008. 55(3): p. 857-65.[9.] Magni, L., Model predictive control of glucose concentration in type I diabetic patients: An in silico
trial. Biomedical Signal Processing and Control, 2009.[10.]Nomura, M., A mathematical insulin-secretion model and its validation in isolated rat pancreatic islets
perifusion. Comput Biomed Res, 1984. 17(6): p.570-9.[11.]Sir William Richard Gowers, manual of Diseases of the Nervous System, 1886[12.]Trevor G. Marshall, N.Mikhiel, W.S. Jackman, K.Perlman, A.M.Albisser, new Microprocessor based
Insulin controller. IEEE Trans. Biomed Eng., Vol. BME-30, No.11, Nov.1983.[13.]Karl Heinz Kienitz, Takashi Yoneyama, A Robust Controller for Insulin Pumps based on H Infinity
Theory, IEEE Trans. Biomed Eng., Vol.04, No.11, Nov.1993.[14.]Zarkogianni, A. Vazeou, S.G. Mougiakakou, A.Prountzou, K.S.Nikita, . IEEE Trans. Biomed Eng., Vol.
58, No.09, Sep.2011.
Fig. 6 Simulation result of dopamine level with model gain of 2 (Left) and 0.5 (Right). The purplecurve (1) shows the dopamine level after dopamine is released into body. The blue curve (2) shows thedopamine level without any input from substantia nigra.
National Conference on Emerging Trends in Science, Technology and Management, 11-12 Nov 2017, ISBN: 978-93-5281-325-4 Page 235
OVER THE COUNTER MEDICATIONS: ANASSESSMENT OF THEIR SAFETY AND USE
Monika Joshi*, Ravi Shankar, Anurag Mishra, Brijesh Singh, Arprit Kumar*Ashoka Institute of Tech & Management, Varanasi, Uttar Pradesh, 221005
Kashi Institute of Pharmacy, Mirzamurad, Varanasi, Uttar PradeshCorresponding Author: [email protected]
Abstract: Over the counter drug means a drug that is sold without a prescription. The use of over thecounter drugs is growing rapidly in India. Therefore a study was conducted with aim to determine theprevalence of over the counter medications in students of pharmacy colleges in eastern Uttar Pradesh and toaccess patients’ perceived safety of these medications. A cross-sectional study was designed; using a self-administered questionnaire for the students’ convenience and easy response disclosure. Data werestatistically analyzed. A total of N = 800 students participated in this survey. Ease in access to OTCmedicine, availability of pharmacist consultation and advertisement in print and electronic media were themain factors disclosed by the respondents that may result in an increase in the use of OTC products. Thestudy revealed that the use of OTC medications was high in the students. Gender, age and educationalinstitution were found significantly affecting the use of OTC medicines. Use of OTC medicines wasgenerally higher among female students (p = 0.001). It was also found that the knowledge about adverseeffects and contraindications is very limited.
Keywords: OTC drugs, RMP, analgesic, antipyretic, ADR.
1. INTRODUCTION
The promotion of consumer involvement in their healthcare is the core principal of health promotionand well being of the society. The best way which is in use in the present scenario is the increased useof OTC drugs rather than prescription drugs. Over the counter (OTC) drugs is one of the self careactivities undertaken by individual, family and community intended to promote health and minimizeillness [1]. ‘OTC Drugs’ means drugs legally allowed to be sold ‘Over the Counter’, i.e. without theprescription of a Registered Medical Practitioner [2]. OTC drugs plays vital role in healthcare system.A huge part of population rely on OTC for the treatment of common ailments like headache, cold,fever, and cough, indigestion, flu and dermatitis. Therefore, wide safety margin must be established forthe OTC drugs. OTC product benefits must outweigh the risk and the chances of misuse of it should below [3]. Individuals can directly be involved in their healthcare by increasing purchase of OTC ratherthan prescribed drugs [4]. The switching of drugs from prescription to OTC has increased worldwide..Popularity of OTC drugs in India had risen promptly. As per OTC market size, India ranks 11th asresult of high growth rate of OTC market over past eight years. Current data indicates Indian OTCmarket to represent $1,773 million with a share of 23% as demonstrated by figure 1.9 In Indiamanufacture, purchase, sale of drug is regulated by Drug and cosmetic act 1940 and rules 1945. InIndia there is no judicial recognition for OTC drugs. The drug included in the schedule H and X ofdrug and cosmetic act are termed as prescription drugs. For the drug listed in schedule G of drug andcosmetic act (1940) no prescription is required but the following mandatory text must be mentioned inthe label: “caution: It is dangerous to take this medicine except under medical supervision [10]. In Indiaand most of the underdeveloped countries all the drugs which are non-prescription are easily availablefor over the counter sale.Moving trend from prescription to non prescription medications saves the time and also reduces cost asit is cheaper for patients to purchase OTC rather than file a prescription [5]. However there are certainother reasons due to which the patients can choose self medication including previous experience of theacute disease, knowledge of drugs and their uses, unavailability of health care professionals fortreatment of patients [6]OTC drugs are easily accessible and are used for the treatment of minor illness. Although OTCmedicines are supposed to be relatively safe, readily available and consumed by patients withoutphysicians consent, it is very important that the patients have the access to clear and broad informationto make an informed choice of proper selection of medicine and their fruitful use. It is very importantto recognize that even OTC medicines can cause unwanted side effects if not properly used and thereare certain OTC drugs which have been used by the patients for drug abuse [9]There are various research reports all over the world claiming that the graduates and post graduates inprofessional colleges are more vulnerable and prone to practice self medication due to their perceptionof low toxicity of OTC drugs, knowledge of drugs, and easy access to internet, wider mediaadvertisements and involvement, unregulated practice of pharmacy profession and level of education

National Conference on Emerging Trends in Science, Technology and Management, 11-12 Nov 2017, ISBN: 978-93-5281-325-4 Page 236
The study was conducted to ascertain:1. Prevalence of use of OTC drugs2. Categories of medications preferred3. Safety priority of using the drugs4. Knowledge of use of OTC drugs
2. MATERIALS AND METHODS
This cross sectional study was conducted during July 2017 to Oct 2017 at different university collegesin eastern region of Uttar Pradesh. A total of 800 students randomly selected from different pharmacycolleges consented to participate in the study. The objective of the study was explained to the studentsand their verbal consent was obtained. The data were collected through self administered closed endedquestionnaire. The questionnaire was divided mainly in two sections first dealing with the demographicparameters and second section dealing with the factors related to attitude, practice and safetyparameters for effective use of OTC drugs.
3. RESULT AND DISCUSSION
The Cross sectional studies over 800 students in different colleges of eastern Uttar Pradesh revealed thefact that the practice of self medication is quiet common in the students without consulting thephysicians.Self medication with OTC drugs can be used in treating minor ailments as it saves time and moneyespecially in areas where health resources are very limited. The use of analgesics and antipyretics instudents was found to be most common followed by cough preparations as can be seen in Fig 1. Themajor reason for self medication was to save money and have minimum expenses signifying the needin developing countries of the world as shown by table 2.It was evident from the data that the students were well known with the drugs and the major source ofinformation being the pharmacist on the pharmacy followed by doctors and then by the parents andrelatives.The major concern was that there were a large percentage (42%) of them were not having theknowledge about side effects or adverse effects of drugs and their storage and other requirementswhich can be detrimental to drugs and finally to the patient himself as evident from the table 3.
Table 1. Demographic profile of pharmacists or shopkeepers and patients asking for OTC (n=800)
Variable N (800) PercentageGender Male 520 65%
Female 280 35%
Age (in years) 18-22 295 36.87%22-24 242 30.25%25-28 235 29.37%
Above 28 28 3.5%Marital Status Single 785 98.12%
Married 15 1.87%
Fig. 1: Category of OTC drugs that are mainly used by the students
18%
11%
National Conference on Emerging Trends in Science, Technology and Management, 11-12 Nov 2017, ISBN: 978-93-5281-325-4 Page 236
The study was conducted to ascertain:1. Prevalence of use of OTC drugs2. Categories of medications preferred3. Safety priority of using the drugs4. Knowledge of use of OTC drugs
2. MATERIALS AND METHODS
This cross sectional study was conducted during July 2017 to Oct 2017 at different university collegesin eastern region of Uttar Pradesh. A total of 800 students randomly selected from different pharmacycolleges consented to participate in the study. The objective of the study was explained to the studentsand their verbal consent was obtained. The data were collected through self administered closed endedquestionnaire. The questionnaire was divided mainly in two sections first dealing with the demographicparameters and second section dealing with the factors related to attitude, practice and safetyparameters for effective use of OTC drugs.
3. RESULT AND DISCUSSION
The Cross sectional studies over 800 students in different colleges of eastern Uttar Pradesh revealed thefact that the practice of self medication is quiet common in the students without consulting thephysicians.Self medication with OTC drugs can be used in treating minor ailments as it saves time and moneyespecially in areas where health resources are very limited. The use of analgesics and antipyretics instudents was found to be most common followed by cough preparations as can be seen in Fig 1. Themajor reason for self medication was to save money and have minimum expenses signifying the needin developing countries of the world as shown by table 2.It was evident from the data that the students were well known with the drugs and the major source ofinformation being the pharmacist on the pharmacy followed by doctors and then by the parents andrelatives.The major concern was that there were a large percentage (42%) of them were not having theknowledge about side effects or adverse effects of drugs and their storage and other requirementswhich can be detrimental to drugs and finally to the patient himself as evident from the table 3.
Table 1. Demographic profile of pharmacists or shopkeepers and patients asking for OTC (n=800)
Variable N (800) PercentageGender Male 520 65%
Female 280 35%
Age (in years) 18-22 295 36.87%22-24 242 30.25%25-28 235 29.37%
Above 28 28 3.5%Marital Status Single 785 98.12%
Married 15 1.87%
Fig. 1: Category of OTC drugs that are mainly used by the students
42%8%
11%
18% 9%
11%
percentage use of OTC drugs
analgesic
antipyretic
antacid
coughsuppresant
National Conference on Emerging Trends in Science, Technology and Management, 11-12 Nov 2017, ISBN: 978-93-5281-325-4 Page 236
The study was conducted to ascertain:1. Prevalence of use of OTC drugs2. Categories of medications preferred3. Safety priority of using the drugs4. Knowledge of use of OTC drugs
2. MATERIALS AND METHODS
This cross sectional study was conducted during July 2017 to Oct 2017 at different university collegesin eastern region of Uttar Pradesh. A total of 800 students randomly selected from different pharmacycolleges consented to participate in the study. The objective of the study was explained to the studentsand their verbal consent was obtained. The data were collected through self administered closed endedquestionnaire. The questionnaire was divided mainly in two sections first dealing with the demographicparameters and second section dealing with the factors related to attitude, practice and safetyparameters for effective use of OTC drugs.
3. RESULT AND DISCUSSION
The Cross sectional studies over 800 students in different colleges of eastern Uttar Pradesh revealed thefact that the practice of self medication is quiet common in the students without consulting thephysicians.Self medication with OTC drugs can be used in treating minor ailments as it saves time and moneyespecially in areas where health resources are very limited. The use of analgesics and antipyretics instudents was found to be most common followed by cough preparations as can be seen in Fig 1. Themajor reason for self medication was to save money and have minimum expenses signifying the needin developing countries of the world as shown by table 2.It was evident from the data that the students were well known with the drugs and the major source ofinformation being the pharmacist on the pharmacy followed by doctors and then by the parents andrelatives.The major concern was that there were a large percentage (42%) of them were not having theknowledge about side effects or adverse effects of drugs and their storage and other requirementswhich can be detrimental to drugs and finally to the patient himself as evident from the table 3.
Table 1. Demographic profile of pharmacists or shopkeepers and patients asking for OTC (n=800)
Variable N (800) PercentageGender Male 520 65%
Female 280 35%
Age (in years) 18-22 295 36.87%22-24 242 30.25%25-28 235 29.37%
Above 28 28 3.5%Marital Status Single 785 98.12%
Married 15 1.87%
Fig. 1: Category of OTC drugs that are mainly used by the students
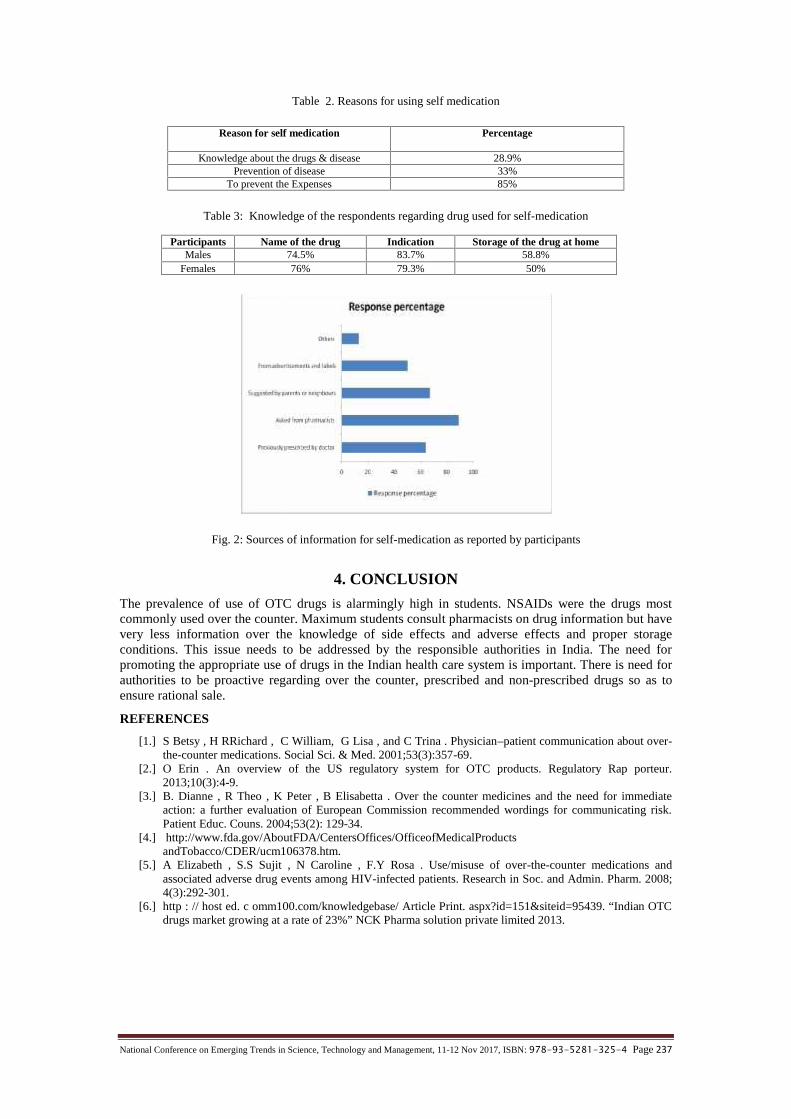
National Conference on Emerging Trends in Science, Technology and Management, 11-12 Nov 2017, ISBN: 978-93-5281-325-4 Page 237
Table 2. Reasons for using self medication
Reason for self medication Percentage
Knowledge about the drugs & disease 28.9%Prevention of disease 33%
To prevent the Expenses 85%
Table 3: Knowledge of the respondents regarding drug used for self-medication
Participants Name of the drug Indication Storage of the drug at homeMales 74.5% 83.7% 58.8%
Females 76% 79.3% 50%
Fig. 2: Sources of information for self-medication as reported by participants
4. CONCLUSION
The prevalence of use of OTC drugs is alarmingly high in students. NSAIDs were the drugs mostcommonly used over the counter. Maximum students consult pharmacists on drug information but havevery less information over the knowledge of side effects and adverse effects and proper storageconditions. This issue needs to be addressed by the responsible authorities in India. The need forpromoting the appropriate use of drugs in the Indian health care system is important. There is need forauthorities to be proactive regarding over the counter, prescribed and non-prescribed drugs so as toensure rational sale.
REFERENCES
[1.] S Betsy , H RRichard , C William, G Lisa , and C Trina . Physician–patient communication about over-the-counter medications. Social Sci. & Med. 2001;53(3):357-69.
[2.] O Erin . An overview of the US regulatory system for OTC products. Regulatory Rap porteur.2013;10(3):4-9.
[3.] B. Dianne , R Theo , K Peter , B Elisabetta . Over the counter medicines and the need for immediateaction: a further evaluation of European Commission recommended wordings for communicating risk.Patient Educ. Couns. 2004;53(2): 129-34.
[4.] http://www.fda.gov/AboutFDA/CentersOffices/OfficeofMedicalProductsandTobacco/CDER/ucm106378.htm.
[5.] A Elizabeth , S.S Sujit , N Caroline , F.Y Rosa . Use/misuse of over-the-counter medications andassociated adverse drug events among HIV-infected patients. Research in Soc. and Admin. Pharm. 2008;4(3):292-301.
[6.] http : // host ed. c omm100.com/knowledgebase/ Article Print. aspx?id=151&siteid=95439. “Indian OTCdrugs market growing at a rate of 23%” NCK Pharma solution private limited 2013.

National Conference on Emerging Trends in Science, Technology and Management, 11-12 Nov 2017, ISBN: 978-93-5281-325-4 Page 238
SODIUM-ION BATTERIES THE FUTURE ASPECTAnuja Singh
Department of Electronics & CommunicationAshoka Institute of Technology & Management
Varanasi, [email protected] Verma, Raj Jaiswal
Department of Electronics & CommunicationAshoka Institute of Technology & Management
Varanasi, [email protected], [email protected]
Abstract – In this paper we are focusing on the alternative energy storage system i.e. Sodium Ion Battery(SIB). Lithium Ion Batteries(LIB) alone cannot satisfy the rising demand for small and mid to large formatenergy storage applications .To mitigate these issues we summarize and compare LIBs with SIBs anddiscuss current research on materials and purpose future directions for SIBs.
Keyword – SIB (Sodium ion battery), LIB (lithium ion battery).
1. INTRODUCTION
Sodium ion batteries are a type of rechargeable metal ion battery that uses sodium ion as charge carriers.[1][2][3]
Battery grade salts of sodium are cheap and abundant, much more than those of lithium. This makes them costeffective alternative especially for applications where weight and energy density are of minor importance such asgrid energy storage for renewable energy sources such as wind and solar power. [1][2]
These cells can be completely drained (to zero charge) without damaging the active materials. They can be storedand shipped safely. Lithium-ion batteries must retain about 30% of charge during storage, enough that they couldshort-circuit and catch fire during shipment.[4] Moreover, Sodium-ion battery has excellent electro-chemicalfeatures in terms of charge-discharge, reversibility, columbic efficiency and high specific discharge capacity. [5]
In 2014 Aquion energy offered a commercially available sodium-ion battery with cost/KWh capacity similarlysimilar to a lead acid battery for use as a backup power source for electricity micro-grids. [6] According to thecompany, it was 85% efficient. Aquion Energy filed for chapter 11 Bankruptcy in March 2017. In 2015researchers announced a device that employed the “18650” format used in laptops, LED flashlights and the Teslamodel S, among other products. Its energy density was claimed to be 90Wh/Kg, a performance comparable tolithium iron phosphate battery. [7] 3
In 2016 other researchers announced a model for a device that use symmetric manganese dioxide electrodes in asalt water bath, separated by a membrane that allowed Cl- to cross it. While charging Na+ ions left the electrodeson one side while other Na ions entered it on the other side. Sodium ion cells have been reported with a voltage of3.6Volts, able to maintain 115 Ah/Kg after 50 cycles, equating to a Cathode-specific energy of approximately400Wh/Kg. [8]
Inferior cycling performance limits the ability of non-aqueous Na-ion batteries to compete with commercial Li-ioncells. In 2015 Faradion claimed to have improved cycling in full Na-ion pouch cells using a layered oxide cathode.[9]
Fig showing a high capacity and power density Na-ion full cell
2. THE SODIUM BATTERYSodium-ion batteries are a direct replacement for lithium-ion (Li-ion) batteries, allowing current Li-ion batterymanufacturers to use existing equipment to construct batteries using Faradion’s next generation materials.[1][2]
Faradion’s sodium ion technology has already shown specific energy densities in full cell exceeding those of theother known sodium-ion materials. In addition, the Faradion team has already developed materials with energydensities exceeding that of the popular LI-ion materials lithium iron phosphate, dispelling the misconception heldby some that sodium ion materials will be unable to achieve high energy densities. [2] The graph below show a
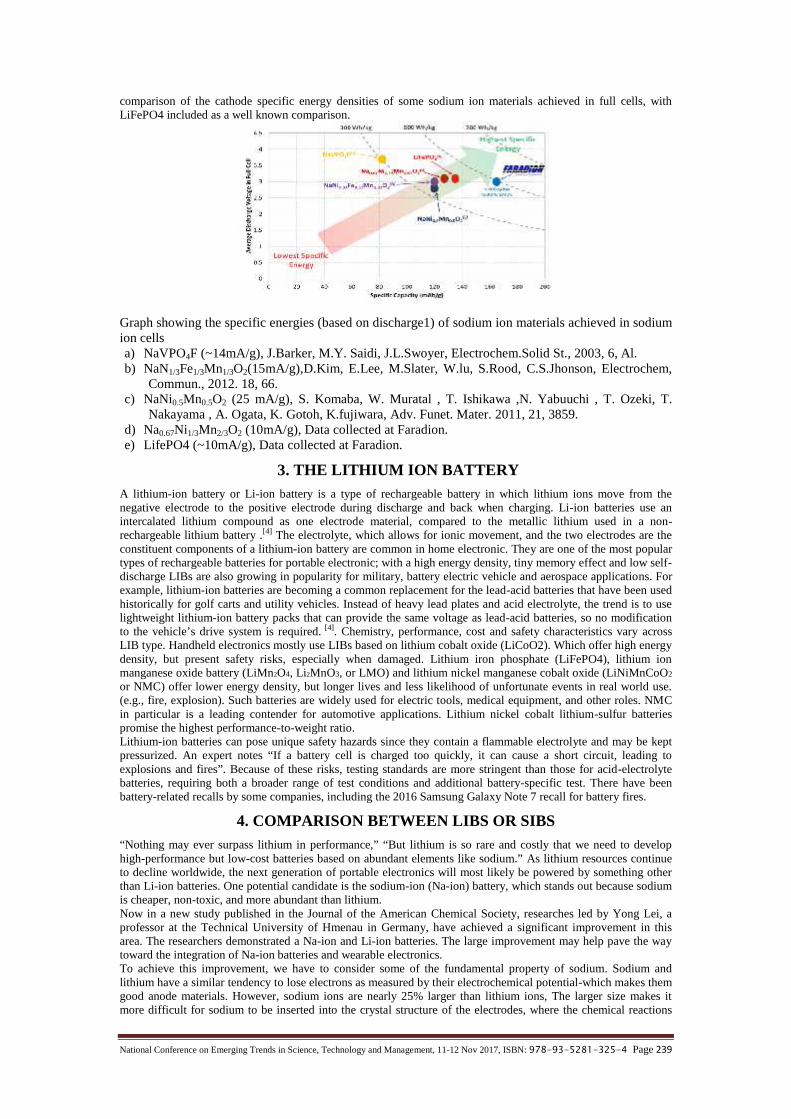
National Conference on Emerging Trends in Science, Technology and Management, 11-12 Nov 2017, ISBN: 978-93-5281-325-4 Page 239
comparison of the cathode specific energy densities of some sodium ion materials achieved in full cells, withLiFePO4 included as a well known comparison.
Graph showing the specific energies (based on discharge1) of sodium ion materials achieved in sodiumion cellsa) NaVPO4F (~14mA/g), J.Barker, M.Y. Saidi, J.L.Swoyer, Electrochem.Solid St., 2003, 6, Al.b) NaN1/3Fe1/3Mn1/3O2(15mA/g),D.Kim, E.Lee, M.Slater, W.lu, S.Rood, C.S.Jhonson, Electrochem,
Commun., 2012. 18, 66.c) NaNi0.5Mn0.5O2 (25 mA/g), S. Komaba, W. Muratal , T. Ishikawa ,N. Yabuuchi , T. Ozeki, T.
Nakayama , A. Ogata, K. Gotoh, K.fujiwara, Adv. Funet. Mater. 2011, 21, 3859.d) Na0.67Ni1/3Mn2/3O2 (10mA/g), Data collected at Faradion.e) LifePO4 (~10mA/g), Data collected at Faradion.
3. THE LITHIUM ION BATTERYA lithium-ion battery or Li-ion battery is a type of rechargeable battery in which lithium ions move from thenegative electrode to the positive electrode during discharge and back when charging. Li-ion batteries use anintercalated lithium compound as one electrode material, compared to the metallic lithium used in a non-rechargeable lithium battery .[4] The electrolyte, which allows for ionic movement, and the two electrodes are theconstituent components of a lithium-ion battery are common in home electronic. They are one of the most populartypes of rechargeable batteries for portable electronic; with a high energy density, tiny memory effect and low self-discharge LIBs are also growing in popularity for military, battery electric vehicle and aerospace applications. Forexample, lithium-ion batteries are becoming a common replacement for the lead-acid batteries that have been usedhistorically for golf carts and utility vehicles. Instead of heavy lead plates and acid electrolyte, the trend is to uselightweight lithium-ion battery packs that can provide the same voltage as lead-acid batteries, so no modificationto the vehicle’s drive system is required. [4]. Chemistry, performance, cost and safety characteristics vary acrossLIB type. Handheld electronics mostly use LIBs based on lithium cobalt oxide (LiCoO2). Which offer high energydensity, but present safety risks, especially when damaged. Lithium iron phosphate (LiFePO4), lithium ionmanganese oxide battery (LiMn2O4, Li2MnO3, or LMO) and lithium nickel manganese cobalt oxide (LiNiMnCoO2
or NMC) offer lower energy density, but longer lives and less likelihood of unfortunate events in real world use.(e.g., fire, explosion). Such batteries are widely used for electric tools, medical equipment, and other roles. NMCin particular is a leading contender for automotive applications. Lithium nickel cobalt lithium-sulfur batteriespromise the highest performance-to-weight ratio.Lithium-ion batteries can pose unique safety hazards since they contain a flammable electrolyte and may be keptpressurized. An expert notes “If a battery cell is charged too quickly, it can cause a short circuit, leading toexplosions and fires”. Because of these risks, testing standards are more stringent than those for acid-electrolytebatteries, requiring both a broader range of test conditions and additional battery-specific test. There have beenbattery-related recalls by some companies, including the 2016 Samsung Galaxy Note 7 recall for battery fires.
4. COMPARISON BETWEEN LIBS OR SIBS“Nothing may ever surpass lithium in performance,” “But lithium is so rare and costly that we need to develophigh-performance but low-cost batteries based on abundant elements like sodium.” As lithium resources continueto decline worldwide, the next generation of portable electronics will most likely be powered by something otherthan Li-ion batteries. One potential candidate is the sodium-ion (Na-ion) battery, which stands out because sodiumis cheaper, non-toxic, and more abundant than lithium.Now in a new study published in the Journal of the American Chemical Society, researches led by Yong Lei, aprofessor at the Technical University of Hmenau in Germany, have achieved a significant improvement in thisarea. The researchers demonstrated a Na-ion and Li-ion batteries. The large improvement may help pave the waytoward the integration of Na-ion batteries and wearable electronics.To achieve this improvement, we have to consider some of the fundamental property of sodium. Sodium andlithium have a similar tendency to lose electrons as measured by their electrochemical potential-which makes themgood anode materials. However, sodium ions are nearly 25% larger than lithium ions, The larger size makes itmore difficult for sodium to be inserted into the crystal structure of the electrodes, where the chemical reactions

National Conference on Emerging Trends in Science, Technology and Management, 11-12 Nov 2017, ISBN: 978-93-5281-325-4 Page 240
take place[1][5]. As a result, the ions can’t move as fast, which lies at the root of the slow charge/discharge problem.Tied in with this problem, the charge transport and stability of the materials also need to be improved.Although we could not decrease the size of the sodium ions, They could improve the efficiency with the thesodium ions are inserted into the electrodes. To do this, we used a molecular design strategy based on extendingthe electrode material’s π-conjugated system, which basically involves manipulating the way that these moleculesbond with each other. Physically, this strategy results in terrace morphology, consisting of multiple widely spacedlayers that form a faster route for the sodium ions to move through. The extended π-conjugated system alsoimproves the charge transport and stabilizes the charged /discharged states so that they can better tolerate the fastinsertion/extraction of Na-ions.In terms of battery performance, this change results in significant improvement. As always, there is still a tradeoffbetween charge/discharge rates and capacity. But the new Na-ion batteries can operate at a current density (ameasure of the charge/discharge rate) that is 1000 times higher (10 A/g vs. 10 mA/g) than most previouslyreported organic Li-ion batteries while retaining a much higher capacity (72 mAh/g).At an intermediate current density (1 A/g), the new battery delivers reversible capacity of 160 mAh/g, which is oneof the highest values reported for both organic Na-ion and Li-ion batteries to date. The battery also exhibits goodcapacity retention (70% retention after 400 cycles). Sodium ion technology is similar to lithium ion technology andthe following points highlight the similarities and differences: Availability and Cost
Sodium ion materials have lower material cost than lithium ion materials (e.g. sodium carbonate is <10% of the cost of equivalent lithium salt). Furthermore, cathode and electrolyte costs can be ~50% ofcell costs, so the overall reduction is substantial. Na is far more abundant in earth’s crust than Li (Na ~2.6% vs Li ~ 0.005%) making this technology more sustainable.
Drop-in SolutionNa ion materials can be processed in the same way as Li ion materials at every step, from the synthesisof the active materials to the electrode processing. This will allow current Li-ion battery manufacturersto use existing equipments to construct batteries using Faradion’s novel material. Existing Li-ionmanufacturing lines can be used to make sodium ion batteries. Current collectors in Na-ion cells can befabricated using aluminum rather than the more expansive copper in lithium cells.
Energy densityFaradion’s novel Na-ion cells have energy densities same as those of conventional Li-ion cells.
PowerInitial electrochemical tests have shown that the rate capabilities of Faradion’s Na-ion can be as good asthose of conventional Li-ion materials.
SafetyFaradion’s Na-ion cells have improved thermal stability as well as transport safety.
Cycle lifePreliminary cell testing has shown excellent cycle life in many Faradion’s novel materials.
Shelf lifePreliminary analysis indicates similar shelf life to currently available Li-ion materials.
5. CONCLUSIONSodium-ion non-aqueous batteries are of great interest as a replacement for lithium ion in portable device andsmall device applications, primarily because they are cheaper, often by a factor of ten. Right now the highest costmaterial in a battery is separator, but folks are anticipating one day lithium being the cost determining material, orthat due to some geo-political situation we won’t be able to access lithium.Through reasonable molecular design strategy, we demonstrated that the extension of the π-conjugated system isan efficient way to improve the high rate performance, leading to much enhanced capacity and cyclability. We alsothink our work provides a good attempt to attempt the search for new electrode materials from the traditionalinorganic to organic materials and might arouse further attention regarding this area.Building on this research, we further plan to improve the batteries using the molecular design strategy and otherinnovative methods. With these points we conclude that we should use SIBs as a replacement for LIBs to satisfythe coming generations.
REFERENCES
[1] Palomares Veronica; et. Al( 2012). “Na-ion batteries, recent advances and present challenges to becomelow cost energy storage systems”. Energy and Environmental Science. 5884-5901.
[2] Paan, Huilin; et al. (2013). “Room-temperature stationary sodium ion batteries for large scale electricenergy storage”. Energy and Environment Science. 6.2338-2360.
[3] Hwang, Jang-Yeon; Myung, Seung-Taek; Sun, Yang-Kook (2017). “Sodium-ion batteries: present andfuture”.chem. Soc. Rev. 46: 3529-3614.
[4] Challenging Lithium-Ion Batteries with New Chemistry, Chemical & Engineering News, Alex Scott, 20,July, 2015.

National Conference on Emerging Trends in Science, Technology and Management, 11-12 Nov 2017, ISBN: 978-93-5281-325-4 Page 241
[5] Saadoune, I.; Difi, S; Edström, K. Lippens, P.E. (2014-05-01). “Electrode materials for sodium ionbatteries: A cheaper solution for the energy storage”. 2014 International Conference on Optimization ofElectrical and Electronic Equipment (OPTIM): 1078-1081.
[6] Bullis, Kevin (November 14, 2014). “A Battery to Prop Up Renewable Power Hits the Market”.[7] Mack, Eric (November 28, 2015). “Researchers create sodium battery in industry standard “18650”
format”.[8] Smith, Kyle C.: Dmello, Rylan (2016-01-01).”Na-Ion Desalination (NID) Enabled by Na-Blocking
Membranes and Symmetric Na-intercalation: Porous-Electrode Modeling”. Journal of theElectrochemical Society. 163 (3): A530-A539. ISSN 0013-4651.
[9] Lavars, Nick (2016-01-06). “Sodium battery contains solution to water desalination”.
National Conference on Emerging Trends in Science, Technology and Management, 11-12 Nov 2017, ISBN: 978-93-5281-325-4 Page 242
DWT-DFRNT MULTIPLE TRANSFORM METHODBASED A ROBUST DIGITAL WATERMARKING
TECHNIQUE FOR IMAGE CONTENTS1Swati Singh, 2Richa Pandey, 3Sumit Kumar
#Electronics & Communication Engineering, Ashoka Institute of Technology & Management, Uttar Pradesh, IndiaEmail: [email protected], [email protected]
*Assistant Professor, Dept. of Electronics & Communication Engineering BIETUttar Pradesh, India3
Abstract — Copyright assurance of advanced substance has turned out to be one of vital issues incomputerized content commercial center. Advanced watermarking might be utilized as a powerfultechnique for distinguishing the copyright responsibility for content against unapproved utilize andconveyance. In this paper, we propose a strong advanced picture watermarking calculation in view of thevarious change technique, discrete wavelet change (DWT) and discrete fractional random transform(DFRNT). We embrace a two-dimensional (2D) standardized identification for concealing data and applythe square code encoding and create a watermark through them. The produced watermark picture isinserted into DWT-DFRNT utilizing quantization procedure with a specific end goal to guarantee strengthand intangibility of the watermark. Exploratory outcomes show that our proposed calculation has enhancedthe extraction execution by precisely removing the shrouded data in the 2D standardized identification fromthe distinguished watermark. Likewise, consolidating the double change strategy, DWT and DFRNT, hasenhanced the intangibility and heartiness of the watermark against essential picture flag preparing assaults.
Keywords: Digital Watermarking, Discrete Wavelet Transform (DWT), Discrete Fractional Random Transform(DFRNT), 2D-barcode, Quantization.
1. INTRODUCTION
With the marvelous development in computerized content commercial center, illicit acts by unapprovedclients to duplicate, alter, and circulate advanced substance, which are copyrighted, are additionallyexpanding always. By the dissemination of replicated or controlled illicit advanced substance, thelawful market is being impacted and copyright proprietors may lose the privilege for their substance.Therefore, copyright assurance and confirmation of advanced substance are developing as significantissues in computerized content commercial center [1, 2]. Advanced watermarking [3, 4] can be utilizedas a viable strategy for distinguishing the copyright responsibility for content from illicit control andconveyance.The essential thought of advanced watermarking is installing watermark information, which containsdata about the copyright of the computerized content, subtly into the computerized media substance,for example, pictures, sound, and video [3, 5]. The shrouded watermark information can be utilized tovalidate the uprightness of the first substance [6] and it can be extricated such that the implantingprocedure is contrarily connected to the watermarked content.Advanced watermarking methods can be characterized into the spatial space and recurrence area asindicated by the area utilized for inserting watermark. In the spatial area based watermarking,watermark is inserted into advanced substance such that the procedure changes the estimations of chosepixels, however it has powerless vigor against basic picture flag handling and assaults, for example,clamor, separating, and pressure, and might be effortlessly decimated by mutilation [7]. In therecurrence area based watermarking, the procedure inserts a watermark into the chose bit of recurrencespace by changing the coefficients [8]. The recurrence area based watermarking is known as morevigorous and impalpable system than the spatial space based watermarking, so the recurrence space isfor the most part utilized as a part of late watermarking strategies [5, 9].In the past looks into, numerous advanced watermarking techniques have been proposed. Cox et al.,[10] proposed a protected watermarking calculation utilizing spread range. Darmstaedter et al., [11]proposed a spatial watermarking calculation by partitioning a picture into squares. Contrasting with theearly watermarking strategies, numerous recurrence area based advanced watermarking systems, forexample, discrete cosine change (DCT) [12-14], DWT [15, 16], particular esteem decay (SVD) [17],and DFRNT [18], have been created to enhance their strength and indistinctness. As of late,watermarking systems in view of double change space, for example, DWT-DCT [19, 20], DWT-SVD[21], and SVD– DCT [22] have likewise been proposed.In this paper, we propose a strong computerized picture watermarking calculation in light of thevarious change strategy, DWT and DFRNT areas utilizing 2D standardized tag keeping in mind the end

National Conference on Emerging Trends in Science, Technology and Management, 11-12 Nov 2017, ISBN: 978-93-5281-325-4 Page 243
goal to enhance the extraction execution, intangibility and heartiness of the watermark against pictureflag handling assaults, for example, pictures pressure and clamor including.
2. RELATED METHODS
2.1. 2D barcodesIn the watermark age process, we utilize 2D scanner tags which have different data limits and the self-blunder remedy work. 2D standardized identifications generally utilized as a part of different regions,for example, daily papers, magazines, blurbs, TV, the web, tickets, receipts, and promotions. 2Dscanner tags hold data in two ways, evenly and vertically, and in this way the measure of recordabledata is definitely more prominent than in a one-dimensional (1D) standardized identification. A 2Dscanner tag is additionally material to advanced substance: An obvious check can be inserted intocomputerized substance, for example, an exploration article or a picture with the goal that it containsthe data significant to the substance.
Figure 1. Types of 2D-barcode
Figure 1 demonstrates some illustrative cases of 2D standardized identifications that have beendischarged and much of the time utilized: (a) the speedy reaction (QR) code, (b) DataMatrix, and (c)PDF417. In various structures, every one of them demonstrate a 2D scanner tag created from a similardata, the message "123456789." Among them, PDF417 is stack standardized tag, though the QR codeand DataMatrix depend on the network technique. The QR code holds the best measure of data, trailedby DataMatrix and PDF417. Among the different sorts of 2D scanner tags, the QR code is known todisplay great execution in many regards, since the code measure is little regardless of the possibilitythat it contains a lot of data, and the code can be filtered and perused quickly.The data limit and code size of 2D standardized tags are subject to the module measure, mistakerevision level, and sorts of encoding. For the most part, the data limit increments as the code size of the2D standardized identification increments, yet diminishes as the mistake redress level ascents. Forinstance, a 21ⅹ21 cell QR code can contain 41 numbers or 25 alphanumeric information if the blunderrectification level is low, however 17 numbers or 10 alphanumeric information if the mistake revisionlevel is high. The data limit of a 25ⅹ25 cell is around two times more prominent than that of a 21ⅹ21cell. Consequently, a 2D standardized tag can be connected to the innovation for computerized contentcopyright insurance innovation, for example, legal stamping, on account of the self-mistake redresswork alongside the amplified data limit, limited code locale, and quick code perusing. This is onaccount of the data contained in a 2D standardized tag can be reestablished even after it is distinguishedfrom pressure, clamor, and assault, for example, separating, beating a specific scope of blunder. Inperspective of the distinctive applications, a separated administration can be given, as the 2D scannertag is distinguished while showing content with the goal that the data significant to the substance mightbe given on the screen.1.2. Multiple transform methodThe transform method used in the proposed system consists of a combination of DWT and DFRNTmultiple transform in order to ensure the imperceptibility and robustness of the watermark due to thefrequency decomposition ability of DWT that extracts robust coefficients and the unpredictable randomcharacteristic of DFRNT.For the multiple transform, first 2D-DWT [7, 23] is used and a host image signal is converted to a 2Dsignal to be used as the input for the 2D-DWT. The 2D-DWT-converted image signals can bedecomposed into H (LH), V (HL), and D (HH), which have different frequency characteristics fromone another. One time of 2D-DWT allows for the embedment of at least three watermarks. This notonly robustly embeds the watermarks into a certain frequency band, but also allows the informationabout the copywriter and user, including the secondary copywriter or those with the neighboring

National Conference on Emerging Trends in Science, Technology and Management, 11-12 Nov 2017, ISBN: 978-93-5281-325-4 Page 244
copyright, to be additionally embedded into the content circulated by the copywriter of the content.This shows the pathways by which the contents are circulated and thereby enables effective multi-stagecirculation tracking.DFRNT accepts the specific frequency coefficients generated by the 2D-DWT as the input data for theDFRNT, and randomly mixes the data by effecting various changes through the manipulation of theparameters. This leads to increased calculation complexity, so that the statistical characteristics of thedata may not be understood by illegal users. The DFRNT [24] is generally performed in the methodthat follows.Firstly, matrix H is generated using P generated as a random seed value, which is one of the parametersshown in Equation (1):
(1)To generate an eigenvector from matrix H, SVD matrix decomposition is performed with respect to H,as shown in Equation (2):
(2)Here, the generated VR is the matrix composed of N orthogonal eigenvectors, as in Equation (3):
(3)Next, the NxN diagonal matrix DR
α is generated using α and m, other parameters of DFRNT, as inEquation (4):
(4)Then, Rα is calculated by Equation (5) using VR. The calculated Rα and the DFRNT input signal X aresubstituted in Equation (6) to obtain XR, the final output of the DRFNT:
(5)
(6)In this way, DFRNT can transform the input signals to arbitrary unpredictable signals with threeparameters and restore them through inverse transformation.
3. PROPOSED WATERMARKING TECHNIQUE
3.1. Watermark generationThe watermark generation process is summarized by the steps as follows.1) Generate a barcode containing information that is embedded into an image signal through a 2Dbarcode encoder2) Put the generated barcode into the block code encoder that we designed for encoding it into a binaryimage.3) Produce the watermark image.
Since the error correction of the 2D barcode is focused on the correction of bust error rather thanrandom error, other possible errors other than bust error are corrected by such methods as block coding.3.2. Watermark embedding algorithmThe watermark embedding algorithm is summarized as follows:
1. First, we generate the watermark image through the 2D barcode and block code encoding.2. The host image is decomposed into three sub-bands, H, V, and D, through the two-level 2D-
DWT. The 2D-DWT is performed by scanning the image signal in the 8x8 block unit, andsome coefficients are chosen among the specified sub-band coefficients of each blockaccording to the key table.
3. Next, the DFRNT is performed on the sub-band coefficients. And then, we embed thewatermark image into the sub-band coefficient value using quantization technique.
4. Finally, we performed the inverse DFRNT (IDFRNT) and inverse DWT (IDWT).5. As the final result, we obtain the watermarked image.
Figure 2 shows the steps in the watermark embedding algorithm.

National Conference on Emerging Trends in Science, Technology and Management, 11-12 Nov 2017, ISBN: 978-93-5281-325-4 Page 245
Figure 2. Watermark embedding algorithm
3.3. Watermark extracting algorithmThe watermark extraction process is performed in such a way that the embedding process is inverselyapplied to the watermarked image signal.
4. EXPERIMENTAL RESULTS
In order to evaluate the performance of our proposed algorithm, we have performed the experimentswith respect to the extraction performance, imperceptibility, and robustness of the watermark in variousconditions including image compression and noise adding attacks.We used 512x512 size standard gray level images as the sample host images and a 21x21 cell QR code,and 2x2 block code encoder.For performing multiple transform, two-level 2D-DWT is performed to decompose the input imagesignal, 512x512 gray image, into the three sub-band frequencies of H, V, and D. The 2D-DWT isperformed by scanning the image signal in the nxn block unit until all pixels of the image signal aretransformed. The size of scanning block is set to 8, and the size of the sub-band coefficient matrixgenerated through performing the two-level 2D-DWT on the image of 512x512 size would be 64x64.Then, DFRNT is performed on each of sub-band frequencies. The default setting values for theparameters of the DFRNT function are set to: α = 0.01; m = 3; and random seed rs = 1. The value of thequantization coefficient Q is determined to be in the range of 20 to 25 according to the quality demandof images.In order to evaluate the imperceptibility and robustness, we compute the peak signal to noise ratio(PSNR) and Bit Error Rate (BER). BER value is calculated as follows:
The experimental result of the proposed watermark embedding algorithm without being attacked isshown in Table 1. The result verifies that the watermark is imperceptible and there are no visibledifferences between the two images by comparing the original image signal with the image signal afterembedding the watermark into the H band of 2D-DWT. The Q value for embedding was set to 25 andthe acquired PSNR is 40.01 dB for Lena image.We evaluated the extraction performance of the proposed watermarking algorithm by computing BERand the experimental results are shown in Figure 3. Figure 3 shows (a) the extracted watermark imagefrom the watermarked Lena image, (b) the restored 2D barcode. In the experimental result, the restored2D barcode gave that BER=0%. This indicates that the 2D barcode was correctly restored.
Table 1: Image signals before and after embedding watermark

National Conference on Emerging Trends in Science, Technology and Management, 11-12 Nov 2017, ISBN: 978-93-5281-325-4 Page 246
Figure 3. Extraction and restoration of 2D-barcode
The PSNR values before and after embedding the watermark for the diverse standard images are givenin Table 2. In the experimental result, the average PSNR of the test sample images was 40.22dB andBER of the extracted watermark kept 0% in all the sample images.
Table 2: Conformance experiment of the watermarked images
We performed the experiments by carrying out image compression and noise adding attacks, and theextracted and restored QR codes after being attacked are shown in Table 3. In the case of compressionattack, JPEG Quality Factor (QF) was set to 65. In the case of noise attack, Noise (g) denotes theGaussian noise with mean set to 0 and variance set to 0.001, and Noise(s) denotes the Salt & Peppernoise with density set to 0.01.The experimental results verify that the proposed algorithm ensures the imperceptibility and robustnessof the watermark.
Table 3. Extraction results by various attacks
In addition, we evaluated the extraction performance of the proposed algorithm with reference to BERthrough comparing the DWT single domain with the DWT-DFRNT multiple transform domain. In theperformed experiment, we computed the BER values the extracted watermark images fixing the PSNRat 40 dB after being attacked and compared them in the two types of domain.As given in Table 3, the experimental results verify that while the DWT-DFRNT multiple transformdomain has a similar level of extraction performance compare with that of the DWT single domain, andthe 2D barcodes of both domains could be restored.

National Conference on Emerging Trends in Science, Technology and Management, 11-12 Nov 2017, ISBN: 978-93-5281-325-4 Page 247
5. CONCLUSIONS
In this paper, we have proposed a vigorous advanced watermarking system for picture substance inview of DWT-DFRNT different change technique.The watermark age process has been executed by utilizing the 2D standardized identification andsquare encoding procedures keeping in mind the end goal to enhance the extraction execution of thewatermark. The watermark implanting process is finished by changing the produced watermarksthrough the various change which takes the advantages of the recurrence deterioration capacity ofDWT and the inalienable irregularity of DFRNT. The trial comes about displayed that the proposedframework has a decent installing/extraction execution. The inserted watermarks fulfilled theindistinctness and the nature of the watermarked pictures kept up at an abnormal state, and theimplanted 2D standardized identifications as watermarks could be superbly reestablished. Theproposed calculation is additionally strong against general picture preparing assaults, for example,picture pressure and clamor including.
REFERENCES
[1.] V. Bhat K, I. Sengupta and A. Das, “An adaptive audio watermarking based on the singular valuedecomposition in the wavelet domain”, Digital Signal Processing, vol. 20, no 6, (2010), pp. 1547–1558.
[2.] X.-Y. Wang and H. Zhao, “A Novel Synchronization Invariant Audio Watermarking Scheme Based onDWT and DCT”, IEEE Transactions on Signal Processing, vol. 54, no. 12, (2006), pp. 4835- 4840.
[3.] I. J. Cox, M. L. Miller, J. M. G. Linnartz and T. Kalker, “A Review of of Watermarking Principles andPractices”, Digital Signal Processing for Multimedia Systems by IEEE, (1999), pp. 461-485.
[4.] I. J. Cox and M. L. Miller, “The first 50 years of electronic watermarking”, Journal on Applied SignalProcessing, Vol. 2002, No 2, (2002), pp. 126-132.
[5.] H.-Y. Huang, C.-H. Yang and W.-H. Hsu, “A Video Watermarking Technique Based on Pseudo-3-DDCT and Quantization Index Modulation”, IEEE Transactions on Information Forensics and Security,vol. 5, no. 4, (2010), pp. 625-637.
[6.] C. Busch, W. Funk and S. Wolthusen, “Digital watermarking: From concepts to real-time videoapplications”, IEEE Transactions on Computer Graphics and Applications, vol. 19, no. 1, (1999), pp.25–35.
[7.] V. M. Potdar, S. Han and E. Chang, “A Survey of Digital Image Watermarking Techniques”,Proceedings of the 3rd IEEE International Conference on Industrial Informatics, (2005), August; Perth,Australia.
[8.] K. K. Sharma and D. K. Fageria, “Watermarking based on image decomposition using self-fractionalFourier functions”, Journal of Optics, vol. 40, no. 2, (2011), pp. 45-50.
[9.] A. Piva, M. Barni and F. Bartolini, “Copyright Protection of Digital Images by Means of FrequencyDomain Watermarking”, Proceedings of SPIE Conference on Mathematics of Data/Image Coding,Compression, and Encryption, vol. 3456, (1998), July; San Diego, CA.
[10.]I. J. Cox, Joe Kilian, F. T. Leighton and T. Shamoon, “Secure spread spectrum watermarking formultimedia,” IEEE Transactions on Image Processing, vol. 6, (1997), pp. 1673-1687.
[11.]V. Darmstaedter, J. f. Delaigle, J. J. Quisquater and B. Macq, “Low cost spatial watermarking”,Computers & Graphics, vol. 22, no. 4, (1998), pp. 417-424.
[12.]W. C. Chu, "DCT-Based Image Watermarking Using Subsampling", IEEE Transactions on Multimedia,vol. 5, no. 1, (2003), pp. 34-38.
[13.]F. Deng and B. Wang, “A novel technique for robust image watermarking in the DCT domain”,Proceedings of the IEEE 2003 International Conference on Neural Networks and Signal Processing, vol.2, (2003), December 14-17; Nanjing, China.
[14.]V. Saxena, P. Khemka, A. Harsulkar and J. P. Gupta, “Performance analysis of color channel for DCTbased image watermarking scheme”, International Journal of Security and Its Applications, vol. 1, no .2,(2007), pp. 41-46
[15.]S. Q. Wu, J. W. Huang and Y. Q. Shi, “Efficiently self-synchronized audio watermarking for assuredaudio data transmission”, IEEE Transactions on Broadcasting, vol. 51, no. 1, (2005), pp. 69-76.
[16.]D. Zhang, B. Wu, J. Sun and H. Huang, “A new robust watermarking algorithm based on DWT”, 2ndInternational Congress on Image and Signal Processing, (2009), October 17-19; Tianjin, China.
[17.]C. -C. Chang, P. Tsai and C. -C. Lin, “SVD-based digital image watermarking scheme”, PatternRecognition Letters, vol. 26, no. 10, (2005), pp. 1577–1586.
[18.]Q. Guo and S. Liu, “Novel image fusion method based on discrete fractional random transform”,Chinese Optics Letters, vol. 8, no. 7, (2010), pp. 656-660.
[19.]A. Al-Haj, “Combined DWT-DCT Digital Image Watermarking”, Journal of Computer Science, vol. 3,no. 9, (2007), pp. 740-746.

National Conference on Emerging Trends in Science, Technology and Management, 11-12 Nov 2017, ISBN: 978-93-5281-325-4 Page 248
[20.]W. Liu and C. Zhao, “Digital watermarking for volume data based on 3D-DWT and 3D-DCT”,Proceedings of the 2nd International Conference on Interaction Sciences: Information Technology,Culture and Human, ACM, vol. 403, (2009), November 24-26; Seoul, Korea.
[21.]Q. Li, C. Yuan and Y. Z. Zong, “Adaptive DWT-SVD domain image watermarking using human visualmodel”, Proceedings of 9th International Conference on Advanced Communication Technology, vol. 3,(2007), February 12-14; Gangwon-do, Korea.
[22.]B. Y. Lei, I. Y. Soon and Z. Li, “Blind and robust audio watermarking scheme based on SVD–DCT”,Signal Processing, vol. 91, no. 8, (2011), pp. 1973-1984.
National Conference on Emerging Trends in Science, Technology and Management, 11-12 Nov 2017, ISBN: 978-93-5281-325-4 Page 249
EXTRACTION OF ANTHOCYANINE FROMSYZYGIUM CUMINI AND COMPARATIVE STUDY
WITH RED WINEMs. Pragya Pandey2*, Ravina Kumari1
Department of Biotechnology, Ashoka Institute of Technology and Management,Varanasi*[email protected]
Abstract - Syzygium cumini commonly known as jamun, is a widely distributed forest tree in India andother tropical and sub-tropical regions of the world. This fruit is rich in naturally occuring polyphenoliccompounds such as anthocyanins, tannins, terpenoids and various minerals having enormous healthbenefits as antioxidants, anti-inflammatory, anti-viral, protection from cardiovascular damage, obesity ,anti cancerous, neuroprotective, prevention of LDL oxidation, diabetes prevention and vision improvement.Polar nature of Anthocyanin pigments allows it to soluble in the so many solvents such as ethanol, methanol,DMSO, acetone and water.An aqueous two phase system may be developed to extract anthocyanin presentin fruit residues during juice production. Compared with traditional extraction using acidified ethanol, thenovel aqueous two phase extraction could not only yield a much higher concentration of anthocyanin, savemore extract, energy and time but also decreases impurities in extract, for example sugars and proteincontents. Purification of anthocyanine is done by solid phase adsorption. Anthocyanins found in red winehas many neutraceuticals properties. Red wine may exerts its effect by different mechanisms such as abilityto raise the high density lipoprotein (HDL) levels, total antocyanine present in fresh jamun is 157.96mg/100g it is much more quantity present in grapes used in the production of red wine.
1. INTRODUCTIONThere has been an increasing demand for health promoting food products by the consumers all over the world.Syzygium cumini is a tropical fruit tree of great economic importance. S. cumini fruit is a very rich source ofanthocyanin. As it matures, its colour changes to pink from green, then to shining crimson red and finally to blackcolour. Most prominent among the flavonoids are the anthocyanins-universal plant colorants. They are ofparticular interest to food colorant industry due to their ability to impart vibrant colours to the products. Now theyare also enhancing the health promoting qualities of foods even (Izabela Konczak & Wei Zhang, 2004). Theextraction of anthocyanins is first step in determination of total as well as individual anthocyanin in any type ofplant tissue. After this purification of anthocyanin containing extract is often necessary because considerableamount of other components may also be extracted and concentrated. To effectively characterise and quantify theanthocyanin it is important to extract them in an efficient manner in which their original form is preserved.Aqueous two-phase system (ATPS) is a new type of liquid–liquid extraction technology developed on the basis ofsolvent extraction. Its principle is based on the selective distribution between two aqueous phases, which is similarto traditional organic solvent extraction. This technology is widely applied in separation and purification ofbioactive substances, succeeding in the separation and purification of protein enzymes, nucleic acids, antibioticsand plant active components. In recent years, the polymer-salt ATPS has aroused extensive concern. Comparedwith the polymer–polymer ATPS, the polymer-salt ATPS has a better application prospect in the extraction andseparation of active component in natural products (xu tang & yun wang, 2017).And the purification ofanthocyanin is carried out by HPLC or CCC. However, these methods are too expensive to popularize.
2. TECHNIQUES INVOLVED IN WINE PREPARATION
2.1. Aqueous two phase extraction:Aqueous two phase solution consists of specific amount of ethanol, inorganic salt and water in a totalamount of 20 g. Inorganic salt was first dissolved into water in 25-mL glass tubes. Through preliminaryexperiments, it was found that the fruit residues hung between top phase and bottom phase. Therefore,in this study, the ratio of material and solvent was 1:20. 1.0 g S. cumini residue was mixed byvortexing for 30 s, followed by addition of ethanol, and again vortexing for 30 s, and then the mixtureis allowed to stand at room temperature for 0.5-1.0 h to enable phase separation. After the two phaseshad separated, the volumes of the top and bottom phases were recorded, and anthocyanins wereanalyzed in the top and bottom phases, respectively.2.2. Acidified ethanol extraction:Acidified ethanol extraction of anthocyanins was performed with 50% (w/w) ethanol at 50°C and pH3.5 for 60 min. Aqueous two-phase extraction of anthocyanins combined with column chromatographytake 100 g of pre-treated AB-8 macroporous resin and soak into deionised water (pH=3.0-3.5) for 24 hto equilibrate, and then filter out the solution. Dilute the anthocyanin extract 5 times by water (pH=3-3.5) until ethanol elimination under vacuum at low temperature (37°C) on a rotary evaporator. Thediluted extract was added into a glass column (Φ1.5×40 cm) packed by 50.0 g pre-treated AB-8

National Conference on Emerging Trends in Science, Technology and Management, 11-12 Nov 2017, ISBN: 978-93-5281-325-4 Page 250
macroporous resin at a volume of 40 mL resin bed . The anthocyanins adsorbed to the resins werewashed with 1-2 BV water (pH 3-3.5) or 1-2 BV 20% (v/v) ethanol solution (pH 3-3.5).
2.3. Analytical proceduresAnthocyanins were directly determined by the pH-differential method (M. Mónica Giusti and Ronald E. Wrolstad, 2001).Samples were diluted with buffer and the absorbance was read at 520 and 700 nm using UV/VISspectrophotometer.
3. DISCUSSIONBy preliminary experiments, it was found that the effect of aqueous two phase extraction strategy on recovery of anthocyanins onaddition of inorganic salts and ethanol to fruit residue without vortexing during addition was least but when inorganic salt wasfirstly added to fruit residue, and the mixture was vortexes for 30 sec before addition of ethanol then the recovery of anthocyaninwas highest.From the earlier experiments, it was also noticed that, the highest yield obtaining method is aqueous two phase extraction with30% ethanol (w/w) and the yield obtained is 92.34%.Some researchers have also reported that ATPE can be utilised for removal of protein impurities and sugar.Also, the column chromatography with AB-8 resin was found to be the most suitable method for purification of anthocyanin.
4. CONCLUSIONWine is an alcoholic beverage but with lower alcohol content and lots of health benefits such as prevents cardiovascular
diseases, anti-inflammatory properties, prevent diabetes, hypertension, prevents memory loss and many more. Similarly jamunalso possesses all these characteristics due to presence of same types of polyphenolic compounds. Even alcohol related deathsand deaths caused by diseases due to alcoholism are a major cause for concern in India. Consumption of alcohol is a social tabooin most parts of India and it is also one of the greatest causes for poverty in the country. From studies, it is found that in 2012alone about 3.3 millions deaths in India were attributed to alcohol consumption. This simply means that large number of peoplefrom India lose their lives early due to alcohol consumption and its fallouts.By aqueous two phase extraction as it was found that the anthocyanin concentration is almost same in jamun juice and red wine
both. Thus the alcoholic related diseases can be solved out to some extent if the drinking habit is made to replace from otheralcoholic beverages to fermented jamun juice or vinegar.
REFRENCES[1.] Chaudhary B, Mukopadhyay K; Syzygium cumini: potential source of nutraceuticals; Biological
Sciences; 2012[2.] Ruan ZP, Zhang LL, Lin YM; Evaluation of the antioxidant activity of Syzygium cumini leaves;
Molecules, 13: 25452556; 2008.[3.] Tang X, Wang Y .etal; Separation ,purification of anthocyanin and vitis linn polysaccharide from grape
juice by two step extraction and dialysis; Journal of food processing and preservation; 2017[4.] Feueresien M M, Barraza M G .etal; Pressurized liquid extraction of anthocyanins from schinus
terebinthifolius raddi; Food chemistry; 2016[5.] Zhang LL, Lin YM. Antioxidant tannins from Syzygium cumini fruit. Afr J Biotecnol, 8: 2301–2309,
2009[6.] Wrolstad R.E. Color and pigment analyses in fruit products. Oregon St. Univ. Agric. Exp. Stn., Bulletin
624:1-17, 1976[7.] Timberlake, C.F. Anthocyanins [related to beverages]—occurrence, extraction and chemistry [coloring
material]. Food Chem. 5:69-80, 1980[8.] Han, J., Wang, Y., Ma J .etal; Simultaneous aqueous two-phase extraction and saponification reaction of
chlorophyll from silkworm excrement; Separation and Purification Technology; 2013[9.] Kammerer, D., Kljusuric, J. G., Carle; Recovery of anthocyanins from grape pomace extracts (Vitis
vinifera L. cv. Cabernet Mitos) using a polymeric adsorber resin; European Food Research andTechnology; 2005
[10.] Yang, X., Zhang, S., Yu .etal; Ionic liquid–anionic surfactant based aqueous two-phase extraction fordetermination of antibiotics in honey by high-performance liquid chromatography; Talanta; 2014
[11.] Corrales, M., Toepfl, S., Butz, P., Knorr; Extraction of anthocyanins from grape by-products assisted byultrasonics, high hydrostatic pressure or pulsed electric fields: A comparison; Innovative Food Science& Emerging Technologies; 2008.

National Conference on Emerging Trends in Science, Technology and Management, 11-12 Nov 2017, ISBN: 978-93-5281-325-4 Page 251
A REVIEW ARTICLE ON FAST DISSOLVING DRUGDELIVERY SYSTEM
Abhishek Kumar*, Dr Anurag Mishra, Brijesh Singh, Pradhi Srivastava, Shiv Kumar Srivastava, Ravi Tripathi,and Gangesh Pandey
*Ashoka Institute of Technology and Management, Varanasi, U.P., India-221003.Email: [email protected]
Abstract-Drug delivery systems are a magic tool for expanding markets/indications, extending product lifecycles and generating opportunities. Oral delivery is currently the gold standard in the pharmaceuticalindustry where it is regarded as the safest, most convenient and most economical method of drug deliveryhaving the highest patient compliance. This tablet format is designed to allow administration of an oral soliddose form in the absence of water or fluid intake. According to European Pharmacopoeia, the oraldisintegrating tablets should disperse or disintegrate in less than three minutes. Difficulty in swallowing(dysphagia) is common among all age groups, especially in elderly, and is also seen in swallowingconventional tablets and capsules. Fast dissolving dosage forms are containing medicinal substances whichdissolve or disintegrates into smaller granules rapidly in the saliva without water or chewing within fewseconds (<60sec) to more than a minute depending on the formulation (due to the action of super-disintegrant or maximizing pore structure in the formulation) and the size for enhancement of patientconvenience and compliance and these are advantageous particularly for pediatric, geriatric, psychiatricpatients who have difficulty in swallowing conventional tablets and capsules. Recent development in fastdisintegrating technology mainly works to improve the disintegration quality of these delicate dosage formswithout affecting their integrity. This article overview the salient features, mechanisms of super-disintegrate, technologies , evaluation parameters and patented technologies available and the advancesmade so far in the field of fabrication of fast disintegrating tablets in the fast dissolving drug deliverysystems.Keywords: Fast dissolving dosage form, super-disintegrate, saliva, patented technologies, disintegration, patientcompliance.
1. INTRODUCTION
Recent advance in novel drug delivery system aims to enhance the safety and efficacy of the drugmolecule by formulating a dosage form being for the administration [1]. Difficulty in swallowing isexperienced by patient such as pediatric, geriatric, bedridden, disabled and mental-ly ill [2]. Fastdissolving tablets are solid dosage form containing medical substances which disintegrate rapidly,usually within few seconds when placed upon tongue requiring no additional water to facilateswallowing [3].Fast dissolving tablets are those when put on tongue disintegrate instantaneously releasing the drugwhich dissolve or disperses in the saliva. Some drugs are absorbed from the mouth, pharynx andesophagus as the saliva passes down into the stomach. In such cases, bioavailability of drug issignificantly greater than those observed from conventional tablets dosage form. Their growingimportance was underlined recently when European pharmacopoeia adopted the term “Orodispersibletablet” as a tablet that to be placed in the mouth where it disperses rapidly before swallowing. Thebioavailability of some drugs may be increased due to absorption of drug in oral cavity and also due topregastric absorption of saliva containing dispersed drugs that pass down into the stomach [4].An ideal Properties of FDT require no water for oral administration, yet dissolve / disperse/ disintegratein mouth in a matter of seconds. Have a pleasing mouth feel. Have an acceptable taste maskingproperty. Be harder and less friable Leave minimal or no residue in mouth after administration Exhibitlow sensitivity to environmental conditions (temperature and humidity). Allow the manufacture oftablet using conventional processing and packaging equipments [5].Ideal Properties of Fast Dissolving Tablets
1. A Fast Dissolving Tablets should be dissolve or disintegrate in the mouth (in saliva) withinseconds.
2. It should not require any liquid or water to show its action.[6]3. Be compatible with taste masking and Have a pleasing mouth feel.4. Be portable without fragility concern.5. The excipients should have high wettability, and the tablet structure should also have a highly
porous network.6. It should not leave minimal or no residue in the mouth after oral administration of the tablet.7. It should be less effective by environmental conditions like humidity, temperature etc.8. More rapid drug absorption from the pre-gastric area i.e. mouth, pharynx and oesophagus
which may produce rapid onset of action.[7,8]

National Conference on Emerging Trends in Science, Technology and Management, 11-12 Nov 2017, ISBN: 978-93-5281-325-4 Page 252
9. Be adaptable and amenable to existing processing and packaging machinery.10. Allow the manufacture of tablets using conventional processing and packaging Equipments at
low cost.[9]11. Allow high drug loading.12. Have sufficient strength to withstand the rigors of the manufacturing process and post
manufacturing handling.Advantages of MDT
1. No need of water to swallow the tablet. [10]2. Can be easily administered to pediatric, elderly and mentally disabled patients.3. Accurate dosing [11] as compared to liquids.4. Dissolution and absorption of drug is fast, offering rapid onset of action.5. Bioavailability of drugs is increased [12] as some drugs are absorbed from mouth, pharynx and
esophagus through saliva passing down into the stomach.[13]6. Advantageous over liquid medication in terms of administration as well as transportation.7. First pass metabolism is reduced, thus offering improved bioavailability and thus reduced dose
and side effects. [14]8. Free of risk of suffocation due to physical obstruction when swallowed, thus offering improved
safety.9. Suitable for sustained/controlled release actives.[15]10. ii. Allows high drug loading.[16]Disadvantage [15, 16]1. Fast dissolving tablet is hygroscopic in nature so must be keep in dry place.2. Some time it possesses mouth feeling.3. MDT requires special packaging for properly stabilization & safety of stable product.4. The tablets usually have insufficient mechanical strength. Hence, careful handling is required5. The tablets may leave unpleasant taste and/or grittiness in mouth if not formulated properly.
Limitations of Fast Dissolving Tablets.[17-19]a. The tablets usually have insufficient mechanical strength. So, careful handling is required.b. The tablets may leave unpleasant taste and/or grittiness in mouth if not formulated properly.c. Drugs with relatively larger doses are difficult to formulate into Fast Dissolving Tablets. e.g.
Antibiotics like amoxicillin with adult dose tablet containing about 500 mg of the drug.d. Patients who concurrently take anti-cholinergic medications may not be the best candidates
for Fast Dissolving Tablet.e. Similarly patients with Sjogren‟s syndrome or dryness of the mouth due to decreased saliva
production may not be good candidates for these tablet formulations.
Salient Feature of Fast Dissolving Drug Delivery System [20]1. Ease of Administration to the patient who cannot swallow.2. No need of water to swallow the dosage form.3. Rapid dissolution and absorption of the drug, which will produce quick onset of action.4. Some drugs are absorbed from the mouth, pharynx and esophagus as the saliva passes down into thestomach (pre-gastric Absorption). In such cases bioavailability of drug is increased and improvesclinical performance through a reduction of unwanted effects.5. Good Mouth Feel property.6. The risk of chocking or suffocation during oral administration of conventional formulation due tophysical obstruction is avoided.7. Beneficial in cases such as motion sickness, sudden episodes of allergic attack or coughing, where anultra rapid onset of action required.8. An increased bioavailability, particularly in cases of insoluble and hydrophobic drugs, due to rapiddisintegration and dissolution of these tablets.9. Benefit of liquid medication in the form of solid preparation.10. Pre-gastric absorption can result in improved bioavailability, reduced dose and improved clinicalperformance by reducing side effects.11. Pre-gastric drug absorption avoids the first-pass metabolism; the drug dose can be reduced if asignificant amount of the drug is lost through the hepatic metabolism.[20]12. Rapid drug therapy intervention.13. New business opportunities: product differentiation, line extension and life-cycle management,exclusivity of product promotion and patent-life extension.[21]Criteria for Drug Selection [22]

National Conference on Emerging Trends in Science, Technology and Management, 11-12 Nov 2017, ISBN: 978-93-5281-325-4 Page 253
a. It should not have bitter taste.b. The dose should be less than 20 mg.c. Molecular weight should be small to Moderate.d. Should be of good solubility in water and saliva.e. It should have partially non-ionized at the oral cavities pH.f. It should have ability to diffuse and partition into the epithelium of the upper GIT (log p > 1, orpreferably > 2)g. Should have extensive First pass metabolism.h. Should have oral tissue permeability.Mechanism of Action of Superdisintegrants [23]The tablet breaks to primary particles by one or more of the mechanisms listed below:‐1. By porosity and capillary action.2. By swelling.3. Because of heat of wetting.4. Due to release of gases.5. By enzymatic action.6. Due to disintegrating particle/particle repulsive forces.7. Due to deformation.
2. METHODOLOGY
Direct compactionDirect compression method is the easiest way to manufacture tablets. Conventional equipment,commonly available excipients and a limited number of processing steps are involved in directcompression.In this method drug with other excepient is mixed in motar pistel and the nixture thusobtained is compressed into tablets through tablet punching machine.
3. EVALUATION OF TABLETSAngle of reposeAngle of repose is defined as the maximum angle possible between the surface of a pile of the powderand horizontal plane. The frictional force in a loose powder or granules can be measured by angle ofrepose. [24]
tan = h / r = tan-1 (h/r)Where, is the angle of repose, h is height of the powder cone, r is radius of the powder coneBulk density
The bulk density of a powder depends primarily on particle size distribution, particle shape, and thetendency of the particles to adhere to one another. [25]Both loose bulk density (LBD) and tapped bulk density (TBD) were determined. Accurately weighedsample taken in a 25 ml measuring cylinder and measured volume of packing and tapped 100 times ona plane hard wooden surface and tapped volume of packing recorded.Percent compressibilityPercent compressibility of powder mixture was determined by Carr’s compressibility index calculated.[26]Hausner’s ratioHausner’s ratio is an indirect index of ease of power flow. It is calculated by the following formula.[27]
Postcompression Parameters
Size and shape of tabletsThe size and shape of the tablet can be dimensionally described, monitored and controlled.ThicknessThe thickness of the tablet was measured by using Screw Gauge and expressed in mm. The limitspecified was average thickness ± 5% deviation.Hardness testThe hardness of the tablets was determined using Precision dial type hardness tester. It is expressed inKg/cm2. Three tablets were randomly picked from each formulation and the mean and standarddeviation values were calculated. [28, 29]

National Conference on Emerging Trends in Science, Technology and Management, 11-12 Nov 2017, ISBN: 978-93-5281-325-4 Page 254
Friability testThe friability of tablets was determined by using Friabilator. It is expressed in percentage (%). 10tablets were initially weighed (Winitial) and transferred into friabilator. The friabilator was operated at25 rpm for 4 minutes or run up to 100 revolutions. The tablets were weighed again (Wfinal). Thepercentage friability was then calculated by, % Friability of tablets less than 1% is consideredacceptable. [30, 31]
% Friability= ×Weight variation testThe 10 tablets were selected randomly from each formulation and weighed individually to check forweight variation. The in Table 3 percentage deviation in weight variation is allowed. In all theformulations the tablet weight was more than130 mg and less than 324 mg, hence 7.5% maximumdifferences allow.Drug content uniformityFive tablets were weighed and crushed with pestle in a small glass mortar. The fine powder wasweighed to get 200 mg (equivalent to 60 mg of Diltiazem Hcl), and transferred to 250 ml conical flaskcontaining 100 ml of Phosphate buffer pH 6.8 stirred for 45 min in ultra sonicator then solution wasfiltered and the filtrate obtained was analyzed by UV spectrophotometrically at 237 nm & drug contentwas determined. [32]Wetting timeA piece of tissue paper (12cm x 10.75cm) folded twice was placed in a Petri dish (6.5 cm internaldiameter) containing 6 ml of phosphate buffer pH 6.8. A tablet was carefully placed on the surface ofthe tissue paper and allowed to wet completely.Water absorption ratioA piece of tissue paper folded twice was placed in a small Petri dish (10 cm diameter) containing 6 mlof phosphate buffer ph 6.8. A tablet was put on the tissue paper and allowed to wet completely. Thewetted tablet was then reweighed. Water absorption ratio, R was determined using following equation.[33] = ( − )Where, Wb – weight of tablet before absorption, Wa – weight of tablet after absorption. Three tabletsfrom each formulation were used and standard deviation was also determined.In-vitro disintegration timeThe in-vitro disintegration time of a tablet was determined using disintegration test apparatus as per I.P.specifications. Place one tablet in each of the 6 tubes of the basket. Add a disc to each tube and run theapparatus using phosphate buffer (pH 6.8) maintained at 37 ±2 C as the immersion liquid. Theassembly should be raised and lowered between 30 cycles per minute in the pH 6.8 maintained at 37 ±2C. The time in seconds taken for complete disintegration of the tablet with no palpable mass remainingin the apparatus was measured and recorded.In-vitro dissolution studiesIn-vitro drug release of tablets was studied by using USP type-II apparatus (USP XXIII DissolutionTest Apparatus) at 50 rpm using 900 ml of phosphate buffer pH 6.8 as dissolution medium. Thetemperature of the dissolution medium was maintained at 37 0.5°C; 5 ml of the sample fromdissolution medium was withdrawn at every 3 min interval and filtered through whatman filter paper.The absorbance of sample was measured by UV spectrophotometric method at 237 nm and Cumulativepercent drug release was calculated by using an equation obtained from a standard calibration curve.[34]Stability studiesStability studies were carried out on optimized tablet formulation. Formulations were stored at 400C ±20C / 75± 5 % RH for 30 days. After 30 days samples were withdrawn and tested with regards to theparameters i.e. thickness, hardness, drug content and drug release study.Drugs that Formulated into Fast Dissolving Drug Delivery Systems
CATEGORY EXAMPLESAntibacterial Agent Ciprofloxacin, Tetracycline, Erythromycin, Rifampicin, Penicillin,
Doxycyclin, Nalidixic Acid, Trimethoprim, Sulphacetamide,Sulphadiazine etc.
Anti Helmintics Albendazole, Mebendazole, Thiabendazole, Livermectin,Praziquantel, Pyantel Embonate, Dichlorophen etc.
Anti Depressants Trimipramine Maleate, Nortryptyiline HCL, Trazodone HCL,Amoxapine, Mianserin HCL, etc.

National Conference on Emerging Trends in Science, Technology and Management, 11-12 Nov 2017, ISBN: 978-93-5281-325-4 Page 255
Anti Diabetics Glibenclamide, Glipizide, Tolbutamide, Tolazamide, Gliclazide,Chlorpropamide etc.
Analgesics/Anti-inflammatory agents Diclofenac Sodium, Ibuprofen, Ketoprofen, Mefenamic Acid,Naproxen, Oxyphenbutazone, Indomethacin, Piroxicam,Phenylbutazone etc.
Anti Hypertensive‟s Amolidipine, Carvedilol, Diltiazem, Felodipine, Minoxidil,Nifedipine, Prazosin HCL, Nimodipine, Terazosin HCL etc.
Anti Arrhythmics Disopyramide, Quinidine Sulphate, Amiodarone HCL etc.Anti Histamines Acrivastine, Cetrizine, Cinnarizine, Loratadine, Fexofenadine,
Triprolidine etc.Anxiolytics, Sedatives, Hypnotics andNeuroleptics
Alprazolam, Diazepam, Clozapine, Amylobarbitone, Lorazepam,Haloperidol, Nitrazepam, Midazolam, Phenobarbitone,Thioridazine, Oxazepam, etc.
Diuretics Acetazolamide, Clorthiazide, Amiloride, Furosemide,Spironolactone, Bumetanide, Erthacrynic Acid, etc
Gastro-intestinal agents Cimetidine, RanitidineHCL, Famotidine, Domperidone,Omperazole, Ondasetron HCL etc.
Corticosteroids Betamethasone, Beclomethasone, Hydrocortisone, Prednisolone,Methyl Prednisolone etc.
Anti Protozoal Agents Metronidazole, Tinidazole, Omidazole, Benznidazole etc.
4. A PROMISING FUTURE IN FAST DISSOLVING DRUG DELIVERYSYSTEM (FDDS) [35, 36]
Most of products are available in the same strengths as traditional dosage forms. There are notcommercially available fast dissolving drug products for all our patient needs. Pharmacist may wish toconsider compounding as a unique way to treat the unmet needs of individual patients. Pharmacistshave been altered to exercise additional care when dispensing new prescription for this kind of drugdelivery. More products need to be commercialized to use this system properly. Special In vitro and Invivo test methods to study the performance of these products are required.Future challenges [37, 35]Fast dissolving intraoral products face many challenges as given below, these challenges are related tonew technologies and products as they mature.
1. Most of the drugs need taste masking.2. Tablets are fragile and must be protected from water. So special packaging is needed.3. A novel manufacturing process is a challenge, due to new equipment, technology and
process.4. Limited drug loading due to technology limitation, taste masking and tablet size.5. Need more clinical trials to study more clinical/medical benefits.6. Older patient benefits by change in taste, flavor and dissolve too fast.7. Cost of the product is a major challenge.
5. CONCLUSION
FDDDS have better patient compliance and may improve biopharmaceutical properties, improvesefficacy and better safety, compared with conventional oral dosage forms. After the FDTs, the newproducts as Fast Dissolving Oral Films (FDOFs) are intended for the application in the oral cavity andthey are innovative and promising dosage form especially for use in elder patients. The development offast dissolving drug products also provides an opportunity for a line extension in market place, a widerange of drugs (e.g. NSAIDS, antiulcer, antihistamine, Hypnotics & sedatives, antipsychotics,antiparkinsonism, antiemetic, antimigrane and antidepressants) can be considered for this dosage form.In future, this system is most acceptable and prescribed due to its quick action i.e. within a minute.Because of increasing patient demand, popularity of these dosage forms will expand the study in future.
REFERENCES[1] Kuchekar, B.S., Badhan, A.C., Mahajan, H.S. (2003) Mouth Dissolv-ing Tablets: A Novel Drug
Delivery System. Pharma Times, 35: 7-9.[2] Seager, H. (1998) Drug-delivery product and the zydis fast dissolving form. J. Pharm. Pharmacol, 50( 4):
375-382.[3] Shu, T., Suzuki, H., Hironaka, K., Ito, K. (2002) Studies of rapidly disintegrating tablets in the oral
cavity using co-grinding mixtures of mannitol with crospovidone. Chem. Pharm. Bull, 50: 193-198.[4] Ankur Sharma, Abhishek Jain, Anuj Purohit, Rakesh Jatav and R. V. Sheorey (2011) Formulation and
evaluation of aceclofenac fast dissolving tablets. International journal of pharmacy & life sciences, 2(4),681-686.

National Conference on Emerging Trends in Science, Technology and Management, 11-12 Nov 2017, ISBN: 978-93-5281-325-4 Page 256
[5] Jagani H, Patel R, Upadhyay P, Bhangale J, Kosalge S and Padalia NM. Pharmacy College, AhmedabadZydus Research Center, Ahmedabad.
[6] D. Brown, Orally Disintegrating Tablet: Taste over Speed. Drug Delivery Tech, 2001; 3(6) 58-61.[7] M. Gohel, M. Patel, A. Amin, R. Agrawal, R. Dave and N. Bariya, Formulation Design and
Optimization of Mouth Dissolve.[8] J. A. Fix, Advances in Quick-Dissolving Tablets Technology Employing Wowtab, Paper Presented at:
IIR Conference on Drug Delivery Systems, Washington DC, USA, 1998; 10.[9] P. Virely, R. Yarwood, Zydis – A Novel Fast Dissolving Dosage Form, Manufacture Chem., 1990; 61:
36–37.[10] Redd LH, Ghosh B and Rajneesh. Fast dissolving drug deliverysystem: A review of literature. Indian J
Pharm Sci. 2002;64(4):331‐336.[11] Habib W, Khankari R and Hontz J.Fast‐dissolving drug deliverysystems: Critical review in therapeutics.
Drug Carrier Systems. 2002;17(1):61‐72.[12] Bradoo R, Shahani S, Poojary S, Deewan, B and Sudarshan S. Fast dissolving drug delivery systems.
JAMA India. 2001;4(10):27‐31.[13] Biradar SS, Bhagavati ST and Kuppasad IJ. Fast dissolving drug delivery systems: A brief overview.
The Int J Pharmacol. 2006; 4(2).[14] Bhaskaran S and Narmada GV. Rapid Dissolving tablet Novel dosage form. Indian Pharmacist.
2002;1:9‐12[15] Sharma S. New generation of tablet: Fast dissolving tablet; Latest review Vol VI . 2008[16] Kumari S, Visht S, Sharma PK and Yadav RK. Fast dissolving Drug delivery system: Review Article;[17] D. Shukla, S. Chakraborty, Mouth Dissolving Tablets I: An Overview of Formulation Technology,
Science Pharm., 2009; 309–326.[18] D. Bhowmik, B. Chiranjib, P. Krishnakanth and R. M. Chandira, Fast Dissolving Tablet: An Overview,
Chemistry Pharma Research, 2009; 1(1): 163-177.[19] V. N. Deshmukh, Mouth Dissolving Drug Delivery System: A Review, International Journal of Pharma
Technology and Research, 2012; 4: 1.[20] R. Panigrahi, S. P. Behera and C. S. Panda, A Review On Fast Dissolving Tablets, Webmed Central
Pharmaceutical Sciences, 2010; 1(11): 1-16.[21] Y. Fu, S. Yang, S. H. Jeong, S. Kimura and K. Park, Orally Fast Disintegrating Tablets: Developments,
Technologies, Taste-Masking and Clinical Studies, Critical Review TM in Therapeutic Drug CarrierSystem, 2004; 21(6): 433-475.
[22] Ajoy Bera and Ashish Mukherjee, A Detailed Study of Mouth Dissolving Drug Delivery System, ActaChimica and Pharmaceutica Indica, 2013; 3(1): 65-93.
[23] Tejvir Kaur, Bhawandeep Gill, Sandeep Kumar, G.D. Gupta, Mouth Dissolving Tablets: A NovelApproach to Drug Delivery, International Journal of Current Pharmaceutical Research, 2011; 3(1): 1-7.
[24] Gupta AK, Mittal A, Jha KK. Fast dissolving tablets a review. The Pharma Innov. 2012; 1(1): 1-7.[25] Sharma S, Kumar D, Singh M, Singh G, Rathore MS. Fast disintegrating tablets a new era in novel drug
delivery system & new market opportunities. J Drug Deliv Ther. 2012; 2(3): 74-86.[26] Anilkumar J. Shinde, Manojkumar S. Patil And Harinath N. More. Formulation and Evaluation of an
oral Floating Tablet of Cephalexin. Indian J. Pharm. Educ. Res.2010; 44(3).[27] Sharma G, Kaur R, Singh S, Kumar A, Sharma S, Singh R. Mouth dissolving tablets a current review of
scientific literature. Int J Pharma Med Res. 2013; 1(2): 73-84.[28] Ashish P, Harsoliya MS, Pathan JK, Shruti S. A review article on formulation of mouth dissolving tablet.
Int J Pharma Clin Sci. 2011; 1(1): 1-8.[29] Shinde A, Yadav V, Gaikwad V, Dange S. Fast disintegration drug delivery system a review. Int Pharma
Sci Res. 2013; 4(7): 2548-2561.[30] Kumar A, Sharma SK, Jaimini M, Ranga S. A review on fast dissolving tablet a pioneer dosage form. Int
J Pharma Res Dev. 2011; 5(11): 1-13.[31] Erande K, Joshi B. Mouth dissolving tablets a comprehensive review. Int J Pharma Res Rev. 2013; 2(7):
25-41.[32] Gupta AK, Mittal A, Jha KK. Fast dissolving tablets a review. The Pharma Innov. 2012; 1(1): 1-7.[33] Menaría MC, Garg R, Dashora A. Recent advancement in fast dissolving tablet technology. Int J Pharma
Res Sci. 2013; 2(7): 827-851.[34] Patel TS, Sengupta M. Fast dissolving tablet technology a review. World J Pharm Pharma Sci. 2013;
2(2): 485-508.[35] Ghosh.T, Ghosh.A and Prasad.D, A Review on Orodispersible tablets and its Future prospective,
International journal of Pharmacy and Pharmaceutical Science, 2011; 3(1).[36] Parkash.V, Maan.S, Deepika, Yadav.SK, Hemlata and Jogpal. V, Fast disintegrating tablets:
Opportunity in drug delivery system, J Adv Pharm Technology Res., 2011; 2(4): 223-235.

National Conference on Emerging Trends in Science, Technology and Management, 11-12 Nov 2017, ISBN: 978-93-5281-325-4 Page 257
ANALYSIS OF REDUCING SHORT CHANNEL EFFECTAnuja Singh
Department of electronics and communicationAshoka Institute of Technology and Management
Varanasi, [email protected] Prajapati, Sonam Kumar Chaurasia
Department of electronics and communicationAshoka Institute of Technology and Management
Varanasi, [email protected], [email protected]
Abstract- In this we have analyzed the different methods to reduce the short channel effects. Short channeleffects include gate sub threshold swing and threshold voltage, DIBL (drain induced barrier lowering). Thispaper gives the review of techniques used to reduce the short channel effects in few years which are C-shaped silicon window, partial grounded plane (PGP) based MOSFET on sell box and graded channel.
Index Terms- Short Channel Effects(SCEs)- DIBL, Sub-threshold Swing, Threshold Voltage.
1. INTRODUCTION
In the present scenario, the devices are scaling to the nanometer dimensions which deal with the devicecharacteristics with decrease in the dimensions of MOS transistors. MOSFETs are continuously scaleddown to meet the desire for high density and high functionality. Scaling theory basically follows thethree rules- (i) Reduce threshold voltage by α, (ii) Reduce all lateral and vertical dimensions by α(>1),(iii) Increase all doping level by α. The reduction of capacitance and power dissipation is the advantageof scaling. The greatest impact of scaling in analog circuit is the reduction of supply voltage. Becauseof scaling, some forbidding effects are also generated which become problematic [1][2], such as shortchannel effects(SCEs) ,channel length modulation and narrow width effects. This paper describes theshort channel effect (SCEs) particularly, which arises as a result of 2-D potential distribution and highelectric fields in the channel region. It includes threshold voltage variation, mobility degradation withvertical field, velocity saturation, hot carrier effect and output impedance variation with drain-sourcevoltage. In this paper, we mainly focus on the response of threshold voltage, sub-threshold swing andDIBL (drain induced barrier lowering) with respect to channel length.
2. DIFFERENT METHODS FOR REDUCING SCEs
Method 1.C-shape silicon window for reducing the short channel effects[3]In this method C-shaped silicon window is expanded by moving a part of buried oxide layer which isheavily doped. When highly doped silicon window is used then threshold swing, DIBL and thresholdvoltage is reduced by channel. In this silicon is used instead of oxide layer which reduces maximumlattice temperature, by introducing a new way for heat generation in active region. The top region andthe down region of C- shape silicon should be same while making the circuit on software. The lengthand thickness of the top region are defined as LN-top and tN-top respectively. The length and thethickness of the middle region can be defined as LN-mid and tN-mid respectively and the doping densityof window should be 1x10^18 cm^-3.
Fig. 1.1. The schematic of CSW-MOSFET.
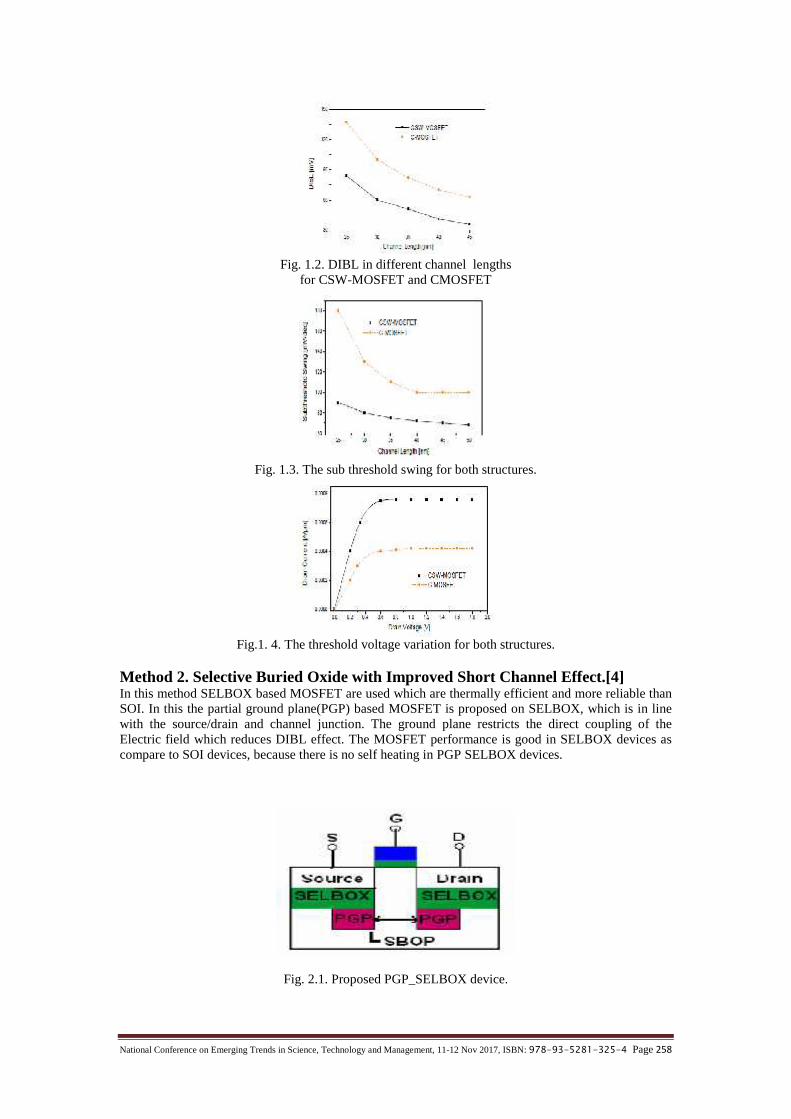
National Conference on Emerging Trends in Science, Technology and Management, 11-12 Nov 2017, ISBN: 978-93-5281-325-4 Page 258
Fig. 1.2. DIBL in different channel lengthsfor CSW-MOSFET and CMOSFET
Fig. 1.3. The sub threshold swing for both structures.
Fig.1. 4. The threshold voltage variation for both structures.
Method 2. Selective Buried Oxide with Improved Short Channel Effect.[4]In this method SELBOX based MOSFET are used which are thermally efficient and more reliable thanSOI. In this the partial ground plane(PGP) based MOSFET is proposed on SELBOX, which is in linewith the source/drain and channel junction. The ground plane restricts the direct coupling of theElectric field which reduces DIBL effect. The MOSFET performance is good in SELBOX devices ascompare to SOI devices, because there is no self heating in PGP SELBOX devices.
Fig. 2.1. Proposed PGP_SELBOX device.
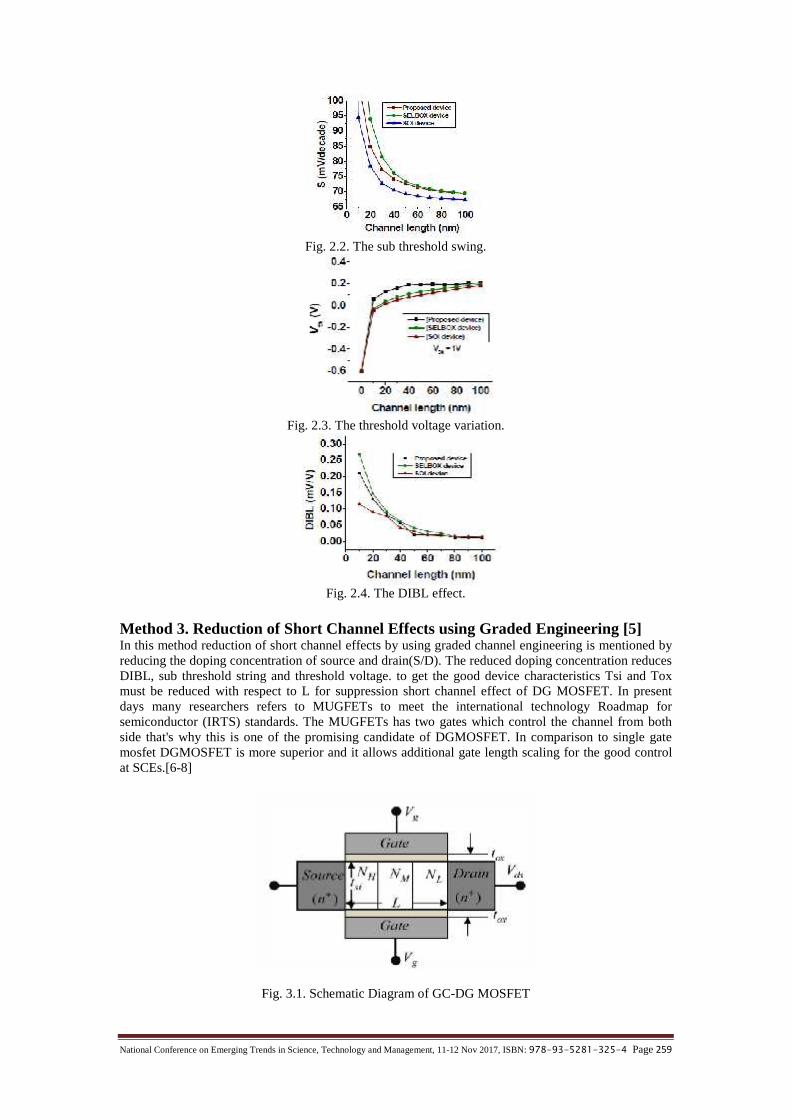
National Conference on Emerging Trends in Science, Technology and Management, 11-12 Nov 2017, ISBN: 978-93-5281-325-4 Page 259
Fig. 2.2. The sub threshold swing.
Fig. 2.3. The threshold voltage variation.
Fig. 2.4. The DIBL effect.
Method 3. Reduction of Short Channel Effects using Graded Engineering [5]In this method reduction of short channel effects by using graded channel engineering is mentioned byreducing the doping concentration of source and drain(S/D). The reduced doping concentration reducesDIBL, sub threshold string and threshold voltage. to get the good device characteristics Tsi and Toxmust be reduced with respect to L for suppression short channel effect of DG MOSFET. In presentdays many researchers refers to MUGFETs to meet the international technology Roadmap forsemiconductor (IRTS) standards. The MUGFETs has two gates which control the channel from bothside that's why this is one of the promising candidate of DGMOSFET. In comparison to single gatemosfet DGMOSFET is more superior and it allows additional gate length scaling for the good controlat SCEs.[6-8]
Fig. 3.1. Schematic Diagram of GC-DG MOSFET
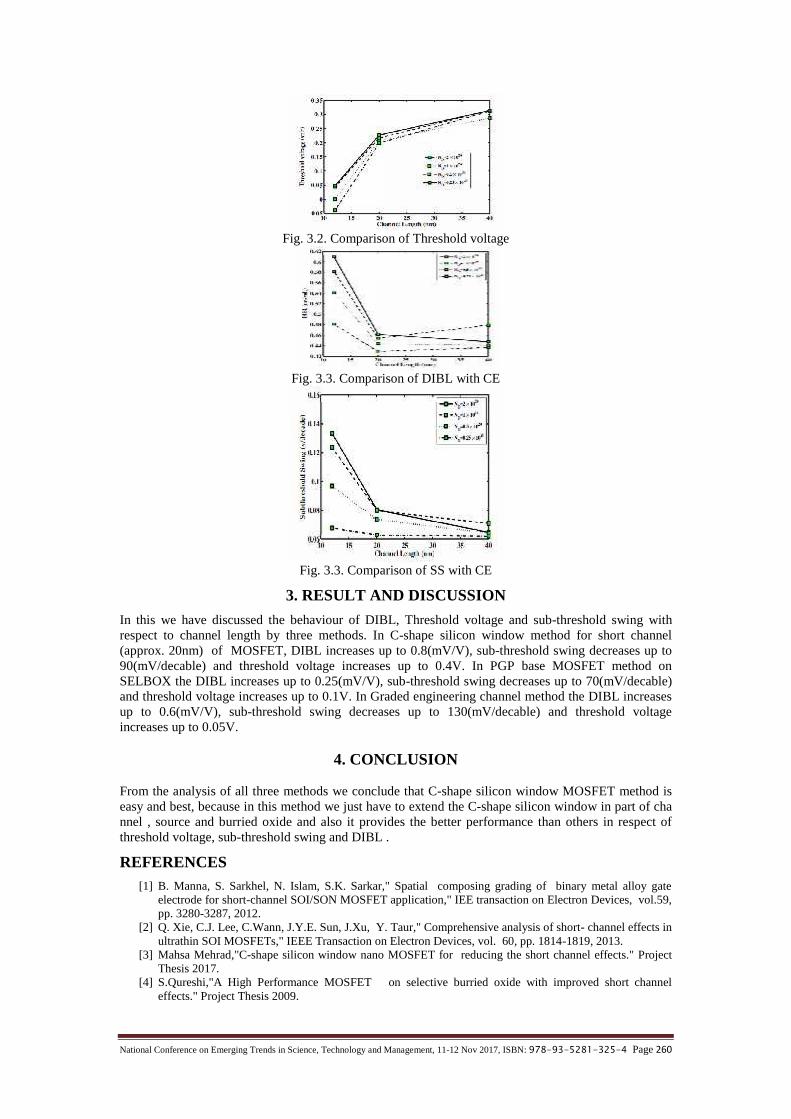
National Conference on Emerging Trends in Science, Technology and Management, 11-12 Nov 2017, ISBN: 978-93-5281-325-4 Page 260
Fig. 3.2. Comparison of Threshold voltage
Fig. 3.3. Comparison of DIBL with CE
Fig. 3.3. Comparison of SS with CE
3. RESULT AND DISCUSSION
In this we have discussed the behaviour of DIBL, Threshold voltage and sub-threshold swing withrespect to channel length by three methods. In C-shape silicon window method for short channel(approx. 20nm) of MOSFET, DIBL increases up to 0.8(mV/V), sub-threshold swing decreases up to90(mV/decable) and threshold voltage increases up to 0.4V. In PGP base MOSFET method onSELBOX the DIBL increases up to 0.25(mV/V), sub-threshold swing decreases up to 70(mV/decable)and threshold voltage increases up to 0.1V. In Graded engineering channel method the DIBL increasesup to 0.6(mV/V), sub-threshold swing decreases up to 130(mV/decable) and threshold voltageincreases up to 0.05V.
4. CONCLUSION
From the analysis of all three methods we conclude that C-shape silicon window MOSFET method iseasy and best, because in this method we just have to extend the C-shape silicon window in part of channel , source and burried oxide and also it provides the better performance than others in respect ofthreshold voltage, sub-threshold swing and DIBL .
REFERENCES[1] B. Manna, S. Sarkhel, N. Islam, S.K. Sarkar," Spatial composing grading of binary metal alloy gate
electrode for short-channel SOI/SON MOSFET application," IEE transaction on Electron Devices, vol.59,pp. 3280-3287, 2012.
[2] Q. Xie, C.J. Lee, C.Wann, J.Y.E. Sun, J.Xu, Y. Taur," Comprehensive analysis of short- channel effects inultrathin SOI MOSFETs," IEEE Transaction on Electron Devices, vol. 60, pp. 1814-1819, 2013.
[3] Mahsa Mehrad,"C-shape silicon window nano MOSFET for reducing the short channel effects." ProjectThesis 2017.
[4] S.Qureshi,"A High Performance MOSFET on selective burried oxide with improved short channeleffects." Project Thesis 2009.

National Conference on Emerging Trends in Science, Technology and Management, 11-12 Nov 2017, ISBN: 978-93-5281-325-4 Page 261
[5] S. Panigrahy," Performance enhancement and reduction of short channel effects of Nano-MOSFET byusing Graded Channel Engineering." Project Thesis 2013.
[6] T. Bendib and F.D. and D. Arar," Sub threshold behaviour optimization of nanoscale graded channel gatesstack double gate(gcgsdg) MOSFET using multi- objective genetic algorithms," Journal of Comput.Electron, vol.10, pp. 210-215, 2011.
[7] S. K. Gupta, A. Baidya and S. Baishya," Simulation and Optimization of lightly doped ultrathin triplemetal double gate(tm-dg) mosfet with high-k dielectric for diminished short channel effects," InternationalConference on Computer and Communication Technolo (ICCCT),vol. 1,2011.
[8] A. Tsormpatzoglou, C.A. Dimitridis, R.Clerc, Q. Rafhay, G. Pananakakis, and G.Ghibaudo," Semi-analytical modeling of short-channel effects in si and ge sub-13nm symmetrical double-gate mosfets,"IEEE Trans. Electron Devices, vol. 54, pp. 1943-1952, 2007.

National Conference on Emerging Trends in Science, Technology and Management, 11-12 Nov 2017, ISBN: 978-93-5281-325-4 Page 262
CLOUD COMPUTING AND SMART GRID1Ankit Dixit
Assistant ProfessorAjay Kumar Garg Engineering College
Ghaziabad, India, [email protected] and2Dr. Sarika Shrivastava Director
Ashoka Institute of Technology & Management, Varanasi-India, [email protected] Kumar,
Assistant ProfessorAjay Kumar Garg Engineering College, Ghaziabad, India, [email protected]
Abstract--Smart Grid is next generation digitally enhanced power system assimilating concepts of moderncommunications and control technologies which allows much greater robustness, efficiency and flexibilitythan today’s power systems. With the continuous realization of smart grid in electrical power system, thedemand of storage and processor resources becomes increasingly higher which can be achieved throughcloud computing. It is an emerging technology that enables rapid delivery of computing resources as autility in a dynamically scalable, virtualized manner. Improvement in robustness, load balancing andstorage capacity is obtained by integrating the electrical power system resources through internal networkby cloud computing.
Key words: Cloud computing, Cloud security, Smart grid
1. INTRODUCTION
The power sector across the world is facing numerous challenges including generation, diversification,demand for reliable and sustainable power supply, energy conservation and reduction in carbonemission. Many countries across the world witnessed the energy deficiency which directly impacteddevelopment of the state and environment through greenhouse gas emission (GHG). The reason forsuch an inefficient and unstable electric system is lack of advancement in electrical transmission anddistribution system [1]. Thus a technological revamp is required in the practices involving production,management and consumption of electricity along with new grid infrastructure. The smart grid is amodern electric power grid infrastructure for improved efficiency, reliability and safety, with smoothintegration of renewable and alternative energy sources, through automated control and moderncommunications technologies [2]-[3].Cloud computing is getting popular which is a model for enabling convenient, on demand networkaccess to a shared pool of configurable computing resources(e.g. networks, servers, storage,applications and services) that can rapidly provisioned and released with minimal management effort orservice provider interaction[4]. Currently, power grid at all levels has a certain processor and storageresources, the advantage of the realization of cloud computing is that the existing distribution ofcomputers can be kept and maximum utilization of the physical structure of information networks ofcurrent electric power system, allocating calculation and storage resources for the current task ispossible. With the help of cloud computing, various control algorithms can be developed to improverobustness and load balancing.Provider of cloud services such as Google, Microsoft owns large data centre’s with massivecomputational and storage capabilities [5]. The relationship between cloud computing, data centre andsmart grid is illustrated in Fig 1.
ComputingCloud
CentersData
GridSmart
Fig. 1. The interactions between cloud computing systems and smart grid and distributed data centers.
The key constituent of cloud computing is data centre which affects routing and congestion controlalgorithm [6].It also impact the internet. Secondly, data centre’s affected the smart electric grid as itconsumes enormous energy and acts as load to the grid.
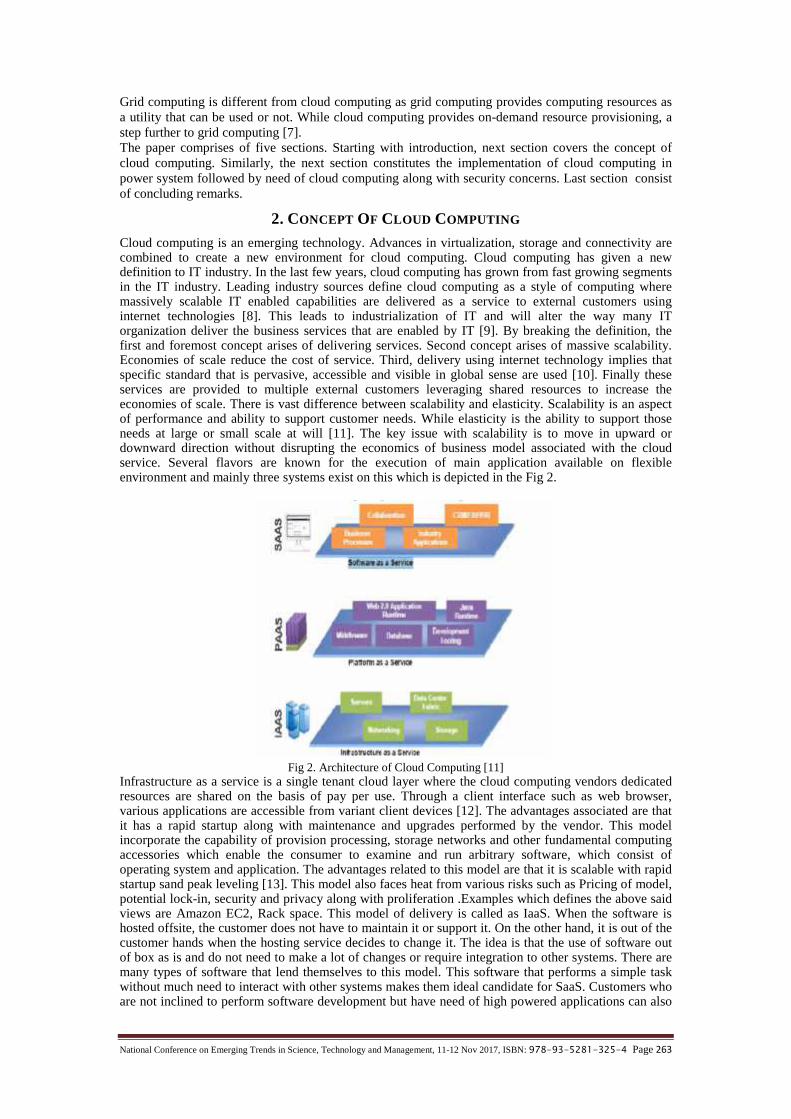
National Conference on Emerging Trends in Science, Technology and Management, 11-12 Nov 2017, ISBN: 978-93-5281-325-4 Page 263
Grid computing is different from cloud computing as grid computing provides computing resources asa utility that can be used or not. While cloud computing provides on-demand resource provisioning, astep further to grid computing [7].The paper comprises of five sections. Starting with introduction, next section covers the concept ofcloud computing. Similarly, the next section constitutes the implementation of cloud computing inpower system followed by need of cloud computing along with security concerns. Last section consistof concluding remarks.
2. CONCEPT OF CLOUD COMPUTING
Cloud computing is an emerging technology. Advances in virtualization, storage and connectivity arecombined to create a new environment for cloud computing. Cloud computing has given a newdefinition to IT industry. In the last few years, cloud computing has grown from fast growing segmentsin the IT industry. Leading industry sources define cloud computing as a style of computing wheremassively scalable IT enabled capabilities are delivered as a service to external customers usinginternet technologies [8]. This leads to industrialization of IT and will alter the way many ITorganization deliver the business services that are enabled by IT [9]. By breaking the definition, thefirst and foremost concept arises of delivering services. Second concept arises of massive scalability.Economies of scale reduce the cost of service. Third, delivery using internet technology implies thatspecific standard that is pervasive, accessible and visible in global sense are used [10]. Finally theseservices are provided to multiple external customers leveraging shared resources to increase theeconomies of scale. There is vast difference between scalability and elasticity. Scalability is an aspectof performance and ability to support customer needs. While elasticity is the ability to support thoseneeds at large or small scale at will [11]. The key issue with scalability is to move in upward ordownward direction without disrupting the economics of business model associated with the cloudservice. Several flavors are known for the execution of main application available on flexibleenvironment and mainly three systems exist on this which is depicted in the Fig 2.
Fig 2. Architecture of Cloud Computing [11]Infrastructure as a service is a single tenant cloud layer where the cloud computing vendors dedicatedresources are shared on the basis of pay per use. Through a client interface such as web browser,various applications are accessible from variant client devices [12]. The advantages associated are thatit has a rapid startup along with maintenance and upgrades performed by the vendor. This modelincorporate the capability of provision processing, storage networks and other fundamental computingaccessories which enable the consumer to examine and run arbitrary software, which consist ofoperating system and application. The advantages related to this model are that it is scalable with rapidstartup sand peak leveling [13]. This model also faces heat from various risks such as Pricing of model,potential lock-in, security and privacy along with proliferation .Examples which defines the above saidviews are Amazon EC2, Rack space. This model of delivery is called as IaaS. When the software ishosted offsite, the customer does not have to maintain it or support it. On the other hand, it is out of thecustomer hands when the hosting service decides to change it. The idea is that the use of software outof box as is and do not need to make a lot of changes or require integration to other systems. There aremany types of software that lend themselves to this model. This software that performs a simple taskwithout much need to interact with other systems makes them ideal candidate for SaaS. Customers whoare not inclined to perform software development but have need of high powered applications can also
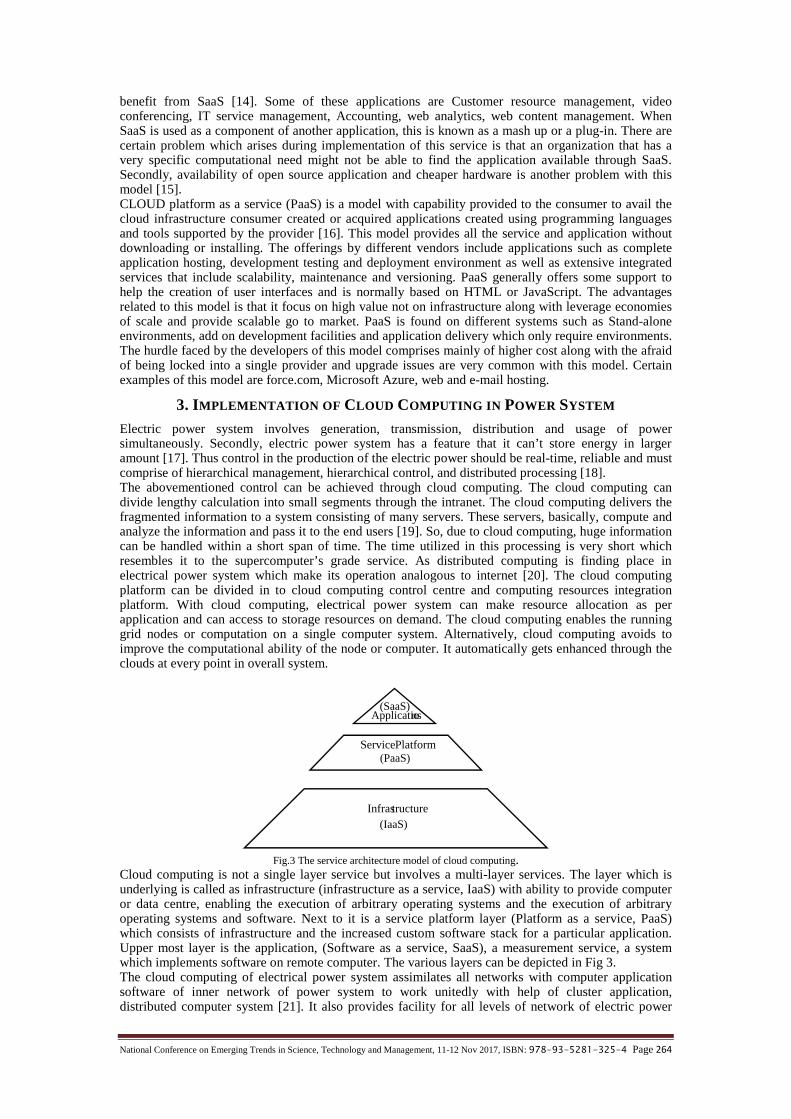
National Conference on Emerging Trends in Science, Technology and Management, 11-12 Nov 2017, ISBN: 978-93-5281-325-4 Page 264
benefit from SaaS [14]. Some of these applications are Customer resource management, videoconferencing, IT service management, Accounting, web analytics, web content management. WhenSaaS is used as a component of another application, this is known as a mash up or a plug-in. There arecertain problem which arises during implementation of this service is that an organization that has avery specific computational need might not be able to find the application available through SaaS.Secondly, availability of open source application and cheaper hardware is another problem with thismodel [15].CLOUD platform as a service (PaaS) is a model with capability provided to the consumer to avail thecloud infrastructure consumer created or acquired applications created using programming languagesand tools supported by the provider [16]. This model provides all the service and application withoutdownloading or installing. The offerings by different vendors include applications such as completeapplication hosting, development testing and deployment environment as well as extensive integratedservices that include scalability, maintenance and versioning. PaaS generally offers some support tohelp the creation of user interfaces and is normally based on HTML or JavaScript. The advantagesrelated to this model is that it focus on high value not on infrastructure along with leverage economiesof scale and provide scalable go to market. PaaS is found on different systems such as Stand-aloneenvironments, add on development facilities and application delivery which only require environments.The hurdle faced by the developers of this model comprises mainly of higher cost along with the afraidof being locked into a single provider and upgrade issues are very common with this model. Certainexamples of this model are force.com, Microsoft Azure, web and e-mail hosting.
3. IMPLEMENTATION OF CLOUD COMPUTING IN POWER SYSTEM
Electric power system involves generation, transmission, distribution and usage of powersimultaneously. Secondly, electric power system has a feature that it can’t store energy in largeramount [17]. Thus control in the production of the electric power should be real-time, reliable and mustcomprise of hierarchical management, hierarchical control, and distributed processing [18].The abovementioned control can be achieved through cloud computing. The cloud computing candivide lengthy calculation into small segments through the intranet. The cloud computing delivers thefragmented information to a system consisting of many servers. These servers, basically, compute andanalyze the information and pass it to the end users [19]. So, due to cloud computing, huge informationcan be handled within a short span of time. The time utilized in this processing is very short whichresembles it to the supercomputer’s grade service. As distributed computing is finding place inelectrical power system which make its operation analogous to internet [20]. The cloud computingplatform can be divided in to cloud computing control centre and computing resources integrationplatform. With cloud computing, electrical power system can make resource allocation as perapplication and can access to storage resources on demand. The cloud computing enables the runninggrid nodes or computation on a single computer system. Alternatively, cloud computing avoids toimprove the computational ability of the node or computer. It automatically gets enhanced through theclouds at every point in overall system.
nsApplicatio(SaaS)
PlatformService(PaaS)
tructureInfras(IaaS)
Fig.3 The service architecture model of cloud computing.Cloud computing is not a single layer service but involves a multi-layer services. The layer which isunderlying is called as infrastructure (infrastructure as a service, IaaS) with ability to provide computeror data centre, enabling the execution of arbitrary operating systems and the execution of arbitraryoperating systems and software. Next to it is a service platform layer (Platform as a service, PaaS)which consists of infrastructure and the increased custom software stack for a particular application.Upper most layer is the application, (Software as a service, SaaS), a measurement service, a systemwhich implements software on remote computer. The various layers can be depicted in Fig 3.The cloud computing of electrical power system assimilates all networks with computer applicationsoftware of inner network of power system to work unitedly with help of cluster application,distributed computer system [21]. It also provides facility for all levels of network of electric power
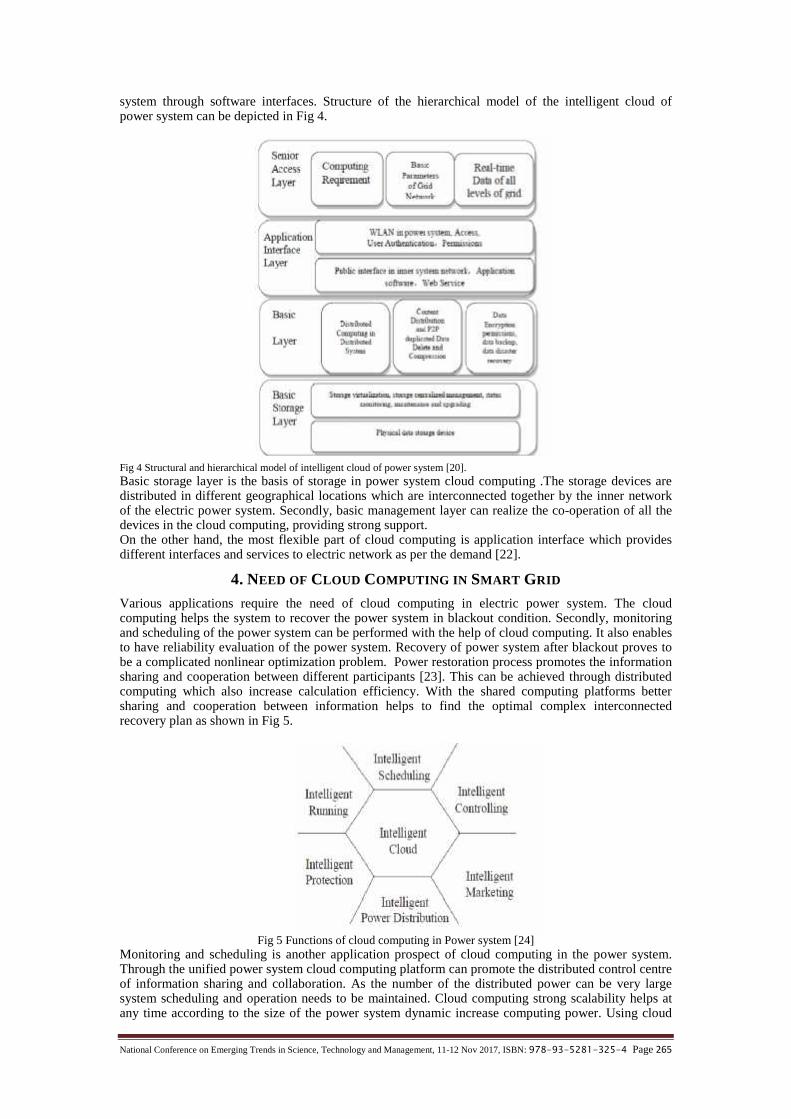
National Conference on Emerging Trends in Science, Technology and Management, 11-12 Nov 2017, ISBN: 978-93-5281-325-4 Page 265
system through software interfaces. Structure of the hierarchical model of the intelligent cloud ofpower system can be depicted in Fig 4.
Fig 4 Structural and hierarchical model of intelligent cloud of power system [20].Basic storage layer is the basis of storage in power system cloud computing .The storage devices aredistributed in different geographical locations which are interconnected together by the inner networkof the electric power system. Secondly, basic management layer can realize the co-operation of all thedevices in the cloud computing, providing strong support.On the other hand, the most flexible part of cloud computing is application interface which providesdifferent interfaces and services to electric network as per the demand [22].
4. NEED OF CLOUD COMPUTING IN SMART GRID
Various applications require the need of cloud computing in electric power system. The cloudcomputing helps the system to recover the power system in blackout condition. Secondly, monitoringand scheduling of the power system can be performed with the help of cloud computing. It also enablesto have reliability evaluation of the power system. Recovery of power system after blackout proves tobe a complicated nonlinear optimization problem. Power restoration process promotes the informationsharing and cooperation between different participants [23]. This can be achieved through distributedcomputing which also increase calculation efficiency. With the shared computing platforms bettersharing and cooperation between information helps to find the optimal complex interconnectedrecovery plan as shown in Fig 5.
Fig 5 Functions of cloud computing in Power system [24]Monitoring and scheduling is another application prospect of cloud computing in the power system.Through the unified power system cloud computing platform can promote the distributed control centreof information sharing and collaboration. As the number of the distributed power can be very largesystem scheduling and operation needs to be maintained. Cloud computing strong scalability helps atany time according to the size of the power system dynamic increase computing power. Using cloud
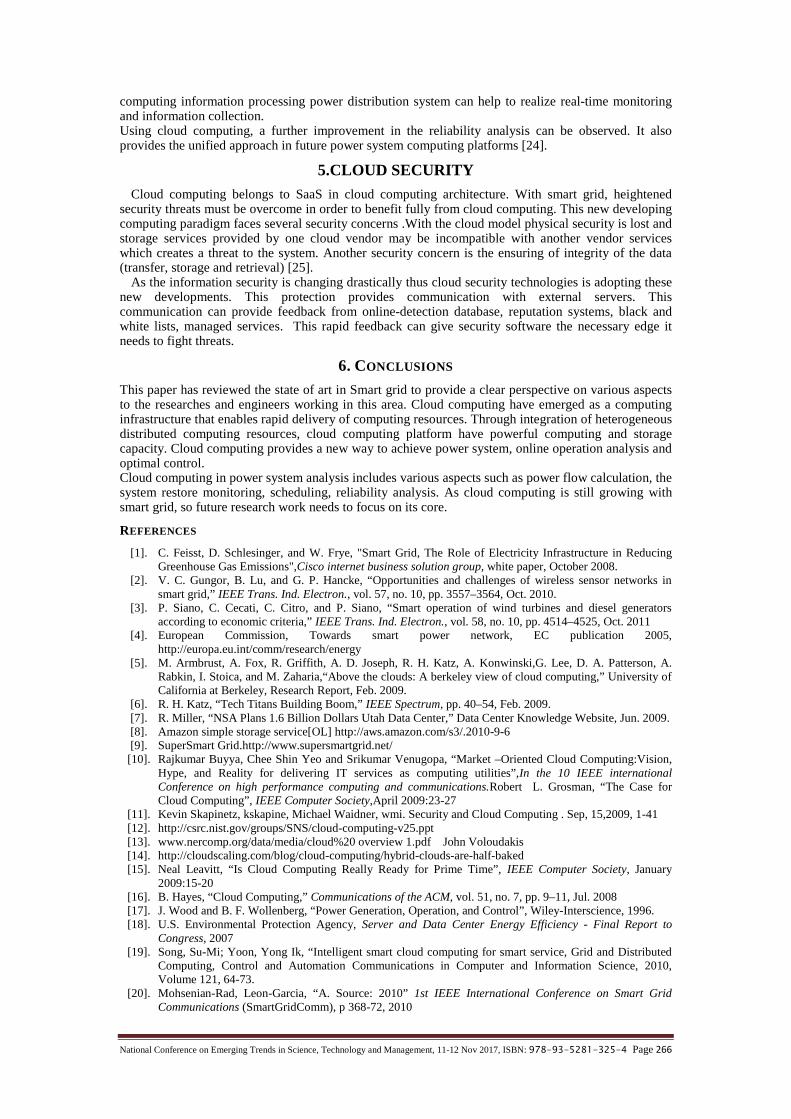
National Conference on Emerging Trends in Science, Technology and Management, 11-12 Nov 2017, ISBN: 978-93-5281-325-4 Page 266
computing information processing power distribution system can help to realize real-time monitoringand information collection.Using cloud computing, a further improvement in the reliability analysis can be observed. It alsoprovides the unified approach in future power system computing platforms [24].
5.CLOUD SECURITY
Cloud computing belongs to SaaS in cloud computing architecture. With smart grid, heightenedsecurity threats must be overcome in order to benefit fully from cloud computing. This new developingcomputing paradigm faces several security concerns .With the cloud model physical security is lost andstorage services provided by one cloud vendor may be incompatible with another vendor serviceswhich creates a threat to the system. Another security concern is the ensuring of integrity of the data(transfer, storage and retrieval) [25].
As the information security is changing drastically thus cloud security technologies is adopting thesenew developments. This protection provides communication with external servers. Thiscommunication can provide feedback from online-detection database, reputation systems, black andwhite lists, managed services. This rapid feedback can give security software the necessary edge itneeds to fight threats.
6. CONCLUSIONS
This paper has reviewed the state of art in Smart grid to provide a clear perspective on various aspectsto the researches and engineers working in this area. Cloud computing have emerged as a computinginfrastructure that enables rapid delivery of computing resources. Through integration of heterogeneousdistributed computing resources, cloud computing platform have powerful computing and storagecapacity. Cloud computing provides a new way to achieve power system, online operation analysis andoptimal control.Cloud computing in power system analysis includes various aspects such as power flow calculation, thesystem restore monitoring, scheduling, reliability analysis. As cloud computing is still growing withsmart grid, so future research work needs to focus on its core.
REFERENCES
[1]. C. Feisst, D. Schlesinger, and W. Frye, "Smart Grid, The Role of Electricity Infrastructure in ReducingGreenhouse Gas Emissions",Cisco internet business solution group, white paper, October 2008.
[2]. V. C. Gungor, B. Lu, and G. P. Hancke, “Opportunities and challenges of wireless sensor networks insmart grid,” IEEE Trans. Ind. Electron., vol. 57, no. 10, pp. 3557–3564, Oct. 2010.
[3]. P. Siano, C. Cecati, C. Citro, and P. Siano, “Smart operation of wind turbines and diesel generatorsaccording to economic criteria,” IEEE Trans. Ind. Electron., vol. 58, no. 10, pp. 4514–4525, Oct. 2011
[4]. European Commission, Towards smart power network, EC publication 2005,http://europa.eu.int/comm/research/energy
[5]. M. Armbrust, A. Fox, R. Griffith, A. D. Joseph, R. H. Katz, A. Konwinski,G. Lee, D. A. Patterson, A.Rabkin, I. Stoica, and M. Zaharia,“Above the clouds: A berkeley view of cloud computing,” University ofCalifornia at Berkeley, Research Report, Feb. 2009.
[6]. R. H. Katz, “Tech Titans Building Boom,” IEEE Spectrum, pp. 40–54, Feb. 2009.[7]. R. Miller, “NSA Plans 1.6 Billion Dollars Utah Data Center,” Data Center Knowledge Website, Jun. 2009.[8]. Amazon simple storage service[OL] http://aws.amazon.com/s3/.2010-9-6[9]. SuperSmart Grid.http://www.supersmartgrid.net/
[10]. Rajkumar Buyya, Chee Shin Yeo and Srikumar Venugopa, “Market –Oriented Cloud Computing:Vision,Hype, and Reality for delivering IT services as computing utilities”,In the 10 IEEE internationalConference on high performance computing and communications.Robert L. Grosman, “The Case forCloud Computing”, IEEE Computer Society,April 2009:23-27
[11]. Kevin Skapinetz, kskapine, Michael Waidner, wmi. Security and Cloud Computing . Sep, 15,2009, 1-41[12]. http://csrc.nist.gov/groups/SNS/cloud-computing-v25.ppt[13]. www.nercomp.org/data/media/cloud%20 overview 1.pdf John Voloudakis[14]. http://cloudscaling.com/blog/cloud-computing/hybrid-clouds-are-half-baked[15]. Neal Leavitt, “Is Cloud Computing Really Ready for Prime Time”, IEEE Computer Society, January
2009:15-20[16]. B. Hayes, “Cloud Computing,” Communications of the ACM, vol. 51, no. 7, pp. 9–11, Jul. 2008[17]. J. Wood and B. F. Wollenberg, “Power Generation, Operation, and Control”, Wiley-Interscience, 1996.[18]. U.S. Environmental Protection Agency, Server and Data Center Energy Efficiency - Final Report to
Congress, 2007[19]. Song, Su-Mi; Yoon, Yong Ik, “Intelligent smart cloud computing for smart service, Grid and Distributed
Computing, Control and Automation Communications in Computer and Information Science, 2010,Volume 121, 64-73.
[20]. Mohsenian-Rad, Leon-Garcia, “A. Source: 2010” 1st IEEE International Conference on Smart GridCommunications (SmartGridComm), p 368-72, 2010

National Conference on Emerging Trends in Science, Technology and Management, 11-12 Nov 2017, ISBN: 978-93-5281-325-4 Page 267
[21]. Qiuhua Huang; Zhou, M.; Yao Zhang; Zhigang Wu Source: 2010 International Conference on PowerSystem Technology (POWERCON 2010), pp 6 , 2010
[22]. K. ElissaWang, Dewen Song, Yaqi; Zhu, Yongli “Source: Dianli Xitong Zidonghua/Automation ofElectric Power Systems”, vol. 34, n 22, p 7-12, November 25, 2010 Language: Chinese
[23]. Berl, A. (Fak. fur Inf. und Math., Univ. of Passau, Passau, Germany); Gelenbe, E.; di Girolamo, M.;Giuliani, G.; de Meer, H.; Minh Quan Dang; Pentikousis, K. Source: Computer Journal, v 53, n 7, pp1045-51, March 2010
[24]. Zhao, Junhua, Fushuan; Xue, Yusheng, Zhenzhi, “Automation of Electric Power Systems”, vol. 34, n 15, p1-8, August 10, 2010.
[25]. Igor Muttik, Chris Barton “Cloud security technologies”, Information security technical report, 2009.

National Conference on Emerging Trends in Science, Technology and Management, 11-12 Nov 2017, ISBN: 978-93-5281-325-4 Page 268
ANALYTICAL COMPARISON OF PARAMETERS INTHE SINGLE GATE (SG), DOUBLE GATE (DG) AND
TRIPLE GATE (TG) MOSFETSaurabh Verma
Department of Electronic and CommunicationAshoka Institute of Technology and Management, Varanasi-221007, India
[email protected] Akhtar
Department of Electronic and CommunicationAshoka Institute of Technology and Management, Varanasi-221007, India
Abstract- Continuous demand for smaller, faster and cheaper low power devices integrated on a single chiphas required very less space for transistors with their good performance and reliability .In this paper, wereview various parameters of the single gate [SG], double gate[DG] and triple gate[TG] MOSFETs .As thenumber of gate increase in MOSFETs, there is the significant improvement observe in transconductance,electric field, threshold voltage and reduction in short channel effect. Results highlight the advantage andchallenges with increase in number of gates.Index Terms — surface potential, transconductance, drain resistance.
1. INTRODUCTION
Now a days with the growing technology it is require to reduce the size and increase the speed ofVery Large Scale Integration (VLSI) circuit .The conventional MOSFET has single gate (SG)[1] ,known as single gate MOSFET,to improve the various parameter of single gate MOSFET such astransconductance, , threshold voltage and reduction in short channel effect. The Double gate (DG)[2]and Triple gate (TG) [3]MOSFETs offer dominant behaviour over conventional single gate[SG]MOSFETs.These MOSFETs represent a basic building block of architecture in the future use ofCMOS technology. By scaling, there will be improvement in performance and cost of integrated circuitwhich has led to the rapid growth of semiconductor industry. In this paper a brief review of single gate(SG), Double gate (DG) and triple gate (TG) MOSFET has given.
2. SINGLE (SG), DOUBLE GATE (DG), TRIPLE GATE (TG) MOSFETS
A. Single GateThe conventional MOSFET is control by single gate which is basic building block of ComplementaryMetal Oxide Semiconductor(CMOS) IC technology that enters the sub-50nm[4] range, the siliconchannel must be less than 50nm in order to avoid the short channel effect(SCE). Fig.1 shown the crosssectional view of single gate (SG) MOSFET.
Fig.1 Basic cross sectional view of Single Gate (SG) MOSFET
B. DOUBLE GATE
In Double gate, there are two gate one is front gate and another one is back gate. Both the gates arecontrolled by the control voltage together which allows current flow in the both channels, betweenfront and back gate direct charge coupling exist.

National Conference on Emerging Trends in Science, Technology and Management, 11-12 Nov 2017, ISBN: 978-93-5281-325-4 Page 269
Fig. 2 Basic cross sectional view of Double Gate(DG) MOSFETsDouble Gate has excellent immunity to short channel effect (SCE)[5]-[7], for suppressing short channeleffect the channel length of device goes down in 45nm technology. The role of threshold voltage hasan importance with IC application such as low voltage, high speed and low power applications.Fg.2shown the basic cross sectional view of double gate (DG) MOSFET.
C. Triple Gate (TG) Mosfets
Triple Gate MOSFETs plays very important aspects of VLSI particularly for low power, good shortchannel effect (SCE), high transconductance , ideal subthreshold factor and high performance at 45nmCMOS technology.
Fig. 3 Basic 3D structure of Triple Gate MOSFET
The 3D structure of Triple Gate MOSFETs is schematically shown in the fig.3 to explain the basictransistor dimension.As thin semiconductor formed on a substrate in the Triple gate MOSFET. As the gate electrode and thegate dielectric are all around the semiconductor body on three sides, so that the transistor have threeseparate channels and gate, and the transistor gate width is equal to the sum of three side ofsemiconductor body. Source and Drain region form on the semiconductor body on the opposite side ofgate electrode. A gate dielectric is form on the top surface and side wall of semiconductor body.
3. COMPARISION AND DISCUSSIONS
The variation of different parameter for single gate (SG),double gate (DG) and triple gate (TG) areobserve with channel length 45 nm , Front Gate Oxide =2.2nm film thickness = 8nm and length ofsource or drain region= 45nm .Fig.4 has shown the variation of surface potential along the channel length in single gate (SG), doublegate (DG) and triple gate (TG). This variation shows from source to drain. the variation of surfacepotential with respect to the channel length explain as the channel length increases the surface potentialof triple gate MOSFET is also increases compare to single and double gate MOSFETs. For the fixedvalue of gate voltage Vg, the drain source voltage Vds increases then surface potential becomes advanceand it shifts towards the source. By applying higher gate- source voltage the magnitude of surfacepotential is raised because of reduced hot carrier effects [8].
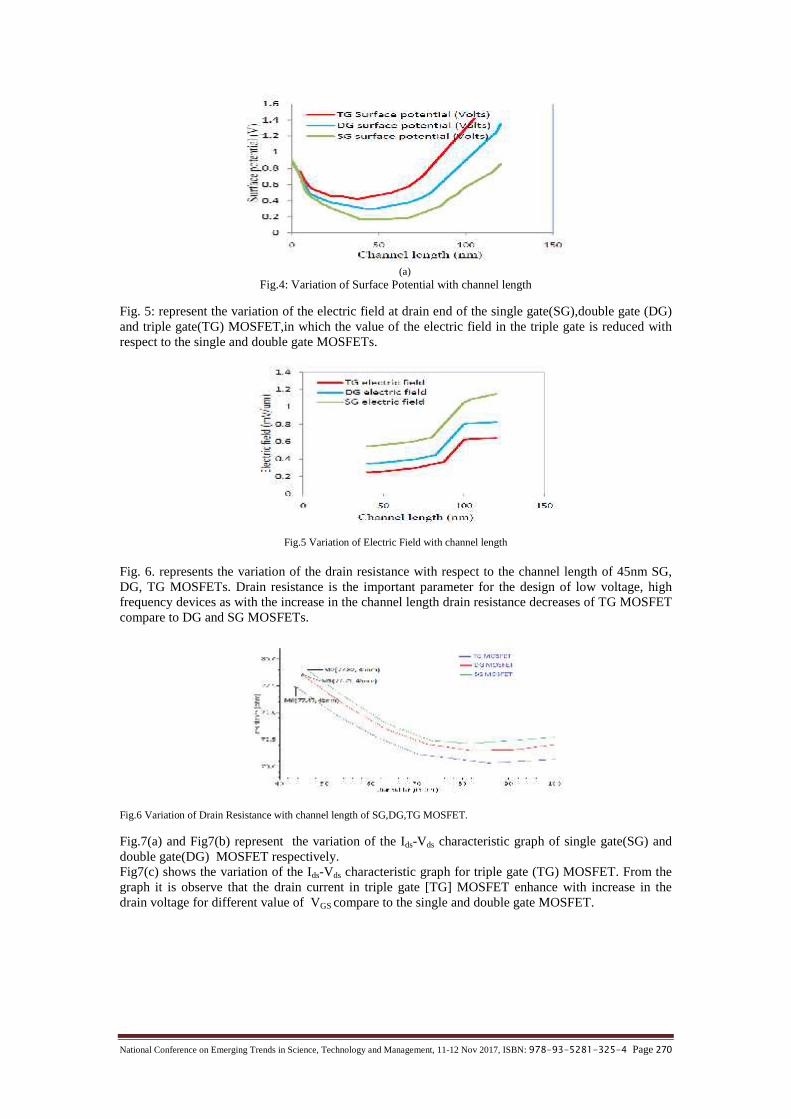
National Conference on Emerging Trends in Science, Technology and Management, 11-12 Nov 2017, ISBN: 978-93-5281-325-4 Page 270
(a)Fig.4: Variation of Surface Potential with channel length
Fig. 5: represent the variation of the electric field at drain end of the single gate(SG),double gate (DG)and triple gate(TG) MOSFET,in which the value of the electric field in the triple gate is reduced withrespect to the single and double gate MOSFETs.
Fig.5 Variation of Electric Field with channel length
Fig. 6. represents the variation of the drain resistance with respect to the channel length of 45nm SG,DG, TG MOSFETs. Drain resistance is the important parameter for the design of low voltage, highfrequency devices as with the increase in the channel length drain resistance decreases of TG MOSFETcompare to DG and SG MOSFETs.
Fig.6 Variation of Drain Resistance with channel length of SG,DG,TG MOSFET.
Fig.7(a) and Fig7(b) represent the variation of the Ids-Vds characteristic graph of single gate(SG) anddouble gate(DG) MOSFET respectively.Fig7(c) shows the variation of the Ids-Vds characteristic graph for triple gate (TG) MOSFET. From thegraph it is observe that the drain current in triple gate [TG] MOSFET enhance with increase in thedrain voltage for different value of VGS compare to the single and double gate MOSFET.
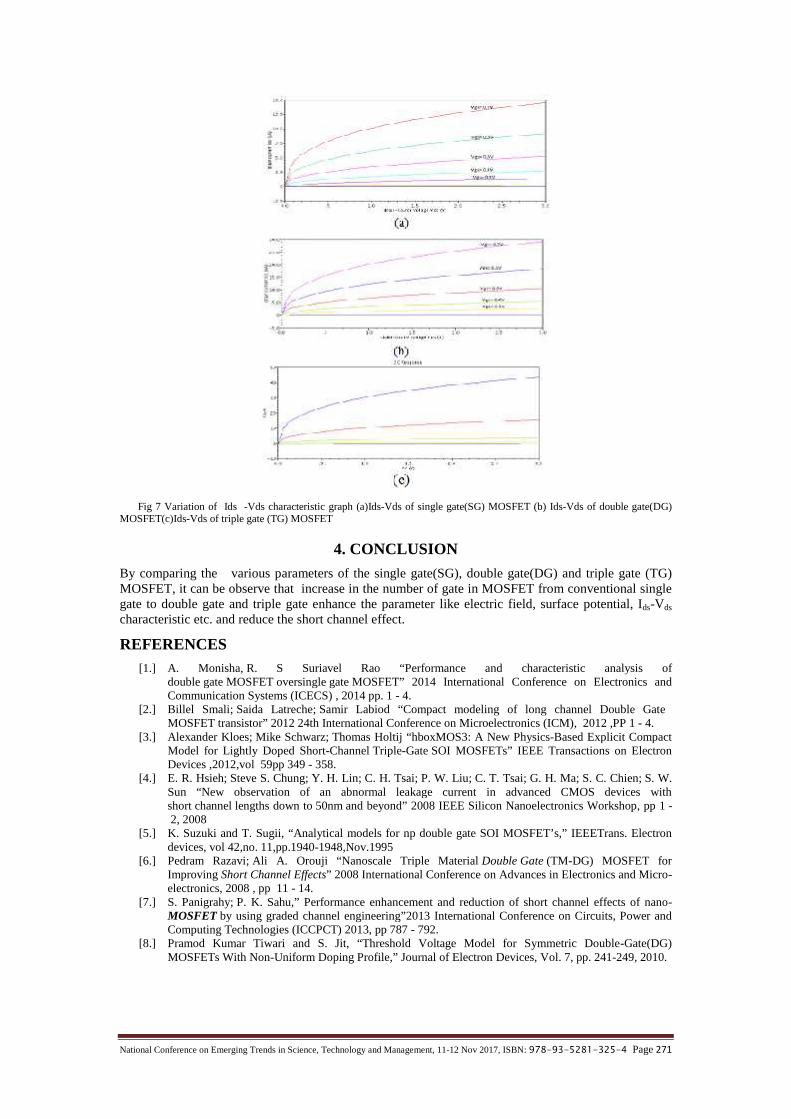
National Conference on Emerging Trends in Science, Technology and Management, 11-12 Nov 2017, ISBN: 978-93-5281-325-4 Page 271
Fig 7 Variation of Ids -Vds characteristic graph (a)Ids-Vds of single gate(SG) MOSFET (b) Ids-Vds of double gate(DG)MOSFET(c)Ids-Vds of triple gate (TG) MOSFET
4. CONCLUSION
By comparing the various parameters of the single gate(SG), double gate(DG) and triple gate (TG)MOSFET, it can be observe that increase in the number of gate in MOSFET from conventional singlegate to double gate and triple gate enhance the parameter like electric field, surface potential, Ids-Vds
characteristic etc. and reduce the short channel effect.
REFERENCES[1.] A. Monisha, R. S Suriavel Rao “Performance and characteristic analysis of
double gate MOSFET oversingle gate MOSFET” 2014 International Conference on Electronics andCommunication Systems (ICECS) , 2014 pp. 1 - 4.
[2.] Billel Smali; Saida Latreche; Samir Labiod “Compact modeling of long channel Double GateMOSFET transistor” 2012 24th International Conference on Microelectronics (ICM), 2012 ,PP 1 - 4.
[3.] Alexander Kloes; Mike Schwarz; Thomas Holtij “hboxMOS3: A New Physics-Based Explicit CompactModel for Lightly Doped Short-Channel Triple-Gate SOI MOSFETs” IEEE Transactions on ElectronDevices ,2012,vol 59pp 349 - 358.
[4.] E. R. Hsieh; Steve S. Chung; Y. H. Lin; C. H. Tsai; P. W. Liu; C. T. Tsai; G. H. Ma; S. C. Chien; S. W.Sun “New observation of an abnormal leakage current in advanced CMOS devices withshort channel lengths down to 50nm and beyond” 2008 IEEE Silicon Nanoelectronics Workshop, pp 1 -2, 2008
[5.] K. Suzuki and T. Sugii, “Analytical models for np double gate SOI MOSFET’s,” IEEETrans. Electrondevices, vol 42,no. 11,pp.1940-1948,Nov.1995
[6.] Pedram Razavi; Ali A. Orouji “Nanoscale Triple Material Double Gate (TM-DG) MOSFET forImproving Short Channel Effects” 2008 International Conference on Advances in Electronics and Micro-electronics, 2008 , pp 11 - 14.
[7.] S. Panigrahy; P. K. Sahu,” Performance enhancement and reduction of short channel effects of nano-MOSFET by using graded channel engineering”2013 International Conference on Circuits, Power andComputing Technologies (ICCPCT) 2013, pp 787 - 792.
[8.] Pramod Kumar Tiwari and S. Jit, “Threshold Voltage Model for Symmetric Double-Gate(DG)MOSFETs With Non-Uniform Doping Profile,” Journal of Electron Devices, Vol. 7, pp. 241-249, 2010.

National Conference on Emerging Trends in Science, Technology and Management, 11-12 Nov 2017, ISBN: 978-93-5281-325-4 Page 272
HYBRID FREEZA-CArman, Mohit Singh, Satyam Dev,
Department of Electrical Engineering,Ashoka Institute of Technology and Management, Varanasi
[email protected] , [email protected], [email protected]
Abstract-In the recent years, we have many problems such as energy crises and environment degradationdue to the increasing CO2 emission and ozone layer depletion has become the primarily concern to bothdeveloped and developing countries. We are going to make revolutionary product Hybrid Freeza-C which isactually a combination of Freeze and AC. We also try to reduce cost and save energy in this project. Ourproject utilizes the solar energy for its operation. Solar refrigeration using thermoelectric module is going tobe one of the most cost effective, clean and environment friendly system. The main purpose of this project isto provide refrigeration to the remote areas where power supply is not possible.
Index Terms- Technical hybridization,role of Peltier module.
1. INTRODUCTION
In this project we are going to technical hybridize Refrigerator and AC. Which helps in savingelectricity and reduces cost. Our objective is to run Refrigerator and AC at single compressor, singlecompression coil and single expansion coil which is common in Freeze and AC after our technicalhybridization in form of Hybrid Freeza-C.From last century till now refrigeration has been one of the most important factors of our daily life. Thecurrent tendency of the world is to look at renewable energy resources as a source of energy. This isdone for the following two reasons; firstly, the lower quality of life due to air pollution; and, secondly,due to the pressure of the ever increasing world population puts on our natural energy resources. Fromthese two facts comes the realization that the natural energy resources available will not lastindefinitely. In this project we try our best to launch a revolutionary product in market which is helpfulfor poor people and also for a people who live in remote areas in daily use at cheap and affordableprice.
2.CONSTRUCTION AND MATERIAL REQUIRED
Refrigerator ChamberCompressorEvaporator CoilsCondenser CoilsExpansion Devices
AC Chamber3 SMPS DC exhaust fan10 waste tin boxThermal module12V DC Battery 7.2 AhSolar Panel 20W
AUTOCAD Designing of Hybrid Freeza-C
3. WORKING OF HYBRID FREEZA-C
Hybrid Freeza-C have two chamber -Refrigerator chamber and AC chamber. When we give supply torefrigeration chamber compressor start working and freezer of refrigerator get cooling rapidly due to

National Conference on Emerging Trends in Science, Technology and Management, 11-12 Nov 2017, ISBN: 978-93-5281-325-4 Page 273
this technically hybridized attached AC chamber also get cooled due to contact of freezing chamber.Once three cooling pattern pipe of AC get cooled due to attached corresponding exhaust fan it exhaustsair strike through cooled pipe and cooled air out through AC chamber.Thermo-electric module is an equipment, which work on principle of conversion of solar energy intoelectrical energy. A solar cell is used to develop 17 V & 1.16 amps current DC supply and 20W. Thiselectrical energy is stored in a battery which is of 12volts DC supply which then supplies the power totransformers. The transformer control three fan out of which two-fan work as exhaust fan & removeheat from heat sink plate. The third in side fan work as heat extractor, this fan remove heat from systemand add to heat sink. During operation, DC current flows through the TEM causing heat to betransferred from one side of the TEC to the other, creating a cold and hot side. It is use during backupmode supply of 12V battery.
Fig. MATLAB/ Simulation ofCharging circuit
Technical hybridization diagram
Output waveform ofCharging circuit

National Conference on Emerging Trends in Science, Technology and Management, 11-12 Nov 2017, ISBN: 978-93-5281-325-4 Page 274
4. REFRIGERATOR /AC VS HYBRID FREEZA-C
Parameters Refrigerator AC Hybrid Freeza-COperation
(Supply mode)Generally, AC
supplyGenerally, AC
supply(Ac + Dc) Supply
Both
Ice MakingCooling effect
HIGH Air Cooling high Slightly Higher ThanRefrigerator
Solar Feature NO NO Yes
Backup NO NO Yes
EnergyConsumption
2KWh/Day 8KWh/DAy
1.5KWh/Day
Cost Rs.12000/- Rs.30000/- Rs.15003/-
5. OBJECTIVES
The overall short term aim was to develop a cheap and compact HybridFreeza-C using a TEC heatexchanger which has facility of freezing and Air conditioning. As has already been explained in sectionabove an important design parameter should be the ability to function under variable input powerconditions. By using a cooler box, all the power provided by the PV system could be utilized during theday, achieving very high overall efficiency for the PV system.1. To make use of environmentally friendly refrigeration and cooling system.2. To investigate the cost and effectiveness of the design or TE module.3. To identify the improvements on the experiment.4. To study the results coming out from this project.5. To compare results with theoretical result.6. To look at commercially available 12V DC cooler boxes.7. To construct a test on the behavior and specifications of a TEC heat exchanger operating in a coolerbox environment.
6. ADVANTAGES OF THE FREEZA-C
1. Light weight and compact for very small heat loads.2. No moving parts, eliminating vibration, noise, and problems of wear.3. Reversing the direction of current transforms the cooling unit into a heater.

National Conference on Emerging Trends in Science, Technology and Management, 11-12 Nov 2017, ISBN: 978-93-5281-325-4 Page 275
4. Operates in any orientation. Not affected by gravity or vibration5. Very low cost device for cooling in small appliances.6. Precision temperature control capability
7. APPLICATIONS AND FUTURE SCOPE OF THE FREEZA-C
1. Medical field- Pharmaceutical industry, medicine and medical equipment storage, etc.2. Military- storing of consumable goods in war affected zones, rural area, etc.3. Dairy (milk) industry.4. Mechanical industry.5. Scientific and Laboratory Equipment— cooling chambers, freezers,cooling incubators, temperaturestabilized chambers, cold laboratory plates and tables, thermo-calibrators, stage coolers, thermostats,coolers and temperature stabilizers for multipurpose sensors6. Restaurant and hotel.7. Vegetable, fish, fruit etc. storage.
8. CONCLUSION
Our team is going to make Hybrid Freeza-C which is actually a combination of Freeze and AC. Wealso try to reduce cost and save energy in this project. Our project utilizes the solar energy for itsoperation. Solar refrigeration using thermoelectric module is going to be one of the most cost effective,clean and environment friendly system. The main purpose of this project is to provide refrigeration tothe remote areas where power supply is not possible.In the coming years thermoelectricity has a lot of potential to create energy saving and effectivesolutions for the industry and commercially as well.
REFERENCES[1.] Power Electronics by Dr. P.S. Bimbra[2.] Peltier module Wikipedia[3.] solar semiconductor industry visit[4.] http://en.wikipedia.org/wiki/solar_cell[5.] encyclobeamia.solarbotics.net/article.
National Conference on Emerging Trends in Science, Technology and Management, 11-12 Nov 2017, ISBN: 978-93-5281-325-4 Page 276
REAL TIME CROWD CONTROL SYSTEM USINGEMBEDDED WEB TECHNOLOGY
Kumar Arvind1, Deepak Kumar Singh2
Asst. Prof. ECE Dept. AITM, [email protected], [email protected]
Abstract-The system proposed in this paper is an advanced solution for monitoring the crowdconditions at a particular place and make the information visible globally in the world. Thetechnology behind this is embedded web technology, which is an advanced and efficient solutionfor connecting the things to the internet and to connect the control unit anywhere in world ofthings through a network. The data updated from the implemented system can be accessible inthe internet from anywhere in the world. With rapid economic and cultural development inmany countries, managing and control of crowd has increasingly become an extremely importantcomponent in the daily life. So it is very essential to build an intelligent Crowd control andmonitoring system in order to resolve the crowd congestion of public places and reduce accidents.One major factor that affects the Crowd flow is the orientation of the Crowd at narrow places ina town or city. In traditional Crowd monitoring system, only visual inspection and audioguideline was used. Each intersection controller works independently of each other with no wayof being remotely monitored or controlled. With the rise of the Internet technology, embeddedWeb technology goes into the mainstream at present, and various web scripts and serverssupport the program running on an embedded device. The managers can manage and monitorCrowd situations through the Web browsers. In this work we have utilized the emergingembedded web server technology to design a web-based Crowd management system that canremotely control and monitor the Crowd at various places simultaneously. The system is aimedat improving the traditional Crowd monitoring system by incorporating better management andmonitoring schemes as well as providing maximum users with real time information.
1. INTRODUCTION
There is a lot of useful information freely available about what the web is, how it came about, and whatit means to use one technology over another. The Internet and the web are commonly interchangeddespite being different parts of the same system. The Internet is infrastructure of hardware system thatfacilitates sending information. This hardware fits together to make the computer networks that in turnuse Internet protocols such as TCP/IP and UDP/IP. “The Web” is short for the World Wide Web and itis complementary to the Internet. It is the series of various interlinked documents accessedthrough the Internet. Ultimately WWW is a set of standards used to communicate information. Thereare two primary factors when communicating over WWW, the server and the client. For right nowthink of the server and the client as two desktop systems. The server system waits for the client systemto initiate communication and then the client system makes a request for information. If the serversystem understands the request it replies with a response. If the server system does not understand therequest it replies back to the client system with an error. This pattern is termed as the client-servermodel.To transfer information in this request-response manner both the web service and the web browsermust talk the same computer language. That language is called as Hypertext Transfer Protocol orHTTP. HTTP is built on other standard protocols such as TCP/IP protocol. HTTP has 9 basic actions,which are called methods that it supports; the most common methods: GET and POST. A GET methodmakes request to the server system to retrieve information. A POST method makes a request to changeinformation on the server system. The program that runs on the server system and can communicateover HTTP is called the web service. A web service is an application used to handle web requests fromthe client system and reply with a response determined by the web developer. You can start and stopthe web service just like any other type of computer program.An embedded system is a computer designed for dedicated functionality such as controlling ormonitoring. Typically they run a real-time operating system (RTOS) to allow for many deterministicoperations and high reliability. Similar to large website publishers like Yahoo, Google, or Facebook,embedded systems have information that needs to be shared with the external systems. Two commonexamples of such external systems would include human-machine interfaces (HMIs) and thesupervisory control and data acquisition (SCADA) systems. Both external system types need tocommunicate with the embedded devices, but their requirements dictate different design decisionswhen using web technology. In this paper we have utilized the emerging embedded web servertechnology to design a Crowd control and monitoring system that can remotely control and Monitor the
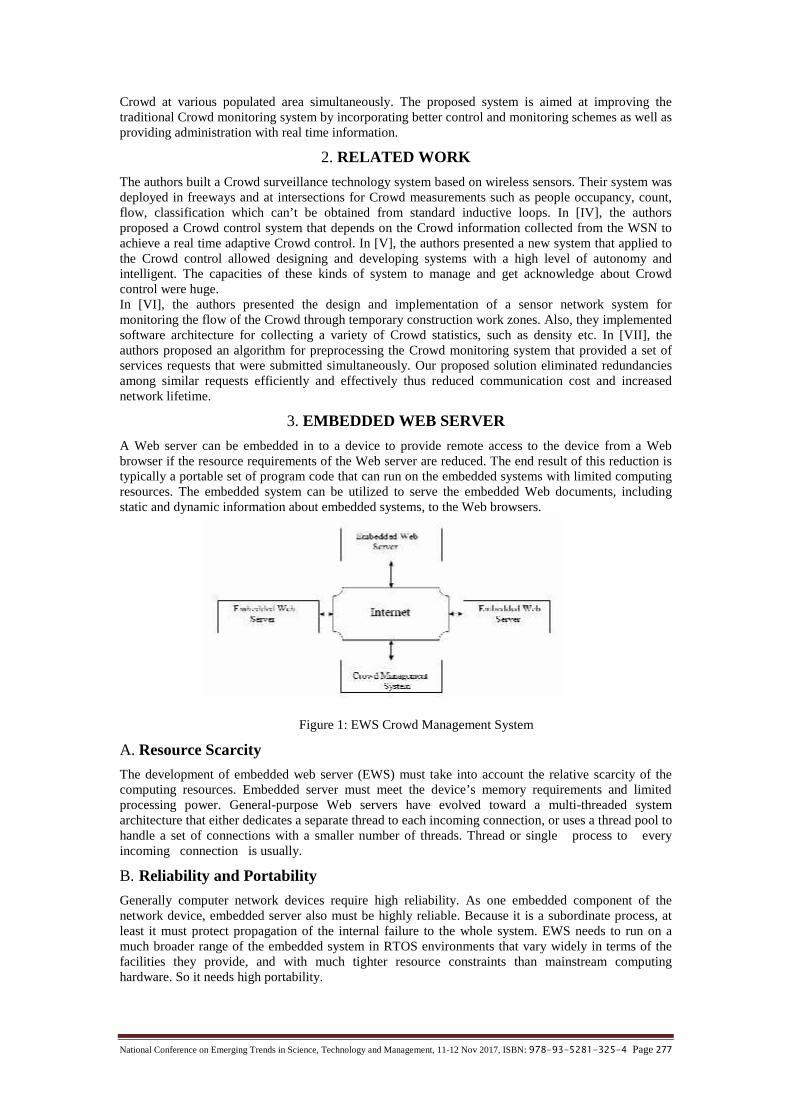
National Conference on Emerging Trends in Science, Technology and Management, 11-12 Nov 2017, ISBN: 978-93-5281-325-4 Page 277
Crowd at various populated area simultaneously. The proposed system is aimed at improving thetraditional Crowd monitoring system by incorporating better control and monitoring schemes as well asproviding administration with real time information.
2. RELATED WORK
The authors built a Crowd surveillance technology system based on wireless sensors. Their system wasdeployed in freeways and at intersections for Crowd measurements such as people occupancy, count,flow, classification which can’t be obtained from standard inductive loops. In [IV], the authorsproposed a Crowd control system that depends on the Crowd information collected from the WSN toachieve a real time adaptive Crowd control. In [V], the authors presented a new system that applied tothe Crowd control allowed designing and developing systems with a high level of autonomy andintelligent. The capacities of these kinds of system to manage and get acknowledge about Crowdcontrol were huge.In [VI], the authors presented the design and implementation of a sensor network system formonitoring the flow of the Crowd through temporary construction work zones. Also, they implementedsoftware architecture for collecting a variety of Crowd statistics, such as density etc. In [VII], theauthors proposed an algorithm for preprocessing the Crowd monitoring system that provided a set ofservices requests that were submitted simultaneously. Our proposed solution eliminated redundanciesamong similar requests efficiently and effectively thus reduced communication cost and increasednetwork lifetime.
3. EMBEDDED WEB SERVER
A Web server can be embedded in to a device to provide remote access to the device from a Webbrowser if the resource requirements of the Web server are reduced. The end result of this reduction istypically a portable set of program code that can run on the embedded systems with limited computingresources. The embedded system can be utilized to serve the embedded Web documents, includingstatic and dynamic information about embedded systems, to the Web browsers.
Figure 1: EWS Crowd Management System
A. Resource Scarcity
The development of embedded web server (EWS) must take into account the relative scarcity of thecomputing resources. Embedded server must meet the device’s memory requirements and limitedprocessing power. General-purpose Web servers have evolved toward a multi-threaded systemarchitecture that either dedicates a separate thread to each incoming connection, or uses a thread pool tohandle a set of connections with a smaller number of threads. Thread or single process to everyincoming connection is usually.
B. Reliability and Portability
Generally computer network devices require high reliability. As one embedded component of thenetwork device, embedded server also must be highly reliable. Because it is a subordinate process, atleast it must protect propagation of the internal failure to the whole system. EWS needs to run on amuch broader range of the embedded system in RTOS environments that vary widely in terms of thefacilities they provide, and with much tighter resource constraints than mainstream computinghardware. So it needs high portability.
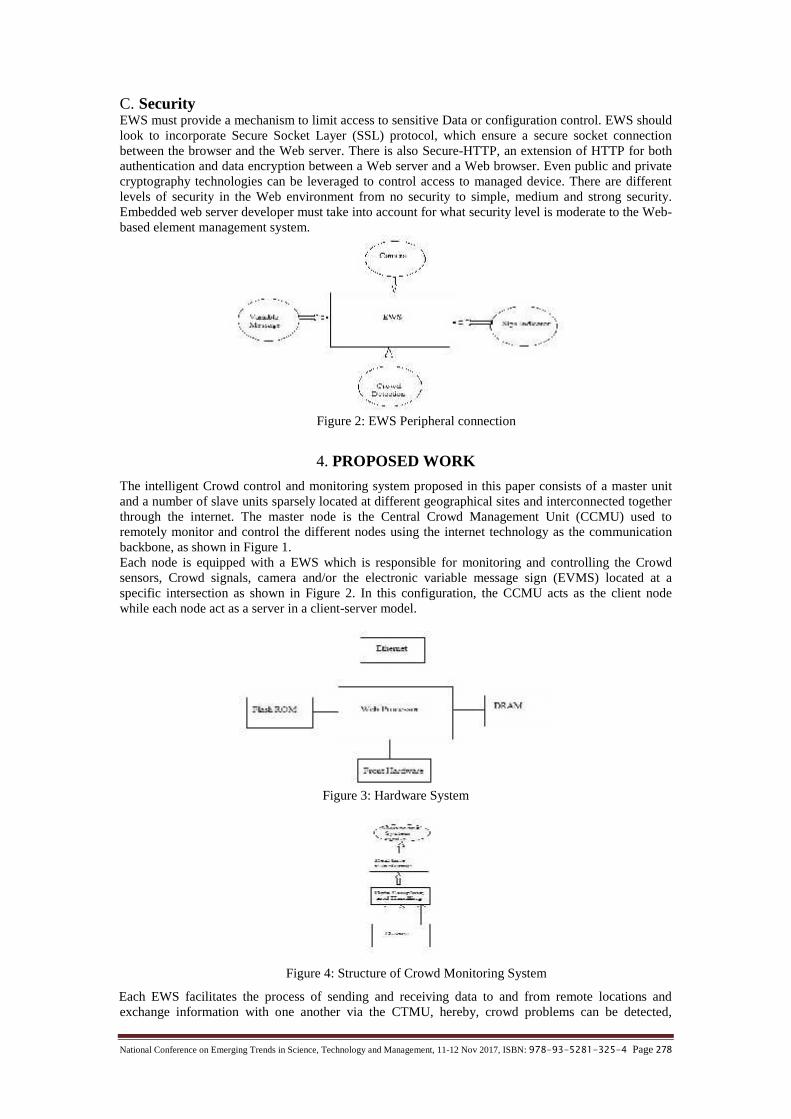
National Conference on Emerging Trends in Science, Technology and Management, 11-12 Nov 2017, ISBN: 978-93-5281-325-4 Page 278
C. SecurityEWS must provide a mechanism to limit access to sensitive Data or configuration control. EWS shouldlook to incorporate Secure Socket Layer (SSL) protocol, which ensure a secure socket connectionbetween the browser and the Web server. There is also Secure-HTTP, an extension of HTTP for bothauthentication and data encryption between a Web server and a Web browser. Even public and privatecryptography technologies can be leveraged to control access to managed device. There are differentlevels of security in the Web environment from no security to simple, medium and strong security.Embedded web server developer must take into account for what security level is moderate to the Web-based element management system.
Figure 2: EWS Peripheral connection
4. PROPOSED WORK
The intelligent Crowd control and monitoring system proposed in this paper consists of a master unitand a number of slave units sparsely located at different geographical sites and interconnected togetherthrough the internet. The master node is the Central Crowd Management Unit (CCMU) used toremotely monitor and control the different nodes using the internet technology as the communicationbackbone, as shown in Figure 1.Each node is equipped with a EWS which is responsible for monitoring and controlling the Crowdsensors, Crowd signals, camera and/or the electronic variable message sign (EVMS) located at aspecific intersection as shown in Figure 2. In this configuration, the CCMU acts as the client nodewhile each node act as a server in a client-server model.
Figure 3: Hardware System
Figure 4: Structure of Crowd Monitoring System
Each EWS facilitates the process of sending and receiving data to and from remote locations andexchange information with one another via the CTMU, hereby, crowd problems can be detected,
National Conference on Emerging Trends in Science, Technology and Management, 11-12 Nov 2017, ISBN: 978-93-5281-325-4 Page 279
analyzed and corrected quickly. The ESW of every master and slave node is identified by its unique IPaddress and can be controlled remotely by CTMU. The embedded server sends and receives the desiredinformation using HTML documents which has the ability to be generated dynamically using theCommon Gateway Interface (CGI). HTTP protocol is the protocol that is used to allow themanagement unit to request status or control the web servers at the different nodes. The embedded webserver must include enough memory to hold the software that facilitates its networking ability. Anoptimized TCP/IP stack is implemented into the web server ROM. In addition, external DRAM isrequired for buffering the incoming data, while an external flash memory is needed to store the htmlweb information and the traffic signal control application software. The management unit will act asthe web client when monitoring and controlling the nodes via a standard web browser. Embedded webserver hardware system includes an embedded processor, DRAM, Flash ROM, Ethernet port, frontterminal application system components and bus controller, as shown in Figure 3.EWS gathers real-time status information and then delivers them to the external database server. Thismethod can easily make use of the database management software installed on the database server toimplement data storage and management. Nevertheless, that happens at the cost of low real-timeresponse capacity because of frequent data interaction between the embedded server and the externaldatabase server. Model explains the structure of the embedded web system and the embedded databasemanagement software transplanted in embedded web server is responsible for data storage andmanagement. Embedded database management software has some special characteristics suitable forthe embedded application environment. First of all, it always has small size, so it can be transplantedand used in the resource-limited embedded environment. For another, its process-driven access modecan efficiently avoid additional consumption caused by the process communication. Data dump shouldbe considered, or the performance of the database accesses will gradually go down along with the dataexpansion.
5. CONCLUSION
With the rise of the Internet technology, embedded Web server technology goes into the mainstream atpresent, and CGI script and Web server support the program running on an embedded device. Themanagers can manage and monitor situations of traffic through the Internet by using web browsers.This paper presents a method that combines embedded WEB technology with Internet to implementremote Crowd control and monitoring through the Web Server applications. Therefore managerialpersonnel can have the remote real-time monitoring and control of crowd management through Webbrowsers without time and geographical constraints.
REFERENCES
[1.] V. Vanithaa, V. Palanisamy, K. Baskaran, “ServiceMerging for Service Oriented Wireless Sensor Networks”, European Journal of ScientificResearch, Vol.50 No.2, pp. 263-269, 2011.
[2.] Iván C., Ana-B G., José-F M., Pedro L., “Wireless Sensor Network-based system for measuringand monitoring road traffic”, Research paper, collecter Iberoamérica, 2008.
[3.] Hettiarachchi H.A.P.K. & Fernando I.M.K., “USB Based High Speed Data Acquisition System foran Unmanned Weather Station”, 2nd Int. Conf. on e-governance, 2004.
[4.] Ayush Kr. Mittal and Deepika Bhandari, " A Novel Approach to Implement Green Wave systemand Detection of Stolen Vehicles", 978-1-4673-4529- 3/12/$31.00_c 2012 IEEE.
[5.] Manohar B., Mehrdad R., Ishu P., Nilesh P., Joe G.,Nigamanth S., “A Sensor Network System forMeasuring Traffic in Short-Term Construction Work Zones”, Research paper, Springer-VerlagBerlin Heidelberg, pp. 216 –230, 2009.

National Conference on Emerging Trends in Science, Technology and Management, 11-12 Nov 2017, ISBN: 978-93-5281-325-4 Page 280
DIGITAL MARKETINGMohammad Asif
Department of management,Ashoka Institute of Technology and Management, Varanasi
Abstract-The rapidly emerging digital economy is challenging the relevance of existing marketing practices,and a radical redesign of the marketing curriculum consistent with the emerging student and business needsof the 21st century is required.After an overview of recent marketing trends, this article describes the needfor a fundamental change in the teaching of marketing in today’s environment, performs a curriculumaudit of existing digital marketing initiatives, and then details a new curriculum reflective of marketing in adigital age and an approach to implement it. Finally, the new major is discussed in the context of specificchallenges associated with the new age of marketing. The approach developed here provides otheruniversities a target to serve as one measure of progress toward a curriculum more in tune with theemerging digital environment.
Keywords-Search Engine Optimization (SEO), Search Engine Marketing (SEM), Social Media Marketing (SMM)Digital market, web chutney, mobile marketing.
1. INTRODUCTION
Digital marketing began in early 1980s, basically used in automobile company where in an advertisingcampaign, people replied in return with the help of Floppy which contains multimedia content. Digitalmarketing is one type of marketingbeing widely used now a days to promoteproducts or servicesand to reach consumersusing digital channels. Digital marketingextends beyond internet marketingincludingchannels that do not require the use ofInternet. It includes mobile phones (both SMS andMMS), social media marketing, display advertising, search engine marketingand many other forms ofdigital media on the project on marketing, taken effectively and efficiently. First time in the year 1979 Michael Aldrich demonstrates the first online shopping
system. As it was the evolution of digital marketing as also we can say it was a startup of
digital marketing. When we talk about India then in the year 1996 “India MART” B2B marketplace
established in India.
2007: Flipkart was established in India. Every E-marketing or commercial enterprises usesmajorly digital means for their marketing purposes.
In 2011, the digital marketing statistics revealed that advertising via the mobile phone andtablets was 200% lower than that of the following years. During this year, the net worth was $2billion.
The growth was in a geometric progression as it rose to $6 billion in 2012. The competitive growthdemands for more improvement in the career works and professionals are being added to the field.From 2013 to March 2015, the investment total increase was 1.5 billion dollars over the precedingyears. There has been an impressive growth up till this present moment.
Above the report by the International Journal of Advanced Research Foundation revealed thatsummarized that India is getting to see the golden period of the Internet sector between 2013 to 2018with incredible growth opportunities and secular growth adoption for E-Commerce, InternetAdvertising, Social Media, Search, Online Content, and Services relating digital marketing.

National Conference on Emerging Trends in Science, Technology and Management, 11-12 Nov 2017, ISBN: 978-93-5281-325-4 Page 281
2. ANALYSIS OF DIGITAL MARKETING FROM PAST TO PRESENTSCENARIO
The survey from people indicates the size of Digital Marketing industry in India: 34% of the companies already had an integrated digital marketing strategy in 2016. 72% marketers believe that traditional model of marketing is no longer sufficient and this will
make the company revenue to be increased by 30% by the end of 2017.
(a) Mobile Marketing
Digital marketing overview reveals that Social media has been playing a supporting role to marketing.Over the years, it has been noticed that 92% of social media users are from the mobile devices. Thisenables the size of digital marketing industries.According to the research made by the Internet and Mobile Association of India (IAMAI, 2008),communication has become a real mass communication tools having about 286 million accounts in2008. The Indian telecommunications market has tremendous growth opportunities and according toIAMAI is projected to exceed 500 million by 2010. According to TRAI, the numbers of mobilesubscriber based in India grew to 980.81 million users in the second quarter of 2015.Adoption for the mobile device is getting higher day by day. SMS marketing is one of the true massmarket media channels across many demographics before the convergence of mobile internet andmobile devices.
(b) E-mail and video marketing
Growing need for the visual content has turned video marketing be one of the most appealing trends ofdigital marketing in 2017. Email marketers of some of the most successful marketing agencies claim areturn of $40 for every dollar they invested. From the digital marketing overview, it was discoveredthat well-targeted email marketing will be one of the most effective ways of ensuring conversions in2017. As shown from the figure below, email is one of the most effective methods for digital marketingas there is a facility to disburse messages to millions of people at a time.
3. WEB CHUTNEY
The agency credited with ushered in the era of digital advertising in India. It is leading digitalmarketing agency. Webchutney has announced key movements within executive leadership acrossNew Delhi and Mumbai. The move signifies a clear mandate to accelerate growth by forging strongerties with partners and clients, while streamlining vertical units and fortifying operational efficiency.The agency has grown to over 200 people across New Delhi, Mumbai and Bangalore with a diverseclient portfolio ranging from startups to Fortune 50 companies within 13 years of establishment.Webchtney was Ranked India’s number one digital agency in 2008, 2009 & 2011. Their servicesinclude online advertising, Website Designing, Mobile Marketing, SEO, Analytics, ApplicationDevelopment and Social Media. Some of their clients are Airtel, Flipkart, Pepsi, Coca-Cola, Bacardi,Red Bull, PepsiCo, Mastercard and Microsoft, to name a few.. The growth signifies the rate of growthof digital marketing industries in India.
4. THINGSTHROUGH WHICHDIGITAL MARKETING WORKS
There arevarious elements by which digital marketing is formed. All forms operate throughelectronicdevices. The most important elements of digital marketing are given below:
(a) Online advertising: Online advertising isavery important part of digital marketing.It isalso called internet advertisingthroughwhich company can deliver the message about theproducts or services. Internet-based advertising providesthe content and ads thatbestMatchestoconsumer interests. Publishers put about their products or serviceson their websites so thatconsumers or users get free information. Advertisers should place more effectiveandrelevant ads online. Through online advertising, company well controls its budget and it has fullcontrolon time.
(b) Email Marketing: When message about the products or services is sent through email to theexisting or potential consumer, itis defined as email marketing.Direct digital marketing isused to send ads, to buildbrand and customerloyalty, to build customer trust and tomake brand awareness. Company can promote itsproducts andservices by using this elementof digital marketing easily. It isrelatively low cost comparing to advertising orother forms ofmedia exposure. Company can bring complete attention of the customer by creatingattractivemix of graphics, text and links on the products and services.

National Conference on Emerging Trends in Science, Technology and Management, 11-12 Nov 2017, ISBN: 978-93-5281-325-4 Page 282
(c) Social Media: Today, social media marketing is one of the most important digital marketingchannels. It is a computer-basedtool that allows people to create, exchange ideas, informationand pictures about the company’s product orservices. According to Nielsen, internet userscontinue to spend more time with social media sites than any other type. Social mediamarketing networks include Facebook, Twitter, LinkedIn and Google+. ThroughFacebook,company can promote events concerning product and services, run promotions that complywiththe Facebook guidelines and explore new opportunities. Through Twitter, companycan increase theawareness and visibility of their brand. It is the best tool for thepromotion of company’s products andservices. In LinkedIn, professionals write theirprofile and share information with others. Company candevelop their profile in LinkedIn sothat the professionals can view and can get more information about the Company’s product andservices. Google+ is also social media network that is more effective than other socialmedia likeFacebook, Twitter. It is not only simple social media network but also it is an authorship toolthatlinks web-content directly with its owner.
5. THE BASIC COMPONENTS
(a) Search Engine Optimization: SEO is the basic knowledge any online marketer should have. Itis the technique to get traffic from organic search results on search engines like Bing andGoogle.
(b) Search Engine Marketing: Pay per click if done right could be the largest drivers of growth foryour business.
(c) Social Media Marketing: Social Media is extremely important these days when it comes toinbound marketing. You don’t only have to write witty tweets and status updates but also buildan audience, understand what they like, engage with them and much more. Social mediaplatform could be a powerful lead generator.
(d) Content Marketing: The purpose of content marketing is to attract the audience who willhopefully become customers. It focuses on providing value to your audience.
Thorough + Useful + Entertaining Content = Value(e) E-mail Marketing: It is the largest driver of revenue for most of the businesses. People will
subscribe to your clothing brands for updates and discounts. If your customers find somethinginteresting, they will click it and will buy from your website.
VI. RECOMMENDATIONAND FORCASTING
Things which is disparity in International and Indian digital marketinga. The activities of production, promotion, advertising, distribution, selling and customer
satisfaction within one’s own country is known as Domestic marketing. Internationalmarketing is when the marketing activities are undertaken at the international level.
b. Domestic marketing caters a small area, whereas International marketing covers a largearea.
c. In domestic marketing, there is less government influence as compared to theinternational marketing because the company has to deal with rules and regulations ofnumerous countries.

National Conference on Emerging Trends in Science, Technology and Management, 11-12 Nov 2017, ISBN: 978-93-5281-325-4 Page 283
d. In domestic marketing, business operations are done in one country only. On the otherhand, in international marketing, the business operations conducted in multiplecountries.
e. In international marketing, there is an advantage that the business organisation can haveaccess to the latest technology of several countries which is absent in case domesticcountries.
f. But the most remarkable point is that this growth rate is not going to be stagnant in thecoming years. Digital Marketing skills in demand - Since marketing is the mostimportant function for any business. New era of marketing is evolving for india.so thereis lots of need of development in India basically technological factors which Indians getat higher cost in comparison to other country.
6. CONCLUSION
During the report the researcher observe that Brand cannot sustain for longer time without digitalpresence. The Indian businesses will need to have a solid internet marketing strategy in place to reapmaximum benefits. While all other industries are struggling with a growth rate of 5 to 10 %, digitalmedia industry is booming high with 40% growth rate. There should be proper use of resource underdigital marketing with optimum scale.as plastic money is in trend now a days,the ladder of engagementhas shown the approaches to attach with the customers. The study has also revealed that in order toutilise the digital marketing in an effective way, the companies are required to design an effectiveplatform. Digital media is the best platform to convert a product to a brand.because it is more costeffective way through digital plateforms.Digital media is not only for engagement brand can increasetheir customers Digital platform helps to increase the of brand recall in target groups. I literally believethat this research report will help at the most useful for general marketers to understand the digitalmarketing and simply can plan all about digital marketing strategies.
REFRENCES[1.] www.betterthinkingsolution.com[2.] www.Quora.com[3.] www.ducttape.com[4.] http://journals.sagepub.com[5.] http://www.camfoundation.com[6.] https://www.techopedia.com[7.] http://www.businesszone.co.uk
National Conference on Emerging Trends in Science, Technology and Management, 11-12 Nov 2017, ISBN: 978-93-5281-325-4 Page 284
SECURITY ISSUES IN NETWORK VIRTUALIZATION:A REVIEWNavin Mani Upadhyay
Department of Computer Science & EngineeringIndian Institute of Technology, (BHU), Varanasi, UP, India
[email protected] Soni
Department of Computer Science & EngineeringAshoka Institute of Technology & Management, Varanasi
[email protected] Singh
Department of Computer Science & EngineeringAshoka Institute of Technology & Management, Varanasi
[email protected] Kumar Maurya
Department of Computer Science & EngineeringAshoka Institute of Technology & Management, Varanasi
Abstract- Network virtualization is a key technology that is necessary to support diverse protocolsuites in the future Internet. A virtualized network uses a single physical infrastructure tosupport multiple logical networks. Each logical network can provide its users with a custom setof protocols and functionalities. Much research work has focused on developing infrastructurecomponents that can provide some level of logical isolation between virtual networks. However,these systems often assume a somewhat cooperative environment where all networkinfrastructure providers, virtual network operators, and users collaborate. As this technologymatures and becomes more widely deployed, it is also important to consider the effects of andpossible defences against malicious operators and users. In this paper, we explore these securityissues in network virtualization. In particular, we systematically discuss the relationship betweenall entities and potential attacks to illustrate the importance of considering security issues in thedesign and implementation of virtualized networks. We also present several ideas on how toproceed toward the goal of secure network virtualization in the future Internet.
Keywords—Internet architecture, network security, network virtualization, network attacks, isolation.
1. INTRODUCTION
Future Internet architectures are currently being explored in the networking research community [1].While the current Internet has provided a very successful communication infras tructure, there areneeds for more security, support for large numbers of embedded and mobile devices, newcommunication paradigms, etc. For many of these new communication domains, specialized protocolsuites have been developed. Due to this specialization, it is not expected that a single protocol stack cansatisfy all the needs of a future Internet. Instead, it is necessary to develop a network architecture thatcan accommodate multiple, different protocol stacks in parallel.Network virtualization is a potential solution that uses a single physical infrastructure that is logicallyshared among multiple virtual networks [2], [3]. Virtual networks can be instantiated dynamically byallocating physical resources from the physical substrate to the virtual network. These resourcesinclude link bandwidth as well as processing resources on routers in order to perform protocolprocessing operations. Related work has explored algorithms for mapping (i.e., resource allocation) [4]and router designs to support virtualization [5], [6].One important aspect of network virtualization is that the three participating entities networkinfrastructure providers, virtual network operators, and users are independent and driven by differentobjectives. Thus, it cannot be assumed that they always cooperate to ensure all aspects of the virtualnetwork operate correctly and securely. Instead, each entity may behave in a non-cooperative ormalicious way to gain benefits. These kinds of attacks are to some extent differentfrom what can be observed in the current Internet since they involve a different kind of underlyingnetwork architecture. We therefore believe that it is important to explore these security issues since athorough understanding can help in developing secure network virtualization in the future Internet. Inthis paper, we discuss security issues in network virtualization. In particular, we explore what potentialattacks can be launched between each pair of participating entities.

National Conference on Emerging Trends in Science, Technology and Management, 11-12 Nov 2017, ISBN: 978-93-5281-325-4 Page 285
In this context, we discuss security requirements and attacker capabilities that underlie our work. Wealso discuss potential defence mechanisms. While we do not discuss any specific mechanism in detail,we provide an overview that can guide future research in this domain. The specific contributions of ourpaper are:
1. A detailed overview of security issues and vulnerabilities in the virtualized networkarchitecture. We discuss what potential attack scenarios may arise based on the maliciousactions by different entities.
2. A discussion of possible defence mechanisms that can address the challenges that arise indeveloping secure network virtualization. We point out that basic security properties, such asconfidentiality, integrity, and performance isolation can be implemented in virtual networksand thus help in achieving security.
We believe that our work points toward an interesting and important new area in network security. Theremainder of this paper is organized as follows. Section II discusses the related work. Section IIIelaborates the network virtualization entities and Section IV discusses the security issues in networkvirtualization, introducing the security model and attack scenarios for each entity in the architecture.Section V discusses possible defence mechanisms and Section VI concludes the paper.
2. R ELATED WORK
The idea of network virtualization was initially proposed in the context of networking test beds tofacilitate researchers to evaluate new ideas and test experiments/protocols in realistic scenarios [7][10].Virtualization in a shared tested proved to be successful in overcoming the limitations and complexitiesof individual physical tested. To facilitate new protocol innovations in the current Internet, the idea ofnetwork virtualization has been proposed as a fundamental design principle [2], [11]. In this context,[12] proposes an architecture that separates the roles of Internet Service Providers (ISPs) intoInfrastructure Providers (managing physical infrastructure) and Service Providers (runningcustomizable network protocols and services).Modern router designs that support network virtualization require an embedded packet processingplatform that can perform custom packet processing for virtual networks that are deployed at runtime,such as [5], [13], [14]. Packet processors in these systems are often implemented using embeddedmulticore network processors [15].Security issues in virtualized network architectures impose significant challenges and requires effectivesolutions. The problem of hosting network protocols and services on third party infrastructures raisesserious questions on the trustworthiness of the participating entities. Reference [16] shows the list ofISPs that introduce hidden traffic shaping techniques on peer-to-peer protocols. Such activities indicatethe requirement to examine security issues, when hosting virtual networks on the networkinfrastructures. Reference [17] discusses the requirement for accountability in the hosted virtualnetworks. Information leakage in virtualized network infrastructures are analogous to the cloudcomputing paradigm. Reference [18] shows a side channel attack that extracts secret information bytargeting co-hosted virtual machines using Amazon EC2 service. Reference [4] suggests a denial-of-service attack can be launched on the physical network that can bring down all hosted virtual networks.Our work, presents a systematicoverview of the security concerns in virtualized networks that arise between all participating entities.Allowing virtual networks to customize the allocated resources by introducing programmability canlead to the introduction of malicious code on the router [19]. Solutions to this problem have beenproposed using techniques from embedded system security [20]. Our work does not discuss thesespecific issues, but looks at security issues that can also arise during normal (i.e., non-malicious)operation of virtualized networks.
3. N ETWORK VIRTUALIZATION
Network virtualization enables multiple logical networks to share the physical resources of theunderlying network infrastructure. This network model introduces flexibility to the Internet ossificationby separating the network architecture functionalities into the following entities:• Network Infrastructure (NI): provides the physical components required to setup the network (e.g.,routers and links). NI efficiently allocates the required network bandwidth and physical resources(device CPU and memory) for each virtual network, ensuring proper resource isolation between them.• Virtual Networks (VN): deploy customizable network protocols by leasing the required infrastructureresources from multiple NIs. Each virtual network is a combination of multiple virtual routers andlinks. When initiating a service, the VN confines to the Service Level Agreements(SLA) with set of NIs and receives the requested resources. Each VN then instantiates the service (e.g.,novel network protocol) on the allocated resources to form a virtual network topology by connecting
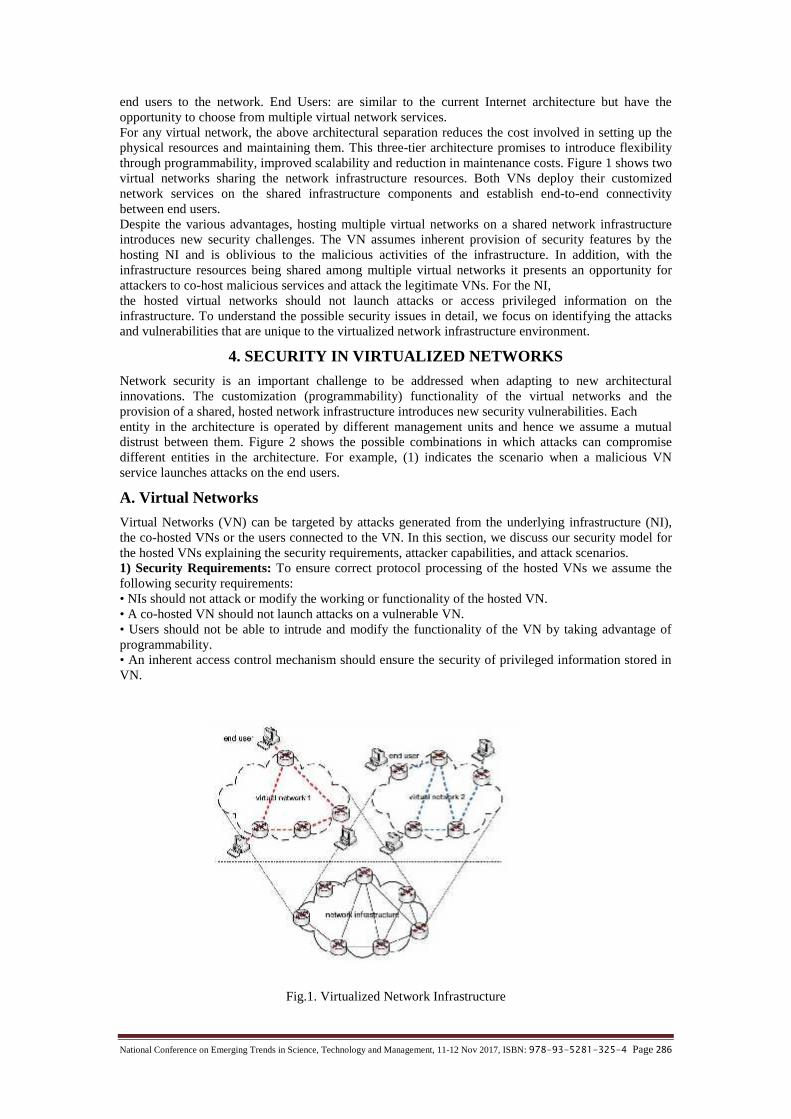
National Conference on Emerging Trends in Science, Technology and Management, 11-12 Nov 2017, ISBN: 978-93-5281-325-4 Page 286
end users to the network. End Users: are similar to the current Internet architecture but have theopportunity to choose from multiple virtual network services.For any virtual network, the above architectural separation reduces the cost involved in setting up thephysical resources and maintaining them. This three-tier architecture promises to introduce flexibilitythrough programmability, improved scalability and reduction in maintenance costs. Figure 1 shows twovirtual networks sharing the network infrastructure resources. Both VNs deploy their customizednetwork services on the shared infrastructure components and establish end-to-end connectivitybetween end users.Despite the various advantages, hosting multiple virtual networks on a shared network infrastructureintroduces new security challenges. The VN assumes inherent provision of security features by thehosting NI and is oblivious to the malicious activities of the infrastructure. In addition, with theinfrastructure resources being shared among multiple virtual networks it presents an opportunity forattackers to co-host malicious services and attack the legitimate VNs. For the NI,the hosted virtual networks should not launch attacks or access privileged information on theinfrastructure. To understand the possible security issues in detail, we focus on identifying the attacksand vulnerabilities that are unique to the virtualized network infrastructure environment.
4. SECURITY IN VIRTUALIZED NETWORKS
Network security is an important challenge to be addressed when adapting to new architecturalinnovations. The customization (programmability) functionality of the virtual networks and theprovision of a shared, hosted network infrastructure introduces new security vulnerabilities. Eachentity in the architecture is operated by different management units and hence we assume a mutualdistrust between them. Figure 2 shows the possible combinations in which attacks can compromisedifferent entities in the architecture. For example, (1) indicates the scenario when a malicious VNservice launches attacks on the end users.
A. Virtual Networks
Virtual Networks (VN) can be targeted by attacks generated from the underlying infrastructure (NI),the co-hosted VNs or the users connected to the VN. In this section, we discuss our security model forthe hosted VNs explaining the security requirements, attacker capabilities, and attack scenarios.1) Security Requirements: To ensure correct protocol processing of the hosted VNs we assume thefollowing security requirements:• NIs should not attack or modify the working or functionality of the hosted VN.• A co-hosted VN should not launch attacks on a vulnerable VN.• Users should not be able to intrude and modify the functionality of the VN by taking advantage ofprogrammability.• An inherent access control mechanism should ensure the security of privileged information stored inVN.
Fig.1. Virtualized Network Infrastructure
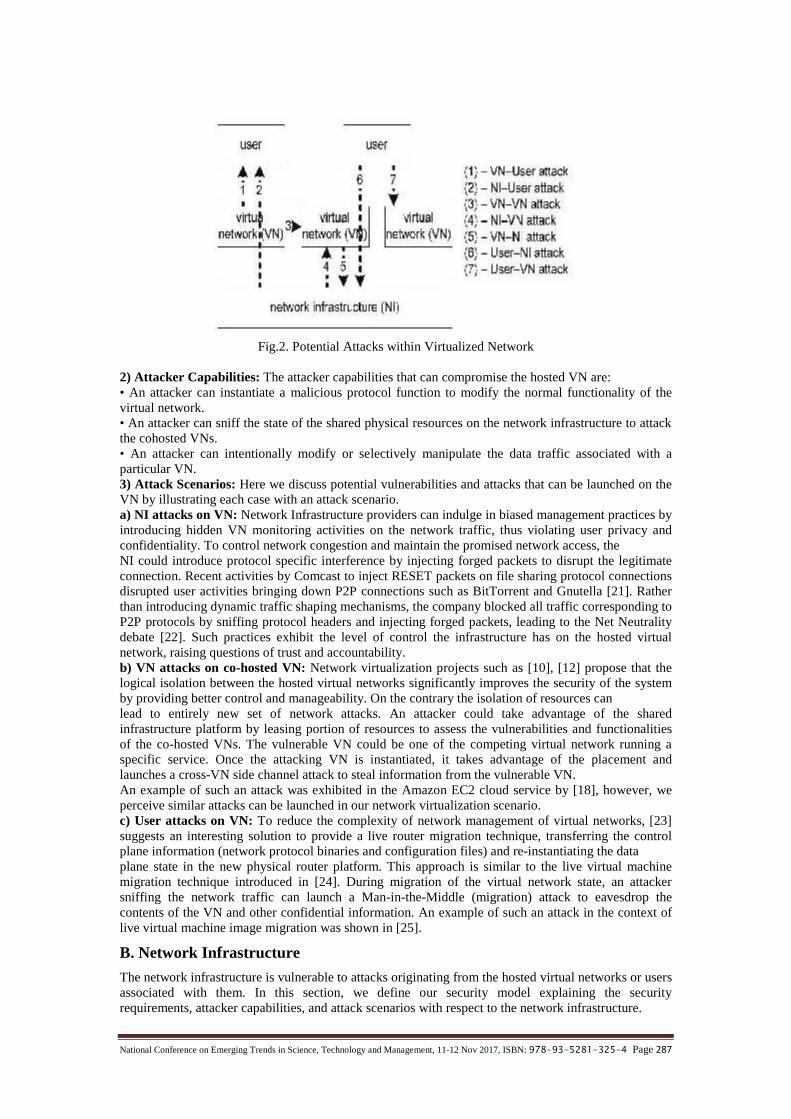
National Conference on Emerging Trends in Science, Technology and Management, 11-12 Nov 2017, ISBN: 978-93-5281-325-4 Page 287
Fig.2. Potential Attacks within Virtualized Network
2) Attacker Capabilities: The attacker capabilities that can compromise the hosted VN are:• An attacker can instantiate a malicious protocol function to modify the normal functionality of thevirtual network.• An attacker can sniff the state of the shared physical resources on the network infrastructure to attackthe cohosted VNs.• An attacker can intentionally modify or selectively manipulate the data traffic associated with aparticular VN.3) Attack Scenarios: Here we discuss potential vulnerabilities and attacks that can be launched on theVN by illustrating each case with an attack scenario.a) NI attacks on VN: Network Infrastructure providers can indulge in biased management practices byintroducing hidden VN monitoring activities on the network traffic, thus violating user privacy andconfidentiality. To control network congestion and maintain the promised network access, theNI could introduce protocol specific interference by injecting forged packets to disrupt the legitimateconnection. Recent activities by Comcast to inject RESET packets on file sharing protocol connectionsdisrupted user activities bringing down P2P connections such as BitTorrent and Gnutella [21]. Ratherthan introducing dynamic traffic shaping mechanisms, the company blocked all traffic corresponding toP2P protocols by sniffing protocol headers and injecting forged packets, leading to the Net Neutralitydebate [22]. Such practices exhibit the level of control the infrastructure has on the hosted virtualnetwork, raising questions of trust and accountability.b) VN attacks on co-hosted VN: Network virtualization projects such as [10], [12] propose that thelogical isolation between the hosted virtual networks significantly improves the security of the systemby providing better control and manageability. On the contrary the isolation of resources canlead to entirely new set of network attacks. An attacker could take advantage of the sharedinfrastructure platform by leasing portion of resources to assess the vulnerabilities and functionalitiesof the co-hosted VNs. The vulnerable VN could be one of the competing virtual network running aspecific service. Once the attacking VN is instantiated, it takes advantage of the placement andlaunches a cross-VN side channel attack to steal information from the vulnerable VN.An example of such an attack was exhibited in the Amazon EC2 cloud service by [18], however, weperceive similar attacks can be launched in our network virtualization scenario.c) User attacks on VN: To reduce the complexity of network management of virtual networks, [23]suggests an interesting solution to provide a live router migration technique, transferring the controlplane information (network protocol binaries and configuration files) and re-instantiating the dataplane state in the new physical router platform. This approach is similar to the live virtual machinemigration technique introduced in [24]. During migration of the virtual network state, an attackersniffing the network traffic can launch a Man-in-the-Middle (migration) attack to eavesdrop thecontents of the VN and other confidential information. An example of such an attack in the context oflive virtual machine image migration was shown in [25].
B. Network Infrastructure
The network infrastructure is vulnerable to attacks originating from the hosted virtual networks or usersassociated with them. In this section, we define our security model explaining the securityrequirements, attacker capabilities, and attack scenarios with respect to the network infrastructure.

National Conference on Emerging Trends in Science, Technology and Management, 11-12 Nov 2017, ISBN: 978-93-5281-325-4 Page 288
1) Security Requirements: For a correct functioning of the network infrastructure we assume thefollowing security requirements:•The hosted VN should not tamper with the allocated NI resources to gain control of the infrastructure.•NI should ensure complete isolation of physical and network resources between co-hosted virtualnetworks.•Legitimate traffic should be processed without any interference, while malicious network trafficshould be inferred and discarded.•NI should support effective access control mechanism to protect from extraction of secret informationstored in the infrastructure.2) Attacker Capabilities: The following attacker capabilities define the possible attack scenarios thatcan be launched on the network infrastructure:•An attacker can send arbitrary data and control packets to flood the network and bring down the NI.•An attacker can assess the vulnerabilities of the infrastructure from the allocated resources to intrudeand take control of the entire infrastructure.•An attacker cannot physically access the equipments but can initiate remote based attacks.3) Attack Scenarios: The following attack scenarios exhibit the vulnerabilities in the networkinfrastructures:a) User attacks on NI: Virtual network providers require flexibility in customizing their service.Modern routers use general purpose programmable packet processors that allow reprogramming therouter functionality [26]. This feature however introduces new vulnerabilities threatening tocompromise the entire network infrastructure. With the introduction of programmability in packetprocessors, code exploits such as buffer overflows, integer vulnerabilities can introduce varioussecurity issues. An attacker could inject a data packet that takes advantage of the code vulnerability ofthe hosted virtual network and modify the operation of the packet processor leading to a denial-of-service attack. This scenario is specific to the customization functionality introduced by the virtualnetwork that compromises the NI. Hence a secure programming paradigm is required wheninstantiating the virtual network service by the network infrastructure.b) VN attacks on NI: A malicious VN can be motivated to attack the infrastructure to disrupt theservices hosted by a competing VN. The hosted platform gives extra opportunity to asses thevulnerabilities of the infrastructure and launch a flooding attack on the network and physical resourcesof NI that brings down the entire infrastructure, eventually breaking the co-hosted VN. Anotherscenario is when the attacker wishes to reproduce some hosted VN service, can manipulatethe configurations of NI by extracting secret information and eavesdrop on the hosted VN traffic. Anexample could be a live video streaming service that can be eavesdropped, reproduced and redirectedto a set of unauthorized users.
C. Users
Various network security issues and related defence mechanisms have been proposed to protect endsystems. However, in this work we focus on attacks originating from a malicious virtual network orfrom a vulnerable network infrastructure that compromises the end user.1) Security Requirements: The basic security requirement for end users is to ensure that attacksshould not modify the working of the end-system. End users should be able to identify and discardattack traffic.2) Attacker Capabilities: The following attacker capabilities define the possible attack scenarios thatcan be launched on the end users:• An attacker can send attack packets to compromise or modify a specific functionality on the endsystem.• An attacker can launch a flooding attack to send continuous network traffic and throttle the networkbandwidth of the end user disrupting access to legitimate network service.• An attacker cannot physically access the end system but can initiate remote based attacks.3) Attack Scenarios:a) NI attacks on User: A compromised network infrastructure can selectively drop/modify packetsbelonging to particular sender or group of senders. The attacker could choose to drop a packet within aparticular time window, thereby forcing the sender to reduce their sending rate as they perceivecongestion. The attacker could selectively drop queued packets exploiting congestion control protocolat the senders. The VN and the sender are completely unaware of the malicious activity of the NI andhence are subjected to reduced quality of service provision.b) VN attacks on User: A VN exploiter with malicious intent can intentionally sniff or monitor theend user network traffic. This monitoring could impose more financial constraints on the end users byraising false alarms, increasing extra financial charges. This provides an opportunity for the
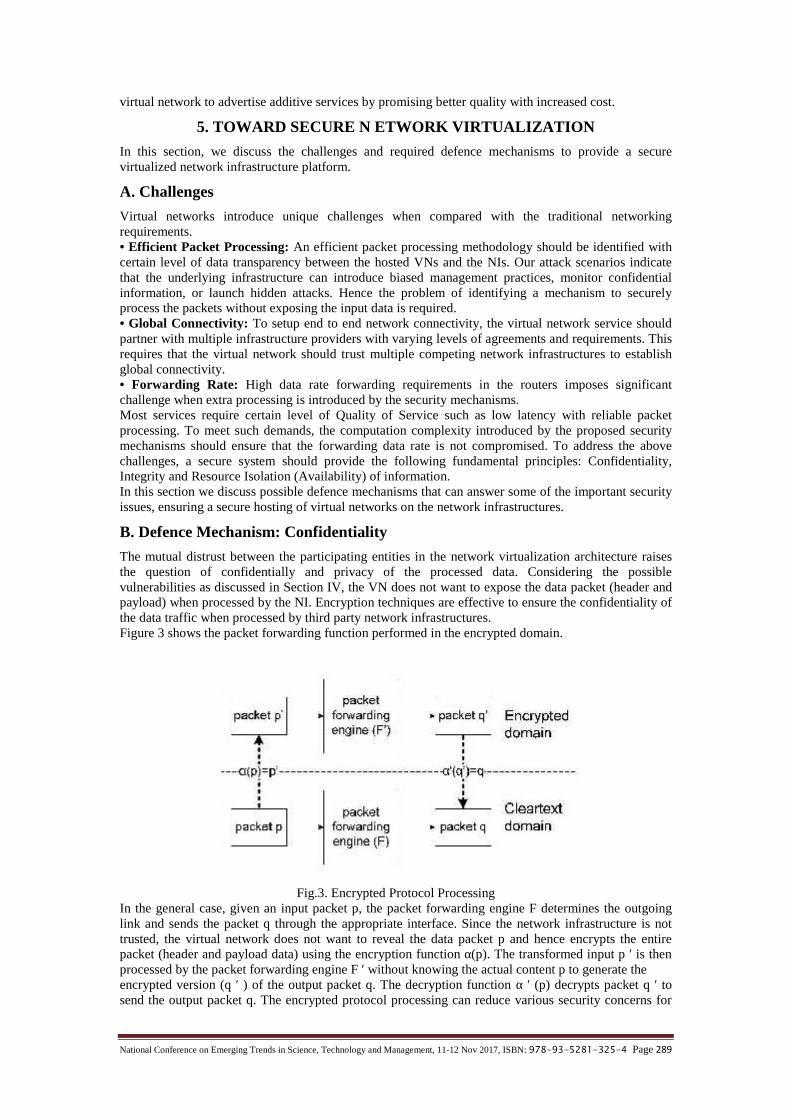
National Conference on Emerging Trends in Science, Technology and Management, 11-12 Nov 2017, ISBN: 978-93-5281-325-4 Page 289
virtual network to advertise additive services by promising better quality with increased cost.
5. TOWARD SECURE N ETWORK VIRTUALIZATION
In this section, we discuss the challenges and required defence mechanisms to provide a securevirtualized network infrastructure platform.
A. Challenges
Virtual networks introduce unique challenges when compared with the traditional networkingrequirements.• Efficient Packet Processing: An efficient packet processing methodology should be identified withcertain level of data transparency between the hosted VNs and the NIs. Our attack scenarios indicatethat the underlying infrastructure can introduce biased management practices, monitor confidentialinformation, or launch hidden attacks. Hence the problem of identifying a mechanism to securelyprocess the packets without exposing the input data is required.• Global Connectivity: To setup end to end network connectivity, the virtual network service shouldpartner with multiple infrastructure providers with varying levels of agreements and requirements. Thisrequires that the virtual network should trust multiple competing network infrastructures to establishglobal connectivity.• Forwarding Rate: High data rate forwarding requirements in the routers imposes significantchallenge when extra processing is introduced by the security mechanisms.Most services require certain level of Quality of Service such as low latency with reliable packetprocessing. To meet such demands, the computation complexity introduced by the proposed securitymechanisms should ensure that the forwarding data rate is not compromised. To address the abovechallenges, a secure system should provide the following fundamental principles: Confidentiality,Integrity and Resource Isolation (Availability) of information.In this section we discuss possible defence mechanisms that can answer some of the important securityissues, ensuring a secure hosting of virtual networks on the network infrastructures.
B. Defence Mechanism: Confidentiality
The mutual distrust between the participating entities in the network virtualization architecture raisesthe question of confidentially and privacy of the processed data. Considering the possiblevulnerabilities as discussed in Section IV, the VN does not want to expose the data packet (header andpayload) when processed by the NI. Encryption techniques are effective to ensure the confidentiality ofthe data traffic when processed by third party network infrastructures.Figure 3 shows the packet forwarding function performed in the encrypted domain.
Fig.3. Encrypted Protocol ProcessingIn the general case, given an input packet p, the packet forwarding engine F determines the outgoinglink and sends the packet q through the appropriate interface. Since the network infrastructure is nottrusted, the virtual network does not want to reveal the data packet p and hence encrypts the entirepacket (header and payload data) using the encryption function α(p). The transformed input p ′ is thenprocessed by the packet forwarding engine F ′ without knowing the actual content p to generate theencrypted version (q ′ ) of the output packet q. The decryption function α ′ (p) decrypts packet q ′ tosend the output packet q. The encrypted protocol processing can reduce various security concerns for

National Conference on Emerging Trends in Science, Technology and Management, 11-12 Nov 2017, ISBN: 978-93-5281-325-4 Page 290
the virtual network without revealing the underlying processed data. However, the important challengeis to identify a mechanism that can support the processing of input data in the encrypted domain.Specifically, the processing technique should include the following features:1. An efficient encryption process that encrypts all incoming data with low latency requirements.2. An encrypted processing function that supports all processing features required by the hosted
virtual networks.The following defence mechanisms propose possible solutions to ensures data confidentiality andprivacy. Secure tunnelling protocol techniques provide the required confidentiality of the data byencapsulating the packet payload. Message Stream Encryption (MSE) protocol obfuscates the headerand payload data to ensure the provision of confidentiality and authentication. To avoid biasedmanagement practices by ISPs, BitTorrent protocol versions introduced MSE based protocolencryption that enhances privacy and confidentiality [27]. However, [28] shows various potentialvulnerabilities that can compromise the working of the MSE protocol. Hence, an efficient protocolprocessing solution that satisfies the requirements of the virtual networks and resistant to attacksis required. Recently, Fully Homomorphic Encryption (FHE) (supports both addition andmultiplication) has theoretically proved to process the data in the encrypted domain without decryptingthe input data [29]. All processing functions are performed in the encrypted domain and hence theinfrastructure is completely oblivious to the data being processed. However, the practical feasibility ofthe FHE technique to satisfy protocol processing requirements and challenges are unclear.
6. SUMMARY AND CONCLUSION
Network virtualization has received significant attention in recent years. We argue that it is importantto consider the security issues and vulnerabilities in the virtualized networks since their architecture isfundamentally different from the current Internet. Our work has identified potential attacks andpresented some initial ideas on how to develop suitable defence mechanism. We believe that theseobservations provide an important first step toward a more detailed understanding of solutions tosecure network virtualization in the future Internet.
REFERENCES
[1.] A. Feldmann, “Internet clean-slate design: what and why?” SIGCOMM Computer CommunicationReview, vol. 37, no. 3, pp. 59–64, Jul. 2007.
[2.] T. Anderson, L. Peterson, S. Shenker, and J. Turner, “Overcoming the Internet impasse throughvirtualization,” Computer, vol. 38, no. 4, pp. 34–41, Apr. 2005.
[3.] J. S. Turner, “A proposed architecture for the GENI backbone platform,” in Proc. of ACM/IEEESymposium on Architectures for Networking and Communication Systems (ANCS), San Jose, CA, Dec.2006, pp. 1–10.
[4.] N. M. M. K. Chowdhury and R. Boutaba, “A survey of network virtualization,” Computer Networks,vol. 54, no. 5, pp. 862–876, Apr. 2010.
[5.] B. Anwer, M. Motiwala, M. b. Tariq, and N. Feamster, “SwitchBlade: a platform for rapid deploymentof network protocols on programmable hardware,” in Proceedings of the Conference on Applications,technologies, architectures, and protocols for computer communications (SIGCOMM), New Delhi,India, Sep. 2010, pp. 183–194.
[6.] Q. Wu, S. Shanbhag, and T. Wolf, “Fair multithreading on packet processors for scalable networkvirtualization,” in Proc. of ACM/IEEE Symposium on Architectures for Networking andCommunication Systems (ANCS), San Diego, CA, Oct. 2010.
[7.] Global Environment for Network Innovation, National Science Foundation, http://www.geni.net/.[8.] An open platform for developing, deploying, and accessing planetaryscale services, Planetlab
Consortium, http://www.planet-lab.org/.[9.] Network Emulation Testbed, University of Utah, http://www.emulab.net/.[10.] A. Bavier, N. Feamster, M. Huang, L. Peterson, and J. Rexford, “In VINI veritas: realistic and controlled
network experimentation,” in SIGCOMM ’06: Proceedings of the 2006 Conference on Applications,Technologies, Architectures, and Protocols for Computer Communications, Pisa, Italy, Aug. 2006, pp.3–14.
[11.] J. S. Turner and D. E. Taylor, “Diversifying the Internet,” in Proc. Of IEEE Global CommunicationsConference (GLOBECOM), vol. 2, Saint Louis, MO, Nov. 2005.
[12.] N. Feamster, L. Gao, and J. Rexford, “How to lease the Internet in your spare time,” SIGCOMMComputer Communication Review, vol. 37, Jan. 2007.
[13.] J. S. Turner, P. Crowley, J. DeHart, A. Freestone, B. Heller, F. Kuhns, S. Kumar, J. Lockwood, J. Lu, M.Wilson, C. Wiseman, and D. Zar, “Supercharging PlanetLab: a high performance, multi-application,overlay network platform,” in SIGCOMM ’07: Proceedings of the 2007 conference on Applications,technologies, architectures, and protocols for computer communications, Kyoto, Japan, Aug. 2007, pp.85–96.

National Conference on Emerging Trends in Science, Technology and Management, 11-12 Nov 2017, ISBN: 978-93-5281-325-4 Page 291
[14.] D. Yin, D. Unnikrishnan, Y. Liao, L. Gao, and R. Tessier, “Customizing virtual networks with partialfpga reconfiguration,” SIGCOMM Computer Communication Review, vol. 41, pp. 125–132, Jan. 2011.
[15.] T. Wolf, “Challenges and applications for network-processor-based programmable routers,” in Proc. ofIEEE Sarnoff Symposium, Princeton, NJ, Mar. 2006.
[16.] Bad ISPs, VUZE, http://wiki.vuze.com/w/Bad ISPs.[17.] E. Keller, R. B. Lee, and J. Rexford, “Accountability in hosted virtual networks,” in Proc. of the First
ACM SIGCOMM Workshop on Virtualized Infrastructure Systems and Architectures (VISA), ser. VISA’09, Barcelona, Spain, Aug. 2009, pp. 29–36.
[18.] T. Ristenpart, E. Tromer, H. Shacham, and S. Savage, “Hey, you, get off of my cloud: exploringinformation leakage in third-party compute clouds,” in Proceedings of the 16th ACM conference onComputer and communications security, ser. CCS ’09. New York, NY, USA: ACM, 2009, pp. 199–212.[Online]. Available: http://doi.acm.org/10.1145/1653662.1653687.
[19.] D. Chasaki, Q. Wu, and T. Wolf, “Attacks on network infrastructure,” in Proc. of Twentieth IEEEInternational Conference on Computer Communications and Networks (ICCCN), Maui, HI, Aug. 2011.
[20.] D. Chasaki and T. Wolf, “Design of a secure packet processor,” in Proc. of ACM/IEEE Symposium onArchitectures for Networking and Communication Systems (ANCS), San Diego, CA, Oct. 2010.
[21.] FCC Rules Against Comcast for BitTorrent Blocking, Electronic Frontier Foundation,http://www.eff.org/deeplinks/2008/08/ fcc-rules-against-comcast-bit-torrent-blocking.
[22.] E. Felten, Three Flavors of Net Neutrality, https://http://www.freedom-to-tinker.com/blog/felten/three-flavors-net-neutrality.
[23.] Y. Wang, E. Keller, B. Biskeborn, J. van der Merwe, and J. Rexford, “Virtual routers on the move: liverouter migration as a network-management primitive,” SIGCOMM Comput. Commun.
[24.] Rev., vol. 38, pp. 231–242, August 2008. [Online]. Available:http://doi.acm.org/10.1145/1402946.1402985.
[25.] C. Clark, K. Fraser, S. Hand, J. G. Hansen, E. Jul, C. Limpach, I. Pratt, and A. Warfield, “Live migrationof virtual machines,” in Proceedings of the 2nd conference on Symposium on Networked SystemsDesign & Implementation - Volume 2, ser. NSDI’05. Berkeley, CA, USA: USENIX Association, 2005,pp. 273–286. [Online]. Available: http://portal.acm.org/citation.cfm?id=1251203.1251223.
[26.] J. Oberheide, E. Cooke, and F. Jahanian, “Exploiting Live Virtual Machine Migration,” in BlackHat DCBriefings, Washington DC, February 2008.
[27.] W. Eatherton, “The push of network processing to the top of the pyramid,” in Keynote Presentation atACM/IEEE Symposium on Architectures for Networking and Communication Systems (ANCS),Princeton, NJ, Oct. 2005.
[28.] Message Stream Encryption, VUZE, http://wiki.vuze.com/w/Message Stream Encryption.[29.] B. B. Brumley and J. Valkonen, “Attacks on message stream encryption,” in Proceedings of the 13th
Nordic Workshop on Secure IT Systems NordSec ’08, H. R. Nielson and C. W. Probst, Eds., October2008, pp. 163–173.
[30.] C. Gentry, “Fully homomorphic encryption using ideal lattices,” in Proceedings of the 41st annual ACMsymposium on Theory of computing, ser. STOC ’09. New York, NY, USA: ACM, 2009, pp. 169178.[Online]. Available: http://doi.acm.org/10.1145/1536414.1536440.
[31.] Navin Mani Upadhyay, Gunjan Mittal, Suman K. Saurabh, P. K. Gupta, “CREATION OF VIRTUALNODE, VIRTUAL LINK AND MANAGING THEM IN NETWORK VIRTUALIZATION.” in WorldCongress on Information and Communication Technologies (WICT-2011) IEEE Conference, 11-14 thDecember, 2011, University of Mumbai, Mumbai, India. http://ieeexplore.ieee.org/document/6141338/.
[32.] Navin Mani Upadhyay, Kunal Gaurav and S.K.Saurabh, Kalpi Institute of Technology, Ambala,Haryana, India. “Security in Network Virtualization Concept and Challenges: A SURVEY” in NationalConference on Recent Trends in Computer Science in Global Scenario (NCRTCSGS), 23 rd Feb, 2013.
[33.] Navin Mani Upadhyay, Kumari Soni and Arvind Kumar “Security Management in NetworkVisualization Environment by using modified root management algorithm for Creation of Virtual Nodeand Virtual Link” in International Journal of Computer Application (IJCA), USA, (0975 – 8887),Volume 162 – No 6, March 2017. http://www.ijcaonline.org/archives/volume162/number6/27250-2017913367
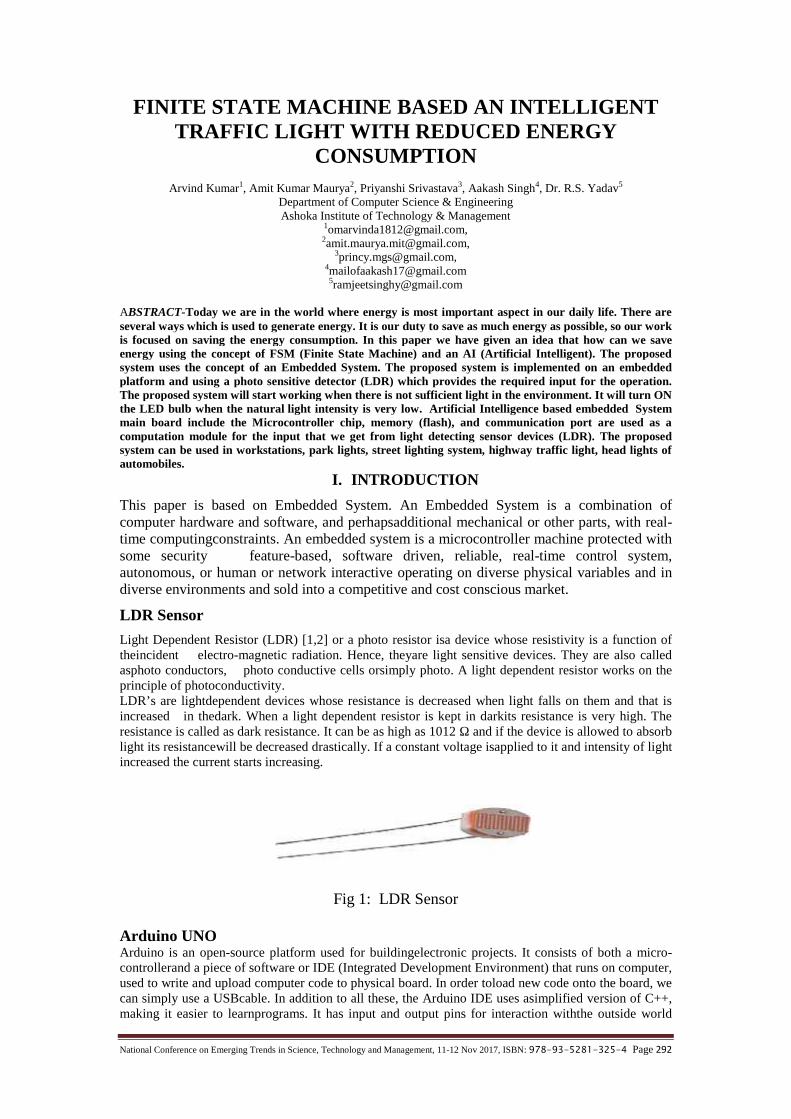
National Conference on Emerging Trends in Science, Technology and Management, 11-12 Nov 2017, ISBN: 978-93-5281-325-4 Page 292
FINITE STATE MACHINE BASED AN INTELLIGENTTRAFFIC LIGHT WITH REDUCED ENERGY
CONSUMPTIONArvind Kumar1, Amit Kumar Maurya2, Priyanshi Srivastava3, Aakash Singh4, Dr. R.S. Yadav5
Department of Computer Science & EngineeringAshoka Institute of Technology & Management
[email protected],[email protected],
[email protected],[email protected]@gmail.com
ABSTRACT-Today we are in the world where energy is most important aspect in our daily life. There areseveral ways which is used to generate energy. It is our duty to save as much energy as possible, so our workis focused on saving the energy consumption. In this paper we have given an idea that how can we saveenergy using the concept of FSM (Finite State Machine) and an AI (Artificial Intelligent). The proposedsystem uses the concept of an Embedded System. The proposed system is implemented on an embeddedplatform and using a photo sensitive detector (LDR) which provides the required input for the operation.The proposed system will start working when there is not sufficient light in the environment. It will turn ONthe LED bulb when the natural light intensity is very low. Artificial Intelligence based embedded Systemmain board include the Microcontroller chip, memory (flash), and communication port are used as acomputation module for the input that we get from light detecting sensor devices (LDR). The proposedsystem can be used in workstations, park lights, street lighting system, highway traffic light, head lights ofautomobiles.
I. INTRODUCTION
This paper is based on Embedded System. An Embedded System is a combination ofcomputer hardware and software, and perhapsadditional mechanical or other parts, with real-time computingconstraints. An embedded system is a microcontroller machine protected withsome security feature-based, software driven, reliable, real-time control system,autonomous, or human or network interactive operating on diverse physical variables and indiverse environments and sold into a competitive and cost conscious market.
LDR Sensor
Light Dependent Resistor (LDR) [1,2] or a photo resistor isa device whose resistivity is a function oftheincident electro-magnetic radiation. Hence, theyare light sensitive devices. They are also calledasphoto conductors, photo conductive cells orsimply photo. A light dependent resistor works on theprinciple of photoconductivity.LDR’s are lightdependent devices whose resistance is decreased when light falls on them and that isincreased in thedark. When a light dependent resistor is kept in darkits resistance is very high. Theresistance is called as dark resistance. It can be as high as 1012 Ω and if the device is allowed to absorblight its resistancewill be decreased drastically. If a constant voltage isapplied to it and intensity of lightincreased the current starts increasing.
Fig 1: LDR Sensor
Arduino UNOArduino is an open-source platform used for buildingelectronic projects. It consists of both a micro-controllerand a piece of software or IDE (Integrated Development Environment) that runs on computer,used to write and upload computer code to physical board. In order toload new code onto the board, wecan simply use a USBcable. In addition to all these, the Arduino IDE uses asimplified version of C++,making it easier to learnprograms. It has input and output pins for interaction withthe outside world

National Conference on Emerging Trends in Science, Technology and Management, 11-12 Nov 2017, ISBN: 978-93-5281-325-4 Page 293
such as with sensors, switches, motors and so on. It has 14 digital input/output pins, 6 analoginputs, a16 MHz quartz crystal, a USB connection,a power jack, an ICSP header and a reset button. Itcontainseverything needed to support the micro-controller.It can take supply through USB or we canpower itwith an AC-to-DC adapter or a battery. Arduino acts as the processing module of thesystem. It takesinput from the LDR, processes thedata and gives the output to LED’s directly or through a relay and atransistor mechanism.
Fig 2: Arduino UNO
II. PROPOSED SYSTEM
In this system the power consumption and cost effectiveness is the most important consideration in thefield of electronics and electrical for consuming power, all the intelligent traffic lights in the city arereplaced by LEDs which requires less power. These LED’s are controlled by LDR sensor which willsense the light of vehicle and make the an intelligent traffic light ON When the vehicle is passedthrough a particular LED , that LED will get ON and the previous LED will get OFF.This system is also simulated with Visual Studio in which the description of each LED is described andthe time at which LED is ON or OFF. So, with the help of this time we can analyze the energyconsumption and energy savings.Our system is represented by finite state automata.Finite state machine–a) FSM of An intelligent traffic lightFinite state machine [6, 7, 8] of an intelligent traffic light [2] consist of two states:
1. Off state (which is initial state)2. On state.In this machine, initially when the LDR sensor [1] detect vehicle the machine will change its statei.e. on state and an intelligent traffic light will start glowing. Initially when the machine will notdetect the vehicle, then it remain on the same state i.e. off state. The intelligent traffic light will notglow. When the machine is in on state and LDR detect vehicle then it will remain on the same stateand the intelligent traffic light will start glowing. Again the machine is in ON state and LDR will notdetect vehicle then it will change its state to off. i.e. the intelligent traffic light will not glow.
Fig 3: FSM of An intelligent traffic light
b) FSM of LDR Sensor
Finite state machine ofLDRsensor [1] consist of two states:1. Passive state (initial state).2. Active state. When the machine is in passive state, and LDR detect [3,4] vehicle then LDR get active
i.e. it will change its state and initially it will remain on initial state i.e. passive statewhen LDR will not detect any vehicle.
When the machine is in active state and LDR detect vehicle then it will remain on same

National Conference on Emerging Trends in Science, Technology and Management, 11-12 Nov 2017, ISBN: 978-93-5281-325-4 Page 294
state i.e. active state. Being on the active state when no vehicle is passed i.e. LDR not detected any vehicle, the
machine change its state to passive state.
Fig 4: FSM of LDR Sensor
Energy Savings Using Proposed Model-The below example is the result of simulation done on the Microsoft Visual Studio Tool.Let say there are 10 LED’s bulbs on a highway and each bulb consuming 50 W of energy per hour thenas per existing system:So by unitary method-
If 1 Bulb turns ON for 60 minutes then itwill take 50 W powersSo in 1 minute 50 / 60 =0.833 WSince 1 LED is consuming 50 W in 60 minutes
So, 10 LEDs are consuming 500 W in 60 minutesAnd 10 LED will consume 8.33 W in 1 min MinutesSuppose from the proposed system each LED will glow for 35 minutes in an hour.
Flow Chart of Proposed Model
Fig 5: Flow Chart of Proposed ModelSo total energy consumed by 1 LED from the proposed system is:-For one LED:-If 1 LED Bulb turns ON for 60 minutes then it will take 50 W.So in 1 minute 50 / 60 =0.833 W

National Conference on Emerging Trends in Science, Technology and Management, 11-12 Nov 2017, ISBN: 978-93-5281-325-4 Page 295
Now 1 LED Bulb turn ON for 35 minutes as per the proposed system then it will consume= 0.833*35=29.155 W
Since, 1 LED consumes =29.155WSo, 10 LED in 35 minutes will consume
= 29.155*10= 291.55 W
Total energy saved as per the proposed system by10 LED’s as compared to existing system:-= 500 W –291.55W =208.45 WEnergy saved in percentage (%)
= 208.45 * 100 / 500= 41.69 %
Fig 6: Energy Savings with pie chart
III. COMPARATIVE STUDY
The proposed system is better than the previoussystems because of the following reasons. It eliminates the use of man power. It works automatically, i.e., on the basisof the intensity of light in theatmosphere. The intensity of light is automaticallyadjusted, i.e., the lights will glowbrighter when there is no
light or avehicle is detected. Also, it will glow atlower intensity when no vehicle is detected.And it will turn offautomatically when there is proper lighting condition.
The proposed system consumes considerable less power than the previous systems. Also, the system is cost effective in terms ofprevious systems. This system is also simulated with Visual Studioin which the descriptions of each LED have
been described.IV. CONCLUSION
From the proposed model it is observed that by using the concept of an intelligentsystem, the energy could be conserved by huge amount and so is the cost of energyconsumption. The above system could also be built by using other sensors like IR etc.
REFERENCES[1] Tran, Duong, AndYen Kheng Tan. "SensorlessIllumination Control ofA Networked LED-Lighting System
Using Feed Forward Neural Network." Industrial Electronics, IEEE Transactions On 61.4
[2] B.K.Subramanyam, K.Bhaskar Reddy, P. Ajay Kumar Reddy “DesignAnd Development of IntelligentWireless An intelligent traffic light Control And Monitoring System Along With GUI”
[3] M. A. Wazed, N. Nafis, M. T. Islam “Design And Fabrication ofAn intelligent traffic light ControlSystem”, Vol. 5, No. 1, June 2010
[4] Wireless Streetlight Control System, Deepak Kapgate, G.H. Raisoni College Of Engineering, NagpurUniversity, International Journal Of Computer Applications (0975 –8887),Volume 41– No.2, March 2012
[5] An intelligent traffic light Glow On Detecting Vechile Movement Using Sensor S. Suganya, R. Sinduja, T.Sowmiya& S. Senthilkumar
[6] “An Introduction To Formal Languages And Automata” By Peter Linz

National Conference on Emerging Trends in Science, Technology and Management, 11-12 Nov 2017, ISBN: 978-93-5281-325-4 Page 296
[7] “Introduction To The Theory Of Computation“ By Michael Sipser[8] “Introduction To Automata Theory, Languages, And Computation (3rd Edition)” By John E. Hopcroft,
Rajeev MotwaniAnd Jeffrey D. Ullman

National Conference on Emerging Trends in Science, Technology and Management, 11-12 Nov 2017, ISBN: 978-93-5281-325-4 Page 297
FILTERING OF OPTIMAL POWER SAVING ROUTINGPROTOCOLS IN MOBILE ADHOC NETWORK: A
COMPARATIVE STUDYKm Soni Ojha1, Juli Singh2, Navin Mani Upadhyay3,
Saloni Singh4, Vivek kr. Srivastava5
Department of Computer Science & EngineeringAshoka Institute of Technology & Management
[email protected]@gmail.com
[email protected]@gmail.com
Abstract-Mobile adhoc networks (MANET) represent distributed systems that consist of wireless mobilenodes that can freely and dynamically organize itself into temporary adhoc network topologies. A mobileadhoc network is a collection of nodes that is connected through a wireless medium forming rapidlychanging topologies. MANETS are infrastructure less and can be set up anytime, anywhere. We comparedthe power consumption behaviour of three routing protocols viz, Adhoc On Demand Distance Vector(AODV) , Dynamic Source Routing (DSR) and the Destination Sequenced Distance Vector Routing(DSDV) with respect to energy consumption. We analyse these routing protocols by extensive simulations inns-2 simulator and show that how pause time affect their performance. This Paper studies about theperformance which is measured in terms of Average Remaining Energy, Average Consumed Energy andNetwork Life Time.
Keywords: Mobile AdHoc Networks (MANET); Demand Distance Vector (AODV); Dynamic Source Routing(DSR); Destination Sequenced Distance Vector Routing (DSDV); Performance Matrix.
1. INTRODUCTION
In MANET, each node acts both as a router and as a host and even the topology of network may alsochange rapidly. These types of networks assume existence of no fixed infrastructure[1]. TheCommunication in MANET takes place by using multi-hop paths. The density of nodes and the numberof nodes are depends on the applications in which it is being used. The mobile hosts can moverandomly and can be turned on or off without notifying other hosts. If two wireless hosts are out oftheir transmission ranges in the ad hoc networks, other mobile hosts placed between them can forwardtheir messages, which effectively build connected networks among the mobile hosts in the deployedarea.
2. ROUTING PROTOCOLS
In this section we briefly review the studied routing protocols
2.1. AdHoc on-Demand Distance Vector Routing (AODV)
AODV is a routing protocol which is designed for wireless and mobile Adhoc network. AODVprotocol creates routes to destination on demand and it supports both unicast and multicast routing. TheAODV protocol is used to create routes. All the nodes which are in the routing table are arranged forbetter efficiency of response time to provide immediate response for establishing new routes. AODVprotocol uses a broadcast route discovery mechanism, as it is also used in the Dynamic Source Routing(DSR) Algorithm.Whenever the nodes need to send data to the destination, if the source node doesn’t have routinginformation in its table, route discovery process begins to find the routes from source to destination.Route discovery begins with broadcasting a route request (RREQ) packet by the source node to itsneighbours. RREQ packet comprises broadcast ID, two sequence numbers, the addresses of source anddestination and hop count. The intermediary nodes which receive the RREQ packet could do two steps:If it isn’t the destination node then it’ll rebroadcast the RREQ packet to its neighbours. Otherwise it’llbe the destination node and then it will send a unicast replay message, route replay (RREP), directly tothe source from which it was received the RREQ packet. A copied RREQ will be ignored. Each nodehas a sequence number. When a node wants to initiate route discovery process, it includes its sequencenumber and the most fresh sequence number it has for destination. The intermediate node that receivethe RREQ packet, replay to the RREQ packet only when the sequence number of its path is larger thanor identical to the sequence number comprised in the RREQ packet. A reverse path from the
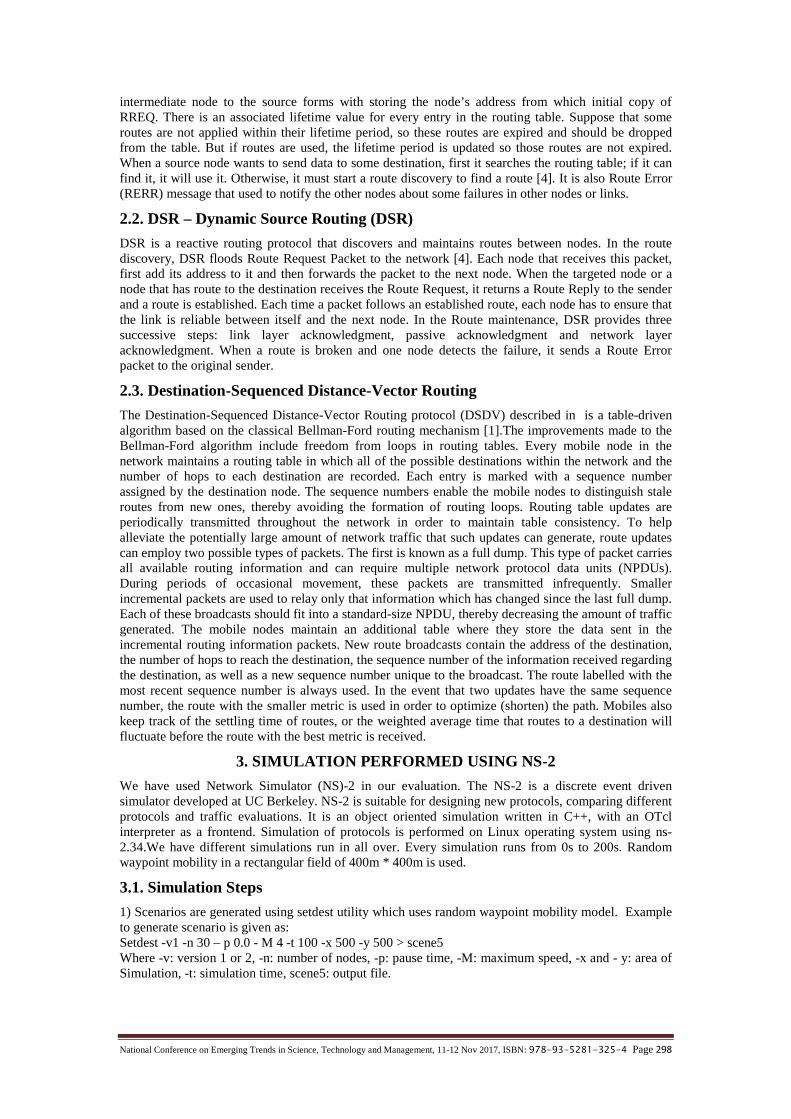
National Conference on Emerging Trends in Science, Technology and Management, 11-12 Nov 2017, ISBN: 978-93-5281-325-4 Page 298
intermediate node to the source forms with storing the node’s address from which initial copy ofRREQ. There is an associated lifetime value for every entry in the routing table. Suppose that someroutes are not applied within their lifetime period, so these routes are expired and should be droppedfrom the table. But if routes are used, the lifetime period is updated so those routes are not expired.When a source node wants to send data to some destination, first it searches the routing table; if it canfind it, it will use it. Otherwise, it must start a route discovery to find a route [4]. It is also Route Error(RERR) message that used to notify the other nodes about some failures in other nodes or links.
2.2. DSR – Dynamic Source Routing (DSR)
DSR is a reactive routing protocol that discovers and maintains routes between nodes. In the routediscovery, DSR floods Route Request Packet to the network [4]. Each node that receives this packet,first add its address to it and then forwards the packet to the next node. When the targeted node or anode that has route to the destination receives the Route Request, it returns a Route Reply to the senderand a route is established. Each time a packet follows an established route, each node has to ensure thatthe link is reliable between itself and the next node. In the Route maintenance, DSR provides threesuccessive steps: link layer acknowledgment, passive acknowledgment and network layeracknowledgment. When a route is broken and one node detects the failure, it sends a Route Errorpacket to the original sender.
2.3. Destination-Sequenced Distance-Vector Routing
The Destination-Sequenced Distance-Vector Routing protocol (DSDV) described in is a table-drivenalgorithm based on the classical Bellman-Ford routing mechanism [1].The improvements made to theBellman-Ford algorithm include freedom from loops in routing tables. Every mobile node in thenetwork maintains a routing table in which all of the possible destinations within the network and thenumber of hops to each destination are recorded. Each entry is marked with a sequence numberassigned by the destination node. The sequence numbers enable the mobile nodes to distinguish staleroutes from new ones, thereby avoiding the formation of routing loops. Routing table updates areperiodically transmitted throughout the network in order to maintain table consistency. To helpalleviate the potentially large amount of network traffic that such updates can generate, route updatescan employ two possible types of packets. The first is known as a full dump. This type of packet carriesall available routing information and can require multiple network protocol data units (NPDUs).During periods of occasional movement, these packets are transmitted infrequently. Smallerincremental packets are used to relay only that information which has changed since the last full dump.Each of these broadcasts should fit into a standard-size NPDU, thereby decreasing the amount of trafficgenerated. The mobile nodes maintain an additional table where they store the data sent in theincremental routing information packets. New route broadcasts contain the address of the destination,the number of hops to reach the destination, the sequence number of the information received regardingthe destination, as well as a new sequence number unique to the broadcast. The route labelled with themost recent sequence number is always used. In the event that two updates have the same sequencenumber, the route with the smaller metric is used in order to optimize (shorten) the path. Mobiles alsokeep track of the settling time of routes, or the weighted average time that routes to a destination willfluctuate before the route with the best metric is received.
3. SIMULATION PERFORMED USING NS-2
We have used Network Simulator (NS)-2 in our evaluation. The NS-2 is a discrete event drivensimulator developed at UC Berkeley. NS-2 is suitable for designing new protocols, comparing differentprotocols and traffic evaluations. It is an object oriented simulation written in C++, with an OTclinterpreter as a frontend. Simulation of protocols is performed on Linux operating system using ns-2.34.We have different simulations run in all over. Every simulation runs from 0s to 200s. Randomwaypoint mobility in a rectangular field of 400m * 400m is used.
3.1. Simulation Steps
1) Scenarios are generated using setdest utility which uses random waypoint mobility model. Exampleto generate scenario is given as:Setdest -v1 -n 30 – p 0.0 - M 4 -t 100 -x 500 -y 500 > scene5Where -v: version 1 or 2, -n: number of nodes, -p: pause time, -M: maximum speed, -x and - y: area ofSimulation, -t: simulation time, scene5: output file.

National Conference on Emerging Trends in Science, Technology and Management, 11-12 Nov 2017, ISBN: 978-93-5281-325-4 Page 299
2) Traffic pattern is generated using cbrgen.tcl file given in indep utilities. In this simulation only onetraffic pattern is generated using following method:ns cbrgen.tcl - type cbr -nn 9 - seed 1- mc 7 - rate 4 > rafiq7Where - type: type of traffic cbr or tcp, - nn: number of nodes, - seed: seed value, -mc: maximumconnection sources, -rate: rate of sending packets.3) After generating traffic patterns and scenarios a tcl script is written for the generation of the tracefiles. These created traffic patterns and scenarios are fed in to tcl script and then executed. Onexecution of tcl script trace files are generated. In this simulation two protocols namely AODV,DSRand DSDV are used to generate trace files which are saved with the extension *.tr which are old tracefile formats. There are two trace file formats available one is old trace file format and other is new tracefile format. With generation of trace file a *.nam file is also generated which shows animation of themoving nodes and routing of packets. Routing of packets and movement of nodes can be easilydepicted by *.nam files.4) When trace files are generated then it is needed to analyse these files. To analyse files awk or perlscripts are written according to performance metrics which are to be used in performance evaluation.This simulation is performed to evaluate the performance based on metrics namely Average RemainingEnergy, Average Consumed Energy and Network Life Time. So, three awk files are used for thissimulation.5) After the analysis of trace files obtained results are stored in a *.xgr file from which x graphs aregenerated by using Xgraph utility of ns-2.
3.2. Performance Metrics
There are many performance metrics which are used for analysis of various protocols. In this project Iam using three performance metrics, which are:Average Remaining Energy/Average System Energy: It is taken as the average of the remainingenergy levels of all the nodes in the network at the end of simulation.Average Consumed Energy: It is taken as the average of the consumed energy of all the nodes in thenetwork at the end of simulation.Network Life Time: It is the time when a node finished its own battery for the first time. Theperformance is better when network life time is high [5].
3.3. Simulations and ResultsThe simulations were performed using Network Simulator 2 (Ns-2), particularly popular in the ad hocnetworking community. The mobility model used is Random Way point Model. The traffic sources areCBR (continuous bit rate), number of data connections is 7, data packet size is 512 byte and datasending rate is 4 packets/sec. The source destination pairs are spread randomly over the network in arectangular filed of 400m x 400m. During the simulation, each node starts its journey from a randomspot to a random chosen destination. The simulation time is 200 seconds and maximum speed of nodesis 20 m/s. The interface queue is 50- packet drop-tail priority queue. Network scenarios for differentnumber of nodes are generated. Impact of changing pause time. In this simulation pause time is varyingand considered 0, 50,100,150 and 200 and other network parameters are considered as in the table 1.Table -1 Simulation Parameters
Parameters ValuesRouting Protocols AODV,DSDV,DSRSimulation time 200 secTraffic Type CBRMax Connections 7Sources 5Packet Rate 4 (pkt/sec)Packet Size 512 bytesPause Time 0,50,100,150,200 (sec)Number of nodes 30Network Area 400mx400mTrans. Range 250mMax. Speed 20m/secMobility Model Random WaypointInterface Queue 50 Pkt. Drop-tail PriorityMac type 802_11Initial energy 200 J ( 146 J in case of network life time)Idle power 0.73 W
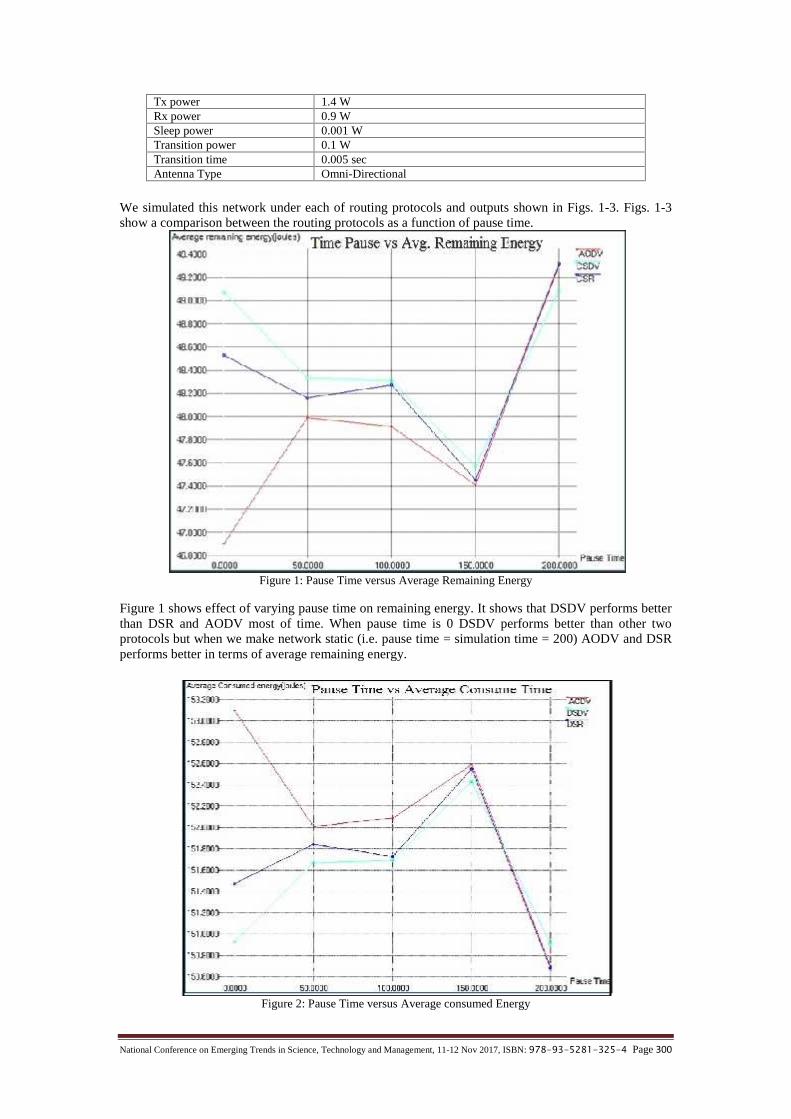
National Conference on Emerging Trends in Science, Technology and Management, 11-12 Nov 2017, ISBN: 978-93-5281-325-4 Page 300
Tx power 1.4 WRx power 0.9 WSleep power 0.001 WTransition power 0.1 WTransition time 0.005 secAntenna Type Omni-Directional
We simulated this network under each of routing protocols and outputs shown in Figs. 1-3. Figs. 1-3show a comparison between the routing protocols as a function of pause time.
Figure 1: Pause Time versus Average Remaining Energy
Figure 1 shows effect of varying pause time on remaining energy. It shows that DSDV performs betterthan DSR and AODV most of time. When pause time is 0 DSDV performs better than other twoprotocols but when we make network static (i.e. pause time = simulation time = 200) AODV and DSRperforms better in terms of average remaining energy.
Figure 2: Pause Time versus Average consumed Energy
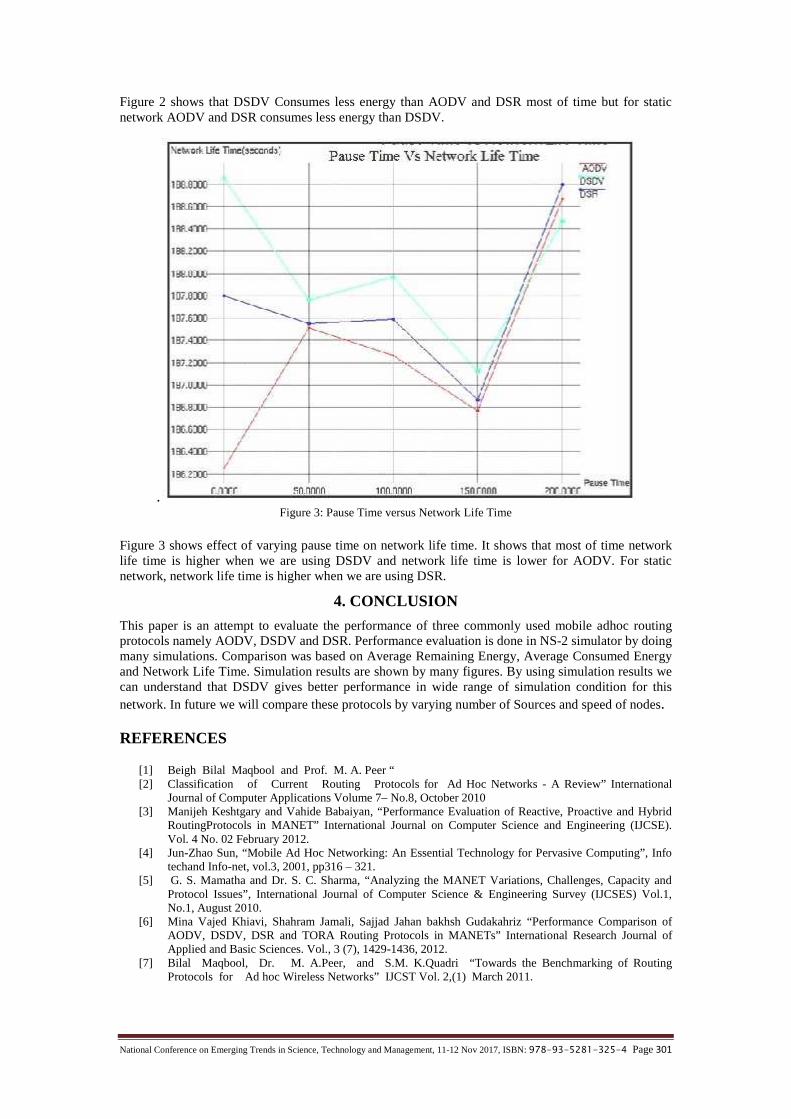
National Conference on Emerging Trends in Science, Technology and Management, 11-12 Nov 2017, ISBN: 978-93-5281-325-4 Page 301
Figure 2 shows that DSDV Consumes less energy than AODV and DSR most of time but for staticnetwork AODV and DSR consumes less energy than DSDV.
.Figure 3: Pause Time versus Network Life Time
Figure 3 shows effect of varying pause time on network life time. It shows that most of time networklife time is higher when we are using DSDV and network life time is lower for AODV. For staticnetwork, network life time is higher when we are using DSR.
4. CONCLUSION
This paper is an attempt to evaluate the performance of three commonly used mobile adhoc routingprotocols namely AODV, DSDV and DSR. Performance evaluation is done in NS-2 simulator by doingmany simulations. Comparison was based on Average Remaining Energy, Average Consumed Energyand Network Life Time. Simulation results are shown by many figures. By using simulation results wecan understand that DSDV gives better performance in wide range of simulation condition for thisnetwork. In future we will compare these protocols by varying number of Sources and speed of nodes.
REFERENCES
[1] Beigh Bilal Maqbool and Prof. M. A. Peer “[2] Classification of Current Routing Protocols for Ad Hoc Networks - A Review” International
Journal of Computer Applications Volume 7– No.8, October 2010[3] Manijeh Keshtgary and Vahide Babaiyan, “Performance Evaluation of Reactive, Proactive and Hybrid
RoutingProtocols in MANET” International Journal on Computer Science and Engineering (IJCSE).Vol. 4 No. 02 February 2012.
[4] Jun-Zhao Sun, “Mobile Ad Hoc Networking: An Essential Technology for Pervasive Computing”, Infotechand Info-net, vol.3, 2001, pp316 – 321.
[5] G. S. Mamatha and Dr. S. C. Sharma, “Analyzing the MANET Variations, Challenges, Capacity andProtocol Issues”, International Journal of Computer Science & Engineering Survey (IJCSES) Vol.1,No.1, August 2010.
[6] Mina Vajed Khiavi, Shahram Jamali, Sajjad Jahan bakhsh Gudakahriz “Performance Comparison ofAODV, DSDV, DSR and TORA Routing Protocols in MANETs” International Research Journal ofApplied and Basic Sciences. Vol., 3 (7), 1429-1436, 2012.
[7] Bilal Maqbool, Dr. M. A.Peer, and S.M. K.Quadri “Towards the Benchmarking of RoutingProtocols for Ad hoc Wireless Networks” IJCST Vol. 2,(1) March 2011.

National Conference on Emerging Trends in Science, Technology and Management, 11-12 Nov 2017, ISBN: 978-93-5281-325-4 Page 302
[8] Dinesh Singh, Deepak Sethi, Pooja “ Comparative Analysis of Energy Efficient Routing Protocols inMANETS (Mobile Ad-hoc Networks)” International Journal of Computer Science and Technology Vol.2, Issue 3, September 2011.
[9] K. Arulandam and Dr.B.Parthasarathy “A new energy level efficiency issues in MANET” InternationalJournal of Reviews in Computing 2009.
[10] Mobile communications by J Schiller pearson 2nd editon.[11] Ad Hoc Networking, Perkins, Addison Wesley, 2001.[12] Marc Greis, Ns Tutorial, http://www.isi.edu /nsnam/ns/tutorial/, accessed on Sep 2012[13] TCL Tutorial, http://www.tcl.tk /man/tcl/tutorial/ tcltutorial.html, accessed on Sep 2012.[14] Trace formats, http://nsnam.isi.edu /nsnam/index. php/NS-2_Trace_Formats , accessed on Jan 2013[15] [Awk basics,http://www.thegeekstuff .com/2010/01/ awk-introduction -tutorial-7-awk-print-examples/ ,
accessed On Jan 2013.

National Conference on Emerging Trends in Science, Technology and Management, 11-12 Nov 2017, ISBN: 978-93-5281-325-4 Page 303
A SURVEY ON BIG DATA AND ITS TECHNOLOGIESJuli Singh1, Km. Soni Ojha2, Dr. R.S. Yadav3, Saumya Gupta4, Saloni Sharma5, Diksha Srivastava6, Kritika Soni7
Department of Computer Science and EngineeringAshoka Institute of Technology and Management
[email protected]@gmail.com
[email protected]@gmail.com
[email protected]@gmail.com
Abstract: Big data is the kind of dataset which is very large and has a massive volume of both structuredand unstructured data. It is very difficult to manage and process them by using traditional data processingapplication. In other words, we can say that big data is a data whose volume, complexity and velocity arevery difficult to process and manage. In this survey paper firstly we define the concept of big data followingthat, the categories and characteristics of big data, different technologies to handle it and its applicationareas.Keywords: Structured data, unstructured data, Semi-structured data, Volume, Variety, Velocity, Value, Veracity.
1. INTRODUCTION
Big Data is not just a data but here, data grows exponentially with time and it has become a completesubject which include variety of tools, framework and techniques [1].These data are obtained fromdifferent social media for example:-Facebook, Whatsapp etc [7].Now a days computer science and technology has main concern towards the big data analysis andmanagement because big data is a big problem in today’s digital and computing world [1] .Infomationsare generated and collected in large amount for which various technologies and technique areimplemented to meet the challenges of big data which has large amount and variety of data [7].The techniques use to handle the massive amount of data are:-Hadoop, Map Reduce, Apache Hive, No SQL and HPCC[2]. Big data can be applicable in variousfields that were not thought before .One major area that has lot of potential in big data is miningindustry. Earlier, the entities were used is Kilobyte and Megabyte which were able to combine theoverall definition of data used throughout the world [7]. In big data the concept of distributedprocessing is used, so workload will be distributed and it enhance system performance.
2. 5 V’s OF BIG DATA
The Parameters i.e. Volume, Velocity, Variety, Value, Veracity are the basic challenges for Big Datamanagement.
Fig 1. Big data technologies and management: What conceptual modeling can do?
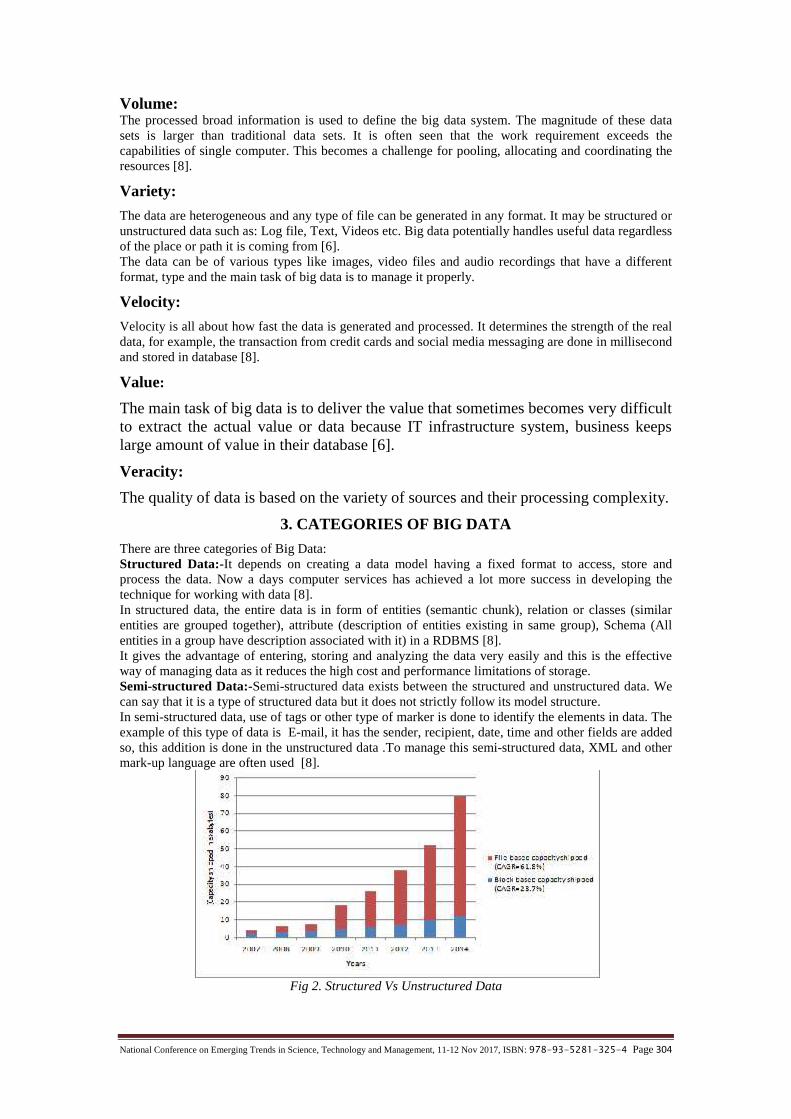
National Conference on Emerging Trends in Science, Technology and Management, 11-12 Nov 2017, ISBN: 978-93-5281-325-4 Page 304
Volume:The processed broad information is used to define the big data system. The magnitude of these datasets is larger than traditional data sets. It is often seen that the work requirement exceeds thecapabilities of single computer. This becomes a challenge for pooling, allocating and coordinating theresources [8].
Variety:
The data are heterogeneous and any type of file can be generated in any format. It may be structured orunstructured data such as: Log file, Text, Videos etc. Big data potentially handles useful data regardlessof the place or path it is coming from [6].The data can be of various types like images, video files and audio recordings that have a differentformat, type and the main task of big data is to manage it properly.
Velocity:
Velocity is all about how fast the data is generated and processed. It determines the strength of the realdata, for example, the transaction from credit cards and social media messaging are done in millisecondand stored in database [8].
Value:
The main task of big data is to deliver the value that sometimes becomes very difficultto extract the actual value or data because IT infrastructure system, business keepslarge amount of value in their database [6].
Veracity:
The quality of data is based on the variety of sources and their processing complexity.
3. CATEGORIES OF BIG DATA
There are three categories of Big Data:Structured Data:-It depends on creating a data model having a fixed format to access, store andprocess the data. Now a days computer services has achieved a lot more success in developing thetechnique for working with data [8].In structured data, the entire data is in form of entities (semantic chunk), relation or classes (similarentities are grouped together), attribute (description of entities existing in same group), Schema (Allentities in a group have description associated with it) in a RDBMS [8].It gives the advantage of entering, storing and analyzing the data very easily and this is the effectiveway of managing data as it reduces the high cost and performance limitations of storage.Semi-structured Data:-Semi-structured data exists between the structured and unstructured data. Wecan say that it is a type of structured data but it does not strictly follow its model structure.In semi-structured data, use of tags or other type of marker is done to identify the elements in data. Theexample of this type of data is E-mail, it has the sender, recipient, date, time and other fields are addedso, this addition is done in the unstructured data .To manage this semi-structured data, XML and othermark-up language are often used [8].
Fig 2. Structured Vs Unstructured Data
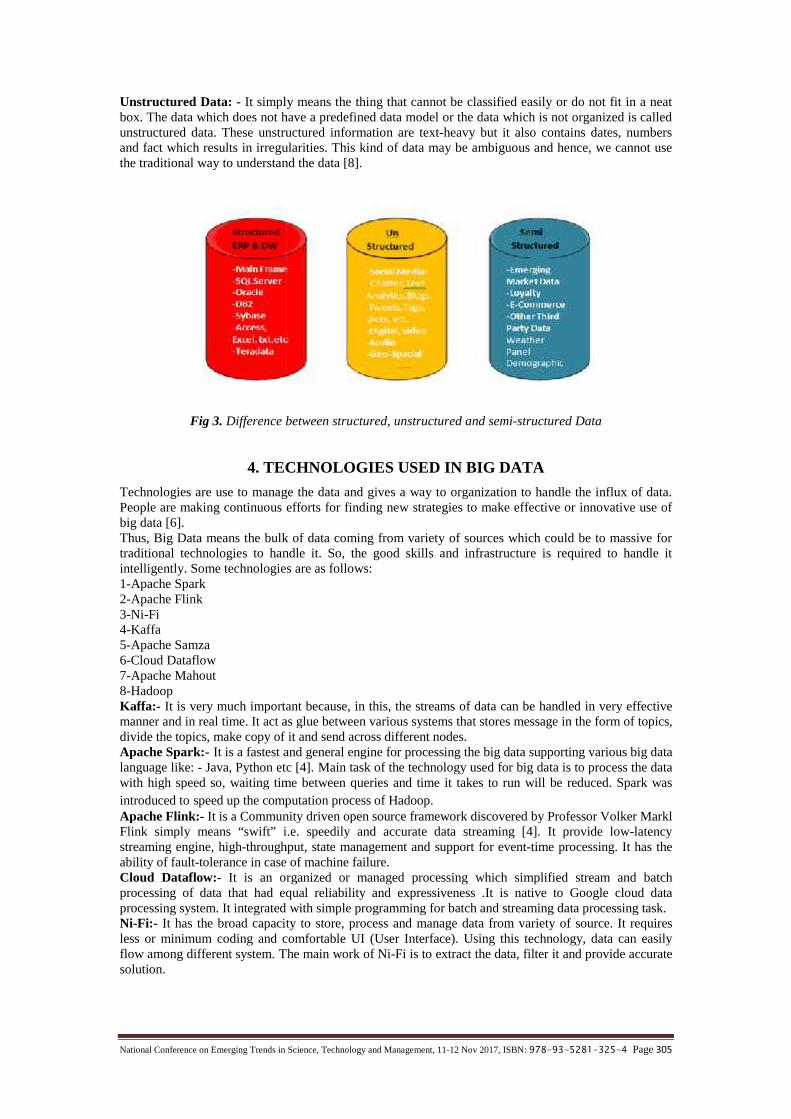
National Conference on Emerging Trends in Science, Technology and Management, 11-12 Nov 2017, ISBN: 978-93-5281-325-4 Page 305
Unstructured Data: - It simply means the thing that cannot be classified easily or do not fit in a neatbox. The data which does not have a predefined data model or the data which is not organized is calledunstructured data. These unstructured information are text-heavy but it also contains dates, numbersand fact which results in irregularities. This kind of data may be ambiguous and hence, we cannot usethe traditional way to understand the data [8].
Fig 3. Difference between structured, unstructured and semi-structured Data
4. TECHNOLOGIES USED IN BIG DATA
Technologies are use to manage the data and gives a way to organization to handle the influx of data.People are making continuous efforts for finding new strategies to make effective or innovative use ofbig data [6].Thus, Big Data means the bulk of data coming from variety of sources which could be to massive fortraditional technologies to handle it. So, the good skills and infrastructure is required to handle itintelligently. Some technologies are as follows:1-Apache Spark2-Apache Flink3-Ni-Fi4-Kaffa5-Apache Samza6-Cloud Dataflow7-Apache Mahout8-HadoopKaffa:- It is very much important because, in this, the streams of data can be handled in very effectivemanner and in real time. It act as glue between various systems that stores message in the form of topics,divide the topics, make copy of it and send across different nodes.Apache Spark:- It is a fastest and general engine for processing the big data supporting various big datalanguage like: - Java, Python etc [4]. Main task of the technology used for big data is to process the datawith high speed so, waiting time between queries and time it takes to run will be reduced. Spark wasintroduced to speed up the computation process of Hadoop.Apache Flink:- It is a Community driven open source framework discovered by Professor Volker MarklFlink simply means “swift” i.e. speedily and accurate data streaming [4]. It provide low-latencystreaming engine, high-throughput, state management and support for event-time processing. It has theability of fault-tolerance in case of machine failure.Cloud Dataflow:- It is an organized or managed processing which simplified stream and batchprocessing of data that had equal reliability and expressiveness .It is native to Google cloud dataprocessing system. It integrated with simple programming for batch and streaming data processing task.Ni-Fi:- It has the broad capacity to store, process and manage data from variety of source. It requiresless or minimum coding and comfortable UI (User Interface). Using this technology, data can easilyflow among different system. The main work of Ni-Fi is to extract the data, filter it and provide accuratesolution.

National Conference on Emerging Trends in Science, Technology and Management, 11-12 Nov 2017, ISBN: 978-93-5281-325-4 Page 306
Apache Mahout:- It is based on Hadoop. It builds broad range of data mining and machine learningalgorithm such as collaborative filtering and frequent pattern mining. It is machine learning and opensource data mining software.Hadoop:- It is Apache based open source framework [3]. It allows distributed processing in which itcreates cluster of computer and manages the work among them [2]. In this, single server is connected tothousands of computers each having their own storage and perform computation locally. It has twocomponents: Hadoop Distributed File System (HDFS) and Map Reduce Frame (MRP) [1].
5. APPLICATION OF BIG DATA
Big Data has become most important subject in today’s modern industries. It gained its successfulexistence from last few years [6]. As big data continues to involve in our day-to-day life, there is a mainfocus on finding real value in its use. The main applications of Big Data are:-1:-Application of Big Data in the Banking and Securities industry:-To maintain financial marketactivity, big data in banking and security industries can be used in high frequency trading, decision-support analytics etc.2:-Application of Big Data in the health sector:-Some hospitals maintain the records of people andpatients. This record can be of millions of people if it is a big organization or working on a big scale, sohere data plays an important role.3:-Application of Big Data in manufacturing and natural resources:-The increase in the demand ofnatural resources like oil, agriculture products, minerals etc leads to increase in volume, complexity andvelocity of data which is challenging [2]. So, manufacturing industry are also untapped. Big Data allowsproductive modeling to support decision making in manufacturing and natural industry.4:-Application of Big Data in data mining industry:-The decision tree helps in determining andunderstanding the combinations of data attributes and tells about the output. This can be helpful infinding the useful data from lot of data set [8]. The application of Big Data is not limited as the scope ofbig-data is increasing with the advancement of new technologies.
6. ADVANTAGE OF BIG DATA
1:-Helpful in making business oriented decisions.2:-Big Data allows companies to create move in depth personal profits of their customers.3:-The real-time features of Big Data are also an important for companies.4:-Customer service is improved.5:-Operational efficiency is better.6:-We can do identification of risk to product or services.
7. LIMITATIONS OF BIG DATA
1:-Handling such a huge complex volume of data is a crucial task.2:- It can disclose the customer behavior and trend patterns.3:-Big Data need speed for tuning with updates.4:-Security Issue [3].
8. FUTURE SCOPE
As the size of data is increasing with the exponential rate, the demand of big data management will bemore and more in future, and this may shut the entire past and present technology to handle the database[5].Future scopes are as follows:-1:- Project looms and cloud balloons can be implemented in big data solution such as- Hadoop that mayprevent DOS attack on a single server.2:- We can use the concept of Cassandra in future to make data reliable, scalable, redundant and cheapwhich help in reducing the time by using Cassandra backup and storage can also be improve.
9. CONCLUSION
From this paper we can conclude that Big Data has a vast variety and volume. The main work of BigData is to manage the huge amount of data and make it available when accessed. With such a hugeheterogeneous data set, it became a problem for which Hadoop and other technologies and techniquesare the solution. The availability of Big Data, low-cost commodity hardware and new informationmanagement have produced a unique moment in the history of data analysis. We can analyze data setsquickly and cost-effectively.

National Conference on Emerging Trends in Science, Technology and Management, 11-12 Nov 2017, ISBN: 978-93-5281-325-4 Page 307
REFERENCES[1.] Varsha B.Bobada, Jan 2016,”Suvey on Big Data and Hadoop”.[2.] Nawsher Khan, Abdullah Gani, Muhammad Alam, July 2014, “Big Data: Survey, technologies and
Challenges”.[3.] Chun-Wei Tsai, Chin-Feng Lai, Han-Chieh Chao and Athanasios V. Vasilakos, 2015,”Big Data Analytics:
A Survey”.[4.] Anuradha N .Nawathe, April 2015, “A survey paper on Big Data and Data mining Issues”.[5.] Samiddha Mukherjee, Ravi Shaw, February 2016 “Big data- concept, application, challenges and future
scope”.[6.] Tasleem Nizam and Sycd Imtiyaz Hassan, May-June 2017, “Big Data: A survey paper on big data
innovation and its technology”.[7.] “Data: A Revolution That Will Transform How We Live, Work, and Think (Hardcover)” , 2013.[8.] Nathan Marz, 2012 Big Data (eBook).
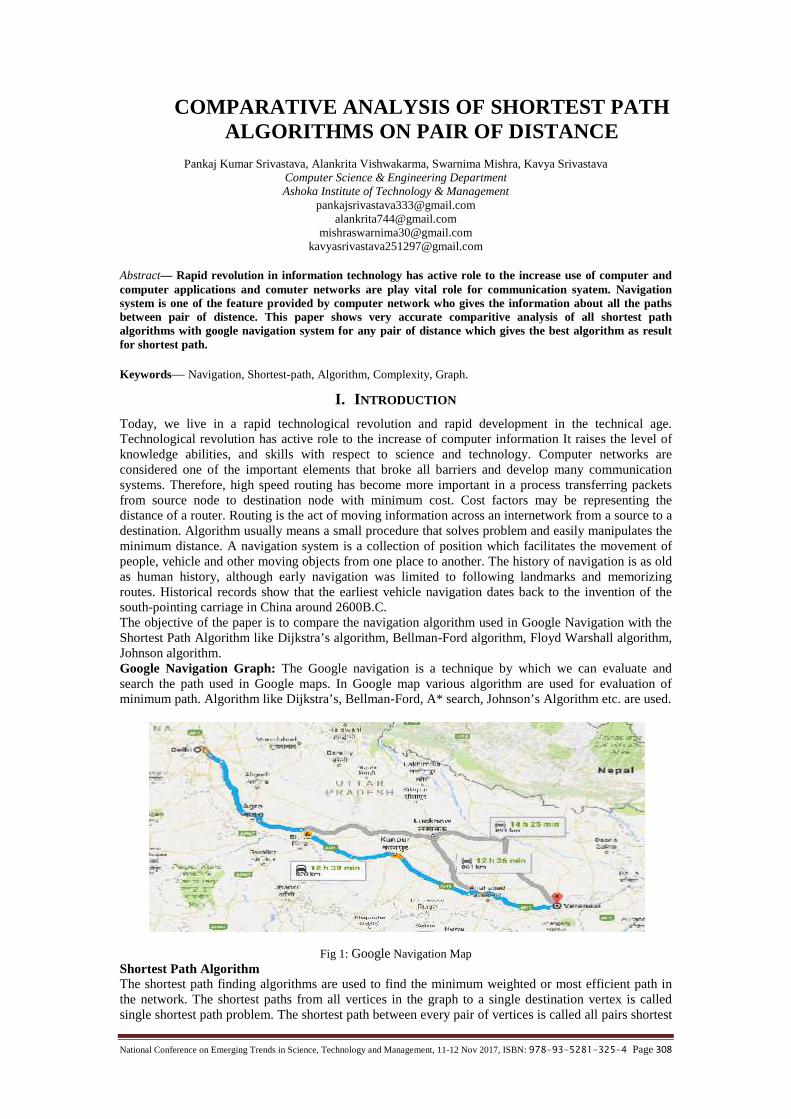
National Conference on Emerging Trends in Science, Technology and Management, 11-12 Nov 2017, ISBN: 978-93-5281-325-4 Page 308
COMPARATIVE ANALYSIS OF SHORTEST PATHALGORITHMS ON PAIR OF DISTANCE
Pankaj Kumar Srivastava, Alankrita Vishwakarma, Swarnima Mishra, Kavya SrivastavaComputer Science & Engineering DepartmentAshoka Institute of Technology & Management
[email protected]@gmail.com
[email protected]@gmail.com
Abstract— Rapid revolution in information technology has active role to the increase use of computer andcomputer applications and comuter networks are play vital role for communication syatem. Navigationsystem is one of the feature provided by computer network who gives the information about all the pathsbetween pair of distence. This paper shows very accurate comparitive analysis of all shortest pathalgorithms with google navigation system for any pair of distance which gives the best algorithm as resultfor shortest path.
Keywords— Navigation, Shortest-path, Algorithm, Complexity, Graph.
I. INTRODUCTION
Today, we live in a rapid technological revolution and rapid development in the technical age.Technological revolution has active role to the increase of computer information It raises the level ofknowledge abilities, and skills with respect to science and technology. Computer networks areconsidered one of the important elements that broke all barriers and develop many communicationsystems. Therefore, high speed routing has become more important in a process transferring packetsfrom source node to destination node with minimum cost. Cost factors may be representing thedistance of a router. Routing is the act of moving information across an internetwork from a source to adestination. Algorithm usually means a small procedure that solves problem and easily manipulates theminimum distance. A navigation system is a collection of position which facilitates the movement ofpeople, vehicle and other moving objects from one place to another. The history of navigation is as oldas human history, although early navigation was limited to following landmarks and memorizingroutes. Historical records show that the earliest vehicle navigation dates back to the invention of thesouth-pointing carriage in China around 2600B.C.The objective of the paper is to compare the navigation algorithm used in Google Navigation with theShortest Path Algorithm like Dijkstra’s algorithm, Bellman-Ford algorithm, Floyd Warshall algorithm,Johnson algorithm.Google Navigation Graph: The Google navigation is a technique by which we can evaluate andsearch the path used in Google maps. In Google map various algorithm are used for evaluation ofminimum path. Algorithm like Dijkstra’s, Bellman-Ford, A* search, Johnson’s Algorithm etc. are used.
Fig 1: Google Navigation MapShortest Path AlgorithmThe shortest path finding algorithms are used to find the minimum weighted or most efficient path inthe network. The shortest paths from all vertices in the graph to a single destination vertex is calledsingle shortest path problem. The shortest path between every pair of vertices is called all pairs shortest
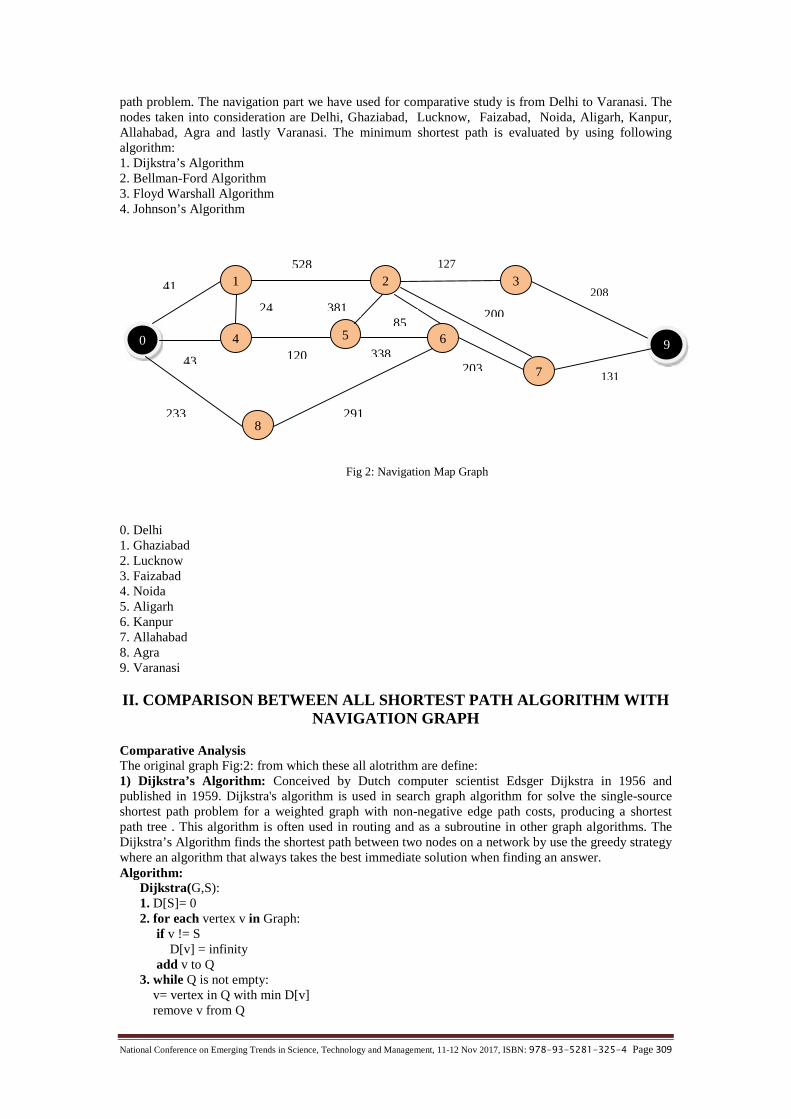
National Conference on Emerging Trends in Science, Technology and Management, 11-12 Nov 2017, ISBN: 978-93-5281-325-4 Page 309
path problem. The navigation part we have used for comparative study is from Delhi to Varanasi. Thenodes taken into consideration are Delhi, Ghaziabad, Lucknow, Faizabad, Noida, Aligarh, Kanpur,Allahabad, Agra and lastly Varanasi. The minimum shortest path is evaluated by using followingalgorithm:1. Dijkstra’s Algorithm2. Bellman-Ford Algorithm3. Floyd Warshall Algorithm4. Johnson’s Algorithm
0. Delhi1. Ghaziabad2. Lucknow3. Faizabad4. Noida5. Aligarh6. Kanpur7. Allahabad8. Agra9. Varanasi
II. COMPARISON BETWEEN ALL SHORTEST PATH ALGORITHM WITHNAVIGATION GRAPH
Comparative AnalysisThe original graph Fig:2: from which these all alotrithm are define:1) Dijkstra’s Algorithm: Conceived by Dutch computer scientist Edsger Dijkstra in 1956 andpublished in 1959. Dijkstra's algorithm is used in search graph algorithm for solve the single-sourceshortest path problem for a weighted graph with non-negative edge path costs, producing a shortestpath tree . This algorithm is often used in routing and as a subroutine in other graph algorithms. TheDijkstra’s Algorithm finds the shortest path between two nodes on a network by use the greedy strategywhere an algorithm that always takes the best immediate solution when finding an answer.Algorithm:
Dijkstra(G,S):1. D[S]= 02. for each vertex v in Graph:
if v != SD[v] = infinity
add v to Q3. while Q is not empty:
v= vertex in Q with min D[v]remove v from Q
203
0
1 2 3
94 5 6
7
8
41
528 127
208
43
24
120
381
338
85200
131
291233
Fig 2: Navigation Map Graph
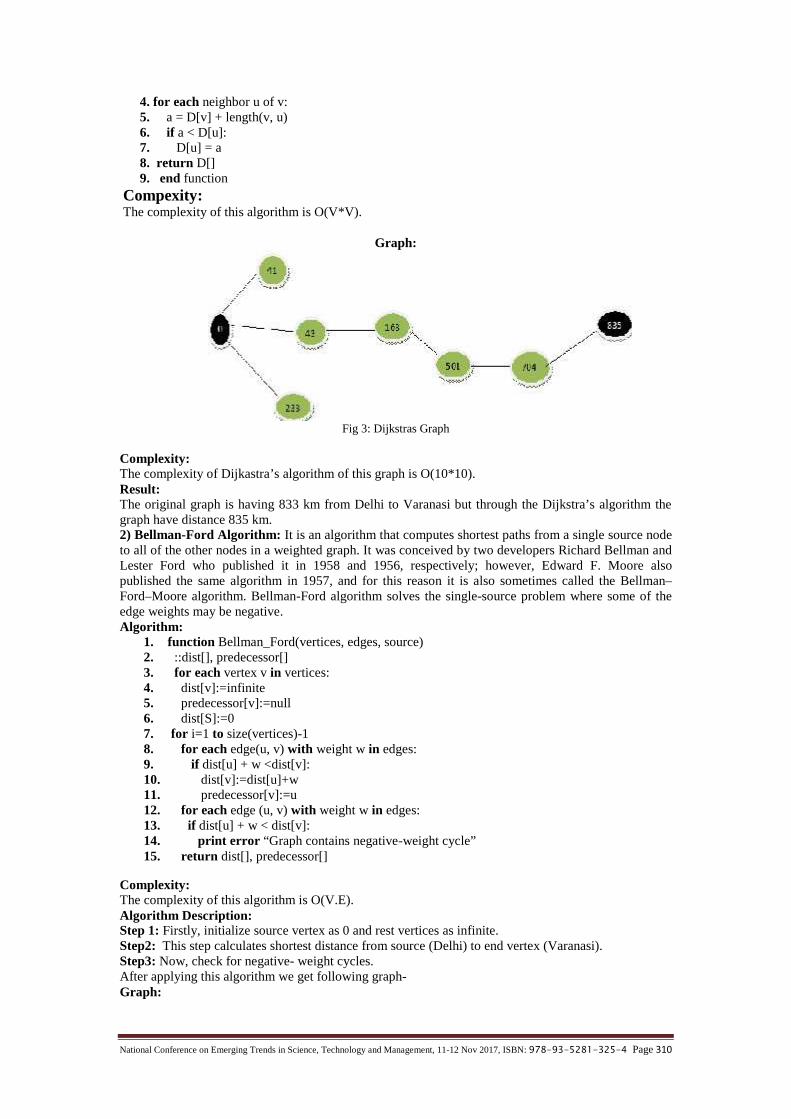
National Conference on Emerging Trends in Science, Technology and Management, 11-12 Nov 2017, ISBN: 978-93-5281-325-4 Page 310
4. for each neighbor u of v:5. a = D[v] + length(v, u)6. if a < D[u]:7. D[u] = a8. return D[]9. end function
Compexity:The complexity of this algorithm is O(V*V).
Graph:
Fig 3: Dijkstras Graph
Complexity:The complexity of Dijkastra’s algorithm of this graph is O(10*10).Result:The original graph is having 833 km from Delhi to Varanasi but through the Dijkstra’s algorithm thegraph have distance 835 km.2) Bellman-Ford Algorithm: It is an algorithm that computes shortest paths from a single source nodeto all of the other nodes in a weighted graph. It was conceived by two developers Richard Bellman andLester Ford who published it in 1958 and 1956, respectively; however, Edward F. Moore alsopublished the same algorithm in 1957, and for this reason it is also sometimes called the Bellman–Ford–Moore algorithm. Bellman-Ford algorithm solves the single-source problem where some of theedge weights may be negative.Algorithm:
1. function Bellman_Ford(vertices, edges, source)2. ::dist[], predecessor[]3. for each vertex v in vertices:4. dist[v]:=infinite5. predecessor[v]:=null6. dist[S]:=07. for i=1 to size(vertices)-18. for each edge(u, v) with weight w in edges:9. if dist[u] + w <dist[v]:10. dist[v]:=dist[u]+w11. predecessor[v]:=u12. for each edge (u, v) with weight w in edges:13. if dist[u] + w < dist[v]:14. print error “Graph contains negative-weight cycle”15. return dist[], predecessor[]
Complexity:The complexity of this algorithm is O(V.E).Algorithm Description:Step 1: Firstly, initialize source vertex as 0 and rest vertices as infinite.Step2: This step calculates shortest distance from source (Delhi) to end vertex (Varanasi).Step3: Now, check for negative- weight cycles.After applying this algorithm we get following graph-Graph:
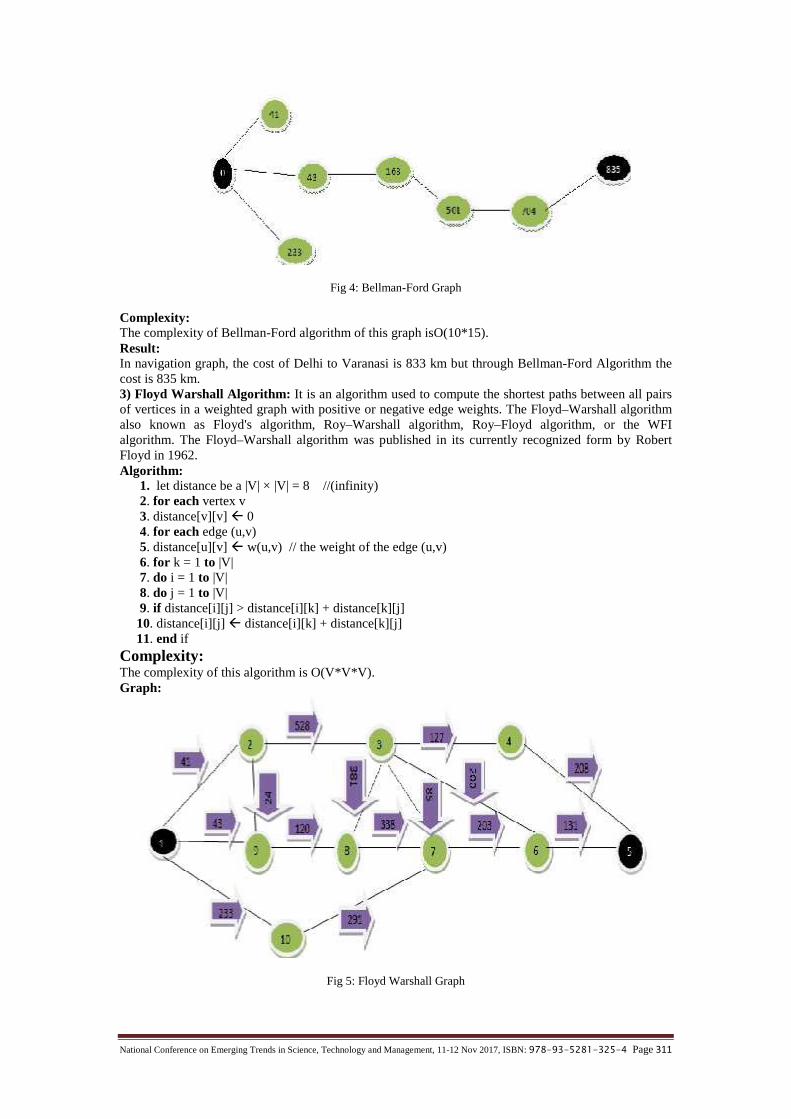
National Conference on Emerging Trends in Science, Technology and Management, 11-12 Nov 2017, ISBN: 978-93-5281-325-4 Page 311
Fig 4: Bellman-Ford Graph
Complexity:The complexity of Bellman-Ford algorithm of this graph isO(10*15).Result:In navigation graph, the cost of Delhi to Varanasi is 833 km but through Bellman-Ford Algorithm thecost is 835 km.3) Floyd Warshall Algorithm: It is an algorithm used to compute the shortest paths between all pairsof vertices in a weighted graph with positive or negative edge weights. The Floyd–Warshall algorithmalso known as Floyd's algorithm, Roy–Warshall algorithm, Roy–Floyd algorithm, or the WFIalgorithm. The Floyd–Warshall algorithm was published in its currently recognized form by RobertFloyd in 1962.Algorithm:
1. let distance be a |V| × |V| = 8 //(infinity)2. for each vertex v3. distance[v][v] 04. for each edge (u,v)5. distance[u][v] w(u,v) // the weight of the edge (u,v)6. for k = 1 to |V|7. do i = 1 to |V|8. do j = 1 to |V|9. if distance[i][j] > distance[i][k] + distance[k][j]
10. distance[i][j] distance[i][k] + distance[k][j]11. end if
Complexity:The complexity of this algorithm is O(V*V*V).Graph:
Fig 5: Floyd Warshall Graph

National Conference on Emerging Trends in Science, Technology and Management, 11-12 Nov 2017, ISBN: 978-93-5281-325-4 Page 312
Complexity:The complexity of Floyd Warshall algorithm of this graph is O(10*10*10).Result:Through the Floyd warshall table the shortest path from vertex 1 to 5 for covering all path is 835 , isthe maximum distance in comparison to navigation distance.4) Johnson’s Algorithm: It is a way to find the shortest paths between all pairs of vertices in a graph,whose edges may have positive or negative weights. But no negative-weight cycles may exist. Itcombines the Bellman-Ford algorithm and Dijkstra’s algorithm to quickly find shortest paths. It isnamed after Donald B. Johnson, who first published the technique in 1977.Algorithm:
1. Johnson_Algo(G)2. create G’ where G’.V = G.V + s,3. G’.E = G.E + ((s, u) for u in G.V), and4. w (s, u) = 0 for u in G.V5. if Bellman-Ford(G) == False6. return “The input graph has a negative weight cycle”7. else:8. for vertex v in G’.V:9. h(v) = dist(s, v) computed by Bellman-Ford10. for edge (u, v) in G’.E:11. w’(u, v) = w(u, v) + h(u) - h(v)12. D = new matrix of distances initialized to infinity13. for vertex u in G’.V:14. run Dijkstra(G, w’, u) to compute dist’(u, v) for all v in G.V15. for each vertex v in G.V:16. D_(u, v) = dist’(u, v) + h(v) – h(u)17. return D
Complexity:The complexity of this algorithm is O(V*ElogV).
Algorithm Description: The three main parts of the algorithms are described below:
Step 1: Adding a base vertex
Step 2: Reweighting the edges by using Bellman Ford Algorithm
Step 3:Finding all pairs shortest path by using Dijkstra’s Algorithm
After imlementing Johnson Algorithm we get following graph:
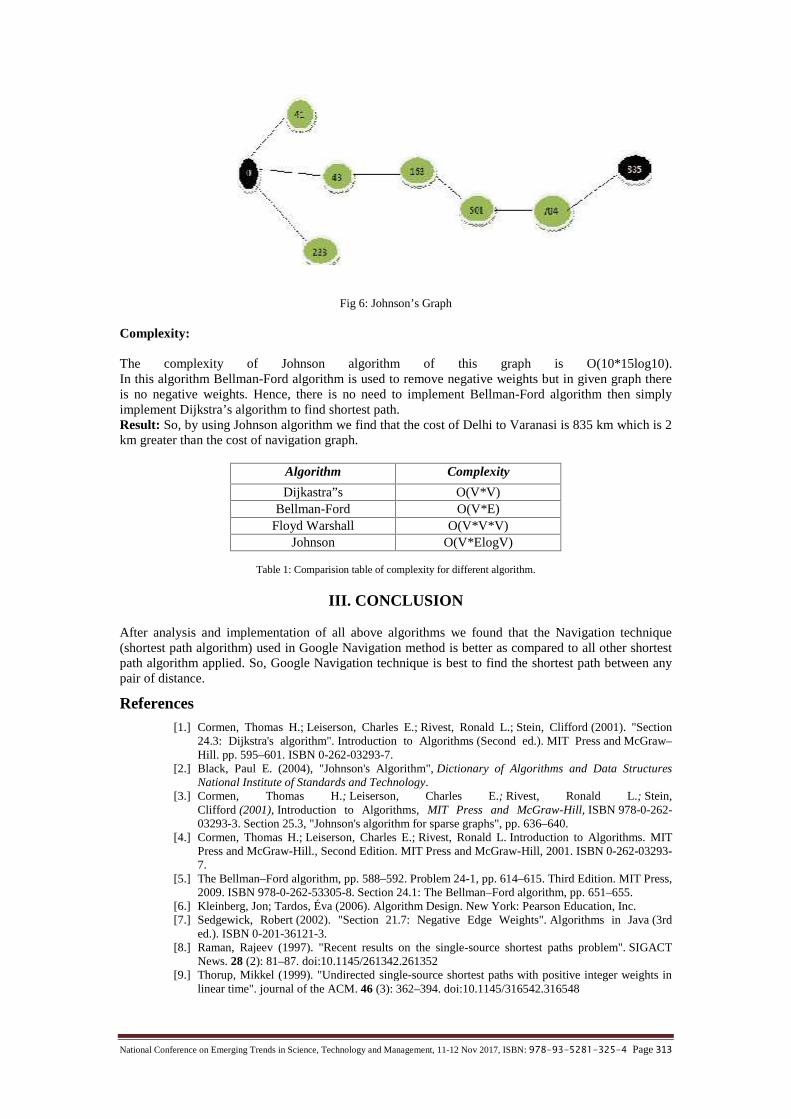
National Conference on Emerging Trends in Science, Technology and Management, 11-12 Nov 2017, ISBN: 978-93-5281-325-4 Page 313
Fig 6: Johnson’s Graph
Complexity:
The complexity of Johnson algorithm of this graph is O(10*15log10).In this algorithm Bellman-Ford algorithm is used to remove negative weights but in given graph thereis no negative weights. Hence, there is no need to implement Bellman-Ford algorithm then simplyimplement Dijkstra’s algorithm to find shortest path.Result: So, by using Johnson algorithm we find that the cost of Delhi to Varanasi is 835 km which is 2km greater than the cost of navigation graph.
Algorithm Complexity
Dijkastra”s O(V*V)Bellman-Ford O(V*E)
Floyd Warshall O(V*V*V)Johnson O(V*ElogV)
Table 1: Comparision table of complexity for different algorithm.
III. CONCLUSION
After analysis and implementation of all above algorithms we found that the Navigation technique(shortest path algorithm) used in Google Navigation method is better as compared to all other shortestpath algorithm applied. So, Google Navigation technique is best to find the shortest path between anypair of distance.
References[1.] Cormen, Thomas H.; Leiserson, Charles E.; Rivest, Ronald L.; Stein, Clifford (2001). "Section
24.3: Dijkstra's algorithm". Introduction to Algorithms (Second ed.). MIT Press and McGraw–Hill. pp. 595–601. ISBN 0-262-03293-7.
[2.] Black, Paul E. (2004), "Johnson's Algorithm", Dictionary of Algorithms and Data StructuresNational Institute of Standards and Technology.
[3.] Cormen, Thomas H.; Leiserson, Charles E.; Rivest, Ronald L.; Stein,Clifford (2001), Introduction to Algorithms, MIT Press and McGraw-Hill, ISBN 978-0-262-03293-3. Section 25.3, "Johnson's algorithm for sparse graphs", pp. 636–640.
[4.] Cormen, Thomas H.; Leiserson, Charles E.; Rivest, Ronald L. Introduction to Algorithms. MITPress and McGraw-Hill., Second Edition. MIT Press and McGraw-Hill, 2001. ISBN 0-262-03293-7.
[5.] The Bellman–Ford algorithm, pp. 588–592. Problem 24-1, pp. 614–615. Third Edition. MIT Press,2009. ISBN 978-0-262-53305-8. Section 24.1: The Bellman–Ford algorithm, pp. 651–655.
[6.] Kleinberg, Jon; Tardos, Éva (2006). Algorithm Design. New York: Pearson Education, Inc.[7.] Sedgewick, Robert (2002). "Section 21.7: Negative Edge Weights". Algorithms in Java (3rd
ed.). ISBN 0-201-36121-3.[8.] Raman, Rajeev (1997). "Recent results on the single-source shortest paths problem". SIGACT
News. 28 (2): 81–87. doi:10.1145/261342.261352[9.] Thorup, Mikkel (1999). "Undirected single-source shortest paths with positive integer weights in
linear time". journal of the ACM. 46 (3): 362–394. doi:10.1145/316542.316548

National Conference on Emerging Trends in Science, Technology and Management, 11-12 Nov 2017, ISBN: 978-93-5281-325-4 Page 314
[10.]Zhan, F. Benjamin; Noon, Charles E. (February 1998). "Shortest Path Algorithms:An EvaluationUsing Real Road Networks". Transportation Science. 32 (1):73. doi:10.1287/trsc.32.1.65
[11.]Ahuja, Ravindra K.; Mehlhorn, Kurt; Orlin, James B.; Tarjan, Robert E. (April 1990). "FasterAlgorithms for the Shortest Path Problem". Journal of Association for Computing Machinery(ACM). 37 (2): 213–223. doi:10.1145/77600.77615

National Conference on Emerging Trends in Science, Technology and Management, 11-12 Nov 2017, ISBN: 978-93-5281-325-4 Page 315
DATA CLUSTERING ON IP ADDRESS USINGK-MEANS ALGORITHM FOR START-UP BUSINESS
Amit Kumar Maurya1, Raina Kashyap2, Janhvi Singh3, Arvind Kumar4, Srishti5, Soumya Priya6
Department of Computer Science & EngineeringAshoka Institute of Technology & Management
[email protected]@gmail.com
[email protected]@gmail.com
[email protected]@gmail.com
ABSTRACT: Cluster is a collection of data members having similar characteristics. The processof establishing a relation or deriving information from raw data by performing some operationson the data set like clustering is known as data mining. The data gathered in practical plot ismore usual than not thoroughly arbitrary and unstructured. Hence, there is always a necessityfor analysis of unstructured data sets to extract relevant facts. This is where unsupervisedalgorithms draw near to process unstructured or even semi structured data sets by resultant. K-Means Clustering is one such technique used to provide a structure to unstructured data so thatvaluable information can be extracted. And with the help of the cluster formed the task ofpicking the tempting one can be done.
1. INTRODUCTION
One of the biggest challenges intending entrepreneurs side is to scrutinize what to sell & where to sellno matter it's a single product or multiple products that occupy a place in the market. Emerging withproduct ideas can be sturdy & it seems like everything has already been done. And it’s truly evidentthat there's a lot of competition prevailing online these days, consumers are tempted towards the thingsawaiting online giants like Amazon, Walmart. But, there are still golden opportunities out there bywhich one can build a business that would generate income.One of the ways to choose the particular area where the business would do a fruitful job is done bytracing the IP address of the people who are willing to consume the product which is to be sold out andcluster them by applying K-Means Algorithm.
2. METHODOLOGY
1. Search the IP address of the intended website from DNS [6].2. Now, the IP addresses of visitor are collected from the web server log of that website.3. Different countries are provided with a range of IP Addresses [8]. Each element in set of IP
address of the visitors are compared to the given range and are kept in the matched clusternamed with that country.
4. Now, we have the cluster of different countries which contains the IP address of the usersfrom the respective countries.
5. Choose the country that has maximum number of IP addresses i.e. the cluster with themaximum value.
6. Coming to the selected country, we will categorize IP addresses state-wise (The ISP isprovided with range of IP addresses for different states [7]).
7. Now, match the IP address found in the cluster above with the range of state-wiseclassification of IP address provided by the ISP.
8. In this way we find the state and further the area too and then do clustering by applying K-Means algorithm.
9. And then once cluster is created the cluster with the maximum size can be the desirable thingon which the goal can be accomplished.
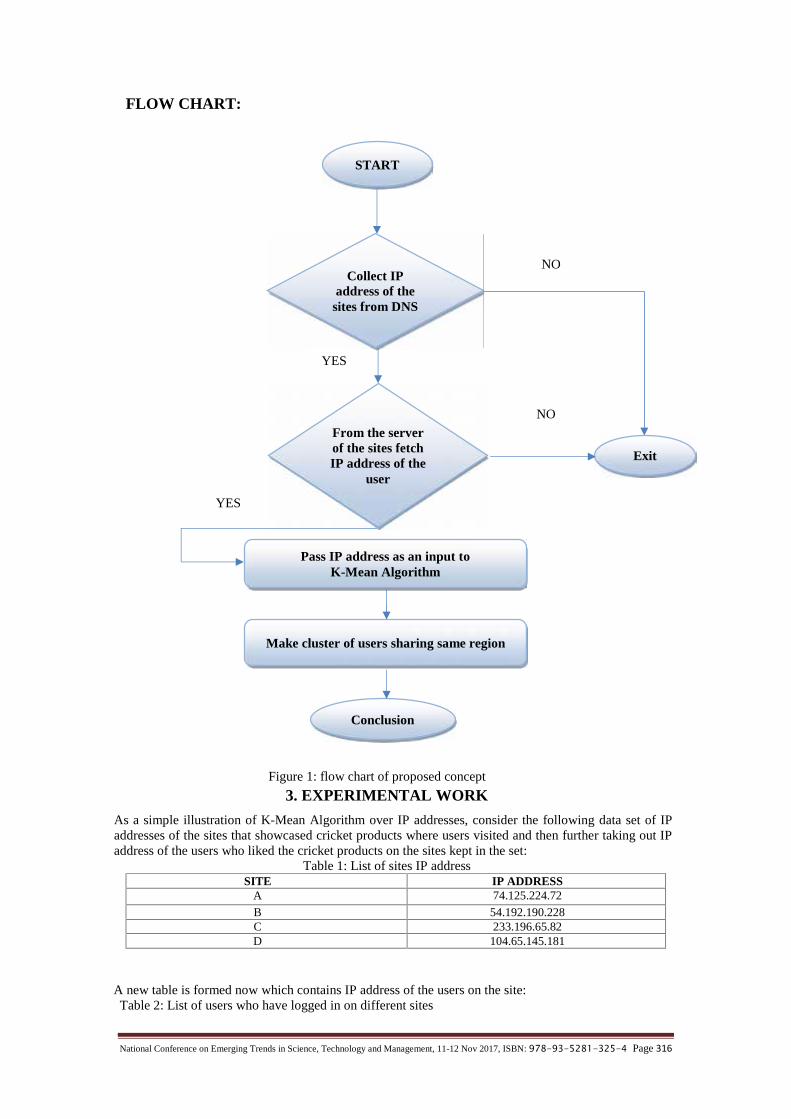
National Conference on Emerging Trends in Science, Technology and Management, 11-12 Nov 2017, ISBN: 978-93-5281-325-4 Page 316
FLOW CHART:
3. EXPERIMENTAL WORK
As a simple illustration of K-Mean Algorithm over IP addresses, consider the following data set of IPaddresses of the sites that showcased cricket products where users visited and then further taking out IPaddress of the users who liked the cricket products on the sites kept in the set:
Table 1: List of sites IP addressSITE IP ADDRESS
A 74.125.224.72
B 54.192.190.228C 233.196.65.82D 104.65.145.181
A new table is formed now which contains IP address of the users on the site:Table 2: List of users who have logged in on different sites
NO
NO
Conclusion
START
Collect IPaddress of the
sites from DNS
From the serverof the sites fetchIP address of the
user
Pass IP address as an input toK-Mean Algorithm
Make cluster of users sharing same region
Exit
YES
YES
Figure 1: flow chart of proposed concept

National Conference on Emerging Trends in Science, Technology and Management, 11-12 Nov 2017, ISBN: 978-93-5281-325-4 Page 317
Site’s IP address 74.125.224.72 54.192.190.228 233.196.65.82 104.65.145.181
Users User’s IP address1 A1:1.6.5.5 B1:1.6.18.100 C1:1.0.1.5 D1:4.15.16.20
2 A2:1.6.10.15 B2:1.6.20.100 C2:1.0.2.150 D2:1.6.90.90
3 A3:1.6.15.7 B3:1.6.40.100 C3:2.5.100.50 D3:4.15.16.150
4 A4:1.6.100.150 B4:1.6.50.50 C4:1.6.10.160 D4:4.15.16.70
5 A5:1.0.2.50 B5:1.6.90.50 C5:1.0.2.70 D5:1.6.22.100
6 A6:1.6.20.140 B6:4.15.16.100 C6:1.0.1.100 D6:1.0.2.100
7 A7:4.15.16.50 B7:1.6.210.100 C7:1.0.1.60 D7:2.5.70.70
8 A8:1.6.150.120 B8:1.6.200.150 C8:1.6.50.20 D8:2.5.60.100
9 A9:1.6.140.140 B9:1.6.5.150 C9:1.0.1.100 D9:2.10.100.20
10 A10:1.0.1.90 B10:1.6.10.200 C10:1.0.1.20 D10:2.10.50.200
Now by applying the algorithm, cluster is made which contains the IP address of the users who sharesame region and they are kept in one group.
We have a different country that encompasses following IP addresses which are as follows:Table 3: Range of IP addresses assigned to different countries
Country IP AddressIndia 1.6.0.0 – 1.7.255.255 and 5.101.108.0 – 5.101.108.255
Canada 4.15.16.0 – 4.15.17.255
China 1.0.3.255 – 1.0.3.255France 2.0.0.0 – 2.15.255.255
Now we do the clustering of the IP addresses of the visitors. From theTable: 2.0 take the IP addresses asan attribute and compare with the Table: 3.0 and form the cluster as shown:
Figure 2: Clusters of IP addresses after applying K-Mean algorithm
It is being clarified that the number of users are more from the region India and we can establish thebusiness ofIP addresses 74.125.224.72, 54.192.190.228 in this part of the world. But just think thatwithout the clustering if we would establish in France then it will not be as profitable as in India.
FRANCEC3,D7,D8,D9,
D10
CANADAA7,B6,D1,D3,D
4
CHINAA5,A10,C9,C10,C1,C2,C5,C6,C7
INDIAA1,A2,A3,A4,A
5,A6,A8,A9,B1,B2
,B3,B4,B5,B7,B8,B9,B10,C4,C8,
D2,D5

National Conference on Emerging Trends in Science, Technology and Management, 11-12 Nov 2017, ISBN: 978-93-5281-325-4 Page 318
4. AREA OF APPLICATIONS
1. For Business purpose.2. For fulfilling the intended task of hunting candidates for any opportunity.
5. CONCLUSION
Data Clustering Using K- Means Algorithm for start-up Business Establishment would result in thesuccess of the business with the help of finding the customers in advance on the basis of IP address. Theprobability of getting profit would be much more than setting business at a place where there is no ideaof customer consuming the product.
REFERENCES[1]. Celebi, M. E., Kingravi, H. A., and Vela, P.A. (2013) “A comparative study of efficient initialization methods
for the k-means clustering algorithm”[2]. Albitz, P. and Liu, C. DNS and BIND. Sebastopol, CA: O’Reilly, 1998[3]. Stewart III, J. BGP4: Inter-Domain Routing the internet, MA: Addison-Wesley, 1999[4]. Tanenbaum, A. Computer Networks. Upper Saddle River, NJ: prentice Hall, 2003[5]. Prajesh P Anchalia, Anjan K Koundinya, Srinath N K, Research Paper “MapReduce Designs of K-Means
Clustering Algorithm”[6]. A.Behrouz Forouzan: Domain Name System[7]. IP address of the ISP’s: tools.tracemyip.org/search—isp/airtel+broadband[8]. IP address ranges by country: lite.ip2location.com/ip-address-ranges-by-country.
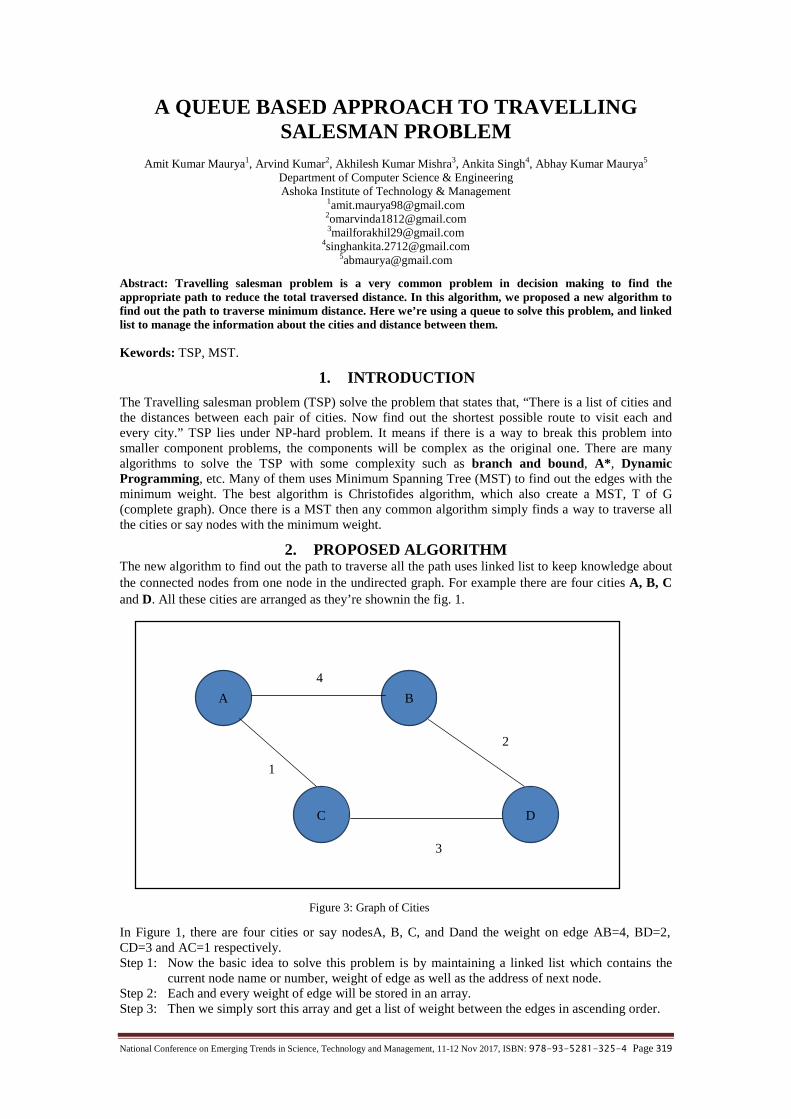
National Conference on Emerging Trends in Science, Technology and Management, 11-12 Nov 2017, ISBN: 978-93-5281-325-4 Page 319
A QUEUE BASED APPROACH TO TRAVELLINGSALESMAN PROBLEM
Amit Kumar Maurya1, Arvind Kumar2, Akhilesh Kumar Mishra3, Ankita Singh4, Abhay Kumar Maurya5
Department of Computer Science & EngineeringAshoka Institute of Technology & Management
[email protected]@[email protected]
[email protected]@gmail.com
Abstract: Travelling salesman problem is a very common problem in decision making to find theappropriate path to reduce the total traversed distance. In this algorithm, we proposed a new algorithm tofind out the path to traverse minimum distance. Here we’re using a queue to solve this problem, and linkedlist to manage the information about the cities and distance between them.
Kewords: TSP, MST.
1. INTRODUCTION
The Travelling salesman problem (TSP) solve the problem that states that, “There is a list of cities andthe distances between each pair of cities. Now find out the shortest possible route to visit each andevery city.” TSP lies under NP-hard problem. It means if there is a way to break this problem intosmaller component problems, the components will be complex as the original one. There are manyalgorithms to solve the TSP with some complexity such as branch and bound, A*, DynamicProgramming, etc. Many of them uses Minimum Spanning Tree (MST) to find out the edges with theminimum weight. The best algorithm is Christofides algorithm, which also create a MST, T of G(complete graph). Once there is a MST then any common algorithm simply finds a way to traverse allthe cities or say nodes with the minimum weight.
2. PROPOSED ALGORITHMThe new algorithm to find out the path to traverse all the path uses linked list to keep knowledge aboutthe connected nodes from one node in the undirected graph. For example there are four cities A, B, Cand D. All these cities are arranged as they’re shownin the fig. 1.
In Figure 1, there are four cities or say nodesA, B, C, and Dand the weight on edge AB=4, BD=2,CD=3 and AC=1 respectively.Step 1: Now the basic idea to solve this problem is by maintaining a linked list which contains the
current node name or number, weight of edge as well as the address of next node.Step 2: Each and every weight of edge will be stored in an array.Step 3: Then we simply sort this array and get a list of weight between the edges in ascending order.
Figure 3: Graph of Cities
4
2
3
1
BA
C D

National Conference on Emerging Trends in Science, Technology and Management, 11-12 Nov 2017, ISBN: 978-93-5281-325-4 Page 320
Step 4: On this basis, starting with the minimum weight, say Wmin presented in the array will besearched in the linked list and select those two nodes which have Wminweight between them.
Step 5: If there is any weight, say Wunvisited presented in array which is not a weight from any of thevisited node then, put Wunvisited in buffer until we get any node which contain the Wunvisited, andgo to step 4 else go to next step.
Step 6: Then call the function to check whether the buffer is empty or not.Step 7: If not, then check the Wunvisited is present in the visited node linked list. If presented then put
that value in Wmin and select those two nodes which have Wminweight between them, elserepeat step 5.
Step 8: Then call the function to check all the nodes are visited or not.Step 9: If not, then perform the step 4 repeatedly.
3. ILLUSTRATION AND EXAMPLE OF ALGORITHM
Let’s take the example shown in figure given below, having four cities or nodes A, B, C, and D withweight 4, 2, 3, and 1 respectively.Initializing the variables which are going to be used in this algorithm.
Arrweight[], is used to store the weight of all edges. Wmin is a variable to store minimum from array. Wunvisited is a buffer to store the unvisited weight of graphs.
According to Step 2, Now every weight will be stored in the array say, Arrweight[]. Now the value ofArrweight[] will be:Arrweight[] = 4, 2, 3, 1;According to Step 3, After performing sorting using any sorting technique the array will store thevalues in ascending order, which will be:
Arrweight[] = 1, 2, 3, 4;
According to Step 4, Wmin in the array Arrweight[] is 1. So we select those nodes which have weightequivalent to 1. Here we select A and C node.
B 4 NA
B
C
D
A 4 N
A 1 N
B 2 N
C 1
D 2
N
N
D 3
C 3
N
N
Figure 4: Linked List Arrangement of Graph
N- NULL
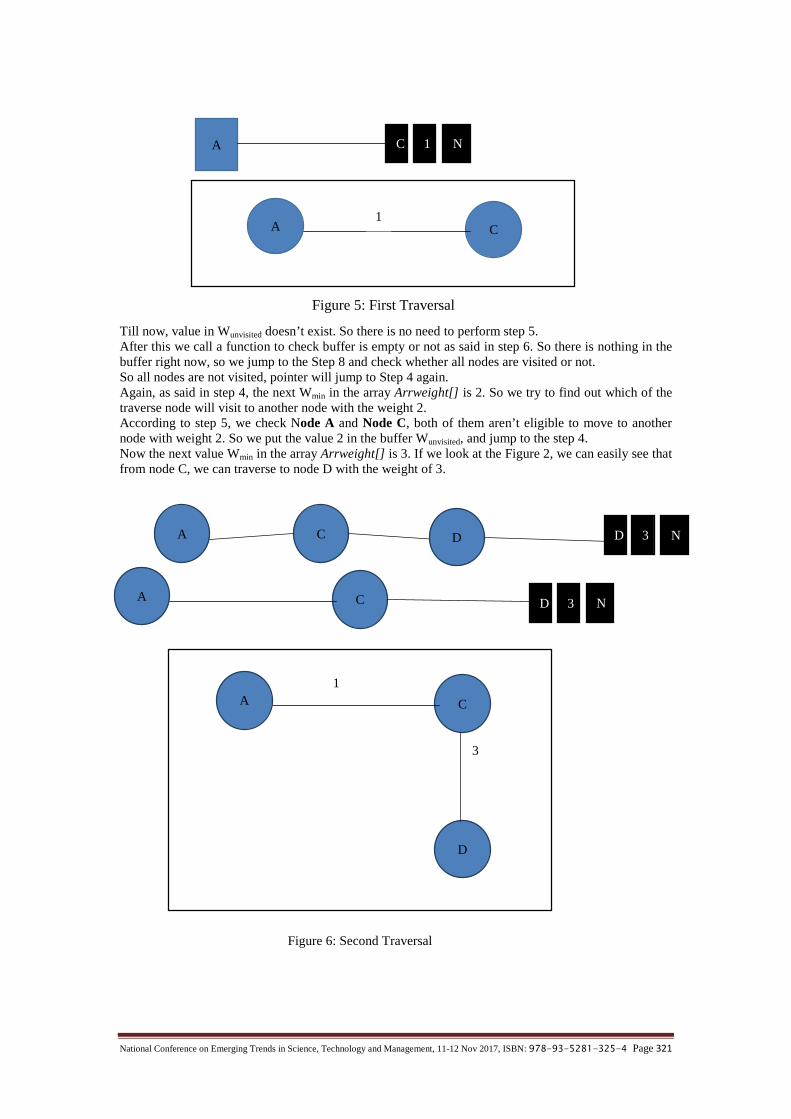
National Conference on Emerging Trends in Science, Technology and Management, 11-12 Nov 2017, ISBN: 978-93-5281-325-4 Page 321
Till now, value in Wunvisited doesn’t exist. So there is no need to perform step 5.After this we call a function to check buffer is empty or not as said in step 6. So there is nothing in thebuffer right now, so we jump to the Step 8 and check whether all nodes are visited or not.So all nodes are not visited, pointer will jump to Step 4 again.Again, as said in step 4, the next Wmin in the array Arrweight[] is 2. So we try to find out which of thetraverse node will visit to another node with the weight 2.According to step 5, we check Node A and Node C, both of them aren’t eligible to move to anothernode with weight 2. So we put the value 2 in the buffer Wunvisited, and jump to the step 4.Now the next value Wmin in the array Arrweight[] is 3. If we look at the Figure 2, we can easily see thatfrom node C, we can traverse to node D with the weight of 3.
A C 1 N
A C1
Figure 5: First Traversal
Figure 6: Second Traversal
A C D 3 N
A C
D
A C D D 3 N
1
3

National Conference on Emerging Trends in Science, Technology and Management, 11-12 Nov 2017, ISBN: 978-93-5281-325-4 Page 322
Now from step 5, we see the value in Wunvisited. There is a value 2, and now we have three nodes thatare already traversed. We already checked node A and node C, now if we look at node D in the Figure2, we can see that from node D to node B we can traverse easily with the weight 2.Now the traversal of nodes will be like as shown below in figure 5.
As in step 6, we look for another element in the buffer, but it is empty. So we skip the step 7 and jumpto step 8. Now, all the nodes are traversed, so we can simply end this algorithm here.
4. CONCLUSION
Solution of travelling salesman problem can also solve the problem in which we need to find theminimum traversed path from one node to another.In conclusion, we can say that this algorithm will work to find the shortest path to solve the Travellingsalesman problem without designing a Minimum Spanning Tree. There are number of steps to traverseall the cities by travelling minimum distance between two nodes.
REFERENCES
[1]. Kruskal, J.B., “On the shortest spanning subtree of a graph and the Travelling salesman problem.” Proc.Amer. Math. Soe, page 48-50, 1956.
[2]. Papadimitriou, Christos H. “The Euclidian travelling salesman is NP-Complete,” Theoretical computerscience, 4, pages 237-244, 1977.
[3]. Papadimitriou, Christos H.; Yannakakis, M., “The travelling salesman problem with distanced one andtwo.” Math.Oper. Res., 18: page 1-11, 1993.
[4]. Serdyukov, A.I., “An algorithm with an estimate for the travelling salesman problem of the maximum,”upravlycomycsistemy, 25: page 80-86.
[5]. Cormon, T.H., Leiserson, C.E., Rivest, r, L; stein, C, “The travelling salesman problem.” Introduciton toalgo, Mc-Graw hill, page 1027-1033.
[6]. Ellis Horowitz, SartajSahni, Sanguthevarrajasekaran, “Fundamentals of Computer Algorithms.” SecondEdition, pages 422-435, 2011
A C
DB
1
2
3
Figure 5: Result of the proposed solution

National Conference on Emerging Trends in Science, Technology and Management, 11-12 Nov 2017, ISBN: 978-93-5281-325-4 Page 323
PRODRUG DESIGN TO OPTIMIZE DRUG DELIVERYTO COLON: A REVIEW
Singh Brijesh*, Ghosh S.K.E.mail: [email protected]
Department of Pharmaceutical Sciences, Dibrugarh University, Dibrugarh-786004(Assam)
Abstract - Classical prodrug design represents a nonspecific chemical approach to mask undesirable drugproperties such as limited bioavailability, lack of site specificity and chemical instability. Colon is beinginvestigated for delivery of protein and peptide based drug molecules. Colon specific drug delivery isdesigned to target drug molecules specifically to this area. Development of site specific delivery systems mayexploit a specific property of the target site for drug release. The gastrointestinal tract is inhabited by over400 bacterial species, each having a specific place and role in the tract. Colon the distal part of the intestineis inhabited by a large variety of gram negative microflora. This microflora produces a large number ofenzymes which are being exploited for formulation of colon specific drug delivery. This review highlightsevolving strategies in targeted prodrug design.
1. TARGETED DRUG DELIVERY TO COLON
Targeted drug delivery to the colon is highly desirable for local treatment of a variety of bowel diseasessuch as (ulcerative colitis, Crohn's disease) amebiosis, colonic cancer, for local treatment of localcolonic pathologies and the systemic delivery of protein and peptide drugs (Oluwatoyin et al 2005).Drug delivery in general aims to increase the concentration of pharmacologically active substances atthe target site, while limiting the exposure of non-target tissues and organs thus the ratio between effectand toxicity of a substance may be improved. Colonic drug delivery is identified as a promisingapproach to prevent colonic cancer by interfering in the early stages of carcinogenesis withnonsteroidal anti-inflammatory drugs (NSAIDs), ulcerative colitis, Crohn’s disease and amebiasis.Various studies have also demonstrated that NSAIDs prevent colon cancer and there are three lines ofevidence for this. First, cancer prevention studies suggest that there may be a 40-50% reduction inmortality from colorectal cancer in persons who take NSAID’s on regular basis (Smalley and Dubois,1997). Second, NSAID’s reduce the number and size of colon adenomas (Shiff and Basil, 1997) andthird there is also evidence that the NSAID’s suppress the HNPCC-associated mutator phenotype infavor of a more stable subset of cells (Ruschoff et al., 1998). The colon is considered as the preferredabsorption site for the oral administration of peptide/ amide drugs because of the relatively lowproteolytic activity (V.H.L.Lee et al., 1990). The in-vivo release of colonic drug delivery systems canbe characterized by a blood concentration versus time curve and its related kinetic parameters such aslag time, pulse time and systemic or local bioavailability. The local bioavailability may be assessed byimaging techniques, recovery in feces or stable isotope technique. The criteria to judge the releasecharacteristics should be based on the nature of delivery system and human physiology. Dose dumpingin the stomach and preliminary release in the small intestine must be avoided because the orocaecaltransit time in a fasted state for oral dosage forms is on an average of 240 minutes, a lag time of at least150 minutes should be observed under normal conditions. Since colonic delivery involves drug releasein region in which bacteria are present, a prolonged lag time should coincide with proven bacterialenzyme activity. Since the viscosity of feces increases significantly in the descending colon, drugrelease is required within the residence time in the ascending and transverse colon. The residence timein the colonic segments has been estimated to be 7-12 hours for man and 17-21 hours for women(Schellekens R.C.A. et al, 2010). However the gastrointestinal toxicity associated with theconventional NSAID’s may limit their long term use for cancer prevention. More recent evidenceinvolves the effective use of NSAID’s in not only preventing carcinogenesis, but also in halting thegrowth and progression of polyps, a progression that usually culminates in full-blown colorectalcarcinoma (Kalgutkar et al, 1998; Janne and Mayer, 2000). Upper gastrointestinal bleeding is themajor event of NSAID’s and co-administration of proton pump inhibitors and H2 receptor antagonistshas been established as a means of preventing such an effect (Ishikawa S. et al, 2008). The study ofCioli et al (1979) suggested that the direct contact of tissue with NSAID’s play an important role in theproduction of gastrointestinal tract lesions. The study also confirmed that gastric side effects were dueto the presence of carboxylic group in parent drug. NSAID’s containing carboxylic group are poorlyabsorbed from the gastrointestinal tract because of unfavorable physiochemical properties. Colontargeted drug delivery system for Zaltoprofen/ Aceclofenac/ Metronidazole have evolved out of theneed to, majority of drug load to colon without being released in stomach and small intestine. As aresult, it is possible to provide an effective and safe therapy for the prevention of colorectal cancer,ulcerative colitis, Chron’s diseases and amebiasis, even with a low dose of Zaltoprofen/ Aceclofenac/

National Conference on Emerging Trends in Science, Technology and Management, 11-12 Nov 2017, ISBN: 978-93-5281-325-4 Page 324
Metronidazole. Zaltoprofen and Aceclofenac are NSAID’s, having excellent effects on post-surgery orpost-trauma chronic inflammation. It is also used in the treatment of rheumatoid arthritis, osteoarthritisand other chronic inflammatory pain conditions (Hirate et al 2006, Aher B.K. 2012). They are notonly cyclooxygenases but also of bradykinin-induced 12-lipoxygenase inhibitor (Tang et al 2005). Theprodrug approach is one of the several promising tools for targeting drug to colon where the carriersdegrade exclusively by colonic bacteria at target site and prodrug is converted into active drug at targetsite. The non-essential amino acids viz. glycine and tyrosine justify there use as a carrier as they havebroad spectrum anti-inflammatory, cytoprotective and immunomodulatory properties (Hibib et al2006), further it would also expected to synergize Zaltoprofen/ Aceclofenac activity. Amino acidsbeing a natural component of our body are non-toxic and also free from side-effects. An increase inhydrophilicity has also been proposed due to amino acids polar group (Sinha and Kumria 2003). Inthe light of this information, it is planned to synthesize prodrug of Zaltoprofen/ Aceclofenac for colontargeting delivery systems which can be used to decrease both the incidence and multiplicity of colontumors, and to decrease the overall colon tumor burden.The colon is believed to be a suitable site for absorption of peptides and protein drugs because offollowing reasons:-
I) Less diversity and intensity of digestive enzymes.II) Comparatively proteolytic activity of colonic mucosa is much less than that observed in the
small intestine, thus colon specific drug delivery system protects peptide drugs from hydrolysisand enzymatic degradation in the duodenum and jejunum and eventually releases drugs in theileum or colon which leads to greater systemic bioavailability.
III)The colon has along residence time (upto 5 days) (Basit et al 2003) and is highly responsive toabsorption enhancers (Akala et al 2003).
Oral route is most convenient and preferred route but other routes for colon specific drug delivery mayalso be used. Rectal administration offers the shortest route for targeting drugs to colon. Howeverreaching the proximal part of the colon via rectal administration is difficult. Rectal administration isalso being uncomfortable for the patient and compliance may be less than optimal (Watts et all 1997).Drug preparation for intra rectal administration is supplied as solutions, foam and suppositories. Theintra rectal route is used both as a means of systemic dosing and for the delivery of topically activedrug to the large intestine. Corticosteroids such as hydrocortisone and prednisolone are administeredvia rectum for the treatment of ulcerative colitis, although these drugs are absorbed from the largebowel. It is generally believed that their efficacy is mainly due to topical application. The concentrationof drug reaching the colon will depend on formulation factors, the extent of retrograde spreading andthe retention time. Foam and suppositories have been shown to retain mainly in the rectum and sigmoidcolon, while enema solutions have a great spreading capacity.Because of the high water absorption capacity of colon, the colonic contents are considerably viscousand their mixing is not efficient thus availability of most drugs to the absorptive membrane is low. Thehuman colon has over 400 distinct species of bacteria as resident flora, a possible population of up to1010 bacteria per gram of colonic contents. Among the reactions carried out by these gut flora are azo-reduction and enzymatic cleavage. These metabolic processes may be responsible for the metabolismof synthesized drugs and may also be applied to colon-targeted delivery of peptide basedmacromolecules like insulin by oral administration (Chein 2005). Colonic disease, drugs and targetsides are summarized in table 1.Table 1. Colon targeting diseases, drugs and sites (Vyas et al 2002)
Targeted sites Disease conditions Drug and active agents
Topical actionInflammatory Bowel Diseases, Irritable
bowel disease and Crohn's disease
Hydrocortisone, Budenoside,Prednisolone, Sulfaselazine,
Olsalazine, Mesalazine,Balsalazide
Local actionChronic pancreatitis pancreatactomy and
cystic fibrosis Colorectal cancerDigestive enzyme supplements
5-Flourouracil
Systemicaction
To prevent gastric irritationTo prevent first pass metabolism of
orally ingested drugsOral delivery of peptidesOral delivery of vaccines
NSAIDsSteroids
InsulinTyphoid

National Conference on Emerging Trends in Science, Technology and Management, 11-12 Nov 2017, ISBN: 978-93-5281-325-4 Page 325
1.1. Advantages of colon targeted drug delivery over conventional drug delivery
Drugs that are destroyed by the acidic environment of the stomach or metabolized by pancreaticenzymes are only slightly affected and can be absorbed from colon so colon targeted drug delivery willbe useful for these drugs. Chronic colitis e.g. ulcerative colitis and Crohn's disease is currently treatedwith glucocorticoids and anti-inflammatory drugs. Administration of glucocorticoids e.g.dexamethasone and methyl prednisolone by the oral and intravenous routes produce systemic sideeffects including immunosuppression, adenosuppression, cushinoid symptoms and bone resorption.Thus the selective delivery of drug to colon could lower the required dose and hence reduce thesystemic side effects. The colon specific drug delivery system has the advantage of more effectivetherapy in terms of reduced dose and reduced undesirable side effects often associated with high doses(McLeod et al 1994). Colonic drug delivery system also would be advantageous when a delay inabsorption is desirable from the therapeutic point of view as for the treatment of diseases that havepeak symptoms in the early morning and that exhibit circadian rhythms such as nocturnal asthma,angina and rheumatoid arthritis (Aswar P. et. al. 2009).
1.2. Features of colon that makes it suitable for targeting various drugs:
a) Colon has lower metabolic activities.b) Responsiveness to absorption enhancers.c) Targeting opportunities offered by colonic bacterial enzymes.d) It has longer residence time.e) Trans mucosal and membrane potential difference that is significant in absorption of drugs
(ionized or unionized).
1.3. Anatomy of human colon:The large intestine extends from the ileo-cecal junction to the anus and it is divided into colon,rectum and anal canal. The entire colon is about 5 feet (150 cm) long, and is dived into fivemajor segments. The rectum is the last anatomic segment before the anus. The ascending anddescending colon are supported by peritoneal folds called mesentery. The right colon consistsof the cecum, ascending colon (approximately 20 cm long), hepatic flexure and the right halfof the transverse colon (normally 45 cm in length). The left colon consists of the left half ofthe transverse colon, splenic flexure, descending colon (approximately 30 cm long) andsigmoid colon (approximately 40 cm in length) (Figure 1.1). Cecum is the widest part of thecolon and approximately 8.5 cm long (Jain et al. 2007). Its main functions are:
a) To absorb fluids and salts that remains after the completion of intestinal digestion.b) To mix its contents with mucus for lubrication.
1.3.1. Structure of colonic wallThe wall of colon is made up of four layers: serosa, external muscularis, sub-mucosa and mucosa. Thesquamous epithelium of serosa is covered with adipose tissue which forms distended fat pouchesknown as appendices epiplocicae.
Figure 1: Anatomy of Gastrointestinal Tract
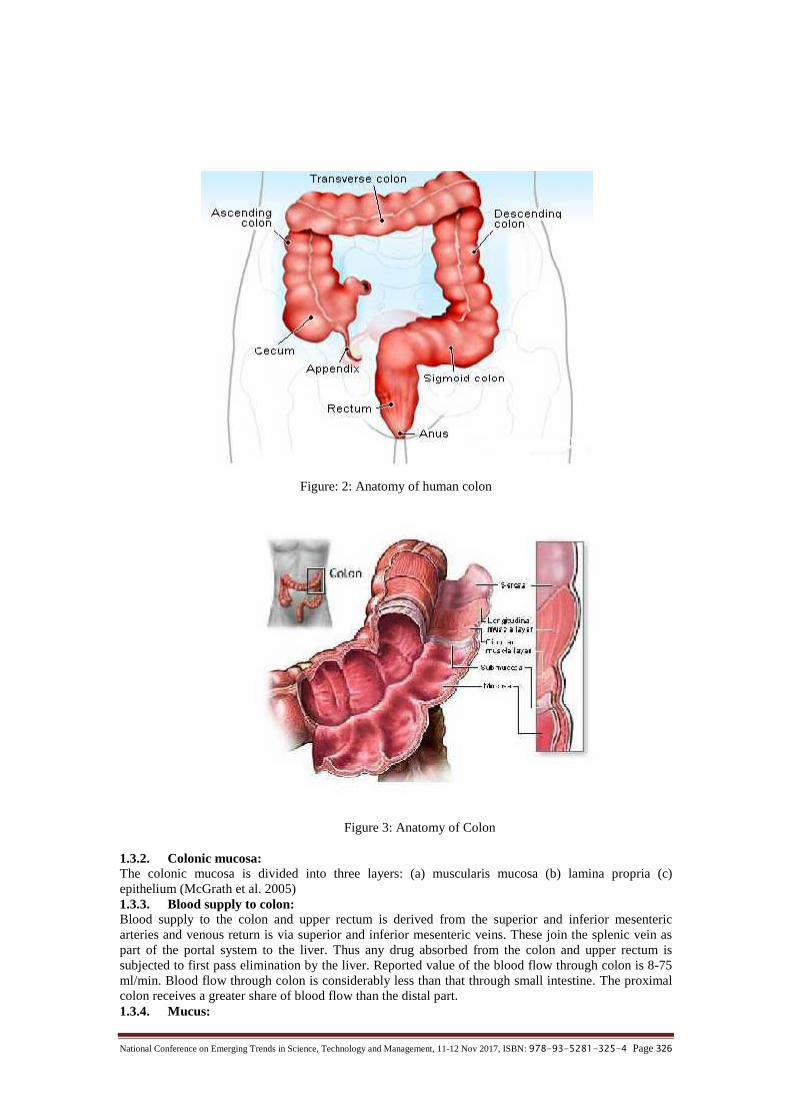
National Conference on Emerging Trends in Science, Technology and Management, 11-12 Nov 2017, ISBN: 978-93-5281-325-4 Page 326
Figure: 2: Anatomy of human colon
Figure 3: Anatomy of Colon
1.3.2. Colonic mucosa:The colonic mucosa is divided into three layers: (a) muscularis mucosa (b) lamina propria (c)epithelium (McGrath et al. 2005)1.3.3. Blood supply to colon:Blood supply to the colon and upper rectum is derived from the superior and inferior mesentericarteries and venous return is via superior and inferior mesenteric veins. These join the splenic vein aspart of the portal system to the liver. Thus any drug absorbed from the colon and upper rectum issubjected to first pass elimination by the liver. Reported value of the blood flow through colon is 8-75ml/min. Blood flow through colon is considerably less than that through small intestine. The proximalcolon receives a greater share of blood flow than the distal part.1.3.4. Mucus:
National Conference on Emerging Trends in Science, Technology and Management, 11-12 Nov 2017, ISBN: 978-93-5281-325-4 Page 327
Mucus is produced by goblet cells. Its acts as lubricant, it plays an important role in protecting colonfrom abrasion from solid matter particularly in the distal part.
1.3.5. Colonic environment:Colonic environment differs from the other parts of the gastrointestinal tract. The absorptive capacityof the colon is much less than that of small intestine due to reduced surface area. The mucosal surfaceof colon is similar to that of small intestine at birth but rapidly changes by losing villa leaving a flatmucosa with deep crypts. As the gut ages there is decrease in the number of non-goblet crypt cells.1.3.6. Nervous control:The vagii to the proximal colon and pelvic nerves to the distal colon provide parasympathetic supply tothe colon, where as sympathetic supply is via the splanchnic and lumbar colonic nerves, which supplythe proximal and distal colon respectively. Vagal stimulation initiates segmental contractions in theproximal colon where as pelvic nerve stimulation causes tonic propulsions and contractions in thedistal colon. Stimulation of either of the splanchnic or lumbar sympathetic nerves causes the colonicmuscles to relax.1.3.7. Colonic pH:The mean pH value in colonic lumen is 6.4 ± 0.6 in ascending colon, 6.6 ± 0.8 in transverse colon and7.0 ± 0.7 in the descending colon. Many other factors such as disease, diet, therapeutic agents orformulations may alter pH value of the colonic segments (McGrath A., 2005).1.3.8. Colonic microflora:The gastrointestinal tract is sterile at the time of birth, but colonization typically begins within fewhours of birth, starting in small intestine and increases gradually over the period of several days. Slowmovement of material through the colon allows a large microbial population to live there. The upperregion of gastrointestinal tract has a very small number of bacteria (103 CFU/ml). Under normalconditions the microflora of the proximal small bowel is similar to those of stomach, the bacterialconcentration 103-104 CFU/ml. The lower and distal ileum has a bacterial concentration of 106-107
CFU/ml. The concentration of bacteria in human colon is 1011-1012 CFU/ml (McGrath A., 2005).The bacterial microflora is predominantly anaerobic with some aerobic species and is composed ofmore than 400 strains, like of Bacteroides, Eubacteria, Clostridia, Enterococci, Enterobacteria,Klebsiella pneumonia and Ruminoccous etc (Kager L. et. al., 1981).Table 2. Metabolizing enzymes in the human colon:
Enzymes Microorganisms Metabolic reaction catalyzedEsterase & amidase E.coli, P.vulgaris
B.subtalis, B.mycoidesCleavage of ester or amidases ofcarboxylic acids
Glucosidase Clostridia, Eubacteria Cleavage of β-glycosidases ofalcohols and phenols
Glucoronidase E.coli, A.aerogens Cleavage of β-glucoronidases ofalcohol and phenols
Hydrogenase Clostridia spp.Lactobacilli spp.
Reduce carbonyl groups andaliphatic double bonds
Azoreductase Clostridia Spp.,Lactobacilli, E.coli
Reductive cleavage of azocompounds
Nitroreductase E.coli, Bacteroides Reduce heterocyclic and aromaticcompounds
Sulfoxide reductaseN-Oxide reductase
E.coli Reduce N-Oxides and Sulfoxides
2. Drug absorptionMolecules that are degraded/ poorly absorbed in the upper gastrointestinal tract, such as peptides andproteins may be better absorbed from the colon due to its environmental conditions. Successful colonicdrug delivery requires careful consideration of number of factors, including the properties of the drugs,the type of delivery system and its interaction with healthy or diseased gut (Philip A. et. al., 2010).3. Approaches used for site specific drug delivery to colon:There are several approaches used for site-specific drug delivery to colon when they are given orally:-
3.1. Primary approaches for colon specific drug delivery: (Prasad et al 1996) Coating with pH- sensitive polymers Delayed (formulation of timed released system) release drug delivery system Exploitation of carriers that are degraded specifically by colonic bacteria
i. Prodrug approach for drug delivery to colon
National Conference on Emerging Trends in Science, Technology and Management, 11-12 Nov 2017, ISBN: 978-93-5281-325-4 Page 328
ii. Azo-polymeric approach for drug delivery to coloniii. Polysaccharide based approach for drug delivery to colon
3.1.1. Coating with pH-sensitive polymers:In the stomach pH ranges between 1 and 2 during fasting but increases after consumption of food. ThepH is about 6.5 in the proximal small intestine and about 7.5 in the distal small intestine. From ileum tothe colon pH declines significantly and is about 6.4 in the ceacum. However, pH values as low as 5.7have been measured in the ascending colon in healthy volunteers (Bussemer et al. 2001). The pH inthe transverse colon is 6.6 and in the descending colon 7.0. Use of pH-dependent polymers is based onthese differences in pH levels. The polymers described as pH-dependent in colon specific drug deliveryare insoluble at low pH levels but become increasingly soluble as pH rises (Ashford et al 1993).Although a pH-dependent polymer can protect a formulation in the stomach and proximal smallintestine, it may start to dissolve even in the lower small intestine and the site-specificity offormulations can be poor (Fukui et al 2001). The decline in pH from the end of the small intestine tothe colon can also result in problems such as lengthy lag times at the ileo-cecal junction or rapid transitthrough the ascending colon can also result in poor site-specificity of enteric-coated single unitformulations (Ashford et al 1993).
3.1.2. Delayed (formulation of timed released system) release drug delivery system:Time controlled release system such as sustained or delayed release dosage forms are also verypromising. However due to potentially large variation of gastric emptying time of dosage forms inhumans (Adkin et al 1993), in this approach colon arrival time of dosage forms can not be accuratelypredicted resulting in poor colonical availability. The dosage forms my also applicable as colontargeting dosage forms by prolonging the lag time of about 5.5 h (range 5 to 6 h). Disadvantage of TCRsystem are-
I) Gastric emptying time varies markedly between subjects or in a manner dependent on typeand amount of food intake.
II) Gastrointestinal movement, especially peristalsis or contraction in the stomach would resultin change in gastrointestinal transit of the drug (Fukui et al 2001).
III) Accelerated transit through different regions of the colon has been observed in patients withthe inflammatory bowel diseases, the carcinoid syndrome, diarrhoea and the ulcerative colitis(Vonder et al 1993).
Therefore time dependent systems are not ideal to deliver drugs to colon, specifically for the treatmentof colon related disease.Appropriate integration of pH sensitive and time release functions into a single dosage form mayimprove the site specificity of drug delivery into a single dosage form may improve the site specificityof drug delivery to the colon. This is because the transit time of dosage forms in the small intestine isless variable i.e. about 3+1 hour (Kinget et al 1998). The time release function (or timer function)should work more efficiently in the small intestine as compared to stomach. In the small intestine drugcarrier will be delivered to the target side and drug release will begin at a predetermined time pointafter gastric emptying. On the other hand in the stomach, the drug release should be suppressed by a pHsensing function (acid resistance) in the dosage form which would reduce variation in gastric residencetime (Fukui et al 2001).3.1.3. Enteric coated Time Release Press Coated Tablets:Enteric-coated time release press coated (ETP) tablets are composed of three components, a drugcontaining core tablet (rapid release function), the press coated swellable hydrophobic polymer layer(time release function) and an enteric coating layer (acid resistance function) (Takaya et al 1995). ETPtablet does not release the drug in the stomach due to the acid resistance of the outer enteric coatinglayer. After gastric emptying, the enteric coating layer rapidly dissolves and the intestinal fluid beginsslowly erode the press coated polymer layer and when the erosion front reaches to the core tablet, rapiddrug release occurs since the erosion process takes a long time, there is no drug release period (lagphase) after gastric emptying. The duration of lag phase, controlled either by the weight or compositionof the polymer (hydroxypropylmethylcellulose acetate succinate) layer (Fukui et al 2001).3.1.4. Exploitation of carriers that are degraded specifically by colonic bacteria:The microflora of colon is in the range of 1011-1012 CFU/ml, consisting mainly of anaerobic bacteria,e.g. Bacteroides, Bifidobacteria, Eubacteria, Clostridia, Enterococci, Enterobacteria andRuminococcus etc. This vast microflora fulfills its energy needs by fermenting various types ofsubstrates that have been left undigested in the small intestine, e.g. di-and tri- saccharides,polysaccharides etc (Rubinstein et al 1990, Cummings et al 1987). For this fermentation, the microfloraproduces a vast number of enzymes like glucoronidase, xylosidase, arabinosidase, galactosidase,nitroreductase, azoreducatase, deaminase, and urea dehydroxylase. Because of the presence of the

National Conference on Emerging Trends in Science, Technology and Management, 11-12 Nov 2017, ISBN: 978-93-5281-325-4 Page 329
biodegradable enzymes only in the colon, the use of biodegradable polymers for CSDDS seems to be amore site-specific approach as compared to other approaches (Basit et al 2003). These polymers shieldthe drug from the environments of stomach and small intestine and are able to deliver the drug to thecolon. On reaching the colon they undergo assimilation by micro-organism or degradation by enzyme(Swift et al 1992) or break down of the polymer back bone leading to a subsequent reduction in theirmolecular weight and thereby loss of mechanical strength. They are then unable to hold the drug entityany longer (Hergenrother et al 1992).3.1.5. Prodrug approach for drug delivery to colon:Prodrug is pharmacologically inactive derivative of parent drug molecule that requires spontaneous or
enzymatic transformation in-vivo to release the active drug. For colonic delivery the prodrug aredesigned to undergo minimal absorption and hydrolysis in the tracts of upper GIT and undergoenzymatic hydrolysis in the colon, there by releasing the active drug moiety from the drug carrier.Metabolism of azo compounds by intestinal bacteria is one of the most extensively studied bacterialmetabolic process (Sinha et al 2003). A number of other linkages susceptible to bacterial hydrolysisespecially in the colon have been prepared where the drug is attached to hydrophobic moieties likeamino acids, glucoronic acids, glucose, glactose, cellulose etc.Limitations of prodrug approach is that it is not very versatile approach as it's formulation dependsupon the functional group available on the drug moiety for chemical linkage. Further more prodrugs arenew chemical entities and need a lot of evaluation before being used as carriers (Sinha et al 2003).3.1.6. Azo bond conjugates:The intestinal microflora is characterized by a complex and relatively stable community ofmicroorganism, many with physiological functions which play vital roles in disease and health. Inaddition to protect the patient against colonization of the intestinal tract by potentially pathogenicbacteria, the microflora is responsible for a wide variety of metabolic processes including the reductionof nitro and azo groups in environmental and therapeutic compounds (Raffi R. et al. 1991).Sulphasalazine was used for treatment of rheumatoid arthritis and anti inflammatory diseases.Chemically it is salicylazosulphapyridine where sulfapyridine is linked to salicylate radical by an azobond (Khan A. et. al. 1982). When taken orally, only small proportion of the ingested dose is absorbedfrom small intestine and bulk of the sulphasalazine reaches to colon. There it is splits at the azo bondby colonic bacteria with the liberation of sulphapyridine and 5-amino salicylic acid. Sulphapyridine isresponsible for most of the side effects of sulphasalazine. Hence various new less toxic carrier moietieshas led to the development and testing of number of other azo-bond prodrugs. In view of abovementioned fact, number of prodrugs of 5-ASA had been developed by replacing the carrier moleculewith others e.g. prodrug of olsalazine which is dimer representing two molecules of 5-ASA that linkedvia an azo bond, a non absorbable sulphanilamide ethylene polymer in poly-amino salicylic acid(Garreto M. et. al. 1981).3.1.7. Glycoside conjugates:Steroid glycosides and glycosidase activity of the colonic microflora form the basis of new colontargeted drug delivery system. Drug glycosides are hydrophilic and thus, poorly absorbed from smallintestine. Once such glycoside reaches to the colon it can be cleaved by bacterial glycosidase releasingfree drug to be absorbed by the colonic mucosa (Chourasia M.K. et. al. 2003).3.1.8. Glucuronide conjugates:Glucuronide and sulphate conjugation is the major mechanisms for the inactivation and preparation forclearance of a variety of drugs. Bacteria of lower gastrointestinal tract secrete β-glucuronidase and candeglucuronidate a variety of drugs in the intestine (Scheline R.P. et. al. 1968). Since deglucuronidationprocess results in the release of active drug and enables its reabsorption.3.1.9. Cyclodextrin conjugates:Cyclodextrin are cyclic oligosaccharides consisted of six to eight glucose units through α-1, 4glucosidic bonds and have been utilized to improve certain properties of drugs such as solubility,stability and bioavailability. The interior of these molecules is relatively lipophilic and the exteriorrelatively hydrophilic, they tend to form inclusion complexes with various drug molecules (Stella V. J.et. al. 1997). They are known to be barely capable of being hydrolyzed and only slightly absorbed inpassage through the stomach and small intestine; however they are fermented by colonic microflorainto small saccharides and thus absorbed in the large intestine (Flourie B. et. al. 1993).3.1.10. Amino-acid conjugates:Due to the hydrophilic nature of polar groups like –NH2 and –COOH, that is present in proteins andtheir basic unit (amino acids), they reduce the membrane permeability of amino acids and proteins.Non-essential amino acids such as tyrosine, glycine, methionine and glutamic acid were conjugatedwith drugs. The glutamic acid conjugate of salicyluric acid (Salicyl-glutamic acid conjugate) was found
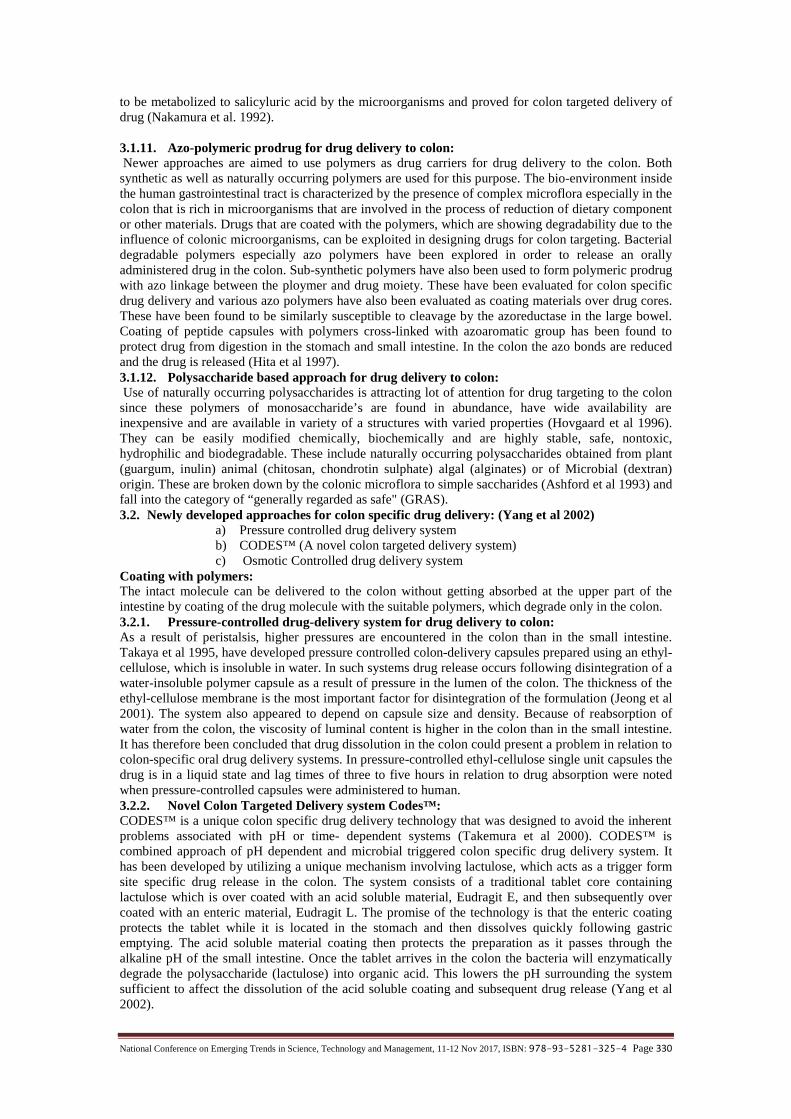
National Conference on Emerging Trends in Science, Technology and Management, 11-12 Nov 2017, ISBN: 978-93-5281-325-4 Page 330
to be metabolized to salicyluric acid by the microorganisms and proved for colon targeted delivery ofdrug (Nakamura et al. 1992).
3.1.11. Azo-polymeric prodrug for drug delivery to colon:Newer approaches are aimed to use polymers as drug carriers for drug delivery to the colon. Both
synthetic as well as naturally occurring polymers are used for this purpose. The bio-environment insidethe human gastrointestinal tract is characterized by the presence of complex microflora especially in thecolon that is rich in microorganisms that are involved in the process of reduction of dietary componentor other materials. Drugs that are coated with the polymers, which are showing degradability due to theinfluence of colonic microorganisms, can be exploited in designing drugs for colon targeting. Bacterialdegradable polymers especially azo polymers have been explored in order to release an orallyadministered drug in the colon. Sub-synthetic polymers have also been used to form polymeric prodrugwith azo linkage between the ploymer and drug moiety. These have been evaluated for colon specificdrug delivery and various azo polymers have also been evaluated as coating materials over drug cores.These have been found to be similarly susceptible to cleavage by the azoreductase in the large bowel.Coating of peptide capsules with polymers cross-linked with azoaromatic group has been found toprotect drug from digestion in the stomach and small intestine. In the colon the azo bonds are reducedand the drug is released (Hita et al 1997).3.1.12. Polysaccharide based approach for drug delivery to colon:Use of naturally occurring polysaccharides is attracting lot of attention for drug targeting to the colon
since these polymers of monosaccharide’s are found in abundance, have wide availability areinexpensive and are available in variety of a structures with varied properties (Hovgaard et al 1996).They can be easily modified chemically, biochemically and are highly stable, safe, nontoxic,hydrophilic and biodegradable. These include naturally occurring polysaccharides obtained from plant(guargum, inulin) animal (chitosan, chondrotin sulphate) algal (alginates) or of Microbial (dextran)origin. These are broken down by the colonic microflora to simple saccharides (Ashford et al 1993) andfall into the category of “generally regarded as safe" (GRAS).3.2. Newly developed approaches for colon specific drug delivery: (Yang et al 2002)
a) Pressure controlled drug delivery systemb) CODES™ (A novel colon targeted delivery system)c) Osmotic Controlled drug delivery system
Coating with polymers:The intact molecule can be delivered to the colon without getting absorbed at the upper part of theintestine by coating of the drug molecule with the suitable polymers, which degrade only in the colon.3.2.1. Pressure-controlled drug-delivery system for drug delivery to colon:As a result of peristalsis, higher pressures are encountered in the colon than in the small intestine.Takaya et al 1995, have developed pressure controlled colon-delivery capsules prepared using an ethyl-cellulose, which is insoluble in water. In such systems drug release occurs following disintegration of awater-insoluble polymer capsule as a result of pressure in the lumen of the colon. The thickness of theethyl-cellulose membrane is the most important factor for disintegration of the formulation (Jeong et al2001). The system also appeared to depend on capsule size and density. Because of reabsorption ofwater from the colon, the viscosity of luminal content is higher in the colon than in the small intestine.It has therefore been concluded that drug dissolution in the colon could present a problem in relation tocolon-specific oral drug delivery systems. In pressure-controlled ethyl-cellulose single unit capsules thedrug is in a liquid state and lag times of three to five hours in relation to drug absorption were notedwhen pressure-controlled capsules were administered to human.3.2.2. Novel Colon Targeted Delivery system Codes™:CODES™ is a unique colon specific drug delivery technology that was designed to avoid the inherentproblems associated with pH or time- dependent systems (Takemura et al 2000). CODES™ iscombined approach of pH dependent and microbial triggered colon specific drug delivery system. Ithas been developed by utilizing a unique mechanism involving lactulose, which acts as a trigger formsite specific drug release in the colon. The system consists of a traditional tablet core containinglactulose which is over coated with an acid soluble material, Eudragit E, and then subsequently overcoated with an enteric material, Eudragit L. The promise of the technology is that the enteric coatingprotects the tablet while it is located in the stomach and then dissolves quickly following gastricemptying. The acid soluble material coating then protects the preparation as it passes through thealkaline pH of the small intestine. Once the tablet arrives in the colon the bacteria will enzymaticallydegrade the polysaccharide (lactulose) into organic acid. This lowers the pH surrounding the systemsufficient to affect the dissolution of the acid soluble coating and subsequent drug release (Yang et al2002).
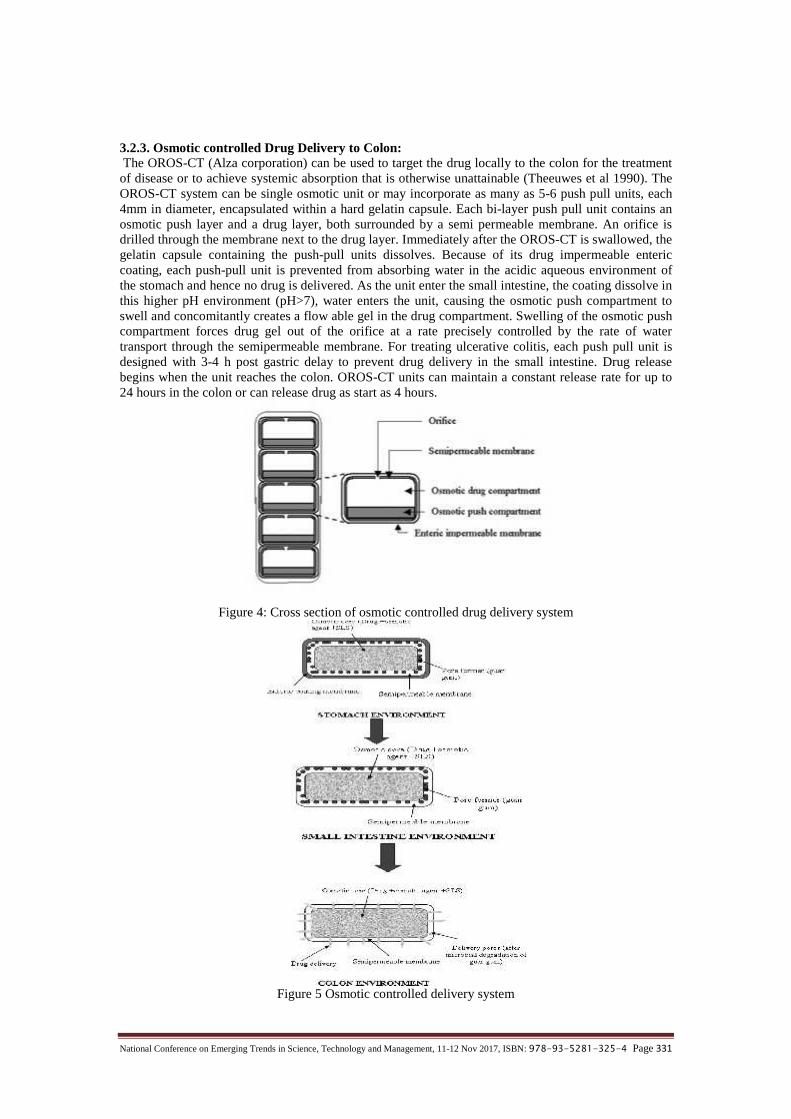
National Conference on Emerging Trends in Science, Technology and Management, 11-12 Nov 2017, ISBN: 978-93-5281-325-4 Page 331
3.2.3. Osmotic controlled Drug Delivery to Colon:The OROS-CT (Alza corporation) can be used to target the drug locally to the colon for the treatment
of disease or to achieve systemic absorption that is otherwise unattainable (Theeuwes et al 1990). TheOROS-CT system can be single osmotic unit or may incorporate as many as 5-6 push pull units, each4mm in diameter, encapsulated within a hard gelatin capsule. Each bi-layer push pull unit contains anosmotic push layer and a drug layer, both surrounded by a semi permeable membrane. An orifice isdrilled through the membrane next to the drug layer. Immediately after the OROS-CT is swallowed, thegelatin capsule containing the push-pull units dissolves. Because of its drug impermeable entericcoating, each push-pull unit is prevented from absorbing water in the acidic aqueous environment ofthe stomach and hence no drug is delivered. As the unit enter the small intestine, the coating dissolve inthis higher pH environment (pH>7), water enters the unit, causing the osmotic push compartment toswell and concomitantly creates a flow able gel in the drug compartment. Swelling of the osmotic pushcompartment forces drug gel out of the orifice at a rate precisely controlled by the rate of watertransport through the semipermeable membrane. For treating ulcerative colitis, each push pull unit isdesigned with 3-4 h post gastric delay to prevent drug delivery in the small intestine. Drug releasebegins when the unit reaches the colon. OROS-CT units can maintain a constant release rate for up to24 hours in the colon or can release drug as start as 4 hours.
Figure 4: Cross section of osmotic controlled drug delivery system
Figure 5 Osmotic controlled delivery system

National Conference on Emerging Trends in Science, Technology and Management, 11-12 Nov 2017, ISBN: 978-93-5281-325-4 Page 332
4. Diseases generally occur in colon:I) Inflammatory bowel disease (IBD)II) Ulcerative colitisIII) Crohn’s disease
4.1. Inflammatory bowel disease (IBD):Inflammatory bowel disease is a collective term encompassing related but distinct chronicinflammatory disorders of gastrointestinal tract such as Crohn’s disease, ulcerative colitis,indeterminate colitis, microscopic colitis and collagenous colitis. Crohn’s disease and ulcerative colitisare the most common diseases. Another chronic disorder of gastrointestinal tract is irritable bowelsyndrome.Inflammatory bowel diseases such as ulcerative colitis and Crohn’s disease are serious intestinaldisease that can ultimately lead to the surgical removal of the colon. It is common in young adults, butcan occur at any age. This disease is worldwide, but it is most common in industrialized countries suchas United States, England and Northern Europe. A survey report states that inflammatory bowel disease(IBD) affects an estimated near about two million peoples in United States alone (Zou M. et al. 2005).
4.2. Treatment of inflammatory bowel disease:
Accurate diagnosis, long term management of inflammatory bowel disease must be governed by thetype of disease and sites involved. Adjunctive treatment with antidiarrheal agents, supplementation ofvitamins and minerals as well proper nutrition is important.5-Amino salicylic acid either in the form of inactive prodrug such as sulfasalazine, balsalazine orolsalazine as controlled release formulations, suppositories, enemas are used in maintaining remissionin mild to moderate active ulcerative colitis. Corticosteroids have been used in treatment ofinflammatory bowel disease since 1955. The various compounds such as prednisone, prednisolone,methylprednisolone and budesonide are applied for systemic and topical short-term treatment inpatients with Crohn’s disease and ulcerative colitis. Because of serious side effects during long-termuse, these drugs are not suitable for maintenance therapy.In severe inflammatory bowel disease, immunosuppressant and immunoregulatory agents may be usedas therapeutic agents. Azathioprine and its metabolite 6-mercaptopurine have been most widely used;methotrexate and cyclosporine are used as alternatives. The therapeutic value of antibiotics,metronidazole and probiotic agents are still debatable. Various oral and colonic drug delivery systemshave been developed; however so far the topical treatment approach in inflammatory bowel disease hasbeen successfully employed mainly with aminosalicylates and corticosteroids (Klotz U. et al. 2005).
4.3. Ulcerative colitis:
Ulcerative colitis is a chronic inflammation of the large intestine (colon). It is a disease that causesinflammation and sores called ulcers, in the lining of the rectum and colon. Ulcer form at sites whereinflammation has killed the cells that usually line the colon then bleed and produce pus. Ulcerativecolitis is closely related to another condition of inflammation of the intestine called Crohn’s disease.Together they are frequently referred as inflammatory bowel disease (IBD).Ulcerative colitis can occur in people of any age, but it usually starts between the age of 15 to 30 years,and less frequent between 50 to 70 years of age. It affects men and women equally and appears to runin families with report upto 20 % of people with ulcerative colitis having a family member or relativewith ulcerative colitis or Crohn’s disease. A high incidence of ulcerative colitis is seen in white andpeople of Jewish descent. Ulcerative colitis is inflammatory chronic disease primarily affecting thecolonic mucosa; it belongs to the inflammatory bowel disease, which is general term for the group ofchronic inflammatory disorders of unknown etiology involving in the gastrointestinal tract (Ardizone S.et al. 2003).
4.4. Symptoms of ulcerative colitis:Most common symptoms of ulcerative colitis are abdominal pain and bloody diarrhea. Followingsymptoms may also be experienced in patients:
a. Anemiab. Weight lossc. Rectal bleedingd. Loss of appetitee. Skin lesionsf. Loss of body fluids and nutrientsg. Fatigue

National Conference on Emerging Trends in Science, Technology and Management, 11-12 Nov 2017, ISBN: 978-93-5281-325-4 Page 333
4.5. Treatment of ulcerative colitis:Both medications and surgery have been used in the treatment of ulcerative colitis. Surgery is reservedfor those who have severe inflammation and life threatening complications. There is no medication thatcan cure ulcerative colitis (Philip A. et al. 2010).4.6. Crohn’s disease:Crohn’s disease, also known as crohn syndrome, is a type of inflammatory bowel disease that mayaffect any part of the gastrointestinal tract from anus to mouth, causing a wide variety of symptoms. Itprimarily causes abdominal pain, diarrhoea (may be bloody if inflammation is severe), vomiting orweight loss. It may also cause complication outside gastrointestinal tract such as anemia, skin rashes,inflammation of the eye, tiredness.Crohn’s disease is caused by interactions between environmental, immunological and bacterial factorsin genetically susceptible individuals. This result in a chronic inflammatory disorder, in which thebody’s immune system attacks the gastrointestinal tract possibly directed at microbial antigens. Thereis a genetic association with Crohn’s disease, primarily with variations of the NOD 2 gene and itsprotein, which senses bacterial cell walls. Siblings of affected individuals are at higher risk. Males andfemales are equally affected. Tobacco smokers are two times more likely to develop Crohn’s diseasethan non smokers.5. Inflammation:Inflammation is a response to tissue injury and infection. When the inflammation process occurs, a
vascular reaction takes place in the fluid of injured site, elements of blood, leukocytes (WBCs) andchemical mediators accumulates at the injured tissue or infection site. The process of inflammation is aprotective mechanism in which body attempts to neutralize and destroy harmful agents at the site ofinjury and to establish conditions for tissue repair. Although there is a relationship betweeninflammation and infection, these terms should not be used interchangeably. Infection is caused bymicroorganisms and result in inflammation, but not all inflammations are caused by infections.Different types of pain:Acute: - Pain occurs suddenly and responds to treatment; can results from trauma, tissue injury,inflammation or surgery.Chronic: - Pain persists for greater than six months and is difficult to treat or control.Cancer: - Pain from pressure on nerves and organs, blockage to blood supply or metastasis to bone.Somatic: - Pain of skeletal muscle, ligaments and joints.Superficial: - Pain from surface areas such as skin and mucous membranes.Vascular: - Pain from vascular or perivascular tissues contributing to headaches or migraines.Visceral: - Pain from smooth muscle and organs.6. Pathophysiology of inflammation:The five characteristics of inflammation called the cardinal sign of inflammation are redness, swelling(oedema), heat, pain and loss of function. Table-2 gives the description and explanation of the cardinalsign of inflammation. The two phases of inflammation are the vascular phase, which occur 10-15minutes after an injury and the delayed phase. The vascular phase is associated with vasodilation andincreased capillary permeability during which blood substances and fluid leave the plasma and go toinjured site. The delay occurs when leukocytes infiltrate the inflamed tissue.Various chemical mediators are released during the inflammation process. Prostaglandins that havebeen isolated from the exudates at inflammatory sites are among them. Prostaglandins (chemicalmediators) have many effects: vasodilation, relaxation of smooth muscle, increased capillarypermeability and sensitization of nerve cells to pain.Cyclo-oxygenase (COX) is enzyme responsible for converting arachidonic acid into prostaglandins andtheir products. This synthesis of prostaglandins causes inflammation and pain at the tissue injury site.There are two enzyme forms of cyclooxygenase: COX-1 and COX-2, protect the stomach lining andregulates blood platelets, COX-2 triggers inflammation and pain.Table: 3 Cardinal Signs of Inflammation
Signs DescriptionErythema(Redness)
Redness occurs in the first phase of inflammation. Blood accumulates in the area oftissue injury because of the release of the body’s chemical mediators (kinins,prostaglandins and histamine) histamine dilates the arterioles.
Edema(Swelling)
Swelling is the second phase of inflammation. Plasma leaks into the interstitial tissueat the injury site. Kinins dilate the arterioles, increasing capillary permeability.
Pain Pain is caused by tissue swelling and the release of chemical meditiators.Heat Heat at the inflammatory site can be caused by increased blood accumulation and may
result from pyrogens (substances that produce fever) that interfere with thetemperature regulating center in the hypothalamus.

National Conference on Emerging Trends in Science, Technology and Management, 11-12 Nov 2017, ISBN: 978-93-5281-325-4 Page 334
Loss offunction
Function is lost because of the accumulation of fluid at the tissue injury site andbecause of pain, which decrease mobility at the effected area.
7. General considerations for design of formulations:The proper selection of a formulation approach is dependent several important factors listed below:(Singh B. et al. 2007)
a. Pathology and pattern of the disease, especially the affected parts of the lowergastrointestinal tract.
b. Physiological composition of the healthy colon.c. The desired release profile of the active ingredient.d. Physiochemical and biopharmaceutical properties of the drug such as solubility, stability
and permeability at desired site.Table: 4 List of marketed products for colonic diseases in India
Sl.No.
Generic name Brand name Dosageform
Therapeutic use Manufacturer
1. Sulfasalazine Salazopyrin Tablet Ulcerative colitis Wallace PharmaceuticalsLtd., Mumbai
2. Tegaserod Tegaspa Tablet Inflammatorybowel diseases,constipation
Lupin Laboratories Ltd.Mumbai
3. 5-Aminosalicylic acid
Pentasa S R tablet Acute ulcerativecolitis of sigmoidand descendingcolon
Ferring Pharmaceuticals,Mumbai
4. Mesalazine Tidocol Tablet Mild and acuteulcerative colitis
Torrent PharmaceuticalsLtd. Ahemdabad
REFERENCES
[1] Adkin D. A., Davis S. S., Sparrow R. A., Wilding I. R. (1993) ‘Colonic transit of different sized tabletsin healthy subjects’ J. Control. Rel., 23, 147-156.
[2] Aher K.B., Bhavar G.B., Joshi H.P., (2012) ‘Development and validation of UV/Visible spectroscopicmethod for estimation of new NSAID, Zaltoprofen in tablet dosage form’ J. Current Pharm. Res., 9 (1),49-54.
[3] Akala E.O., Elekwachi O., Chase V., Johnson H., Marjorie L., Scott K., (2003) ‘Organic redox initiatedpolymerization process for the fabrication of hydrogel for colon specific drug delivery’ Drug Dev. Ind.Pharm., 29(4), 375-386.
[4] Ardizone S., (2003) ‘Ulcerative colitis’ Orphanet. 1-8.
[5] Ashford M., Fell J. T., Attwood D., Sharma H., Woodhead P., (1993) ‘An evaluation of pectin as acarrier for drug targeting to the colon’, J. Control. Rel., 26, 213-220.
[6] Aswar P., Khadabadi S., Kuchekar B., Wane T., Matake N., (2009) ‘Development and in-vitroevaluation of colon specific formulations for orally administered diclofenac sodium’ Arch. Pharm. Sci.& Res., 1, 48-53.
[7] Basit A., Bloor J., (2003) ‘Perspectives on colonic drug delivery’ Business Briefing Pharmtech., 185–190
[8] Bussemer T., Bodmeier I. R., (2001) ‘Pulsatile drug-delivery systems’ Crit. Rev. Ther. Drug Carr.System, 18, 433-458.
[9] Chien Y.W., (2005) ‘Novel Drug Delivery Systems’, 2nd Edition, Marcel Dekker, Inc., New York,Volume 50, 163
[10] Chourasia M., Jain S., (2003) ‘Pharmaceutical approaches to colon targeted drug delivery systems’ J.Pharm. Pharm. Sci., 6, 33-66.
[11] Cioli V., Putzolu S., Rossi V., Carrandino C. (1979) ‘The role of direct tissue contact in the productionof gastrointestinal ulcers by anti-inflammatory drugs in rats’ Toxicol. Appl. Pharmacol., 50, 283–289.
[12] Cummings J. H., Englyst H. N., (1987) ‘Fermentation in the human large intestine and availablesubstrates’ American J. Clin. Nut., 45, 1243-1255.
[13] Flourie B., Molis C., Achour L., Dupas H., Hatat C., Rambaud J.C., (1993) ‘Fate of β cyclodextrin in thehuman intestine’ J. Nutr., 123, 676-680.
[14] Fukui E., Miyamura N., Kobayashi M., (2001) ‘An in-vitro investigation of the suitability of presscoated tablets with hydroxypropyl methylcellulose acetate succinate (HPMCAS) and hydrophobicadditives in the outer shell for colon targeting’ J. Control. Rel., 70, 97-107.

National Conference on Emerging Trends in Science, Technology and Management, 11-12 Nov 2017, ISBN: 978-93-5281-325-4 Page 335
[15] Garreto M., Ridell R. H., Wurans C. S., (1981) ‘Treatment of chronic ulcerative colitis with poly-ASA:A new nona- bosrbable carrier for release of 5-aminosalicylic acid in the colon’ Gastroentero., 84, 1162.
[16] Habib M. M., Hodgso H. J., Davidson B. R., (2006) ‘The role of glycine in hepatic ischemia reperfusioninjury’ Current Pharm. Design, 12, 2953–2967
[17] Hergenrother R. W., Wabewr H. D., Cooper S. L., (1992) ‘The effect of chain extenders and stabilizerson the in-vivo stability of polyurethanes’ J. App. Biomat., 3, 17-22.
[18] Hirate K., Uchida A., Ogawa Y., Arai T., Yoda K., (2006) ‘Zaltoprofen, a nonsteroidal antiinflammatory drug, inhibits bradykinin-induced pain responses without blocking bradykinin receptors’Neurosci. Res., 55, 288-294.
[19] Hita V., Singh R., Jain S. K. (1997) ‘Colonic targeting of metronidazole using azo aromatic polymers,development and characterization’ Drug deliv., 4, 19-22.
[20] Hovgaard L., Brondsted H., (1996) ‘Current applications of polysaccharides in colon targeting’ Crit.Rev. Ther. Dru. Carr. Sys., 13, (3), 185-223.
[21] Ishikawa S., Inaba T., Mizuno M., Okada H., Kuwaki K., Kuzume T., Yokota H., Fukuda Y., Takeda K.,Nagano H., Wato M., and Kawai K., (2008) ‘Incidence of serious upper gastrointestinal bleeding inpatients taking non-steroidal anti-inflammatory drugs in japan’ Acta Medica Okayama, 62 (1), 29-36.
[22] Jain A., Gupta Y., Jain S., (2007) ‘Perspective of biodegradable natural polysaccharides for the sitespecific drug delivery to the colon’ J. Pharm. Pharmceut. Sci., 10, 86-128.
[23] Janne P.A., Mayer R.J., (2000) ‘Primary care: chemoprevention of colorectal cancer’ N. Engl. J. Med.,343, 1960-1968.
[24] Jeong Y., Ohno T., Hu Z., Yoshikawa Y., Shibata N., Nagata S., Takada K., (2001) ‘Evaluation of anintestinal pressure-controlled colon delivery capsules prepared by a dipping method’ J. Cont. Rel., 71,175-182.
[25] Kager L., Liljegvist L., Malmoorg S., Nord C., (1981) ‘Effect of clindamycin prophylaxis on the colonicmicroflora in patients undergoing colorectal surgery’ Antimicrob. Agents Chem., 20, 736-740.
[26] Kalgutkar A.S., Crews B.C., Rowlinson S.W., et al., (1998) ‘Asprin like molecules that covalentlyinactivate cyclooxygenase-2’ Science, 280, 1268-1270.
[27] Khan A., Truelove S. C., Aronseq J. K., (1982) ‘The disposition and metabolism of sulphasalazine(salicylazo-sulphapyridine) in man’ Br. J. Clin. Pharmacol., 13, 523 528.
[28] Kinget R., Kalala W., Vervoort L., Mooter G., (1998) ‘Colonic drug delivery’ J. Drug Targ., 6, 129-149
[29] Klotz U., Schwab M., (2005) ‘Topical delivery of therapeutic agents in the treatment of inflammatorybowel diseases’ Adv. Dr. Del. Rev., 57, 267-279.
[30] McGrath A., (2005) ‘Anatomy and physiology of gastrointestinal tract, bowel and urinary system’ 1-16
[31] McLeod A. D., Friend D. R., Thoma N. T., (1994) ‘Glucocorticoid - dextran conjugates as potentialprodrugs for colon specific delivery hydrolysis in rat gastrointestinal tract contents’, J. Pharm. Sci., 83(9), 1284–1288.
[32] Nakamura J., Asai K., Nishida K., Sasaki H., (1992) ‘A novel prodrug of salicylic acid, salicylic acid-glutamic acid conjugate utilizing hydrolysis in rabbit intestinal microorganism’ Chem. Pharm. Bull.,40, 2164-2168.
[33] Oluwatoyin A.O. and John T.F. (2005) ‘In-vitro evaluation of khaya and albizia gums as compressioncoating for drug targeting to the colon, J. Pharm. Phamacol., 57, 163-168.
[34] Philip A., Philip B., (2010) ‘Colon targeted drug delivery system: A review on primary and novelapproaches’ Oman. Med. J., 25, 1-9.
[35] Prasad R., Krishnaiah Y.S.R., Satyanarayana S., (1996) ‘Trends in colonic drug delivery: A review’Indian Drugs, 33, 1-10.
[36] Raffi, R., Franklin, W., Heflich R. H., Cerniglia, C. E., (1991) ‘Reduction of nitroaromatic compoundsby anaerobic bacteria isolated from the human intestinal tract’ Appl Environ Mivrobiol., 57, 962-968.
[37] Rubunstein A., (1990) ‘Microbially controlled drug delivery to the colon’ Biopharmaceutics and DrugDisposition, 11, 465-475.
[38] Ruschoff J., Wallinger S., Dietmaier W., et al. (1998) ‘Asprin suppresses the mutator phenotypeassociated with hereditary nonpolyposis colorectal cancer by genetic selection’ Proc. Natl Acad. Sci., 95,11301-11306.
[39] Scheline, R. P., (1968) ‘Drug metabolism by intestinal microor – ganism’ J. Pharm. Sci., 57, 2021-2037.
[40] Schellekens R.C.A., Stellaard F., Olsder G.G., et al., (2010) ‘Oral ileocolonic drug delivery by thecolopulse- system: A bioavilability study in healthy volunteers’ J. Contr. Release, 146, 334-340.
[41] Shiff S. and Basil R. (1997) ‘Non-steroidal anti-inflammatory drugs and colorectal cancer: evolvingconcepts of their Chemopreventive actions’ Gastroenterology, 113, 1992-1998.
[42] Singh B. (2007) ‘Modified release solid formulation for colonic delivery’ Rec. Pat. D. Deliv. & Formu.,1, 53-63.

National Conference on Emerging Trends in Science, Technology and Management, 11-12 Nov 2017, ISBN: 978-93-5281-325-4 Page 336
[43] Sinha V. R, Kumria R., (2003) ‘Microbially triggered drug delivery to the colon’ Eur. J. Pharm. Sci., 18,3-18.
[44] Sinha V. R., Kumria R., (2003) ‘Coating polymers for colon specific drug delivery: A comparative in-vitro evaluation’ Act. Pharm., 53, 41-47.
[45] Smalley W. and Dubois R. N. (1997) ‘Colorectal cancer and non-steroidal anti-inflammatory drugs’Adv. Pharmacol., 39, 1-20
[46] Stella V. J., Rajewski R. A., (1997) ‘Cyclodextrins: their future in drug formulation and delivery’ Pharm.Res., 14, 556-567.
[47] Swift, G., (1992) ‘Biodegradable polymers in the environment: are they really biodegradable’ Proc. Acs.Div. Poly. Mat. Sci. Eng., 66, 403-404.
[48] Takaya T., Ikeda C., Imagawa N., Niwa K., Takada K., (1995) ‘Development of a colon delivery capsuleand the pharmacological activity of recombinant human granulocyte colony-stimulating factor (rhG-CSF) in beagle dogs’ J. Pharm. Phamacol., 47, 474-478.
[49] Takemura S., Watanabe S., Katsuma M., Fukui M., (2000) ‘Human gastrointestinal treatment study of anovel colon delivery system (CODES) using scintography, process Interaction Symptoms’ Control. Rel.Bio. Mat. 27, 445-446.
[50] Tang H.B., Inoue A., Oshita K., Hirate K., Nakata Y., (2005) ‘Zaltoprofen inhibits bradykinin inducedresponses by blocking the activation of second messenger signaling cascades in rat dorsal root ganglioncells’ Neuropharmacol., 48, 1035-1042.
[51] Theeuwes F., Guittared G., Wong P., (1990) ‘Delivery of drugs to colon by oral dosage forms’ U. S.Patent, 4904474.
[52] V.H.L. Lee, A. Yamamoto, (1990) ‘Penetration and enzymatic barriers to peptide and proteinabsorption’ Adv. Drug Delivery Rev., 4, 171-207
[53] Vonder Ohe M. R., Camolleri M., Kvols L. K., Thomforde G. M., (1993) ‘Motor dysfunction of thesmall bowel and colon in patients with the carcinoid syndrome and diarrhea’ New England J. Med., 329,1073-1078.
[54] Vyas S. P., Khar R. K., (2002) ‘Controlled Drug Delivery Concepts and Advances’, first edition, VallabhPrakashan, Delhi, 218-253
[55] Watts P., Illum L., (1997) ‘Colonic drug delivery’ Drug Dev. Ind. Pharm., 23, 893-913
[56] Yang L., James S., Joseph A. (2002) ‘Colon specific drug delivery new approaches and in-vitro/ in-vivoevaluation’ Int. J. Pharm., 235, 1-15.
[57] Zou M., Cheng G., Okomot H., Hao X., Feng A., Danjo K., (2005) ‘Colon specific drug delivery systembased on cyclodextrin prodrugs: in-vivo evaluation of 5-aminosalicylic acid from its cyclodextrinconjugates’ World J. Gastroent. 11(47), 7457-7460.
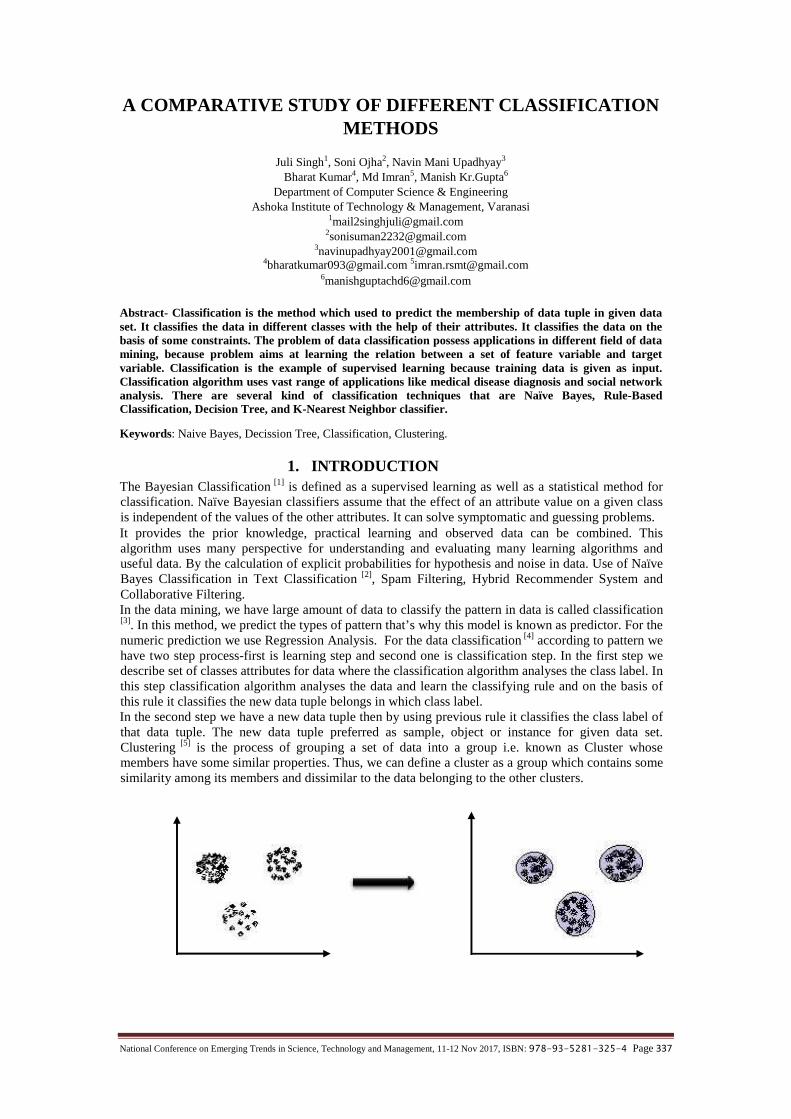
National Conference on Emerging Trends in Science, Technology and Management, 11-12 Nov 2017, ISBN: 978-93-5281-325-4 Page 337
A COMPARATIVE STUDY OF DIFFERENT CLASSIFICATIONMETHODS
Juli Singh1, Soni Ojha2, Navin Mani Upadhyay3
Bharat Kumar4, Md Imran5, Manish Kr.Gupta6
Department of Computer Science & EngineeringAshoka Institute of Technology & Management, Varanasi
[email protected]@gmail.com
[email protected]@gmail.com [email protected]
Abstract- Classification is the method which used to predict the membership of data tuple in given dataset. It classifies the data in different classes with the help of their attributes. It classifies the data on thebasis of some constraints. The problem of data classification possess applications in different field of datamining, because problem aims at learning the relation between a set of feature variable and targetvariable. Classification is the example of supervised learning because training data is given as input.Classification algorithm uses vast range of applications like medical disease diagnosis and social networkanalysis. There are several kind of classification techniques that are Naïve Bayes, Rule-BasedClassification, Decision Tree, and K-Nearest Neighbor classifier.
Keywords: Naive Bayes, Decission Tree, Classification, Clustering.
1. INTRODUCTIONThe Bayesian Classification [1] is defined as a supervised learning as well as a statistical method forclassification. Naïve Bayesian classifiers assume that the effect of an attribute value on a given classis independent of the values of the other attributes. It can solve symptomatic and guessing problems.It provides the prior knowledge, practical learning and observed data can be combined. Thisalgorithm uses many perspective for understanding and evaluating many learning algorithms anduseful data. By the calculation of explicit probabilities for hypothesis and noise in data. Use of NaïveBayes Classification in Text Classification [2], Spam Filtering, Hybrid Recommender System andCollaborative Filtering.In the data mining, we have large amount of data to classify the pattern in data is called classification[3]. In this method, we predict the types of pattern that’s why this model is known as predictor. For thenumeric prediction we use Regression Analysis. For the data classification [4] according to pattern wehave two step process-first is learning step and second one is classification step. In the first step wedescribe set of classes attributes for data where the classification algorithm analyses the class label. Inthis step classification algorithm analyses the data and learn the classifying rule and on the basis ofthis rule it classifies the new data tuple belongs in which class label.In the second step we have a new data tuple then by using previous rule it classifies the class label ofthat data tuple. The new data tuple preferred as sample, object or instance for given data set.Clustering [5] is the process of grouping a set of data into a group i.e. known as Cluster whosemembers have some similar properties. Thus, we can define a cluster as a group which contains somesimilarity among its members and dissimilar to the data belonging to the other clusters.
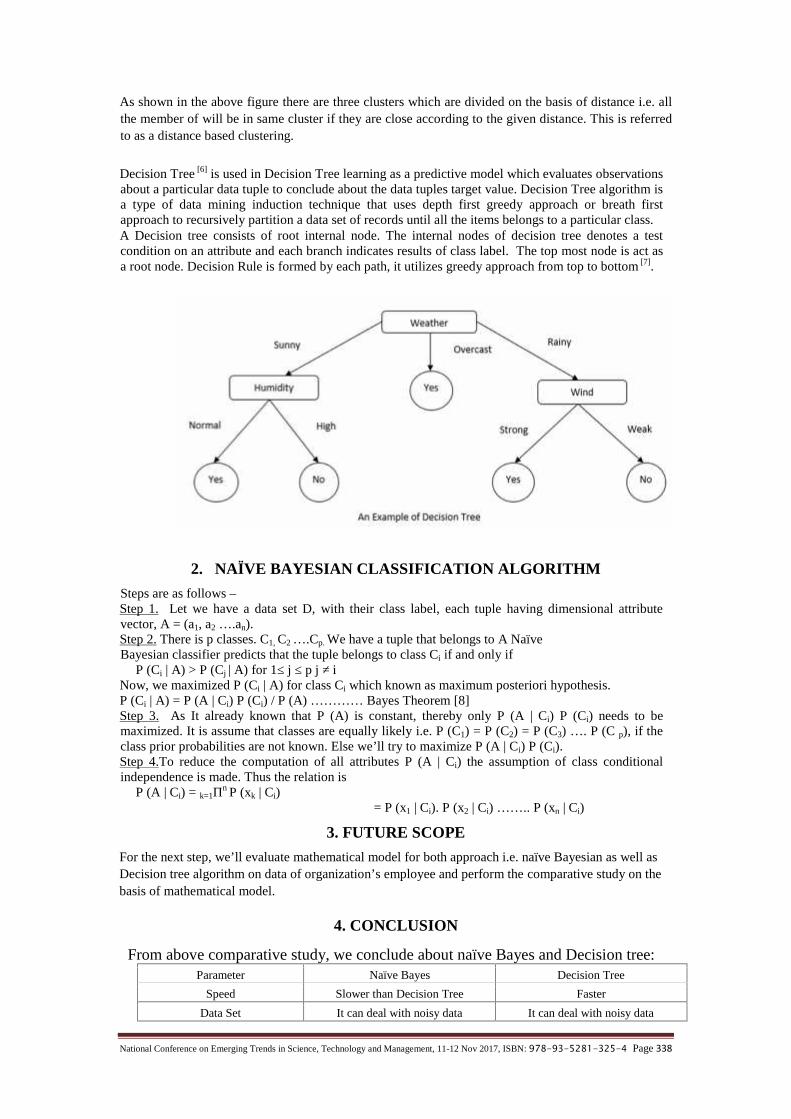
National Conference on Emerging Trends in Science, Technology and Management, 11-12 Nov 2017, ISBN: 978-93-5281-325-4 Page 338
As shown in the above figure there are three clusters which are divided on the basis of distance i.e. allthe member of will be in same cluster if they are close according to the given distance. This is referredto as a distance based clustering.
Decision Tree [6] is used in Decision Tree learning as a predictive model which evaluates observationsabout a particular data tuple to conclude about the data tuples target value. Decision Tree algorithm isa type of data mining induction technique that uses depth first greedy approach or breath firstapproach to recursively partition a data set of records until all the items belongs to a particular class.A Decision tree consists of root internal node. The internal nodes of decision tree denotes a testcondition on an attribute and each branch indicates results of class label. The top most node is act asa root node. Decision Rule is formed by each path, it utilizes greedy approach from top to bottom [7].
2. NAÏVE BAYESIAN CLASSIFICATION ALGORITHM
Steps are as follows –Step 1. Let we have a data set D, with their class label, each tuple having dimensional attributevector, A = (a1, a2 ….an).Step 2. There is p classes. C1, C2 ….Cp. We have a tuple that belongs to A NaïveBayesian classifier predicts that the tuple belongs to class Ci if and only if
P (Ci | A) > P (Cj | A) for 1≤ j ≤ p j ≠ iNow, we maximized P (Ci | A) for class Ci which known as maximum posteriori hypothesis.P (Ci | A) = P (A | Ci) P (Ci) / P (A) ………… Bayes Theorem [8]Step 3. As It already known that P (A) is constant, thereby only P (A | Ci) P (Ci) needs to bemaximized. It is assume that classes are equally likely i.e. P (C1) = P (C2) = P (C3) …. P (C p), if theclass prior probabilities are not known. Else we’ll try to maximize P (A | Ci) P (Ci).Step 4.To reduce the computation of all attributes P (A | Ci) the assumption of class conditionalindependence is made. Thus the relation is
P (A | Ci) = k=1Πn P (xk | Ci)= P (x1 | Ci). P (x2 | Ci) …….. P (xn | Ci)
3. FUTURE SCOPE
For the next step, we’ll evaluate mathematical model for both approach i.e. naïve Bayesian as well asDecision tree algorithm on data of organization’s employee and perform the comparative study on thebasis of mathematical model.
4. CONCLUSION
From above comparative study, we conclude about naïve Bayes and Decision tree:Parameter Naïve Bayes Decision Tree
Speed Slower than Decision Tree Faster
Data Set It can deal with noisy data It can deal with noisy data

National Conference on Emerging Trends in Science, Technology and Management, 11-12 Nov 2017, ISBN: 978-93-5281-325-4 Page 339
Accuracy For obtaining good results itrequires large amount of record.
High Accuracy
Effectiveness on Huge data Large Data
Deterministic/Non-Deterministic
Non Deterministic Deterministic
Table 1: Conclusion Table
REFERENCES[1] Sayali D. Jadhav, H.P.Channe, “Comparative study of K-NN, Naïve Bayes and Decision Tree
Classification Techniques”, ISSN: 2319-7064, 2014.[2] S.L. Ting, W.H. Ip, Albert H.C. Tsang, “Is Naïve Bayes a Good Classifier for Document
Classification?”, Vol. 5, No. 3, July, 2011.[3] Hem Jyotsana Parashar, Singh Vijendra, and Nisha Vasudeva, “An Efficient Classification Approach
for Data Mining”, Vol-2, No-4, August 2012.[4] A. McCallum, and K. Nigam, “A comparison of event models for naïve Bayes text classification”,
Journal of Machine Learning Research, Vol. 3, 2003, pp. 1265–1287.[5] I. H. Witten and E. Frank, “Data mining: Practical Machine Learning Tools and Techniques,” 2nd ed,
Morgan-Kaufman Series of Data Management Systems San Francisco Elsevier, 2005.[6] Margaret H. Danham, S. Sridhar,” Data mining, Introductory and Advanced Topics”, Person
education, 1st ed., 2006.[7] Mathew N. Anyanwu and Sajjan G. Shiva, “Comparative Algorithm”, Researchgate, January 2009.[8] Sangita Gupta, Suma V, “Performance Analysis using Bayesian Classification Case Study of Software
Industry” Vol. 99– No.16, August 2014.

National Conference on Emerging Trends in Science, Technology and Management, 11-12 Nov 2017, ISBN: 978-93-5281-325-4 Page 340
GPS BASED RAILWAY CROSSING LEVEL SYSTEM1Rakesh Kumar Singh, 2Ankur Srivastava, 3Samli Gupta, 4Ruby Vishwakarma, 5Priyanshu Vishwakarma
Department of Computer Science and EngineeringASHOKA Institute of Technology and Management
Varanasi, Utter Pradesh, [email protected]
[email protected]@gamil.com
Abstract— Railway is one of the largest transport systems in all over the country. Accident due to the levelcrossing is unavoidable. It is the railway management system providing railway safety. Level crossing is thepoint at which the train and road are interact with each other so that the possibility of the accident isarising. The biggest issue is the accidents through the level crossing by which more than thousand peoplesleft their life. If anyone can handle this problem properly then the accident may became less. But it is notpossible that one man handle railway system manually.Nowadays it is very difficult task to track traffic violations or accident mostly which are happened atrailway crossing. But it is possible to track the train by using a special device integrated in the train. In thispaper, we propose the advance railway crossing system. It gives a current location of a train and providescomplete information of the train running, and all the related information will be display on screen. Andusing the available internet facilities or GPS concept, this proposed concept provides Indian railway toenables the monitoring all movement of the train at all the places.
1. INTRODUCTION
With over 32700 level crossings and complex nature of road traffic, India ranks better than manyadvanced countries in safety at level. The Railways are continuously following the various steps toreduce the unmanned level crossing accidents and no effort is made to dilute the gravity and theseriousness of accidents. In the control and scope of intervention in curbing a unmanned level crossingaccidents, the role of Railways is limited and highly constricted as most of them have been foundoccurring due to negligence on the part of road vehicle users.The fundamental process of in this concept is that getting the train location with the help of GPStechnology and sharing its latitude and longitude with the help of internet. The information related toposition is frequently sent through internet. The proposed system uses sensor and GPS for functioning.The current location of train & related information can be retrieved from the train, using propercommunication. In the proposed system the Global Positioning system, this is normally used forfinding the position of the train.The main advantage of this concept is that during an accident of the train GPS and Sensor can be ableto get the location of the train in terms of latitude and longitude in the system (monitor).
2. HARDWARE DETIALS
The hardware of the proposed concept consists of following components: Global Positioning System Shield Arduino system Sensor BlueNMEA VSPE( Virtual Serial Port Emulator )
A. Global Positioning SystemThe Global Positioning system (GPS) is the satellite based the navigation system that uses about30 satellites for its operation. GPS works in any environment and weather condition all over theworld.GPS receiver compares the time delay between the signals that was transmitted by a satellite with atime it was received. The difference between time is the key and this tells the GPS receiver how faraway the satellite is. Now, the same calculation performed from a few more satellite then thereceiver can determine user’s current location and display it on the electronic devices. For thisinformation at least we need signal from 3 satellite to calculate a 2D position (Latitude andLongitude) and track train movement with four or more satellite, the GPS receiver can determinethe user’s 3D position (Latitude, Altitude and Longitude). Once the user’s (train) location has beendetermine, the GPS unit can further calculate other information like speed, track, sunrise andsunset time and so on.
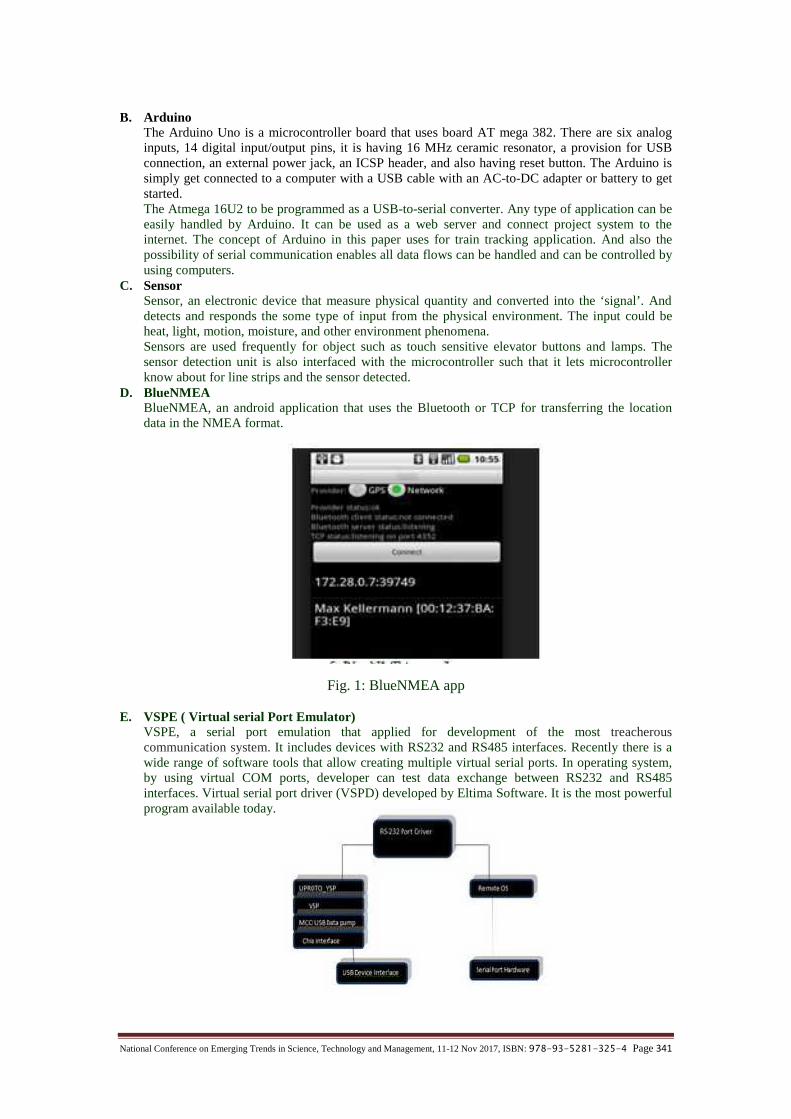
National Conference on Emerging Trends in Science, Technology and Management, 11-12 Nov 2017, ISBN: 978-93-5281-325-4 Page 341
B. ArduinoThe Arduino Uno is a microcontroller board that uses board AT mega 382. There are six analoginputs, 14 digital input/output pins, it is having 16 MHz ceramic resonator, a provision for USBconnection, an external power jack, an ICSP header, and also having reset button. The Arduino issimply get connected to a computer with a USB cable with an AC-to-DC adapter or battery to getstarted.The Atmega 16U2 to be programmed as a USB-to-serial converter. Any type of application can beeasily handled by Arduino. It can be used as a web server and connect project system to theinternet. The concept of Arduino in this paper uses for train tracking application. And also thepossibility of serial communication enables all data flows can be handled and can be controlled byusing computers.
C. SensorSensor, an electronic device that measure physical quantity and converted into the ‘signal’. Anddetects and responds the some type of input from the physical environment. The input could beheat, light, motion, moisture, and other environment phenomena.Sensors are used frequently for object such as touch sensitive elevator buttons and lamps. Thesensor detection unit is also interfaced with the microcontroller such that it lets microcontrollerknow about for line strips and the sensor detected.
D. BlueNMEABlueNMEA, an android application that uses the Bluetooth or TCP for transferring the locationdata in the NMEA format.
Fig. 1: BlueNMEA app
E. VSPE ( Virtual serial Port Emulator)VSPE, a serial port emulation that applied for development of the most treacherouscommunication system. It includes devices with RS232 and RS485 interfaces. Recently there is awide range of software tools that allow creating multiple virtual serial ports. In operating system,by using virtual COM ports, developer can test data exchange between RS232 and RS485interfaces. Virtual serial port driver (VSPD) developed by Eltima Software. It is the most powerfulprogram available today.
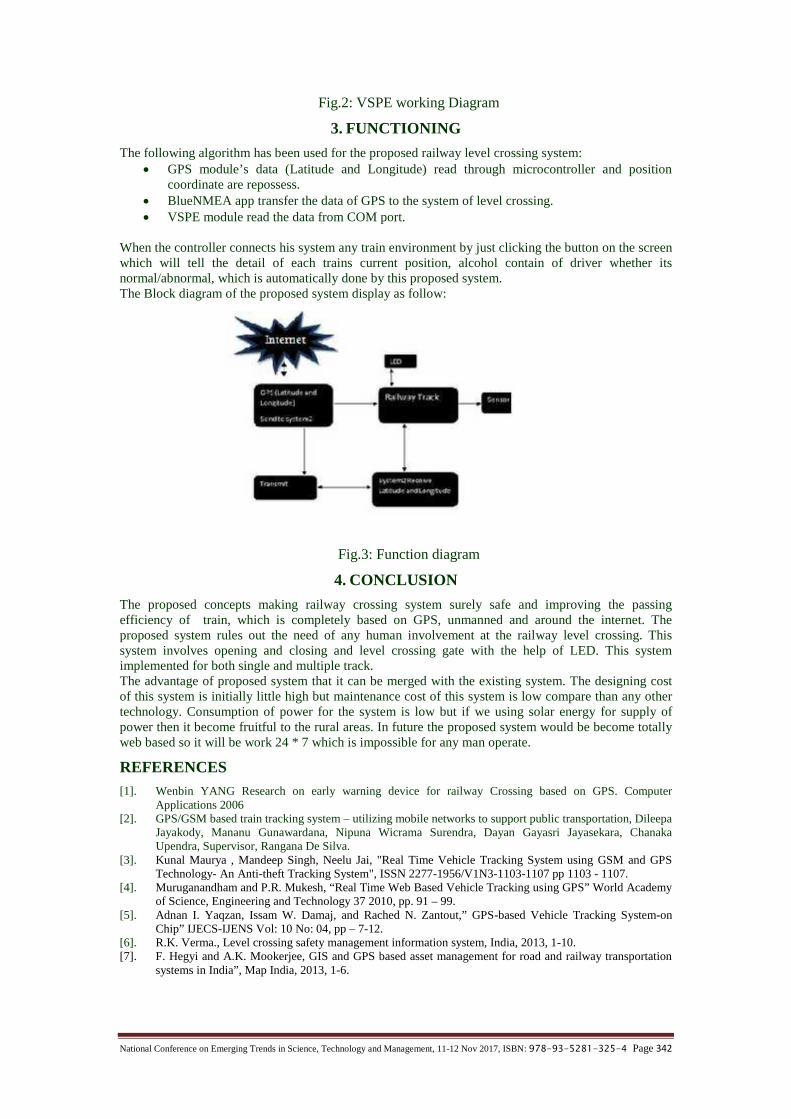
National Conference on Emerging Trends in Science, Technology and Management, 11-12 Nov 2017, ISBN: 978-93-5281-325-4 Page 342
Fig.2: VSPE working Diagram
3. FUNCTIONING
The following algorithm has been used for the proposed railway level crossing system: GPS module’s data (Latitude and Longitude) read through microcontroller and position
coordinate are repossess. BlueNMEA app transfer the data of GPS to the system of level crossing. VSPE module read the data from COM port.
When the controller connects his system any train environment by just clicking the button on the screenwhich will tell the detail of each trains current position, alcohol contain of driver whether itsnormal/abnormal, which is automatically done by this proposed system.The Block diagram of the proposed system display as follow:
Fig.3: Function diagram
4. CONCLUSION
The proposed concepts making railway crossing system surely safe and improving the passingefficiency of train, which is completely based on GPS, unmanned and around the internet. Theproposed system rules out the need of any human involvement at the railway level crossing. Thissystem involves opening and closing and level crossing gate with the help of LED. This systemimplemented for both single and multiple track.The advantage of proposed system that it can be merged with the existing system. The designing costof this system is initially little high but maintenance cost of this system is low compare than any othertechnology. Consumption of power for the system is low but if we using solar energy for supply ofpower then it become fruitful to the rural areas. In future the proposed system would be become totallyweb based so it will be work 24 * 7 which is impossible for any man operate.
REFERENCES[1]. Wenbin YANG Research on early warning device for railway Crossing based on GPS. Computer
Applications 2006[2]. GPS/GSM based train tracking system – utilizing mobile networks to support public transportation, Dileepa
Jayakody, Mananu Gunawardana, Nipuna Wicrama Surendra, Dayan Gayasri Jayasekara, ChanakaUpendra, Supervisor, Rangana De Silva.
[3]. Kunal Maurya , Mandeep Singh, Neelu Jai, "Real Time Vehicle Tracking System using GSM and GPSTechnology- An Anti-theft Tracking System", ISSN 2277-1956/V1N3-1103-1107 pp 1103 - 1107.
[4]. Muruganandham and P.R. Mukesh, “Real Time Web Based Vehicle Tracking using GPS” World Academyof Science, Engineering and Technology 37 2010, pp. 91 – 99.
[5]. Adnan I. Yaqzan, Issam W. Damaj, and Rached N. Zantout,” GPS-based Vehicle Tracking System-onChip” IJECS-IJENS Vol: 10 No: 04, pp – 7-12.
[6]. R.K. Verma., Level crossing safety management information system, India, 2013, 1-10.[7]. F. Hegyi and A.K. Mookerjee, GIS and GPS based asset management for road and railway transportation
systems in India”, Map India, 2013, 1-6.
National Conference on Emerging Trends in Science, Technology and Management, 11-12 Nov 2017, ISBN: 978-93-5281-325-4 Page 343
SELECTIVE CREATININE DETERMINATION USINGMOLECULARLY IMPRINTED POLYMER (MIP) BASED
COLORIMETRIC SENSORDr. Amit Kumar Patel,
Department of Chemistry, Ashoka Institute of Technology and Management, Varanasi
Abstract-This paper reports a colorimetric sensor for determination of creatinine (Cre) based on sol-gelderivated molecularly imprinted polymer (MIP) by classical jaffe reaction. The sensor is reproducible andhas been applied for the determination of Cre in aqueous and real samples. The molecularly imprintedpolymeric chains were tethered to the sol-gel coated glass slide in brush pattern of high density, for thequantitative estimation of Cre at trace level. Active methylene group of creatinine encapsulated in MIPcavity react with alkaline sodium picrate yielding orange-yellow complex with maximum absorbance at520nm when modified glass slide placed in a 1mm cuvette. The sensor gave a linear absorption response inrange of 0.8 to 110 ppm with limit of detection (LOD) 0.23 ppm.
Keywords- Molecularly imprinted polymers, Sol-gel colorimetric sensor, Creatinine.
1. INTRODUCTION
Molecular imprinting is an emerging technology. Molecularly imprinted polymers (MIPs) arecross-linked polymers with specific binding sites for a template molecule. These binding sites aretailor-made by the copolymerizing cross-linker with a functional monomer in the presence of thetemplate molecule [1]. After removal of the template from the polymer, the recognition sites, in termsof size and functional groups, are complementary to the template molecule. MIPs possess advantagesphysical robustness, resistance to high temperatures and pressure, and inertness toward acids, bases,metal ion and organic solvents compared to biomolecule. It was first reported in 1949 by adsorbingdifferent dyes in silica [2,3]. Originally it was introduced as a means to create binding sites in syntheticpolymers.The technique has now matured and has become established in several disciplines owing to its abilityto become an attractive method for the preparation of sensor component and catalyst [4-6].Surface imprinting has been widely studied as one approach to improving the performance of MIPs, asit solve the problems of limited mass transfer and template removal often associated with the traditionaltechnique of molecular imprinting. This improvement is especially valuable when imprintingmacromolecules, for which diffusion limitation is the major issue. One common approach to surfaceimprinting is the creation of thin MIP film on suitable substrate, such as gold and carbon. An advantageof this approach is the direct formation of a thin film that can be applied to sensor electrode like thequartz crystal microbalance (QCM) [7,8] and surface plasmon resonance (SPR) [9]. Variousmethodologies used to prepare such MIP film including spin coating [7,10] and surface-initiated atomtransfer radical polymerization (ATRP) [9]. One major issue with this approach is controlling the MIPfilm thickness, as it should be sufficiently thin for rapid mass transfer. This is especially important insensor applications, where high sensitivity and short response time are desired.Because of major breakdown product of mammalian metabolism, creatinine becomes an importantdiagnostic substance in the assay of renal, thyroid and muscular functions and testing its clearancecould offer a quick and relatively simple biomedical diagnosis of acute myocardial infection[11,12].The determination of Cre concentration in biological fluids is an increasingly important clinical testbecause they are not affected by short-term dietary changes or the rate of metabolism [11,13].Therefore, the accurate and rapid determination of Cre in biological fluids is of utmost relevance in thediagnosis and treatment of muscular and kidney disorders.Several method for the determination of Cre among other metabolites in biological fluids have beenreported, such as FIA methods [14,15] by using sensors and biosensors [16-20], high- performanceliquid chromatography [21,22]. Several MIP based sensors for the determination of Cre in biologicalfluids have been reported [10, 23, 24].In the present work, I adapted a simple “grafting-to” procedure by tethering a MIPcre over a sol-gelmodified glass surface to reduce interference from biomolecules present in real sample such asacetoacetate, ascorbic acid, glucose and uric acid and to enhance the specificity.

National Conference on Emerging Trends in Science, Technology and Management, 11-12 Nov 2017, ISBN: 978-93-5281-325-4 Page 344
2. EXPERIMENTAL
2.1. Reagents and apparatusCreatinine (Analr grade) sodium hydroxide and picric acid were purchased from Aldrich. Melamine(mel), chloranil (chl) and other chemicals (interference) were purchased from Loba Chemie, India, SDFine, India and Otto, Chemie, India. Tetraethoxyorthosilicate (TEOS) were purchased from Fluka,Germany. Other reagents (ethanol, dimethylformamide, hydrochloric acid were purchased fromRankem, NewDelhi, India. Microscope glass cover slip (MGC) 22X22 mm, thickness 0.13-0.16mmwas purchased from Blue star, Mumbai, India. All solution was prepared in triple distilled deionizedwater (PH value Ca. 6.9). Urine sample and blood serum sample were provided by hospitals.An auto colorimeter (LT114 wavelength range: 400-680mm) used for the evaluation of the opticalchracteristics of MIP-based Cre sensor. Film thickness measured by a Laser surface profilometer(perthometer) PGK120,Mohr, Germany. FTIR (KBr) spectra were recorded using FTIR spetrometer(Jasco FT/IR 5300) Additionally , surface imaging was carrid out using scanning electron microscope(SEM, Model-XL20,Philips, The Netherlands)
2.2. Synthesis of the molecularly imprinted polymer for Cre
MIP [poly mel-co-chl] and corresponding non-imprinted polymer (NIP) were prepared andcharecterised earlier [self]. In brief, equimolar DMF solution of mel, chl and Cre (as template) wasprepared. Mel chl solution was heated under reflux for 1 hr and then for 4h at 1600c after addition ofCre solution to obtain a MIP-Cre adduct as brownish black slurry. The residual monomers, if any werewashed off from the slurry with ethanol. The NIP was prepared following the similar procedure but inthe absence of template.
2.3. Formation of sol-gel coated glass substrate
MGC, were used as substrate for the formation of thin layer of sol-gel. The MGC were cut to8mmx22mm. All the substrate were cleaned using tripled distilled water and drying at roomtemperature. Finally, It was stored in a dessiccator. Sol-gel clear solution was prepared by stirring themixture of 1.0 ml TEOS, 1.0 ml ethanol, 0.5 ml of water, and 50 µl of 0.1 M HCl for 45 min.Afterwords, resulting solution undergo polycondensation to maintain syneresis stage for another 45min. The freshly formed sol-gel at syneresis stage was introduced on the surface of MGC substrate andspun at rate of 4500 rpm for optimized 2 min to form thin layer of sol-gel film, which left to gelationagain for 15min.
2.4. Formation of MIP- sol-gel coated glass coverslip colorimetric sensor
The optimized amount of MIP-Cre adduct (0.5ml of 103 mgl-1 in DMF) was then introduced withmicropipette over sol-gel coated MGC and spun at 4500 rpm for optimized 90 sec and kept indessiccator for overnight drying. The imprinted Cre was completely removed from the film by dippingthe coated substrate in 15 ml of 10% (v/v) aqueous methanol for 25 sec followed by through rinsingwith triple distilled water and drying at room temperature.
2.5. Colorimetric detection
The Cre detection by colorimetric were carried out by classical jaffe method. The sensor immersed indifferent Cre concentration (from 0.1 to 120ppm) for rebinding then immersed in water to remove Crephysically adsorb on substrate if any and then immersed in alkaline sodium picrate solution. Finally theabsorbances of the substrate placed in optical cuvette (i.d 10mm) were measured at 520nm aftercleaning with a colorimeter against a reagent blank substrate immersed in a tube containing all thereagent but the analyte. Exactly the same procedure was followed for NIP covalently bonded with sol-gel coated MGC. For every Cre concentration, three sets of assay each contain triplicate sample werepreferred to assess the reproducibility and reliability of the method.
3. RESULTS AND DISCUSSION
The absorption maximum for MIP based colorimetric sensor for Cre was 520nm when Creencapsulated MIPcre-sol-gel coated glass cover slip placed in alkaline sodium picrate prepared bymixing 0.4 ml 16% sodium hydroxide and 0.6ml, 6% picric acid diluted to 2ml. The intensity of thecolour produced in the jaffe reaction is apparently independent of the conc of picric acid used [25]although at higher concentration the rate of development of colour decreases. The conc of alkali alsoinfluence colour produced, the colour intensity being greatest when alkali conc is kept low. Thus colourproduced in the jaffe reaction is inversely proportional to the con of picric acid and alkali. The effect of
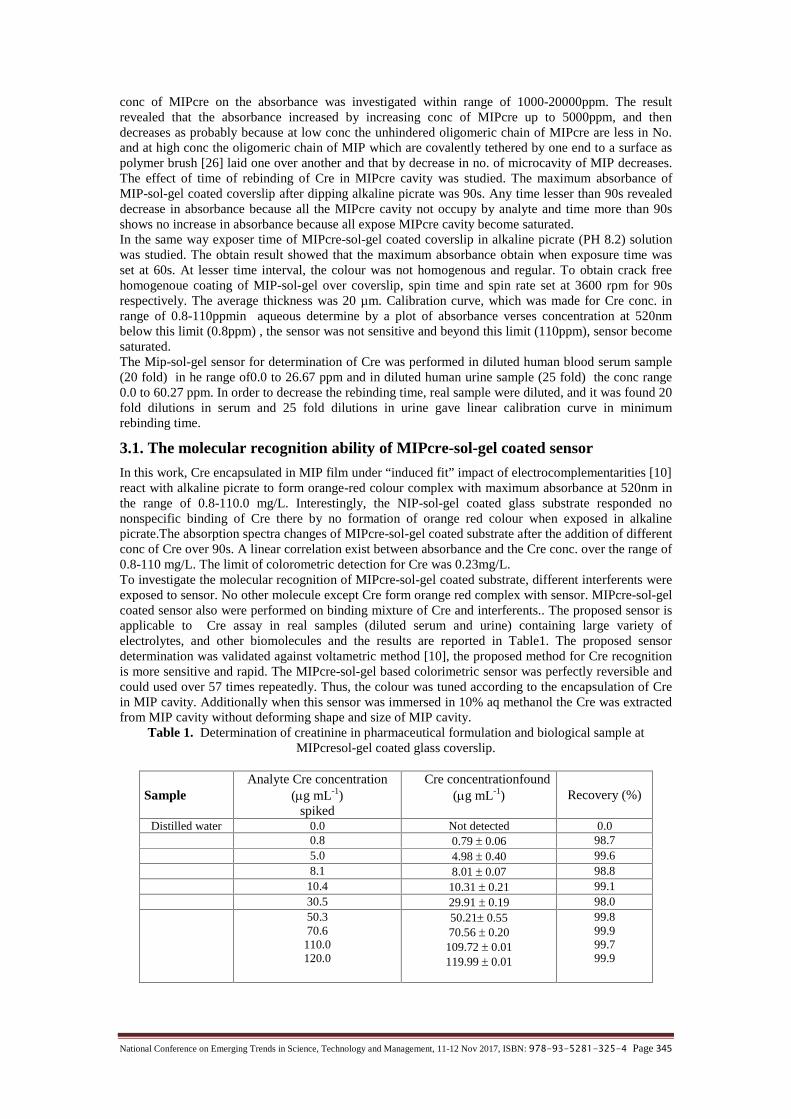
National Conference on Emerging Trends in Science, Technology and Management, 11-12 Nov 2017, ISBN: 978-93-5281-325-4 Page 345
conc of MIPcre on the absorbance was investigated within range of 1000-20000ppm. The resultrevealed that the absorbance increased by increasing conc of MIPcre up to 5000ppm, and thendecreases as probably because at low conc the unhindered oligomeric chain of MIPcre are less in No.and at high conc the oligomeric chain of MIP which are covalently tethered by one end to a surface aspolymer brush [26] laid one over another and that by decrease in no. of microcavity of MIP decreases.The effect of time of rebinding of Cre in MIPcre cavity was studied. The maximum absorbance ofMIP-sol-gel coated coverslip after dipping alkaline picrate was 90s. Any time lesser than 90s revealeddecrease in absorbance because all the MIPcre cavity not occupy by analyte and time more than 90sshows no increase in absorbance because all expose MIPcre cavity become saturated.In the same way exposer time of MIPcre-sol-gel coated coverslip in alkaline picrate (PH 8.2) solutionwas studied. The obtain result showed that the maximum absorbance obtain when exposure time wasset at 60s. At lesser time interval, the colour was not homogenous and regular. To obtain crack freehomogenoue coating of MIP-sol-gel over coverslip, spin time and spin rate set at 3600 rpm for 90srespectively. The average thickness was 20 µm. Calibration curve, which was made for Cre conc. inrange of 0.8-110ppmin aqueous determine by a plot of absorbance verses concentration at 520nmbelow this limit (0.8ppm) , the sensor was not sensitive and beyond this limit (110ppm), sensor becomesaturated.The Mip-sol-gel sensor for determination of Cre was performed in diluted human blood serum sample(20 fold) in he range of0.0 to 26.67 ppm and in diluted human urine sample (25 fold) the conc range0.0 to 60.27 ppm. In order to decrease the rebinding time, real sample were diluted, and it was found 20fold dilutions in serum and 25 fold dilutions in urine gave linear calibration curve in minimumrebinding time.
3.1. The molecular recognition ability of MIPcre-sol-gel coated sensor
In this work, Cre encapsulated in MIP film under “induced fit” impact of electrocomplementarities [10]react with alkaline picrate to form orange-red colour complex with maximum absorbance at 520nm inthe range of 0.8-110.0 mg/L. Interestingly, the NIP-sol-gel coated glass substrate responded nononspecific binding of Cre there by no formation of orange red colour when exposed in alkalinepicrate.The absorption spectra changes of MIPcre-sol-gel coated substrate after the addition of differentconc of Cre over 90s. A linear correlation exist between absorbance and the Cre conc. over the range of0.8-110 mg/L. The limit of colorometric detection for Cre was 0.23mg/L.To investigate the molecular recognition of MIPcre-sol-gel coated substrate, different interferents wereexposed to sensor. No other molecule except Cre form orange red complex with sensor. MIPcre-sol-gelcoated sensor also were performed on binding mixture of Cre and interferents.. The proposed sensor isapplicable to Cre assay in real samples (diluted serum and urine) containing large variety ofelectrolytes, and other biomolecules and the results are reported in Table1. The proposed sensordetermination was validated against voltametric method [10], the proposed method for Cre recognitionis more sensitive and rapid. The MIPcre-sol-gel based colorimetric sensor was perfectly reversible andcould used over 57 times repeatedly. Thus, the colour was tuned according to the encapsulation of Crein MIP cavity. Additionally when this sensor was immersed in 10% aq methanol the Cre was extractedfrom MIP cavity without deforming shape and size of MIP cavity.
Table 1. Determination of creatinine in pharmaceutical formulation and biological sample atMIPcresol-gel coated glass coverslip.
SampleAnalyte Cre concentration
(g mL-1)spiked
Cre concentrationfound(g mL-1) Recovery (%)
Distilled water 0.0 Not detected 0.00.8 0.79 0.06 98.75.0 4.98 0.40 99.68.1 8.01 0.07 98.8
10.4 10.31 0.21 99.130.5 29.91 0.19 98.050.370.6
110.0120.0
50.21 0.5570.56 0.20
109.72 0.01119.99 0.01
99.899.999.799.9
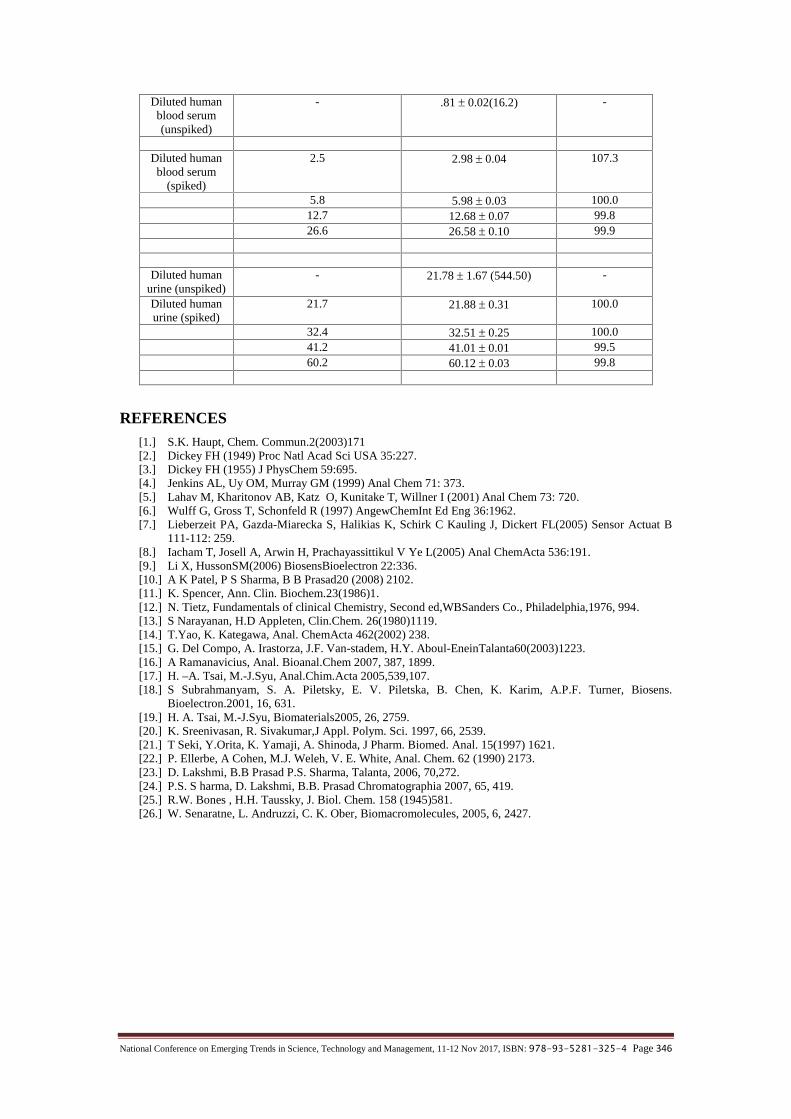
National Conference on Emerging Trends in Science, Technology and Management, 11-12 Nov 2017, ISBN: 978-93-5281-325-4 Page 346
Diluted humanblood serum(unspiked)
- .81 0.02(16.2) -
Diluted humanblood serum
(spiked)
2.5 2.98 0.04 107.3
5.8 5.98 0.03 100.012.7 12.68 0.07 99.826.6 26.58 0.10 99.9
Diluted humanurine (unspiked)
- 21.78 1.67 (544.50) -
Diluted humanurine (spiked)
21.7 21.88 0.31 100.0
32.4 32.51 0.25 100.041.2 41.01 0.01 99.560.2 60.12 0.03 99.8
REFERENCES[1.] S.K. Haupt, Chem. Commun.2(2003)171[2.] Dickey FH (1949) Proc Natl Acad Sci USA 35:227.[3.] Dickey FH (1955) J PhysChem 59:695.[4.] Jenkins AL, Uy OM, Murray GM (1999) Anal Chem 71: 373.[5.] Lahav M, Kharitonov AB, Katz O, Kunitake T, Willner I (2001) Anal Chem 73: 720.[6.] Wulff G, Gross T, Schonfeld R (1997) AngewChemInt Ed Eng 36:1962.[7.] Lieberzeit PA, Gazda-Miarecka S, Halikias K, Schirk C Kauling J, Dickert FL(2005) Sensor Actuat B
111-112: 259.[8.] Iacham T, Josell A, Arwin H, Prachayassittikul V Ye L(2005) Anal ChemActa 536:191.[9.] Li X, HussonSM(2006) BiosensBioelectron 22:336.[10.] A K Patel, P S Sharma, B B Prasad20 (2008) 2102.[11.] K. Spencer, Ann. Clin. Biochem.23(1986)1.[12.] N. Tietz, Fundamentals of clinical Chemistry, Second ed,WBSanders Co., Philadelphia,1976, 994.[13.] S Narayanan, H.D Appleten, Clin.Chem. 26(1980)1119.[14.] T.Yao, K. Kategawa, Anal. ChemActa 462(2002) 238.[15.] G. Del Compo, A. Irastorza, J.F. Van-stadem, H.Y. Aboul-EneinTalanta60(2003)1223.[16.] A Ramanavicius, Anal. Bioanal.Chem 2007, 387, 1899.[17.] H. –A. Tsai, M.-J.Syu, Anal.Chim.Acta 2005,539,107.[18.] S Subrahmanyam, S. A. Piletsky, E. V. Piletska, B. Chen, K. Karim, A.P.F. Turner, Biosens.
Bioelectron.2001, 16, 631.[19.] H. A. Tsai, M.-J.Syu, Biomaterials2005, 26, 2759.[20.] K. Sreenivasan, R. Sivakumar,J Appl. Polym. Sci. 1997, 66, 2539.[21.] T Seki, Y.Orita, K. Yamaji, A. Shinoda, J Pharm. Biomed. Anal. 15(1997) 1621.[22.] P. Ellerbe, A Cohen, M.J. Weleh, V. E. White, Anal. Chem. 62 (1990) 2173.[23.] D. Lakshmi, B.B Prasad P.S. Sharma, Talanta, 2006, 70,272.[24.] P.S. S harma, D. Lakshmi, B.B. Prasad Chromatographia 2007, 65, 419.[25.] R.W. Bones , H.H. Taussky, J. Biol. Chem. 158 (1945)581.[26.] W. Senaratne, L. Andruzzi, C. K. Ober, Biomacromolecules, 2005, 6, 2427.
National Conference on Emerging Trends in Science, Technology and Management, 11-12 Nov 2017, ISBN: 978-93-5281-325-4 Page 347
A STUDY OF EMPLOYEE PERFORMANCEEVALUATION USING DATA MINING TECHNIQUES
Ankur Srivastava#, Rakesh Kumar Singh*, Km. Soni#
Assistant Professor, Assistant Professor, Assistant Professor,1, 2, 3 Department of Computer Science and Engineering,
[email protected]@[email protected]
ASHOKA institute of technology and managementVaranasi, Uttar Pradesh, India
Abstract— Management play important, and risky role to select talented employee if they want to progressthe organisation because every employee have different talent in different field and it is also very importantto enhance the quality of the employee to give their effort in organisation. So classification of the employeeaccording to their talent is not simple task [1]. In this proposed work, we want to classify the employee asexcellent, good and average according the association rule. In this project the rule is based upon attributesof employee for example updation, annual overcome, regular etc. By the help of this classification themanagement can give the responsibility according the Excellency of the employee [6][2].
Keywords— Employee, Association rule, Classification, Pattern evaluation, Data mining.
1. INTRODUCTION
Management play important and risky role to select talented employee if they want to progress theorganisation because every employee have different talent in different field and it is also very importantto enhance the quality of the employee to give their effort in organisation. So classification of theemployee according to their talent is not simple task [1]. This project is focused on to increase theemployee technical skills after short interval of time for example (2 year) which enhanced quality ofthe employee according to the organisation need. In this way organization at zenith in competitivemarket. In this project we want to classify the employee as excellent, good and average according theassociation rule.The management decision mostly depends on the performance of the employee. The talent evaluationcan be achieved with the help of knowledge based and decision making system. As per this work,organization continuous monitoring the employee performance and if there is need of training to theiremployee then organization provide them. And after completion of training management check theperformance of the employee and categorised into the categories. By the help of this work, rightemployee with appropriate skills to be justified with the talent evaluation tools.
2. MAJOR COMPONENTS
In the proposed system, major components are: Employee profiles database, Data pre-processing, Data transformation, Pattern evaluation, Domain expert and mined pattern (Historical data), Knowledge derived.
Employee profiles database: Management provides form requesting to enter the information ofcurrent employee based on their updation. This information is stored in database. Some fields displayedin the form are mandatory to be entered by employee otherwise form will not be accepted.Data pre-processing: Data entered in the form is important for the organization. Before applydata mining technique data has to be cleaned from the inconsistencies, incompleteness and noisy datathat may erupt unexpectedly in the database even after taking precautions.Data selection: Select relevant attributes from employee for assisting the mining and categorizedthem as Excellent, Good, Average based on which talented candidate performance is checked.Data cleaning: The attribute which is already save in the database of the organization and lessimportant attribute is neglect able.Data transformation: The data used in data enrichment is modified into appropriate format usingdata reduction techniques.Data enrichment: Employee attributes are again categorized into the sub attributes.
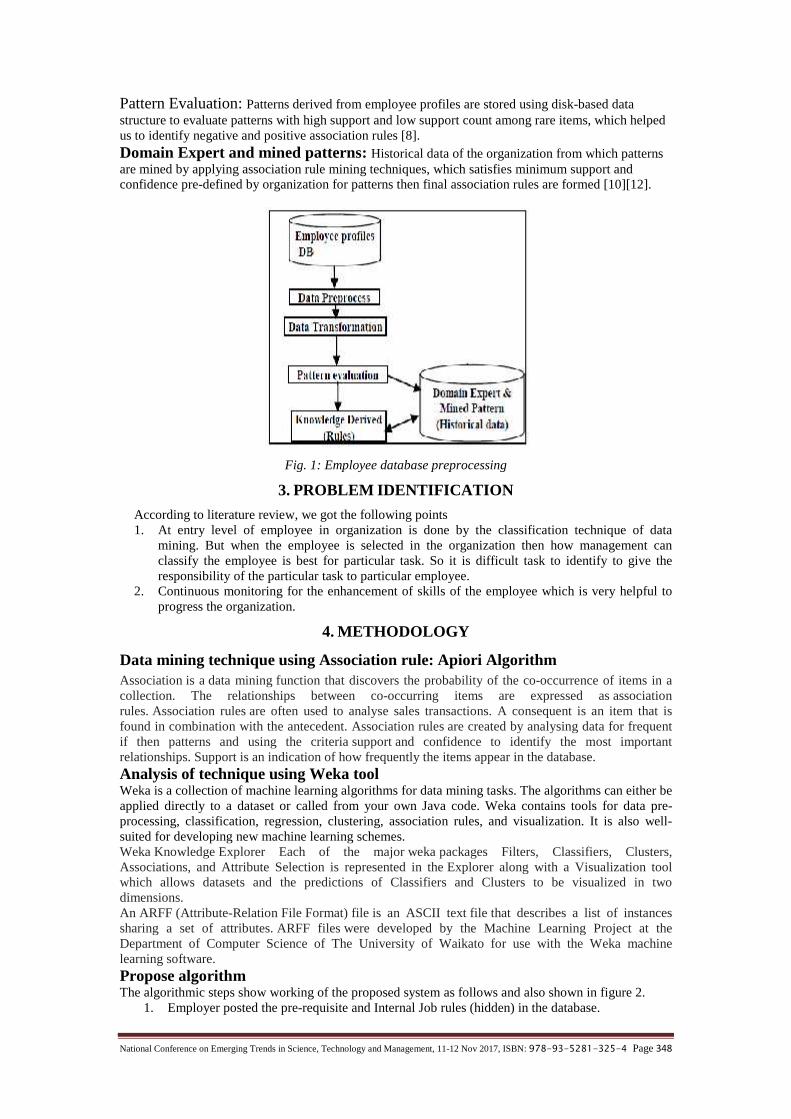
National Conference on Emerging Trends in Science, Technology and Management, 11-12 Nov 2017, ISBN: 978-93-5281-325-4 Page 348
Pattern Evaluation: Patterns derived from employee profiles are stored using disk-based datastructure to evaluate patterns with high support and low support count among rare items, which helpedus to identify negative and positive association rules [8].Domain Expert and mined patterns: Historical data of the organization from which patternsare mined by applying association rule mining techniques, which satisfies minimum support andconfidence pre-defined by organization for patterns then final association rules are formed [10][12].
Fig. 1: Employee database preprocessing
3. PROBLEM IDENTIFICATION
According to literature review, we got the following points1. At entry level of employee in organization is done by the classification technique of data
mining. But when the employee is selected in the organization then how management canclassify the employee is best for particular task. So it is difficult task to identify to give theresponsibility of the particular task to particular employee.
2. Continuous monitoring for the enhancement of skills of the employee which is very helpful toprogress the organization.
4. METHODOLOGY
Data mining technique using Association rule: Apiori AlgorithmAssociation is a data mining function that discovers the probability of the co-occurrence of items in acollection. The relationships between co-occurring items are expressed as associationrules. Association rules are often used to analyse sales transactions. A consequent is an item that isfound in combination with the antecedent. Association rules are created by analysing data for frequentif then patterns and using the criteria support and confidence to identify the most importantrelationships. Support is an indication of how frequently the items appear in the database.Analysis of technique using Weka toolWeka is a collection of machine learning algorithms for data mining tasks. The algorithms can either beapplied directly to a dataset or called from your own Java code. Weka contains tools for data pre-processing, classification, regression, clustering, association rules, and visualization. It is also well-suited for developing new machine learning schemes.Weka Knowledge Explorer Each of the major weka packages Filters, Classifiers, Clusters,Associations, and Attribute Selection is represented in the Explorer along with a Visualization toolwhich allows datasets and the predictions of Classifiers and Clusters to be visualized in twodimensions.An ARFF (Attribute-Relation File Format) file is an ASCII text file that describes a list of instancessharing a set of attributes. ARFF files were developed by the Machine Learning Project at theDepartment of Computer Science of The University of Waikato for use with the Weka machinelearning software.Propose algorithmThe algorithmic steps show working of the proposed system as follows and also shown in figure 2.
1. Employer posted the pre-requisite and Internal Job rules (hidden) in the database.

National Conference on Emerging Trends in Science, Technology and Management, 11-12 Nov 2017, ISBN: 978-93-5281-325-4 Page 349
2. Employee provides information to the Employer data base.3. Push the profiles into employee profile database (CPDB).4. Filtering involves redundancies, inconsistencies, incomplete, noisy and syntactical errors in
profiles (data cleaning process).5. Derive both negative and positive association rules after applying apriori algorithm with
automated or user defined (variable support, depends on number of records identified)confidence evaluated later.
6. Compare the rules derived with the constraint rules placed by employer.7. Build the selected employee list.8. Augment the selected list of employee to HDB (History Database) Generate New database
(NDB). Note: (updation if required) to knowledge based database (historical database).9. Reapply association rule mining algorithm with automated pre/user-defined support and
confidence. (Perform comparison) generate new rules, and avoids risk factor.10. Generate the final list for selection of employee.
5. CONCLUSIONS
In our proposed system classify the employee based upon the performance and updation of employee.In our proposed system we use the data mining technique to classify the employee according to theirskills. Selecting employee by management Department in project oriented organization involvessentiments of the employees in the organization. Importantly performance management to improveskills of the employee in the organization which is not easy to handle. Our proposed system helps tomanagement department not only to take prompt decisions for employee accurately without risk factor.Also classifies the skilled employee into different level of hierarchy. Finally our proposed systemsimprove the evaluation of employee.
REFERENCES[1.] S. M. Metev and V. P. Veiko, Laser Assisted Microtechnology, 2nd ed., R. M. Osgood, Jr., Ed. Berlin,
Germany: Springer-Verlag, 1998.[2.] Abhay S Chounde, Sushama A Keskar and Anand Desai, “web based recruitment process:A challenge
for Indian i.t. companies,” published by IEEE in 2010.[3.] Jacob Duif, Marie-Louise Barry, “Towards Framework for Human Resource Management Processes in
mature project oriented organization case for an ICT organization n south africa,” Published by IEEE in2011.
[4.] V.Cho and E.Ngai, “Data Mining for Selection of Insurance Agents,” Expert Systems Appl., 20, No 3,pp 123-132, 2003.
[5.] Yu Zhitao, ”System Design for Property Managers Skills Standard Based on the Psycological contract,”published by IEEE in 2011.
[6.] Gao Shikui and An Haizhong, “Research on Comprehensive HRM based on e-hr under the 0economiccrisis,” published by IEEE 2010.
[7.] R.Lakshmipathi, M.Chandrasekaran, et.l, "An intelligent agent based talent evaluation system using aknowledge base," international journal of information technology and knowledge management 2010,volume 2, No. 2, pp.231-236.
[8.] B Ling Zhou and Stephen Yau, "Association rule and quantitative association rule mining amonginfrequent items," in proceedings of ACM in 2007.
[9.] R. Agrawal and R. Srikant, “Fast algorithms for mining association rules,” In Proceedings of the 20thInternational Conference on Very Large Databases(VLDB), Sept. 1994, pp. 487-499.
[10.] R. Agrawal and R. Srikant, “Mining sequential patterns,” In International Conference on DataEngineering (ICDE), 1995, pp. 85-93.
[11.] R. Srikant and R. Agarawal, “Mining quantitative association rules in large relational tables,” InProceedings of the ACM - Special Interest Group on Management of Data (ACM SIGMOD), 1996,pp.1-12.
[12.] R. J. Bayardo, “Efficiently mining long patterns from database,” In Proceedings of the 1998 ACMSIGMOD International conference on Management of data, 1998, pp. 85-93.
[13.] R. Agrawal, T. Imielinski, and A. Swami, ”Mining association rules between sets of items in largedatabases,” In Proceedings of the Association for Computing Machinery- Special Interest Group onManagement of Data (ACM-SIGMOD), May 1993, pp. 207-216.
[14.] M. Mayilvaganan and D.Kalpanadevi,”Comparison of classification Techniques for predicting theperformance of students’ Academic Environment”, In international conference on Communication andnetwork Technology (ICCNT), 2014.
[15.] Midhum Mohan M G &Siju K Augustin and DR.Kumari Roshni VS,”A BigData Approach forClassification and Prediction of Student Result Using MapReduce”,in IEEE Recent Advance inintelligent Computational System(RAICS),10-12 December 2015.

National Conference on Emerging Trends in Science, Technology and Management, 11-12 Nov 2017, ISBN: 978-93-5281-325-4 Page 350
[16.] Baradwaj, B. K., and Pal, S. 2012. Mining educational data to analyze students' performance. arXivpreprint arXiv:1201.3417.
[17.] Mohammed M. Abu Tair, Alaa M. El-Halees, “Mining Educational Data to Improve Students’Performance: A Case Study”, International Journal of Information and Communication TechnologyResearch, Volume 2 No. 2, February 2012 ISSN 2223-4985.
[18.] Mankad, K., Sajja, P.S., and Akerkar, R. Evolving Rules Using Genetic Fuzzy Approach: AnEducational Case Study. International Journal on Soft Computing, 2(1), 35-46. (2011).
[19.] Carter, P.: The Complete Book of Intelligence Tests. John Wiley,0-470-01773-2 (2005)
National Conference on Emerging Trends in Science, Technology and Management, 11-12 Nov 2017, ISBN: 978-93-5281-325-4 Page 351
INDUSTRIAL WASTE WATER TREATMENT: AREVIEW
Akanksha Raj Sriwastava, Nitin VermaDepartment of Biotechnology
Ashoka Institute of Technology & Managemant, Varanasi-221007
Abstract-Human activities generate a tremendous volume of sewage and wastewater that require treatmentbefore discharge into waterways. Often this wastewater contains excessive amounts of nitrogen, phosphorus,and metal compounds, as well as organic pollutants that would overwhelm waterways with an unreasonableburden. Wastewater also contains chemical wastes that are not biodegradable, as well as pathogenicmicroorganisms that can cause infectious disease.Phenols and phenolic compounds originated from oilrefineries, pulp and paper manufacturing plants, resins and coke manufacturing, steel and pharmaceuticalindustries are toxic to human beings, fish and to several biochemical functions. Increasing presence ofphenols represents a significant environmental toxicity hazard. As they persist in the environment, they arecapable of long-range transportation, bioaccumulation in human and animal tissue and biomagnifications infood chain.. The concentration of phenols in waste waters varies from 10 to 300 mg/L. Increasingly stringentrestrictions have been imposed on the concentrations of these compounds in wastewaters for safe discharge.Thus, the approach for the removal of phenols from industrial wastewater has generated significantinterest. On the other hand due to increased demand for textile products, the textile industry and itswastewater have been increasing proportionally, making it one of the main sources of severe pollutionproblems worldwide. Approximately 100.000 commercial dyes and dyestuff are used in the coloring (textile,cosmetic, leather) industries and around 10-15% of all dyestuff are directly lost to wastewater. Particularly,azo dyes are the most commonly used synthetic dyes in textile, food, paper-making and cosmetic industries.Biological treatment has been shown to be economical, practical and the most promising and versatileapproach as it leads to complete mineralization of phenol with low possibility of the production ofbyproducts. Industrial biological wastewater treatment systems are designed to remove pollutants from theenvironment using microorganisms. The microorganisms used are responsible for the degradation of theorganic matter. A number of biotechnological approaches have been suggested by recent research as ofpotential interest towards combating this pollution source in an eco – efficient manner, including the use ofbacteria or fungi. Biotreatment depicts a cheaper and environmentally friendlier alternative for colourremoval in textile effluents. Biological treatments have several advantages such as cheap, simple, producesmaller volumes of excess sludge and high flexibility, since it can be applied to very different types ofeffluents. In this viewpoint, the application of biodegradation process to metabolize the toxic wastewaterappears to be an alternative to conventional treatment processes. In this review we have emphasized mainlyon dyes & phenolics based waste water treatment.
Key words-Industrial waste water, Microbial, Dyes, Phenol, Toxic, Hazardous.
1. INTRODUCTION
Water pollution due to colour dyestuff industrial waste becomes a major alarm worldwide. Manyindustries including leather and textile uses dyes comprehensively in different unit operation. Mainpollution in textile industries came from dyeing and finishing segment. These processes require a widerange of input chemicals and dyestuff, which are generally an organic compound of complex structures(Chen et al, 2003) Wastewater containing dyes are very difficult to treat, since the dyes are recalcitrantorganic molecules, resistant to biological degradation and are stable to light. The dye pollution causedby the industrial wastewater is an important and hazardous problem faced by many countries(Baughman et al, 1988). Dye pollution from industrial effluents has a direct impact on human’s healthand ecological equilibrium (Joshi et al, 2004). Dyes even at low concentrations affect aquatic andterrestrial life. Dye concentrations in watercourses higher of 1 mg/L caused by the direct discharges oftextile effluents, treated or not, can give rise to public acquiescent (Zhou & Zimmermann, 1993). Somedyes show carcinogenic and mutagenic effect when inhaled and when in contact with the skin.Therefore, the removal of the dyes from wastewater is required (Ergas,et al,2006). The biologicaltreatment is the most economically used methods compared to other physical and chemical processes.Levin et al(2004) evaluated the argentinean white rot fungi for their ability to produce lignin-modifyingenzymes and decolorize industrial dyes. Chen et al (2003) investigated the degradation of N-heterocyclic indole by a novel endophytic fungus Phomopsis liquidambari. It was also established thatPhanerochaete chrysosporium is capable of biodegrading various pollutants (Robinson et al, 2011).Numerous bacteria capable of dye decolourization have been reported. Bacterial strains capable ofdecolorizing Methyl Red (MR) have also been reported as suitable for future applications in azo dyescontaining industrial effluents(Banat et al, 1997)(Wong & Yuen, 1996).
National Conference on Emerging Trends in Science, Technology and Management, 11-12 Nov 2017, ISBN: 978-93-5281-325-4 Page 352
Amongst vat dyes, indigo is commonly used for the manufacture of denim. Cotton is the most widelyused fabric among all textiles, hence azo dyes and vat dyes are discharged frequently in large quantitiesinto the environment. Azo dyes due to their poor exhaustion properties as much as 30% of the initialdye applied remains unfixed and ends up in effluents. In the case of vat dyes, around 5-20% remainsunfixed.(Manu & Chaudhari, 2003).The primary use for indigo is as a dye for cotton yarn, which is mainly for the production of denimcloth for blue jeans. Amongst the vat dyes, indigo dyes are commonly used for the manufacture ofdenim (Chang-en Tian et al, 2013). Dye manufacturing industries and textile industries are the largestsource of dye containing effluent that on discharge generates serious environmental threats. Methyl redis an anionic azo dye. It is well known that methyl red dye has been used in paper printing and textiledyeingand it causes irritation of the eye, skin and digestive tract inhaled/swallowed (Ayadetal,2011).Methylene blue is a model cationic dye employed by industries such textile industry for avariety of purposes. Methylene blue can cause eye burn which may be responsible for permanent injuryto the eyes of human as well as aquatic animals.Azo dyes are the largest class of dyes used in industry.Their release into the environment has resulted in a pollution problem worldwide. Azo dyes arearomatic structures characterized by one or more azo linkages (R1N=NR2).An estimated 700,000metric tons of dyes are produced annually worldwide, of which 60-70% are azo dyes, Duringmanufacturing and usage, an estimated 10-15% is released into the environment (Asadet al, 2007).Therefore, emission of these pollutants should be avoided and efficient approaches have to be searchedout to degrade those dyes that have been released in the environment.On the other hand phenol containing wastewater needs careful handling before they are discharged tothe receiving water bodies. Due to discharge of toxic effluents long-term consequence of exposure cancause cancer, delayed nervous damage, malformation in urban children, mutagenic changes,neurological disorders etc Balaji et al., (2005). Phenol and chromium are the major contaminant presentin the effluent discharged from the various industrial processes such as wood preserving, metalfinishing, petroleum refining, leather tanning and finishing, paint and ink formulation, pulp and paperindustry, Textile Industry Pharmaceutical industry and manufacturing of automobile parts industries(Tziotzios et al., 2005)
Microbes used for industrial waste water treatment
Several fungal and bacterial systems have been demonstrated to degrade various classes of dyes.Efforts to isolate bacterial cultures capable of degrading azo dyes have been a promising task. Brahimi-Horn et al.(1992) described a bacteria Mirothecium verrucaria which are capable of effectivelydecolorizing two azo dyes, Orange II, 10B (blue) and RS (red).Levin et al. (2004) evaluated theargentinean white rot fungi for their ability to produce lignin-modifying enzymes and decolorizeindustrial dyes. Chen et al.(2003) investigated the degradation of N-heterocyclic indole by a novelendophytic fungus Phomopsis liquidambari. A wide variety of microorganisms are capable ofdecolorization of a wide range of dyes some of them are as bacteria: Escherichia coli, Pseudomonasluteola, Aeromonashydrophila; Fungi: Aspergillus niger, Phanerochaete chrysosporium, Aspergillusterricola, P.chrysosporium;Phomopsis liquidambari., yeasts: Saccharomyces cerevisiae, Candidatropicalis, C. lipolytica ; algae: Spirogyra species , Chlorella vulgaris , C. sorokiniana,Lemnaminuscula, Scenedesmusobliquus, C. pyrenoidosa and Closteriumlunula.(Hu. T. L., 1994)(Pandeyet al, 2007) (Nigam et al,1996). White-rot basidiomycetes are a group of fungi capable ofdepolymerizing and mineralizing otherwise not easily degradable lignin with their extracellular andnon-specific ligninolytic enzymes(Levin et al. (2004) .Degradation of phenol occurs as a result of theactivity of a large number of microorganisms including bacteria and fungi. Bacterial species includeBacillus sp, Pseudomonas sp, Achromobacter sp etc. Fusarium sp, Corious versicolor, Ralstonia sp,Streptomyces sp etc are also proved to be efficient fungal groups that evidenced phenol biodegradationNair et al., (2008); Basha et al., (2010).Screening of potential microorganisms is a critical step in the construction of an effective treatmentprocess. Microrganisms can play a significant role in industrial waste water treatment process.Environmental protection agencies are promoting prevention of transfer of pollution problems from onepart of the environment to another. This means that for most dye manufacturing industries and textileindustries, developing on site or in plant facilities to treat their own effluent before discharging is fastapproaching reality (Mabel et al, 2013). Dye removal from coloured effluent in particular, has recentlybecome of major scientific interest.
National Conference on Emerging Trends in Science, Technology and Management, 11-12 Nov 2017, ISBN: 978-93-5281-325-4 Page 353
Methods used for Waste water treatment:
Physical and Chemical MethodsThose methods include ozonization, adsorption, ion exchange, membrane filtration, chemical oxidationetc. But these processes are high energy consuming, non economic, release effluents and waste waterswhich requires further treatment and thus are alarming for the environment. As well as completeremoval of the pollutants cannot be possible by the use of physical and chemical processes.Chemical oxidation:Chemical oxidation with ozone can be used to treat organic pollutants or act asdisinfectant agents. Ozone is a powerful oxidant that can oxidize a great number of organic andinorganic materials. Ozone based technologies research is also being focused on the catalytic ozonationwhere the presence of catalyst significantly improved the oxidation rate of organic compounds.(Wanget al, 2008). The goal of any oxidation process is to generate and use hydroxyl free radicals (OH.) asstrong oxidant that react with organic contaminants and destroy compounds that can not be oxidized byconventional oxidant. Fenton's reagent is an effective chemical means of decolorization of the textilewastewater which are resistant to biological treatment or is poisonous to live biomass but not veryeffective in reducing its COD unless combined with another process such as coagulation. Ozonetreatment is widely used in water treatment; ozone either alone or in combinations (O3-UV or O3-H2O2)is now used in the treatment of industrial effluents . Industrial textile wastewater is usually treated byconventional methods such as photochemical oxidation. UV light activates the destruction of H2O2 intohydroxyl radicals, these radicals may attack organic molecules by abstracting a hydrogen atom fromthe molecule that can oxidize organic compound (RH) producing organic radical (R).(Arsalan et al,2007).Ion exchange: Ion exchange means the removal of an ion from an aqueous solution by replacinganother ionic species. There are natural and synthetic materials available which are specially designedto enable ion exchange operations at high levels. So ion exchangers are used to perform this ionexchange for removal of organic and inorganic pollutants along with other heavy metals forpurification and decontamination of industrial effluent. Synthetic and industrially produced ionexchange resins are mainly made up of polystyrene and polyacrylate are in the form of small andporous beads. The most common one is aluminium silicate minerals which are also called zeolites(Raghu and Basha, (2007). There are different zeolites available made up of various ionic materialswhich have affinity towards some particular metals. The main features of the ionic resins includematerial properties such as like adsorption capacity, porosity, density etc.The main disadvantagesassociated with ion exchange method are the high cost of the ion exchange resins and each resin mustbe selectively removes one type of contaminant only. Further, complete removal of the contaminant isnot possible. Besides, it can be used for limited cycles only as by passing concentrated metal solutionthe matrix gets easily owned out by organics and other solids in the wastewater after several use.Moreover ion exchange is also highly sensitive to pH of the solution (Liotta et al., (2009).Adsorption: Adsorption is a widely used method for the treatment of industrial wastewater containingcolour, heavy metals and other inorganic and organic impurities stated by several researchers (Al-Rakibi et al, 2007). Adsorbent materials are basically derived from low-cost agricultural wastes,activated carbon prepared from various raw materials such as sawdust, nut shells, coconut shells etc.Zawani et al.,(2009). These adsorbents are basically used for the effective removal and recovery oforganic and metal pollutants from wastewater streams. Bioadsorption is a novel approach, andconsidered to be relatively superior to other techniques because of its low cost, simplicity of design,high efficiency, availability and ability to separate wide. The dye removal capacity by each givenbiomass actually depends upon the surface area of the adsorbent, natural adsorbing capacity of thebiomass, pH of the solution, type of dye and salt content. There are many reports on the removal ofdyestuff by sawdust, hardwood, baggase pith, rice husk and bark, maize Cob and banana pith. Aconventional biological waste water treatment process is not very efficient in treating dye waste waterthough, because dyes are less biodegradable. Due to the presence of ionic functional groups and porousnature, peat acts as a good adsorbent, as it adsorbs a wide variety of pollutant organic materials.Adsorption is an attractive and effective method for dye removal from wastewater, especially if theadsorbent is cheap and widely available (Jecu.,L,2000)(Patel & Vash,2010). Activated carbon is themost widely used method of dye removal with great success because it's higher adsorption capacity.The adsorption on activated carbon without pretreatment is impossible because the suspended solidsrapidly clog the filter (Dincer et al ,2007).The cellular structure of peat makes it an ideal choice as anadsorbent. It has the ability to adsorb transition metals and polar organic compounds from dye-containing effluents. Unlike activated carbon it requires no activation, and also costs much less. Woodchips show a good adsorption capacity for acid dyes, although due to their hardness, it is not as good asother available sorbents and longer contact times are required (Nigam et al., 2000). Many low-cost
National Conference on Emerging Trends in Science, Technology and Management, 11-12 Nov 2017, ISBN: 978-93-5281-325-4 Page 354
adsorbents have been investigated on fly ash for dye adsorption (Gupta and Sarah., 2009). Itsadsorption capacity depends on the properties of adsorbent such as porous structure, chemical structureand surface area (Dincer et al., 2007).Membrane filtration:Membrane filtration technique has received a significant attention for the wastewater treatment. Itconsiders the application of hydraulic pressure to bring about the desired separation through the semipermeable membrane as reported by Chen et al (2004).Membranes are of different pore size and it is necessary to select membranes of appropriatepore size for specific purpose so that effluent and wastewater could be purified and permeatecould be recycled a number of times(Bodalo et al,2008).The main problem associated with this processis incomplete removal of contaminants, high energy requirement, high cost of the membrane andlongevity of the membrane. After long term use the membrane get clogged with the contaminantspresent in the waste water and is damaged due to extra pressure on the membrane (Robinson et al.,2001).Electrocoagulation has been developed in recent years and employs the electrochemical reaction toproduce metal ions at the anode, causing the metal ions to immediately undergo further spontaneousreactions to produce corresponding hydroxides and/or polyhydroxides at the cathode (Park et al.,2006)(Raghu et al, 2007). Radiation in general is the emission of any rays or particles from a source,the energy travels through space. Radiation is classified into two main categories; ionizing radiationand non-ionizing.(Arafat, HA,2007). Generally, use of radiolysis in environmental remediation ofwastewater, contaminated soil, sediment and textile effluents is a promising treatment technology;because the effect of radiation can be intensified in aqueous solution in which the dye molecules aredegraded effectively by the primary products formed from the radiolysis of water. The radiation dosenecessary for complete decomposition of a dye depends principally on its molecular structure andreactivity towards the primary water radiolysis products (Yang et al , 2005)(Zhang et al, 2005).Gamma and electron beam radiation can be considered as alternate methods for the treatment ofwastewater from textile industries. In such techniques, mainly hydroxyl radicals are used as primaryoxidants. The usefulness of ionizing radiation for efficient degradation of a large variety of pollutantshas been successfully demonstrated (Zhang et al., 2005).Biological Treatments: Since the removal of dyes from effluents by physico-chemical means are oftenvery costly, though efficient accumulation of concentrated sludge creates a disposal problem. Thus,there is a need to find alternative treatments that are effective in removing dyes from large volumes ofeffluents, low in cost and technically attractive.Biological methods being cheap and simple to use are resorted to as the proposed solution. The abilityof microorganisms to carry out dye decolorization has received much attention and is seen as a cost-effective method for removing these pollutants from the environment. Lately, fundamental work hasrevealed the existence of a wide variety of microorganisms capable of decolorizing wide range of dyes(Robinson et al., 2001).Microbial decolorization involving suitable bacteria, algae and fungi has attracted increasing interestthese microorganisms are able to biodegrade and/or bioabsorb dyes in wastewater(Chao et al , 1994)Scientists demonstrated that Trichophyton rubrum LSK-27 is a promising culture for dye removalapplications and can be a potential candidate for treatment of textile effluents under aerobic conditionsleading to non toxic degradation of dye compounds. The role of fungi in the treatment of wastewaterhas been extensively investigated. Fungi have proved to be a suitable organism for the treatment oftextile effluents and in dye removal (Banat et al., 1996). The fungal mycelia have an additiveadvantage over single cell organisms by solubilising the insoluble substrates by producing extracellularenzymes, due to an increased cell-to-surface ratio; fungi have a greater physical and enzymatic contactwith the environment. The extracellular nature of the fungal enzymes is also advantageous in toleratinghigh concentrations of the toxicants (Kaushik and Malik, 2009). .
3. CONCLUSION
Synthetic dyes are used in many industries which include tanning industries, textile industries,leather industries etc. On the other hand Phenols constitute a significant category of pollutantsand are also major components of paper pulp bleach plant effluents. Many industries disposetheir effluent without any treatment or by partial physical or chemical treatments. Due to thisthe water pollution is a serious problem nowadays. With the use of microorganisms, one candegrade the dye residues remained in the effluents as well as reduce some other harmfuleffects of effluent too. To overcome such situation these effluents must be biologically treatedprior to disposal.

National Conference on Emerging Trends in Science, Technology and Management, 11-12 Nov 2017, ISBN: 978-93-5281-325-4 Page 355
REFERENCES[1.] Al-Rekabi Wisaam S., Qiang He and Qiang Wei Wu (2007) Improvements in Wastewater Treatment
Technology, Pakistan Journal of Nutrition, 6 (2): 104-110.[2.] ArslanI, Basagolu I.A & Bahnemann D.W,(2000) Advanced chemical oxidation of reactive dyes in
simulated dyehouse effluents by ferrioxalate-Fenton/UV-A and TiO2/UV-A processes,Dyes &Pigments,47,issue 3,207-218.
[3.] Asad S. , M.A. Amoozegar ,, A.A. Pourbabaee, M.N. Sarbolouki, S.M.M. Dastgheib ,2007,Decolorization of textile azo dyes by newly isolated halophilic and halotolerant bacteria BioresourceTechnology, 98 ,2082–2088.
[4.] Ayed L,,Mahadi, A, Cheref.A,Bakrouf A,2011,Decolorization and degradation of azo dye Methyl Redby an isolated Sphingomonaspaucimobilis: Biotoxicity and metabolitescharacterization,Desalination,274, Issues 1–3, Pages 272–277.
[5.] Balan DSL, Monteiro RTR (2001). Decolorization of textile indigo dye by ligninolytic fungi. J.Biotechnol. 89:141-145.
[6.] Balaji V., Datta S. and Bhattacharjee C. (2005) Evaluation on Biological Treatment for IndustrialWastewater, Vol 85.
[7.] Banat, I. M., Nigam, P., McMullan, G., Marchant, R., Singh, D., 1997. The isolation of thermophilicbacterial cultures capable of textile dye decolorization. Environ. Int. 23, 547 – 551.
[8.] Basha Khazi Mahammedilyas, Rajendran Aravindan, and Thangavelu Viruthagiri (2010) ,Recentadvances in the Biodegradation of Phenol: A review Asian J. Exp. Biol. Sci., Vol 1 (2): 219-234.
[9.] Baughman, G. L., Perenich, T. A., 1988. Fate of dyes in aquatic systems: Solubility and partitioning ofsome hydrophobic dyes and related compounds. Environ. Toxicol. Chem. 7, 183-199.
[10.] Brahimi-Horn, M. C., Lim, K. K., Liany, S. L., Mou, D. G., 1992. Binding of textile azo dyes byMirotheciumverrucaria- Orange II, 10B (blue) and RS (red) azo dye uptake for textile wastewaterdecolorization. J. Ind. Microbiol. 10, 31 – 36.
[11.] Bodalo A., Gomez J.L., Gomez M., Leon G., Hidalgo A.M. and Ruiz M.A., (2008) Phenol removalfrom water by hybrid processes: Study of the membrane process step. Desalination, 223, 323-329.
[12.] Chang-en Tian, Ruicai Tian, Yuping Zhou, Qionghua Chen and Huizhen Cheng, (2013), Decolorizationof indigo dye and indigo dye-containing textile effluent by Ganoderma weberianum, African Journal ofMicrobiology Research Vol. 7(11), pp. 941-947, 12 March, 2013.
[13.] Chao, W. L., Lee, S. L., 1994. Decolorization of azo dyes by three white rot fungi: influence of carbonsource. World J. Microbiol.Biotechnol. 10, 556 – 559.
[14.] Chen, K. C., Wu, J. Y., Liou, D. J., Hwang, S. C. J., 2003. Decolorization of textile dyes by newlyisolated bacterial strains. J. Biotechnol. 10, 57-68.
[15.] Dincer, A.R.; Gunes, Y.; Karakaya, N. and Gunes, E. (2007). Comparison of activated carbon andbottom ash for removal of reactive dye from aqueous solution. Bioresource Technol., 98, 834-839.
[16.] Ergas, S. J., Therriault, B. M. & Rechkow, D. A,2006,Evaluation of water reuse technologies for textileindustry. Journal of Environmental engineering, 315-323.
[17.] Gupta, V.K. and Suhas (2009). Application of low-cost adsorbents for dye removal. A review. Journal ofEnvironmental Management, 90 (8), 2313-2342.
[18.] Hank D., Saidani N., Namane A. and Hellal A. (2010) Batch phenol biodegradation study andapplication of factorial experimental design, Journal of Engineering Science and Technology Review, 3(1), 123-127.
[19.] Hu. T. L., 1994. Decolorization of reactive azo dyes by transformation with Pseudomonas luteola.Biores. Technol. 49, 47 – 51.
[20.] Jecu, L.2000,Solid state fermentation of agricultural wastes for endoglucanase production ,IndustrialCrops and Products ,11:1-5.
[21.] Joshi, M.; Bansal, R. & Purwar, R.,2004, Color removal from textile effluents, Indian Journal of Fibre &Textile research, 29, 239-259.
[22.] Kaushik, P. and Malik, A. (2009). Fungal dye decolourization: recent advances and future potential.Environment. International, 35, 127-141.
[23.] Levin L , Papinutti L., F. Forchiassin,2004, Evaluation of Argentinean white rot fungi for their ability toproduce lignin-modifying enzymes and decolorize industrial dyes Bioresource Technology 94, 169–176.
[24.] Liotta L. F., Gruttadauriab M., Dicarloc G., Perrini G. and Librando V. (2009) Heterogeneous catalyticdegradation of phenolic substrates: Catalysts activity Journal of Hazardous Materials, 162 588–606.
[25.] Manu B, Chaudhari S (2003). Decolourization of indigo and azo dyes in semicontinuous reactors withlong hydraulic retention time. Process. Biochem. 38:1213-1221.
[26.] Mabel Joshaline.C, Subathra.MShyamala.M, S.Padmavathy,2013, Microbial decolourisation of azo dyes- a comparitive analysis International Journal of Advancements in Research & Technology, Volume 2,Issue 11.
[27.] Nair C. Indu, Jayachandran K. and Shashidhar Shankar (2008) Biodegradation of phenol, AfricanJournal of Biotechnology, Vol. 7 (25), pp. 4951-4958.
[28.] Nigam, P., Banat, I. M., Singh, D., Marchant, P., 1996.Microbial process of fast decolorization of textileeffluent containing azo, diazo, and reactive dyes.Process Biochem. 31, 435 – 442.
[29.] Pandey Anjali, Singh Poonam, LeelaIyengar, 2007, Bacterial decolorization and degradation of azo dyesInternational Biodeterioration& Biodegradation 59, 73–84.

National Conference on Emerging Trends in Science, Technology and Management, 11-12 Nov 2017, ISBN: 978-93-5281-325-4 Page 356
[30.] Park D., Yun Y. S., Jo J. H., & Park J. M., (2006) Biosorption process for treatment of electroplatingwastewater containing Cr (VI): Laboratory-scale feasibility test. Industrial & Engineering ChemistryResearch, 45 14: 5059–5065.
[31.] Patel Himanshu and Vashi R.T. (2010) Treatment of textile wastewater by adsorption and coagulation,E-Journal of Chemistry, 7(4), 1468-1476.
[32.] Raghu S., Basha C. and Ahmed (2007) Chemical or electrochemical techniques, followed byionexchange, for recycle of textile dye wastewater Journal of Hazardous Materials Volume, 149, Issue 2,Pages 324-330.
[33.] Robinson, T.; Chandran, B. and Nigam, P. (2001). Studies on the decolorization of an artificial textileeffluent by white-rot fungi in N-rich and N-limited media. Appl. Microbiol. Biotechnol., 57, 810-813.
[34.] Robinson, T.; Chandran, B. & Nigam, P., 2001, Studies on the production of enzymes by white-rot fungifor the decolourisation of textile dyes. Enzyme and Microbial technology, 29, 575-579.
[35.] Tziotzios G., Teliou M., Kaltsouni V., Lyberatos G. and Vayenas D.V. (2005) Biological phenolremoval using suspended growth and packed bed reactors, Biochemical Engineering Journal, 26, 65–71.
[36.] Wang X. J., Chen S. L., Gu X. Y., Wang K. Y. and Qian Y. Z. (2008) Biological aerated filter treatedtextile washing wastewater for reuse after ozonation pre-treatment, Water Science Technology, WST58.4.
[37.] Wong, P. K., Yuen, P. Y., 1996. Decolorization and biodegradation of methyl red by Klebsiellapneumoniae RS-13. Water Res. 30, 1736 – 1744.
[38.] Xing-GuangXie, Chuan-Chao Dai, 2015, Degradation of a model pollutant ferulic acid by the endophyticfungus Phomopsisliquidambari, Bioresource Technology 179, 35–42.
[39.] Yang, C.; Jared, M.C. and Garrahan, J. (2005). Electrochemical coagulation for textile effluentdecolorization. J. Hazard. Mater., B127, 40-47.
[40.] Zawani Z., Luqman Chuah A. and Thomas Choong S. Y. (2009) Equilibrium, kinetics andthermodynamic studies: adsorption of remazol black 5 on the palm kernel shell activated carbon (PKS-AC), European Journal of Scientific Research Vol.37 No.1, pp.67-76.
[41.] Zhang, S.J.; Yu, H.Q. and Li, Q.R. (2005). Radiolytic degradation of acid orange 7: A mechanistic study.Chemosphere, 61, 1003-1011.
[42.] Zhou, W., Zimmermann, W., 1993. Decolourization of industrial effluents containing reactive dyes byactinomycetes. FEMS Microbiol. Lett. 107, 157 –16.
National Conference on Emerging Trends in Science, Technology and Management, 11-12 Nov 2017, ISBN: 978-93-5281-325-4 Page 357
NUMERICAL SIMULATION AND PARAMETRICOPTIMIZATION IN TURNING OF INCONEL 718
Rajiv Kumar Yadava, Kumar Abhishekb, SibaSankarMahapatrac
a,b,cNational Institute of Technology, Rourkela-769008, Odisha, India
Abstract
In the era of globalization, simulation and optimization of parametric combination of a process has beenconsidered as a key issue in manufacturing sector for maintaining both quality and productivity simultaneously. Inthe turning of Inconel 718, a Fe-Ni based super alloywhich has been widely used in the aerospace industry becauseof its capacity to keep mechanical properties at high temperatures. In this work, turning parameters such as toolmaterial (uncoated and coated), cutting speed, feed rate and depth of cut have been varied in three levels toinvestigate their effects on the performance characteristics viz., material removal rate, surface roughness andcutting force. DEFORM-3DTM Version 6.1 has been adopted for simulation of these performance characteristicswhereas data envelopment analysis (DEA) has been implemented for the prediction of optimal cutting conditionsin dry turning of Inconel 718 using two types of tungsten carbide tools (uncoated and CVD coated) to obtain theoptimum results.
Keywords:DEFORM-3DTM; Data envelopment analysis; Inconel 718.
1. Introduction
Nickel-based super alloys are widely used in aerospace industry particularly in making componentsfor jet engines and gas turbines because of their high yield strength, excellent fatigue resistance, andgood corrosion endurance in severe conditions. Out of commercially available nickel base super-alloys,Inconel 718 is frequently used in aircraft gas turbines, reciprocating engines, space vehicles,nuclear power plants, chemical and petrochemical industries, and heat exchangers. Hence, it is theessential to analyze the machinability aspects of these components. Literature in this field of study isrich enough highlighting various aspects of machining of conventional metals essential for betterunderstanding of machining process behavior, parametric influence and their interaction in order toproduce high quality finished part in terms of dimensional accuracy, material removal rate as well asgood surface finish. Liao and Chen [1] proposed a data envelopment analysis (DEA) approach as aneffective methodology for solving the multi-response optimization for practical applications. Liao [2]attempted to achieve the optimizationof multi-response problem with censored data by using thecombination of neural network and DEA method. Devillez et al. [3] observed the influence of drymachining on surface integrity. The study also focused that dry machining with a coated carbide toolleads to improved surface quality with residual stresses and microhardness values in the machiningaffected zone of the same order than those obtained in wet conditions when using the optimized cuttingspeed value. Yanda et al. [4] used finite element method (FEM) simulation technique to investigate theeffect of rake angle on stress, strain and temperature on the edge of carbide cutting tool in orthogonalcutting of ductile cast iron FCD500 grade. The study also concluded that increase in rake angle inpositive section causes decrease of the cutting force.Tanase et al. [5] attempted for temperatureprediction using the process simulation with DEFORM 3D software package in machining of Ck 45 ofDIN 17200. The research also highlights that temperature of machined surface is much lower than chiptemperature.Muthu et al. [6]applied finite element method for simulation of turning process of Inconel718 material for various nose radius values.Bhoyar and Kamble [7] propose a finite element analysissimulation model in order to predict cutting forces, specific cutting energy and temperatures occurringat different points through the chip/tool contact region and the coating/substrate boundary for a rangeof cutting tool materials and defined cutting conditions. Singh et al. [8] evaluated the effect of processparameter on MRR and different surface roughness characteristics in turning of GFRP with the aid ofDEA methodology. The present work focused on both simulation and optimization of process variablewhile turning of Inconel 718.
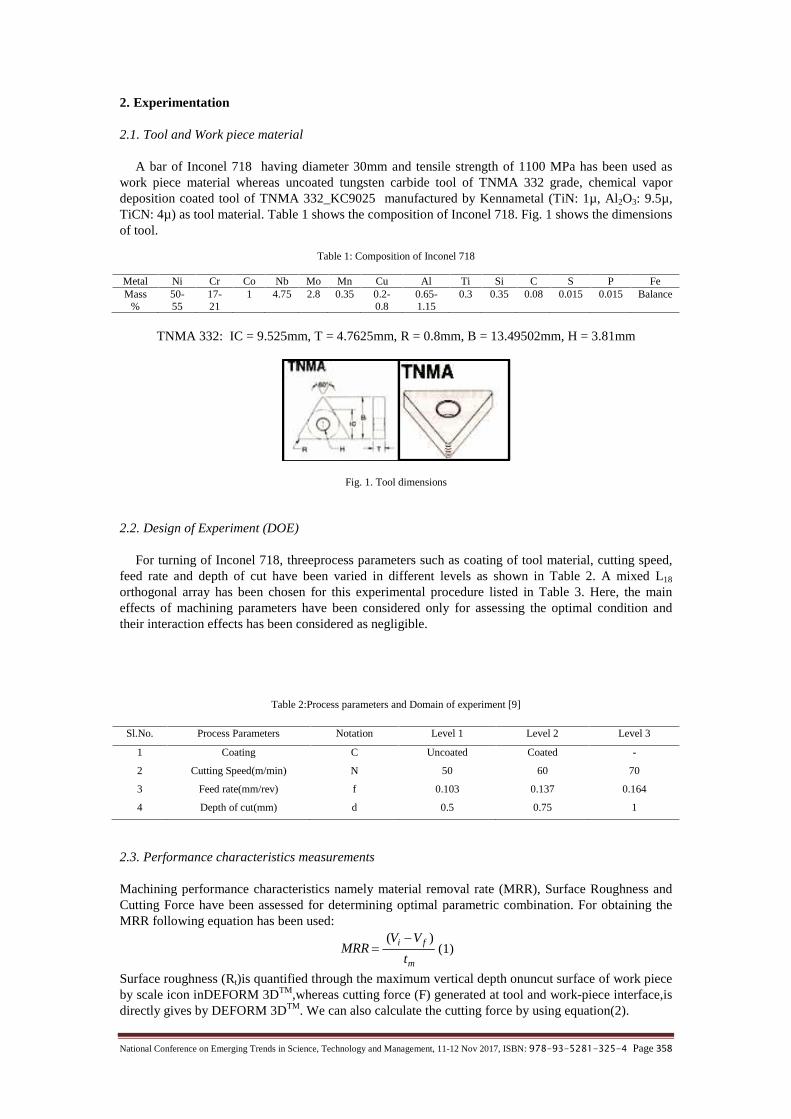
National Conference on Emerging Trends in Science, Technology and Management, 11-12 Nov 2017, ISBN: 978-93-5281-325-4 Page 358
2. Experimentation
2.1. Tool and Work piece material
A bar of Inconel 718 having diameter 30mm and tensile strength of 1100 MPa has been used aswork piece material whereas uncoated tungsten carbide tool of TNMA 332 grade, chemical vapordeposition coated tool of TNMA 332_KC9025 manufactured by Kennametal (TiN: 1µ, Al2O3: 9.5µ,TiCN: 4µ) as tool material. Table 1 shows the composition of Inconel 718. Fig. 1 shows the dimensionsof tool.
Table 1: Composition of Inconel 718
Metal Ni Cr Co Nb Mo Mn Cu Al Ti Si C S P FeMass
%50-55
17-21
1 4.75 2.8 0.35 0.2-0.8
0.65-1.15
0.3 0.35 0.08 0.015 0.015 Balance
TNMA 332: IC = 9.525mm, T = 4.7625mm, R = 0.8mm, B = 13.49502mm, H = 3.81mm
Fig. 1. Tool dimensions
2.2. Design of Experiment (DOE)
For turning of Inconel 718, threeprocess parameters such as coating of tool material, cutting speed,feed rate and depth of cut have been varied in different levels as shown in Table 2. A mixed L18
orthogonal array has been chosen for this experimental procedure listed in Table 3. Here, the maineffects of machining parameters have been considered only for assessing the optimal condition andtheir interaction effects has been considered as negligible.
Table 2:Process parameters and Domain of experiment [9]
Sl.No. Process Parameters Notation Level 1 Level 2 Level 3
1 Coating C Uncoated Coated -
2 Cutting Speed(m/min) N 50 60 70
3 Feed rate(mm/rev) f 0.103 0.137 0.164
4 Depth of cut(mm) d 0.5 0.75 1
2.3. Performance characteristics measurements
Machining performance characteristics namely material removal rate (MRR), Surface Roughness andCutting Force have been assessed for determining optimal parametric combination. For obtaining theMRR following equation has been used:
m
fi
t
VVMRR
)( (1)
Surface roughness (Rt)is quantified through the maximum vertical depth onuncut surface of work pieceby scale icon inDEFORM 3DTM,whereas cutting force (F) generated at tool and work-piece interface,isdirectly gives by DEFORM 3DTM. We can also calculate the cutting force by using equation(2).

National Conference on Emerging Trends in Science, Technology and Management, 11-12 Nov 2017, ISBN: 978-93-5281-325-4 Page 359
)cos(
)cos(.
sin
CS AF (2)
where, iV = Initial Volume fV = Final Volume S = Shear Stress, CA = Area of undeform chip, =
Friction angle, =Rake angle, = Shear angle
1. Cutting force of 60_0.103_0.75_CVDtool (370N) 2. Cutting force of 60_0.164_0.50_CVDtool (301N)3. Cutting force of 50_0.137_0.50_CVDtool (353N) 4. Cutting force of 50_0.164_0.75_CVDtool (775N)5. Cutting force of 70_0.137_1_Uncoated (780N) 6. Cutting force of 60_0.164_1_Uncoated (890N)7. Cutting force of 60_0.103_0.5_Uncoated (221N) 8. Cutting force of 50_0.164_1.0_Uncoated (990N)
Note: Cutting force of cutting speed (N) _feed rate (f) _depth of cut (f) _tool material (cutting force)
Fig. 2. Cutting force in different conditions
3. Proposed Methodology and Discussions
In this present work,DEFORM 3DTMhas been used for the simulation for the experimental datawhereas DEA has been used for assessing the optimum machining condition.
3.1. Finite Element Analysis
In recent years, Finite Element analysis has become the main tool for simulating metal cuttingprocess because to avoidtime and cost consuming in the actual test, hence it is preferred overexperimental work. DEFORM 3DTM uses Usui’s tool wear model to measure flank wear of cuttinginserts, which is used only with non-isothermal run as it requires interface temperature calculation. Theinitial temperature for work-piece and tool is set to room temperature. Simulations are carried out toreach the transient condition and then transformed to steady-state condition. The cutting insert is takenas a rigid object and the work-piece as plastic. During meshing of cutting insert and work-piece, thenumber of tetrahedron elements is fixed to 20000. During meshing, a finer mesh can be seen at the tooltip and work-piece. The tetrahedral mesh of insert and work-piece are shown in Fig. 3.
Fig. 3. Tetrahedral mesh of tool and work-piece.
In Usui’s tool wear model, the wear rate is a function of constant pressure, relative velocity andabsolute temperature at the contact surface as Eq. given below:
dtaPVew Tb
(3)
1 2 3 4
5 6 7 8

National Conference on Emerging Trends in Science, Technology and Management, 11-12 Nov 2017, ISBN: 978-93-5281-325-4 Page 360
where, P = interface pressure; V = sliding velocity; T=interface temperature (in degree absolute);dt = time increment; a, b = experimental calibrated coefficients.The simulation results have been presented in Table 3.
Table 3: Simulation Result
Input Variables Experimental Results [9] Simulation Results
Sl.No.
C N f d F (N) Rt (µm) F (N) Rt (µm)MRR(mm3/
sec)1 Uncoated 50 0.103 0.50 74 0.734 314 0.89 1320.75
2 Uncoated 50 0.137 0.75 509 0.901 530 1.27 1475.86
3 Uncoated 50 0.164 1.00 911 1.028 990 1.33 1181.00
4 Uncoated 60 0.103 0.50 60 0.830 221 0.93 858.76
5 Uncoated 60 0.137 0.75 374 0.997 445 1.34 1398.48
6 Uncoated 60 0.164 1.00 776 1.124 890 1.53 1443.07
7 Uncoated 70 0.103 0.75 78 0.898 190 1.04 936.33
8 Uncoated 70 0.137 1.00 513 1.065 780 1.87 1540.65
9 Uncoated 70 0.164 0.50 94 1.275 201 1.36 1090.67
10 Coated 50 0.103 1.00 650 0.653 790 0.93 1537.41
11 Coated 50 0.137 0.50 263 0.903 353 1.12 1235.29
12 Coated 50 0.164 0.75 665 1.030 775 1.28 1804.00
13 Coated 60 0.103 0.75 241 0.776 370 0.93 2524.60
14 Coated 60 0.137 1.00 676 0.943 785 1.67 2871.28
15 Coated 60 0.164 0.50 256 1.153 301 1.36 1982.97
16 Coated 70 0.103 1.00 380 0.845 450 1.23 2110.88
17 Coated 70 0.137 0.50 60 1.094 150 1.27 1471.97
18 Coated 70 0.164 0.75 395 1.220 470 1.53 1654.24
3.2. Optimization through Data Envelopment Analysis (DEA)
Data Envelopment Analysis (DEA) is first formulated by Charles, Cooper, and Rhodes in1978based on linear programming technique which is used to empirically measure the productiveefficiency of decision making units (DMUs) when the production process presents a structure ofmultiple inputs and outputs.Step 1: Normalization of input responseIt is necessary to normalize responses to ensure that all the attributes are equivalent and the sameformal.The given MRR response is normalized by the following equations:
min)(max)(
min)(
ijXijX
ijXijX
ijN
(4)
For surface roughness parameter:
min)(max)(
max)(
ijXijX
ijXijX
ijN
(5)
where, Nij = Normalized value after grey relational generation, (Xij)max= Maximum value of responseparameter
(Xij)min= Minimum value of response parameter and Xij = Value of response in ithcolumn and jth row ofdesign matrix.
Calculated normalized values have been tabulated in Table 4.Step 2: Calculation for relative efficiencyFor each experiment the relative efficiency has been computed by the aid of Lingo software packagewhich has been presented in Table 5.Following equation is used for the calculation of the relativeefficiency:

National Conference on Emerging Trends in Science, Technology and Management, 11-12 Nov 2017, ISBN: 978-93-5281-325-4 Page 361
y
kykykk VOEmax (6)Subjected to, 1kxkxUI 1ksE design such that 0, kykx VU ,
where, kyV is most favorable weights for output y of the experiment k being evaluated; kxU is most
favorable weights for input x of the experiment k being evaluated kyO values of output y for
experiment k; kxI values of input x for experiment.
Step 3: Ranking of DMUs:The ranking of DMUs has been done according to its relative efficiency and to obtain the ordinal value,the lowest ordinal value that has been assessed has given highest rank.Step 4: Obtain the optimal combinations:On the basis ordinal value obtained, the effect of factor can be evaluated as follows:
ijjijji SOVSOVE minmax (7)
where, sum of ordinal value for each level j has been denoted by ijSOV
And the optimum level for each factor combination can be assessed. Best controllable factor has beenassessed by follows:
ijj SOVjj max* (8)
Table 4: Normalized Values and Relative EfficienciesSl. No. Simulation results Relative
Efficiency
Ranking
Nor-F Nor-Rt Nor-MRR
1 0.80476 1.00000 0.22956 0.067666 5
2 0.54762 0.61224 0.30663 0.133974 8
3 0.00000 0.55102 0.16012 0.987582 17
4 0.91548 0.95918 0.00000 0.000000 1
5 0.64881 0.54082 0.26818 0.101092 7
6 0.11905 0.34694 0.29034 0.518744 15
7 0.95238 0.84694 0.03854 0.009839 2
8 0.25000 0.00000 0.33882 0.962333 16
9 0.93929 0.52041 0.11523 0.038673 3
10 0.23810 0.95918 0.33721 0.281833 13
11 0.75833 0.76531 0.18709 0.059481 4
12 0.25595 0.60204 0.46968 0.404370 14
13 0.73810 0.95918 0.82774 0.264983 12
14 0.24405 0.20408 1.00000 1.000000 18
15 0.82024 0.52041 0.55861 0.198212 9
16 0.64286 0.65306 0.62217 0.233224 11
17 1.00000 0.61224 0.30470 0.090603 6
18 0.61905 0.34694 0.39527 0.199963 10
Table 5: Main effects on SOV
Factors Level 1 Level 2 Level 3 Max-MinC 74 97 - 23N 61 62 48 14f 44 59 68 24d 28 53 90 62
The main effect of each parameter has been assessed by above formula and optimal parametriccombination is obtained as 3322 dfNC shown in Table 5 and Fig. 4.

National Conference on Emerging Trends in Science, Technology and Management, 11-12 Nov 2017, ISBN: 978-93-5281-325-4 Page 362
Fig. 4.Factorial Plots
4. Conclusions
The present study focused on the simulation and optimization of process parameters criterion inmachining of Inconel 718by utilizingDEFORM 3DTMandDEA methodology. DEA method has beeneasily applicable to evaluate the alternatives and select the most suitable manufacturing system as itinvolves the least amount of mathematical calculations. The study illustrates the applicability,effectiveness and flexibility of this method.
References
[1] Liao H. C., Chen Y. K., 2002. Optimizing multi-response problem in the Taguchi method by DEA based ranking method.International Journal of Quality & Reliability Management, 19, p. 7.
[2] Liao H. C., 2004. A data envelopment analysis method for optimizing multi-response problem with censored data in theTaguchi method. Computers & Industrial Engineering, 46, p. 817.
[3] DevillezA., Le Coz G., Dominiak S., Dudzinski D., 2011. Dry machining of Inconel 718, work piece surface integrity. Journalof Materials Processing Technology, 211, p. 1590.
[4] Yanda H., Ghani J.,CheHaron C. H., 2010. Effect of rake angle on stress, strain and temperature on the edge of carbidecutting tool in orthogonal cutting using FEM simulation. ITB Journal of Engineering Science, 42, p. 179.
[5] TanaseI., PopoviciV., CeauG. ,PredinceaN., 2012. Cutting edge temperature prediction using the process simulation withDEFORM 3D software package. Proceedings in Manufacturing Systems, 7, p.265.
[6] Muthu E., Senthamarai K., Jayabal S., 2012. Finite element simulation in machining of Inconel 718 nickel basedsuperalloy.International Journal of Advanced EngineeringApplications, 1, p. 22.
[7] Bhoyar Y. R., Kamble P. D., 2013. Finite element analysis on temperature distribution in turning process using DEFORM-3D.International Journal of Research in Engineering & Technology, 2, p. 901.
[8] Singh A., Abhishek K.,Sahu J.,Datta S., Mahapatra S. S., DEA based Taguchi approach for multi-objective optimization: Acase study. International Conference on Modeling, Optimization and Computing (ICMOC 2012).
[9] Satyanarayana.B, RangaJanardhana.G, HanumanthaRao.D, Kalyan.R.R., 2012.Prediction of optimal cutting parameters forhigh speed dry turning of Inconel 718 using GONNS.International Journal of Mechanical Engineering and Technology, 3,p.294.
0
100
200
C1 C2
0
100
200
N1 N2 N3
0
100
200
f1 f2 f3
0
100
200
d1 d2 d3
National Conference on Emerging Trends in Science, Technology and Management, 11-12 Nov 2017, ISBN: 978-93-5281-325-4 Page 363
A REVIEW: CURRENT TRENDS OF MEDICINALPLANTS HAVING ANTIDIABETIC ACTIVITY
Nath Devendra1, Singh Sandhya2, Kumar Rajesh3, Maurya Pankaj4
Department of PharmacyFaculty of Pharmacy, Ashoka Institute of Technology and Management, Varanasi
[email protected], [email protected]
Abstract: Ayurveda and other Indian literature mentioned the use of plants in treatment of various humanailments. In the last few years, there has been an exponential growth in the field of herbal medicine andgaining popularity both in developing and developed countries because of their natural origin and less sideeffects. Diabetes mellitus is a chronic heterogeneous disorder affecting the β-cells of endocrinal pancreaticgland nearly 10% of the population all over the world also the number of those affected is increasing day byday. plant showing lowering the elevated glucose level mainly belongs to the family Leguminoseae,Lamiaceae, Liliaceae, Cucurbitaceae, Asteraceae, Moraceae, Rosaceae and Araliaceae. The most activeplants have been known to cure and control diabetes without causing any side effects like Allium sativum,Gymnemasylvestre, Citrulluscolocynthis, Trigonellafoenum greacum, Momordicacharantia andFicusbengalensis. Aim of the present study is evaluated various medicinal plants used for antidiabeticactivity. This article to provide an in-depth and comprehensive review on various plant species that havebeen explored as anti-diabetic agents.
Keywords: β-cellsdiabetes mellitus, insulin, natural products, glucose
INTRODUCTION
Diabetes is usually a lifelong(chronic) disease in which there are high levels of sugar in the blood [1].Diabetes Mellitusis a metabolic disorder initially characterized by a glucose level loss homeostasis,due to fat and Protein metabolismdisturbances of carbohydrate, resulting from defects in insulinproduction,secretion, insulin action [2]. In longtermdamage to organs such as the kidneys, liver, heartand blood vessels eyes, nerves. Complications in some of theseorgans can lead to death.
TYPE I DIABETES MELLITUS
It is a result of cellular mediated autoimmune destruction of the insulin producing and secreting β-cellsof the pancreas, which results in an absolute deficiency of insulin for the body. Patients are more proneto ketoacidosis. It usually occurs in children and young adults, usually before 40 years of age, althoughdisease onset can occur at any age. The patient with type I diabetes must rely on insulin medication forsurvival. It may account for 5 -10 % of all diagnosed cases of diabetes. Autoimmune, genetic andenvironmental factors are the major risk factors for type I diabetes [3].
TYPE II DIABETES MELLITUS
Two key features in the pathogenesis of type II diabetes mellitus are a decreased ability of insulintostimulate glucose uptake in peripheral tissues, insulin resistance, and the inability of the pancreatic β-cell to secrete insulin adequately,βcell failure. The major sites of insulin resistance in type 2 diabetesare the liver, skeletal muscle andadipose tissue [4]. Both defects, insulin resistance and β-cell failure,are caused by a combination ofgenetic and environmental factors. Environmental factors such aslifestyle habits (i.e., physicalinactivity and poor dietary intake), obesity and toxins may act as initiatingfactors or progression factorsfor type II diabetes [5].
EPIDEMIOLOGY
The prevalence of GDM in India varied from 3.8 to 21% in different parts of the country, depending onthe geographical locations and diagnostic methods used. GDM has been found to be more prevalent inurban areas than in rural areas [19-26]. For a given population and ethnicity, the prevalence of GDMcorresponds to the prevalence of Impaired Glucose Tolerance [IGT, in non-pregnant adult] within thatgiven population [6].
GESTATIONAL DIABETES MELLITUS
Gestational diabetes, blood glucose elevation during pregnancy, is a significant disorder ofcarbohydratemetabolism due to hormonal changes during pregnancy, which can lead to elevated bloodglucose ingenetically predisposed individuals. It is more common among obese women and womenwith a familyhistory of diabetes. It usually resolves once the baby is born, however, after pregnancy, 5-

National Conference on Emerging Trends in Science, Technology and Management, 11-12 Nov 2017, ISBN: 978-93-5281-325-4 Page 364
10% ofwomen with gestational diabetes are found to have type II diabetes and 20-50% of women haveachance of developing diabetes in the next 5-10 years [7],.Gestational Diabetes is a form of diabetesconsisting of high blood glucose levels during pregnancy and goes away after the baby is born. Itdevelops towards the To treating the diabetes without any complication or any side effects is achallenging problem in the medical community [8]. The medicinal plants used on anti diabetictreatments possess pancreatic β-cells regenerating; insulin releasing activity and also fight the problemof Insulin resist adipose tissue, and inhibit the glucose absorption from the intestine.Symptoms of diabetes• Fatigue or severe weakness• Abnormal thirst• Irritability• Unexplained weight loss• Increased hunger• Recurrent infections• Blurred vision
Methodology: The study aimed to recollect and record, the information on anti-diabetic plants fromthe hyperglycemic condition. In this review, we have collected about 180 plants which are effective forthe reduction of hyperglycemic condition. The plants haveabout medicinal plants with Ant diabeticActivity.Important Medicinal Plants Explored as Anti-Diabetic:Acacia ArabicaAcacia arabica (babul) is used as home remedy in Indian system of medicine for reducingthecomplications of diabetes. It is found that this plant extract acts as an anti-diabetic agent by actingassecretagouge to release insulin. It induces hypoglycemia in control rats but not in alloxanizedanimals.Powdered seeds of Acacia arabicawhen administered (2, 3 and 4 g/kg body weight) to normalrabbits, induced hypoglycemic effect by initiating release of insulin from pancreatic beta cells [8].
ADANSONIA DIGITATA
Leaves bark and fruits of Adansoniadigitataare traditionally employed in several African regionsasfood and for medicinal purposes, and for the letter use, it is also named “the small pharmacy orchemisttree. Hypoglycemic activity of methanolic stem bark extract of Adansoniadigitatain Wister ratshasbeen investigated in streptozotocin induced diabetes.
ADHATODA VASICA
The methanolic extract from the leaves of AdhatodavasicaNees (Acanthaceae) showed a sucroseinhibitory activity with sucrose as a substrate. Compounds vasicine and vasicinol showed a highsucrose inhibitory activity, and the IC50 values were 125 μM and 250 μM, respectively. Kinetic datarevealedthat the compounds vasicine andvascinol inhibited sucrose-hydrolysing activity of rat intestinalα-glucosidase competitively with Ki values of 82 μM and 183 μM, respectively. [9].
AEGLE MARMELOS
Aegle marmelos leaf extract is being used in Indian system of medicine as an antidiabetic agent. Amethanolic extract of Aeglemarmeloswas found to reduce blood sugar in alloxan induced diabeticrats.Reduction in blood sugar could be seen from 6th day after continuous administration of the extractandon 12th day sugar levels were found to be reduced by 54%. This result indicates thatAeglemarmelosextract effectively reduced the blood glucose in diabetes induced by alloxan and it alsoshowedantioxidant activity [10].
ALOE BARBADENSIS
Aloe, a popular house plant, has a long history as a multipurpose folk remedy. The plant can beseparated into two basic products: gel and latex. Aloe veragel is the leaf pulp or mucilage, Aloe latex,commonly referred to as “aloe juice,” is a bitter yellow exudate from the pericyclic tubules justbeneath the outer skin of the leaves. Extracts of aloe gum effectively increases glucose tolerance inboth normal and diabetic rats [11].

National Conference on Emerging Trends in Science, Technology and Management, 11-12 Nov 2017, ISBN: 978-93-5281-325-4 Page 365
ANDROGRAPHIS PANICULATA
The chloroform extract of Andrographis paniculataroots has been tested for its antihyperglycemicactivity in alloxan-induced diabetic rats using chronic and acute studies. Significantreductions in blood glucose levels were observed in both acute and chronic studies. The extractsignificanly inhibited the induction of albuminuria, proteinemia and uremia. activity with thechloroform extract of A. paniculata roots and supports the traditional usage of the plant by Ayurvedicphysicians for the control of diabetes [12].
ANTHOCEPHALUS INDICUS
Anthocephalusindicus(family, Rubiacae: Hindi name- Kadam) is one such Ayurvedic remedy thathasbeen mentioned in many ancient Indian medical literatures to possess antidiarrhoeal,detoxification,analgesic and aphrodisiac properties.
ARTANEMA SESAMOIDES
The methanolic extract of Artanema sesamoideswas investigated for its antidiabetic activity instreptozotocin induced diabetic rat models. Administration of this extract significantly reduced thefasting blood glucose level and increased the glycogen level in liver, compared to a control group.Theextract also diminished the elevated level of SGPT, SGOT, and serum alkaline phosphatase andalsoexhibited anti-oxidant activity.
AZADIRACHTA INDICA
Hydroalcoholic extracts of this plant showed anti-hyperglycemic activity in streptozotocin-treatedrats.The extractcaused an increase in glucose uptake and glycogen deposition in isolated rathemidiaphragm. Apart from having anti-diabetic activity, this plant also has anti-bacterial,antimalarial,antifertility, hepatoprotective and antioxidant effects [13].
BOERHAVIA DIFFUSA
Boerhaviadiffusa (Nyctaginaceae) is known as punarnava and is used as diuretic, hepatoprotectiveandfor treatment of other diseases in the Indian medicinal system. A study was designed to investigatetheeffects of daily oral administration of aqueous solution of Boerhaviadiffusaleaf extract (BLEt)(200mg/kg) for 4 weeks on blood glucose concentration and hepatic enzymes in normal rats andalloxaninduceddiabetic rats
BUTEA MONOSPERMA
The plant Buteamonospermabelongs to the family Fabaceae. It is also known as Buteafrondosa,(Hindi-Dhak, Palas) and is found throughout India. A methanol extract of Buteamonospermaseeds,tested invitro, showed significant anthelmintic activity, anticonvulsive and hepatoprotective. In light ofthetraditional claim on the use of Buteamonospermain the treatment of diabetes,
CAESALPINIA BONDUCELLA
Caesalpiniabonducella F. (Leguminosae) is a medicinal plant, widely distributed throughout India andthe tropical regions of the world. Four extracts (petroleum ether, ether, ethyl acetate and aqueous) oftheseed kernels were prepared and tested for their hypoglycaemic potentials in normal rats as wellasalloxan-induced diabetic rats.
CASSIA AURICULATA
C. auriculata (Family: Cesalpinaceae) is a common plant in Asia, profoundly used in Ayurvedicmedicineas a tonic, a stringent and as a remedy for diabetes, conjunctivitis and opthalmia. It is one oftheprincipal constituents of ‘‘Avaaraipanchagachooranam”- an Indian herbal formulation used inthetreatment of diabetes to control the blood sugar level.
DISCUSSION
The body cannot produce enough insulin in which the Diabetes is a chronic disease that occurs when orcannot use insulin effectively. The diabetes disease by the year 2025, it is projected that 300 millionpeople will have diabetes patient.and it may reach to 366 million diabetes patient in the year 2030.Type 2 diabetes is a common condition and a serious global health problem.In most countries, diabeteshas increased alongside rapid cultural and social changes: ageing populations, increasing urbanisation,dietary changes, reduced physical activity and unhealthybehaviours. A person’s risk of developing

National Conference on Emerging Trends in Science, Technology and Management, 11-12 Nov 2017, ISBN: 978-93-5281-325-4 Page 366
Type 2 Diabetes Mellitus has been shown to be highly linked to obesity and any family history ofdiabetes.
CONCLUSION
Among many disease or disorders of carbohydrate, fat and protein metabolism, diabetes is a seriousdisorder effecting large population of the world. It is associated with decreased insulin production orresistance towards its action. Plants have been traditionally used to treat diabetes patients, both insulindependent &non insulindependentdiabetes.the role of herbs in the management of diabetes, however itwould be unwarranted to assure that all these plants can be blindly used in diabetic patients. Althoughthere is an increase in the number of patientssuffering from diabetes in every age group during the lastdecade. Herbs are highly esteemed for millennia as a rich source of therapeutic agents for preventionand treatment of diabetes and its ailments. Although the contribution of modern synthetic medicine forelevating the human sufferings cannot be under-estimated, equally true is the fact that most of themleave unwanted harmful side/toxic effects on the human system disturbing the basic physiology?During the last three decades or so there has been serious realization of these problems associated withsynthetic drugs and as a result the world has started looking towards the herbs as agents of therapywhich, apart from being comparatively economical and easily available, are relatively free from theproblems of side effects, toxicity and developing resistance towards causative organisms.
REFERENCES
[1.] Ross and Wilson, Annewaugh, Allison Grant ‘Anatomy and physiology and lllness; 12th edition page no.236-238.
[2.] Barcelo A, Rajpathak S. “Incidence and prevalence of diabetes mellitus in the Americas”. AmericanJournal of Public Health, 10, 300-308, 2001.
[3.] Abebe D, Debella A, Urga K. Illustrative checklist: Medicinal plants and other useful plants of Ethiopia.EHNRI, Nairobi, Kenya: Camerapix Publisher International. 188-194, 2003.
[4.] Ostenson CG. “The pathophysiology of type 2 diabetes mellitus: an overview”. Acta Physiology ofScandinavian, 171, 241-247, 2001.
[5.] Uusitupa M. “Lifestyles matter in the prevention of Type 2 diabetes”. Diabetes Care, 25, 1650-1651,2002.
[6.] Yogev Y, Ben-Haroush A, Hod M. Pathogenesis of gestational diabetes mellitus; In: Moshe Hod, LoJovanovic.
[7.] Gian Carlo Di Renzo, Alberto de Leiva, Oded Langer editors. Textbook of Diabetes and Pregnancy.1sedLondon: Martin Dunitz, Taylor & Francis Group plc; 2003. p. 46.
[8.] Worthley LIG. The Australian short course on intensive care medicine, Handbook, Gillingham Printers,South Australia; 2003, 31-55. Maruthupandian A, Mohan VR, Kottaimuthu R (2011) Ethnomedicinalplants used for the treatment diabetesand jaundice by Palliyartribals in Sirumalai hills, WesterG(http://nopr.niscair.res.in/handle/123456789/13349).
[9.] Hong Gao, Yi-Na Huang, Bo Gao, Peng Li, Chika Inagaki and Jun Kawabata. “Inhibitory effect on α-glucosidase by AdhatodavasicaNees.” Food Chemistry, 108(3), 965-972, 2000.
[10.] Sabu MC, Ramadasan K. “Antidiabetic activity of Aeglemarmelosand its relationship with itsantioxidproperties”.
[11.] Indian J PhysiolPharmacol, 48(1), 81-88, 2001.[12.] Awadi FMA, Gumaa KA. “Study on the activity of the individual plants of an antidiabetic mixture”.
Acta Diabetologica Latina, 24, 37-41, 1987.[13.] Kumar V, Khanna AK, Khan MM, Singh R, Singh S, Chander R et al. “Hypoglycemic, lipid lowering
and antioxidant activities in root extract of Anthocephalusindicusin alloxan induced diabetic rats”. IndianJournal of Clinical Biochemistry, 24(1), 65-69, 2009.
[14.] Chattopadhyay RR, Chattopadhyay RN, Nandy AK, Poddar G, Maitra SK. “The effect of fresh leaves ofAzadirachtaindica on glucose uptake and glycogen content.

National Conference on Emerging Trends in Science, Technology and Management, 11-12 Nov 2017, ISBN: 978-93-5281-325-4 Page 367
NPA A MAJOR ISSUE IN CURRENT BANKINGSCENARIO
Vishal Gupta and Rajendra TewariDept. of Business Administration
Ashoka Institute of Technology and ManagementVaranasi
Abstract: NPA stands for Non performing assets which means overdue of payment like interest on loaning.on overdraft,C.C.etc more than 180 days the account will consider as NPA account.NPA plays a vital role inbanking industry. it also helps to categories the account .NPA has been a major issue for the banks as therecovery of interest, loan amount ,O.D.,principle amount is due for a long time.
Keywords: Reason for rise in NPA, Why most NPA in Public sector bank, Remedies to avoid NPA
INTRODUCTIONAdvances are the primary function of the Banks. The earning of the bank is highly depend on the
interest earned by bank provided on different loans .The branch size of the bank is always measuredwith deposit and advances. Bu non recovery of loans, interest, overdraft interest has been major issuefor the banks and that is the reason for increasing NPA day by day. The continued increase in NPAparticularier in small ticket accounts is a cause of grave concern.According to RBI terms loan on which interest or installment of principle remain overdue for a periodof more than 90 days from the end of particular quarter is called as an NPA.Note: However in terms of agriculture /farm loan the NPA is defined as under for short duration cropagriculture loan such as paddy ,jowar etc.If the loan or installment /interest is not paid for 2 crop seasons it would be termed as an NPA.
REASON FOR THE RISE IN NPA IN RECENT YEARS
1. GDP slow down2. Relaxed lending3. 80% credit given by the public sector banks provide around 80% of the credit to industries and
it is this part of credit distribution that forms a great chunk of NPA.4. Weak recovery system.
REASONS OF SLIPPAGES
Most important slippage is poor/ineffective monitoring especially in big accounts having large amountssanctioned, say over Rupees 10 lakh. Non-adherence to terms & conditions laid down in sanction letter,etc. • Providing unjustified and continuous excesses / adhoc sanctions without proper appraisal of needsetc. • Securities have become obsolete and have never or rarely been inspected. • Bank fails to identifyearly warning signals at the right time and take remedial measures. • Failure in due diligence(especially new / taken over accounts). • Sometimes external factors lead to account becoming NPAlike poor economic growth, demand and supply factors of the market, business failures, etc.The unacceptably high level of NPA in the banks in India especially the public sector banks is a matterof great concern. To some extent the rising incidents of NPA can perhaps be attributed to the economicslowdown witnessed in 2012-13. The corporate banking division of one of the best known foreignbanks in India puts its relationship manager or credit training. Besides teaching the basics of the creditrisk numerous case studies live cases of banks is analyzed deeply.Why Most NPA in public sector?
1. Five sectors textiles, aviation, mining; infrastructure contributes to most of the NPA sincemost of the loans given in these sectors by PSB.
2. Public sectors banks provide around 80% of the credit to industries is the reason for NPA.3. Less professional management4. Political Pressure.
DATA:PNB- 5300 cr

National Conference on Emerging Trends in Science, Technology and Management, 11-12 Nov 2017, ISBN: 978-93-5281-325-4 Page 368
UCO Bank- 1497 crIOB - 1425 crDena bank -663 crAsset ClassificationAs per Reserve Bank of India’s guidelines banks classify their loan assets in FOUR groups. It hasdispensed with the earlier classification based on eight “Health Codes”. The new classification is:1. Standard Asset: Standard asset is one which does not show or indicate any sign of distress orproblem with regard to recovery/repayment of dues. Normal banking risk (s) is/are acceptable. Suchassets are called Standard Assets.2. Substandard Assets: With effect from March 31, 2001, a substandard asset was one, which hasremained NPA for a period not exceeding 18 months. However this was reduced further in 31.3.2005 to12 months by RBI. Now this period is 90 days from the due date.Characteristic critical features of such accounts are:Sub-standard asset has general credit weaknesses. It jeopardizes the liquidation of debt. Bank mayincur some . In such cases, current net-worth of the borrower/guarantor or the current market value ofthe security charged to bank is not enough to ensure recovery. Doubtful Assets: Starting from March31, 2005, an asset would be classified as doubtful if it has remained in the substandard category for aperiod of 12 months. Other important features of such assets are: • Asset becomes NPA for more than12 months (which was 18 months before 31.05.2005). Liquidation of dues is highly doubtful orimprobable or highly questionable. Security erosion at 50% or more over the previous year’s value.Loss Assets: A loss asset is one where loss has been identified by the bank or internal or externalauditors or the RBI inspection but the amount has not been written off wholly. Though there may besome salvage.Other main features are: Loss identified by bank or by the internal auditor/ RBI or statutory auditors. •Amount not fully written off since there might be some salvage / recovery value, may be very small/negligible (less than even 10 % of outstanding). Some special aspects of NPA. Security does notinclude net worth of the borrower or guarantor. If arrears of interest and principal are paid by theborrower in the case of loan accounts classified as NPAs, account may be classified as ‘standard’accounts. Gross and Net Non-performing Assets simply speaking, Gross NPAs are the ones that showtotal figures of amount unrecovered without any adjustment of provisions etc.• Net NPA = Gross NPA – ProvisionsFindingBecause of mismanagement in Bank there is a positive relationship between total advances, net profitand NPA of banks which is not good. The cause of NPA is because of wrong choise of customer. Bankis unable to give loans to the new customers due to lack of funds which arise due to NPASuggestion:1: Pre sanctioning evaluation.2: Recovery camps3: Compromise proposal4: Suit filingConclusion:According to Raghuram G Rajan ex governor RBI1: Borrower is weak2: Lender is weak in collection the loan3: Identification the strong accounts for lending.
REFERENCE[1.] Management of financial institutions and services.[2.] Bob Maitri a magazine of Bank of baroda[3.] Presentation of Mr Raghuram G Rajan.
National Conference on Emerging Trends in Science, Technology and Management, 11-12 Nov 2017, ISBN: 978-93-5281-325-4 Page 369
A COMPREHENSIVE REVIEW: SOLID LIPIDNANOPARTICLES CONTAINING METHOTREXATE
Shiv Kumar Srivastava*, Abhishek Kumar, Pradhi Srivastava and Ravi TripathiDepartment of Pharmacy, Ashoka Institute of Technology and Management, Varanasi
Email: [email protected]
Abstract- Solid lipid nanoparticles (SLN) are most developing formulations of nanotechnology with severalapplications in different fields like drug delivery, clinical medicine and research as well as in other variedsciences. Solid lipid nanoparticles (SLN) are very potential formulations for topical delivery of anti-inflammatory and anti-arthritic drugs.SLN are the spherical particles of nanometer range which immersedin water or aqueous surfactant solution either using lipophilic and hydrophilic drug. Even the enhancementof solubility and bioavailability of poorly soluble drugs should be carried out using different biodegradableand bioacceptable polymers which can also overcome the toxic effects of traditional drug carrier system.Inthis review article SLNs containing Methotrexate were formulated for treatment efficiency in arthritis.SLNs were prepared by Solvent emulsification diffusion method with fixed amount of Methotrexate andpoloxamer 188.SLN based formulations can be potential for topical delivery of Methotrexate .we focused onthe various development techniques, their evaluation and comparison of different traditional carriersystems.Keywords: Solid lipid nanoparticles, colloidal carriers, Methotrexate, anti-arthritic drugs, poloxamer, Solventemulsification diffusion method.
1. INTRODUCTION
The field of Novel Drug Delivery System is emerging at an exponential rate with the deepunderstanding gained in diversified fields of Biotechnology, Biomedical Engineering andNanotechnology[1]. Many of the recent formulation approaches utilize Nanotechnology that is thepreparation of Nanosized structures containing the API[2]. Nanotechnology, as defined by the NationalNanotechnology Initiative (NNI), is the study and use of structures roughly in the size range of 1 to 100nm. The overall goal of nanotechnology is the same as that of medicine: to diagnose as accurately andearly as possible and to treat as effectively as possible without any side effects using controlled andtargeted drug delivery approach[3]. Some of the important Drug Delivery System developed usingNanotechnology principles are- Nanoparticles, Solid Lipid Nanoparticles, Nanosuspension,Nanoemulsion, Nanocrystals[4]. In this article the main focus is on Solid Lipid Nanoparticles (SLNs).SLNs introduced in 1991 represent an alternative and better carrier system to traditional colloidalcarriers such as emulsions, liposomes and polymeric micro and nanoparticles.Solid lipid nanoparticles(SLN) are aqueous colloidal dispersions, the matrix of which comprises of solid biodegradable lipids[4]. SLNs combine the advantages and avoid the drawbacks of several colloidal carriers of its classsuch as physical stability, protection of incorporated labile drugs from degradation, controlled release,excellent tolerability [5]SLN formulations for various application routes (parenteral, oral, dermal,ocular, pulmonar, rectal) have been developed and thoroughly characterized in vitro and in vivo [6].They have many advantages such as good biocompatibility, non toxic, stable against coalescence, drugleakage, hydrolysis, biodegradable, physically stable and good carrier for lipophillic drugs [3]. Thereare major difference between lipid emulsion and liposomes. The basic structure of a lipid emulsion is aneutral lipophilic oil core surrounded by monolayer of amphiphilic lipid. In contrast, liposomes containan outer bilayer of amphiphilic molecule such as phospholipid with an aqueous compartment inside [4].Rheumatoid arthritis is an autoimmune disease in which inflammation of the cells lining the synoviumproduces pain, swelling, and progressive erosion of the synovial joints. Rheumatoid Arthritis treatmentoriginated with NSAIDs, such as Aspirin and other salicylates which act as anti-inflammatory agents toreduce the pain and inflammation and DMARDs (Disease modifying anti rheumatic drugs) suppressthe immunological processes involved in the progression of Rheumatoid Arthritis. Out of severalDMARDs Methotrexate (MTX), an antiproliferative and immunosuppressive agent, is the drug ofchoice in the treatment of the disease [7]. Methotrexate is an anticancer, disease modifying antirheumatic drug[59,60], and BCS Class – III drug having high solubility and low permeability. MTX isa folic acid antagonist used alone or in association with other therapeutic agents.Unfortunately, progression of joint destruction cannot be inhibited completely by MTX treatment inmost patients with RA. This lack of efficacy is due to the fact that large amounts of the administeredMTX are rapidly eliminated by the kidneys, resulting in short plasma half life and low drugconcentration in the targeted tissue. To overcome these disadvantages and to improve thepharmacokinetic properties, a topical gel formulation containing Methotrexate entrapped in SLN forthe treatment of rheumatoid arthritis was developed to overcome the problem of frequent dosing andlow therapeutic efficiency.

National Conference on Emerging Trends in Science, Technology and Management, 11-12 Nov 2017, ISBN: 978-93-5281-325-4 Page 370
AIMS OF SOLID LIPID NANOPARTICLES
It has been claimed that SLN combine the advantages and avoid the disadvantages of other colloidalcarriers. Proposed advantages include [10]-
1- Possibility of controlled drug release and drug targeting.2- Increased drug stability3- High drug payload4- Incorporation of lipophilic and hydrophilic drugs5- No biotoxicity of the carrier ,Avoidance of organic solvents6- No problems with respect to large scale production and sterilization7- Increased Bioavailability of entrapped bioactive compounds.
PRINCIPLE OF DRUG RELEASE FROM SLN
The general standards of medication discharge from lipid nanoparticles are as per the following:1. Higher surface territory because of little molecule measure in nanometer extent gives highermedication discharge.2. Slow medication discharge can be accomplished when the medication is homogenously scattered inthe lipid framework. It depends on sort and medication entanglement model of SLN.3. Crystallinization conduct of the lipid carrier and high portability of the medication lead to quickmedication discharge.4. Fast initial drug release in the first 5 min in the drug –enriched shell model as a result of the outerlayer of particle due to larger surface area of drug depositon on the particle surface.5. The burst release is reduced with increasing particle size and prolonged release could be obtainedwhen the particles were sufficiently large, i.e., lipid macromolecules.6. The type of surfactant and its concentration, which will interact with the outer shell and affect itsstructure, should be noted as the outer factor which is important, because a low surfactant concentrationleads to a minimal burst and prolonged drug release.7. The particle size affect drug release rate directly depends on various parameters such as compositionof SLN formulation (such as surfactant, structural properties of lipid, drug) production method andconditions (such as production time, equipment, sterilization and lyophilization [5].
METHODS OF PREPARATION
The performance of SLNs greatly depends on the method of preparation which in turn influences theparticle size, drug loading capacity, drug release, drug stability etc. Different approaches exist for theproduction of finely dispersed lipid nanoparticle dispersions. Few of the production processes such ashigh pressure homogenization and microemulsion dilution have demonstrated scaling up possibility, aprerequisite for introduction of a product to the market [16, 17].
COMPOSITION OF SLNS: LIPIDS
The lipid, itself, is the main ingredient of lipid nanoparticles that influence their drug loading capacity,their stability and the sustained release behavior of the formulations.SELECTION CRITERIA FOR LIPIDS: Important point to be considered in the selection of drugcarrier system (lipid) is its loading capacity and also the intended use. Lipids that form highlycrystalline particles with a perfect lattice cause drug expulsion. More complex lipids containing fattyacids of different chain length form less perfect crystals with many imperfections.These imperfections provide the space to accommodate the drugs. Role of Co-emulsifier: Due to lowmobility of the phospholipid molecules, sudden lack of emulsifier on the surface of the particle leadsthe particle aggregation and increase in the particle size of SLNs. To avoid this co-emulsifiers areemployed.PREPARATION OF SOLID LIPID NANOPARTICLES: The performance of SLNs greatlydepends on the method of preparation which in turn influences the particle size, drug loading capacity,drug release, drug stability etc. Different approaches exist for the production of finely dispersed lipidnanoparticle dispersions [16].
METHODS OF PREPARATION OF SOLID LIPID NANOPARTICLES [5,10]
1. High pressure homogenizationA. Hot homogenizationB. Cold homogenization

National Conference on Emerging Trends in Science, Technology and Management, 11-12 Nov 2017, ISBN: 978-93-5281-325-4 Page 371
2. Ultrasonication /high speed homogenizationA. Probe ultrasonicationB. Bath ultrasonication
3. Solvent evaporation Method4. Solvent emulsification-diffusion method5. Supercritical fluid method6. Microemulsion based method7. Double emulsion method8. Precipitation technique9. Film-ultrasound dispersion10. Solvent Injection Technique11. Using Membrane Contractor
EVALUATION PARAMETERS
Various methods used to study the in vitro release of the drug are: In vitro drug release:Dialysis tubing, Reverse dialysis, Franz Diffusion Cell
APPLICATIONS
SLN as Potential new Adjuvant for Vaccines Adjuvants are used in vaccination to enhance the immuneresponse. The safer new subunit vaccines are less effective in immunization and therefore effectiveadjuvants are required. New developments in the adjuvant area are the emulsion systems. These are oil-in-water emulsions that degrade rapidly in the body.Solid Lipid Nanoparticles in Cancer Chemotherapy [22, 23,27]SLN as potential new adjuvant for vaccinesSolid lipid nanoparticles in cancer chemotherapy [18-20,34]SLN have been to be useful as drug carriers. [27].Solid lipid nanoparticles for parasitic diseases[4,15,25]Human immunodeficiency virus (HIV) [25].SLN applied to the treatment of malaria[15](e.g., liposomes, solid lipid nanoparticles and nano and microemulsions) and polymer-based
nanocarriers (Nanocapsules and nanospheres)[12].Targeted delivery of solid lipid nanoparticles for the treatment of lung diseases[4 23].Solid lipid nanoparticles in tuberculosis disease [4,15]Transfection agent[33]Solid lipid nanoparticles for lymphatic targeting[4]
CONCLUSION
Arthritis is an inflammatory condition of the bone joints that is associated with hyperalgesia andfunctional impairment [28,29].Methotrexate is one of the most widely studied and effective therapeutic agent available to treat autoimmune diseases such as Rheumatoid Arthritis however the poor pharmacokinetic and narrow safetymargin of the drug limits the therapeutic outcomes of conventional drug delivery systems.For animproved delivery of MTX several pathophysiological features such as angiogenesis, enhancedpermeability and retention effects can be used as targets or as tools of drug delivery.[25,26].SLNs have emerged as important tools to modify the release profile of a large number of drugsincluding protein and peptide molecules. SLNs are produced from and biocompatible andbiodegradable lipid materials making them a promising therapeutic strategy for drug targeting anddelivery.Solid lipid nanoparticle is a promising drug delivery system as it has the potential to fulfill all therequirements for a topical drug delivery and advantageous in comparison to conventional gels as it hasocclusion property, drug targeting and modulation of drug release.In the present review the Methotrexate SLNs were incorporated in gel form.Overall results show that Methotrexate solid lipid nanoparticles incorporated in gel is advantageous asit leads to a modified release and increased skin penetration associated with targeting effect andavoidance of systemic uptake due to their unique size dependent properties.The increased amount of drug in the dermis is related to the occlusion property. An adhesive layeroccluding the skin surface is formed after the evaporation of water from the SLNs gel applied to theskin surface. The hydration of the stratum corneum increases which facilitates drug penetration intodeeper skin strata by reducing corneocyte packing and widening the inter corneocytegap.Occlusive

National Conference on Emerging Trends in Science, Technology and Management, 11-12 Nov 2017, ISBN: 978-93-5281-325-4 Page 372
effect appears strongly related to particle size. Nanoparticles turned out to be 15 fold more occlusivethan micro particles smaller than 400 nm were found to elicit more intense effect. So Methotrexate-SLNs with the mean diameter of 85.12 nm should have the ability to form an occlusive film on thesurface of the skin, increases the hydration of the stratum corneum and improve the permeation of theMethotrexate into skin.
REFERENCES[1.] Nadkar S, Lokhande C. Current Trends in Novel Drug Delivery- An OTC Perspective. Pharma Times
2010; 42 Suppl4 :17-23.[2.] Loxley A. Solid Lipid Nanoparticles for the Delivery of Pharmaceutical Actives. Drug Delivery
Technology2009; 9 Suppl8 :32.[3.] S Nunes; R Madureira; D Campos; B Sarmento; A Gomes; M Pintado; F Reis.Crit Rev Food SciNutr.,
2015, 149.[4.] J Kaur; G Singh; S Saini; AC Rana. J. drug deliv. Ther., 2012, 2(5), 146-150.[5.] S Das; AChaudhury. AAPS Pharm. Sci. Tech., 2011, 12(1), 62-76.[6.] Mishra B, Patel BB, Tiwari S. Colloidal nanocarriers: a review on formulation technology, types and
applications toward targeted drug delivery. Nanomedicine: NMB2010; 6 Supply 1 :e9-e24[7.] Ekambaram P, Sathali AH, Priyanka K. Solid Lipid Nanoparticles: A Review. Scientific Reviews and
Chemical. Communication2012; 2 Suppl1 :80-102.[8.] Charcosset C, El-Harati A, Fessi H. Preparation of solid lipid nanoparticles using a membrane contactor.
Journal of Controlled Release2005; 108 :112–120.[9.] N. K. Jain, Controlled and Novel Drug Delivery 1st Edition, (CBS Publishers and Distributors1997) 3-
28.[10.] KH Ramteke; SA Joshi; SN Dhole. IOSRPHR, 2012, 2(6), 34-44[11.] A Tiwari; S Rashi; S Anand. WJPPS., 2015, 4 (8), 337-355[12.] Westesen K, Siekmann B, Koch MHJ., Int. J. Pharm. 1993, 93, 189–99.[13.] Jenning V, Gohla S., J. Microencapsul, 18, 2001; 149– 158.[14.] Magenheim B, Levy MY, Benita S., Int. J. Pharm. 94, 1993; 115–123.[15.] Meyer E, Heinzelmann H. Surface science: Springer Verlag, 1992, 99-149.[16.] Swarbrick J, Boylan J. Encyclopedia of pharmaceutical technology. 2nd ed, 2002.[17.] Venkateswarlu V, Manjunath K., Journal of Controlled Release, 2004, 95, 627–38.[18.] Heike Bunjes, Tobias Unruh. Advanced Drug Delivery Reviews, 2007, 59 , 379–402.[19.] Drake B, Prater CB, Weisenhorn AL, Gould SAC, Albrecht TR, Quate CF., Science, 1989, 243, 1586-9.[20.] V. Jenning, Ph.D. Thesis, Free University of Berlin, 1999.[21.] E. Zimmermann, S. Liedtke, R.H. Muller, K. Mader, Proc. Intern. Symp. Control. Rel. Bioact.
Mater.1999, 26, 595–596.[22.] S. Liedtke, E. Zimmermann, R.H. Muller, K. Mader, Proc. Intern. Symp. Control. Rel. Bioact.
Mater.1999, 26, 599–600.[23.] Chen Y, Lu LF, Cai Y, Zhu JB, Liang BW, Yang CZ. , J. Control. Release, 1999, 59, 299–307.[24.] Utreja S, Jain NK. Advances in Controlled and Novel Drug Delivery, CBS Publihers& Distributors,
New Delhi, 2001, 408–425.[25.] P. K. Gupta, J. K. Pandit, A. Kumar and P. Swaroop, S.gupta, T. Ph. Res.,3,2010117-138.[26.] Qing Zhi Lu, Aihua Yu, Yanwei Xi and Houli Li, Zhimei Song, Jing Cui and Fengliang Cao, Guangxi
Zhai, Int. J. Pharm., 372, 191 – 198 (2009).[27.] Rishi Paliwal, ShivaniRai, Bhuvaneshwar Vaidya, Kapil Khatri, Amit K. Goyal, Neeraj Mishra, Abhinav
Mehta and Suresh P. Vyas, PhD. Nanomedicine, Nanotechnology, Biology and Medicine, 5(2), (2009)pp. 184-191.
[28.] Bin Lua, Su-Bin Xionga, Hong Yanga and Xiao-Dong Yina, Ruo- Bing Chaoa, Eur. J. PharmaceuticalSci., 28(1-2), 86-95 (2006).
[29.] KarstenMader, 187-212.[30.] Sven Gohla, Eur. J. Pharm. Biopharm., 50, 161-177 (2000).[31.] VobalaboinaVenkateswarlu and KopparamManjunath, J. Controlled Rel., 95, 627-638 (2004).[32.] PINCUS T, SOKKA T: Should contemporary rheumatoid arthritis clinical trials be more like standard
patient care and vice versa Ann Rheum Dis 2004; 63 (Suppl. II): 32-9.[33.] YAZICI Y, SOKKA T, KAUTIAINEN H, SWEARINGEN C, KULMAN I, PINCUS T: Long-term
safety of methotrexate in routine clinical care: Discontinuation is unusual and rarely due to laboratoryabnormalities. Ann Rheum Dis 2004 (e-publication, June, 2004).
[34.] Wolfe F, Cathey MA. Analysis of methotrexate treatment effect in a longitudinal observational study:utility of cluster analysis. J Rheumatol 1991; 18: 672–77.

noh loc ge yTf ao n
det
Muti ats n
n aI g
a e
k m
o eh ns tA
V ia sra an
E
T
S
T
M
2
0
1
7


