Embed Size (px)
Citation preview

The European Commission’s scienceand knowledge service
Joint Research Centre

EU-Commission JRC Contribution to EVE IWG:
In-vehicle battery durability
E. Paffumi, M. De Gennaro
28th Meeting of the GRPE Informal Working Group on Electric Vehicles
and the Environment (EVE)
October 16th-18th, 2018, Ottawa (Canada)

Presentation Summary (1/2)
Follow-up of the JRC activities for contribution to the EVE IWG under the “in-vehicle battery ageing” topic
Summary up to June 2018, i.e. what’s old:
• Finalisation of the durability scenario analysis: chemistry formulation, battery architecture, vehicle technologies (BEV, PHEV);
• In-vehicle cross-validation of the model’s results against experimental data from Canada;
• Development of further scenarios for in-vehicle battery durability: 2 additional BEVs (i.e. A-segment + D-segment SUV);
• Estimation of the Years needed to reach 90% ; 80% ; 70% ; 60% ; 50% capacity fade
• Scientific paper on in-vehicle battery durability, copy of the modeling methodology, list of input/output parameters of in-vehicle battery durability module of JRC TEMA platform
28th Meeting of the GRPE EVE IWG
October 16th-18th, 2018, Ottawa (Canada)

Presentation Summary (2/2)
Follow-up of the JRC activities for contribution to the EVE IWG under the “in-vehicle battery ageing” topic
Current Status (June-October 2018), i.e. what’s new:
• Development of further scenarios for in-vehicle battery durability:
duty cycle representative of other EU geographic regions, ambient temperature or customer profiles;
Preliminary results of ambient temperature studies, i.e. warm and cold temperatures
28th Meeting of the GRPE EVE IWG
October 16th-18th, 2018, Ottawa (Canada)

Performance based models (SotA)
Capacity fade Power fadeCalendar Cycle Calendar Cycle
LiFePO4
Sarasketa-Zabala et Al. (2013/14);
Wang et Al. (2011);
Sarasketa-Zabala et Al. (2013);
Sarasketa-Zabala et Al.(2013);
Sarasketa-Zabala et Al.(2015);
NCM + spinel Mn Wang et Al. (2014); - -
NCM – LMO -Cordoba-Arenas et Al.(2014);
-Cordoba-Arenas etAl. (2015);
Calendar + Cycle (4 Combinations):
• #1 (LiFePO4): Sarasketa-Zabala et Al. (2013/14) model for calendar plus Wang et Al. (2011) model for cycle;
• #2 (LiFePO4): Sarasketa-Zabala et Al. (2013/14) model for calendar plus Sarasketa-Zabala et Al. (2015) model for cycle;
• #3 (NCM + Spinel Mn): Wang et Al. (2014) for calendar plus Wang et Al. (2014) for cycle;
• #4 (NCM-LMO): Wang et Al. (2014) for calendar plus Cordoba-Arenas et Al. (2015) for cycle;
28th Meeting of the GRPE EVE IWG
October 16th-18th, 2018, Ottawa (Canada)

Implementation of the Performance based models into JRC TEMA (assumptions, 1/2)
Pre-Processor
Statistical Mobility
GIS
& E
xte
rnal
Syst
em
Inte
rfac
e
Module 0
Hybrid/Electric Vehicles and
Recharge Behavioral Models
Modal-shift
analysis
Vehicles usability
analysis and UF
Vehicles energy
demand analysis
Driving, Evaporative and
Cold-Start emissions module
Infrastructure
Design and V2G
Module 1
Module 2
Module 3
Module 4
Module 5
Hyb
rid
/Con
ven
tion
al F
uel
Veh
icle
s E
mis
sion
s
Calendar Ageing
Cycle Ageing
Vehicle Electric Architecture (examples)
TEMA Structure
VehicleType
Battery Size [Wh]
Battery ShapeNo. of Cells
[#] and TypeReference Voltage [V]
Electric Architecture
T-Shaped PHEV 16,000 T-shaped 192 – pouch 365 2P-96S
Parallelepiped BEV 1 24,000 Parallelepiped 192 – pouch 360 48S-2P-2S
Flat-shaped BEV 2 85,000 Flat6,912 -
cylindrical345 16S-72P-6S
Usable Energy at BoL [Wh]
Usable Energy at EoL [Wh]
Reserve [% of battery capacity]
Energy consumption [Wh/km]
T-shaped (PHEV) 12,000 9,600 25% 205
Parallelepiped (BEV 1) 18,000 14,400 15% 210
Flat-shaped (BEV 2) 63,750 51,000 15% 265
PHEV BEV 1 BEV 2
28th Meeting of the GRPE EVE IWG
October 16th-18th, 2018, Ottawa (Canada)

Implementation of the performance based models into JRC TEMA (assumptions, 2/2)
The models have been implemented by adopting the following assumptions:
• the calendar and cycle capacity fades are calculated at cell level (uniform ageing assumption);
• the model assumes average quantities in the reference period per each vehicle for DOD, C-rate, Ah-throughput and
temperature;
• DOD and temperature are assumed equal to the battery values, consistently with the uniform fade assumption, whilst
the C-rate and Ah-throughput are scaled from the battery level down to the cell;
• the battery temperature is regulated by the BMS between 22 °C and 27 °C during the driving and recharging phases
(cycle capacity fade modelling), whilst it assumes the ambient temperature in the parking phase (calendar capacity
fade modelling);
• The model capacity fade is calculated at the net of the capacity fade reserve. i.e.:
Qloss-total = Qloss-calendar + Qloss-cycle - Reserve
• 5 recharge strategies adopted:
Str. 1 = Long Stop Random AC;
Str. 2 = Short-Stop Random DC;
Str. 3 = Night AC - Str. 4 = Smart AC;
Str. 5 = Long-Stop AC 3-phases;
• 5 vehicle segments:
B-segment BEV
D-segment premium BEV
D segment PHEV
2 additional BEVs (i.e. A-segment + D-segment SUV)
28th Meeting of the GRPE EVE IWG
October 16th-18th, 2018, Ottawa (Canada)

Summary of the logical passages
#3
Real-world
Driving data
#2
3 vehicle reference architectures
(from cell-to-vehicle)
#1
Performance-based models
(validated on exp. at cell-level)
#4
Durability Scenarios
(Yrs and/or km to EoL)
28th Meeting of the GRPE EVE IWG
October 16th-18th, 2018, Ottawa (Canada)
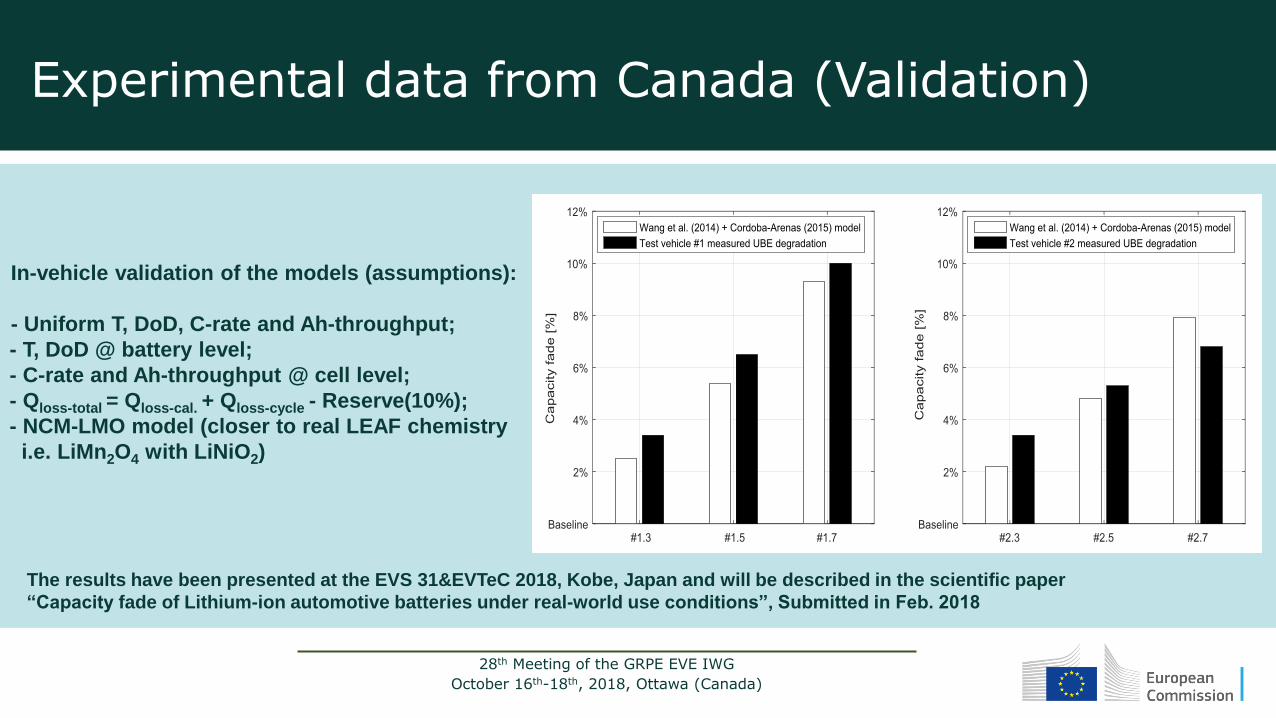
Experimental data from Canada (Validation)
In-vehicle validation of the models (assumptions):
- Uniform T, DoD, C-rate and Ah-throughput;
- T, DoD @ battery level;
- C-rate and Ah-throughput @ cell level;
- Qloss-total = Qloss-cal. + Qloss-cycle - Reserve(10%);
- NCM-LMO model (closer to real LEAF chemistry
i.e. LiMn2O4 with LiNiO2)
The results have been presented at the EVS 31&EVTeC 2018, Kobe, Japan and will be described in the scientific paper
“Capacity fade of Lithium-ion automotive batteries under real-world use conditions”, Submitted in Feb. 2018
28th Meeting of the GRPE EVE IWG
October 16th-18th, 2018, Ottawa (Canada)

Further Scenarios explored
Scenarios presented in June 2018, EVE 27th, include:
• Different duty cycle representative of more EU geographic areas;additional databases included in the analysis;
• Analysis of the BEV1, BEV2 and PHEV1 vehicles:• Focus on NCM-LMO chemistry;• 5 recharge strategies per 5 user bins (as before);• Estimates of the Years needed to reach 80% capacity fade, 100,000km
and 160,000km.
28th Meeting of the GRPE EVE IWG
October 16th-18th, 2018, Ottawa (Canada)

EU-wide extension of the activity data
No
. o
f d
ays
[#]
No
. o
f
veh
icle
s [
#]
Reco
rds
[·10
6]
Tri
ps [
·10
6]
To
tal
trip
s
len
gth
s
[km
·10
6]
No
. o
f t
rip
per
day
(mean
) [
#]
Tri
p l
en
gth
[km
]
(mean
)
Daily d
riven
dis
tan
ce
(mean
) [k
m]
Pri
vate
Veh
icle
s
Province of Modena 31 16,263 16.00 1.9 14.98 6.6 7.8 51.9
Province of Florence 31 12,478 32.01 2.6 20.66 6.4 8.0 51.3
Province of Amsterdam 7 197,756 466.28 1.1 19.86 1.9 19.7 37.2
Province of Brussels 14 96,802 277.05 1.1 11.21 7.9 7.7 55.2
Province of Paris 7 171,220 963.27 2.3 38.39 4.2 17.0 71.7
Province of Luxembourg 7 14,090 24.33 0.08 1.0 2.5 11.9 30.1
Co
mm
erc
ial V
eh
icle
s
Province of Lisbon 7 7,522 66.16 0.16 2.48 5.8 15.0 86.1
Province of Krefeld 7 4,160 22.11 0.01 0.97 1.7 88.8 151.7
Province of Warsaw 7 862 3.79 0.003 0.16 2.4 51.8 124.3
Province of Bratislava 7 18,296 23.08 0.04 1.0 1.5 22.9 35.0
Province of Vienna 7 9,943 49.44 0.06 2.14 13.8 37.9 134.2
Province of Ljubljana 7 11,616 95.77 0.08 4.04 3.4 45.3 148.6
Province of Zagreb 7 12,036 91.66 0.15 3.79 4.6 24.3 104.6
Province of Budapest 7 32,410 320.45 0.32 14.10 4.1 44.1 179.0
Province of Sofia 7 11,368 79.60 0.20 3.28 5.4 16.4 87.4
Province of Athens 7 15,366 42.09 0.13 1.49 4.9 11.0 53.9
TOTAL 632,186 2.57·103 10.19 139.57
TOTAL (private) 506,105 1.77·103 8.56 101.87
TOTAL (commercial) 126,081 0.80·103 1.63 37.70
*From Octo Telematics+ From BeMobile
28th Meeting of the GRPE EVE IWG
October 16th-18th, 2018, Ottawa (Canada)

Mobility Behaviour Private Vehicles
28th Meeting of the GRPE EVE IWG
October 16th-18th, 2018, Ottawa (Canada)

28th Meeting of the GRPE EVE IWG
October 16th-18th, 2018, Ottawa (Canada)
Further Scenarios (capacity fade – visualisation)
BEV 1 + Recharge Strategy 1- Li-Ion NCM-LMO (2015)
Calendar
Ageing
Cycle
Ageing
Calendar
+Cycle
Ageing -
Reserve

28th Meeting of the GRPE EVE IWG
October 16th-18th, 2018, Ottawa (Canada)
Further Scenarios explored (EoL - tabulated)
EoL @ 80% capacity fadeLi-Ion NCM-LMO (2015)
Years Driving to Set Threshold
0 - 500 km/month 500 – 1,000 km/month 1,000 -1,500 km/month 1,500 – 2,000 km/month 2,000+ km/month
Years to EoL
Years to 100,000
km
Years to 160,000
km
Years to EoL
Years to 100,000
km
Years to 160,000
km
Years to EoL
Years to 100,000
km
Years to 160,000
km
Years to EoL
Years to 100,000
km
Years to 160,000
km
Years to EoL
Years to 100,000
km
Years to 160,000
km
Re
char
ge S
trat
egy
#1
PHEV-1
Modena Prov.
NCM-LMO (2015)
16.5 ≥ 20 ≥ 20 14.6 14.2 ≥ 20 - - -
Amsterdam Prov. 18.3 ≥ 20 ≥ 20 15.3 11.6 18.6 13.7 6.9 11 12.5 4.9 7.8 11.3 3.4 5.4
Brussels Prov. 18 ≥ 20 ≥ 20 15.2 12.6 ≥ 20 13.6 6.9 11 12.8 4.8 7.7 12.1 3.7 5.9
Luxembourg Prov. 17.5 ≥ 20 ≥ 20 15 11.5 18.4 13.6 7 11.1 12.6 5 7.9 11.4 3.4 5.4
Paris Prov. 15.6 ≥ 20 ≥ 20 13.6 11.2 17.9 12.4 6.8 10.8 11.4 4.8 7.7 9.8 2.6 4.2
BEV-1
Modena Prov. 9.7 ≥ 20 ≥ 20 8.6 12.8 ≥ 20 8.2 7.9 12.6 - -
Amsterdam Prov. 10.9 ≥ 20 ≥ 20 9.1 11.6 18.6 8.2 6.9 11 7.5 4.9 7.8 6.7 3.4 5.4
Brussels Prov. 10.8 ≥ 20 ≥ 20 9.1 12.7 ≥ 20 8.2 6.9 11 7.6 4.8 7.7 7.2 3.7 5.9
Luxembourg Prov. 10.5 ≥ 20 ≥ 20 9 11.6 18.5 8.1 7 11.2 7.5 5 7.9 6.8 3.4 5.4
Paris Prov. 9.4 ≥ 20 ≥ 20 8.2 11.1 17.9 7.4 6.8 10.8 6.8 4.8 7.7 5.9 2.6 4.2
BEV-2
Modena Prov. 12.1 ≥ 20 ≥ 20 12.7 11.2 17.9 13.6 6.9 11 14.7 5 8.1 16.1 3.9 6.3
Amsterdam Prov. 13.9 ≥ 20 ≥ 20 13.7 11.6 18.6 13.6 6.9 11 13.5 4.9 7.8 13.3 3.4 5.4
Brussels Prov. 13.4 ≥ 20 ≥ 20 13.4 12.6 ≥ 20 13.4 6.9 11 13.7 4.8 7.7 13.7 3.7 5.9
Luxembourg Prov. 13.4 ≥ 20 ≥ 20 13.4 11.6 18.5 13.4 7 11.1 13.2 4.9 7.9 13.3 3.4 5.4
Paris Prov. 12 ≥ 20 ≥ 20 12 11.2 17.9 12 6.8 10.8 11.9 4.8 7.7 11.8 2.6 4.2
Re
char
ge S
trat
egy
#2
BEV-1
Modena Prov.
NCM-LMO (2015)
9.3 ≥ 20 ≥ 20 7.9 11.7 18.7 7.1 7.1 11.4 6.6 5.1 8.1 6.2 3.7 6
Amsterdam Prov. 10.9 ≥ 20 ≥ 20 8.9 11.6 18.8 7.9 6.9 11 7.2 4.9 7.8 6.5 3.4 5.4
Brussels Prov. 10.8 ≥ 20 ≥ 20 8.8 12.7 ≥ 20 7.8 6.9 11 7.4 4.8 7.7 6.9 3.7 5.9
Luxembourg Prov. 10.4 ≥ 20 ≥ 20 8.7 11.6 18.6 7.8 7 11.1 7.1 4.9 7.9 6.5 3.4 5.4
Paris Prov. 9.3 ≥ 20 ≥ 20 7.9 11.3 18 7.1 6.8 10.8 6.6 4.8 7.7 5.6 2.6 4.2
BEV-2
Modena Prov. 11.6 ≥ 20 ≥ 20 11.4 11 17.7 11.3 6.8 10.8 11.2 4.8 7.7 11.2 3.4 5.4
Amsterdam Prov. 13.7 ≥ 20 ≥ 20 13.2 11.7 18.7 12.9 6.9 11 12.8 4.9 7.8 12.6 3.4 5.4
Brussels Prov. 13.2 ≥ 20 ≥ 20 12.8 12.7 ≥ 20 12.7 6.9 11 13.1 4.8 7.7 13.2 3.7 5.9
Luxembourg Prov. 13.1 ≥ 20 ≥ 20 12.8 11.6 18.6 12.6 7 11.1 12.5 4.9 7.9 12.4 3.4 5.4
Paris Prov. 11.8 ≥ 20 ≥ 20 11.5 11.3 18.1 11.4 6.8 10.8 11.3 4.8 7.7 11.3 2.6 4.2
Legend
EoL below 5.0 years;
EoL above or equal to 5.0 and below 10.0 years;
EoL above or equal to 10.0 years;

Further Scenarios explored
New scenarios include:• Warm and cold ambient temperatures, i.e. Lisbon and Stockholm 2017
temperatures, keeping the same driving duty cycle of Modena province;
• Analysis of the BEV1 and BEV2 vehicles:• Focus on NCM-LMO chemistry;• 5 recharge strategies per 5 user bins (as before);• Increase of the energy consumption due to the usage of the HVAC
system +15% due to the cabin cooling, +35% due to the cabinheating;
• Estimates of the Years needed to reach 80% capacity fade, 100,000kmand 160,000km.
28th Meeting of the GRPE EVE IWG
October 16th-18th, 2018, Ottawa (Canada)

Environmental temperature variation
28th Meeting of the GRPE EVE IWG
October 16th-18th, 2018, Ottawa (Canada)

28th Meeting of the GRPE EVE IWG
October 16th-18th, 2018, Ottawa (Canada)
Further Scenarios (capacity fade – visualisation)
BEV 1 + Recharge Strategy 1 - Li-Ion NCM-LMO (2015)
Calendar
Ageing
Cycle
Ageing
Calendar
+Cycle
Ageing -
Reserve

Further Scenarios (capacity fade – visualisation)
BEV 1 + Recharge Strategy 2 - Li-Ion NCM-LMO (2015)
Calendar
Ageing
Cycle
Ageing
Calendar
+Cycle
Ageing -
Reserve
28th Meeting of the GRPE EVE IWG
October 16th-18th, 2018, Ottawa (Canada)

Further Scenarios (capacity fade – visualisation)
BEV 2 + Recharge Strategy 1 - Li-Ion NCM-LMO (2015)
Calendar
Ageing
Cycle
Ageing
Calendar
+Cycle
Ageing -
Reserve
28th Meeting of the GRPE EVE IWG
October 16th-18th, 2018, Ottawa (Canada)

28th Meeting of the GRPE EVE IWG
October 16th-18th, 2018, Ottawa (Canada)
Further Scenarios explored (EoL - tabulated)
Legend
EoL below 5.0 years;
EoL above or equal to 5.0 and below 10.0 years;
EoL above or equal to 10.0 years;
EoL @ 80% capacity fadeLi-Ion NCM-LMO (2015)
Years Driving to Set ThresholdEnvironment temperature (Modena 2011)
0 - 500 km/month 500 – 1,000 km/month 1,000 -1,500 km/month 1,500 – 2,000 km/month 2,000+ km/month
Years to EoL
Years to 100,000
km
Years to 160,000
km
Years to EoL
Years to 100,000
km
Years to 160,000
km
Years to EoL
Years to 100,000
km
Years to 160,000
km
Years to EoL
Years to 100,000
km
Years to 160,000
km
Years to EoL
Years to 100,000
km
Years to 160,000
km
Recharge Strategy #1 Modena Prov.
BEV-1 12.1% fleet share
NCM-LMO (2015)
9.7 ≥ 20 ≥ 20 8.6 12.8 ≥ 20 8.2 7.9 12.6 - -
BEV-2 53.6% fleet share 12.1 ≥ 20 ≥ 20 12.7 11.2 17.9 13.6 6.9 11 14.7 5 8.1 16.1 3.9 6.3
Recharge Strategy #2 Modena Prov. BEV-1 24.8% fleet share 9.3 ≥ 20 ≥ 20 7.9 11.7 18.7 7.1 7.1 11.4 6.6 5.1 8.1 6.2 3.7 6
BEV-2 79.8% fleet share 11.6 ≥ 20 ≥ 20 11.4 11 17.7 11.3 6.8 10.8 11.2 4.8 7.7 11.2 3.4 5.4
EoL @ 80% capacity fadeLi-Ion NCM-LMO (2015)
Years Driving to Set ThresholdWarm environment temperature (Lisbon 2017)
0 - 500 km/month 500 – 1,000 km/month 1,000 -1,500 km/month 1,500 – 2,000 km/month 2,000+ km/month
Years to EoL
Years to 100,000
km
Years to 160,000
km
Years to EoL
Years to 100,000
km
Years to 160,000
km
Years to EoL
Years to 100,000
km
Years to 160,000
km
Years to EoL
Years to 100,000
km
Years to 160,000
km
Years to EoL
Years to 100,000
km
Years to 160,000
km
Recharge Strategy #1 Modena Prov.
BEV-1 9.9% fleet share
NCM-LMO (2015)
7.0 ≥ 20 ≥ 20 6.3 13.2 ≥ 20 - - -
BEV-2 46.4 % fleet share 8.5 ≥ 20 ≥ 20 9.2 11.3 18.0 9.9 7.0 11.3 10.8 5.2 8.3 11.9 4.1 6.5
Recharge Strategy #2 Modena Prov.
BEV-1 19.9 % fleet share 6.5 ≥ 20 ≥ 20 5.6 12.0 19.2 5.0 7.2 11.6 4.7 5.2 8.4 4.3 3.8 6.0
BEV-2 75.0% fleet share 8.1 ≥ 20 ≥ 20 8.0 11.1 17.693 7.9 6.8 10.838 7.9 4.9 7.8 7.9 3.5 5.5
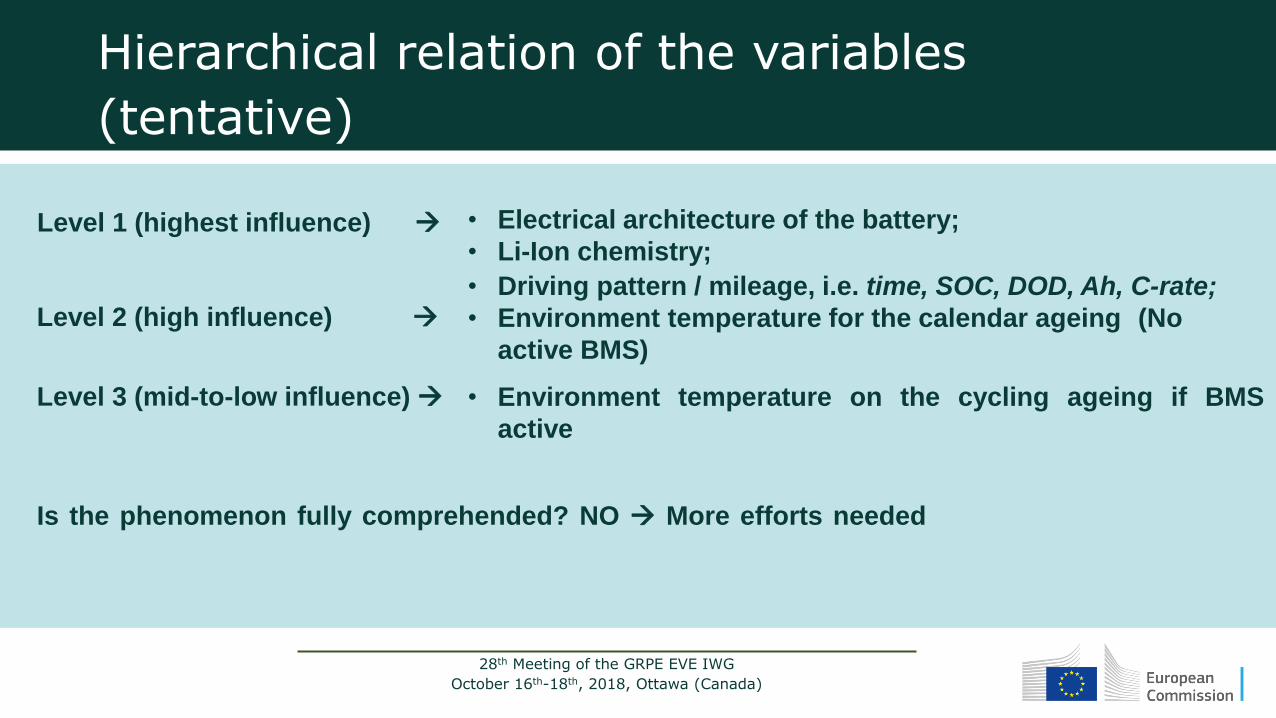
Hierarchical relation of the variables
(tentative)
• Driving pattern / mileage, i.e. time, SOC, DOD, Ah, C-rate;
• Environment temperature for the calendar ageing (No
active BMS)
• Electrical architecture of the battery;
• Li-Ion chemistry;
• Environment temperature on the cycling ageing if BMS
active
Is the phenomenon fully comprehended? NO More efforts needed
Level 1 (highest influence)
Level 2 (high influence)
Level 3 (mid-to-low influence)
28th Meeting of the GRPE EVE IWG
October 16th-18th, 2018, Ottawa (Canada)

28th Meeting of the GRPE EVE IWG
October 16th-18th, 2018, Ottawa (Canada)
Input/output of in-vehicle battery durability module of JRC TEMA platform
HV battery
chemistry
Output from JRC TEMA
Capacity fade Power fade
Calendar Cycle Calendar Cycle
LiFePO4
Sarasketa-Zabala et Al. (2013/14);
Wang et Al. (2011);
Sarasketa-Zabala et Al. (2013);
Sarasketa-Zabala et Al. (2013);
Sarasketa-Zabala et Al. (2015);
NCM + Spinel Mn
Wang et Al. (2014);
- -
NCM – LMO -Cordoba-Arenas et Al.
(2014);-
Cordoba-Arenas et Al. (2015);
Input to JRC TEMA
General parameters
• Age of the car since manufacture [yrs]• Run-in km• Vehicle technology (BEV, PHEV)• EoL threshold for capacity fade and power fade
Environmental parameters
• Ambient temperature max and min for each month of the year [°C]
Duty cycle parameters
• Average number of trips per month• Average driven distance [km]• Average driving time [h]• Average driving speed [km/h]• Average energy consumption [Wh/km]• Average resting time without charging [h]• Average parking time [sec]
Charging data
• Average recharging time [h]• Recharging power [kW]• Charging mode/level• Average number of recharge per month
Battery parameters
• Battery chemistry • Battery architecture (no. of modules, no. of
cells, cell voltage, cell current, series/parallel connection i.e. 48S-2P-2S etc.)
• Reference battery voltage [V]• Battery capacity [Wh]• Battery reserve [%]• Average weighted battery temperature [°C]• Battery temperature min and max (BMS) [°C]• Average battery SoC min driving [%]• Average battery Delta SoC during charging [%]• Average battery SoC parking no charging [%]

Thank you for the attention
Q&A
Contacts Info:EC DG JRC DIR-C ETC Sustainable Transport [email protected]


