Embed Size (px)
Citation preview
ISBN xxx
EUNIS 2016: Crossroads where the past meets the future
EUNIS 22nd Annual Congress Book of Proceedings
ISSN 2409-1340
i
Preface
Dear Reader,
A few days preceding the opening of EUNIS 2016 let me share with you a few thoughts and ideas
about how we ‘ve come thus far.
Aristotle University of Thessaloniki has been a member of EUNIS community for more than ten years
now. Our involvement in EUNIS activities started to increase during the last three years the moment
we decided to adopt one more extrovert business strategy so as to enhance our bonds with the other
European Institutions. At this point, I would like to thank personally Jean-Francois Desnos as it was
his warm support and encouragement that induced us to announce our candidacy for hosting EUNIS
2016.
Over the last two years, while the Congress was being prepared, we were overcome by mixed
feelings. On the one hand, we felt greatly honoured and enthusiastic at having been given such a
golden opportunity. On the other hand, however, there were times of fatigue, anxiety and stress
just to mention but a few at the thought of carrying on such a tradition passed to us by our
honourable predecessors. But in the end and above all, we felt happy and proud that we had been
given the chance to be part of a combined effort that strengthened EUNIS collaborative mentality.
This Book of Proceedings, and the Congress in general, is the result of the work of a great number of
people as EUNIS Board Members, EUNIS Task Forces Leaders, the members of the Scientific
Committee, the Authors and the local organizers have worked in close co-operation to produce
remarkable results that will make, as promised, EUNIS 2016 a memorable event. At this point, allow
me to express my warmest thanks to all of them for their contribution. Special thanks to our
sponsors as nothing could be done without their support.
To conclude, 60 stimulating papers, each evaluated by 3 Scientific Committee Members, that will
ignite discussions during the Congress’ days, are included in this Book plus one more honorary paper
that all together perfectly reflect the theme of this year’s Congress: Crossroads where the past
meets the future. The selected theme depicts the multifaceted Crossroads (geographical, historical
and technological) that you are invited to explore during your stay in Thessaloniki. A Crossroads
indeed, where in the universal paths of historic memory, the taste of wine mingles with the smell of
cinnamon and the presence of great men and women that shaped our culture still finds visible proof
in the countless faces of life in this modern ancient city.
I wish you a good reading.
Looking forward to meeting you face to face in Thessaloniki.
Yiannis Salmatzidis
Chair of the Organising Committee
EUNIS 2016
ii
EUNIS at a glance
EUNIS is the European University Information Systems Organization. It was formed in 1993. It was
registered as a non-profit organization in Paris, France in 1998.
EUNIS brings together those who are responsible for the management, development and the policy
for Information Technology in Higher Education in Europe. The objective of EUNIS is to contribute to
the development of high quality information systems. To achieve this, the aims of EUNIS are:
encourage exchange, cooperation and debates between those responsible for information
systems in higher education or research institutes/organizations within Europe;
establish relationships with supervisory organizations in charge of information systems in
hig her education and in research institutes in each country as well as at European level.
Aristotle University of Thessaloniki at a glance
AUTh is the largest University in Greece covering all disciplines. It is widely recognized as a vibrant
center of learning which draws its inspiration from a long tradition of academic achievement. This
can be supported, among other factors, by the fact that so much in science, as in the arts and
divinity, medicine and technology, it prides itself in its international role. Most of its academic
personnel have been trained in reputable Universities in Europe, the United States and as far afield
as Australia and Japan. The University has been actively participating in the Erasmus Programme
since 1987, accounting approximately one fourth of the total Erasmus mobility in Greece in the
frame of Student for Studies Mobilities as well as Staff for Teaching Mobilities.
Nevertheless, mindful of rapid change and progress, we aim to improve our strategy, policies and
everyday practices, in order to meet contemporary local and global demands. By assessing our
experience, we have been able to determine our strengths and weaknesses, and we have adopted a
holistic internationalization strategy, the main objectives of which can be briefly described as
follows:
Strengthen our role in the European and international knowledge community by building
upon collective and personal academic achievements.
Enhance our visibility among the traditionally prestigious academic institutions all over the
world, by establishing long-term cooperation schemes at research, education and training
level.
Reinforce our traditional presence as leading education and research institution in
Southeastern Europe and Eastern Mediterranean, by building focused strategic partnerships
in the area.
Play a decisive role in academic exchange, good practices dissemination, and knowledge
diffusion.
iii
Support multicultural co-existence, social and cultural cohesion, and promote sustainable
regional development.
Make multilateral, rather than unilateral approach, a core aspect of our work in education,
research and administrative level.
Make our graduates able to think and act across traditional academic boundaries and across
national borders. Properly equip them so that they may benefit from international
knowledge and experience and support national and local dynamic development.
Take into consideration global market demands and adjust respectively our educational
policies.
Enhance our cooperation with commercial enterprises abroad in terms of internship offers in
order to improve our students’ international employability.
Enhance and reinforce our relation with Greek society.
Despite the financial difficulties, it invests every year remarkable resources in the field of
Information Technology recognizing its special role in the daily administrative, educational and
research operations and it prides itself in the quality of electronic services that it offers to the
academic community.

iv
EUNIS 2016 Congress Committees
Organising Committee
The organising committee was responsible for organizing the Program, budget, contracts, PR,
sponsors, coordination of the work of the Scientific Committee, registration process,
accommodation, evaluation of the Congress, the day to day Congress operations and logistics.
John Murphy, EUNIS’ President, Chair of the Programme Committee
Prof. Panos Argyrakis, Head of the IT Board of Aristotle University of Thessaloniki
Yiannis Salmatzidis, Chair of the Organizing Committee, Technical Manager of IT Center of Aristotle University of Thessaloniki
Angeliki Agorogianni, Head of Administration and User Support Unit of IT Center of Aristotle University of Thessaloniki
Dimitris Daskopoulos, Head of Services Unit of IT Center of Aristotle University of Thessaloniki
Program Committe
The programme committe was responsible for the Track Themes, Keynotes, decisions on review
criteria, scheduling papers in thematic sessions. The programme committe was made up of the
members of the Organizing committee as well as the following members:
Ilkka Siissalo, EUNIS BencHEIT Task Force Leader
Elsa Cardoso, EUNIS Business Intelligence Task Force Leader
Victoriano Giralt, EUNIS Interoperability Task Force Leader
Gill Ferrell, EUNIS eLearning Task Force Leader
Johan Bergstrom, Eunis Research and Analysis Initiative (ERAI) Leader
Noel Wilson, EUNIS Member
Michele Mennielli, EUNIS Board Secretary
Michael Turpie, Chair of the Organizing Committee EUNIS 2015
Jean-François Desnos, EUNIS Executive Secretary
Scientific Committee
The Scientific Committee, structured with the support of the EUNIS Board and the 5 Congress Track
Leaders, namely Elsa Cardoso (Leadership & Management), Victoriano Giralt (ICT Infrastructure &
Security), Gill Ferell (Teaching & Learning), Mikael Berglund (Software Development) and Michele
Mennielli (OpenX & Interoperability), fulfilled timely an outstanding mission..
John Murphy, EUNIS’ President, Chair of the Programme Committee
Prof. Panos Argyrakis, Head of the IT Board of Aristotle University of Thessaloniki
Yiannis Salmatzidis, Chair of the Organising Committee, Technical Manager of IT Center of Aristotle University of Thessaloniki
Angeliki Agorogianni, Head of Administration and User Support Unit of IT Center of Aristotle University of Thessaloniki
Dimitris Daskopoulos, Head of Services Unit of IT Center of Aristotle University of Thessaloniki
Ilkka Siissalo, EUNIS BencHEIT Task Force Leader
Elsa Cardoso, EUNIS Business Intelligence Task Force Leader
Victoriano Giralt, EUNIS Interoperability Task Force Leader
Gill Ferrell, EUNIS eLearning Task Force Leader
v
Johan Bergstrom, Eunis Research and Analysis Initiative (ERAI) Leader
Noel Wilson, EUNIS Member
Michele Mennielli, EUNIS Board Secretary
Michael Turpie, Chair of the Organizing Committee EUNIS 2015
Jean-François Desnos, EUNIS Executive Secretary
Asbjørn Reglund Thorsen, Oslo University, Norway
Raimund Vogl, EUNIS Treasurer
Bas Cordewener, EUNIS Board Member
Ramon Grau Sala, EUNIS Board Member
Mikael Berglund, EUNIS Board Member
Tomasz Szmuc, EUNIS Board Member
Ligia Maria Ribeiro, EUNIS Board Member
Valérie Le Strat, EUNIS Board Member
Malte Dreyer, EUNIS Board Member
Amandine Alehyane, ERAI’s Editorial Committee Member
Yves Epelboin, ERAI’s Editorial Committee Member
Anna Pacholak, ERAI’s Editorial Committee Member
Thierry koscielniak, ERAI’s Editorial Committee Member
Jan Madey, EUNIS past President
Spiros Bolis, GUNET (Greek Universities Network)
Panayiotis Tsanakas, Chairman of GRNET (Greek NREN)
Athina Vakali, Member of the IT Board of Aristotle University of Thessaloniki
Georgios Pagkalos, Member of the IT Board of Aristotle University of Thessaloniki
Nikolaos Pitsianis, Member of the IT Board of Aristotle University of Thessaloniki
Susan Grajek, EDUCAUSE, Vice President, Data, Research, and Analytics
Ed Simons, euroCRIS, President
Anne Kealley, CAUDIT, CEO
Peter Tinson, UCISA Executive Director
vi
EUNIS 2016 Sponsors
Platinum
Gold
Silver
Bronze
EUNI 7
7
Table of Contents
Honorary Paper
The Form of Spirals Carved on Ancient Greek Monuments 12
Jean-François DESNOS, Bruno HELLY2
Parallel Session One – ICT Infrastructure & Security
Challenging Dropbox: The Adoption and Usage of New Cloud Storage Service "sciebo" at German
Universities 19
Dominik Rudolph, Raimund Vogl, Holger Angenent, Anne Thoring, Andreas Wilmer, Christian Schild1
EUNIS 2016: Hybrid clouds infrastructures in Higher Education Institutions – A proof of concept 30
Pedro Lopes, Francisco Pereira, António Costa
SIGMA Cloud An Open Academic and Research Environment 34
Juan José Fuentes, Jordi Cuní
Parallel Session One – Leadership & Management
CIO structures and the success of HE institutions 40
Markus von der Heyde, Andreas Breiter
Re-Engineering Working Culture - How an ICT Project Promotes a University Towards Its Strategic Goals
44
Lotta Linko, Ari Kuusio
EUNIS 2016: IT strategy for a public university – why, what, when and how? 47
Soren Berglund
Parallel Session One – Software Development
A secure infrastructure for mobile blended learning applications (EUNIS 2016 Best Paper Award winner) 49
M. Politze, S. Schaffert, B. Decker
Deploying an University App Store with Open Innovation 57
Jaime Busquets, Miguel Macías, Raúl Mengod, Juan Evangelista4 and Carlos Turro
LARK: Location-Aware Personalized Travel Guide with Rich Knowledge 63
Bontomitsidis Spyridon, Floros Dimitrios, ManolasDimitrios, Mylonakis Konstantinos, Pitsianis Nikos
Parallel Session One – OpenX & Interoperability – Special student mobility session
Erasmus Without Paper — from the technical perspective 70
Janina Mincer-Daszkiewicz, Wojciech Rygielski
Supporting Student Mobility with EMREX — a field trial on exchanging student achievement records 74
EUNI 8
8
Mats Lindstedt, Anders Bøgebjerg Hansen, Stefano Russo, Geir Vangen, Janina Mincer-Daszkiewicz, Mattias
Holmlund
Paperless mobility in European Higher Education Institutions with Moebius 77
Stefania Niavi, Stauros Argiropoulos, Anastasios Selalmazidis, Nikos Liolios
Parallel Session Two – Leadership & Management
ERAI 2016: Update 80
Johan Bergström, Michele Mennielli, Amandine Alehyane
State of Enterprise Architecture practice in Finnish Higher Education sector 82
Nestori Syynimaa, Patrik Maltusch, Esa Suominen
The Future of IT Management: A Longitudinal Qualitative Review 92
Noel Wilson, Johan Bergström
Parallel Session Two – ICT Infrastructure & Security Honorary Paper
EUNIS 2016: Enter the mindset of a hacker. Why? Because to protect against hackers, you have to think
as one! 100
Asbjørn Reglund Thorsen
University ict security certification 101
Ciclosi F., Mauri M., Polzonetti A
Using Honeypots in Network Intelligence Architectures – The University of Trás-os-Montes e Alto Douro
case study 111
José Bessa, Hugo Coelho, Pedro Monteiro, José Brito, António Costa
Parallel Session Two – Software Development
A browser-based digital signing solution over the web 124
Fotis Loukos, Charalampos Tsipizidis, Dimitris Daskopoulos
Engaging students in building better digital services 127
Pauliina Kupila, Ulla Lehtonen
User Support 2.0 – New Communication Channels in the IT-ServiceDesk at RWTH Aachen University 131
Sarah Grzemski
Parallel Session Two – Teaching & Learning
Electronic management of assessment: business processes, system requirements and institutional
capability 134
Dr Gill Ferrell, Lisa Gray
E-learning advancements in the academic foreign language teaching 142
Anna Pacholak, Monika Galbarczyk

EUNI 9
9
Active teaching and learning: stimulating students’ engagement at Paris Descartes University 152
Xavier Coumoul, Anne Laude, Pierre Buffet, Ludivine Alvarez, Marion Harent, Stéphanie Lehu, Thierry
Koscielnia
Parallel Session Three – Leadership & Management
The social university: delivering business benefit through online networking 154
Dr Gill Ferrell, Anna Mathews
Creating an IT plan is more than words on a page 162
Karoline Westerlund
Parallel Session Three – ICT Infrastructure & Security
The Campuscard System: An innovative multifunctional smartcard solution for higher education
institutions 164
Dr. rer. nat. Tamas Molnar
Automated User Information Conversion to improve Identity Federation Scalability 168
Daniela Pöhn, Wolfgang Hommel
Digital Identity for University People 178
G. Gentili, F. Ippoliti, M. Maccari, A.Polzonetti
Parallel Session Three – Software Development
Towards a distributed research data management system 184
M. Politze, F. Krämer
New university erp for studying, teaching nd administration ‐ past, present and future of the peppi 187
Tuomas Orama, Jaakko Rannila, Mika Lavikainen, Lauri Stigell
Research Software Sustainability is essential to Open Research Recommendations and an update on
developments 195
Simon Hettrick, Matthias Katerbow, Bas Cordewener
Parallel Session Three – OpenX & Interoperability
Identify to simplify: improving interoperability at a national level with the ORCID HUB 197
Michele Mennielli, Andrea Bollini,Josh Brown, Susanna Mornati
Interoperability between Information Systems of Portuguese Higher Education Institutions (EUNIS Elite
Award 2016 for excellence in implementing Information Systems for Higher Education) 200
Lígia M. Ribeiro, Rui H. Pereira, Osvaldo Pacheco, Mário Bernardes, Ricardo T. Martins
Interoperability + semantics = check! Smart and Cost Effective Data Modelling and Tools of the Future 213
Suvi Remes, Miika Alonen, Patrik Maltusch, Mikael af Hällström

EUNI 10
10
Parallel Session Four – Leadership & Management
Putting the CHEITA Global Complexity Index to the test 218
1st Johan Bergström1, 2nd Anne Kealley2, 3d Leah Lang3, 4th Lori MacMullen4, 5thMichele Mennielli5, 6th Paul
Sherlock6, 7th Peter Tinson7, 8th, Markus von der Heyde8
BENCHEIT – Benchmarking Higher Education IT An Update on the Work of the EUNIS Bencheit Task Force
221
1st Ilkka Siissalo1, 2nd Yiannis Salmatzidis 2, 3rd Angeliki Agorogianni3, 4th Yvonne Kivi4
Finding the holy grail of IT Benchmarking 223
1st Johan Bergström1, 2nd Rens van der Vorst2, 3d Michele Mennielli3, 4th Yvonne Kivi4, 5th Teemu Seesto5, 6th,
Ole Langfelt6, 7th Jose Pascual Gumbau Mezquita7, 8th Antonio Fernández Martínez8, 9th Vicente Andreu
Navarro7, 10th Paco Sampalo9
Parallel Session Four – ICT Infrastructure & Security
Challenges of Supporting Education and Research to Make Use of eduGAIN 226
Ioannis Kakavas
Towards Pan-European Cloud Services 229
Branko Radojević, Andres Steijaert, Lars Fuglevaag
A brief overview of the Information System for Science and Higher Education in Poland 231
Jarosław Protasiewicz, Marek Michajłowicz, Mikołaj Szypke
Parallel Session Four – Teaching & Learning
Turning AUTh into e-University 234
Pinelopi Giovanitsa
EUNIS 2016: Creating Virtual Learning Environment for Higher Education Institutions 237
Zvonko Martinović, Sandra Kučina Softić, Vedran Mušica
Bestr: Open Badges and SIS to empower Lifelong & Lifewide Learning 244
Matteo Bertazzo, Chiara Carlino, Federico Giacanelli, Simone Ravaioli
Parallel Session Four – OpenX & Interoperability
Next-Generation Digital Learning Environments: Closer Than You Think! 248
Bruce Maas, Rob Abel, Jack Suess, John O’Brien
EMREX in Poland supporting internal mobility 253
Janina Mincer-Daszkiewicz, Wojciech Rygielski
Looking back at the EUNIS repository data using text mining techniques 262
Elsa Cardoso, Ricardo Ribeiro
EUNI 11
11
Parallel Session Five – Leadership & Management
Central IT Organizations and How They Support Research in the U.S. Central IT Organizations and How
They Support Research in the U.S. 266
Gregory D. Palmer
Academic IT support for Data Science 282
Simon Price
Future Trends in Higher Education and Research in Finland 285
Outi Tasala
Parallel Session Five – ICT Infrastructure & Security
How Application Virtualization improved the student and staff IT experience at Odisee University College
287
Jan Van Calster
EUNIS 2016: You are leaking metadata! 292
Asbjørn Reglund Thorsen
Democratizing (certified) video conferencing 294
George Kougioumtzakis, Savvas Anastasiades
Parallel Session Five – Teaching & Learning
MOOCs: searching for a viable business model 298
Yves Epelboin
The Greek Universities Open Courses Program 313
Pantelis Balaouras, Konstantinos Tsimpanis, Lazaros Merakos
Computer science higher education in Poland. Quality & quantity analysis. 316
Andrzej Żyławski
Parallel Session Five – OpenX & Interoperability
An Integral Approach to Support Research Data Management at the Humboldt-Universität zu Berlin 320
Malte Dreyer, Andreas Vollmer
Project THOR: Persistent Identifiers in the service of open, interoperable research 328
Tom Demeranville, Josh Brown
How Do Researchers Manage their Data? An Empirical Comparison between Policies and Practice 330
Anne Thoring, Dominik Rudolph, Raimund Vogl
EUNI 12
12
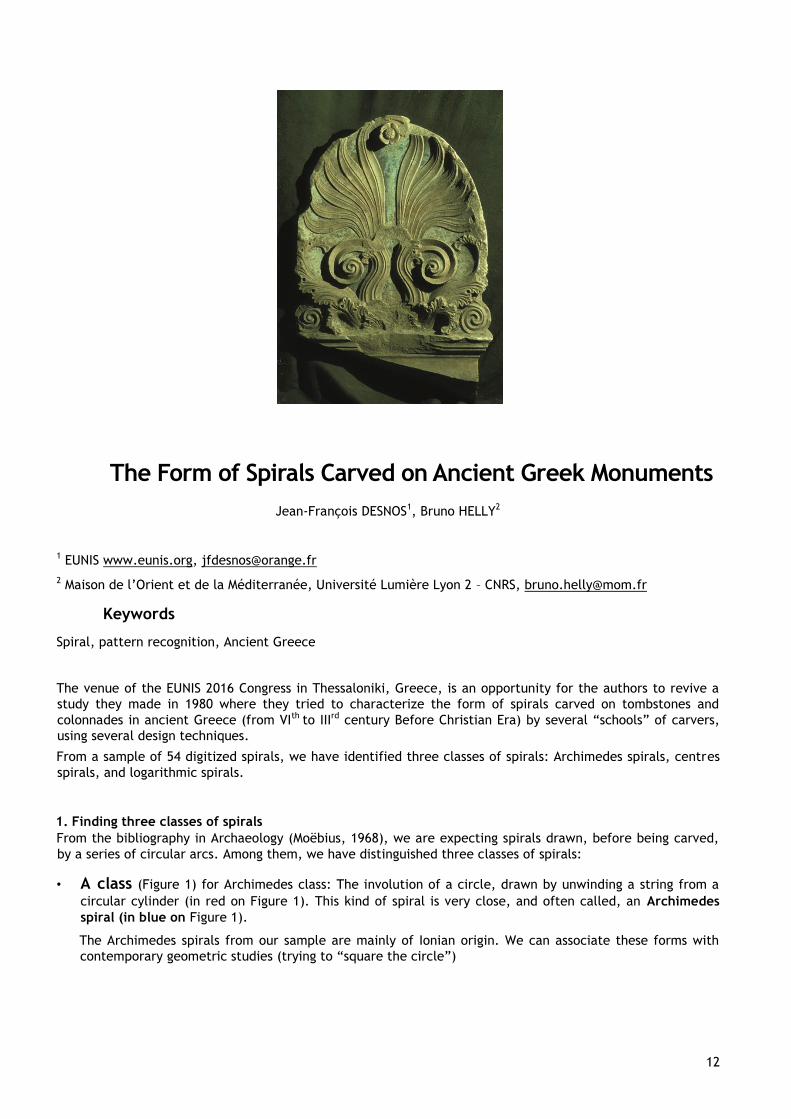
The Form of Spirals Carved on Ancient Greek Monuments
Jean-François DESNOS1, Bruno HELLY2
1 EUNIS www.eunis.org, [email protected]
2 Maison de l’Orient et de la Méditerranée, Université Lumière Lyon 2 – CNRS, [email protected]
Keywords
Spiral, pattern recognition, Ancient Greece
The venue of the EUNIS 2016 Congress in Thessaloniki, Greece, is an opportunity for the authors to revive a
study they made in 1980 where they tried to characterize the form of spirals carved on tombstones and
colonnades in ancient Greece (from VIth to IIIrd century Before Christian Era) by several “schools” of carvers,
using several design techniques.
From a sample of 54 digitized spirals, we have identified three classes of spirals: Archimedes spirals, centres
spirals, and logarithmic spirals.
1. Finding three classes of spirals
From the bibliography in Archaeology (Moëbius, 1968), we are expecting spirals drawn, before being carved,
by a series of circular arcs. Among them, we have distinguished three classes of spirals:
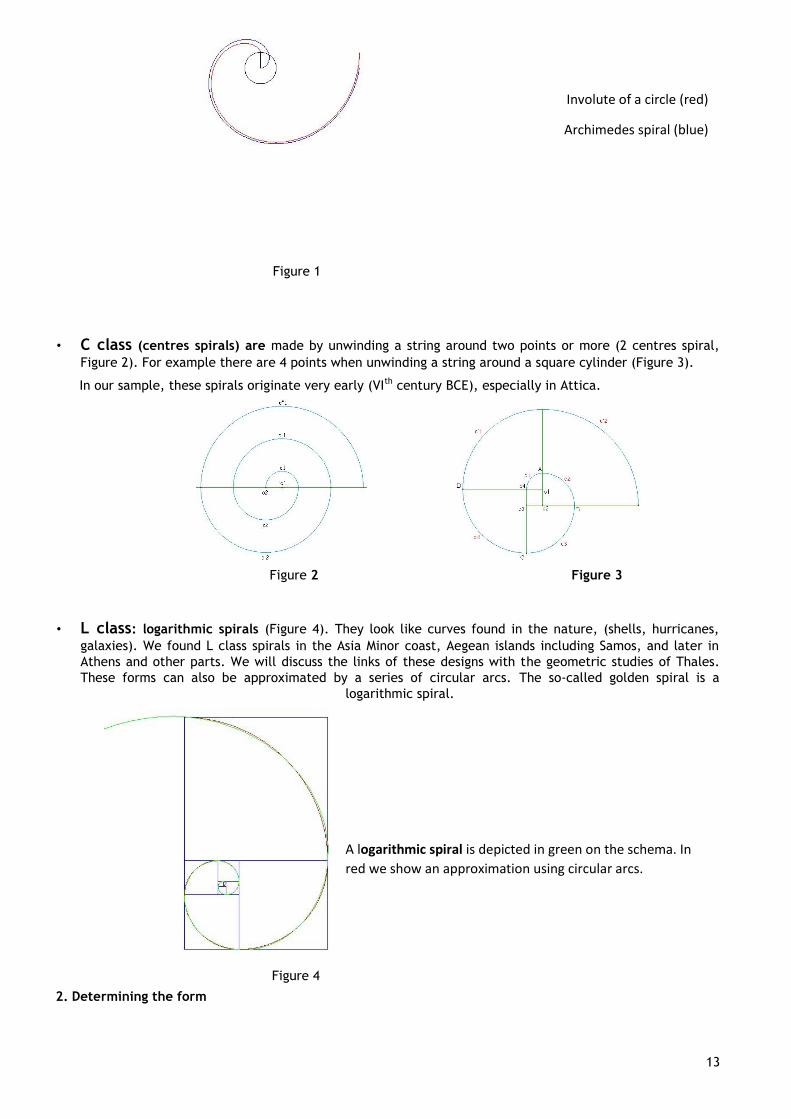
• A class (Figure 1) for Archimedes class: The involution of a circle, drawn by unwinding a string from a
circular cylinder (in red on Figure 1). This kind of spiral is very close, and often called, an Archimedes
spiral (in blue on Figure 1).
The Archimedes spirals from our sample are mainly of Ionian origin. We can associate these forms with
contemporary geometric studies (trying to “square the circle”)
EUNI 13
13
Involute of a circle (red)
Archimedes spiral (blue)
Figure 1
• C class (centres spirals) are made by unwinding a string around two points or more (2 centres spiral,
Figure 2). For example there are 4 points when unwinding a string around a square cylinder (Figure 3).
In our sample, these spirals originate very early (VIth century BCE), especially in Attica.
Figure 2 Figure 3
• L class: logarithmic spirals (Figure 4). They look like curves found in the nature, (shells, hurricanes,
galaxies). We found L class spirals in the Asia Minor coast, Aegean islands including Samos, and later in
Athens and other parts. We will discuss the links of these designs with the geometric studies of Thales.
These forms can also be approximated by a series of circular arcs. The so-called golden spiral is a
logarithmic spiral.
A logarithmic spiral is depicted in green on the schema. In
red we show an approximation using circular arcs.
Figure 4
2. Determining the form
EUNI 14
14
The Pattern Recognition problem then, is the retrieval of the spiral geometric elements. We chose not to
study the curves in polar coordinates (r, θ) because their equation depends on the chosen origin of axes.
We preferred to analyse the curvature, which is an intrinsic property. This point made this research
new and innovative (Desnos, 1980).
If the radius of curvature is expressed as a function of the angle that the tangent makes with a fixed
direction Ox, we notice that the assumed spirals have some remarkable properties:
• For the A class (Archimedes), the radius of curvature grows linearly with the polar angle (involution
of a circle).
It can be described in polar coordinates by the equation r = a + b θ
One other property is that any ray from the origin intersects successive turnings of the spiral in points
with a constant separation of the distance.
• For the C class (centres), the radius of the curvature is piecewise constant (circular arcs).
• For the L class (logarithmic), the radius of the curvature grows exponentially with the polar angle.
This kind of spiral is also quite well approximated by a sequence of circle arcs, of radius 1, kl, k21,
k31, …
The equation in polar coordinates is r = aeb θ Some more
properties for the L group are:
- The angle φ between the tangent and the radial line is constant.
- The distance between the turnings increases in geometric progression.
- The radius of the curvature can be written:
R = kelθ
3. Implementation
The software was designed and developed by the authors in PL1 language.
The inputs were done manually by points. The outputs were made on a Benson plotter.
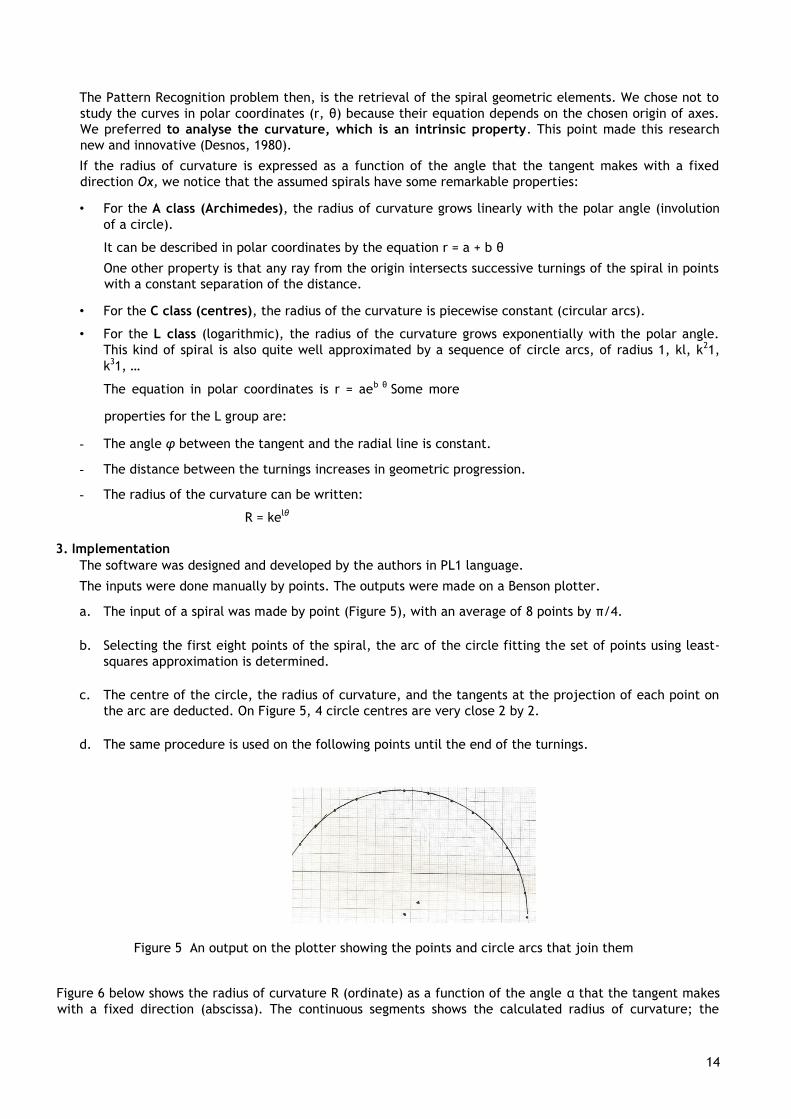
a. The input of a spiral was made by point (Figure 5), with an average of 8 points by π/4.
b. Selecting the first eight points of the spiral, the arc of the circle fitting the set of points using least-
squares approximation is determined.
c. The centre of the circle, the radius of curvature, and the tangents at the projection of each point on
the arc are deducted. On Figure 5, 4 circle centres are very close 2 by 2.
d. The same procedure is used on the following points until the end of the turnings.
Figure 5 An output on the plotter showing the points and circle arcs that join them
Figure 6 below shows the radius of curvature R (ordinate) as a function of the angle α that the tangent makes
with a fixed direction (abscissa). The continuous segments shows the calculated radius of curvature; the
EUNI 15
15
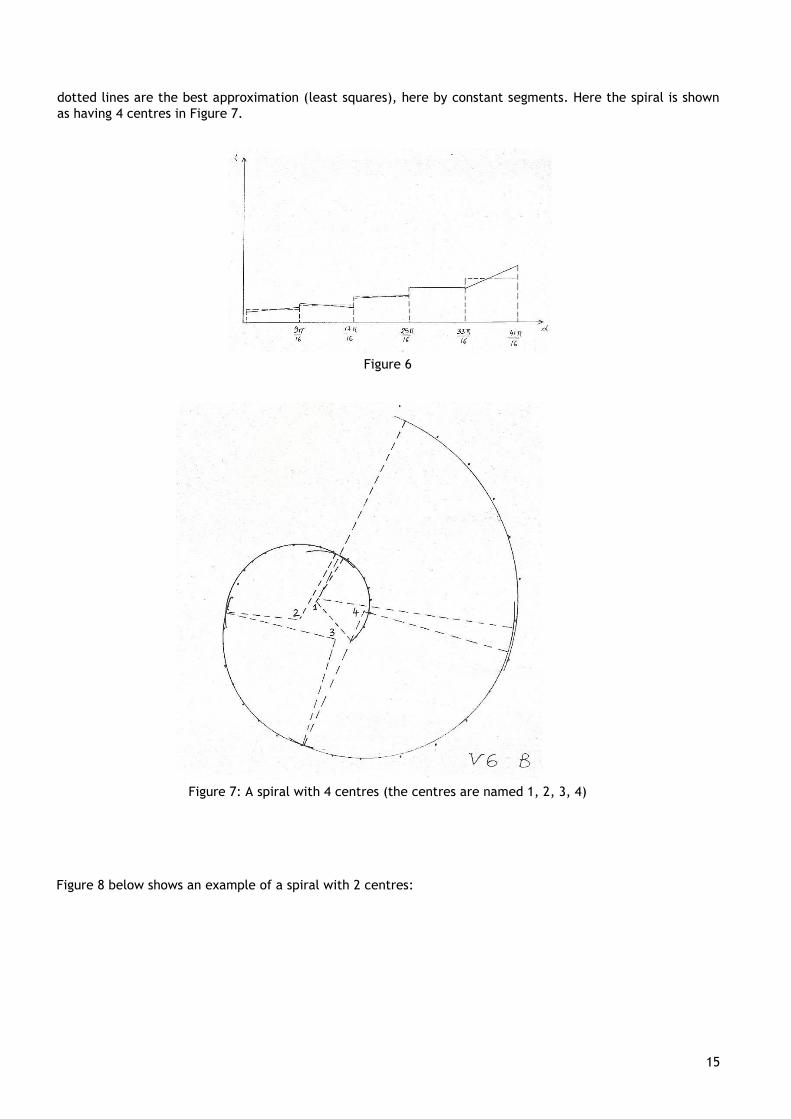
dotted lines are the best approximation (least squares), here by constant segments. Here the spiral is shown
as having 4 centres in Figure 7.
Figure 6
Figure 7: A spiral with 4 centres (the centres are named 1, 2, 3, 4)
Figure 8 below shows an example of a spiral with 2 centres:
EUNI 16
16
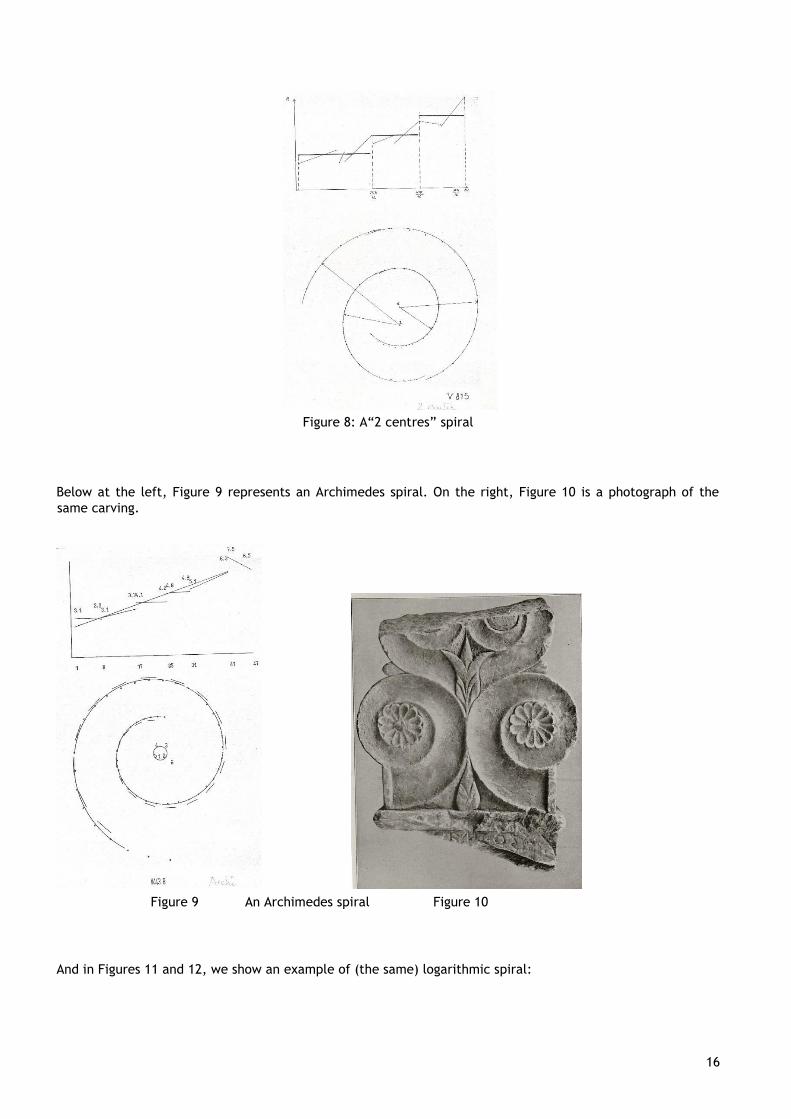
Figure 8: A“2 centres” spiral
Below at the left, Figure 9 represents an Archimedes spiral. On the right, Figure 10 is a photograph of the
same carving.
Figure 9 An Archimedes spiral Figure 10
And in Figures 11 and 12, we show an example of (the same) logarithmic spiral:

EUNI 17
17
Figure 11 A Logarithmic spiral (Samos VIth BCE) Figure 12
4. Results
We admit that the sample remains small, with spirals chosen for the quality of the craft, in order to minimize
the classification errors after processing.
In 1980, the input process was done by points and was very long and tedious. That’s why, from several
thousands of beautiful photographs taken by our colleague and friend Christoph Wolters (Wolters, 1969), only
54 spirals were analysed. Today, the photographs could be digitized more easily, with a recognition program
using a spline or Bézier approximation, which was already discussed in 1980 with Professor P.-J. Laurent in
Grenoble (Laurent, 1972).
From these 54 spirals, we could define the form of 21 spirals, which is quite satisfying considering the
precision of the carving, photographs, digitization, and approximations used. Among them, representatives of
the three classes were determined.
A class Five Archimedes spirals were detected
• from Samos, date 530-520 VIth century BCE
• from Sardis (Asia Minor), date middle VI BCE
• from Amorgos (Aegean island), date middle VIth century BCE
• from Kos (Aegean island), date Vth century BCE
• from Attica (Piraeus), date IV BCE
These are mainly Ionian artworks including Athens and the islands. The design is probably related to
geometric problems like squaring the circle (finding a straight line that has a length which is equal to the
circle arc).
C class Nine spirals were determined as centres spirals
• a 4 centres spiral from Kertsch (Black Sea), date Vth century BCE
• a 2 centres spiral from Attica, date VIth century (575-545) BCE
• a 2 centres spiral from Attica, date VIth century (550-5525)BCE
• a 4 centres spiral from Sidon, date 430 BCE
• a 4 centres spiral from Athens, date 425-410 BCE
• two centres spirals from Athens Erechteion, date 410-400 BCE
• a 4 centres spiral from Athens, date IVth BCE
• a 4 centres spiral from South Russia, date early IIIth century BCE
EUNI 18
18
This class has early origins, especially in Attica. But on IIIrd century BCE, Demetrius, the king of Macedonia
forbade carvers any marble ornaments in the Athens area. Workshops were closed and the carvers moved to
other Greek areas.
L class Seven spirals were classed as Logarithmic
• one from Troade, date around 550 BC (VIth century BCE)
• one from Samos, date around 530-520 BC (VIth century BCE)
• one from Samos, date around 530-520 BC (VIth century BCE)
• one from Samos, date around early Vth century BCE
• one from Karystos (Euboea), date around 440-430 BCE
• one from Athens, date 365-340 BCE
• an unknown origin spiral…
Mainly designed in the Ionian tradition (Troade, Aegean islands, especially Samos). We expect a relationship
between logarithmic designs and the first geometric definitions assigned to Thales.
As a conclusion, we can say that today we have the informatics tools to treat the thousands of photographs
preserved at Maison de l’Orient Méditerranéen. Analysing them through modern approximation techniques, it
could be possible to associate a large segmentation in classes to the techniques of the carver’s workshops, the
movements of the craftsmen, the place and dates of the sculptures.
Bibliography
Desnos, J.-F. Pattern Recognition of Spirals Carved on Ancient Greek Monuments, 1980 Conference on Pattern
Recognition, Oxford, England.
Laurent, P.-J. Approximation et Optimisation, Ed. Hermann, Paris, 1972
Moëbius, H. Die Ornamente der griechischen Grabstele, um Nachträge und Register vermehrte Auflage,
München, 1968.
Wolters, Ch. Die Anthemien-Ornamente der Grabstelen von Demetrias, Thesis, Ruprecht-KarlUniversität zu
Heidelberg, 1969
The Authors
Dr Jean-François Desnos is a Research Engineer in Applied Mathematics and Informatics retired from
Université Joseph Fourier, Grenoble. He is a former President of EUNIS.
Pr Dr Bruno Helly is an Emeritus Research Director in Archaeology at Centre National de la Recherche
Scientifique. He has been working for 40 years on ancient Thessaly.
EUNI 19
19
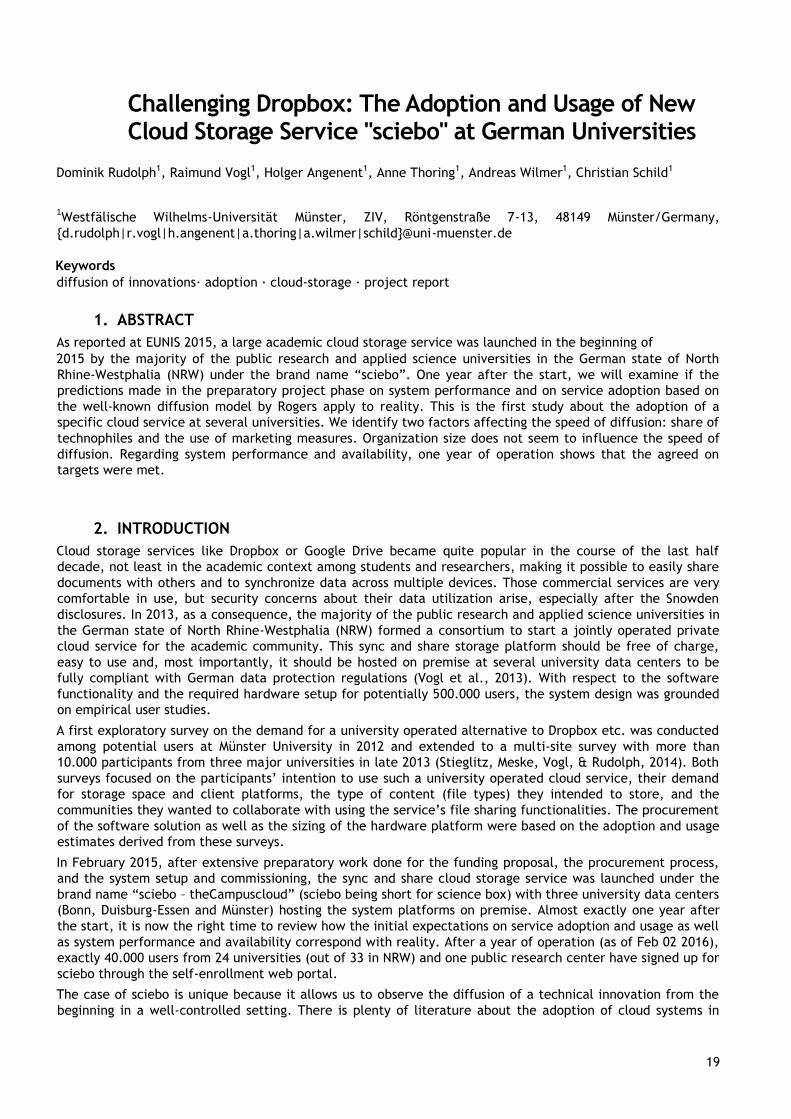
Challenging Dropbox: The Adoption and Usage of New Cloud Storage Service "sciebo" at German Universities
Dominik Rudolph1, Raimund Vogl1, Holger Angenent1, Anne Thoring1, Andreas Wilmer1, Christian Schild1
1Westfälische Wilhelms-Universität Münster, ZIV, Röntgenstraße 7-13, 48149 Münster/Germany,
{d.rudolph|r.vogl|h.angenent|a.thoring|a.wilmer|schild}@uni-muenster.de
Keywords
diffusion of innovations· adoption · cloud-storage · project report
1. ABSTRACT
As reported at EUNIS 2015, a large academic cloud storage service was launched in the beginning of
2015 by the majority of the public research and applied science universities in the German state of North
Rhine-Westphalia (NRW) under the brand name “sciebo”. One year after the start, we will examine if the
predictions made in the preparatory project phase on system performance and on service adoption based on
the well-known diffusion model by Rogers apply to reality. This is the first study about the adoption of a
specific cloud service at several universities. We identify two factors affecting the speed of diffusion: share of
technophiles and the use of marketing measures. Organization size does not seem to influence the speed of
diffusion. Regarding system performance and availability, one year of operation shows that the agreed on
targets were met.
2. INTRODUCTION
Cloud storage services like Dropbox or Google Drive became quite popular in the course of the last half
decade, not least in the academic context among students and researchers, making it possible to easily share
documents with others and to synchronize data across multiple devices. Those commercial services are very
comfortable in use, but security concerns about their data utilization arise, especially after the Snowden
disclosures. In 2013, as a consequence, the majority of the public research and applied science universities in
the German state of North Rhine-Westphalia (NRW) formed a consortium to start a jointly operated private
cloud service for the academic community. This sync and share storage platform should be free of charge,
easy to use and, most importantly, it should be hosted on premise at several university data centers to be
fully compliant with German data protection regulations (Vogl et al., 2013). With respect to the software
functionality and the required hardware setup for potentially 500.000 users, the system design was grounded
on empirical user studies.
A first exploratory survey on the demand for a university operated alternative to Dropbox etc. was conducted
among potential users at Münster University in 2012 and extended to a multi-site survey with more than
10.000 participants from three major universities in late 2013 (Stieglitz, Meske, Vogl, & Rudolph, 2014). Both
surveys focused on the participants’ intention to use such a university operated cloud service, their demand
for storage space and client platforms, the type of content (file types) they intended to store, and the
communities they wanted to collaborate with using the service’s file sharing functionalities. The procurement
of the software solution as well as the sizing of the hardware platform were based on the adoption and usage
estimates derived from these surveys.
In February 2015, after extensive preparatory work done for the funding proposal, the procurement process,
and the system setup and commissioning, the sync and share cloud storage service was launched under the
brand name “sciebo – theCampuscloud” (sciebo being short for science box) with three university data centers
(Bonn, Duisburg-Essen and Münster) hosting the system platforms on premise. Almost exactly one year after
the start, it is now the right time to review how the initial expectations on service adoption and usage as well
as system performance and availability correspond with reality. After a year of operation (as of Feb 02 2016),
exactly 40.000 users from 24 universities (out of 33 in NRW) and one public research center have signed up for
sciebo through the self-enrollment web portal.
The case of sciebo is unique because it allows us to observe the diffusion of a technical innovation from the
beginning in a well-controlled setting. There is plenty of literature about the adoption of cloud systems in
EUNI 20
20
organizations like SMEs (Alshamaila, Papagiannidis, & Li, 2013; Tehrani & Shirazi, 2014; Trigueros-Preciado,
Pérez-González, & Solana-González, 2013) or special industries (Cegielski,
Allison Jones-Farmer, Wu, & Hazen, 2012; Gupta, Seetharaman, & Raj, 2013; Ivanova & Ivanov, 2010;
Khanagha, Volberda, Sidhu, & Oshri, 2013; Lian, Yen, & Wang, 2014; Low, Chen, & Wu, 2011; Moryson &
Moeser, 2016; Oliveira, Thomas, & Espadanal, 2014), but only little is known about the adoption behavior of
end-users who can decide freely if they want to use a new cloud service or not (Shin, Jo, Lee, & Lee, 2014).
Universities are a special case: On the one hand, they are organizations with a quite uniform population and a
manageable size. On the other hand, because of the principle of freedom of research and teaching held high
in Germany, there is no possibility to command the use of a system, so users have to be convinced.
3. PREDICTIONS
In preparing the sciebo project and applying for substantial funding, reliable predictions on the user adoption
of this new service were crucial for the system design and amount of hardware to procure. For the university
data centers volunteering to host the platform, estimates of the internet bandwidth to be dedicated to sciebo
was important, and for the universities that had to decide if they wanted to join the sciebo project
consortium it was necessary to know what quality of service, especially with respect to system availability,
they could expect. Thus, based on empirical research, predictions were made on the required storage volume
for the sciebo system platform and the required internet bandwidth – both directly connected to the adoption
of the new service by its eligible users. System availability scores were estimated based on the analysis of
three years of well documented operations incidents at the University of Münster.
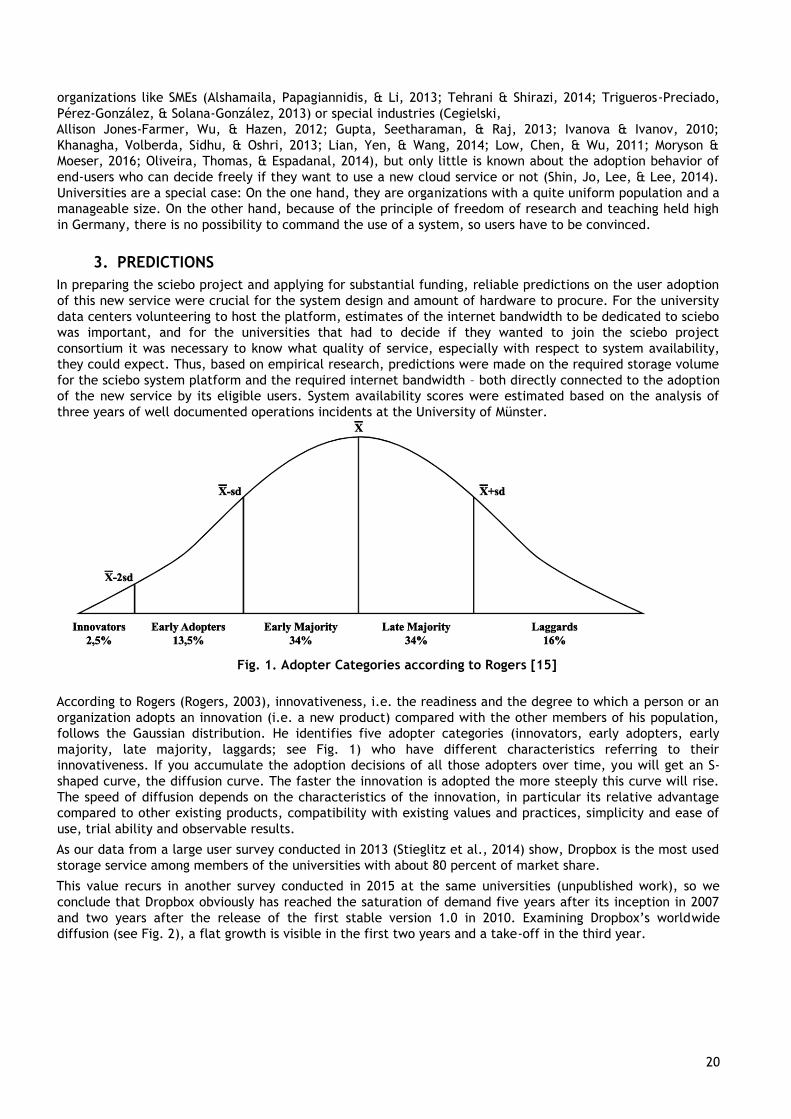
Fig. 1. Adopter Categories according to Rogers [15]
According to Rogers (Rogers, 2003), innovativeness, i.e. the readiness and the degree to which a person or an
organization adopts an innovation (i.e. a new product) compared with the other members of his population,
follows the Gaussian distribution. He identifies five adopter categories (innovators, early adopters, early
majority, late majority, laggards; see Fig. 1) who have different characteristics referring to their
innovativeness. If you accumulate the adoption decisions of all those adopters over time, you will get an S-
shaped curve, the diffusion curve. The faster the innovation is adopted the more steeply this curve will rise.
The speed of diffusion depends on the characteristics of the innovation, in particular its relative advantage
compared to other existing products, compatibility with existing values and practices, simplicity and ease of
use, trial ability and observable results.
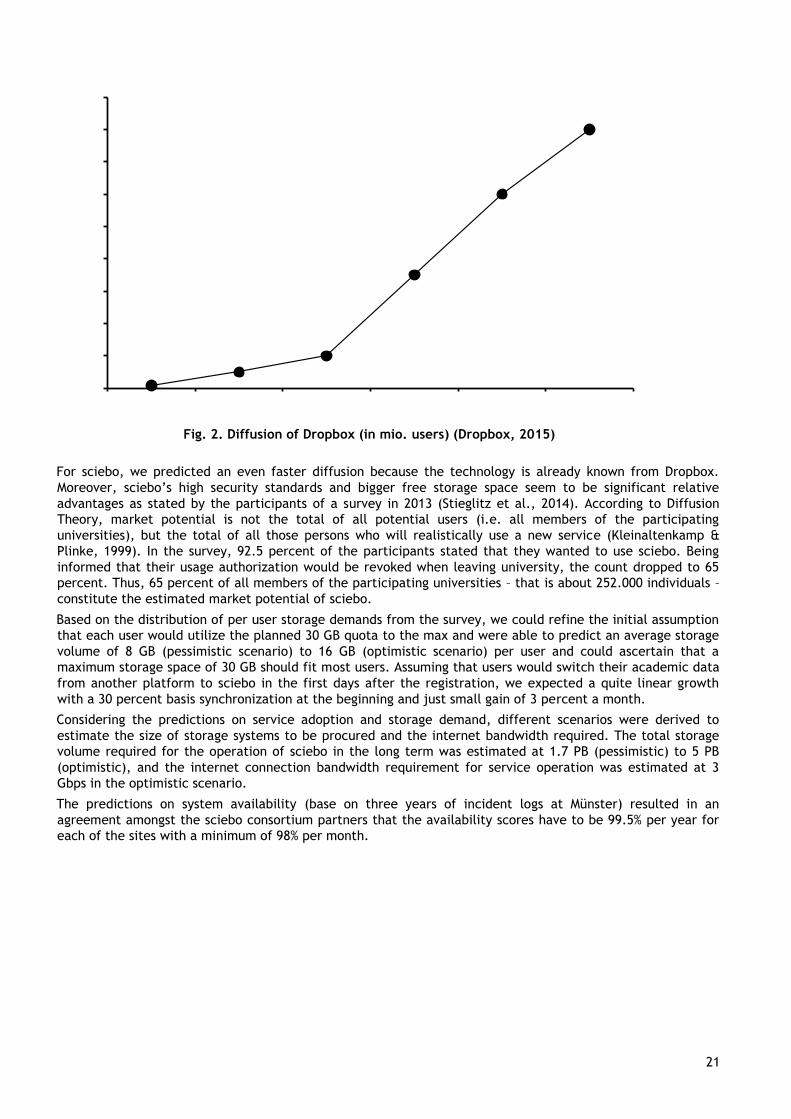
As our data from a large user survey conducted in 2013 (Stieglitz et al., 2014) show, Dropbox is the most used
storage service among members of the universities with about 80 percent of market share.
This value recurs in another survey conducted in 2015 at the same universities (unpublished work), so we
conclude that Dropbox obviously has reached the saturation of demand five years after its inception in 2007
and two years after the release of the first stable version 1.0 in 2010. Examining Dropbox’s worldwide
diffusion (see Fig. 2), a flat growth is visible in the first two years and a take-off in the third year.
EUNI 21
21
Fig. 2. Diffusion of Dropbox (in mio. users) (Dropbox, 2015)
For sciebo, we predicted an even faster diffusion because the technology is already known from Dropbox.
Moreover, sciebo’s high security standards and bigger free storage space seem to be significant relative
advantages as stated by the participants of a survey in 2013 (Stieglitz et al., 2014). According to Diffusion
Theory, market potential is not the total of all potential users (i.e. all members of the participating
universities), but the total of all those persons who will realistically use a new service (Kleinaltenkamp &
Plinke, 1999). In the survey, 92.5 percent of the participants stated that they wanted to use sciebo. Being
informed that their usage authorization would be revoked when leaving university, the count dropped to 65
percent. Thus, 65 percent of all members of the participating universities – that is about 252.000 individuals –
constitute the estimated market potential of sciebo.
Based on the distribution of per user storage demands from the survey, we could refine the initial assumption
that each user would utilize the planned 30 GB quota to the max and were able to predict an average storage
volume of 8 GB (pessimistic scenario) to 16 GB (optimistic scenario) per user and could ascertain that a
maximum storage space of 30 GB should fit most users. Assuming that users would switch their academic data
from another platform to sciebo in the first days after the registration, we expected a quite linear growth
with a 30 percent basis synchronization at the beginning and just small gain of 3 percent a month.
Considering the predictions on service adoption and storage demand, different scenarios were derived to
estimate the size of storage systems to be procured and the internet bandwidth required. The total storage
volume required for the operation of sciebo in the long term was estimated at 1.7 PB (pessimistic) to 5 PB
(optimistic), and the internet connection bandwidth requirement for service operation was estimated at 3
Gbps in the optimistic scenario.
The predictions on system availability (base on three years of incident logs at Münster) resulted in an
agreement amongst the sciebo consortium partners that the availability scores have to be 99.5% per year for
each of the sites with a minimum of 98% per month.
EUNI 22
22
4. FINDINGS
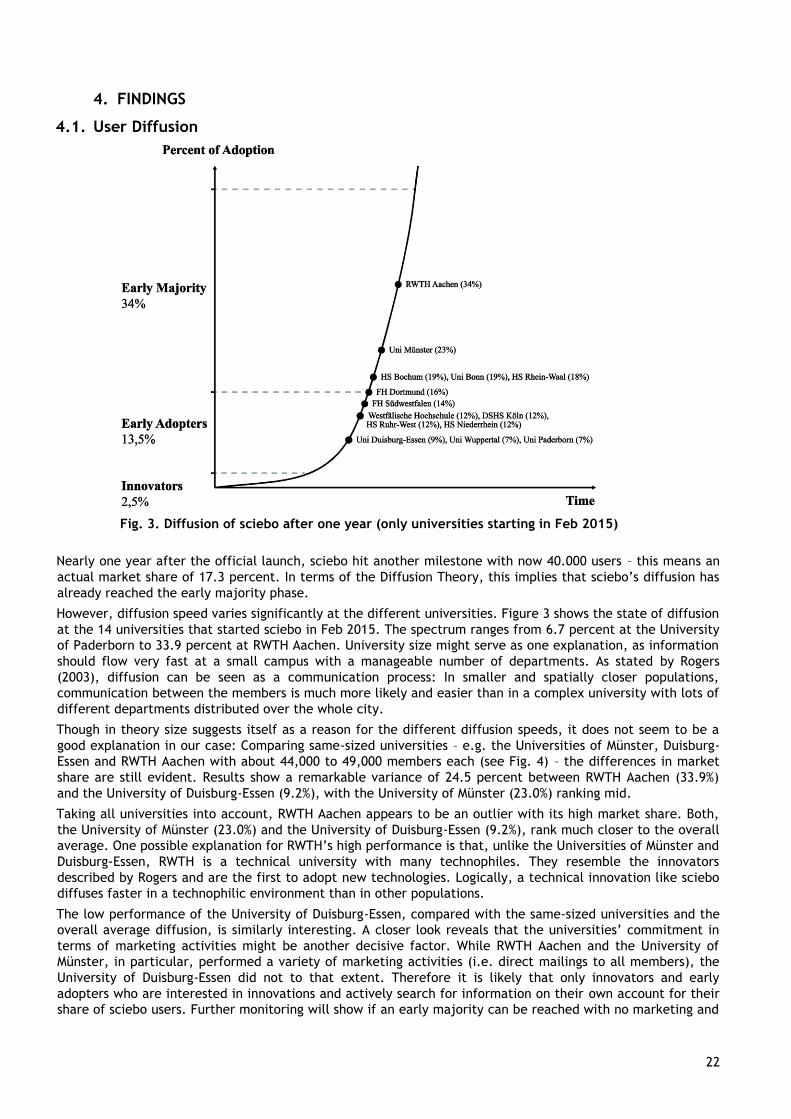
Fig. 3. Diffusion of sciebo after one year (only universities starting in Feb 2015)
Nearly one year after the official launch, sciebo hit another milestone with now 40.000 users – this means an
actual market share of 17.3 percent. In terms of the Diffusion Theory, this implies that sciebo’s diffusion has
already reached the early majority phase.
However, diffusion speed varies significantly at the different universities. Figure 3 shows the state of diffusion
at the 14 universities that started sciebo in Feb 2015. The spectrum ranges from 6.7 percent at the University
of Paderborn to 33.9 percent at RWTH Aachen. University size might serve as one explanation, as information
should flow very fast at a small campus with a manageable number of departments. As stated by Rogers
(2003), diffusion can be seen as a communication process: In smaller and spatially closer populations,
communication between the members is much more likely and easier than in a complex university with lots of
different departments distributed over the whole city.
Though in theory size suggests itself as a reason for the different diffusion speeds, it does not seem to be a
good explanation in our case: Comparing same-sized universities – e.g. the Universities of Münster, Duisburg-
Essen and RWTH Aachen with about 44,000 to 49,000 members each (see Fig. 4) – the differences in market
share are still evident. Results show a remarkable variance of 24.5 percent between RWTH Aachen (33.9%)
and the University of Duisburg-Essen (9.2%), with the University of Münster (23.0%) ranking mid.
Taking all universities into account, RWTH Aachen appears to be an outlier with its high market share. Both,
the University of Münster (23.0%) and the University of Duisburg-Essen (9.2%), rank much closer to the overall
average. One possible explanation for RWTH’s high performance is that, unlike the Universities of Münster and
Duisburg-Essen, RWTH is a technical university with many technophiles. They resemble the innovators
described by Rogers and are the first to adopt new technologies. Logically, a technical innovation like sciebo
diffuses faster in a technophilic environment than in other populations.
The low performance of the University of Duisburg-Essen, compared with the same-sized universities and the
overall average diffusion, is similarly interesting. A closer look reveals that the universities’ commitment in
terms of marketing activities might be another decisive factor. While RWTH Aachen and the University of
Münster, in particular, performed a variety of marketing activities (i.e. direct mailings to all members), the
University of Duisburg-Essen did not to that extent. Therefore it is likely that only innovators and early
adopters who are interested in innovations and actively search for information on their own account for their
share of sciebo users. Further monitoring will show if an early majority can be reached with no marketing and
EUNI 23
23
just word of mouth, or if the number of users will be stagnating. According to some authors there is a gap
between the early adopters and the early majority which has to be bridged by marketing activities
(Christensen, 2011; Moore, 2014), while Rogers (2003) considers both groups as a continuum.
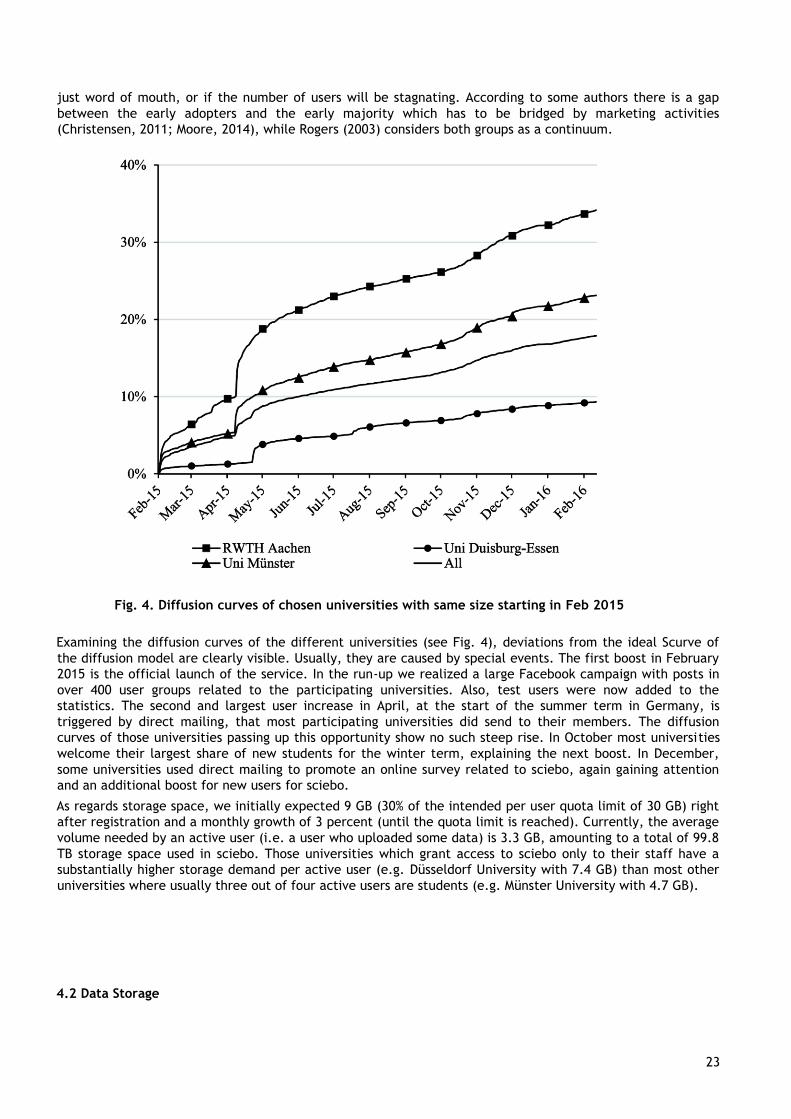
Fig. 4. Diffusion curves of chosen universities with same size starting in Feb 2015
Examining the diffusion curves of the different universities (see Fig. 4), deviations from the ideal Scurve of
the diffusion model are clearly visible. Usually, they are caused by special events. The first boost in February
2015 is the official launch of the service. In the run-up we realized a large Facebook campaign with posts in
over 400 user groups related to the participating universities. Also, test users were now added to the
statistics. The second and largest user increase in April, at the start of the summer term in Germany, is
triggered by direct mailing, that most participating universities did send to their members. The diffusion
curves of those universities passing up this opportunity show no such steep rise. In October most universities
welcome their largest share of new students for the winter term, explaining the next boost. In December,
some universities used direct mailing to promote an online survey related to sciebo, again gaining attention
and an additional boost for new users for sciebo.
As regards storage space, we initially expected 9 GB (30% of the intended per user quota limit of 30 GB) right
after registration and a monthly growth of 3 percent (until the quota limit is reached). Currently, the average
volume needed by an active user (i.e. a user who uploaded some data) is 3.3 GB, amounting to a total of 99.8
TB storage space used in sciebo. Those universities which grant access to sciebo only to their staff have a
substantially higher storage demand per active user (e.g. Düsseldorf University with 7.4 GB) than most other
universities where usually three out of four active users are students (e.g. Münster University with 4.7 GB).
4.2 Data Storage
EUNI 24
24
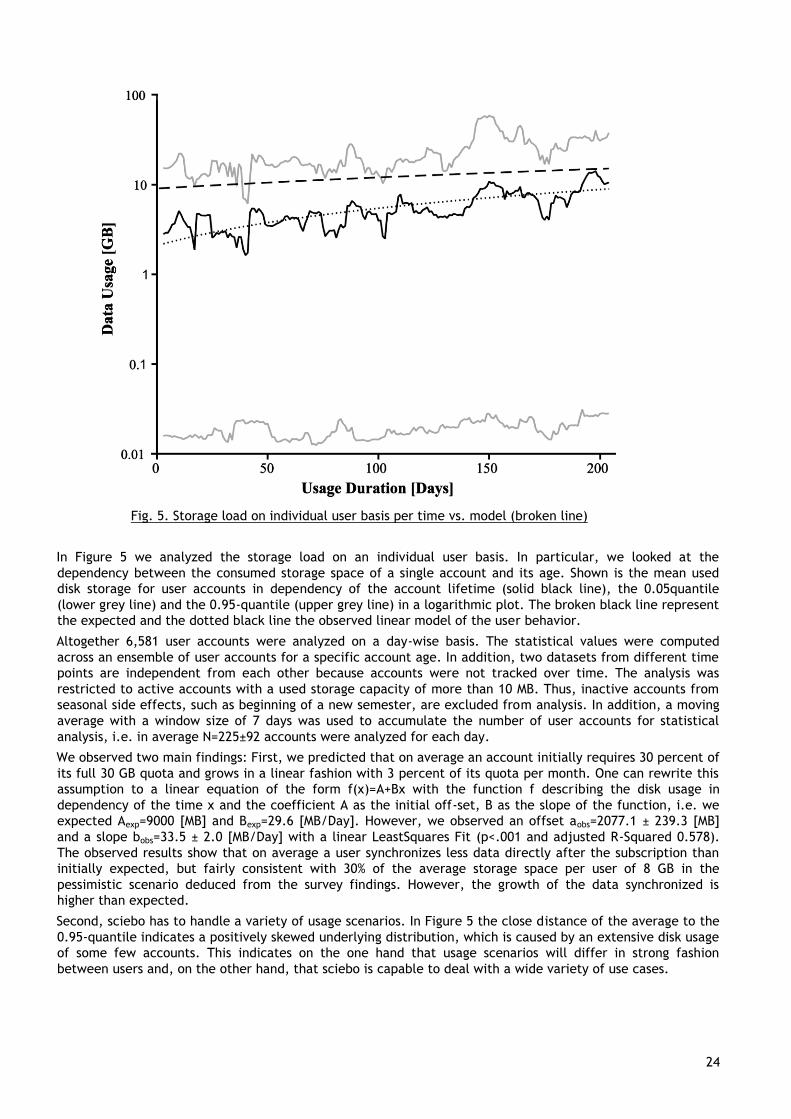
Fig. 5. Storage load on individual user basis per time vs. model (broken line)
In Figure 5 we analyzed the storage load on an individual user basis. In particular, we looked at the
dependency between the consumed storage space of a single account and its age. Shown is the mean used
disk storage for user accounts in dependency of the account lifetime (solid black line), the 0.05quantile
(lower grey line) and the 0.95-quantile (upper grey line) in a logarithmic plot. The broken black line represent
the expected and the dotted black line the observed linear model of the user behavior.
Altogether 6,581 user accounts were analyzed on a day-wise basis. The statistical values were computed
across an ensemble of user accounts for a specific account age. In addition, two datasets from different time
points are independent from each other because accounts were not tracked over time. The analysis was
restricted to active accounts with a used storage capacity of more than 10 MB. Thus, inactive accounts from
seasonal side effects, such as beginning of a new semester, are excluded from analysis. In addition, a moving
average with a window size of 7 days was used to accumulate the number of user accounts for statistical
analysis, i.e. in average N=225±92 accounts were analyzed for each day.
We observed two main findings: First, we predicted that on average an account initially requires 30 percent of
its full 30 GB quota and grows in a linear fashion with 3 percent of its quota per month. One can rewrite this
assumption to a linear equation of the form f(x)=A+Bx with the function f describing the disk usage in
dependency of the time x and the coefficient A as the initial off-set, B as the slope of the function, i.e. we
expected Aexp=9000 [MB] and Bexp=29.6 [MB/Day]. However, we observed an offset aobs=2077.1 ± 239.3 [MB]
and a slope bobs=33.5 ± 2.0 [MB/Day] with a linear LeastSquares Fit (p<.001 and adjusted R-Squared 0.578).
The observed results show that on average a user synchronizes less data directly after the subscription than
initially expected, but fairly consistent with 30% of the average storage space per user of 8 GB in the
pessimistic scenario deduced from the survey findings. However, the growth of the data synchronized is
higher than expected.
Second, sciebo has to handle a variety of usage scenarios. In Figure 5 the close distance of the average to the
0.95-quantile indicates a positively skewed underlying distribution, which is caused by an extensive disk usage
of some few accounts. This indicates on the one hand that usage scenarios will differ in strong fashion
between users and, on the other hand, that sciebo is capable to deal with a wide variety of use cases.
EUNI 25
25
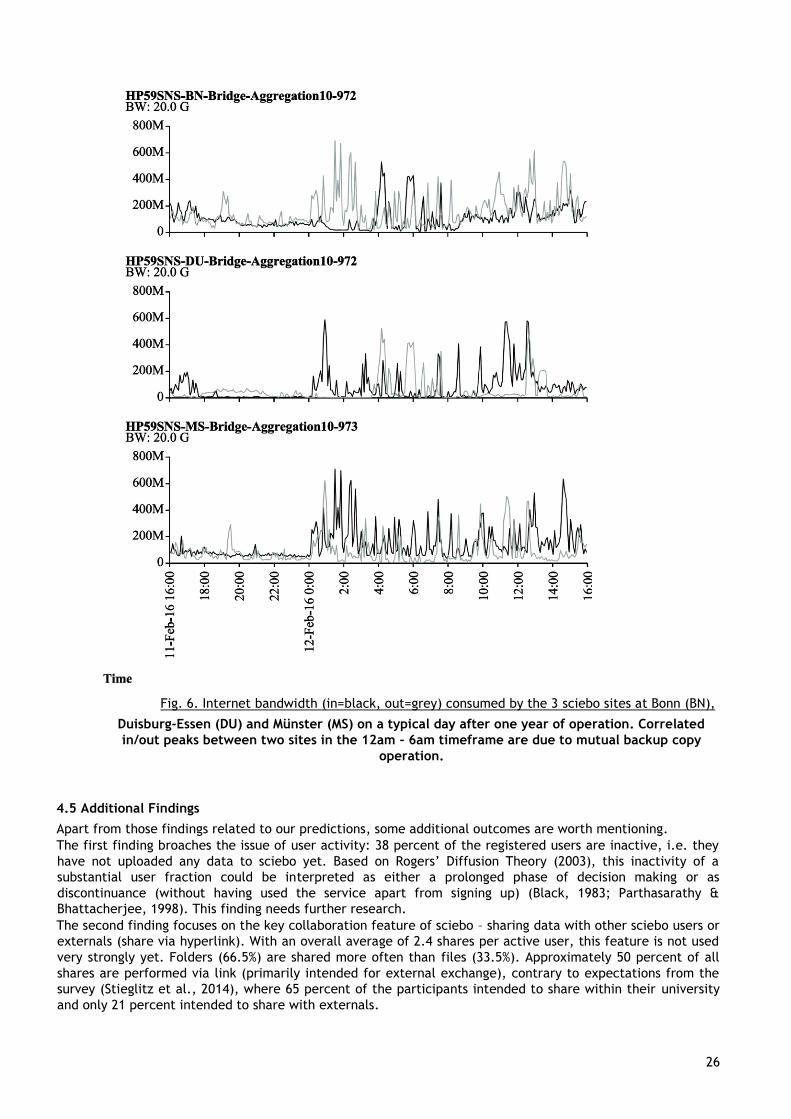
4.3 Bandwidth
The initial estimates of bandwidth requirements were essential to make sure that the internet connection
bandwidth of the three university data centers hosting the sciebo platform was not entirely consumed by the
new sciebo service. Based on simply models of service utilization (up- and downloads) an overall limit of 3
Gbps sustained for the whole sciebo system, thus approx. 1 Gbps for each of the datacenter sites, was
predicted as being sufficient.
One year after the start of operation, this sustained data rate has not been reached by far, but temporary
bandwidth peaks at each of the three sites are in the 800 Mbps range (see Fig. 6). With continuous growth of
the sciebo user base and storage volume, bandwidth demands will necessarily grow, but negative effects on
the internet connectivity of the hosting universities (each currently has a 10 Gbps internet link) are, as
initially predicted, not to be expected, especially since traffic policies limiting the bandwidth allocated to
individual connection could still be imposed. The mutual data backups between the three sites are schedules
in the 12am to 6am timeframe where service utilization is low and thus do not negatively impact the
bandwidth budget.
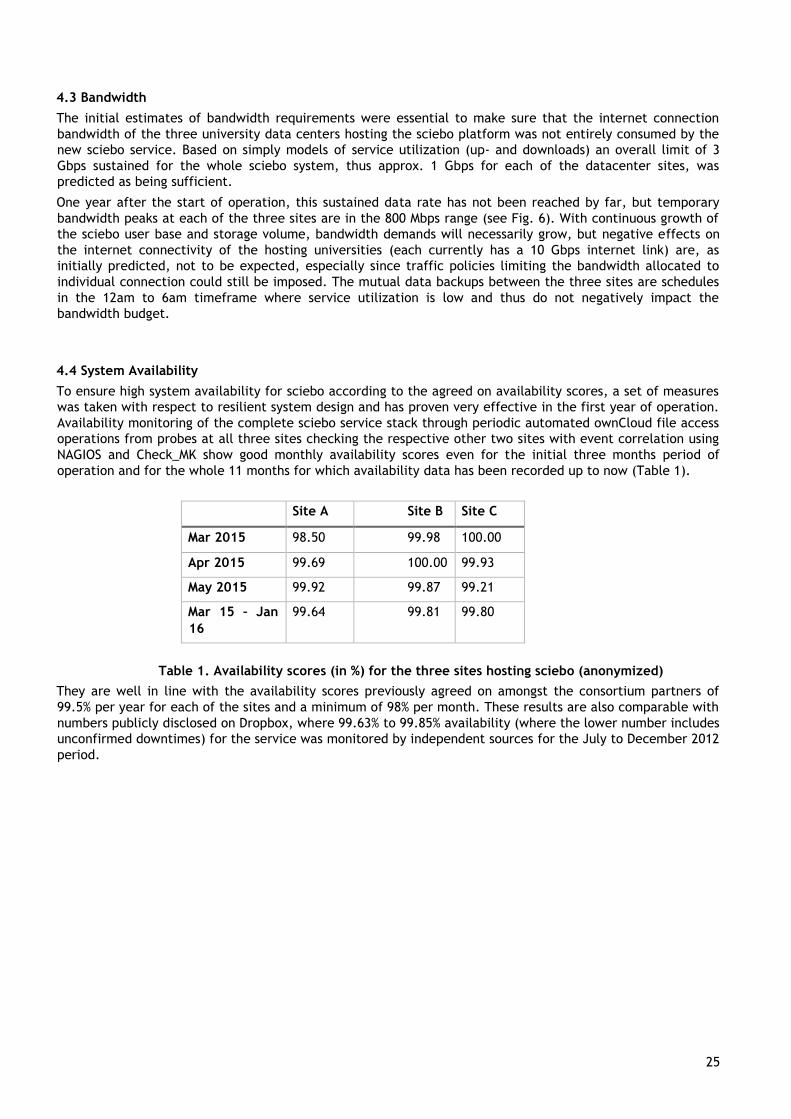
4.4 System Availability
To ensure high system availability for sciebo according to the agreed on availability scores, a set of measures
was taken with respect to resilient system design and has proven very effective in the first year of operation.
Availability monitoring of the complete sciebo service stack through periodic automated ownCloud file access
operations from probes at all three sites checking the respective other two sites with event correlation using
NAGIOS and Check_MK show good monthly availability scores even for the initial three months period of
operation and for the whole 11 months for which availability data has been recorded up to now (Table 1).
Site A Site B Site C
Mar 2015 98.50 99.98 100.00
Apr 2015 99.69 100.00 99.93
May 2015 99.92 99.87 99.21
Mar 15 – Jan
16
99.64 99.81 99.80
Table 1. Availability scores (in %) for the three sites hosting sciebo (anonymized)
They are well in line with the availability scores previously agreed on amongst the consortium partners of
99.5% per year for each of the sites and a minimum of 98% per month. These results are also comparable with
numbers publicly disclosed on Dropbox, where 99.63% to 99.85% availability (where the lower number includes
unconfirmed downtimes) for the service was monitored by independent sources for the July to December 2012
period.
EUNI 26
26
Fig. 6. Internet bandwidth (in=black, out=grey) consumed by the 3 sciebo sites at Bonn (BN),
Duisburg-Essen (DU) and Münster (MS) on a typical day after one year of operation. Correlated
in/out peaks between two sites in the 12am – 6am timeframe are due to mutual backup copy
operation.
4.5 Additional Findings
Apart from those findings related to our predictions, some additional outcomes are worth mentioning.
The first finding broaches the issue of user activity: 38 percent of the registered users are inactive, i.e. they
have not uploaded any data to sciebo yet. Based on Rogers’ Diffusion Theory (2003), this inactivity of a
substantial user fraction could be interpreted as either a prolonged phase of decision making or as
discontinuance (without having used the service apart from signing up) (Black, 1983; Parthasarathy &
Bhattacherjee, 1998). This finding needs further research.
The second finding focuses on the key collaboration feature of sciebo – sharing data with other sciebo users or
externals (share via hyperlink). With an overall average of 2.4 shares per active user, this feature is not used
very strongly yet. Folders (66.5%) are shared more often than files (33.5%). Approximately 50 percent of all
shares are performed via link (primarily intended for external exchange), contrary to expectations from the
survey (Stieglitz et al., 2014), where 65 percent of the participants intended to share within their university
and only 21 percent intended to share with externals.
EUNI 27
27
5. CONCLUSION
These first results show that the predictions on service adoption and system availability made in the design
phase of the sciebo service do well conform to the reality of one year of operation. Especially the prognoses
on required system platform parameters phrased in the aftermath of the 2013 survey (Stieglitz et al., 2014)
are – up to now – in line with the service’s adoption, and, moreover, Rogers’ diffusion theory (Rogers, 2003)
has proved to be an adequate model. We could identify two factors influencing the speed of diffusion of the
sciebo cloud-service:
1. Share of technophiles in the organization
2. Use of marketing measures
Both findings are supported by the diffusion model. As known from the diffusion literature, an innovation is
more likely to be adopted if it is not too complex and consistent with known products. Consequently,
technophiles who understand a technical innovation much better and usually find it less complex than other
people, will be more likely to adopt an innovation quickly. As noted by some authors, there might be a gap –
in terms of missing peer-to-peer connections – between innovators and early adopters on the one hand and
the early majority on the other hand, because of the significant differences between those groups (Moore,
2014). Marketing measures like direct mailings, Facebook posts, YouTube videos etc. can bridge this gap by
informing the early majority about a new service, and thus speed up the diffusion process. According to our
data, organization size does not influence the diffusion speed.
Finally, the universities’ heterogeneous rate of adoption and the high fraction of inactive users leave a wide
field for further research. In the upcoming months, analyzing the reasons for discontinuance of use will be a
key focus.
6. REFERENCES
Alshamaila, Y., Papagiannidis, S., & Li, F. (2013). Cloud computing adoption by SMEs in the north east of England: A multi-perspective framework. Journal of Enterprise Information Management, 26(3), 250–275.
Black, W. (1983). Discontinuance and Diffusion: Examination of the Post Adoption Decision Process. Advances
in Consumer Research, 10(1).
Cegielski, C. G., Allison Jones-Farmer, L., Wu, Y., & Hazen, B. T. (2012). Adoption of cloud computing technologies in supply chains: An organizational information processing theory approach. The international journal of logistics Management, 23(2), 184–211.
Christensen, C. M. (2011). The innovator's dilemma: The revolutionary book that will change the way you do business. New York, NY: Harper Business.
Dropbox. (2015). Stats. Retrieved from https://www.dropbox.com/
Gupta, P., Seetharaman, A., & Raj, J. R. (2013). The usage and adoption of cloud computing by small and
medium businesses. International Journal of Information Management, 33(5), 861–874.
Ivanova, M., & Ivanov, G. (2010). Cloud computing for authoring process automation. Procedia-Social and
Behavioral Sciences, 2(2), 3646–3651.
Khanagha, S., Volberda, H., Sidhu, J., & Oshri, I. (2013). Management innovation and adoption of emerging
technologies: The case of cloud computing. European Management Review, 10(1), 51– 67.
Kleinaltenkamp, M., & Plinke, W. (1999). Markt- und Produktmanagement: Die Instrumente des technischen Vertriebs. Berlin: Springer.
Lian, J.-W., Yen, D. C., & Wang, Y.-T. (2014). An exploratory study to understand the critical factors affecting the decision to adopt cloud computing in Taiwan hospital. International Journal of Information Management, 34(1), 28–36.
Low, C., Chen, Y., & Wu, M. (2011). Understanding the determinants of cloud computing adoption. Industrial
management & data systems, 111(7), 1006–1023.
Moore, G. A. (2014). Crossing the chasm: Marketing and selling disruptive products to mainstream customers (3. ed.). New York, NY: Harper Business.
Moryson, H., & Moeser, G. (2016). Consumer Adoption of Cloud Computing Services in Germany: Investigation of Moderating Effects by Applying an UTAUT Model. International Journal of Marketing Studies, 8(1), 14.
Oliveira, T., Thomas, M., & Espadanal, M. (2014). Assessing the determinants of cloud computing adoption: An analysis of the manufacturing and services sectors. Information & Management, 51(5), 497–510.
EUNI 28
28
Parthasarathy, M., & Bhattacherjee, A. (1998). Understanding Post-Adoption Behavior in the Context of Online Services. Information Systems Research, 9(4), 362–379. doi:10.1287/isre.9.4.362 Rogers, E. M. (2003). Diffusion of innovations (5th ed.). New York: Free Press.
Shin, J., Jo, M., Lee, J., & Lee, D. (2014). Strategic management of cloud computing services: Focusing on
consumer adoption behavior. Engineering Management, IEEE Transactions on, 61(3), 419–427.
Stieglitz, S., Meske, C., Vogl, R., & Rudolph, D. (2014). Demand for Cloud Services as an Infrastructure in Higher Education. In International Conference on Information Systems (Ed.), ICIS 2014 Proceedings. Retrieved from http://aisel.aisnet.org/icis2014/proceedings/ISCurriculum/20/
Tehrani, S. R., & Shirazi, F. (2014). Factors influencing the adoption of cloud computing by small and medium size enterprises (SMEs). In Human Interface and the Management of Information. Information and Knowledge in Applications and Services (pp. 631–642). Springer.
Trigueros-Preciado, S., Pérez-González, D., & Solana-González, P. (2013). Cloud computing in industrial SMEs: identification of the barriers to its adoption and effects of its application. Electronic Markets, 23(2), 105–114.
Vogl, R., Angenent, H., Bockholt, R., Rudolph, D., Stieglitz, S., & Meske, C. (2013). Designing a Large Scale Cooperative Sync&Share Cloud Storage Platform for the Academic Community in Northrhine-Westfalia. In U. Sukovski (Ed.), ICT Role for Next Generation Universities - 19th European University Information Systems. Riga: Riga Technical University. Retrieved from https://eunis2013-journals.rtu.lv/article/view/eunis.2013.008
AUTHORS’ BIOGRAPHIES
Dominik Rudolph is a research assistant and executive secretary of the Zentrum für
Informationsverarbeitung (the computing center) of the University of Münster (Germany).
He received his Ph.D. from the University of Münster, where he also studied
communication sciences, economics and modern history. His research focusses on the
diffusion of media innovations from the user perspective. Related to the sciebo project
he is responsible for marketing and evaluation of the service.
Raimund Vogl holds a Ph.D. in elementary particle physics from the University of
Innsbruck (Austria). After completing his Ph.D. studies in 1995, he joined Innsbruck
University Hospital as IT manager for medical image data solutions and moved on to be
deputy head of IT. He served as a lecturer in medical informatics at UMIT (Hall, Austria)
and as managing director for a medical image data management software company
(icoserve, Innsbruck) and for a center of excellence in medical informatics (HITT,
Innsbruck). Since 2007 he has been director of the Zentrum für Informationsverarbeitung
(the university computing center) of the University of Münster (Germany). His research
interests focus on management of complex information systems and information
infrastructures.
Holger Angenent has studied physics at the Technical University of Ilmenau and the
University of Münster (Germany). He worked four years as a research assistant at the
institute of Theoretical Physics in Münster. Since 2010 he is a research assistant at the
Zentrum für Informationsverarbeitung (the university computing center) of the University
of Münster and responsible for high performance computing systems and cloud services.
In the sciebo project he is responsible for the technical operations.
EUNI 29
29
Anne Thoring is a research assistant for public relations and marketing at the Zentrum
für Informationsverarbeitung (the computing center) of the University of Münster
(Germany). She graduated from University College London (UK) and the University of
Münster with degrees in communication sciences, publishing and strategic communication.
Her research focuses on strategies and tools of corporate communications.
Andreas Wilmer is a research assistant at the Zentrum für Informationsverarbeitung (the
computing center) of the University of Münster (Germany). He received his Ph.D. from
the University of Münster, where he also studied physics and applied mathemathics.
Since 2014 he is part of the sciebo team where he implements new software tools.
C. Schild is a research assistant at the Zentrum für Informationsverarbeitung (the
university computing center) of the University of Münster (Germany) and responsible for authentication systems. He studied physics at University of Münster. He was a leading member of the JOIN project at the university of Münster which participated in several european cooperative projects (some ipv6 task forces, 6WIN, 6NET) to develop and propagate the IPv6 protocol.
EUNI 30
30
EUNIS 2016: Hybrid clouds infrastructures in Higher Education Institutions – A proof of concept
Pedro Lopes1, Francisco Pereira
2, António Costa
3
1Pedro Lopes, ESTGL-IPV, Lamego, [email protected]
2 António Costa, UTAD, Vila Real, [email protected]
3 Francisco Pereira, UTAD, Vila Real, [email protected]
Keywords
Cloud computing, cloud federation, cloud infrastructure, cloud interoperability, datacentre, academic cloud
federation.
1. Abstract
Taking into account recent developments concerning the cloud computing paradigm, the need for integration
and interaction between datacenters at the level of higher education institutions, in order to meet growing
computing needs, it is relevant to study and apply models of clouds federation to meet these needs. This
article establishes the guidelines for a study which is being developed, that are based on the design of a
model for a federation between higher education institutions. This work is based on the establishment of
guidelines for best practices in the idealization, design and implementation of hybrid clouds federation. This
work is presented as a technical approach to the implementation of an Academic Cloud Federation.
2. Introduction
The need to address the growing demand for computing power drives the need for more and more institutions
to invest in resources for research purposes, and new organizations for management at resources level but
also at the institution organizational level in order to maximise the efficiency (and redundancy) with the
support from platforms in the realm of Cloud Computing. A practical example this is the Conseil Européen
pour la Recherche Nucléaire (CERN), with the implementation of a private cloud based on OpenStack platform,
that in less than two months of implementation created a proof of concept (Bell, 2013).
The CERN need for computing power and need to provide this capability to research teams in different areas
results in a constantly evolving and engagement to the support platforms used (Sverdlik, 2014). CERN is
currently one of the major contributors to the OpenStack community with the release of modules source code
blocks for the platform (Verge, 2014).
Since Cloud Computing is a major research area within several international research organizations, a
definition of guidelines is relevant, following a logical continuity definition of recommendations for best
practices guides following the recommendations of GÉANT that listed a set of standards for the creation of a
federation of hybrid clouds at the level of higher education institutions (GÉANT, 2016).
BonFIRE is a multi-site testbed that supports testing of cloud-based and distributed applications
(Kavoussanakis et al., 2013). In this facility is offer a federated, multi-site cloud testbed for the users as an
homogeneous way to interact with the facility (García-Pérez et al., 2014). This facility is connected to
FEDERICA and GÉANT Auto BAHN (Büchli et al., n.d.; “FEDERICA Project,” n.d.; Hume et al., 2012;
Rabljenovic et al., n.d.). The FED4FIRE project is have the intention to federate bonfire and all similar
facilities used for research and experimentation, facilitating and extending its use for for example research in
smart cities, on the top of BonFIRE and other networks (“Federation for Future Internet Research and
Experimentation,” n.d.)
3. Conception
The essence of hybrid clouds federation model relies on the integration of several private clouds presents in
higher education institutions in order to disclose it as a single cloud with more features and resources. We
present the guidelines for a study which is being developed based on the design of a model for Academic
Cloud Federation and the subsequent implementation. The core of the model is based on the integration of
EUNI 31
31
various private clouds of higher education institutions in order to aggregate private clouds into a single cloud.
One pillar in the model is the intrinsic autonomy attributed each institution, which is very important. The
other pillar is the model supports for different approaches, taking into account the degree of relationship and
integration pursue by each institution. The model gives the possibility of the federation itself or its
constituent clouds, each independently, to be interconnect with strategic partners or public clouds. This
approach opens paths to versatility and flexibility in the federation level of integration. As more institutions
join this federation more resources are likely to be shared as well, providing ground to research in areas such
as quality of service policies, administrative security, management and access control or auditing among
others.
Table 1 shows the classification for each of the interconnected component which make up the model
recommended for this work.
Table 1 - Classification table of the recommended model
Zone Clouds Clouds of various institutions of higher education
External Clouds Clouds external to institutions, public or private
partners
Connections type A Connecting links between zone clouds and external
Clouds
Connections type B Connecting links between the various zone clouds
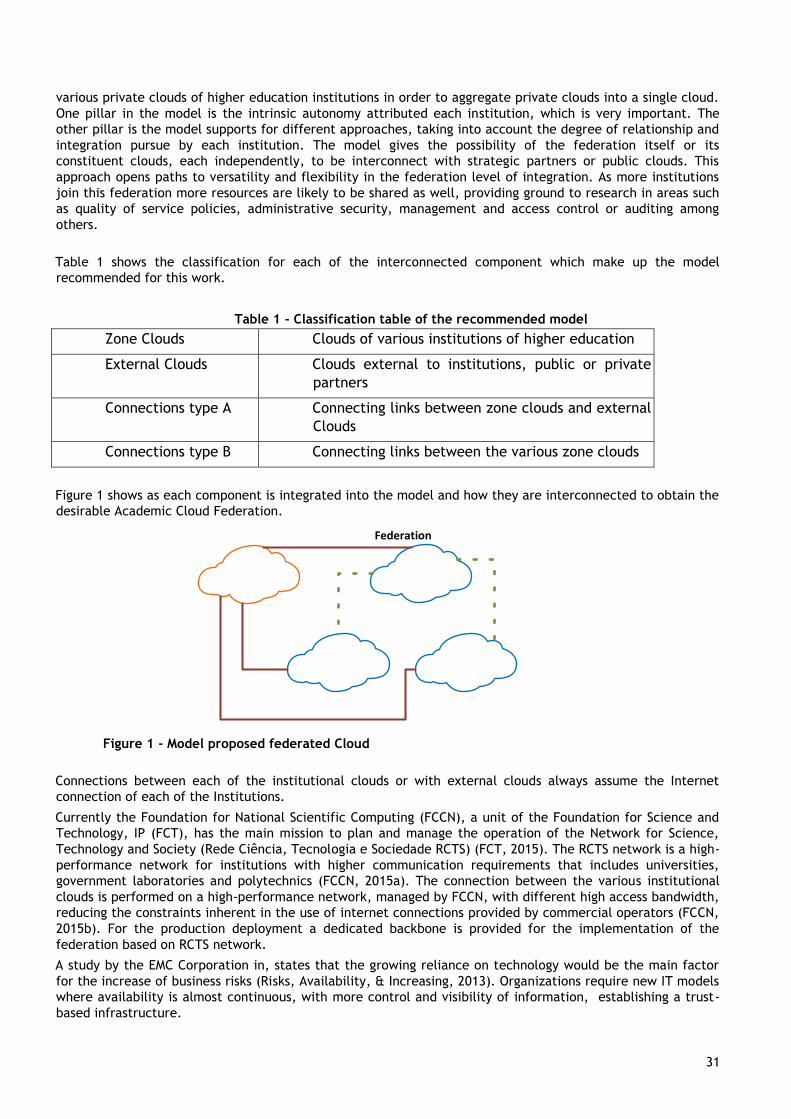
Figure 1 shows as each component is integrated into the model and how they are interconnected to obtain the
desirable Academic Cloud Federation.
Federation
Figure 1 - Model proposed federated Cloud
Connections between each of the institutional clouds or with external clouds always assume the Internet
connection of each of the Institutions.
Currently the Foundation for National Scientific Computing (FCCN), a unit of the Foundation for Science and
Technology, IP (FCT), has the main mission to plan and manage the operation of the Network for Science,
Technology and Society (Rede Ciência, Tecnologia e Sociedade RCTS) (FCT, 2015). The RCTS network is a high-
performance network for institutions with higher communication requirements that includes universities,
government laboratories and polytechnics (FCCN, 2015a). The connection between the various institutional
clouds is performed on a high-performance network, managed by FCCN, with different high access bandwidth,
reducing the constraints inherent in the use of internet connections provided by commercial operators (FCCN,
2015b). For the production deployment a dedicated backbone is provided for the implementation of the
federation based on RCTS network.
A study by the EMC Corporation in, states that the growing reliance on technology would be the main factor
for the increase of business risks (Risks, Availability, & Increasing, 2013). Organizations require new IT models
where availability is almost continuous, with more control and visibility of information, establishing a trust-
based infrastructure.
E
x
EUNI 32
32
Even the National Institute of Standards and Technology (NIST) has released a guide planning and taking
contingency plans for information technologies systems (Swanson et al., 2002). Thus it would be necessary to
draw a plan in which the system continuity would not be affected by any adverse conditions such as technical
failures, dead services, natural disasters (storm or energy interruption for example).
The possibility of using a model for shared resources could allow setting processes, policies and restore critical
system procedures following a catastrophic event in a less arduous task. With shared resources, geographically
separated, the model will add the advantage for increasing fault tolerance and increased availability of
service. The intuitions can think, discuss, analyse, test and implement a global strategy and contingency
measures involving the federated academic cloud, increasing and improving the services already provided by
each institution to its users.
Randles et al. addresses a comparative study for the implementation of a load balancing algorithm for cloud
computing (Randles, Lamb, & Taleb-Bendiab, 2010). This algorithm, coupled with the existence of a
geographically distributed infrastructure, thought, designed and engineered to provide high availability allow
the development of resilience to the Academic Cloud Federation.
4. Conclusions
At this stage of the study we are testing the proof of concept in terms of a federated structure of higher
education institutions. With satisfactory preliminary results but with the awareness of the need for some more
research to mitigate a number of aspects in the form of improvements and manage minor implementation
problems. The model emphasizes the creation of a strong technological base, supporting all the needs of
higher education institutions wherever possible, even at the implementation phase of the Academic Cloud
Federation, providing innovation, support, knowledge and confidence. Networking with other institutions
presents as guarantee for support at critical moments, when faced with the lack of resources within the own
private cloud. This confidence is important for institutions to take their strategic decisions without being
limited to their own internal limitations, allowing to be more versatile in the search for new directions. At the
same time we will need to consider how to control and aggregate information from logs recorded by the
system from different players in the federation. This need arises from the natural shared management of the
federation. After an institution of higher education is integrated into the federation, it will naturally to have
some sort of federation administration access. In this sense it is urgent to draw up a notebook of good
management practices and in parallel, review of knowledge extraction mechanisms from operations’ logs
made by all stakeholders in the system.
5. REFERENCES
Bell, T. (2013). CERN Uses OpenStack. Retrieved February 2, 2016, from
https://www.openstack.org/user-stories/cern/
Büchli, M., Campanella, M., Ivánszky, G., Radoslaw, Krzywania, Peeters, B., … Wilson, D. (n.d.). Deliverable
DJ.3.3.1: GÉANT2 Bandwidth on Demand Framework and General Architecture. Architecture.
FCCN. (2015a). A Rede Ciência, Tecnologia e Sociedade. Retrieved July 12, 2015, from https://www.fccn.pt/pt/rede-academica/a-rede-ciencia-tecnologia-e-sociedadercts/#!/pt/rede-academica/a-rede-ciencia-tecnologia-e-sociedade-rcts/apresentacao/
FCCN. (2015b). Entidades ligadas à Rede Académica. Retrieved August 16, 2015, from
https://www.fccn.pt/pt/rede-academica/entidades-ligadas/
FCT. (2015). Fundação para a Computação Cientifica Nacional. Retrieved July 12, 2015, from
https://www.fccn.pt/pt/a-fccn/
Federation for Future Internet Research and Experimentation. (n.d.). Retrieved January 15, 2016, from
http://www.fed4fire.eu/
FEDERICA Project. (n.d.). Retrieved April 15, 2016, from http://www.fp7-federica.eu/
García-Pérez, D., Lorenzo del Castillo, J. Á., Al-Hazmi, Y., Martrat, J., Kavoussanakis, K., Hume, A. C., …
Margery, D. (2014). Cloud and Network Facilities Federation in BonFIRE. In D. an Mey, M. Alexander, P.
EUNI 33
33
Bientinesi, M. Cannataro, C. Clauss, A. Costan, … J. Weidendorfer (Eds.), (Vol. 8374, pp. 126–135). Berlin,
Heidelberg: Springer Berlin Heidelberg. doi:10.1007/978-3-64254420-0_13
GÉANT. (2016). Campus Best Practice. Retrieved February 2, 2016,
from http://services.geant.net/cbp/Pages/Home.aspx
Hume, A. C., Al-Hazmi, Y., Belter, B., Campowsky, K., Carril, L. M., Carrozzo, G., … Van Seghbroeck, G.
(2012). BonFIRE: A multi-cloud test facility for internet of services experimentation. Lecture
Notes of the Institute for Computer Sciences, Social-Informatics and Telecommunications Engineering,
44 LNICST(January), 81–96. doi:10.1007/978-3-642-35576-9_11
Kavoussanakis, K., Hume, A., Martrat, J., Ragusa, C., Gienger, M., Campowsky, K., … Margery, D. (2013).
BonFIRE: The clouds and services testbed. Proceedings of the International Conference on Cloud
Computing Technology and Science, CloudCom, 2(257386), 321–326. doi:10.1109/CloudCom.2013.156
Rabljenovic, V., Ivanszky, G., Muyal, S., Camisard, E., Büchli, M., Krzywania, R., … Robles, E. (n.d.).
Deliverable DJ.3.2.1: GÉANT2 Bandwidth on Demand ( BoD ) User and Application Survey, 3.
Retrieved from http://geant2.archive.geant.net/upload/pdf/GN2-05-208v7_DJ3-3-
1_GEANT2_Initial_Bandwidth_on_Demand_Framework_and_Architecture.pdf
Randles, M., Lamb, D., & Taleb-Bendiab, A. (2010). A comparative study into distributed load balancing
algorithms for cloud computing. 24th IEEE International Conference on Advanced Information
Networking and Applications Workshops, WAINA 2010, 551–556. doi:10.1109/WAINA.2010.85
Risks, T., Availability, T., & Increasing, A. (2013). How Organizations Are Improving Business Resiliency With
Continuous IT Availability, (February), 1–8.
Sverdlik, Y. (2014). CERN’s OpenStack Cloud to Reach 150,000 Cores by 2015. Retrieved February 2, 2016,
from http://www.datacenterknowledge.com/archives/2014/11/07/cerns-openstackcloud-to-reach-
150000-cores-by-2015/
Swanson, M., Wohl, A., Pope, L., Grance, T., Hash, J., & Thomas, R. (2002). Contingency Planning Guide for
Information Technology Systems. Nist Special Publication, 800(34). Retrieved from
http://oai.dtic.mil/oai/oai?verb=getRecord&metadataPrefix=html&identifier=ADA40 4260
Verge, J. (2014). CERN Contributes Identity Federation Code to OpenStack. Retrieved February 2, 2016, from
http://www.datacenterknowledge.com/archives/2014/06/30/rackspace-cloud-usercern-contributes-
code-to-openstack/
6. AUTHORS’ BIOGRAPHIES
Pedro Lopes is in the final research stage to complete the PhD in Computer Sciences in Universidade de Trás-
os-Montes and Alto Douro (UTAD). He is System and Network Administrator in Instituto Superior Politécnico de
Viseu (IPV), and invited teacher in IPV. He is a Microsoft Certified Professional with MCP, MCSA and MCSA
Messaging.
Francisco Pereira is an Assistant Professor at Universidade de Trás-os-Montes lecturing, working e researching
in the fields of Operating Systems, Computer Networks and Cloud Computing. He as also publish in the fields
of Hardware Architecture, Parallel Computing and Computer Graphics.
António Costa is ICT specialist at the University of Trás-os- Montes and Alto Douro ( UTAD ) and is
responsible for the coordination the areas of core infrastructure and communications, computer security areas,
data center, VoIP and communications networks. He collaborates in teaching on different degrees of
Computer Courses, as well as in research, extension and development projects. Holds a degree in Electrical
Engineering (specialization in Electronics, Instrumentation and Computation) and a post-graduate degree in
engineering area. Currently, he is in the final research stage to complete the PhD in Computer Sciences. He
made several made courses or specializations which includes the Upper Course Director for Public
Administration; Diploma of specialization of the Information Society for Public Administration, SIP
Masterclasses and a OpenStack specialization.
EUNI 34
34
SIGMA Cloud An Open Academic and Research Environment
Juan José Fuentes[1], Jordi Cuní[2]
[1] SIGMA AIE
[2] SIGMA AIE
Keywords
SIGMA, cloud, SaaS, Opennebula
1. ABSTRACT
SIGMA, as many other entities had to face the situation of a datacenter full of servers, a high power
consumption, heat diffusion… the migration of the CPD to a Virtual Datacenter was a matter of
time, and the time came as so many servers required a large workforce to manage, a large amount
of power to fed the servers and to cool the rooms, even the servers were sometimes underused and
squandered.
SIGMA as a non-profit organization and a consortium of public Universities has a policy of support
and foster open source organizations, and whenever possible implement open source over
commercial solutions.
Looking for the solution that best fitted our needs was a hard work, primary due to the many
projects that exists over the Internet, some solutions analyzed were Openstack, Proxmox and
Opennebula, being the latter the chosen one.
That was our first step into the open cloud world.
2. SIGMA GESTION UNIVERSITARIA CONSORTIUM
SIGMA Gestion Universitaria [1] is a nonprofit consortium established in 1996 by a
group of 8 top level Spanish Public Universities to provide technological solutions to their needs for
managing academics, learning, research and organization processes. SIGMA represents 20% of the
students in the Spanish university system. The consortium’s objective has evolved towards the
continuous technological modernization of university management through the development of IT
solutions aimed at automating the administrative processes and, as a result, guaranteeing their
effectiveness.
Technology and innovation are the backbone of the services and solutions provided, based on a
highly open source development and deployment platform for J2EE5 certified application servers
compliant on a multi-tier and high performance proven open architecture. Internationalization is
also one of SIGMA’s top priorities. For years, SIGMA has established relationships with other
European universitity consortiums. Lately, SIGMA has open new strategic areas of interest such as
SaaS, BI, eLearning and Mobile.
3. Introduction to Open Cloud
There are a lot of projects about cloud management, each one with its own strengths and
weaknesses, the first task we faced was to define the main features we need and centered the
search on the projects that best could fit those requirements. So to delimit the scope of the
project we centered the decision over 3 projects, Openstack[2], Proxmox[3] and Opennebula[4].
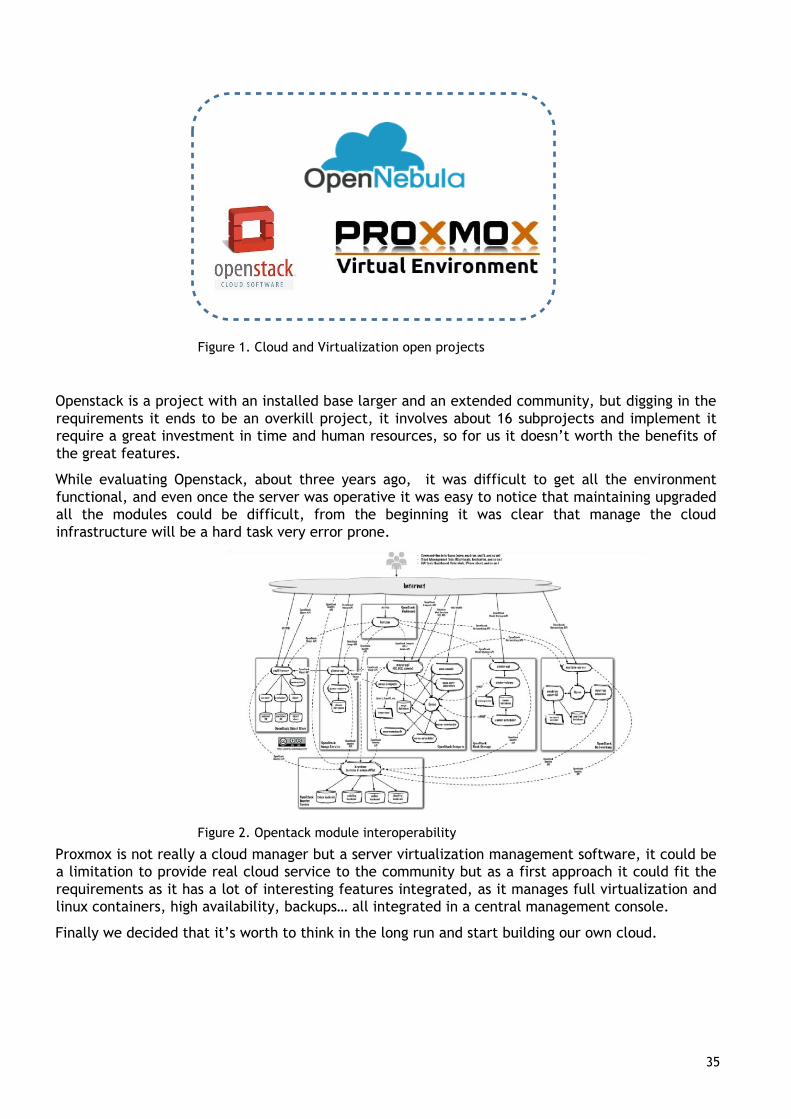
EUNI 35
35
Figure 1. Cloud and Virtualization open projects
Openstack is a project with an installed base larger and an extended community, but digging in the
requirements it ends to be an overkill project, it involves about 16 subprojects and implement it
require a great investment in time and human resources, so for us it doesn’t worth the benefits of
the great features.
While evaluating Openstack, about three years ago, it was difficult to get all the environment
functional, and even once the server was operative it was easy to notice that maintaining upgraded
all the modules could be difficult, from the beginning it was clear that manage the cloud
infrastructure will be a hard task very error prone.
Figure 2. Opentack module interoperability
Proxmox is not really a cloud manager but a server virtualization management software, it could be
a limitation to provide real cloud service to the community but as a first approach it could fit the
requirements as it has a lot of interesting features integrated, as it manages full virtualization and
linux containers, high availability, backups… all integrated in a central management console.
Finally we decided that it’s worth to think in the long run and start building our own cloud.
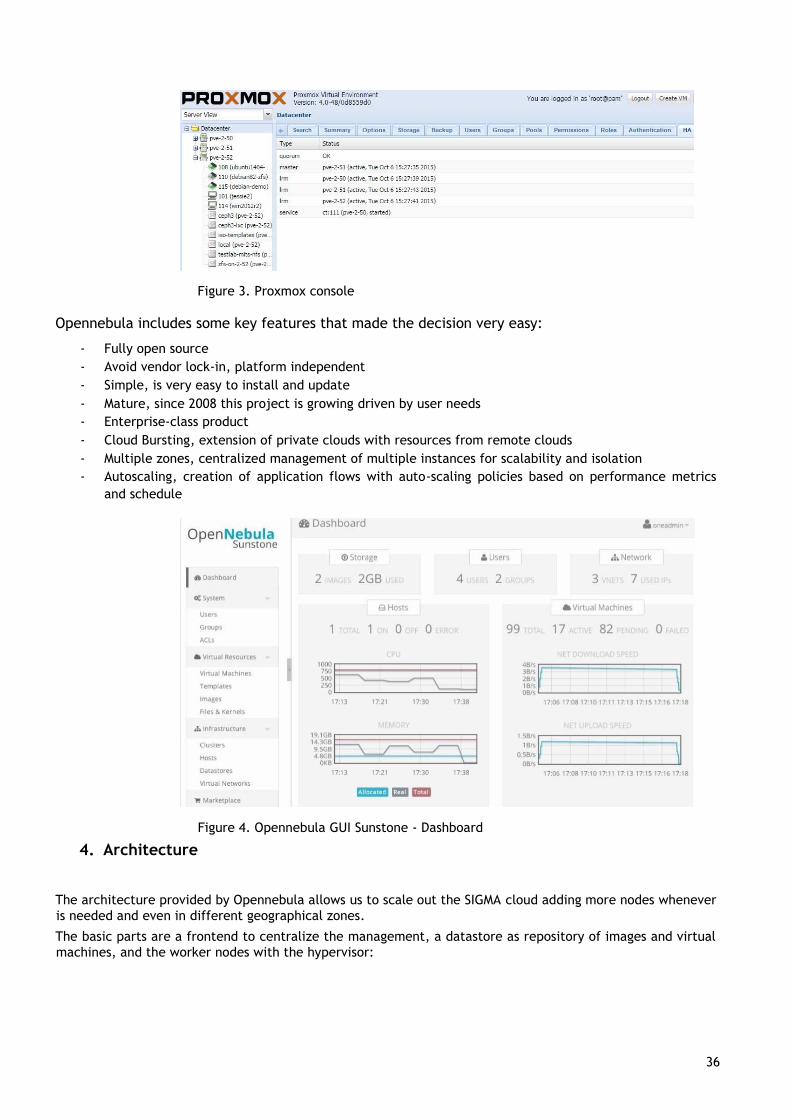
EUNI 36
36
Figure 3. Proxmox console
Opennebula includes some key features that made the decision very easy:
- Fully open source
- Avoid vendor lock-in, platform independent
- Simple, is very easy to install and update
- Mature, since 2008 this project is growing driven by user needs
- Enterprise-class product
- Cloud Bursting, extension of private clouds with resources from remote clouds
- Multiple zones, centralized management of multiple instances for scalability and isolation
- Autoscaling, creation of application flows with auto-scaling policies based on performance metrics
and schedule
Figure 4. Opennebula GUI Sunstone - Dashboard
4. Architecture
The architecture provided by Opennebula allows us to scale out the SIGMA cloud adding more nodes whenever
is needed and even in different geographical zones.
The basic parts are a frontend to centralize the management, a datastore as repository of images and virtual
machines, and the worker nodes with the hypervisor:
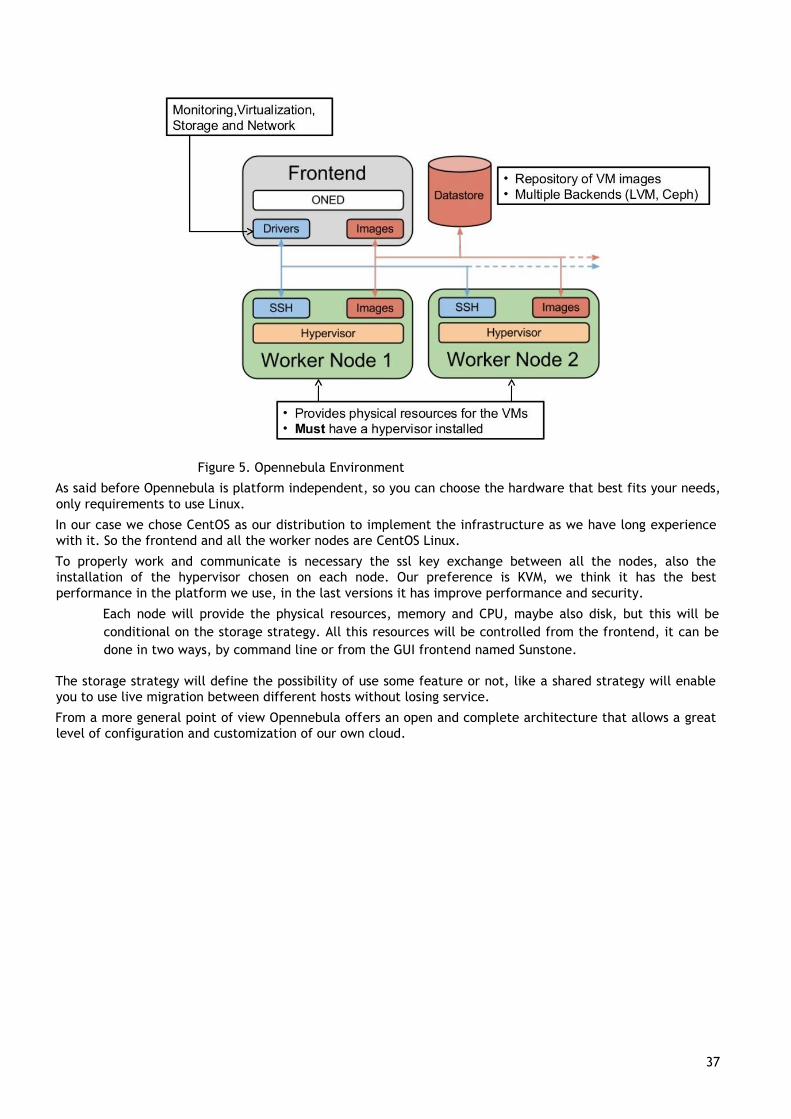
EUNI 37
37
Figure 5. Opennebula Environment
As said before Opennebula is platform independent, so you can choose the hardware that best fits your needs,
only requirements to use Linux.
In our case we chose CentOS as our distribution to implement the infrastructure as we have long experience
with it. So the frontend and all the worker nodes are CentOS Linux.
To properly work and communicate is necessary the ssl key exchange between all the nodes, also the
installation of the hypervisor chosen on each node. Our preference is KVM, we think it has the best
performance in the platform we use, in the last versions it has improve performance and security.
Each node will provide the physical resources, memory and CPU, maybe also disk, but this will be
conditional on the storage strategy. All this resources will be controlled from the frontend, it can be
done in two ways, by command line or from the GUI frontend named Sunstone.
The storage strategy will define the possibility of use some feature or not, like a shared strategy will enable
you to use live migration between different hosts without losing service.
From a more general point of view Opennebula offers an open and complete architecture that allows a great
level of configuration and customization of our own cloud.
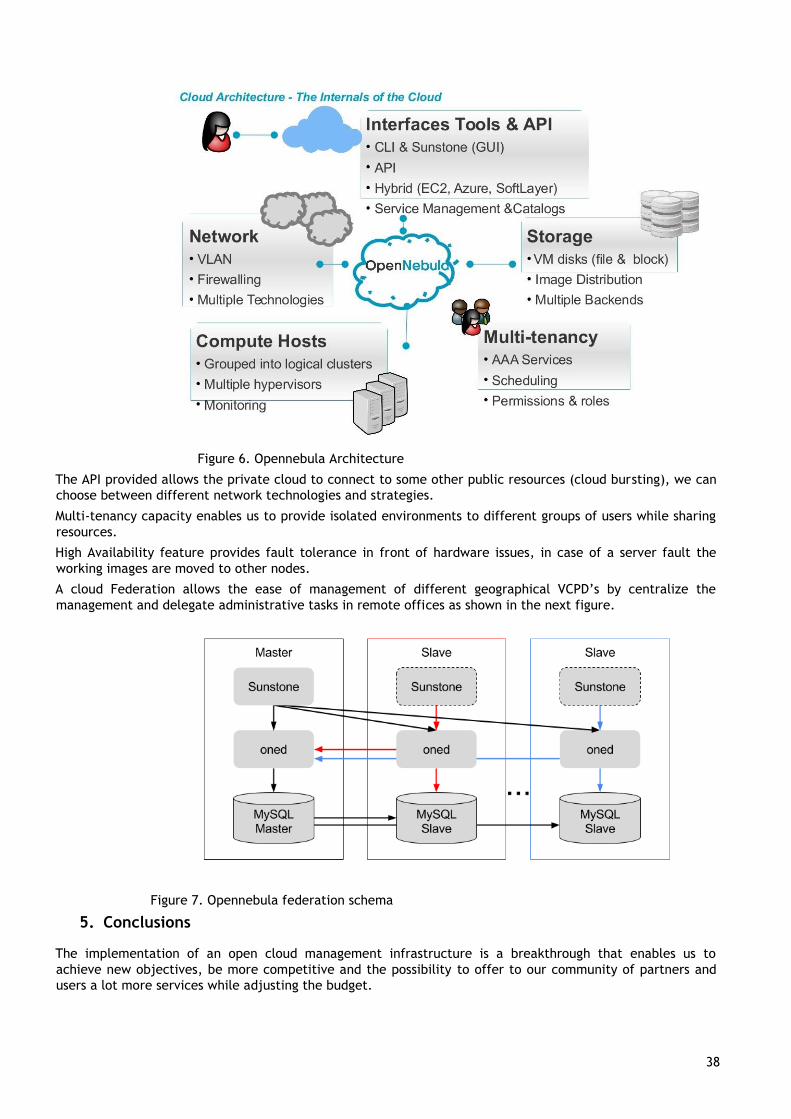
EUNI 38
38
Figure 6. Opennebula Architecture
The API provided allows the private cloud to connect to some other public resources (cloud bursting), we can
choose between different network technologies and strategies.
Multi-tenancy capacity enables us to provide isolated environments to different groups of users while sharing
resources.
High Availability feature provides fault tolerance in front of hardware issues, in case of a server fault the
working images are moved to other nodes.
A cloud Federation allows the ease of management of different geographical VCPD’s by centralize the
management and delegate administrative tasks in remote offices as shown in the next figure.
Figure 7. Opennebula federation schema
5. Conclusions
The implementation of an open cloud management infrastructure is a breakthrough that enables us to
achieve new objectives, be more competitive and the possibility to offer to our community of partners and
users a lot more services while adjusting the budget.
EUNI 39
39
As our business grow we try to use high quality standards and follow international best practices, in this
scenario building our own cloud was the more logical scenario to step into.
As many other institutions the great number of possibilities available in the current cloud landscape
represents a challenge for us, is easy to take a bad choice, so we try to manage by evaluating, comparing and
participating in the cloud community as much as we can.
Using Opennebula has helped us to build our own private cloud in a way that we were able to learn quick,
implement fast a basic cloud infrastructure, which we’re evolving and expanding, and keeping the budget.
In the next years we’ve planned to deploy an infrastructure over different geographical locations to expand
the SIGMA Cloud ONE thanks to the base we have yet built and taking advantage of the numerous resources
and key features we have available.
6. REFERENCES
[1] SIGMA Helping Universities Succeed http://www.gestionuniversitariasigma.com/
[2] Openstack http://www.openstack.org
[3] Proxmox http://www.proxmox.com
[4] Opennebula http://www.opennebula.org
AUTHORS’ BIOGRAPHIES
Juan Jose Fuentes
IT Manager
Postgraduate in Corporative Networks Design (2005)
CISM (Certified Information Security Manager) 2015
Technical Computer and Software Engineer at Universitat Aut noma de Barcelona (1998 2001). He works for
SIGMA since 2001, currently leading the Middleware & Systems area. His role covers a wide range of activities
from designing strategy plans for backups, recovery, monitoring and storage to defining and carrying out the
design of the CPD provisioning. He maintains and upgrades the backend resources of SIGMA. He gives advice
to the company customers in their hardware infrastructures. He took part in the strategic migrations projects
such as database migration (Ingres to Oracle), and middleware migrations ( Iplanet–Glassfish– Weblogic).
In the lasts year his main effort has been focused on achieving a multi-tenant solution in order to minimize
the maintenance cost of the SaaS service that SIGMA delivers to their customers.
He is currently focused on building the SIGMA Higher Education SaaS in a cloud environment.
Jordi Cuní
He was born in 1976 in Barcelona Spain. Computer Science degree at Universitat Oberta de Catalunya (2006 –
2012), Computer and Software Engineer at Universitat Aut noma de Barcelona (1997 – 2000).
He works for SIGMA since 2000, being the current Manager of Architecture Area and Software quality
assurance Area. He leads a development team counting on 7 people for those areas.
His role focuses mainly on maintenance and develop the own Sigma framework in order to increase the
productivity, define the methodology among the different areas and establish the software development tools
for the rest of the company. At last but not least his area takes part on technical and performance support
for our customers and helps them in the migration projects of their back-end resources. Previously, he had
been project management for developing SIGMA’s area for 5 years. His main efforts was focused on develop
software solutions on resource planning necessities, stock management of static and mobile resources and
physical and on-line surveys.
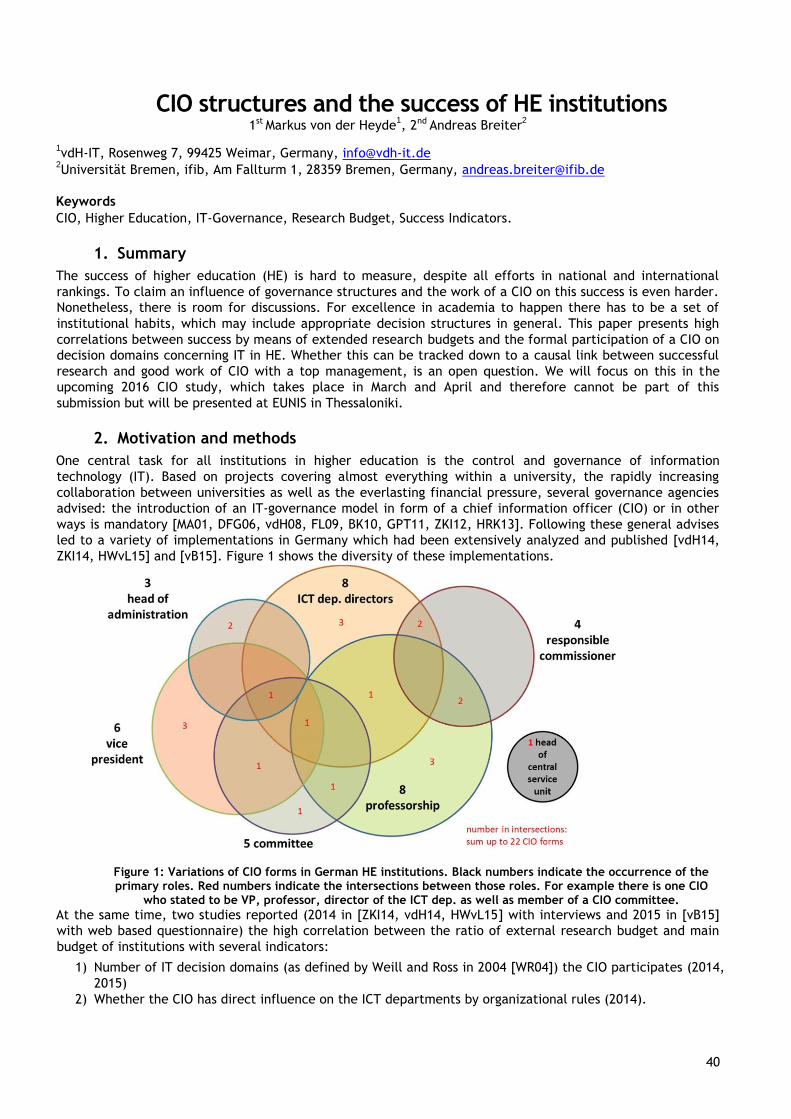
EUNI 40
40
CIO structures and the success of HE institutions 1st Markus von der Heyde
1, 2nd Andreas Breiter
2
1vdH-IT, Rosenweg 7, 99425 Weimar, Germany, [email protected]
2Universität Bremen, ifib, Am Fallturm 1, 28359 Bremen, Germany, [email protected]
Keywords
CIO, Higher Education, IT-Governance, Research Budget, Success Indicators.
1. Summary
The success of higher education (HE) is hard to measure, despite all efforts in national and international
rankings. To claim an influence of governance structures and the work of a CIO on this success is even harder.
Nonetheless, there is room for discussions. For excellence in academia to happen there has to be a set of
institutional habits, which may include appropriate decision structures in general. This paper presents high
correlations between success by means of extended research budgets and the formal participation of a CIO on
decision domains concerning IT in HE. Whether this can be tracked down to a causal link between successful
research and good work of CIO with a top management, is an open question. We will focus on this in the
upcoming 2016 CIO study, which takes place in March and April and therefore cannot be part of this
submission but will be presented at EUNIS in Thessaloniki.
2. Motivation and methods
One central task for all institutions in higher education is the control and governance of information
technology (IT). Based on projects covering almost everything within a university, the rapidly increasing
collaboration between universities as well as the everlasting financial pressure, several governance agencies
advised: the introduction of an IT-governance model in form of a chief information officer (CIO) or in other
ways is mandatory [MA01, DFG06, vdH08, FL09, BK10, GPT11, ZKI12, HRK13]. Following these general advises
led to a variety of implementations in Germany which had been extensively analyzed and published [vdH14,
ZKI14, HWvL15] and [vB15]. Figure 1 shows the diversity of these implementations.
Figure 1: Variations of CIO forms in German HE institutions. Black numbers indicate the occurrence of the primary roles. Red numbers indicate the intersections between those roles. For example there is one CIO
who stated to be VP, professor, director of the ICT dep. as well as member of a CIO committee. At the same time, two studies reported (2014 in [ZKI14, vdH14, HWvL15] with interviews and 2015 in [vB15]
with web based questionnaire) the high correlation between the ratio of external research budget and main
budget of institutions with several indicators:
1) Number of IT decision domains (as defined by Weill and Ross in 2004 [WR04]) the CIO participates (2014,
2015)
2) Whether the CIO has direct influence on the ICT departments by organizational rules (2014).
EUNI 41
41
3) Participation on the decision on the overall ICT infrastructure (2015).
4) Transparency of IT personal across the institution (2014)
5) The amount of time a CIO spends on actual strategic work and projects (2014).
6) An established HPC service structure (2015).
7) The absolute amount of research budget (2014, 2015).
Apart from many other statistically evaluated indicators, these line up in a certain direction: They all aim at
the power of a CIO with respect to the overall decisions on IT. Those CIOs which are limited to verbal power
alone seem not as successful with applications on external research funds.
3. Causal links
In the interviews (2014), many CIOs emphasized their role in moderation, coordination and general
responsibility for the overall strategic use of IT. Most CIOs also argued for participation on the board of
directors. Those CIOs who have a permanent guest or member status in the rectorate or on executive boards
emphasized the current value. Those who rely on the contact to a certain member from those councils
hypothesized a high value of direct participation.
Three major impacts can be identified: 1) Being part of these councils obviously guarantees early access to
valuable information. 2) IT also can provide additional information on value and service being connected to
new initiatives. 3) The overall value of IT can be shaped and identified much more effectively by the joint
perspectives on the alignment of IT and business.
To gain these advantages, it seems necessary to open up decision processes. Institutions stay behind:
- when transparency for personal budgets is limited,
- when there is only one joint position of operative ICT directors and CIOs,
- when all decision powers for IT stay on the level of the board of directors,
- when there is no delegation of decision competencies to the IT expert (CIO), and
- when there is limited flexibility on the access to joint resources (e.g. HPC services and others).
Up to now, not one single indicator alone but all indicators in a joint approach point in the same direction.
The focus on the 2016 study will therefore include more questions to shed light onto this causal link between
decisions and success of higher education.
4. Future perspective
Since the actual causal link remains open, and we cannot test in real life the differences between institutions.
The 2016 study will additionally focus on:
• Personality of the CIO: Degree of innovation; ability to decide; focus on success and some other factors
from psychological frameworks [Ai02].
• Context of the institution: Ability to adopt quickly; flexibility of structures; degree of innovation; focus
on governance and strategy and other key indicators from organizational frameworks [ISO08, WR09].
• Application of IT management frameworks: IT maturity rankings, quality of IT services, perceived
degree of security and user experiences and other factors from international IT standards may also be
correlated to the success and value of IT [BF11].
The correlation of those factors will hopefully help us to learn more about the causal link as well as about the
efficiency of the CIOs work within his/her institutional context.
The pure measurement of success indicated by research funds also needs to be extended towards student
success and abundance rates. But these factors had been a puzzle for more than half a century for the applied
research in Germany and around the world [Sc15].
5. References
[Ai02] Axiometrics International (2002). Validity Studies Of The Hartman Profile Model. Retrieved February 27,
2016, from: http://www.axiometrics.net/AiValidityReport.pdf
[BK10] Bröcker, W., König, F. (2010). Informationsverarbeitung an Hochschulen – Organisation, Dienste und
Systeme. Empfehlungen der Kommission für IT-Infrastruktur für 2011–2015. Deutsche Forschungsgemeinschaft
2010. Retrieved February 27, 2016, from http://www.dfg.de/download/
pdf/foerderung/programme/wgi/empfehlungen_kfr_2011_2015.pdf

EUNI 42
42
[BF11] Breiter, A., Fischer, A. (2011). Implementierung von IT Service Management in der öffentlichen
Verwaltung. Nationale und internationale Fallstudien und deren vergleichende Analyse. Berlin: Springer.
[FL09] Fernández, A. M., Llorens, F. L. (2009). An IT-Governance framework for universities in Spain. In:
Proceedings of the EUNIS 2009 Conference: June 23rd to 26th 2009, University of Santiago de Compostela,
2009. ISBN 978-84-9887-138-8. Retrieved February 27, 2016, from:
http://www.gti4u.es/pdf/an_it_governance_framework_for_universities_in_spain.pdf
[GPT11] Görl, S., Puhl, J., Thaller, M. (2011). Empfehlungen für die weitere Entwicklung der
Wissenschaftlichen Informationsversorgung des Landes NRW. ISBN: 978‐3‐8442‐0694‐4, Köln, 2011
[HRK13] HRK Website (2013). Entschließung der 13. Mitgliederversammlung der HRK am 20. November 2012 in
Göttingen: Hochschule im digitalen Zeitalter: Informationskompetenz neu begreifen - Prozesse anders steuern.
Published in Beiträge zur Hochschulpolitik 1/2013. Retrieved
February 27, 2016, from http://www.hrk.de/fileadmin/redaktion/hrk/02-Dokumente/02-
10Publikationsdatenbank/Beitr-2013-01_Informationskompetenz.pdf
[HWvL15] H Hotzel, M Wimmer, M von der Heyde, U Lang (2016). IT-Governance – role of a CIO in German
Universities – a Survey by ZKI. In PIK-Praxis der Informationsverarbeitung und Kommunikation 38 (3-4), 121-
126, also available as PDF by deGruyter.com
[ISO08] ISO/IEC 38500:2008 “Corporate Governance of Information Technology”, ISO/IEC. 2008, from:
www.iso.org
[MA01] Mönkediek, J., Arends, P. (2001). Informationsverarbeitung an Hochschulen – Organisation, Dienste
und Systeme. Empfehlungen der Kommission für Rechenanlagen für 2001–2005. Deutsche
Forschungsgemeinschaft 2001. Retrieved February 27, 2016, from http://www.dfg.de/download/
pdf/foerderung/programme/wgi/wgi_kfr_empf.pdf
[Sc15] Schulmeister, R. (2015). Abwesenheit von Lehrveranstaltungen Ein nur scheinbar triviales Problem. Eine
Meta-Studie von 300 empirischen Arbeiten. Hamburg. Retrieved February 27, 2016, from
http://rolf.schulmeister.com/pdfs/Abwesenheit.pdf
[vdH08] von der Heyde, M., Hotzel, H., Olbrich, S., Stenzel, H., Weckmann, H.-D., Wimmer, M. (2008).
Strukturkonzepte für die Informations-und Kommunikationsversorgung von Hochschulen. In PIK-Praxis der
Informationsverarbeitung und Kommunikation 32 (3), 167-173.
[vdH14] von der Heyde, M. (2014). CIO-Modelle an deutschen Hochschulen - Netzwerk der entscheidenden
Faktoren. Informatik 2014. In Lecture Notes in Informatics (LNI) 232, 1815-1823.
[vB15] von der Heyde, M., Breiter, A. (2015). Wer entscheidet? IT-Governance an Hochschulen. Informatik
2015, in Lecture Notes in Informatics (LNI), in print.
[WR04] Weill, P., Ross, J. W. (2004). IT Governance: How Top Performers Manage IT Decision Rights for
Superior Results. Harvard Business School Press. Boston 2004. ISBN 978-1591392538
[WR09] Weill, P., Ross, J. W. (2009). IT Savy - what non-IT executives should know to make IT pay off.
Harvard Business School Press, Boston.
[ZKI12] ZKI Website (2012). Treiben oder getrieben werden? - IT-Strategie in Hochschulen. Abschlussbericht
des IT-Strategieforums. ZKI. Retrieved February 27, 2016, from
http://www.zki.de/fileadmin/zki/Arbeitskreise/IT-SF/webdav/web-public/Publikation/
EndredaktionPapier_120130-final.pdf
[ZKI14] ZKI Website (2014). CIOs und IT-Governance an deutschen Hochschulen“. ZKI. Retrieved
February 27, 2016, from http://www.zki.de/fileadmin/zki/Publikationen/ZKI_CIO-Studie_final.pdf
6. Author’s biographies
Dr. Markus von der Heyde received his PhD in Computer Sciences from the University of
Bielefeld for his work at the Max Planck Institute for Biological Cybernetics Tübingen in
2000. His approach is to adopt biological principles into distributed computer
applications in order to enhance stability and robustness.
Since 2004 he has worked within ZKI on topics as information security,
servicemanagement, strategy and governance. Until 2011 he was ICT director of Bauhaus-
University in Weimar. Until today he also focuses on internationalization and supports ZKI,
GI, EUNIS and EDUCAUSE and serves as program committee member as well as a proposal
reviewer for conferences and the scientific community. In cooperation with various
partners he continues to

EUNI 43
43
conduct the German CIO studies. Today, he is management consultant specialized on IT topics in higher
education.
See further details on https://de.linkedin.com/in/mvdh42
Prof. Dr. Andreas Breiter is Professor for Information Management and Education
Technologies at the University of Bremen and Scientific Director of the Institute for
Information Management Bremen GmbH (ifib). His main areas of expertise are IT-
Management, IT Service Management and IT-Controlling, Information Management in
Education, E-Learning-platforms as well as Mediatization. He also chair of working group
3.7 (IT in Educational Management) of the International Federation of Information
Processing (IFIP), member of the Association for Computing Machinery (ACM) and also
member of the Gesellschaft für Medizinische Datenverarbeitung und Statistik (GMDS).
See further details on https://www.linkedin.com/in/andreas-breiter-a0b0711
EUNI 44
44
Re-Engineering Working Culture - How an ICT Project Promotes a University Towards Its Strategic Goals
Lotta Linko, Ari Kuusio
Lotta Linko, Online Communications Manager, Häme University of Applied Sciences, P.O. Box 230, FIN-13101
Hämeenlinna, [email protected]
Dr Ari Kuusio, Chief Information Officer, Häme University of Applied Sciences, P.O. Box 230, FIN13101
Hämeenlinna, [email protected]
Keywords
strategy, change, social intranet, cloud services, Office 365, Yammer, agile development, project, ework,
digitalisation, collaboration, communication
1. Summary
This case study discusses how HAMK, Häme University of Applied Sciences, has successfully promoted its
strategic goals by taking a new approach to an “ICT project”. We have introduced Office 356 within the whole
organisation, and at the same time systematically launched a change in the way of working and the culture of
thinking. An ICT project has, in addition to gradually changing the everyday actions and applications, grown
into a more profound movement around attitudes towards knowledge, collaboration, and communication.
The value of this case lies in showing how information and communication technology and a well managed
project can play a major part in changing processes. The key is in seeing ICT as more than a set of
technologies: strategically lead, it is tool for rethinking our processes and making them serve our purposes in
the changing demands. In our case, the project works at three levels: tools, methods, and culture.
We will describe our change from the strategic leadership and the tactical ICT management points of view,
and give an overview to the actions at operational level. We will also list the reasons to this project being
different from previous ICT projects.
2. EXTENDED ABSTRACT
The Finnish education system, including regulation and funding, is facing major changes as part of the
happenings taking place in the Finnish society. At the same time the state of the economy, the turmoil of the
world of work and the rapid development of technologies pose demands for Universities’ curricula, processes,
and efficiency. HAMK has been faced with new requirements and has acted by bringing changes into its
strategy and management system, as well as the ways and services of studying, teaching, and working.
HAMK’s aim as a publically-funded organisation is to act productively, cost-efficiently, and responsibly to the
benefit of its stakeholders. One key element to success is digitalisation and collaboration.
The technology used at HAMK was reaching the end of its life phase and also hindered us from changing our
working habits and attitudes. Combined with these no-longer-suitable solutions, we had heterogeneous
working methods and unsufficient staff competences as a challenge.
HAMK’s new strategy and new management were the starting point for the change. The demand to
differentiate from competition in terms of brand and processes, as well as to meet new customer
expectations (future millennial students) lead to bold decisions. One of them was advancing digitalisation.
The technology change project - from Oracle Portal and separate tools for communication and cooperation to
Office 365 platform - included the levels of working habit and communication culture changes.
As the project was aiming at new ways of working, it was carried out in new way, too. The desire for quick
results lead to choosing agile methodology as the way to proceed instead of the traditional waterfall approach.
In accordance with agile principles, the project was carried out in phases and demand-based releases instead
of detailed descriptions of the finalised future entity.
EUNI 45
45
This was the first large-scale agile project carried out at HAMK and it also served as a pilot for future
development tactics. Forming future actions into a project ensured documented goals and sufficient resources,
and picking change-minded developers and experts from several different units as project participants
guaranteed that more than technical or technological viewpoints were taken into account while planning
development and delivering quickly-employable results.
The project was a good pilot in testing a new development approach: it taught the participants new and
valuable working skills at the same time enabling cross-boundary team-building. The project also pioneered in
implementing full-scale cloud services enabling easy e-working, collaboration and communication – this was a
major leap in both technology and ideology for an ‘old-school’ organisation. We have come to realise that the
agile development principles and methods applied within the project must be applied among this and other
projects. The project has thus given ideas to the new way of HAMK project portfolio management which is
underway.
The O365 cloud service in itself forces us to continue to being proactive and carry on development in our
working tools and habits. A complex system and changing environment calls for continuously seeking best
practices and applications in different work roles. Choosing cloud also made us think of data and information
security issues at new level.
The project was a kick-off for a process change: the advancement is no longer carried out as a project but as
a natural part of people developing their own work as individuals, teams, units, and all of HAMK. During the
project, continuous but comprehensible changes were brought into the everyday work: this paved the way to
the change mindset in people which is seen as a fact of the future. The project also invited to looking at and
changing the ways of working: different processes have been scrutinised, and in some cases we have been
able to make chains leaner.
As a result of the project, the working culture and habits have changed: after one year of use we can clearly
see more openness, more collaboration and more communication, which are elements of the strategic goals of
digitalisation and collaboration. The changes, however, are not extensive nor final: a lot of work remains to
be done in an organisation with 600 employees and 6000 students – with a service which is constantly evolving
and changing by nature. From the organisation ICT point of view, we no longer deliver the same perfect set of
tools for all users but provide optimal options for different user groups and individual users with their own
devices. Choosing cloud is choosing change, and we have to adapt our services and service capability
accordingly, and constantly.
3. AUTHORS’ BIOGRAPHIES
Biography: Lotta Linko
Education:
Master of Arts, University of Tampere, Finland. Major: English Translation, minors: Finnish language
and literature. 1993.
Professional Development further education programme, Tecnichal University (currently Aalto
University), Espoo, Finland. 2002.
Work experience:
Manager of Online Communications, Häme University of Applied Sciences. 2003-present.
Communications Officer, Tikkurila Oy (chemical industry). 1998-2003.
Marketing Communications Specialist, Tellabs Oy (telecommunications industry). 1995-1998.
Document Controller, Martis Oy (acquired by Tellabs). 1993-1995.
Memberships:
The Finnish Association of Technical Journalists
The Finnish Association of Science Editors and Journalists
EUNI 46
46
LinkedIn: http://www.linkedin.com/in/lottalinko
Biography: Ari Kuusio
Education:
Master of Science (Economics), University of Jyväskylä, Finland. Major: Information technology. 2004.
Licentiate of Science (Economics), University of Jyväskylä. 2009.
Scientific degrees:
Doctor of Philosophy (Business Economics), University of Jyväskylä. 2012.
Work experience:
Chief Information Officer, Häme University of Applied Sciences. 2007-present.
System Manager, TeliaSonera Oy (telecommunications industry). 1999-2007. Planner, Finnish
Tax Administration. 1989-1999.
LinkedIn:
https://fi.linkedin.com/in/ari-kuusio-95868622
EUNI 47
47
EUNIS 2016: IT strategy for a public university – why, what, when and how?
Soren Berglund
CIO
Umea University
Sweden
Keywords
IT strategy, cloud, IT organization, ROI, CIO
Introduction
This paper discusses the challenges of establishing an IT strategy for a public institution in Higher Education.
As a CIO, you are expected to have an IT strategy for your institution. This is a task that may be done with
some regularity, say each 3rd year. Does an IT strategy works that way? Should it be more frequent regarding
the rapid changes within ITC? Or should it be the other way around, let the IT strategy be a moving target and
go into a never-ending transformation. This paper addresses the challenges with an institutional IT strategy:
Why? What? When? How?
Why should you invest in an IT strategy?
Good question! Who cares? Does it help you? Is it worth the endeavor? Yes, it must be worth it, otherwise
don´t. It should be your work goals and work plan and your foundation for internal and external acceptance of
where you are going with your institutions ITC. You need to have a strategy, and it can be defined, exposed
and used in many ways. Without a plan, you are lost !
What is an IT strategy?
Good point! Does it look like a thick book? Is it a sheet of paper? Is it a video? Is it statements with a price tag
or is it a storytelling piece of art? Is it in your head, not explicitly shown to anyone? A good strategy is like
good rhetoric, it explains what you want to do and why, and it addresses the obvious critique that always
exists within our institutions. Is there a difference in being a public university versus another organizational
form? In this central section, I´ll go through areas that need to be managed in an IT strategy.
When to release an IT strategy?
Good thinking! Timing is everything. When is the right time to present a shift in motion? I´ll walk through
some institutional indicators that can trigger a move or change with current IT strategy. This includes shift in
institutional business strategy, changes in central management and changes in the financing model,
technology shift and organizational changes.
EUNI 48
48
How to implement an IT strategy?
Good planning! An IT-strategy that is not implemented is worthless and may represent a lot of effort put into
nothing. It is important to understand the managerial culture of your institution and how to deal with
acceptance and resistance. Should you go all-in and risk your position or wait for collegial support? Know your
supporters and your opposition.
----------------------------
The author is CIO for Umeå university since 2009. He has a degree in Computer Science and Business,
University of Umeå, 1978. After university studies, employed as System Analyst and Designer for business
information systems. Returned to Umeå university for doctoral studies and teaching in Informatics with special
focus in System Design and System Development. He has been a Project
Manager for several national projects. He has been Head of the Ladok Division at the University of Umea, a
large unit specialized in system development and maintenance. He has been a board member of EUNIS and
worked as an expert for the European Commission. Current EUNIS publications includes:
Berglund, S and Wallmark, M (2015) Moving a decentralized University to the Cloud. The 21st European
University Information Systems Organisation (EUNIS) congress, EUNIS 2015. Dundee, 10-12 June, 2015.
Berglund, S (2015) Procurment of Cloud Services. The 21st European University Information Systems
Organisation (EUNIS) congress, EUNIS 2015. Dundee, 10-12 June, 2015.
Berglund, S (2013) Always connected, the Umea university campus and city network approach. The 18th
European University Information Systems Organisation (EUNIS) congress, EUNIS 2013. Riga, 12-14 June, 2013.
Berglund, S (2011) Yes, I am a student. Give me a discount! The 17th European University Information Systems
Organisation (EUNIS) congress, EUNIS 2011. Dublin 15-17 June, 2011.
Lind, M and Berglund, S (2008), e-Me - the Student’s Best Friend. The 14th European University
Information Systems Organisation (EUNIS) congress, EUNIS 2008 VISION IT - Visions for IT in Higher Education,
University of Aarhus Universitet, Denmark (voted conference best paper)
EUNI 49
49
A secure infrastructure for mobile blended learning applications
EUNIS 2016 Best Paper Award winner
M. Politze1, S. Schaffert2, B. Decker3
1IT Center RWTH Aachen University, Seffenter Weg 23, 52074 Aachen, [email protected] 2IT Center RWTH Aachen University, Seffenter Weg 23, 52074 Aachen, [email protected] 3IT Center RWTH Aachen University, Seffenter Weg 23, 52074 Aachen, [email protected]
Keywords
mobile, blended learning, infrastructure, oauth2, caching, SOA
1. ABSTRACT
New trends like The Internet of Things, Wearables and BYOD pose new challenges to existing IT infrastructure
and applications. Especially the increasing amount and heterogeneity of devices demands changes on existing
IT systems. Further degrees of automation are required to successfully operate existing IT infrastructure and
applications. Many students try to individualize the existing services using own software. These changes in
student behavior have led us to the creation of an infrastructure designed for secure mobile access. After
three years of operation this infrastructure has evolved to deliver far more than only access to legacy systems
and is now supporting several blended learning scenarios and other university processes.
2. MOTIVATION
Due to increased mobility and the rising number of students the universities have to standardize existing
processes, improve cooperation between institutions, reduce overall costs or increase efficiency. Also the
students have changed the demands on their universities and its employees. Previously various processes that
are supported by IT infrastructure and applications were introduced to serve this purpose. Not only are IT
infrastructure and applications becoming more important to the universities’ processes and employees but
also the students and their daily life. This leads to increased competition among the universities to present
the best and most appealing services to their students.
The Horizon Report is one of the most regarded studies concerning the development of education. In the 2015
report (The New Media Consortium 2015 – The NMC Horizon Report, 2015) the upcoming major developments
in the higher education sector are identified as follows:
• Less than a year:
o Bring Your Own Device (BYOD)
o Flipped Classroom
• Two to three years:
o Makerspaces
o Wearable Technology
• Four to five years
o Adaptive Learning Technologies
o The Internet of Things
Both, these developments and the organizational challenges need to be faced by the universities IT
infrastructure and applications in the near future to remain operational and meet the expectations of
governments, employees and students.

EUNI 50
50
The technical challenges of increasing device heterogeneity and count is accompanied by an increasing urge
of individualization. Especially students from technical fields seek to customize, improve and extend the
existing means for their personal scenario. Leaving the individualization of certain IT applications to the users
themselves may reduce efforts when developing the applications in first place but also needs defined
processes, guidelines and interfaces that allow controlled access to the needed data in a machine readable
way for every student.
3. GOALS
To better cope with the latest development and fast changing requirements, increased mobility and higher
degree of personalization Service Oriented Architectures (SOA) are widely used. However due to the broad
fields of application of SOA during the past years a multitude of incompatible standards, formats and
architectures have been developed and are now part of virtually any application framework. While choosing
the right SOA is a critical step for the short term success it is most important to build a comprehensive and
consistent model of the data exchanged between the systems. To generate this common model several
processes at the university need to be analyzed in how they use the available data.
In any software system if it is a SOA or a more traditional monolithic architecture a central asset of the
collected data is reliability. While in a monolithic environment reliability of the data may be controlled
centrally in a SOA other assertions have to be provided. In terms of data security there are three key concepts:
confidentiality, integrity and availability. As the SOA will participate in a multitude of processes these need
to be strictly enforced by the architecture (security by design).
Further security and reliability needs like authenticity, non-repudiation, accountability or anonymity should
also be included into the design of the architecture.
According to the need for reliability and security of the owners and curators of the data, the protection of
personal data needs to be enforced. By extending processes and sharing data across system boundaries, data
will be accumulated to datasets and may become available to a broader audience. Especially for personal
data the general right of personality needs to be protected.
4. CURRENT ARCHITECTURE
Generally the infrastructure was designed to combine different existing source systems already used by the
students and university staff for E-Learning, Campus Management, Identity Management and other purposes
(Politze & Decker, 2014). Data preparation and data consolidation between these systems and attached apps
is done utilizing existing standards: REST, SAML and OAuth2. The data is then rendered on the smart device
using client technologies like the Cordova Framework.
Figure 1 Schema of the Proxy service accessing legacy systems.
The infrastructure designed for RWTHApp consists of two main services shown in Figure 1: (1) The Proxy
service forms the central component to make data from legacy systems accessible from smart devices in a
secure and consistent fashion. (2) The authorization service (OAuth2) that handles the consent of the users to
access their data in the legacy systems.
From an architectural point of view the Proxy service is primarily intended to deliver data to smart and
mobile devices. Nevertheless some more traditional web applications are also already taking advantage of the
centralized implementation of the services. Even though the Proxy Service centralizes the access to legacy
systems it is built using some of the paradigms introduced by micro services: primary the independence of
functional units to access the independent legacy systems.
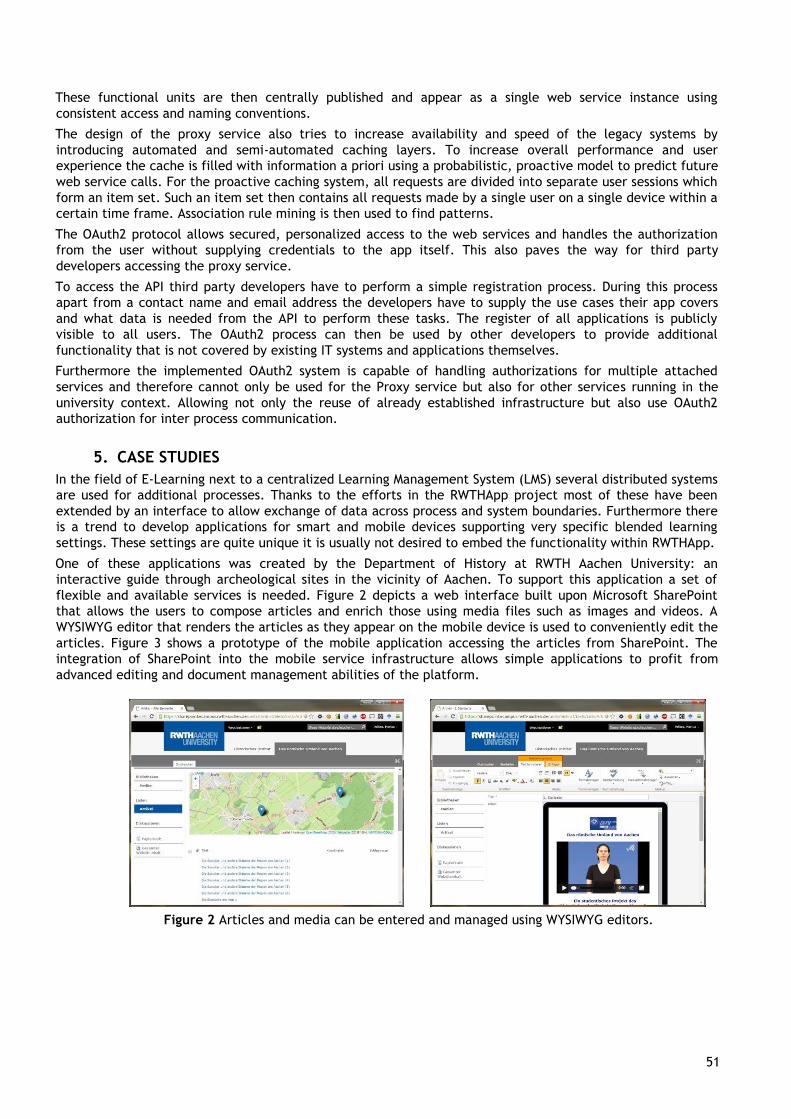
EUNI 51
51
These functional units are then centrally published and appear as a single web service instance using
consistent access and naming conventions.
The design of the proxy service also tries to increase availability and speed of the legacy systems by
introducing automated and semi-automated caching layers. To increase overall performance and user
experience the cache is filled with information a priori using a probabilistic, proactive model to predict future
web service calls. For the proactive caching system, all requests are divided into separate user sessions which
form an item set. Such an item set then contains all requests made by a single user on a single device within a
certain time frame. Association rule mining is then used to find patterns.
The OAuth2 protocol allows secured, personalized access to the web services and handles the authorization
from the user without supplying credentials to the app itself. This also paves the way for third party
developers accessing the proxy service.
To access the API third party developers have to perform a simple registration process. During this process
apart from a contact name and email address the developers have to supply the use cases their app covers
and what data is needed from the API to perform these tasks. The register of all applications is publicly
visible to all users. The OAuth2 process can then be used by other developers to provide additional
functionality that is not covered by existing IT systems and applications themselves.
Furthermore the implemented OAuth2 system is capable of handling authorizations for multiple attached
services and therefore cannot only be used for the Proxy service but also for other services running in the
university context. Allowing not only the reuse of already established infrastructure but also use OAuth2
authorization for inter process communication.
5. CASE STUDIES
In the field of E-Learning next to a centralized Learning Management System (LMS) several distributed systems
are used for additional processes. Thanks to the efforts in the RWTHApp project most of these have been
extended by an interface to allow exchange of data across process and system boundaries. Furthermore there
is a trend to develop applications for smart and mobile devices supporting very specific blended learning
settings. These settings are quite unique it is usually not desired to embed the functionality within RWTHApp.
One of these applications was created by the Department of History at RWTH Aachen University: an
interactive guide through archeological sites in the vicinity of Aachen. To support this application a set of
flexible and available services is needed. Figure 2 depicts a web interface built upon Microsoft SharePoint
that allows the users to compose articles and enrich those using media files such as images and videos. A
WYSIWYG editor that renders the articles as they appear on the mobile device is used to conveniently edit the
articles. Figure 3 shows a prototype of the mobile application accessing the articles from SharePoint. The
integration of SharePoint into the mobile service infrastructure allows simple applications to profit from
advanced editing and document management abilities of the platform.
Figure 2 Articles and media can be entered and managed using WYSIWYG editors.
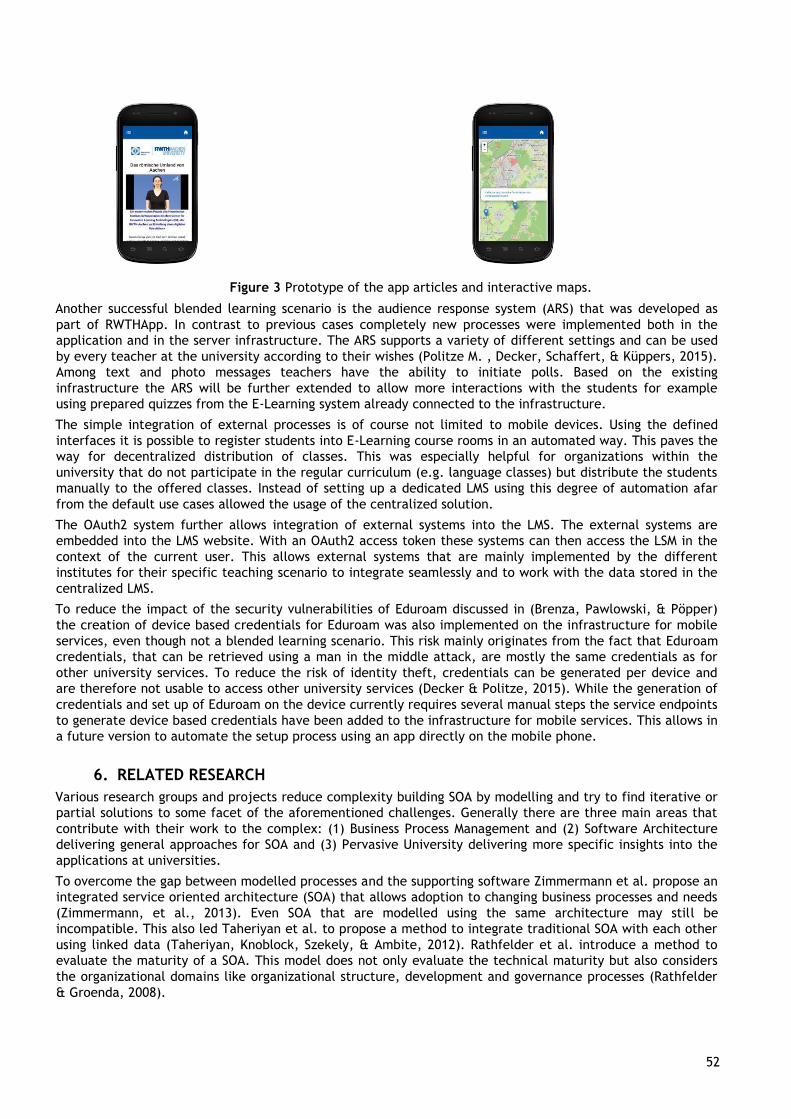
EUNI 52
52
Figure 3 Prototype of the app articles and interactive maps.
Another successful blended learning scenario is the audience response system (ARS) that was developed as
part of RWTHApp. In contrast to previous cases completely new processes were implemented both in the
application and in the server infrastructure. The ARS supports a variety of different settings and can be used
by every teacher at the university according to their wishes (Politze M. , Decker, Schaffert, & Küppers, 2015).
Among text and photo messages teachers have the ability to initiate polls. Based on the existing
infrastructure the ARS will be further extended to allow more interactions with the students for example
using prepared quizzes from the E-Learning system already connected to the infrastructure.
The simple integration of external processes is of course not limited to mobile devices. Using the defined
interfaces it is possible to register students into E-Learning course rooms in an automated way. This paves the
way for decentralized distribution of classes. This was especially helpful for organizations within the
university that do not participate in the regular curriculum (e.g. language classes) but distribute the students
manually to the offered classes. Instead of setting up a dedicated LMS using this degree of automation afar
from the default use cases allowed the usage of the centralized solution.
The OAuth2 system further allows integration of external systems into the LMS. The external systems are
embedded into the LMS website. With an OAuth2 access token these systems can then access the LSM in the
context of the current user. This allows external systems that are mainly implemented by the different
institutes for their specific teaching scenario to integrate seamlessly and to work with the data stored in the
centralized LMS.
To reduce the impact of the security vulnerabilities of Eduroam discussed in (Brenza, Pawlowski, & Pöpper)
the creation of device based credentials for Eduroam was also implemented on the infrastructure for mobile
services, even though not a blended learning scenario. This risk mainly originates from the fact that Eduroam
credentials, that can be retrieved using a man in the middle attack, are mostly the same credentials as for
other university services. To reduce the risk of identity theft, credentials can be generated per device and
are therefore not usable to access other university services (Decker & Politze, 2015). While the generation of
credentials and set up of Eduroam on the device currently requires several manual steps the service endpoints
to generate device based credentials have been added to the infrastructure for mobile services. This allows in
a future version to automate the setup process using an app directly on the mobile phone.
6. RELATED RESEARCH
Various research groups and projects reduce complexity building SOA by modelling and try to find iterative or
partial solutions to some facet of the aforementioned challenges. Generally there are three main areas that
contribute with their work to the complex: (1) Business Process Management and (2) Software Architecture
delivering general approaches for SOA and (3) Pervasive University delivering more specific insights into the
applications at universities.
To overcome the gap between modelled processes and the supporting software Zimmermann et al. propose an
integrated service oriented architecture (SOA) that allows adoption to changing business processes and needs
(Zimmermann, et al., 2013). Even SOA that are modelled using the same architecture may still be
incompatible. This also led Taheriyan et al. to propose a method to integrate traditional SOA with each other
using linked data (Taheriyan, Knoblock, Szekely, & Ambite, 2012). Rathfelder et al. introduce a method to
evaluate the maturity of a SOA. This model does not only evaluate the technical maturity but also considers
the organizational domains like organizational structure, development and governance processes (Rathfelder
& Groenda, 2008).
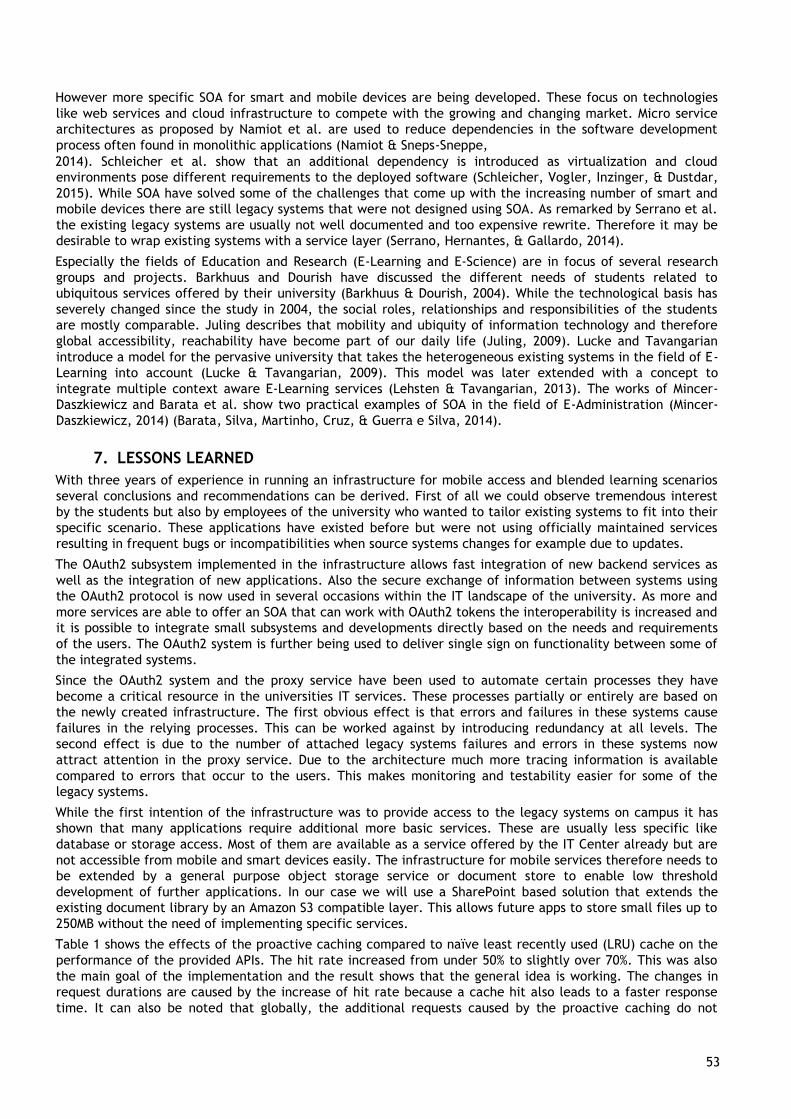
EUNI 53
53
However more specific SOA for smart and mobile devices are being developed. These focus on technologies
like web services and cloud infrastructure to compete with the growing and changing market. Micro service
architectures as proposed by Namiot et al. are used to reduce dependencies in the software development
process often found in monolithic applications (Namiot & Sneps-Sneppe,
2014). Schleicher et al. show that an additional dependency is introduced as virtualization and cloud
environments pose different requirements to the deployed software (Schleicher, Vogler, Inzinger, & Dustdar,
2015). While SOA have solved some of the challenges that come up with the increasing number of smart and
mobile devices there are still legacy systems that were not designed using SOA. As remarked by Serrano et al.
the existing legacy systems are usually not well documented and too expensive rewrite. Therefore it may be
desirable to wrap existing systems with a service layer (Serrano, Hernantes, & Gallardo, 2014).
Especially the fields of Education and Research (E-Learning and E-Science) are in focus of several research
groups and projects. Barkhuus and Dourish have discussed the different needs of students related to
ubiquitous services offered by their university (Barkhuus & Dourish, 2004). While the technological basis has
severely changed since the study in 2004, the social roles, relationships and responsibilities of the students
are mostly comparable. Juling describes that mobility and ubiquity of information technology and therefore
global accessibility, reachability have become part of our daily life (Juling, 2009). Lucke and Tavangarian
introduce a model for the pervasive university that takes the heterogeneous existing systems in the field of E-
Learning into account (Lucke & Tavangarian, 2009). This model was later extended with a concept to
integrate multiple context aware E-Learning services (Lehsten & Tavangarian, 2013). The works of Mincer-
Daszkiewicz and Barata et al. show two practical examples of SOA in the field of E-Administration (Mincer-
Daszkiewicz, 2014) (Barata, Silva, Martinho, Cruz, & Guerra e Silva, 2014).
7. LESSONS LEARNED
With three years of experience in running an infrastructure for mobile access and blended learning scenarios
several conclusions and recommendations can be derived. First of all we could observe tremendous interest
by the students but also by employees of the university who wanted to tailor existing systems to fit into their
specific scenario. These applications have existed before but were not using officially maintained services
resulting in frequent bugs or incompatibilities when source systems changes for example due to updates.
The OAuth2 subsystem implemented in the infrastructure allows fast integration of new backend services as
well as the integration of new applications. Also the secure exchange of information between systems using
the OAuth2 protocol is now used in several occasions within the IT landscape of the university. As more and
more services are able to offer an SOA that can work with OAuth2 tokens the interoperability is increased and
it is possible to integrate small subsystems and developments directly based on the needs and requirements
of the users. The OAuth2 system is further being used to deliver single sign on functionality between some of
the integrated systems.
Since the OAuth2 system and the proxy service have been used to automate certain processes they have
become a critical resource in the universities IT services. These processes partially or entirely are based on
the newly created infrastructure. The first obvious effect is that errors and failures in these systems cause
failures in the relying processes. This can be worked against by introducing redundancy at all levels. The
second effect is due to the number of attached legacy systems failures and errors in these systems now
attract attention in the proxy service. Due to the architecture much more tracing information is available
compared to errors that occur to the users. This makes monitoring and testability easier for some of the
legacy systems.
While the first intention of the infrastructure was to provide access to the legacy systems on campus it has
shown that many applications require additional more basic services. These are usually less specific like
database or storage access. Most of them are available as a service offered by the IT Center already but are
not accessible from mobile and smart devices easily. The infrastructure for mobile services therefore needs to
be extended by a general purpose object storage service or document store to enable low threshold
development of further applications. In our case we will use a SharePoint based solution that extends the
existing document library by an Amazon S3 compatible layer. This allows future apps to store small files up to
250MB without the need of implementing specific services.
Table 1 shows the effects of the proactive caching compared to naïve least recently used (LRU) cache on the
performance of the provided APIs. The hit rate increased from under 50% to slightly over 70%. This was also
the main goal of the implementation and the result shows that the general idea is working. The changes in
request durations are caused by the increase of hit rate because a cache hit also leads to a faster response
time. It can also be noted that globally, the additional requests caused by the proactive caching do not
EUNI 54
54
decrease the performance for the end user, as the average request duration is lower than without proactive
caching. The change in dirty read percentage is small enough that it could be insignificant.
Table 1 Effect of proactive caching to overall performance
LRU-Cache Proactive-Cache
Hit rate 48.32% 70.89%
Avg. duration 1557ms 1004ms
Requests <700ms 81.03% 87.63%
Dirty reads 2.27% 2.29%
Using the presented infrastructure we are now able to serve 40,000 installations of RWTHApp on 6 different
operating systems. During this semester we were also able to serve over 50 courses with our blended learning
services in the app. The infrastructure also serves 96 applications from external developers (mostly students)
with about 30,000 users that use the provided APIs for more specialized scenarios. Currently 10,000 devices
are already connected using device based Eduroam credentials.
Last but not least we were able to observe a speedup in developing new applications on top of the defined
services. While it was certainly an investment to build this interface in our current projects we can see that
due to better standardization and clear access guidelines the development of all new applications on top of
the service layer gets easier, more understandable and more maintainable.
8. FUTURE CHALLENGES
Compared to the structures in E-Learning there is currently no widely used centralized system supporting E-
Science processes. However at the university there is an initiative to set up an integrated Research Data
Management (RDM) system within the next years. Since the actual implementation of the system is not yet
finished the capabilities of the system can yet be influenced to support the efforts towards a more complete
university programmable interface. Apart from the integrated system several institutes and organizations
have set up their own RDM systems and usually offer only very restricted access to the contained data.
As in the case of E-Learning there are several ideas for applications for smart and mobile devices in E-
Science. Again these are usually very specific to certain institutes or organizations and their processes. While
most of these applications originate from the local context they often reach out to other organizational
processes in the field of E-Administration (e.g. employment status).
RWTHApp will continue to support more processes of the students’ daily routines. This functionality can be
extended in such a way that students no longer need to actively query the app for information but RWTHApp
suggests the most relevant information for the students. This behavior poses additional challenges to the
infrastructure as queries to the information systems in the cooperate context are no longer based on the
interaction with the users but may be collected automatically.
The device based generation of Eduroam can be published further to be used by students of other universities.
This lifts the current implementation from the local to the federative context. Findings from this case study
will provide more input of how the infrastructure scales across these contexts.
To evaluate the current case studies a formal definition of the requirements posed on the infrastructure is
needed. Based on the current state and related research, these requirements will further disambiguated and
show how to measure if the infrastructure fulfils the current and future requirements. To support the
continual improvement process the findings of the definition will then be applied to the set of case studies.
The Ultimate goal is to develop a programmable interface for every process of the university. However due to
the massive amount and complexity of processes, contributing systems and stakeholders a full implementation
is questionable. The presented infrastructure should provide a solid basis for future implementations and
adoptions of processes within the university. To verify the resulting goodpractice infrastructure it will then be
used as a basis for future case studies that are implemented in the university context.
9. REFERENCES
Barata, R., Silva, S., Martinho, D., Cruz, L., & Guerra e Silva, L. (2014). Open APIs in Information Systems for
Higher Education. In 20th EUNIS Congress. Umea.
EUNI 55
55
Barkhuus, L., & Dourish, P. (2004). Everyday Encounters with Context-Aware Computing in a Campus
Environment. In D. Hutchison, T. Kanade, J. Kittler, J. M. Kleinberg, F. Mattern, J. C. Mitchell, . . . I.
Siio, UbiComp 2004: Ubiquitous Computing (Vol. 3205, pp. 232–249). Berlin, Heidelberg: Springer
Berlin Heidelberg.
Brenza, S., Pawlowski, A., & Pöpper, C. (n.d.). A practical investigation of identity theft vulnerabilities in
Eduroam.
Decker, B., & Politze, M. (2015). Authentifizierungs- und Autorisierungsschnittstelle für (mobile) Geräte als
Komponente des RWTH-IdMs. Heidelberg.
Juling, W. (2009). Vom Rechnernetz zu e-Science. PIK - Praxis der Informationsverarbeitung und
Kommunikation, 32(1).
Lehsten, P., & Tavangarian, D. (2013). CASA-Ein Konzept zur nutzergetriebenen, kontextbasierten
Dienstintegration in Lehr-und Lernumgebungen.
Lucke, U., & Tavangarian, D. (2009). Eine Service-und Kontext-basierte Infrastruktur für die Pervasive
University.
Mincer-Daszkiewicz, J. (2014). We Publish, You Subscribe — Hubbub as a Natural. In 20th EUNIS Congress.
Umea.
Namiot, D., & Sneps-Sneppe, M. (2014). On Micro-services Architecture.
Politze, M., & Decker, B. (2014). RWTHApp: from a requirements analysis to a service orieanted architecture
for secure mobile access to personalized data. 20th EUNIS Congress. Umea.
Politze, M., Decker, B., Schaffert, S., & Küppers, B. (2015). Facilitating Teacher-Student Communication and
Interaction in Large-Scale Lectures With Smartphones and RWTHApp. In L. Gómez Chova, A. López
Martínez, & I. Candel Torres, EDULEARN 15 (pp. 4820–4828). Barcelona: IATED Academy.
Rathfelder, C., & Groenda, H. (2008). iSOAMM: An Independent SOA Maturity Model. In R. Meier, & S.
Terzis, Distributed Applications and Interoperable Systems (Vol. 5053, pp. 1–15). Berlin, Heidelberg:
Springer Berlin Heidelberg.
Schleicher, J. M., Vogler, M., Inzinger, C., & Dustdar, S. (2015). Smart Fabric - An InfrastructureAgnostic
Artifact Topology Deployment Framework.
Serrano, N., Hernantes, J., & Gallardo, G. (2014). Service-Oriented Architecture and Legacy Systems. IEEE
Software, 31(5), pp. 15–19.
Taheriyan, M., Knoblock, C. A., Szekely, P., & Ambite, J. L. (2012). Rapidly Integrating Services into the
Linked Data Cloud. In D. Hutchison, T. Kanade, J. Kittler, J. M. Kleinberg, F. Mattern, J.
C. Mitchell, . . . E. Blomqvist, The Semantic Web – ISWC 2012 (Vol. 7649, pp. 559–574). Berlin,
Heidelberg: Springer Berlin Heidelberg.
The NMC Horizon Report: 2015 Higher Education Edition. (2015). Austin, Texas.
Zimmermann, A., Sandkuhl, K., Pretz, M., Falkenthal, M., Jugel, D., & Wissotzki, M. (2013). Towards an
integrated service-oriented reference enterprise architecture. In P. Knauber, J. Knodel, & M. F. Lungu.
AUTHORS’ BIOGRAPHIES
Marius Politze, M.Sc. is research assistant at the IT Center RWTH Aachen University since
2012. His research is focused on service oriented architectures supporting university
processes. He received his M.Sc. cum laude in Artificial Intelligence from Maastricht
University in 2012. In 2011 he finished his B.Sc. studies in Scientific Programming at FH
Aachen University of Applied Sciences. From 2008 until 2011 he worked at IT Center as a
software developer and later as a teacher for scripting and programming languages.
EUNI 56
56
Steffen Schaffert, B.Sc. is a master student at Maastricht University in Artificial
Intelligence. He finished his Bachelor's degree in Scientific Programming at FH Aachen
University of Applied Sciences in 2013. Since 2010, he works as a software developer at
the IT Center RWTH Aachen University.
Dipl.-Inform. Bernd Decker is deputy team lead of the IT process support team at IT
Center RWTH Aachen University since 2011. From 2006 to 2009 he worked at IT Center
as Software Developer and since 2009 as lead of the development group. His work is
focused on IT solutions for processes in the field of E-Learning, E-Services and campus
management systems.
EUNI 57
57
Deploying an University App Store with Open Innovation
Jaime Busquets 1, Miguel Macías
2, Raúl Mengod
3, Juan Evangelista4 and Carlos Turro5
1 ASIC-Universitat Politécnica de València, Camino de Vera 46021 Valencia, [email protected].
2 ASIC-Universitat Politécnica de València, Camino de Vera 46021 Valencia, [email protected].
3 ASIC-Universitat Politécnica de València, Camino de Vera 46021 Valencia, [email protected].
4 ASIC-Universitat Politécnica de València, Camino de Vera 46021 Valencia, [email protected].
5 ASIC-Universitat Politécnica de València, Camino de Vera 46021 Valencia, [email protected].
Keywords
App, Store, Open Innovation
1. Summary
The usual practice of universities when deploying corporate apps for mobile devices is to have it in the
official stores of the most common systems and grow it by the addition of services like a corporate webpage.
This behavior fails in the sense that don’t address both the ways that mobile user consume services and also
because calls for a centralized IT service managing all the web app.
The Open Innovation paradigm allows involving internal and external users in the definition and creation of
services. The new Strategic Plan for 2015-2020 of the UPV states the "Open Innovation" paradigm as a
strategic project for that period. The vision of that strategic project is to develop a methodology of
innovative projects that can help a radical improvement of the organization. As a first action, UPV has a pilot
project in order to implement a corporate mobile ecosystem, including a corporate App Store and develop
applications through a development framework that offer users agile alternatives to perform common
functions.
Benefits of this project are increased service, improving the user experience, and also security and
confidence that are and inherent risk in traditional stores. UPV App Store is presented to the users in mid-
March 2016 containing a dozen downloadable applications.
2. INTRODUCTION
Universitat Politècnica de València (UPV) is a Spanish University with a long history in applying IT technologies
to all parts of the learning process and also to University’s management services. This path has led to
developments like Polimedia (Turro et al. 2010), and also the flipped Classroom experience (Busquets et al,
2015) which have been presented in EUNIS and other conferences. The new Strategic Plan for 2015-2020 of
the UPV states the "Open Innovation" paradigm as a strategic project for that period. The vision of that
strategic project is to develop a methodology of innovative projects that can help a radical improvement of
the organization.
As a first action, UPV has a pilot project in order to implement a corporate mobile ecosystem, including a
corporate app store and develop applications through a development framework that offer users agile
alternatives to perform common functions. Desirable characteristics of both the portal and the resulting apps
is that they are attractive, cross-platform, simple, safe, task oriented, easily configurable, scalable,
evolvable and usable.
The document goes as follows: First we will review Open innovation paradigm and its implementation at UPV.
Then we will show the case of Corporate Apps deployment and the Ecosystem that UPV has built around it.
Finally we will show the current results of the project and the conclusions of it.
3. OPEN INNOVATION AT UPV
Open innovation (Chesbrough 2006) is a paradigm that assumes that companies can and should use external
ideas as well as internal ideas, and internal and external paths to market, as the company look to advance
their technology. According to some authors like Marcet (Marcet 2008), open innovation can be developed in
organizations like public administrations, and by doing so they are able to provide the greatest possible value
to its users, and especially in a rapidly changing world like the present.
EUNI 58
58
At UPV, the initiative started with a pilot project in which outside experts, who acted as facilitators in the
process, selected about thirty people from very different positions in the organization, all with the common
denominator of being able to propose innovative ideas in a dynamic environment exploration.
They worked in the process in successive stages, in which ideas could be discussed, analyzed, and classified,
compared with the challenges that an organization like the UPV can have in the immediate future and in a
changing environment like the present. There was also opportunity of comparing ideas with companies and
external organizations who have had similar experiences in the recent past.
Each round carried a selection of promising ideas, so at the end there was a manageable quantity of them.
The selected ideas for further development were:
• Mobile applications (the subject of this paper)
• Virtual Office 24x7x365
• Transparent management
• Learning competences
With them we could move to the phase of product design, always following design methodologies and an
associated business model.
The success of the experience, and further work on the selected ideas led to the UPV to propose this
methodology to be part of its Strategic Plan for the years 2015-2020.
4. THE CASE OF CORPORATE APPS
The usual practice of universities when deploying corporate apps for mobile devices is to have it in the
official stores of the most common systems (iOS, Android and Windows).This common behavior presents some
problems, namely:
1. As features are being added in successive versions, the app grows in size and complexity, so browsing
behavior within it gets increasingly complex, and at the end it is more difficult to find content inside
the app than in the corporate website.
2. Also, as the app becomes more complex, it is more difficult to develop these new features, so the
incorporation of them is often delayed.
3. There are different groups of users (teachers, students, technical, administrative, researchers,
visitors, alumni, etc.) and within each group different people have different needs.
4. The development of the corporate app can only be done by the main developers group, as any update
in the app can potentially harm other features.
So, a single corporate application hardly suits both the long and medium-term requirements and therefore
tends to be underrated and scarcely used.
A different approach to solve these problems is to create an ecosystem of independent apps, each with a
specific, easy functionality, delegating user administration of the same to user’s device. In this way users can
decide what apps to install and how to organize them, depending on his needs or activities. This also allows a
faster development cycle, because each app is independent from the others.
A big issue with this approach is that, if those apps are published in the standard app stores, there is no easy
way for a user to know what apps are available. Also, given that not all applications are intended for all user
profiles, it seems reasonable to consider a profile management so that if the user does not belong to a
particular group (teacher, student, etc.) the store shouldn’t recommend applications which do not
correspond to that profile.
Another consequence of posting apps on standard stores, is also that there is not an easy way to know if a
particular app has been endorsed as safe by the university, because the policies of those stores do not require
it. For example, in September 2015 a number of external apps faked as official applications of different
Spanish universities. So in those stores there are applications that can fake institutional, through the use of
corporate image, and be rated even higher than the official implementation of the institution.
The solution to those problems is to distribute the apps by a own store, conveniently certified, and
recommend registered users the applications that can be useful to them, limiting the presence of the
institution in official stores to a single corporate application that provides essential information and a link to
its own store.
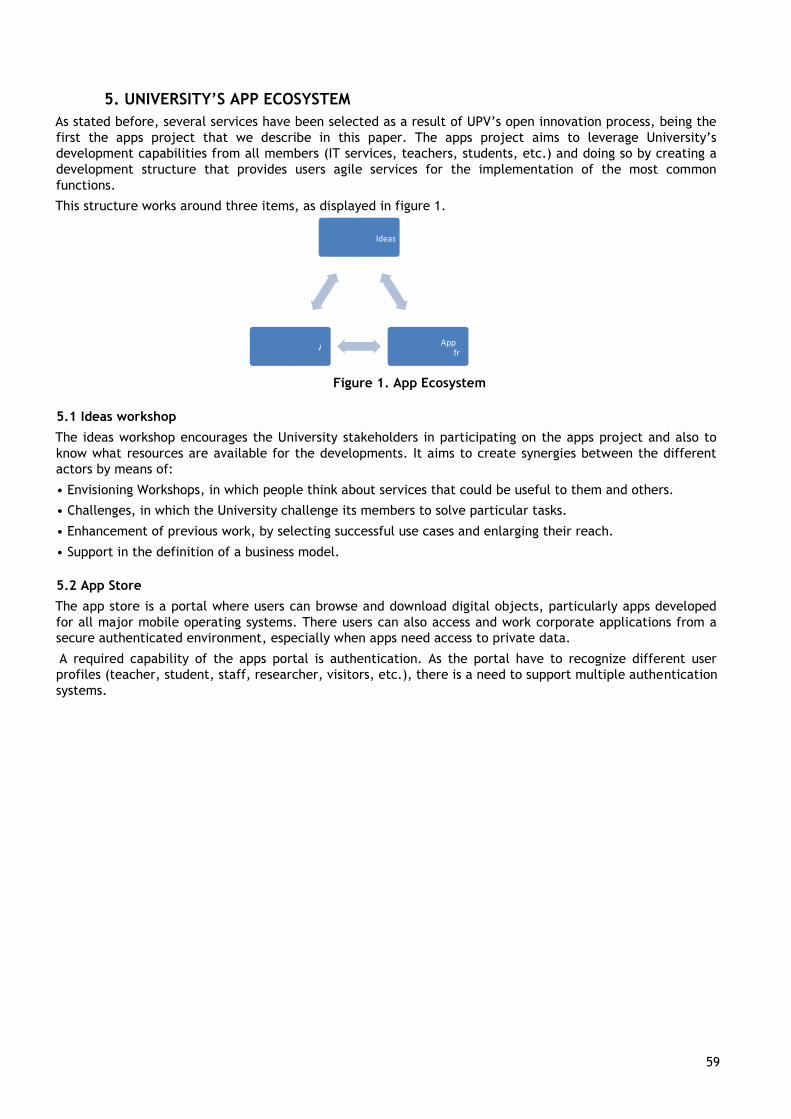
EUNI 59
59
5. UNIVERSITY’S APP ECOSYSTEM
As stated before, several services have been selected as a result of UPV’s open innovation process, being the
first the apps project that we describe in this paper. The apps project aims to leverage University’s
development capabilities from all members (IT services, teachers, students, etc.) and doing so by creating a
development structure that provides users agile services for the implementation of the most common
functions.
This structure works around three items, as displayed in figure 1.
Figure 1. App Ecosystem
5.1 Ideas workshop
The ideas workshop encourages the University stakeholders in participating on the apps project and also to
know what resources are available for the developments. It aims to create synergies between the different
actors by means of:
• Envisioning Workshops, in which people think about services that could be useful to them and others.
• Challenges, in which the University challenge its members to solve particular tasks.
• Enhancement of previous work, by selecting successful use cases and enlarging their reach.
• Support in the definition of a business model.
5.2 App Store
The app store is a portal where users can browse and download digital objects, particularly apps developed
for all major mobile operating systems. There users can also access and work corporate applications from a
secure authenticated environment, especially when apps need access to private data.
A required capability of the apps portal is authentication. As the portal have to recognize different user
profiles (teacher, student, staff, researcher, visitors, etc.), there is a need to support multiple authentication
systems.
Ideas
worksh
App
developmefr
a
A
p
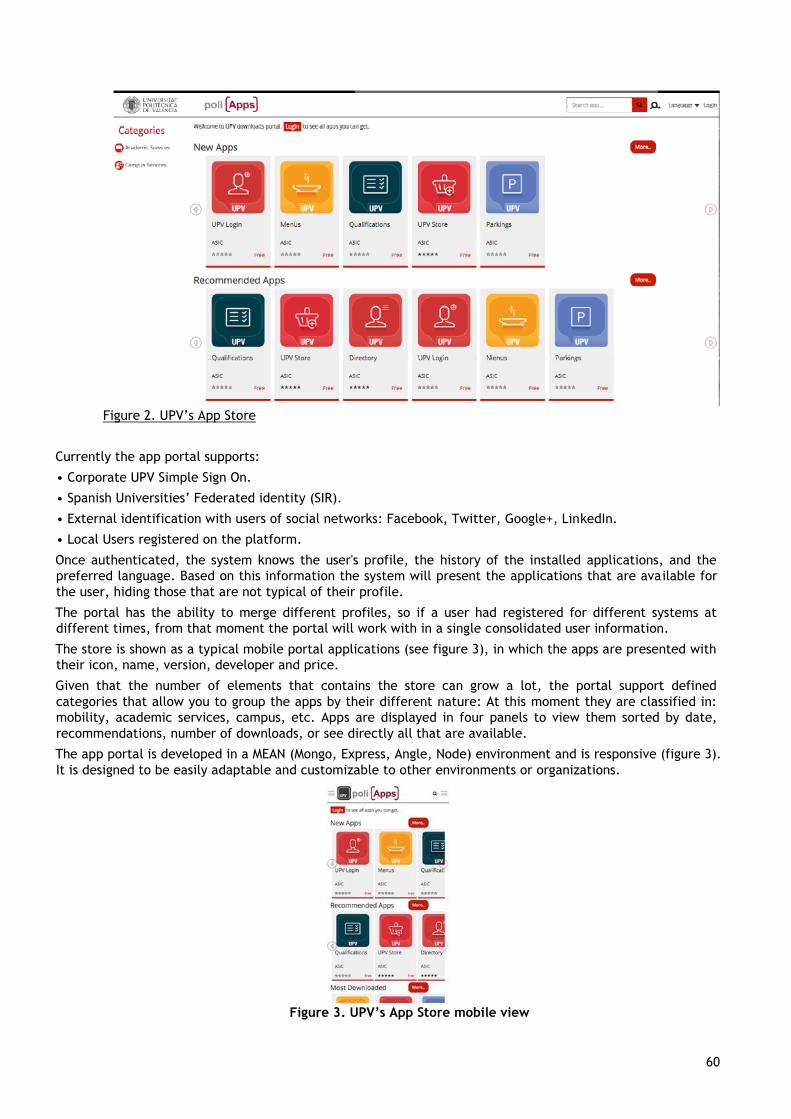
EUNI 60
60
Figure 2. UPV’s App Store
Currently the app portal supports:
• Corporate UPV Simple Sign On.
• Spanish Universities’ Federated identity (SIR).
• External identification with users of social networks: Facebook, Twitter, Google+, LinkedIn.
• Local Users registered on the platform.
Once authenticated, the system knows the user's profile, the history of the installed applications, and the
preferred language. Based on this information the system will present the applications that are available for
the user, hiding those that are not typical of their profile.
The portal has the ability to merge different profiles, so if a user had registered for different systems at
different times, from that moment the portal will work with in a single consolidated user information.
The store is shown as a typical mobile portal applications (see figure 3), in which the apps are presented with
their icon, name, version, developer and price.
Given that the number of elements that contains the store can grow a lot, the portal support defined
categories that allow you to group the apps by their different nature: At this moment they are classified in:
mobility, academic services, campus, etc. Apps are displayed in four panels to view them sorted by date,
recommendations, number of downloads, or see directly all that are available.
The app portal is developed in a MEAN (Mongo, Express, Angle, Node) environment and is responsive (figure 3).
It is designed to be easily adaptable and customizable to other environments or organizations.
Figure 3. UPV’s App Store mobile view
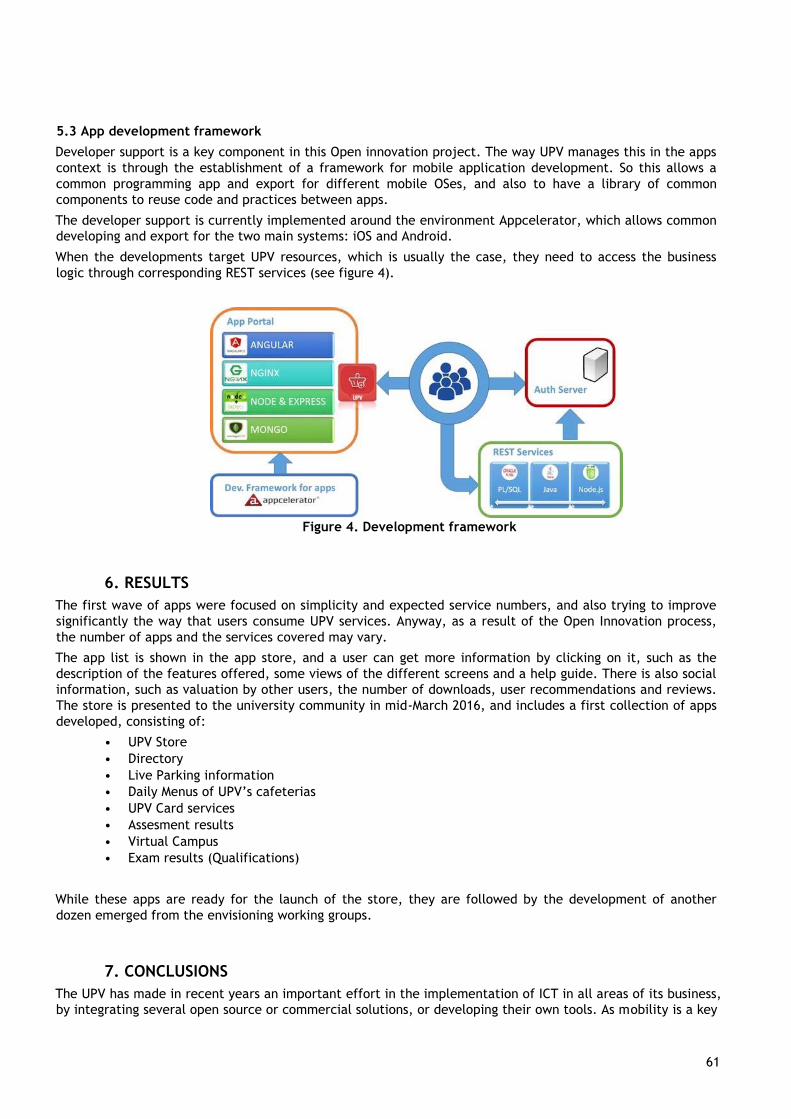
EUNI 61
61
5.3 App development framework
Developer support is a key component in this Open innovation project. The way UPV manages this in the apps
context is through the establishment of a framework for mobile application development. So this allows a
common programming app and export for different mobile OSes, and also to have a library of common
components to reuse code and practices between apps.
The developer support is currently implemented around the environment Appcelerator, which allows common
developing and export for the two main systems: iOS and Android.
When the developments target UPV resources, which is usually the case, they need to access the business
logic through corresponding REST services (see figure 4).
Figure 4. Development framework
6. RESULTS
The first wave of apps were focused on simplicity and expected service numbers, and also trying to improve
significantly the way that users consume UPV services. Anyway, as a result of the Open Innovation process,
the number of apps and the services covered may vary.
The app list is shown in the app store, and a user can get more information by clicking on it, such as the
description of the features offered, some views of the different screens and a help guide. There is also social
information, such as valuation by other users, the number of downloads, user recommendations and reviews.
The store is presented to the university community in mid-March 2016, and includes a first collection of apps
developed, consisting of:
• UPV Store
• Directory
• Live Parking information
• Daily Menus of UPV’s cafeterias
• UPV Card services
• Assesment results
• Virtual Campus
• Exam results (Qualifications)
While these apps are ready for the launch of the store, they are followed by the development of another
dozen emerged from the envisioning working groups.
7. CONCLUSIONS
The UPV has made in recent years an important effort in the implementation of ICT in all areas of its business,
by integrating several open source or commercial solutions, or developing their own tools. As mobility is a key

EUNI 62
62
factor in today's society and especially in the university environment, there was a considerable gap between
the solutions effectively implemented and the ability to access these services in mobility.
Throughout the past year, following an Open Innovation path, the UPV has added to its capabilities the ability
to manage, support and maintain large number of mobile applications, which offer users of the university
access many services in an easy and useful way while in mobility.
The store is currently being launched in March 2016, and contain a dozen different Apps and is developing
another dozen of them, which will join the store in the coming months.
8. REFERENCES
Appcelerator (2016). http://www.appcelerator.com/
Busquets, J., & Turró, C. Preliminary results from a flipped classroom experience: Getting an insight from the
real marks. 2015 EUNIS conference
Chesbrough, H. W. (2006). Open innovation: The new imperative for creating and profiting from technology.
Harvard Business Press.
Marcet, X. (2008, September). Open Innovation: A New Paradigm. In Hybrid Intelligent Systems, 2008. HIS'08.
Eighth International Conference on (pp. 959-960). IEEE.
Turro, C., Cañero, A., & Busquets, J. (2010, December). Video learning objects creation with polimedia. In
Multimedia (ISM), 2010 IEEE International Symposium on (pp. 371-376). IEEE.
9. AUTHORS’ BIOGRAPHIES
Jaime Busquets: http://es.linkedin.com/pub/jaime-busquets/
Juan Evangelista: https://www.linkedin.com/in/juanevangelistadavid
Raul Mengod: https://es.linkedin.com/in/raúl-mengod-lópez-176a9611/en
Carlos Turró: https://www.linkedin.com/pub/carlos-turr%C3%B3-ribalta

EUNI 63
63
LARK: Location-Aware Personalized Travel Guide with Rich Knowledge
Bontomitsidis Spyridon1 ([email protected]), Floros Dimitrios1 ([email protected]), Manolas
Dimitrios1 ([email protected]), Mylonakis Konstantinos1 ([email protected]), Pitsianis Nikos1
1Department of Electrical and Computer Engineering, Aristotle University of Thessaloniki, Greece
Keywords
Learn, Experience, Tours, Routing, Multimedia, Web, Mobile, Application, Context-aware
1. ABSTRACT
We present LARK, a mobile web application at edu.lark.gr, that provides location-aware information
content. LARK is a query-search-optimization engine that serves as a multimedia database, an
individually customized tour planner and an on-site tour guide. Technically, LARK consists of a server
component to facilitate generation, modification, search of multimedia content that can be related,
and adaptive, to physical locations and a mobile app to render and adapt the tours on user's mobile
device(s) and interests. LARK provides new possibilities for collecting and sharing specialized
knowledge beyond tourism, by presenting tours with high educational and historical significance for its
users.
2. INTRODUCTION
LARK is a mobile web application at edu.lark.gr, to provide a new experience with personalized tour
planning and on-site guidance. Many modern museums offer visitors audio guides to certain themed
sections via provided players, and recently, via mobile web applications. At a much larger scale, with
much richer information, offering personalized customization, LARK accompanies and guides anybody
with a mobile device, a smartphone or a tablet, to a city or county and enriches the travel experience
with enlightening and delightful information.
LARK utilizes synergistically modern technologies and techniques for sensing and processing.
Smartphones, or similar mobile devices, can accurately identify location, access the Internet, and
playback audio and video content from various sources. LARK acts as both a personalized tour planner
and an on-site personal guide to new or familiar destinations facilitating tour plans ahead of time or in
the spur of the moment. Aware and adaptive to spatial location, LARK can guide a tourist, an
adventurer or a student, on foot or vehicle, not only describing locations and directions, but also
providing information on local tales, legends, history, architecture, arts, customs, shopping and
services. Everything is done at a personal pace, by personal taste and interests (Figure 1).
The content of a guided tour can be extended and enriched to a variety of themes beyond
conventional tourism. Special thematic walks can be accessible at any time and not only when the
specialists are
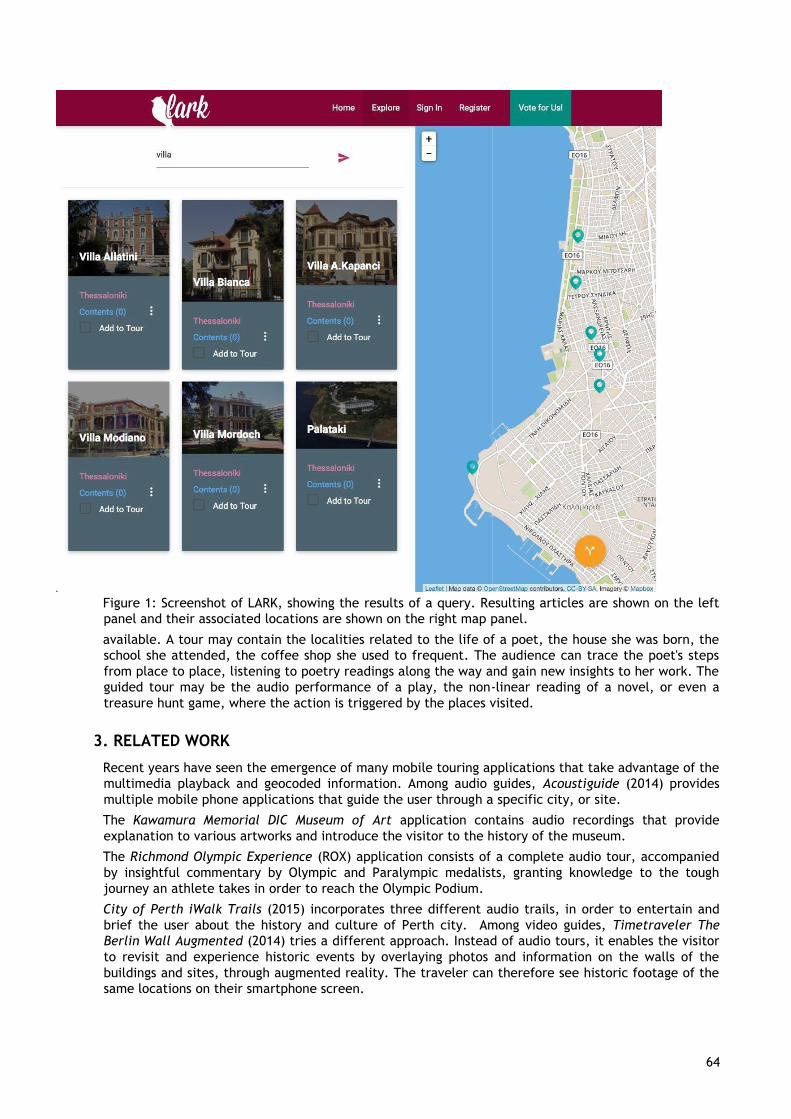
EUNI 64
64
Figure 1: Screenshot of LARK, showing the results of a query. Resulting articles are shown on the left
panel and their associated locations are shown on the right map panel.
available. A tour may contain the localities related to the life of a poet, the house she was born, the
school she attended, the coffee shop she used to frequent. The audience can trace the poet's steps
from place to place, listening to poetry readings along the way and gain new insights to her work. The
guided tour may be the audio performance of a play, the non-linear reading of a novel, or even a
treasure hunt game, where the action is triggered by the places visited.
3. RELATED WORK
Recent years have seen the emergence of many mobile touring applications that take advantage of the
multimedia playback and geocoded information. Among audio guides, Acoustiguide (2014) provides
multiple mobile phone applications that guide the user through a specific city, or site.
The Kawamura Memorial DIC Museum of Art application contains audio recordings that provide
explanation to various artworks and introduce the visitor to the history of the museum.
The Richmond Olympic Experience (ROX) application consists of a complete audio tour, accompanied
by insightful commentary by Olympic and Paralympic medalists, granting knowledge to the tough
journey an athlete takes in order to reach the Olympic Podium.
City of Perth iWalk Trails (2015) incorporates three different audio trails, in order to entertain and
brief the user about the history and culture of Perth city. Among video guides, Timetraveler The
Berlin Wall Augmented (2014) tries a different approach. Instead of audio tours, it enables the visitor
to revisit and experience historic events by overlaying photos and information on the walls of the
buildings and sites, through augmented reality. The traveler can therefore see historic footage of the
same locations on their smartphone screen.
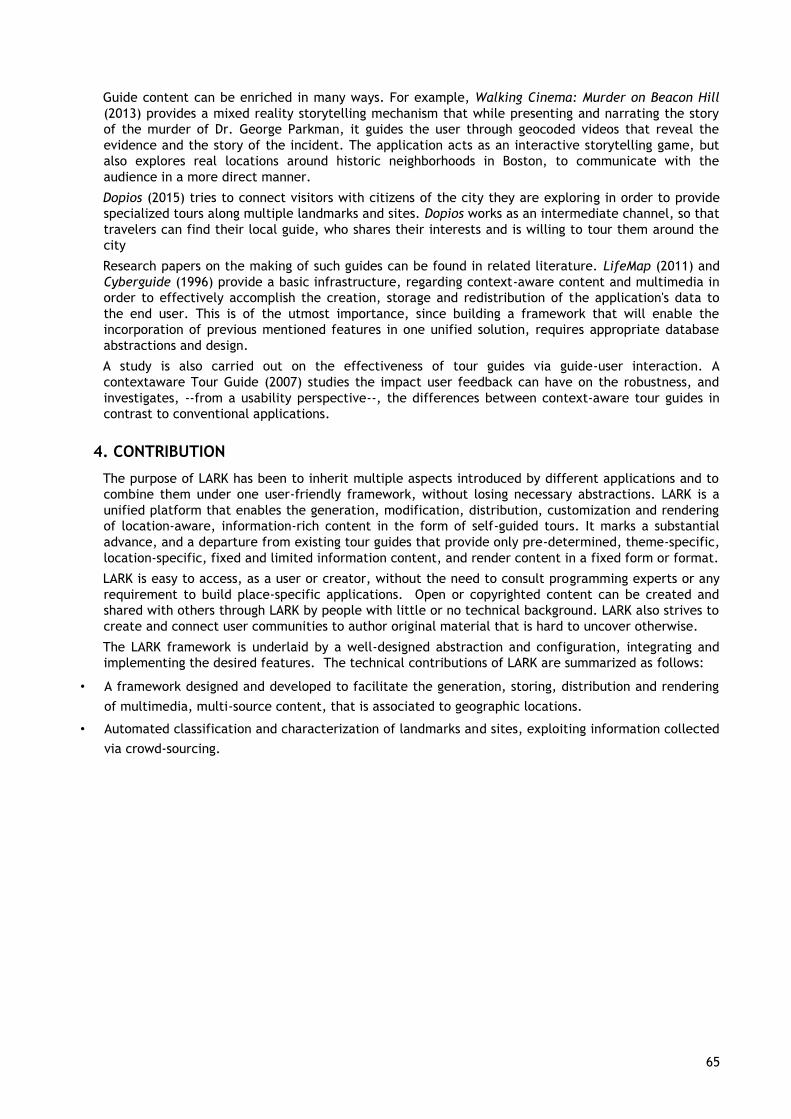
EUNI 65
65
Guide content can be enriched in many ways. For example, Walking Cinema: Murder on Beacon Hill
(2013) provides a mixed reality storytelling mechanism that while presenting and narrating the story
of the murder of Dr. George Parkman, it guides the user through geocoded videos that reveal the
evidence and the story of the incident. The application acts as an interactive storytelling game, but
also explores real locations around historic neighborhoods in Boston, to communicate with the
audience in a more direct manner.
Dopios (2015) tries to connect visitors with citizens of the city they are exploring in order to provide
specialized tours along multiple landmarks and sites. Dopios works as an intermediate channel, so that
travelers can find their local guide, who shares their interests and is willing to tour them around the
city
Research papers on the making of such guides can be found in related literature. LifeMap (2011) and
Cyberguide (1996) provide a basic infrastructure, regarding context-aware content and multimedia in
order to effectively accomplish the creation, storage and redistribution of the application's data to
the end user. This is of the utmost importance, since building a framework that will enable the
incorporation of previous mentioned features in one unified solution, requires appropriate database
abstractions and design.
A study is also carried out on the effectiveness of tour guides via guide-user interaction. A
contextaware Tour Guide (2007) studies the impact user feedback can have on the robustness, and
investigates, --from a usability perspective--, the differences between context-aware tour guides in
contrast to conventional applications.
4. CONTRIBUTION
The purpose of LARK has been to inherit multiple aspects introduced by different applications and to
combine them under one user-friendly framework, without losing necessary abstractions. LARK is a
unified platform that enables the generation, modification, distribution, customization and rendering
of location-aware, information-rich content in the form of self-guided tours. It marks a substantial
advance, and a departure from existing tour guides that provide only pre-determined, theme-specific,
location-specific, fixed and limited information content, and render content in a fixed form or format.
LARK is easy to access, as a user or creator, without the need to consult programming experts or any
requirement to build place-specific applications. Open or copyrighted content can be created and
shared with others through LARK by people with little or no technical background. LARK also strives to
create and connect user communities to author original material that is hard to uncover otherwise.
The LARK framework is underlaid by a well-designed abstraction and configuration, integrating and
implementing the desired features. The technical contributions of LARK are summarized as follows:
• A framework designed and developed to facilitate the generation, storing, distribution and rendering
of multimedia, multi-source content, that is associated to geographic locations.
• Automated classification and characterization of landmarks and sites, exploiting information collected
via crowd-sourcing.
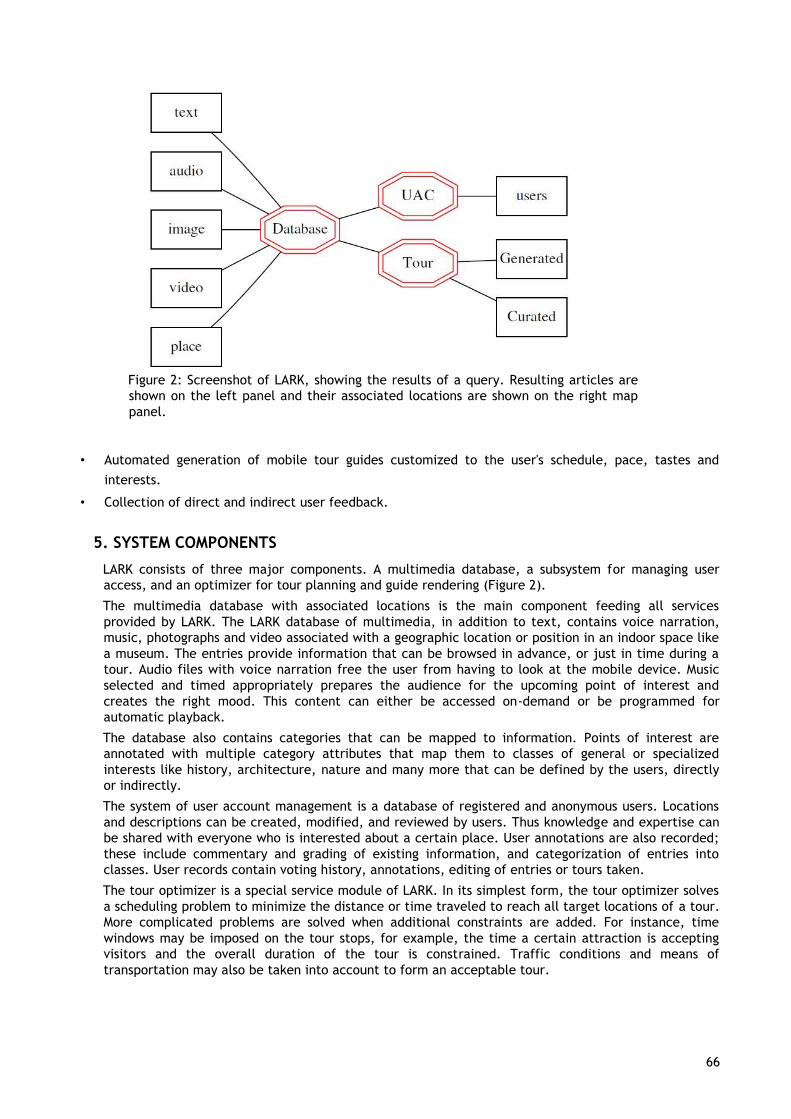
EUNI 66
66
Figure 2: Screenshot of LARK, showing the results of a query. Resulting articles are
shown on the left panel and their associated locations are shown on the right map
panel.
• Automated generation of mobile tour guides customized to the user's schedule, pace, tastes and
interests.
• Collection of direct and indirect user feedback.
5. SYSTEM COMPONENTS
LARK consists of three major components. A multimedia database, a subsystem for managing user
access, and an optimizer for tour planning and guide rendering (Figure 2).
The multimedia database with associated locations is the main component feeding all services
provided by LARK. The LARK database of multimedia, in addition to text, contains voice narration,
music, photographs and video associated with a geographic location or position in an indoor space like
a museum. The entries provide information that can be browsed in advance, or just in time during a
tour. Audio files with voice narration free the user from having to look at the mobile device. Music
selected and timed appropriately prepares the audience for the upcoming point of interest and
creates the right mood. This content can either be accessed on-demand or be programmed for
automatic playback.
The database also contains categories that can be mapped to information. Points of interest are
annotated with multiple category attributes that map them to classes of general or specialized
interests like history, architecture, nature and many more that can be defined by the users, directly
or indirectly.
The system of user account management is a database of registered and anonymous users. Locations
and descriptions can be created, modified, and reviewed by users. Thus knowledge and expertise can
be shared with everyone who is interested about a certain place. User annotations are also recorded;
these include commentary and grading of existing information, and categorization of entries into
classes. User records contain voting history, annotations, editing of entries or tours taken.
The tour optimizer is a special service module of LARK. In its simplest form, the tour optimizer solves
a scheduling problem to minimize the distance or time traveled to reach all target locations of a tour.
More complicated problems are solved when additional constraints are added. For instance, time
windows may be imposed on the tour stops, for example, the time a certain attraction is accepting
visitors and the overall duration of the tour is constrained. Traffic conditions and means of
transportation may also be taken into account to form an acceptable tour.
EUNI 67
67
Interactive tours can also be generated, based on position, path and the user's recent interactions,
resulting to a unique experience. This provides a form of interactive narrative tours, that do not
always produce the same final route, but change and adapt, based on user's choices.
6. INTERNAL PROCESSING AND LEARNING
The internal abstraction and processing in LARK are as follows. Locations are denoted by nodes and
paths by edges in a graph. Both nodes and edges can be associated with classes and multimedia
content. Content assigned to edges is filtered depending on the transportation means. Related
content can be triggered according to proximity or similarity criteria.
Advanced computational techniques are used to characterize the nodes, to generate tours and collect
feedback from the user. Nodes are automatically classified into multiple classes in order to associate
them in different ways and themes. Each node is denoted by a vector in a d-dimensional space, where
each dimension represents a different attribute (i.e. historical value). The attributes are elicited or
crowd-sourced from user feedback. A k-means classifier is used to categorize each node into classes
for node classification and characterization. Neighborhood clusters can be provided as alternative
suggestions that might interest the user.
After the classification process, correct labeling of the derived clusters is also very important, in order
for the application to provide correct results. The labeling process can be enhanced through the use
of the Latent Dirichlet allocation (LDA) algorithm on the content or the reviews of a specific site. LDA
can identify common topics along multiple documents that accompany a place and use these to
correctly identify each cluster.
The customized tours are spawned through the use of both the user's current location and the classes
that best match user interests and subjects queried. The suggested route minimizes the overall
distance or time needed to traverse the tour. The scheduler takes into account the distances between
places, the form of transportation, real time traffic conditions, probable amount of time spent in
each node, opening hours of the places to be visited and the user's available timeline.
LARK collects and learns from the user feedback, without the user's direct involvement or with user's
direct feedback or contribution. For instance, the application records whether the tour was
completed, how much time was spent en-route and at each location. If a location visit has been
prematurely terminated or completely omitted, the user is queried to reconfirm an interest in the
subject. The user feedback, direct and indirect is used to better associate attributes to nodes, so that
this information can be utilized in future tour planning.
LARK enables and encourages the user to participate in recording and sharing information related to
points of her interest.
7. CONCLUSION
Creation of multimedia materials in addition to text, containing voice narration, songs and music,
photographs and video related to a location and their reproduction in sequence and on queue for a
self-guided tour has become very easy with the ever-expanding capabilities of mobile technology.
Combining technologies like the Global Positioning System, Wi-Fi position estimation, and maps with
such multimedia can lead to the creation of easy-to-use, high quality, context-aware applications.
LARK interconnects all of these with the appropriate abstractions in order to provide a unified
platform for travelers and guides, containing the tools to create, distribute and render multimedia
tours around the globe.
By making connections to visitors, LARK aspires to also have positive impact on local communities, on
local people in all walks of life, and open new and exciting opportunities to sustain and advance local
culture, arts and business.
LARK is available at edu.lark.gr, and accessible from anywhere the Internet reaches.
We thank Prof. Xiaobai Sun of Duke University for her critical comments.
EUNI 68
68
8. REFERENCES
City of Perth iWalk Trails, (2015). Mobile phone audio tour app
http://www.perth.wa.gov.au/our-capital-city/things-see-and-do/self-guided-trails
Acoustiguide (2014). Audio - multimedia tours for multiple platforms.
http://www.acoustiguide.com/
Chon, J., & Cha, H. (2011). LifeMap: A smartphone-based context provider for location-based services.
IEEE Pervasive Computing, 10(2), 58–67. http://doi.org/10.1109/MPRV.2011.13 Gulliver, S. R., Ghinea, G., Patel, M., & Serif, T. (2007). A context-aware Tour Guide: User
implications. Mobile Information Systems, 3(2), 71–88.
Abowd, G. D., Atkeson, C. G., Hong, J., Long, S., Kooper, R., & Pinkerton, M. (1996). Cyberguide: A
Mobile Context-Aware Tour Guide. Baltzer Journals, 3(September 1996), 1–21.
Burigat, S., & Chittaro, L. (2005). Location-aware visualization of VRML models in GPS-based mobile
guides. In Proceedings of the tenth international conference on 3D Web technology (pp. 57–64).
Dey, A. K. (2010). Context-aware computing. Ubiquitous Computing Fundamentals, 321–352.
Schilit, B., Adams, N., & Want, R. (1994). Context-aware computing applications. In Mobile Computing
Systems and Applications, 1994. WMCSA 1994. (pp. 85–90).
Untravel Media (2013). Walking Cinema: Murder on Beacon Hill
https://itunes.apple.com/us/app/walking-cinema-murder-on-beacon/
Robin von Hardenberg (2014). Timetraveler The Berlin Wall Augmented
https://itunes.apple.com/en/app/timetraveler-die-berliner/
Dopios (2015) https://www.dopios.com
2nd Experimental School (2014). Heritage tours of Thessaloniki monuments
http://edutech.mysch.gr/mnimeia/mesopolemou.html
9. AUTHORS’ BIOGRAPHIES
Spyridon Bontomitsidis is a graduate (2015) of the department of Electrical and
Computer Engineering of Aristotle University of Thessaloniki. His strong interest in
software led him to work outside of his degree and gain experience in webprogramming,
android developing and algorithms. Adding that with the hardware expertise acquired
from the University, he formed a true engineering profile, able combine software and
hardware efficiently. He worked for nine months at IMEC, Belgium implementing his
thesis, which gave him the opportunity to design professional level hardware and
software, adding value to the existing cutting
edge research work. In addition, he is part of Meerkat, a developing team, with distinctions in
various national competitions on smart applications to improve everyday life and tone up
tourism. (LinkedIn: https://gr.linkedin.com/in/spiros-bontomitsidis-1866a484)
Dimitrios Floros is a Ph.D. candidate in Electrical and Computer Engineering at
Aristotle University of Thessaloniki, Greece. He received his diploma with excellence
from the same institution in 2015, with a thesis on the analysis and design of 3D
projection mapping systems. His primary research interests lie in the field of high
performance numerical computing. His enthusiasm with software developing led him to
become part of an award winning team, Meerkat, developing web-apps as well as mobile
applications that help solving everyday live problems. He has also worked for Passias S.A.,
developing and updating the
existing inner-company ERP system.
(LinkedIn: https://gr.linkedin.com/in/dimflo)
EUNI 69
69
Konstantinos Mylonakis is a student of department of Electrical and Computer
Engineering of Aristotle University of Thessaloniki. Currently working on his thesis in the
field of Fast Multipole Method. Besides his interest in the field of computational physics,
he enjoyed to expand his developing skills learning about Web developing and system
administration. His enthusiasm for dealing with complex real life problems led him to
join the Meerkat team, where he works on back-end and algorithm tasks. He has won
three awards as members of Meerkat team for the application Prisma, Aneas and Lark
and looks forward to improve
the existing projects and deal with new challenges.
(LinkedIn: https://gr.linkedin.com/in/kostasmylonakis)
Dimitrios Manolas is finishing his studies in the department of Electrical and
Computer Engineering of the Aristotle University of Thessaloniki. He is presently working
on his thesis on energy efficiency through behavioral economics. Dimitrios has channeled
much of his engineering problem-solving background into new areas and ventures, taking
a strong interest in the managerial and marketing fields. He had the opportunity to
develop his competences further by working for 6 months for Procter & Gamble. For the
past two and a half years, Dimitrios has also been strongly involved in volunteering, by
taking key positions in the Erasmus Student Network, Europe's largest student
organization for the advancement of mobility and international higher education. (LinkedIn: https://gr.linkedin.com/in/dimitriosmanolas)
Nikos Pitsianis is an assistant professor with the department of Electrical and
Computer Engineering of the Aristotle University of Thessaloniki, Greece. His research
experience and interests are in algorithms and architectures for high performance
numerical computing and applications in integrated sensing and processing. He holds a
PhD in Computer Science from Cornell University.
EUNI 70
70
Erasmus Without Paper — from the technical perspective
Janina Mincer-Daszkiewicz ([email protected]), Wojciech Rygielski ([email protected]),
Faculty of Mathematics, Informatics, and Mechanics, University of Warsaw, Banacha 2, 02-097
Warszawa, Poland
Keywords
Erasmus Without Paper, student mobility, Erasmus+, Student Information System, EWP Network, EWP Registry,
connectors, GitHub, semantic versioning
1. INTRODUCTION
The Erasmus Without Paper (EWP) project [2, 3] aims to create a network supporting the electronic
exchange of student data by interlinking the existing Erasmus student databases of Higher Education
Institutions (HEIs) with the goal to permanently migrate from the paper world to the electronic world of
student data. It is a response to the current needs of the information society, more specifically a large
number of potential end-beneficiaries ranging from students, institutional Erasmus coordinators, IRO staff,
HEIs at large, national agencies, or even the European Commission. The project addresses the Erasmus+ goal
of increasing student mobility and recognition of student achievements (measured in recognized ECTS points).
The EWP Network is the first attempt to standardize student data transfer on a European-wide scale. It is
important to note that the transfer does not involve documents themselves (e.g. scanned copies) but the data
that is contained in these documents, so that they can be used for the generation of various documents,
processed automatically and stored in institutional databases. In particular, no data is held centrally.
There are 11 partners composed of public institutions, higher education organizations, and companies from 8
European countries with a dissemination potential to over 400 HEIs from 36 European countries. They are
supported by 11 associate partners actively involved in the project.
The project started on November 1st, 2015 and will last for two years (grant number 562264-EPP-12015-1-BE-
EPPKA3-PI-FORWARD).
In this paper we present the results of the first half year of the project, mostly from the technical perspective.
We want to share some design and implementation decisions concerning the architecture, security, scalability
of the EWP Network, data format, API, protocols supporting data exchange, and other technically oriented
issues.
2. PROJECT GOALS
The project aims to design and work out a pilot for an integrated communication network supporting the
exchange of student data in an electronic form, and to build connecting software modules (connectors) that
will allow Student Information Systems (SISs) with built-in mobility modules (part of SIS that takes care of
Bilateral Agreements, student applications, Learning Agreements, Transcript of Records and other documents)
and/or stand-alone Mobility systems (like MoveON or MobilityOnLine) to exchange data over the EWP Network.
In more detail, the main project tasks are the following:
• Describe all possible mobility scenarios.
• Create common data models for the exchanged information and design appropriate document formats.
• Define the necessary transport protocols and standards.
• Take care of identity management (authentication and authorization methods).
• Solve the security and privacy issues.
• Build connector modules (also generic) that allow data handling software to send and receive data
over the network.
• Include extra tools to increase performance and usability (e.g. grade conversion).
EUNI 71
71
3. GENERAL PROJECT DEVELOPMENT DECISIONS
The final success of the project depends on the number of institutions joining the network. It is crucial that
from the very beginning the software will be designed and developed using an open source approach with the
active involvement of the academic community. We have created the official EWP organization on GitHub
(https://github.com/erasmus-without-paper/). All technically biased project work will be reported on GitHub.
We will post there specifications, source code, documentation etc. All developers interested in the work
progress or wanted to get involved should subscribe to the chosen projects on GitHub. We have also created a
web page for developers involved in the design and implementation of the EWP platform and connectors
(http://developers. erasmuswithoutpaper.eu/) with the general overview of the documents and
specifications, information on their state, links, tools, etc.
There is a set of repositories for various sections of documentation. Documents posted on GitHub are
available for review, change notifications help to keep all informed, built-in issue trackers can be used for
asking questions, reporting errors or posting suggestions. GitHub supports formal versioning of documents and
source code (we will follow rules of semantic versioning). Official versions of data format and Application
Programming Interface (API) will be approved by the project partners, and — once the APIs are released onto
production servers — backward compatibility will be guaranteed. The data format will be defined officially by
XSD and a validation tool will be provided to help with formal verification of the produced data files.
We plan to take into account data formats developed by other mobility-oriented European projects, like
EMREX-ELMO worked out by the EMREX group [1, 4].
4. ARCHITECTURE AND SECURITY
EWP Network is composed of the EWP Hosts and the Registry (see Fig. 1). EWP Hosts are groups of HEIs. The
EWP project aims on allowing communication between them. In order to join the Network, the Host should
publish a valid Discovery Manifest file somewhere on its servers and send the URL of this file to the EWP
Registry administrator. It will be stored in the Registry allowing partners to identify and verify future requests.
Fig. 1 Main components of the EWP Network
Registry
The Registry is the only centralized part of the EWP Network. It allows all EWP Hosts to access the list of
other EWP Hosts. It may also be used for projects unrelated to EWP, as long as these projects have similar
architecture. The Registry is being updated automatically. It periodically reads all the information which all
EWP Hosts provide within their Discovery Manifest files, and these changes are reflected in the Registry
responses.
The major advantage of such automatic updating is that the partners do not need to contact the
Registry maintainer when they want to change some of their Registry entries. Most changes in the Registry can
be performed simply by updating the manifest on the partner's server (and the Registry will fetch these
changes automatically). This approach supports the scalability of the solution.
EWP Hosts are not required to implement all features of the EWP Network. In order to avoid unnecessary
requests, the Registry also keeps track of all the implemented APIs.
Some of the APIs are event listener APIs. If Host 2 wants to receive change notifications from other hosts, it
indicates in its Manifest file that it has implemented a specific event listener API. Now, if Host 1 is able to
broadcast such notifications, then it asks the Registry which hosts have implemented the proper listeners, and
posts the proper notifications at the listener URLs.
EUNI 72
72
Security
There are two types of certificates involved in the communication:
• Server certificates are used by the Host when it responds to API requests.
• Client certificates are used to issue requests within the EWP Network.
Implementers may use the same certificate for both purposes.
API
In order to join the EWP Network, a new partner needs to implement a subset of its APIs. There are many APIs,
and each partner will choose which of them he wants to implement. Each partner has to implement Discovery
Manifest API:
• It serves to identify the partner, announce the list of HEIs covered by the partner’s system, and used
certificates while fetching the data from the EWP Network. It's like a simple "business card" of the
EWP Host. Its role may be expanded along the project.
• It serves to inform all other members of the network about which features (APIs) the EWP Host has
implemented. This list may include external APIs (unrelated to the EWP project).
The partner needs to host the Discovery Manifest file somewhere on its servers. The Discovery Manifest file is
a simple XML file which must conform to the provided XML Schema.
The Echo API allows beginner EWP developers to test the security of their EWP Network connections. It
doesn't "do" anything, but it requires the developer to implement the core security framework (which will be
needed by all the other APIs later on).
The EWP Network specification posted on GitHub describes EWP Network components, establishes common
security measures, features, data types and vocabulary, and explains how partners communicate between one
another.
5. SUMMARY
The Erasmus Without Paper project has entered the design and implementation phase. The pilot we are
working on aims to test out the feasibility of the proposed solutions for all HEIs in Europe. In the first step the
general architecture of the EWP Network has been designed along with some general discovery services and
security mechanisms. The API design is in progress. The development of connectors for local systems will
follow. All the specifications, documents, and source code will be hosted on GitHub. We want to share them
with the academic community and prospective developers of local connectors. This paper is a call for
cooperation, especially directed toward other European projects/groups with the focus on student mobility
and student data sharing across borders.
6. REFERENCES
[1] EMREX project. Retrieved in January 2016 from: http://www.emrex.eu.
[2] Erasmus Without Paper (EWP), an Update. Presentation by Valère Meus at 2015 Gröningen Declaration
Network Annual Meeting, Málaga, 4-6 May, 2015. Retrieved in January 2016 from:
http://www.groningendeclaration.org/erasmus-without-paper-ewp-update [3] Erasmus Without Paper project. Retrieved in January 2016 from: http://www.erasmuswithoutpaper.eu. [4] Lindstedt M., Hansen A.B., Ravaioli S., Vangen G., Sidselrud A., Mincer-Daszkiewicz J., Henriksson P.
(2015). Field trial on the impact of enabling easy mobility on recognition of external
studies (EMREX). EUNIS 2015, Dundee. http://www.eunis.org/eunis2015/wphttp://www.eunis.org/eunis2015/wp-content/uploads/sites/3/2015/04/EUNIS2015_submission_13_P1_TRACK_3_slot_3.pdfcontent/uploads/sites/3/2015/04/EUNIS2015_submission_13_P1_TRACK_3_slot_3.pdf
7. AUTHORS’ BIOGRAPHIES
Janina Mincer-Daszkiewicz graduated in computer science in the University of Warsaw,
Poland, and obtained a Ph.D. degree in math from the same university. She is an
associate professor in Computer Science at the Faculty of Mathematics, Informatics and
Mechanics at the University of Warsaw specializing in operating systems, distributed
EUNI 73
73
systems, performance evaluation and software engineering. Since 1999, she leads a project for the
development of a student management information system USOS, which is used in 47 Polish Higher Education
Institutions, gathered in the MUCI consortium. Janina takes active part in many nation-wide projects in
Poland. She has been involved in Egracons, EMREX and Erasmus Without Paper European projects.
Wojciech Rygielski graduated in computer science in the University of Warsaw, Poland.
He is a senior programmer working on USOS.
He is one of the main developers from Poland in EMREX and Erasmus Without Paper
European projects. He is responsible for keeping the EWP specifications clean, up-to-
date and backward-compatible.
EUNI 74
74
Supporting Student Mobility with EMREX — a field trial on exchanging student achievement records
Mats Lindstedt1, Anders Bøgebjerg Hansen2, Stefano Russo3, Geir Vangen4, Janina Mincer-Daszkiewicz5, Mattias
Holmlund6
1CSC – IT Center for Science Ltd, Finland 2IT Department of the Ministry of Higher Education and Science
(UFM-IT), Denmark 3KION, Italy 4FSAT, University of Oslo, Norway 5University of Warsaw, Poland 6ICT,
Umeå University, Sweden
Keywords
Learning mobility, student information systems, digital result exchange, European policy experimentation,
recognition
1. BACKGROUND
The EMREX project, co-funded by Erasmus+, addresses the EU 2020 target that 20% of higher education
students should be mobile during their studies. EMREX focuses on the exchange of student achievement
records between higher education institutions. EMREX together with e.g. Erasmus Without Paper, FAIR and
other similar initiatives is part of a wider set of activities on student mobility by EU. Academic recognition in
higher education is seen as a challenge in learner mobility and also as a potential area for the improvement
of a more efficient education system in general.
The EMREX field trial aims at testing new ways to make the administration of student mobility easier and thus
promoting a higher attainment level to student mobility in higher education and also encouraging more
effective recognition of prior learning and avoiding overlapping studies. In the first phase the trial is set up
between Finland, Norway, Sweden, Denmark and Italy. Students in these countries may during the field trial
log into their student portal at their home university and collect study achievements from the host university.
Poland will also utilize the EMREX solution for its internal mobility.
This session aims at presenting the objectives for the EMREX project, demonstrates the solution for exchanging achievement records, and discusses the first preliminary findings from the ongoing field trial.
2. THE EMREX FIELD TRIAL
The tangible outcome of EMREX is a federated solution that supports the exchange of student data on
achievements. The solution will be highly scalable and can thus be easily implemented in the whole European
community. The field trial will test the hypothesis that the new functionality will lower the burden of
administrative tasks laid upon students and lower involvement of the administration.
The solution was developed in 2015 and a live field trial is conducted in 2016. Each partner in the project has
set up a National Contact Point (NCP) and a Student Mobility Plug-In (SMP) for the local Student Information
System (SIS). Exchange students in the participating countries will use the EMREX solution to electronically
retrieve their achievement records from the host HEI. The students, mobility coordinators and administrators
will be asked to participate in surveys and the statistics from the exchanges will be collected and analysed.
The first findings from the field trial will be presented in this session.
3. THE EMREX SOLUTION
The EMREX solution consists of several components. The idea is that they should be as independent of each
other as possible. In this way, it will be easier to add new participants to the network.
Each SIS or institution, depending on local implementation, that wishes to fetch results via the EMREX
network, must implement an SMP (EMREX-Client). The client provides the student with a secure login, enables
the student to contact the host HEI and provides a way to store the retrieved results in the local SIS.
Each country that wishes to provide results to the EMREX network must implement an NCP. The NCP provides
the student with a secure login in the host country and enables the student to select and fetch their results
from the host HEI. The EMREX network will use the ELMO format to exchange the results.
The process is initiated by the student, logging into the SMP, which contacts a platform, EMREG register, to
check which NCPs are connected and available. The student chooses their host HEI and the student data is
EUNI 75
75
verified by the NCP. An electronic transfer of student achievements via the NCP and SMP is performed as soon
as the student has approved the course list at the host university.
The EMREX solution will be demonstrated in the session.
EMREX is based on open source code and freely available to all. The solution will be available for all HEIs in
Europe from 2017. New countries can join the EMREX network through creating their own EMREX clients and
contribute to the network by providing their own NCPs.
4. PRELIMINARY FINDINGS AND FUTURE BENEFITS AND OPPORTUNITIES
The biggest benefit coming out of this policy project will be the increased availability, quality and reliability
of information about student records of achievement information. This will make student mobility processes
easier, faster and more transparent for students. Students will also benefit from the recognition of previous
academic studies and degrees because of increased eligibility, when applying for studies in higher education.
The universities will benefit from a reduction of manual work. The field trial also supports the collection of
measurable data on the rate of recognition that can then be analysed and used for improving the national
policies on student mobility and rules for recognition of previous studies. The data will increase the quality of
the learning mobility statistics.
In this session the first preliminary conclusions from the ongoing field trial will be presented and discussed.
Another benefit from the field trial will be the comparison of the transcripts of records in the participating
countries. To fully benefit from an electronic transfer there is a need for a common format. The solution will
also be evaluated from a technical perspective to smooth the path for newcomers to join the EMREX network.
One of the goals and benefits of the field trial is the peer learning of the authorities involved. The way to
support this particular goal is making the results of the development process openly available through open
source code. The up-scaling of the EMREX-platform will be provided by applying a decentralised management
model: the higher education institutions in the European Community will be responsible for the operation and
funding of their own part of the solution. The EMREX-platform will thus not be dependent on being
coordinated by a central body or organisation nor on centralised funding, which will secure its sustainability.
All institutions of higher education will be able to use the information from countries offering the
functionality.
5. BIOGRAPHIES
Mats Lindstedt has a Master of Science in Business Strategy and International Marketing and a Licentiate in Applied
Mathematics from the Helsinki University of Technology. He has over 15 years of experience from the ICT industry
including program management and R&D development. Since 2012 he work for CSC Ltd in Finland and with developing
support for student services. Previously he was the project manager for Tiptop, developing web based support for
university students’ personal study plans. Currently he is the project manager for the EMREX project.
Anders Bøgebjerg Hansen holds a master’s degree in political science from the University of Copenhagen. He has worked
with different student information systems at two universities and has 15 years of experience coordinating systems
development on the customer side within higher education in Denmark. He is a special adviser at the IT Department of
the Ministry of Higher Education and Science (UFM-IT) where he works with contract and project management with
relation to the student information system STADS and the application system DANS. These systems are used at all 8
universities and several institutions of architecture and art in Denmark. Anders Bøgebjerg Hansen has been the project
manager of many large EU tenders and has for several years been involved in Nordic forums in the area of student
information systems.
Simone Stefano Russo has more than 15 years experience in developing nationwide software systems. He spent most of
them at Kion, the company which is the leader in developing Students Information Systems for the Italian Universities,
where he works as part of the group that manages the mobility module for the student information system "ESSE3" used
by over 60 universities in Italy.
Geir Vangen has more than 20 years experience in developing nationwide systems within higher
education in Norway. At USIT, the University of Oslo University Center for Information Technology, he works as
EUNI 76
76
development manager for the student information system FS. Geir Vangen is also responsible for architecture and
methods for the section within USIT that develops systems for student information (FS), research information (CRIStin),
national admission (SO) and data warehouse. He participates in national and international standardization work, and has
been a member of the groups developing the MLO and ELM-standards. He is a member of the steering committee of RS3G.
He has been member of national committees appointed by the Ministry of Education and Research, and has lead projects
on behalf of the Ministry. Geir Vangen graduated from University of Oslo, Institute of Informatics in 1989.
Janina Mincer-Daszkiewicz graduated in computer science in the University of Warsaw, Poland, and obtained a Ph.D.
degree in math from the same university. She is an associate professor in Computer Science at the Faculty of
Mathematics, Informatics and Mechanics at the University of Warsaw. Her main fields of research include operating
systems, distributed systems, performance evaluation and software engineering. Since 1999, she leads a project for the
development of a student management information system USOS, which is used in over 40 Polish Higher Education Institutions, gathered in the MUCI consortium. In 2008, she started the Mobility Project with RS3G. Janina takes active part in many nation-wide projects in Poland.
Mattias Holmlund holds an Bachelor of Science in System Analysis from Umeå University. He has been working with IT since 2001 and held the position as Operations Manager of one of three Swedish national SIS-Ladok installations until 2011. He is currently involved in setting up the new operational organization for the next generation of the Ladok-system. In the Emrex project he is technical responsible for the Swedish part of the development and also as a Work package leader in the Erasmus without paper project (EWP).
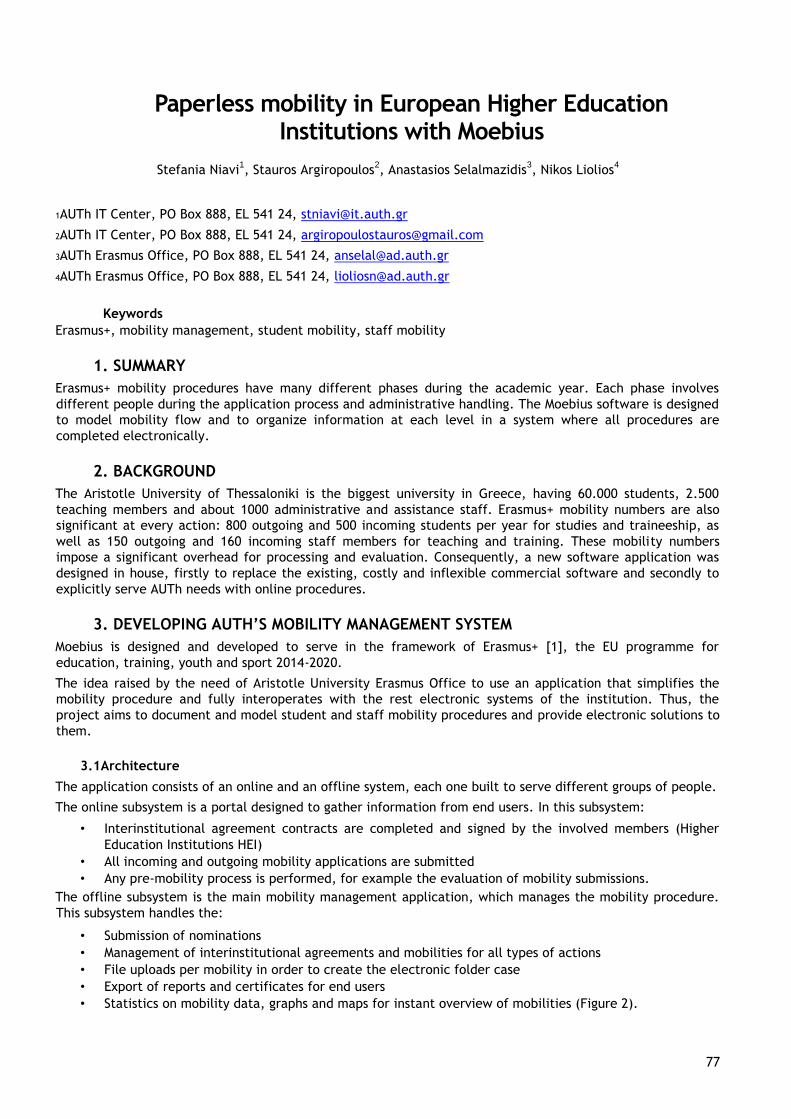
EUNI 77
77
Paperless mobility in European Higher Education Institutions with Moebius
Stefania Niavi1, Stauros Argiropoulos
2, Anastasios Selalmazidis
3, Nikos Liolios
4
1AUTh IT Center, PO Box 888, EL 541 24, [email protected]
2AUTh IT Center, PO Box 888, EL 541 24, [email protected]
3AUTh Erasmus Office, PO Box 888, EL 541 24, [email protected]
4AUTh Erasmus Office, PO Box 888, EL 541 24, [email protected]
Keywords
Erasmus+, mobility management, student mobility, staff mobility
1. SUMMARY
Erasmus+ mobility procedures have many different phases during the academic year. Each phase involves
different people during the application process and administrative handling. The Moebius software is designed
to model mobility flow and to organize information at each level in a system where all procedures are
completed electronically.
2. BACKGROUND
The Aristotle University of Thessaloniki is the biggest university in Greece, having 60.000 students, 2.500
teaching members and about 1000 administrative and assistance staff. Erasmus+ mobility numbers are also
significant at every action: 800 outgoing and 500 incoming students per year for studies and traineeship, as
well as 150 outgoing and 160 incoming staff members for teaching and training. These mobility numbers
impose a significant overhead for processing and evaluation. Consequently, a new software application was
designed in house, firstly to replace the existing, costly and inflexible commercial software and secondly to
explicitly serve AUTh needs with online procedures.
3. DEVELOPING AUTH’S MOBILITY MANAGEMENT SYSTEM
Moebius is designed and developed to serve in the framework of Erasmus+ [1], the EU programme for
education, training, youth and sport 2014-2020.
The idea raised by the need of Aristotle University Erasmus Office to use an application that simplifies the
mobility procedure and fully interoperates with the rest electronic systems of the institution. Thus, the
project aims to document and model student and staff mobility procedures and provide electronic solutions to
them.
3.1Architecture
The application consists of an online and an offline system, each one built to serve different groups of people.
The online subsystem is a portal designed to gather information from end users. In this subsystem:
• Interinstitutional agreement contracts are completed and signed by the involved members (Higher
Education Institutions HEI)
• All incoming and outgoing mobility applications are submitted
• Any pre-mobility process is performed, for example the evaluation of mobility submissions.
The offline subsystem is the main mobility management application, which manages the mobility procedure.
This subsystem handles the:
• Submission of nominations
• Management of interinstitutional agreements and mobilities for all types of actions
• File uploads per mobility in order to create the electronic folder case
• Export of reports and certificates for end users
• Statistics on mobility data, graphs and maps for instant overview of mobilities (Figure 2).
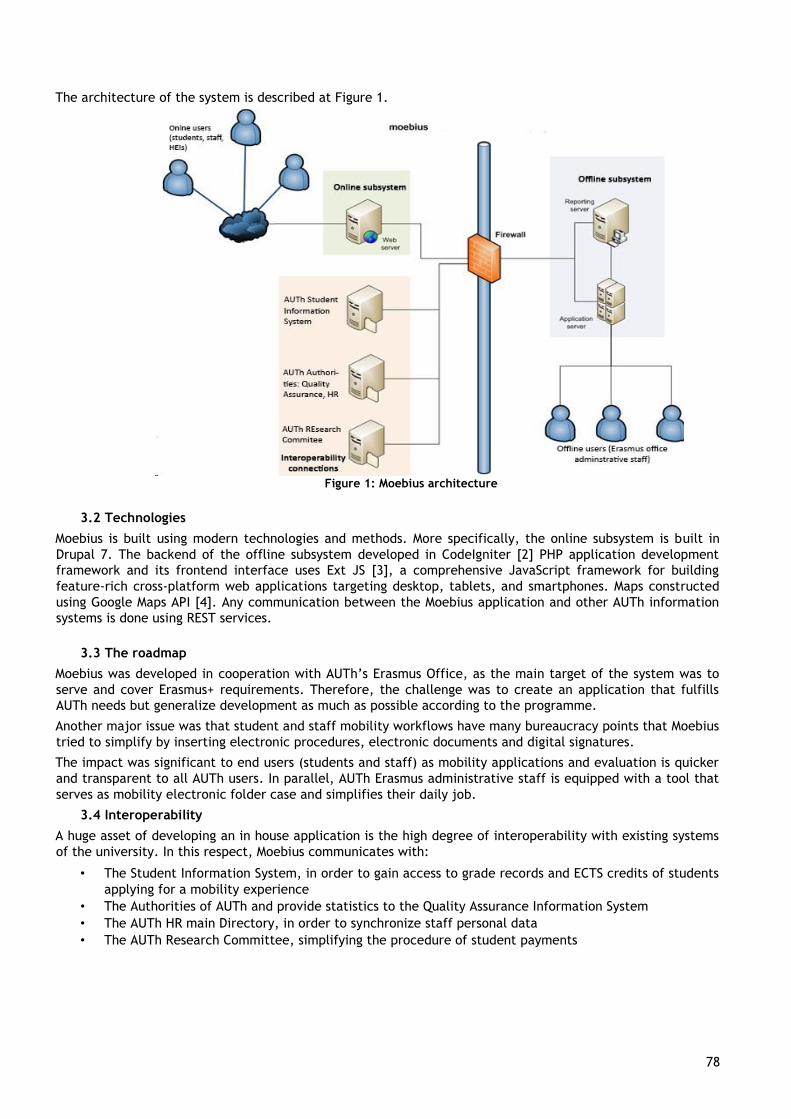
EUNI 78
78
The architecture of the system is described at Figure 1.
Figure 1: Moebius architecture
3.2 Technologies
Moebius is built using modern technologies and methods. More specifically, the online subsystem is built in
Drupal 7. The backend of the offline subsystem developed in CodeIgniter [2] PHP application development
framework and its frontend interface uses Ext JS [3], a comprehensive JavaScript framework for building
feature-rich cross-platform web applications targeting desktop, tablets, and smartphones. Maps constructed
using Google Maps API [4]. Any communication between the Moebius application and other AUTh information
systems is done using REST services.
3.3 The roadmap
Moebius was developed in cooperation with AUTh’s Erasmus Office, as the main target of the system was to
serve and cover Erasmus+ requirements. Therefore, the challenge was to create an application that fulfills
AUTh needs but generalize development as much as possible according to the programme.
Another major issue was that student and staff mobility workflows have many bureaucracy points that Moebius
tried to simplify by inserting electronic procedures, electronic documents and digital signatures.
The impact was significant to end users (students and staff) as mobility applications and evaluation is quicker
and transparent to all AUTh users. In parallel, AUTh Erasmus administrative staff is equipped with a tool that
serves as mobility electronic folder case and simplifies their daily job.
3.4 Interoperability
A huge asset of developing an in house application is the high degree of interoperability with existing systems
of the university. In this respect, Moebius communicates with:
• The Student Information System, in order to gain access to grade records and ECTS credits of students
applying for a mobility experience
• The Authorities of AUTh and provide statistics to the Quality Assurance Information System
• The AUTh HR main Directory, in order to synchronize staff personal data
• The AUTh Research Committee, simplifying the procedure of student payments
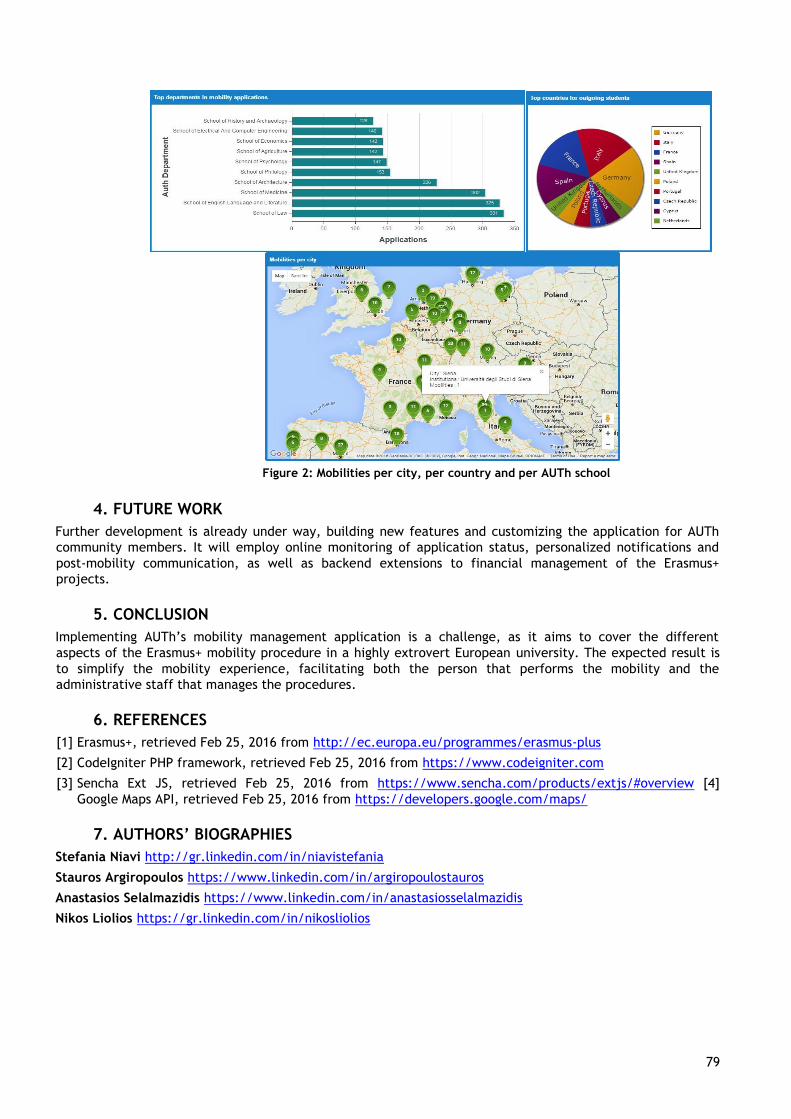
EUNI 79
79
Figure 2: Mobilities per city, per country and per AUTh school
4. FUTURE WORK
Further development is already under way, building new features and customizing the application for AUTh
community members. It will employ online monitoring of application status, personalized notifications and
post-mobility communication, as well as backend extensions to financial management of the Erasmus+
projects.
5. CONCLUSION
Implementing AUTh’s mobility management application is a challenge, as it aims to cover the different
aspects of the Erasmus+ mobility procedure in a highly extrovert European university. The expected result is
to simplify the mobility experience, facilitating both the person that performs the mobility and the
administrative staff that manages the procedures.
6. REFERENCES
[1] Erasmus+, retrieved Feb 25, 2016 from http://ec.europa.eu/programmes/erasmus-plus
[2] CodeIgniter PHP framework, retrieved Feb 25, 2016 from https://www.codeigniter.com
[3] Sencha Ext JS, retrieved Feb 25, 2016 from https://www.sencha.com/products/extjs/#overview [4]
Google Maps API, retrieved Feb 25, 2016 from https://developers.google.com/maps/
7. AUTHORS’ BIOGRAPHIES
Stefania Niavi http://gr.linkedin.com/in/niavistefania
Stauros Argiropoulos https://www.linkedin.com/in/argiropoulostauros
Anastasios Selalmazidis https://www.linkedin.com/in/anastasiosselalmazidis
Nikos Liolios https://gr.linkedin.com/in/nikosliolios

EUNI 80
80
ERAI 2016: Update
1st Johan Bergström, 2nd Michele Mennielli2, 3rd Amandine Alehyane
3
1Umeå Universitet, Sweden, [email protected]
2Cineca, Italy, [email protected]
3Paris Ile-de-France Digital University, France, [email protected]
Keywords
Research, analysis, ERAI, Surveys, Collaboration
1. Summary
The ERAI project now has 2 years to its name. When it comes to content and process the project is maturing
however there is still alot of work to be done. This presentation will describe previous and current work,
results and analysis as well as challenges and call to action. Participate in this session and project to make
this a valued component of the EUNIS offering.
2. ERAI
One of the challenges in the ever-faster changing world of technology is how to stay competitive. The need
for continuous improvement and agility for higher education IT requires knowledge about in-sector and out-of-
sector trends. While organizations like Gartner are excellent resources for pushing out our field of vision to
garner knowledge about out-of-sector trends EUNIS started the EUNIS Research and Analysis Initiative (ERAI)
to provide a platform for IT leaders to understand the uses and trends of IT for the European Higher Education
system. The overall mission of EUNIS is “to help member institutions develop their IT landscape by sharing
experiences and working together.”
3. Previous and current work
There are a number of previous as well as upcoming projects that will be described. Both from a process
perspective but also when it comes to results.
• ERAI/Eunis and Eurocris collaboration – The state of CRIS in Europe
• Benchmarking – joining the different initiatives in Europe
• CIO – top ten
• CLOUD Computing
4. Journal
Last year ERAI published three issues predominantly focused on the congress. The goal of 6 publications were
therefore not reached. However, ERAI has been able to grow some traction and this has given the journal a
position in which we can provide the platform to our partners. Both GEANT and EuroCris have shown interest
in using the Journal as a means to publish their congress’ full papers.
In order to further make the work around the Journal more efficient we will set up a repository, hosted by
EuroCris to store publications coming from ERAI/EJHEIT. This will move us closer to the goal of making the
journal Open Access.
ERAI-paper-template.doc
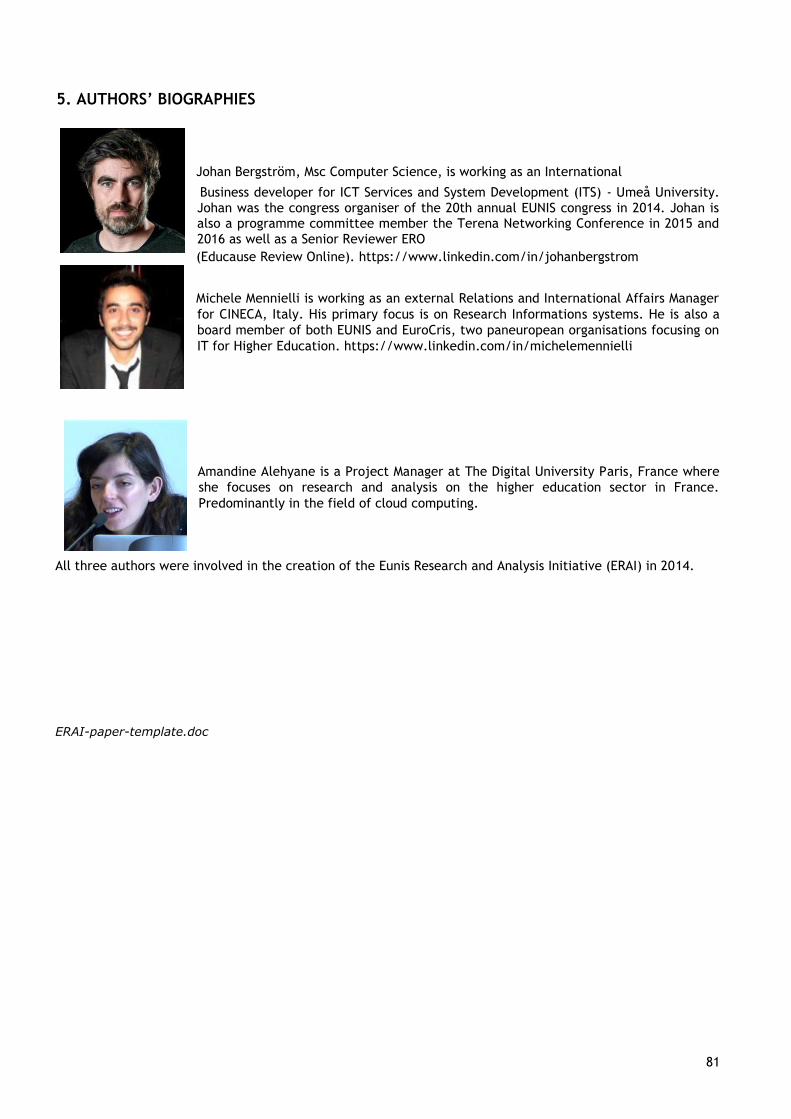
EUNI 81
81
5. AUTHORS’ BIOGRAPHIES
Johan Bergström, Msc Computer Science, is working as an International
Business developer for ICT Services and System Development (ITS) - Umeå University.
Johan was the congress organiser of the 20th annual EUNIS congress in 2014. Johan is also a programme committee member the Terena Networking Conference in 2015 and
2016 as well as a Senior Reviewer ERO
(Educause Review Online). https://www.linkedin.com/in/johanbergstrom
Michele Mennielli is working as an external Relations and International Affairs Manager
for CINECA, Italy. His primary focus is on Research Informations systems. He is also a
board member of both EUNIS and EuroCris, two paneuropean organisations focusing on
IT for Higher Education. https://www.linkedin.com/in/michelemennielli
Amandine Alehyane is a Project Manager at The Digital University Paris, France where
she focuses on research and analysis on the higher education sector in France.
Predominantly in the field of cloud computing.
All three authors were involved in the creation of the Eunis Research and Analysis Initiative (ERAI) in 2014.
ERAI-paper-template.doc
EUNI 82
82
State of Enterprise Architecture practice in Finnish Higher Education sector
1st Nestori Syynimaa, 2nd Patrik Maltusch, 3rd Esa Suominen
1Enterprise Architect, CSC – IT Center for Science, Espoo, Finland, [email protected]
2Head of Enterprise Architecture team, Aalto University, Helsinki, Finland, [email protected]
3Enterprise Architect, Helsinki Metropolia University of Applied Sciences, Helsinki, Finland,
Keywords
Enterprise Architecture, maturity, capability
1. ABSTRACT
Enterprise Architecture (EA) has been practiced in Finnish Higher Education (HE) sector for several
years. In 2011 the Finnish parliament ratified an act mandating all public sector organisation to adopt
EA by 2014. Despite the Act, several studies have shown that the maturity of EA is low in Finnish
public sector. To support the development of EA practice in Finnish HE sector, an EA Special Interest
Group (EA-SIG) was founded in 2012. To shed light to the current state of the EA practice in Finnish HE
sector, this paper reports the findings from a recent EA maturity study conducted by EA-SIG. The
findings indicate that currently only half of the Finnish HE institutions have achieved the “defined”
level of EA maturity. According to the study, the other half will achieve this level in two years.
2. INTRODUCTION
Enterprise Architecture (EA) has been practiced in Finnish Higher Education (HE) sector for several
years. Officially the history of Finnish HE sector EA started in 2009 when eleven Finnish Higher
Education Institutions (HEIs) started an EA-pilot as part of the RAKETTI-initiative. The pilot
participants got a head start to prepare for the Act on Information Management Governance in Public
Administration, which was ratified in 2011 (Finnish Ministry of Finance, 2011). The Act mandates all
Finnish public sector organisations, including HEIs, to adopt EA by 2014. The report from 2014
revealed that the EA maturity in Finnish HE sector was low, even among the HEIs participating to the
EA-pilot (Kella, 2014). Several studies has shown that the EA is not properly understood in Finnish
public sector (Hiekkanen et al., 2013; Lemmetti & Pekkola, 2012; Pehkonen, 2013; Tuomola, 2014).
According to two recent PhD dissertations this is one of the main reasons for the low EA maturity
(Seppänen, 2014; Syynimaa, 2015).
Finnish HE sector consist of Universities and Universities of Applied Sciences (UASs). Currently there
are 15 universities and 25 UASs in Finland. To support the development of EA practice in Finnish HE
sector, HEIs have founded an EA Special Interest Group (EA-SIG) in 2012. EA-SIG has provided general
EA training and peer support for EA practitioners in Finnish HE sector.
In order to shed light to the current status and maturity of EA practice in Finnish HE sector, this paper
presents findings from a recent EA maturity study conducted by EA-SIG in the end of year 2015. In the
future, the study will be conducted annually.
The rest of the paper is organised as follows. The research methodology of the paper is described in
Section 3 and results in Section 4. Section 5 concludes the paper by summarising the findings of the
paper and by providing some suggestions.
3. RESEARCH METHODOLOGY The EA maturity study was conducted as a web questionnaire. The questionnaire was based on the EA
maturity model of KARTTURI, The Guide for Developing Higher Education Enterprise Architecture (CSC,
2013). KARTTURI EA Maturity Model (KEMM) consists of eight EA domains and five maturity levels as
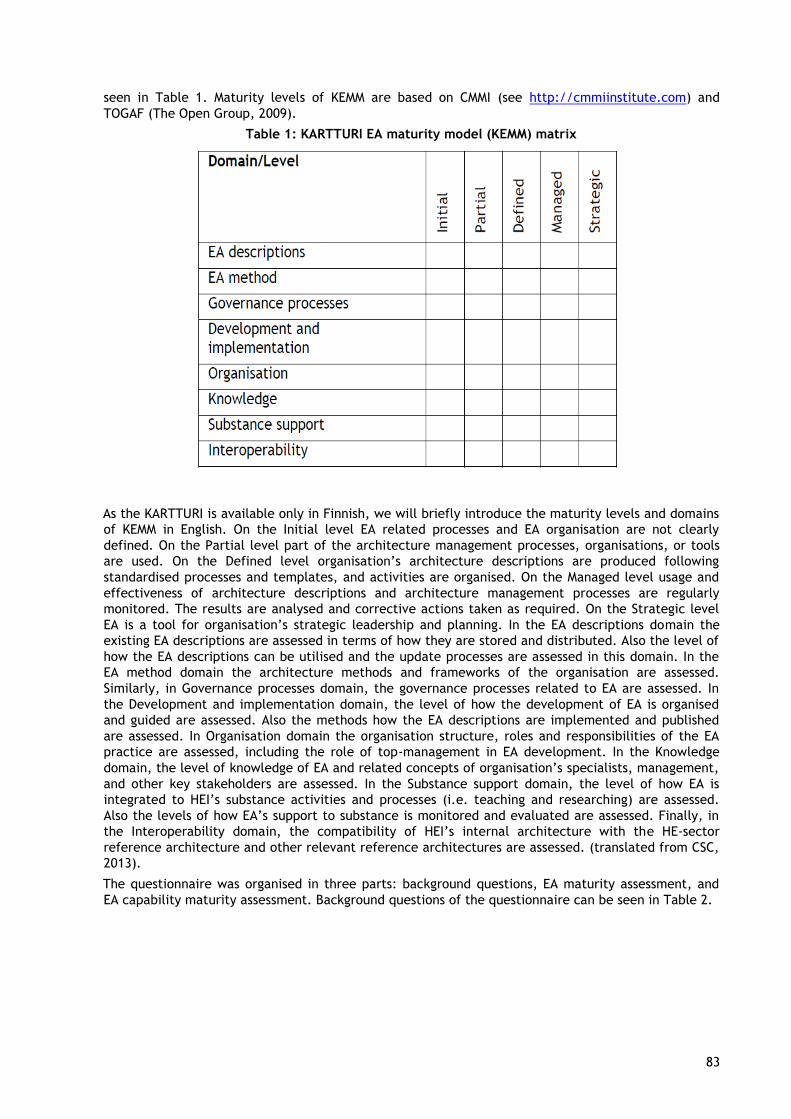
EUNI 83
83
seen in Table 1. Maturity levels of KEMM are based on CMMI (see http://cmmiinstitute.com) and
TOGAF (The Open Group, 2009).
Table 1: KARTTURI EA maturity model (KEMM) matrix
As the KARTTURI is available only in Finnish, we will briefly introduce the maturity levels and domains
of KEMM in English. On the Initial level EA related processes and EA organisation are not clearly
defined. On the Partial level part of the architecture management processes, organisations, or tools
are used. On the Defined level organisation’s architecture descriptions are produced following
standardised processes and templates, and activities are organised. On the Managed level usage and
effectiveness of architecture descriptions and architecture management processes are regularly
monitored. The results are analysed and corrective actions taken as required. On the Strategic level
EA is a tool for organisation’s strategic leadership and planning. In the EA descriptions domain the
existing EA descriptions are assessed in terms of how they are stored and distributed. Also the level of
how the EA descriptions can be utilised and the update processes are assessed in this domain. In the
EA method domain the architecture methods and frameworks of the organisation are assessed.
Similarly, in Governance processes domain, the governance processes related to EA are assessed. In
the Development and implementation domain, the level of how the development of EA is organised
and guided are assessed. Also the methods how the EA descriptions are implemented and published
are assessed. In Organisation domain the organisation structure, roles and responsibilities of the EA
practice are assessed, including the role of top-management in EA development. In the Knowledge
domain, the level of knowledge of EA and related concepts of organisation’s specialists, management,
and other key stakeholders are assessed. In the Substance support domain, the level of how EA is
integrated to HEI’s substance activities and processes (i.e. teaching and researching) are assessed.
Also the levels of how EA’s support to substance is monitored and evaluated are assessed. Finally, in
the Interoperability domain, the compatibility of HEI’s internal architecture with the HE-sector
reference architecture and other relevant reference architectures are assessed. (translated from CSC,
2013).
The questionnaire was organised in three parts: background questions, EA maturity assessment, and
EA capability maturity assessment. Background questions of the questionnaire can be seen in Table 2.
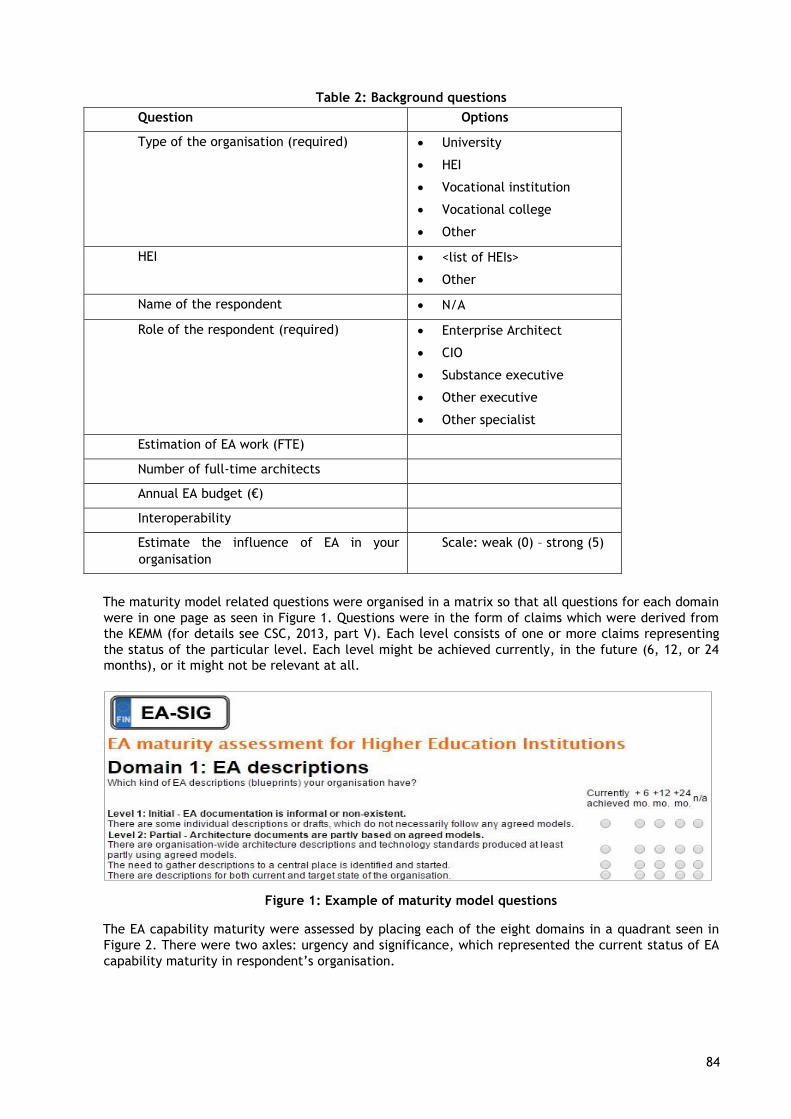
EUNI 84
84
Table 2: Background questions
Question Options
Type of the organisation (required) University
HEI
Vocational institution
Vocational college
Other
HEI <list of HEIs>
Other
Name of the respondent N/A
Role of the respondent (required) Enterprise Architect
CIO
Substance executive
Other executive
Other specialist
Estimation of EA work (FTE)
Number of full-time architects
Annual EA budget (€)
Interoperability
Estimate the influence of EA in your
organisation
Scale: weak (0) – strong (5)
The maturity model related questions were organised in a matrix so that all questions for each domain
were in one page as seen in Figure 1. Questions were in the form of claims which were derived from
the KEMM (for details see CSC, 2013, part V). Each level consists of one or more claims representing
the status of the particular level. Each level might be achieved currently, in the future (6, 12, or 24
months), or it might not be relevant at all.
Figure 1: Example of maturity model questions
The EA capability maturity were assessed by placing each of the eight domains in a quadrant seen in
Figure 2. There were two axles: urgency and significance, which represented the current status of EA
capability maturity in respondent’s organisation.
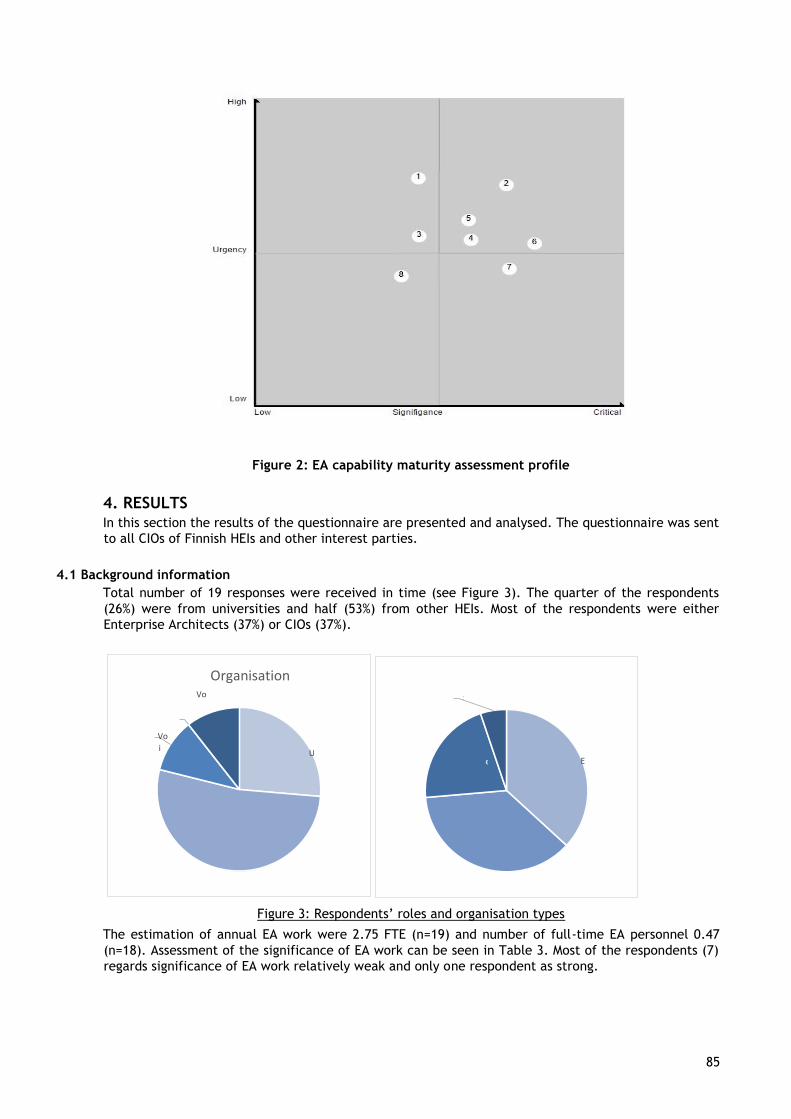
EUNI 85
85
Figure 2: EA capability maturity assessment profile
4. RESULTS
In this section the results of the questionnaire are presented and analysed. The questionnaire was sent
to all CIOs of Finnish HEIs and other interest parties.
4.1 Background information
Total number of 19 responses were received in time (see Figure 3). The quarter of the respondents
(26%) were from universities and half (53%) from other HEIs. Most of the respondents were either
Enterprise Architects (37%) or CIOs (37%).
Figure 3: Respondents’ roles and organisation types
The estimation of annual EA work were 2.75 FTE (n=19) and number of full-time EA personnel 0.47
(n=18). Assessment of the significance of EA work can be seen in Table 3. Most of the respondents (7)
regards significance of EA work relatively weak and only one respondent as strong.
U
n
Vo
cai
n
Vo
ca
Organisation
type (
E
ntA
r
e
x
s
p
R
o
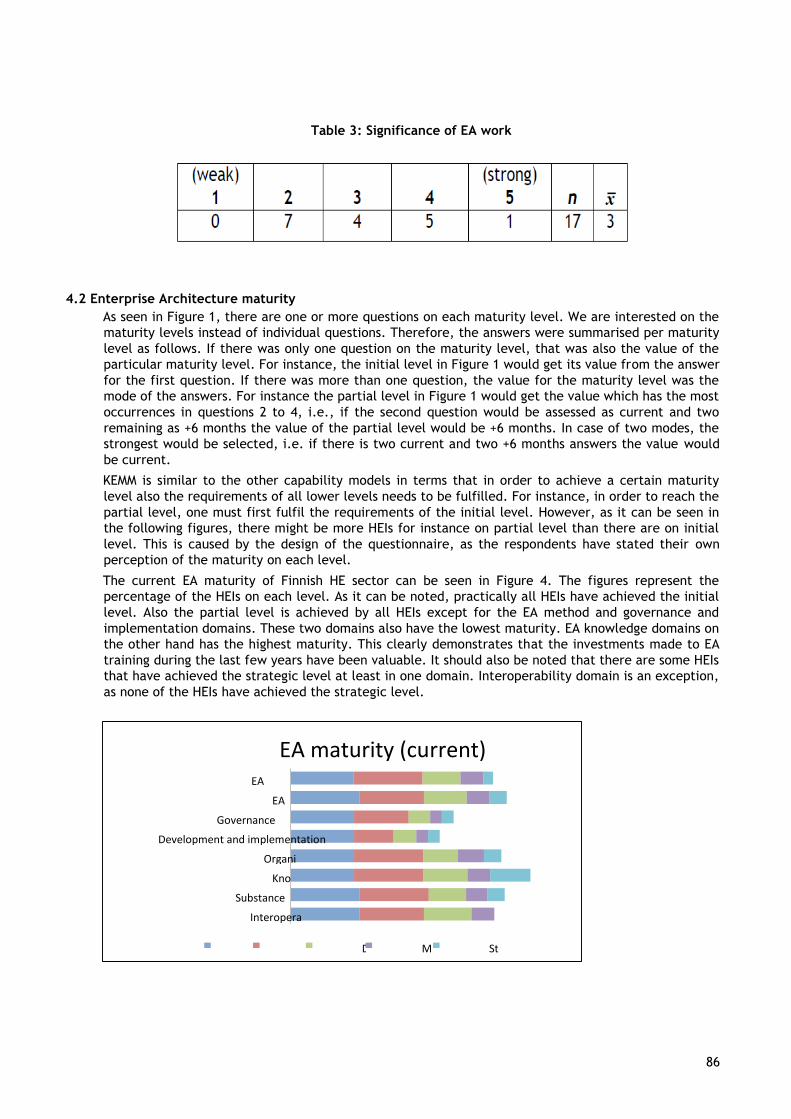
EUNI 86
86
Table 3: Significance of EA work
4.2 Enterprise Architecture maturity
As seen in Figure 1, there are one or more questions on each maturity level. We are interested on the
maturity levels instead of individual questions. Therefore, the answers were summarised per maturity
level as follows. If there was only one question on the maturity level, that was also the value of the
particular maturity level. For instance, the initial level in Figure 1 would get its value from the answer
for the first question. If there was more than one question, the value for the maturity level was the
mode of the answers. For instance the partial level in Figure 1 would get the value which has the most
occurrences in questions 2 to 4, i.e., if the second question would be assessed as current and two
remaining as +6 months the value of the partial level would be +6 months. In case of two modes, the
strongest would be selected, i.e. if there is two current and two +6 months answers the value would
be current.
KEMM is similar to the other capability models in terms that in order to achieve a certain maturity
level also the requirements of all lower levels needs to be fulfilled. For instance, in order to reach the
partial level, one must first fulfil the requirements of the initial level. However, as it can be seen in
the following figures, there might be more HEIs for instance on partial level than there are on initial
level. This is caused by the design of the questionnaire, as the respondents have stated their own
perception of the maturity on each level.
The current EA maturity of Finnish HE sector can be seen in Figure 4. The figures represent the
percentage of the HEIs on each level. As it can be noted, practically all HEIs have achieved the initial
level. Also the partial level is achieved by all HEIs except for the EA method and governance and
implementation domains. These two domains also have the lowest maturity. EA knowledge domains on
the other hand has the highest maturity. This clearly demonstrates that the investments made to EA
training during the last few years have been valuable. It should also be noted that there are some HEIs
that have achieved the strategic level at least in one domain. Interoperability domain is an exception,
as none of the HEIs have achieved the strategic level.
Interopera
bility
Substance
support
Kno
wled
Organi
sation
Development and implementation
Governance
processes
EA
met
EA
descriptio
EA maturity (current)
P
a
D
e
M
an
St
r
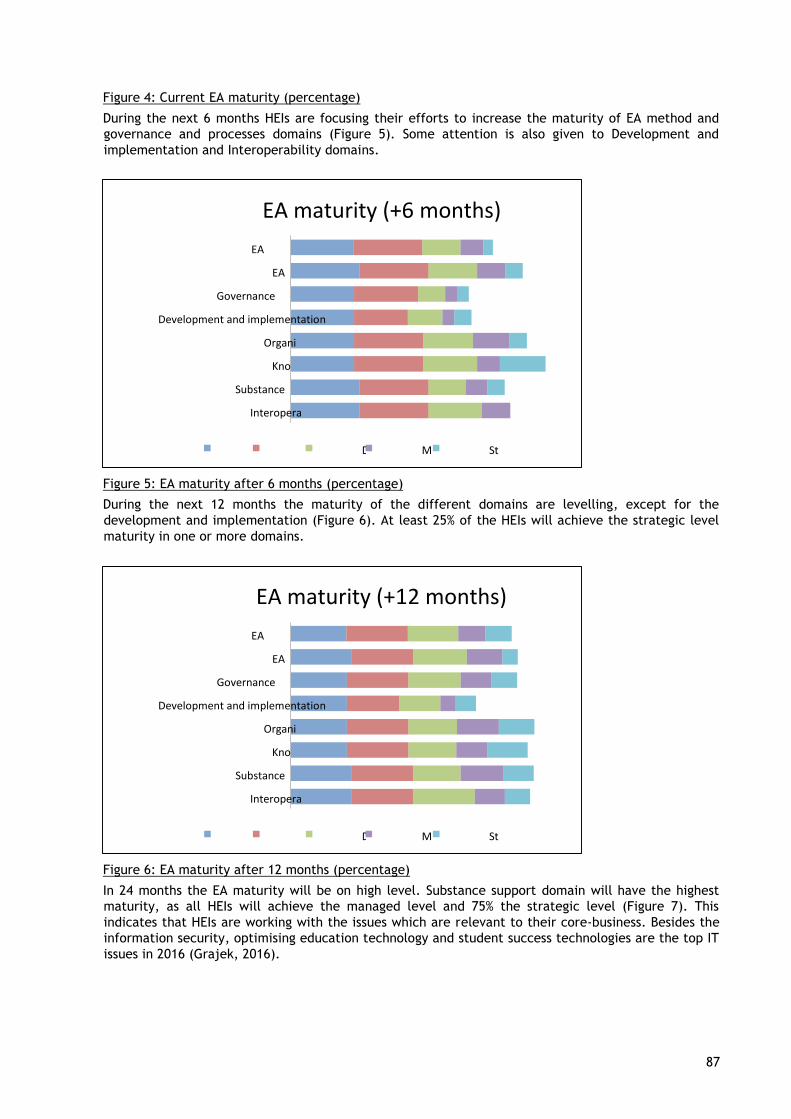
EUNI 87
87
Figure 4: Current EA maturity (percentage)
During the next 6 months HEIs are focusing their efforts to increase the maturity of EA method and
governance and processes domains (Figure 5). Some attention is also given to Development and
implementation and Interoperability domains.
Figure 5: EA maturity after 6 months (percentage)
During the next 12 months the maturity of the different domains are levelling, except for the
development and implementation (Figure 6). At least 25% of the HEIs will achieve the strategic level
maturity in one or more domains.
Figure 6: EA maturity after 12 months (percentage)
In 24 months the EA maturity will be on high level. Substance support domain will have the highest
maturity, as all HEIs will achieve the managed level and 75% the strategic level (Figure 7). This
indicates that HEIs are working with the issues which are relevant to their core-business. Besides the
information security, optimising education technology and student success technologies are the top IT
issues in 2016 (Grajek, 2016).
Interopera
bility
Substance
support
Kno
wled
Organi
sation
Development and implementation
Governance
processes
EA
met
EA
descriptio
EA maturity (+6 months)
P
a
D
e
M
an
St
r
Interopera
bility
Substance
support
Kno
wled
Organi
sation
Development and implementation
Governance
processes
EA
met
EA
descriptio
EA maturity (+12 months)
P
a
D
e
M
an
St
r

EUNI 88
88
Figure 7: EA maturity after 24 months (percentage)
The overall development of EA maturity is illustrated in Figure 8. The percentage of HEIs achieving the
defined level is raising steadily from 50% to 100% during the next 24 months. Also the percentage of
organisations on the managed level and strategic level are increasing.
Figure 8: Development of overall EA maturity
4.3 Enterprise Architecture capability maturity
The maturity of EA capability refers to the levels of urgency and significance of each KEMM
architecture domain. In other words, how critical and urgent each domain is to HE sector. The
maturity of EA capability is illustrated in Figure 9. As it can be seen, Substance support is the most
significant and urgent maturity domain. Another domain with high urgency is the Knowledge domain,
which is interesting, as it is currently the most mature domain.
The average of all significance assessments is 2.97 which is in line with the background question
average seen in Table 3.
Interopera
bility
Substance
support
Kno
wled
Organi
sation
Development and implementation
Governance
processes
EA
met
EA
descriptio
EA maturity (+24 months)
P
a
D
e
M
an
St
r
C
u
m
m
m
Overall EA maturity
P
a
D
e
M
an
St
r
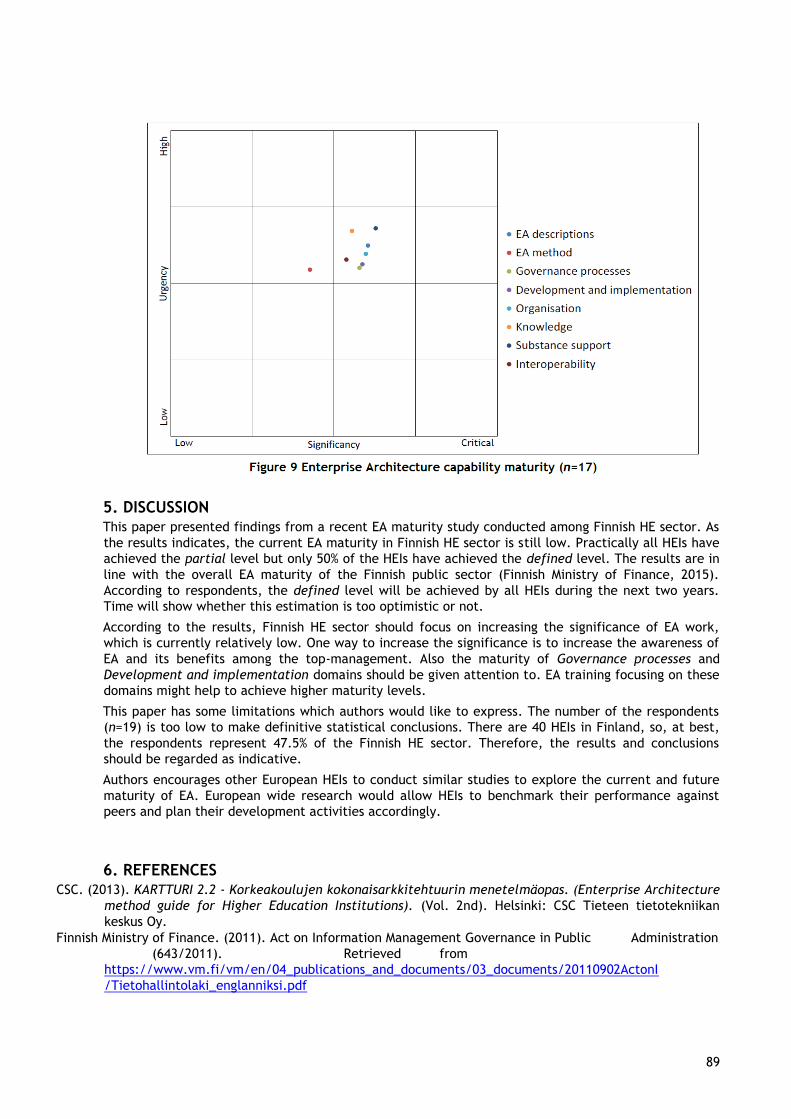
EUNI 89
89
5. DISCUSSION This paper presented findings from a recent EA maturity study conducted among Finnish HE sector. As
the results indicates, the current EA maturity in Finnish HE sector is still low. Practically all HEIs have
achieved the partial level but only 50% of the HEIs have achieved the defined level. The results are in
line with the overall EA maturity of the Finnish public sector (Finnish Ministry of Finance, 2015).
According to respondents, the defined level will be achieved by all HEIs during the next two years.
Time will show whether this estimation is too optimistic or not.
According to the results, Finnish HE sector should focus on increasing the significance of EA work,
which is currently relatively low. One way to increase the significance is to increase the awareness of
EA and its benefits among the top-management. Also the maturity of Governance processes and
Development and implementation domains should be given attention to. EA training focusing on these
domains might help to achieve higher maturity levels.
This paper has some limitations which authors would like to express. The number of the respondents
(n=19) is too low to make definitive statistical conclusions. There are 40 HEIs in Finland, so, at best,
the respondents represent 47.5% of the Finnish HE sector. Therefore, the results and conclusions
should be regarded as indicative.
Authors encourages other European HEIs to conduct similar studies to explore the current and future
maturity of EA. European wide research would allow HEIs to benchmark their performance against
peers and plan their development activities accordingly.
6. REFERENCES CSC. (2013). KARTTURI 2.2 - Korkeakoulujen kokonaisarkkitehtuurin menetelmäopas. (Enterprise Architecture
method guide for Higher Education Institutions). (Vol. 2nd). Helsinki: CSC Tieteen tietotekniikan
keskus Oy.
Finnish Ministry of Finance. (2011). Act on Information Management Governance in Public Administration
(643/2011). Retrieved from
https://www.vm.fi/vm/en/04_publications_and_documents/03_documents/20110902ActonI
/Tietohallintolaki_englanniksi.pdf
EUNI 90
90
Finnish Ministry of Finance. (2015). Tietoja valtion tietohallinnosta 2014. Valtiovarainministeriön julkaisuja
27/2015. (Facts on information management of Finland 2014. Publications of the Ministry of Finance
27/2015). (Finnish Ministry of Finance,). Helsinki: Ministry of Finance Retrieved from
http://vm.fi/julkaisu?pubid=6408.
Grajek, S. (2016). Top 10 IT Issues, 2016: Divest, Reinvest, and Differentiate,EDUCAUSE review (pp. 10-63).
Retrieved from http://er.educause.edu/~/media/files/articles/2016/1/erm1611.pdf.
Hiekkanen, K., Korhonen, J. J., Collin, J., Patricio, E., Helenius, M., & Mykkanen, J. (2013, 15-18 July 2013).
Architects' Perceptions on EA Use -- An Empirical Study. Paper presented at the Business Informatics
(CBI), 2013 IEEE 15th Conference on.
Kella, T. (2014). Kokonaisarkkitehtuurin tila ja periaatteet Suomen korkeakouluissa. Retrieved from
https://confluence.csc.fi/download/attachments/31819654/KA-
ty%C3%B6n+ja+https://confluence.csc.fi/download/attachments/31819654/KA-ty%C3%B6n+ja+-
periaatteiden+status+20140218.pdfperiaatteiden+status+20140218.pdf
Lemmetti, J., & Pekkola, S. (2012). Understanding Enterprise Architecture: Perceptions by the Finnish Public
Sector. In H. Scholl, M. Janssen, M. Wimmer, C. Moe, & L. Flak (Eds.), Electronic Government (Vol.
7443, pp. 162-173). Berlin: Springer.
Pehkonen, J. (2013). Early Phase Challenges and Solutions in Enterprise Architecture of Public Sector.
(Master's Degree Programme in Information and Knowledge Management), Tampere University of
Technology, Tampere. Retrieved from
http://dspace.cc.tut.fi/dpub/bitstream/handle/123456789/21449/Pehkonen.pdf
Seppänen, V. (2014). From problems to critical success factors of enterprise architecture adoption Vol.
201. Jyväskylä Studies in Computing (pp. 250). Retrieved from
http://urn.fi/URN:ISBN:978-951-39-5941-8
Syynimaa, N. (2015). Enterprise Architecture Adoption Method for Higher Education Institutions. (pp. 262).
Retrieved from http://www.gerenios.com
The Open Group. (2009). TOGAF Version 9. Zaltbommel, Netherlands: Van Haren Publishing.
Tuomola, J. (2014). Establishing Enterprise Architecture as a Part of Management and Development: the
Field of Health and Welfare. (Master's Degree Programme in Information and Knowledge Management),
Tampere University of Technology, Tampere. Retrieved from
http://dspace.cc.tut.fi/dpub/bitstream/handle/123456789/22744/Tuomola.pdf
7. AUTHORS’ BIOGRAPHIES
Dr. Nestori Syynimaa MBCS CITP works as an Enterprise Architect for CSC -
Finnish IT Center for Science, as a freelance trainer for the leading Finnish
ICT-training company Sovelto Plc, and is the founder of Gerenios Ltd. He is also a
member of the Finnish EA-SIG. His is experienced trainer in Enterprise Architecture
and Office 365. Previously he has worked as CIO, CTO, and senior consultant in ICT
industry since 2000. He holds BBA from Seinäjoki University of Applied Sciences and
M.Sc. (Econ. & BusAdm with major in CS) from University of Vaasa, Finland. He
received his Ph.D. from Henley Business School, University of Reading, UK. His second
Ph.D. dissertation on EA is under pre-examination in University of Jyväskylä, Finland.
He also holds several industry certificates including TOGAF, ITIL, Microsoft Certified
Trainer, Microsoft Certified Educator, and MCSA (Office 365).
Patrik Maltusch is the head of EA architecture team at Aalto University, Finland.
He is also chairman of the Finnish EA-SIG and one of the lead educators who have
coached administration staff in the national Higher Education EA schooling program.
Past experience include working as a customer service instructor for nearly ten years
and further fifteen years as network architect and business owner for internal
infrastructure design in a global Telco company. Patrik is also a distinguished and
accredited security professional, risk manager, system auditor and a certified Higher
Education Enterprise Architect. As entrepreneur and start up facilitator Patrik
understands what staying practical means for business. For Patrik interoperability is
the key to success in an ever growing and more complex and complicated ecosystem
landscape. Something that can be achieved using EA methodology in a more
EUNI 91
91
visualized way.
Esa Suominen works as an Enterprise Architect at Helsinki Metropolia
University of Applied Sciences. He is also secretary of the Finnish EA-SIG. He has
long experience in IT sector at HE Institute. He has worked as Team leader at
Information System Development group, Project Manager, IT Manager and in IT
Support. He holds M. Sc. from University of Lappeenranta, Finland. He is
interested in to implement Enterprise architecture and Project Portfolio
Management in practical way at organisations.
EUNI 92
92
The Future of IT Management: A Longitudinal Qualitative Review
Noel Wilson1 and Johan Bergström2
1 BALLYMENA, Northern Ireland, BT42 2BT, [email protected]
2 ICT Services and System Development (ITS), Umeå University, 901 87 Umeå, Sweden,
Keywords IT Management, IT Leadership, IT Strategy, CIO
1. Summary
This paper is a sequel to the 2015 paper “EUNIS Congress' 21st Birthday: A Historical Perspective on its
Proceedings”. Its focus is on IT management activities as interpreted from information available in the “EUNIS
Proceedings repository”. Papers on non-technical aspects of IT management are a small percentage of those
presented over the Congress’ 21 year history; they fall under several tracks, however by “drilling down” into
abstracts and keywords an indication of “hot topics” is possible.
IT management foci have seen paradigm shifts from emphasis on operational and service management through
customer relations and strategic management, then governance and ‘top table’ participation. Technological
advances are impacting significantly upon society, with the pace of change being rampant. With the
socialization of IT and the personalization of “smart” devices are we confronting a future where current IT
management emphasis needs to change in terms of an ability to keep pace with an agile environment? What
skills are necessary if IT leadership is to be in tune with institutional requirements and capable of delivery so
as to maintain competitive advantages? Is the successive reliance on conventional management practices agile
enough in the present time? Are we at a crossroads where present management emphasis is at variance with a
need to be an innovative leader identifying and devising technology-rich environments that are abreast of our
student generation? Some challenges and approaches to them are outlined in response to these questions,
calling upon research elsewhere in the Higher Education (HE) sector and in business literature.
2. IT MANAGEMENT: HISTORICAL CONTEXT
IT managerial skills and experiences have changed considerably since the early establishment of centralized
computer departments, say, from the late 1950s onwards. “Early days” managerial competencies focused on
“running hardware” with little attention given to users, apart from researchers and their compute
requirements. Considering this era as “first generation management”; the emphasis was on technical and
operational knowledge and experience where the management function often resided with persons whose
experience was gained through direct use of the technology. Over the past 50 years a transition from a
technical specialist to board-level strategist has evolved.
As the application of computing diversified to encompass non-scientific and non-engineering disciplines the
need to recognize support requirements arose. Also, administrative computing began to develop, often as a
separate organizational unit. The emergence of early organizational structures included a “user support”
function sitting alongside, typically, a “systems” and “operations” function, however managerial oversight
remained predominately a technical responsibility.
In the 1970s, as organizational structures developed those who held responsibility for functional areas became
eligible for promotion to managerial positions. Concurrently, user bases were expanding with undergraduates
now using computers and the presence of mini and microcomputers bringing about a broader spectrum of
support services. The transition from a technical specialist manager towards an appreciation of wider service
needs began. Their departmental subordinates were the “technical brains” who helped steer technical and
operational needs. Relationships with peers in finance and staffing completed the portfolio of senior
managerial requirements commensurate with the era.
EUNI 93
93
With the 1980s came further managerial developments, including mergers of library and IT departments as
information in digital formats became de rigueur. In a number of UK institutions the merged department
came under the leadership of persons with a librarianship background, indicating transition towards user
centric strategic developments. Moving to the next decade, the ubiquity of IT was evident with major changes
in the types of applications used in the academic world, demands for new management information systems
to support the academic function, personal devices routinely used by students and digital networking pushing
physical boundaries for IT use. Then, IT management became a boardroom level function due to its criticality
to institutional competitiveness, as management information systems became the life blood of the business.
Consultancy assignments replaced or complemented major in-house developments as a way of injecting new
thinking and new knowledge into projects, perhaps indicating a more “open” approach to human resource
provision.
The new millennium heralded further changes with many novel applications being harnessed, especially by
the Y-Generation who were now in tertiary education as technically savvy Information Age students. The
habitual use of social media, mobile devices and an ever increasing range of relevant freeware served to
further delineate what should, and should not, be the strategic direction of centralized departments. As the
millennium progresses so has the constraints on budgets due to the economic downturn and the increasing
dependency on IT to support the institution’s business. Availability of commercial software and consultancy
services alongside the ever-evolving “in the cloud computing” opportunities are impacting the HE sector as
institutions seek to keep pace with information requirements. Can internal human resources and the
corresponding knowledge base alone sustain the needs of a progressive tertiary education sector? Emerging
technologies is a buzz phrase that succinctly encapsulates the paradigm within which IT seems to now be
permanently seated. On the other hand, and against strong external pressures, the sector is confronting
flexibility and sustainability issues as a constant demand. What can be achieved? Today emphasis is focused
more towards strategic and leadership matters than technology; the capability to deliver business value using
technological platforms with lowest ‘total cost of ownership’ is a greater challenge than an exclusively
technological one. The continuing decline of government funding, especially in the UK but also elsewhere,
coupled with increased competitiveness and the constant need for information services see the Chief
Information Officer’s (CIO’s) roles extend far beyond the technology; they contribute to a vision for
institutional change and act as a catalyst to bring about these changes.
3. MANAGERIAL CHALLENGES
Myriad phrases populate the literature when the pace of change in IT is discussed. Today’s business emphasis
focuses on information and data including analytics, privacy and security aspects and “the cloud” with its
many ramifications for how IT is provided and managed. The proliferation of mobile devices pushes the
“technology everywhere” agenda whether for staff or students. Mobility is but one dimension of the “internet
of things”, with cloud computing presenting opportunities not even conceived a few years previously. These
technologies are the tip of an emerging technologies iceberg. Looking at the UK’s UCISA “Strategic Challenges
for IT Services” report (2013) we note that effective governance, choice of appropriate delivery model, use of
consultancy, process improvement and ‘corporate data issues’ inhibiting value optimization from Business
Intelligence applications are some of the key challenges. Educause’s 2016 “Top 10” list (2016) promotes
“divest, reinvest and differentiate” as key themes; divest from what can be provided by others, reinvest in
the workforce skills and structures and differentiate by adopting technologies, processes and services that
align with the institution’s most strategic priorities.
Agility within a leadership context seems to balance with emerging technologies within an IT business support
context. To achieve flexibility, sustainability and a competitive edge mandates a sound and agile leadership
culture. An ability to keep abreast of new developments affords the opportunity to examine their relevance
and business worth to a progressive institution. An important question is “What level of technical knowledge
is appropriate to appraise new developments and their suitability for addressing aspects of an IT Strategic
Plan and how best can this knowledge be achieved?” With the prevalence of emphasis on management
performance, whether using Balanced Scorecards, Key Performance Metrics or Service Agreements, the need
to take “right” and “timely” decisions is critical.
The senior IT manager, along with their departmental team, is a critical link in the university’s overall
decision making process. This collective resource needs to focus on a common goal; their capability to ‘add
value to the business.’ Restructuring of organizational units is common, especially in UK universities, though
perhaps predicated by a requirement to reduce operational costs rather than as a method of strategic
realignment of skill sets. For example, customer focused developments whilst necessitating sound technical
EUNI 94
94
domain knowledge also mandates a persona with capability of building and maintaining successful human-
human relationships. ‘Back of organization’ specialist teams may not possess the social and technical skills to
be members of a ‘front of organization’ team. Similarly, retraining and the pace of retraining necessary to
keep pace with the contemporary technological world, is predicated on an aspiration to interact widely and
to possess a positive attitude towards ‘learning from others’, with less effort directed towards ‘learning by
doing’. A recent Deloitte report on “Higher Education is Evolving” (2011) discusses the roles of the CIO within
Canadian Universities, stating that “Higher education CIOs today often see themselves engaged in campus-
wide discussions and decisions that have little to do with technology.” This assertion is likely to adequately
describe the European as well as the US situation. For example, EDUCAUSE’s article by Berman et al (2014) on
“Challenge Accepted! Why CIO Is the Best Job on Campus” cites several CIOs roles, many indirectly
technology-related and many others at the very heart of institution’s vision and strategy.
4. A REVIEW OF EUNIS CONGRESS PRESENTATIONS
A qualitative review of Congress contributions associated with non-technical managerial level issues is
challenging given the nature of information available. In general terms, Eunis Congresses tend to focus on
technical matters and in its formative years there were several contributions from within the research
community. Even today technical contributions continue to feature heavily, including several that are
presented under a leadership theme given their “pushing new approaches and technologies” nature. Whilst
technical leadership is acknowledged, nevertheless the focus is upon the higher tiers of leadership; those
involved in the wider horizon gazing and actively contributing to how the overall institution is being
positioned within the higher education arena.
Using track titles and undertaking amalgamations where there are similarities across years, for
Table 1: Generic Track Titles example tracks where “leadership” or “strategy” is in the track title are combined into a generic “leadership” or “strategy” title respectively, the distribution of what may be perceived as “Csuite” presentations is as shown in
Table 1. The total of these presentations represents approximately 35% of all Congress presentations over the past 21 years. Examining when particular tracks were introduced provides some indication of when a topic became important. For example
“changing roles of computer centres” featured in
years 1997 and 1998 whereas “IT Governance” didn’t
feature until 2004, “leadership” and “strategy” in 2005 and
“new challenges” in 2010.
An examination of paper titles, abstracts (where available) and tracks provides a generalized synopsis of
management-related issues. In line with the paper’s title, effort has been made to identify contributions that
evidence an evolution of the role played by centralized IT departments.
As early as 1997, in the UK, Information Strategies (IS) were becoming topical; also in the USA the relevance
of environmental screening to strategic planning highlighted the pace of change within the HE sector. Rothery
and Hughes (1997) in discussing IS conclude that the role of central IT/Computing Services whilst not central
to the Information Strategy process, is essential in implementing IT developments contained within it, thus
reinforcing the department’s institutional commitment. The authors reinforce the importance of an IS as
opposed to the technology, highlighting a significant departure in how computing/IT is viewed. The era
brought about a new emphasis, one of wider institutional needs not only technology per se. Central IT
departmental leadership needed to grasp that subsidiary or subservient nature of an IT Strategy to the
Information Strategy; their capacity to function strategically as opposed to technologically and managerially
became more centre stage. Foster (1997), in discussing environmental screening, advised that “technology is
no longer the limiting factor. Now, more often than not, institutional culture and practice are the inhibitors
or catalysts for change”. Her remarks indicate a transition of emphasis towards “the greater good of the
institution.” Reid (1998) provides insight to changing roles of central IT departments. He mentions strategy-
and policy-related roles. Strong indications of mergers with libraries and the need to more closely IT align
with the core business of the university are articulated. His work highlights matters requiring leaders who
could identify with trends and who had the ability to operate at board level in the interest of ensuring the
salient aspects of their organizational units were understood and protected.
Generic Track Titles Count
IT Strategy 84
IT Leadership 77
IT Governance 119
IT Management 61
Changing
Roles/Structures/Challenge
s
64
EUNI 95
95
In 1999 Congress’s focus turned towards technological innovations. Whilst “IT Strategy” and interuniversity
collaboration featured nevertheless these presentations adopted a stance around technologies. The topic of
“University Management” featured in 2000 though presentations focused on technologies including knowledge
management and national networking initiatives. Similarly in 2001, the tracks “Changes in University
Organisation and Structure” gave consideration to technology, for example the use of the internet to support
“anytime-anywhere support services”. This was the only topic that clearly provided opportunity for strategic
leadership contributions. The 2002 event’s programme continued with themes broadly aligned to those in the
preceding three years though Law’s (2002) keynote presentation on “Planning and designing IS for university
management” provided that higher level of non-technical leadership focus. Furthermore, as a keynote
presentation, it reinforced the continuance of importance of IS’s from their emergence some five years
earlier. Amsterdam’s Congress, in 2003, heavily featured the “e-topics” (e-Learning, e-University and e-
Science), with the Gartner keynote presentation on “Higher Education: the state of the technology”. The first
decade of Eunis Congresses concluded with the 2004 Congress theme of “IT Innovation in a Changing World”.
The tracks addressed continued to feature aspects of transactional leadership with grid computing, various
applications of commercial products to “e-scenarios” and IT governance much to the fore.
By 2005, tracks included “Strategy” and “Governance and Leadership” headings alongside technologyrelated
topics including middleware, e-learning and information systems. 2006 continued with “Strategy” and the
introduction of a session on “Leadership: Effective Management” complemented by tracks comparable to the
immediate past Congresses. Regrettably abstracts are unavailable to ascertain the nature of paper
contributions though paper titles indicate discussions around leadership and IS developments, the role of IT in
shaping an organization, customer focus and leading and managing. Apart from a track incorporating “IT
governance and strategy” the 2007 Congress track list returned its attention to technologies including
implications associated with mobile device use, IT support for the Bologna process, identity management and
security and “e-themes”. 2007’s keynote address, by Zastrocky, titled “IT leadership and the Role of the CIO”
identified the upcoming shortage of IT leaders and the role and requirement for Chief Information Officers
(CIOs). His research on CIO roles reinforces a 21stC requirement for these persons to be “full spectrum”
contributors to the organization’s most senior executive team (Zastrocky, 2000). In 2008 three tracks
featured “management”, namely “managing processes”, “Managing IT projects” and “Managing IT
Infrastructure and Data Centres”. Based on the associated abstracts, each paper focused on what may be
considered to incorporate elements of organizational leadership; leadership incorporating strategy execution
and the facilitation of change based around adoption of new technologies and new processes. For example
data centre virtualization, standards adoption e.g. associated with ITIL ® and COBIT ®, podcasting and various
software technologies were discussed. Moving to 2009, technologies, identity management, e-learning,
security and web-based solutions dominated, with “IT Governance” the only observed track providing a
strategic and potentially pan-national approach to governance (Fernández and Llorens, 2009). A similar suite
of tracks featured in 2010, with the introduction of a “New Challenges” track serving to capture papers
discussing the potential value of specific technologies to learning, teaching and administration. The 2012
Congress saw “Leadership” return to the track list where associated contributions focused on the academic
realms of the university. Moving to 2013, “Leadership and Governance” was a track within which
benchmarking, departmental reorganization and approaches to IT governance based around the ISO Standard
featured. The role of Chief Information Officers (CIOs) first featured in a track title; “CIO and IT
Management”, in 2014. The associated papers, similar to in 2012, featured technologies (e.g. Microsoft Lync
and cloud computing) apart from Wilson’s (2014) where changes within HE and Institution’s IT demands
impacted upon central IT department’s roles and organizational structures. Last year’s Congress (2015)
featured a track titled “Leadership, Management and Governance (Surveys).” Hotzel et al (2015) provided an
interesting survey of CIO types within the German University sector; other papers within the track focused on
technologies with enterprise architecture, based around COBIT, being used to assess the value that IT adds to
an institution (Westerlund, 2015).
The synopsis illustrates the substantial variability perceived to exist across the history of the Congress, yet
where presentations indicative of “C-suite” matters arise it is interesting to note the ebb and flow of key
issues. Changing roles and structures within IT departments featured from 1997 to 2001; IT governance was
evident during the period 2004 to 2009; IT strategy during 2005 to 2012 and IT Leadership from 2005 through
to 2015. Whilst each track did not feature in each year of the time intervals nevertheless an indication of the
prevalence of the topic is acquired.
5. WHAT IS THE FUTURE FOR LEADERSHIP AND MANAGEMENT?

EUNI 96
96
Positions that fall within the “C-suite” classification, such as the CIO or “IT leader”, vary in their
responsibility portfolios and some smaller institutions may not incorporate the word “chief” in senior IT titles.
Hopkins and Clarke (2013) provided a thought-provoking glimpse at how institutional IT roles could change,
quoting Jon Madonna, “Nothing stops an organization faster than people who believe that the way you worked
yesterday is the best way to work tomorrow.” The emphasis on changes of skills and competencies is strongly
stated. In 2014, Eriksson focused on managerial attributes relevant in today’s agile world. Both contributions
touch upon technological, political, financial and social changes as they influence the environment within
which the successful IT leader operates. Moving forward over the next few years it is likely to be the case that
“change will be a constant” whether technologically or otherwise. Quoting, from George Orwell, “If people
cannot write well, they cannot think well, and if they cannot think well, others will do their thinking for
them”, the latter part of his expression ably sums up the criticality of effectiveness for leaders and managers.
However, can we expect a university to recruit, retain and develop the portfolio of skills necessary to keep
ahead of the changes it faces? “Probably not” for many institutions however a culture of acceptance of
consultancy, reports from trusted community sources (e.g. Educause, EUNIS, and UCISA) and
networking/partnering with fellow institutions may help alleviate the skills and workforce pain.
Considering the initial question “Are we confronting a future where past and current management emphasis
needs to change?” indications are that the answer is “Yes” and that change does take place, whether through
restructuring, role changes or approaches to service provisioning. For example, the maturity of modern
ubiquitous technologies, the socialization of IT and the personalization of “smart” devices serve to demystify
the technical aspects with resulting changes in demand on support services. The management of the IT
support function is on a transition towards customer service, quality and performance management, and
“any-time any-where” access. Strategic opportunities to avail of offcampus support from providers such as
NorMAN and UniDesk are outsourcing options. In the UK the Joint Information Systems Committee (JISC)
provides a contemporary and comprehensive portfolio of services to support institutions, whether by
analyzing IT expenditures, providing access to a shared data service framework or producing a comprehensive
suite of “state of the art” reports across a range of issues relevant to technology and its implications for
teaching and learning, research and administration. The “X as a Service” (XaaS) model, of which the
preceding examples are part, is sufficiently mature to become an alternative to in-house provision. The
capacity to evaluate, select, implement and then successfully manage XaaS developments mandates expertise
such as contract management, relationship management and negotiation. Whilst these skills are not a new
requirement, nevertheless they are likely to be the skillset of key persons if an institution pursues the
displacement, for example, of aspects of data centre services with an “IT as a Service” (ITaaS) provider. An
appetite for retraining may be needed. Change is inevitable within management practices; no longer is it
timely, economic or strategic to expect to have oversight of key business needs and concurrently devise and
implement bespoke solutions. The future of effective management resides in the territories of collaboration,
business partnerships and the effective transformation of staff skills and aspirations towards enhanced social
networking, greater acceptance of solutions already proven elsewhere and the internal dissolving of technical
organizational barriers. The preceding comments relate to “within organizational unit” strategic matters
however the leadership role to evolve change must be in tune with “board level” requirements and be
capable of delivering change within their scope where the action underpins competitive advantages for their
institution. Conventionally the identification of managerial and leadership skills has been based on theoretical
models of the “quadrant type” or “personality trait assessment tools”. These approaches compartmentalize
persons based on perceived strengths however agile environments may blur boundaries to mandate greater
levels of risk taking, greater flexibility in terms of roles, responsibilities and decision making and more
frequently dealing with business and technological issues that are beyond one’s “comfort zone” of knowledge
and experience. Transformational leaders are needed in an agile environment, those with a vision, a
capability to inspire others and to contribute to cultural change. Findings of the Educause report “Todays
Higher Education IT Workforce” (2014) are pertinent regarding non-technical skills and appetites to reskill for
“non-managerial” staff.
Regarding the question concerning “level of technical knowledge appropriate to appraise new developments
and their suitability for addressing aspects of an IT Strategic Plan”, the answer should have cognizance of
what aspects will be in-house and necessitate local business intelligence, for example those associated with
information management and business intelligence. Analytical skills coupled with a capability to effectively
interact with other senior business unit staff are required.
Keeping pace in an agile environment encompasses government policy, the institution’s student catchment
and the execution of the university’s mission statement. IT leadership that demonstrates acuity in this wider
context, a strong track record of ‘horizon scanning’, the ability to identify need for change and execute
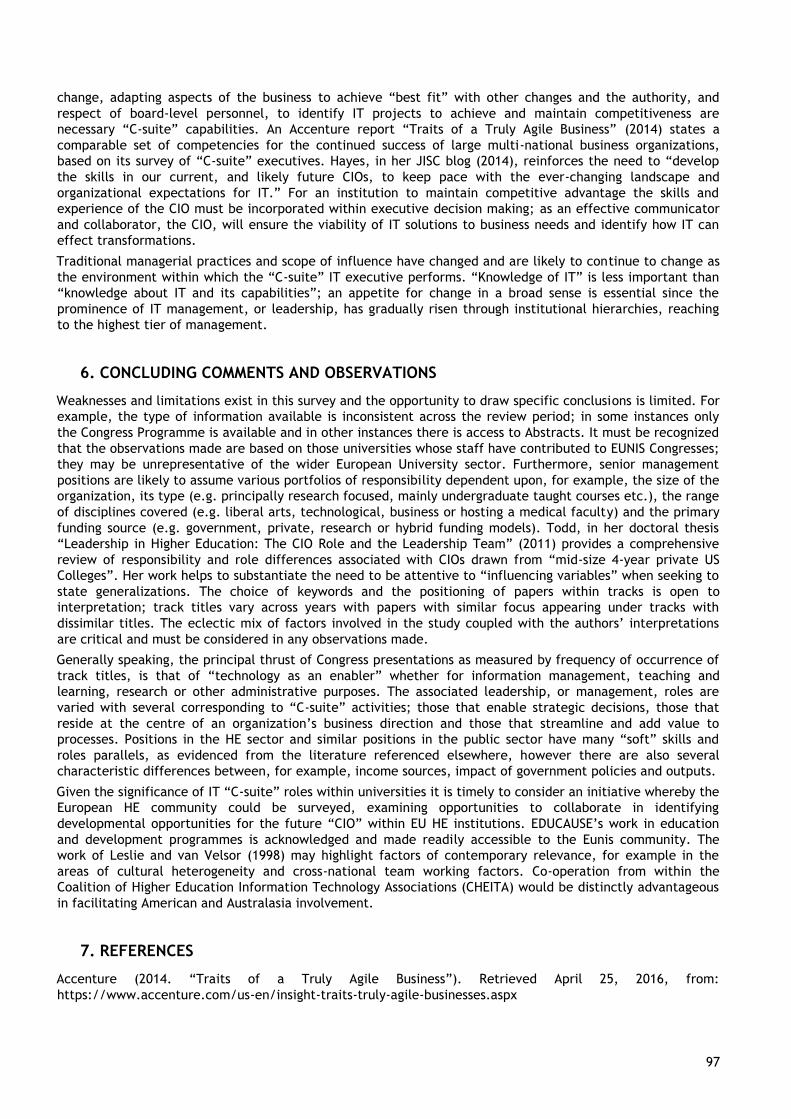
EUNI 97
97
change, adapting aspects of the business to achieve “best fit” with other changes and the authority, and
respect of board-level personnel, to identify IT projects to achieve and maintain competitiveness are
necessary “C-suite” capabilities. An Accenture report “Traits of a Truly Agile Business” (2014) states a
comparable set of competencies for the continued success of large multi-national business organizations,
based on its survey of “C-suite” executives. Hayes, in her JISC blog (2014), reinforces the need to “develop
the skills in our current, and likely future CIOs, to keep pace with the ever-changing landscape and
organizational expectations for IT.” For an institution to maintain competitive advantage the skills and
experience of the CIO must be incorporated within executive decision making; as an effective communicator
and collaborator, the CIO, will ensure the viability of IT solutions to business needs and identify how IT can
effect transformations.
Traditional managerial practices and scope of influence have changed and are likely to continue to change as
the environment within which the “C-suite” IT executive performs. “Knowledge of IT” is less important than
“knowledge about IT and its capabilities”; an appetite for change in a broad sense is essential since the
prominence of IT management, or leadership, has gradually risen through institutional hierarchies, reaching
to the highest tier of management.
6. CONCLUDING COMMENTS AND OBSERVATIONS
Weaknesses and limitations exist in this survey and the opportunity to draw specific conclusions is limited. For
example, the type of information available is inconsistent across the review period; in some instances only
the Congress Programme is available and in other instances there is access to Abstracts. It must be recognized
that the observations made are based on those universities whose staff have contributed to EUNIS Congresses;
they may be unrepresentative of the wider European University sector. Furthermore, senior management
positions are likely to assume various portfolios of responsibility dependent upon, for example, the size of the
organization, its type (e.g. principally research focused, mainly undergraduate taught courses etc.), the range
of disciplines covered (e.g. liberal arts, technological, business or hosting a medical faculty) and the primary
funding source (e.g. government, private, research or hybrid funding models). Todd, in her doctoral thesis
“Leadership in Higher Education: The CIO Role and the Leadership Team” (2011) provides a comprehensive
review of responsibility and role differences associated with CIOs drawn from “mid-size 4-year private US
Colleges”. Her work helps to substantiate the need to be attentive to “influencing variables” when seeking to
state generalizations. The choice of keywords and the positioning of papers within tracks is open to
interpretation; track titles vary across years with papers with similar focus appearing under tracks with
dissimilar titles. The eclectic mix of factors involved in the study coupled with the authors’ interpretations
are critical and must be considered in any observations made.
Generally speaking, the principal thrust of Congress presentations as measured by frequency of occurrence of
track titles, is that of “technology as an enabler” whether for information management, teaching and
learning, research or other administrative purposes. The associated leadership, or management, roles are
varied with several corresponding to “C-suite” activities; those that enable strategic decisions, those that
reside at the centre of an organization’s business direction and those that streamline and add value to
processes. Positions in the HE sector and similar positions in the public sector have many “soft” skills and
roles parallels, as evidenced from the literature referenced elsewhere, however there are also several
characteristic differences between, for example, income sources, impact of government policies and outputs.
Given the significance of IT “C-suite” roles within universities it is timely to consider an initiative whereby the
European HE community could be surveyed, examining opportunities to collaborate in identifying
developmental opportunities for the future “CIO” within EU HE institutions. EDUCAUSE’s work in education
and development programmes is acknowledged and made readily accessible to the Eunis community. The
work of Leslie and van Velsor (1998) may highlight factors of contemporary relevance, for example in the
areas of cultural heterogeneity and cross-national team working factors. Co-operation from within the
Coalition of Higher Education Information Technology Associations (CHEITA) would be distinctly advantageous
in facilitating American and Australasia involvement.
7. REFERENCES
Accenture (2014. “Traits of a Truly Agile Business”). Retrieved April 25, 2016, from:
https://www.accenture.com/us-en/insight-traits-truly-agile-businesses.aspx
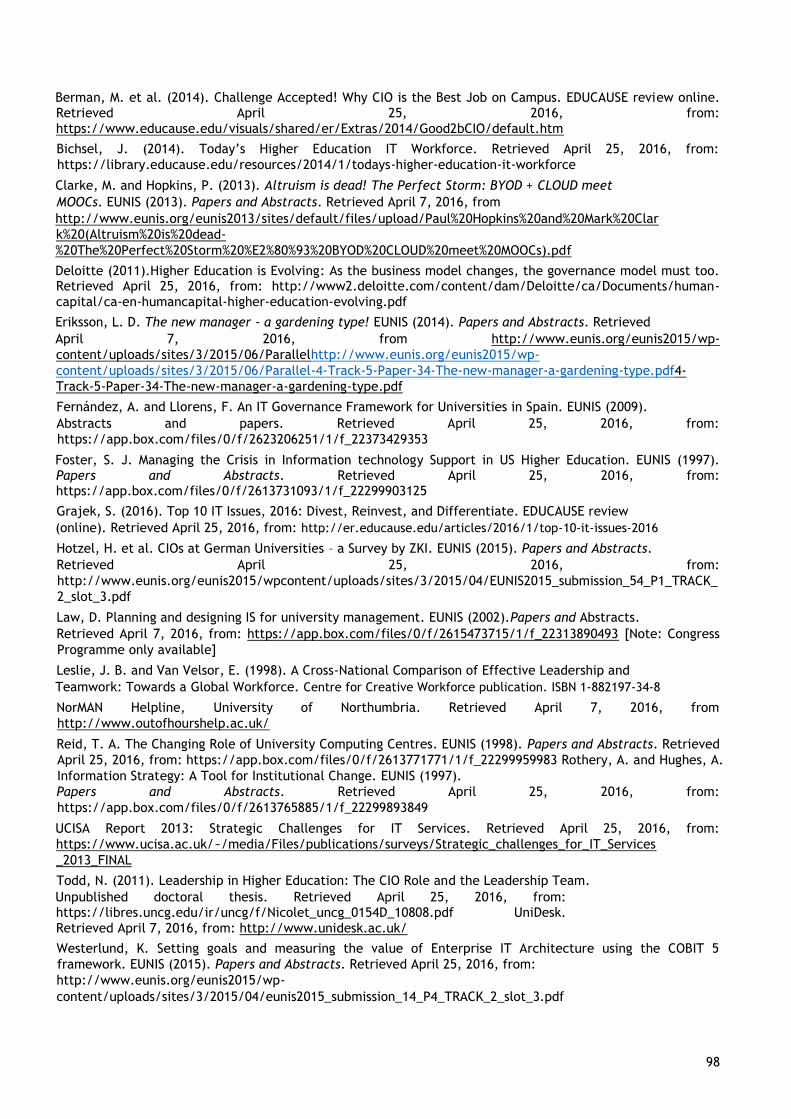
EUNI 98
98
Berman, M. et al. (2014). Challenge Accepted! Why CIO is the Best Job on Campus. EDUCAUSE review online. Retrieved April 25, 2016, from:
https://www.educause.edu/visuals/shared/er/Extras/2014/Good2bCIO/default.htm
Bichsel, J. (2014). Today’s Higher Education IT Workforce. Retrieved April 25, 2016, from:
https://library.educause.edu/resources/2014/1/todays-higher-education-it-workforce
Clarke, M. and Hopkins, P. (2013). Altruism is dead! The Perfect Storm: BYOD + CLOUD meet
MOOCs. EUNIS (2013). Papers and Abstracts. Retrieved April 7, 2016, from
http://www.eunis.org/eunis2013/sites/default/files/upload/Paul%20Hopkins%20and%20Mark%20Clar
k%20(Altruism%20is%20dead-
%20The%20Perfect%20Storm%20%E2%80%93%20BYOD%20CLOUD%20meet%20MOOCs).pdf
Deloitte (2011).Higher Education is Evolving: As the business model changes, the governance model must too. Retrieved April 25, 2016, from: http://www2.deloitte.com/content/dam/Deloitte/ca/Documents/human-
capital/ca-en-humancapital-higher-education-evolving.pdf
Eriksson, L. D. The new manager - a gardening type! EUNIS (2014). Papers and Abstracts. Retrieved
April 7, 2016, from http://www.eunis.org/eunis2015/wp-
content/uploads/sites/3/2015/06/Parallelhttp://www.eunis.org/eunis2015/wp-
content/uploads/sites/3/2015/06/Parallel-4-Track-5-Paper-34-The-new-manager-a-gardening-type.pdf4-
Track-5-Paper-34-The-new-manager-a-gardening-type.pdf
Fernández, A. and Llorens, F. An IT Governance Framework for Universities in Spain. EUNIS (2009).
Abstracts and papers. Retrieved April 25, 2016, from:
https://app.box.com/files/0/f/2623206251/1/f_22373429353
Foster, S. J. Managing the Crisis in Information technology Support in US Higher Education. EUNIS (1997). Papers and Abstracts. Retrieved April 25, 2016, from: https://app.box.com/files/0/f/2613731093/1/f_22299903125
Grajek, S. (2016). Top 10 IT Issues, 2016: Divest, Reinvest, and Differentiate. EDUCAUSE review
(online). Retrieved April 25, 2016, from: http://er.educause.edu/articles/2016/1/top-10-it-issues-2016
Hotzel, H. et al. CIOs at German Universities – a Survey by ZKI. EUNIS (2015). Papers and Abstracts.
Retrieved April 25, 2016, from:
http://www.eunis.org/eunis2015/wpcontent/uploads/sites/3/2015/04/EUNIS2015_submission_54_P1_TRACK_
2_slot_3.pdf
Law, D. Planning and designing IS for university management. EUNIS (2002).Papers and Abstracts.
Retrieved April 7, 2016, from: https://app.box.com/files/0/f/2615473715/1/f_22313890493 [Note: Congress
Programme only available]
Leslie, J. B. and Van Velsor, E. (1998). A Cross-National Comparison of Effective Leadership and
Teamwork: Towards a Global Workforce. Centre for Creative Workforce publication. ISBN 1-882197-34-8
NorMAN Helpline, University of Northumbria. Retrieved April 7, 2016, from
http://www.outofhourshelp.ac.uk/
Reid, T. A. The Changing Role of University Computing Centres. EUNIS (1998). Papers and Abstracts. Retrieved
April 25, 2016, from: https://app.box.com/files/0/f/2613771771/1/f_22299959983 Rothery, A. and Hughes, A.
Information Strategy: A Tool for Institutional Change. EUNIS (1997).
Papers and Abstracts. Retrieved April 25, 2016, from:
https://app.box.com/files/0/f/2613765885/1/f_22299893849
UCISA Report 2013: Strategic Challenges for IT Services. Retrieved April 25, 2016, from:
https://www.ucisa.ac.uk/~/media/Files/publications/surveys/Strategic_challenges_for_IT_Services
_2013_FINAL
Todd, N. (2011). Leadership in Higher Education: The CIO Role and the Leadership Team.
Unpublished doctoral thesis. Retrieved April 25, 2016, from: https://libres.uncg.edu/ir/uncg/f/Nicolet_uncg_0154D_10808.pdf UniDesk.
Retrieved April 7, 2016, from: http://www.unidesk.ac.uk/
Westerlund, K. Setting goals and measuring the value of Enterprise IT Architecture using the COBIT 5
framework. EUNIS (2015). Papers and Abstracts. Retrieved April 25, 2016, from:
http://www.eunis.org/eunis2015/wp-
content/uploads/sites/3/2015/04/eunis2015_submission_14_P4_TRACK_2_slot_3.pdf
EUNI 99
99
Wilson, N. Information Technology - In Transformation: Organizational Structure Implications? EUNIS (2014).
Papers and Abstracts. Retrieved April 25, 2016, from: http://www.eunis.org/eunis2014/papers/
Zastrocky, M. R. and Schlier, F. (2000). The higher education CIO in the 21st century. EDUCAUSE Quarterly,
23(1), 58–59.
8. AUTHORS’ BIOGRAPHIES
Noel Wilson holds a Master in Mathematics from Ulster University. He
is a Chartered IT Professional and a Fellow of the British Computer
Society. His career in the HE sector spanned 41 years, with 35 spent
in various managerial roles. In July 2005 the University awarded him
a Distinguished Learning Support Fellowship for his contributions to
IT and media service developments. His LinkedIn reference is:
http://www.linkedin.com/pub/noel-wilson/15/476/91a
Johan Bergström manages the EUNIS ERAI project. He is employed as
a
Project Manager and International Business Co-ordinator at the
University of
Umeå. He graduated from Uppsala University with a Bachelor in
Computer Science and Linguistics. He has held various positions in
industry and higher education. Johan’s expertise includes project
management, consulting, business analysis, coaching and training.
His LinkedIn reference is:
https://www.linkedin.com/profile/in/johanbergstrom
EUNI 100
100
EUNIS 2016: Enter the mindset of a hacker. Why? Because to protect against hackers, you have to think as
one!
1st Asbjørn Reglund Thorsen
FSAT, Fridtjof Nansens vei 17, 0369 Oslo, [email protected]
Keywords
Security, hackers, live-demos, mindset, dark-web, tor-browser
1. Summary
Even the best security researchers can fall for hackers trickery, so how on earth should you expect an ordinary
person to make good enough security precautions? To protect against hackers you have to think as one. In this
talk the speaker will show with several live demos how hackers might attack you in the every day life and how
easy it is to get hacked.
2. ABOUT THE EXTENDED ABSTRACT
A good hacker has both great skills and great tools to compromise you as a target. In this talk the presenter
will show, by examples, how hackers easily can pinpoint you or your company with easy to use tools and some
cunning techniques.
This talk has several live demos and all of them should be quite easy to understand and several possible
precaution tips will be shown.
One demo shows how an attacker easily can become man in the middle without the victim even touching the
computer/tablet/pad/mobile. Another demo will show how a hacker can plant a device in your company’s
network and easily get access from the internet.
The audience will be walked through several methods of hacking and a tour deep into the dark web where
hackers buy and sell credit cards, personal information, usernames and passwords etc. This market place
provides hackers and others with basically everything money can buy.
This talk is for everybody that wants to dive quickly into the world of a hacker to understand what’s out there
and that hacking is big business.
3. REFERENCES
Tor browser: https://www.torproject.org/projects/torbrowser.html.en Hak5
gadgets: http://hakshop.myshopify.com
4. AUTHORS’ BIOGRAPHIES
Asbjørn Reglund Thorsen is group leader and head of development at group Delta at FSAT, responsible for
maintaining and developing applications for the national admission services in Norway. He also works as a pen-
tester, speaker and is a co-founder of Awareness Security AS. He is board member of Open Web Application
Security Project (OWASP) in Norway and has specialized in web application security both as a pentester and
course instructor, he also likes to play with wifi pineapple and other gadgets. Linkein profile:
https://www.linkedin.com/in/reglund
EUNI 101
101
University ict security certification
Ciclosi F.1, Mauri M.
1, Polzonetti A
2
1Computer Center University of Camerino
2ELIOS srl. Spin Off University of Camerinos
Keywords
Security, Certification, ISO 27001, ISMS
1. ABSTRACT
Information security management is a key aspect in the good governance of ICT. Due to the
evolution and widespread about the Internet, organizations are easier to attack on the
information technology systems. Given the above background, the University’s IT Services and
Systems Centre (CINFO) decided to respond to external requests by trying to manage the change
in such a manner that would imply giving up an old approach, based just on technology update,
and directly aiming at managing the procedures concerning security issues. In this paper we
discute the certificate process at Camerino University and the results obtained.
2. INTRODUCTION
In the last few years, the University of Camerino has been tackling a number of challenges
concerning ICT security, both in order to comply with the increasingly stringent regulations for
Italian Pas [1], as well as to respond to sudden changes (not just the technological ones) that
have been affecting service infrastructures during the current transition from a client-server
paradigm to a new functional one. Being based on a cloud system and on software defined
networking, the new paradigm is providing the basis for a global interconnection model
involving heterogeneous and ‘smart’ devices that are typical of the so-called ‘Internet of Things’
[2].
Given the above background, the University’s IT Services and Systems Centre (CINFO) decided to
respond to external requests by trying to manage the change in such a manner that would imply
giving up an old approach, based just on technology update, and directly aiming at managing
the procedures concerning security issues.
Within such a scenario, starting from 2012, an in-depth work has been done to gradually
redefine all the IT processes, so that they could be provided under stable operating conditions,
in compliance with rules and arrangements (not just technical ones), so that confidentiality,
integrity and availability requirements could be guaranteed, even though in a general although
quantifiable manner .
The final decision to start a virtuous route that, by using the ISO 27001 certification as
operating gearing, could lead to a redefinition of internal organizational processes, was made in
response to the issues originating from the ‘Studio di Fattibilità Tecnica’ (Technical Feasibility
Study) [3], as per Art. 50-bis (‘Continuità Operativa’ (Operational Continuity)) of the ‘Codice
dell’Amministrazione Digitale’ (Digital Administration Code) (Legislative Decree No. 82/2005,
and as amended through Legislative Decree No. 235/2010) [4].
3. THE CERTIFICATION PROCESS
The certification process included the following macro activities, which were not necessarily
performed individually and consequentially:
• Definition of ISMS (Information Security Management System) perimeter
• Establishment of a shared ISMS policy
• Applicability statement (Annex A)
• Redefinition of the organizational structure
EUNI 102
102
• Implementation of a risk analysis method
• Implementation of a risk management strategy developed through improvement actions
• Definition of control effectiveness indicators
• Definition of an audit and review plan
In particular, the process started with a study and investigation phase in order to define the
perimeter of the ISMS pertaining to CINFO, including the field of application, as well as limits
and exclusions [5]. The outcome of this study phase enabled us to define the certification scope
in the following object statement: ‘Supply of connectivity, email, web portal, telephone,
hosting and management services to the University and to customers that may request them.’
Therefore, an in-depth analysis of the main services supplied by the University on behalf of
CINFO was carried out, especially focusing on their organization, infrastructures, data, devices,
networks and support technology.
In particular, an asset tree was developed for every service (BS - Business Service), in order to
map out its layout. The asset tree includes the following information units:
• IF (Information)
• SW (Software)
• HW (Hardware)
• COM (Communication devices)
• L (Locations)
• P (People – Human Resources)
Likewise, the various parties that are interested in supplying/using such services were also
identified and divided into the following groups: students, teaching staff, technical-
administration staff, external staff, public parties, private parties and external users. Then a
set of guidelines was also developed to specify the structure’s features and the requirements
set forth by the University’s policies concerning IT security. Such guidelines were conceived by
keeping in mind that they could also be applied, at a later stage, to methods and tools used for
information management. The work devoted to this phase facilitated the rise of a new kind of
awareness as regards the meaning of information security, where information started being
considered as an essential resource that is needed to carry out the University’s business
activities. Hence, given its value, it deserves to be properly regulated and protected.
The document infrastructure set up to support the certification process is composed of
regulations, roles and rules that specify how resources, including sensitive information, are to
be managed, protected and distributed within the University. In particular, each document
tackles a single security topic by describing it from any possible points of view and according to
any interests it may have for different users [6]. The documents were divided into the following
categories:
• DS – System Documents;
• PO – Organizational Procedures;
• PT – Technical Procedures;
• IO – Operating Instructions.
The classification of every single document is made by indicating a chronological number that
univocally identifies it within the corresponding category. Moreover, for the benefit of human
users, a title explaining the document’s contents is also provided. Therefore, the whole
documentation was made available to all the interested parties that were authorized
beforehand, through publication on a special web portal with limited and controlled access.
The following step saw the development of a matrix that helps to establish a correlation
between the control objectives and the controls specified in the Annex A enclosed to the ISO
27001:2005 standard [7], and its applicability to the perimeter of the above-mentioned system
(see Figure 1). Within such a context, the current state of implementation by CINFO of the
indications set forth for the various controls was also identified and detailed.
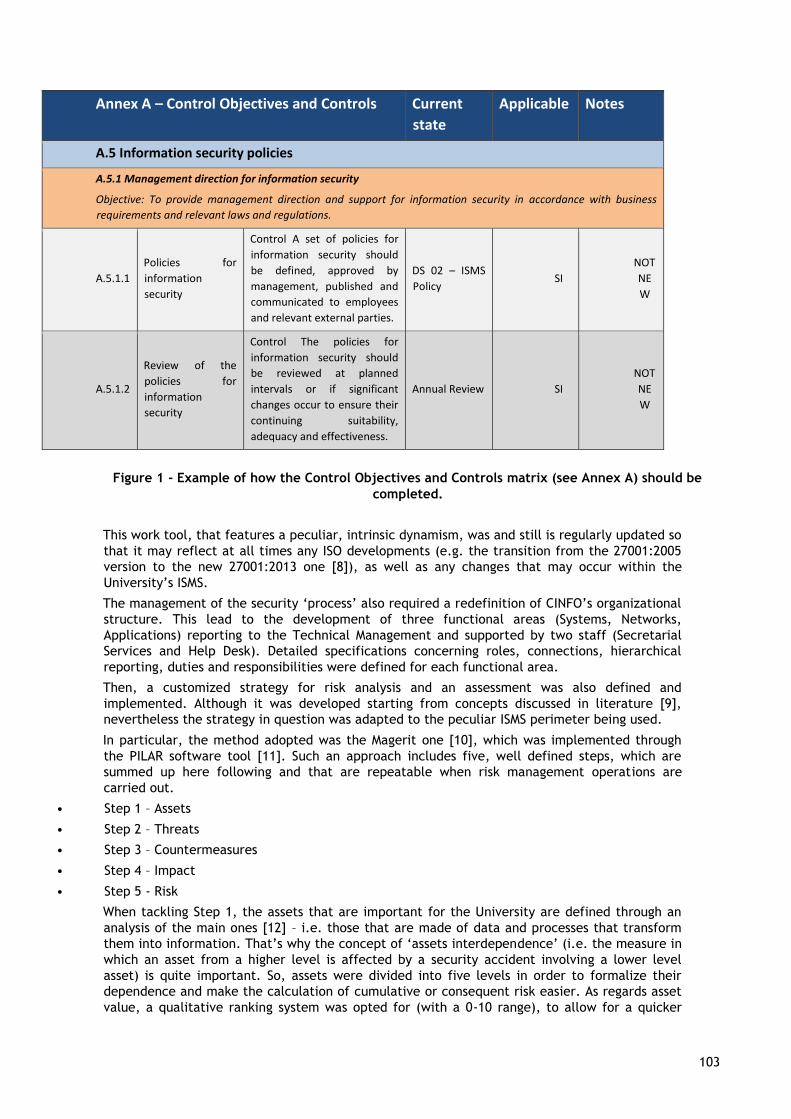
EUNI 103
103
Annex A – Control Objectives and Controls Current
state
Applicable Notes
A.5 Information security policies
A.5.1 Management direction for information security
Objective: To provide management direction and support for information security in accordance with business
requirements and relevant laws and regulations.
A.5.1.1
Policies for
information
security
Control A set of policies for
information security should
be defined, approved by
management, published and
communicated to employees
and relevant external parties.
DS 02 – ISMS
Policy SI
NOT
NE
W
A.5.1.2
Review of the
policies for
information
security
Control The policies for
information security should
be reviewed at planned
intervals or if significant
changes occur to ensure their
continuing suitability,
adequacy and effectiveness.
Annual Review SI
NOT
NE
W
Figure 1 - Example of how the Control Objectives and Controls matrix (see Annex A) should be
completed.
This work tool, that features a peculiar, intrinsic dynamism, was and still is regularly updated so
that it may reflect at all times any ISO developments (e.g. the transition from the 27001:2005
version to the new 27001:2013 one [8]), as well as any changes that may occur within the
University’s ISMS.
The management of the security ‘process’ also required a redefinition of CINFO’s organizational
structure. This lead to the development of three functional areas (Systems, Networks,
Applications) reporting to the Technical Management and supported by two staff (Secretarial
Services and Help Desk). Detailed specifications concerning roles, connections, hierarchical
reporting, duties and responsibilities were defined for each functional area.
Then, a customized strategy for risk analysis and an assessment was also defined and
implemented. Although it was developed starting from concepts discussed in literature [9],
nevertheless the strategy in question was adapted to the peculiar ISMS perimeter being used.
In particular, the method adopted was the Magerit one [10], which was implemented through
the PILAR software tool [11]. Such an approach includes five, well defined steps, which are
summed up here following and that are repeatable when risk management operations are
carried out.
• Step 1 – Assets
• Step 2 – Threats
• Step 3 – Countermeasures
• Step 4 – Impact
• Step 5 - Risk
When tackling Step 1, the assets that are important for the University are defined through an
analysis of the main ones [12] – i.e. those that are made of data and processes that transform
them into information. That’s why the concept of ‘assets interdependence’ (i.e. the measure in
which an asset from a higher level is affected by a security accident involving a lower level
asset) is quite important. So, assets were divided into five levels in order to formalize their
dependence and make the calculation of cumulative or consequent risk easier. As regards asset
value, a qualitative ranking system was opted for (with a 0-10 range), to allow for a quicker
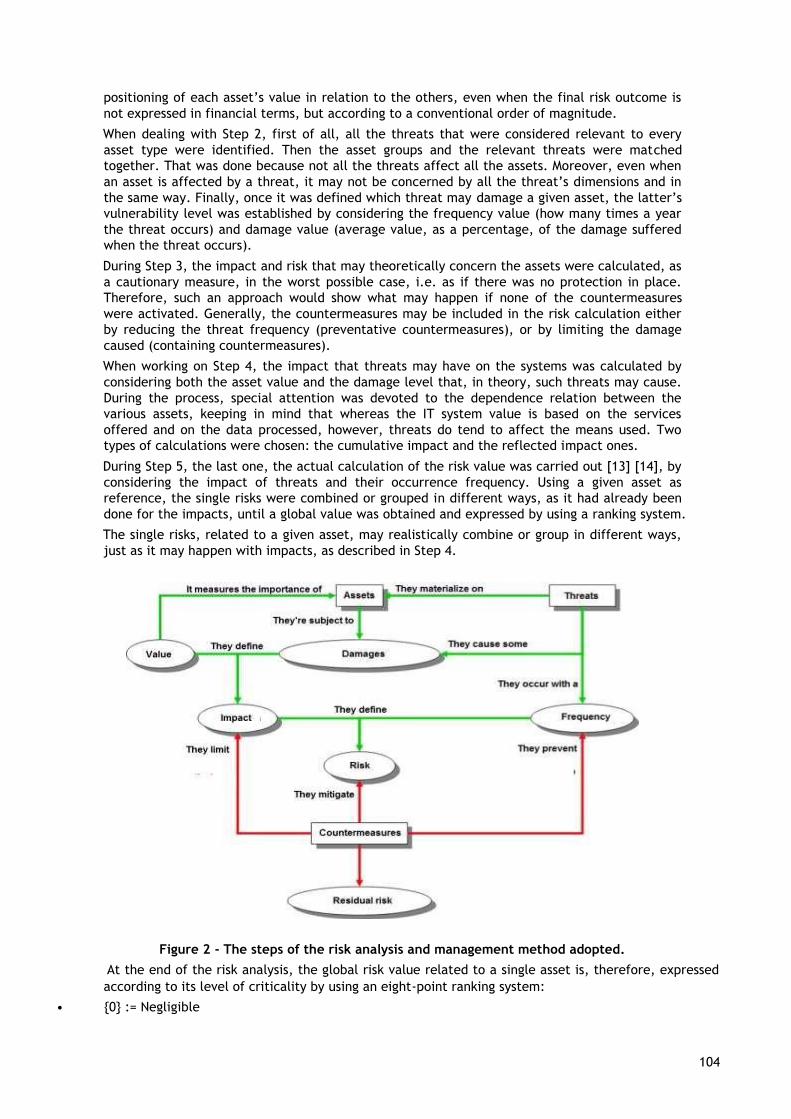
EUNI 104
104
positioning of each asset’s value in relation to the others, even when the final risk outcome is
not expressed in financial terms, but according to a conventional order of magnitude.
When dealing with Step 2, first of all, all the threats that were considered relevant to every
asset type were identified. Then the asset groups and the relevant threats were matched
together. That was done because not all the threats affect all the assets. Moreover, even when
an asset is affected by a threat, it may not be concerned by all the threat’s dimensions and in
the same way. Finally, once it was defined which threat may damage a given asset, the latter’s
vulnerability level was established by considering the frequency value (how many times a year
the threat occurs) and damage value (average value, as a percentage, of the damage suffered
when the threat occurs).
During Step 3, the impact and risk that may theoretically concern the assets were calculated, as
a cautionary measure, in the worst possible case, i.e. as if there was no protection in place.
Therefore, such an approach would show what may happen if none of the countermeasures
were activated. Generally, the countermeasures may be included in the risk calculation either
by reducing the threat frequency (preventative countermeasures), or by limiting the damage
caused (containing countermeasures).
When working on Step 4, the impact that threats may have on the systems was calculated by
considering both the asset value and the damage level that, in theory, such threats may cause.
During the process, special attention was devoted to the dependence relation between the
various assets, keeping in mind that whereas the IT system value is based on the services
offered and on the data processed, however, threats do tend to affect the means used. Two
types of calculations were chosen: the cumulative impact and the reflected impact ones.
During Step 5, the last one, the actual calculation of the risk value was carried out [13] [14], by
considering the impact of threats and their occurrence frequency. Using a given asset as
reference, the single risks were combined or grouped in different ways, as it had already been
done for the impacts, until a global value was obtained and expressed by using a ranking system.
The single risks, related to a given asset, may realistically combine or group in different ways,
just as it may happen with impacts, as described in Step 4.
Figure 2 - The steps of the risk analysis and management method adopted.
At the end of the risk analysis, the global risk value related to a single asset is, therefore, expressed
according to its level of criticality by using an eight-point ranking system:
• {0} := Negligible
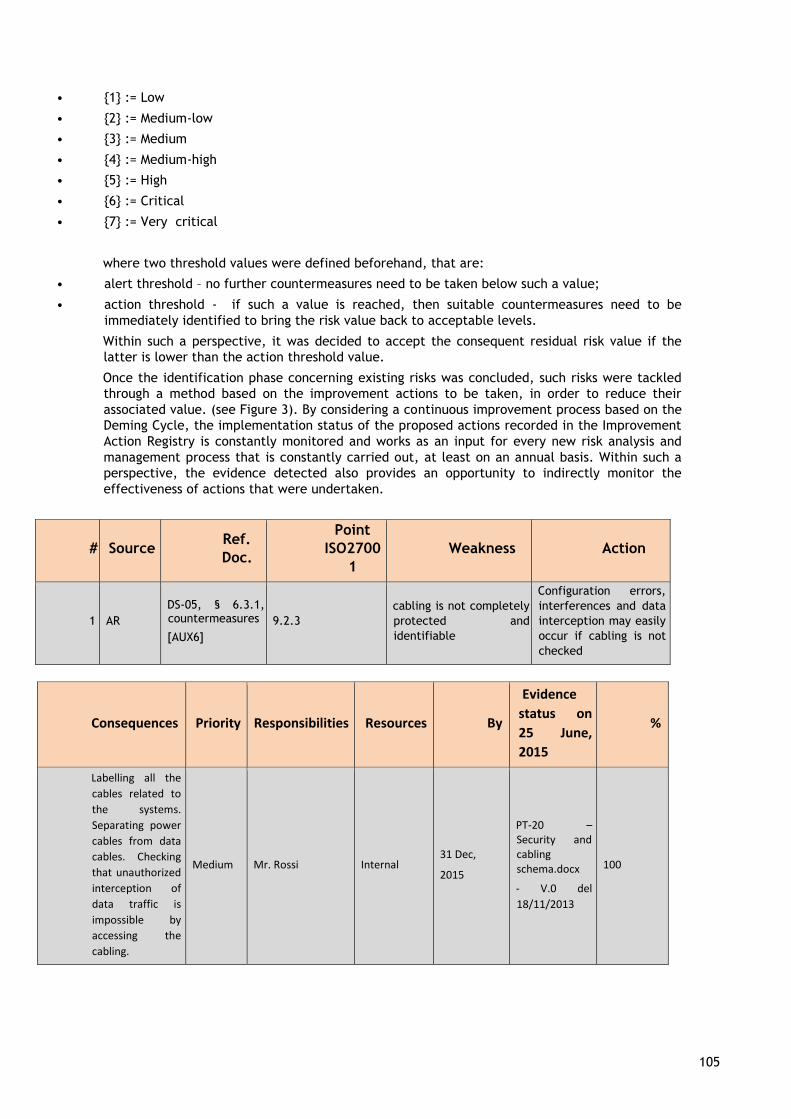
EUNI 105
105
• {1} := Low
• {2} := Medium-low
• {3} := Medium
• {4} := Medium-high
• {5} := High
• {6} := Critical
• {7} := Very critical
where two threshold values were defined beforehand, that are:
• alert threshold – no further countermeasures need to be taken below such a value;
• action threshold - if such a value is reached, then suitable countermeasures need to be
immediately identified to bring the risk value back to acceptable levels.
Within such a perspective, it was decided to accept the consequent residual risk value if the
latter is lower than the action threshold value.
Once the identification phase concerning existing risks was concluded, such risks were tackled
through a method based on the improvement actions to be taken, in order to reduce their
associated value. (see Figure 3). By considering a continuous improvement process based on the
Deming Cycle, the implementation status of the proposed actions recorded in the Improvement
Action Registry is constantly monitored and works as an input for every new risk analysis and
management process that is constantly carried out, at least on an annual basis. Within such a
perspective, the evidence detected also provides an opportunity to indirectly monitor the
effectiveness of actions that were undertaken.
# Source Ref.
Doc.
Point
ISO2700
1
Weakness Action
1 AR
DS-05, § 6.3.1, countermeasures
[AUX6]
9.2.3 cabling is not completely
protected and
identifiable
Configuration errors,
interferences and data
interception may easily
occur if cabling is not
checked
Consequences Priority Responsibilities Resources By
Evidence
status on
25 June,
2015
%
Labelling all the
cables related to
the systems.
Separating power
cables from data
cables. Checking
that unauthorized
interception of
data traffic is
impossible by
accessing the
cabling.
Medium Mr. Rossi Internal 31 Dec,
2015
PT-20 – Security and cabling schema.docx
- V.0 del
18/11/2013
100
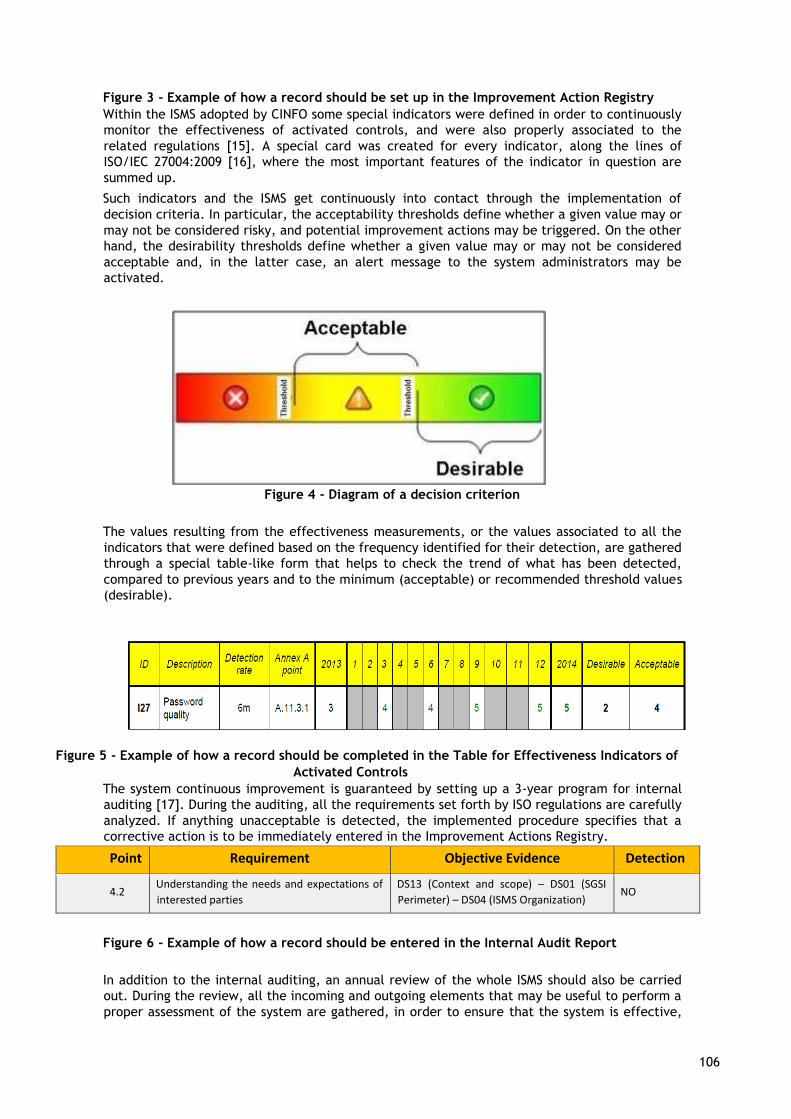
EUNI 106
106
Figure 3 - Example of how a record should be set up in the Improvement Action Registry
Within the ISMS adopted by CINFO some special indicators were defined in order to continuously
monitor the effectiveness of activated controls, and were also properly associated to the
related regulations [15]. A special card was created for every indicator, along the lines of
ISO/IEC 27004:2009 [16], where the most important features of the indicator in question are
summed up.
Such indicators and the ISMS get continuously into contact through the implementation of
decision criteria. In particular, the acceptability thresholds define whether a given value may or
may not be considered risky, and potential improvement actions may be triggered. On the other
hand, the desirability thresholds define whether a given value may or may not be considered
acceptable and, in the latter case, an alert message to the system administrators may be
activated.
Figure 4 - Diagram of a decision criterion
The values resulting from the effectiveness measurements, or the values associated to all the
indicators that were defined based on the frequency identified for their detection, are gathered
through a special table-like form that helps to check the trend of what has been detected,
compared to previous years and to the minimum (acceptable) or recommended threshold values
(desirable).
Figure 5 - Example of how a record should be completed in the Table for Effectiveness Indicators of
Activated Controls
The system continuous improvement is guaranteed by setting up a 3-year program for internal
auditing [17]. During the auditing, all the requirements set forth by ISO regulations are carefully
analyzed. If anything unacceptable is detected, the implemented procedure specifies that a
corrective action is to be immediately entered in the Improvement Actions Registry.
Point Requirement Objective Evidence Detection
4.2 Understanding the needs and expectations of
interested parties DS13 (Context and scope) – DS01 (SGSI
Perimeter) – DS04 (ISMS Organization) NO
Figure 6 - Example of how a record should be entered in the Internal Audit Report
In addition to the internal auditing, an annual review of the whole ISMS should also be carried
out. During the review, all the incoming and outgoing elements that may be useful to perform a
proper assessment of the system are gathered, in order to ensure that the system is effective,
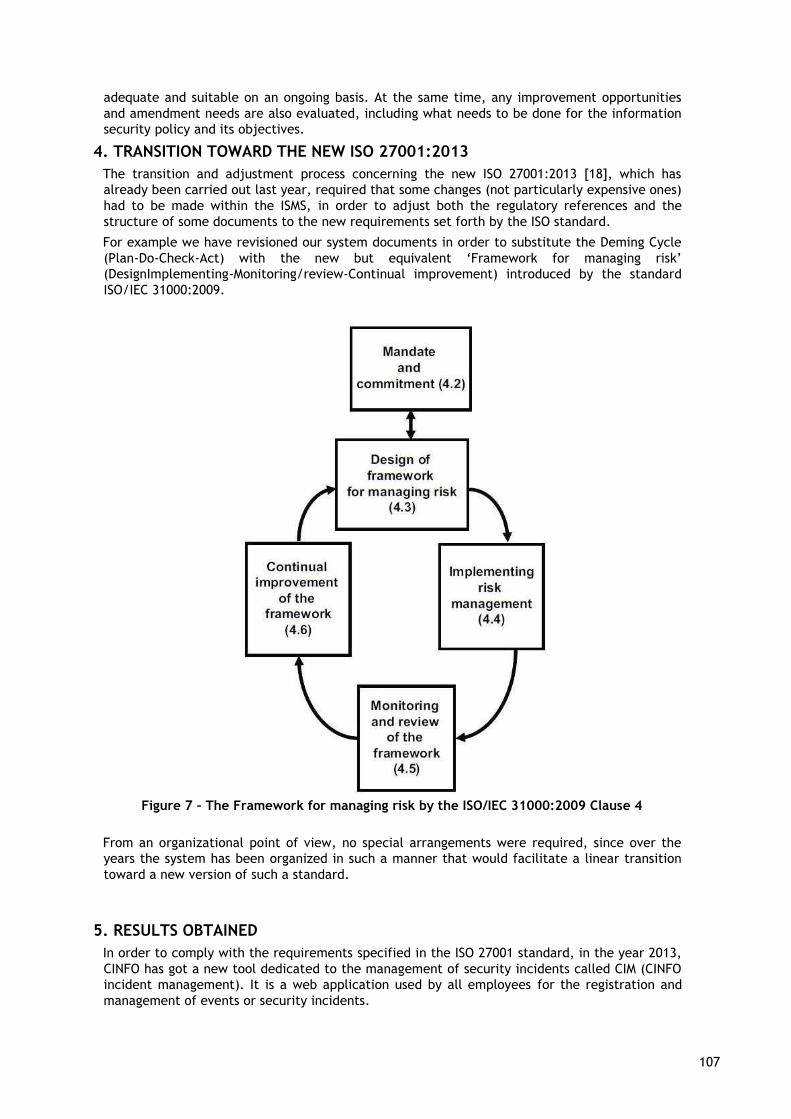
EUNI 107
107
adequate and suitable on an ongoing basis. At the same time, any improvement opportunities
and amendment needs are also evaluated, including what needs to be done for the information
security policy and its objectives.
4. TRANSITION TOWARD THE NEW ISO 27001:2013
The transition and adjustment process concerning the new ISO 27001:2013 [18], which has
already been carried out last year, required that some changes (not particularly expensive ones)
had to be made within the ISMS, in order to adjust both the regulatory references and the
structure of some documents to the new requirements set forth by the ISO standard.
For example we have revisioned our system documents in order to substitute the Deming Cycle
(Plan-Do-Check-Act) with the new but equivalent ‘Framework for managing risk’
(DesignImplementing-Monitoring/review-Continual improvement) introduced by the standard
ISO/IEC 31000:2009.
Figure 7 – The Framework for managing risk by the ISO/IEC 31000:2009 Clause 4
From an organizational point of view, no special arrangements were required, since over the
years the system has been organized in such a manner that would facilitate a linear transition
toward a new version of such a standard.
5. RESULTS OBTAINED
In order to comply with the requirements specified in the ISO 27001 standard, in the year 2013,
CINFO has got a new tool dedicated to the management of security incidents called CIM (CINFO
incident management). It is a web application used by all employees for the registration and
management of events or security incidents.
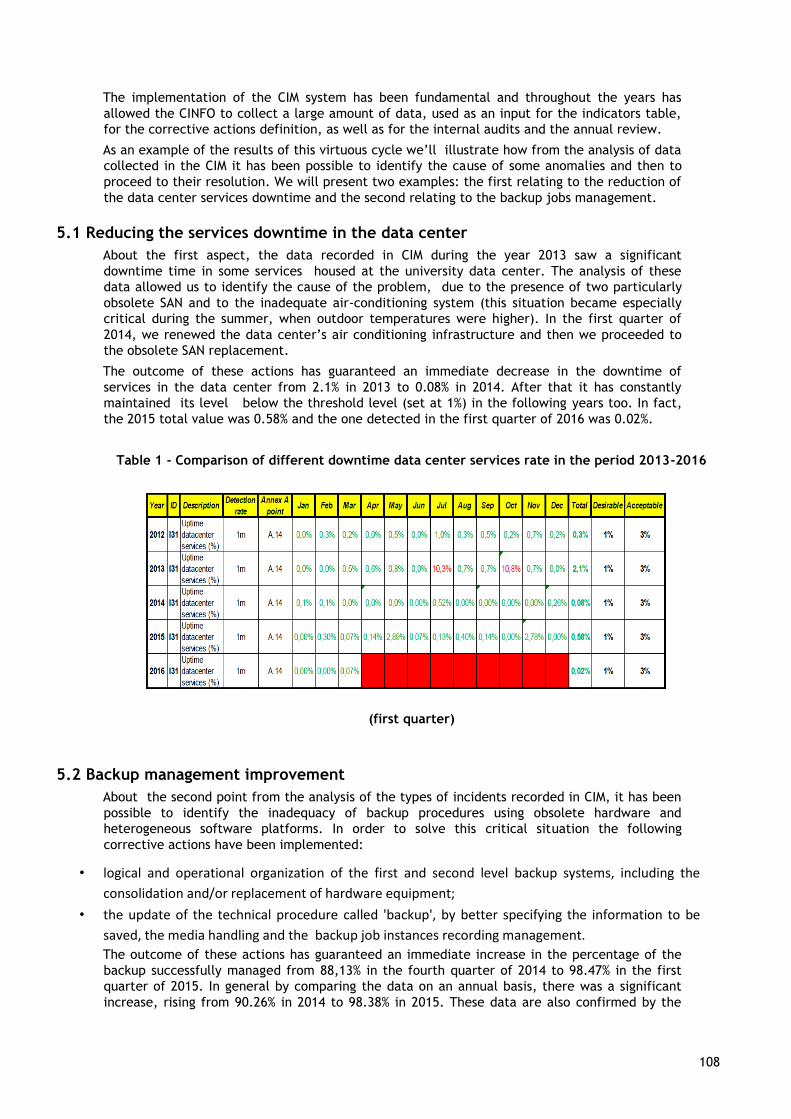
EUNI 108
108
The implementation of the CIM system has been fundamental and throughout the years has
allowed the CINFO to collect a large amount of data, used as an input for the indicators table,
for the corrective actions definition, as well as for the internal audits and the annual review.
As an example of the results of this virtuous cycle we’ll illustrate how from the analysis of data
collected in the CIM it has been possible to identify the cause of some anomalies and then to
proceed to their resolution. We will present two examples: the first relating to the reduction of
the data center services downtime and the second relating to the backup jobs management.
5.1 Reducing the services downtime in the data center
About the first aspect, the data recorded in CIM during the year 2013 saw a significant
downtime time in some services housed at the university data center. The analysis of these
data allowed us to identify the cause of the problem, due to the presence of two particularly
obsolete SAN and to the inadequate air-conditioning system (this situation became especially
critical during the summer, when outdoor temperatures were higher). In the first quarter of
2014, we renewed the data center’s air conditioning infrastructure and then we proceeded to
the obsolete SAN replacement.
The outcome of these actions has guaranteed an immediate decrease in the downtime of
services in the data center from 2.1% in 2013 to 0.08% in 2014. After that it has constantly
maintained its level below the threshold level (set at 1%) in the following years too. In fact,
the 2015 total value was 0.58% and the one detected in the first quarter of 2016 was 0.02%.
Table 1 - Comparison of different downtime data center services rate in the period 2013-2016
(first quarter)
5.2 Backup management improvement
About the second point from the analysis of the types of incidents recorded in CIM, it has been
possible to identify the inadequacy of backup procedures using obsolete hardware and
heterogeneous software platforms. In order to solve this critical situation the following
corrective actions have been implemented:
• logical and operational organization of the first and second level backup systems, including the
consolidation and/or replacement of hardware equipment;
• the update of the technical procedure called 'backup', by better specifying the information to be
saved, the media handling and the backup job instances recording management.
The outcome of these actions has guaranteed an immediate increase in the percentage of the
backup successfully managed from 88,13% in the fourth quarter of 2014 to 98.47% in the first
quarter of 2015. In general by comparing the data on an annual basis, there was a significant
increase, rising from 90.26% in 2014 to 98.38% in 2015. These data are also confirmed by the
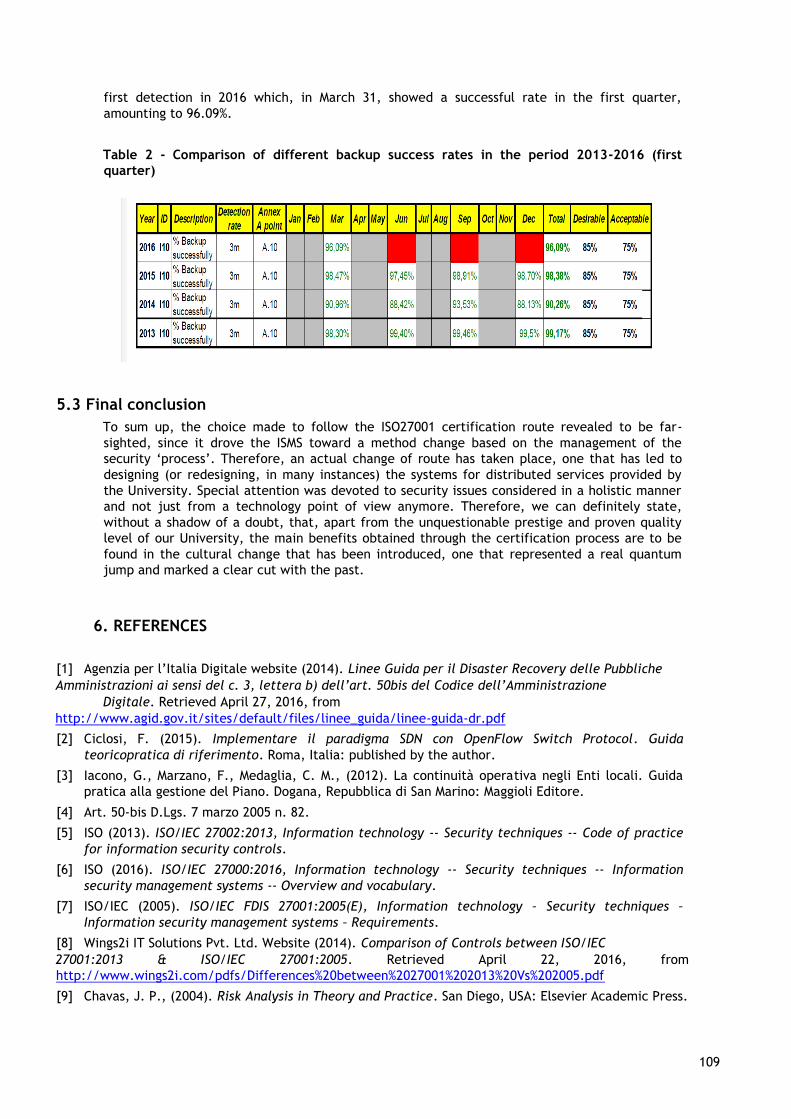
EUNI 109
109
first detection in 2016 which, in March 31, showed a successful rate in the first quarter,
amounting to 96.09%.
Table 2 - Comparison of different backup success rates in the period 2013-2016 (first
quarter)
5.3 Final conclusion
To sum up, the choice made to follow the ISO27001 certification route revealed to be far-
sighted, since it drove the ISMS toward a method change based on the management of the
security ‘process’. Therefore, an actual change of route has taken place, one that has led to
designing (or redesigning, in many instances) the systems for distributed services provided by
the University. Special attention was devoted to security issues considered in a holistic manner
and not just from a technology point of view anymore. Therefore, we can definitely state,
without a shadow of a doubt, that, apart from the unquestionable prestige and proven quality
level of our University, the main benefits obtained through the certification process are to be
found in the cultural change that has been introduced, one that represented a real quantum
jump and marked a clear cut with the past.
6. REFERENCES
[1] Agenzia per l’Italia Digitale website (2014). Linee Guida per il Disaster Recovery delle Pubbliche
Amministrazioni ai sensi del c. 3, lettera b) dell’art. 50bis del Codice dell’Amministrazione
Digitale. Retrieved April 27, 2016, from
http://www.agid.gov.it/sites/default/files/linee_guida/linee-guida-dr.pdf
[2] Ciclosi, F. (2015). Implementare il paradigma SDN con OpenFlow Switch Protocol. Guida
teoricopratica di riferimento. Roma, Italia: published by the author.
[3] Iacono, G., Marzano, F., Medaglia, C. M., (2012). La continuità operativa negli Enti locali. Guida
pratica alla gestione del Piano. Dogana, Repubblica di San Marino: Maggioli Editore.
[4] Art. 50-bis D.Lgs. 7 marzo 2005 n. 82.
[5] ISO (2013). ISO/IEC 27002:2013, Information technology -- Security techniques -- Code of practice
for information security controls.
[6] ISO (2016). ISO/IEC 27000:2016, Information technology -- Security techniques -- Information
security management systems -- Overview and vocabulary.
[7] ISO/IEC (2005). ISO/IEC FDIS 27001:2005(E), Information technology – Security techniques –
Information security management systems – Requirements.
[8] Wings2i IT Solutions Pvt. Ltd. Website (2014). Comparison of Controls between ISO/IEC
27001:2013 & ISO/IEC 27001:2005. Retrieved April 22, 2016, from
http://www.wings2i.com/pdfs/Differences%20between%2027001%202013%20Vs%202005.pdf
[9] Chavas, J. P., (2004). Risk Analysis in Theory and Practice. San Diego, USA: Elsevier Academic Press.
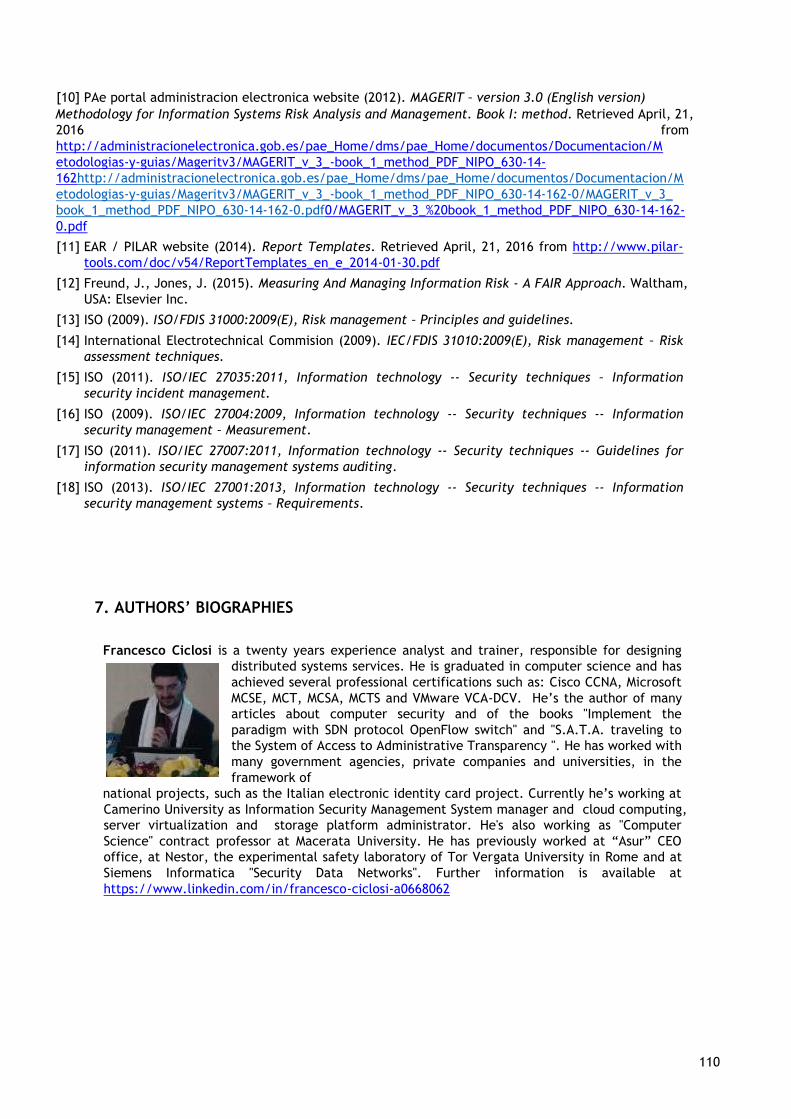
EUNI 110
110
[10] PAe portal administracion electronica website (2012). MAGERIT – version 3.0 (English version)
Methodology for Information Systems Risk Analysis and Management. Book I: method. Retrieved April, 21,
2016 from
http://administracionelectronica.gob.es/pae_Home/dms/pae_Home/documentos/Documentacion/M
etodologias-y-guias/Mageritv3/MAGERIT_v_3_-book_1_method_PDF_NIPO_630-14-
162http://administracionelectronica.gob.es/pae_Home/dms/pae_Home/documentos/Documentacion/M
etodologias-y-guias/Mageritv3/MAGERIT_v_3_-book_1_method_PDF_NIPO_630-14-162-0/MAGERIT_v_3_
book_1_method_PDF_NIPO_630-14-162-0.pdf0/MAGERIT_v_3_%20book_1_method_PDF_NIPO_630-14-162-
0.pdf
[11] EAR / PILAR website (2014). Report Templates. Retrieved April, 21, 2016 from http://www.pilar-
tools.com/doc/v54/ReportTemplates_en_e_2014-01-30.pdf
[12] Freund, J., Jones, J. (2015). Measuring And Managing Information Risk - A FAIR Approach. Waltham,
USA: Elsevier Inc.
[13] ISO (2009). ISO/FDIS 31000:2009(E), Risk management – Principles and guidelines.
[14] International Electrotechnical Commision (2009). IEC/FDIS 31010:2009(E), Risk management – Risk
assessment techniques.
[15] ISO (2011). ISO/IEC 27035:2011, Information technology -- Security techniques – Information
security incident management.
[16] ISO (2009). ISO/IEC 27004:2009, Information technology -- Security techniques -- Information
security management – Measurement.
[17] ISO (2011). ISO/IEC 27007:2011, Information technology -- Security techniques -- Guidelines for
information security management systems auditing.
[18] ISO (2013). ISO/IEC 27001:2013, Information technology -- Security techniques -- Information
security management systems – Requirements.
7. AUTHORS’ BIOGRAPHIES
Francesco Ciclosi is a twenty years experience analyst and trainer, responsible for designing
distributed systems services. He is graduated in computer science and has
achieved several professional certifications such as: Cisco CCNA, Microsoft
MCSE, MCT, MCSA, MCTS and VMware VCA-DCV. He’s the author of many
articles about computer security and of the books "Implement the
paradigm with SDN protocol OpenFlow switch" and "S.A.T.A. traveling to
the System of Access to Administrative Transparency ". He has worked with
many government agencies, private companies and universities, in the
framework of
national projects, such as the Italian electronic identity card project. Currently he’s working at
Camerino University as Information Security Management System manager and cloud computing,
server virtualization and storage platform administrator. He's also working as "Computer
Science" contract professor at Macerata University. He has previously worked at “Asur” CEO
office, at Nestor, the experimental safety laboratory of Tor Vergata University in Rome and at
Siemens Informatica "Security Data Networks". Further information is available at
https://www.linkedin.com/in/francesco-ciclosi-a0668062
EUNI 111
111
Using Honeypots in Network Intelligence Architectures – The University of Trás-os-Montes e
Alto Douro case study
José Bessa1, Hugo Coelho1, Pedro Monteiro1, José Brito1, António Costa1
[email protected], [email protected], [email protected], [email protected], [email protected]
1University of Trás-os-Montes e Alto Douro, Quinta de Prados, 5000-801 Vila Real, Portugal
Keywords
Network Intelligence Architectures, Business Intelligence, Big Data, ETL, Honeypots, Security,
Intrusion Detection Systems, Monitoring.
ABSTRACT
Organizations have increasingly data that needs to be processed to produce information and
knowledge in a timely manner. To assist this, Information Systems in the decision-making processes
have been developed, which are the case of Decision Support Systems and the Business Intelligence
architectures. Many of the organizations’ services are supported by communication infrastructures
and it is necessary to guarantee that these are prepared to ensure the proper functioning and
availability of services and applications. According to this, there is a lot of data being produced
indicating their operational status in order to monitor and track their performance.
Considering the Information’s importance to organizations, security and confidentiality of the data
needs to be assured, therefore Intrusion Detection Systems are an integral part in systems
management, with particular importance on safety and infrastructure’s reliability and the business
data supported by them. This case study was conducted to assess the contribution that Honeypots can
have in the creation of security intelligence. The use of Honeypots, Decision Support Systems and
Business Intelligence architectures in the organizations’ network infrastructures allows to build
Network Intelligence Architectures for management and more efficient protection.
With the NIA built for the case study of the University of Tras-os-Montes e Alto Douro, IT and
Communications Services have greater insight into their network infrastructure, allowing them to
take informed and consented decisions based on the service and security indicators provided by the
NIA and create policies to protect the infrastructure.
Introduction and Scope
Nowadays, Information, Knowledge and Intelligence represents a key to the success of an organization,
and allows it to gain competitive advantage and gives the best possible way to manage the business.
In order to achieve these levels of abstraction, first it is necessary to consider the data from the
organizations daily activity. Given the exponential growth of data, there is a need to streamline its
treatment, which has encouraged the use of Information Technologies (IT) to support the
organization’s Information Systems (IS). These systems do not work isolated and they need to be
integrated, which involves the use of communication infrastructures and support systems, particularly
when organic units are geographically dispersed. More and more organizations use communication
infrastructures to support their business, and as such it is important that they are monitored and
managed so they can sustain in the best way the various activities of organizations, not only for their
normal operation, but also for strategic activities (Taylor, Gresty & Askwith, 2001).
Monitoring is crucial for the management operations, as it allows to early on identify trends and
patterns in data traffic, network devices’ behavior (anomalies, performance issues), in order to
ensure infrastructure’s reliability, robustness, high productivity and quality of service to those who
use it (Avizienis et al., 2004). After handling the data generated by IT, which is part of the network
infrastructure and its systems, it is possible to get knowledge about it. In order to know their
behavior, a tailored SI such as a Decision Support Systems (DSS), can be used to enable informed and
consensual decision making.
EUNI 112
112
The use of DSS and Business Intelligence (BI) architectures to obtain Knowledge on management and
monitoring network infrastructures, can be associated to the concept of Network Intelligence. On the
other hand, the Computer Security issues are closely linked to the performance of these
infrastructures. Therefore, it is important to use mechanisms to assess whether it is safe and
vulnerability free, including them in a Network Intelligence Architectures (NIA) (Russell & Cohn,
2012).
In order to reduce the risk of compromising information, security policies should be created to ensure
business continuity in its normal flow. These policies should be regularly reviewed so that there is a
constant evaluation. They must ensure that the information is accessed only by authorized entities
and that is always available, while the data is real and consistent. Additionally it is necessary that
vulnerability and threat detection methods are present in the infrastructure. This will help to
improve the security policies already established. Thus, it becomes possible to calculate the risk that
the compromised Information may cause to the organization (Ahmed, Mahmood & Hu, 2016).
One of the mechanisms used to increase IT Security is the use of Honeypots. A Honeypot is another
security tool, which along with other tools of this kind, helps in network intrusion detection, giving
network and system administrators the necessary knowledge to treat these network security incidents,
either by detection and prevention of attacks, or to its reaction. If then, this Knowledge of the
intrusion is integrated into a Knowledge Management platform, it is possible to create a DSS, able to
assess on creating standards and security policies to be applied to the infrastructure, so they remain
in a stable state of security (Spitzner, 2002).
This work aims to demonstrate the applicability of probes based on Honeypot models for intrusion
detection in an attempt to improve the Security Information strategy carried out by the University of
Trás-os-Montes e Alto Douro’s (UTAD) IT and Communications Services (SIC-UTAD), given the
considerable number of detected intrusion attempts this institution receives. These, in successful
cases, could compromise their services and consequently their reliability.
This paper is divided into four sections: in section 2 it is provided the scope of the paper and in
section 3 a conceptual aproach around some of the key concepts that can be associated with Network
Intelligence architectures. In the 4th section the case study is explained, the identified needs that
led to the execution of this work, the proposed Network Intelligence architecture to UTAD and the
used technologies. The paper ends with a section of tests and achieved results, as well as some final
considerations and perspectives for future work.
Conceptual Aproach
The development of a NIA that make feasible the intentions of SIC-UTAD for the management of the
network infrastructure, required the necessity to understand the concepts/technologies that can be
applied over the data generated by the network, to obtain Knowledge and Intelligence, namely
(Russell & Cohn, 2012): the DSS and BI architectures (focusing on Extract-Transforme-Load processes
and Data Visualization). On the other hand, assuming data security as essential, there was a need to
understand the Intrusion Detection Systems (IDS) and, in this article, the application of Honeypots to
ensure this assumption, allowing its incorporation in this type of architectures.
3.1. From Big Data to Managing and Monitoring Network Communication Infrastructures
Nowadays, a great number of organizations have network communication infrastructures to support
their several activities. In this way, many organizations can only support their business and activities,
if they have an infrastructure of this kind (Sterbenz et al., 2010).
Given the importance of the network infrastructures mentioned above, it is important to manage and
monitor them. Monitoring is crucial for the management operations, since it allows to early identify
trends and patterns in data traffic, behavior of network devices (anomalies, performance issues), in
order to ensure the reliability, robustness, high productivity of infrastructure and quality of service
for those who use it. Monitoring represents a key element in network management, being this
composed by activities, methods, processes and tools that support the operation and maintenance of
the network infrastructure (Lee, Levanti & Kim, 2014).
Similar to what happens with remaining organizational data, also data from the network
infrastructure have exponentially grown, being this phenomenon associated with the concept of Big
EUNI 113
113
Data. This concept have appeared from the need to improve the management of large volumes of
data, expediting the decision-making process.
Big Data is applied to the organization's ability to manage, store and analyze data. The data storage
process is one of the most important aspects contemplated in this concept, hence it is necessary to
create new ways to do that, given that the traditional ways fall outside this new paradigm. On the
other hand, it is essential that not only the data is stored but also used in the organization routines,
in order to speed up and sustain their activities (Chen & Zhang, 2014).
With Big Data it is possible to identify the most important customers and their needs to strengthen
relationships, maximize profits and sales, mining data associated to clients in order to generate new
marketing campaigns, analyze data from media and banking to detect new socio-economic market
trends, analyze data from social networks, among others. (Bolón-Canedo, Sánchez-Maroño &
AlonsoBetanzos, 2015).
When it comes to Big Data it is critical to consider the 5V's that allow to realize their essence and
relevance that there is a concept explaining this phenomenon, which are: Volume, Variety, Velocity,
Value and Veracity. Explaining each of these "V's" (Hashem et al., 2015.):
• Volume is associated with the large amounts of data in multiple formats, from different sources, internal (e.g. internal IS) and external (e.g. newspapers, Internet, partners IS, social networks), and it is still constantly growing. The greater the data volume is, the greater the ability to detect hidden patterns and optimize analytical models;
• Variety closely associated with the data format irregularity, since these may be structured (e.g. relational databases), semi-structured (e.g. XML, RDFS) or without structure (e.g. SMS, tweets, audio, video, images), which it is expected given the variety of data sources (e.g. sensors, mobile data, operational IS);
• Velocity refers to the transmission of data, its handling, delivery and availability in the data storage structures. This factor is important so that the availability of data is made in a timely manner, which is becoming real-time, since the dynamics of organizations requires that the time for decision-making becomes shorter;
• Value is the factor that explains the importance of data for relevant business information to be identified and extracted, as well as standards for defining action strategies and to influence the creation of new products/services;
• Veracity of data is required so that when analytical models are applied, decisions can be made based on real and consistent data, not creating ambiguities, fraud, questions, inconsistencies or incoherencies in these management activities.
Despite the current adoption and exploration of the concept of Big Data in the organizational
environment, simple data collection by itself is no guarantee of competitive advantages. The data are
mere representations of real facts, and only have value when contextualized and delivered to whom
can interpret, for generate Information. For process management it is of interest to achieve a higher
level of abstraction, namely Knowledge, passing through the analysis and extraction of conclusions
from the Information (Kebede, 2010).
In order to manage the network infrastructure is important to have Knowledge and Intelligence
(crossing Knowledge with the personal experience of those who use it) to take consensual and timely
decisions. Thus, we can say that the NIA are architectures that in its genesis include mechanisms to
obtain Knowledge and later Intelligence from network infrastructures.
A NIA contemplates the use of DSS to facilitate the processes of obtainment, retention and
management of Knowledge and Intelligence enhancing and maximizing organizational resources
(Scheibe et al., 2006). DSS belong to the class of information systems that are designed to facilitate
decision-making processes, and have advanced analytical capabilities. They are often tailored to the
person or group that uses them, so they should be flexible, interactive and dynamic (Vizecky &
ElGayar, 2011). Its main tasks consists in the production and dissemination of information, hence they
can be considered an information system.
This type of systems have other features such as the creation of Intelligence and organizational
Knowledge, through the use of analytical data models with possibility of simulation scenarios and
friendly interface with users over the creation of dashboards that represent graphically the data
complexity using Data Visualization (DV) techniques (Grierson, Corney & Hatcher, 2015). Dashboards
created in these kind of systems, in this case for the manage and monitor network infrastructures,
use the DV techniques, which allow the application of analytical models and statistical functions,
EUNI 114
114
whose results are presented visually through interactive dashboards composed by tables, diagrams,
graphs, histograms, maps and pilot panels (Janvrin, Raschke & Dilla, 2014).
The decision-making implies that there is organizational intelligence, that involves gathering
information, analyze it, disseminate it (to who knows the business), get new opportunities, react in
time and adapting. Everyday, this capacity should be an integral part of any organization, for business
decision-making to be appropriated and have quality. However, with organizations storing increasing
amounts of data, there is a need for the use of IT to its storage, delivery and processing to extract
organizational intelligence. In order to fullfil that need, the concept of BI emerged (Ramakrishnan,
Jones & Sidorova, 2012).
The concept of BI can be understood as a set of techniques and tools used to extract intelligence from
a data set. Related to BI is a set of concepts, methods and processes to improve business decisions,
which uses data from multiple sources and applies the experience and assumptions to develop, in a
accurate way, knowledge of business dynamics (Petrini & Pozzebon, 2009).
Given the importance of the concept of BI to organizations, this has been exhaustively studied and
defined by several authors. For this work, we assumed the definition of BI developed by the authors
Sharda, Delen & Turban (2013), in which it is said that BI is an aggregator concept that combines
architectures, tools, data sources, analytical tools, applications and methodologies. Integrates data
analysis with decision support systems to provide information for all persons in the organization, who
need to make tactical and strategic decisions. With the development of an appropriate BI
architecture, an organization may be able to develop intelligent decision support systems for
competitive advantage in the industry in which it operates (Wu, Chen & Olson, 2014).
The ability to combine business activities, IT and analytics, should be on the focus of the
organization's work, with the creation of an adequate infrastructure that will achieve the
organization's goals and allowing it to take competitive advantages; agility in decision-making
processes; ability to handle sensitive information; identify patterns, trends or hidden behavior in the
organization's data that may represent propitious situations related to customers and/or new business
opportunities (Chen, Chiang & Storey, 2012).
A BI architecture must be aligned in the global infrastructure of the IS of an organization. Typically a
BI architecture consists of (Olszak & Ziemba, 2007): internal data sources (data from operational
systems) or external, Extract-Transform-Load (ETL), data storage source (e.g. database, Data
Warehouse, Data Marts, ad-hoc queries), analytical tools for data processing (e.g. OLAP servers, Data
Mining) and front-end applications where the data analysis results will be presented (e.g. dashboards,
reports, graphics).
The ETL tools are a fundamental part of BI systems, since they are used to simplify and standardize
the data migration process. In this work, this process has a particular focus, given the complexity and
variety of data formats of the systems used in this case study. This module, aims to gather several
data from heterogeneous platforms of the organization in a standard format that can be used by DSS,
and at the same time should be able to integrate and standardize data. Also, it must be flexible
because the requirements can be changed and the dynamics of databases should be considered as
well (Guo et al., 2015).
The ETL concept, as the name suggests, involves three steps (Prema & Pethalakshmi, 2013):
Extraction, where a copy of the new data is obtained since the last application of ETL tools, which
are present in the various data sources (which may have different shapes and structures); in
Transform, data is processed into information, a task consisting in the translation of encoded values;
application of this process to certain categories of rows and/or columns; merge (merging) or
aggregation of data in order to create a uniform structure which can be stored in the database.
Finally the Load is done, which consists in the activity of populate the target tables present in the
database, which can be a simple step, namely, rewrite new data over the oldest, or a more complex
process in which data is held for historical purposes, keeping all records of all changes made.
Scalability is one of the most important factors to consider when this type of modules are constructed,
since in some situations, the ETL modules have to process millions of data and update databases with
millions of records. The exponential growth of data (Big Data) and the increasing data sources require
that the ETL technologies become more advanced and flexible (Karagiannis, Vassiliadis & Simitsis,
2013).
EUNI 115
115
3.2. Security
When we are talking about IS in organizations and Big Data, it is also necessary to take into account
the policies and computer security mechanisms that prevent systems and organizational data of being
accessed by unauthorized entities, ensuring their integrity. In this sense IDS emerged, which as the
name suggests, are designed to detect and prevent intrusions (Liao et. al, 2013).
To understand the applicability of such systems it is necessary to understand what an intrusion is. An
intrusion consists of a set of activities with the goal of misrepresent and/or compromise the integrity,
confidentiality and availability of a resource. This type of illegal action comes from an attack or set
of attacks and may or may not distort the data in a permanent way (Zuquete, 2013).
IDS try to assess this type of illegal activity and can detect intrusions from an early stage of trial or
suspicious activity, to the consummation of this act. They act independently of the mechanisms that
support the correct use of the systems in which they are applied, and to build an intrusion profile,
they collect data on the various activities associated with a System allowing to conclude on likely
past, present or future intrusions, this being a dynamic and constantly updated process (Jaiganesh,
Mangayarkarasi & Sumathi, 2013).
Regarding intrusion reaction, this systems may be of two types: passive or active, whereas the former
only react with alerts and reports to a specialist in this area to apply defensive measures, the latter
have automatic response mechanisms to intrusions (Sekhar et. al, 2015). Despite the benefits of these
systems, IDS like any other system, have limitations such as: false positives by false alarms and false
negatives when an intrusion is not detected, which can lead to loss of trust in these systems;
overhead on the network and its systems; a lack of standardizationon on the specification of
intrusions and attacks; outdated attack databases, since all days new attacks are created; High
technology requirements to support their action mechanisms(Spathoulas & Katsikas, 2010; Corona,
Giacinto & Roli, 2013).
With the use of IDS for information security, illusion systems have been created, which is the case of
Honeypots. Although there are several definitions of what a Honeypot is (Pouget, Dacier & Debar,
2003), the most consensual explains that this is a security resource without production value and
whose true value lies in being probed, attacked or compromised, thus obtaining various information
about the attackers and will allow to create preventive measures against attacks (Spitzner, 2002). In
other words, a honeypot is a resource on the network, that although it is not a production system, has
the ability to seem like one and to look vulnerable.
As a direct consequence of the definition, any traffic directed to a Honeypot is considered abnormal.
This assumption means that, unlike the Network Intrusion Detection Systems (NIDS), the data
collected is of great value and private of noise (Briffaut, Lalande & Toinard, 2009). On the other hand,
the monitoring is isolated, making a Honeypot unaware of other network behavior, proving the need
for other security tools, as wel as the creation of Honeynets (Curran et al., 2005). This simplicity in
how a honeypot works, allows its support systems to not require large computational resources.
By logging and analysing adverse events, a Honeypot be used for the treatment of security incidents it
captures, allowing preventive actions (resource deterrence), detection (event alerts), reaction
(attacker data) and research (increase Knowledge). The fact that there are worldwide research
Honeypots allows the information obtained by them to be correlated, identifying attack patterns
(West-Brown et al., 2003). These patterns can then be crossed with the information obtained by
prevention and reaction Honeypots existing in the organization networks, leading to security policies
being created and applied in other network resources, such as traffic filtering policies applied to
Firewalls, based on previously detected events (Spitzner, 2002; Pouget, Dacier & Debar, 2003).
Honeypots can be classified in three ways that are directly related to how an attacker interacts with
it:
• Low Interaction: These Honeypots are easier to deploy and configure, since they only simulate services with which the attacker can interact and their importance is based on the detention of unauthorized scans and connection attempts (Briffaut, Lalande & Toinard, 2009). The risk of this type of honeypots is very low, since an operating system (OS) is not given to an attacker to interact with, but only a set of services configured to operate in a predetermined way (Spitzner, 2002);
• Medium Interaction: These consist of isolated subsystems monitored in real systems, giving the attacker the ability to interact with an OS that is pre-configured to not expose all the features expected from a real system, reducing the risk of being compromised (Honeynet Project, 2004). The
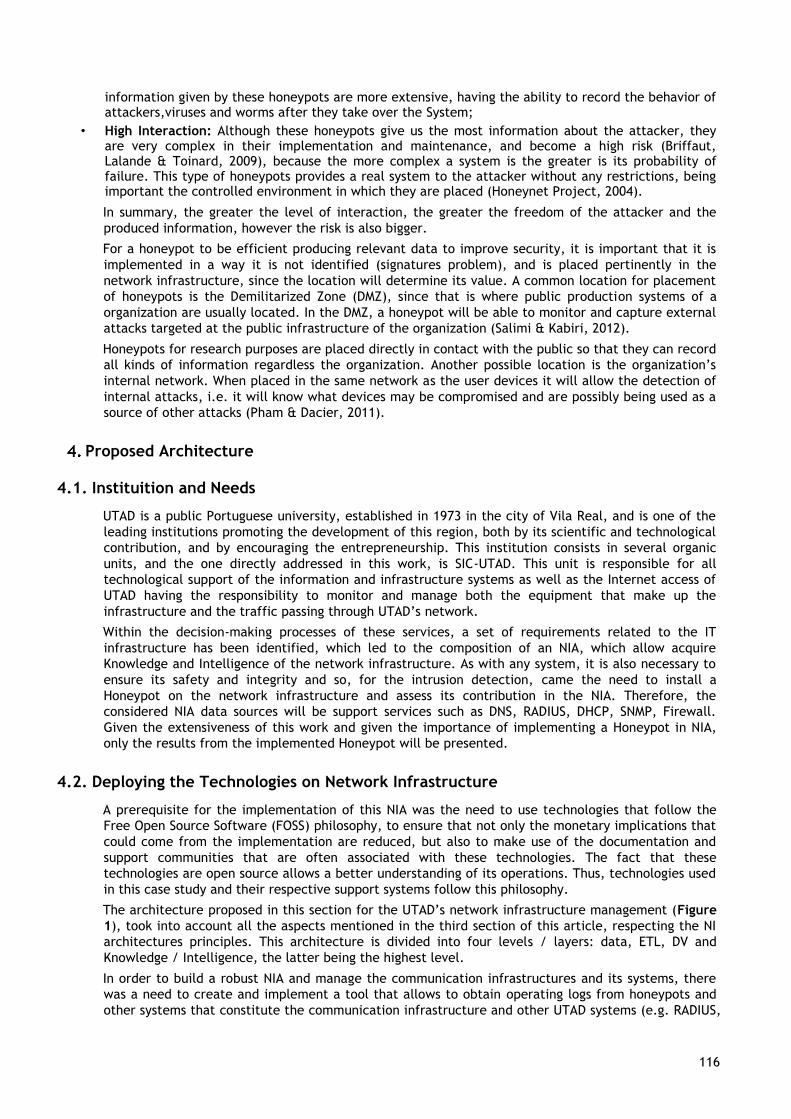
EUNI 116
116
information given by these honeypots are more extensive, having the ability to record the behavior of attackers,viruses and worms after they take over the System;
• High Interaction: Although these honeypots give us the most information about the attacker, they are very complex in their implementation and maintenance, and become a high risk (Briffaut, Lalande & Toinard, 2009), because the more complex a system is the greater is its probability of failure. This type of honeypots provides a real system to the attacker without any restrictions, being important the controlled environment in which they are placed (Honeynet Project, 2004).
In summary, the greater the level of interaction, the greater the freedom of the attacker and the
produced information, however the risk is also bigger.
For a honeypot to be efficient producing relevant data to improve security, it is important that it is
implemented in a way it is not identified (signatures problem), and is placed pertinently in the
network infrastructure, since the location will determine its value. A common location for placement
of honeypots is the Demilitarized Zone (DMZ), since that is where public production systems of a
organization are usually located. In the DMZ, a honeypot will be able to monitor and capture external
attacks targeted at the public infrastructure of the organization (Salimi & Kabiri, 2012).
Honeypots for research purposes are placed directly in contact with the public so that they can record
all kinds of information regardless the organization. Another possible location is the organization’s
internal network. When placed in the same network as the user devices it will allow the detection of
internal attacks, i.e. it will know what devices may be compromised and are possibly being used as a
source of other attacks (Pham & Dacier, 2011).
Proposed Architecture
4.1. Instituition and Needs
UTAD is a public Portuguese university, established in 1973 in the city of Vila Real, and is one of the
leading institutions promoting the development of this region, both by its scientific and technological
contribution, and by encouraging the entrepreneurship. This institution consists in several organic
units, and the one directly addressed in this work, is SIC-UTAD. This unit is responsible for all
technological support of the information and infrastructure systems as well as the Internet access of
UTAD having the responsibility to monitor and manage both the equipment that make up the
infrastructure and the traffic passing through UTAD’s network.
Within the decision-making processes of these services, a set of requirements related to the IT
infrastructure has been identified, which led to the composition of an NIA, which allow acquire
Knowledge and Intelligence of the network infrastructure. As with any system, it is also necessary to
ensure its safety and integrity and so, for the intrusion detection, came the need to install a
Honeypot on the network infrastructure and assess its contribution in the NIA. Therefore, the
considered NIA data sources will be support services such as DNS, RADIUS, DHCP, SNMP, Firewall.
Given the extensiveness of this work and given the importance of implementing a Honeypot in NIA,
only the results from the implemented Honeypot will be presented.
4.2. Deploying the Technologies on Network Infrastructure
A prerequisite for the implementation of this NIA was the need to use technologies that follow the
Free Open Source Software (FOSS) philosophy, to ensure that not only the monetary implications that
could come from the implementation are reduced, but also to make use of the documentation and
support communities that are often associated with these technologies. The fact that these
technologies are open source allows a better understanding of its operations. Thus, technologies used
in this case study and their respective support systems follow this philosophy.
The architecture proposed in this section for the UTAD’s network infrastructure management (Figure
1), took into account all the aspects mentioned in the third section of this article, respecting the NI
architectures principles. This architecture is divided into four levels / layers: data, ETL, DV and
Knowledge / Intelligence, the latter being the highest level.
In order to build a robust NIA and manage the communication infrastructures and its systems, there
was a need to create and implement a tool that allows to obtain operating logs from honeypots and
other systems that constitute the communication infrastructure and other UTAD systems (e.g. RADIUS,
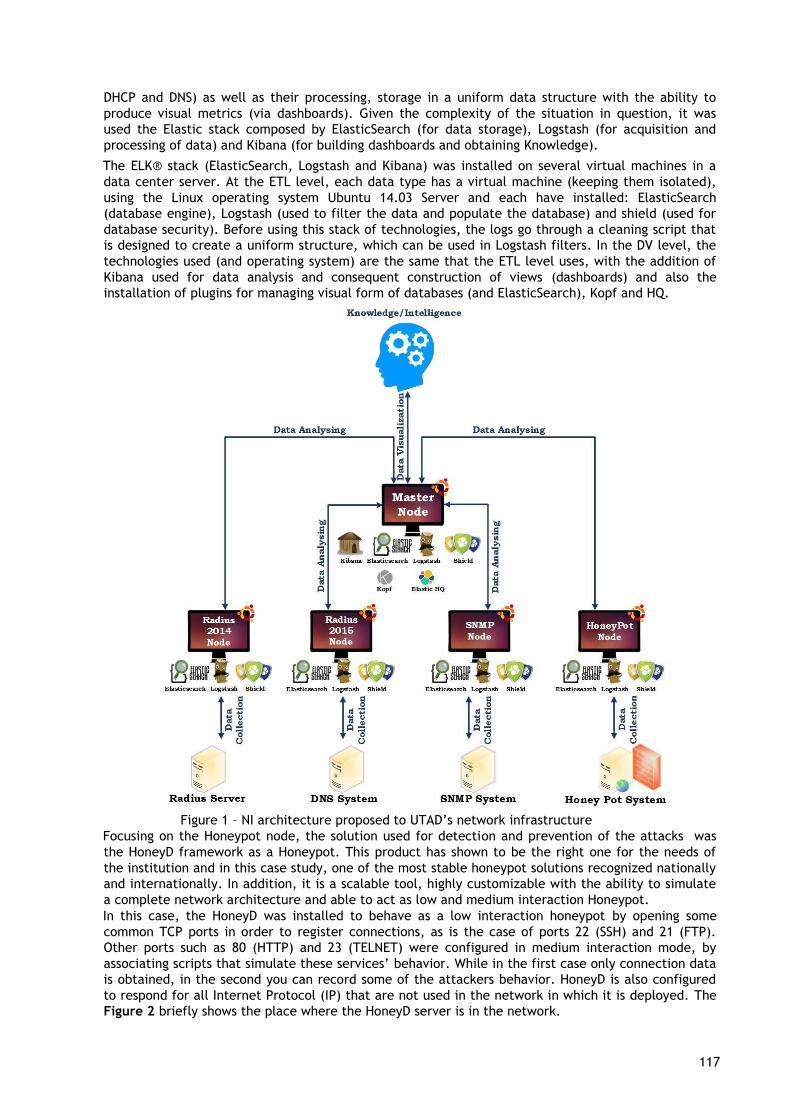
EUNI 117
117
DHCP and DNS) as well as their processing, storage in a uniform data structure with the ability to
produce visual metrics (via dashboards). Given the complexity of the situation in question, it was
used the Elastic stack composed by ElasticSearch (for data storage), Logstash (for acquisition and
processing of data) and Kibana (for building dashboards and obtaining Knowledge).
The ELK® stack (ElasticSearch, Logstash and Kibana) was installed on several virtual machines in a
data center server. At the ETL level, each data type has a virtual machine (keeping them isolated),
using the Linux operating system Ubuntu 14.03 Server and each have installed: ElasticSearch
(database engine), Logstash (used to filter the data and populate the database) and shield (used for
database security). Before using this stack of technologies, the logs go through a cleaning script that
is designed to create a uniform structure, which can be used in Logstash filters. In the DV level, the
technologies used (and operating system) are the same that the ETL level uses, with the addition of
Kibana used for data analysis and consequent construction of views (dashboards) and also the
installation of plugins for managing visual form of databases (and ElasticSearch), Kopf and HQ.
Figure 1 – NI architecture proposed to UTAD’s network infrastructure
Focusing on the Honeypot node, the solution used for detection and prevention of the attacks was
the HoneyD framework as a Honeypot. This product has shown to be the right one for the needs of
the institution and in this case study, one of the most stable honeypot solutions recognized nationally
and internationally. In addition, it is a scalable tool, highly customizable with the ability to simulate
a complete network architecture and able to act as low and medium interaction Honeypot.
In this case, the HoneyD was installed to behave as a low interaction honeypot by opening some
common TCP ports in order to register connections, as is the case of ports 22 (SSH) and 21 (FTP).
Other ports such as 80 (HTTP) and 23 (TELNET) were configured in medium interaction mode, by
associating scripts that simulate these services’ behavior. While in the first case only connection data
is obtained, in the second you can record some of the attackers behavior. HoneyD is also configured
to respond for all Internet Protocol (IP) that are not used in the network in which it is deployed. The
Figure 2 briefly shows the place where the HoneyD server is in the network.
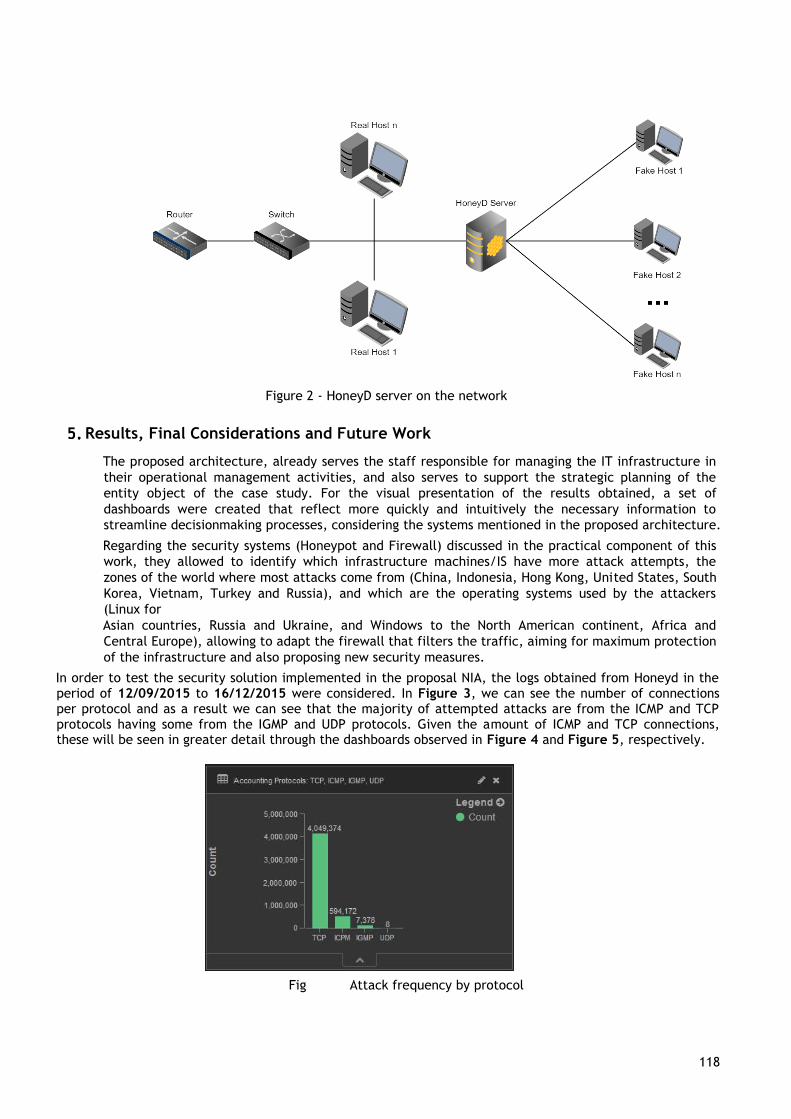
EUNI 118
118
Figure 2 - HoneyD server on the network
Results, Final Considerations and Future Work
The proposed architecture, already serves the staff responsible for managing the IT infrastructure in
their operational management activities, and also serves to support the strategic planning of the
entity object of the case study. For the visual presentation of the results obtained, a set of
dashboards were created that reflect more quickly and intuitively the necessary information to
streamline decisionmaking processes, considering the systems mentioned in the proposed architecture.
Regarding the security systems (Honeypot and Firewall) discussed in the practical component of this
work, they allowed to identify which infrastructure machines/IS have more attack attempts, the
zones of the world where most attacks come from (China, Indonesia, Hong Kong, United States, South
Korea, Vietnam, Turkey and Russia), and which are the operating systems used by the attackers
(Linux for
Asian countries, Russia and Ukraine, and Windows to the North American continent, Africa and
Central Europe), allowing to adapt the firewall that filters the traffic, aiming for maximum protection
of the infrastructure and also proposing new security measures.
In order to test the security solution implemented in the proposal NIA, the logs obtained from Honeyd in the period of 12/09/2015 to 16/12/2015 were considered. In Figure 3, we can see the number of connections per protocol and as a result we can see that the majority of attempted attacks are from the ICMP and TCP protocols having some from the IGMP and UDP protocols. Given the amount of ICMP and TCP connections, these will be seen in greater detail through the dashboards observed in Figure 4 and Figure 5, respectively.
Fig
ure
Attack frequency by protocol
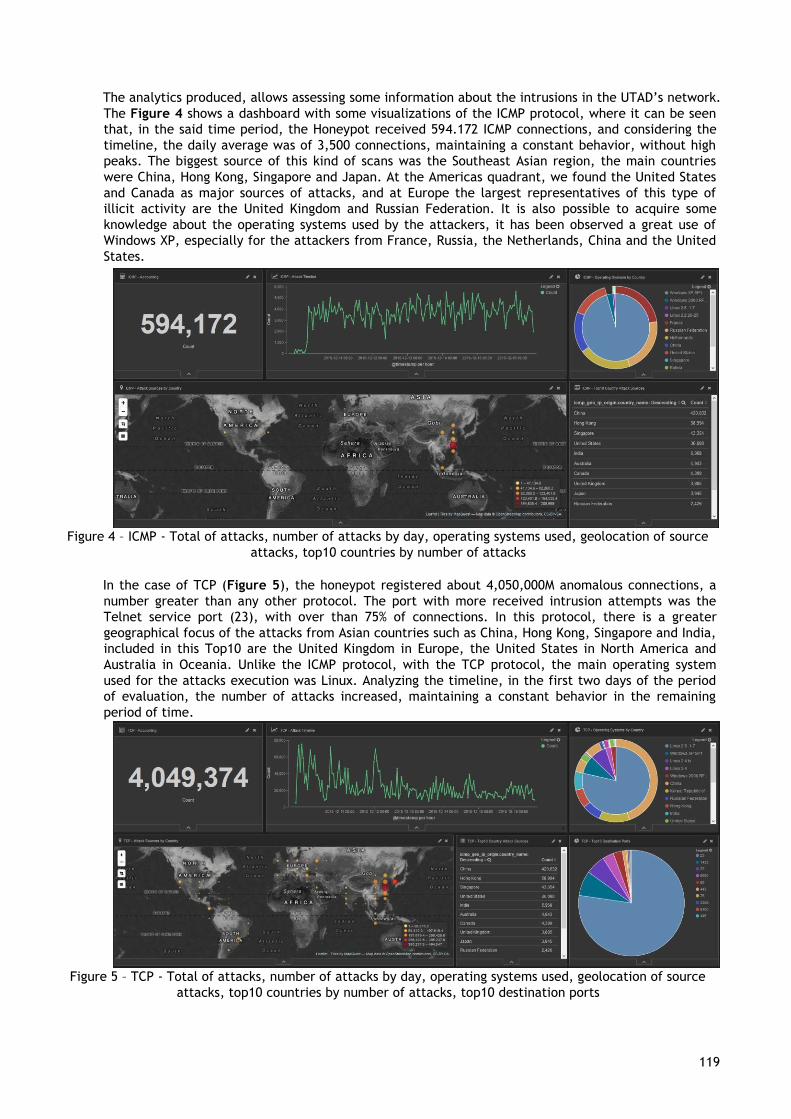
EUNI 119
119
The analytics produced, allows assessing some information about the intrusions in the UTAD’s network.
The Figure 4 shows a dashboard with some visualizations of the ICMP protocol, where it can be seen
that, in the said time period, the Honeypot received 594.172 ICMP connections, and considering the
timeline, the daily average was of 3,500 connections, maintaining a constant behavior, without high
peaks. The biggest source of this kind of scans was the Southeast Asian region, the main countries
were China, Hong Kong, Singapore and Japan. At the Americas quadrant, we found the United States
and Canada as major sources of attacks, and at Europe the largest representatives of this type of
illicit activity are the United Kingdom and Russian Federation. It is also possible to acquire some
knowledge about the operating systems used by the attackers, it has been observed a great use of
Windows XP, especially for the attackers from France, Russia, the Netherlands, China and the United
States.
Figure 4 – ICMP - Total of attacks, number of attacks by day, operating systems used, geolocation of source
attacks, top10 countries by number of attacks
In the case of TCP (Figure 5), the honeypot registered about 4,050,000M anomalous connections, a
number greater than any other protocol. The port with more received intrusion attempts was the
Telnet service port (23), with over than 75% of connections. In this protocol, there is a greater
geographical focus of the attacks from Asian countries such as China, Hong Kong, Singapore and India,
included in this Top10 are the United Kingdom in Europe, the United States in North America and
Australia in Oceania. Unlike the ICMP protocol, with the TCP protocol, the main operating system
used for the attacks execution was Linux. Analyzing the timeline, in the first two days of the period
of evaluation, the number of attacks increased, maintaining a constant behavior in the remaining
period of time.
Figure 5 – TCP - Total of attacks, number of attacks by day, operating systems used, geolocation of source
attacks, top10 countries by number of attacks, top10 destination ports
EUNI 120
120
Nowadays, the network communication infrastructures are essential to support the activity of
organizations, and thus, it is important that they are monitored and managed in the best possible way
in order to guarantee quality of service to those who use them. This context is applied to UTAD and
to the management areas of SIC-UTAD, hence the need to create an architecture that would allow to
get Knowledge and Intelligence from the network infrastructure, that makes use of concepts
associated with NIA above referred in the conceptual approach of this article. On the other hand, the
organizations data is of great value to them, since it is part of their private property and so it is of
most importance to ensure their protection and assure damage prevention in risk situations.
In the network infrastructure was introduced a security mechanism that allows SIC-UTAD to have a
better perception of anomalous traffic flowing on the network infrastructure of the university.
Beyond this detection of attack attempts, the honeypot installed allowed dissuasion of production
resources, decreasing the probability of them to be attacked, and also allowed adapt Firewall rules
which filters the traffic of university, based on the generated security indicators. Until now, the
results are very positive, since it is possible to obtain knowledge of the generated data by the
infrastructure services, previously described, allowing SIC-UTAD to have a proactive approach in the
monitoring and management of UTAD’s network infrastructure, having been made some adjustments
in it.
Regarding future work, it is intended to continue research in this area of Network Intelligence, given
the development that have been made in this. It is also intended to create new dashboards for
decision support and adapt the proposed architecture to all data sources used in UTAD’s network
infrastructure. Associated to the Honeypot it is intended to optimize the data treatment process, in
order to make it more robust, efficient and fault-tolerant. In addition to this optimization, it is
expected to expand the applicability of this mechanism through the creation of several honeypots in
the various university’s subnets allowing a holistic view of the intrusions and attacks in the entire
infrastructure.
REFERENCES
Ahmed, M., Mahmood, A. & Hu, J. (2016). A survey of network anomaly detection techniques. Journal
of Network and Computer Applications, 60, 19-31.
Avizienis, A., Laprie, J., Randell, B. & Landwehr, C. (2004). Basic concepts and taxonomy of
dependable and secure computing. IEEE Transactions on Dependable and Secure Computing, 1(1),
1133.
Bolón-Canedo, V., Sánchez-Maroño, N. & Alonso-Betanzos, A. (2015). Recent advantages and
emerging challenges of features selection in the context of Big Data. Knowledge-Based Systems, 86,
33-45.
Briffaut, J., Lalande, J. & Toinard, C. (2009). Security and results of a large-scale high-interaction
Honeypot. Journal of Computers, 4(5), 395-404.
Chen, C. & Zhang, C. (2014). Data-intensive applications, challenges, techniques and technologies: A
survey on Big Data. Information Sciences, 275, 314-347.
Chen, H., Chiang, R. & Storey, V. (2012). Business Intelligence and analytics: From Big Data to big
impact. MIS Quarterly, 36(4), 1165-1188.
Corona, I., Giacinto, G. & Roli, F. (2013). Adversarial attacks against intrusion detection systems:
Taxonomy, solutions and open issues. Information Sciences, 239, 201-225.
Curran, K., Morrisey, C., Fagan, C., Murphy, C., O'Donnell, B., Fitzpatrick, G. & Condit, S. (2005). Monitoring hacker activity with a Honeynet. International Journal of Network Management, 15(2), 123-134.
Grierson, H., Corney, J. & Hatcher, G. (2015). Using visual representations for the searching and
browsing of large, complex, multimedia data sets. International Journal of Information Management,
35(2), 244-252.
Guo, S., Yuan, Z., Sun, A. & Yue, Q. (2015). A new ETL approach based on data virtualization. Journal
of Computer Science and Technology, 30(2), 311-323.
Hashem, I., Yaqoob, I., Anuar, N., Mokhtar, S., Gani, A. & Khan, S. (2015). The rise of "Big Data" on
Cloud Computing: Review and open research issues. Information Systems, 47, 98-115.
EUNI 121
121
Honeynet Project, The. (2004). Know your enemy: Learning about security threats (2ª ed.). Boston:
Addison-Wesley.
Jaiganesh, V., Mangayarkarasi, S. & Sumathi, P. (2013). Intrusion detection systems: A survey and
analysis of classification techniques. International Journal of Advanced Research in Computer and
Communication Engineering, 2(4), 1629-1635.
Janvrin, D., Raschke, R. & Dilla, W. (2014). Making sense of complex data using interactive data
visualization. Journal of Accounting Education, 32(4), 31-48.
Karagiannis, A., Vassiliadis, P. & Simitsis, A. (2013). Scheduling strategies for efficient ETL execution.
Information Systems, 38(6), 927-945.
Kebede, G. (2010). Knowledge management: An information science perspective. International
Journal of Information Management, 30(5), 416-424.
Lee, S., Levanti, K., Kim, H. (2014). Network monitoring: Present and future. Computer Networks, 65,
84-98.
Liao, H., Lin, C., Lin, Y. & Tung, K. (2013). Intrusion detection system: A comprehensive review.
Journal of Network and Computer Applications, 36(1), 16-24.
Olszak, C. & Ziemba, E. (2007). Approach to building and implementing Business Intelligence systems.
Interdisciplinary Journal of Information, Knowledge and Management, 2, 134-148.
Petrini, M. & Pozzebon, M. (2009). Managing sustainability with the support of Business Intelligence:
Integrating socio-environmental indicators and organisational context. The Journal of Strategic
Information Systems, 18(4), 178-191.
Pham, V. & Dacier, M. (2011). Honeypot trace forensics: The observation viewpoint matters. Future
Generation Computer Systems, 27(5), 539-546.
Pouget, F., Dacier, M. & Debar, H. (2003). Honeypot, Honeynet, Honeytoken: Terminological issues.
Boston: Addison-Wesley.
Prema, A. & Pethalakshmi, A. (2013). Novel approach in ETL. In Pattern Recognition, Informatics and Mobile Engineering (PRIME), 2013. International Conference on, Salem: India (pp. 429-434). IEEE.
Ramakrishnan, T., Jones, M., Sidorova, A. (2012). Factors influencing Business Intelligence (BI) data
collection strategies: An empirical investigation. Decision Support Systems, 52(2), 486-496.
Russell, J., Cohn, R. (2012). Network Intelligence. Wisconsin: Book on Demand.
Salimi, A. & Kabiri, P. (2012). Avoiding Cyber-attacks to DMZ and capturing forensics from intruders
using Honeypots. Journal of Advances in Computer Research, 3(1), 65-79.
Scheibe, K., Carstensen Jr., L., Rakes, T. & Rees, L. (2006). Going the last mile: A spatial decision
support system for wireless broadband communications. Decision Support Systems, 42(2), 557-570.
Sekhar, M., Tulasi, K., Amulya, V., Teja, D. & Kumar, M. (2015). Implementation of IDS using Snort on
bayesian network. International Journal of Computer Science and Mobile Computing, 4(4), 790-795.
Sharda, R., Delen, D. & Turban, E. (2013). Business Intelligence: A managerial perspective on
analytics (3ª ed.). New Jersey: Prentice Hall.
Spathoulas, G. & Katsikas, S. (2010). Reducing false positives in intrusion detection systems.
Computers & Security, 29(1), 35-44.
Spitzner, L. (2002). Honeypots: Tracking Hackers. London: Addison-Wesley.
Sterbenz, J., Hutchison, D., Çetinkaya, E., Jabbar, A., Rohrer, J., Scholler, M. & Smith, P. (2010).
Resilience and survivability in communication networks: Strategies, principles, and survey of
disciplines. Computer Networks, 54(8), 1245-1265.
Taylor, M., Gresty, D. & Askwith, R. (2001). Knowledge for network support. Information and
Software Technology, 43(8), 469-475.
Vizecky, K. & El-Gayar, O. (2011). Increasing research relevance in DSS: Looking forward by reflecting
on 40 years of progress. In System Sciences, 2011. HICSS’44th Hawaii International Conference on,
Hawaii: United States, (pp. 1-9). IEEE.
West-Brown, M., Stikvoort, D., Kossakowski, K., Killcrece, G., Ruefle, R. & Zajicek, M. (2003).
Handbook for Computer Security Incident Response Teams (CSIRTs) (2ª ed.). Pittsburgh: Software
Engineering Institute.
EUNI 122
122
Wu, D., Chen, S. & Olson, D. (2014). Business Intelligence in risk management: Some recent
progresses. Information Sciences, 256, 1-7.
Zuquete, A. (2013). Segurança em Redes Informáticas (4ª ed.). Lisbon: FCA.
EUNI 123
123
AUTHORS’ BIOGRAPHIES
José Bessa is an Information Systems student at University of Trás-os-Montes e
Alto Douro (UTAD), Vila Real, Portugal, where he got his bachelor’s degree in
2013 and is now completing his master’s degree in Computer Science. He is currently
researching Information Systems Architectures and Network
Communications. Besides this, implements Business Intelligence (BI) and Self-
Service BI solutions at UTAD. Further information is available at
www.linkedin.com/in/jmiguelbessa.
Hugo Coelho is currently studying Computer Science at the University of Trás-os-
Montes e Alto Douro (UTAD), Vila Real, Portugal, where he acquired his bachelor's
degree in 2015 and he is now completing his master’s degree. He is also researching the
applications that a security information and event management have in the context of
the university that he attends. Further information is available at
www.linkedin.com/in/coelhohu.
Pedro Monteiro is a Computer Science student at University of Trás-os-Montes
and Alto Douro (UTAD), Vila Real, Portugal, where he got his bachelor’s degree in 2015
and is now completing his master’s degree. Besides studies he is currently researching
security information and event management systems and their applications in the
context of the university he attends. Further information is available at
www.linkedin.com/in/monteirop.
José Brito is a Computer Science student at University of Trás-os-Montes and
Alto Douro (UTAD), Vila Real, Portugal, he is currently researching security information,
IoT, Big Data and Data Visualization Services and their applications in the context of the
university he attends. Further information is available at
www.linkedin.com/in/josepedrobrito.
António Costa is a ICT specialist at the University of Trás-os-Montes e Alto Douro
(UTAD), Vila Real, Portugal, and is responsible for the coordination the areas of core
infrastructure and communications, computer security areas, data center, VoIP and
communications networks. He collaborates in teaching on different degrees of Computer
Courses, as well as in research, extension and development projects. Holds a degree in
Electrical Engineering (specialization in Electronics, Instrumentation and Computation)
and a post-graduate degree in engineering area. Currently, he is in the final research
stage to complete the PhD in Computer Sciences. He made several made courses or
specializations which includes the
Upper Course Director for Public Administration; Diploma of specialization of the Information Society for
Public Administration, SIP Masterclasses and a OpenStack specialization. Further information is available at
www.linkedin.com/in/ariocosta.
EUNI 124
124
A browser-based digital signing solution over the web
Fotis Loukos1, Charalampos Tsipizidis
2, Dimitris Daskopoulos
3
1Aristotle University of Thessaloniki IT Center, PO Box 888, EL 541 24, [email protected]
2Aristotle University of Thessaloniki IT Center, PO Box 888, EL 541 24, [email protected] 3Aristotle University of Thessaloniki IT Center, PO Box 888, EL 541 24, [email protected]
Keywords
Digital Signing, Document and Grade Signing, Certificates, Web Extensions, Native Messaging API.
1. INTRODUCTION
The ability to digitally sign documents or pieces of information for submission over the web is an area of work
that concerns all major organizations and governments. Educational institutions have the typical needs of
document signing, as well as assuring that the grade submission process and long term archival of grades is not
exposed to risk. Typical solutions so far have involved hardware cryptographic devices that guarantee a higher
level of security for safekeeping of the signer’s personal certificate. This makes it harder for web browser
applications to access these non-standard devices for signing and most existing solutions resort to Java applets
loading proprietary libraries. With Java being plagued by so many vulnerabilities, maintaining a working, let
alone secure, setup on end-user machines has become a major challenge for organizations. Furthermore,
Oracle has already announced that the Java Plugin for browsers will be phased out in the near future (Oracle,
2016).
2. PROPOSED SOLUTION
In order to overcome the aforementioned problems, a pure Javascript solution should be deployed. Currently,
Javascript supports the Web Crypto API (Sleevi & Watson, 2014) which allows cryptographic operations such as
hashing, encrypting and signing. However, to ensure the privacy of the end users, the Web Crypto API does
not support cryptographic operations using cryptographic devices which can be used to identify the user. Thus,
a different approach is required.
Google Chrome Native Messaging (Google, 2016) is a technology which allows developers to create native
applications, called Native Messaging Hosts, which can be executed by the Google Chrome browser, and
communicate using a message passing interface with Google Chrome extensions and apps. Hence, a native
application which uses the PKCS11 API (RSA Laboratories, 2004) can be used to sign any message in
cooperation with an extension that implements the communications with the browser.
2.1 Architecture
The proposed solution consists of two major components, the Native Messaging Host and the Native Messaging
Application. The Native Messaging Host is the OS native program that uses the cryptographic interface to
communicate with a hardware cryptographic device and digitally sign the payload. On the other hand, the
Native Messaging Application is a pure Javascript implementation running in the web browser having the form
of a Web Extension Plugin. It initiates the signing process, by passing the payload to the Native Messaging Host
and retrieves the results.
2.2 The Native Messaging Host
The Native Messaging Host is launched by the Web Extension Plugin and receives a JSON formatted message at
its standard input. The message consists of a payload to be signed and a number of different options.
Currently, the host can accept messages in various encodings, such as base64, which allows users to sign
arbitrary binary data, and can apply a hash function to the input message. By loading any known PKCS11
libraries, it searches for attached hardware devices and signs the payload when it finds an appropriate
certificate.
EUNI 125
125
With multiplatform support being a prerequisite, the program should be written in a portable scripting
language, and Python 3 was the authors’ programming language of choice.
In order to interface with PKCS11 libraries, the PyKCS11 Python module (Amato & Rousseau, 2016) was used. It
is based on the SWIG framework and implements a Python wrapper around any standard PKCS11 library. It has
been successfully tested with the Gemalto Classic Client and the Safenet eToken Client under Windows (x86
and x64 architectures), Linux (x86 and x64 architectures) and Mac OS X.
2.3 The Native Messaging Application (Browser Plugin)
The Native Messaging Application initiates the signing procedure when the user triggers a DOM element inside
a specific webpage. The extension then crafts a JSON message containing parts of the webpage to be signed
and forwards it to the Native Messaging Host. The extension also registers a callback function, triggered when
the Native Messaging Host responds, to embed the signed data back into the webpage and inform the user of
the successful signing. After the end of the signing process the data can be sent to the web server for storage.
The Google Chrome extension is available for installation through the Google Chrome Web store. Users can be
guided to either preinstall the Plugin, or the webpage can prompt installation by clicking at an element in the
related website (inline installation). The latter makes the procedure more transparent.
3. CONCLUSION
We have implemented a low maintenance solution for digital signing based on personal certificates stored on
hardware devices. So far, this solution is only available to Google Chrome users. Similar functionality will be
made available to Mozilla users with the WebExtensions API which is expected to be released in Q2 2016. The
installation procedure is simple and is not affected by the security updates of Java or other third-party
software. It allows organizations with a large employee basis to function on wide scale digital signing projects
with the maximum of security, that is personally stored digital certs.
4. REFERENCES
Amato, G. & Rousseau, L., PyKCS11 - PKCS#11 Wrapper for Python. Retrieved February 18 2016, from:
https://bitbucket.org/PyKCS11/pykcs11.
Google (2016). Native Messaging. Retrieved February 18 2016, from:
https://developer.chrome.com/extensions/nativeMessaging.
Oracle (2016). Moving to a Plugin-Free Web. Retrieved February 18 2016, from:
https://blogs.oracle.com/java-platform-group/entry/moving_to_a_plugin_free.
RSA Laboratories (2004), PKCS #11 v2.20: Cryptographic Token Interface Standard. Public Key Cryptography
Standards PKCS#11-v2.20.
Sleevi, R., & Watson M. (2014), Web Cryptography API, W3C.
5. AUTHORS’ BIOGRAPHIES
Dr Fotis Loukos is working for the Computing Infrastructure and Systems Administration Department of the IT
Center of Aristotle University of Thessaloniki where he focuses on Network and Information Security. He is the
PKI Administrator of the Hellenic Academic and Research Institutions Certification Authority (HARICA), a
Certification Services Provider included in most major Root CA programs (Mozilla, Microsoft, Apple) and in the
EU TSL. He is also an external contractor for the European Network Information Security Agency (ENISA). He
holds a Doctor of Philosophy in Computer Science from the Department of Informatics of the Aristotle
University of Thessaloniki. His interests include Network and Information Security, Cryptography and Public
Key Infrastructures.
https://gr.linkedin.com/in/fotisloukos
Charalampos Tsipizidis works as a software developer at the IT Center of the Aristotle University of
Thessaloniki. His work experience and interests lie in web conferencing systems (both Flash and WebRTC
based), web development with numerous PHP frameworks, Linux system administration, load balancing and
information security.
https://gr.linkedin.com/pub/charalampos-tsipizidis/3a/822/2b7

EUNI 126
126
Dimitris Daskopoulos holds a Master’s degree in Computer Engineering from Penn State University. He works
at the IT Center of the Aristotle University of Thessaloniki, as Head of the Services Unit, a line of work he still
finds immersive after 20 years. His interests are in web development, authentication/authorization, and
DevOps practices for university applications.
EUNI 127
127
Engaging students in building better digital services
Pauliina Kupila1, Ulla Lehtonen
2
1University of Helsinki, P.O. Box 53, 00014 University of Helsinki, Finland, [email protected]
2University of Helsinki, P.O. Box 53, 00014 University of Helsinki, Finland, [email protected]
Keywords
Innovation, technology, mobile application, student-centred, social theory of learning
1. Summary
University students use a number of Social Network Sites (SNS) in their everyday life (Usuel et al. 2009). For
example Facebook and WhatsApp are used to create own circles and groups to help in connecting with other
students. The University of Helsinki does not recommend educational use of Facebook since we cannot
require the students to sign up for user accounts in SNSs.
The Digital Teaching and Learning Environment project of the University of Helsinki develops new teaching
and learning services in order to create a uniform and user-friendly learning environment. The services are
developed using the agile approach and with the attitude "mobile first". Both teachers and students are
engaged in planning and testing of the services.
As a new way to catch ideas and feedback from students we have invited students to participate in a Student
Panel, which meets about three times a semester. The incentive to participate in the panel is the chance to
influence on the planning of new digital services. The panel members will serve as early adopters of our
services.
Before launching the Student Panel, we organized a student workshop for innovating new digital student
services. One of the ideas presented was the Opinder. It is a mobile application, which helps students to
communicate with other students in the same courses. The Opinder is connected to the student
information system (SIS) and it shows the courses a student has registered to. Students can create events, and
invite other students from their courses to join the events. As students get to know each another, they can
create own groups and make direct invitations to the groups. Students can also chat with one another.
2. STUDENT-CENTRED APPROACH
The Digital Teaching and Learning Environment project’s focus is on students, and we are very interested in
students' opinions on the new services. We take part in student events and co-operate with the student union.
As our working method is agile, we test our services on students continuously. We carefully follow their
feedback on improvements and possible missing details in our services. This student-centred approach is also
one of the top priorities in the new strategy of University of Helsinki (2017 – 2020). (2016)
2.1 Student Panel
The purpose of the Student Panel of the University of Helsinki is to let students guide our development of
digital services. At the same time, we want to challenge ourselves and the University to try out new
approaches to the teaching and learning environment.
The Student Panel has 15 members from different faculties. The panel members will provide the project with
feedback on upcoming digital services, and brainstorm new digital student services and mobile
applications. The Student panel has the power to change our plans and priorities on developing digital
services. The Student Panel gathers about three times in semester, and so far it has met five times.
In the very first panel meeting we introduced My Studies, the new digital service we had developed. At that
point My Studies provided the student with a list of upcoming lectures and an ability to add them to his
calendar. Our question to the Panel was, is this enough or should there be a calendar view. Contrary to our
expectations, the students saw the calendar view as an important feature. With that in mind, we
implemented it in our next development sprint. According to our user tracking the calendar view is more
frequently used than the list of lectures; thus, the Student Panel had a right instinct on the needs of the
students.
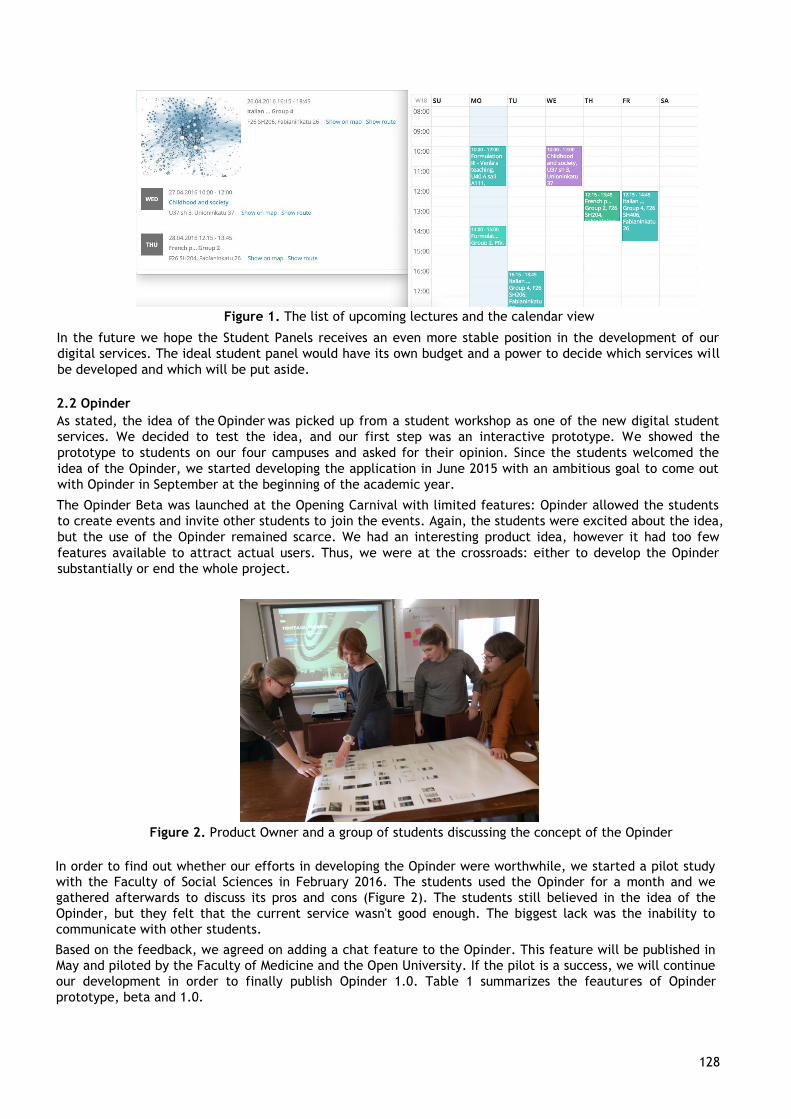
EUNI 128
128
Figure 1. The list of upcoming lectures and the calendar view
In the future we hope the Student Panels receives an even more stable position in the development of our
digital services. The ideal student panel would have its own budget and a power to decide which services will
be developed and which will be put aside.
2.2 Opinder
As stated, the idea of the Opinder was picked up from a student workshop as one of the new digital student
services. We decided to test the idea, and our first step was an interactive prototype. We showed the
prototype to students on our four campuses and asked for their opinion. Since the students welcomed the
idea of the Opinder, we started developing the application in June 2015 with an ambitious goal to come out
with Opinder in September at the beginning of the academic year.
The Opinder Beta was launched at the Opening Carnival with limited features: Opinder allowed the students
to create events and invite other students to join the events. Again, the students were excited about the idea,
but the use of the Opinder remained scarce. We had an interesting product idea, however it had too few
features available to attract actual users. Thus, we were at the crossroads: either to develop the Opinder
substantially or end the whole project.
Figure 2. Product Owner and a group of students discussing the concept of the Opinder
In order to find out whether our efforts in developing the Opinder were worthwhile, we started a pilot study
with the Faculty of Social Sciences in February 2016. The students used the Opinder for a month and we
gathered afterwards to discuss its pros and cons (Figure 2). The students still believed in the idea of the
Opinder, but they felt that the current service wasn't good enough. The biggest lack was the inability to
communicate with other students.
Based on the feedback, we agreed on adding a chat feature to the Opinder. This feature will be published in
May and piloted by the Faculty of Medicine and the Open University. If the pilot is a success, we will continue
our development in order to finally publish Opinder 1.0. Table 1 summarizes the feautures of Opinder
prototype, beta and 1.0.
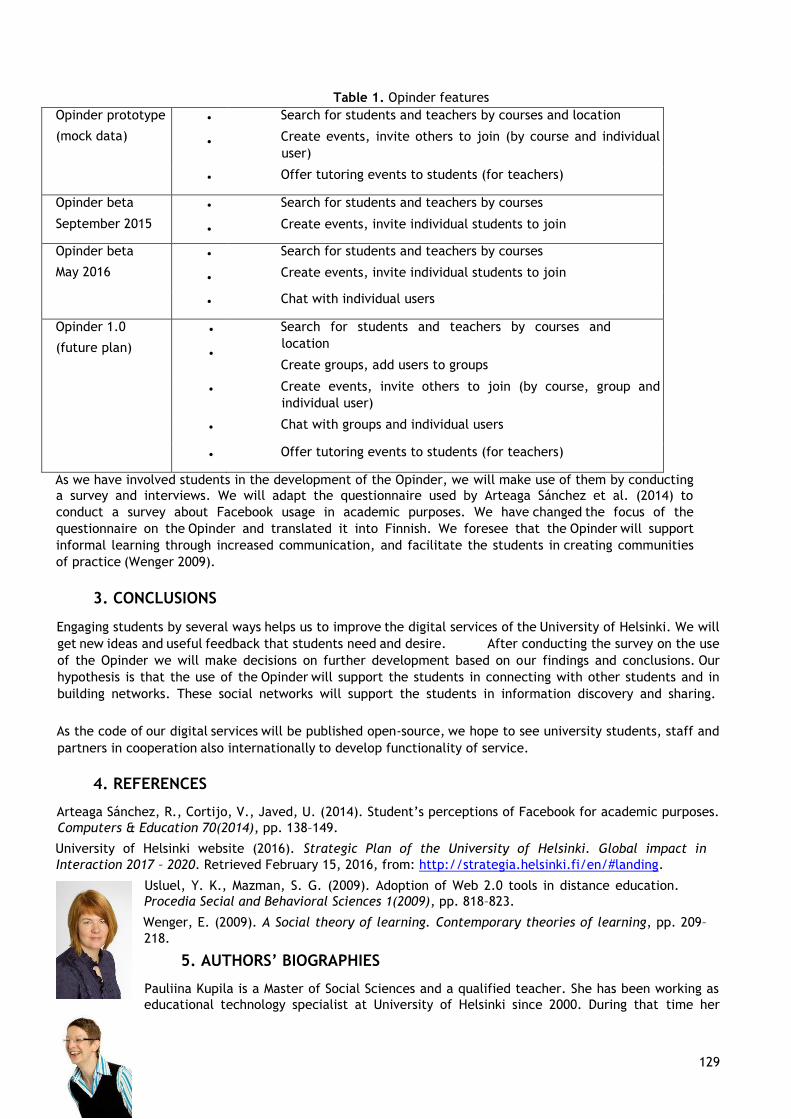
EUNI 129
129
Table 1. Opinder features
Opinder prototype
(mock data)
•
•
Search for students and teachers by courses and location
Create events, invite others to join (by course and individual
user)
• Offer tutoring events to students (for teachers)
Opinder beta
September 2015
•
•
Search for students and teachers by courses
Create events, invite individual students to join
Opinder beta
May 2016
•
•
Search for students and teachers by courses
Create events, invite individual students to join
• Chat with individual users
Opinder 1.0
(future plan)
•
•
Search for students and teachers by courses and
location
Create groups, add users to groups
• Create events, invite others to join (by course, group and
individual user)
• Chat with groups and individual users
• Offer tutoring events to students (for teachers)
As we have involved students in the development of the Opinder, we will make use of them by conducting
a survey and interviews. We will adapt the questionnaire used by Arteaga Sánchez et al. (2014) to
conduct a survey about Facebook usage in academic purposes. We have changed the focus of the
questionnaire on the Opinder and translated it into Finnish. We foresee that the Opinder will support
informal learning through increased communication, and facilitate the students in creating communities
of practice (Wenger 2009).
3. CONCLUSIONS
Engaging students by several ways helps us to improve the digital services of the University of Helsinki. We will
get new ideas and useful feedback that students need and desire. After conducting the survey on the use
of the Opinder we will make decisions on further development based on our findings and conclusions. Our
hypothesis is that the use of the Opinder will support the students in connecting with other students and in
building networks. These social networks will support the students in information discovery and sharing.
As the code of our digital services will be published open-source, we hope to see university students, staff and
partners in cooperation also internationally to develop functionality of service.
4. REFERENCES
Arteaga Sánchez, R., Cortijo, V., Javed, U. (2014). Student’s perceptions of Facebook for academic purposes.
Computers & Education 70(2014), pp. 138–149.
University of Helsinki website (2016). Strategic Plan of the University of Helsinki. Global impact in
Interaction 2017 – 2020. Retrieved February 15, 2016, from: http://strategia.helsinki.fi/en/#landing.
Usluel, Y. K., Mazman, S. G. (2009). Adoption of Web 2.0 tools in distance education.
Procedia Secial and Behavioral Sciences 1(2009), pp. 818–823.
Wenger, E. (2009). A Social theory of learning. Contemporary theories of learning, pp. 209–
218.
5. AUTHORS’ BIOGRAPHIES
Pauliina Kupila is a Master of Social Sciences and a qualified teacher. She has been working as
educational technology specialist at University of Helsinki since 2000. During that time her

EUNI 130
130
main duties have been teacher training, project management and development. Currently she is the product
owner of Opinder and My Studies in the Digital Teaching and Learning Environment project.
(LinkedIn: https://fi.linkedin.com/in/pauliinakupila)
Ulla Lehtonen is a Master of Science (Tech) and a Bachelor of Social Sciences. She has worked at the
University of Helsinki for a decade as educational technology specialist, head of academic affairs and planning
officer. Thus her main duties have varied from teacher training to administration, student admissions, quality
management, and project management. Currently she is the product owner of My Teaching and a number of
smaller services in the Digital Teaching and Learning Environment project.
(LinkedIn: https://fi.linkedin.com/in/ullalehtonen)
EUNI 131
131
User Support 2.0 – New Communication Channels in the IT-ServiceDesk at RWTH Aachen University
Sarah Grzemski1
1RWTH Aachen University IT Center, Seffenter Weg 23, 52074 Aachen, [email protected]
Keywords
Service desk, chat support, blog, multi-channel communication, omni-channel communication
1.Summary
The world we live in is increasingly becoming mobile. Smartphones and tablets act as our daily
companions. As a result, our communication habits have changed. At the same time, the demand for
quick answers to questions and requests is rising. Telephone and e-mail experience competition from
chats and web portals while blogs with corresponding communities as well as information portals
enjoy increasing popularity. Looking at the annual user satisfaction survey conducted by the RWTH
Aachen University IT Center, the results of 2014 confirmed this trend for the customers of the IT
Center. Regarding the survey results and against the backdrop of the above mentioned developments,
the ITServiceDesk conceptualized scenarios for additional future-oriented communication channels
that have been implemented in 2015. Hence the IT-ServicDesk that was recently based on telephone
and e-mail communication has step by step advanced to a multi-channel service provider. This was a
necessary precondition to establish an omni-channel system in the future.
2. IT CENTER OF RWTH AACHEN UNIVERSITY AND ITS IT-SERVICEDESK
The IT Center is a central organization of RWTH Aachen University that supports crucial IT processes of
the university, provides and distributes approx. 34 basic as well as individual IT services for other
organizational units of the university and external partners. As a provider of IT services, the IT Center
has to analyze the wants and needs of its customers. The implementation of IT Service Management in
2008 already showed that a central contact for users of the IT services provided by the IT Center is
essential to bring a high-quality approach to the increasing user requirements. The IT-ServiceDesk
(ITSD) is responsible for accommodating any concerns the user may have and for directly processing
1stlevel support queries. Additionally, the IT-SD organizes and structures the communication between
the user and the various specialist departments of the IT Center in the event of more complex issues.
The variety and complexity of the services and the heterogeneity of users pose a significant challenge
to the IT-SD supporters, their knowledge and communication skills. These communicative
competencies include a very broad range of content knowledge and expertise on the one hand and
allow the IT-SD staff to operate in a particularly professional and customer-oriented way on the other
hand. In order to better and more sensitively respond to customer needs and hence to increase
customer understanding, the IT-SD has been conducting annual user survey since 2011. The user
survey of 2014 indicated that the customers of the IT Center are requesting new and modern contact
channels.
3. IT-SERVICEDESKS WITH NEW COMMUNICATION CHANNELS
The self-conception of the IT Center as a modern IT service provider and changing communication
habit of the users affected the IT-SD to intensively discuss and deal with new, modern communication
channels. We started by looking at other outstanding universities (TU9 and Idea League). The analysis
revealed that except for the Delft University of Technology none of the above-mentioned universities
offered e.g. a chat support or a blog with community for their support teams, helpdesks or
information centers. Issues concerning work organization, staff workloads as well as implementation
scenarios were subject of intensive discussion. Initial experience with our ticket portal (live since
January 2015) that allows the user to check the status of their inquiry online and at any time proved
helpful in this matter. We had also gained experience of posting information via the Facebook account
of the RWTH Aachen University. Against this background and with the wish that our customers would
open up to new, modern communication channels, the IT Center blog with its support community, the
web chat available via the website of the documentation portal as well as the support chat of the
EUNI 132
132
RWTHApp were designed as a multi-channel solution. Multi-channel means having various channels
available for customers to submit requests: email, chat, social media, etc. This implies that the
customer support department has to run 5 or even more applications to manage all of those customer
interactions. For the customer, there is no connection between the systems, so there is no
information flow between different requests. There is also no connection for the supporter due to the
non-integrated information about the customer history. Despite of this challenges the implementation
of a multi-channel system was an appropriate step forward. From the perspective of the user the
diversity of communication channels -that had been realized in the short term- is highly convenient
and allows an individualized communication behavior. Otherwise the IT-SD and its staff gained
organizational and individual experiences in dealing with the new channels. Hence the IT-SD met the
requirements of its customers, upgraded its communication system and created a positive image as a
modern service provider.
3.1 Chat Support via RWTHApp and Web Chat
Owing to the pre-existing functionalities of the audience response system, integrated in the RWTHApp,
the integration of the support chat in the RWTHApp was not a real issue. The integration on the
documentation portal website could also be implemented rapidly. What proves more challenging is
the development of a suitable, user-friendly backend for both use cases. It had to be ensured that the
chats are integrated in the requirement of the existing reporting rules (number, duration, time of
reception etc.). Additionally, it was necessary to test how many chats are to be processed by the staff
and how many staff members are basically required to realize a swift and high-quality chat support.
Questions e.g. how quickly a chat had to be responded, how users should be addressed and what
questions were even suitable to be processed and answered via the communication channel chat had
to be answered beforehand. “Go live” was in November 2015 and at present it can be stated that the
prudent procedure of not promoting the support chat via the IT Center blog and not yet releasing a
Facebook post gives us time to deal with this new additional communication channel and to learn
what our customers will expect from this channel.
3.2 IT Center Blog and its Community
The IT Center blog was designed as a modern information platform that provides weekly, target-
groupspecific posts. A defined process that regulates what posts are released at what time and how,
allows the authors to “produce to stock” and backlog posts but also to permit guest commentaries. As
a result, we have succeeded in consistently releasing at least one post each week, since July 1, 2015.
The objective is to involve users in moderated discussions so that finally support communities will
emerge. Contests and quizzes are intended to encourage users to participate actively in the creation
of the community. Experience from networking groups of student dormitories have shown that there is
a great deal of readiness to act as supporters on the user side.
4. CONCLUSION & OUTLOOK
Today it´s self-evident that users communicate via chats, web portals, apps and Facebook beside the
conventional contact channels. This diversity of communication opportunities is already established in
business. The IT Center followed this development through the implementation of a communication
strategy including chats and blog. Along with major challenges, the progressive digitization also
presents a wide array of possibilities to intelligently control customer inquiries, prevent calls and
enhance the benefits for the customer. However, the implementation of new channels must be closely
coordinated and tailored to the individual customer target groups. It has to be taken into account
what channel is really needed and what technical support possibilities can be integrated accordingly.
Securing a fully integrated reporting that spans across all channels should also be considered. The
impact of the changing communication behavior on the staff has to be taken into consideration. E.g.
the level of flexibility and the willingness to communicate with the customers on a multitude of
channels will increase. The aim is to synchronize and integrate various communication channels at the
IT Center in a way that will eventually ensure a special user experience and at the same time reduce
the staff’s workload. In this system of omni-channel communication all customer information and
contact points are cross-linked through various applications. Specifically, this represents that the
advantages of digital and conventional communication and distribute/sales channels are seamlessly
tied together, guiding the customer from the initial information search through contacting and up to
the order process, irrespective of when and, in particular, which channels were utilized for the
individual steps. The strategic vision of IT Center is to become an omni-channel service provider.

EUNI 133
133
5. AUTHORS’ BIOGRAPHIES
Sarah Grzemski studied Economic Geography, Geography and Economics. She
received her Master’s degree from RWTH Aachen University in 2002. Until 2007, she worked
as a research assistant in the Department of Economic Geography of Services. Her main
research focus were employees in call and service centers. Since 2007 until today, she has
been employed at the IT Center of RWTH Aachen University. Initially, she worked for the
division of Process IT Support. Since 2010, she is the head of the division IT-ServiceDesk. In
this role, she assumes responsibility for the staff and the strategic development of the IT-
ServiceDesk, particularly with regard to customer support and service.
EUNI 134
134
Electronic management of assessment: business processes, system requirements and institutional
capability Dr Gill Ferrell
1, Lisa Gray
2
1 Consultant to Jisc, One Castlepark, Tower Hill, Bristol, BS2 0JA, UK, [email protected]
2Jisc,
One Castlepark, Tower Hill, Bristol, BS2 0JA, UK, [email protected]
Keywords
Assessment, business processes, digital assessment, electronic management of assessment, integration,
life-cycle, online submission, online marking, process review, self-assessment, system requirements.
1. ABSTRACT
This paper reports the final outcomes of a programme of work looking at the electronic management
of assessment (EMA) that was carried out in collaboration with UK universities, national agencies,
system suppliers and the EUNIS membership.
Collaboration via the EUNIS e-Learning Task Force has allowed cross-fertilisation of ideas and sharing
of resources at the European level. We report on some of the outcomes of this work and suggest how
individual universities can use the resources to build capacity in their own institution.
2. INTRODUCTION
This paper is the fourth in a series looking at enhancement of assessment and feedback practice in UK
universities and the lessons to be learned for the wider EUNIS community. The first paper (Ferrell &
Sheppard 2013) presented a landscape review which showed that, although assessment and feedback
lies at the heart of the learning experience, it remains the single biggest source of student
dissatisfaction with the UK higher education experience. Subsequent papers (Ferrell & Stewart 2014
and Ferrell & Gray 2015) analysed the problems from both institutional and systems perspectives and
looked at tools and approaches that were being successfully applied to tackle all of these issues.
This paper reports the final outcomes of this programme of work carried out in collaboration with UK
universities, national agencies, system suppliers and the EUNIS membership. We have amassed a
significant amount of knowledge and guidance about good practice. The goal now is to help
universities make effective use of the available guidance in their own context.
Throughout this paper we use the term electronic management of assessment (EMA). This describes
the way technology can support the management of the entire life cycle of assessment and feedback
activity, including the electronic submission of assignments, marking, feedback and the return of
marks and feedback to students.
3. FINDING COMMON GROUND
At first sight it seemed as if we were tackling issues too diverse and complex to make any sense of
them in a single university let alone deliver solutions that were applicable UK wide and ultimately
useful to all EUNIS members.
The first big step forward came when, building upon the work of EUNIS Elite Award winners 2014
Manchester Metropolitan University (Stubbs 2014), we were able to define an academic model showing
a high level view of the academic processes involved in assessment and feedback. The assessment and
feedback lifecycle shown below was found to have widespread applicability across UK higher and
further education and work with the EUNIS e-Learning Task Force revealed that it was similarly useful
in the wider European context.
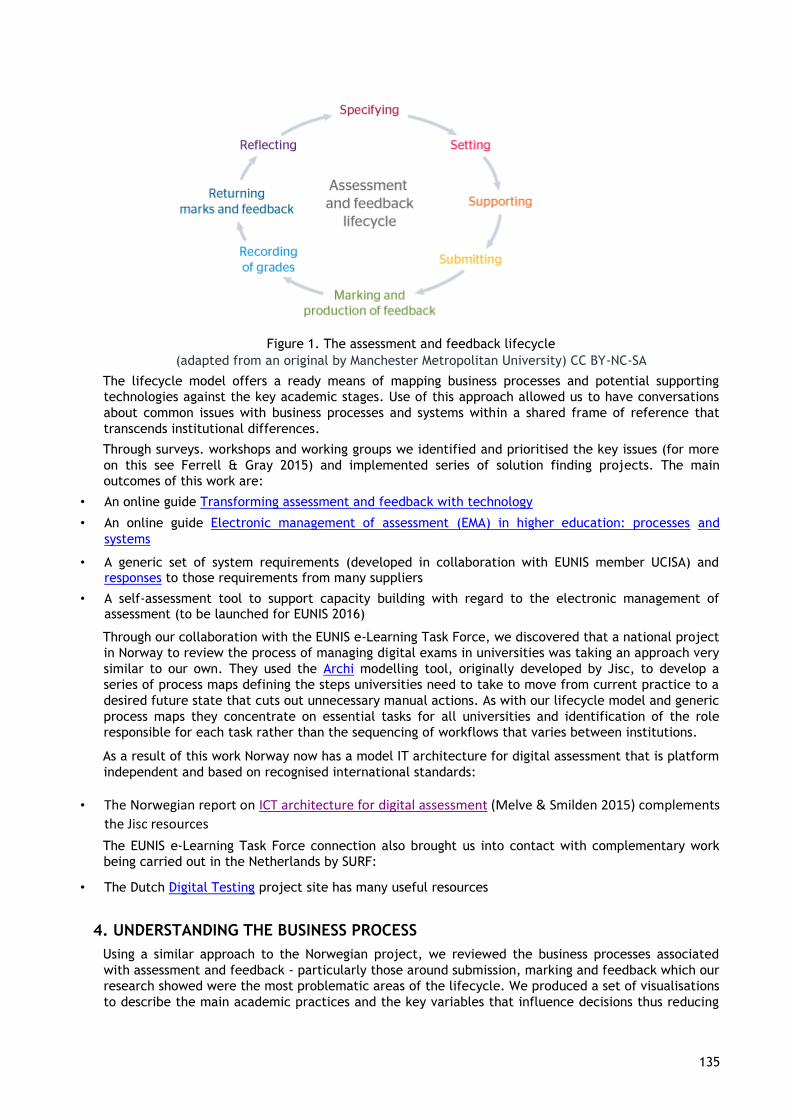
EUNI 135
135
Figure 1. The assessment and feedback lifecycle
(adapted from an original by Manchester Metropolitan University) CC BY-NC-SA
The lifecycle model offers a ready means of mapping business processes and potential supporting
technologies against the key academic stages. Use of this approach allowed us to have conversations
about common issues with business processes and systems within a shared frame of reference that
transcends institutional differences.
Through surveys. workshops and working groups we identified and prioritised the key issues (for more
on this see Ferrell & Gray 2015) and implemented series of solution finding projects. The main
outcomes of this work are:
• An online guide Transforming assessment and feedback with technology
• An online guide Electronic management of assessment (EMA) in higher education: processes and
systems
• A generic set of system requirements (developed in collaboration with EUNIS member UCISA) and responses to those requirements from many suppliers
• A self-assessment tool to support capacity building with regard to the electronic management of assessment (to be launched for EUNIS 2016)
Through our collaboration with the EUNIS e-Learning Task Force, we discovered that a national project
in Norway to review the process of managing digital exams in universities was taking an approach very
similar to our own. They used the Archi modelling tool, originally developed by Jisc, to develop a
series of process maps defining the steps universities need to take to move from current practice to a
desired future state that cuts out unnecessary manual actions. As with our lifecycle model and generic
process maps they concentrate on essential tasks for all universities and identification of the role
responsible for each task rather than the sequencing of workflows that varies between institutions.
As a result of this work Norway now has a model IT architecture for digital assessment that is platform
independent and based on recognised international standards:
• The Norwegian report on ICT architecture for digital assessment (Melve & Smilden 2015) complements
the Jisc resources
The EUNIS e-Learning Task Force connection also brought us into contact with complementary work
being carried out in the Netherlands by SURF:
• The Dutch Digital Testing project site has many useful resources
4. UNDERSTANDING THE BUSINESS PROCESS
Using a similar approach to the Norwegian project, we reviewed the business processes associated
with assessment and feedback - particularly those around submission, marking and feedback which our
research showed were the most problematic areas of the lifecycle. We produced a set of visualisations
to describe the main academic practices and the key variables that influence decisions thus reducing
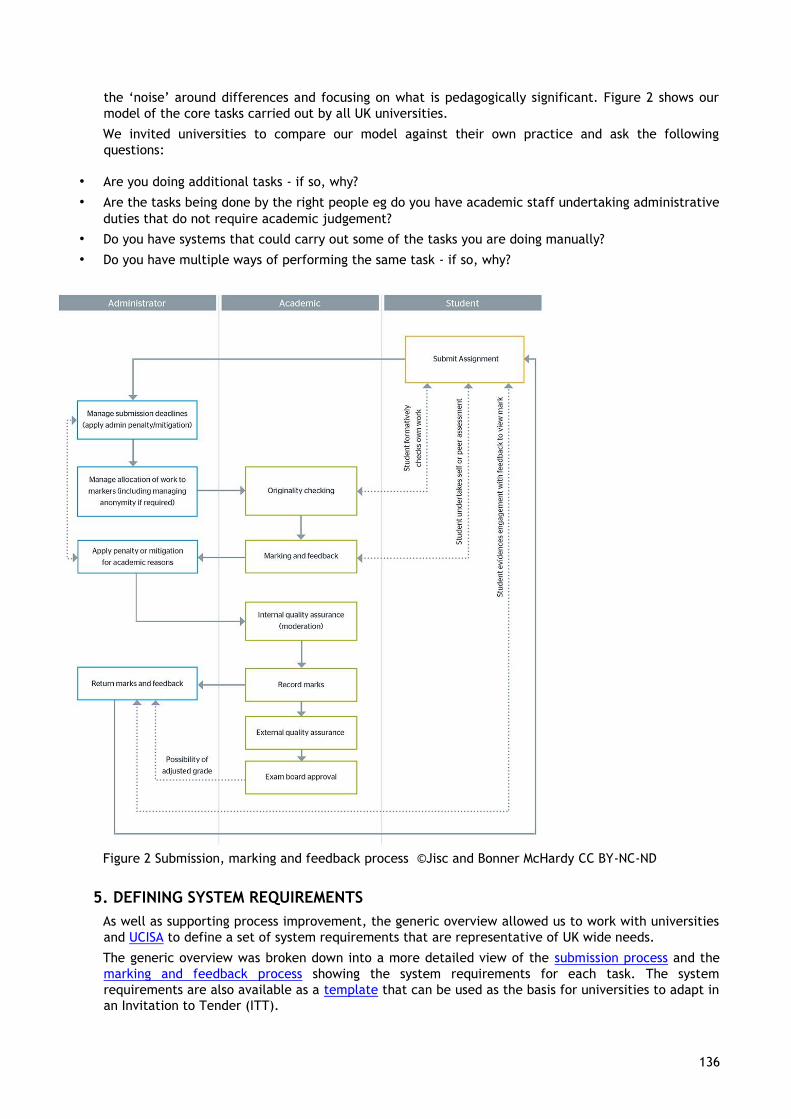
EUNI 136
136
the ‘noise’ around differences and focusing on what is pedagogically significant. Figure 2 shows our
model of the core tasks carried out by all UK universities.
We invited universities to compare our model against their own practice and ask the following
questions:
• Are you doing additional tasks - if so, why?
• Are the tasks being done by the right people eg do you have academic staff undertaking administrative
duties that do not require academic judgement?
• Do you have systems that could carry out some of the tasks you are doing manually?
• Do you have multiple ways of performing the same task - if so, why?
Figure 2 Submission, marking and feedback process ©Jisc and Bonner McHardy CC BY-NC-ND
5. DEFINING SYSTEM REQUIREMENTS
As well as supporting process improvement, the generic overview allowed us to work with universities
and UCISA to define a set of system requirements that are representative of UK wide needs.
The generic overview was broken down into a more detailed view of the submission process and the
marking and feedback process showing the system requirements for each task. The system
requirements are also available as a template that can be used as the basis for universities to adapt in
an Invitation to Tender (ITT).

EUNI 137
137
A range of system suppliers completed the template comparing their product features against the
requirements and these have been published on the Jisc EMA blog to aid universities and colleges
better understand the ways in which particular systems can support their needs and to see how
particular combinations of systems might work together. Interestingly the EUNIS connection prompted
interest from suppliers across Europe some of whom are not currently operating in the UK market.
6. INDICATORS OF EMA MATURITY
As a result of this body of work, we were able to identify a series of key factors that universities need
to think about in relation to their assessment practice and these became the indicators of institutional
EMA maturity.
6.1 STRATEGY/POLICY AND QUALITY ASSURANCE
A key indicator of maturity is the extent to which institutions have moved towards ensuring that
electronic management of assessment is enshrined in their formal strategy, policies and procedures.
Responsibility for assessment and feedback policy and procedure is often devolved to local level
within institutions so it can take some time for good practice involving new use of technology to
become normalised. During the early stages of adoption there will be many pilot projects but for
these practices to become embedded such that they are the normal way of doing things requires a
more directive approach. As institutions become more confident in the benefits of EMA they tend to
offer fewer possibilities of 'opting out' of the digital approach.
The persistence of organisational myths surrounding policy and quality assurance processes is actually
a significant barrier to change. The tendency to do things the way they have always been done can
often be perpetuated by a belief that this is somehow enshrined in policy. Academics are often
surprised to find that many characteristics of existing processes are matters of historic choice rather
than regulatory issues. They are often surprised at how few regulations there actually are or how easy
it is to make changes to perceived barriers in the regulatory frameworks. Variation in how staff apply
assessment policy across an institution is thus often down to such myths about what actually
constitutes the policy in the first place.
6.2 CURRICULUM DATA
Good quality data about the academic curriculum and how it is assessed is essential. Simply having
easy access to information about what learning outcomes are being assessed, how they will be
assessed and when feedback and marks are due, can greatly improve student satisfaction. Assessment
remains an area where much information is still paper-based. Having information in digital format can
facilitate the transfer of data between systems and cut out manual entry. The corollary of this is that
the more technology is used, the more errors and inconsistencies in data become visible.
Many institutions operate ineffective assessment regimes because they simply do not have sufficient
information about what is being assessed. Basic analytics on assessment practice can help avoid a
range of issues such as assessment 'bunching' impacting staff and student workload, over-assessment
or assessing certain learning outcomes many times whilst ignoring others. Good information
management is a very significant indicator of institutional capability.
6.3 PROCESSES AND WORKING PRACTICES
Many institutions struggle to get the most out of their information systems due to the variety and
complexity of their business processes. Large universities rarely have a single, institution-wide,
business process for a given function. Different faculties, schools, departments and programmes each
have their own way of doing things and this variation can prevent them from achieving the efficiencies
and benefits possible through EMA technology.
Any organisation with many different ways of carrying out the same activity is likely to need a series
of time-consuming and cumbersome workarounds to adapt their information systems to these bespoke
approaches. We found that standardisation of business processes is necessary before universities can
move beyond large scale pilots to institution-wide implementation of EMA.
6.4 TECHNOLOGY
The capability of existing commercial systems to meet institutional requirements is often voiced as a
concern. However, we found that data and business processes are equally, if not more, relevant issues.
Participants in our research frequently commented on the extent to which new technologies are
'bolted on' to old processes without people really taking the time to stand back and consider what the
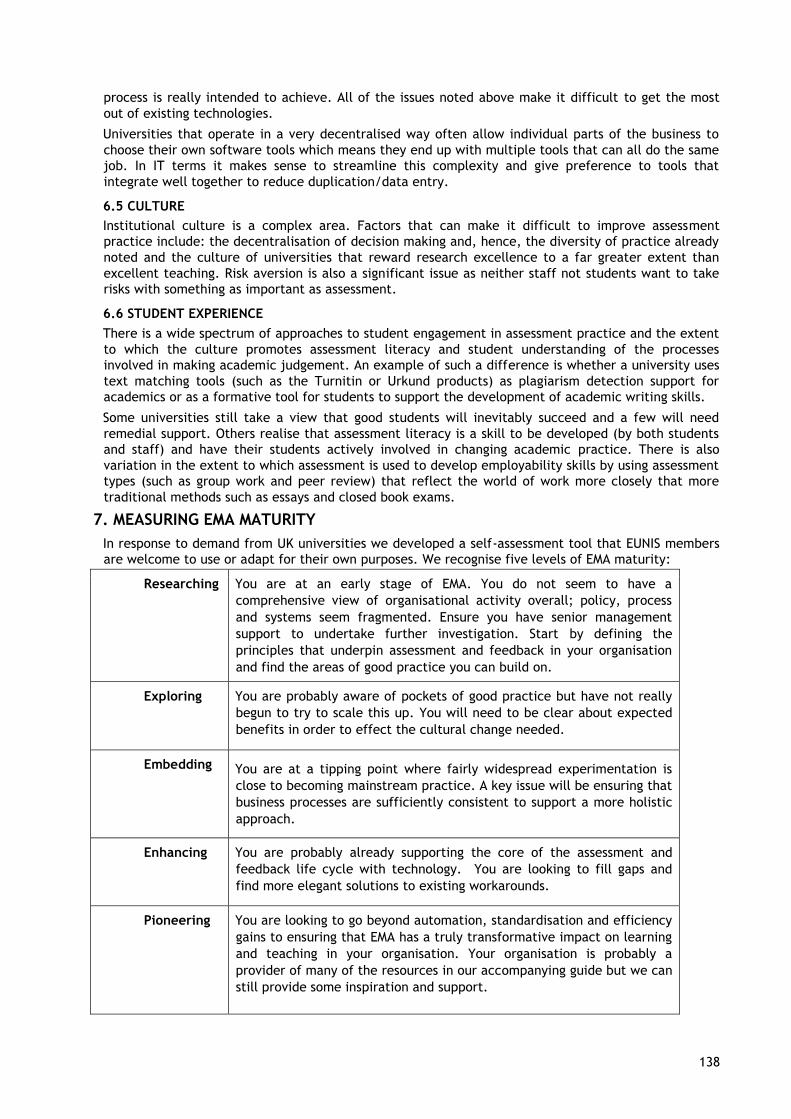
EUNI 138
138
process is really intended to achieve. All of the issues noted above make it difficult to get the most
out of existing technologies.
Universities that operate in a very decentralised way often allow individual parts of the business to
choose their own software tools which means they end up with multiple tools that can all do the same
job. In IT terms it makes sense to streamline this complexity and give preference to tools that
integrate well together to reduce duplication/data entry.
6.5 CULTURE
Institutional culture is a complex area. Factors that can make it difficult to improve assessment
practice include: the decentralisation of decision making and, hence, the diversity of practice already
noted and the culture of universities that reward research excellence to a far greater extent than
excellent teaching. Risk aversion is also a significant issue as neither staff not students want to take
risks with something as important as assessment.
6.6 STUDENT EXPERIENCE
There is a wide spectrum of approaches to student engagement in assessment practice and the extent
to which the culture promotes assessment literacy and student understanding of the processes
involved in making academic judgement. An example of such a difference is whether a university uses
text matching tools (such as the Turnitin or Urkund products) as plagiarism detection support for
academics or as a formative tool for students to support the development of academic writing skills.
Some universities still take a view that good students will inevitably succeed and a few will need
remedial support. Others realise that assessment literacy is a skill to be developed (by both students
and staff) and have their students actively involved in changing academic practice. There is also
variation in the extent to which assessment is used to develop employability skills by using assessment
types (such as group work and peer review) that reflect the world of work more closely that more
traditional methods such as essays and closed book exams.
7. MEASURING EMA MATURITY
In response to demand from UK universities we developed a self-assessment tool that EUNIS members
are welcome to use or adapt for their own purposes. We recognise five levels of EMA maturity:
Researching You are at an early stage of EMA. You do not seem to have a
comprehensive view of organisational activity overall; policy, process
and systems seem fragmented. Ensure you have senior management
support to undertake further investigation. Start by defining the
principles that underpin assessment and feedback in your organisation
and find the areas of good practice you can build on.
Exploring You are probably aware of pockets of good practice but have not really
begun to try to scale this up. You will need to be clear about expected
benefits in order to effect the cultural change needed.
Embedding You are at a tipping point where fairly widespread experimentation is
close to becoming mainstream practice. A key issue will be ensuring that
business processes are sufficiently consistent to support a more holistic
approach.
Enhancing You are probably already supporting the core of the assessment and
feedback life cycle with technology. You are looking to fill gaps and
find more elegant solutions to existing workarounds.
Pioneering You are looking to go beyond automation, standardisation and efficiency
gains to ensuring that EMA has a truly transformative impact on learning
and teaching in your organisation. Your organisation is probably a
provider of many of the resources in our accompanying guide but we can
still provide some inspiration and support.
EUNI 139
139
Completion of the self-assessment questions generates a report rating the respondent at one of the
five levels against each of the key indicator headings: strategy/policy and quality assurance;
curriculum data; processes and working practices; technology; culture; student experience. The
report gives a set of suggested actions intended to help build on strengths and address limitations. It
also provides links to resources that might help you carry out the suggested actions.
8. LESSONS LEARNED FROM SELF-ASSESSMENT PILOT
We piloted this approach at the end of 2015 with twelve universities (including three EUNIS members)
which provided valuable lessons.
Overall the participants reported that the outcomes matched their own understanding of their
strengths and weaknesses and that the suggested actions fitted with their experience of how to make
progress in each of these areas.
8.1 LEVEL OF GRANULARITY
During the pilot however it became clear that our focus on the whole institution was too broad.
Universities with very decentralised structures, and those at the early stages of EMA maturity, tend to
exhibit very different profiles in different parts of the institution. These institutions need their action
plan and supporting resources at a level of granularity individual to each of their component business
units.
We thus redesigned the self-assessment to work at different levels. Respondents are now asked to
define what happens in their 'organisation' in many of the questions. Organisation in this case refers to
the coherent entity on behalf of which they are responding so it may be a programme team, a
department or the whole institution. We also ask about consistency across your 'component areas' and
practices at 'local level'. At institutional level component areas/ local level will generally be schools
or faculties, at department level they may be programmes of study and at programme/ course level
they may be individual modules.
8.2 MOVING BETWEEN LEVELS
Our five level scale reflects the increasing use of EMA bringing further benefits for students and
institutions. Our pilot showed that it should however be viewed with a number of caveats.
The scale is not a simple linear one. The first two levels are quite similar in terms of the user
experience. You may correspond to the researcher level because your institutional practice is
disjointed and people do not have a clear idea what others are doing. However, the overall user
experience may not be significantly different to that of institutions at the explorer level.
Institutions have also reported that the amount of effort needed to move between levels is not
equally distributed. The most significant amount of effort is needed to get from the early stages to
the embedding and enhancing levels. Once there, further progress is proportionately easier to achieve.
Progress through the levels is associated with evidence of greater benefits but that is not to say that
every institution will necessarily be aiming to reach the highest level. In some cases institutions may
provide an excellent student assessment experience in spite of constraints on how much they can
invest in supporting information systems.
8.3 DATA VALIDITY
In many cases it may not be possible for an individual to answer all the questions. Indeed, we suggest
that the self-assessment should be done as a group exercise because the dialogue that ensues is the
first stage in the change process.
There will always be some concerns about the validity of data from a self-reporting exercise such as
this. Different people may have a different interpretation of some of the questions and responses and
it is only through dialogue that such differences can be explored and enhance the institutional
knowledge base. Most of those involved in the collaborative development of this tool found the
dialogue instigated by the self-assessment process to be the most valuable aspect of the activity. We
therefore suggest the tool is best suited to supporting continuous improvement rather than any kind of
benchmarking.
EUNI 140
140
Whether your approach to developing EMA capability is top-down or bottom-up and whether you are a
policy maker or a practitioner, you will probably find that you want to compare results from different
parts of your institution. This will help you target staff development, select areas to pilot new
approaches and identify good practice that can be built upon.
9. SUMMARY
Assessment lies at the heart of the learning experience and universities right across Europe are trying
to get to grips with moving traditional practice into the digital age. The drivers for this are both the
need for efficiency and the need to meet the expectations of students who have grown up in that era
and who need university to prepare them for a digital future.
Collaboration between members of the EUNIS e-Learning Task Force has shown that, even with a topic
as complex as this, we can find common ground and benefit from sharing experience. Find out more
from:
Jisc guide: Transforming assessment and feedback with technology
Jisc EMA blog: http://ema.jiscinvolve.org/wp/
10. REFERENCES
Ferrell, G & Sheppard, M (2013) Supporting assessment and feedback in practice with technology: a
view of the UK landscape. Paper presented at EUNIS 2013: Riga, 12-14 June 2013. Retrieved
February 29, 2016, from: https://eunis2013-journals.rtu.lv/article/view/eunis.2013.025
Ferrell, G. and Stewart, A (2014) Technology supported assessment and feedback: tackling the issues
of pedagogy, process & people. Paper presented at EUNIS 2014: Umea, 11-13 June 2014.
Ferrell, G. and Gray, L. (2015) 5/10 'Must try harder': applying technology to the management of assessment and feedback. Paper presented at EUNIS 2015: Dundee, 10-12 June 2015. EUNIS Journal of Higher Education 2015 Congress Issue. Retrieved February 29, 2016, from: http://www.eunis.org/erai/2015-3/
Melve, I. & Smilden, B. (2015) ICT Architecture for Digital Assessment: best practice document.
Retrieved February 29, 2016, from:
http://services.geant.net/cbp/Knowledge_Base/Campus_Networking/Documents/CBP-
44_ICTarchitecture-for-digital-assessment_published.pdf
Stubbs, M. (2014) Transforming the Student Experience: Manchester Metropolitan University’s EQAL Project. Retrieved February 29, 2016, from: http://www.eunis.org/wpcontent/uploads/2014/06/Stubbs-MMU-UK.pdf
AUTHORS’ BIOGRAPHIES
Gill has teaching and research experience and has held senior management
positions in a number of university administrative functions as well as directing a UK
support service enhancing the use of ICT in further and higher education. She acts as a
consultant to universities and national agencies in both the UK and Europe and has been an
invited speaker at many national and international events. Current interests include: data
and information management, technology enhanced learning, assessment and feedback
and learning space design. She was a EUNIS Board member from 2010-2015 and is currently
leader of the EUNIS eLearning Task Force.
http://uk.linkedin.com/in/gillferrell
Lisa is a Senior Co-Design Manager within the Student Experience team at Jisc,
providing leadership on the use of technology-enhanced learning and teaching in Higher and
Further Education. For 10 years she has led a range of innovation and change programmes
EUNI 141
141
on the themes of technology-enhanced assessment and curriculum transformation. Lisa has spoken
widely on the many ways that technology can enhance assessment and feedback and on the use of e-
portfolios to support learning, and has orchestrated a range of highly regarded activities in these
areas including the development of advice and guidance materials and a series of national workshops.
https://uk.linkedin.com/in/lisagray1

EUNI 142
142
E-learning advancements in the academic foreign language teaching
Anna Pacholak1, Monika Galbarczyk
2
1
University of Warsaw, Centre for Open and Multimedia Education, ul. S. Banacha 2c, 02-097 Warsaw, Poland,
University of Warsaw, Centre for Open and Multimedia Education, ul. S. Banacha 2c, 02-097 Warsaw, Poland,
Keywords e-learning, Higher Education, e-course, foreign languages, on-line teaching, life-long learning,
MOOC, SPOC.
1. ABSTRACT
Among the initiatives undertaken within the 2020 Bologna Process strategy for Higher Education, focusing on
the development of innovative life-long learning systems and the mobility, multilingualism and employability
empowering, an on-line foreign language teaching project was launched (in 2006) at the University of Warsaw.
It was implemented by the University Centre for Open and Multimedia Education and realized with the use of
an IT educational Moodle platform and the extensive application of e-learning EFL methodology. The paper
presents the ways in which the concept of online foreign language teaching has been expanding and growing
within the University for 10 years now. Progressively, multi-level and multi-purpose e-courses together with
on-line placement tests have been created and the number of the languages taught increased to 14, reaching
over 5 000 users in 2015 and more than 37 000 course participants since the very beginning of the project.
The paper also describes the major challenges and the future prospects of computerbased foreign language
teaching at the University.
2. Introduction and background
Developing an ICT-skilled and knowledge-based society is the priority of the European Union. However,
according to the EU 2015 Joint Report on education and training (ET 2020), 25% of adult EU citizens still
represent low levels of digital skills and only 10.7% take part in life-long learning process (EU ET2020, 2015).
The strategy which enhances the EU goals fulfillment is the 2020 Bologna Process strategy implemented by
the European Universities. The integral part of this policy is the development of life-long learning systems as
well as the empowering of the mobility, multilingualism and employability. Its main aims focus on the
improvement of the learning environment and removal of the study barriers by introducing, among others,
student-oriented programmes, enhancing innovation and exploiting the potential of digital technologies.
Hence, the implementation of the innovative and modern didactics is an important goal in the universities
development strategies, which is also the case of the University of Warsaw. One of the forms of reaching this
objective is the inclusion of the ICT into the didactic process. This expectation is met, among others, within
the ICT supported courses at the university. It lets students encounter various forms of learning and
introduces them to life-long learning process which in turn makes them more competitive on the labour
market and increases their employability.
Among the initiatives undertaken within this policy, an on-line foreign language teaching project was
launched (in 2006) at the University of Warsaw. It was based on the existing IT infrastructure - an educational
platform and an e-learning methodology worked out by the University Center for Open and Multimedia
Education.
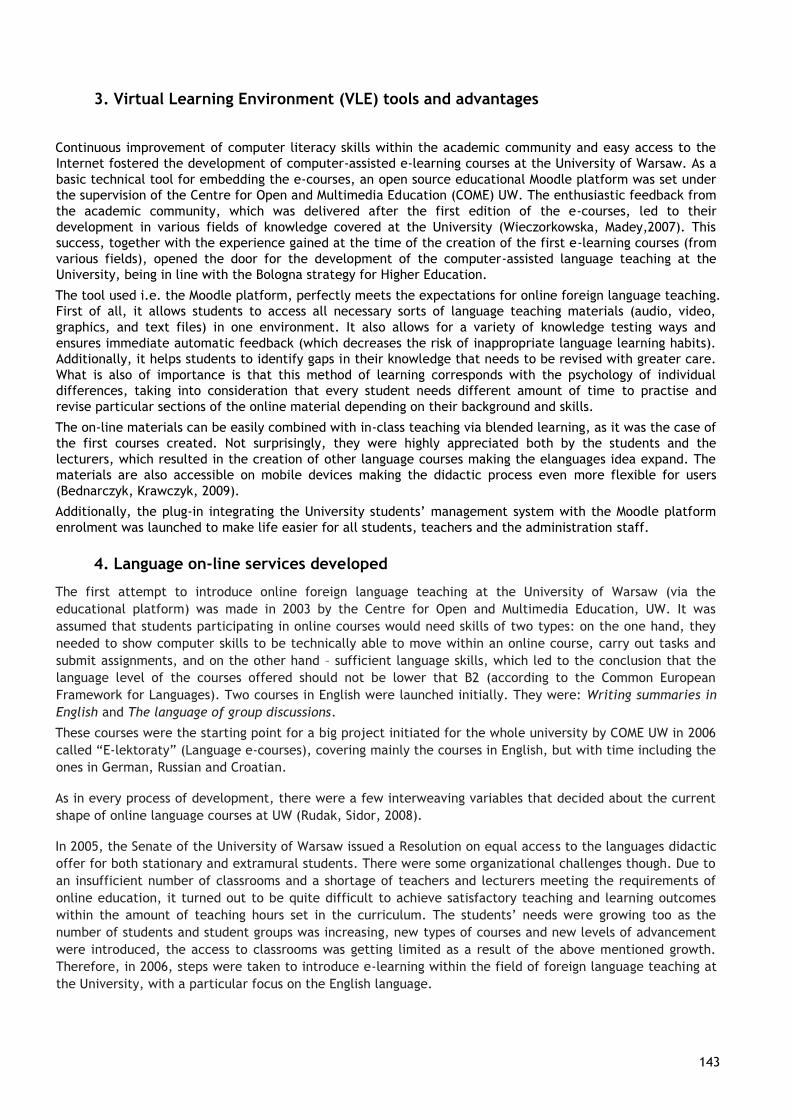
EUNI 143
143
3. Virtual Learning Environment (VLE) tools and advantages
Continuous improvement of computer literacy skills within the academic community and easy access to the
Internet fostered the development of computer-assisted e-learning courses at the University of Warsaw. As a
basic technical tool for embedding the e-courses, an open source educational Moodle platform was set under
the supervision of the Centre for Open and Multimedia Education (COME) UW. The enthusiastic feedback from
the academic community, which was delivered after the first edition of the e-courses, led to their
development in various fields of knowledge covered at the University (Wieczorkowska, Madey,2007). This
success, together with the experience gained at the time of the creation of the first e-learning courses (from
various fields), opened the door for the development of the computer-assisted language teaching at the
University, being in line with the Bologna strategy for Higher Education.
The tool used i.e. the Moodle platform, perfectly meets the expectations for online foreign language teaching.
First of all, it allows students to access all necessary sorts of language teaching materials (audio, video,
graphics, and text files) in one environment. It also allows for a variety of knowledge testing ways and
ensures immediate automatic feedback (which decreases the risk of inappropriate language learning habits).
Additionally, it helps students to identify gaps in their knowledge that needs to be revised with greater care.
What is also of importance is that this method of learning corresponds with the psychology of individual
differences, taking into consideration that every student needs different amount of time to practise and
revise particular sections of the online material depending on their background and skills.
The on-line materials can be easily combined with in-class teaching via blended learning, as it was the case of
the first courses created. Not surprisingly, they were highly appreciated both by the students and the
lecturers, which resulted in the creation of other language courses making the elanguages idea expand. The
materials are also accessible on mobile devices making the didactic process even more flexible for users
(Bednarczyk, Krawczyk, 2009).
Additionally, the plug-in integrating the University students’ management system with the Moodle platform
enrolment was launched to make life easier for all students, teachers and the administration staff.
4. Language on-line services developed
The first attempt to introduce online foreign language teaching at the University of Warsaw (via the
educational platform) was made in 2003 by the Centre for Open and Multimedia Education, UW. It was
assumed that students participating in online courses would need skills of two types: on the one hand, they
needed to show computer skills to be technically able to move within an online course, carry out tasks and
submit assignments, and on the other hand – sufficient language skills, which led to the conclusion that the
language level of the courses offered should not be lower that B2 (according to the Common European
Framework for Languages). Two courses in English were launched initially. They were: Writing summaries in
English and The language of group discussions.
These courses were the starting point for a big project initiated for the whole university by COME UW in 2006
called “E-lektoraty” (Language e-courses), covering mainly the courses in English, but with time including the
ones in German, Russian and Croatian.
As in every process of development, there were a few interweaving variables that decided about the current
shape of online language courses at UW (Rudak, Sidor, 2008).
In 2005, the Senate of the University of Warsaw issued a Resolution on equal access to the languages didactic
offer for both stationary and extramural students. There were some organizational challenges though. Due to
an insufficient number of classrooms and a shortage of teachers and lecturers meeting the requirements of
online education, it turned out to be quite difficult to achieve satisfactory teaching and learning outcomes
within the amount of teaching hours set in the curriculum. The students’ needs were growing too as the
number of students and student groups was increasing, new types of courses and new levels of advancement
were introduced, the access to classrooms was getting limited as a result of the above mentioned growth.
Therefore, in 2006, steps were taken to introduce e-learning within the field of foreign language teaching at
the University, with a particular focus on the English language.
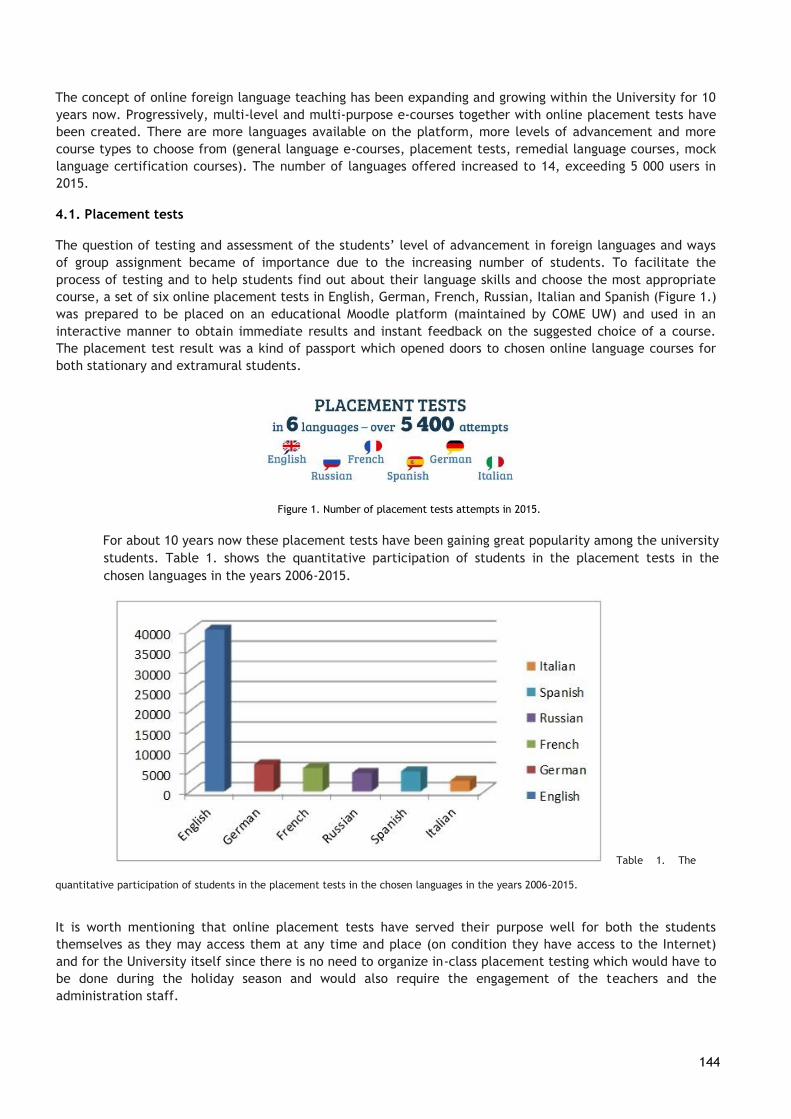
EUNI 144
144
The concept of online foreign language teaching has been expanding and growing within the University for 10
years now. Progressively, multi-level and multi-purpose e-courses together with online placement tests have
been created. There are more languages available on the platform, more levels of advancement and more
course types to choose from (general language e-courses, placement tests, remedial language courses, mock
language certification courses). The number of languages offered increased to 14, exceeding 5 000 users in
2015.
4.1. Placement tests
The question of testing and assessment of the students’ level of advancement in foreign languages and ways
of group assignment became of importance due to the increasing number of students. To facilitate the
process of testing and to help students find out about their language skills and choose the most appropriate
course, a set of six online placement tests in English, German, French, Russian, Italian and Spanish (Figure 1.)
was prepared to be placed on an educational Moodle platform (maintained by COME UW) and used in an
interactive manner to obtain immediate results and instant feedback on the suggested choice of a course.
The placement test result was a kind of passport which opened doors to chosen online language courses for
both stationary and extramural students.
Figure 1. Number of placement tests attempts in 2015.
For about 10 years now these placement tests have been gaining great popularity among the university
students. Table 1. shows the quantitative participation of students in the placement tests in the
chosen languages in the years 2006-2015.
Table 1. The
quantitative participation of students in the placement tests in the chosen languages in the years 2006-2015.
It is worth mentioning that online placement tests have served their purpose well for both the students
themselves as they may access them at any time and place (on condition they have access to the Internet)
and for the University itself since there is no need to organize in-class placement testing which would have to
be done during the holiday season and would also require the engagement of the teachers and the
administration staff.
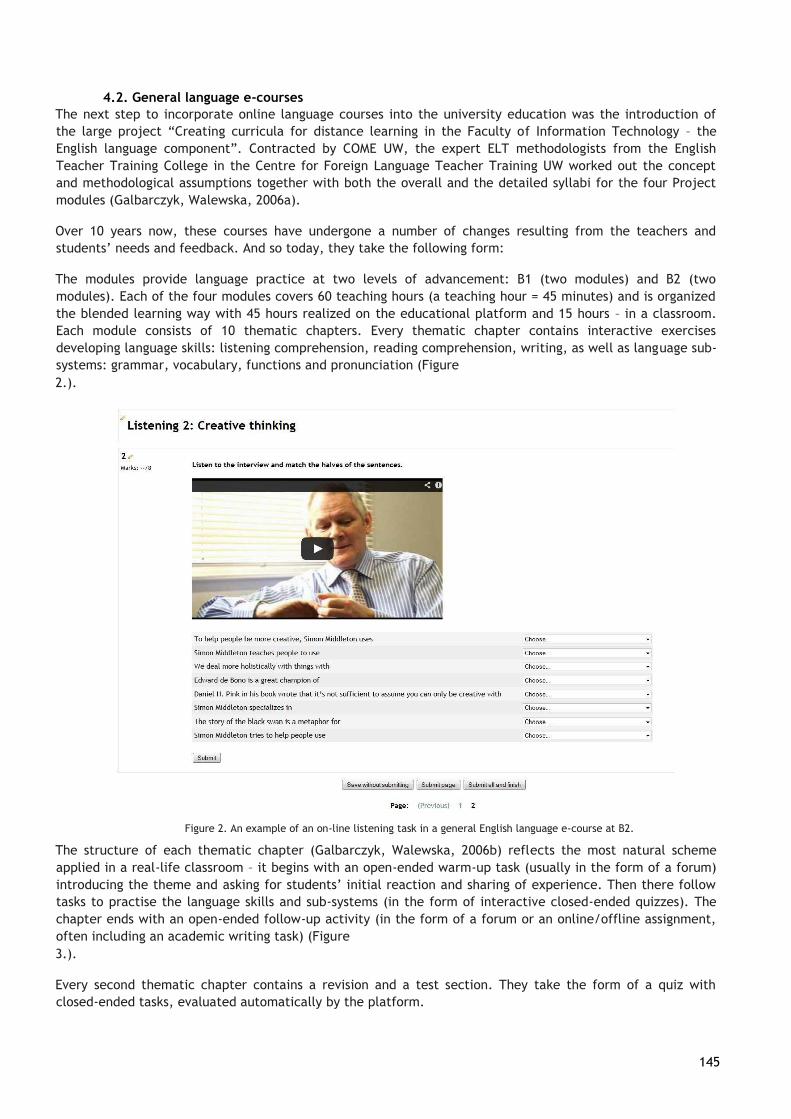
EUNI 145
145
4.2. General language e-courses
The next step to incorporate online language courses into the university education was the introduction of
the large project “Creating curricula for distance learning in the Faculty of Information Technology – the
English language component”. Contracted by COME UW, the expert ELT methodologists from the English
Teacher Training College in the Centre for Foreign Language Teacher Training UW worked out the concept
and methodological assumptions together with both the overall and the detailed syllabi for the four Project
modules (Galbarczyk, Walewska, 2006a).
Over 10 years now, these courses have undergone a number of changes resulting from the teachers and
students’ needs and feedback. And so today, they take the following form:
The modules provide language practice at two levels of advancement: B1 (two modules) and B2 (two
modules). Each of the four modules covers 60 teaching hours (a teaching hour = 45 minutes) and is organized
the blended learning way with 45 hours realized on the educational platform and 15 hours – in a classroom.
Each module consists of 10 thematic chapters. Every thematic chapter contains interactive exercises
developing language skills: listening comprehension, reading comprehension, writing, as well as language sub-
systems: grammar, vocabulary, functions and pronunciation (Figure
2.).
Figure 2. An example of an on-line listening task in a general English language e-course at B2.
The structure of each thematic chapter (Galbarczyk, Walewska, 2006b) reflects the most natural scheme
applied in a real-life classroom – it begins with an open-ended warm-up task (usually in the form of a forum)
introducing the theme and asking for students’ initial reaction and sharing of experience. Then there follow
tasks to practise the language skills and sub-systems (in the form of interactive closed-ended quizzes). The
chapter ends with an open-ended follow-up activity (in the form of a forum or an online/offline assignment,
often including an academic writing task) (Figure
3.).
Every second thematic chapter contains a revision and a test section. They take the form of a quiz with
closed-ended tasks, evaluated automatically by the platform.

EUNI 146
146
Figure 3. An example of an on-line module structure in a general English language e-course at B2.
The skill of speaking, quite difficult to be practised online due to asynchronous communication, is dealt with
during the in-class meetings. The e-teachers, as they become known under this name, are supported with
specially prepared stationary lesson scenarios, placed on the platform within a separate course for e-teachers
- a kind of repository of teaching materials. The scenarios contain sets of photocopiable exercises (for
individual work, pairwork and groupwork) which develop the ideas from particular thematic chapters and give
room for the spoken language practice in class. Obviously, e-teachers are entitled to add their own tasks to
the ones available on the platform (Figure 4.).
Figure 4. An example of an interactive assignment in a general English language e-course at B1.
The online English language courses received good working reviews during the pilot study (600 people took
part in it), from both the e-teachers and the students who were truly interested to continue their language
studies this way.
The online English language courses have served as a model for other courses. Namely, they gave a start to
the General English Course at C1, the so-called specialist courses above B2 level in Business English
Communication, Writing summaries in English and The language of meetings and conferences (though these
ones are run without in-class meetings), and online full semestre courses (60 teaching hours per semestre) in
other languages like Croatian, Czech, German and Russian. It is important to add that though learning takes
place mainly via the educational platform, the certification in every course is carried out in class. Today,
students of all faculties and types of studies may freely participate in a chosen online course (Figure 5.).
They also have a chance to express their opinion on the courses completing the online evaluation forms
placed within every course.
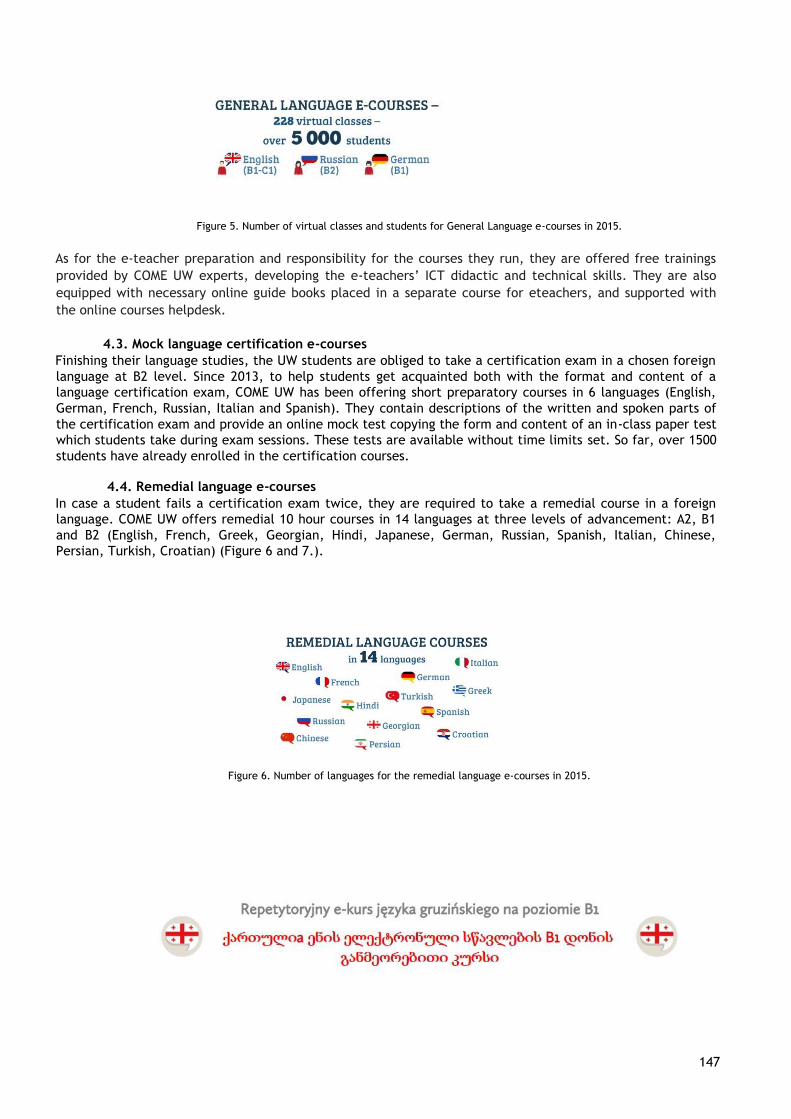
EUNI 147
147
Figure 5. Number of virtual classes and students for General Language e-courses in 2015.
As for the e-teacher preparation and responsibility for the courses they run, they are offered free trainings
provided by COME UW experts, developing the e-teachers’ ICT didactic and technical skills. They are also
equipped with necessary online guide books placed in a separate course for eteachers, and supported with
the online courses helpdesk.
4.3. Mock language certification e-courses
Finishing their language studies, the UW students are obliged to take a certification exam in a chosen foreign
language at B2 level. Since 2013, to help students get acquainted both with the format and content of a
language certification exam, COME UW has been offering short preparatory courses in 6 languages (English,
German, French, Russian, Italian and Spanish). They contain descriptions of the written and spoken parts of
the certification exam and provide an online mock test copying the form and content of an in-class paper test
which students take during exam sessions. These tests are available without time limits set. So far, over 1500
students have already enrolled in the certification courses.
4.4. Remedial language e-courses
In case a student fails a certification exam twice, they are required to take a remedial course in a foreign
language. COME UW offers remedial 10 hour courses in 14 languages at three levels of advancement: A2, B1
and B2 (English, French, Greek, Georgian, Hindi, Japanese, German, Russian, Spanish, Italian, Chinese,
Persian, Turkish, Croatian) (Figure 6 and 7.).
Figure 6. Number of languages for the remedial language e-courses in 2015.
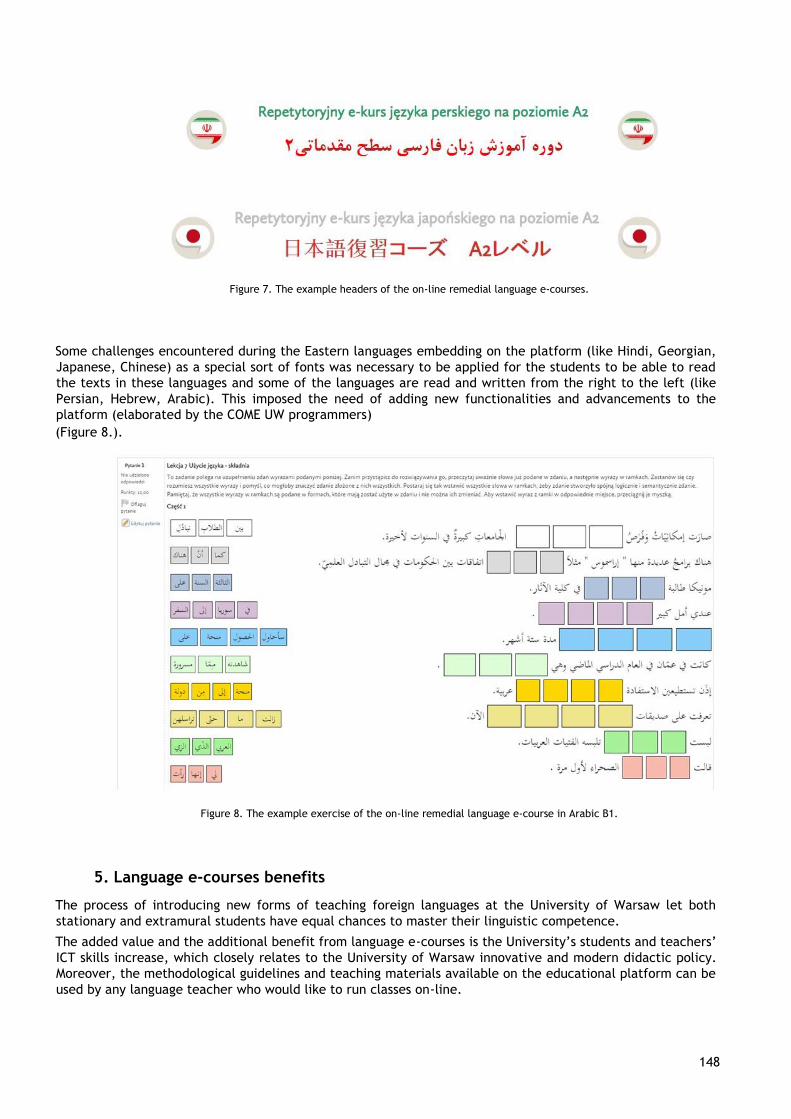
EUNI 148
148
Figure 7. The example headers of the on-line remedial language e-courses.
Some challenges encountered during the Eastern languages embedding on the platform (like Hindi, Georgian,
Japanese, Chinese) as a special sort of fonts was necessary to be applied for the students to be able to read
the texts in these languages and some of the languages are read and written from the right to the left (like
Persian, Hebrew, Arabic). This imposed the need of adding new functionalities and advancements to the
platform (elaborated by the COME UW programmers)
(Figure 8.).
Figure 8. The example exercise of the on-line remedial language e-course in Arabic B1.
5. Language e-courses benefits
The process of introducing new forms of teaching foreign languages at the University of Warsaw let both
stationary and extramural students have equal chances to master their linguistic competence.
The added value and the additional benefit from language e-courses is the University’s students and teachers’
ICT skills increase, which closely relates to the University of Warsaw innovative and modern didactic policy.
Moreover, the methodological guidelines and teaching materials available on the educational platform can be
used by any language teacher who would like to run classes on-line.
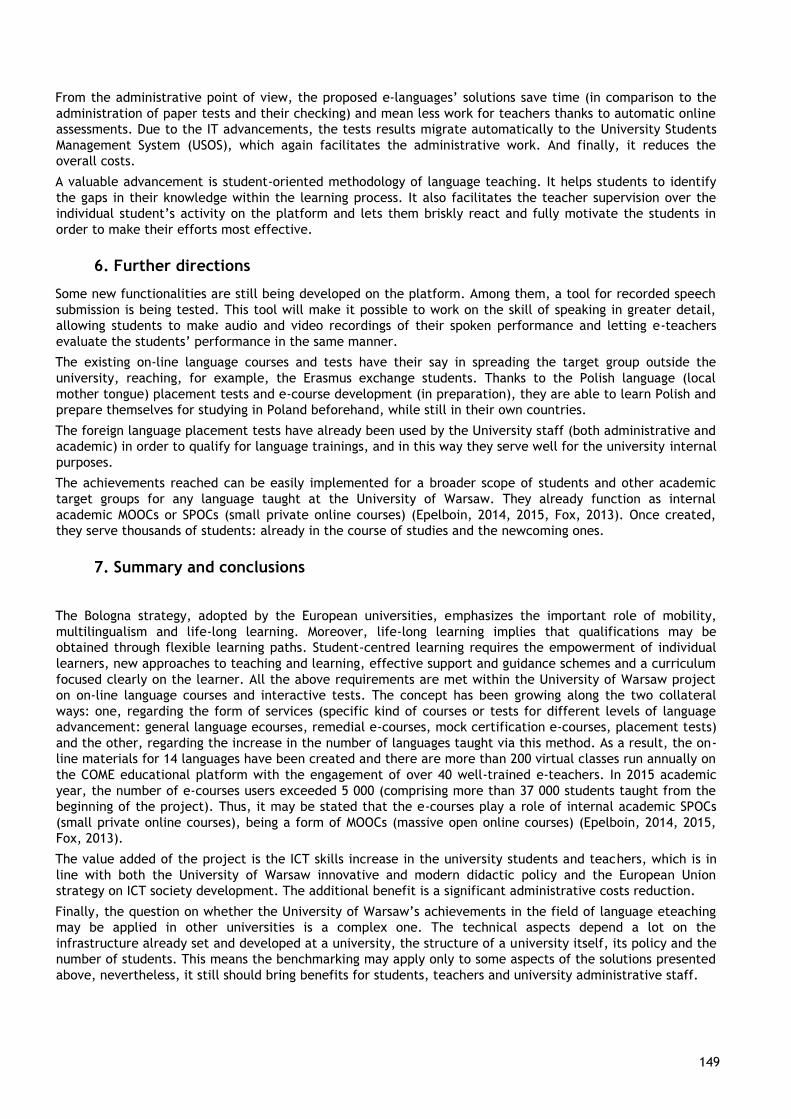
EUNI 149
149
From the administrative point of view, the proposed e-languages’ solutions save time (in comparison to the
administration of paper tests and their checking) and mean less work for teachers thanks to automatic online
assessments. Due to the IT advancements, the tests results migrate automatically to the University Students
Management System (USOS), which again facilitates the administrative work. And finally, it reduces the
overall costs.
A valuable advancement is student-oriented methodology of language teaching. It helps students to identify
the gaps in their knowledge within the learning process. It also facilitates the teacher supervision over the
individual student’s activity on the platform and lets them briskly react and fully motivate the students in
order to make their efforts most effective.
6. Further directions
Some new functionalities are still being developed on the platform. Among them, a tool for recorded speech
submission is being tested. This tool will make it possible to work on the skill of speaking in greater detail,
allowing students to make audio and video recordings of their spoken performance and letting e-teachers
evaluate the students’ performance in the same manner.
The existing on-line language courses and tests have their say in spreading the target group outside the
university, reaching, for example, the Erasmus exchange students. Thanks to the Polish language (local
mother tongue) placement tests and e-course development (in preparation), they are able to learn Polish and
prepare themselves for studying in Poland beforehand, while still in their own countries.
The foreign language placement tests have already been used by the University staff (both administrative and
academic) in order to qualify for language trainings, and in this way they serve well for the university internal
purposes.
The achievements reached can be easily implemented for a broader scope of students and other academic
target groups for any language taught at the University of Warsaw. They already function as internal
academic MOOCs or SPOCs (small private online courses) (Epelboin, 2014, 2015, Fox, 2013). Once created,
they serve thousands of students: already in the course of studies and the newcoming ones.
7. Summary and conclusions
The Bologna strategy, adopted by the European universities, emphasizes the important role of mobility,
multilingualism and life-long learning. Moreover, life-long learning implies that qualifications may be
obtained through flexible learning paths. Student-centred learning requires the empowerment of individual
learners, new approaches to teaching and learning, effective support and guidance schemes and a curriculum
focused clearly on the learner. All the above requirements are met within the University of Warsaw project
on on-line language courses and interactive tests. The concept has been growing along the two collateral
ways: one, regarding the form of services (specific kind of courses or tests for different levels of language
advancement: general language ecourses, remedial e-courses, mock certification e-courses, placement tests)
and the other, regarding the increase in the number of languages taught via this method. As a result, the on-
line materials for 14 languages have been created and there are more than 200 virtual classes run annually on
the COME educational platform with the engagement of over 40 well-trained e-teachers. In 2015 academic
year, the number of e-courses users exceeded 5 000 (comprising more than 37 000 students taught from the
beginning of the project). Thus, it may be stated that the e-courses play a role of internal academic SPOCs
(small private online courses), being a form of MOOCs (massive open online courses) (Epelboin, 2014, 2015,
Fox, 2013).
The value added of the project is the ICT skills increase in the university students and teachers, which is in
line with both the University of Warsaw innovative and modern didactic policy and the European Union
strategy on ICT society development. The additional benefit is a significant administrative costs reduction.
Finally, the question on whether the University of Warsaw’s achievements in the field of language eteaching
may be applied in other universities is a complex one. The technical aspects depend a lot on the
infrastructure already set and developed at a university, the structure of a university itself, its policy and the
number of students. This means the benchmarking may apply only to some aspects of the solutions presented
above, nevertheless, it still should bring benefits for students, teachers and university administrative staff.
EUNI 150
150
8. REFERENCES
1. 2015 Joint Report of the Council and the Commission on the implementation of the Strategic
framework for European cooperation in education and training ET2020., (2015). Retrieved Feb 28,
2016 from http://ec.europa.eu/education/documents/et-2020-draftjoint-report-408-2015_en.pdf
2. Bednarczyk, I., Jonatowska, J., (2008). E-angielski na UW w: E. Gajek, & D. GoltzWasiucionek (Red.),
Kształcenie komplementarne a dydaktyka języków obcych, Wydawnictwo Uczelniane WSG, Bydgoszcz,
pages 51-60
3. Bednarczyk, I., Krawczyk, T. (2009), E-nauczanie języków obcych na Uniwersytecie
Warszawskim, Zeszyty Naukowe Wydziału ETI Politechniki Gdańskiej, no. 7, pages 21-27.
Retrieved Jan, 28 2016 from
https://www.come.uw.edu.pl/sites/default/files/mainfiles/tresc/metodologia/ehttps://www.come.
uw.edu.pl/sites/default/files/mainfiles/tresc/metodologia/e-lektoraty.pdflektoraty.pdf
4. Epelboin Y. (2014), MOOC 2014: should universities enter the competition? EUNIS Journal of
Higher Education IT, Issue 2014-1. Retrieved Jan, 28 2016 from
http://www.eunis.org/erai/2014-1/
5. Epelboin Y. (2015), MOOCs and pedagogy: where are we heading?, EUNIS Journal of Higher Education
IT, Issue 2015-3. Retrieved Jan, 28 2016 from http://www.eunis.org/erai/2015-3/
6. Fox A., (2013), From MOOCs to SPOCs, Communications of the ACM, Vol. 56 No. 12, pages
38-40, doi 10.1145/2535918. Retrieved Jan, 28 2016 from
http://cacm.acm.org/magazines/2013/12/169931-from-moocs-to-spocs/abstract
7. Galbarczyk, M., Walewska, A. (2006a). Koncepcja i założenia metodyczne kursu języka angielskiego
dla studentów informatyki w ramach projektu „Opracowanie programów nauczania do kształcenia na
odległość na kierunku studiów wyższych INFORMATYKA".
Retrieved Jan, 28 2016 from
http://osilek.mimuw.edu.pl/images/a/a2/Koncepcja_kursu_po_recenzji.pdf
8. Galbarczyk, M., Walewska, A. (2006b). Program ramowy kursu języka angielskiego dla studentów
informatyki w ramach projektu „Opracowanie programów nauczania do kształcenia na odległość na
kierunku studiów wyższych INFORMATYKA" Retrieved Jan, 28 2016 from
http://wazniak.mimuw.edu.pl/images/5/5c/Program_ramowy_po_recenzji.pdf
9. Marciniak, Z., Chmielecka, E., Kraśniewski, A., Saryusz-Wolski, T., (2014), Report of the National
Qualifications Framework for Higher Education, Eduactional Research Institute, Warsaw.
10. Rudak, L., Sidor, D., (2008). Taksonomia e-kursów w: Praca zbiorowa (Red: Zespół Ośrodka
Kształcenia Na Odległość OKNO PW), Postępy e-edukacji, Oficyna Wydawnicza Politechniki
Warszawskiej, Warszawa, pages 211 – 219.
11. Wieczorkowska, G., Madey, J. (2007), Dekalog edukacji internetowej,in: P. Wiemann, & G.
Domańska- Żurek (Red.), VI konferencja Uniwersytet Wirtualny: model, narzędzia, praktyka,
Wydawnictwo PJWSTK, Warszawa, pages 10-17.
9. AUTHORS’ BIOGRAPHIES
Anna Pacholak, MSc, works in the Center for Open and Multimedia Education, University
of Warsaw. She has been engaged in various educational projects involving e-learning
such as Doctorates for Mazovia (e-course: Basics of knowledge commercialization),
Ministry of Regional Development e-courses on projects’ evaluation, Audiovisual and
Media Education Programme (PEAM), Warsaw School of Data Analysis. Her main scope of
interest is open access education, e-learning involvement in teaching and learning,
motivation aspects in learning process, new technologies for education. She is a
EUNI 151
151
member of the Editorial Board of the EduAction open access online journal and the EUNIS Journal of Higher
Eduaction IT.
Academic ELT methodology teacher and teacher trainer at the University of Warsaw
since 1994 (The University College of English Language Teacher Education; The Centre
for Foreign Language Teaching); author/co-author and editor of ELT coursebooks for
primary and secondary education in Poland. Currently works for the Centre for Open
and Multimedia Education, the University of Warsaw: in charge of online foreign
language courses; also deals with online course design, testing and evaluation. Interests:
effective communication in a foreign language, self-awareness and self-monitoring in
language learning, language differences as a source of development of communicative
competence; blended learning, new technologies in e-learning.
EUNI 152
152
Active teaching and learning: stimulating students’ engagement at Paris Descartes University
Xavier Coumoul1, Anne Laude2, Pierre Buffet3, Ludivine Alvarez4, Marion Harent5, Stéphanie Lehu6,
Thierry Koscielniak7
1234567
Paris Descartes University, Sorbonne Paris Cité University 45 rue des saints-pères, 75006 Paris, France 1 Professor of Biochemistry and Toxicology, Bio medical Sciences College [email protected] 2 Professor of Law, Dean of Law College [email protected] 3 Professor of Medecine, MD, Medecine College [email protected] 456
Instructional Designer, Digital Pedagogy Office [email protected] [email protected] [email protected] 7 Executive Director, Digital Pedagogy Office [email protected]
Keywords eLearning, game-based learning, social learning, gamification, BYOD
1. Summary
In this presentation we will examine six concrete examples that will demonstrate how student’s engagement
can be stimulated by different kinds of online activities at Paris Descartes University. We will demonstrate
innovative ways to use Moodle forum before, during and after a lecture. You will hear feedbacks from
teachers and students on several interactive, game-based or social learning activities.
2. Outcomes
• Learn how to perform easy to use interactive online activities before, during and after lectures
• Explore how online activities enhance learning experiences
• Exchange on feedbacks from students and teachers
3. Extended Abstract
Six examples of innovative teaching and learning activities will be demonstrate. Most of the values comes
from mixed experiences online and during lectures.
1- Interactive BYOD sessions with LMS Moodle during lectures .This activity has been described at EUNIS 2014
conference. Results and further developments will be described.
EUNIS-2016-koscielniak.doc
EUNI 153
153
2- Students are co-writing an article on Law during Master courses. They use a pad application which permits
synchronous writing under the supervision of the professor. The resulting article is copied on Wikipedia at the
end of the group work.
3- After a series of Medecine lectures, final Q&A sessions are organized using an online forum. More than 1500
students could prepare questions three days before the session. Answers are given in the theater. Ranking of
questions is possible via a « like » feature.
4- « Chemist jeopardy » and « Cell signalisation Grand Slam » are activities based on the same model of online
quizzes with rewards.
5- « Campus life »: students may ask online a question after each lecture. The most liked get a reward badge
and is answered during the next lecture.
6- « Game of Throbes » A trivial pursuit like game which is performed live with students groups. A lot of fun and
emulation on a very serious subject: infectious diseases.
4. REFERENCES
Emery, S. (2012). Factors for Consideration when Developing a Bring Your Own Device (BYOD)
Strategy in Higher Education. Retrieved February 14, 2016, from:
https://scholarsbank.uoregon.edu/xmlui/bitstream/handle/1794/12254/Emery2012.pdf?sequence=1 Fang, B.
(2009). From Distraction to Engagement: Wireless Devices in the Classroom. Retrieved February 14, 2016.
From: EDUCAUSEreview http://www.educause.edu/ero/article/distractionengagement-wireless-devices-
classroom.
Badeau-Mahmoud et al. (2014) Interactive lectures with Moodle and students’ devices: BYOD at Paris
Descartes. Retrieved February 14, 2016. From : EUNIS international congress 2014.
http://www.eunis.org/download/2014/papers/eunis2014_submission_19.pdf
5. AUTHORS’ BIOGRAPHIES
Thierry Koscielniak is Executive Director of the Digital Pedagogy Office of Paris Descartes
University, France.
www.parisdescartes.fr
He is a member of the EIRA (EUNIS Research and Analysis Initiative) editorial committee
and EUNIS E-learning task force.
He is member of the French association of Digital Education Departments in Higher
Education (www.anstia.fr).
As a member of the IT Strategic Steering Board of his university, he plays a role
in strategic planning and policy development for information system, infrastructure and
programs.
His department is in charge of the LMS Moodle, of the e-portfolio management system
Mahara and of the university social network based on Elgg:
http://carnets.parisdescartes.fr
Thierry completed his Ph.D. in Computational Chemistry at Pierre et Marie Curie
University.
https://www.linkedin.com/in/tkoscielniak twitter :
@tkoscielniak
EUNIS-2016-koscielniak.doc
EUNI 154
154
The social university: delivering business benefit through online networking
Dr Gill Ferrell1, Anna Mathews
2
1Aspire Ltd, Le Chay 47360, St Sardos, France, [email protected]
2UCISA, University of Oxford, 13 Banbury Road Oxford OX2 6NN, UK, [email protected]
Keywords
Academic freedom, benefits realisation, cyber bullying, cyber crime, esafety, governance, legal compliance,
policy, service delivery, service design, social media, social networking, strategy.
1. ABSTRACT
This paper encourages senior management teams to adopt a strategic approach to university use of social
media.
Social media tools have a user base of millions and are increasingly used by universities but often in an ad hoc
fashion. There are examples of good use of social media for business activities including student recruitment,
induction, learning and teaching, research, delivering IT customer service, alumni relations and other areas.
However, universities have not yet been able to embed pockets of good practice into more strategic
approaches that meet particular needs. Many have been swept along by a global trend without being clear
what they want to achieve using social media. There are more HE courses on developing a social media
strategy than there are university social media strategies!
The time is right to be more visionary in approach and more tactical in the use of particular tools. Senior
management teams need understanding of the opportunities and risks to provide leadership and ensure this
type of engagement delivers the desired benefits.
A strategic approach doesn't mean your university's social presence will become bland and corporate but
rather that you can use new tools to enhance the core activities of a scholarly community.
2. INTRODUCTION
This paper outlines the need for senior management teams to adopt a strategic approach to the use of social
media by their universities.
Social media is a general term for a range of internet-based applications that allow people to create, co-
create, share and interact with information. The scale of use of these tools is phenomenal with the most
popular applications having many millions of active users worldwide. Use of such tools within universities is
already common and is increasing. However, awareness of the benefits and risks associated with use of such
tools is generally lowest amongst senior staff who have responsibility for corporate governance.
The paper draws on guidance in a Toolkit published by UCISA in 2015 for UK universities (UCISA 2015). The
Toolkit recognises that good use of social media requires effective collaboration across many different
functional areas of the institution including: senior management; marketing; IT; learning and teaching; legal
and student support and, hence, the full Toolkit contains specific guidance for different types of user. Here
we look specifically at the key messages for senior management teams.
The paper is specifically concerned with the higher education context and how this differs from the use of
such tools in other types of organisations. It looks at social media from a perspective of corporate governance
in higher education thus it is not a guide to the use of specific tools and nor is it limited to the use of such
tools for learning and teaching purposes.

EUNI 155
155
3. MAKING THE MOST OF THE OPPORTUNITIES
There is strong evidence that the effective use of social media is delivering considerable benefits across all
aspects of university activities. To take but a few examples:
• Students are making contact with their peers through university networks before arriving on campus,
and in some cases even prior to application, aiding recruitment and retention.
• Researchers are engaging in action research and communicating about their research using such tools.
• Students are using the tools to develop and demonstrate their competence in skills required for the
world of work.
• Universities are using the tools to reach, interact, and work collaboratively with a range of audiences
and using such public engagement to show the value of their activities in relation to the wider
economy and society.
• Social tools are changing the nature of internal communications between university services and their
customers.
• Social media tools are being used effectively to enhance learning and teaching practice such as
examples of their use to support peer review, peer support, collaborative working and enhancing
learning in large group settings.
• Social networks offer another channel to engage with university alumni.
There are short case studies on all of these types of benefits in our Toolkit.
The cultural trend implied by use of such tools is a significantly different and more social relationship
between higher education providers and their stakeholders. The university is more of a knowledge hub than
an ivory tower. Communications are likely to be more rapid and less formal. In using social media as part of
your official channels of communication you will need to ensure you can both manage and meet user
expectations.
With current tools it is very easy to innovate and experiment, but it is worth investing a little time in
understanding the spirit of each tool’s user community. Much authentic engagement will evolve quite
naturally and organically, and you may indeed take the community in new directions, but managing a
corporate presence does require a certain degree of planned effort and dedicated staff time. Such
communications can be very cost effective but they do need to be resourced. You cannot expect staff to
engage in social media communications on top of everything else they already do.
4. PRACTICAL APPROACHES
4.1 Defining a strategy
We suggest the use of social media is a strategic issue that requires senior level commitment but do you
actually need a social media strategy?
The answer is that you probably don't need a separate strategy so long as you are thinking strategically and
know how the use of social media fits with your institutional mission. Ensure the senior management team
discusses the role that social media could play in underpinning your institutional values and supporting your
particular mission. Also ensure that your use of these tools is aligned with other important institutional
planning documents. For example have your overarching information and communications strategies been
updated to take account of these new forms of communication?
However, if your institution is taking its first steps with social media, then you might find it useful to a
separate (possibly short-term) strategy and action plan to make the most of the opportunities and clarify how
you will measure that benefits realisation is actually taking place.
4.2 Defining a policy
In order to meet your responsibilities with regard to corporate governance you will need some form of policy
on the use of social media by your staff and students.
Many universities have social media policies and they vary considerably in their approach – possibly because
different universities have given different departments responsibility for this area. Such policies may be
'owned' by departments of marketing, communications and external relations; human resources; or
EUNI 156
156
information services. You need to think about who has the expertise to devise such a policy and also the role
of policy as an enabler versus a means to deal with misconduct.
Smithers (2012) discusses the issues associated with university social media policies being developed by
people with backgrounds in other industries, who have been brought in for this purpose, and who do not really
understand how scholarly communities operate. He suggests this results in policies that are developed without
enough vision for what could be achieved and which are taking protectionist and damage-limitation
approaches, restricting the opportunities to innovate and collaborate.
Universities employ a wide-ranging body of staff many of whom have legitimate reasons to use social media in
support of their professional practice. In other cases, however, staff may spend an excessive amount of work
time on social media activity that is not work-related or exhibit behaviours that would seem incompatible
with the pastoral care of students. Too much emphasis on penalising misconduct can result in a policy that is
negative in tone and discourages staff from making the most of opportunities.
A practical approach is to indicate the level of social media activity you might expect a particular job role to
entail – a spectrum might range from neutral (not expected to participate on behalf of the business) through
to encouraged (not a requirement but can be beneficial and guidance available) to expected (a normal part of
the role).
The message here is the need to ensure that policies act as enablers to delivering the benefits of social media
as well as effectively managing the risks. It may be a good idea to frame your policy to be as much about
institutional values as about rules. It is also beneficial to involve a range of stakeholders in drawing
up/reviewing the policy in order to gain buy-in and help determine what is reasonable in different contexts
(bearing in mind that different departments may have different cultures within a single university).
Our Toolkit contains a lot of good practice guidance on this topic.
4.3 Choosing the right tools
The choice of which tools to use is a significant one. There are many tools available and fashions change
rapidly. Particular tools often appeal to a certain demographic so in order to interact effectively you need to
understand how the social media channels you adopt are perceived by your target audience(s). You also need
to consider what type of interactions your students will feel it appropriate to have with a learning provider
via social channels. The higher education student and staff population is a very diverse community and it
would be overly simplistic to stereotype attitudes to social media.
Universities also need to consider the international dimension of their activities. Social networks and other
tools that are popular in Europe may be little used, or even banned, in some key target overseas markets such
as China and other parts of Asia.
Currently there is a lot of thought being given to reputation management on social media but less evidence of
effort being put into looking at how information flows via social networks support all aspects of the student
lifecycle. The ad hoc addition of tools in an organic fashion can lead to confusion on the part of staff and
students about which tools to use for which purposes. The difficulty at an institutional level is therefore
getting the right balance between tools that are readily available to you (and possibly already familiar to your
staff) and tools that your students prefer to use, bearing in mind that you may have a diverse student
population and a set of younger users whose habits and preferences change quite frequently.
A few practical suggestions:
• View social media as part of service delivery – think about your stakeholders and their needs and preferences. A service design approach and the use of individual user stories or personas can help (see Baranova et al 2010).
• Look at the fit with IT infrastructure – consider the possible tools in relation to their compatibility
with your other infrastructure.
• Solve real world problems – for example, consider whether social media tools might address issues due
to students not reading email?
• Be inclusive – ensure that the tools you use are accessible to the widest possible range of potential
users.
EUNI 157
157
• Look at total cost of ownership – consider the total cost of the various options available, bearing in mind that tools free at the point of use may require chargeable customisation and that some tools may have cost implications in terms of the guidance and/or training needed.
4.4 Staying legal
At first sight the range of legal issues that need to be considered when using social media is quite daunting. In
practice however there is nothing significantly new about any of this. The relevant legislation has been in
place for some time and universities already have well established procedures for ensuring compliance in
other areas of their activity. The basic need is to undertake a review of your policies and guidance. Ensure
that they take account of the use of social media and include relevant examples to help clarify the issues for
staff and students. Simply having policies and guidelines is not enough, however – in order for them to be
effective you must communicate them well to all of your users.
Our Toolkit takes you through a few examples where less familiar issues may arise including:
Copyright and intellectual property rights (IPR) Universities are generally very well aware of their
responsibilities in these areas but issues can arise due to the ease of capturing and sharing information on
social media. Copyright and IPR do exist in the virtual world and the laws are basically the same but they are
easier to infringe and to detect! In some cases, the issues can be quite complex e.g. a single piece of
multimedia content may actually consist of a number of different layers with different ownership and there
may be multiple contributors to content on blogs and wikis. It can often be quite difficult to determine who
owns content and in which country’s jurisdiction the content was generated. There is also a lack of clarity of
what may be permitted under exceptions to copyright because of a lack of suitable case law e.g. in the field
of data and text mining.
Our advice is to apply common sense and existing good practice. When using content produced by staff you
need to think about whether or not the content was produced as part of their duties of employment, and
when using content produced as part of an inter-institutional project you need to think about having a
consortium agreement that defines how that content can be used. You may also wish to use the student-
generated content on social media, either as learning resources or to showcase other aspects of the student
experience, and you should ensure that you have the appropriate consent to do so. Note also that whilst
reproduction by a student as part of their learning may fall within a copyright exemption, reproduction of the
same material by the institution as part of their marketing may not.
Data protection and privacy Particular care needs to be taken with regard to the sharing of images and
video clips where individuals are recognisable, as this may infringe on an individual’s right to privacy (as
defined by Article 8 of the European Convention on Human Rights) as well as data protection legislation.
Personal data must be fairly and lawfully processed and learners should be informed about all uses of their
personal data and consent to that use. Institutions should also be aware that individuals captured on audio or
video undertaking activities such as singing, dancing, acting, miming, reading aloud or even simply giving a
lecture may be covered by performers’ rights and their explicit consent will be required to publish the video
clip or podcast. The Web2Rights project established that even avatars recorded in virtual worlds can acquire
performers’ rights.
Most European countries have stringent data protection laws. The UK Data Protection Act makes special
provision in relation to sensitive personal data: this comprises data about a person’s religious beliefs as well
as personal data relating to racial or ethnic origin, political opinions, membership of trade union organisations,
physical or mental health, sexual life and offences or alleged offences. Whenever processing sensitive
personal data, explicit consent is required and additional safeguards should be in place. Social networks that
support student societies may therefore process sensitive personal data. The ease of combining data from
different sources may also mean that personal data or sensitive personal data, whilst anonymous in its original
source, can be aggregated with other data such that individuals are identifiable.
International law Many social media tools are available worldwide and support for international recruitment
and international research is indeed part of their appeal for universities. This does however mean that if
content infringes a law in another country then those making the content available could be sued in that
other country. As an example, copyright materials that could be made available under the US fair use
provisions may fall foul of UK copyright law where the boundaries are more narrowly drawn. As an example it
is possible for a wiki to be built up by a number of contributors across the world: each may have diligently
followed local laws but some may have ended up doing things that would have been illegal in UK law.
It is illegal to import something from another country which would be infringing copyright had the act in
question been carried out in your country. Thus a wiki host could be liable for illegal content that was
EUNI 158
158
incorporated in good faith by a third party in another country. Defamation laws may also vary from country to
country. Whilst the risks are real, actual examples of cross-border cases going to court are extremely rare
(one of the most notable examples was the French state blocking the sale of Nazi memorabilia via Yahoo).
Research ethics Another area that is specific to our particular environment is the opportunities offered by
social media to help in carrying out research. Universities should provide guidance on the use of social media
in research and ensure that ethics policies are updated to cover research conducted using social media.
Our Toolkit offers common sense guidance on all of these issues and other areas such as the posting of
inappropriate content by students or staff.
4.5 Academic freedom
Given the nature and values of the higher education environment, it is unsurprising that matters relating to
academic freedom and freedom of speech are particularly prevalent and contentious in relation to the use of
social media. From the university perspective the issues relate to the extent to which the institution might be
held legally responsible for the actions of its staff and students in the 'virtual world' and the extent to which
such actions reflect on the image of the institution.
Situations where online behaviours go beyond the bounds of normal acceptability to the extent they are
illegal and/or constitute harassment of others should be covered by statute and policy. There are however
many more grey areas, where the right to express certain opinions using certain social media channels is more
contentious.
Academic blogging, and other forms of commentary via social media, is one of the more contentious areas.
Debates about academic freedom are nothing new, but potentially controversial opinions that were previously
restricted to a limited journal readership now have a much wider audience and frequently receive
considerable media attention, as do comments made by academics about universities.
It is a moot point to what extent institutions would wish to control the use of social media by staff and
students. Attempts to do so may simply drive criticism underground to other channels or behind the screen of
anonymity. There is a need to clarify where professional ends and private begins, and to be clear about what
constitutes inappropriate behaviour. It is equally clear that promoting and supporting examples of good
practice is as important as defining what will not be tolerated.
Our Toolkit looks at the issues in more detail and provides guidance including:
• Define your context – relate your approach to social media to your existing position in an institution
that has a legal responsibility to promote freedom of speech and academic freedom.
• Be value-driven – emphasise your institutional values in guidance for staff and students.
• Keep it simple – if you choose to have a policy, do not make it complicated — a simple policy of
advising people not to say or do anything online that they would not do offline can suffice as guidance,
as for example in these quotes from UCISA (2014) Model Regulations:
“Real world standards of behaviour apply online and on social networking platforms, such as Facebook,
Blogger and Twitter.”
“You must not cause needless offence, concern or annoyance to others.”
“The way you behave when using IT should be no different to how you would behave under other
circumstances. Abusive, inconsiderate or discriminatory behaviour is unacceptable.”
4.6 DEALING WITH PROBLEMS
Despite the enormous benefits of social media in many aspects of everyday life, the tools, like so many others,
have the potential to be misused. The BBC in June 2014 reported that 50% of calls passed on to front-line
police now involve crimes originating from misuse of social media. Other forms of cybercrime are also on the
increase (and are indeed opening up as a whole new subject area in many universities). Universities need to
understand the issues and be proactive about preventing them.
Behaviours that may constitute bullying or harassment can take a variety of forms. Various terms have been
coined to describe behaviours that specifically relate to the use of social media: creeping, stalking, trolling
and ratting are all discussed in our Toolkit. Online bullying and harassment is often carried out by the same
types of perpetrators and for the same reasons as in the physical world. In the digital world however the
EUNI 159
159
choice of victim may be more random and people can be subject to this type of persistent behaviour from
complete strangers.
Awareness of bullying and harassment is probably strongest in terms of its association with young people but
anybody can be affected. Social media use is increasing the extent to which teachers and tutors are subject
to abuse. Criticism on sites such as Ratemyprofessors.com and The Student Room can often overstep the
bounds of acceptability. There are a number of celebrity academic cases but this issue is something that many
academics on social media may encounter.
Universities have a duty of care so as an institution you need to think very carefully about how best to protect
your staff and students from cyber bullying without inadvertently accepting liability for matters beyond your
control.
In 2013 UCISA was involved in helping UK universities deal with the appearance of a series of social media
sites with names such as Spotted:<institution>. In this case users were asked to post descriptions and/or
images of people spotted in institutional libraries causing some students to state that they no longer felt safe
in the library. UCISA issued guidance to members about using existing procedures to require hosts to effect a
takedown of such pages, focusing particularly on the visibility of university insignia and the lack of subject
consent.
Simple steps to help your university discharge its duty of care include:
• Define limits – have a clear policy and guidance on what constitutes acceptable and unacceptable
behaviour: this can take the form of a specific social media policy or may be handled by the IT
acceptable use policy and other documents such as the student charter and staff conditions of
employment.
• Be consistent – have a clear and consistent approach to dealing with inappropriate posts on university
official social media channels.
• Offer guidance – support staff and students in the effective use of social media using the suggestions
outlined in our Toolkit.
• Help keep your users safe – alert staff and students to the dangers of misuse of social media and point
them to sources of advice and help (you can find many sources referenced in our Toolkit).
• Act quickly and only when you need to – be wary of overreacting to ill-considered remarks but be
prepared to alert the relevant authorities if an individual appears to be facing real risk.
Our Toolkit offers further guidance on these topics and preventing other forms of cyber crime perpetrated via
social media.
5. SUMMARY
A few of the main pointers for corporate users are highlighted here. You will find further information and
good practice guidance spread throughout each section of our online Toolkit:
• Know why you are doing this – be clear about what benefits you want to achieve.
• Be consistent – have an appropriate combination of strategy/policy/guidelines to communicate your
approach to all users. This does not need to be complicated — focus on how your use of social media
supports your core principles and values rather than on defining a detailed set of rules about what can
and cannot be done.
• Understand your users – think about using approaches such as service design to better understand
how social media can improve the experience of interacting with your institution. This will help you
choose the right tools and design effective processes to support their use.
• Be visible and accessible – make sure your users can find you by clearly signposting links to your
social media presence on the home page of your website. Make sure the tools you choose are
accessible to the widest possible range of users.
• Create a strong digital identity – you will have corporate branding and communication guidelines but
finding your corporate voice in social media channels can be more of a challenge. Your style should
maintain professional standards although it is likely to be less formal than other types of
communication. Where you have a group of staff contributing to corporate communications do not be
afraid to let them have individual identities.
EUNI 160
160
• Be current and relevant – by setting up a social media presence you are committing to keeping it up-
to-date and relevant to the target audience. You may want to consider splitting a channel into
different identities for different audiences if topics are becoming mixed or, conversely, amalgamating
groups that are similar and have limited activity. You also need to ensure that dormant accounts are
closed down.
• Ensure adequate resourcing – ensure that official channels of communication have an active
presence at all reasonable times. What is likely to meet user expectations may vary depending on the
purpose for which a particular communication channel is set up. One or two people doing this in their
spare time is not likely to generate effective engagement. A certain amount of dedicated resource
may be needed in a number of key areas of the institution.
• Engage your users – keep your social media channels social and do not use them simply to broadcast
information. As part of offering meaningful engagement you will need to decide how best to
encourage discussion and the exchange of ideas whilst finding appropriate ways to respond to
criticism and views you do not agree with. As an institution you need to find your own voice and
create your own image as a place of stimulating and thoughtful debate.
• Protect your users – a duty of care to both staff and students demands pro-activity about esafety and
about sources of advice in cases of cyber bullying or harassment whether or not this takes place
through official institutional channels.
• Protect your institution –ensure that your institution operates within the law and follow our guidance
to mitigate the risk of legal liability or reputational risk should any of your users break the law.
• Keep an eye on trends – social media is here to stay but is a fast-moving environment so you need to
keep an eye on what your users are doing (and saying) and also look out for new developments that
might offer opportunities for you to innovate and differentiate.
• Measure success – think about what meaningful success measures look like for your institution and
measure the things that matter.
By following our simple, common-sense guidelines you can ensure that your university is free to innovate in
this new digital environment and use social tools to deliver benefit in many aspects of activity.
6. REFERENCES
Baranova, P., Morrison, S. and Mutton, J. (2010) Service design in higher and further education: a briefing paper. Retrieved February 11, 2016, from: http://wiki.cetis.ac.uk/images/8/82/Service_Design.pdf
Smithers, M. (2012) Universities and social media: Academics need to be bold in our use of social media and
not outsource digital dissemination to widget gurus. LSE Impact Blog. Retrieved February 11, 2016, from:
http://blogs.lse.ac.uk/impactofsocialsciences/2012/10/03/smithers-universitiessocial-media/
UCISA (2014) Model regulations for the use of institutional IT facilities and systems. Retrieved February 11,
2016, from: www.ucisa.ac.uk/modelregs
UCISA (2015) Social Media Toolkit: a practical guide to achieving benefits and managing risks.
Retrieved February 11, 2016, from: www.ucisa.ac.uk/socialmedia
7. AUTHORS’ BIOGRAPHIES
Gill has teaching and research experience and has held senior management positions in
a number of university administrative functions as well as directing a UK support
service enhancing the use of ICT in further and higher education. She acts as
a consultant to universities and national agencies in both the UK and Europe and has
been an invited speaker at many national and international events. Current interests
include: data and information management, technology enhanced learning,
assessment and feedback and learning space design.
http://uk.linkedin.com/in/gillferrell

EUNI 161
161
Anna is Head of Policy and Projects at UCISA. She drafts UCISA’s consultation responses
and represents the Association at meetings and events. She works in collaboration with
UCISA’s special interest groups and leads the annual statistics survey. She has previously
been a programme manager at the University of Oxford and has worked in support of
medical research. www.ucisa.ac.uk/contact
UCISA publications, case studies and event materials (presentations, streamed content
and other post–event resources) are freely available to colleagues across the UK and
internationally at www.ucisa.ac.uk

EUNI 162
162
Creating an IT plan is more than words on a page
Karoline Westerlund1
1Umeå universitet, SE-901 87 Umeå, Sweden, [email protected]
Keywords
IT plan, IT governance, Security, Risk analyses, Shadow IT
1. Summary
This paper presents an approach making awareness of security issues further out in the organization by creating an IT plan for one department at our university. The IT plan provides a structure to help organize and define roles and responsibilities, an enabler. The IT plan should be communicated, understood and accepted.
2. ABSTRACT
I was contacted by the Head of Administration at one of our departments asking what authority their IT
support group had when it came to IT resources and security issues.
I thought it would be interesting to share their experiences and work together with them. I invited myself to
the group and we started a one year long journey meeting once a month which resulted in an IT plan as Dean
signed up. For me it was interesting to see what issues they were facing and what local solutions they had
developed instead of using our central IT services. Trust was important and I decided not to lecture them.
Instead I asked questions about their choices of solutions, hopefully making them rethinking.
The objective was to provide a structured methodology to help the IT group developing and implementing an IT plan for governance and planning of IT resources at their department. The outcome was to define decision rights and liability frameworks for desired behavior regarding IT usage. The department needed to understand and commit to the plan and for that we needed full commitment from the department’s leadership.
The IT group supported 170 employees and 2000 students. Together, they used a variety of IT services and managed a large amount of information. They had a mixture of centrally provided services and local solutions developed and managed by the IT group.
The IT plan had to align with the university’s governance policies and regulations and supplement with local rules that were unique to their needs. I wanted to point out the most important areas to cover, keep it short so people actually took part of it and put some more detailed documents in an appendix, see figure 1.
Every meeting covered one of the areas. I put up the frame and questions and the first thing we did was to
identify the key responsibility roles and assign people to the roles. We used the RACI matrix, responsibility
assignment matrix, to visualize. We determined the key points of the responsibilities and mandates they had.
We identified the support they gave to the most commonly IT services used on a daily basis and what areas
they covered. Standard specifications were set for workplaces for different roles. The most important security
issues related to behavior were highlighted. Here we are talking about information security, backup, password,
phishing mail and virus.
EUNI 163
163
It is important to have control over higher permissions to the applications. We set up a matrix of applications,
persons connected and what kind of permission.
Software and licenses is a complicated area. To maintain control you must established procedures for
purchasing and installation of software. We developed a description of various software normally available
and pointed out one responsible person in the group.
During the year we identified areas that needed improvement. A new matrix describing activities, expected
results and responsible appointed person was prepared. One important security issue was that they had their
own backup solution and the hardware placed in a room in the basement with no security classification. A new
lesson had to be learned – how to identify risk factors and classify the information. Another lesson learned was
that what is not documented is not – you have to understand the need of documentation and know where you
will find it.
When we started our work we agreed upon that the Head of administration is to be responsible for the IT plan,
keep it alive and update it with the IT group and communicate it to everyone in the department. When the IT
plan was approved by the Dean the Head of Administration called for an all staff meeting presenting the IT
plan and pointed out the most important security issues they had to relate to.
This kind of work did not come easy for the group. They had a lot of information but needed help to transform
it to an IT plan.
3. REFERENCES
Westerlund, K (2015) The importance of having a disaster recovery planning process EUNIS (2015) ISSN 2409-
1340 http://www.eunis.org/eunis2015
Westerlund, K (2015) Setting goals and measuring the value of Enterprise IT Architecture using the COBIT 5
framework EUNIS (2015) ISSN 2409-1340 http://www.eunis.org/eunis2015
Westerlund, K (2013) One way to communicate the value of Enterprise Architecture – maturity levels for IT
applications, EUNIS (2013) ISBN 978-9934-10-433-6 http://eunis2013.rtu.lv/content/program Westerlund, K
(2012) How we built an Enterprise Architecture framework meeting our needs, EUNIS (2012),
www.eunis.pt/images/docs/abstacts/P2C1.pdf
Westerlund, K (2011) On Budget is Not Enough – Lesson Learned Leaving an Email System from the
90s, EUNIS (2011), www.eunis.ie/papers/On-Budget-Is-Not-Enough_KarolineWesterlund_Paper.pdf
4. AUTHORS’ BIOGRAPHIES
K. Westerlund. I work as an IT-strategist at Umeå University since 1997. I am a part of
the IT Office and we have a mandate from the University Management to take strategic
responsibility for all common IT at the university. Between the years 1994 to 1997 I
worked as a project manager and was responsible for the development of an IT system
supporting human recourses, named Primula, for higher education in Sweden. At the
beginning of the 90s I worked as a development strategist at Umeå University and in the
sector. During the years 2006 to 2012 I was a member of the Ladok Board. I have studied
informatics, economics and law at Umeå University. I have the strategic responsibility for
IT security. On an annual basis, I give a number of seminars in various fields such as
Enterprise Architecture, Governance, Management and Information Security.
EUNI 164
164
The Campuscard System: An innovative multifunctional smartcard solution for higher education institutions
Dr. rer. nat. Tamas Molnar
1Project Manager Campuscard Berlin, Humboldt University Berlin, Unter den Linden 6, 10099 Berlin,
Keywords
Smartcards, Mifare, Self-service Terminals
1. Introduction
The Campuscard system is an innovative, integrated card system for universities and colleges, which is
introduced as joint project of six universities and colleges in Berlin for over 100 000 students. The
system is designed to incorporate multiple card types, from student cards, which are being currently
introduced at six institutions, to employee and visitor cards with multiple services included:
- Identification (optical and electronic)
- Electronic payment system (canteens, cafeterias, copy and print services)
- Use of the library (electronic identification and payment of fees)
- Optical and electronic ticketing for public transport
- Access control (employee cards only)
The system is based on Mifare DESfire EV1 cards and is compliant with ISO/IEC 14443 (NXP
Semiconductors N.V., 2010) , which can be considered secure. (Oswald & Paar, 2011)
2. The challenge of issuing cards to 100 000 users
The system was created as a solution for a problem, which most institutions face when issuing
smartcards for their students: The traditional distribution processes of card systems are either time
consuming or connected to high costs. There are approximately 150 institutions in Germany as of 2016
with a student card system in operation, which integrates the most common functions relevant for the
users.
The card issuing is however the most complex and most expensive process of these systems as it either
relies on a high number of employees or on costly card placement machines to enable a postal
shipment of the cards to the users.
We have found that institutions try to solve this problem by selecting one of two common solutions to
the card issuing problem:
- Several universities (i.e.: University of Konstanz) issue cards with direct personal contact. This process
involves the production of the cards from previously uploaded information by the student, either in-
house or outsourced by an external card production partner.
This procedure enables to produce a larger number of personalised smartcards in advance of the
issuing process and offers a relatively trouble free procedure.
The main disadvantage of this solution is however the reliance on a high number of staff for the card
issuing itself. An institution with 20 000 to 30 000 students has to issue approximately 5-8 000 cards
every other semester by hand, requiring the high number of employees at peak times for a speedy
process, but does not require them in the other eleven month of the year. In addition the card
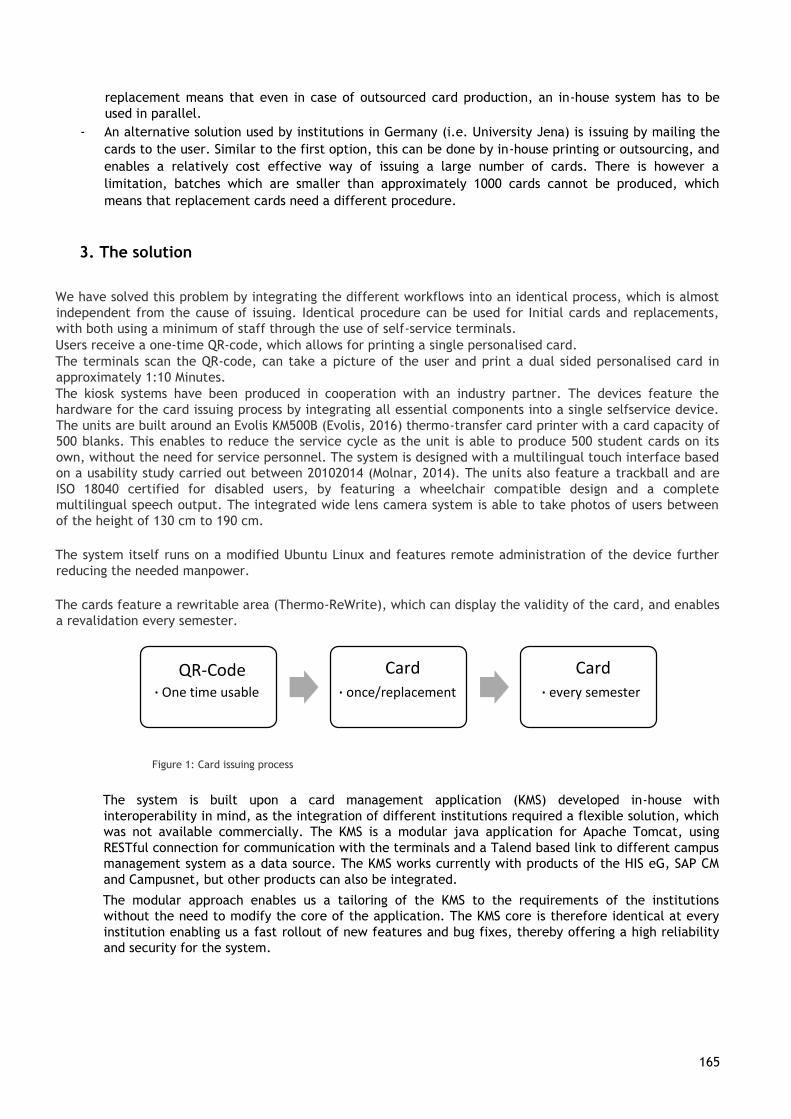
EUNI 165
165
replacement means that even in case of outsourced card production, an in-house system has to be
used in parallel.
- An alternative solution used by institutions in Germany (i.e. University Jena) is issuing by mailing the
cards to the user. Similar to the first option, this can be done by in-house printing or outsourcing, and
enables a relatively cost effective way of issuing a large number of cards. There is however a
limitation, batches which are smaller than approximately 1000 cards cannot be produced, which
means that replacement cards need a different procedure.
3. The solution
We have solved this problem by integrating the different workflows into an identical process, which is almost
independent from the cause of issuing. Identical procedure can be used for Initial cards and replacements,
with both using a minimum of staff through the use of self-service terminals.
Users receive a one-time QR-code, which allows for printing a single personalised card.
The terminals scan the QR-code, can take a picture of the user and print a dual sided personalised card in
approximately 1:10 Minutes.
The kiosk systems have been produced in cooperation with an industry partner. The devices feature the
hardware for the card issuing process by integrating all essential components into a single selfservice device.
The units are built around an Evolis KM500B (Evolis, 2016) thermo-transfer card printer with a card capacity of
500 blanks. This enables to reduce the service cycle as the unit is able to produce 500 student cards on its
own, without the need for service personnel. The system is designed with a multilingual touch interface based
on a usability study carried out between 20102014 (Molnar, 2014). The units also feature a trackball and are
ISO 18040 certified for disabled users, by featuring a wheelchair compatible design and a complete
multilingual speech output. The integrated wide lens camera system is able to take photos of users between
of the height of 130 cm to 190 cm.
The system itself runs on a modified Ubuntu Linux and features remote administration of the device further
reducing the needed manpower.
The cards feature a rewritable area (Thermo-ReWrite), which can display the validity of the card, and enables
a revalidation every semester.
Figure 1: Card issuing process
The system is built upon a card management application (KMS) developed in-house with
interoperability in mind, as the integration of different institutions required a flexible solution, which
was not available commercially. The KMS is a modular java application for Apache Tomcat, using
RESTful connection for communication with the terminals and a Talend based link to different campus
management system as a data source. The KMS works currently with products of the HIS eG, SAP CM
and Campusnet, but other products can also be integrated.
The modular approach enables us a tailoring of the KMS to the requirements of the institutions
without the need to modify the core of the application. The KMS core is therefore identical at every
institution enabling us a fast rollout of new features and bug fixes, thereby offering a high reliability
and security for the system.
QR-Code
∙ One time usable
Card
issuing ∙ once/replacement
Card
validation ∙ every semester
EUNI 166
166
4. References
Evolis. (2016). Evolis.fr. Von Evolis Product Leaflet KM500B:
http://fr.evolis.com/sites/default/files/atoms/files/kb-ksm1-160-fre-a4_rev_a1_0.pdf abgerufen
Molnar, T. (2014). Improved Usability of electronic Government Services for the ageing Population. Berlin: HU
Berlin.
NXP Semiconductors N.V. (2010). Mifare DESFire EV1 Specifications. Netherlands.
Oswald, D., & Paar, C. (2011). Breaking Mifare DESFire MF3ICD40: Power Analysis and Templates in the Real
World. In B. Preneel, & T. Takagi, CHES 2011 (S. 207-211). Nara, Japan: Springer.
Author´s Biography
Dr. Tamas Molnar is the head of unit of the Service Centre Campuscard since
2015 and project manager for the Campus card system since 2011.
Education
Primary and Secondary Schooling – Some in Germany
2001 Completed with Final Examination
09/2001 – 07/2003 University of Technology Budapest – Studies: Electrical Engineering
09/2003 – 07/2008 Corvinus University Budapest – Studies: Business Information Systems Focus:
Electronic Government
2007 - 2008 University Potsdam, Exchange Student Informatics
2008 Degree Business Informatics (Grade: Good)
In cooperation of the University Potsdam and the Corvinus University Budapest
05/2009 - 04/2014 Humboldt-University Berlin – Ph.D. Program
Focus: Software Usability in Electronic Government Systems
2014 Ph.D. in Software Usability (Grade: Magna Cum Laude)
Work Experience
09/2005 – 01/2006 Teaching Assistant, Corvinus Universität,
Chair of Theoretical Informatics, Focus: Oracle Database Systems
09/2006 – 10/2007 Project Team Member, Auda GmbH.
Focus: Multimedia Systems in education
10/2007 – 03/2008 Work on the Usability Project of the State Chancellery Brandenburg
01/2009 – 10/2010 Consultant/Project Lead, Brandenburg State Forestry Institute Focus:
IT-Security Projects

EUNI 167
167
Since 01/2011 Project Manager, Humboldt-University Berlin
Focus: Smartcard based identification systems
Since 06/2015 Head of unit, Service Centre Campuscard, Humboldt-Univeristy Berlin
Dr. Tamas Molnar, Humboldt-University Berlin [email protected],
+49 30 2093 70136
EUNI 168
168
Automated User Information Conversion to improve Identity Federation Scalability
Daniela Pöhn1 and Wolfgang Hommel
2
1Leibniz Supercomputing Centre, Bavarian Academy of Sciences and Humanities,
Boltzmannstraße 1, D-85748 Garching n. Munich, Germany, [email protected]
²Universität der Bundeswehr München, Computer Science Department, D-85577 Neubiberg, Germany,
Keywords
Federated Identity Management, Inter-Federation, SAML, User information, Attribute conversion.
1. ABSTRACT
Many European higher education institutions (HEIs) have joined an identity federation, which is
typically run by their national research and education network (NREN). For example, the German
NREN DFN operates the so-called authentication and authorization infrastructure (AAI) DFN-AAI. By
being part of a federation, each HEI makes use of federated identity management (FIM). FIM allows
users to use the account at their home organization, also called identity provider (IDP), when
accessing a service, run by a service provider (SP). By applying FIM, each user account is maintained
at a single place, which reduces the required effort for identity & access management and improves
the overall quality of user data.
Security Assertion Markup Language (SAML) is the predominant standard for FIM within the higher
education. It introduces the closed-trust-boundaries paradigm, which is realized by mostly static
national federations and, as research is not limited to geographic boundaries, inter-federations. The
biggest inter-federation within the higher education environment is eduGAIN, operated by GÉANT
(GÉANT, 2016). In order to be part of a federation or inter-federation, IDPs and SPs need to run a FIM
software. Examples of widely deployed FIM software suites are Shibboleth and SimpleSAMLphp.
In order to let the user access a personalized or access-protected service, the SP requires certain user
information, called attributes, from the IDP. These attributes can be, e.g., a unique ID, the user’s
real name, or an email address. The IDP sends such attributes in an assertion statement to the SP,
while the SP indicates beforehand the required attributes in its so-called metadata. Metadata is one
key element of SAML, which describes an entity (i.e., IDP or SP) with, among other information, the
technical communication endpoints (URLs), contact information, and information about the attributes.
Before the attributes are sent to the SP by the IDP, they eventually need to be transformed into the
data format understood by the SP. After resolving and filtering all the required attributes, this is done
via attribute conversion rules. Federations have created so-called schemas to have a standardized
vocabulary of attributes, i.e., they specify attributes with their names, unique identifiers, syntax, and
semantics. For example, the German federation DFN-AAI uses the dfnEduPerson schema (DFN-AAI,
2009), which extends the international schema eduPerson (Internet2, 2013). Additionally, another
international schema, SCHAC (REFEDS, 2015), exists, while projects and research communities can
establish further individual schemas.
If no suitable conversion rule is available at the IDP, the IDP administrator has to implement and
manually deploy a new conversion rule to the IDP software configuration. This workflow is typically
triggered when a user contacts the IDP administrator complaining that a service does not work the
way it should. As different FIM software use different programming languages and different conversion
methods, the situation gets even more complicated.
EUNI 169
169
Therefore, in this article we present an approach based on a generic user attributes conversion rule
repository, extending our previous work in (HMP, 2014). We first discuss the motivation for generic
conversion rules and elicit the required functionality. We then design an architecture and workflows
for this generic conversion rule repository, which is then explained based on a thorough example. We
conclude this article with a summary and provide an outlook to our future work.
2. MOTIVATION FOR GENERIC CONVERSION RULES
Setting up an IDP software the first time requires a connector to the local identity and access
management (I&AM) system, which is typically implemented using a leightweight directory access
protocol (LDAP) server or relational database management system. The I&AM system authenticates
the user and provides the user attributes in an IDP-internal format. Due to historical reasons and HEI-
specific individual I&AM requirements, the IDP-internally used schema often differs from the schemas
used nationally and internationally. Similarly, especially commercial SP services may require user data
in proprietary formats that are not compatible with the schemas used in FIM federations. Therefore,
attribute conversion rules are needed.
The German schema dfnEduPerson includes, for example, the attributes
• dfnEduPersonCostCenter,
• dfnEduPersonStudyBranch1,
• dfnEduPersonFieldOfStudyString, and
• dfnEduPersonFinalDegree.
Typical attributes for the schema eduPerson are the following:
• eduPersonAffiliation,
• eduPersonScopedAffiliation, eduPersonEntitlement, and
• eduPersonPrincipalName.
Other common attributes, according to inetOrgPerson, are, e.g.:
• cn (CommonName),
• displayName,
• givenName,
• sn (Surname),
• o (OrganizationName), and
• mail.
SCHAC comprises further attributes, for example:
• schacHomeOrganization,
• schacMotherTongue, schacDateOfBirth, and
• schacCountryOfCitizenship.
Other federations may have yet again different schemas. In order to send the raw attributes from the
I&AM to the SP, the IDP operator has to transform them by adding conversion rules. Within the FIM
software Shibboleth, the conversion is done in a multi-step workflow:
• Fetch the raw user data into the ID
• P software (DataConnector)
• Define the attributes (AttributeDefinition)
• Filter the attributes (AttributeFilter)
• Send the attributes (AttributeRelease)
Other FIM software use similar steps, but with a different configuration format and step denomitations.
EUNI 170
170
Typical conversion rules are:
• Renaming, e.g., from DateofBirth to schacDateOfBirth, Merging and
Splitting, e.g., sn and givenName to displayName, and Transforming, e.g.,
different date formats.
For these conversion rules, Shibboleth and other FIM software have pre-defined conversion types,
which still need to be applied manually by the IDP administrator.
Therefore, a new attribute at an SP requires the IDP administrator to add the definition, the
conversion, and the filtering manually to the IDP configuration. As the user first has to inform the
administrator, the administrator needs to gather all the required technical information and then adds
the conversion rule; this results in waiting time for the user before she can actually make use of the
desired service.
In order to enable automated conversion of attributes, a centralized conversion rule repository needs
to be established. This repository stores the information for a conversion from format A to a format B
using a generic syntax, which can then be transformed, e.g., to Shibboleth or SimpleSAMLphp
conversion rule implementations. In contrast to the conversion rule repository described in (HMP,
2014), the generic conversion rule repository uses a generic format, enabling the re-use of conversion
rules by different FIM software suites.
Therefore, an IDP administrator can upload her newly written conversion rule to the repository. If
another IDP needs the same conversion rule, but uses another FIM software, it searches the repository
based on the source and target attributes; the generic rule is transferred to the IDP and automatically
integrated into its FIM software configuration by an IDP extension. This enables the full automation of
IDP-SP setup procedures and enables the user to immediately make use of a service.
3. FUNCTIONALITY OF THE GENERIC CONVERSION RULES REPOSITORY
The centralized generic conversion rule repository can be seen as a trusted third party (TTP) for the
re-use of conversion rules. The TTP can be operated, for example, by a federation or interfederation.
An extension of the IDP software downloads and integrates the generated conversion rules. This helps
IDPs to reduce the workload, while, at the same time, reducing the waiting time for the users, and
helping SPs to receive the required attributes.
Instead of the manually written and added conversion rule after a notification from the user, the
extension searches for an appropriate conversion rule. The generic conversion rule is adapted for the
FIM software and integrated locally. Although this approach is straight-forward, no such service is
operated currently.
By making use of a generic conversion rule repository with a relational database for conversion rules,
the setup is automated:
• First, the IDP software extension detects that the IDP does not have the necessary attributes for the
SP available. The SP requirements are stated in the SAML metadata and required for the automation
to work. The IDP attributes can be found within the configuration of the IDP software. By a simple
comparison, the missing attributes can be identified.
• By having the required attributes and all the attributes the IDP can offer, the extension queries the
TTP. The TTP uses an application programming interface (API) for the communication with the IDPs.
The TTP searches a generic conversion rule suited for the IDP.
• If a generic conversion rule is found of a simple conversion, the rule is downloaded and a specific
format generated by the IDP software. More complex conversion rules with scripts should be stored
IDP software specific and manually downloaded by the IDP administrator.
• If no generic conversion rule is found, the IDP is returned an error. The IDP operator then writes a
new conversion rule, which should optionally be uploaded to the TTP. The TTP extracts the generic
rule by applying the templates. The generic rule is saved in the database.
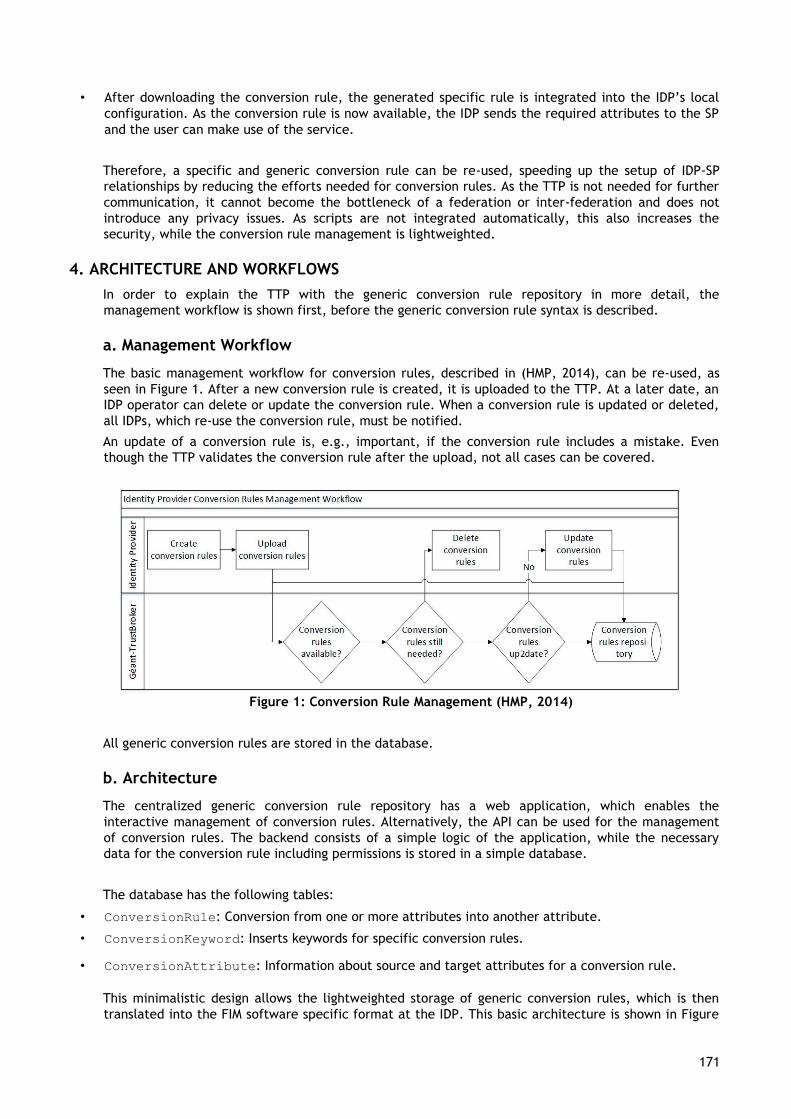
EUNI 171
171
• After downloading the conversion rule, the generated specific rule is integrated into the IDP’s local
configuration. As the conversion rule is now available, the IDP sends the required attributes to the SP
and the user can make use of the service.
Therefore, a specific and generic conversion rule can be re-used, speeding up the setup of IDP-SP
relationships by reducing the efforts needed for conversion rules. As the TTP is not needed for further
communication, it cannot become the bottleneck of a federation or inter-federation and does not
introduce any privacy issues. As scripts are not integrated automatically, this also increases the
security, while the conversion rule management is lightweighted.
4. ARCHITECTURE AND WORKFLOWS
In order to explain the TTP with the generic conversion rule repository in more detail, the
management workflow is shown first, before the generic conversion rule syntax is described.
a. Management Workflow
The basic management workflow for conversion rules, described in (HMP, 2014), can be re-used, as
seen in Figure 1. After a new conversion rule is created, it is uploaded to the TTP. At a later date, an
IDP operator can delete or update the conversion rule. When a conversion rule is updated or deleted,
all IDPs, which re-use the conversion rule, must be notified.
An update of a conversion rule is, e.g., important, if the conversion rule includes a mistake. Even
though the TTP validates the conversion rule after the upload, not all cases can be covered.
Figure 1: Conversion Rule Management (HMP, 2014)
All generic conversion rules are stored in the database.
b. Architecture
The centralized generic conversion rule repository has a web application, which enables the
interactive management of conversion rules. Alternatively, the API can be used for the management
of conversion rules. The backend consists of a simple logic of the application, while the necessary
data for the conversion rule including permissions is stored in a simple database.
The database has the following tables:
• ConversionRule: Conversion from one or more attributes into another attribute.
• ConversionKeyword: Inserts keywords for specific conversion rules.
• ConversionAttribute: Information about source and target attributes for a conversion rule.
This minimalistic design allows the lightweighted storage of generic conversion rules, which is then
translated into the FIM software specific format at the IDP. This basic architecture is shown in Figure
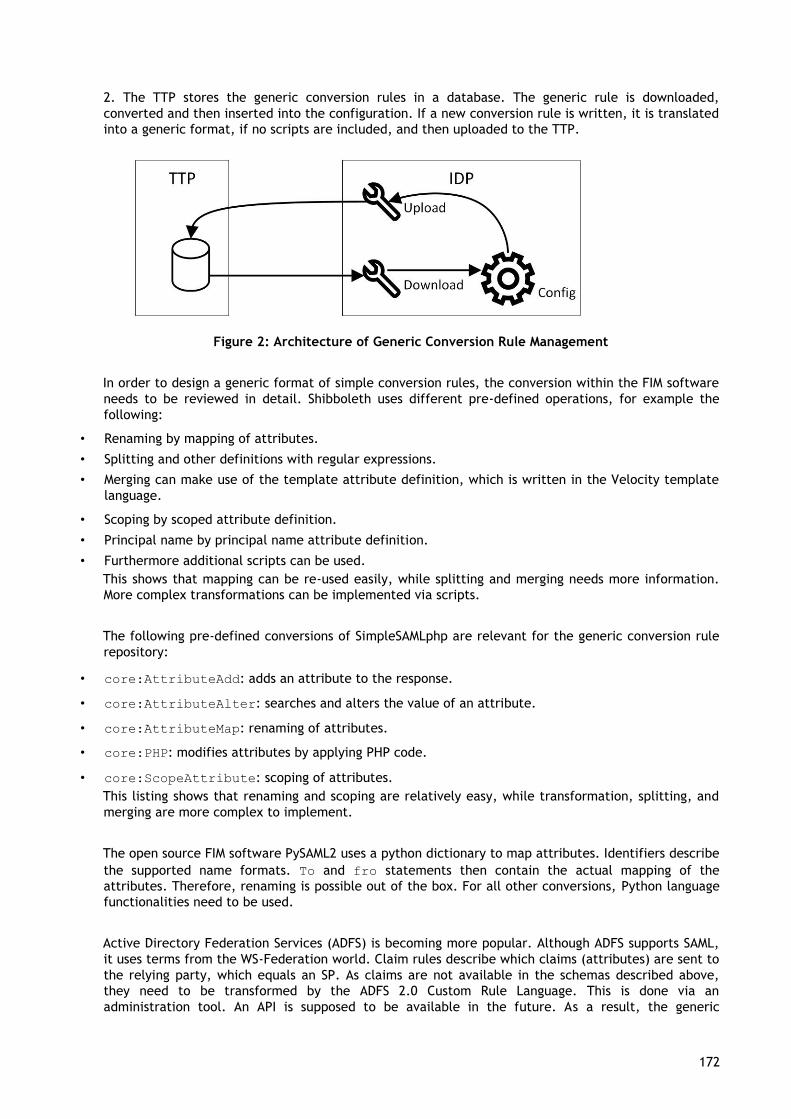
EUNI 172
172
2. The TTP stores the generic conversion rules in a database. The generic rule is downloaded,
converted and then inserted into the configuration. If a new conversion rule is written, it is translated
into a generic format, if no scripts are included, and then uploaded to the TTP.
Figure 2: Architecture of Generic Conversion Rule Management
In order to design a generic format of simple conversion rules, the conversion within the FIM software
needs to be reviewed in detail. Shibboleth uses different pre-defined operations, for example the
following:
• Renaming by mapping of attributes.
• Splitting and other definitions with regular expressions.
• Merging can make use of the template attribute definition, which is written in the Velocity template
language.
• Scoping by scoped attribute definition.
• Principal name by principal name attribute definition.
• Furthermore additional scripts can be used.
This shows that mapping can be re-used easily, while splitting and merging needs more information.
More complex transformations can be implemented via scripts.
The following pre-defined conversions of SimpleSAMLphp are relevant for the generic conversion rule
repository:
• core:AttributeAdd: adds an attribute to the response.
• core:AttributeAlter: searches and alters the value of an attribute.
• core:AttributeMap: renaming of attributes.
• core:PHP: modifies attributes by applying PHP code.
• core:ScopeAttribute: scoping of attributes.
This listing shows that renaming and scoping are relatively easy, while transformation, splitting, and
merging are more complex to implement.
The open source FIM software PySAML2 uses a python dictionary to map attributes. Identifiers describe
the supported name formats. To and fro statements then contain the actual mapping of the
attributes. Therefore, renaming is possible out of the box. For all other conversions, Python language
functionalities need to be used.
Active Directory Federation Services (ADFS) is becoming more popular. Although ADFS supports SAML,
it uses terms from the WS-Federation world. Claim rules describe which claims (attributes) are sent to
the relying party, which equals an SP. As claims are not available in the schemas described above,
they need to be transformed by the ADFS 2.0 Custom Rule Language. This is done via an
administration tool. An API is supposed to be available in the future. As a result, the generic
EUNI 173
173
conversion rule repository can only send the names of the attributes and the type of conversions in
this specific case.
In order to fully automate the conversion, the following information is needed:
• sort of conversion,
• source attributes,
• target attribute, and
• additional information, like regex.
By mapping the pre-defined conversion rules, the following keywords are extracted, which are needed
to allow the automated generation of FIM software specific conversion rules:
• source,
• target,
• targeturn1,
• targeturn2 as well as the transformations
• regex respectively pattern and
• conversion.
The generic conversion rule is described as follows.
source={source1, source2, ...};
transformation = [renaming, merging, regex, conversion];
target={target, targeturn1, targeturn2}; source(transformation) =>
target;
A simple renaming can be described as the following generic code:
source;
transformation = renaming;
target={target, targeturn1, targeturn2};
In order to transform the generic conversion rule to a FIM-software-specific conversion rule, templates
with the keywords are necessary at the IDP side. Shibboleth uses extensible markup language (XML)
code to configure the software and, therefore, transform user attributes. The renaming template for
the FIM software Shibboleth is the following: <resolver:AttributeDefinition
xsi:type="Simple" xmlns="urn:mace:shibboleth:2.0:resolver:ad"
id="{{ target }}" sourceAttributeID="{{ source }}">
<resolver:Dependency ref="{{ source|resource }}" />
<resolver:AttributeEncoder xsi:type="SAML1String"
xmlns="urn:mace:shibboleth:2.0:attribute:encoder"
name="{{ targeturn1 }}"/>
<resolver:AttributeEncoder xsi:type="SAML2String"
xmlns="urn:mace:shibboleth:2.0:attribute:encoder"
name="{{ targeturn2 }}" friendlyName="{{ target }}" />
</resolver:AttributeDefinition>

EUNI 174
174
The FIM software SimpleSAMLphp is written, as the name indicates, in PHP. The renaming template is
therefore different:
'authproc' => array(
50 => array(
'class' => 'core:AttributeMap',
'{{ target }}' => '{{ source }}',
),
)
PySAML2 uses a python dictionary for the mapping of attributes, resulting in the following template:
MAP = {
"identifier": "urn:oasis:names:tc:SAML:2.0:attrname-format:basic",
"fro": {
'{{ target }}': '{{ source }}',
},
"to": {
'{{ source }}': '{{ target }}',
}
}
These templates can be filled in with the values, when generating specific conversion rules. As long as
a template exist, a specific simple conversion rule can be generated.
5. EXAMPLE
In order to illustrate the generic conversion rule repository, an example with the IDP Leibniz
Supercomputing Centre (LRZ) is given. The IDP LRZ uses the FIM software Shibboleth, which enables
simple conversion rules, like renaming and scoping; Transformation and other conversion rules
including scripts need to be downloaded manually. Besides the national federation DFN-AAI, LRZ is
also member of the international inter-federation eduGAIN.
Let us assume that the DFN-AAI operates such a conversion rule repository. Therefore, the IDP
operator of the LRZ configured the IDP software extension in such a way that simple conversion rules
of the DFN-AAI are automatically downloaded and integrated, while other conversion rules need be
manually processed. Although this manual step results in waiting time, it is important for the trust in
and acceptance of conversion rules. As additional feature, the user is sent an email automatically
once the service is usable.
An employee of the LRZ wants to make use of a new service. In this step, the IDP software extension
determines the required conversion rules. As the service specifies two attributes, which are not
known by the LRZ yet, the IDP software extension queries the TTP.
For one attribute, mailName, a generic conversion rule can be found. The conversion rule consists of
the target mailName and the source attributes sn and givenName.
source={sn, givenName}; transformation =
merging;
target={mailName, targeturn1, targeturn2};
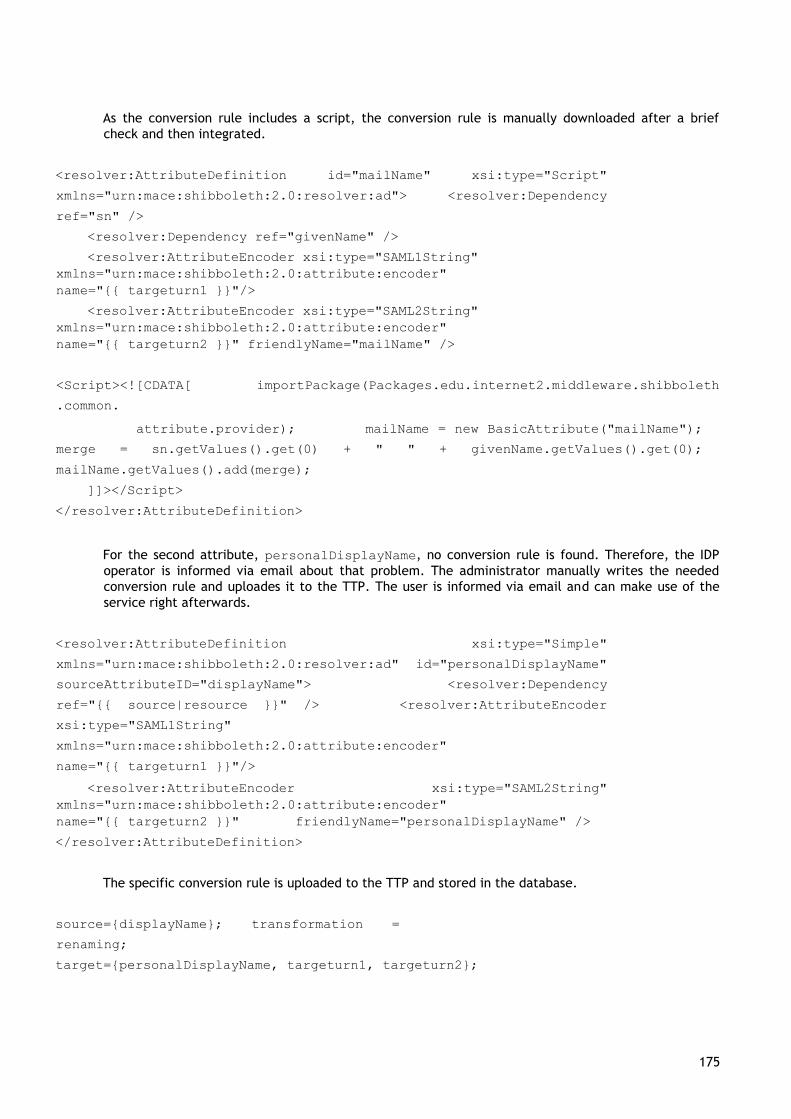
EUNI 175
175
As the conversion rule includes a script, the conversion rule is manually downloaded after a brief
check and then integrated.
<resolver:AttributeDefinition id="mailName" xsi:type="Script"
xmlns="urn:mace:shibboleth:2.0:resolver:ad"> <resolver:Dependency
ref="sn" />
<resolver:Dependency ref="givenName" />
<resolver:AttributeEncoder xsi:type="SAML1String"
xmlns="urn:mace:shibboleth:2.0:attribute:encoder"
name="{{ targeturn1 }}"/>
<resolver:AttributeEncoder xsi:type="SAML2String"
xmlns="urn:mace:shibboleth:2.0:attribute:encoder"
name="{{ targeturn2 }}" friendlyName="mailName" />
<Script><![CDATA[ importPackage(Packages.edu.internet2.middleware.shibboleth
.common.
attribute.provider); mailName = new BasicAttribute("mailName");
merge = sn.getValues().get(0) + " " + givenName.getValues().get(0);
mailName.getValues().add(merge);
]]></Script>
</resolver:AttributeDefinition>
For the second attribute, personalDisplayName, no conversion rule is found. Therefore, the IDP
operator is informed via email about that problem. The administrator manually writes the needed
conversion rule and uploades it to the TTP. The user is informed via email and can make use of the
service right afterwards.
<resolver:AttributeDefinition xsi:type="Simple"
xmlns="urn:mace:shibboleth:2.0:resolver:ad" id="personalDisplayName"
sourceAttributeID="displayName"> <resolver:Dependency
ref="{{ source|resource }}" /> <resolver:AttributeEncoder
xsi:type="SAML1String"
xmlns="urn:mace:shibboleth:2.0:attribute:encoder"
name="{{ targeturn1 }}"/>
<resolver:AttributeEncoder xsi:type="SAML2String"
xmlns="urn:mace:shibboleth:2.0:attribute:encoder"
name="{{ targeturn2 }}" friendlyName="personalDisplayName" />
</resolver:AttributeDefinition>
The specific conversion rule is uploaded to the TTP and stored in the database.
source={displayName}; transformation =
renaming;
target={personalDisplayName, targeturn1, targeturn2};
EUNI 176
176
The federation operator of the DFN-AAI receives an email about this new conversion rule, which can
be validated so other IDPs can make use of it in a fully automated manner.
When another user of a different IDP wants to use the same service, the IDP can re-use the newly
added conversion rule, reducing the waiting time for the user and the manual workload of the
operator.
6. CONCLUSION
The generic conversion rule repository has been described in order to improve the conversion rule
repository for Shibboleth (HMP, 2014). Therefore, it extends the proof of concept implementation of
the GÉANT-TrustBroker by the on-the-fly attribute conversion between IDPs and SPs with different
schemas and FIM software. This generic approach with the use of templates for the FIM software
allows the re-use of shared conversion rules independend of the FIM software. Therefore, it speeds up
the setup of IDP-SP relationships, helps SPs to receive the needed attributes, and reduces the waiting
time for users. As scripts can be used within conversion rules and different FIM software uses different
scripting language, a generic way to describe scripts should be found.
In the next step, this generic conversion rule repository is tested with different engaged parties within
the GÉANT project. The experiences gained testing the generic conversion rule repository will be used
to improve the repository, extend it to support further FIM software suites, and help to support IDPs in
eduGAIN.
7. ACKNOWLEDGMENT
The research leading to these results has received funding from the European Union’s Horizon 2020
research and innovation programme under Grant Agreement No. 691567 (GN4-1).
The authors wish to thank the members of the Munich Network Management (MNM) Team for helpful
comments on previous versions of this paper. The MNM-Team, directed by Prof. Dr. Dieter
Kranzlmüller and Prof. Dr. Heinz-Gerd Hegering, is a group of researchers at Ludwig-
MaximiliansUniversität München, Technische Universität München, the University of the Federal Armed
Forces, and the Leibniz Supercomputing Centre of the Bavarian Academy of Sciences and Humanities.
8. REFERENCES
Hommel, W., Metzger, S., Pöhn, D. (2014). Géant-TrustBroker: Simplifying Identity & Access
Management for International Research Projects and Higher Education Communities. 20th congress of
the European University Information Systems Organisation (EUNIS 2014)
DFN-AAI (2009). dfnEduPerson Schema 1.0. Retrieved February 15,
2016, from: https://www.aai.dfn.de/fileadmin/documents/attributes/200811/dfneduperson-
1.0.schema.txt
GÉANT (2016). eduGAIN Homepage. Retrieved February 15, 2016, from:
http://services.geant.net/edugain/Pages/Home.aspx
Internet2 (2013). eduPerson Object Class Specification (201310). Retrieved February 15, 2016, from:
http://software.internet2.edu/eduperson/internet2-mace-dir-eduperson-201310.html
REFEDS (2015). SCHAC Releases. Retrieved February 15, 2016, from:
https://wiki.refeds.org/display/STAN/SCHAC+Releases
9. AUTHORS’ BIOGRAPHIES
EUNI 177
177
Daniela Pöhn received a university diploma degree in Computer Science from the
University of Hagen, Germany, in 2012.
She was engaged in the IT industry as a full-time software developer during her
studies, before she joined LRZ as a Ph.D. candidate in September 2012.
She is involved in the identity management research activity of the GÉANT
project since April, 2013, leading one task about the TrustBroker approach. The focus is
mainly on interoperability within federated identity management.
Wolfgang Hommel has a Ph.D. as well as a postdoctoral lecture qualification
from Ludwig-Maximilians-Universität in Munich, Germany, where he teaches information
security lectures and labs.
His research focuses on information security and IT service management in
complex large-scale and inter-organizational scenarios
EUNI 178
178
Digital Identity for University People
G. Gentili,1 F. Ippoliti2, M. Maccari1, A.Polzonetti3
1 Computer Center University of Camerino Italy
2 School of Science and Technology University of Camerino Italy
3 ELIOS srl. UNICAM Spin Off Via le mosse,22 62032 Camerino (MC)
Keywords
Digital Identity, Smart Card, Electronic .
1. ABSTRACT
Identity management is a set of technologies and processes supporting identity information. Its adoption in
Public Administration, in particular in the domain of university, maintains organization autonomy giving at the
same time students and staff support to access the services that are delivered. In this paper, we present a
project lead by University of Camerino with the Italian Banking Group UBI. The project consists in the issue of
Enjoy my UniCam card allowing users to have, on a single physical card, several functionalities about
facilitated banking account, university services and digital signature certificate. First results about the testing
phase are presented.
2. INTRODUCTION
Over the time, managing personal identity on-line has become a serious issue. It has become increasingly
important in terms of personal security, partly because organizations are now highly networked when it comes
to information. Digital Identity (ID) is spread among different organizations. Small amounts of information
cannot reveal enough about people to impact on us in a negative way but, when using the internet extensively,
we can find several more information than expected [1]. So, depending on the context, person may be
represented by different “partial identities”. For example, a person may use one or more partial identities for
work and others in spare time, e.g., with the family, doing sports, or dealing with companies like a bank, an
Internet service provider, or a supermarket [2] [3] [5].
The project is based on a prepaid card named “Enjoy”, that made possible the creation of a project leaded by
University of Camerino (UniCam) in collaboration with the Italian Banking Group UBI and the Namirial
Certification Authority. This initiative has also made possible the creation of a digital scenario “Enjoy
Ecosystem”, resulting from a collaboration of five Italian universities and many UBI local branches. Aim of
the paper is to present the UniCam experience in digital identity management. The goal is to create a card for
students, faculty and administrative staff that allow you to have, on a single physical card, several
functionalities such as bank services, academic services and digital signature, letting the owners to save time
and increase their satisfaction toward the university. The “all-in-one” solution has been chosen to guarantee
safety, privacy and trust. [6]
In order to complete the project, several issues have been addressed and solved. From the political point of
view, the project is a valuable means of bringing innovation in UniCam. About the legal point of view, it also
allowed the adoption of the Italian Digital Administration Code. For what concerns the organizational issues,
an agreement was signed among UniCam, Italian Banking Group UBI and Namirial Certification Authority; it
regulates terms and conditions in order to achieve the whole project objective. Finally, about the technical
aspects, a new system was implemented. It is integrated with all the other existing infrastructures in the
university, supporting different technologies. For instance, to set data flows among stakeholders, some web
services have been implemented and SFTP (Secure Shell File Transfer Protocol) server has been integrated.
Finally, from the administrative point of view, the use of Enjoy My UniCam card allows a remarkable
simplification of the paperwork.[10]
Section 3 discusses the whole Enjoy my UniCam card project, with a deep description of actors, system
architecture and processes. Section 4 describes the services available with Enjoy my UniCam card. Finally,
Section 5 concludes the paper.
3. ENJOY MY UNICAM
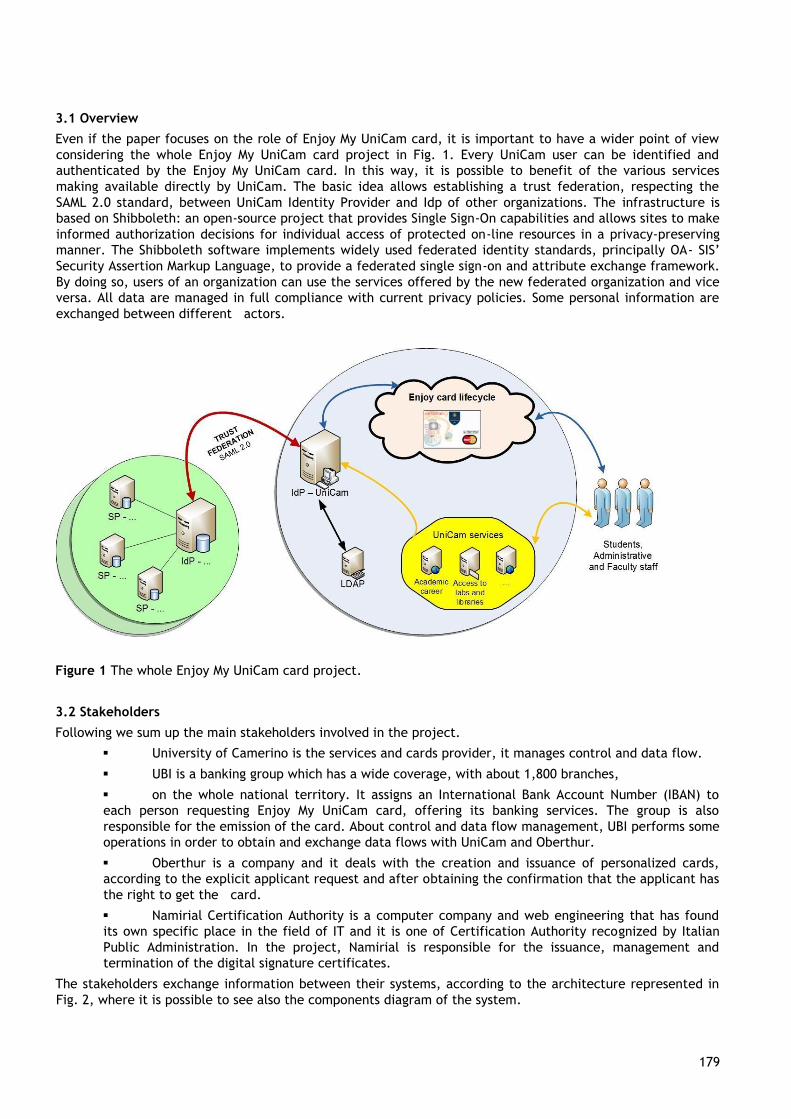
EUNI 179
179
3.1 Overview
Even if the paper focuses on the role of Enjoy My UniCam card, it is important to have a wider point of view
considering the whole Enjoy My UniCam card project in Fig. 1. Every UniCam user can be identified and
authenticated by the Enjoy My UniCam card. In this way, it is possible to benefit of the various services
making available directly by UniCam. The basic idea allows establishing a trust federation, respecting the
SAML 2.0 standard, between UniCam Identity Provider and Idp of other organizations. The infrastructure is
based on Shibboleth: an open-source project that provides Single Sign-On capabilities and allows sites to make
informed authorization decisions for individual access of protected on-line resources in a privacy-preserving
manner. The Shibboleth software implements widely used federated identity standards, principally OA- SIS’
Security Assertion Markup Language, to provide a federated single sign-on and attribute exchange framework.
By doing so, users of an organization can use the services offered by the new federated organization and vice
versa. All data are managed in full compliance with current privacy policies. Some personal information are
exchanged between different actors.
Figure 1 The whole Enjoy My UniCam card project.
3.2 Stakeholders
Following we sum up the main stakeholders involved in the project.
University of Camerino is the services and cards provider, it manages control and data flow.
UBI is a banking group which has a wide coverage, with about 1,800 branches,
on the whole national territory. It assigns an International Bank Account Number (IBAN) to
each person requesting Enjoy My UniCam card, offering its banking services. The group is also
responsible for the emission of the card. About control and data flow management, UBI performs some
operations in order to obtain and exchange data flows with UniCam and Oberthur.
Oberthur is a company and it deals with the creation and issuance of personalized cards,
according to the explicit applicant request and after obtaining the confirmation that the applicant has
the right to get the card.
Namirial Certification Authority is a computer company and web engineering that has found
its own specific place in the field of IT and it is one of Certification Authority recognized by Italian
Public Administration. In the project, Namirial is responsible for the issuance, management and
termination of the digital signature certificates.
The stakeholders exchange information between their systems, according to the architecture represented in
Fig. 2, where it is possible to see also the components diagram of the system.
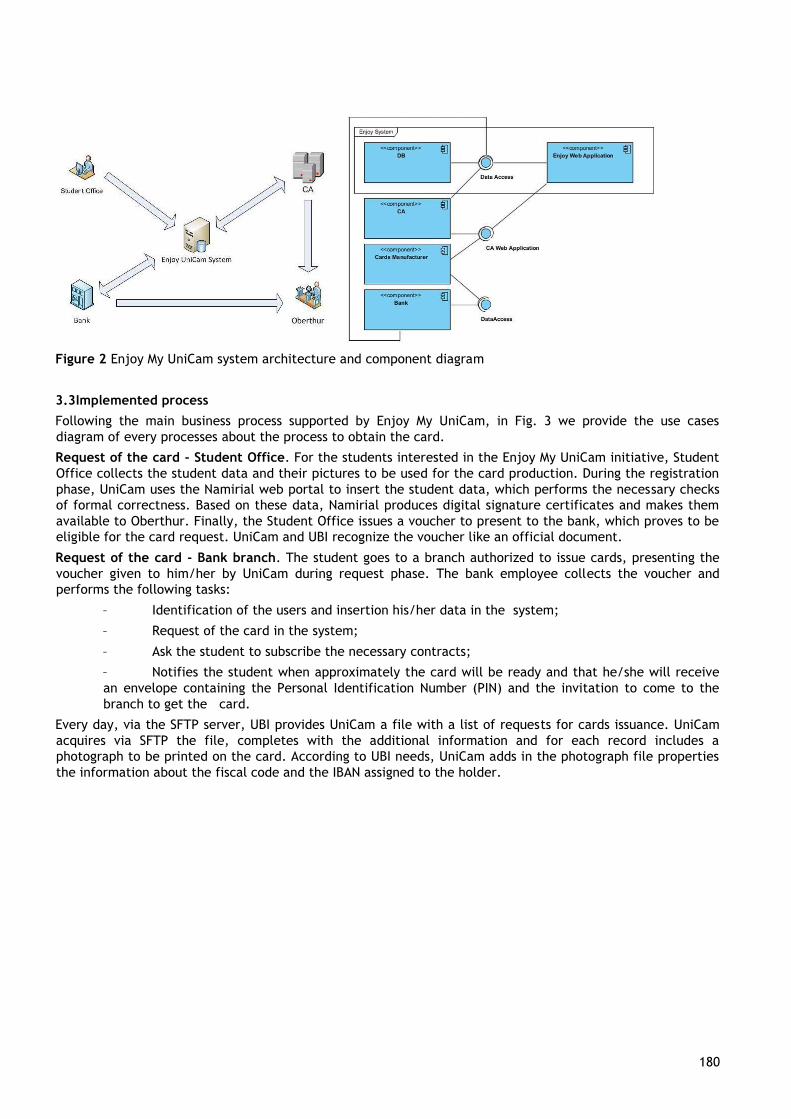
EUNI 180
180
Figure 2 Enjoy My UniCam system architecture and component diagram
3.3Implemented process
Following the main business process supported by Enjoy My UniCam, in Fig. 3 we provide the use cases
diagram of every processes about the process to obtain the card.
Request of the card - Student Office. For the students interested in the Enjoy My UniCam initiative, Student
Office collects the student data and their pictures to be used for the card production. During the registration
phase, UniCam uses the Namirial web portal to insert the student data, which performs the necessary checks
of formal correctness. Based on these data, Namirial produces digital signature certificates and makes them
available to Oberthur. Finally, the Student Office issues a voucher to present to the bank, which proves to be
eligible for the card request. UniCam and UBI recognize the voucher like an official document.
Request of the card - Bank branch. The student goes to a branch authorized to issue cards, presenting the
voucher given to him/her by UniCam during request phase. The bank employee collects the voucher and
performs the following tasks:
– Identification of the users and insertion his/her data in the system;
– Request of the card in the system;
– Ask the student to subscribe the necessary contracts;
– Notifies the student when approximately the card will be ready and that he/she will receive
an envelope containing the Personal Identification Number (PIN) and the invitation to come to the
branch to get the card.
Every day, via the SFTP server, UBI provides UniCam a file with a list of requests for cards issuance. UniCam
acquires via SFTP the file, completes with the additional information and for each record includes a
photograph to be printed on the card. According to UBI needs, UniCam adds in the photograph file properties
the information about the fiscal code and the IBAN assigned to the holder.
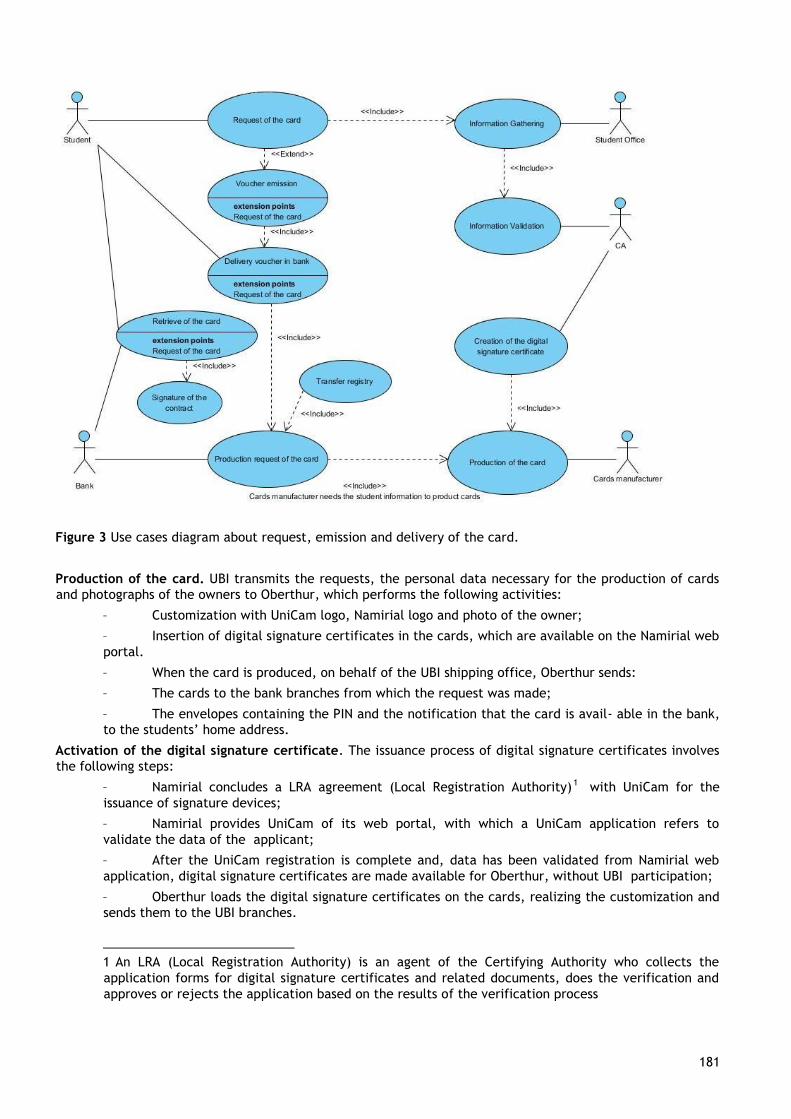
EUNI 181
181
Figure 3 Use cases diagram about request, emission and delivery of the card.
Production of the card. UBI transmits the requests, the personal data necessary for the production of cards
and photographs of the owners to Oberthur, which performs the following activities:
– Customization with UniCam logo, Namirial logo and photo of the owner;
– Insertion of digital signature certificates in the cards, which are available on the Namirial web
portal.
– When the card is produced, on behalf of the UBI shipping office, Oberthur sends:
– The cards to the bank branches from which the request was made;
– The envelopes containing the PIN and the notification that the card is avail- able in the bank,
to the students’ home address.
Activation of the digital signature certificate. The issuance process of digital signature certificates involves
the following steps:
– Namirial concludes a LRA agreement (Local Registration Authority) 1 with UniCam for the
issuance of signature devices;
– Namirial provides UniCam of its web portal, with which a UniCam application refers to
validate the data of the applicant;
– After the UniCam registration is complete and, data has been validated from Namirial web
application, digital signature certificates are made available for Oberthur, without UBI participation;
– Oberthur loads the digital signature certificates on the cards, realizing the customization and
sends them to the UBI branches.
1 An LRA (Local Registration Authority) is an agent of the Certifying Authority who collects the
application forms for digital signature certificates and related documents, does the verification and
approves or rejects the application based on the results of the verification process
EUNI 182
182
Delivery of the card. When the card and PIN have been produced, the student receives at his/her home
address the PIN and the invitation to go to the bank branch to receive the card. When the student is at the
office, he/she was handed the envelope containing the card and the delivery device signature module. The
student signs the module and UBI sends it via mail to Namirial. Every day Namirial will call a procedure to
communicate to UniCam the information acquired. At this point Namirial sends directly to the students’ home
address PIN and Personal Unblocking Key (PUK) of the digital signature certificate.
Reissue of the card. In case of theft or loss of card, the student must:
– Request the freezing of money services in the way specified in the contract documents: that is
calling the customer service or going directly to the bank branch;
– Request the freezing of digital signature certificate, as specified by Namirial in the
documentation attached to the envelope containing PIN and PUK;
– Go to the Student office to request the release of a new voucher with which to present the
replacement request of the card at the bank branch, in order to maintain the same IBAN;
– Go to the bank branch where the student originally requested the issuance of the first card,
showing the new voucher. In this way, the replacement request is processed as a standard procedure
for a new Enjoy My UniCam card.
The process then follows the normal process of issuing a card. The voucher is a prerequisite, without which
the student cannot request the card. It’s the only document obtained from the Student Office, certifying the
students have the right to become cardholders.
Early extinction of the card. If a student loses the right to ownership of the card (e.g. in the case of drop-
out), the Student office must inform the student that, before closing the relationship with the University, he
must go to the bank branch to return the Enjoy My UniCam card, according to the usual banking regulations
about the extinction of the cards.
4. SUPPORTED SERVICES
The card allows the students to have, in a single physical device, several functionalities, in different areas:
bank and university services.
– Bank services. The card is technically a prepaid card with an associated IBAN. It is valid for 5
years and it has not fixed fee. It allows you to make the usual banking operations, with special
facilitations, such as paying anywhere displaying the MasterCardTM symbol in Italy and abroad, making
free withdrawals at every Bancomat cash machines in Italy, making and/or receiving transfers using
home banking, paying bills and making RID payments and so on.
– UniCam services. The card allows the student to be recognized in UniCam facilities giving the
possibility to access to laboratory and library, pay the meal at the canteen, register for exams, display
and summary of the academic career, and require internships and thesis, enrollment to university
sports center.
– As already mentioned, the card contains a digital signature certificate, with legal value, with
which you can digitally sign documents. In order to use the UniCam services about the request of
particular documents or, for example, to require thesis, it is possible to fill the document directly
from your laptop and then, finally, sign it with digital signature certificate. In this way, the document
will have official and legal value.
UniCam also participates in the IDEM Federation. So organizations in IDEM become Identity Provider: identities
of own users can be exchanged, providing appropriate safeguards and always respecting the privacy of users
[7][8][9]. With Enjoy my UniCam card, it will be possible, in every university or organization participating to
IDEM, to access to any service available such as libraries, logging in in computer labs, connecting to
universities Wi-Fi networks, which are often present in squares and public areas of faculties, and so on.
5. CONCLUSION
In this paper, we present the experience of the University of Camerino about the multi-services card. The
adopted solution presents several advantages. On one hand, it avoids the possibility to have many and many
EUNI 183
183
cards to benefit different services. On the other, in term of identity federation it is part of community making
advantages of related benefits.
Enjoy My UniCam card obtained good results during the testing phase, delivering over 2330 cards in the first
21 months. The waiting time between the request and the final delivery has been about 15 days, which is a
nice result considering the processing. In the next future, UniCam is going to activate several more services
such as paying photocopies, coffees or snacks at the vending machines and about public transport service
aiming to build up a smart campus.
6. REFERENCES
1. Al-Khouri, A. M. (2012). PKI in government digital identity management systems. European
Journal of ePractice, 4, 4-21.
2. Jensen, J. (2012, August). Federated identity management challenges. InAvailability,
Reliability and Security (ARES), 2012 Seventh International Conference on (pp. 230-235). IEEE.
3. Bour,I.(2013). Electronic Identities in Europe - Overview of eID solutions connecting Citizens
to Public Authorities. Technical report, Transaction Security
4. NIST (2001). Security requirements for cryptographic modules.Technical report, National
Institute of Standards and Technology.
5. Eve Maler, D.R.(2010) The Venn of Identity: Options and Issues in Federated Identity
Management. Technical report, European Commission
6. Gaedke, M., Meinecke, J., Nussbaumer, M.(2005) A modeling approach to federated identity
and access management. WWW ’05 Special interest tracks and posters of the 14th international
conference on World Wide Web.
7. Carota, S., Corradini, F., Falcioni, D., Maggiulli, M.L., Marcantoni, F., Piangerelli, R.,
Polzonetti, A., Re, B., Sergiacomi, A.(2012) FedCohesion:
Federated Identity Man- agement in the Marche Region. In: EGOVIS/EDEM. (2012) 112–124
8. Morgan, R., Cantor, S., Carmody, S., Hoehn, W., Klingenstein, K.(2004) Federated Security:
The Shibboleth Approach. Technical report, EDUCAUSE Quarterly (2004)
9. Baldoni, R.(2012). Federated Identity Management Systems in eGovernment: the Case of Italy.
Electronic Government, an International Journal, 9(1), 64-84.
10. Falcioni, D., Ippoliti, F., Marcantoni, F., & Re, B. (2013). Digital Identity into Practice: The
Case of UniCam. In Technology-Enabled Innovation for Democracy, Government and Governance (pp.
18-28). Springer Berlin Heidelberg.
EUNI 184
184
Towards a distributed research data management system
M. Politze1, F. Krämer2
1 IT Center RWTH Aachen University, Seffenter Weg 23, 52074 Aachen, [email protected]
2 IT Center RWTH Aachen University, Seffenter Weg 23, 52074 Aachen, [email protected]
Keywords
RDM, distributed systems, PID, metadata, RDF
1. SUMMARY
At RWTH Aachen University a project aims at improving the support and technical infrastructure for Research
Data Management (RDM). In this project the need was identified to provide researchers with a tool to simply
register and store metadata corresponding to their files. Our solution enables researchers via a web interface
to register and identify their data with PIDs as well as store metadata in a standardized form. To account for
confidentiality concerns data and metadata can optionally also be stored in a file locally. The solution will be
deployed and evaluated in March 2016.
2. BACKGROUND
There is an initiative to set up an integrated Research Data Management (RDM) system within the next years
at RWTH Aachen University. A project group focuses on consulting and training as well as on the development
of technical solutions for RDM. Since managing data requires extra effort from researchers, usability and
seamless integration into existing workflows are key to establishing an integrated RDM. Technical solutions
need to cover all domains of the research process: private and collaborative domain, in which researchers
actively work with the data, as well as the archive and publication domain, in which data is accessed less
frequently. Registering metadata is the prerequisite for re-discovering and re-using data, but requires extra
effort from researchers. However, this task is the easier the earlier it is performed since the context of the
data generation is more present to the researcher. We therefore want to offer a tool for the registration of
metadata that works independently from the local IT environment of the researcher, allowing every
researcher to document metadata as soon as research data is produced. It also needs to be flexible regarding
the storage of data as well as metadata since many institutes have their own IT infrastructure and sometimes
strong privacy and confidentiality concerns regarding even meta-information about their research.
Furthermore, structure and format of metadata need to be standardized to allow for a seamless transition to
the archive or publication domain and for the data to be found and re-used later. The RDM project closely
cooperates with a number of pilot users, which will test the solution throughout the development process.
3. OUR SOLUTION
Our first step towards an integrated RDM system is to offer a distributed solution that allows the usage
of an integrated service layer (ISL) as well as any private services already available to the researcher.
Researchers log on to a web interface where they can register their data to a PID (persistent identifier)
service. They can choose from a number of predefined metadata schemas that use Dublin Core as a basis, and
fill it in. Depending on the user’s institutional context it is also possible to preset a metadata schema. To
achieve maximum re-usability the metadata schemas and presets are defined in RDF format. The link
between data and metadata will be established using the registered PID. Via a REST API it will also be possible
to automatically provide metadata from local systems such as test stations or measurement devices. Storage
of the data and metadata can be realized in two different workflows depending on the researcher’s
preferences.
(1) Private Workflow: Formalized metadata is stored together with the research data in the private archive.
Metadata is provided in an RDF file. To ensure retrievability data and metadata are linked by a PID service.
(2) Integrated workflow: Formalized metadata is stored in the integrated metadata store. With the number of
users and disciplines the available metadata schemas will be continually expanded. The storage concept for
metadata still poses a challenge. For the first version a generic RDF triple store will be used. The researcher
also has the option to transfer the research data into the integrated archive service. A PID links data and
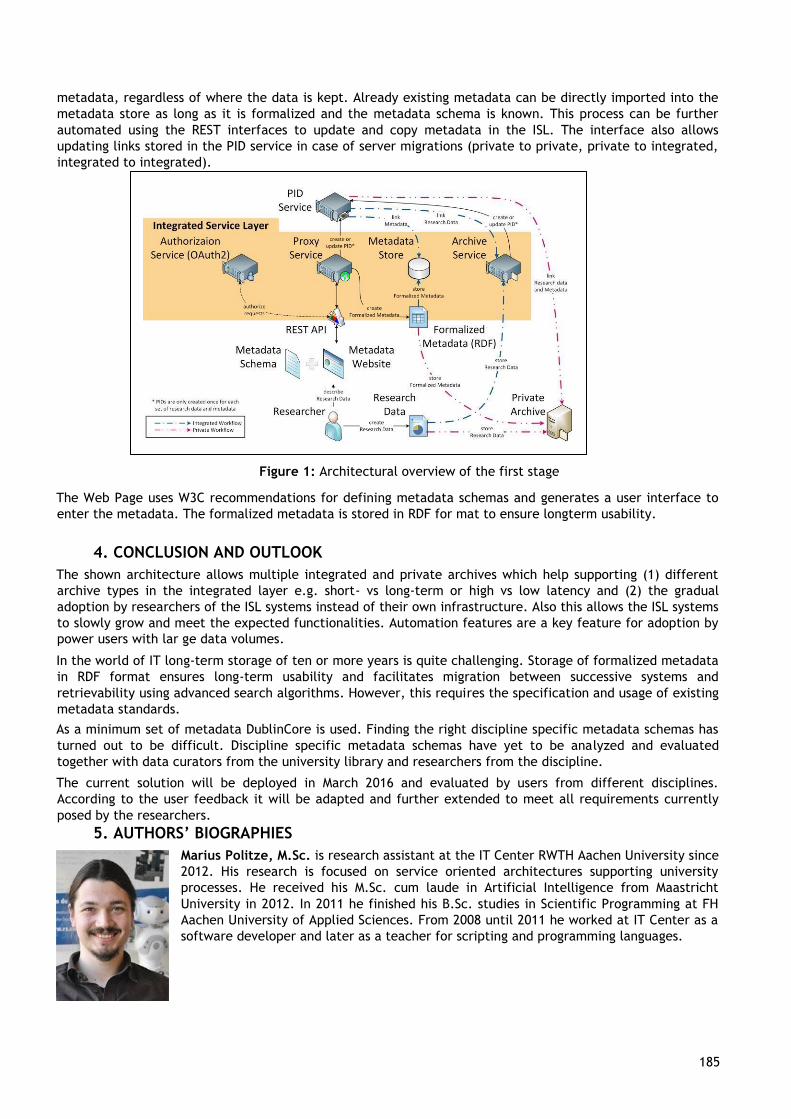
EUNI 185
185
metadata, regardless of where the data is kept. Already existing metadata can be directly imported into the
metadata store as long as it is formalized and the metadata schema is known. This process can be further
automated using the REST interfaces to update and copy metadata in the ISL. The interface also allows
updating links stored in the PID service in case of server migrations (private to private, private to integrated,
integrated to integrated).
Figure 1: Architectural overview of the first stage
The Web Page uses W3C recommendations for defining metadata schemas and generates a user interface to
enter the metadata. The formalized metadata is stored in RDF for mat to ensure longterm usability.
4. CONCLUSION AND OUTLOOK
The shown architecture allows multiple integrated and private archives which help supporting (1) different
archive types in the integrated layer e.g. short- vs long-term or high vs low latency and (2) the gradual
adoption by researchers of the ISL systems instead of their own infrastructure. Also this allows the ISL systems
to slowly grow and meet the expected functionalities. Automation features are a key feature for adoption by
power users with lar ge data volumes.
In the world of IT long-term storage of ten or more years is quite challenging. Storage of formalized metadata
in RDF format ensures long-term usability and facilitates migration between successive systems and
retrievability using advanced search algorithms. However, this requires the specification and usage of existing
metadata standards.
As a minimum set of metadata DublinCore is used. Finding the right discipline specific metadata schemas has
turned out to be difficult. Discipline specific metadata schemas have yet to be analyzed and evaluated
together with data curators from the university library and researchers from the discipline.
The current solution will be deployed in March 2016 and evaluated by users from different disciplines.
According to the user feedback it will be adapted and further extended to meet all requirements currently
posed by the researchers.
5. AUTHORS’ BIOGRAPHIES
Marius Politze, M.Sc. is research assistant at the IT Center RWTH Aachen University since
2012. His research is focused on service oriented architectures supporting university
processes. He received his M.Sc. cum laude in Artificial Intelligence from Maastricht
University in 2012. In 2011 he finished his B.Sc. studies in Scientific Programming at FH
Aachen University of Applied Sciences. From 2008 until 2011 he worked at IT Center as a
software developer and later as a teacher for scripting and programming languages.
EUNI 186
186
Florian Krämer studied Political Science, Economics and Linguistics and received his
Master of Arts from RWTH Aachen University in 2010. After working as a research
assistant in the Institute for Political Science he joined the IT Center in 2011. Here his
tasks first included support and training, he was responsible for the online documentation
and worked on different projects including knowledge management and research data
management. Since 2015 he is responsible for the coordination of the activities
concerning RDM within the IT Center and a member of the RWTH project group on RDM.
EUNI 187
187
New university erp for studying, teaching nd administration ‐ past, present and future of the peppi
1st Tuomas Orama, 2 nd Jaakko Rannila, 3 rd Mika Lavikainen, 4th Lauri Stigell
1st, Development manager, Helsinki Metropolia University of Applied Sciences, Bulevardi 31 PL 4000,
tuomas.orama(at)metropolia.fi
2nd, Project manager, Helsinki Metropolia University of Applied Sciences, Bulevardi 31 PL 4000,
jaakko.rannila(at)metropolia.fi
3rd, Project manager, Helsinki Metropolia University of Applied Sciences, Bulevardi 31 PL 4000,
mika.lavikainen(at)metropolia.fi
4th, Lauri Stigell, CEO, Edumate Consulting Ltd, lauri.stigell(at)edumate.fi
Keywords
Student Information System (SIS), Enterprise Resource Planning (ERP), Service oriented architecture (SOA),
Enterprise Architecture, Enterprise Service Bus (ESB), Administrative Model, Consortium
1. INTRODUCTION
It has been over a decade in Finland since the latest new Higher Education Institution (HEI) student
information system (SIS) was released. At the moment, there is more or less only two prevailing ecosystems
in Finland. Those two are Oodi in universities and Winha in universities of applied sciences (MINEDU 2016).
Both of them are made in the late 90’s.
HEI’s woke up into the situation of renewing ecosystems in 2005 when ProAMK (PROAMK 2007) project was
started. Its goal was set high ‐ to create one ecosystem for every university of applied sciences in the areas
of education and research. In 2007, the project was closed down because of lack of belief and courage. In
2009 new project started by the ministry of education. It was called RAKETTI and one of its goals was to
create or acquire a new student information system for the whole sector. In 2010 the project excluded that
goal from the project ‐ because of lack of belief and courage. Instead, the project refocused on the
architectural specifications, definitions of definite national services and some reference projects (RAKETTI
2014).
Picture 1 (SYNERGIA 2015) illustrates the agreed education process areas within Finnish HEI’s. Gradually the
understanding was reached which process areas would be covered by national solutions (student admission,
application procedure) and which by the HEI’s themselves.
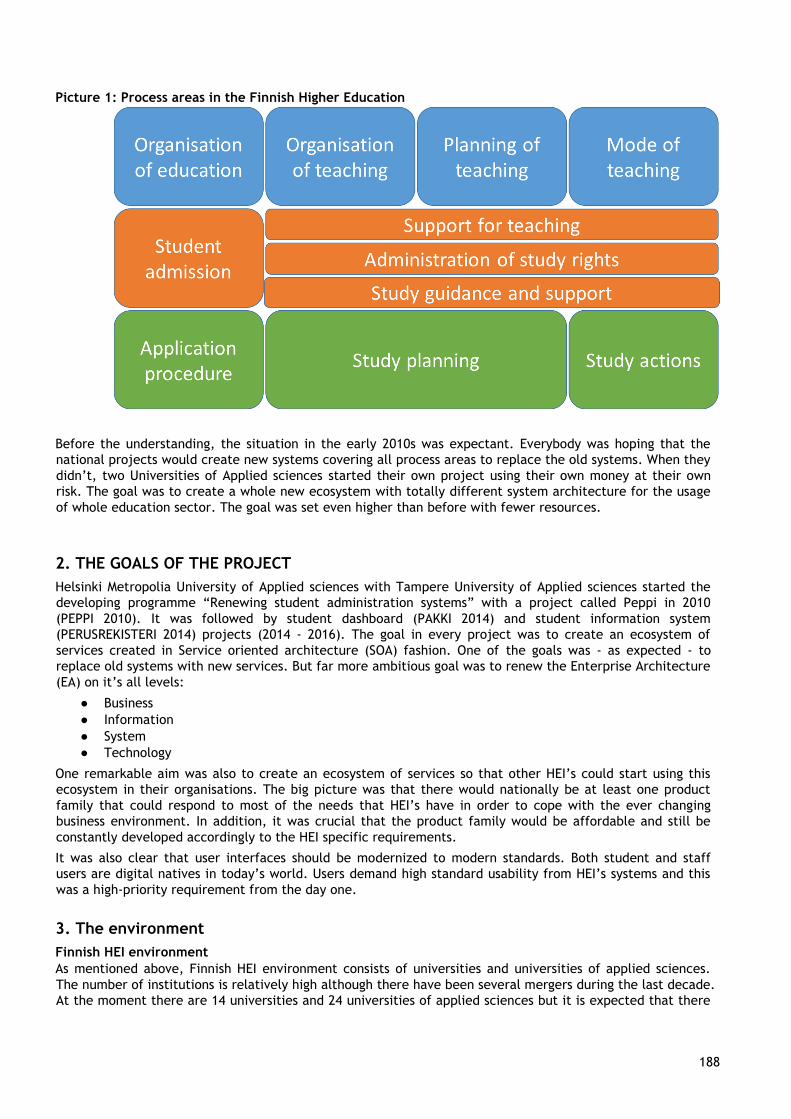
EUNI 188
188
Picture 1: Process areas in the Finnish Higher Education
Before the understanding, the situation in the early 2010s was expectant. Everybody was hoping that the
national projects would create new systems covering all process areas to replace the old systems. When they
didn’t, two Universities of Applied sciences started their own project using their own money at their own
risk. The goal was to create a whole new ecosystem with totally different system architecture for the usage
of whole education sector. The goal was set even higher than before with fewer resources.
2. THE GOALS OF THE PROJECT
Helsinki Metropolia University of Applied sciences with Tampere University of Applied sciences started the
developing programme “Renewing student administration systems” with a project called Peppi in 2010
(PEPPI 2010). It was followed by student dashboard (PAKKI 2014) and student information system
(PERUSREKISTERI 2014) projects (2014 ‐ 2016). The goal in every project was to create an ecosystem of
services created in Service oriented architecture (SOA) fashion. One of the goals was ‐ as expected ‐ to
replace old systems with new services. But far more ambitious goal was to renew the Enterprise Architecture
(EA) on it’s all levels:
● Business
● Information
● System
● Technology
One remarkable aim was also to create an ecosystem of services so that other HEI’s could start using this
ecosystem in their organisations. The big picture was that there would nationally be at least one product
family that could respond to most of the needs that HEI’s have in order to cope with the ever changing
business environment. In addition, it was crucial that the product family would be affordable and still be
constantly developed accordingly to the HEI specific requirements.
It was also clear that user interfaces should be modernized to modern standards. Both student and staff
users are digital natives in today’s world. Users demand high standard usability from HEI’s systems and this
was a high‐priority requirement from the day one.
3. The environment
Finnish HEI environment
As mentioned above, Finnish HEI environment consists of universities and universities of applied sciences.
The number of institutions is relatively high although there have been several mergers during the last decade.
At the moment there are 14 universities and 24 universities of applied sciences but it is expected that there
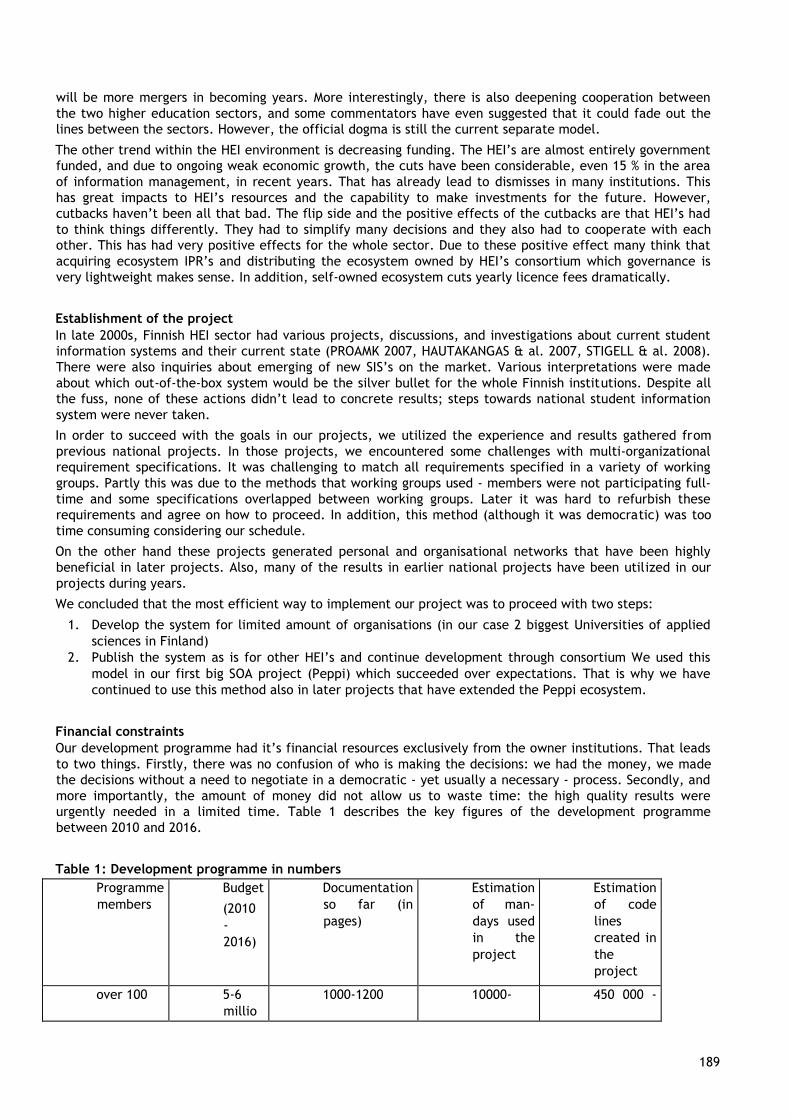
EUNI 189
189
will be more mergers in becoming years. More interestingly, there is also deepening cooperation between
the two higher education sectors, and some commentators have even suggested that it could fade out the
lines between the sectors. However, the official dogma is still the current separate model.
The other trend within the HEI environment is decreasing funding. The HEI’s are almost entirely government
funded, and due to ongoing weak economic growth, the cuts have been considerable, even 15 % in the area
of information management, in recent years. That has already lead to dismisses in many institutions. This
has great impacts to HEI’s resources and the capability to make investments for the future. However,
cutbacks haven’t been all that bad. The flip side and the positive effects of the cutbacks are that HEI’s had
to think things differently. They had to simplify many decisions and they also had to cooperate with each
other. This has had very positive effects for the whole sector. Due to these positive effect many think that
acquiring ecosystem IPR’s and distributing the ecosystem owned by HEI’s consortium which governance is
very lightweight makes sense. In addition, self‐owned ecosystem cuts yearly licence fees dramatically.
Establishment of the project
In late 2000s, Finnish HEI sector had various projects, discussions, and investigations about current student
information systems and their current state (PROAMK 2007, HAUTAKANGAS & al. 2007, STIGELL & al. 2008).
There were also inquiries about emerging of new SIS’s on the market. Various interpretations were made
about which out‐of‐the‐box system would be the silver bullet for the whole Finnish institutions. Despite all
the fuss, none of these actions didn’t lead to concrete results; steps towards national student information
system were never taken.
In order to succeed with the goals in our projects, we utilized the experience and results gathered from
previous national projects. In those projects, we encountered some challenges with multi‐organizational
requirement specifications. It was challenging to match all requirements specified in a variety of working
groups. Partly this was due to the methods that working groups used ‐ members were not participating full‐
time and some specifications overlapped between working groups. Later it was hard to refurbish these
requirements and agree on how to proceed. In addition, this method (although it was democratic) was too
time consuming considering our schedule.
On the other hand these projects generated personal and organisational networks that have been highly
beneficial in later projects. Also, many of the results in earlier national projects have been utilized in our
projects during years.
We concluded that the most efficient way to implement our project was to proceed with two steps:
1. Develop the system for limited amount of organisations (in our case 2 biggest Universities of applied
sciences in Finland)
2. Publish the system as is for other HEI’s and continue development through consortium We used this
model in our first big SOA project (Peppi) which succeeded over expectations. That is why we have
continued to use this method also in later projects that have extended the Peppi ecosystem.
Financial constraints
Our development programme had it’s financial resources exclusively from the owner institutions. That leads
to two things. Firstly, there was no confusion of who is making the decisions: we had the money, we made
the decisions without a need to negotiate in a democratic ‐ yet usually a necessary ‐ process. Secondly, and
more importantly, the amount of money did not allow us to waste time: the high quality results were
urgently needed in a limited time. Table 1 describes the key figures of the development programme
between 2010 and 2016.
Table 1: Development programme in numbers
Programme
members
Budget
(2010
‐
2016)
Documentation
so far (in
pages)
Estimation
of man‐
days used
in the
project
Estimation
of code
lines
created in
the
project
over 100 5‐6
millio
1000‐1200 10000‐ 450 000 ‐
EUNI 190
190
n € 15000 650 000
Technical environment
The Finnish public sector’s system architecture has been focusing on these principles during the last decade:
● Interoperability ‐ service interfaces ● Enterprise Architecture
● National Enterprise Service Bus
● Mobile services
● Open data
● Open source software
As we started our own project we wanted to have an answer to every principle mentioned above. First of all
Peppi ecosystem is made using an only open source software. It is made in SOA fashion which means that all
the thing you can do in a user interface can be made through service interface (REST/JSON or SOAP/XML).
All the services run in ServiceMix 5 which is ESB product. This pretty much answers all the interoperability
issues. These solutions also answer the issues of integrating the services to national ESB because of the usage
of standard interfaces. Peppi ecosystem is also designed by the principles of EA and all the aspects of it have
been taken into account. All Peppi user interfaces are made with responsive web design. This covers the part
that all services can be used with wide range of mobile devices. Also, native applications can be made
because all the services can be accessed through back end application interfaces (REST/JSON). (PEPPI 2016a)
4. THE RESULTS
At the end of 2016 Peppi ecosystem covers all the needed functionalities in the areas of studying, teaching,
and the student administration. As a result, the system architecture is better organized, master data
management and integration management is controlled and well documented, large‐scale reporting is
enabled and the organizations have been able to get rid of the obsoleted systems. Most importantly the new
services are user‐friendly and the system itself has reduced the need for manual work.
As mentioned, Peppi ecosystem has been developed in different projects. Here are explained projects
and services within Peppi ecosystem in short
● Peppi project (2013)
○ Enterprise resource planning
■ Curricula
■ Course planning / management
■ Schedules / room reservations
■ Organisation management eg. teacher resourcing ●
Student registry project (2016)
○ Student information system (SIS)
■ Student registry
■ Assessment / Accomplishment registry
■ Code management
■ Reports (eg. printed certificates and statistical reports)
● Student dashboard project (2016)
○ Personal curriculum management
○ Personal assessments / accomplishments
○ Personal reports
○ Enrollments
○ Personal information management
● Intranet / integrated dashboards project (2016)
○ Intranet
○ Course workspaces
○ Dashboard integrations
● Numerous smaller projects ie. (2013 ‐ 2016)
○ Study‐plan service
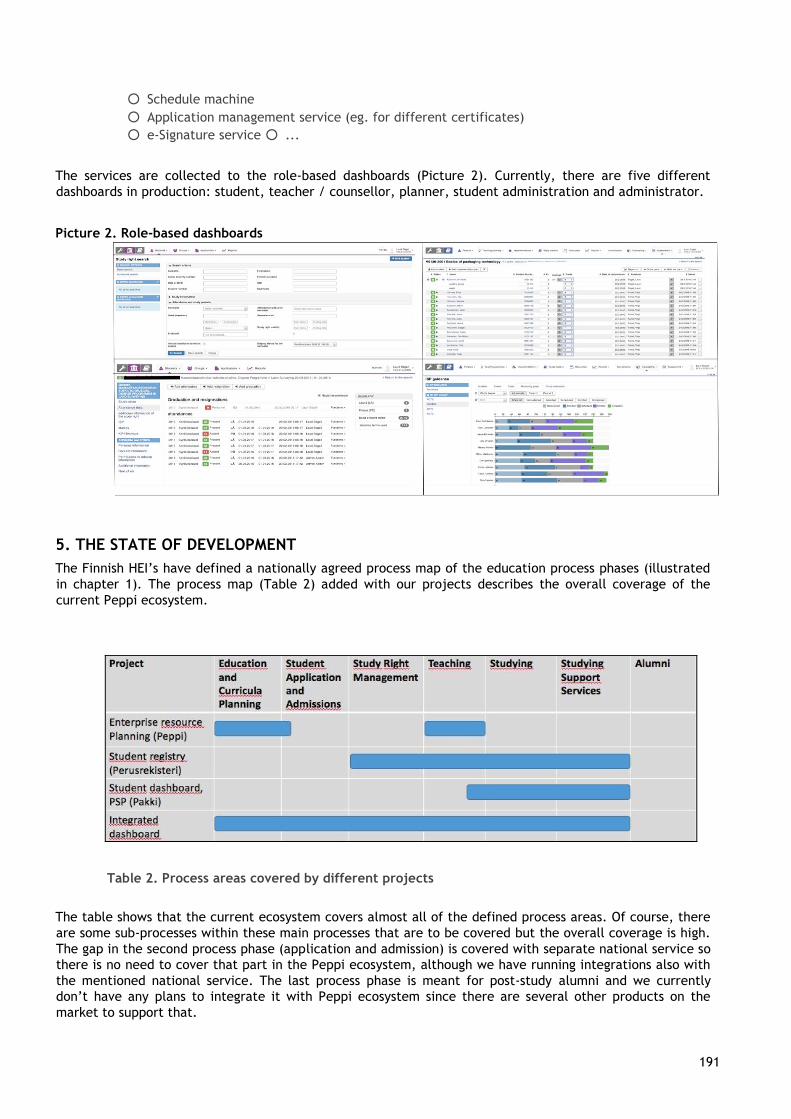
EUNI 191
191
○ Schedule machine
○ Application management service (eg. for different certificates)
○ e‐Signature service ○ ...
The services are collected to the role‐based dashboards (Picture 2). Currently, there are five different
dashboards in production: student, teacher / counsellor, planner, student administration and administrator.
Picture 2. Role‐based dashboards
5. THE STATE OF DEVELOPMENT
The Finnish HEI’s have defined a nationally agreed process map of the education process phases (illustrated
in chapter 1). The process map (Table 2) added with our projects describes the overall coverage of the
current Peppi ecosystem.
Table 2. Process areas covered by different projects
The table shows that the current ecosystem covers almost all of the defined process areas. Of course, there
are some sub‐processes within these main processes that are to be covered but the overall coverage is high.
The gap in the second process phase (application and admission) is covered with separate national service so
there is no need to cover that part in the Peppi ecosystem, although we have running integrations also with
the mentioned national service. The last process phase is meant for post‐study alumni and we currently
don’t have any plans to integrate it with Peppi ecosystem since there are several other products on the
market to support that.
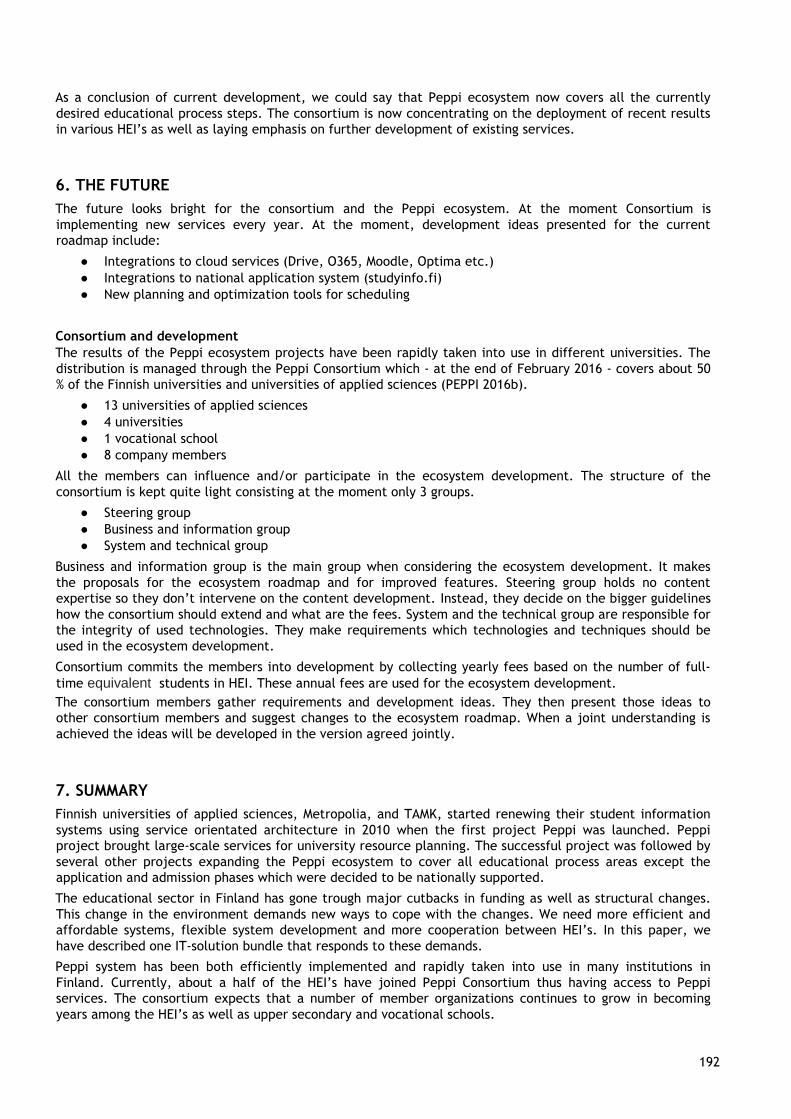
EUNI 192
192
As a conclusion of current development, we could say that Peppi ecosystem now covers all the currently
desired educational process steps. The consortium is now concentrating on the deployment of recent results
in various HEI’s as well as laying emphasis on further development of existing services.
6. THE FUTURE
The future looks bright for the consortium and the Peppi ecosystem. At the moment Consortium is
implementing new services every year. At the moment, development ideas presented for the current
roadmap include:
● Integrations to cloud services (Drive, O365, Moodle, Optima etc.)
● Integrations to national application system (studyinfo.fi)
● New planning and optimization tools for scheduling
Consortium and development
The results of the Peppi ecosystem projects have been rapidly taken into use in different universities. The
distribution is managed through the Peppi Consortium which ‐ at the end of February 2016 ‐ covers about 50
% of the Finnish universities and universities of applied sciences (PEPPI 2016b).
● 13 universities of applied sciences
● 4 universities
● 1 vocational school
● 8 company members
All the members can influence and/or participate in the ecosystem development. The structure of the
consortium is kept quite light consisting at the moment only 3 groups.
● Steering group
● Business and information group
● System and technical group
Business and information group is the main group when considering the ecosystem development. It makes
the proposals for the ecosystem roadmap and for improved features. Steering group holds no content
expertise so they don’t intervene on the content development. Instead, they decide on the bigger guidelines
how the consortium should extend and what are the fees. System and the technical group are responsible for
the integrity of used technologies. They make requirements which technologies and techniques should be
used in the ecosystem development.
Consortium commits the members into development by collecting yearly fees based on the number of full‐
time equivalent students in HEI. These annual fees are used for the ecosystem development.
The consortium members gather requirements and development ideas. They then present those ideas to
other consortium members and suggest changes to the ecosystem roadmap. When a joint understanding is
achieved the ideas will be developed in the version agreed jointly.
7. SUMMARY
Finnish universities of applied sciences, Metropolia, and TAMK, started renewing their student information
systems using service orientated architecture in 2010 when the first project Peppi was launched. Peppi
project brought large‐scale services for university resource planning. The successful project was followed by
several other projects expanding the Peppi ecosystem to cover all educational process areas except the
application and admission phases which were decided to be nationally supported.
The educational sector in Finland has gone trough major cutbacks in funding as well as structural changes.
This change in the environment demands new ways to cope with the changes. We need more efficient and
affordable systems, flexible system development and more cooperation between HEI’s. In this paper, we
have described one IT‐solution bundle that responds to these demands.
Peppi system has been both efficiently implemented and rapidly taken into use in many institutions in
Finland. Currently, about a half of the HEI’s have joined Peppi Consortium thus having access to Peppi
services. The consortium expects that a number of member organizations continues to grow in becoming
years among the HEI’s as well as upper secondary and vocational schools.
EUNI 193
193
The intriguing challenge is how we can keep on developing current and possible new services while
consortium is still in a strong expanding phase. Thus far we have been able to do that, but it is clear we will
continue evaluating both development method and administrative practices regularly in order to answer the
needs of growing community. If ‐ and when ‐ we can do that, the future looks successful for the Peppi
ecosystem.
8. REFERENCES
HAUTAKANGAS, Sami; SAARINEN, VESA: Yliopistojen opintohallinnon tietojärjestelmäselvitys, Minedu 2007.
MINEDU 2016. The higher education in Finland is based on the two‐pilar system consisting of traditional
universities and universities of applied sciences (former polytechnics). University Education in Finland.
Retrieved 29.2.2016, from
http://www.minedu.fi/OPM/Koulutus/yliopistokoulutus/?lang=en
PAKKI 2014. Retrieved 29.2.2016, from
https://wiki.metropolia.fi/display/Pakkiprojekti/Pakkiprojekti
PEPPI 2010. Retrieved 29.2.2016, from https://wiki.metropolia.fi/display/peppi/Peppi+‐+Vaihe+2
PEPPI 2016a. Retrieved 29.2.2016, from http://www.peppi‐konsortio.fi/tekninen.html and
https://wiki.metropolia.fi/display/peppi/2.+Arkkitehtuuri
PEPPI 2016b. Retrieved 29.2.2016, from http://www.peppi‐konsortio.fi/konsortio.html
PERUSREKISTERI 2014. Retrieved 29.2.2016, from
https://wiki.metropolia.fi/display/perusrekisteriprojekti/Perusrekisteriprojekti
PROAMK 2007. Retrieved 29.2.2016, from https://www.proamk.fi/
RAKETTI 2014. Retrieved 29.2.2016, from https://confluence.csc.fi/download/attachments/40568204/OPI‐
loppuraportti_2014‐03‐25_Lopulline n.pdf
STIGELL, Lauri; SORMUNEN, Marko; AUVINEN, Jussi: Opintohallinnon tietojärjestelmäselvitys 2008, University
of Kuopio, 2008.
SYNERGIA 2015. Retrieved 29.2.2016, from
https://confluence.csc.fi/download/attachments/51895485/process%20areas_english.png
9. AUTHOR’S BIOGRAPHIES
Tuomas Orama works as development manager and is the head of the development
unit in Metropolia University of Applied Sciences in Helsinki, Finland. He graduated as
an industrial designer from Kuopio Academy of Design. He has studied also in Institute
of Design and Fine Arts in Lahti university of applied sciences and in università per
stranieri di Perugia. His work experience includes dozens of IT‐projects for more than
a decade. He has worked in several expert positions in national IT‐projects in HE‐level.
Jaakko Rannila works as project manager at Metropolia University of Applied
Sciences in Helsinki, Finland. He has bachelor's degree in science (Industrial
Engineering and Management, Helsinki Stadia polytechnic, 2006). His work
EUNI 194
194
experience includes several IT‐projects varying from SOA‐projects to fully tailored software projects as
well as a large national project involving Education IT‐management. In addition, he has experience in
developing ERP systems and search engine systems in Higher Education, renewing qualification criteria to
upper secondary education in degree programme of
Mika Lavikainen works as project manager at Metropolia University of
Applied Sciences in Helsinki, Finland. He has master’s degree in science (Industrial
Engineering and Management, Lappeenranta University of Technology, 2005). His work
experience includes several IT‐projects varying from CRM‐projects to fully tailored
software as a service projects as well as large EU Framework six projects. In addition
to IT‐based projects he has experience in developing advanced collaborative working
environments (including augmented reality prototyping), Collaborative Networked Organizations (CNO’s) and virtual organizations.
Lauri Stigell in an entrepreneur and owner of Edumate Consulting Ltd. He has
master’s degree in arts (General History, University of Turku 2003). His work
experience includes educational politics, learning and studying development and
several national and university IT‐projects.
EUNI 195
195
Research Software Sustainability is essential to Open Research Recommendations and an update on
developments
Simon Hettrick1, Matthias Katerbow
2, Bas Cordewener
3
1The Software Sustainability Institute (SSI), Edinburgh, United Kingdom, [email protected]
2Deutsche Forschungsgemeinschaft (DFG), Bonn, Germany, [email protected]
3Knowledge
Exchange (KE), Bristol, United Kingdom, [email protected]
Keywords
Research, software, sustainability, preservation, re-usability, reproducibility, infrastructure,
European coordination
1. Summary
A recent Knowledge Exchange workshop on software sustainability recommended a number of technical and
societal changes and the overall need to raise awareness of researchers’ reliance on software. The importance
of these findings and first steps to explore European coordination and cooperation of national initiatives will
be addressed in the presentation.
2. Abstract
Without software, modern research would not be possible. We tend to marvel at results rather than the tools
used for research, which means the fundamental role of software in research has been largely overlooked.
This puts at risk the reliability and reproducibility of research and its results. The practices of software
sustainability minimises these risks and help to increase trust in research results, increase the rate of
discovery, increase return on investment and ensure that research data remains readable and usable for
longer.
A recent Knowledge Exchange workshop on software sustainability recommended a number of technical and
societal changes and the overall need to raise awareness of researchers’ reliance on software. It also led to
steps to explore European coordination and cooperation of national initiatives.
The presentation will explain the value of sustainable software to research, the measures that can support the
sustainability, and the steps currently explored to establish a Software Sustainability Initiative in each
European country and to have these initiatives linked to share knowledge and expertise through a European
Software Sustainability infrastructure. Most of the content of this presentation can be found in a report on the
workshop issued by Knowledge Exchange1
1 Hettrick, S. (2016). Research Software Sustainability Report on a Knowledge Exchange Workshop. Knowledge
Exchange. Retrieved May 10, 2016, from http://www.knowledge-exchange.info/event/software-sustainability
EUNI 196
196
3. Author’s biographies
Simon Hettrick is the Deputy Director of the UK's Software Sustainability Institute. He is responsible for the
Institute's policy team which investigates the use of software in the research community and campaigns for
changes that will improve the software that is used in research. He has a particular interest in the people who
develop software in academia - Research Software Engineers - and has been a passionate advocate for greater
recognition and reward for this group.
Before working for the Institute, Simon conducted research into waveguide lasers, worked as a patent
attorney and then moved into communications. He still considers himself a physicist, but can no longer do
maths.
Dr. Matthias Katerbow is working as a Programme Officer at the “German Research Foundation” (DFG) and he
is responsible for the funding programme e-Research-Technologies. He is also representing the DFG in the
“Knowledge Exchange” initiative. He has a particular interest in the development of information
infrastructure, IT services for science and humanities as well as enabling of Open Scholarship.
Before working for the DFG, Matthias has worked as a linguist at the research center “Deutscher Sprachatlas”
at Marburg University. He received his doctoral degree from the Marburg University for his work on Language
Acquisition and Language Variation. He studied Linguistics, Phonetics, Informatics and Linguistic Engineering.
He is still concerned with research, but without being a researcher.
Bas Cordewener is the Coordinator of Knowledge Exchange, an initiative in which DEFF (Denmark), DFG
(Germany) SURF (Netherlands), Jisc (United Kingdom) and CSC (Finland) work together. Engaged in
establishing, funding and policy development of IT Infrastructures for Higher Education and Research,
Knowledge Exchange partners focus on Open Access, Research Data and Open Scholarship.
Before working for Jisc (who host the Knowledge Exchange office), Bas worked for SURF in several
management positions addressing IT related educational innovation, innovation of research and international
collaboration.
EUNIS-2016-paper-template.doc
197
Identify to simplify: improving interoperability at a national level with the ORCID HUB
1st Michele Mennielli1, 2nd Andrea Bollini
2, 3rd Josh Brown
3, 4th Susanna Mornati
4
1 Cineca, Via Magnanelli 6/3, 40033 Casalecchio di Reno (BO), [email protected] 2 Cineca, Via dei Tizi 6/B, 00185 Roma, [email protected] 3 ORCID, 10411 Motor City Drive, Suite 750, Bethesda MD 208171st, [email protected] 4 Cineca, Via R. Sanzio 4, 20090 Segrate (MI), [email protected]
Keywords
Open Source, ORCID, Interoperability, Standards, DSpace, DSpace-CRIS, IRIS, CRIS.
1. Summary
The ORCID HUB is an open source infrastructure implemented by Cineca that simplifies the
integration of multiple ORCID applications. The Hub is designed originally for national initiatives,
but it can also be adopted for institutions with numerous and complicate applications to be
integrated with ORCID. The Hub provides a dashboard for single researcher to authorize and monitor
the applications to communicate with her ORCID profile. Massive data updating and Reporting are
provided for administrators and managers to easily have an up-to-date and panoramic view of ORCID
data.
2. The ORCID HUB
Italy is home to a remarkable project linking 80% of researchers, including doctoral students, and
their publications, institutionally and in national infrastructures, using ORCID iDs. The project allows
better identification of all Italian researchers and simplifies crucial processes within the research
ecosystem.
In April 2015 Cineca released the first CRIS/ORCID integration for its open source solution
DSpaceCRIS. This was the first (technological) step towards national ORCID adoption. In May 2015 the
Italian Agency for the Evaluation of Universities and Research (ANVUR) announced that they would
Knowledge Exchange Office
C/ O
Jisc, One
Castlepark, Towe
r Hill, Bristol, BS2
0JA
t: +44 203 697
5804 [email protected]
198
use ORCID as the researcher identifier for the National Research Evaluation exercise (VQR), starting
in the Summer of 2015.
ANVUR, with the institutional support of CRUI (the Conference of Rectors of Italian Universities) and
the technological support of Cineca, then founded the I.R.ID.E Project (Italian Researcher Identifier
for Evaluation) to deliver this. In June 2015 Cineca signed a consortium agreement with ORCID, to
allow all Italian member Institutions to access ORCID services.
For this project, Cineca created an ORCID Hub, released as an open-source software in July 2015. By
October 2015 there were over 50,000 ORCID iDs linked to the ORCID HUB and more than 50
applications connected (including the national publication database, IRIS installations, and
thirdparty legacy CRIS systems).
This open-source project has demonstrated the power of the implementation of a unique identifier
for researchers at a national level, generating network effects and showcasing the value of
collaboration between community-led organisations at scale. As a unique identifiers, ORCID provides
a way to distinguish each researcher from every other one and, through integration in key research
workflows, supports automated linkages between researchers and their activities and outputs. The
Hub is a registry that stores all Italian researchers' ORCIDs and the authorisations for applications to
interact with the researcher profile, allowing to register once and get ORCID stored both in the
national database and institutional repositories.
At the moment the Hub is serving the Italian research community but it can be adopted by any other
nation or grouping seeking to embed identifiers in national or large infrastructures. Also single
institutions can benefit from this technology where they can integrate multiple applications with
ORCID in one go.
Before the end of 2015, Cineca made functionality available in DSpace-CRIS to update ORCID profiles
using local data and implemented the full integration of the Cineca’s extended CRIS platform (IRIS)
with ORCID. At the beginning of 2016 Cineca added to DSpace-CRIS the feature to import locally the
biographic data from the ORCID Profile. In the coming months Cineca will upgrade to the ORCID API
v2, define the compliancy with the PTCRIS synchronization framework and add the possibility to
collect information on publications and projects, besides biographic data.
Among the features offered with the ORCID HUB there are:
• Auto-Update functionality for Italian researchers (or any researchers associated with
ORCID through the HUB): data provided by 1 researcher are automatically added to its
collaborators (e.g.: co-author, co-investigator, etc);
• Easy import/export of ORCID information (Biography, Works, Funding) from CSV
format;
• The researcher can authorize at once different applications to interact with ORCID
(local CRIS, a national database, etc.)
• A central database matching “local/national ID” and ORCID which can be accessed
with REST (Data As a Service)
The ORCID hub takes advantage of the functionality of the ORCID member API, but even a subset of
these functions would be a significant benefit to any repository or research management network.
199
3. CONCLUSION
ORCID is becoming an essential infrastructure in the research ecosystem. It is open and free to
researchers and its wide adoption will enhance the interoperability of information and the fluidity of
workflows interconnecting different systems. The potential for new, exciting services is getting
higher. Sustainability provided by institutions and other players will guarantee that ORCID will
remain in the control of the community of scholars. Cineca's ORCID Hub is released as open-source
software and it can be freely adopted by countries and large communities, thanks to impressive
team work between Cineca and ORCID technical staff, representing a contribution to the success of a
free, open, interoperable infrastructure to help illuminate the world of research.
4. REFERENCES
ORCID-HUB: https://github.com/Cineca/OrcidHub
DSpace-CRIS: http://cineca.github.io/dspace-cris/
IRIS: http://www.cineca.it/en/content/iris-institutional-research-information-system
PTCRIS: Mendes Moreira J, Cunha A and Macedo N. An ORCID based synchronization framework for a
national CRIS ecosystem [version 1; referees: 2 approved, 1 approved with reservations].
F1000Research 2015, 4:181 (doi: 10.12688/f1000research.6499.1)
5. AUTHORS’ BIOGRAPHIES
Michele Mennielli works for International Relations and Business Development at Cineca, the Italian
Consortium of University. He is Board Member and Secretary of EUNIS, Board Member Executive for
External Relations at euroCRIS and Member of the DSpace Steering Group.
Andrea Bollini is Deputy leader of International Business Development and Head of Open Source &
Open Standards Strategy at Cineca. He has been responsible for software design and development of
IT solutions for several projects since 2004. He has achieved an extensive experience in setting up
repositories with DSpace software and has been a DSpace committer since January 2007. He is
member of the euroCRIS CERIF Task Group and of the Architecture Task Group. He is now the
responsible for the relation with the open source community and domain communities to preserve
and improve the Cineca positioning, assuring the adherence of Cineca solutions to best practice and
standards.
Education: Master Degree in Applied Mathematics at the University of Rome La Sapienza (Italy) and
Postgraduate Master, II level, in Information & Communication Technology Management at the
University of Milan II (Italy), Sun Certified Java Programmer, Sun Certified Web Component
Developer and Sun Certified Business Component Developer.
Josh Brown directs the operations of ORCID EU and project manages ORCID's work on the THOR
project. Before ORCID, Josh was consortium and operations manager for SCOAP3, programme
manager for digital infrastructure at Jisc, and project officer for SHERPA-LEAP at University College
London. His background is in academic libraries.
Susanna Mornati is Head of International Business Development and she is also leading the Solution
for Institutional Research Department in Cineca. She has been responsible for IT projects and
services for research since 2010. She holds a strong experience in project and program management
in complex environments. She participates as an expert in the activities of several committees and
serves on a number of international scientific boards. She writes and lectures on various aspects of
IT management for research. Main previous positions: Responsible for e-publishing and digital
repositories services at CILEA (2003-2009), Vice Director of Libraries at the University of Insubria
(2002-2003), Director of the Physics Library at the University of Milan (1996-2001), Associate at CERN
Scientific Information Service, Geneva, Switzerland, (1994-1996). Education: Master Degree in
Linguistics at the University of Milan, Postgraduate Master, II level, in Information & Communication
Technology Management at the University of Milan Bicocca, Diplôme de Langue de l'Alliance
Française, English Certificate of Proficiency.
200
Interoperability between Information Systems of Portuguese Higher Education Institutions
EUNIS Elite Award 2016 for excellence in implementing Information Systems for Higher
Education winner
Lígia M. Ribeiro1, Rui H. Pereira
2, Osvaldo Pacheco
3, Mário Bernardes
4, Ricardo T. Martins
5
1 Universidade do Porto, Faculdade de Engenharia, R. Dr. Roberto Frias, 4200-465 Porto, Portugal,
[email protected] 2 Instituto Politécnico do Porto, ISCAP, Portugal, [email protected] 3 Universidade de Aveiro, Departamento de Electrónica, Telecomunicações e Informática, Campus
Universitário de Santiago, 3810-193 Aveiro,Portugal, [email protected] 4 Universidade de Coimbra, Serviço de Gestão de Sistemas de Informação e Infraestruturas de Comunicação R. Arco da Traição, 3000-056 Coimbra, Portugal, [email protected] 5 Universidade de Aveiro, Serviços de Tecnologias de Informação e Comunicação, Campus
Universitário de Santiago, 3810-193 Aveiro, Portugal, [email protected]
Keywords
Interoperability platforms, information systems, cloud computing, electronic administration
1. ABSTRACT
The main thrust of this work is to present an interoperability platform between information
systems of higher education institutions in Portugal and the main advantages and benefits its
use has already allowed within an academic community of about 100,000 users. This
interoperability platform, running on a cloud computing environment, was a major result of
a project called "IES+Perto", meaning "Higher Education Institutions Closer", involving some
of the most prestigious Portuguese universities and the largest polytechnic in the country. It
was developed with a unifying but not intrusive perspective, so that each institution would
continue to be solely responsible for the organization and delivery of its information.
A common mobility strategy for digital content supported by an application for mobile
devices, and a set of services for electronic data transfer between institutions for the
academic processes of student national mobility and joint courses of study, have been
developed using the interoperability platform.
The project IES+Perto and the interoperability platform in particular have contributed very
positively to innovation, administrative modernization and electronic management of the
institutions involved, creating conditions for the extension of services to other higher
education institutions, as has already happened by supporting new initiatives that the
project IES+Perto proponents and other higher education institutions submitted for funding
under a new application to the National Administrative Modernization Support System, which
were approved.
2. OVERVIEW OF THE PROJECT IES+PERTO
The project IES+Perto was a collaborative and resource sharing project between four
Portuguese higher education institutions (HEI), financed with 1.7 million euros by the
National Administrative Modernization Support System (SAMA). The project provides 87,000
students, 6,000 professors and researchers and 3,500 other employees from the universities
of Porto, Aveiro, and Coimbra and the Polytechnic Institute of Porto with new information
technology (IT) services, exploring the benefits of interoperability, open standards and cloud
computing, to advance a development strategy headed for administrative modernization and
rationalization of costs in the higher education context.
201
The project was able to create important synergies not only between the actors directly
implicated in carrying out the project, but also among employees of different departments
of the organizational structure of the partner institutions that have made significant
contributions to the objectives to be achieved, besides other national bodies such as the
National Foundation for Scientific Computation (FCCN), a branch of the National Foundation
for Science and Technology (FCT), and the National Security Office (GNS).
The results of the project highlight a federated cloud computing environment
interconnecting existing private clouds of the partner institutions and, built on top of the
federated cloud, an interoperability platform which enables access, communication and
interaction with the information provided by the information systems of each institution.
This interoperability platform enabled the development of common applications and services
in a fast and efficient way, despite the deep differences in the implementation of the
information systems of each institution.
Taking advantage of the interoperability platform, a common strategy to explore academic
information through mobile devices was designed, resulting in the development of an
application that includes a set of features to facilitate easy access to services of the partner
institutions. It was used furthermore to implement interfaces to enable the electronic data
transfer between institutions for national student mobility programs and joint courses of
study. Aiming for the complete dematerialization of academic processes, an application
library was developed for digital signature with the Citizen Card, looking after the
innovativeness of administrative services and the confidence of stakeholders. Some
preliminary results of the project IES+Perto have been presented in a previous work (Ribeiro
& Valente, 2015).
The developments were carried out using open and interoperability standards to minimize
maintenance costs and future licensing needs and facilitate interconnection with other
applications for higher education.
An inter-institutional cooperation agreement between the partner institutions was
established to ensure governance and shared management of the federated cloud and the
interoperability platform, as well as applications and services it supports or will be
supporting in the future, creating conditions for the extension of services to other higher
education institutions beyond the four already implied, as is already the case.
3. DEVELOPMENT OF AN INTEROPERABILITY PLATFORM
3.1 Context
A consortium of higher education institutions or other sister organizations responsible for
delivering information systems and academic applications for higher education does not exist
in Portugal. Only FCCN, the Portuguese NREN (National Research and Education Network),
provides connectivity services and related applications and services to the academic
community. It follows that each institution develops or acquires its own tailored information
system, although there are specific agreements for the use of information systems developed
in the context of a single institution by other institutions. The existing information systems
are very different in scope, integration capabilities and standards compliance. This scenario
does not favor the ability to share information and services automatically between
institutions. However the demands on higher education have been changing fast, much as a
result of the global economic and financial background, but also due to the rapid pace of
technological advancement. In particular, student mobility and the use of mobile devices are
the “new normal” of operations that challenge higher education IT services.
Aiming to increase the level to which technology is leveraged for the benefit of the academic
community, the partners of the project IES+Perto decided strategically on developing an
interoperability platform between their information systems, bearing in mind its
applicability to other institutions of higher education.
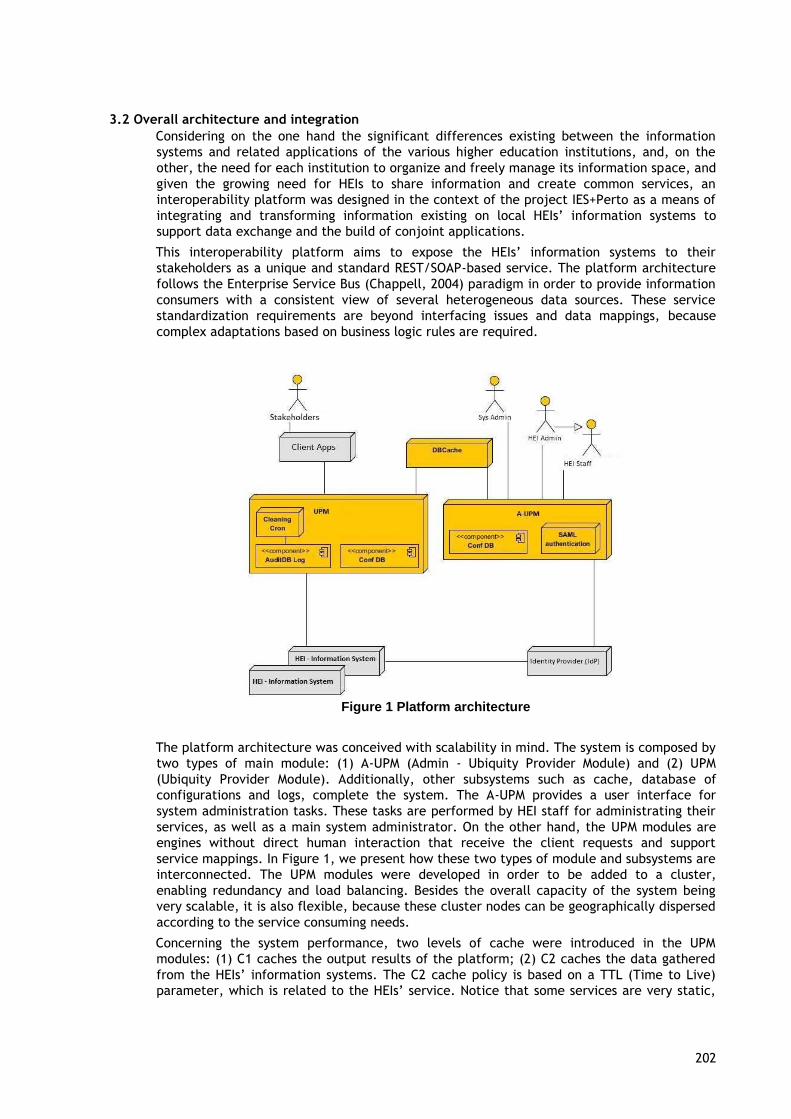
202
3.2 Overall architecture and integration
Considering on the one hand the significant differences existing between the information
systems and related applications of the various higher education institutions, and, on the
other, the need for each institution to organize and freely manage its information space, and
given the growing need for HEIs to share information and create common services, an
interoperability platform was designed in the context of the project IES+Perto as a means of
integrating and transforming information existing on local HEIs’ information systems to
support data exchange and the build of conjoint applications.
This interoperability platform aims to expose the HEIs’ information systems to their
stakeholders as a unique and standard REST/SOAP-based service. The platform architecture
follows the Enterprise Service Bus (Chappell, 2004) paradigm in order to provide information
consumers with a consistent view of several heterogeneous data sources. These service
standardization requirements are beyond interfacing issues and data mappings, because
complex adaptations based on business logic rules are required.
Figure 1 Platform architecture
The platform architecture was conceived with scalability in mind. The system is composed by
two types of main module: (1) A-UPM (Admin - Ubiquity Provider Module) and (2) UPM
(Ubiquity Provider Module). Additionally, other subsystems such as cache, database of
configurations and logs, complete the system. The A-UPM provides a user interface for
system administration tasks. These tasks are performed by HEI staff for administrating their
services, as well as a main system administrator. On the other hand, the UPM modules are
engines without direct human interaction that receive the client requests and support
service mappings. In Figure 1, we present how these two types of module and subsystems are
interconnected. The UPM modules were developed in order to be added to a cluster,
enabling redundancy and load balancing. Besides the overall capacity of the system being
very scalable, it is also flexible, because these cluster nodes can be geographically dispersed
according to the service consuming needs.
Concerning the system performance, two levels of cache were introduced in the UPM
modules: (1) C1 caches the output results of the platform; (2) C2 caches the data gathered
from the HEIs’ information systems. The C2 cache policy is based on a TTL (Time to Live)
parameter, which is related to the HEIs’ service. Notice that some services are very static,
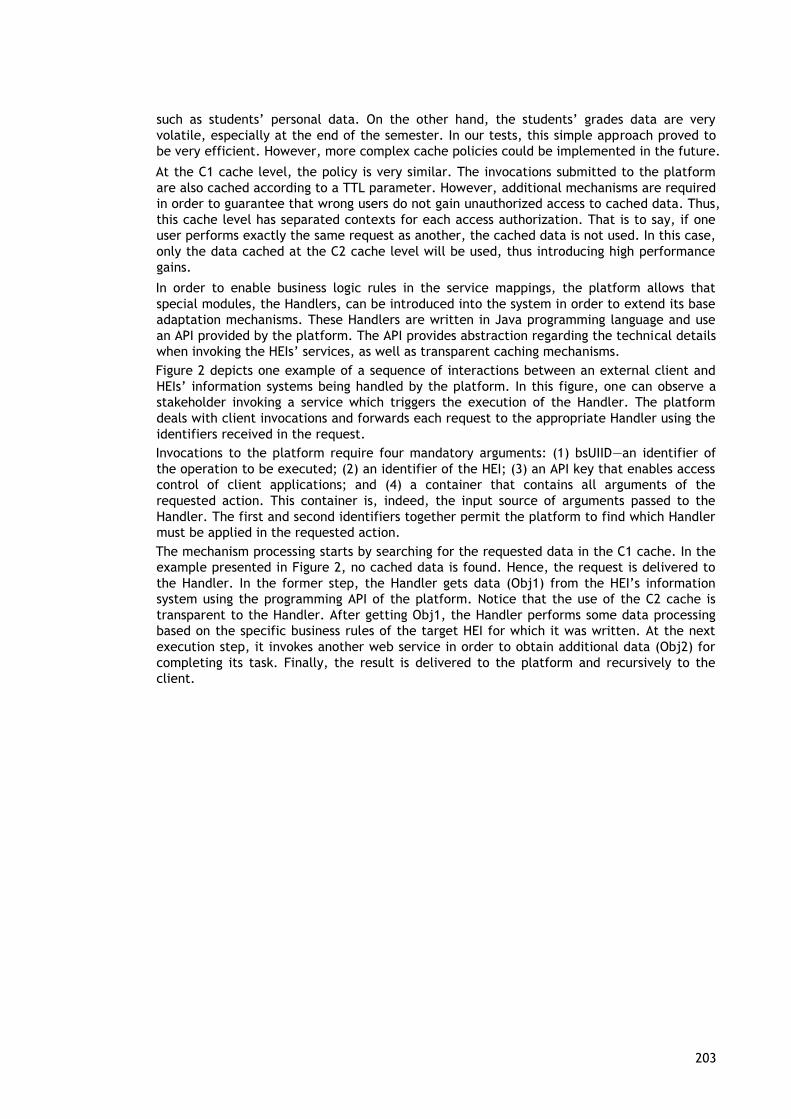
203
such as students’ personal data. On the other hand, the students’ grades data are very
volatile, especially at the end of the semester. In our tests, this simple approach proved to
be very efficient. However, more complex cache policies could be implemented in the future.
At the C1 cache level, the policy is very similar. The invocations submitted to the platform
are also cached according to a TTL parameter. However, additional mechanisms are required
in order to guarantee that wrong users do not gain unauthorized access to cached data. Thus,
this cache level has separated contexts for each access authorization. That is to say, if one
user performs exactly the same request as another, the cached data is not used. In this case,
only the data cached at the C2 cache level will be used, thus introducing high performance
gains.
In order to enable business logic rules in the service mappings, the platform allows that
special modules, the Handlers, can be introduced into the system in order to extend its base
adaptation mechanisms. These Handlers are written in Java programming language and use
an API provided by the platform. The API provides abstraction regarding the technical details
when invoking the HEIs’ services, as well as transparent caching mechanisms.
Figure 2 depicts one example of a sequence of interactions between an external client and
HEIs’ information systems being handled by the platform. In this figure, one can observe a
stakeholder invoking a service which triggers the execution of the Handler. The platform
deals with client invocations and forwards each request to the appropriate Handler using the
identifiers received in the request.
Invocations to the platform require four mandatory arguments: (1) bsUIID—an identifier of
the operation to be executed; (2) an identifier of the HEI; (3) an API key that enables access
control of client applications; and (4) a container that contains all arguments of the
requested action. This container is, indeed, the input source of arguments passed to the
Handler. The first and second identifiers together permit the platform to find which Handler
must be applied in the requested action.
The mechanism processing starts by searching for the requested data in the C1 cache. In the
example presented in Figure 2, no cached data is found. Hence, the request is delivered to
the Handler. In the former step, the Handler gets data (Obj1) from the HEI’s information
system using the programming API of the platform. Notice that the use of the C2 cache is
transparent to the Handler. After getting Obj1, the Handler performs some data processing
based on the specific business rules of the target HEI for which it was written. At the next
execution step, it invokes another web service in order to obtain additional data (Obj2) for
completing its task. Finally, the result is delivered to the platform and recursively to the
client.
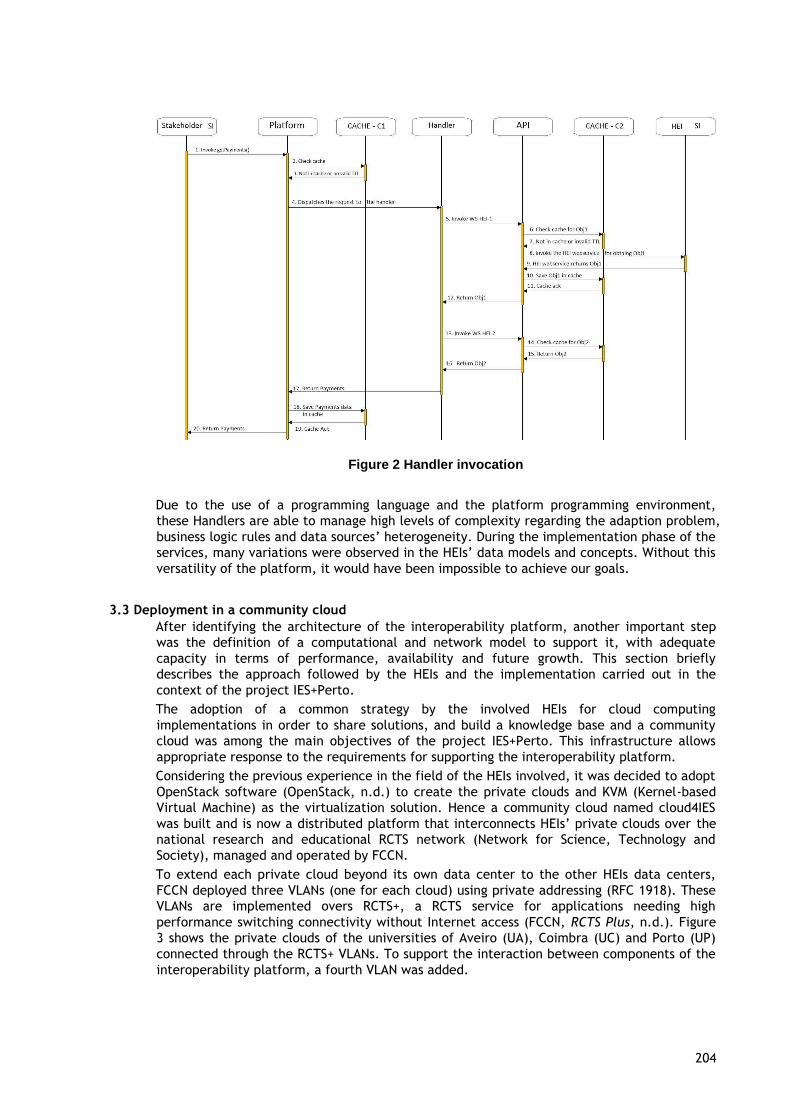
204
Figure 2 Handler invocation
Due to the use of a programming language and the platform programming environment,
these Handlers are able to manage high levels of complexity regarding the adaption problem,
business logic rules and data sources’ heterogeneity. During the implementation phase of the
services, many variations were observed in the HEIs’ data models and concepts. Without this
versatility of the platform, it would have been impossible to achieve our goals.
3.3 Deployment in a community cloud
After identifying the architecture of the interoperability platform, another important step
was the definition of a computational and network model to support it, with adequate
capacity in terms of performance, availability and future growth. This section briefly
describes the approach followed by the HEIs and the implementation carried out in the
context of the project IES+Perto.
The adoption of a common strategy by the involved HEIs for cloud computing
implementations in order to share solutions, and build a knowledge base and a community
cloud was among the main objectives of the project IES+Perto. This infrastructure allows
appropriate response to the requirements for supporting the interoperability platform.
Considering the previous experience in the field of the HEIs involved, it was decided to adopt
OpenStack software (OpenStack, n.d.) to create the private clouds and KVM (Kernel-based
Virtual Machine) as the virtualization solution. Hence a community cloud named cloud4IES
was built and is now a distributed platform that interconnects HEIs’ private clouds over the
national research and educational RCTS network (Network for Science, Technology and
Society), managed and operated by FCCN.
To extend each private cloud beyond its own data center to the other HEIs data centers,
FCCN deployed three VLANs (one for each cloud) using private addressing (RFC 1918). These
VLANs are implemented overs RCTS+, a RCTS service for applications needing high
performance switching connectivity without Internet access (FCCN, RCTS Plus, n.d.). Figure
3 shows the private clouds of the universities of Aveiro (UA), Coimbra (UC) and Porto (UP)
connected through the RCTS+ VLANs. To support the interaction between components of the
interoperability platform, a fourth VLAN was added.
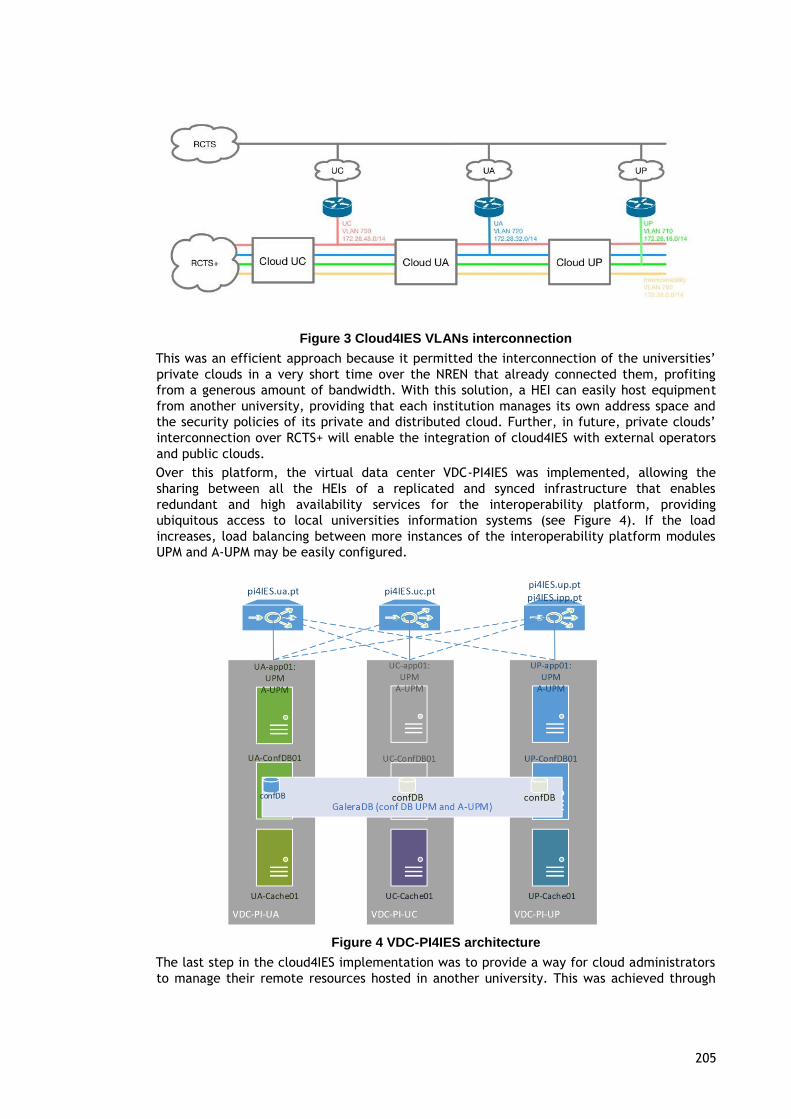
205
Figure 3 Cloud4IES VLANs interconnection
This was an efficient approach because it permitted the interconnection of the universities’
private clouds in a very short time over the NREN that already connected them, profiting
from a generous amount of bandwidth. With this solution, a HEI can easily host equipment
from another university, providing that each institution manages its own address space and
the security policies of its private and distributed cloud. Further, in future, private clouds’
interconnection over RCTS+ will enable the integration of cloud4IES with external operators
and public clouds.
Over this platform, the virtual data center VDC-PI4IES was implemented, allowing the
sharing between all the HEIs of a replicated and synced infrastructure that enables
redundant and high availability services for the interoperability platform, providing
ubiquitous access to local universities information systems (see Figure 4). If the load
increases, load balancing between more instances of the interoperability platform modules
UPM and A-UPM may be easily configured.
Figure 4 VDC-PI4IES architecture
The last step in the cloud4IES implementation was to provide a way for cloud administrators
to manage their remote resources hosted in another university. This was achieved through
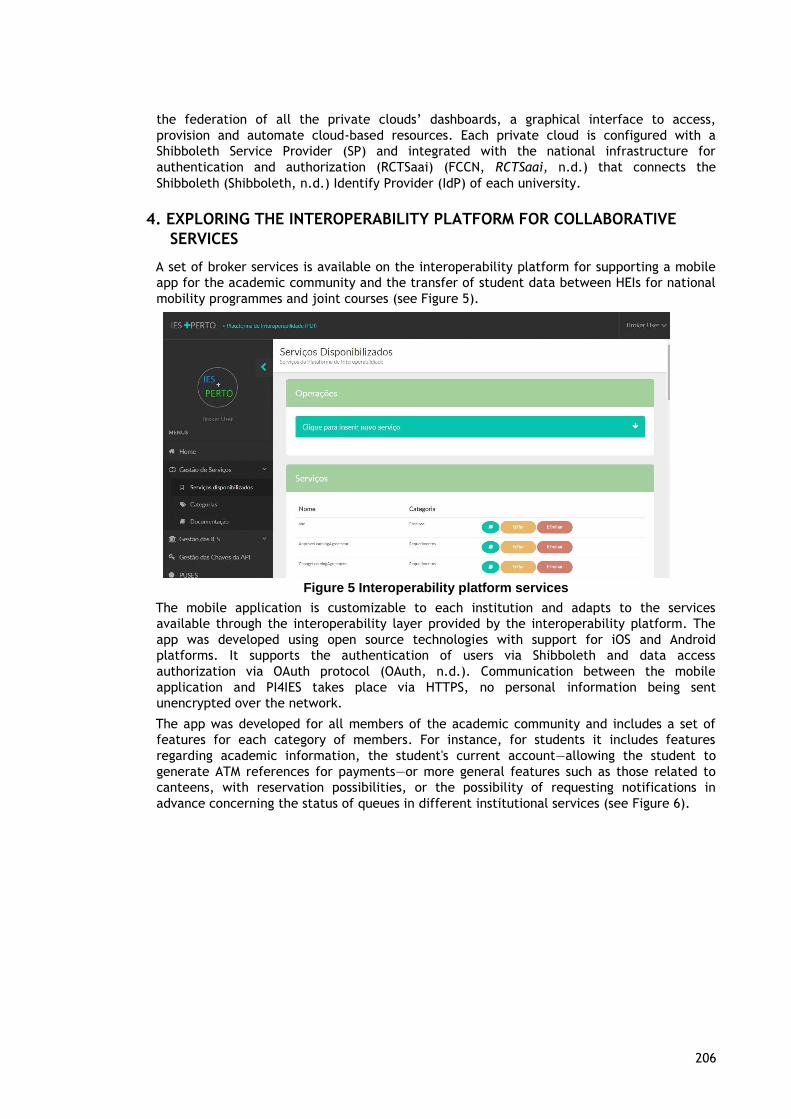
206
the federation of all the private clouds’ dashboards, a graphical interface to access,
provision and automate cloud-based resources. Each private cloud is configured with a
Shibboleth Service Provider (SP) and integrated with the national infrastructure for
authentication and authorization (RCTSaai) (FCCN, RCTSaai, n.d.) that connects the
Shibboleth (Shibboleth, n.d.) Identify Provider (IdP) of each university.
4. EXPLORING THE INTEROPERABILITY PLATFORM FOR COLLABORATIVE
SERVICES
A set of broker services is available on the interoperability platform for supporting a mobile
app for the academic community and the transfer of student data between HEIs for national
mobility programmes and joint courses (see Figure 5).
Figure 5 Interoperability platform services
The mobile application is customizable to each institution and adapts to the services
available through the interoperability layer provided by the interoperability platform. The
app was developed using open source technologies with support for iOS and Android
platforms. It supports the authentication of users via Shibboleth and data access
authorization via OAuth protocol (OAuth, n.d.). Communication between the mobile
application and PI4IES takes place via HTTPS, no personal information being sent
unencrypted over the network.
The app was developed for all members of the academic community and includes a set of
features for each category of members. For instance, for students it includes features
regarding academic information, the student's current account—allowing the student to
generate ATM references for payments—or more general features such as those related to
canteens, with reservation possibilities, or the possibility of requesting notifications in
advance concerning the status of queues in different institutional services (see Figure 6).
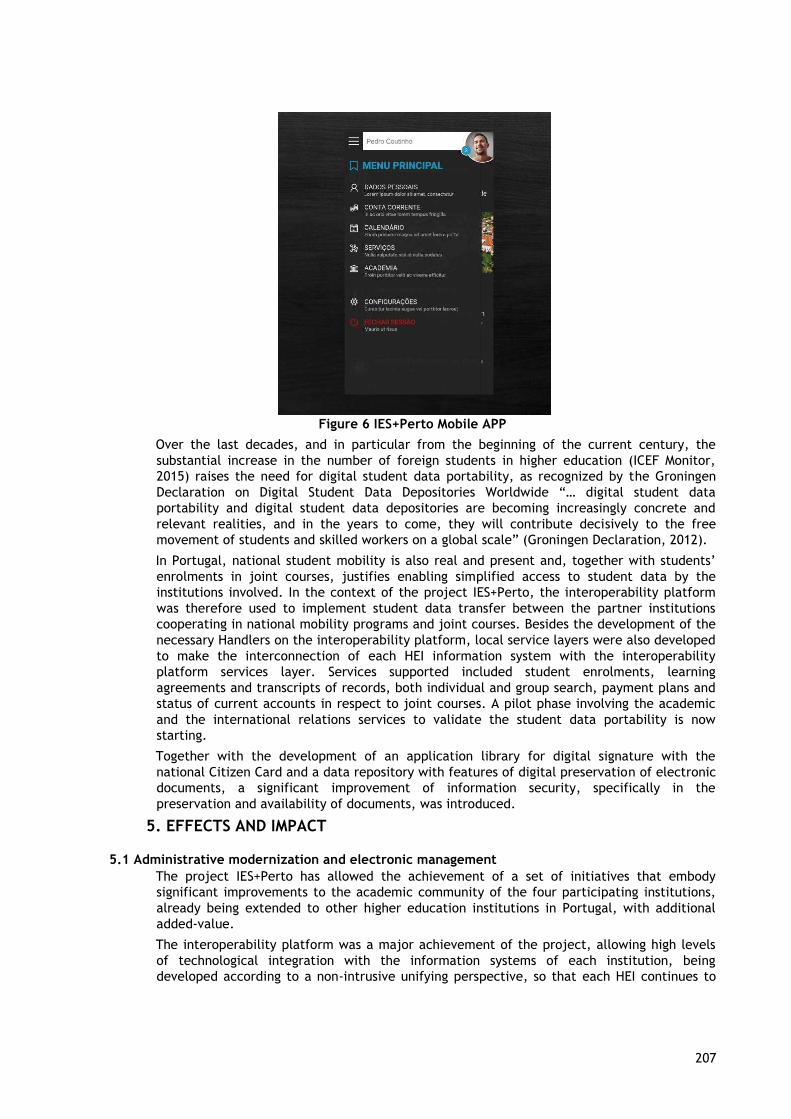
207
Figure 6 IES+Perto Mobile APP
Over the last decades, and in particular from the beginning of the current century, the
substantial increase in the number of foreign students in higher education (ICEF Monitor,
2015) raises the need for digital student data portability, as recognized by the Groningen
Declaration on Digital Student Data Depositories Worldwide “… digital student data
portability and digital student data depositories are becoming increasingly concrete and
relevant realities, and in the years to come, they will contribute decisively to the free
movement of students and skilled workers on a global scale” (Groningen Declaration, 2012).
In Portugal, national student mobility is also real and present and, together with students’
enrolments in joint courses, justifies enabling simplified access to student data by the
institutions involved. In the context of the project IES+Perto, the interoperability platform
was therefore used to implement student data transfer between the partner institutions
cooperating in national mobility programs and joint courses. Besides the development of the
necessary Handlers on the interoperability platform, local service layers were also developed
to make the interconnection of each HEI information system with the interoperability
platform services layer. Services supported included student enrolments, learning
agreements and transcripts of records, both individual and group search, payment plans and
status of current accounts in respect to joint courses. A pilot phase involving the academic
and the international relations services to validate the student data portability is now
starting.
Together with the development of an application library for digital signature with the
national Citizen Card and a data repository with features of digital preservation of electronic
documents, a significant improvement of information security, specifically in the
preservation and availability of documents, was introduced.
5. EFFECTS AND IMPACT
5.1 Administrative modernization and electronic management
The project IES+Perto has allowed the achievement of a set of initiatives that embody
significant improvements to the academic community of the four participating institutions,
already being extended to other higher education institutions in Portugal, with additional
added-value.
The interoperability platform was a major achievement of the project, allowing high levels
of technological integration with the information systems of each institution, being
developed according to a non-intrusive unifying perspective, so that each HEI continues to
208
be responsible for organizing its own information. This makes possible the fast and smooth
further development of common applications and services for HEIs.
The application for mobile devices built on top of the interoperability platform allows the
interaction of the academic community with the respective institutional services, thus
obviating travel needs at a physical counter. Furthermore, the design and implementation of
targeted services for mobile platforms, exploiting open standards and interoperability, entail
immediate benefits to all the national academic community, including the approximately
300,000 students in public higher education. Apart from these, the solution will also provide
obvious benefits to third parties with which the HEIs interact.
As far as we are aware, the electronic transfer of student data implemented using the
interoperability platform for national mobility programs and joint courses was the first effort
of electronic transfer of data between higher education institutions in Portugal for academic
purposes, translating into efficiency gains in service to the community.
In addition, the application library implemented a digital signature with the national Citizen
Card, contributing to the dematerialisation of processes, this being a main driver for
improvements in the quality of service to the community and the increase of the confidence
of stakeholders.
Therefore the results achieved have a significant impact on the internal services of the HEIs.
This impact is realized in a further simplification and dematerialisation of processes by
exploiting new service models supported by IT, linking the virtual and face-to-face service
channels.
5.2 Innovation and best practices
The interoperability platform developed in the context of the IES+Perto project is the result
of an innovative initiative that, at the same time, implemented several best practices. In
fact, it is the first time in Portugal that four HIEs gathered to form a consortium not for
research purposes, but for building a platform that is intended to address common needs. To
ensure the future management of the platform, the involved HIEs signed a protocol that
creates an administrative board to produce regulation and evaluate new members, and also
a technical board, formed by specialists of each institution. This way, no extra costs will be
involved in the management of the platform.
The interoperability platform, completely implemented with open source tools and following
open standards, also constitutes a useful case in the adoption of several best practices. First,
the optimization resulting from sharing computational resources in a cloud computing
environment should be highlighted. Secondly, the sharing of human resources and their
expertise has also led to substantial benefits, integrating technical teams and enabling
collaboration in the development of new projects.
Finally, by running business processes over the interoperability platform, there is a clear
improvement in the quality of service of the involved institutions, dematerializing the
exchange of information and reducing overall operational costs.
In the context of ICT, interoperability is commonly accepted as bringing innovation, although
the correlation between interoperability and innovation is complex, interoperability being a
very context-specific concept (Gasser & Palfrey, 2007). We argue that the interoperability
platform developed in the context of project IES+Perto actually conveyed innovation
because it allows seamless data integration and transmission between academic institutions,
facilitating the development of new services to the users. In particular, it allows the
promotion of new services aimed at mobile platforms, offering up a distinctive application
that reveals a competitive advantage not only in the public context but also the private. Also,
both the use of open source technologies and standards and the agreement established
between the partner institutions to maintain and develop further the federated cloud and
the interoperability platform built on top of it assure the sustainability of these resources
and the prospect of the innovation continuum. To the extent that cloud interoperability is a
challenging issue and many obstacles still exist (Toosi, Calheiros, & Buyya, 2014) we can also
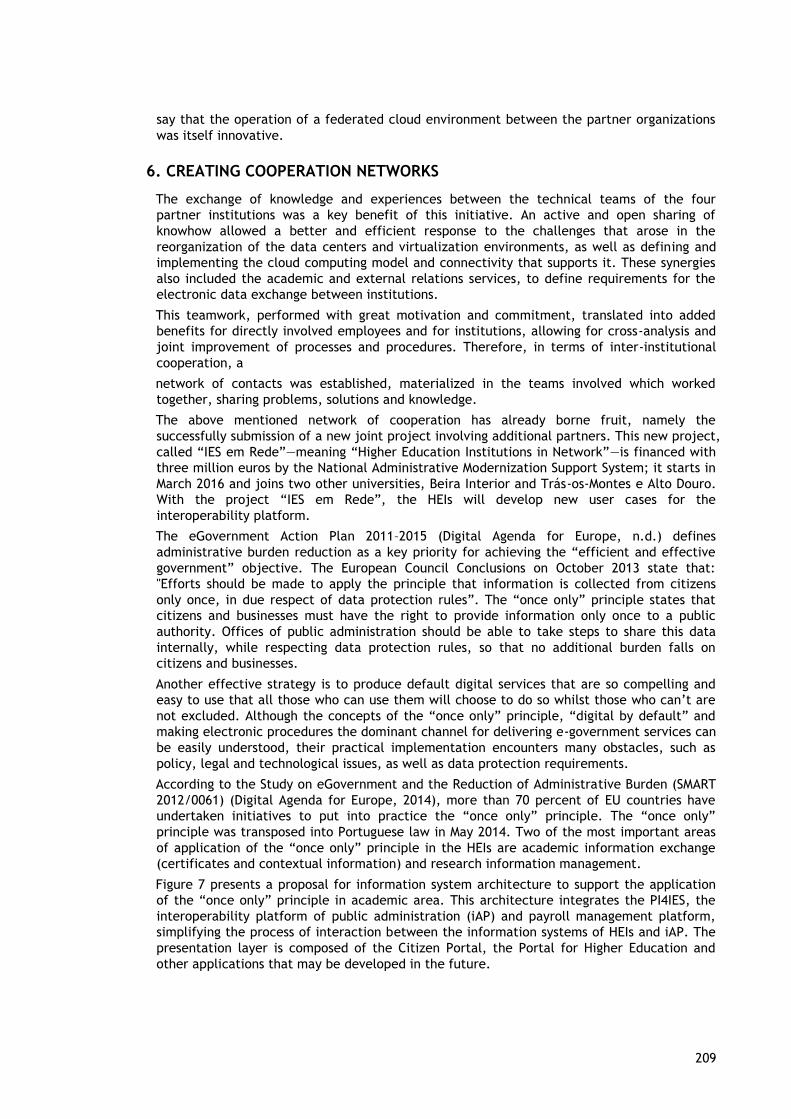
209
say that the operation of a federated cloud environment between the partner organizations
was itself innovative.
6. CREATING COOPERATION NETWORKS
The exchange of knowledge and experiences between the technical teams of the four
partner institutions was a key benefit of this initiative. An active and open sharing of
knowhow allowed a better and efficient response to the challenges that arose in the
reorganization of the data centers and virtualization environments, as well as defining and
implementing the cloud computing model and connectivity that supports it. These synergies
also included the academic and external relations services, to define requirements for the
electronic data exchange between institutions.
This teamwork, performed with great motivation and commitment, translated into added
benefits for directly involved employees and for institutions, allowing for cross-analysis and
joint improvement of processes and procedures. Therefore, in terms of inter-institutional
cooperation, a
network of contacts was established, materialized in the teams involved which worked
together, sharing problems, solutions and knowledge.
The above mentioned network of cooperation has already borne fruit, namely the
successfully submission of a new joint project involving additional partners. This new project,
called “IES em Rede”—meaning “Higher Education Institutions in Network”—is financed with
three million euros by the National Administrative Modernization Support System; it starts in
March 2016 and joins two other universities, Beira Interior and Trás-os-Montes e Alto Douro.
With the project “IES em Rede”, the HEIs will develop new user cases for the
interoperability platform.
The eGovernment Action Plan 2011–2015 (Digital Agenda for Europe, n.d.) defines
administrative burden reduction as a key priority for achieving the “efficient and effective
government” objective. The European Council Conclusions on October 2013 state that:
"Efforts should be made to apply the principle that information is collected from citizens
only once, in due respect of data protection rules”. The “once only” principle states that
citizens and businesses must have the right to provide information only once to a public
authority. Offices of public administration should be able to take steps to share this data
internally, while respecting data protection rules, so that no additional burden falls on
citizens and businesses.
Another effective strategy is to produce default digital services that are so compelling and
easy to use that all those who can use them will choose to do so whilst those who can’t are
not excluded. Although the concepts of the “once only” principle, “digital by default” and
making electronic procedures the dominant channel for delivering e-government services can
be easily understood, their practical implementation encounters many obstacles, such as
policy, legal and technological issues, as well as data protection requirements.
According to the Study on eGovernment and the Reduction of Administrative Burden (SMART
2012/0061) (Digital Agenda for Europe, 2014), more than 70 percent of EU countries have
undertaken initiatives to put into practice the “once only” principle. The “once only”
principle was transposed into Portuguese law in May 2014. Two of the most important areas
of application of the “once only” principle in the HEIs are academic information exchange
(certificates and contextual information) and research information management.
Figure 7 presents a proposal for information system architecture to support the application
of the “once only” principle in academic area. This architecture integrates the PI4IES, the
interoperability platform of public administration (iAP) and payroll management platform,
simplifying the process of interaction between the information systems of HEIs and iAP. The
presentation layer is composed of the Citizen Portal, the Portal for Higher Education and
other applications that may be developed in the future.
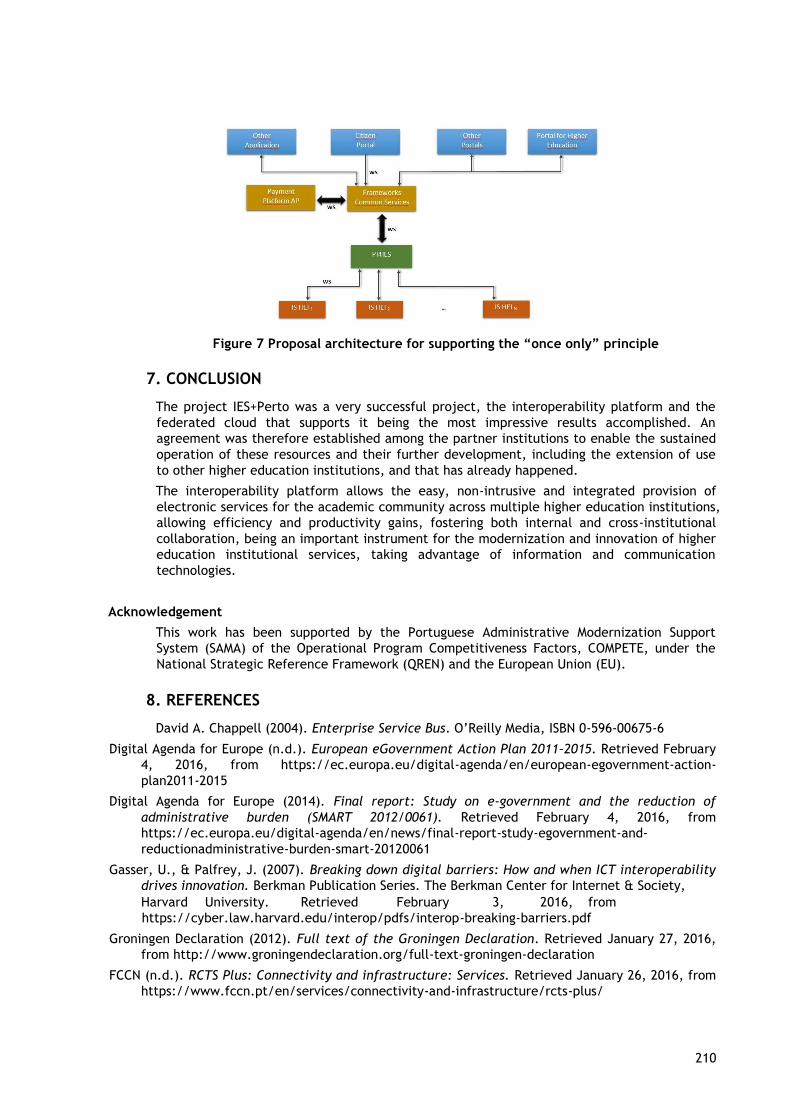
210
Figure 7 Proposal architecture for supporting the “once only” principle
7. CONCLUSION
The project IES+Perto was a very successful project, the interoperability platform and the
federated cloud that supports it being the most impressive results accomplished. An
agreement was therefore established among the partner institutions to enable the sustained
operation of these resources and their further development, including the extension of use
to other higher education institutions, and that has already happened.
The interoperability platform allows the easy, non-intrusive and integrated provision of
electronic services for the academic community across multiple higher education institutions,
allowing efficiency and productivity gains, fostering both internal and cross-institutional
collaboration, being an important instrument for the modernization and innovation of higher
education institutional services, taking advantage of information and communication
technologies.
Acknowledgement
This work has been supported by the Portuguese Administrative Modernization Support
System (SAMA) of the Operational Program Competitiveness Factors, COMPETE, under the
National Strategic Reference Framework (QREN) and the European Union (EU).
8. REFERENCES
David A. Chappell (2004). Enterprise Service Bus. O’Reilly Media, ISBN 0-596-00675-6
Digital Agenda for Europe (n.d.). European eGovernment Action Plan 2011–2015. Retrieved February
4, 2016, from https://ec.europa.eu/digital-agenda/en/european-egovernment-action-
plan2011-2015
Digital Agenda for Europe (2014). Final report: Study on e-government and the reduction of
administrative burden (SMART 2012/0061). Retrieved February 4, 2016, from
https://ec.europa.eu/digital-agenda/en/news/final-report-study-egovernment-and-
reductionadministrative-burden-smart-20120061
Gasser, U., & Palfrey, J. (2007). Breaking down digital barriers: How and when ICT interoperability
drives innovation. Berkman Publication Series. The Berkman Center for Internet & Society,
Harvard University. Retrieved February 3, 2016, from
https://cyber.law.harvard.edu/interop/pdfs/interop-breaking-barriers.pdf
Groningen Declaration (2012). Full text of the Groningen Declaration. Retrieved January 27, 2016,
from http://www.groningendeclaration.org/full-text-groningen-declaration
FCCN (n.d.). RCTS Plus: Connectivity and infrastructure: Services. Retrieved January 26, 2016, from
https://www.fccn.pt/en/services/connectivity-and-infrastructure/rcts-plus/
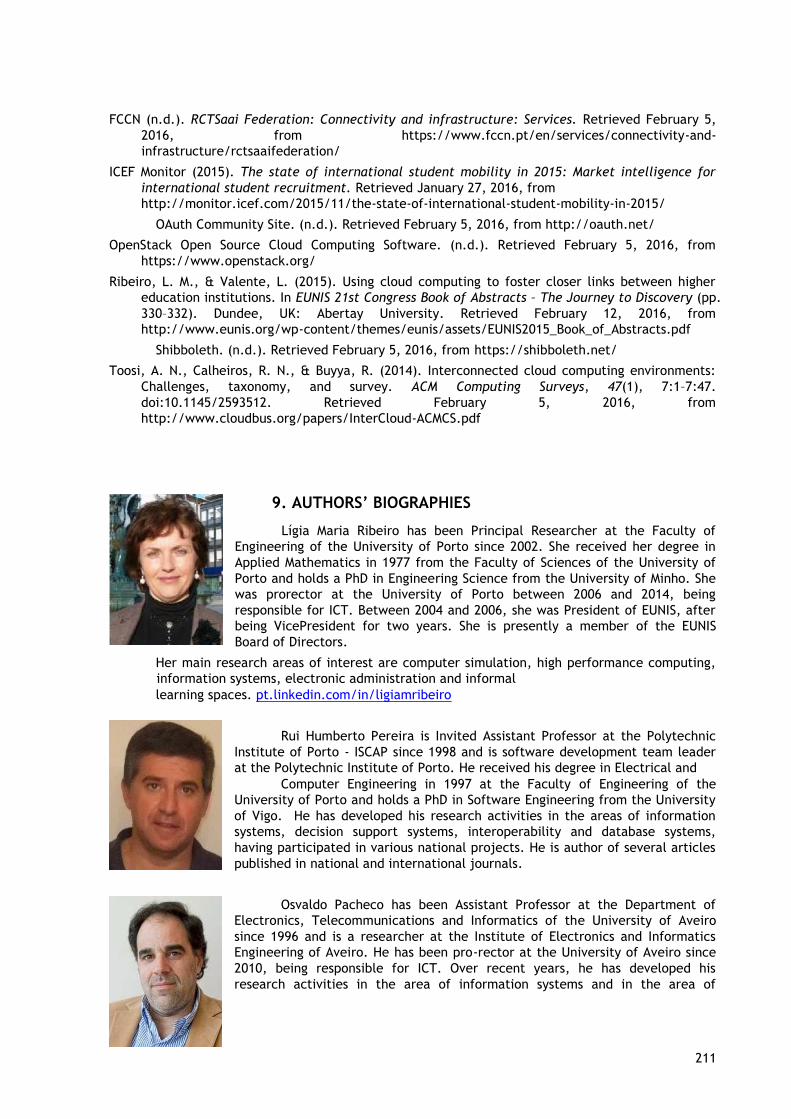
211
FCCN (n.d.). RCTSaai Federation: Connectivity and infrastructure: Services. Retrieved February 5,
2016, from https://www.fccn.pt/en/services/connectivity-and-
infrastructure/rctsaaifederation/
ICEF Monitor (2015). The state of international student mobility in 2015: Market intelligence for
international student recruitment. Retrieved January 27, 2016, from
http://monitor.icef.com/2015/11/the-state-of-international-student-mobility-in-2015/
OAuth Community Site. (n.d.). Retrieved February 5, 2016, from http://oauth.net/
OpenStack Open Source Cloud Computing Software. (n.d.). Retrieved February 5, 2016, from
https://www.openstack.org/
Ribeiro, L. M., & Valente, L. (2015). Using cloud computing to foster closer links between higher
education institutions. In EUNIS 21st Congress Book of Abstracts – The Journey to Discovery (pp.
330–332). Dundee, UK: Abertay University. Retrieved February 12, 2016, from
http://www.eunis.org/wp-content/themes/eunis/assets/EUNIS2015_Book_of_Abstracts.pdf
Shibboleth. (n.d.). Retrieved February 5, 2016, from https://shibboleth.net/
Toosi, A. N., Calheiros, R. N., & Buyya, R. (2014). Interconnected cloud computing environments:
Challenges, taxonomy, and survey. ACM Computing Surveys, 47(1), 7:1–7:47.
doi:10.1145/2593512. Retrieved February 5, 2016, from
http://www.cloudbus.org/papers/InterCloud-ACMCS.pdf
9. AUTHORS’ BIOGRAPHIES
Lígia Maria Ribeiro has been Principal Researcher at the Faculty of
Engineering of the University of Porto since 2002. She received her degree in
Applied Mathematics in 1977 from the Faculty of Sciences of the University of
Porto and holds a PhD in Engineering Science from the University of Minho. She
was prorector at the University of Porto between 2006 and 2014, being
responsible for ICT. Between 2004 and 2006, she was President of EUNIS, after
being VicePresident for two years. She is presently a member of the EUNIS
Board of Directors.
Her main research areas of interest are computer simulation, high performance computing,
information systems, electronic administration and informal
learning spaces. pt.linkedin.com/in/ligiamribeiro
Rui Humberto Pereira is Invited Assistant Professor at the Polytechnic
Institute of Porto - ISCAP since 1998 and is software development team leader
at the Polytechnic Institute of Porto. He received his degree in Electrical and
Computer Engineering in 1997 at the Faculty of Engineering of the
University of Porto and holds a PhD in Software Engineering from the University
of Vigo. He has developed his research activities in the areas of information
systems, decision support systems, interoperability and database systems,
having participated in various national projects. He is author of several articles
published in national and international journals.
Osvaldo Pacheco has been Assistant Professor at the Department of
Electronics, Telecommunications and Informatics of the University of Aveiro
since 1996 and is a researcher at the Institute of Electronics and Informatics
Engineering of Aveiro. He has been pro-rector at the University of Aveiro since
2010, being responsible for ICT. Over recent years, he has developed his
research activities in the area of information systems and in the area of
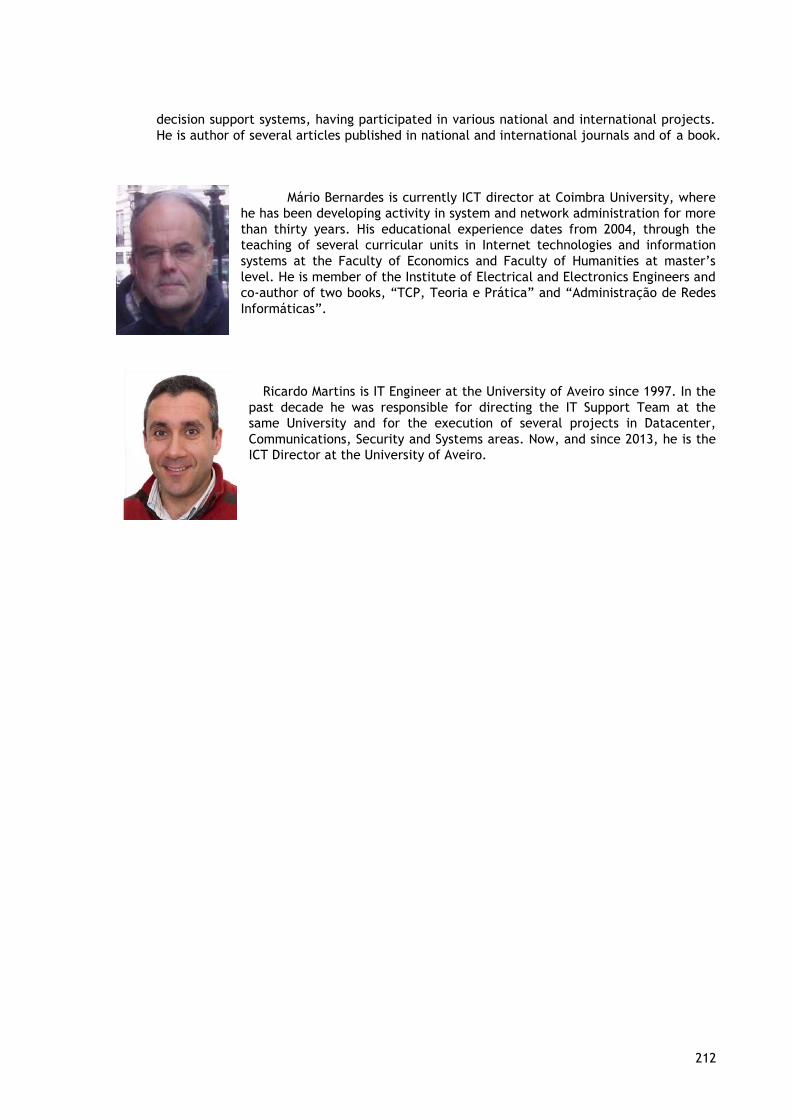
212
decision support systems, having participated in various national and international projects.
He is author of several articles published in national and international journals and of a book.
Mário Bernardes is currently ICT director at Coimbra University, where
he has been developing activity in system and network administration for more
than thirty years. His educational experience dates from 2004, through the
teaching of several curricular units in Internet technologies and information
systems at the Faculty of Economics and Faculty of Humanities at master’s
level. He is member of the Institute of Electrical and Electronics Engineers and
co-author of two books, “TCP, Teoria e Prática” and “Administração de Redes
Informáticas”.
Ricardo Martins is IT Engineer at the University of Aveiro since 1997. In the
past decade he was responsible for directing the IT Support Team at the
same University and for the execution of several projects in Datacenter,
Communications, Security and Systems areas. Now, and since 2013, he is the
ICT Director at the University of Aveiro.
213
Interoperability + semantics = check! Smart and Cost Effective Data Modelling and Tools of
the Future Suvi Remes1, Miika Alonen2, Patrik Maltusch3, Mikael af Hällström4
1 CSC – IT Center for Science, Keilaranta 14, FIN-02101 Espoo, [email protected] 2 CSC – IT Center for Science, Keilaranta 14, FIN-02101 Espoo, [email protected] 3 Aalto University, PO BOX 11000, FIN-00076 Aalto, [email protected]
4Finnish Tax Administration, PO BOX 325, FIN-00052 Vero, [email protected]
Keywords
semantic interoperability, terminological theory, linked data, metadata, data modelling
1. SUMMARY
The more we rely on digitalisation in our transaction and businesses, the more we need to
ensure that machine to machine communication can take place at high speed. Still,
interoperability of information systems and the lack of shared semantics, both between
humans and machines, is an internationally recognised issue. Information systems in the
Finnish higher education sector, in the field where decentralisation of information systems is
preferred, are not an exception. Semantic interoperability will enable higher education
institutions wide cost benefits in relation of 1:38 at the national level.
In Finland we are in the process of implementing information systems and harmonising the
legacy data models in the way that makes use of the shared semantics, standards and other
best practices according to the common architectural vision. This basic infrastructure for
information management is built by combining terminological theory, linked data and
adaptable data modelling practices.
2. SMART AND COST EFFECTIVE DATA MODELLING
AND TOOLS OF THE FUTURE
When you “talk the talk” you need to “walk the walk” it’s a common phrase you hear. The
new approach we have to data management and interoperability is a mix of some existing
elements with previously untapped potential, e.g. use of semantic technologies and linked
data in the Finnish higher education sector. It forms a structured, common architecture
frame connecting conceptual modelling of business, services and processes to defining and
maintaining controlled terminology and further to constructing data models for information
systems.
Many efforts have been made trying to define best practices and guidelines for
interoperability; one of the most effective being RAKETTI-project (Information Services as
Part of the HEIs’ Structural Reform) during the years 2008-2014. The results, however,
support mainly data storage, data collection and reporting activities based on a strictly
normalised data model. Typically architecture of higher education information systems is
based on traditional databases which have their own data models and terminology and
moving the data from one information system to another requires high cost expert labor
work.
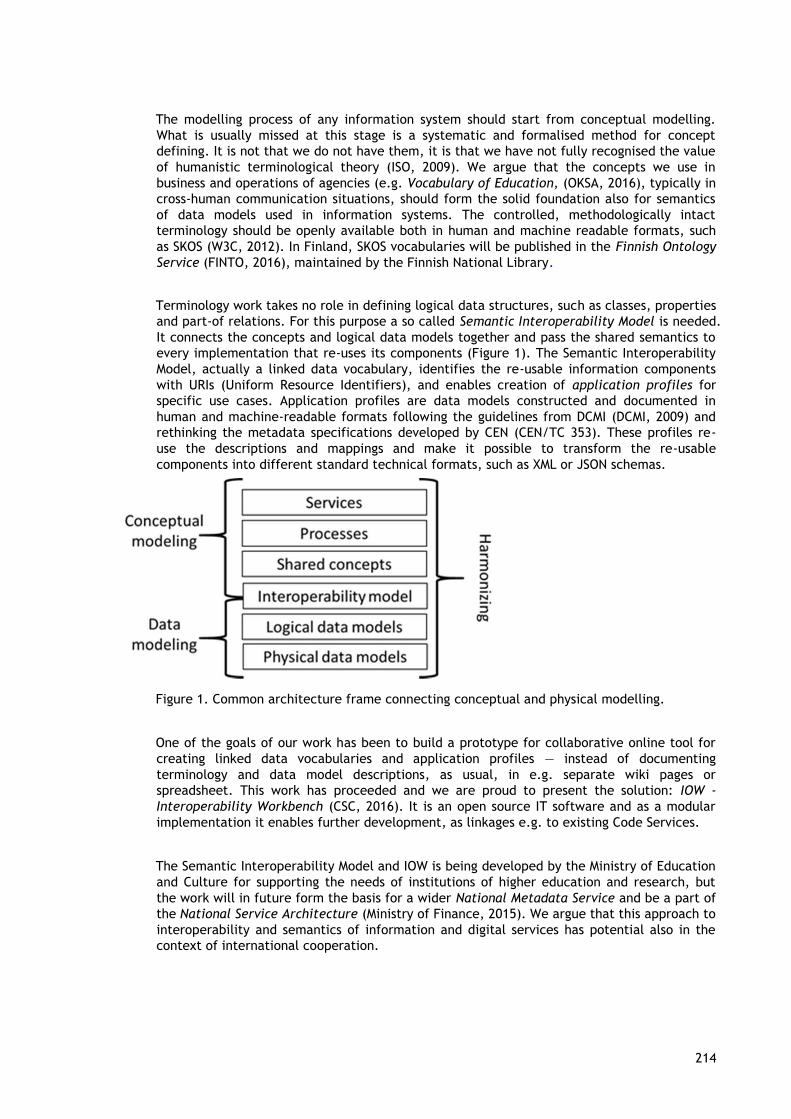
214
The modelling process of any information system should start from conceptual modelling.
What is usually missed at this stage is a systematic and formalised method for concept
defining. It is not that we do not have them, it is that we have not fully recognised the value
of humanistic terminological theory (ISO, 2009). We argue that the concepts we use in
business and operations of agencies (e.g. Vocabulary of Education, (OKSA, 2016), typically in
cross-human communication situations, should form the solid foundation also for semantics
of data models used in information systems. The controlled, methodologically intact
terminology should be openly available both in human and machine readable formats, such
as SKOS (W3C, 2012). In Finland, SKOS vocabularies will be published in the Finnish Ontology
Service (FINTO, 2016), maintained by the Finnish National Library.
Terminology work takes no role in defining logical data structures, such as classes, properties
and part-of relations. For this purpose a so called Semantic Interoperability Model is needed.
It connects the concepts and logical data models together and pass the shared semantics to
every implementation that re-uses its components (Figure 1). The Semantic Interoperability
Model, actually a linked data vocabulary, identifies the re-usable information components
with URIs (Uniform Resource Identifiers), and enables creation of application profiles for
specific use cases. Application profiles are data models constructed and documented in
human and machine-readable formats following the guidelines from DCMI (DCMI, 2009) and
rethinking the metadata specifications developed by CEN (CEN/TC 353). These profiles re-
use the descriptions and mappings and make it possible to transform the re-usable
components into different standard technical formats, such as XML or JSON schemas.
Figure 1. Common architecture frame connecting conceptual and physical modelling.
One of the goals of our work has been to build a prototype for collaborative online tool for
creating linked data vocabularies and application profiles — instead of documenting
terminology and data model descriptions, as usual, in e.g. separate wiki pages or
spreadsheet. This work has proceeded and we are proud to present the solution: IOW -
Interoperability Workbench (CSC, 2016). It is an open source IT software and as a modular
implementation it enables further development, as linkages e.g. to existing Code Services.
The Semantic Interoperability Model and IOW is being developed by the Ministry of Education
and Culture for supporting the needs of institutions of higher education and research, but
the work will in future form the basis for a wider National Metadata Service and be a part of
the National Service Architecture (Ministry of Finance, 2015). We argue that this approach to
interoperability and semantics of information and digital services has potential also in the
context of international cooperation.
215
3. REFERENCES
CEN/TC 353. European Learning Standards. Retrieved from
www.cen.eu/work/areas/ICT/eEducation
CSC. (2016). IOW - Interoperability Workbench. Retrieved from http://iow.csc.fi
DCMI. (2009). Guidelines for Dublin Core Application Profiles. Retrieved from http://dublincore.org
FINTO. (2016). Finnish Ontology Service. Retrieved from http://finto.fi
ISO. (2009). Terminology work -- Principles and methods (ISO 704: 2009)
Ministry of Finance. (2015). National Architecture for Digital Services. Retrieved from
http://vm.fi/en/national-architecture-
for-digital-services OKSA. (2016).
Vocabulary of Education. Retrieved
from
http://confluence.csc.fi/display/TIES/S
anastotyo
W3C. (2012). SKOS Primer. Retrieved from http://www.w3.org/TR/skos-primer
AUTHORS’ BIOGRAPHIES
Suvi Remes is working as specialist in information
management and semantic interoperability at CSC – IT Center
for Science and has experience in developing information and
data management and architecture on different levels of
abstraction and operations.
She leads as project manager the service development
of IOW - Interoperability Workbench and coordinates its
introduction and implementation in the field of higher
education and research but also on a national level together
with strategic co-operation partners. She is a member of the
Ministry of Education and Culture
led working group for Vocabulary of Education, and co-
coordinates the language translations for the terminology. She
is also a member of a national-level terminology working group which guides and develops
the terminology work and its processes for the public sector in Finland.
Suvi is also working for the Open Science and Research Initiative (ATT) which the Finnish
Ministry of Education and Culture set out to promote research information accessibility and
open science. Suvi chairs the ATT Metadata Working Group which has studied possibilities to
improve interoperability, especially semantic interoperability, in metadata management
focusing on research data and datasets. She also, from time to time, coaches the research
administration terminology working group. She has experience in working in various
international networks, including standardisation work both in the national and the
international bodies, e.g. CEN and ISO.
Suvi holds a M.Sc. in Cultural Geography and she has since deepened her understanding of
semantic theories studying further Linguistics and Literature. Her interest lies in the
terminological theory and its applications in information management and different
communication situations.

216
Previously Suvi has worked few years in a private sector company in industry coordinating
and developing information management processes. She has also work experience from study
administration, focused that time on international student mobility and admissions.
Miika Alonen is working as interoperability architect and
specialist in semantic interoperability at CSC – IT Center for Science. He
is the chief architect and also active developer in the service
development of IOW - Interoperability Workbench and participates in
various national networks in the implementation process of this new
architecture approach.
Miika has a strong IT background and experience in projects
focusing in semantic interoperability. He holds a M.Sc. in Software
Engineering and is currently, on the side of his full time job, doing his
postgraduate studies at Aalto University in
the field of Semantic Computing.
LinkedIn profile:
https://www.linkedin.com/in/miika-alonen-67500b21
Patrik Maltusch is heading the EA architecture team at Aalto University. He is also acting
member and chairman of the Finnish National Enterprise Architecture
Special Interest Group and one of the lead educators who have coached
administration staff in the national wide Higher Education EA schooling
program. Past experience include working as a customer service
instructor for nearly ten years and further fifteen years as network
architect and business owner for internal infrastructure design in a
global Telco company. Patrik is also a distinguished and accredited
security professional, risk manager, system auditor and a certified
Higher Education Enterprise Architect. As entrepreneur and start up
facilitator Patrik understands what staying practical means for business.
For Patrik interoperability is the key to success in an ever growing and
more complex and complicated ecosystem landscape. Something that
can be achieved using EA methodology in a more visualized way.
Experience per domain:
Software Security 5+ years, Hotel & Restaurant 10+ years, Information Security 10+ years,
ICT Service Management 15+ years, Project Management 15+ years, Business Management
15+ years, ICT Networks 20+ years, IT Systems 30+ years.
LinkedIn profile:
https://fi.linkedin.com/in/maltusch

217
Publications:
Maltusch, Patrik & Nieminen, Virpi (2015). Business and Dynamic Change: The Arrival of Business
Architecture. Applying Architecture to Business Transformation and Decision-making: Case Aalto
University. Future Strategies Inc.
http://futstrat.com/books/BusinessandDynamicChange.php
Mikael af Hällström works as senior advisor at Finnish Tax Administration. He has been
working in different cross-governmental projects since the mid–2000s, mainly focusing on
developing interoperability, including national controlled terminologies and vocabularies,
information architecture modeling frameworks, nationally harmonised code lists and
classifications and XML schema conformance. Mikael chairs several national level working
groups with connection to these themes and he is also a member of steering groups directing
development of procedures and actions on interoperability in the public sector in Finland. He
holds a Master’s degree in Law.
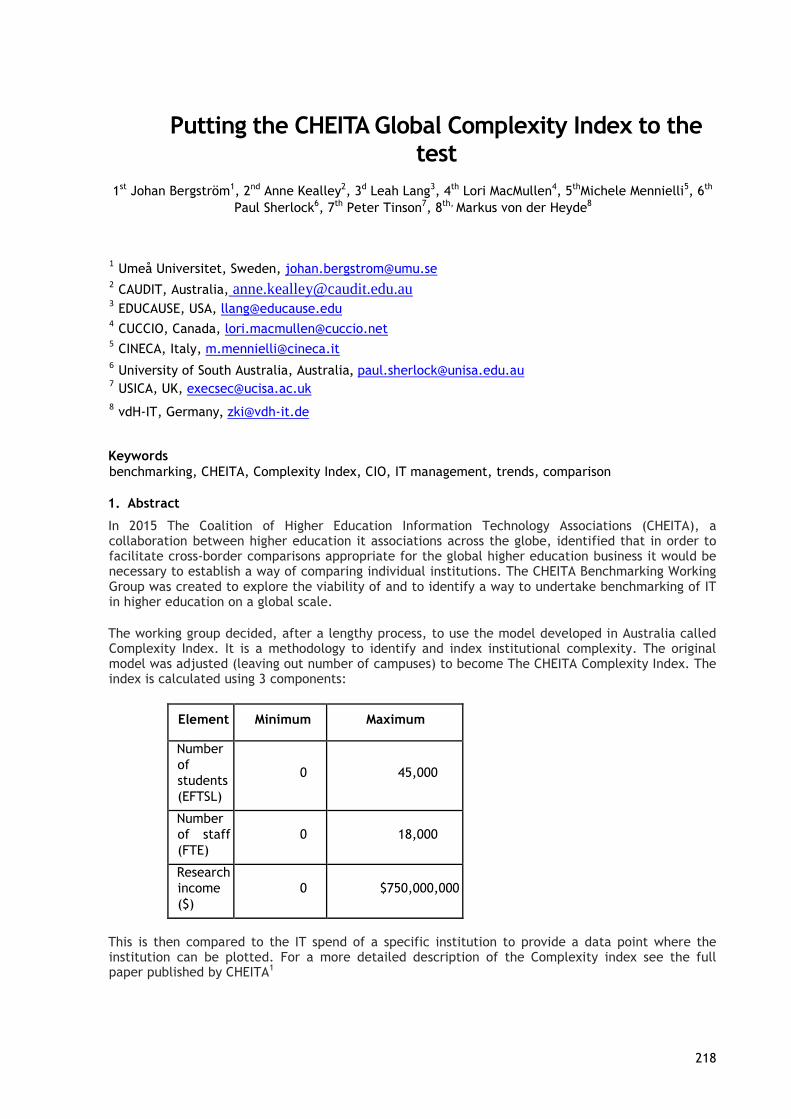
218
Putting the CHEITA Global Complexity Index to the test
1st Johan Bergström1, 2nd Anne Kealley2, 3d Leah Lang3, 4th Lori MacMullen4, 5thMichele Mennielli5, 6th
Paul Sherlock6, 7th Peter Tinson7, 8th, Markus von der Heyde8
1 Umeå Universitet, Sweden, [email protected] 2 CAUDIT, Australia, [email protected] 3 EDUCAUSE, USA, [email protected] 4 CUCCIO, Canada, [email protected] 5 CINECA, Italy, [email protected] 6 University of South Australia, Australia, [email protected] 7 USICA, UK, [email protected] 8 vdH-IT, Germany, [email protected]
Keywords
benchmarking, CHEITA, Complexity Index, CIO, IT management, trends, comparison
1. Abstract
In 2015 The Coalition of Higher Education Information Technology Associations (CHEITA), a collaboration between higher education it associations across the globe, identified that in order to facilitate cross-border comparisons appropriate for the global higher education business it would be necessary to establish a way of comparing individual institutions. The CHEITA Benchmarking Working Group was created to explore the viability of and to identify a way to undertake benchmarking of IT in higher education on a global scale.
The working group decided, after a lengthy process, to use the model developed in Australia called Complexity Index. It is a methodology to identify and index institutional complexity. The original model was adjusted (leaving out number of campuses) to become The CHEITA Complexity Index. The index is calculated using 3 components:
Element Minimum Maximum
Number
of
students
(EFTSL)
0 45,000
Number
of staff
(FTE)
0 18,000
Research
income
($)
0 $750,000,000
This is then compared to the IT spend of a specific institution to provide a data point where the institution can be plotted. For a more detailed description of the Complexity index see the full paper published by CHEITA1
219
Benchmarking IT benefits institutions by giving the institution the possibility to compare with peer universities. By using the CHEITA Complexity Index, benchmarking IT can be extended internationally and enable comparison with institutions from other countries. This serves a purpose to provide more members of a peer group and in some cases, where an institution does not have any peers within its country, an actual peer group.
The concept of trans-national comparison using the Complexity index to create peer groups has not yet been put to the test. The CHEITA Benchmarking working group has the ambition to create a discussion between IT leaders from different parts of the world, seemingly of the same complexity. This discussion will shed light on both the validity of the Global Complexity Index as well as the value of benchmarking in general. This presentation will include a discussion on the process and concept behind both the Complexity Index as well as the discussion group. If available at the time of the EUNIS2016 congress, a presentation on key findings will also be presented.
2. REFERENCES
1. Bergström, Johan, Eden Dahlstrom, Pekka Kähkipuro, Anne Kealley, Leah Lang, Lori MacMullen, Michele Mennielli, Paul Sherlock, and Peter Tinson. Benchmarking IT: A Global Approach.
CHEITA, July 15, 2015. (http://www.cheita.org/wp-content/uploads/2015/08/CheitaBM.pdf)
3. AUTHORS’ BIOGRAPHIES
Johan Bergström, Msc Computer Science, is working as an International Business
developer for ICT Services and System Development (ITS) - Umeå University. Johan
was the congress organiser of the 20th annual EUNIS congress in 2014 and currently
the manager of Eunis Research and Analysis Initiative.
https://www.linkedin.com/in/johanbergstrom
Anne Kealley, Dip. Teach, B Bus, Grad. Cert. O&G Engineering, is the CEO of the
Council of Australian University Directors of Information Technology (CAUDIT). Anne
is a member of the Organising Committee for the THETA 2017 conference, a proposal
reviewer for the EDUCAUSE 2016 conference and a member of the Scientific
Community of the EUNIS 2016 Congress. https://au.linkedin.com/in/annekealley
Leah Lang leads EDUCAUSE Analytics Services, a suite of data services, products, and
tools that can be used to inform decision-making about IT in higher education. Leah
has a B.S. in Statistics from Penn State and an M.S. in Survey Methodology from the
University of Maryland.
Michele Mennielli, Michele Mennielli is working as an external Relations and
International Affairs Manager for CINECA, Italy. His primary focus is on Research
Informations systems. He is also a board member of both EUNIS and EuroCris, two
paneuropean organisations focusing on IT for Higher Education.
https://www.linkedin.com/in/michelemennielli
Paul Sherlock is an Officer (Library & IT) at the University of South Australia (UniSA)
where he is responsible for the strategic direction and operational management of the
University’s IT and Library services. Paul has previously been President of the Council
220
of Australia University Directors of Information Technology (CAUDIT). During Paul’s presidency
CAUDIT was incorporated and international ties with South Africa were established. Paul led the
development of the CAUDIT complexity index which is been adapted for use
internationally by the CHEITA benchmarking working group.
https://au.linkedin.com/in/sherlockpaul
Dr. Markus von der Heyde received his PhD in Computer Sciences from the
University of Bielefeld for his work at the Max Planck Institute for Biological
Cybernetics Tübingen in 2000. His approach is to adopt biological principles into
distributed computer applications in order to enhance stability and robustness.
Since 2004 he works within ZKI on topics as information security, service-
management, strategy and governance. Until 2011 he was ICT director of Bauhaus-
University in Weimar. Until today he also focuses on internationalization and
supports ZKI, GI, EUNIS and EDUCAUSE and serves as program committee member as well as proposal
reviewer for conferences and the scientific community. In cooperation with various partners he
continues to conduct the German CIO studies. Today, he is management consultant specialized on IT
topics in higher education. See further details on https://de.linkedin.com/in/mvdh42.
.
Peter Tinson is Executive Director of UCISA. Peter has worked for UCISA since 2005.
His responsibilities include representing the UK Higher Education IT community in
discussions with Government departments and other bodies on the development and
implementation of legislation and policy.
Lori MacMullen is the Executive Director of the Canadian University Council of Chief
Information Officers (CUCCIO). Representing 57 Canadian Universities CUCCIO serves
as the national voice for IT-related issues in Canadian universities and provides a
forum for members to share ideas, best practices and advance collaboration across
the sector. Ms. MacMullen holds a Business Administration degree from the
University of New Brunswick. In addition to her formal education, Ms. MacMullen
has also attended the Program for Public Executives at Queen’s University and has participated in a
number of international, national and provincial committees aimed at advancing IT related issues in
both the public and academic sectors.
221
BENCHEIT – Benchmarking Higher Education IT An Update on the Work of the EUNIS Bencheit Task
Force 1st Ilkka Siissalo1, 2nd Yiannis Salmatzidis 2, 3rd Angeliki Agorogianni3, 4th Yvonne Kivi4
1 University of Helsinki IT Center, PO Box 28, FI-00014 University of Helsinki,
Finland,[email protected] 2 Aristotle University of Thessaloniki, University Campus, 54124 Thessaloniki, Greece, [email protected] 3 Aristotle University of Thessaloniki, University Campus, 54124 Thessaloniki, Greece,
[email protected] 4University of Helsinki IT Center, PO Box 28, FI-00014 University of Helsinki, Finland,
Keywords
benchmarking, BencHEIT, CIO, IT management, costs
1. Summary
BencHEIT is a free of charge yearly survey with the aim of establishing a comprehensive knowledge of how cost efficiently IT works in European universities, and universities of applied sciences. The BencHEIT Task Force gathers the data and generates an analysis for the CIOs to use in comparing the organization´s IT costs and volumes to their peer´s numbers. It also provides them with tools to start more detailed discussions how to improve the performance of institute’s IT services. Analysis gives some perspective to common development within the higher education IT.
Data is collected in three dimensions
1. Organizational level: centralized IT, other centralized units, distributed units e.g. faculties and research centers. This way participating organization can see how (de)centralized their IT is in comparison to others.
2. Account level: financial data is divided in hardware, software, staff, facilities, outsourcing
and other costs.
3. Services: all costs and also some of the volume data is collected within different IT services
e.g. infrastructure, workstations, business applications.
The initiative was started as a country-wide Finnish project, and in the year 2012 it was opened to all interested European HEIs. The number of participants have increased every year since we started the project in its current form in 2012. In the last round we had 49 participants, from Finland, Sweden, Denmark, Norway, Germany, Greece and Slovenia.
Every year for the past four years, the Task Force together with EUNIS has hosted a workshop day somewhere in Europe (Münich, Paris, Bologna and Barcelona), for everyone interested in benchmarking. One of the topics has been finding possible common indicators for comparing results from other similar studies at hand. This will also be one of the topics discussed in the pre-congress workshop in Thessaloniki 7th June 2016. The Task Force is also planning a workshop in Trondheim,
EUNIS-2016-paper-template.doc
Norway in the fall 2016.
222
Bencheit is one of the EUNIS official task forces. This presentation is an update on what the project
is doing at the moment, and what is new for the year 2016. The presentation aims to explain how
the project works, and what the benefits of participating are, also for someone who has never heard
about it before.
We will hear from Yiannis Salmatzidis and Angeliki Agorogianni, telling us about the University of Thessaloniki´s experiences and benefits as a fairly new participant.
2. AUTHORS’ BIOGRAPHIES
Ilkka Siissalo is the CIO of University of Helsinki, EUNIS Vice President and chairman of the Bencheit
steering group. Ilkka holds an M.Sc degree in biochemical sciences as well as a bachelor level degree
in marketing. Ilkka has acted as the IT leader in various research related institutions both within the
private sector and academia for over 25 years.
Yiannis Salmatzidis is the Technical Manager of the IT Centre of Aristotle University of Thessaloniki, the largest university in Greece. He is also a member of the EUNIS Board and a member of the Bencheit steering group. Yiannis graduated from the Department of Electrical Engineering at Aristotle University. He holds a Master’s Degree in Electrical Engineering, from University of Maryland at College Park,
USA. He is a Fulbright Fellow.
Angeliki Agorogianni is the Head of Administration and User Support Unit at the Information Technology Center of Aristotle University of Thessaloniki since 2013. Between the years 1997-2012 she worked at the Telecommunication Center of Aristotle University as administrator of the voice network and the videoconferencing infrastructure of the university. She holds a bachelor’s Degree in electrical engineering from Aristotle University and a Master’s Degree in Business Administration. Since 2014 she leads the annual Bencheit survey for Aristotle University.
Yvonne Kivi is an IT specialist at the University of Helsinki and the project manager of BencHEIT.
She holds a B.Sc degree from Arcada university of applied sciences. Yvonne is the key contact person
to most of the institutions that participate in the Bencheit work.
EUNIS-2016-paper-template.doc
223
Finding the holy grail of IT Benchmarking
1st Johan Bergström1, 2nd Rens van der Vorst2, 3d Michele Mennielli3, 4th Yvonne Kivi4, 5th Teemu
Seesto5, 6th, Ole Langfelt6, 7th Jose Pascual Gumbau Mezquita7, 8th Antonio Fernández Martínez8, 9th
Vicente Andreu Navarro7, 10th Paco Sampalo9
1Umeå Universitet, Sweden, [email protected] 2Fontys University, The Netherlands, [email protected] 3Cineca, Italy, [email protected] 4University of Helsinki, Finland, [email protected] 5FUCIO, Network of Finnish Universities’ Chief IT officers c/o University of Turku,
[email protected] 6Norwegian University of Science and Technology, [email protected] 7Universitat Jaume I, [email protected], [email protected] 8Universidad de Almeria, [email protected] 9 Universidad Polytechnica de Cartagena, [email protected]
Keywords benchmarking, BencHEIT, CIO, IT management, trends, comparison
1. Abstract
There are a number of benchmarking initiatives throughout Europe. Together, these are covering a
fairly large number of institutions. The goals of these initiatives are to get a full picture of the state
of IT at an institution with a purpose of facilitating a comparison between institutions. At the
BencHEIT meeting in Barcelona an idea was put forward to find a number of common indicators from
these benchmarking surveys. A goal of this work is to provide a possible overview of the situation of
IT in Higher Education in Europe.
Ensuring good benchmarking with secured data points over region, countries or even continents is
the holy grail of benchmarking. The BencHEIT initiative in Europe is a good example of a well
managed and ambitious endeavor to make this happen. However, this is within the scope of a
specific survey, where the definition of each data point is discussed and decided (still there is
always the risk of misunderstanding the intent of a specific collection point).
When it comes to analyze the different benchmarking initiatives from different regions, countries or
continents it becomes more difficult. A group of representatives from three different benchmarking
projects have engaged in trying to find this holy grail.
The project, called “Trans-national Benchmarking”, is trying to find a path to this holy grail. Instead
of comparing and encompassing all aspects of the benchmarking work the groups is working to
define the common denominators between the 3.
The first step is for each one of us to go through these documents to try to find commonalities,
starting with the Context indicators. A quick overview of these indicators show that you can pair
them into three different areas. ● Basic data or Context indicators about the institution. This is more or less mandatory to
facilitate some kind of comparison.
224
● Indicators that we believe or look like they are comparable. These will then have to be
defined more closely to ensure they are actually asking the same questions (and thus getting
comparable answers).
● Indicators that we would like to have, based on the needs of the institutions (what
indicators they are using to run their business and influence stakeholders).
This presentation will focus on describing this set of indicators that are comparable between
different benchmarking projects. The project has identified the indicatiors and will move on to
providing a pilot where these indicators will be put to test. This will also outline the constitution of
the transnational benchmarking community.
The project is not yet finished but the results will be available before EUNIS2016.
2. AUTHORS’ BIOGRAPHIES
Johan Bergström, Msc Computer Science, is working as an International Business
developer for ICT Services and System Development (ITS) - Umeå University. Johan
was the congress organiser of the 20th annual EUNIS congress in 2014. Johan is also a
programme committee member the Terena Networking Conference in 2015 and 2016
as well as a Senior Reviewer ERO (Educause Review Online).
https://www.linkedin.com/in/johanbergstrom
Michele Mennielli, Michele Mennielli is working as an external Relations and
International Affairs Manager for CINECA, Italy. His primary focus is on Research
Informations systems. He is also a board member of both EUNIS and EuroCris, two
paneuropean organisations focusing on IT for Higher Education.
https://www.linkedin.com/in/michelemennielli
Teemu Seesto has M.Sc. in economics from Turku School of Economics. He has been a
teacher of information systems science for twenty years. Seesto was the CIO of Turku
School of Economics during 2006-2010. He is currently the IT general secretary of
FUCIO, the Network of Finnish universities’ CIOs. Teemu is a member of the Bencheit
steering group.
Yvonne Kivi is an IT specialist at the University of Helsinki and the project manager
of BencHEIT. She holds a B.Sc degree from Arcada university of applied sciences.
Yvonne is the key contact person to most of the institutions that participate in the
Bencheit work.
Ole Langfelt IT architect and IT security manager at the Norwegian University of
Technology.
Rens van der Vorst has a degree in Economics & Law and Political
Science. He works for Fontys University (45k students) as head of IT innovation.
His most recent projects are the Quantified Student (a Runkeeper App for
Students), CitizinOne (a life long portfolio), an IT benchmark for higher education
225
in the Netherlands. Rens is very active in Dutch community SURF and European community
EUNIS.
Jose Pascual Gumbau Mezquita Director of Office for Planning and IT Forecast at
University Jaume I.
Vicente Andreu Navarro has a degree in Computer Engineering. He works at
University Jaume I as Senior IT Innovation Specialist. He is in charge of IT security
management and personal data protection. He is also involved in IT organization and
governance and has been the leader of the academic pilots in STORK and STORK2.0
projects on electronic identity, co-funded by the European Commission.
Antonio Fernández Fernández Martínez
Paco Sampalo
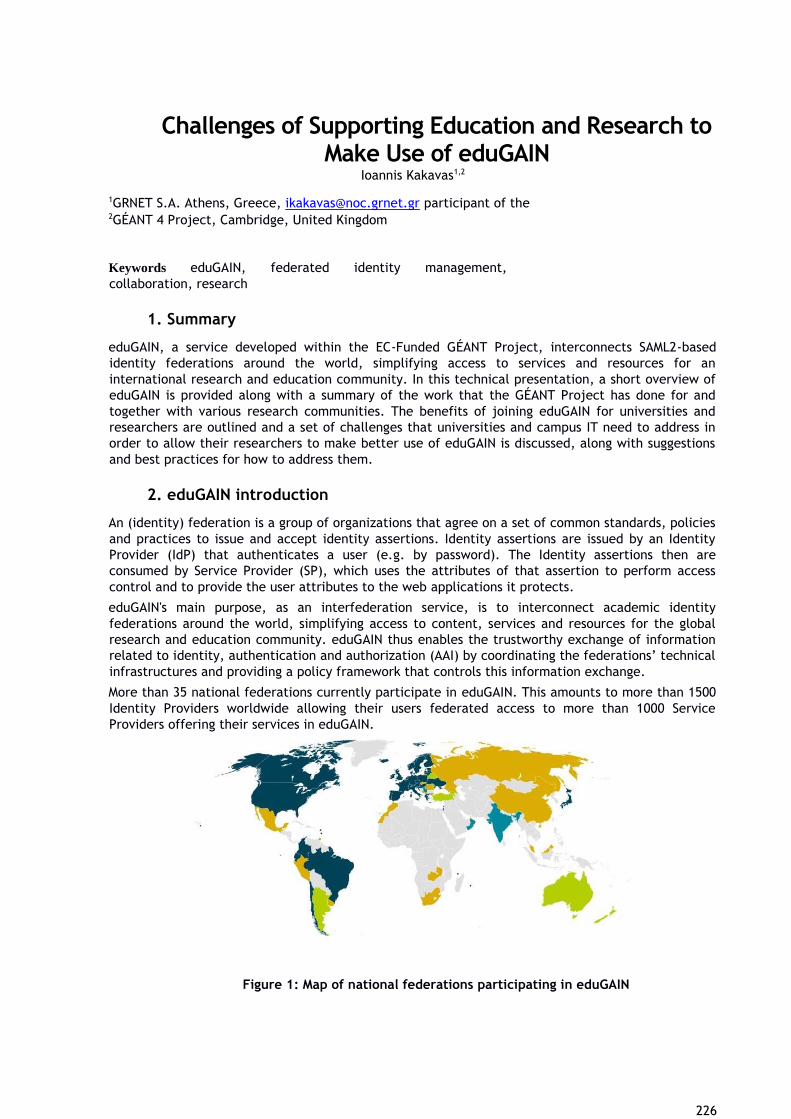
226
Challenges of Supporting Education and Research to Make Use of eduGAIN
Ioannis Kakavas1,2
1GRNET S.A. Athens, Greece, [email protected] participant of the 2GÉANT 4 Project, Cambridge, United Kingdom
Keywords eduGAIN, federated identity management,
collaboration, research
1. Summary
eduGAIN, a service developed within the EC-Funded GÉANT Project, interconnects SAML2-based
identity federations around the world, simplifying access to services and resources for an
international research and education community. In this technical presentation, a short overview of
eduGAIN is provided along with a summary of the work that the GÉANT Project has done for and
together with various research communities. The benefits of joining eduGAIN for universities and
researchers are outlined and a set of challenges that universities and campus IT need to address in
order to allow their researchers to make better use of eduGAIN is discussed, along with suggestions
and best practices for how to address them.
2. eduGAIN introduction
An (identity) federation is a group of organizations that agree on a set of common standards, policies
and practices to issue and accept identity assertions. Identity assertions are issued by an Identity
Provider (IdP) that authenticates a user (e.g. by password). The Identity assertions then are
consumed by Service Provider (SP), which uses the attributes of that assertion to perform access
control and to provide the user attributes to the web applications it protects.
eduGAIN's main purpose, as an interfederation service, is to interconnect academic identity
federations around the world, simplifying access to content, services and resources for the global
research and education community. eduGAIN thus enables the trustworthy exchange of information
related to identity, authentication and authorization (AAI) by coordinating the federations’ technical
infrastructures and providing a policy framework that controls this information exchange.
More than 35 national federations currently participate in eduGAIN. This amounts to more than 1500
Identity Providers worldwide allowing their users federated access to more than 1000 Service
Providers offering their services in eduGAIN.
Figure 1: Map of national federations participating in eduGAIN
227
3. Benefits of joining eduGAIN
Through eduGAIN, universities and their researchers and students can access a great range of
services, operated in the member federations in a collaborative environment. Researchers are able
to use their local university accounts to access any service connected to eduGAIN that might
otherwise be unavailable and without the need to create and manage additional, service specific
accounts. Research communities and their services gain exposure to a wide international academic
audience while avoiding the cost of user management and user support.
4. Challenges for eduGAIN participants
While eduGAIN offers considerable benefits both for researchers and for services addressed to them,
these benefits come associated with a certain cost and additional challenges. Operational cost
burdens mainly universities since interfederation adds an extra complexity layer to their existing
identity management solutions. Participation in eduGAIN also unveils new administration and policy
dilemmas for campus IT. They are now responsible for ensuring that the privacy of their users is
respected while at the same time releasing enough information for them to access services in
meaningful manner. The presentation offers recommendations, stemming from the experience of
the GÉANT Project, on how campus IT can mitigate some of these issues in order to better support
their researchers getting access to eduGAIN enabled services.
5. eduGAIN collaboration with research communities
Research communities, driven by their need for fine-grained access management for research data,
have produced a paper entitled ‘Federated Identity Management (FIM) for Research Collaborations’
in which they detail their requirements for federated identity management identify issues that pose
challenges for the wider adoption of FIM technologies offered by national federations and by
eduGAIN. The GÉANT Project, addressing these requirements and issues, has worked closely with a
number of research communities with the end goal of assisting them to satisfy their use cases.
Namely, it has worked closely with CERN, DARIAH, ELIXIR, UMBRELLA, ESA and other research
communities in order to allow them to:
• Enable researchers to access data sets that cannot be publicly disseminated using a
federated identity model that ensures sufficiently reliable authentication and proper
authorization.
• Expose their services to international and cross-organization groups of researchers via
eduGAIN, offering proper authentication and authorization in user friendly way and at the
same time taking away the burden of a complex user management infrastructure
• Simplify the access to their web-based service offerings for researchers by allowing them to
use their existing - now federated- university credentials instead of obliging them to create
service specific accounts.
The presentation provides an insight of the work that has been completed in collaboration with some of the aforementioned research communities, of the key outcomes and conclusions and explores how these are used to structure guidelines and best practices for the benefit of the rest of the research community.
6. REFERENCES
Broeder, D., Jones, B., Kelsey, D., Kershaw, P., Lüders, S., Lyall, A., Nyrönen, T., Wartel, R., Weyer,
H. (2012). Federated Identity Management (FIM) for Research Collaborations
7. Author Biography
Ioannis Kakavas holds a degree in Electrical and Computer Engineering from National Technical
University of Athens and a M.Sc. in Information and Communication Systems Security from the Royal
Institute of Technology (KTH) in Sweden. He has been with GRNET S.A. since 2014, working with
Identity and Access Management, Identity Federation and Security. He is a member of the team that
operates the national identity federation and the security officer for GRNET. Ioannis participates in

228
the Geant Project, and specifically in the Enabling Users task, collaborating with international user
communities to assist them to increase their usage of AAI infrastructures.
229
Towards Pan-European Cloud Services
Branko Radojević1, Andres Steijaert
2, Lars Fuglevaag
3
1CARNet / GÉANT, J. Marohnića 5, Zagreb, Croatia, [email protected]
2SURFnet / GÉANT, Moreelsepark 48, Utrecht, Nederlands, [email protected]
3UNINETT
/ GÉANT, Abels gate 5, Trondheim, Norway, [email protected]
Keywords
Clouds, NREN, services, research, education.
1. Summary
Cloud services really make users the choosers by using the services they want, in easy and often
economically attractive manner. European NRENs (National Research and Educational Network) have
recognized the need for a common, systematic approach to cloud services, and have joined forces in
the GÉANT4 Clouds activity. This paper gives an overview of the challenges and possibilities
associated with cloud services in research and education, and how the European NREN community is
responding to these. It outlines the result of the NREN collaboration through GÉANT so far,
specifically addressing the ongoing procurements and its implications and benefits for a wide number
of European R&E institutions.
2. Working together empowers our position toward vendors
Cloud services really make users choosers. They empower users to select and use the services they
want, in an easy and often economically attractive manner. Research and education organizations
can become more agile and provide their users with a wider range of relevant IT services. Cloud
services offer great potential but also pose challenges. Research and education institutions as a rule
need to know that their data are secure. Procurement regulations and billing are factors that
complicate the use of commercial cloud services as well as the growth of “shadow IT” where the IT
department is bypassed by users.
European NRENs have recognized the need for a common, systematic approach to cloud services, and
have joined forces in the GÉANT4 Clouds activity. The NRENs are working together to aggregate
demand and work with vendors in a community effort to bring cloud services to European research
and higher education. The goal is ambitious; to deliver cloud services that meet the requirements of
the sector to institutions across Europe, and to establish a delivery ecosystem for such services that
can keep feeding new services to the community in the years to come.
The initial work was done in previous project (GÉANT3plus) where the team has worked with the
NRENs to set common set of goals to be achieved through negotiation process with the commercial
vendors. A number of documents were prepared and released and one of the most important is the
Indicative list of requirements for CSPs (Cloud Service Providers) that on one side harmonizes the
list of requirements between the NRENs, and on the other side shows a baseline of joint
requirements to the vendors. This step resulted in a number of vendors applying for the self-
assessment based of this document that shows their commitment toward community needs and lists
that clearly in the now published GÉANT Cloud catalogue.
Following this achievement the team decided to move to the next step: to make a joint procurement
for the cloud services. The first area of cloud services to be handled by the activity is Infrastructure
as a Service (IaaS). Six of the NRENs are working specifically to do a European tender for IaaS
services that will make the procurement of cloud services easier for institutions. Major international
IaaS providers have been approached and have expressed their interest. Now the tender is in
progress, and NRENs and universities can expect to benefit from the results in the summer/autumn
of 2016.
During this year GÉANT Clouds team will continue work together with interested institutions and all
major cloud vendors from Europe and beyond to prepare new services beyond IaaS tender. This
230
approach opens possibility to work on to work on other services to provide direct discounted access
for research and education users all across Europe without need to do formal procurements, but also
to investigate which services are most attractive to our potential users on a larger scale and to
prepare future procurements for those services.
The benefits of the joint approach are numerous, but one of the most important is the ability to
share knowledge between members of the European NRENs family, which generally lacks experts in
the procurement field. And the possibility to approach commercial vendors together already showed
its strength, since it was already possible to achieve agreements that a single NREN or a smaller
group of NRENs could not achieve. The work in that direction is continuing and it looks very
promising.
3. AUTHORS’ BIOGRAPHIES
Branko Radojević has worked as Deputy CEO at CARNet since 2005, and is leading the computer &
data infrastructure team in CARNet. He has more than 20 years of experience in managing
information systems in academic, research and education area. Since 2007 he gained a lot of
international experience through the work in GÉANT 2, 3, 3plus and now in GÉANT 4. He is currently
leading the Service delivery efforts that includes vendor management and cloud brokerage though
the work in GÉANT 4.
Andres Staijert is a Program Manager at SURFnet since 2001, and a initiator and member of the
SURFtaskforce Cloud where he coordinates and contributes to the SURF cloud first strategy and
support higher education and research organizations in their joint adoption of the cloud. Since 2013 he
is leading the GÉANT Cloud team with primary objective of ensuring that the research and higher
education community in Europe is optimally positioned to benefit from cloud computing and cloud
services. GÉANT Cloud team works on cloud strategy, standards, interoperability, cloud brokerage,
vendor management and cloud integration.
Lars Fuglevaag has worked as Head of Communications at UNINETT since 2008, and is leading the
team for communications and customer relations in the service department of UNINETT. He has
close to 30 years’ experience within marketing and communications in both the public and private
sector. He has substantial international experience through the NORDUnet communications group,
the TF-CPR task force and the GÉANT PR Network, and is currently work package leader for
communications and NREN support in the GÉANT Clouds Activity (GN4 SA7 Task 4).
231
A brief overview of the Information System for Science and Higher Education in Poland
Jarosław Protasiewicz, Marek Michajłowicz, Mikołaj Szypke
National Information Processing Institute, Warsaw, Poland
Keywords
information system; higher education and science; decision support system
1. Summary
The article is aimed to introduce the Information System for Science and Higher Education in Poland
briefly. The system acquires data concerning universities and research institutions, analyzes these
data, and supports decision-making processes of governmental bodies.
2. INTRODUCTION
The Information System for Science and Higher Education (POL-on) is the integrated and centralized
information system [1], which supports the Ministry of Science and Higher Education as well as other
Ministries and institutions related to science and higher education. Its primary task is to create a
global database of scientific institutions, universities, and Polish science. Collected information
supports the decision-making processes. Moreover, some data stored in the system are publicly
available. Although the system is designed only for Poland, the cooperation with other countries may
be established. We have to note that there are interesting and well-grounded international initiatives
concerning scientific data like the CERIF data model supported by Current Research Information
System [2], Open Access Infrastructure for Research in Europe [3], Digital Repository Infrastructure
Vision for European Research [4], etc. The paper is structured as follows: Section 3 briefly explains
how the data are collected, Section 4 discusses the primary business processes, and Section 5 shows
some technical details. Finally, conclusions are presented.
3. DATA ACQUISITION AND VALIDATION
The Polish universities and research units are obliged by the law to provide various information and
store it in the central system, i.e. POL-on. The information concerns their educational and scientific
activities, namely students, researchers and academic teachers, academic degrees and titles,
faculties and studies, diploma theses, projects, patents, publications, conferences, awards,
laboratories and their equipment, properties, investments, etc. The data can be transferred to the
system by using tools of mass import or may be manually entered via the web interfaces. However,
the automatic import is available only for limited kinds of data, mainly information regarding
students and researchers. Regardless of the method data delivery, all records are validated according
to the rules based on the law and the best practices.
4. BUSINESS PROCESSES
The system contains data regarding almost all Polish universities and research units as well as their
students and researchers. These data are necessary for the government to manage the area of higher
education and science properly. Among many business processes that the POL-on supports, there are
several that are especially important. These are, namely:
• verification of the granting of financial aid to students;
• supporting the division of public grant;
• controlling the quality of higher education and particularly suitable employment structure of
academics teachers and researchers;
• monitoring the careers of graduates by using the administrative data;
• sharing public data – a practical implementation of the policy of open data/ government;
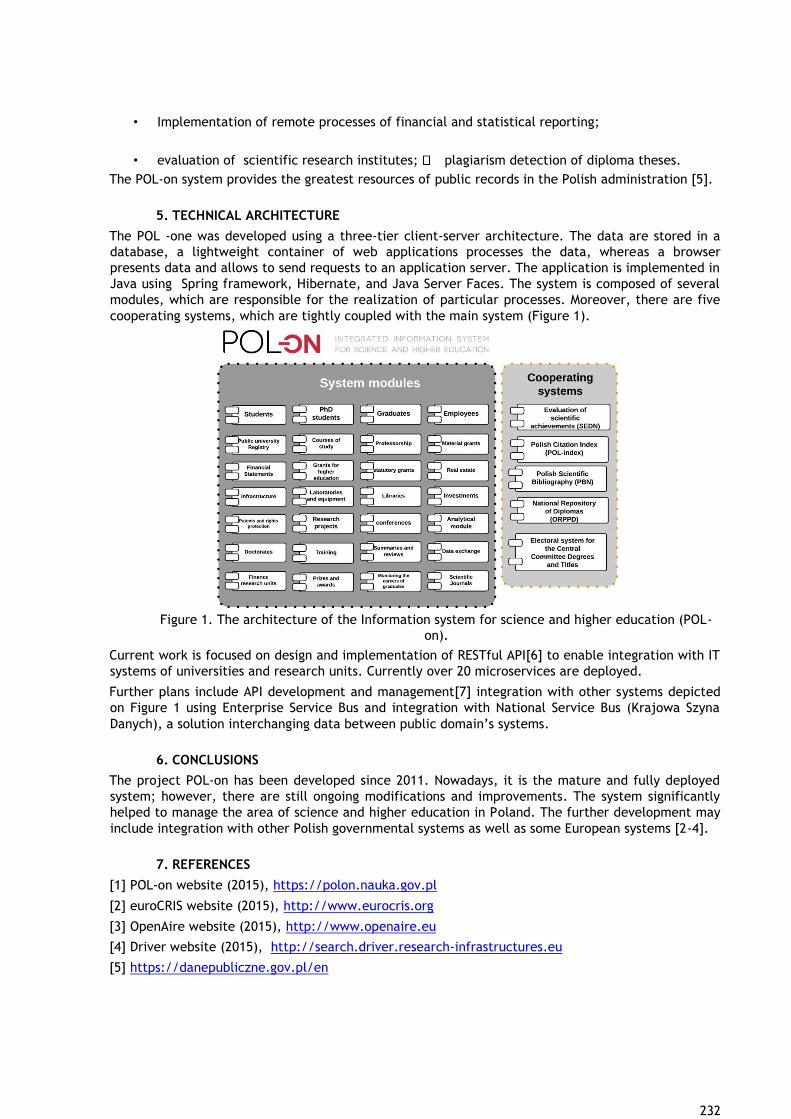
232
• Implementation of remote processes of financial and statistical reporting;
• evaluation of scientific research institutes; plagiarism detection of diploma theses.
The POL-on system provides the greatest resources of public records in the Polish administration [5].
5. TECHNICAL ARCHITECTURE
The POL -one was developed using a three-tier client-server architecture. The data are stored in a
database, a lightweight container of web applications processes the data, whereas a browser
presents data and allows to send requests to an application server. The application is implemented in
Java using Spring framework, Hibernate, and Java Server Faces. The system is composed of several
modules, which are responsible for the realization of particular processes. Moreover, there are five
cooperating systems, which are tightly coupled with the main system (Figure 1).
Figure 1. The architecture of the Information system for science and higher education (POL-
on).
Current work is focused on design and implementation of RESTful API[6] to enable integration with IT
systems of universities and research units. Currently over 20 microservices are deployed.
Further plans include API development and management[7] integration with other systems depicted
on Figure 1 using Enterprise Service Bus and integration with National Service Bus (Krajowa Szyna
Danych), a solution interchanging data between public domain’s systems.
6. CONCLUSIONS
The project POL-on has been developed since 2011. Nowadays, it is the mature and fully deployed
system; however, there are still ongoing modifications and improvements. The system significantly
helped to manage the area of science and higher education in Poland. The further development may
include integration with other Polish governmental systems as well as some European systems [2-4].
7. REFERENCES
[1] POL-on website (2015), https://polon.nauka.gov.pl
[2] euroCRIS website (2015), http://www.eurocris.org
[3] OpenAire website (2015), http://www.openaire.eu
[4] Driver website (2015), http://search.driver.research-infrastructures.eu
[5] https://danepubliczne.gov.pl/en
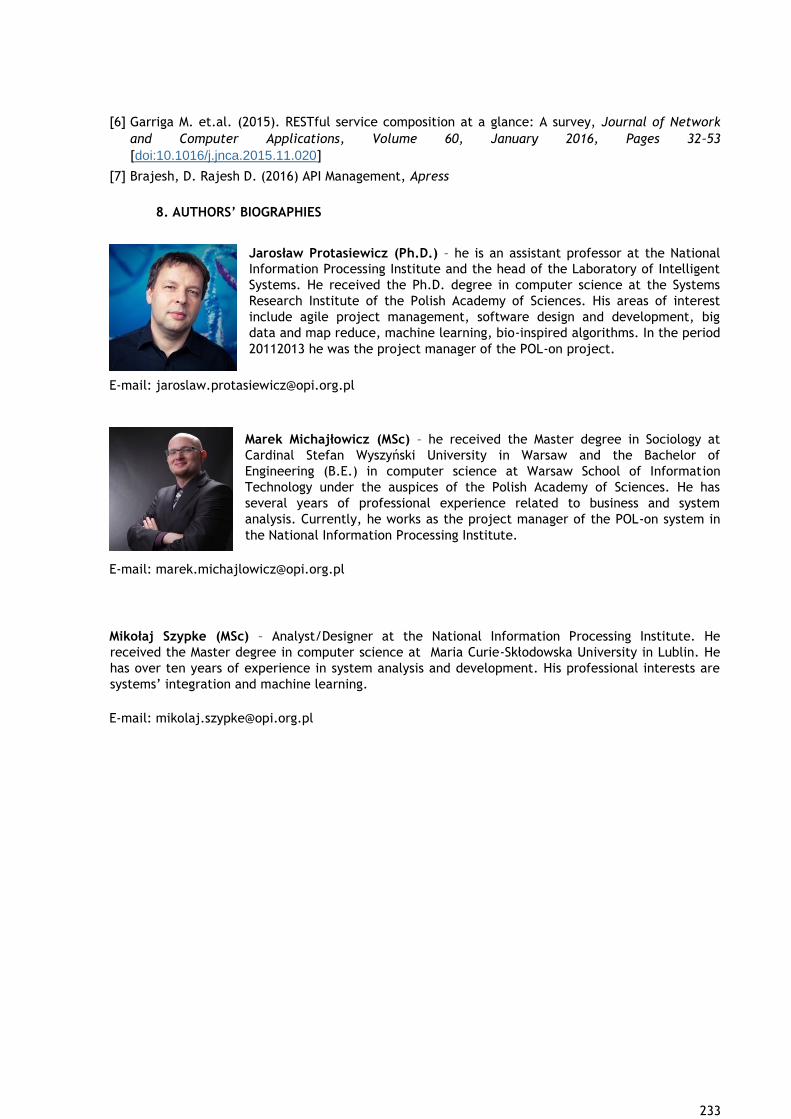
233
[6] Garriga M. et.al. (2015). RESTful service composition at a glance: A survey, Journal of Network
and Computer Applications, Volume 60, January 2016, Pages 32–53
[doi:10.1016/j.jnca.2015.11.020]
[7] Brajesh, D. Rajesh D. (2016) API Management, Apress
8. AUTHORS’ BIOGRAPHIES
Jarosław Protasiewicz (Ph.D.) – he is an assistant professor at the National
Information Processing Institute and the head of the Laboratory of Intelligent
Systems. He received the Ph.D. degree in computer science at the Systems
Research Institute of the Polish Academy of Sciences. His areas of interest
include agile project management, software design and development, big
data and map reduce, machine learning, bio-inspired algorithms. In the period
20112013 he was the project manager of the POL-on project.
E-mail: [email protected]
Marek Michajłowicz (MSc) – he received the Master degree in Sociology at
Cardinal Stefan Wyszyński University in Warsaw and the Bachelor of
Engineering (B.E.) in computer science at Warsaw School of Information
Technology under the auspices of the Polish Academy of Sciences. He has
several years of professional experience related to business and system
analysis. Currently, he works as the project manager of the POL-on system in
the National Information Processing Institute.
E-mail: [email protected]
Mikołaj Szypke (MSc) – Analyst/Designer at the National Information Processing Institute. He
received the Master degree in computer science at Maria Curie-Skłodowska University in Lublin. He
has over ten years of experience in system analysis and development. His professional interests are
systems’ integration and machine learning.
E-mail: [email protected]
234
Turning AUTh into e-University
Pinelopi Giovanitsa
Aristotle University of Thessaloniki, IT Center, PO Box 888, EL 54124,
Keywords learning management systems, moodle, blackboard, eclass
1. ABSTRACT
Among other universities, AUTh is nowadays facing the need to accommodate new technologies in its
learning process. Therefore, AUTh uses learning platforms such as moodle, blackboard and eclass to
provide its educators, students and administrators an integrated system to create personalized
learning environments. Learners of our university and worldwide, have the ability to take courses
entirely on-line through downloading the course material, chatting with the instructor, taking exams
and watching the lectures on demand or in real time, only by using a web browser at home without
any cost.
2. INTRODUCTION
In the mid-2000s, AUTh decided to use centra, eclass and blackboard as its main learning
management systems. It was at 2010 when those systems were mature and the users of the
university were really familiar with the idea of online learning. In 2013 due to the cost of the usage
and the administration of those platforms, AUTh decided to turn into open source learning
management systems and moodle was chosen as the best solution to merge all the courses in one
platform. In fact, moodle was chosen as the main learning platform only for members of the
university and alongside, for the project called “Open Courses”, eclass was chosen as the platform
for all freely accessible and available to everyone institutes’ courses over the internet.
3. REPLACING BLACKBOARD WITH MOODLE
When the decision was made to move from blackboard to moodle, one of the main concerns for the
two centers involved, IT and Central Library, was to limit the burden that the teachers or the
students might experience while using this new learning management system. Therefore, 92
instructional meetings, took place from the staff of the Central Library, educating more than 1200
users, both teachers and students, to our new platform. Alongside, the same staff created and
distributed 19 manuals with guiding tools and how-to questions to help the users of the university. It
is important to mention that guiding the teachers and organizing new instructional meetings are
daily duties of the Central Library staff.
The main issues, raised by users, that both centers had to answer, was the transition and the
enrollment of the students in particular courses, the upload and the distribution of the course
material, the creation of new courses and the use of the new tools that moodle offers. In general,
our users did not experience much difficulties while using this new system. Most of the teachers
have the experience to use that kind of platforms and there is also the support staff in both centers
that they can always turn into. Respectively, our students are familiar with learning management
systems and the do not put so much effort to learn how to use a new one. Furthermore, there are a
lot of comments from students who want all of their teachers to participate in this central learning
systems.
235
3.1 Issues and considerations behind the process
While choosing the moodle platform as the central management system, issues about the philosophy
of the LMS, were raised. We had to take into consideration what tools our users want, what features
they like and what data instructors need to guide and support student learning. Furthermore, the
choice of compatible browsers, languages supported and active user community were very
significant. In addition, we had to check what migration and conversion tools to use in order to
eliminate the possibility to lose any course material that had to be created from scratch. Also, one
of the main aspects we had to focus on, was the security provided from the LMS as far as online
testing, plagiarism and grading were concerned. The technical aspects that we had to answer were
the hardware, software, network and staff requirements, the features of backups provided and the
storage capacity that was needed.
3.2 Taking with numbers and similar experiences
In 2014, prior the replacement of the commercial learning management system blackboard with the
open source moodle, the number of users was nearly 50.000, the number of courses was 2.246, the
cost of the license was approximately 70.000 euros and 4 people were needed to support the users
and manage the platform.
Nowadays, moodle supports more than 54.448 users (among them 46.788 students and 1.260
teachers) and 4.340 courses. 3.714 of them are active and 32.048 students logged in the past six
months to view the courses they participate in. The total amount of the courses in moodle comes
from the old ones that were migrated from blackboard, the new ones that were asked to be created
from scratch and the number of courses from all the independent platforms from various faculties
who decided to get merged in the central learning management system. This merge, made the
educational process much easier for the users as their need to participate in all of their courses from
one placed was fulfilled. In addition, with the use of moodle there is no need for any licensing cost
and 5 people work on the platform only at the 75% of their time.
In comparison with other universities or colleges that experienced the migration from blackboard to
moodle, in Aristotle University of Thessaloniki six months were needed to complete the process.
University of Dar-es-Salaam (UDSM) had 415 courses, with 73 of them active, and 19.528 users. It
took two active years to migrate from blackboard to moodle. Beaufort Country Community College
(BCCC) had 250 courses per semester with more than 1.000 users and needed two and a half years to
migrate. University of Alberta had 15.000 courses, 8.400 academic and faculty staff, 6.500 support
staff, 51.900 users and seven years were needed to fully migrate from one LMS to the other.
4. ECLASS ONLY FOR OPEN COURSES
As mentioned before, IT center uses the open source platform called “eClass” for hosting its open
courses. There are 385 courses with 279 of them available for anyone around the globe, 189 teachers
and approximately 21.383 learners. There is no cost in using the platform and only 2 people are
needed to support the users and manage the system.
5. CONCLUSION
There is no doubt that turning AUTh into an e-university has many benefits. It is not only the cost
that was decreased but also the administration and management time that is now spent. AUTh
community has understood the significance of elearning and Information Technology Center is
adopting all the new techniques to provide this service worldwide.
236
6. REFERENCES
Μιχάλης Γερόλιμος, Νίκη Καλιακούδα, Τάνια Κάργα, Δέσποινα Παπαδάκη (2015), «Από το Blackboard
στο elearning: η εμπειρία της Υπηρεσίας Ηλεκτρονικών Μαθημάτων της ΒΚΠ».
IT Center (2015), “Survey about the services provided by IT Center for all the users of the
university”.
Nadjia Soldatic (2014), “Migration from BB to Moodle”,
https://prezi.com/sz99wvi99qnc/migrationhttps://prezi.com/sz99wvi99qnc/migration-
from-bb-to-moodle/from-bb-to-moodle/
7. AUTHORS’ BIOGRAPHY
Pinelopi Giovanitsa https://gr.linkedin.com/in/pinelopi-giovanitsa-914034a6

237
EUNIS 2016: Creating Virtual Learning Environment for Higher Education Institutions
Zvonko Martinović, Sandra Kučina Softić, Vedran Mušica
University of Zagreb, University Computing Centre, Croatia, [email protected]
University of Zagreb, University Computing Centre, Croatia, [email protected]
University of Zagreb, University Computing Centre, Croatia, [email protected]
Keywords
VLE, Moodle, Mahara, Adobe Connect, IT infrastructure, user support.
INTRODUCTION
University of Zagreb, University Computing Centre (SRCE) has a central role in the systematic
implementation of e-learning not only at the University of Zagreb but also at other higher education
institutions in the Republic of Croatia.
Providing a stable and rich Virtual Learning Environment (VLE) for a large number of teachers and
students is an extensive and challenging task. The process of setting up and maintaining a VLE
consists out of three important components: software, infrastructure and user support. Each of
these components is essential for a smooth running system and providing good user experience.
In this paper we will present our experience in building and maintaining a VLE at the University of
Zagreb, University Computing Centre SRCE since 2007.
THE E-LEARNING CENTRE AT SRCE
The E-learning Centre (ELC) was established at the University of Zagreb, University Computing
Centre in 2007 and today is a focal point for systematic take-up and supporting e-learning across the
higher education institutions in Croatia. Some of the activities that the Centre engages in are
supporting teachers and students in use of e-learning technologies, cooperating with and supporting
local elearning teams and groups, ensuring a generally accessible e-learning platform (LMS/VLE),
maintaining a network (of professionals, teachers and students) for sharing knowledge and
experience in e-learning but also promoting the use of new technologies in education. Creating a
positive environment and raising awareness of e-learning within the academic community is one of
the priorities as well.
Within the Centre, we try to provide a multidisciplinary support and recognize specific needs of our
users. For that reason the team consists of people with a wide variety of skills such as software
development, instructional design, pedagogy, graphical design etc.
VLE MERLIN - SOFTWARE
Throughout the years, Moodle has established itself as the leading open source Learning Management
System in education. It is widely used in higher education around the world and provides a reliable
system that brings new features and improvements with every new version. Also, since Moodle is
open source software with large community, number of great extension plugins and good online user
and developers documentation. These were some of the main reasons why Centre chose Moodle for
the LMS as well. The first installation was made in 2007 and has been continuously upgraded and
developed since then. The present installation translated is in Croatian language, with number of
adjustments and improvements made by the Centre team based on the needs and requirements of
the teachers. The e-learning platform, together with e-portfolio system, system for webinars and
connection with Information system of Higher Education Institutions (ISVU) builds the VLE for Higher
Education Institutions.
238
Providing a sustainable and easily accessible VLE for over 40 higher education institutions
(universities, faculties, polytechnics and professional schools) requires a system that will satisfy very
diverse needs. Currently, the VLE Merlin hosts over 4,700 e-courses, used by over 2,100 teachers and
28,000 students in the current academic year, with over 12,200 archived e-courses and over 75,200
users in total.
Moodle version 2.9 has been installed for the academic year 2015/2016 and it provides users with
modern and contemporary LMS. Installation of additional modules, development of new ones as well
as modification of existing code enables fitting Moodle to the specific user needs. Integration of
Moodle with Mahara (e-portfolio system) extends the e-learning environment with a tool for student-
centred learning. The e-portfolio system can be used as a single tool or in conjunction with Moodle
enabling an export of data or grading students’ e-portfolios as an assignment. Real-time
communication with rich presentation and meeting control features is provided through webinar
system based on Adobe Connect. Version 9.4, which is presently hosted, enables customization and
integration with Moodle. Integrated and extended systems can enable a different kind of e-learning
and comply with the specific teacher/student needs. VLE can be used for blended learning courses
or organization of the fully online studies.
The VLE at SRCE is titled Merlin (http://merlin.srce.hr) and is connected with other information
systems like ISVU and MojOblak (remote storage system based on ownCloud) further extending
system usability. All systems are accessible using Single Sign-On (SSO) for authentication and
authorization through AAI@EduHr infrastructure. AAI@EduHr is the Authentication and Authorization
Infrastructure of science and higher education in Croatia. Technically, AAI@EduHr is a hub-and-spoke
federation with centralized login service. Each Identity provider (institution) maintains its own LDAP
directory and related IdM software. For SSO implementation at AAI@EduHr Security Assertion Markup
Language (SAML) 2.0 is used.
Since study programmes in Croatia usually last for five years, Merlin is organized in such a way to
enable students to access their courses throughout their entire study. For each academic year, a
separate Moodle installation is used. Teaching and classes are organized within the Merlin system for
the current academic year, while previous courses are archived and still accessible for teachers and
students.
Integration with ISVU is very important as it provides significant benefits in organization of e-courses
but also in management of teachers and students. It is possible to open courses on Merlin directly
from ISVU as well as enrol and synchronize students and teachers and divide students into groups.
Moodle by itself provides great features with integration with many remote storage systems like
Google Drive, Dropbox etc. but to use these systems, users need to create new accounts. Also,
storing learning materials or sensitive research data on remote systems always involve security issues.
Having that in mind, SRCE established the service titled MojOblak which provides a large storage
space (100GB for employees and 20GB for students) to all academic members (researchers, teachers
and students). MojOblak is available within Moodle as any other repository and is accessed using SSO.
With the increased use of mobile devices and importance of timely notifications from the systems,
Moodle Mobile capabilities are used. Customized application called Merlin Mobile is available for
users with Android mobile devices enabling receiving of nearly instant push notifications. Using
Merlin Mobile application it is possible to access online courses using a smartphone, participate in
many activates and send or receive messages and notifications.
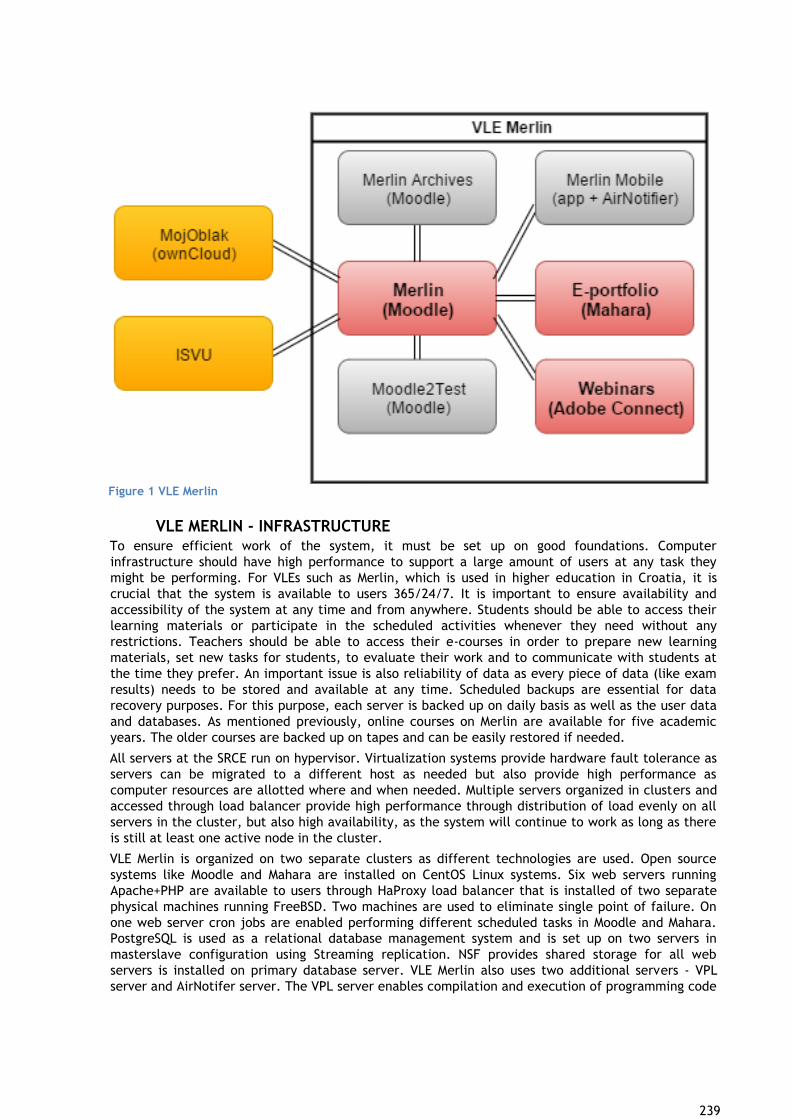
239
Figure 1 VLE Merlin
VLE MERLIN - INFRASTRUCTURE
To ensure efficient work of the system, it must be set up on good foundations. Computer
infrastructure should have high performance to support a large amount of users at any task they
might be performing. For VLEs such as Merlin, which is used in higher education in Croatia, it is
crucial that the system is available to users 365/24/7. It is important to ensure availability and
accessibility of the system at any time and from anywhere. Students should be able to access their
learning materials or participate in the scheduled activities whenever they need without any
restrictions. Teachers should be able to access their e-courses in order to prepare new learning
materials, set new tasks for students, to evaluate their work and to communicate with students at
the time they prefer. An important issue is also reliability of data as every piece of data (like exam
results) needs to be stored and available at any time. Scheduled backups are essential for data
recovery purposes. For this purpose, each server is backed up on daily basis as well as the user data
and databases. As mentioned previously, online courses on Merlin are available for five academic
years. The older courses are backed up on tapes and can be easily restored if needed.
All servers at the SRCE run on hypervisor. Virtualization systems provide hardware fault tolerance as
servers can be migrated to a different host as needed but also provide high performance as
computer resources are allotted where and when needed. Multiple servers organized in clusters and
accessed through load balancer provide high performance through distribution of load evenly on all
servers in the cluster, but also high availability, as the system will continue to work as long as there
is still at least one active node in the cluster.
VLE Merlin is organized on two separate clusters as different technologies are used. Open source
systems like Moodle and Mahara are installed on CentOS Linux systems. Six web servers running
Apache+PHP are available to users through HaProxy load balancer that is installed of two separate
physical machines running FreeBSD. Two machines are used to eliminate single point of failure. On
one web server cron jobs are enabled performing different scheduled tasks in Moodle and Mahara.
PostgreSQL is used as a relational database management system and is set up on two servers in
masterslave configuration using Streaming replication. NSF provides shared storage for all web
servers is installed on primary database server. VLE Merlin also uses two additional servers - VPL
server and AirNotifer server. The VPL server enables compilation and execution of programming code
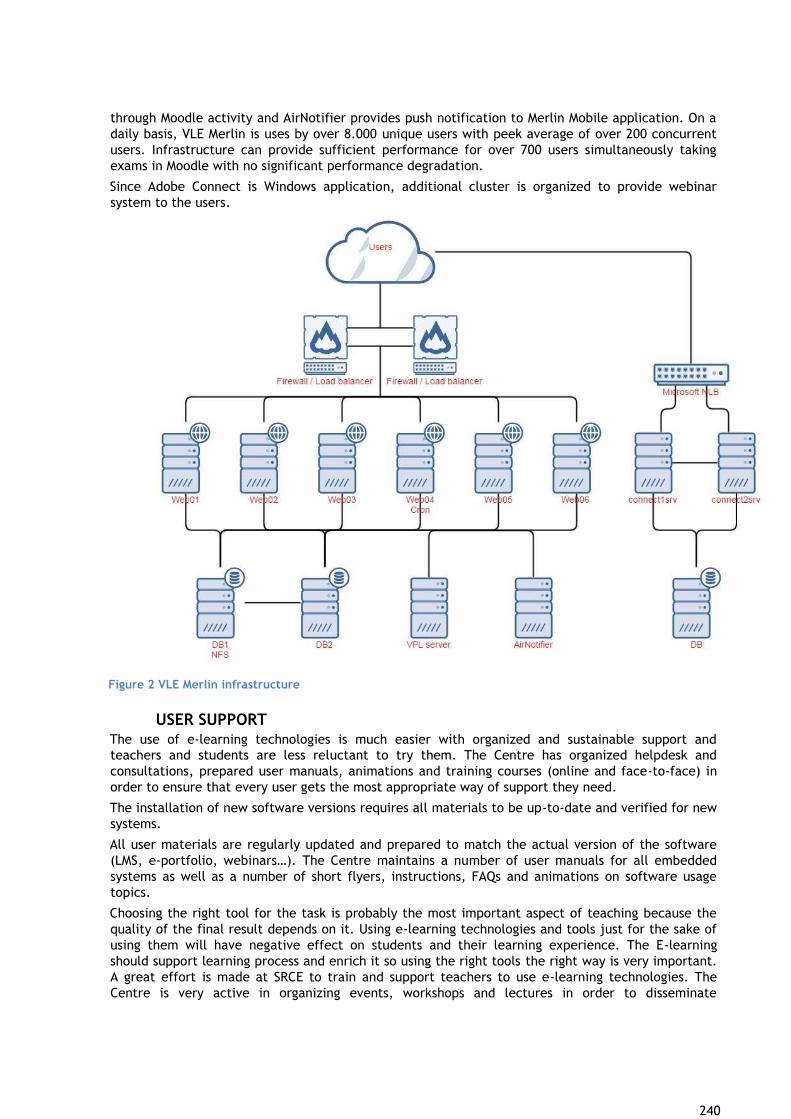
240
through Moodle activity and AirNotifier provides push notification to Merlin Mobile application. On a
daily basis, VLE Merlin is uses by over 8.000 unique users with peek average of over 200 concurrent
users. Infrastructure can provide sufficient performance for over 700 users simultaneously taking
exams in Moodle with no significant performance degradation.
Since Adobe Connect is Windows application, additional cluster is organized to provide webinar
system to the users.
Figure 2 VLE Merlin infrastructure
USER SUPPORT
The use of e-learning technologies is much easier with organized and sustainable support and
teachers and students are less reluctant to try them. The Centre has organized helpdesk and
consultations, prepared user manuals, animations and training courses (online and face-to-face) in
order to ensure that every user gets the most appropriate way of support they need.
The installation of new software versions requires all materials to be up-to-date and verified for new
systems.
All user materials are regularly updated and prepared to match the actual version of the software
(LMS, e-portfolio, webinars…). The Centre maintains a number of user manuals for all embedded
systems as well as a number of short flyers, instructions, FAQs and animations on software usage
topics.
Choosing the right tool for the task is probably the most important aspect of teaching because the
quality of the final result depends on it. Using e-learning technologies and tools just for the sake of
using them will have negative effect on students and their learning experience. The E-learning
should support learning process and enrich it so using the right tools the right way is very important.
A great effort is made at SRCE to train and support teachers to use e-learning technologies. The
Centre is very active in organizing events, workshops and lectures in order to disseminate
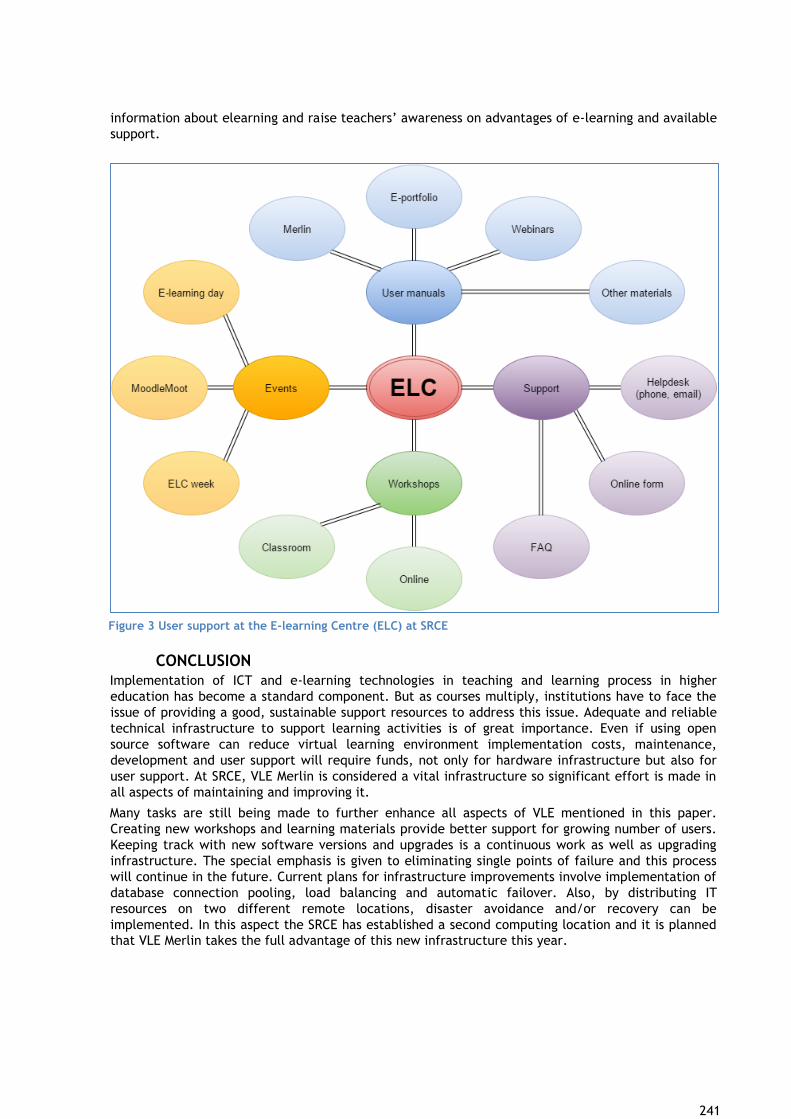
241
information about elearning and raise teachers’ awareness on advantages of e-learning and available
support.
Figure 3 User support at the E-learning Centre (ELC) at SRCE
CONCLUSION
Implementation of ICT and e-learning technologies in teaching and learning process in higher
education has become a standard component. But as courses multiply, institutions have to face the
issue of providing a good, sustainable support resources to address this issue. Adequate and reliable
technical infrastructure to support learning activities is of great importance. Even if using open
source software can reduce virtual learning environment implementation costs, maintenance,
development and user support will require funds, not only for hardware infrastructure but also for
user support. At SRCE, VLE Merlin is considered a vital infrastructure so significant effort is made in
all aspects of maintaining and improving it.
Many tasks are still being made to further enhance all aspects of VLE mentioned in this paper.
Creating new workshops and learning materials provide better support for growing number of users.
Keeping track with new software versions and upgrades is a continuous work as well as upgrading
infrastructure. The special emphasis is given to eliminating single points of failure and this process
will continue in the future. Current plans for infrastructure improvements involve implementation of
database connection pooling, load balancing and automatic failover. Also, by distributing IT
resources on two different remote locations, disaster avoidance and/or recovery can be
implemented. In this aspect the SRCE has established a second computing location and it is planned
that VLE Merlin takes the full advantage of this new infrastructure this year.
242
REFERENCES
Bekić, Z. & Kučina Softić, S. (2006). Proceedings of the EQIBELT Workshops. University of Zagreb,
University Computing Centre, Croatia.
Kučina Softić, S. (2010), Enhancing E-learning Implementation with Organized E-learning Support,
EDEN Annual Conference 2010, Valencia, Spain
SRCE website (2016). Srce: E-learning Centre. Retrieved February 26, 2016, from:
http://www.srce.unizg.hr/en/elc/.
VLE Merlin homepage (2016). Merlin 2015/2016. Retrieved February 26, 2016, from:
http://merlin.srce.hr/.
E-portfolio system homepage (2016). Početna stranica - e-portfolio. Retrieved February 26, 2016,
from: https://moodle.srce.hr/eportfolio/.
Webinar system homepage (2016). Sustav za webinare. Retrieved February 26, 2016, from:
https://connect.srce.hr/.
Moodle website (2016). Moodle - Open-source learning platform | Moodle.org. Retrieved February
26, 2016, from: https://moodle.org/.
Mahara website (2016). Home - Mahara ePortfolio System. Retrieved February 26, 2016, from:
https://mahara.org/.
Adobe website (2016). Webinar software solution and services | Adobe Connect Webinars. Retrieved
February 26, 2016, from: http://www.adobe.com/products/adobeconnect/webinars.html.
AUTHORS’ BIOGRAPHIES
First Author
Zvonko Martinović, M.Edu., Computer Science and Pedagogy Head of unit at
University of Zagreb University Computing Centre Zvonko Martinović is currently
a head of unit at University of Zagreb, University Computing Centre SRCE.
Zvonko has worked at SRCE for 7 years. Within his role he is responsible for
administration, maintenance and development of e-learning systems at SRCE.
Zvonko has expertise in software development and is involved in development
and integration of e-learning systems. Previously Zvonko worked at Valicon d.o.o.
as software developer.
Zvonko graduated at the University of Rijeka, Faculty of Humanities and
Social Sciences.
Second Author
Sandra Kucina Softic is the Assistant Director for the Training and User Support
at the University Computing Centre SRCE. She is also Head of the E-Learning
Centre at the University Computing Centre of the University of Zagreb and the
Office for E-Learning at the University of Zagreb, central support units for the
implementation of e-learning in higher education. She works on e-learning
promotion and implementation at the University of Zagreb, monitoring and
coordination of the implementation and providing support as well as advising
institutions, teachers and students in implementation of new technologies in
learning and teaching processes.
In 2011 she received the Rector's award for successful and motivated work on the development and
systematic implementation of e-learning at the University of Zagreb.
In 2013 she was elected the EDEN Executive Committee member and in 2014 she received EDEN
Fellow
Award.
In 2014 she finished a Master’s Programme in Digital Education at the University of Edinburgh, UK.
243
Third Author
Vedran Mušica, bacc. ing. techn. inf., Computer Science Moodle Administrator
Vedran Mušica is currently Moodle Administrator and developer at University of
Zagreb, University Computing Centre SRCE, and works at SRCE for last 8 years. He
is part of CEU team and is responsible for administration, maintenance and
development of Moodle systems at SRCE.
Vedran has expertise in software development and works as a part of the team for
development of e-learning systems. Previously Vedran worked at Večernji list d.d.
as journalist, webmaster and web developer.
Vedran graduated at Veleučilište Velika Gorica.
244
Bestr: Open Badges and SIS to empower Lifelong & Lifewide Learning
Matteo Bertazzo1, Chiara Carlino
2, Federico Giacanelli
3, Simone Ravaioli
4
1 Cineca, via Magnanelli 6, Casalecchio di Reno (BO) Italy, [email protected] 2 Kion, via Magnanelli 2, Casalecchio di Reno (BO) Italy, [email protected] 3 Cineca, via Magnanelli 6, Casalecchio di Reno (BO) Italy, [email protected] 4 Kion, via Magnanelli 2, Casalecchio di Reno (BO) Italy, [email protected]
Keywords
Open Badges, Lifelong Learning, Non-formal Learning, skills, Student Information System,
credentialing, recognition.
1. Summary Everybody is a learner, everybody learns all the time. University students also learn outside
university. How can technology help turning the nowadays need for constant learning into growth
opportunities – for learners, for universities and for the job market? Bestr is a web-based platform,
leveraging Open Badges to valorize Lifelong & Lifewide learning. Integrated with the Student
Information System and as open as Open Badges are, it aims at bridging the gap between learning
inside and outside university, between learning and working, between working and living.
This paper presents the brand new integration between Bestr and ESSE3 – the Student Information
System used by 80% of Italian universities –, and how this lets universities recognize informal learning
in their formal paths, maintaining the full control over the quality of such learning experiences and
their value according to the student’s path inside university.
2. OPEN BADGES TO VALORIZE SKILLS
Lifelong learning is not a pretty slogan anymore: it has become mandatory for every professional to
keep growing, to build his/her own unique professional path, capable to keep pace with the ever
changing requirements of the job market. The large amount and immediate availability of learning
resources online have also made even more common for learning to take place everywhere –
especially outside learning-dedicated environments: reading articles, watching videos, engaging in
specialized communities. All this learning is a learner’s valuable asset, but misses to be properly
recognized as it doesn’t include an official certification.
On the other hand, employers are eager to find people with specific skills – especially soft skills,
which are not usually part of a formal curriculum studiorum: McKinsey’s data about skills gap and
skills perception is quite significant and prompts all players (learners, employer, learning providers,
assessment providers, public administrations) in taking a step towards bridging the (perceived) skills
gap and taking into account EU’s recommendation on the validation of non-formal and informal
learning.
2.1. Bestr
Bestr is a web platform where skills are represented as Open Badges: any organization can issue
Badges through Bestr, provided that it carefully describes the skills, achievements or membership
the Badge represents, and the criteria used to assign it to a learner. This means that every
experience can be valorized: an internship, a language course, a volunteering activity, a hobby – as
long as an organization is defining and verifying it in a clear fashion, it can become a Badge, and a
learner can claim it.

245
Once made visible through Badges, skills become real: learners decide to get them, so they can
expose them in ePortfolios and digital resumée; companies and organizations can endorse them,
learning providers can suggest learning paths to gain them, assessment providers can verify them.
These are the actions allowed and encouraged by the Bestr platform.
Through Open Badges, Bestr aims at giving visibility to all skills: the ones desired by companies, the
ones owned by learners and the ones developed by learning providers.
3. ENDORSEMENT TO RECOGNIZE VALUE
The “openness” of Open Badges has become even more effective with the release of the
endorsement extension in Open Badges Specifications v1.1 in May 2015: with endorsement external
organizations – i.e. organizations not involved in the process of designing, assessing, or issuing a
Badge – can express their endorsement for a given Badge, at any point of the Badge’s life.
Endorsement thus becomes the way of expressing the broader trust network that crystallizes around
a given skill - aka Badge – and gest to play a big part in the process of adding value to the Badge: the
Badge value is now defined by the trust and value recognized to the issuing organization plus the
trust and value recognized to the endorsing organizations.
Figure 1
4. FROM OPEN BADGES TO CREDITS: INTEGRATION WITH SIS
For the learner, a Badge endorsed by an employer might mean more chances to get a job, and a
Badge endorsed by a learning institution might mean a chance to have his/her learning recognized
within a formal learning path.
So, Open Badge endorsing – if properly integrated within Student Information System - could also be a
shortcut for Universities to digitize the recognition of non formal and informal learning – whether it
happened inside or outside university – into credits or admission points, and include it in the Diploma
Supplement.
By interacting directly with the Student Information System used by 80% of Italian universities
(ESSE3), Bestr encourages this process and provides universities with digital automation tools capable
of allowing a quick and paperless recognition of non-formal learning activities, while still maintaining
the control over what gets recognized, keeping up to the high standards typical of a university and
making sure that recognition happens coherently with each student’s course of study.
246
4.1. Bestr and ESSE3: how it works
The endorsement of a Badge is a completely free operation for a University on Bestr: through
endorsement, the university expresses a positive approach towards the Badge, and this can also be
publicly motivated with a brief statement. ESSE3 allows the operator in the university administration
to view all the Bestr Badges recognized as valid by that University, including Badges issued by the
University and those which have its endorsement. For each Badge, the University can establish
whether any, or how many, credits may be recognized for students who hold them, depending on
their degree course and didactic activities.
Through ESSE3, a university can view which of its students have – on Bestr – obtained the Badges it
approves. In accordance with rules laid down for each degree course and didactic activity, credits
are recognized for students holding the Badges. For example, a student who holds a badge
corresponding to an active educational experience, relevant to his degree course and supported by a
final examination of a standard which has been checked in advance by the University and confirmed
with an endorsement, may have the whole of that didactic activity recognised. For the same Badge,
but for a student following a degree course that is less relevant, recognition may still be conferred as
extra-curricular didactic activity, potentially as an extra amount, for which credits, area, type of
activity and discipline will be defined.
5. CONCLUSIONS With this implementation, Cineca’s aim is to provide Universities with a digital instrument to
implement rapidly, and in an innovative way, something that is already a long established idea of
university teaching: recognizing the value of a language certificate obtained through an experience
abroad, or an internship that has developed competencies that are complementary to a degree
course, and so on. The disruptive element does not lie just on the technological side, making
recognition easier, faster and more transparent for all the operators, but also in the fact that, by
making use of Open Badges, recognition can be activated for competencies that, until a very short
time ago, were not identified in a sufficiently structured way to be taken into consideration by a
University.
The integration between Bestr and ESSE3 has been released in April 2016; the first universities
involved are the University of Milano Bicocca and the members of EduOpen Network, a new Italian
MOOC platform providing Open Badges through Bestr as attendance certificates for its courses.
6. REFERENCES
McKinsey (2013),
http://www.mckinsey.com/client_service/public_sector/mckinsey_center_for_government/educati
on_to_employment
European Council Recommendation of 20 December 2012 on the validation of non-formal and
informal learning, http://eur-
lex.europa.eu/LexUriServ/LexUriServ.do?uri=OJ:C:2012:398:0001:0005:EN:PDF
Open Badges Specifications, https://openbadgespec.org/
Bestr, https://bestr.it/
Eduopen, http://eduopen.org/en/
247
7. AUTHORS’ BIOGRAPHIES
Matteo Bertazzo holds a Master Degree in Computer Science from Ca’ Foscari
University of Venice, Italy. After a research fellowship in Location-based
Services from the National Research Council he works as web developer and
technical project manager. He currently works as Solution Designer and PMP®
certified Project Manager at CINECA InterUniversity Consortium. He has been
involved in a number of Education and Digital Humanities projects, both for the
consortium’s members and for EU-funded projects. He currently leads the
development of Bestr, the Italian Open Badge platform. See Linkedin profile at
https://www.linkedin.com/in/mbertazz
Chiara Carlino takes care of the online and offline communication for the Bestr
project, as well as for Kion and its offer. With a literary background and a
bachelor in Philosophy (2005), she works at the intersection between humans
and technologies: from semantic web to digital communication, from web
analysis and monitoring to user interfaces, from functional requirements to
technological applications capable of changing social interactions - such as
Open Badges. Chiara already presented at Eunis 2010 (Warsaw) and 2011
(Dublin), and is co-organizer of the 14th Epic Conference (http://openepic.eu).
See Linkedin profile at https://it.linkedin.com/in/carlinochiara
Federico Giacanelli fell in love with Physics first, getting a Master Degree in
Theoretical Physics from the University of Bologna (1993) then a Physics PhD
from the University of Torino (1998). He then fell in love with the Internet and
the Web, dedicating the rest of his life to networking administration, Multimedia
and streaming services, Ontology based portals, Blogs and CMSs at CINECA
InterUniversity Consortium. He loves exploring digital human interactions so he
works on web application design, from gathering functional requirements to UX
design. He is currently responsible for Bestr UX development. See Linkedin
profile at https://it.linkedin.com/in/fedgiaca
Born and raised in Italy, Simone Ravaioli holds a Bachelor and Masters Degree in
Management Information System from Loyola University Chicago.
After a corporate experience in the US he returns to Italy in 2006 through
CINECA, the leading consortium of Italian Universities dedicated to developing
software for HE. He currently holds the position of International Affairs Manager
and Country Manager Turkey. Simone is founding member of RS3G - an
international group of HE implementers focusing on data exchange standards.
He also represents RS3G in the European Standardization Committee (CEN). In
2010 he is appointed Chair of the first EAIE Task Force called DSDP - Digital
Student Data Portability. In 2014 the epiphany with Open Badges turned him
into the Chief Dreamer of Bestr, the first Italian badging platform and with that a deep involvement
with the international community. Simone is a Slow Food activist and considers himself a "FreeMover"
and a Conversation Instigator.
248
Next-Generation Digital Learning Environments: Closer Than You Think!
Bruce Maas1, Rob Abel
2, Jack Suess
3, John O’Brien4
1Univ. of Wisconsin, Division of IT, Madison Wisconsin, [email protected]
2IMSglobal, 801 International Drive, Lake Mercy Florida 32746, [email protected]
3University of Maryland Baltimore County, Division of IT, Baltimore Md. 21250,
[email protected] 4EDUCUASE, 282 Century Plaza, Louisville Co. 80027,
Keywords
NGDLE, Unizin, personalization, interoperability, accessibility, caliper, analytics.
1. Summary
EDUCAUSE, with support of the Bill and Melinda Gates Foundation, ran focus groups in
2014 looking at digital learning environments and what was missing that would allow
them to better support teaching and learning. What came out of these discussions has
been named next-generation digital learning environments (NGDLE). This abstract and
the accompanying session will focus on what the essential requirements are for NGDLE
and give an update on one consortium of universities, named Unizin, that is working to
implement and deploy an advanced digital learning environment.
2. Introduction
The web-based learning management system (LMS) was first introduced approximately
twenty years ago. The EDUCAUSE Center for Applied Research, in a study on faculty and
student usage of technology, found that 85 percent of faculty and 83 percent of student
use the LMS regularly1. As a mainstream educational technology service, few technology
products have so quickly reached this level of adoption. Despite this high adoption rate,
just 41% of faculty that were surveyed report using the LMS to promote interaction
outside the classroom.2
In the report “The Next Generation Digital Learning Environment,”3 it was noted that the
LMS has been highly successful in enabling the administration of learning but less so at
enabling learning itself. In addition, the design of most LMS products has been course-
and instructor-centric and not designed for students to create customizable pathways.
In 2013, Jack Suess, Malcolm Brown, and Rob Abel wrote an EDUCAUSE Review article
titled “A New Architecture for Learning.”4 They proposed that today’s learner is in a
position to integrate a wide array of personal connections, resources, and collaborations
– both local to and external to the institution – in order to construct the pathways
needed to meet personal educational goals. They noted that many refer to this type of
learning as connected learning. Similarly, instructors have an unprecedented number of
options for how they design and execute a course.
The authors note that as the LMS became more essential to course administration, IT
organizations develop a production mindset to the operation of the LMS and don’t
encourage adoption of innovative new products without months of testing. As a result,
there is little incentive to explore new applications and services, let alone encourage
personalization. The result is that this productionmentality often serves as an
impediment to academic innovation by faculty.
3. Next-Generation Digital Learning Environment (NGDLE)
The NGDLE report5 describes an environment that doesn’t replace the LMS, but augments
it, to focus on five dimensions of core functionality: (1)interoperability and integration;
249
(2)personalization; (3) analytics, advising, and learning assessment; (4) collaboration;
and (5) accessibility and universal design. The report notes that some dimensions are
further along and better defined; however, all five must be built out to meet the vision.
The report encourages our higher education community to envision the NGDLE as
something akin to a Lego Set. They note two benefits from this approach, if we
standardize how the pieces fit together, then we can build this over time and leverage
many parts available today. Second, this approach readily allows for personalization.
4. Interoperability and Integration
Interoperability is the lynchpin of the NGDLE. As noted in the report, much of the
proposed plans is built from standards developed by IMS. IMS was founded in 1995, as a
project within the National Learning Infrastructure Initiative of EDUCOM (now EDUCAUSE).
In 1999, IMS became an independent organization with a mission to advance technology
that can affordably scale and improve education participation and attainment. IMS now
has 350 members (55 from higher education) that participate in activities around
standards creation, innovative use of technology, and the large-scale deployment to
achieve learning impact.
IMS has four major efforts that align closely with the NGDLE, these include: accessibility
– the IMS standard Access for All6; analytics – the IMS Caliper Analytics standard7;
interoperability – the IMS LTI2 standard8; and collaboration and personalization – the IMS
Community App Sharing Architecture (CASA) project9.
5. Unizin Project
Unizin is a consortium of twenty-two higher-education institutions, educating over 700,000 students, that is facilitating the transition toward collaborative digital education with the goal to improve learner success. Founded in 2014, their mission is to improve the learning experience by providing an environment built on collaboration, data, standards, and scale.
Unizin leverages standards and has focused heavily on creating NGDLE Lego blocks in the areas of collaboration; analytics, advising, and learning assessment; and interoperability and integration. Examples of these projects include content tools for eText and course design, analytics tool, and support tools for faculty and staff.
6. Summary
Through work such as the NGDLE, higher education is creating a shared vision for the
creation of connected-learning environments that focus on personalized learning. These
environments are critical for using technology to affordably scale and improve education.
While there has been much work in collaborative research between Europe and the
United States, this has been less so when it comes to educational tools. We hope that
through our session we will begin a dialogue that can help both regions work closely
together towards our common goals of improving education.
7. References
1 Eden Dahlstrom and Jacqueline Bichsel, ECAR Study of Undergraduate Students and
Information Technology, 2014, research report (Louisville, CO: ECAR, October 2014). 2 Eden Dahlstrom, D. Christopher Brooks, and Jacqueline Bichsel, The Current Ecosystem of
Learning Management Systems in Higher Education: Student, Faculty, and IT Perspectives,
research report (Louisville, CO: ECAR, September 2014). 3 Malcolm Brown, Joanne Dehoney, Nancy Millichap, The Next Generation Digital Learning
Environment, research report (Louisville, CO: ELI, April 2015). 4 Rob Abel, Malcolm Brown, and John Suess, “A New Architecture for Learning,” EDUCAUSE
Review 48, no. 5 (September/October 2013), http://er.educause.edu/articles/2013/10/a-
250
new-architecturehttp://er.educause.edu/articles/2013/10/a-new-architecture-for-
learningfor-learning. 5 Brown, Dehoney, Millichap, The Next Generation Digital Learning Environment 6 https://www.imsglobal.org/activity/accessibility 7 https://www.imsglobal.org/activity/caliperram 8 https://www.imsglobal.org/lti-v2-introduction 9 https://www.imsglobal.org/activity/community-app-sharing-architecture-casa
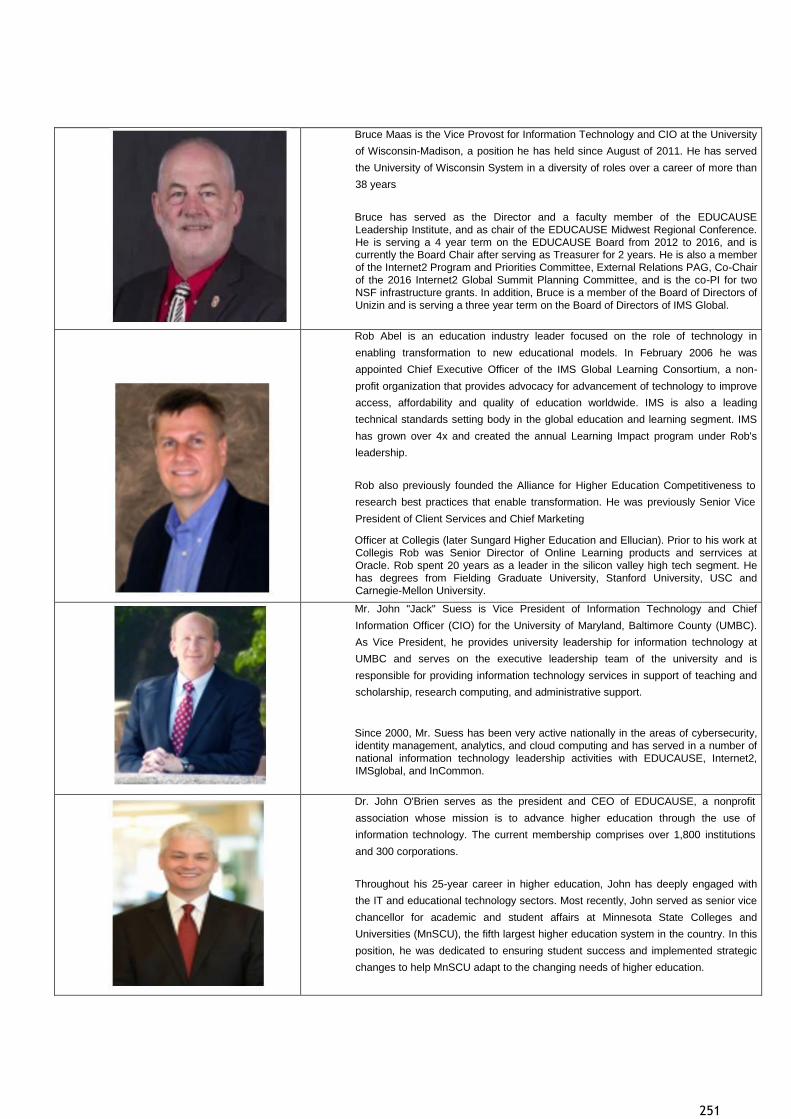
251
Bruce Maas is the Vice Provost for Information Technology and CIO at the University
of Wisconsin-Madison, a position he has held since August of 2011. He has served
the University of Wisconsin System in a diversity of roles over a career of more than
38 years
Bruce has served as the Director and a faculty member of the EDUCAUSE
Leadership Institute, and as chair of the EDUCAUSE Midwest Regional Conference.
He is serving a 4 year term on the EDUCAUSE Board from 2012 to 2016, and is currently the Board Chair after serving as Treasurer for 2 years. He is also a member
of the Internet2 Program and Priorities Committee, External Relations PAG, Co-Chair
of the 2016 Internet2 Global Summit Planning Committee, and is the co-PI for two
NSF infrastructure grants. In addition, Bruce is a member of the Board of Directors of
Unizin and is serving a three year term on the Board of Directors of IMS Global.
Rob Abel is an education industry leader focused on the role of technology in
enabling transformation to new educational models. In February 2006 he was
appointed Chief Executive Officer of the IMS Global Learning Consortium, a non-
profit organization that provides advocacy for advancement of technology to improve
access, affordability and quality of education worldwide. IMS is also a leading
technical standards setting body in the global education and learning segment. IMS
has grown over 4x and created the annual Learning Impact program under Rob's
leadership.
Rob also previously founded the Alliance for Higher Education Competitiveness to
research best practices that enable transformation. He was previously Senior Vice
President of Client Services and Chief Marketing
Officer at Collegis (later Sungard Higher Education and Ellucian). Prior to his work at
Collegis Rob was Senior Director of Online Learning products and serrvices at
Oracle. Rob spent 20 years as a leader in the silicon valley high tech segment. He
has degrees from Fielding Graduate University, Stanford University, USC and
Carnegie-Mellon University.
Mr. John "Jack" Suess is Vice President of Information Technology and Chief
Information Officer (CIO) for the University of Maryland, Baltimore County (UMBC).
As Vice President, he provides university leadership for information technology at
UMBC and serves on the executive leadership team of the university and is
responsible for providing information technology services in support of teaching and
scholarship, research computing, and administrative support.
Since 2000, Mr. Suess has been very active nationally in the areas of cybersecurity,
identity management, analytics, and cloud computing and has served in a number of
national information technology leadership activities with EDUCAUSE, Internet2,
IMSglobal, and InCommon.
Dr. John O'Brien serves as the president and CEO of EDUCAUSE, a nonprofit
association whose mission is to advance higher education through the use of
information technology. The current membership comprises over 1,800 institutions
and 300 corporations.
Throughout his 25-year career in higher education, John has deeply engaged with
the IT and educational technology sectors. Most recently, John served as senior vice
chancellor for academic and student affairs at Minnesota State Colleges and
Universities (MnSCU), the fifth largest higher education system in the country. In this
position, he was dedicated to ensuring student success and implemented strategic
changes to help MnSCU adapt to the changing needs of higher education.

252

253
EMREX in Poland supporting internal mobility
Janina Mincer-Daszkiewicz ([email protected]), Wojciech Rygielski ([email protected]),
Faculty of Mathematics, Informatics, and Mechanics, University of Warsaw, Banacha 2, 02-097
Warszawa, Poland
Keywords
EMREX, internal mobility, admission system, Learning Agreement, Transcript of Records, USOS API,
Federated IdM, Erasmus Without Paper
1. ABSTRACT
EMREX [1, 3] is the ERASMUS+ Key Action 3 project (grant number 388499-EPP-1-2014-2-FI-EPPKA3PI-
POLICY) which aims at building a platform for an effective transfer of mobile students’
achievements between partner institutions and thus promoting higher attainment level to student
mobility in higher education. Five countries, Finland, Norway, Sweden, Denmark and Italy, agreed to
add student mobility plug-ins (SMP) to local student information systems (SIS), set up national
contact points (NCP) at country-level through which partner institutions may get access to data on
student achievements, and run field trial. Poland is the evaluation body which is responsible in the
project for the evaluation of the impact of the EMREX platform on the student mobility and the
quality and scalability of the solution from the technical perspective.
To avoid legal issues of data privacy, the partners in the project decided that in EMREX data transfer
will be initiated by data owners, i.e. mobile students. Student will log in to SIS of home institution,
with help of SMP be directed to the NCP of the country of the host institution, be authorized by the
SIS of the host institution, and trigger transfer of achievements.
The EMREX platform seems to solve a well recognized problem in a simple and elegant way.
Development of the software components needed to join the network does not seem like a difficult
task. The designed solution looks attractive from the perspective of the main stakeholders, mobile
students and university administration.
Poland has a rich program of internal mobility, called MOST (Polish word for bridge), see [5]. In
academic year 2015/2016, 534 students from 28 higher education institutions (HEI) spend semester
or two in other Polish HEI. 15 of these institutions belong to MUCI consortium [6] and use the same
SIS, called University Study-Oriented System (USOS, [7]). If the Polish partner integrates USOS with
the EMREX platform mobile students from these institutions will be able to easily transfer their
transcripts of records from USOS installation at host institution to USOS installation at home
institution. The effect of scale will be immediate. If the system proves useful internally, going
international will be an easy next step.
In the paper we describe EMREX solution for Poland internal mobility from the technical and
organizational perspective.
2. INTRODUCTION
EMREX [1, 3] is the ERASMUS+ Key Action 3 project which aims at building a platform for more
effective transfer of mobile students’ achievements between partner institutions and thus
promoting higher attainment level to student mobility in higher education and also encouraging
more effective recognition of prior learning and avoiding overlapping studies. Five countries, Finland,
Norway, Sweden, Denmark and Italy, agreed to develop student mobility plug-ins (SMP) to local
student information systems (SIS), set up national contact points (NCP) at country-level through
which partner institutions from other countries may get access to data on student achievements,
and run field trial. Poland is the evaluation body which is responsible in the project for the
evaluation of the impact of the EMREX platform on the student mobility and of the quality and
scalability of the solution from the technical perspective.
254
To avoid legal issues of data privacy, the partners in the project decided that in EMREX data transfer
will be initiated by data owners, i.e. mobile students. Student will log in to SIS of home institution
using SMP, be directed to the NCP of the country of the host institution, be authorized by the SIS of
the host institution, and trigger transfer of achievements.
The EMREX platform seems to solve a well recognized problem of timely delivery of student
achievements in a simple and elegant way. Development of the software components needed to
join the network does not seem to be a difficult task. NCP is (possibly) one per country, SMP is one
per software developer of SIS, and there is also one central registry with binding information. The
designed solution looks attractive from the perspective of main stakeholders, mobile students and
university administration.
Poland has a rich program of internal mobility, called MOST (Polish word for bridge), see [5]. It is
based on the rules similar to Socrates/Erasmus but is limited to students of Polish HEIs who want to
spend one or two semesters at other Polish HEI. Program is coordinated by UAC (University
Accreditation Commission) established in 1998 by the Conference of Rectors of Polish Universities. In
academic year 2015/2016, 534 students from 28 HEIs spend semester or two in another Polish HEI.
There is a central admission system for MOST (called IRK-MOST) run by the University of Warsaw.
The system also supports exchange of documents such as Learning Agreement and Transcript of
Records; however the program coordinators and partner institutions have not yet decided to deploy
that functionality.
USOS [7] is a student information system developed by the consortium MUCI [6] of 47 Polish HEIs. 15
of these institutions are involved in MOST. IRK-MOST, like USOS, was developed by MUCI, by the
same development team which also takes part in the EMREX project. If the Polish partner integrates
USOS with the EMREX platform mobile students from these institutions will be able to easily transfer
their transcripts of records from USOS installation at host institution to USOS installation at home
institution. The effect of scale will be immediate. If the system proves useful internally, going
international will be an easy next step.
More challenging than software development are changes in institutional administrative procedures.
Testing them internally can be a useful proof-of-concept.
Polish team decided to extend its role in the project and build EMREX components for Polish
institutions using USOS. In this paper we present EMREX solution for Poland internal mobility from
the technical and organizational perspective. Program MOST and its organization inside Poland is
described in more detail in chapter 3. EMREX goals and the network architecture are explained in
chapter 4. Chapter 5 contains description of EMREX for Polish HEIs from MUCI consortium and is the
main chapter of this paper. Final thoughts are presented in chapter 6.
3. PROGRAM MOST
MOST (Polish word for bridge) is a mobility program for Polish students. It is based on the rules
similar to Socrates/Erasmus+ but is limited to students of Polish HEIs who want to spend one or two
semesters at other Polish HEI. Program is coordinated by UAC (University Accreditation Commission)
established in 1998 by the Conference of Rectors of Polish Universities. The main goals of UAC's
activity are:
• creation of an accreditation system of courses of studies at universities,
• creation and implementation of the standards of the education quality at universities,
• enhancement of the education quality,
• recognition of the HEIs ensuring high quality of the education,
• promotion of student mobility both in a national and international dimension.
Program MOST is carried since 1999. It involves 20 Polish public universities, members of UAC, and 8
associated HEIs. It covers over 400 fields of studies. Over 6000 students took part in the program
since its start. Statistics for academic year 2015/2016 give some idea of the scope of the program:
• 2967 study offers,
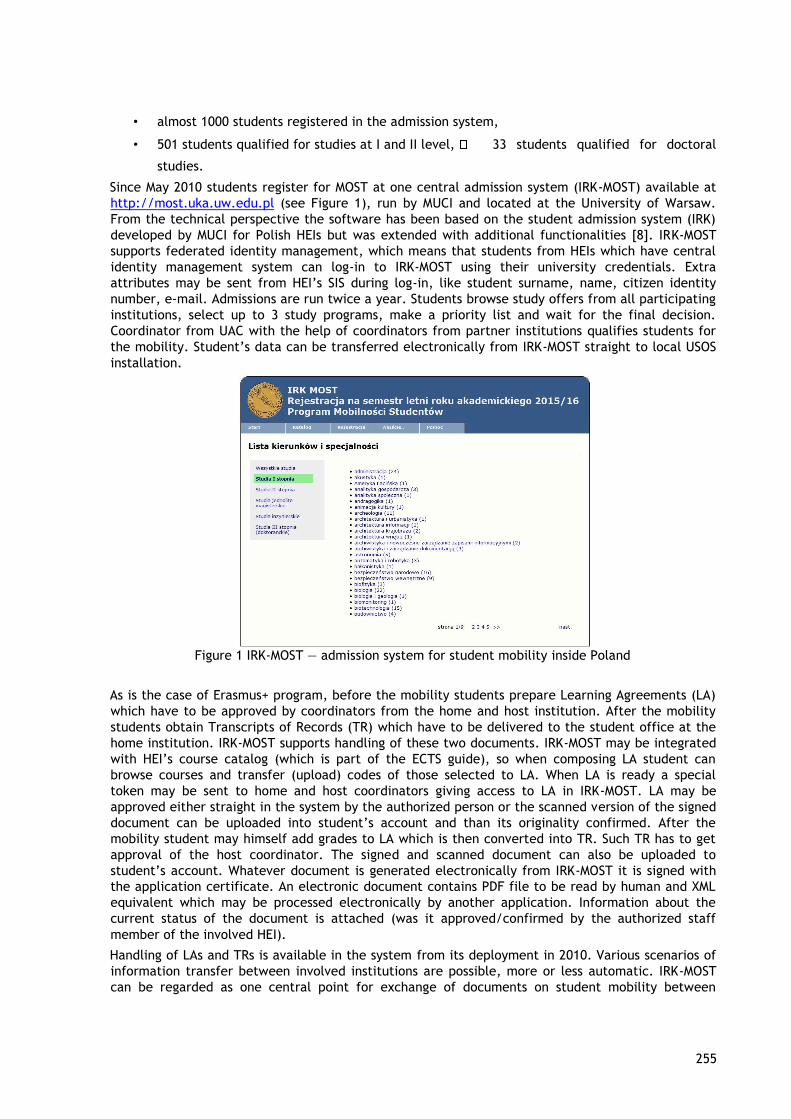
255
• almost 1000 students registered in the admission system,
• 501 students qualified for studies at I and II level, 33 students qualified for doctoral
studies.
Since May 2010 students register for MOST at one central admission system (IRK-MOST) available at
http://most.uka.uw.edu.pl (see Figure 1), run by MUCI and located at the University of Warsaw.
From the technical perspective the software has been based on the student admission system (IRK)
developed by MUCI for Polish HEIs but was extended with additional functionalities [8]. IRK-MOST
supports federated identity management, which means that students from HEIs which have central
identity management system can log-in to IRK-MOST using their university credentials. Extra
attributes may be sent from HEI’s SIS during log-in, like student surname, name, citizen identity
number, e-mail. Admissions are run twice a year. Students browse study offers from all participating
institutions, select up to 3 study programs, make a priority list and wait for the final decision.
Coordinator from UAC with the help of coordinators from partner institutions qualifies students for
the mobility. Student’s data can be transferred electronically from IRK-MOST straight to local USOS
installation.
Figure 1 IRK-MOST — admission system for student mobility inside Poland
As is the case of Erasmus+ program, before the mobility students prepare Learning Agreements (LA)
which have to be approved by coordinators from the home and host institution. After the mobility
students obtain Transcripts of Records (TR) which have to be delivered to the student office at the
home institution. IRK-MOST supports handling of these two documents. IRK-MOST may be integrated
with HEI’s course catalog (which is part of the ECTS guide), so when composing LA student can
browse courses and transfer (upload) codes of those selected to LA. When LA is ready a special
token may be sent to home and host coordinators giving access to LA in IRK-MOST. LA may be
approved either straight in the system by the authorized person or the scanned version of the signed
document can be uploaded into student’s account and than its originality confirmed. After the
mobility student may himself add grades to LA which is then converted into TR. Such TR has to get
approval of the host coordinator. The signed and scanned document can also be uploaded to
student’s account. Whatever document is generated electronically from IRK-MOST it is signed with
the application certificate. An electronic document contains PDF file to be read by human and XML
equivalent which may be processed electronically by another application. Information about the
current status of the document is attached (was it approved/confirmed by the authorized staff
member of the involved HEI).
Handling of LAs and TRs is available in the system from its deployment in 2010. Various scenarios of
information transfer between involved institutions are possible, more or less automatic. IRK-MOST
can be regarded as one central point for exchange of documents on student mobility between
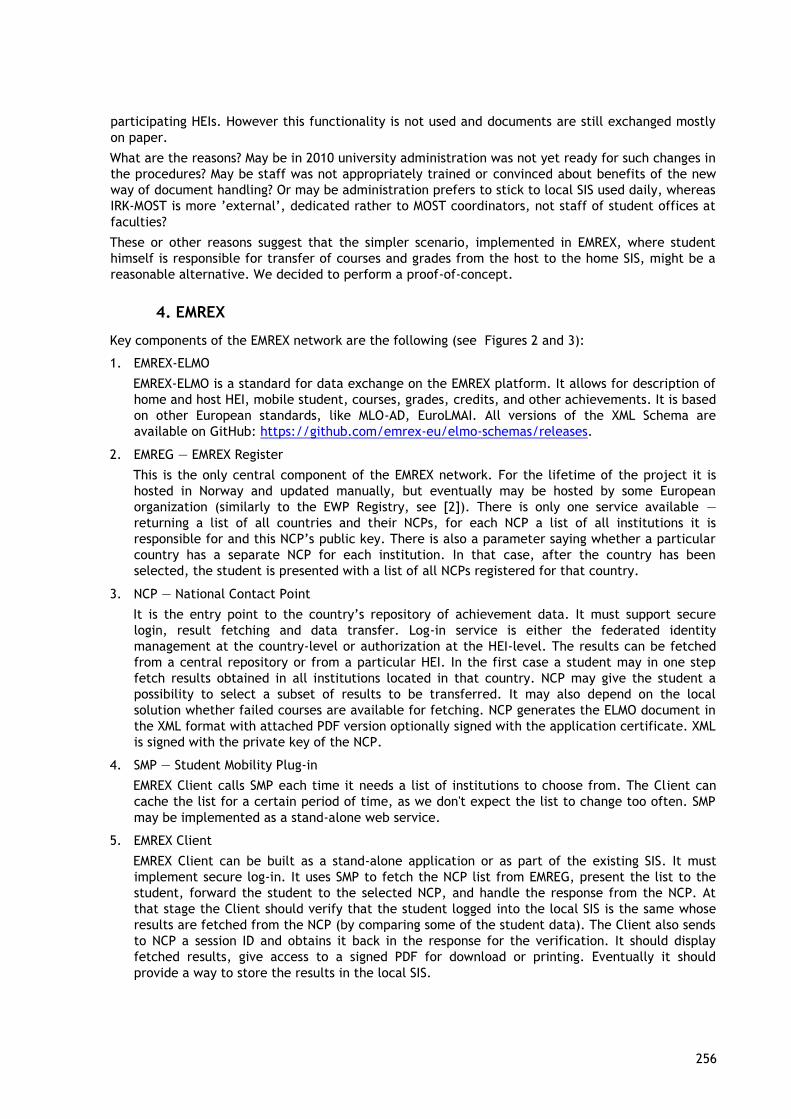
256
participating HEIs. However this functionality is not used and documents are still exchanged mostly
on paper.
What are the reasons? May be in 2010 university administration was not yet ready for such changes in
the procedures? May be staff was not appropriately trained or convinced about benefits of the new
way of document handling? Or may be administration prefers to stick to local SIS used daily, whereas
IRK-MOST is more ’external’, dedicated rather to MOST coordinators, not staff of student offices at
faculties?
These or other reasons suggest that the simpler scenario, implemented in EMREX, where student
himself is responsible for transfer of courses and grades from the host to the home SIS, might be a
reasonable alternative. We decided to perform a proof-of-concept.
4. EMREX
Key components of the EMREX network are the following (see Figures 2 and 3):
1. EMREX-ELMO
EMREX-ELMO is a standard for data exchange on the EMREX platform. It allows for description of
home and host HEI, mobile student, courses, grades, credits, and other achievements. It is based
on other European standards, like MLO-AD, EuroLMAI. All versions of the XML Schema are
available on GitHub: https://github.com/emrex-eu/elmo-schemas/releases.
2. EMREG — EMREX Register
This is the only central component of the EMREX network. For the lifetime of the project it is
hosted in Norway and updated manually, but eventually may be hosted by some European
organization (similarly to the EWP Registry, see [2]). There is only one service available —
returning a list of all countries and their NCPs, for each NCP a list of all institutions it is
responsible for and this NCP’s public key. There is also a parameter saying whether a particular
country has a separate NCP for each institution. In that case, after the country has been
selected, the student is presented with a list of all NCPs registered for that country.
3. NCP — National Contact Point
It is the entry point to the country’s repository of achievement data. It must support secure
login, result fetching and data transfer. Log-in service is either the federated identity
management at the country-level or authorization at the HEI-level. The results can be fetched
from a central repository or from a particular HEI. In the first case a student may in one step
fetch results obtained in all institutions located in that country. NCP may give the student a
possibility to select a subset of results to be transferred. It may also depend on the local
solution whether failed courses are available for fetching. NCP generates the ELMO document in
the XML format with attached PDF version optionally signed with the application certificate. XML
is signed with the private key of the NCP.
4. SMP — Student Mobility Plug-in
EMREX Client calls SMP each time it needs a list of institutions to choose from. The Client can
cache the list for a certain period of time, as we don't expect the list to change too often. SMP
may be implemented as a stand-alone web service.
5. EMREX Client
EMREX Client can be built as a stand-alone application or as part of the existing SIS. It must
implement secure log-in. It uses SMP to fetch the NCP list from EMREG, present the list to the
student, forward the student to the selected NCP, and handle the response from the NCP. At
that stage the Client should verify that the student logged into the local SIS is the same whose
results are fetched from the NCP (by comparing some of the student data). The Client also sends
to NCP a session ID and obtains it back in the response for the verification. It should display
fetched results, give access to a signed PDF for download or printing. Eventually it should
provide a way to store the results in the local SIS.
257
Security of the solution is obtained through login at the Client and NCP, HTTPS protocol used to
transfer data over Internet, signing XML, validating a student at the Client.
Implementation is partly based on the existing infrastructure (student authorization, data
repositories). Reusable parts of the implementation are open-sourced, available on GitHub
(https://github.com/emrex-eu).
Figure 2 Main components of the EMREX network (from resources of the EMREX project)
Figure 3 Scenario of data exchange via EMREX network (from resources of the EMREX project)
5. EMREX IN POLAND
In Poland, every HEI has a separate authentication system. There is also no central repository of
student achievements. Having multiple NCPs, one for each HEI, seems to be the most appropriate
option. This is yet to be decided how the list of NCPs will be updated in EMREG (PUSH or PULL).
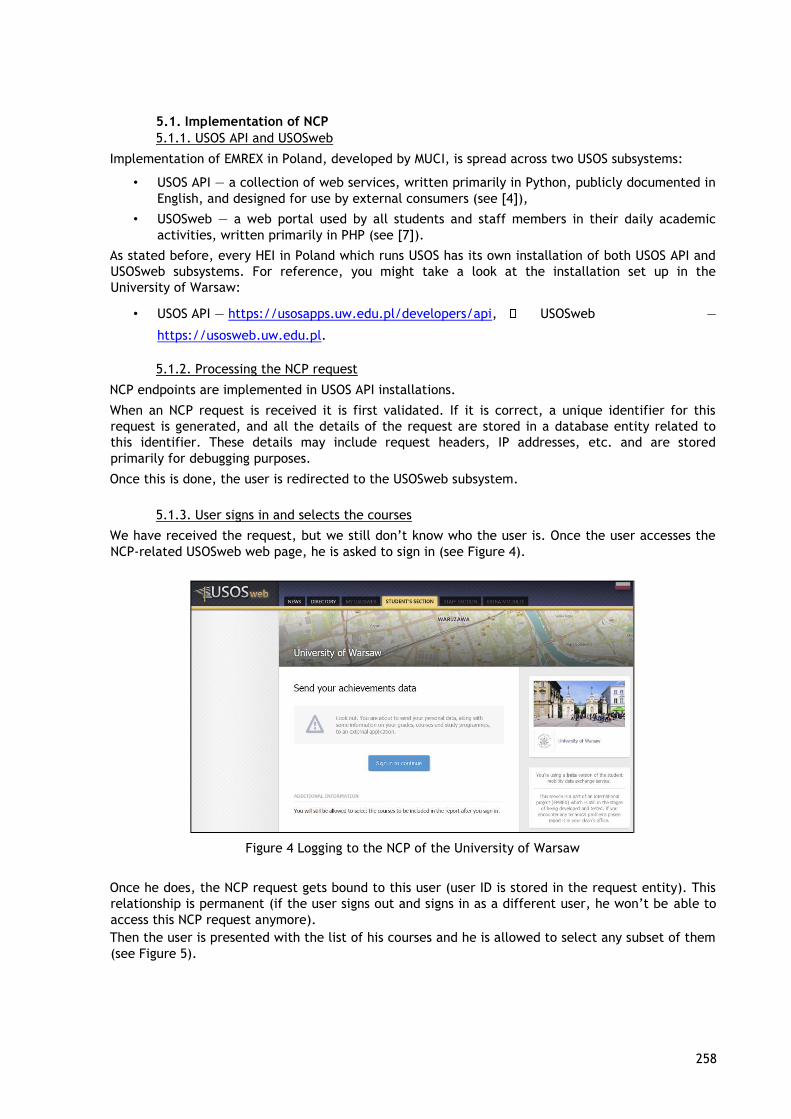
258
5.1. Implementation of NCP
5.1.1. USOS API and USOSweb
Implementation of EMREX in Poland, developed by MUCI, is spread across two USOS subsystems:
• USOS API — a collection of web services, written primarily in Python, publicly documented in
English, and designed for use by external consumers (see [4]),
• USOSweb — a web portal used by all students and staff members in their daily academic
activities, written primarily in PHP (see [7]).
As stated before, every HEI in Poland which runs USOS has its own installation of both USOS API and
USOSweb subsystems. For reference, you might take a look at the installation set up in the
University of Warsaw:
• USOS API — https://usosapps.uw.edu.pl/developers/api, USOSweb —
https://usosweb.uw.edu.pl.
5.1.2. Processing the NCP request
NCP endpoints are implemented in USOS API installations.
When an NCP request is received it is first validated. If it is correct, a unique identifier for this
request is generated, and all the details of the request are stored in a database entity related to
this identifier. These details may include request headers, IP addresses, etc. and are stored
primarily for debugging purposes.
Once this is done, the user is redirected to the USOSweb subsystem.
5.1.3. User signs in and selects the courses
We have received the request, but we still don’t know who the user is. Once the user accesses the
NCP-related USOSweb web page, he is asked to sign in (see Figure 4).
Figure 4 Logging to the NCP of the University of Warsaw
Once he does, the NCP request gets bound to this user (user ID is stored in the request entity). This
relationship is permanent (if the user signs out and signs in as a different user, he won’t be able to
access this NCP request anymore). Then the user is presented with the list of his courses and he is allowed to select any subset of them
(see Figure 5).
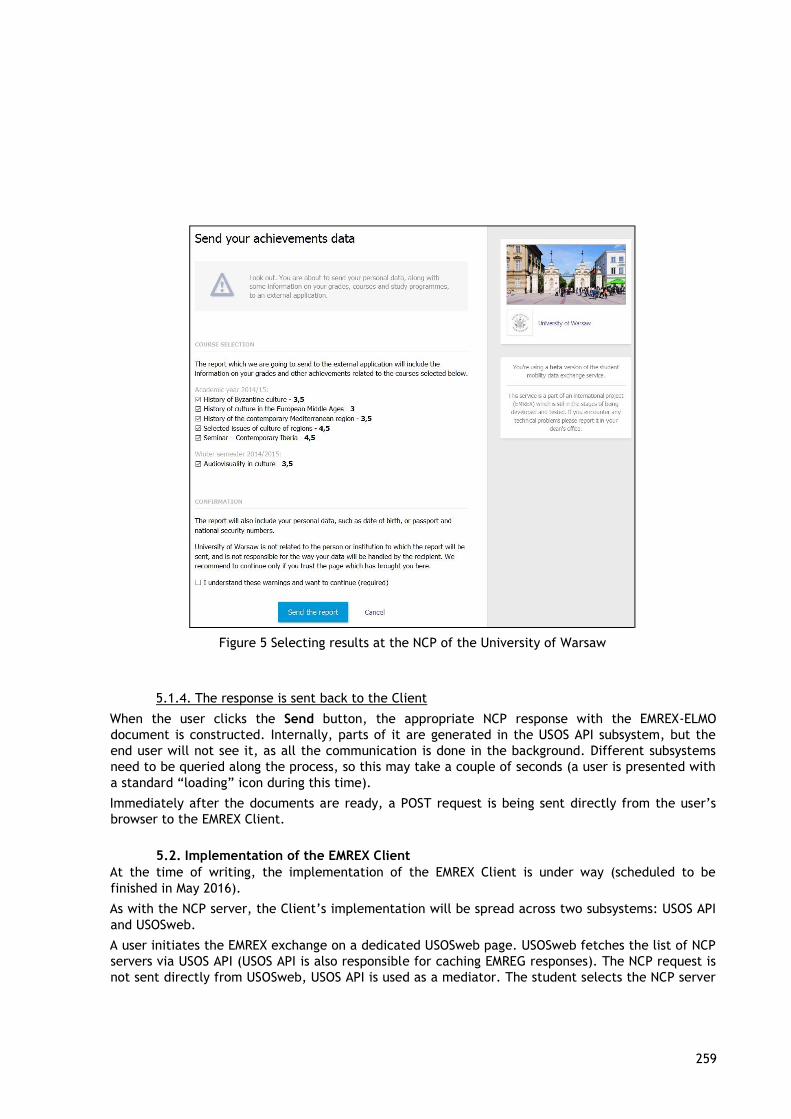
259
Figure 5 Selecting results at the NCP of the University of Warsaw
5.1.4. The response is sent back to the Client
When the user clicks the Send button, the appropriate NCP response with the EMREX-ELMO
document is constructed. Internally, parts of it are generated in the USOS API subsystem, but the
end user will not see it, as all the communication is done in the background. Different subsystems
need to be queried along the process, so this may take a couple of seconds (a user is presented with
a standard “loading” icon during this time).
Immediately after the documents are ready, a POST request is being sent directly from the user’s
browser to the EMREX Client.
5.2. Implementation of the EMREX Client
At the time of writing, the implementation of the EMREX Client is under way (scheduled to be
finished in May 2016).
As with the NCP server, the Client’s implementation will be spread across two subsystems: USOS API
and USOSweb.
A user initiates the EMREX exchange on a dedicated USOSweb page. USOSweb fetches the list of NCP
servers via USOS API (USOS API is also responsible for caching EMREG responses). The NCP request is
not sent directly from USOSweb, USOS API is used as a mediator. The student selects the NCP server
260
on the USOSweb page, and then USOS API method is called with the server’s URL. A unique ID is
generated for this request (session Id) and a database entity is stored to track it. Then the user is
redirected to the NCP URL with the return URL parameter referring back to a proper receiver USOS
API method.
Once the student selects the courses and is redirected back to the receiver method, the underlying
entity is updated and the received EMREX-ELMO document is stored and verified. The user is
redirected to the home USOSweb subsystem and presented with the results of the EMREX-ELMO
processing. If the verification process goes well, and the local system is able to understand the data
in the document, then it may additionally allow the student to select the courses which he would
like to store locally (this being an extra option).
Suspicious import requests would need to be approved by an authorized staff member (the attached
PDF document should be useful in this case).
5.3. Other issues
The solution will first be made available for testing on the USOS DEMO server. It is a test bed of
USOS based applications, with anonymised data, fully functional, available for testers, training, and
also for external companies which integrate their products with USOS.
A student who wants to transfer results from one HEI to another should log-in to both systems.
Federated identity management for Polish HEIs would substantially help in solving the problem of
student authorization. MUCI will recommend HEIs to join the federation. There is also a problem of
the validity of a student account in home and host institutions after students leave the institution. It
seems reasonable to keep these accounts active indefinitely, not only to assist students in accessing
their data in the university repository but also to encourage them to maintain contact with their
Alma Mater.
Electronic data exchange is a first step in the process of automatic recognition of student
achievements, probably the easier one. Up to now it was the task of the local Erasmus coordinator
to translate student achievements expressed in the context of regulations and culture of the host
institution to that of the home institution. This translation also involves grade conversion. What was
done by the human should be done automatically by the system. The system has to acquire the
knowledge and experience of humans. This problem is yet to be recognized and worked out with the
strong involvement of all interested stakeholders from European higher education institutions.
6. SUMMARY
Implementation of the EMREX Client and NCP for USOS will be made available for Polish HEIs from
the MUCI consortium in June 2016 as part of the official distribution of USOS version 6.2. This means
that the platform will become available to almost 50 HEIs in Poland after regular annual upgrade of
the student information system, at no extra cost. Depending on the schedule participants of the
program MOST will be able to get their results from host institutions starting from the summer
semester 2015/2016. Important aspect of the scenario supported by EMREX is that the initiative is on
the side of the students and also the students are the potential benefactors. This may be the key to
successful deployment.
As our experience shows, IT solutions should be tailored to needs/expectations/capabilities of the
organization at its current stage of development. If the EMREX scenario proves useful it may open
the door for more sophisticated scenarios, like the ones supported by the Erasmus Without Paper
(EWP) Network. EWP project [2] aims to create a network supporting the electronic exchange of
student data by interlinking the existing Erasmus student databases of HEIs. In EWP scenario data
exchange will be under control of the administration, mostly staff of International Relations Offices.
EMREX is the first step towards paperless world which is the goal of the EWP project.
261
7. ACKNOWLEDGEMENTS
EMREX project is supported by the ERASMUS+ Key Action 3 grant from EACEA (grant number
388499EPP-1-2014-2-FI-EPPKA3-PI-POLICY). EMREX is the joint work of project partners — thank you
all.
8. REFERENCES
[1] EMREX project. Retrieved in January 2016 from: http://www.emrex.eu.
[2] Erasmus without Paper project. Retrieved in January 2016 from: http://erasmuswithoutpaper.eu.
[3] Lindstedt M., Hansen A.B., Ravaioli S., Vangen G., Sidselrud A., Mincer-Daszkiewicz J.,
Henriksson P. (2015). Field trial on the impact of enabling easy mobility on recognition of
external
studies (EMREX). EUNIS 2015, Dundee.
http://www.eunis.org/eunis2015/wphttp://www.eunis.org/eunis2015/wp-
content/uploads/sites/3/2015/04/EUNIS2015_submission_13_P1_TRACK_3_slot_3.pdfcontent/upload
s/sites/3/2015/04/EUNIS2015_submission_13_P1_TRACK_3_slot_3.pdf
[4] Mincer-Daszkiewicz J. (2012). USOS API — how to open universities to Web 2.0 community by data sharing. EUNIS 2012, Vila Real. http://www.eunis.pt/index.php/programme/full-programme.
[5] MOST program (http://most.amu.edu.pl) and MOST admission system
(http://most.uka.uw.edu.pl). Retrieved in January 2016.
[6] MUCI consortium. Retrieved in January 2015 from: http://muci.edu.pl.
[7] University Study Oriented System. Retrieved in January 2015 from: http://usos.edu.pl.
[8] Ziemiański G. (2010). Exchange of Students Data Between Higher Education Institutions in Poland. Master thesis, University of Warsaw (in Polish).
9. AUTHORS’ BIOGRAPHIES
Janina Mincer-Daszkiewicz graduated in computer science in the University of
Warsaw, Poland, and obtained a Ph.D. degree in math from the same university.
She is an associate professor in Computer Science at the Faculty of Mathematics,
Informatics and Mechanics at the University of Warsaw specializing in operating
systems, distributed systems, performance evaluation and software engineering.
Since 1999 she leads a project for the development of a student management
information system USOS, which is used in 47 Polish Higher Education
Institutions, gathered in the MUCI consortium. Janina takes active part in many
nation-wide projects in Poland. She has been involved in Egracons, EMREX and
Erasmus Without Paper European projects.
Wojciech Rygielski graduated in computer science in the University of Warsaw,
Poland. He is a senior programmer working on USOS.
He is one of the main developers from Poland in EMREX and Erasmus Without
Paper European projects. He designed and developed EMREX Client and NCP for
USOS.
262
Looking back at the EUNIS repository data using text mining techniques
Elsa Cardoso1, Ricardo Ribeiro
2
1ISCTE- Instituto Universitário de Lisboa and INESC-ID, Av. das Forças Armadas, 1649-026 Lisboa, Portugal,
[email protected] 2ISCTE- Instituto Universitário de Lisboa and INESC-ID, Av. das Forças Armadas, 1649-026 Lisboa,
Portugal, [email protected]
Keywords
Text mining, topic modelling, EUNIS repository
1. Summary
Topic modelling algorithms can be applied to a large collection of documents to uncover themes and their
relationship, thus adding an automatic semantic layer to the archive of documents. In this work, topic
modelling has been applied to the collection of papers published at the EUNIS (European University
Information Systems) annual congresses from 1997 until 2015. Drawing on the initial work of (Wilson and
Bergström, 2015), this paper extends the historical analysis of the conference proceedings with the
application of text mining techniques to analyse the original texts. The performed analyses include the
automatic identification of the most relevant topics and their evolution throughout the years for European
University Information Systems, and the quantification of the degree of internationalization and cooperation
of the EUNIS annual conference.
2. EUNIS repository analysis
The mission of the European University Information Systems organization (EUNIS) is to help member
institutions to develop their information technology (IT) landscape by sharing experiences and working
together. EUNIS was created in 1993, and currently has approximately 120 member institutions. Several
activities and events are periodically organized. The most significant events are the annual conference or
congress (hosted by a member institution) and the Rectors conference. Task forces (TF) have been created
to foster a deeper collaboration and sharing of experiences between members with similar interests.
Presently, there are four task forces established: BencHEIT (focused on benchmarking IT major costs),
business intelligence, e-learning, and interoperability. Task forces also organize separate events, like the
BencHEIT annual event (since 2012) and the Business Intelligence TF event in Hannover and Paris, in 2011
and 2013 respectively. More recently, the EUNIS Research and Analysis (ERAI) initiative has been launched
with the purpose promoting the EUNIS research outcomes, being responsible for the editing of an e-journal,
the EUNIS Journal of Higher Education IT (EJHEIT). The first issue of this e-journal was published in the
fourth quarter of 2014.
In 2015, the ERAI team performed the first analysis of the existing set of publications (Wilson and Bergström,
2015) focusing on the papers published in the annual congresses. This exercise was very insightful, sharing
light on some publishing trends. Since EUNIS does not currently have a data repository, the proceedings of
the annual conferences have been stored in the original conference web sites, maintained by the member
institutions that hosted the events. The ERAI team performed an extensive web search, to assemble, as
much as possible, all the published papers. Key findings from (Wilson and Bergström, 2015) were: (1) a set of
comprehensive records exist only from 1997 onwards; (2) the congress tracks are inconsistent across years;
and (3) authors vary in their interpretation of keywords (i.e., keywords are also inconsistent across years).
Three major trends were identified by Wilson and Bergström’s analysis. First, 2001 up to 2009 was identified
as the most popular period for paper presentations, with 2007 achieving the highest value of paper
263
publication in congresses. Second, United Kingdom (UK), Portugal, Germany, and Spain constitute the top-4
countries of paper authors. Finally, the most popular themes identified by the authors were e-issues,
leadership and management, infrastructure and security, and information management.
The goal of the present work is to expand the data analysis of exiting EUNIS congress publications, applying
business intelligence (BI) and text mining techniques. The motivation for this work emerged from the need
to have a comprehensive view of the evolution of information systems development in Higher Education
Institutions in Europe. BI and text mining enable the automatic extraction of reliable sematic information
from unrestricted text, such as papers’ full text and congress programmes. The end result complements the
knowledge gained from a standard statistical analysis. In order to achieve this goal, a thorough data
cleaning process has been developed. This data preparation stage constituted a very intensive and time-
consuming process, since contextual information about each congress is scattered (across different web sites
and books) and sometimes insufficient. A multidimensional model has been designed to facilitate the
analysis of paper submissions to EUNIS congresses. The multidimensional analysis was implemented using
Microsoft Excel power pivots, applying standard Data Warehouse techniques. The output of this stage
enabled the computation of several generic data repository indicators for the dataset of publications from
1997 until 2015, such as:
• total number of papers
• papers with keyword definition (number and %)
• papers with abstract definition (number and %)
• papers without author definition (number and %)
• papers with authors from different countries (number and %)
• papers without track definition (number and %)
• number of countries represented
• average number of authors per paper
• number of papers per track (average, min, max)
• number of congress tracks
Text mining techniques, and topic modelling algorithms in particular, can be applied to a large collection of
documents to uncover themes and their relationship. The main goal of this work is to use different topic
modelling algorithms to define an automatic semantic layer to the archive of EUNIS congress papers
published in the time period of 1997 until 2015. The initial set of research questions outlined for this project
is:
RQ1. Which are the most relevant topics in the area of European University Information Systems?
RQ2. How did this set of topics evolve throughout the years?
RQ3. How did the number of represented countries evolve throughout the years?
RQ4. How did the number of papers with authors from different countries evolve throughout the years?
RQ5. How did the ratio number of published papers versus number of conference tracks evolve throughout
the years?
In order to answer the first two research questions, topic modelling algorithms were applied to
automatically identify the most relevant topics and their evolution throughout the years for European
University Information Systems. RQ3 has an impact on the analysis of the degree of internationalization of
annual conferences. As previously mentioned, one of the main objectives of EUNIS is to establish an
international Higher Education community to collaborate and share experiences among members. To this
end, RQ4 will enable an analysis of the degree of cooperation between countries.
3. Topic modelling
Topic models allow us to explore large collections of (textual) documents in an unsupervised manner. The
intuition behind this type of models is that by collecting statistics about the distributional properties of the
words occurring in the documents of a given collection it is possible to uncover its latent topics. “Words
with similar distributional properties have similar meanings” (Sahlgren, 2006).
In general, topic modelling approaches can be divided in probabilistic approaches and nonprobabilistic
approaches. The main difference between these approaches is that the relationships between words and
topics and documents and topics in probabilistic models, like Latent Dirichlet Aloocation (Blei, Ng, and
264
Jordan, 2003), are modelled using probability distributions, while in nonprobabilistic approaches, like Latent
Semantic Analysis (Landauer and Dumais, 1997), such restriction does not exists (Steyvers and Griffiths,
2007). However, as mentioned by Blei, Ng, and Jordan (2003), the main advantage of (generative)
probabilistic models is their modularity and extensibility. In terms of performance, both types of approaches
show similar performance when used for classification, with probabilistic models inducing better quality
topics (Stevens et al., 2013). Moreover, as probabilistic modules, this kind of approaches can be easily
integrated in a more complex model.
One of the most well-known probabilistic topic models is Latent Dirichlet Allocation (LDA). Given a fixed
number of topics, LDA considers that each topic is characterized by a probability distribution over the
vocabulary of the collection and that documents are mixtures of topics. LDA is a generative model, so it
assumes that each document of the collection is generated from a topic distribution and each word of the
document is generated from the distribution over the vocabulary corresponding to a topic randomly selected
from the topic distribution.
One of the limitations of this model is that it assumes a fixed number of topics, required to train the model.
This choice can have a strong impact on the results: a small number can lead generic topics, while choosing
a large of number may lead to low quality topics. The hierarchical Dirichlet Process (HDP) (Teh et al., 2007)
can be seen as an extension to LDA that allows an unrestricted number of topics. HDP can estimate the
number of topics of a given collection by using a sampling method.
In this work we explored both approaches to determine the right amount of topics that better explains the
collection of documents (i.e., EUNIS papers). To this end, several experiences were conducted with
different algorithms, leading to different sets of topics. In the end, the final set of topics is always a choice
of the analyst. The rationale is to perform a sufficient number of experiences to aid the analyst in the
selection of the most relevant and recurrent topics. The inferred models are used to analyze the evolution
of topics through time.
4. Conclusions
Preliminary results allowed us to better understand the main themes of the EUNIS conferences, as well as
the evolution of such themes over the last 20 years.
An important aspect of this work is data visualization. The generic conference paper indicators are simple
data visualization, characteristic of business intelligence projects. However, topic modelling visualization is
still a research topic and hence constitutes a challenge to this work. The goal is to provide a sufficiently rich
albeit simple text visualization of the evolution of themes in the context of the EUNIS conferences.
5. REFERENCES
Wilson, N., and Bergström, J. (2015) EUNIS Congress' 21st Birthday - A Historical Perspective on its
Proceedings. In Proceedings of EUNIS 2015, Dundee, UK, 10-12 June, 2015
Landauer, T. K. and Dumais, S. T. (1997), A Solution to Plato's Problem: The Latent Semantic Analysis Theory
of Acquisition, Induction and Representation of Knowledge, in Psychological Review, 104 (2) , 211–240
Sahlgren, M. (2006), The Word-Space Model, PhD Thesis
Teh, Y., Jordan, M., Beal, M., Blei, D. (2007), Hierarchical Dirichlet processes, Journal of the American
Statistical Association, 101(476), 1566–1581
Blei, D., Ng, A., Jordan, M. (2003), Latent Dirichlet allocation, Journal of Machine Learning Research
3, 993–1022
Steyvers, M., and Griffiths, T. (2007), Handbook of Latent Semantic Analysis, chap. Probabilistic Topic
Models, 427–448. Lawrence Erlbaum Associates
Stevens, K., Kegelmeyer, P., Andrzejewski, D., and Buttler, D. (2012), Exploring Topic Coherence over many
models and many topics. In Proceedings of the 2012 Joint Conference on Empirical Methods in Natural
Language Processing and Computational Natural Language Learning, Association for Computational
Linguistics, 952–961
265
6. AUTHORS’ BIOGRAPHIES
Prof. Dr. Elsa Cardoso. Assistant Professor, Director of the Master in Integrated
Business Intelligence Systems at ISCTE – University Institute of Lisbon, Portugal,
and leader of the Business Intelligence Task Force of EUNIS (European University
Information Systems organization). She is also a researcher at the Information and
Decision Support Systems Group of INESC-ID Lisboa, Portugal.
She has a PhD in Information Science and Technology, with a specialization in
Business Intelligence. Her research interests include business intelligence and data
warehousing, big data analytics, performance management, balanced scorecard,
business process management, applied to Higher Education, Healthcare, and IT
service management. She is a
member of: Institute of Electrical and Electronics Engineers (IEEE), Association for Computing Machinery
(ACM), Portuguese Institute of Business Process Management (IPBPM), Portuguese Quality Association and the
vice-representative of ISCTE-IUL at CS03, the commission of IPQ (Instituto Português da Qualidade) for
Quality in Information Technology.
https://pt.linkedin.com/in/elsa-cardoso-88092215
Prof. Dr. Ricardo Ribeiro has a PhD (2011) in Information Systems and Computer
Engineering and an MSc (2003) in Electrical and Computer Engineering, both from
Instituto Superior Técnico, and a graduation degree (1996) in Mathematics/Computer
Science from Universidade da Beira Interior. From 1999 to 2011, he was a Lecturer at
the Lisbon University Institute (ISCTEIUL), where he is now an Assistant Professor and
the Director of the Computer Engineering undergraduate programme. Since 1996, he
has been a researcher at INESC-ID Lisboa, Portugal, working in speech and language
processing. He is a member of the Spoken Language systems Laboratory of INESC-ID
since its creation in 2001. His current research interests focus on the following areas:
high-level information extraction from unrestricted text or speech, and
improving machine-learning techniques using domain-related information. He has participated in several
European and Nationally-funded projects, organized several scientific events and was a member of the
program committee of several others, and edited a book on the computational processing of Portuguese.
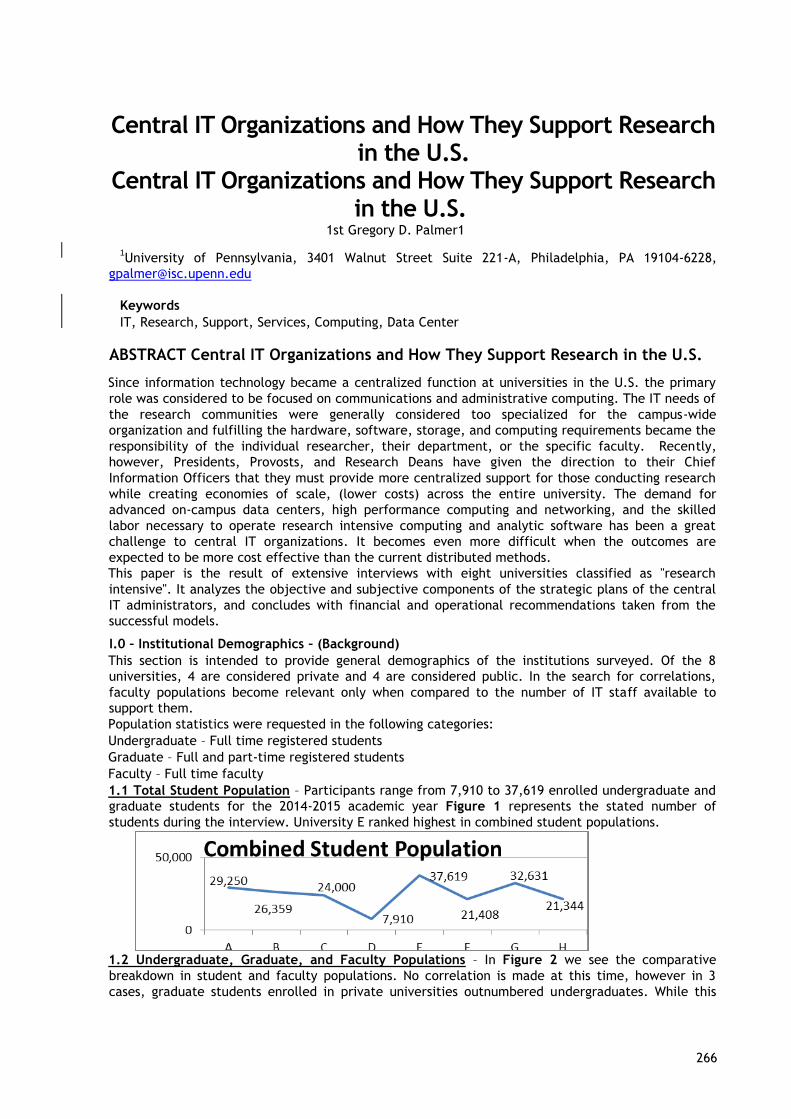
266
Central IT Organizations and How They Support Research in the U.S.
Central IT Organizations and How They Support Research in the U.S.
1st Gregory D. Palmer1
1University of Pennsylvania, 3401 Walnut Street Suite 221-A, Philadelphia, PA 19104-6228,
Keywords
IT, Research, Support, Services, Computing, Data Center
ABSTRACT Central IT Organizations and How They Support Research in the U.S.
Since information technology became a centralized function at universities in the U.S. the primary
role was considered to be focused on communications and administrative computing. The IT needs of
the research communities were generally considered too specialized for the campus-wide
organization and fulfilling the hardware, software, storage, and computing requirements became the
responsibility of the individual researcher, their department, or the specific faculty. Recently,
however, Presidents, Provosts, and Research Deans have given the direction to their Chief
Information Officers that they must provide more centralized support for those conducting research
while creating economies of scale, (lower costs) across the entire university. The demand for
advanced on-campus data centers, high performance computing and networking, and the skilled
labor necessary to operate research intensive computing and analytic software has been a great
challenge to central IT organizations. It becomes even more difficult when the outcomes are
expected to be more cost effective than the current distributed methods.
This paper is the result of extensive interviews with eight universities classified as "research
intensive". It analyzes the objective and subjective components of the strategic plans of the central
IT administrators, and concludes with financial and operational recommendations taken from the
successful models.
I.0 – Institutional Demographics – (Background)
This section is intended to provide general demographics of the institutions surveyed. Of the 8
universities, 4 are considered private and 4 are considered public. In the search for correlations,
faculty populations become relevant only when compared to the number of IT staff available to
support them.
Population statistics were requested in the following categories:
Undergraduate – Full time registered students
Graduate – Full and part-time registered students
Faculty – Full time faculty
1.1 Total Student Population – Participants range from 7,910 to 37,619 enrolled undergraduate and
graduate students for the 2014-2015 academic year Figure 1 represents the stated number of
students during the interview. University E ranked highest in combined student populations.
1.2 Undergraduate, Graduate, and Faculty Populations – In Figure 2 we see the comparative
breakdown in student and faculty populations. No correlation is made at this time, however in 3
cases, graduate students enrolled in private universities outnumbered undergraduates. While this
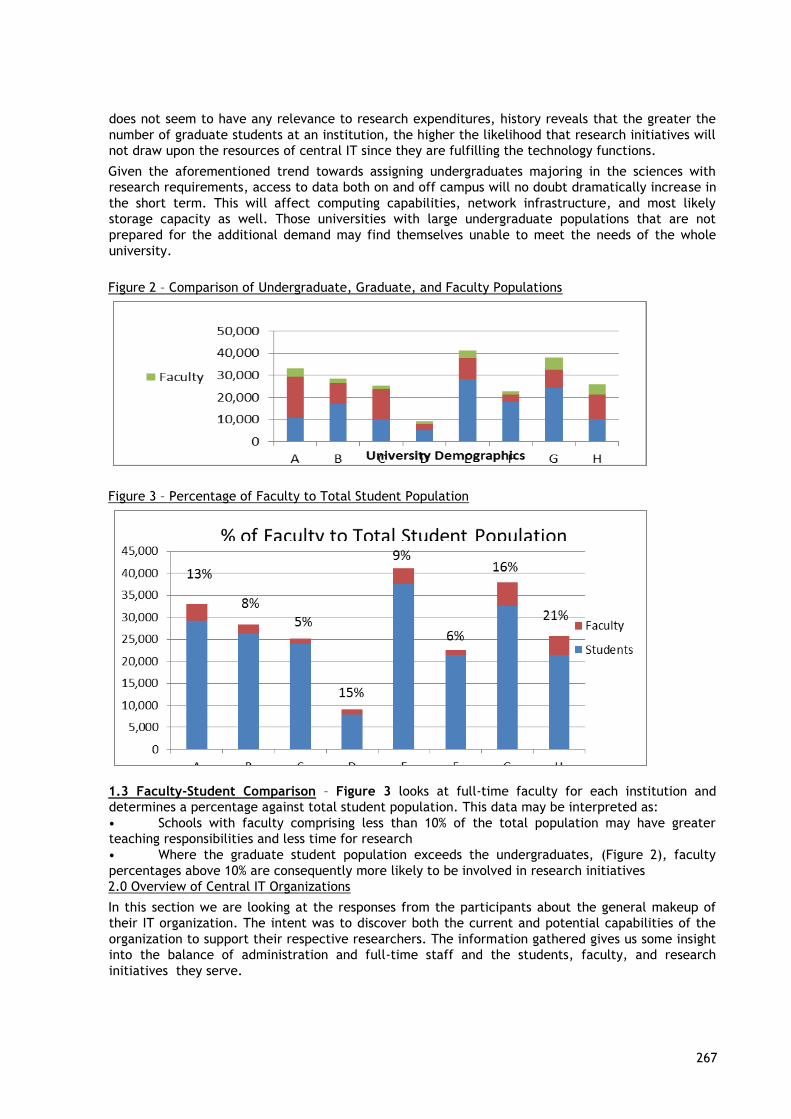
267
does not seem to have any relevance to research expenditures, history reveals that the greater the
number of graduate students at an institution, the higher the likelihood that research initiatives will
not draw upon the resources of central IT since they are fulfilling the technology functions.
Given the aforementioned trend towards assigning undergraduates majoring in the sciences with
research requirements, access to data both on and off campus will no doubt dramatically increase in
the short term. This will affect computing capabilities, network infrastructure, and most likely
storage capacity as well. Those universities with large undergraduate populations that are not
prepared for the additional demand may find themselves unable to meet the needs of the whole
university.
Figure 2 – Comparison of Undergraduate, Graduate, and Faculty Populations
Figure 3 – Percentage of Faculty to Total Student Population
1.3 Faculty-Student Comparison – Figure 3 looks at full-time faculty for each institution and
determines a percentage against total student population. This data may be interpreted as:
• Schools with faculty comprising less than 10% of the total population may have greater
teaching responsibilities and less time for research
• Where the graduate student population exceeds the undergraduates, (Figure 2), faculty
percentages above 10% are consequently more likely to be involved in research initiatives
2.0 Overview of Central IT Organizations
In this section we are looking at the responses from the participants about the general makeup of
their IT organization. The intent was to discover both the current and potential capabilities of the
organization to support their respective researchers. The information gathered gives us some insight
into the balance of administration and full-time staff and the students, faculty, and research
initiatives they serve.
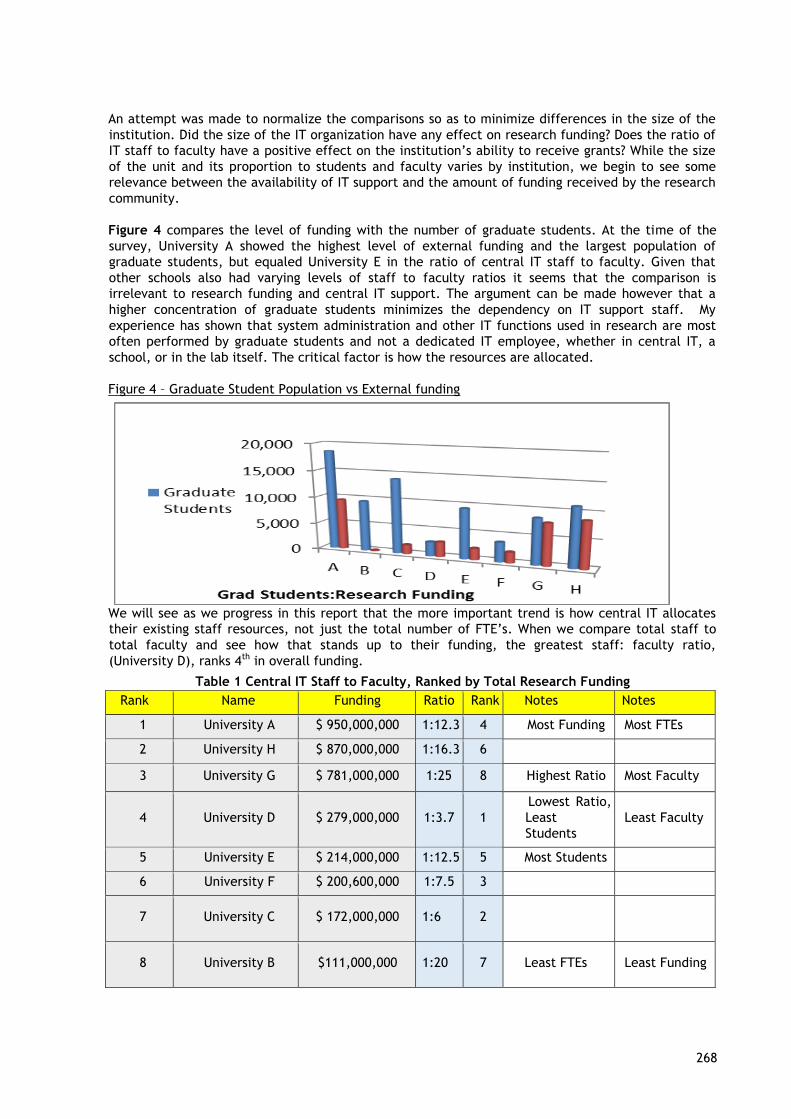
268
An attempt was made to normalize the comparisons so as to minimize differences in the size of the
institution. Did the size of the IT organization have any effect on research funding? Does the ratio of
IT staff to faculty have a positive effect on the institution’s ability to receive grants? While the size
of the unit and its proportion to students and faculty varies by institution, we begin to see some
relevance between the availability of IT support and the amount of funding received by the research
community.
Figure 4 compares the level of funding with the number of graduate students. At the time of the
survey, University A showed the highest level of external funding and the largest population of
graduate students, but equaled University E in the ratio of central IT staff to faculty. Given that
other schools also had varying levels of staff to faculty ratios it seems that the comparison is
irrelevant to research funding and central IT support. The argument can be made however that a
higher concentration of graduate students minimizes the dependency on IT support staff. My
experience has shown that system administration and other IT functions used in research are most
often performed by graduate students and not a dedicated IT employee, whether in central IT, a
school, or in the lab itself. The critical factor is how the resources are allocated.
Figure 4 – Graduate Student Population vs External funding
We will see as we progress in this report that the more important trend is how central IT allocates
their existing staff resources, not just the total number of FTE’s. When we compare total staff to
total faculty and see how that stands up to their funding, the greatest staff: faculty ratio,
(University D), ranks 4th in overall funding.
Table 1 Central IT Staff to Faculty, Ranked by Total Research Funding
Rank Name Funding Ratio Rank Notes Notes
1 University A $ 950,000,000 1:12.3 4 Most Funding Most FTEs
2 University H $ 870,000,000 1:16.3 6
3 University G $ 781,000,000 1:25 8 Highest Ratio Most Faculty
4 University D $ 279,000,000 1:3.7 1
Lowest Ratio,
Least
Students
Least Faculty
5 University E $ 214,000,000 1:12.5 5 Most Students
6 University F $ 200,600,000 1:7.5 3
7 University C $ 172,000,000 1:6 2
8 University B $111,000,000 1:20 7 Least FTEs Least Funding
269
2.1 CIO Divisions and Staffing for Research Support
During the interview process, each institution volunteered information about anticipated changes in
their organizational structure. With the number of divisions reporting to the CIO ranging from 3,
(University B) to 10, (University G), all universities had either already consolidated or were planning
to consolidate the number of groups that reported directly to the CIO. Two universities are
currently undergoing major reorganizations, (University H and University D), with the objectives of
finding synergies within their staff and re-allocating duplicate processes and resources into a more
efficient and balanced model.
Four universities included Research Support as a division, but only one had a staffing level greater
than 2 individuals, and one participant counted their general purpose system administrator as a
“research division”. Of these, the staff members “float” between researchers across all disciplines
and provide support only in reaction to requests with little or no proactive attempt to discover areas
where they could provide a positive effect. Ticketing systems for service and trouble requests are
prevalent in all the participants, however only one differentiated between standard IT requests and
the more specific research challenges.
While 3 institutions were planning on dedicating an FTE to an individual academic unit with the
greatest research activity, how to equitably fund that person is still an issue. This becomes more
complicated when schools and centers have their own, dedicated IT staff separate from the central
IT organization. Everyone admitted that while the research community can have very customized
needs according to their projects, synergies and economies of scale are generally lost when working
in a decentralized IT environment. In all cases, the central IT group and the diverse IT organizations
have defined their separate roles over time. Central IT generally has the stigma of being responsible
for desktop support, voice systems, and cabling infrastructure. And even though Internet, Internet2,
and wide area network connectivity is generally assumed to be the domain of central IT, there are
still many cases where Individual PIs, schools, and centers pursue their own negotiations for external
connectivity. Those universities with medical schools all report a strong IT group specifically for
healthcare. While there is some level of cooperation, the domains are clearly separate.
Table 2 gives a general view of trends in staff and process realignment. Senior administration such
as the Executive Vice President and the Vice President for Research are realizing that inefficiencies
in a distributed environment are costly and non-productive. Changes are planned over an extended
period, generally 3-5 years, but the culture of ownership is difficult to overcome.
Table 2 Current and Future Trends in Staffing/Funding
Name Research
Division?
Future Research
Support
Allocation
Future Funding Future
University A Yes Yes Float By School Direct Charge Long Term
Contracting,
University B No Yes Dean’s
Request
By
Tracked
Usage
Centralized Fee “Tax” by School
University C Yes Yes Float By School Hybrid Contracting,
direct
University D Yes Yes Float By School General
Operating
Some contract
University E No ? Dean/VPR
Request
? Allocated “Tax” Same
University F No ? Dean/VPR
Request
? Allocated “Tax” Restructuring!
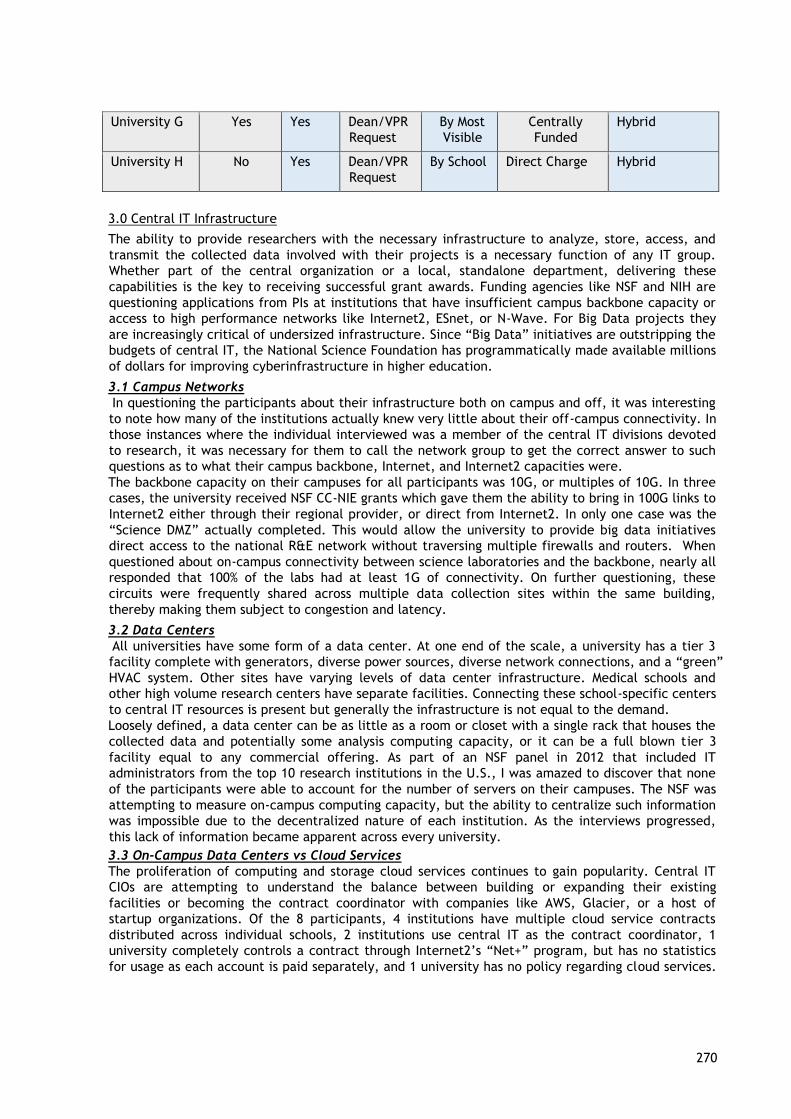
270
University G Yes Yes Dean/VPR
Request
By Most
Visible
Centrally
Funded
Hybrid
University H No Yes Dean/VPR
Request
By School Direct Charge Hybrid
3.0 Central IT Infrastructure
The ability to provide researchers with the necessary infrastructure to analyze, store, access, and
transmit the collected data involved with their projects is a necessary function of any IT group.
Whether part of the central organization or a local, standalone department, delivering these
capabilities is the key to receiving successful grant awards. Funding agencies like NSF and NIH are
questioning applications from PIs at institutions that have insufficient campus backbone capacity or
access to high performance networks like Internet2, ESnet, or N-Wave. For Big Data projects they
are increasingly critical of undersized infrastructure. Since “Big Data” initiatives are outstripping the
budgets of central IT, the National Science Foundation has programmatically made available millions
of dollars for improving cyberinfrastructure in higher education.
3.1 Campus Networks
In questioning the participants about their infrastructure both on campus and off, it was interesting
to note how many of the institutions actually knew very little about their off-campus connectivity. In
those instances where the individual interviewed was a member of the central IT divisions devoted
to research, it was necessary for them to call the network group to get the correct answer to such
questions as to what their campus backbone, Internet, and Internet2 capacities were.
The backbone capacity on their campuses for all participants was 10G, or multiples of 10G. In three
cases, the university received NSF CC-NIE grants which gave them the ability to bring in 100G links to
Internet2 either through their regional provider, or direct from Internet2. In only one case was the
“Science DMZ” actually completed. This would allow the university to provide big data initiatives
direct access to the national R&E network without traversing multiple firewalls and routers. When
questioned about on-campus connectivity between science laboratories and the backbone, nearly all
responded that 100% of the labs had at least 1G of connectivity. On further questioning, these
circuits were frequently shared across multiple data collection sites within the same building,
thereby making them subject to congestion and latency.
3.2 Data Centers
All universities have some form of a data center. At one end of the scale, a university has a tier 3
facility complete with generators, diverse power sources, diverse network connections, and a “green”
HVAC system. Other sites have varying levels of data center infrastructure. Medical schools and
other high volume research centers have separate facilities. Connecting these school-specific centers
to central IT resources is present but generally the infrastructure is not equal to the demand.
Loosely defined, a data center can be as little as a room or closet with a single rack that houses the
collected data and potentially some analysis computing capacity, or it can be a full blown tier 3
facility equal to any commercial offering. As part of an NSF panel in 2012 that included IT
administrators from the top 10 research institutions in the U.S., I was amazed to discover that none
of the participants were able to account for the number of servers on their campuses. The NSF was
attempting to measure on-campus computing capacity, but the ability to centralize such information
was impossible due to the decentralized nature of each institution. As the interviews progressed,
this lack of information became apparent across every university.
3.3 On-Campus Data Centers vs Cloud Services
The proliferation of computing and storage cloud services continues to gain popularity. Central IT
CIOs are attempting to understand the balance between building or expanding their existing
facilities or becoming the contract coordinator with companies like AWS, Glacier, or a host of
startup organizations. Of the 8 participants, 4 institutions have multiple cloud service contracts
distributed across individual schools, 2 institutions use central IT as the contract coordinator, 1
university completely controls a contract through Internet2’s “Net+” program, but has no statistics
for usage as each account is paid separately, and 1 university has no policy regarding cloud services.
271
The researcher, in an effort to minimize costs and increase the number of services, will gravitate to
decisions that based on these two criteria.
4.0 Central IT Research Support Services
In this section we look at specific services offered by central IT in support of their research
communities. This is where we begin to see trends in staffing changes that recognize the importance
of shared resources and the economies that will bring to the entire university. These economies are
realized not just in dollars, but in efficiency and productivity.
4.1 Relationship Management
Proactively discovering the needs of the research community is a process still in its infancy across
those universities interviewed. 5 of the 8 participants are reactive as opposed to actively reaching
out to deans and department heads. The decentralized nature of IT on campuses and the lack of
specialized staff known as relationship managers have led the vast majority of investigators to look
externally for solutions involving data storage and computing capacity. Since research requests are
not tracked separately and often fall into the same queue as telephone change orders, it requires
“knowing the right person” to get something accomplished in a timely fashion and in many cases
where there is not any type of introduction to IT for new faculty, it simply does not occur to the
individual researcher to contact central IT.
Universities C, D, and H are experimenting with Client Relationship Managers. These individuals are
focused on building relationships within research intensive areas. They become knowledgeable about
the largest grants that are currently active and proactively look for opportunities to assist schools
and departments with their technological challenges. At the same time, they work with the local IT
staff and bring their campus-wide knowledge to reveal synergies that create cost and productivity
efficiencies. The results have been greater than anticipated, and two of these schools are planning
expansions in RM staffing to narrow the scope of responsibility. University H has just begun their RM
program and it is too early to quantify the impact.
4.2 Internal Staff Contracting
Also in the preliminary stages is the concept of contracting central IT staff directly to the researcher.
Currently at Universities A, C, and D a researcher may contract directly with central IT for specific
job functions. The individual remains an employee of central IT but reports on a daily basis to the
laboratory they have been assigned to. Using grant funds to pay for this service, the investigator
discovers that his graduate students are now free to work on the project and not system
administration or programming. This becomes a tremendous productivity enhancement which
ultimately results in real dollar savings as well since those functions are now fixed costs instead of
variable. The contract period may be task oriented or run the length of the grant period.
4.3 Internal Communications
All participants reported regularly scheduled meetings with the office of the VP for Research, (VPR).
These were generally high level administrative meetings with occasional requests for specific
researchers considered high profile. The perception is that strategic planning at the individual PI
level takes second place to administrative functions at these meetings. The office of the VPR is
primarily concerned with grant applications and budget accounting so the involvement of central IT
is frequently focused on software modules that improve the business process and rarely on the
scientific processes.
In decentralized environments there are efforts within the private universities to coordinate
activities with the IT administrators at the various schools and centers. Those few IT organizations
that have instituted a Relationship Management Program have reported that the outlook is promising
but given the historical lack of communication, the new credibility has the potential to overwhelm
the RM.
4.4 Central IT Offered Services
While every central IT organization provides a list of services to their campus community, the most
widely known offerings are for students. Table 3 lists those services that would be most attractive to
researchers with an x indicating that the service is available and used. In those cases where the
participant responded with “informal”, (by request only), it was recorded as not being available. It
must be noted that every participant admitted that there is no marketing plan other than the listing
272
of the offered services on a website and, occasionally, how they will benefit the client. A description
of the service and any additional information garnered during the interview follows.
4.5 Grant Writing – Grant applications are commonly based on the collection and analysis of
preliminary data. Funding agencies are increasingly requiring collaborative efforts across two or
more institutions. This increases the potential for success and distributes the award rather than
concentrating on a single school or center. Other than research in the areas of computer science and
communications networking, it is highly likely that the primary investigator will not design the most
efficient process for collecting, archiving, analyzing, and distributing data sets or findings. Central IT
is a logical resource for assisting the PI in developing an actual data management plan and providing
the text for their grant application.
4.6 Hardware and Software Purchasing – When researchers submit their grant applications they will
include equipment listings in their budgets. In most cases these are solicited directly from vendors
and may or may not include the volume discounts available at the university level. There is a
potential for economies of scale if central IT made the purchases in combination with their own and
other units across the campus. The perception is that the highly specialized nature and
sophistication of certain hardware is beyond the understanding of central IT. If a central purchasing
resource is made available it must be flexible enough to comply with customized configurations and
document possible synergies across departments.
4.7 Contract Help – As noted above, some schools are offering central IT employees as contractors
to a research project for the duration of the grant. The objective is to remove those who are
involved in analysis and reporting from IT tasks and thereby increase performance and productivity.
When asked if this service was offered, responses were not always “yes” or “no”. Table 3 reflects
only those schools that offer this service on a regular basis. In one other case a very high profile
research project warranted this kind of attention but it was the exception rather than a regularly
offered service.
4.8 Technical Compliance – For non-IT primary investigators, this service will review the data
management design and processes to determine that the outcome will function as desired. Not to be
confused with Consulting, Institutional Compliance, or Funding Agency Compliance, this was
explained as a design review only, with recommendations.
4.9 Computing Capacity, Individuals – Small research projects or initiatives that require infrequent
or low-end processing capability may be resolved with in-room hardware. Cost would be a major
issue for this category of research. The question was posed to determine if central IT would provide
or purchase computing capacity that may be part of a cluster, cloud, or shared data center
infrastructure and would provide configuration support. The researcher would have the benefit of
support but not the cost of an entire system.
4.10 Computing Capacity, Shared – Research computing requirements are generally sporadic,
ranging from 4 times a year to daily computational analysis of very large data sets. There are many
options for the investigators including supercomputing centers, cloud services, on-campus clusters
within a school, and central IT provided computing centers. While all the participants offered some
form of campus central computing functionality, the models varied based on funding and staff
availability.
4.11 Data Center Infrastructure – As mentioned above and reflected in Table 3, all participants
offer space in a data center managed by central IT. However, services will vary according to the
type of data center and the requirements of the researcher at each institution. There is only 1Tier 3
data center among those surveyed. The power outputs are commonly AC and only occasionally DC.
Diverse power sources and network pathways are rare. These limitations have pushed many
investigators to cloud services, usually unbeknownst to central IT.
4.12 Technical Consulting – This occurs when central IT goes beyond a simple design review and
actually works with the researcher prior to the grant submission to maximize the efficiency of the IT
data management plan. This may occur through a relationship manager or in combination with
central IT staff members. While 4 participants labeled this as a valid service offering, it is
predominantly available upon request only.
273
4.13 Wide Area Connectivity – In some cases, the investigator may have a requirement for direct
connections to funding agencies or collaborators off the campus net. Given the cost and
management components this occurs only with “Big Data” projects that are well funded and have a
high frequency of transmissions. The examples most often used include Internet2, the National
Institute of Health, NOAA, and the Department of Energy. Of the 3 universities listed as offering this
service, one has an isolated case but is receptive to more if the circumstances require it. Another
university will guide assist the researcher, but will not assume responsibility for the connection. The
third university also has the regional Internet2 interconnect as part of the central IT organization
and is able to facilitate these special cases to suit the requirements. While such requests are rare,
reduced costs and increased capacity needs show a trend for more off-campus connectivity.
4.14 ERP - Enterprise Resource Planning (ERP) is business management software—not typically a
suite of integrated applications that an institution can use to collect, store, manage and interpret
data from many academic, business and research activities, including: budget planning, cost
analysis, or service delivery. While all but one participant provides some form of ERP system, one
university is faced with multiple home grown software platforms in a decentralized environment.
Efforts there are underway to consolidate and make consistent the process whereby the institution
manages research budgets and reporting functions.
4.15 Project Management – This service encompasses central IT taking responsibility for a
component of a research initiative or in very few cases the entire data management plan of a
project. Those that offer this function admitted that there was room for improvement and the
knowledge base necessary to adequately perform such duties was time consuming and therefore very
costly. The benefit to the researcher is that they will be able to totally devoid themselves of such IT
functions as configurations, implementations, etc. and devote their resources to the research
project.
4.16 Institutional Compliance – 6 of the 8 universities interviewed conducted design reviews in one
form or another to ensure that the equipment, applications, and data management would not
disrupt the campus infrastructure. The remaining 2 institutions left the detailed reviews to the
decentralized IT groups and made recommendations only when called upon. Involving central IT in
such design reviews would minimize issues with implementations that do not consider the impact in
such areas as security or backbone capacity on the university as a whole.
4.17 Funding Agency Compliance – distinct from other areas mentioned above, researchers may be
required to ensure that their projects comply with federal and state standards for data management
and security. This is most common with healthcare and patient data but also is relevant to many
other facets of the university’s mission regarding research and education. It is most often left to the
decentralized IT organization to assume responsibility for ensuring that standards are met. In very
few cases was central IT responsible for agency compliance and then only when called upon.
4.18 Relationship Management – Still in its infancy, the relationship managers are rapidly showing
their value to the research community. Working across schools and centers they are able to identify
cost saving synergies and act as facilitators between individuals and laboratories. It is rare that
different departments interact, creating a loss of economy for the university as a whole. The
relationship manager can be instrumental in bringing the research community together.
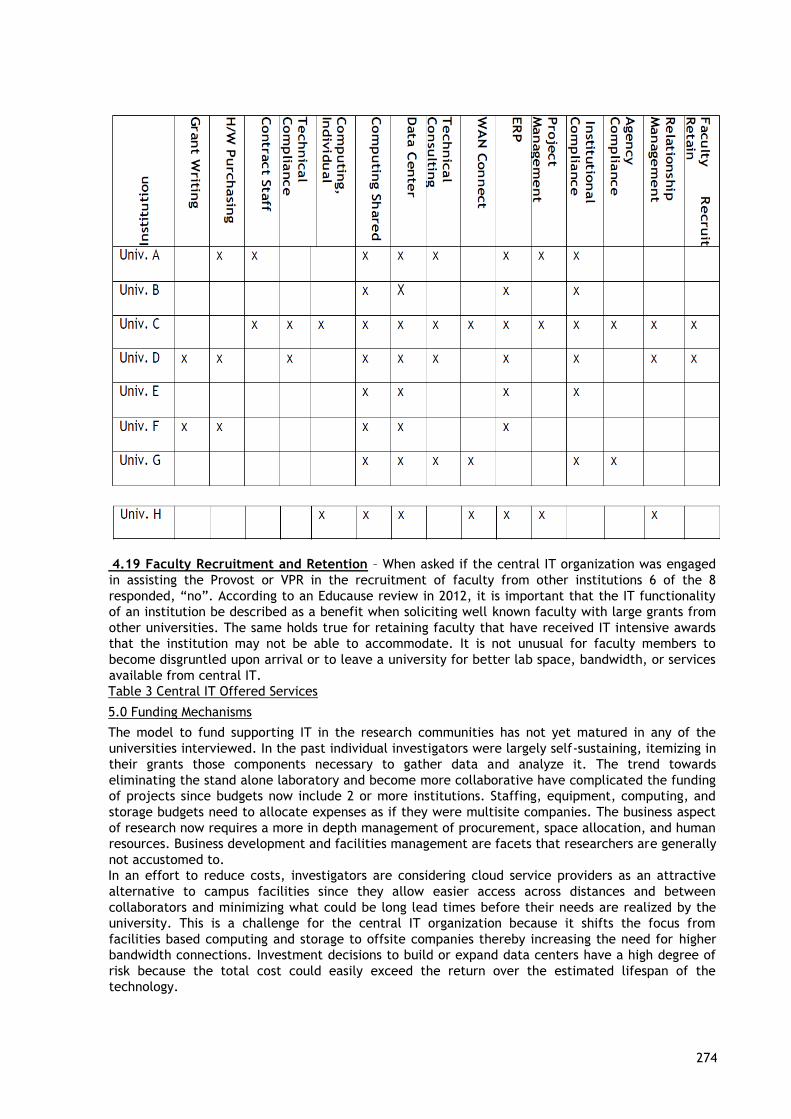
274
4.19 Faculty Recruitment and Retention – When asked if the central IT organization was engaged
in assisting the Provost or VPR in the recruitment of faculty from other institutions 6 of the 8
responded, “no”. According to an Educause review in 2012, it is important that the IT functionality
of an institution be described as a benefit when soliciting well known faculty with large grants from
other universities. The same holds true for retaining faculty that have received IT intensive awards
that the institution may not be able to accommodate. It is not unusual for faculty members to
become disgruntled upon arrival or to leave a university for better lab space, bandwidth, or services
available from central IT.
Table 3 Central IT Offered Services
5.0 Funding Mechanisms
The model to fund supporting IT in the research communities has not yet matured in any of the
universities interviewed. In the past individual investigators were largely self-sustaining, itemizing in
their grants those components necessary to gather data and analyze it. The trend towards
eliminating the stand alone laboratory and become more collaborative have complicated the funding
of projects since budgets now include 2 or more institutions. Staffing, equipment, computing, and
storage budgets need to allocate expenses as if they were multisite companies. The business aspect
of research now requires a more in depth management of procurement, space allocation, and human
resources. Business development and facilities management are facets that researchers are generally
not accustomed to.
In an effort to reduce costs, investigators are considering cloud service providers as an attractive
alternative to campus facilities since they allow easier access across distances and between
collaborators and minimizing what could be long lead times before their needs are realized by the
university. This is a challenge for the central IT organization because it shifts the focus from
facilities based computing and storage to offsite companies thereby increasing the need for higher
bandwidth connections. Investment decisions to build or expand data centers have a high degree of
risk because the total cost could easily exceed the return over the estimated lifespan of the
technology.
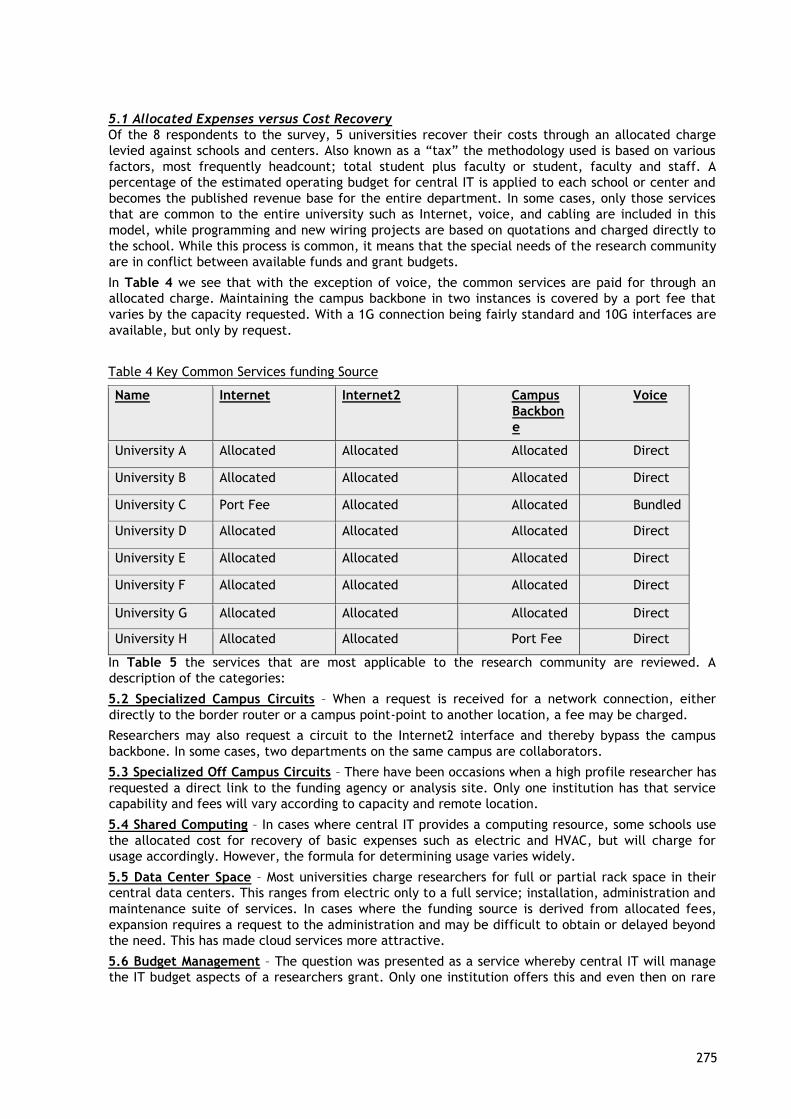
275
5.1 Allocated Expenses versus Cost Recovery
Of the 8 respondents to the survey, 5 universities recover their costs through an allocated charge
levied against schools and centers. Also known as a “tax” the methodology used is based on various
factors, most frequently headcount; total student plus faculty or student, faculty and staff. A
percentage of the estimated operating budget for central IT is applied to each school or center and
becomes the published revenue base for the entire department. In some cases, only those services
that are common to the entire university such as Internet, voice, and cabling are included in this
model, while programming and new wiring projects are based on quotations and charged directly to
the school. While this process is common, it means that the special needs of the research community
are in conflict between available funds and grant budgets.
In Table 4 we see that with the exception of voice, the common services are paid for through an
allocated charge. Maintaining the campus backbone in two instances is covered by a port fee that
varies by the capacity requested. With a 1G connection being fairly standard and 10G interfaces are
available, but only by request.
Table 4 Key Common Services funding Source
Name Internet Internet2 Campus
Backbon
e
Voice
University A Allocated Allocated Allocated Direct
University B Allocated Allocated Allocated Direct
University C Port Fee Allocated Allocated Bundled
University D Allocated Allocated Allocated Direct
University E Allocated Allocated Allocated Direct
University F Allocated Allocated Allocated Direct
University G Allocated Allocated Allocated Direct
University H Allocated Allocated Port Fee Direct
In Table 5 the services that are most applicable to the research community are reviewed. A
description of the categories:
5.2 Specialized Campus Circuits – When a request is received for a network connection, either
directly to the border router or a campus point-point to another location, a fee may be charged.
Researchers may also request a circuit to the Internet2 interface and thereby bypass the campus
backbone. In some cases, two departments on the same campus are collaborators.
5.3 Specialized Off Campus Circuits – There have been occasions when a high profile researcher has
requested a direct link to the funding agency or analysis site. Only one institution has that service
capability and fees will vary according to capacity and remote location.
5.4 Shared Computing – In cases where central IT provides a computing resource, some schools use
the allocated cost for recovery of basic expenses such as electric and HVAC, but will charge for
usage accordingly. However, the formula for determining usage varies widely.
5.5 Data Center Space – Most universities charge researchers for full or partial rack space in their
central data centers. This ranges from electric only to a full service; installation, administration and
maintenance suite of services. In cases where the funding source is derived from allocated fees,
expansion requires a request to the administration and may be difficult to obtain or delayed beyond
the need. This has made cloud services more attractive.
5.6 Budget Management – The question was presented as a service whereby central IT will manage
the IT budget aspects of a researchers grant. Only one institution offers this and even then on rare
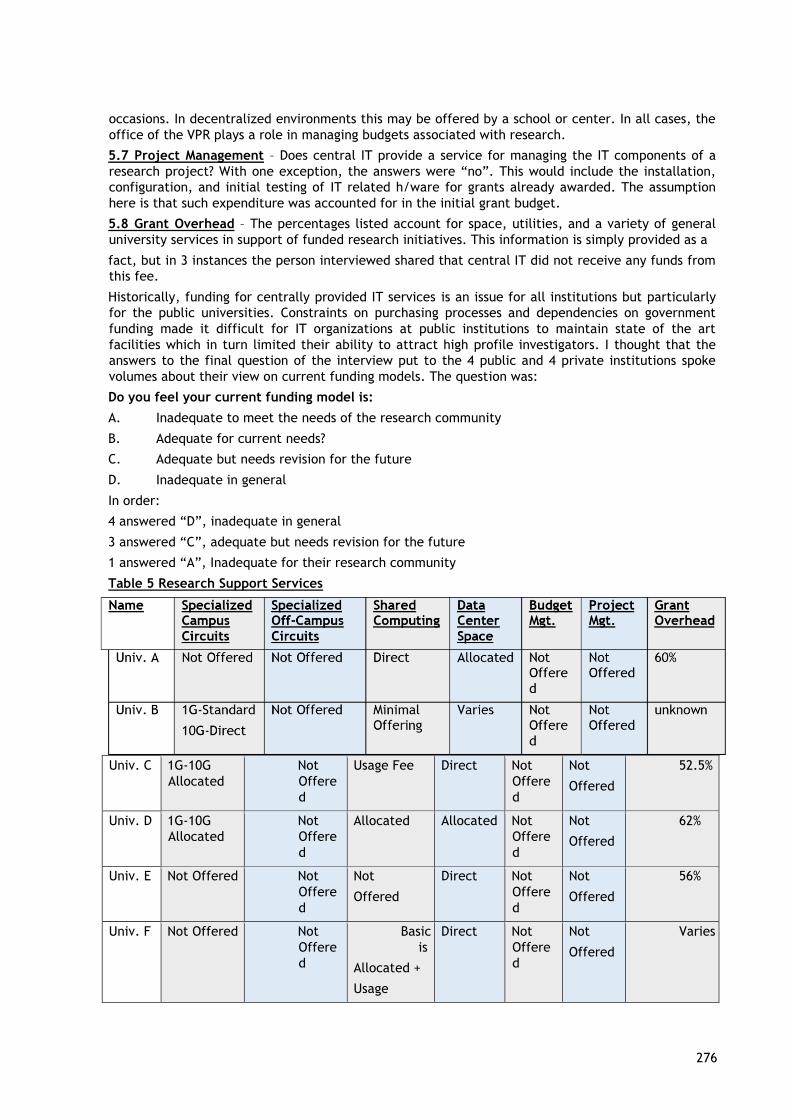
276
occasions. In decentralized environments this may be offered by a school or center. In all cases, the
office of the VPR plays a role in managing budgets associated with research.
5.7 Project Management – Does central IT provide a service for managing the IT components of a
research project? With one exception, the answers were “no”. This would include the installation,
configuration, and initial testing of IT related h/ware for grants already awarded. The assumption
here is that such expenditure was accounted for in the initial grant budget.
5.8 Grant Overhead – The percentages listed account for space, utilities, and a variety of general
university services in support of funded research initiatives. This information is simply provided as a
fact, but in 3 instances the person interviewed shared that central IT did not receive any funds from
this fee.
Historically, funding for centrally provided IT services is an issue for all institutions but particularly
for the public universities. Constraints on purchasing processes and dependencies on government
funding made it difficult for IT organizations at public institutions to maintain state of the art
facilities which in turn limited their ability to attract high profile investigators. I thought that the
answers to the final question of the interview put to the 4 public and 4 private institutions spoke
volumes about their view on current funding models. The question was:
Do you feel your current funding model is:
A. Inadequate to meet the needs of the research community
B. Adequate for current needs?
C. Adequate but needs revision for the future
D. Inadequate in general
In order:
4 answered “D”, inadequate in general
3 answered “C”, adequate but needs revision for the future
1 answered “A”, Inadequate for their research community
Table 5 Research Support Services
Univ. C 1G-10G
Allocated
Not
Offere
d
Usage Fee Direct Not
Offere
d
Not
Offered
52.5%
Univ. D 1G-10G
Allocated
Not
Offere
d
Allocated Allocated Not
Offere
d
Not
Offered
62%
Univ. E Not Offered Not
Offere
d
Not
Offered
Direct Not
Offere
d
Not
Offered
56%
Univ. F Not Offered Not
Offere
d
Basic
is
Allocated +
Usage
Direct Not
Offere
d
Not
Offered
Varies
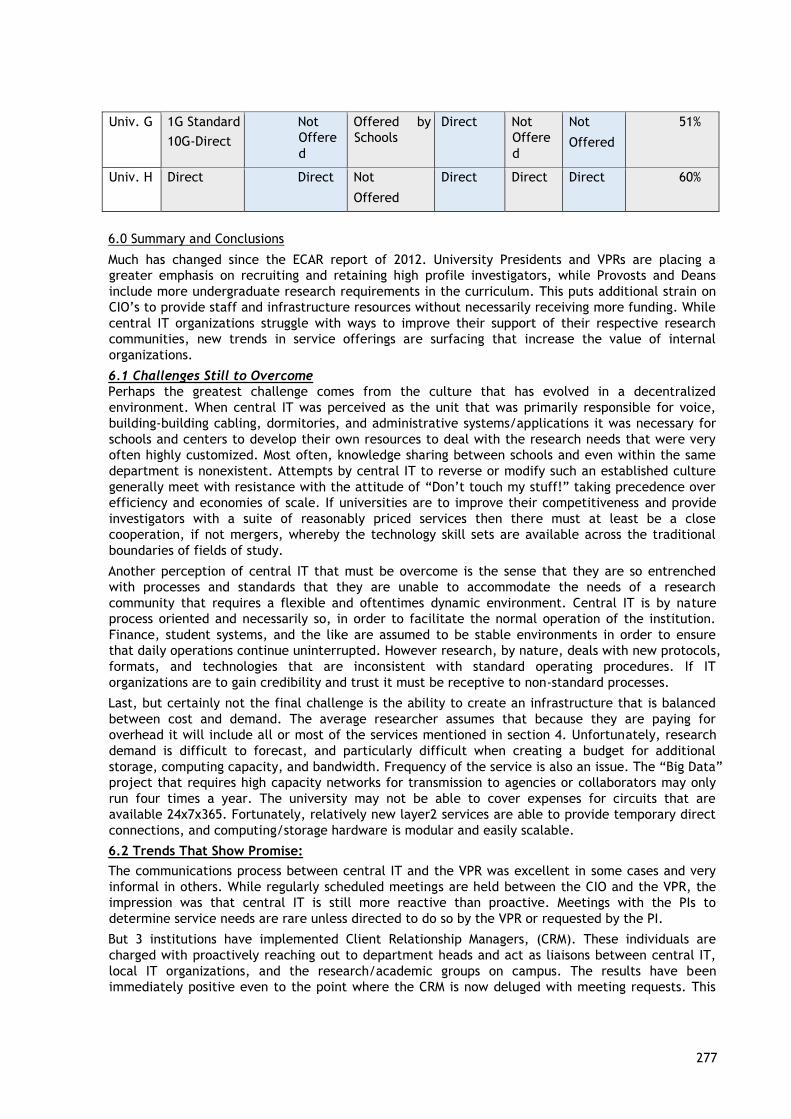
277
Univ. G 1G Standard
10G-Direct
Not
Offere
d
Offered by
Schools
Direct Not
Offere
d
Not
Offered
51%
Univ. H Direct Direct Not
Offered
Direct Direct Direct 60%
6.0 Summary and Conclusions
Much has changed since the ECAR report of 2012. University Presidents and VPRs are placing a
greater emphasis on recruiting and retaining high profile investigators, while Provosts and Deans
include more undergraduate research requirements in the curriculum. This puts additional strain on
CIO’s to provide staff and infrastructure resources without necessarily receiving more funding. While
central IT organizations struggle with ways to improve their support of their respective research
communities, new trends in service offerings are surfacing that increase the value of internal
organizations.
6.1 Challenges Still to Overcome
Perhaps the greatest challenge comes from the culture that has evolved in a decentralized
environment. When central IT was perceived as the unit that was primarily responsible for voice,
building-building cabling, dormitories, and administrative systems/applications it was necessary for
schools and centers to develop their own resources to deal with the research needs that were very
often highly customized. Most often, knowledge sharing between schools and even within the same
department is nonexistent. Attempts by central IT to reverse or modify such an established culture
generally meet with resistance with the attitude of “Don’t touch my stuff!” taking precedence over
efficiency and economies of scale. If universities are to improve their competitiveness and provide
investigators with a suite of reasonably priced services then there must at least be a close
cooperation, if not mergers, whereby the technology skill sets are available across the traditional
boundaries of fields of study.
Another perception of central IT that must be overcome is the sense that they are so entrenched
with processes and standards that they are unable to accommodate the needs of a research
community that requires a flexible and oftentimes dynamic environment. Central IT is by nature
process oriented and necessarily so, in order to facilitate the normal operation of the institution.
Finance, student systems, and the like are assumed to be stable environments in order to ensure
that daily operations continue uninterrupted. However research, by nature, deals with new protocols,
formats, and technologies that are inconsistent with standard operating procedures. If IT
organizations are to gain credibility and trust it must be receptive to non-standard processes.
Last, but certainly not the final challenge is the ability to create an infrastructure that is balanced
between cost and demand. The average researcher assumes that because they are paying for
overhead it will include all or most of the services mentioned in section 4. Unfortunately, research
demand is difficult to forecast, and particularly difficult when creating a budget for additional
storage, computing capacity, and bandwidth. Frequency of the service is also an issue. The “Big Data”
project that requires high capacity networks for transmission to agencies or collaborators may only
run four times a year. The university may not be able to cover expenses for circuits that are
available 24x7x365. Fortunately, relatively new layer2 services are able to provide temporary direct
connections, and computing/storage hardware is modular and easily scalable.
6.2 Trends That Show Promise:
The communications process between central IT and the VPR was excellent in some cases and very
informal in others. While regularly scheduled meetings are held between the CIO and the VPR, the
impression was that central IT is still more reactive than proactive. Meetings with the PIs to
determine service needs are rare unless directed to do so by the VPR or requested by the PI.
But 3 institutions have implemented Client Relationship Managers, (CRM). These individuals are
charged with proactively reaching out to department heads and act as liaisons between central IT,
local IT organizations, and the research/academic groups on campus. The results have been
immediately positive even to the point where the CRM is now deluged with meeting requests. This
278
has put a new strain on central IT and created a backlog of work orders and capital projects, but the
mere fact that IT is listening to the needs of the community has at least temporarily created a good
image.
The sustainability of the CRM will depend on whether or not the organization has the resources to
satisfy the demand.
Another positive trend is the provision of temporary IT staff to the researcher for the length of the
grant. The person reports to central IT on the organization chart but is “embedded” in the
researchers lab and works either part time or full time for the P.I. The grant covers the fully loaded
cost of the employee and can be paid to central IT via a budget transfer. Arrangements are made
prior to the grant submission where the skills are specified and the financials are a fixed rather than
estimated cost.
The benefits of this program include the having the advanced skill and knowledge sets that an IT
professional can offer, presumably at competitive rates, and the separation of duties between
graduate students and IT staff means that the student is focusing on the research and not on
programming or system administration. While this concept is new enough that the initial embedded
staff members are still on their first assignment, when the research project is complete, the person
will be returned to the pool, awaiting their next placement.
Centralized computing which is shared across the university and available to researchers was claimed
to be an offered service by all the participants. While the funding models vary, most of the
initiatives are pilot programs, but growing. Most of the research communities still prefer to have
their system analysis done on site but the “server under the desk” is still prevalent. Everyone admits
that the unknown systems are only hidden until they stop working, at which time either the central
or departmental IT unit is called upon. By providing community access to centralized computing,
central IT eliminates a number of potential issues; security, standards compliance, backup and
restoration, cost economies of scale, access to high performance networks, and proper trouble ticket
reporting. One additional advantage is that the university IT department becomes a viable option for
the investigators when determining the cost, data availability, and security of their research.
Three of the universities have created research divisions within the central IT organization that
report directly to the CIO, (a 4th is in progress, but with only 1 person). The reported benefits reveal
this to be an excellent decision. Not only is the interaction between IT and the research community
vastly improved, but the link between services requested and services offered has reduced response
times and increased trust and credibility. Funding for the additional staff is generally provided
through a combination of direct charges and allocations.
6.3 Areas for Improvement:
While the above improvement trends are showing positive results there is still the issue of vertical
communications across the organizational charts of an institution. The Relationship Manager can play
a key role in acting as the research ombudsman if they are given the authority to interact at all
levels. They can be a valuable source of information for both the VPR and the CIO. Frequent
meetings with PIs will lead to the discovery of service needs and these can be passed on to local IT
organizations or central IT whichever is more appropriate.
One element that was particularly lacking was the marketing of current or new services by central
IT. While improvements are being made in inter-campus communications there does not seem to be
a cohesive effort to make the research community aware of the services being offered. Central IT is
frequently in competition with commercial providers and it is not unusual to discover that an
available service or product was awarded to an outside company simply because the investigator was
not aware the need could be filled internally. Some universities have established working groups
consisting of research deans, a representative from the VPR’s office, and central IT. This is one good
avenue for making options available as long as it doesn’t come across as a “hard sell”.
Commensurate with the marketing concept is the provision of an ROI. With the exception of very
large labs with assigned business managers, most researchers are not business oriented and will
make IT decisions based on traditional procedures. The perfect example is when data will be sent to
a collaborator or funding agency by shipping hard drives via commercial carrier. If damage occurs,
(and it does happen on occasion), the rest of the data can be useless. Using the connection to the

279
advanced network can be faster, more reliable, and more secure. What the research community
needs to know is why they should use central IT services. What is the payback in terms of cost and
productivity? This may be an additional role for the research relationship manager or the project
manager, but the resource can quickly be funded if the money spent on an outside provider is
channeled through central IT.
In a decentralized environment establishing a bi-directional trust relationship with school/center IT
Directors and their staff is essential to the success of a cooperative work environment whereby both
organizations realize a benefit. Achieving this allows the university to react more quickly to the
researchers service needs. This generates more productive outcomes on grant objectives which
The last example I will speak to is the inclusion of central IT in the overhead charge levied against
grants, (See Table 5, page 16). In very few cases does this funding seem to find its way into
supporting IT services. This is one possible source of funding for the research Relationship Manager.
While this paper should be considered an individual’s opinion relevant to facts gathered from a small
sampling of universities, and in no way is a research initiative comparable to the ECAR report of 2012,
it is nonetheless a statement about the current trends and conditions relevant to how central IT
organizations are dealing with the growing demand to support their research communities.
Based on interviews, external readings, and personal observations as the Director of a regional
research network and connector for Internet2, I can safely say that 3 important trends are taking
place across the U.S. IT organizations are becoming more proactive, more client centric, and
treating themselves as a business within the university. I can only hypothesize that the impetus for
these trends is brought about by Presidents, VPRs, and Deans that see research as; 1.) a means of
improving the human condition, 2.) the expansion of knowledge about our universe, 3.) good
business, and 4.) national and global recognition. Order these in any sequence you see fit.
REFERENCES
Bichsel, Jacqueline (2012) “Research Computing, The Enabling Role of Information Technology”,
(Research Report), Louisville, CO: EDUCAUSE Center for Applied Research, November, 2012,
http://www.educause.edu/ecar
Dirks, Nicholas B., (2015) “Rebirth of the Research University”, The Chronicle of Higher Education,
April 2015, http://chronicle.com/article/Rebirth-of-the-
University/229585/?cid=at&utm_source=at&utm_medium=en
National Institute of Health (2014) “NIH Data Book”, (U.S. Government Web Publication),
Washington, D.C.: U.S. Department of Health and Human Services,
http://report.nih.gov/nihdatabook/
National Science Foundation, “Campus Cyberinfrastructure - Network Infrastructure and
Engineering Program (CC-NIE)”, (Program Solicitation), Washington, D.C.: Office of Cyberinfrastructure, October 2012 http://www.nsf.gov/pubs/2013/nsf13530/nsf13530.htm see also: https://www.nsf.gov/attachments/123382/public/CCNIEThomp.pdf
National Science Foundation, “A Timeline of NSF History”, (U.S. Government Web Publication),
Washingotn, D.C., https://www.nsf.gov/about/history/overview-50.jsp
Williams June, Audrey, “What it Means to Reach for Carnegie’’s Top Tier”, The Chronicle of Higher
Education, April 27, 2015, http://chronicle.com/article/What-It-Means-to-
Reachhttp://chronicle.com/article/What-It-Means-to-Reach-
for/229651/?cid=at&utm_source=at&utm_medium=enfor/229651/?cid=at&utm_source=at&utm_medi
um=en
280
Use the “APA Reference format” for references – that is, a list at the end of the paper, ordered
alphabetically and formatted accordingly: http://apastyle.apa.org/. The references are also in
10point Trebuchet MS font (format: Body text – EUNIS 2). References should be published materials
accessible to the public.
Gregory D. Palmer, Biography
Education
• Bachelor of Science, Business, Operations Management 1988
• Co-authored, Statistical Analysis of Small Business Behavior
• Cum Laude graduate
Honors
Awards
Experienc
e
• Invited Speaker, EUNIS Congress, Riga, Latvia - 2013
• Invited Speaker, Caribbean Knowledge and Learning Network, Port of Spain, Trinidad/Tobago
• Invited Speaker, Wharton School of Business, University of Pennsylvania – Executive
Masters in Technology Management Speaker Series - 2003
• Invited Speaker, University of Texas/Dallas – 2002
• University of Pennsylvania Models of Excellence – 2010
• Keystone Initiative for Network Based Education and Research - Achievement Award – 2009 – 2010
• University of Pennsylvania Models of Excellence – 2006
MAGPI Exec. Director , Univ. of Pennsylvania November, 1999 – Current
• Established regional high performance network in PA, NJ, and DE in support of research and education
• Created a unique business model for the construction of fiber optic, dense wave division multiplexing
• Successfully contracted with government laboratories for high capacity transport
circuits
• One of 6 co-authors for the successful $99.6 M Broadband Technology Opportunity Program, (ARRA stimulus funds for the Pennsylvania state network, PennREN)
• Original programs developed in education and professional development for students and faculty in grades K-20
• Co-PI for the first Digital Humanities grant award, “Digital Corinth” - 2008
• Chairman, Internet2 Africa Regional Interest Group – 2008 – 2013
• Board Member – Pennsylvania Council for International Education, 2007 – 2011

281
• Advisory Council Member – Asian Studies Collaborative, 2009 – 2012
• Board Member – Hi-Tech Healthcare Annual Symposium – 2010 - 2013
Director of Global IT Operations, Christian Dalloz, Ltd. 1998 - 1999
Global LAN/WAN infrastructure development for 42 sites worldwide
SAP servers, EMC storage Management
Y2K integration on all systems and desktops
Distributed backbone built for 6 countries in Europe plus the U.S.
Director of Campus Computing, Drexel University, 1995 - 1998
• Awarded NSF grant for participation in the Vbns research and education network
• Completed campus re-wiring project
• Initiated the first wireless pilot project
• Transitioned mainframe computing to centrally administered server farm
• Implemented Digital Northern Telecom PBX to replace Centrex voice service
Telecommunications Manager, Okidata 1985 - 1995
• Collaborated with parent, OKI Japan, to implement multi-nation X.25 packet
network
• Digital PBX with 5 digit dialing to 5 locations in North America
• First Local Area Network Ethernet installation
• Digital Voice Trunking over T-1 connections
• Videoconferencing to 5 North American sites via ISDN
282
Academic IT support for Data Science
Simon Price
Advanced Computing Research Centre, IT Services, University of Bristol, Beacon House, Bristol BS8
1QU, UK, [email protected]
Keywords
Data Science, Big Data, Research Data Management, Research Software Engineering
1. Summary
Globally, over 500 universities now offer data science courses at undergraduate or postgraduate
level and, in research-intensive universities, these courses are typically underpinned by academic
research in statistics, machine learning and computer science departments and, increasingly, in
multidisciplinary data science institutes. Much has been written about the academic challenges of
data science from the perspective of its core academic disciplines and from its application domains,
ranging from sciences and engineering through to arts and humanities. However, relatively little has
been written about the institutional information technology (IT) support challenges entailed by this
rapid growth in data science. This paper sets out some of these IT challenges and examines
competing support strategies, service design and financial models through the lens of academic IT
support services.
2. THE DATA SCIENCE LANDSCAPE
There is currently no universally agreed definition of "data science" and, much like the related term
"big data", the term "data science" has been adopted by different communities to refer to
substantially different concepts. In industry, data science is frequently associated with data
analytics, data engineering and big data technologies such like Hadoop or NoSQL. These associations
are also found in the university sector, where data science courses have emerged from an eclectic
range of academic departments (Swanstrom 2016). However, research-intensive universities tend to
emphasise the established academic disciplines of applied statistics, machine learning and computer
science over specific technologies. Despite 52% of data scientists on LinkedIn having only earned the
title in the past four years (RJMetrics 2015), a well founded academic claim has been made that data
science as a practical applied discipline is at least 50 years old (Donoho 2015).
Setting aside industry's and academia's differing views on the core competences of a data scientist,
few would argue against the multidisciplinary nature of data science nor that its impressive range of
applications is entirely dependent on IT. Given the major investment in data science research and
education by governments and industry, right across the spectrum of academic disciplines, this might
seem like good news for financially hard-pressed academic IT support services.
The Alan Turing Institute, the UK's national centre for Data Science, was launched in January 2015
with an initial £52m (€67m) investment from government and industry (ATI 2015). Headquartered at
The British Library and further funded through the UK's Engineering and Physical Sciences Research
Council (EPSRC), the five founding partner universities of Cambridge, Edinburgh, Oxford, UCL and
Warwick have each committed to major recurrent investment in Data Science within their
institutions. In the United States, universities such as UC Berkeley, NYU, MIT and Stanford have
major Data Science programs and the universities of Rochester and Michigan have both individually
made investments on a similar scale to the UK's initial ATI investment.
Why then, with all this inward investment, is this not necessarily good news for the traditional
university IT Services division?
3. IT CHALLENGES OF DATA SCIENCE
One challenge lies in the fact that effective research IT support, and data science research in
particular, demands more than just the standardised, centralised, corporate-style IT support that
universities have increasingly moved their IT divisions towards, albeit with worthy intentions of
283
reducing operating expenditure by exploiting economies of scale. That 21% of the data science
courses listed in (Swanstrom 2016) are delivered online suggests that this corporate approach to
education IT might be working as well for data science as for other disciplines. However, research IT
support for the application of data science across multiple disciplines is far more challenging.
Research data comes in a broad range of data types and formats from heterogeneous sources,
including laboratory equipment, scanners, medical devices, sensors networks, digital collections or
the web; it is processed through computational pipelines and scientific workflows; it is analysed and
visualised using data science methods that may also require considerable time investment to gain an
understanding of the data and domain together. The specialist IT knowledge required to support
such involved and domain-specific work is more likely to originate from staff (or students) embedded
in the research group itself rather than from generalist IT support staff working centrally.
In other words, the traditional academic IT Services division is highly unlikely to have enough staff
with either a background in each specific research domain nor with up-to-date experience working
as an applied data scientist. It is therefore not surprising that the money flowing into universities to
develop data science research is being channeled into the operational expenditure of the research
groups themselves rather than into IT Services. However, the irony is that the research groups do not
have, and will never be able to afford, enough people with this rare combination of skills either.
4. CO-DESIGNING IT SUPPORT FOR DATA SCIENCE
In 2015, the University of Bristol started designing a data science institute, following its established
model for multidisciplinary university-wide institutes. While its existing institutes address specific
grand challenges, such as climate or health, the new one concerns a set of widely applicable
methods, tools. A process of co-design between academics and professional services is exploring a
broader model, the Data Institute, builds on Bristol's existing strengths in research data storage and
management, advanced computing and research software engineering (Gardiner et al. 2012). The
main challenge Bristol or other universities in providing world-class support for data science research
is to find economically sustainable ways of developing and bringing together teams of people, for the
right period of time, who collectively have the right mix of skills to support academic IT aspects of
data science embedded within research groups. From the IT side, a survey of all 190+ IT Services
staff skills provided an up-to-date profile of relevant skills to inform training and future recruitment
needs. On the academic side, a variety of staffing, advocacy and costing models are being
considered to bridge the data science skills gap that neither academic IT nor the Data Institute can
achieve alone. Options currently being explored include shared posts, facility-based versus fractional
posts as a means of cost recovery from grants - to fund people and equipment. Also, potential
synergies with corporate data storage, management and analytics are being examined: can we apply
our data science expertise from research to bring wider benefits to the organisation.
5. REFERENCES
ATI website (2015). The Alan Turing Institute - the UK's national institute for data science. Retrieved February 12, 2016, from: https://turing.ac.uk/.
RJMetrics website (2015). The State of Data Science. Benchmark Report Series. Retrieved February
12, 2016, from: https://rjmetrics.com/resources/reports/the-state-of-data-science/.
Donoho, D. (2015). 50 years of Data Science. Tukey Centennial Workshop, Princeton, NJ, September
18, 2015. Pre-print, Version 1.00, September, 18, 2015, Stanford University.
Gardiner, C., Gray, S., Price, S., Boyd, D., Knight, V., Steer, D. & Cregan, B. (2012). Towards
sustainable, enterprise-scale Research Data Storage and Management. Digital Research 2012,
University of Oxford.
Swanstrom, R. (2016) DataScience.Community website. College & University Data Science Degrees.
Retrieved February 12, 2016, from: http://datascience.community/colleges.
6. AUTHOR BIOGRAPHY
Dr Simon Price is the Academic Research IT Manager for the University of Bristol and a
Visiting Fellow in Computer Science, with research interests in Data Science, e-Science,
e-Research and Digital Humanities. He leads the Research IT group in the Advanced
284
Computing Research Centre, a joint venture between IT Services and the Department of Computer
Science. Over the last two decades years he has led a wide range of academic IT projects and
services at the University of Bristol, including strategic
institutional projects like the data.bris Research Data Service, IT Services R&D, the Institute for
Learning and Research Technology (ILRT), the Learning Technology Support Service, as well as the
Bristol Online Surveys (BOS) national service as well as numerous academic software development
projects. https://uk.linkedin.com/in/snprice
285
Future Trends in Higher Education and Research in Finland
Outi Tasala
Coordinator at CSC – IT Center for Science, Keilaranta 14, Espoo, Finland, [email protected]
Keywords
HEI’s, future, trends, education, research, national perspective
1. Summary
There is an endeavor in the higher education sector in Finland to identify and predict the future
trends that will have the most impact on the sector within the next 5 to 10 years. The aim is to
provide a national outlook on what is to come; to convey one possible picture of what the future of
the Finnish HEI’s, and perhaps also the international higher education and research communities,
will hold. The work is done with the goal of helping the institutions in finding a common ground
when planning ahead, thinking anew their ecosystems, and in identifying possibilities for working
together.
2. ABSTRACT
The field in which the institutions of higher education in Finland operate in is in flux, partly due to
the recession. The institutions have to cut back, but at the same time there is a need to invest in
digitalization, as this is seen as a way to ensure growth in the future.
A common understanding of the possible future changes is needed to steer the strategic decisions for
the future. Thus, it is important to know what the vital areas are where change is imminent, and
what to focus on in the long run.
In the higher education sector in Finland there is an endeavor to identify and predict the trends that
will have the most impact on the field within the next 5 to 10 years. The starting point for gathering
information was Educause 2015 conference, on the basis of which the representatives of the HEI’s in
Finland have compiled a list of the future trends in higher education and research. Finnish HEI’s
student administration staff, support services, experts on pedagogy, digital education and learning,
and experts on research administration are now processing the list further, and adapting and
localizing it to better suit Finland and the European higher education area. The results from this will
be presented in the Finnish rector’s ICT meeting in September 2016.
Future changes are inevitable and preparing for them well in advance is crucial. Work like this has
been done already, mostly from an IT perspective. Indeed this analysis builds on Educause and the
work by Gartner, among others. However, a local perspective is needed, especially in a small market
like Finland. The aim for this work is to provide a national outlook on what is to come; to convey one
possible picture of what the future of the Finnish HEI’s, and possibly also the international higher
education and research communities, will hold.
The work is ongoing and the final paper is expected by the end of 2016, but the results available now
already give good grounds for discussion in an international context. The early results show that in
the future even some of the core tasks may be outsourced and acquired from organizations outside
the institutions’ traditional ecosystems. Cooperation within the institution and faculties, but even
more importantly between the institutions, will make a greater success factor in a small market.
Business intelligence thinking is inserting itself in the Finnish HEI’s, and academic and learning
286
analytics will be utilized to a greater degree. There is also some indication that the core structure of
the institutions is changing, affecting the roles of staff in various ways.
This analysis hopes to serve as a toolkit for the rectors of the HEI’s in Finland; identifying the key
issues and making predictions for the future may help the institutions in finding a common ground
when planning ahead, thinking anew their ecosystems, and in identifying possibilities for working
together.
3. AUTHOR’S BIOGRAPHY
The author currently works as a coordinator at CSC – IT center for Science, an
organization governed by the Ministry of Education and Culture in Finland. The
work at CSC aims at helping the HEI’s in their efforts in digitalizing the
processes and services in the field of education, mainly by facilitating the work
of different interest groups. The author has a Master of Arts degree from the
University of Helsinki. More information about the author can be found on
LinkedIn:
https://fi.linkedin.com/in/outitasala
287
How Application Virtualization improved the student and staff IT experience at Odisee University
College Cloud computing, collaboration, standardization.
Jan Van Calster
1. SUMMARY
Odisee is a Flemish University college, based close to Brussels, Belgium, and a member of the KU
Leuven Association. The university was created on January 1, 2014 through the merger of
Hogeschool-Universiteit Brussel (HUB) and the Katholieke Hogeschool Sint-Lieven (KAHO, Ghent)..
Odisee currently has an enrolment of 11,000 degree programmes along with 9,500 postgraduate
programmes covered by 1,100 administration and academic staff across 6 Clusters. At campuses in
Brussels and Ghent, Odisee also service KULeuven University students (7000 enrolments) and
Academic staff (750 members). The University College currently employs Microsoft System centre
more commonly known as SCCM to distribute applications to the 4000 PC’s situated in a mixture of
Labs, open access Labs and staff/administrative desktop and laptops. All of these machines are
required for the Universities main function in bringing mainstream applications to the students,
teaching staff as well as applications necessary to deliver the day to day working of a successful
University.
2. THE PROBLEM
Odisee is committed to ‘Improving the Student IT Experience’ and as part of this program the
proactive management of the software estate and innovative ways of delivering software to users
would contribute positively to an all-around improvement in IT delivery.
Odisee had reached a point where the infrastructure for managing software delivery needed to be
brought in line with students expectations for modern software application delivery – anytime,
anywhere on demand.. One particular problem to remedy - the completion of a new request for a
software application by a user - was impacting on the ability of the IT team to meet SLA’s. With
lots of software applications to release, the ongoing testing and release cycle was consuming more
and more resource. This is could have contributed to user dissatisfaction with their IT Service and
was a key area to improve.
Distributing software in the ‘old’ way also created very large distribution packages. Like most
universities it is difficult to predict in advance in which classroom needed what software packages
In some cases an average of 140 software titles were installed on classroom PC’s. Managing this
many applications across 1000’s of PC’s could cause further issues; applications not working as they
should, incompatible software packages, conflicting requirements etc.
Moreover, to facilitate planning of computer classrooms, the installation of software titles in more
classrooms than actually needed could result in either violation of licensing agreements or in
extreme instances buying more licenses than actually needed.
Some software titles could be licensed to certain groups of students (e.g. ICT students) and
installed in dedicated labs However, this could restrict them from using this software in open labs
environments or in BYOD situations. It was clear that challenging the way the university delivered
software to students could provide an enhanced student experience
288
3. APPLICATIONS ANYWHERE, ANYTIME AND ANY DEVICE
In the field of education there is much diversity between institutions. There is no standard of
software delivery with most university IT teams adopting their preferred method of software
delivery. The needs of the university and requirements of the student need to be considered more
comprehensively in the age of Bring Your Own Device (BYOD). BYOD is commonplace nowadays but
for many this has sometimes stopped at providing WIFI access to student and staff’s own devices.
Historically, the idea of Universities collaborating to share packages were applicable has been
difficult because of the vast array of different technologies that are used.
The project, which sought a new technology to meet the correct requirements was funded by the
University to find the most efficient way of delivering applications to students and staff without the
need for physical installation of the software package. This was made all the more important due
to complex license models and the inflexibility of moving licenses around the University IT estate.
Maximizing benefits of Application Virtualisation
4. AMBITIONS
The project was designed to deliver many ambitions the University had when it came to delivering
software to staff and students. The most important ones being:
• Use IT to improve the student experience
• Deliver applications to the desktop quickly and efficiently
• Reduce log on times and IT administration
• Improve timetabling and asset management
• Reduce software license costs
• Easily support applications on campus and BYOD
• Focus on proactive student support
• Remove the need for multiple and/or large desktop images.
With a focus on the student experience; the solution needed to efficiently deliver applications to
the university managed estate, and the students unmanaged devices in a way that enabled tight
control over licenses.
High performance on machines using CAD/GIS/STEM was essential, as Odisee required a method of
delivery with no compromises, where the application could be locally executed on the device
making use of some of the powerful hardware already purchased for labs that required heaver
weight applications.
Another key requirement of the solution was to enable more informed decision making of
- what software titles were being used
- who was using software;
- the ability to structure software purchases more efficiently by knowing how many of
software application were being used and in what quantity.
Finally, an easy way for students and staff to access this large array of software without the need
for complicated installation on a University owned device. Likewise the solution needed to be user
friendly on a student/staff owned device (on or off campus) whilst giving IT control of offline
access and license control.
289
5. SOLUTION AND IMPLEMENTATION
An evaluation began and some investigation of the market in 2014 and after discussion with teams
in the Faculties, a project proposal came together that would see all 4 faculties join forces with
the aim of implementing a managed software delivery service that would be centrally run from IT.
The team agreed that the following requirements were crucial for a modern software management
and delivery infrastructure:
• Quick turnaround of packaging an application (hit more SLA’s)
• Simple console for ad-hoc deployment of apps
• Ability to add set list of applications to unattended PC install
• Web-based self-service kiosk for users (AppStore)
• Delivery of software to unsupported workstations (BYOD)
• Offline access; users must be able to use software when away from campus with no
connection
• Support for legacy applications on newer operating systems
• Security (applications must be managed to adhere to licensing regulations)
• Easy to update/patch applications (software kept up to date smoothly)
The contenders
• Citrix ZenApp – Discounted as out of budget range
• Microsoft App-V – Discounted as failed to meet all technical challenges
• Numecent/Software2 Application Jukebox – Finalist through to POC
The Application Jukebox system provided an advanced application virtualisation technology,
arguably offering Odisee greater flexibility than other application virtualisation products on the
market. It had already been implemented and used extensively at some of the Europe’s largest
universities with significant results.
Application Jukebox provides a mechanism to deliver, manage and virtualize applications to a client
machine from a centrally administered server. Odisee aimed to reduce the cost of application
delivery, while improving service levels, simplifying management, and improving reliability and
user experience.
With Application Jukebox, Odisee student could access and work on their applications as if they
were installed locally. There are no reported performance issues and no complicated proprietary
web interfaces they would need to navigate. Once activated, the university software applications
appear in their Start Menus or on their desktop – just like local applications.
Applications are now delivered to end-user machines across their networks, meaning students can
access the applications anywhere, whether on campus, at home or on the move. Critically, for the
IT team, applications still remain centrally controlled and can be revoked at any time.
The main anticipated benefits of the App J (Application Jukebox) system would include:
• Faster software installation and more reliable PCs
Reimaging of PCs is currently taking at least 6-8 hours. This is mainly down to the size of
the image(s) and the amount and size of the Software applications available on the PCs.
Using the application virtualisation software, PCs could be re-imaged in much less time
than before, with a more reliable build.
• Better and faster PC performance / running of applications
PC performance is improved as software packages do not have to be installed on the PC
image. Software would be deployed on-demand, which means that PCs would be running
quite lean, compared to the huge number of current applications that are currently sitting
290
on the PC. Traditionally, the more applications you install locally, the more bloated the
registry and system folder will get. This makes the computer slower and increases the risk
of failures. Application virtualization leaves the registry and the system folder untouched.
Moreover, the application still behaves as if it was locally installed, and there’s generally
no compromise on performance, so users can make full use of 3D graphics, HD content,
high-CPU performance and any other local resources. Advanced configurable virtualisation
means the user experience remains the same without any conflicts with the end machine.
• Improved speed and flexibility of software deployment.
Currently the image is agreed for each academic year, making if difficult to deploy new software or version upgrades etc. within the academic year. Application Jukebox would allow new software/versions to be easily deployed throughout the academic year, ensuring a more
flexible response to teaching /academic needs.
• Improved software license purchasing decision process.
By using Application Jukebox’s reporting tools, it is possible to see what software
application has been used. Application usage is metered within the system on a ‘per user
per second’ basis, so a wealth of data is available for analysis. This data is then fed into
Software2’s Hub, where management dashboards are created with up-to-the-minute
application usage information.
• Enhanced student experience;
Improved student experience – potentially any Windows application to any managed
machine. In addition, software applications could be found in a consistent way, across the
whole University.
• Full License Management leading to the maximisation of software resources
Administrators can keep track of exactly how many licences are being used at any given
time and redistribute them where necessary. By maintaining a central pool of licences and
allowing users to take from the pool wherever they are, as and when they need them,
resources can be maximised and vast amounts of money saved. For example, expensive
licences that are needed for teaching in School computer labs can be easily switched to
other areas, such as the LRC, when the computer labs are closed.
• Secure remote access to applications / Support for the Universities BYOD strategy
Applications are delivered to end-user machines across their networks, meaning users could
eventually access applications anywhere, whether at home or on the move. However,
applications still remain centrally controlled and can be revoked at any time. A self-service
portal could therefore, longer term, make it easy for students to access the software they
need on their own devices and laptops.
6. CONCLUSIONS
Application Jukebox has vastly improved the way we are delivering applications to;
- Odisee end users
- Odisee Students on university devices
- Odisee Students on their own devices
- Odisee Staff and administration desktops
Odisee now have the ability to stream any Windows application to any compatible device and have
vastly improved performance against SLA’s in the process.
291
7. AUTHOR’S BIOGRAPHY
Jan Van Calster – has a masters degree from the University of Leuven in Mathematics and applied
Computer Sciences and has worked for HUB and now Odisee as they are now known as since 1983.
Jan has taken on two roles in that time period serving as a member of the teaching staff; teaching
networking courses up until 2004 where after that period he took on the new role of ICT Manager
and now serves at the ICT Service Desk Manager.
His Linkedin profile can be found here : https://be.linkedin.com/in/janvc
292
EUNIS 2016: You are leaking metadata! Abstract
Asbjørn Reglund Thorsen
FSAT, Fridtjof Nansens vei 17, 0369 Oslo, [email protected]
Keywords
Hacking, metadata, automation, collection, analyzing, making, tool, harvest, google, dorking,
bigdata
1. Summary
A lot of people know that a document may contain information they don't want to share with the
world. But did you know that metadata in your pictures might have GPS coordinates embedded? Did
you know that your powerpoint presentation might contain your username, IP addresses and other
stuff that you might not want to share with the world. It's smart to check what information google,
bing and others have collected about you and/or your business. It's also smart to have a remove
metadata strategy so that you have control over your data.
2. ABOUT THE EXTENDED ABSTRACT
Each time you upload a picture, office file or something else to the internet, do you know what
metadata these files contain? Do you wash the files before you upload them?
Google, Bing and other search engines indexes all commonly awailable web site on the internet. This
presentation will in detail show how a hacker can use these search engines to harvest open data files
like ppt(x), doc(x), pdf, excel, odt, gif, jpg and a lot of other files. People often do not know or
think about that all files contain metadata and what information the metadata contains. Metadata
may contain information like names, usernames, passwords, IP adresses to the internal network, GPS
data, software versions used to create the document and much more. A hacker can use e.g Google to
scope searches to pin point certain files from certain companies to harvest information. It is possible
to automate such searches, and in this talk the presenter will walk you through how to make your
own tool to harvest data of interest. This talk includes several live demos and will be an eye opener
for people and/or companies, and will hopefully raise awareness of this topic. This talk is both for
technical and non technical people.
3. REFERENCES
Reglund.com. Security blog with code examples. Retrieved February 13, 2016, from:
https://www.reglund.com/youre-leaking-data-without-knowing-it/.
Reglund.com. Security blog with code examples. Retrieved February 13, 2016, from:
https://www.reglund.com/metadata-in-pictures-embedded-in-docx-files-2/.
4. AUTHORS BIOGRAPHY
Asbjørn Reglund Thorsen is group leader and head of development at group Delta at FSAT,
responsible for maintaining and developing applications for the national admission services in
Norway. He also works as a pen-tester, speaker and is a co-founder of Awareness Security AS. He is
board member of Open Web Application Security Project (OWASP) in Norway and has specialized in

293
web application security both as a pentester and course instructor, he also likes to play with wifi
pineapple and other gadgets. Linkein profile: https://www.linkedin.com/in/reglund
294
Democratizing (certified) video conferencing
George Kougioumtzakis1, Savvas Anastasiades2
1 Aristotle University of Thessaloniki IT Center, PO Box 888, EL 541 24, [email protected] 2 Aristotle University of Thessaloniki IT Center, PO Box 888, EL 541 24,
Keywords
Video conferencing decentralization, modernization, optimization, regulatory compliance.
1. Summary
An overly expansive view of legal/regulatory restrictions, coupled with an outdated perception of the cost and complexity of modern video conferencing implementations, have for some time prevented our institution from taking full advantage of video conferencing in its academic and administrative functions.
Addressing this, we have created a framework to further the deployment of small-to-moderate scale video conferencing services, i.e. with sessions involving 3-6 points of up to ten persons each, in a coordinated, decentralized and cost-effective way. We have seen substantial positive results while gaining insights that may be of use to institutions facing similar scenarios.
2. CONTEXT
Since 2011, Greek law grants collective bodies of Greek academic institutions the ability to conduct their official meetings via video conference, provided that the infrastructure exists to ensure participants’ identity as well as data confidentiality and integrity.
This provision, along with a concurrent change in the composition of a particular class of collective bodies (faculty election and advancement committees) created an immediate need for compliant (“CVC” - certified video conferencing) solutions to facilitate both hosting and participating in Greek academic institutions’ official meetings.
Initially, only one CVC capable installation was fully operational in our institution, with two more on limited availability. Unsurprisingly, demand surged and was poised to reach unsustainable levels, despite our scrambling to setup additional video conferencing points in our central facilities. In response, a goal was set to decentralize the CVC service, ideally setting up an independently operated installation at each department of our university.
We faced several challenges pursuing that goal; this is an outline of those that may be of interest to non-Greek institutions. The term CVC may hereafter be interpreted as “Video conferencing involving 3-6 points of up to ten persons each”.
3. CHALLENGES
3.1. Clearly define your aim
Video conferencing encompasses a broad range of scenarios and corresponding implementations, making it easy to lose sight of your target. Clearly defining and prioritizing your aims can save deployment time, effort and cost.
295
In our case, the focus was a baseline implementation that each of our institutions’ departments could deploy swiftly and at minimal cost to address their CVC needs. At the same time we pursued versatile and expandable implementations with an eye towards eventually addressing other video conferencing scenarios.
Affordability (including the ability to repurpose existing hardware), versatility and expandability made personal computers the most compelling platform to build around. Our baseline was nothing fancier than pc + projector + speakerphone + PTZ “pan-tilt-zoom” camera (we actually had to wait for the market to provide performance pc video conferencing equipment at a comfortable pricepoint before proceeding). We have since complemented this implementation with more sophisticated ones (always pc-based), to accommodate a broader spectrum of use-cases.
3.2. Develop comprehensive and tailor-made propositions
To be convincing, our proposition had to leave no blind spots and be able to stand up to minute
examination. A clear road map to implementation with time and cost estimates has been essential.
We found that, even if they were not strictly our responsibility, leaving pertinent aspects
unaccounted for made our proposition significantly less compelling. Items we had to consider
include:
• Technical and administrative workflow design
• Law and regulatory compliance (and misinterpretations thereof)
• Room configuration, including furnishing, lighting and soundproofing
• Equipment specifications, suggestions and possible vendors
• Equipment testing and setup
• Additional tools for scheduling and coordination
• Staff training
• Support and backup
At the same time, while based on a template, our approach had to be flexible enough to
accommodate (and, where possible, take advantage of) the specific situation and needs of every
department. As an example, we came across six separate instances where departments had invested
in dedicated video conferencing equipment but never came around to deploying it. In four of them,
it was possible to incorporate this equipment in our implementation and help them recover their
investment.
3.3. Practice what you preach
Initially, our central video conferencing facilities operated dedicated video conferencing (H.323) equipment and we soon found that advocating for one platform while using another weakened our argument. Also, faculty and administrative staff were often biased against a personal computer based setup, usually from personal experience with sub-par equipment.
In response, we procured and deployed our proposed baseline personal computer based implementation as the primary/default in our central facilities (pre-existing equipment was kept online as backup, as well as for psychological reasons).
Further, we visibly adopted our proposed tools and workflow, so organizers and participants of every meeting would experience a live functioning demonstration of our complete proposal. These participants often included people holding key positions in the decision making of their respective departments.
Feedback from daily interaction has shown that this has been a very effective way to clear misconceptions about the adequateness and efficiency of our proposal. Additionally, it has

296
encouraged the administrative staff de-mystify and engage in the CVC organization process, making it easier for them to eventually take over and operate independently.
3.4. Do not antagonize peripheral operators
This is especially important if you intend to offer your central facilities as backup for peripheral CVC points. By cultivating your services to an ever-higher standard, you may be discouraging efforts to replicate and decentralize them. In extreme cases this may even result in departments reverting from their already established CVC points, to yours.
To encourage decentralization, focus on a consistent level of service across every CVC point,
(including your own) and always seek to propagate any improvements you introduce.
3.5. Keep everyone in the loop
Open lines for communication with CVC points’ operators present you with an opportunity to benefit
from their feedback and help towards consistent CVC operations throughout your institution. This is
also valid for inter-institutional cooperation.
4. RESULTS
Table 1: Active CVC installations at the Aristotle University of Thessaloniki
2012 2015
H.323 based 3 7
Personal computer based 0 9
Total 3 16
The additional four H.323 implementations operating in 2015 are formerly inactive equipment which has since been activated. All CVC equipment procured since 2012 has been personal computer based.
Table 2: CVC decentralization
2012 2015
Schools with access to an active local installation
capable of hosting a certified video conference 3/41 (7.3%)
22/41
(53.7%
)
While far from complete, the level of decentralization we have reached has eased the pressure on
our central facilities, which are at the moment (and, barring dramatic regulation changes, for the
foreseeable future), operating under a sustainable load.
5. AUTHORS’ BIOGRAPHIES
George Kougioumtzakis: https://gr.linkedin.com/in/kougioumtzakis

297
Savvas Anastasiades: http://users.auth.gr/sanastas/CV-Anastasiades_en.doc
298
MOOCs: searching for a viable business model
Yves Epelboin1
1Professor Emeritus, university P.M. Curie (UPMC Sorbonne Universités), Paris, France
Keywords
MOOC, SPOC, e-learning, online course, business model
1. ABSTRACT
MOOCs are a new form of online learning different from the well-know distance learning, which
exists since many years. The novelty is in the fact that they are opened to a general public and
written for people working alone from a distance. All teachers, who have been involved in such
projects, agree that the courses must be completely rebuilt. One cannot just accommodate old
documents to a new means of distribution of the information. Moreover, MOOCs being accessible all
around the world, documents of poor quality, acceptable in the theater and a small class, must be
completely redesigned. Thus MOOCs are complex and expensive objects, which, contrary to ordinary
courses, require a full team, to be created. The pioneers were enthusiastic teachers and support
staff and did not count their efforts and time. But there is a large gap between building and
delivering a few MOOCs and systematically transforming a conventional teaching into MOOCs. Being
expensive any long-term project, based on MOOCs, cannot be launched without a business model and
all MOOCs creators, all MOOCs providers face the same dilemma: how to subsidize a pro-MOOCs
politics? We will first recall the environment needed to build a MOOC and explain why most
universities cannot define a business model by their own since they do have neither the finances nor
the manpower to systematically transform their teaching and massively create MOOCs. Cooperation
among universities, donators, special funding and other sources of income are needed. MOOCs
providers must also find their own business model, which differs from the possible ones for the
creators, and do not have other choice than to work together and find complementary business
models. In a last part we will show, through some examples, emerging business models for both the
providers and the creators. The future of MOOCs and online learning is closely linked to the
consolidation of these business models.
2. MANPOWER NEEDED FOR A MOOC
Building a MOOC has been, in the beginning, the work of teachers, pioneers and volunteers, who did
not count their time, who had decided, for various reasons to jump in this new venture. This is why
the time to build a MOOC, i.e. its cost has been systematically underestimated.
In a conventional course, the teacher stands alone in front of his/her students. The preparation and
writing of the course, therefore, are essentially solitary tasks. A certain part of the preparative work
may be done collectively, but ultimately, the teacher alone is in control of what he/she delivers to
the students and documents are judged more by their contents than by their form. But building a
MOOC is not just assembling a number of already existing documents and notes and quickly shooting
some videos. It is much more demanding because all documents will be available worldwide and
judged by numerous people. Quality has become an important matter (Butcher and Wilson-Strydom
2012) and online learning has been the first to profit from this momentum. The reputation of the
institutions as well as the authors might be at risk if this is not taken into account (Parr 2014). In
brief, to become a MOOC, a course must be rebuild from scratch.
A MOOC is a project, which requires the skills of very diverse people, as we will explain later. Like
any team project, it requires a project manager to run it. As one may imagine, most teachers are
unlikely to be willing to add this to their existing workload. They do not all possess the necessary
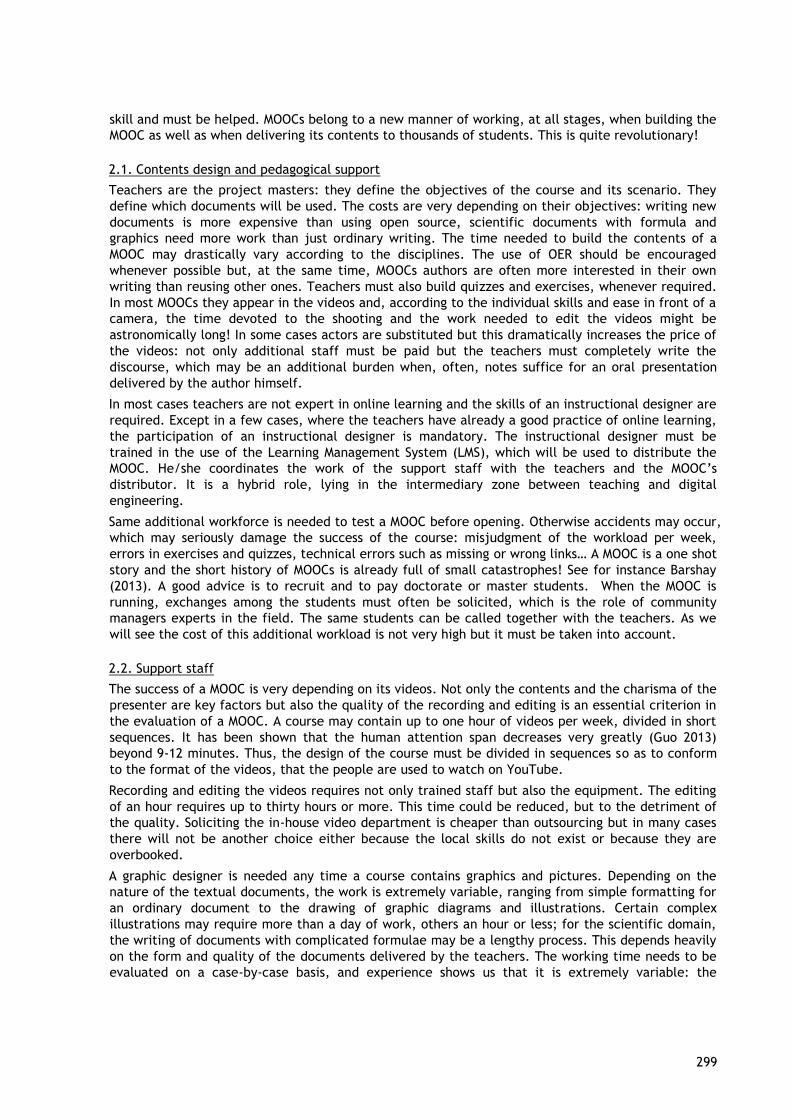
299
skill and must be helped. MOOCs belong to a new manner of working, at all stages, when building the
MOOC as well as when delivering its contents to thousands of students. This is quite revolutionary!
2.1. Contents design and pedagogical support
Teachers are the project masters: they define the objectives of the course and its scenario. They
define which documents will be used. The costs are very depending on their objectives: writing new
documents is more expensive than using open source, scientific documents with formula and
graphics need more work than just ordinary writing. The time needed to build the contents of a
MOOC may drastically vary according to the disciplines. The use of OER should be encouraged
whenever possible but, at the same time, MOOCs authors are often more interested in their own
writing than reusing other ones. Teachers must also build quizzes and exercises, whenever required.
In most MOOCs they appear in the videos and, according to the individual skills and ease in front of a
camera, the time devoted to the shooting and the work needed to edit the videos might be
astronomically long! In some cases actors are substituted but this dramatically increases the price of
the videos: not only additional staff must be paid but the teachers must completely write the
discourse, which may be an additional burden when, often, notes suffice for an oral presentation
delivered by the author himself.
In most cases teachers are not expert in online learning and the skills of an instructional designer are
required. Except in a few cases, where the teachers have already a good practice of online learning,
the participation of an instructional designer is mandatory. The instructional designer must be
trained in the use of the Learning Management System (LMS), which will be used to distribute the
MOOC. He/she coordinates the work of the support staff with the teachers and the MOOC’s
distributor. It is a hybrid role, lying in the intermediary zone between teaching and digital
engineering.
Same additional workforce is needed to test a MOOC before opening. Otherwise accidents may occur,
which may seriously damage the success of the course: misjudgment of the workload per week,
errors in exercises and quizzes, technical errors such as missing or wrong links… A MOOC is a one shot
story and the short history of MOOCs is already full of small catastrophes! See for instance Barshay
(2013). A good advice is to recruit and to pay doctorate or master students. When the MOOC is
running, exchanges among the students must often be solicited, which is the role of community
managers experts in the field. The same students can be called together with the teachers. As we
will see the cost of this additional workload is not very high but it must be taken into account.
2.2. Support staff
The success of a MOOC is very depending on its videos. Not only the contents and the charisma of the
presenter are key factors but also the quality of the recording and editing is an essential criterion in
the evaluation of a MOOC. A course may contain up to one hour of videos per week, divided in short
sequences. It has been shown that the human attention span decreases very greatly (Guo 2013)
beyond 9-12 minutes. Thus, the design of the course must be divided in sequences so as to conform
to the format of the videos, that the people are used to watch on YouTube.
Recording and editing the videos requires not only trained staff but also the equipment. The editing
of an hour requires up to thirty hours or more. This time could be reduced, but to the detriment of
the quality. Soliciting the in-house video department is cheaper than outsourcing but in many cases
there will not be another choice either because the local skills do not exist or because they are
overbooked.
A graphic designer is needed any time a course contains graphics and pictures. Depending on the
nature of the textual documents, the work is extremely variable, ranging from simple formatting for
an ordinary document to the drawing of graphic diagrams and illustrations. Certain complex
illustrations may require more than a day of work, others an hour or less; for the scientific domain,
the writing of documents with complicated formulae may be a lengthy process. This depends heavily
on the form and quality of the documents delivered by the teachers. The working time needs to be
evaluated on a case-by-case basis, and experience shows us that it is extremely variable: the
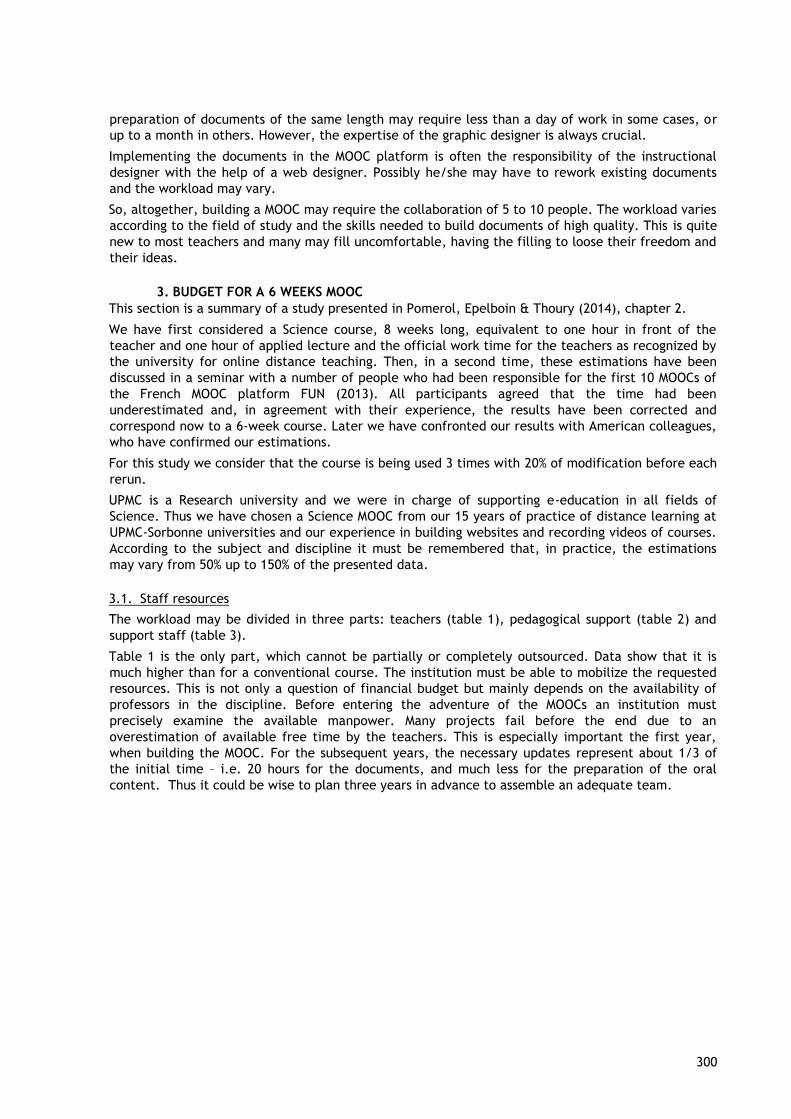
300
preparation of documents of the same length may require less than a day of work in some cases, or
up to a month in others. However, the expertise of the graphic designer is always crucial.
Implementing the documents in the MOOC platform is often the responsibility of the instructional
designer with the help of a web designer. Possibly he/she may have to rework existing documents
and the workload may vary.
So, altogether, building a MOOC may require the collaboration of 5 to 10 people. The workload varies
according to the field of study and the skills needed to build documents of high quality. This is quite
new to most teachers and many may fill uncomfortable, having the filling to loose their freedom and
their ideas.
3. BUDGET FOR A 6 WEEKS MOOC
This section is a summary of a study presented in Pomerol, Epelboin & Thoury (2014), chapter 2.
We have first considered a Science course, 8 weeks long, equivalent to one hour in front of the
teacher and one hour of applied lecture and the official work time for the teachers as recognized by
the university for online distance teaching. Then, in a second time, these estimations have been
discussed in a seminar with a number of people who had been responsible for the first 10 MOOCs of
the French MOOC platform FUN (2013). All participants agreed that the time had been
underestimated and, in agreement with their experience, the results have been corrected and
correspond now to a 6-week course. Later we have confronted our results with American colleagues,
who have confirmed our estimations.
For this study we consider that the course is being used 3 times with 20% of modification before each
rerun.
UPMC is a Research university and we were in charge of supporting e-education in all fields of
Science. Thus we have chosen a Science MOOC from our 15 years of practice of distance learning at
UPMC-Sorbonne universities and our experience in building websites and recording videos of courses.
According to the subject and discipline it must be remembered that, in practice, the estimations
may vary from 50% up to 150% of the presented data.
3.1. Staff resources
The workload may be divided in three parts: teachers (table 1), pedagogical support (table 2) and
support staff (table 3).
Table 1 is the only part, which cannot be partially or completely outsourced. Data show that it is
much higher than for a conventional course. The institution must be able to mobilize the requested
resources. This is not only a question of financial budget but mainly depends on the availability of
professors in the discipline. Before entering the adventure of the MOOCs an institution must
precisely examine the available manpower. Many projects fail before the end due to an
overestimation of available free time by the teachers. This is especially important the first year,
when building the MOOC. For the subsequent years, the necessary updates represent about 1/3 of
the initial time – i.e. 20 hours for the documents, and much less for the preparation of the oral
content. Thus it could be wise to plan three years in advance to assemble an adequate team.
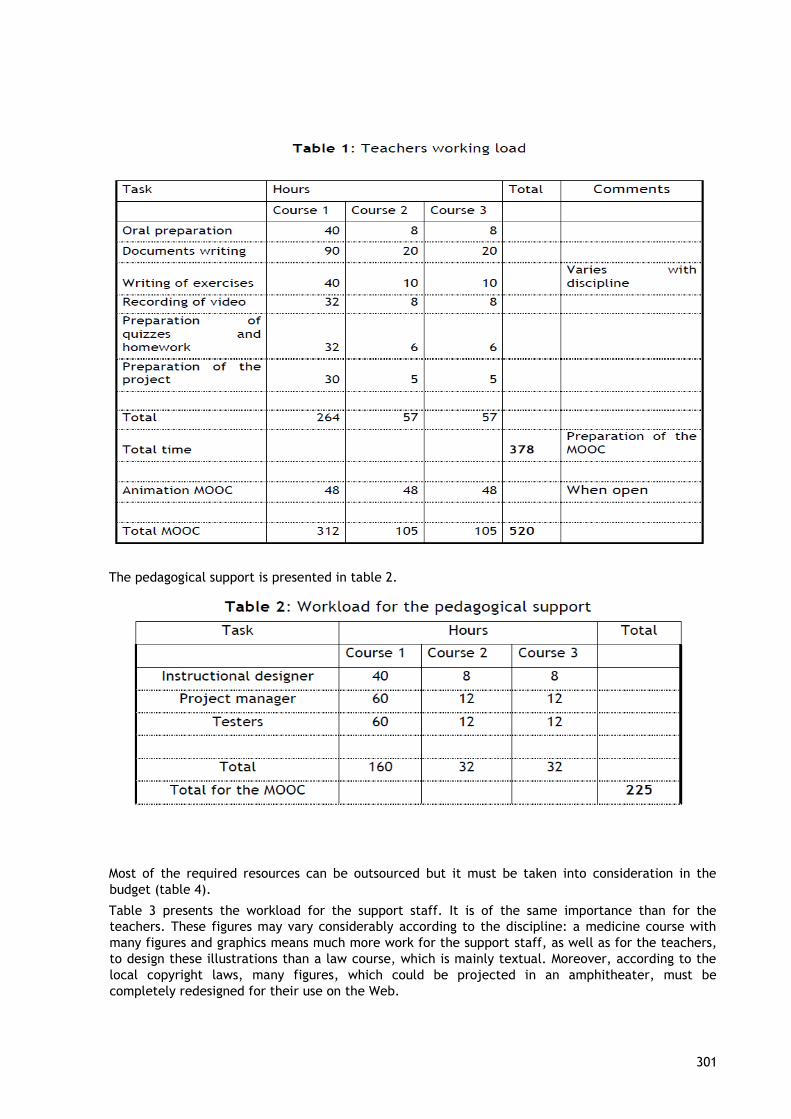
301
The pedagogical support is presented in table 2.
Most of the required resources can be outsourced but it must be taken into consideration in the
budget (table 4).
Table 3 presents the workload for the support staff. It is of the same importance than for the
teachers. These figures may vary considerably according to the discipline: a medicine course with
many figures and graphics means much more work for the support staff, as well as for the teachers,
to design these illustrations than a law course, which is mainly textual. Moreover, according to the
local copyright laws, many figures, which could be projected in an amphitheater, must be
completely redesigned for their use on the Web.
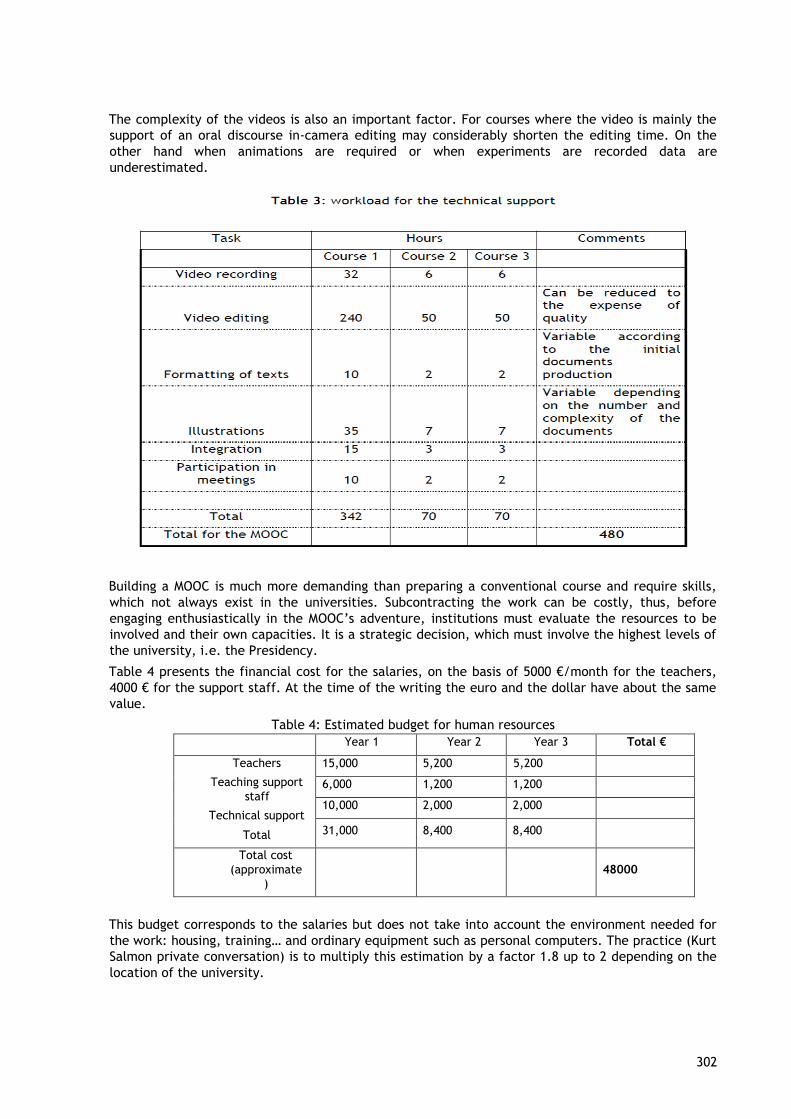
302
The complexity of the videos is also an important factor. For courses where the video is mainly the
support of an oral discourse in-camera editing may considerably shorten the editing time. On the
other hand when animations are required or when experiments are recorded data are
underestimated.
Building a MOOC is much more demanding than preparing a conventional course and require skills,
which not always exist in the universities. Subcontracting the work can be costly, thus, before
engaging enthusiastically in the MOOC’s adventure, institutions must evaluate the resources to be
involved and their own capacities. It is a strategic decision, which must involve the highest levels of
the university, i.e. the Presidency.
Table 4 presents the financial cost for the salaries, on the basis of 5000 €/month for the teachers,
4000 € for the support staff. At the time of the writing the euro and the dollar have about the same
value.
Table 4: Estimated budget for human resources
Year 1 Year 2 Year 3 Total €
Teachers
Teaching support
staff
Technical support
Total
15,000 5,200 5,200
6,000 1,200 1,200
10,000 2,000 2,000
31,000 8,400 8,400
Total cost
(approximate
) 48000
This budget corresponds to the salaries but does not take into account the environment needed for
the work: housing, training… and ordinary equipment such as personal computers. The practice (Kurt
Salmon private conversation) is to multiply this estimation by a factor 1.8 up to 2 depending on the
location of the university.
303
3.2. Logistics for a MOOC
Except for the video, the equipment is quite reasonable: computers and their software, from word
and HTML editors up to Adobe Photoshop and Illustrator or equivalent. When animations are required
it is more complicated and can be justified, in-house, when used elsewhere in the institution.
The environment for recording the videos may vary considerably, according to the desired quality
and sophistication of the videos. The first factor to be taken into consideration is the available skills.
It would be useless to build an expensive studio for video beginners. It rises from a few thousands
euros to record an oral speech up to €30,000-50,000 to be able to change the background, to be able
to record a writing hand and to multiply the points of view. EPFL (2012), in Lausanne, has written a
short memo to guide the newcomers.
The environment needed to distribute the course and make it available to the students will be
discussed later together with the business models for the MOOCs providers because we believe that
it would be unwise for a single university to be its own provider: running an Information Systems
environment 24/7, accessible for tens of thousands users or more without disturbance is not within
the reach of most universities.
4. COST EFFICIENCY OF DIFFERENT METHODS OF TEACHING
In the beginning of MOOCs much has been said about the end of the universities since MOOCs would
permit a mass education for a much cheaper price. See for instance Frey (2013) or The Economist
(2014) but looking at the previous figures one can imagine that the reality is not so simple.
Let us now compare the costs when delivering the same course in a hybrid mode, i.e. a SPOC (Small
Private Online Course) with small groups of students in face-to-face classes like it is used at EPFL or
in the classical approach, i.e. in a lecture hall. The SPOC needs fewer teachers because plenary
lectures in the amphitheater are suppressed and the number of application lectures in small groups
is reduced. When delivering the course as a MOOC, community managers only are needed in front of
the students. This cost is drowned in the total cost to build the MOOC, especially considering the
variability of our estimation between 30 000 € and 100 000 €!
In our calculation, we consider one teacher for 50 students and a meeting every two weeks for the
hybrid mode (SPOC). For the classical delivery one hour in the theater per week and one meeting
every week in small groups (50 students). Since we did not have a precise estimation for the cost of
the buildings, our estimation is based on the lower bound of rental prices. This therefore includes
the depreciation of the assets. Thus this curve is not correct when taking into account the huge
investment of building new premises. When this investment is not available, such as in many African
and Asian countries, SPOCs and MOOCs become the only solution. This will have to be remembered
when presenting some business models later.
Results are shown in figure 1.
The cost increases rapidly with the number of students because the salaries of the teachers
represent an important part of the expenses.
Distance education and SPOCs are about the same and are represented on the same curve. Distance
education requires personal exchanges between the teachers and the students and the workload is

304
about the same. The only difference is the cost of the buildings.
Figure 1: comparison of the cost of delivery of a conventional course, a SPOC and a MOOC
For the classical delivery, our estimates are based on the official working time of Higher Education
teachers in France: 6 hours of work for one hour in front of the students in the lecture hall, 4 hours
of work for one hour of applications lecture with small groups of students. Playing with all these
variables and different estimations for the cost of the MOOC, gives always curves shown in figure 1.
Below 200 up to 300 students the cheapest means to deliver a course is the classical approach.
Blended learning (SPOC) becomes cheaper only for large classes above 500 students. A conventional
MOOC, i.e. delivering a course without face-to-face interaction and no personal interaction is never
of interest below 300 students. These values vary with the real cost of the MOOC and other
variables such as salaries, buildings… which may change from one university to another, but the
message is very clear: savings can be made, using MOOCs or SPOCs, only for very large groups of
students. For a single university it may only work for the freshmen years.
This leads to two conclusions: increasing the number of students or grouping universities, to share
the costs, are the only solutions to save money. These are just the solutions, emerging in some US
universities.
5. BUSINESS MODELS: WHY TO INVEST IN A MOOC?
MOOCs can be used in various contexts: initial or life long education or simply for personal
development. The list of possible motivations is infinite.
In the classical framework of universities, MOOCs permit to innovate by offering alternative methods
of teaching and learning, complementary or substitute of the traditional methods. The MOOC
approach is not really new since traditional Learning Management Systems (LMS) already permit this
approach. But it has been seldom used. MOOCs add the new Web 2.0 popular social aspects, and are
a unique opportunity to generalize initiatives, which, in the past, have had difficulties to go beyond
the prototype stage and were kept in a niche. In a globalized world, where it would be necessary to
open a university every day to educate the young generation, MOOC are the only realistic substitute
to educate large masses of students. This is true in Africa and Asia, but also in a number of other
countries.
Before proposing a strategy and its business model, it is necessary to clearly define the goals,
prioritize them and estimate the budget required. The following list summarizes possible
orientations. The order of presentation has no meaning.
1. As a support for an educational transformation
305
SPOCs might be an important constituent of a change in education, including the first year in
university. This is one of the major objectives of the EPFL in Lausanne. Flipped pedagogy
through MOOCs aims to make the students involved in their training. This approach is being
thought mainly for newcomers, in the first year of bachelor. One of the concerns is to train
the students to be autonomous. This approach has some limitation since the campus social
life, at least in Western societies, is an important aspect of the culture for young people and
it is necessary to offer spaces where they may work together, watch courses videos together
and, more generally, mix. In other words it is necessary to create learning spaces and
learning centers.
2. For students who missed an examination
When a student does not succeed in a module for the first semester, at least in France,
he/she has to wait until June to pass again the examination. In the mean time he/she no
longer addresses the matter. This is also relevant for students who have been allowed to go
into the next year without completely acquiring the previous year.
3. At the entrance of the University
Many students engage in Higher Education without having the level and/or without really
knowing the discipline they have chosen. Specialized short MOOCs could help them to realize
the direction in which they undertake studies, what does it means and also and to assess
themselves their skills in order to avoid disappointment.
4. For life long learning, specialization, improvement of professional skills.
When addressing people already engaged in their professional life, face-to-face exchange
may not be necessary and may be replaced by any exchange tool, from videoconference
(Skype for instance) to simple chat. However, each student must be able to interact with a
teacher and establish a personal relationship. This is the only difference with a MOOC, where
students remain quite anonymous and requires a different approach called SPOC (Small
Private Online Course).
5. For all international students who cannot access higher education.
Universities from less developed countries, Africa and Asia first, would appreciate a help
from more developed countries. Not all countries speak English and there is a place for other
languages. Moreover, the approach to teaching and learning is strongly related to the
national culture and a number of countries might be interested in a different approach from
the dominant US one. The best approach would certainly be to help these countries to
develop their own MOOCs, taking into account their own culture.
Culture dissemination being one of the HE mission, such MOOCs are a good means to fill it.
6. To share an expertise or learning on any topic with anyone.
The scientific reputation of excellence of a university must be based on two legs: research
and teaching. It is one of the missions of the universities. Moreover, it is a good means to
establish and maintain the reputation of the institution.
7. To attract good students from all around the world at bachelor or master level.
Students from abroad as well as students who have been following other curriculums would
be better prepared to attend a curriculum, especially at higher level, when using MOOCs
before arriving.
Universities are constrained by their financial and staff resources. The high expenditure can be
recover only for large numbers of students such as newcomers in universities or through an active
policy for distance education. In other parts of the world, mainly Africa and Asia, where it should be
necessary to build one university everyday, using MOOCs may drastically decrease the capital
investment in buildings and teacher training. However, it is not so easy to maintain a link between
students and teachers, as the experience of the virtual university in Senegal seems to show it
(Caramel 2015). In all other cases building MOOCs is a political decision for which a precise business
model must be established. The adequate human and financial resources must accompany it.
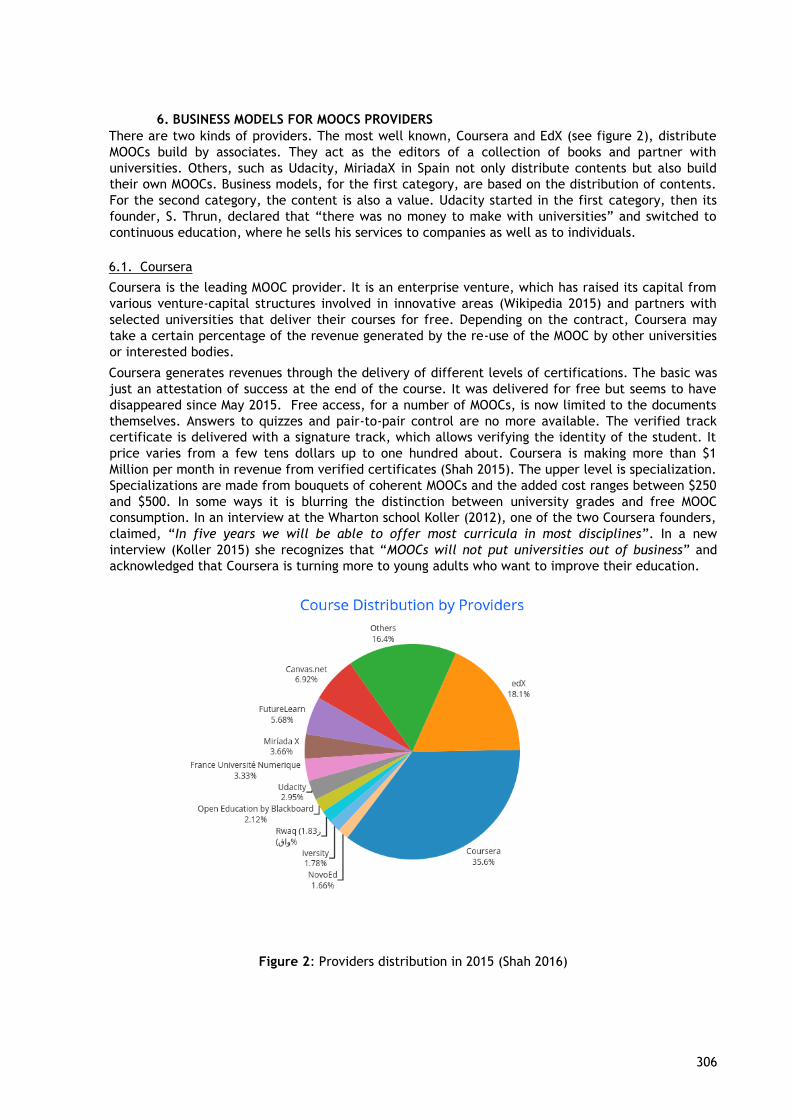
306
6. BUSINESS MODELS FOR MOOCS PROVIDERS
There are two kinds of providers. The most well known, Coursera and EdX (see figure 2), distribute
MOOCs build by associates. They act as the editors of a collection of books and partner with
universities. Others, such as Udacity, MiriadaX in Spain not only distribute contents but also build
their own MOOCs. Business models, for the first category, are based on the distribution of contents.
For the second category, the content is also a value. Udacity started in the first category, then its
founder, S. Thrun, declared that “there was no money to make with universities” and switched to
continuous education, where he sells his services to companies as well as to individuals.
6.1. Coursera
Coursera is the leading MOOC provider. It is an enterprise venture, which has raised its capital from
various venture-capital structures involved in innovative areas (Wikipedia 2015) and partners with
selected universities that deliver their courses for free. Depending on the contract, Coursera may
take a certain percentage of the revenue generated by the re-use of the MOOC by other universities
or interested bodies.
Coursera generates revenues through the delivery of different levels of certifications. The basic was
just an attestation of success at the end of the course. It was delivered for free but seems to have
disappeared since May 2015. Free access, for a number of MOOCs, is now limited to the documents
themselves. Answers to quizzes and pair-to-pair control are no more available. The verified track
certificate is delivered with a signature track, which allows verifying the identity of the student. It
price varies from a few tens dollars up to one hundred about. Coursera is making more than $1
Million per month in revenue from verified certificates (Shah 2015). The upper level is specialization.
Specializations are made from bouquets of coherent MOOCs and the added cost ranges between $250
and $500. In some ways it is blurring the distinction between university grades and free MOOC
consumption. In an interview at the Wharton school Koller (2012), one of the two Coursera founders,
claimed, “In five years we will be able to offer most curricula in most disciplines”. In a new
interview (Koller 2015) she recognizes that “MOOCs will not put universities out of business” and
acknowledged that Coursera is turning more to young adults who want to improve their education.
Figure 2: Providers distribution in 2015 (Shah 2016)
307
Some people doubt that Coursera will be able to make money from certificates only and wonder if it
may not turn into an online university later. For the moment D. Koller claims that “the pressure [is]
to bring in revenue because we want to bring revenue back to our university partners so that they
can sustain their course development”.
Coursera business model, based on delivering certificates, is constraint by avoiding competition with
its partner universities. Since Coursera is selecting its partners it may restrict itself into competing
with the most modest colleges only, offering “the best courses for a modest fee”. Not everybody is
convinced that Coursera will be able to generate enough revenue through the delivery of certificates.
6.2. EdX
EdX has a complete different business model. It is a not-for-profit company, a foundation with
primary funding from MIT, Harvard and the Bill and Melinda Gates Foundation. More than 50
institutions have joined them. Partners may choose between two models. In the first one, EdX
retains most of the revenue made from the course. In the second one it may provide assistance to its
partners and act as consultant (Kolowich 2013, Ross 2014).
Access to the EdX platform may be free for universities but EdX retains most of the possible revenue.
Partners universities can become members of the foundation and must pay a high fee. EdX
encourages another form of partnership through the development of Open EdX, which has been
adopted by many consortiums and private companies such as FUN in France, XuetangX in China,
Edraak in Jordania… More than 120 installations exist now around the world.
Students may obtain for free an Honor code certificate, simple attestation of participation. They
may also obtain verified certificates similar to the Coursera ones for a fee between a few $tens and
$100. Xseries certificates are equivalent to the Coursera specializations.
A main difference between both business models is that EdX must just sustain itself and does not
need any other return to its initial investors. EdX President Arnt Agarwal declares that EdX wants
only to be self-sustained. EdX counts on its partners’ consortiums, which are running Open Edx. EdX
sustainability is linked to the good will of its partners. How long will they be able to provide funds?
6.3. Other US providers
Coursera and EdX are working mainly with universities. Among the other providers it is worth
mentioning Udacity and Udemy, which have a very different business model
Udacity started, like Coursera, as a private company and with the same objectives: to complement
or to be a substitute to the classical Higher Education approach. Its funder, S. Tron went to the point
to work with San Jose University but this initiative was a failure, very few students passing the final
grade with success. He concluded that massive open online courses do not work for Higher Education
(Waters 2014) and turned quickly towards professional development (Chafkin 2013). Udacity offers
its own courses to the public for a small amount of money (some are free) and also develop courses
at the demand for companies. It works together with names such as Google, Facebook, and ATT… For
$200 per month students may follow selected bouquets of courses developed with the industry
(similar to Coursera specializations) and obtain nanodegrees. It includes a personal coaching and
pretends to become an alternative to university grades for people already engaged in their
professional life.
Udacity pretends to build its business model by working with the industry to offer intensive courses
oriented towards high skill jobs. The company said it officially reached profitability in July 2015
(Mathewson 2015).
Udemy (Udemy 2013) follows a different business model. It acts as an online marketplace where
independent instructors can build and sell courses. Udemy is taking a share of the money that
students pay to follow the courses. This share depends on who is recruiting the students, the teacher
or Udemy. Other vendors use the same business model and the competition may become tough to
retain the best teachers (McGuire 2014).
308
Looking at EdX business model on one hand and Coursera and Udacity on the other one, it seems that Coursera is more and more following Udacity business model finding more potential from partnership
with the industry.
Maintaining a list of all startups in the MOOC business is quite a challenge. See for instance Class
Central (2015) although it is mainly oriented towards the US market.
6.4. European Providers
Nobody in Europe can claim to be the European provider. A few countries have established national
providers, most of the others rely on local or private initiatives of limited extends.
Futurelearn (2013), in UK, is a charity from the Open University; Futurelearn wants to bring the best
of UK universities worldwide. More recently it has invited foreign universities to join but publishes
courses in English only. Futurelearn develops its own software with a different insight towards the
pedagogy, encouraging interactions among the students. Access is free but a statement of
participation (a simple unverified certificate) costs 29£. A statement of Attainment (verified
certification) costs 119£. Futurelearn does not look for other resources. Its total dependency from
The Open University is its weakness: the charity recently announced that it was in deficit of £ 17M,
due to the declining number of students registering for its distance learning.
France Université Numérique (FUN 2013) is a national initiative launched by the Ministry of Higher
Education in France in June 2013, it made the choice of Open EdX as soon as available. It is now a
consortium of most French universities. FUN delivers unverified certificates. Very soon its members
will offer ECTS (European Credit Transfer System) through classic examinations or distance control
like EdX and Coursera. Members of the consortium pay a fee from €5,000 for two MOOCs per year up
to €20,000 per year for an unlimited number of MOOCs, 5 SPOCs per year and the possibility to use
the platform to deliver their courses their courses for online continuous education. A recent report
(France Stratégie 2016) mentions that it must find additional resources through various means,
selling courses for continuous education to the industry or to other universities.
Iversity (2015) in Germany, plays a double role as a classical MOOC provider in Germany and, at the
same time, develops its own line of courses. Iversity’s business model is also to act as a broker of
ECTS for European students. Although European universities have standardized their curricula, it is
not easy today for an European student to include external ECTS in the curriculum of the university
where he/she is registered. Iversity believes it can act as an intermediary.
MiriadaX, in Spain, is less known. However, according to figure 2, it is the second provider in Europe.
It is a Spanish-speaking platform with contributors from 45 universities from Spain and South America
with support from Telefonica, Banco Santander. Very few is known about its business model. It
seems to be oriented mainly toward education in South America.
These are the most well known European providers working with universities. Each of them is mainly
working in its own country, although they are willing to expand their influence.
EADTU (European Association of Distance Education) is trying to assemble information about existing
MOOCs and to act as a hub through a European initiative OpenupEd (OpenupEd 2013). It is only a
relay of information.
A number of private start-ups are going into the business of MOOCs. Their business model is mainly
oriented towards continuous education and with some sectors of the Higher Education able to
provide a technical education of direct interest for the companies. They sell their courses to
individual and to the industry. Openclassrooms, in France, is a good example: for 20€/month any
individual may have access to their documents, for 90$ people may follow a given course and for the
duration of the course have a weekly distance class exchange with a tutor. For 300€ it becomes a
personal tutoring.
A number of providers build their business models around freemium: free or cheap access to basic
documents and different levels of fees according to personal or group training.
309
7. Business models for universities
Various conferences in Europe show that the interest for MOOCs in Europe does not yet reach the
peak of the hype curve, showing a large difference of the strategy between the European HE
institutions and the US ones. This is clearly explained in the Porto (2014) declaration in favor of open
and online education. But, to our knowledge, very few business models seem to appear in Europe
when the path is already paved in the US. In other parts of the world (Middle East and Asia) the
situation is unclear.
7.1. Business models for US education
The fees, in the US institutions, have reached an unacceptable level and the result is that the total
student debt is greater than the housing one, of the of the order of $1200 Billions! Between 2002 and
2012 the mean debt per student has doubled (Wikipedia 2016), so that more and more young people
are asking themselves about the value of HE study above the Bachelor level. At the same time there
is a demand for more colleges seats at a reasonable price. To decrease the cost of education by the
means of MOOCs it is necessary to assemble large cohorts of students, as seen in figure 1. Coursera
and EdX are playing this role.
Arizona State University, one of the largest US Universities, has established, in partnership with EdX,
the Global Freshman Academy (Hill 2015), an online program to offer to freshmen the first year of
university, for a lower price. Students must acquire 8 credits among 12 courses, each for $200, but
they will pay only in case of success. The only non-reimbursable fee is for the verified certificates,
which will cost $45. This means that a year of study will cost less than $6000 and that most of the
money will be paid in case of success only. The number of students is unlimited. ASU is paying for
the courses development and EdX for the platform. Knowing the number of students, who leave the
university without anything, the smart idea with this project is to pay in case of success only. ASU
and EdX believe they will attract enough students to recover the investment.
Another example (Straumsheim 2015) is the online MBA program from Urbana Champaign University;
it is built in partnership with Coursera. This eMBA will be made of specializations. The contents,
made of 18 courses, will be available for free as MOOCs. Students, who pursue the eMBA, will follow
the same courses with the addition of all the university facilities and mentoring from a distance for
$1000 each. They must also pay $79 for each verified certificate. The total cost of the degree will
be about $20000. A great idea is that they can take (and pay) the courses individually and postpone
their decision until the end, thus paying by fractions, if they go to the end of the program. Once
again, this model allows students not to pay before knowing their chances of success. Coursera
recovers some funds through the verified certificates; the University expects to bring enough
students in its existing MBA to cover its expense.
MIT has a different approach, considering using the same courses internally as SPOCs and a selection
of them externally as MOOCs. The smart idea is that the additional expense is very limited when
using internal resources outside. Since Open EdX is their LMS, the additional cost to transform an
internal course into a MOOC is just exporting the course to EdX and paying for the animation of the
course. They also plan to use MOOCs as an admission test. Newer is a pilot program for a
micromaster degree, which can be obtained online through selected MOOCs and verified certificates.
Successful students may then apply for a second semester on campus to complete their degree.
These examples show an ongoing direction, in the US, to mix online and on campus courses, to
decrease the fees addressing the courses to a larger number of students. At the same time, in a
world where universities are competing to recruit the best students, MOOCs are a good means to
attract and test good students. Some universities, for instance, offer grants to the students, who
succeed in their own MOOCs.
More generally, in the US, MOOCs are now merging in the online offer. Some may be opened to the
general public and, at the same time, being used internally with a full mentoring.
7.2. Business models for European universities
A very important difference, between Europe and the US, is that (with the exception of UK except
Scotland), most universities are under State regulations and that the level of fees is rather limited.
310
Thus the interest in MOOCs is seldom to decrease the cost of the fees. Reasons to build a MOOC are
more relevant to the categories presented in section 5. No one university believes it may recover the
expense needed to develop MOOCs except for the few, which may be sold for continuous education.
This is why business models are mostly based on the possibility of obtaining grants from national and
European agencies.
EPFL in Lausanne (Switzerland) is one a few HE institutions with a clear business model. Pioneer for
the MOOCs in Europe, working with Coursera and EdX, EPFL has first offered MOOCs as an efficient
communication medium and has been very successful in this. It now offers full curricula, delivering
ECTS for €30, a full cursus being made of 8 to 12 ECTS. Examinations are of the classic form in
partners’ centers (EPFL 2014). This hybrid education is oriented mostly towards French speaking
Africa, where EPFL expects to find a relay of development.
Other initiatives, where institutions deliver ECTS, slowly emerge all around Europe, but, as already
mentioned, these ECTS are not, for the moment, transferable between institutions and thus cannot
be part of a diploma and are of very limited value. This may change when MOOCs will be used
intensively in the universities as part of their distance learning activity but nothing, comparable to
the US, is yet visible. EPFL is an exception.
So, to conclude, no clear business model is yet emerging in European universities.
7.3. Business models in Asia and Africa
Education is certainly one of the main objectives, in any country, for a better future. This requires
huge capital investments; it is not only a question of finances. Most countries in Africa and Asia do
not possess the number of required teachers and their training will take years. They do not have the
capacity, in capital investment and in human resources, to build classical universities. A special form
of MOOCs, if adapted to the local environment and local culture, is the only solution. Teaching
through MOOCs will lower the number of required teachers and the capital investments to teach a
huge number of students. For the moment most of the initiatives are coming from the Northern
countries and the main providers. Most do not yet have any business model and are supported by the
enthusiasm of local universities, who do a fantastic job with very modest means. Edraak (2013) is a
political one for Arabic speaking countries. Oyo and Kalema (2014) have explained the state of online
courses in Africa and why this continent is far from thinking about business models. See also
eLearning Africa news 2015.
In Asia, MOOCs have mainly be the playground of the main US providers except for the Chinese state
agency XuetangX already mentioned. Singapore, Hong Kong universities obviously have the capacity
to build and distribute their own MOOCs but it is too early to speak of business models.
8. CONCLUSION: WHERE DO WE STAND?
MOOCs business models are not yet established. The future may be quite different in US and in
Europe. In US, where the fees are sky-rocketing some Higher Education institutions, at the college
level, might be in danger and be challenged by distance education through MOOCs. However, the
universities, offering master and doctorate levels, seem confident about their future. MOOCs have
been a push to develop online courses both for distance and for on-campus studies. MOOCs are a
byproduct of this movement and will continue to grow. In Europe the changes are slower and a
number of universities still believe in the interest of “open” MOOCs. However, this generous idea is
challenged by the limitation of resources. MOOCs are moving traditional teaching out of a false
equilibrium and we may expect that online education will be fully recognized in traditional
education. Nevertheless funding will be a limitation in most institutions. In Asia and Africa the
movement is only starting. India is becoming an active player after China. MOOCs are the only
solution to respond to the education challenge when one should build one university every day. But
it is still to come.
Continuous education will be revolutionized. Successful companies appear already both in US and
Europe. It is the area where the business models are clearer and all companies and institutions,
involved today in this area, will be challenged soon.
311
9. REFERENCES
Barshay J. (2013). My first MOOC: Online class about how to create online classes failed miserabily.
The Hechinger Report. Retrieved from http://digital.hechingerreport.org/content/my-first-
mooccrashed_371/
Butecher N., & Wilson-Strydom M. (2012). A guide to quality in online learning. Academics
Partnership. Retrieved from http://teachonline.ca/sites/default/files/tipstools/A%20Guide%20to%20Quality%20in%20Online%20Le
arning.pdf
Caramel L. (2015). Le calvaire des étudiants de l’Université Virtuelle du Sénégal. Le Monde,
23/07/2015. Retrieved from http://www.lemonde.fr/afrique/article/2015/07/23/le-calvaire-
bienreel-des-etudiants-de-l-universite-virtuelle-du-senegal_4695253_3212.html
Chafkin M. (2013). Udacity’s Sebastian Thrun, Godfather of free online education changes course.
Fastcompany, 14 November. Retrieved from
http://www.fastcompany.com/3021473/udacitysebastian-thrun-uphill-climb
Class Central (2015). List of MOOCs providers. Retrieved from
https://www.classcentral.com/providers
Edraak (2013) Arabic MOOC Platform. Retrieved from https://www.edraak.org/ eLearning
Africa News (2015). Retrieved from http://ela-newsportal.com/tag/mooc/
EPFL (2012). MOOC Studio Recording. Center for Digital Education. Retrieved from
https://documents.epfl.ch/groups/m/mo/moocs/www/MOOC-Full-Studio.pdf
EPFL (2014) Formations hybrides EPFL. Retrieved from http://moocs.epfl.ch/page-118161-fr.html
Frey T. (2013). By 2030 over 50% of colleges will collapse.
Retrieved from
http://www.futuristspeaker.com/2013/07/by-2030-over-50-of-colleges-will-collapse/
France Stratégie (2016) MOOC français : l’heure des choix (in French), February 4th. Retrieved from
http://www.strategie.gouv.fr/presse/communiques-de-presse/mooc-francais-lheure-choix
FUN (2013). France Université Numérique. http://www.france-universite-numerique.fr/moocs.html
Futurelearn (2013) UK MOOC Platform. Retrieved from http://www.futurelearn.com
Guo P. (2013). Retrievd from http://blog.edx.org/optimal-video-length-student-engagement/ Hill P.
(2015). ASU, edX and The Black Knight: MOOCs are not dead yet. E-Literate, April 22.
Retrieved from http://mfeldstein.com/asu-edx-and-the-black-knight-moocs-are-not-dead-yet/
Iversity (2015). Retrieved from https://iversity.org/en/pages/financing-round-in-the-millions
Koller D. (2012). Interview at Wharton School. Retrieved from
http://knowledge.wharton.upenn.edu/article/moocs-on-the-move-how-coursera-is-disrupting-
thetraditional-classroom/
Koller D. (2015). Interview at Wharton School. Retrieved from
http://knowledge.wharton.upenn.edu/article/moocs-making-progress-hype-died/
Kolowich S. (2013). How EdX plans to earn and share revenues from ist free online course. The
Chronicle of Higher Education. 21 februa ry. Retrieved from
http://chronicle.com/article/How-EdX-Plans-to-Earn-and/137433/
Mathewson T.G. (2015). Udacity’s new business model markets nanodegrees for high-demand skills.
Education Dive 17 september. Retrieved from http://www.educationdive.com/news/udacitys-
newbusiness-model-markets-nanodegrees-for-in-demand-skills/405832/
McGuire R. (2014) Is the Udemy Marketplace model still valuable to instructors?. Skilldup.
5December. Retrieved from http://www.skilledup.com/insights/is-the-udemy-marketplace-
modelstill-valuable-to-instructors
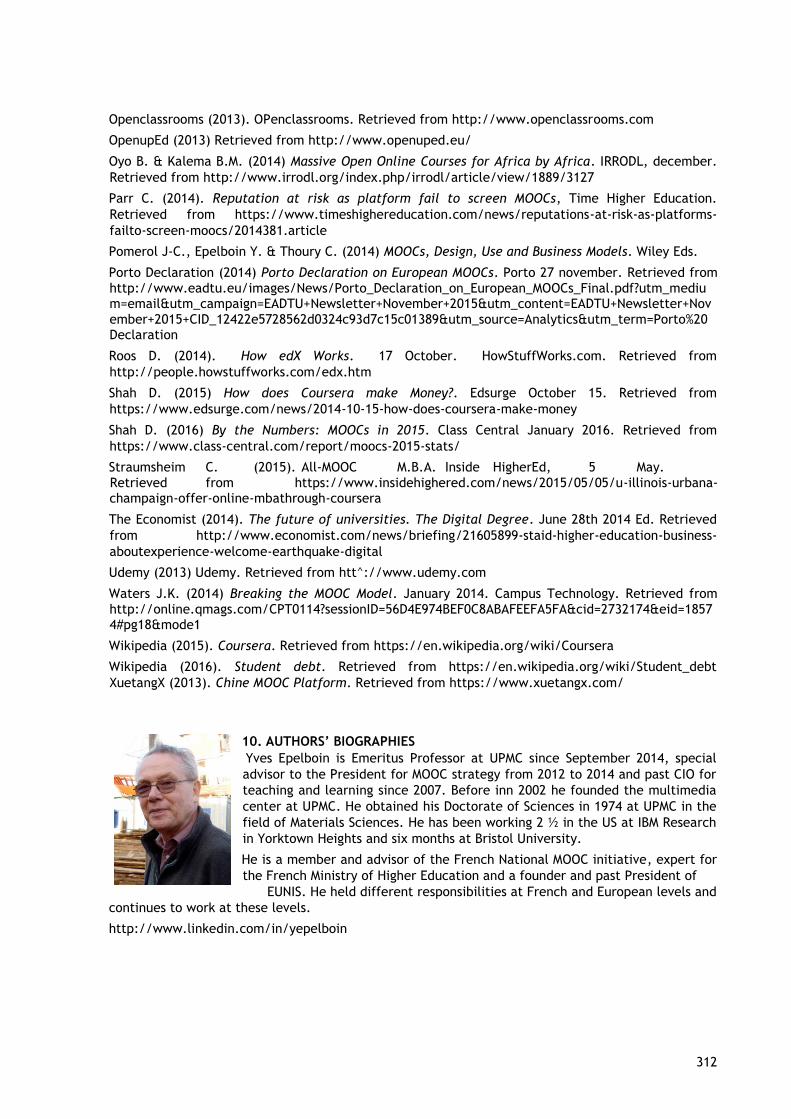
312
Openclassrooms (2013). OPenclassrooms. Retrieved from http://www.openclassrooms.com
OpenupEd (2013) Retrieved from http://www.openuped.eu/
Oyo B. & Kalema B.M. (2014) Massive Open Online Courses for Africa by Africa. IRRODL, december.
Retrieved from http://www.irrodl.org/index.php/irrodl/article/view/1889/3127
Parr C. (2014). Reputation at risk as platform fail to screen MOOCs, Time Higher Education.
Retrieved from https://www.timeshighereducation.com/news/reputations-at-risk-as-platforms-
failto-screen-moocs/2014381.article
Pomerol J-C., Epelboin Y. & Thoury C. (2014) MOOCs, Design, Use and Business Models. Wiley Eds.
Porto Declaration (2014) Porto Declaration on European MOOCs. Porto 27 november. Retrieved from
http://www.eadtu.eu/images/News/Porto_Declaration_on_European_MOOCs_Final.pdf?utm_mediu m=email&utm_campaign=EADTU+Newsletter+November+2015&utm_content=EADTU+Newsletter+Nov
ember+2015+CID_12422e5728562d0324c93d7c15c01389&utm_source=Analytics&utm_term=Porto%20 Declaration
Roos D. (2014). How edX Works. 17 October. HowStuffWorks.com. Retrieved from
http://people.howstuffworks.com/edx.htm
Shah D. (2015) How does Coursera make Money?. Edsurge October 15. Retrieved from
https://www.edsurge.com/news/2014-10-15-how-does-coursera-make-money
Shah D. (2016) By the Numbers: MOOCs in 2015. Class Central January 2016. Retrieved from
https://www.class-central.com/report/moocs-2015-stats/
Straumsheim C. (2015). All-MOOC M.B.A. Inside HigherEd, 5 May.
Retrieved from https://www.insidehighered.com/news/2015/05/05/u-illinois-urbana-champaign-offer-online-mbathrough-coursera
The Economist (2014). The future of universities. The Digital Degree. June 28th 2014 Ed. Retrieved
from http://www.economist.com/news/briefing/21605899-staid-higher-education-business-
aboutexperience-welcome-earthquake-digital
Udemy (2013) Udemy. Retrieved from htt^://www.udemy.com
Waters J.K. (2014) Breaking the MOOC Model. January 2014. Campus Technology. Retrieved from
http://online.qmags.com/CPT0114?sessionID=56D4E974BEF0C8ABAFEEFA5FA&cid=2732174&eid=1857 4#pg18&mode1
Wikipedia (2015). Coursera. Retrieved from https://en.wikipedia.org/wiki/Coursera
Wikipedia (2016). Student debt. Retrieved from https://en.wikipedia.org/wiki/Student_debt
XuetangX (2013). Chine MOOC Platform. Retrieved from https://www.xuetangx.com/
10. AUTHORS’ BIOGRAPHIES
Yves Epelboin is Emeritus Professor at UPMC since September 2014, special
advisor to the President for MOOC strategy from 2012 to 2014 and past CIO for
teaching and learning since 2007. Before inn 2002 he founded the multimedia
center at UPMC. He obtained his Doctorate of Sciences in 1974 at UPMC in the
field of Materials Sciences. He has been working 2 ½ in the US at IBM Research
in Yorktown Heights and six months at Bristol University.
He is a member and advisor of the French National MOOC initiative, expert for
the French Ministry of Higher Education and a founder and past President of
EUNIS. He held different responsibilities at French and European levels and
continues to work at these levels.
http://www.linkedin.com/in/yepelboin
313
The Greek Universities Open Courses Program
Pantelis Balaouras1, Konstantinos Tsimpanis
2, Lazaros Merakos
3
1,2,3
National & Kapodistrian University of Athens (UoA), Greek Academic Network (GUnet),
Panepistimiopolis, 15784 Athens, Greece, [email protected],
3
Keywords
Open Courses, MOOCs, OER
Summary
Since 2012, twenty five Greek Higher Education Institutes (HEI) have participated in a coordinated
nationwide effort for developing open courses, available to the general public, from their
undergraduate and graduate programs. After three years of development, more than 3.500 high
quality open courses with common specifications are available through a national open courses portal.
We present the contributions of a horizontal project, designed to coordinate and support the projects
of the participating HEI, regarding to course specifications, design guidelines, training, technical
approach (architecture & hosting), and the developed software platforms and products.
Extended abstract
Offering open educational material of high-quality for free over the Internet has started the
revolution of "opening up higher education" [1-3]. At the same time, the emergence of MOOCs
(Massive Open Online Courses) [4-6] has created new potential and has raised intense debate about
their future role in higher education. Ιn this context, the majority of the Greek Higher Education
Institutes (HEI) – Universities and Technological Education Institutes – have launched projects for
developing open courses, available to the general public.
In addition to the HEI’s Open Courses projects, the horizontal project “Central Repository of Greek
Open Courses” [7] has been launched at national level in order to coordinate and support the
aforementioned HEI projects in developing and providing the open courses. It was carried out by the
Greek Academic Network (GUnet) [8] – a non-profit organization formed by the Greek HEI. This group
of projects forms the Greek Open Academic Courses Program, which has been funded by the Greek
Ministry of Education in the context of the Operational Program “Life Long Learning” [9], cofinanced
by Greece and the European Union.
The main objective of the projects is the creation and provision of open academic courses, i.e.
courses taught at Greek HEIs that have been adapted to the digital environment, and they are freely
available over the Internet to everyone. The open courses do not form any kind of distance learning
program. The term MOOCs is not used for the developed courses because a) the content is always
available, not only during a specific time period as in MOOCs, b) presently, no support nor
certifications are provided. Anyone may access the open courses without registration: the target
groups are students and graduates, researchers, professionals, lifelong learners and whoever wishes
to extend or renew their knowledge. Open courses provide a free learning environment for the
general public, consistent with the mission of the public HEIs. The participants gain new knowledge,
training and learning opportunities.
After three years of development, more than 3.500 high quality open courses with common
specifications from 25 HEIs are available at the national portal developed for the open courses.
Presently, the open courses account for more than the 7% of all the courses taught at Greek HEI,
covering a wide range of topics. The most covered subjects are Natural Sciences (25,99%),
Humanities and Arts (14,88%), Engineering and Technology (14,67%), Social Sciences (13,97%),
Medicine and Health Professions (6,16%), Agricultural Sciences (1,52%).
Based on their educational content, the open courses are classified in three different categories:
314
• A- courses: provide the learner with course description and goals, keywords and glossary terms,
educational material organized in course units, notes or/ and presentation slides, bibliography,
• A courses: in addition to A- provide podcasts synchronized to presentation slides,
• A+ courses: in addition to A- provide exercises and quizzes, digital resources and multimedia
educational material. Please note that only A+ courses include videolectures as part of the
educational material.
More than 500 technical staff have collaborated with more than 3.000 faculty members (about 15% of
all faculty members) in order to develop the courses. These numbers show that one of the most
important goals - the creation of more awareness regarding open courses, open educational resources
and open education in the faculty members - has been achieved.
Apart from raising awareness, the other main objectives of the horizontal project were
• the design, development and operation of the i) National Open Courses Search Gateway (NOCSG)
[10],ii) the Open Delos platform [11], a rich media and lecture platform for education, iii) the
upgrading of the Open eClass platform [12] in terms of architecture, user interface and
functionality to support open courses
• the drafting of common specifications for the open courses structure and the required equipment
for the development phase
• the provision of guidelines, training and consulting services, related to the development of open
courses, to the HEI staff
• the central hosting of open courses to achieve economies of scale
• the awarding of the best open courses and the promotion and dissemination of the results
This paper discusses the aforementioned objectives and the support provided by the horizontal
project to the institutional projects.
In conclusion, the open courses program has had a strong impact on the Greek academic community
and has raised awareness on open education and OER: it has created more than 3.500 open courses
and involved more than 3.000 faculty members. This program may serve as a good practice example
for other countries and academic communities.
References
[1] MIT OpenCourseWare. http://ocw.mit.edu
[2] Open Education Consortium. http://openedconsortium.org
[3] Pan-European initiative OpenupEd around so-called MOOCs. http://openuped.eu
[4] Coursera online courses. http://coursera.org
[5] Edx online courses. http://edx.org
[6] Udacity online courses. https://www.udacity.com
[7] Project “Central Repository of Greek Open Courses”, http://project.opencourses.gr
[8] Greek Academic Network (GUnet), http://www.gunet.gr
[9] Operational Program “Life Long Learning”, http://www/edulll.gr
[10] The Greek Open Courses Search Gateway, http://opencourses.gr
[11] The Open Delos platform, http://www.opendelos.org
[12] The Open eClass platform, http://www.openeclass.org
Author biographies
Dr. Pantelis Balaouras holds a PhD degree in Informatics and Telecommunications and a Diploma in
Computer Engineering. He is in charge of the multimedia‐based e‐learning and communication
services at the Network Operations Center of the National & Kapodistrian University of Athens. He
also serves as the technical director of GUnet’s Center for e‐learning and media production
315
(mc.gunet.gr), and he is responsible for the development of the Open Delos platform (opendelos.org).
He is the technical and project manager of the horizontal project “Central Repository of Greek Open
Courses”.
Costas Tsibanis holds an M.Sc in Informatics, an M.Sc in Management and Economics of
Telecommunication Networks, and a B.Sc. in Mathematics. At the Network Operations Center of the
National & Kapodistrian University of Athens, he is leading the group responsible for designing and
deploying web‐based Internet and e‐learning services. Since 2003, he has been the lead architect of
the Open eClass platform (openeclass.org) and the Open Courses Search Gateway (opencourses.gr).
Lazaros Merakos is a Professor in the Department of Informatics and Telecommunications at the
National & Kapodistrian University of Athens, and Director of the Communication Networks
Laboratory and the Networks Operations and Management Center. His research interests are in the
design and performance analysis of communication networks. He has authored more than 250 papers
in the above areas. He is chairman of the board of the Greek Academic Network (GUnet), vice-
president of the board of the Greek Research Network (GRnet), and member of the board of the
Computer Technology Institute and Press "Diophantus". He is the scientific person in charge for the
horizontal project “Central Repository of Greek Open Courses”.
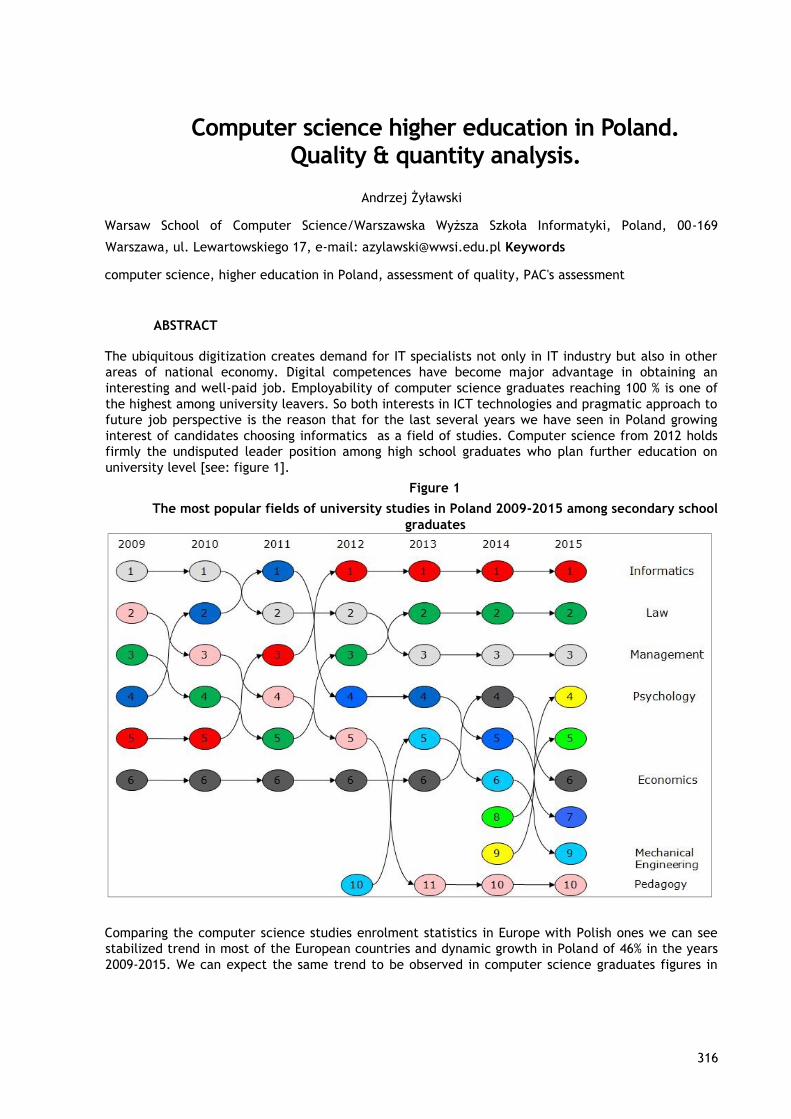
316
Computer science higher education in Poland. Quality & quantity analysis.
Andrzej Żyławski
Warsaw School of Computer Science/Warszawska Wyższa Szkoła Informatyki, Poland, 00-169
Warszawa, ul. Lewartowskiego 17, e-mail: [email protected] Keywords
computer science, higher education in Poland, assessment of quality, PAC's assessment
ABSTRACT
The ubiquitous digitization creates demand for IT specialists not only in IT industry but also in other
areas of national economy. Digital competences have become major advantage in obtaining an
interesting and well-paid job. Employability of computer science graduates reaching 100 % is one of
the highest among university leavers. So both interests in ICT technologies and pragmatic approach to
future job perspective is the reason that for the last several years we have seen in Poland growing
interest of candidates choosing informatics as a field of studies. Computer science from 2012 holds
firmly the undisputed leader position among high school graduates who plan further education on
university level [see: figure 1].
Figure 1
The most popular fields of university studies in Poland 2009-2015 among secondary school
graduates
Comparing the computer science studies enrolment statistics in Europe with Polish ones we can see
stabilized trend in most of the European countries and dynamic growth in Poland of 46% in the years
2009-2015. We can expect the same trend to be observed in computer science graduates figures in
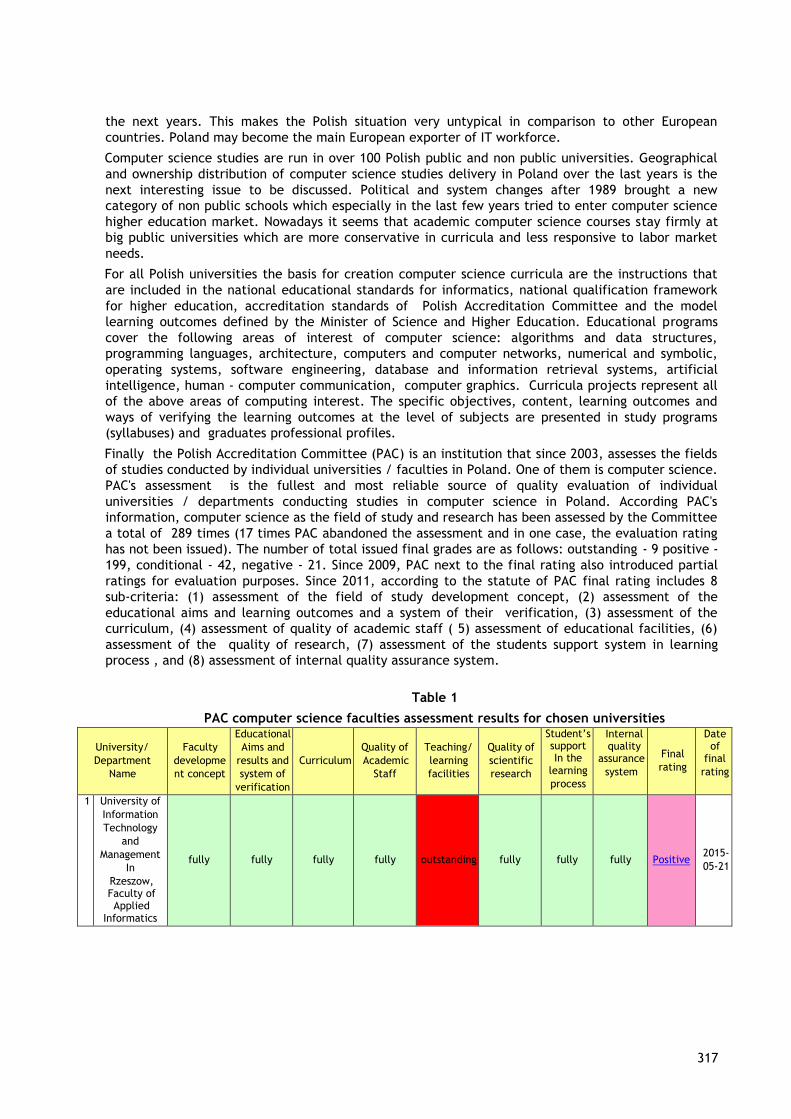
317
the next years. This makes the Polish situation very untypical in comparison to other European
countries. Poland may become the main European exporter of IT workforce.
Computer science studies are run in over 100 Polish public and non public universities. Geographical
and ownership distribution of computer science studies delivery in Poland over the last years is the
next interesting issue to be discussed. Political and system changes after 1989 brought a new
category of non public schools which especially in the last few years tried to enter computer science
higher education market. Nowadays it seems that academic computer science courses stay firmly at
big public universities which are more conservative in curricula and less responsive to labor market
needs.
For all Polish universities the basis for creation computer science curricula are the instructions that
are included in the national educational standards for informatics, national qualification framework
for higher education, accreditation standards of Polish Accreditation Committee and the model
learning outcomes defined by the Minister of Science and Higher Education. Educational programs
cover the following areas of interest of computer science: algorithms and data structures,
programming languages, architecture, computers and computer networks, numerical and symbolic,
operating systems, software engineering, database and information retrieval systems, artificial
intelligence, human - computer communication, computer graphics. Curricula projects represent all
of the above areas of computing interest. The specific objectives, content, learning outcomes and
ways of verifying the learning outcomes at the level of subjects are presented in study programs
(syllabuses) and graduates professional profiles.
Finally the Polish Accreditation Committee (PAC) is an institution that since 2003, assesses the fields
of studies conducted by individual universities / faculties in Poland. One of them is computer science.
PAC's assessment is the fullest and most reliable source of quality evaluation of individual
universities / departments conducting studies in computer science in Poland. According PAC's
information, computer science as the field of study and research has been assessed by the Committee
a total of 289 times (17 times PAC abandoned the assessment and in one case, the evaluation rating
has not been issued). The number of total issued final grades are as follows: outstanding - 9 positive -
199, conditional - 42, negative - 21. Since 2009, PAC next to the final rating also introduced partial
ratings for evaluation purposes. Since 2011, according to the statute of PAC final rating includes 8
sub-criteria: (1) assessment of the field of study development concept, (2) assessment of the
educational aims and learning outcomes and a system of their verification, (3) assessment of the
curriculum, (4) assessment of quality of academic staff ( 5) assessment of educational facilities, (6)
assessment of the quality of research, (7) assessment of the students support system in learning
process , and (8) assessment of internal quality assurance system.
Table 1
PAC computer science faculties assessment results for chosen universities
University/
Department
Name
Faculty
developme
nt concept
Educational
Aims and
results and
system of
verification
Curriculum
Quality of
Academic
Staff
Teaching/
learning
facilities
Quality of
scientific
research
Student’s support In the
learning
process
Internal quality
assurance
system
Final
rating
Date of
final
rating
1 University of
Information
Technology
and
Management
In
Rzeszow, Faculty of Applied
Informatics
fully fully fully fully outstanding fully fully fully Positive 2015-
05-21
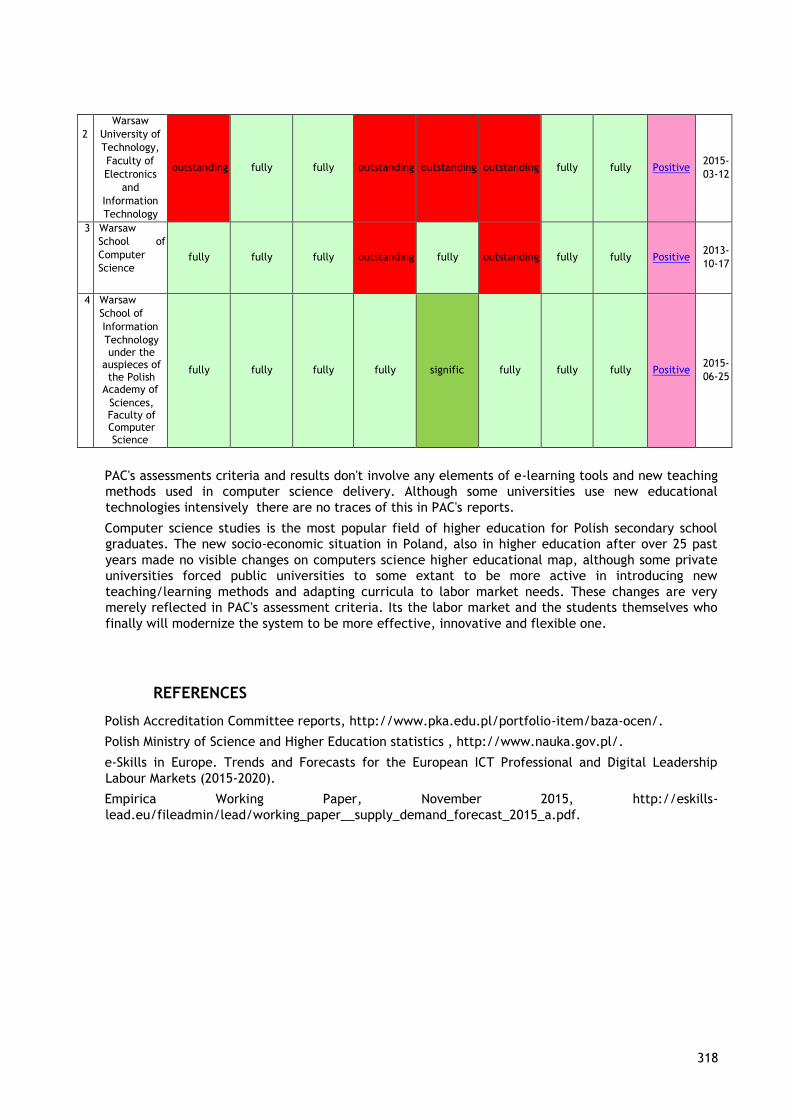
318
2
Warsaw
University of
Technology,
Faculty of
Electronics
and
Information
Technology
outstanding fully fully outstanding outstanding outstanding fully fully Positive 2015-
03-12
3 Warsaw
School of
Computer
Science fully fully fully outstanding fully outstanding fully fully Positive
2013-
10-17
4 Warsaw
School of
Information
Technology under the
auspieces of the Polish
Academy of
Sciences, Faculty of Computer Science
fully fully fully fully signific fully fully fully Positive 2015-
06-25
PAC's assessments criteria and results don't involve any elements of e-learning tools and new teaching
methods used in computer science delivery. Although some universities use new educational
technologies intensively there are no traces of this in PAC's reports.
Computer science studies is the most popular field of higher education for Polish secondary school
graduates. The new socio-economic situation in Poland, also in higher education after over 25 past
years made no visible changes on computers science higher educational map, although some private
universities forced public universities to some extant to be more active in introducing new
teaching/learning methods and adapting curricula to labor market needs. These changes are very
merely reflected in PAC's assessment criteria. Its the labor market and the students themselves who
finally will modernize the system to be more effective, innovative and flexible one.
REFERENCES
Polish Accreditation Committee reports, http://www.pka.edu.pl/portfolio-item/baza-ocen/.
Polish Ministry of Science and Higher Education statistics , http://www.nauka.gov.pl/.
e-Skills in Europe. Trends and Forecasts for the European ICT Professional and Digital Leadership
Labour Markets (2015-2020).
Empirica Working Paper, November 2015, http://eskills-
lead.eu/fileadmin/lead/working_paper__supply_demand_forecast_2015_a.pdf.
319
AUTHOR'S BIOGRAPHIE
Andrzej Żyławski most of his professional life has been managing educational institutions preparing
computer science specialists. 1991-2000 director of Mila College, 2000-2012 rector of Warsaw School
of Computer Science. Presently president of Warsaw School of Computer Science. From 2007
chairman of the audit committee of Polish Scientific Association of Internet Education. In 2009
received a New@Poland award for Polish Open Internet Informatics Academia Project from Polish
Association of Private ICT Employers. In 2013 received award from Informatics Europe for Best
Education Practices in recognition of the outstanding educational initiatives. Research areas involve
IT usage in pre and university education, education management and university – business
relationships.
Warsaw School of Computer Science/Warszawska Wyższa Szkoła Informatyki, Poland, 00-169
Warszawa, ul. Lewartowskiego 17, e-mail: [email protected]
Linked in profile: https://www.linkedin.com/profile/preview?vpa=pub&locale=
320
An Integral Approach to Support Research Data Management at the Humboldt-Universität zu Berlin
Malte Dreyer1, Andreas Vollmer
1
1Computer and Media Service, Humboldt-Universita ̈t zu Berlin, Unter den Linden 6, 10099 Berlin,
Germany, [email protected], [email protected]
1. Abstract
To address the increasing requirements on research data management, the Humboldt-Universität zu
Berlin (HU) developed and established an integrated approach to provide research data support and
services to scholars, students and administrative staff. This paper will discuss the type of
requirements from external stakeholders, as well as the needs expressed and identified from within
the HU. The derived concept will be explained in detail and examples for specific activities will be
given.
2. Introduction
Results or products of research are not just solely publications (Piwowar, 2013), but also raw data,
data aggregations, visualizations, software or even complex infrastructures. Compared to traditional
research products like papers and books, digital artifacts change and eventually vanish much faster
when not taken care for in a proper way (Vines et al., 2014). Many common publication formats have
developed throughout the last centuries of traditional publishing and still influence how publications
look like today (Gross, Harmon, & Reidy, 2002). Common standards for handling and enriching digital
research data are not yet widely established. Data formats are far more heterogeneous (Arms &
Fleischhauer, 2005), there are just few stable formats which last more than a decade, processing
data is mostly individual (Hey, Tansley, Tolle, & others, 2009). Even long term storage and
preservation, besides being costly, is not a commodity yet, like it is for storing books or journals
(Palaiologk, Economides, Tjalsma, & Sesink, 2012). Data is being produced in vast amounts and
unlike for traditional publications, individual data are often not enriched by metadata, categorized
or described by abstracts by the libraries (Wessels et al., 2014). Hence, proper data management
and data literacy is an increasing requirement on research processes. In the context of research
transparency, fidelity and veracity as well as good scientific practice, more and more research
funders mandate certain methods of research data management or at least require a documented
reflection on the intended data handling processes (Keralis, Stark, Halbert, & Moen, 2013). Data
literacy or “research data literacy” (Schneider, 2013) however can't just be seen as a requirement
from funders about research transparency. Proper data handling, well reflected views on data
quality and fidelity and related software also enables for extended capabilities to re-use data and to
develop more sustainable software systems.
Among other aspects, this results in research data being a far more ephemeral and fragile format
than their paper pendants (Warner & Buschman, 2005). What is more, addressing the open science
paradigm of sharing research data even extends the scope of complexity to specific scholarly
cultures (Borgman, 2012).
As scientific disciplines or domains differ considerably in requirements, technological preferences,
standards and collaboration schemes, global activities like the Research Data Alliance (RDA) are a
crucial community activity to work on the plethora of issues involved and explore specific problem
domains, provide guidelines or document existing diversity (Berman, Wilkinson, & Wood, 2014).
Exploiting these recommendations and results enables to adjust objectives and focus on more stable
task domains.
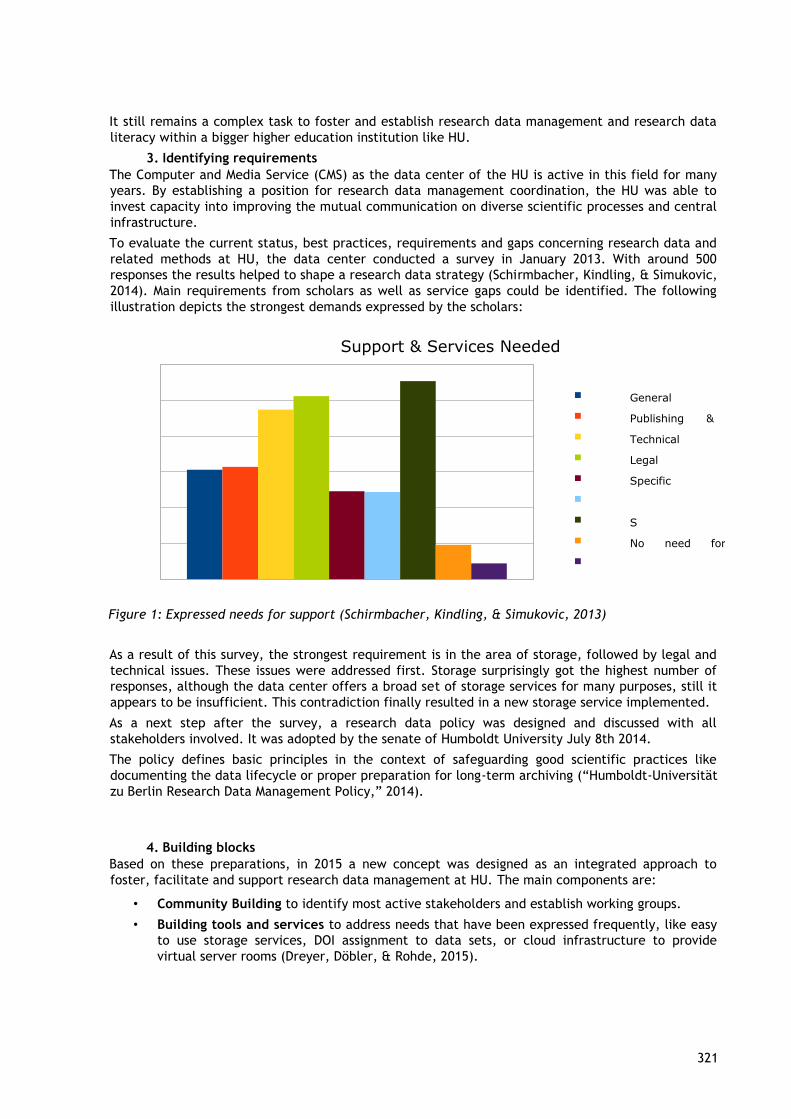
321
It still remains a complex task to foster and establish research data management and research data
literacy within a bigger higher education institution like HU.
3. Identifying requirements
The Computer and Media Service (CMS) as the data center of the HU is active in this field for many
years. By establishing a position for research data management coordination, the HU was able to
invest capacity into improving the mutual communication on diverse scientific processes and central
infrastructure.
To evaluate the current status, best practices, requirements and gaps concerning research data and
related methods at HU, the data center conducted a survey in January 2013. With around 500
responses the results helped to shape a research data strategy (Schirmbacher, Kindling, & Simukovic,
2014). Main requirements from scholars as well as service gaps could be identified. The following
illustration depicts the strongest demands expressed by the scholars:
Figure 1: Expressed needs for support (Schirmbacher, Kindling, & Simukovic, 2013)
As a result of this survey, the strongest requirement is in the area of storage, followed by legal and
technical issues. These issues were addressed first. Storage surprisingly got the highest number of
responses, although the data center offers a broad set of storage services for many purposes, still it
appears to be insufficient. This contradiction finally resulted in a new storage service implemented.
As a next step after the survey, a research data policy was designed and discussed with all
stakeholders involved. It was adopted by the senate of Humboldt University July 8th 2014.
The policy defines basic principles in the context of safeguarding good scientific practices like
documenting the data lifecycle or proper preparation for long-term archiving (“Humboldt-Universität
zu Berlin Research Data Management Policy,” 2014).
4. Building blocks
Based on these preparations, in 2015 a new concept was designed as an integrated approach to
foster, facilitate and support research data management at HU. The main components are:
• Community Building to identify most active stakeholders and establish working groups.
• Building tools and services to address needs that have been expressed frequently, like easy
to use storage services, DOI assignment to data sets, or cloud infrastructure to provide
virtual server rooms (Dreyer, Döbler, & Rohde, 2015).
Support & Services Needed
General
issues Publishing &
citing Technical
issues Legal
issues Specific
issues
S
tNo need for
support
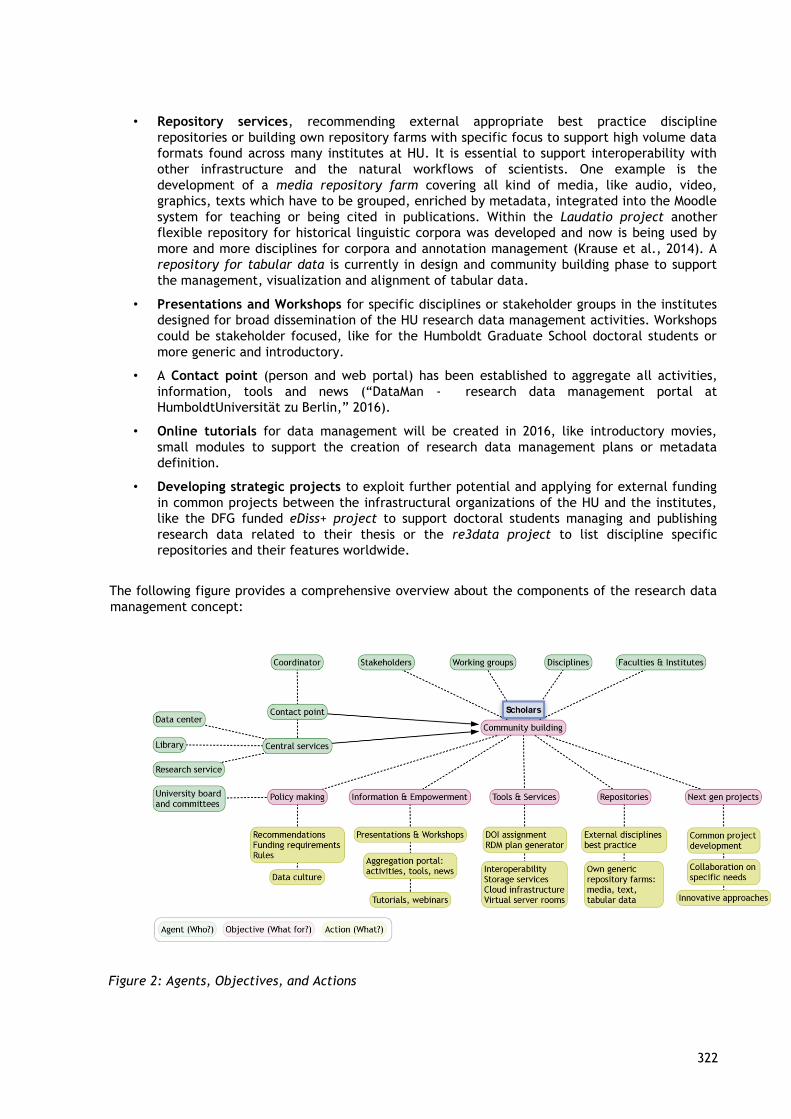
322
• Repository services, recommending external appropriate best practice discipline
repositories or building own repository farms with specific focus to support high volume data
formats found across many institutes at HU. It is essential to support interoperability with
other infrastructure and the natural workflows of scientists. One example is the
development of a media repository farm covering all kind of media, like audio, video,
graphics, texts which have to be grouped, enriched by metadata, integrated into the Moodle
system for teaching or being cited in publications. Within the Laudatio project another
flexible repository for historical linguistic corpora was developed and now is being used by
more and more disciplines for corpora and annotation management (Krause et al., 2014). A
repository for tabular data is currently in design and community building phase to support
the management, visualization and alignment of tabular data.
• Presentations and Workshops for specific disciplines or stakeholder groups in the institutes
designed for broad dissemination of the HU research data management activities. Workshops
could be stakeholder focused, like for the Humboldt Graduate School doctoral students or
more generic and introductory.
• A Contact point (person and web portal) has been established to aggregate all activities,
information, tools and news (“DataMan - research data management portal at
HumboldtUniversität zu Berlin,” 2016).
• Online tutorials for data management will be created in 2016, like introductory movies,
small modules to support the creation of research data management plans or metadata
definition.
• Developing strategic projects to exploit further potential and applying for external funding
in common projects between the infrastructural organizations of the HU and the institutes,
like the DFG funded eDiss+ project to support doctoral students managing and publishing
research data related to their thesis or the re3data project to list discipline specific
repositories and their features worldwide.
The following figure provides a comprehensive overview about the components of the research data
management concept:
Figure 2: Agents, Objectives, and Actions
323
The position of the research data coordination and point of contact is situated within the data
center's innovation group. Additional services are provided in the appropriate departments of the
data center. The library advises on metadata enrichment and electronic publication aspects. The HU
research service center is providing legal advice about research data handling, e.g. about usage
rights or intellectual property rights involved.
5. Community Building and Communication
As each scientific discipline has very unique communication, collaboration and publication cultures,
the research data activities aim for a better understanding of their specific needs by stipulating
discussions with the institutes and scholars most active in this area.
It is worth mentioning that each stakeholder group, professors, research fellows, project staff, or
administration have a very distinct view on requirements and ways to address them. This makes
multifold solutions to the very same problem necessary and raises the institutional awareness for
research data, especially in the field of arts and humanities. To address these problems, discussions
about specific faculty or institute positions for the local support of data management started.
Currently, related support activities are very time consuming, like the development of small services,
the cleaning of data, writing scripts to transform data or metadata structures. When it comes to
shared staff for these tasks, the competitive requirements have to be managed in a very structured
way to provide benefits for as many different people as possible and to keep the newly created
position for research data coordination from congestion and finally dissatisfaction. Given the very
specific issues within an institute’s domain and therefore the long learning period involved, this new
kind of position should provide an appropriate long-term perspective.
Additional communication activities include e.g. PhD seminars like “Introduction to research data
management” or “How to develop a data management plan” as well as supporting scholars to find
the suitable external research data repository.
We expect to fully establish this integrative approach by the end of 2017. New discussions about
small supporting services and tools are currently started to include as much new insight from
scholars as possible. As the cooperation with institutes intensifies and the community grows, the
view on service gaps and further organizational instruments improves steadily. It is expected, that
the current paradigm and trend about digitalization will amplify the needs for supporting services
within the next 5 years. As research is ever changing and especially top research is changing focus
every some years, it will be a big challenge to create instruments that are flexible enough and
prepared for change as well as to stay close to state of the art.
6. Two examples for tools and services
To accomplish the formally adopted research data management policy and get its intentions into
realworld action, it has to be accompanied by helpful services to enable for reliable, user-friendly
management and ongoing curation of data. The university data center and the university library both
continue to establish related services. The university library e.g. established services like the
persistent identifier Datacite (Brase, 2009) service, inclusion into the library catalog or citation
formatting as well as support and advice on metadata, digitization and additional identifiers. The
data center currently focusses on repositories and storage technology. Both align and adjust their
strategy in a common jour-fixe.
6.1. HU Box
One service created in the course of these activities is the “HU Box” service, which provides an
online/offline sync and share scenario to HU users. At HU there are two main usage scenarios for
such a service:
324
• a data exchange platform for network based sharing of files and collaboration of groups using
various devices
• personal and synchronized data storage (file synchronization) with on-premise storage
Several free and commercial software products were evaluated by HU, JGU Mainz, and TU
Kaiserslautern. The evaluation of the following software products was cancelled at HU due to missing
functions: aeroFS, Ajaxplorer, Druva inSync, Teamdrive and Tonido. Final candidates for closer
examination were “Seafile”, “ownCloud” and “Powerfolder". Seafile turned out to be the most
suitable solution for the requirements listed.
Besides the main scenarios for file exchange and sharing, additional more specifically research data
oriented scenarios have been identified. These are e.g. in the fields of additional identifiers to be
assigned as well as interfaces to existing systems, data privacy levels or collaborative editing
features as well as write-once storage concepts to enable for stable data citation. They will be
explored individually in separate projects.
6.2. Media Repository Farm
As another example service, the media repository farm will be explained in more detail. The media
repository farm at the HU aims at providing a flexible, yet long-term supported media management
platform for research and teaching. For this purpose, the open source software “ResourceSpace” was
extended by modules enabling scholarly usage as well as teaching scenarios. A wide range of audio,
video, textual or presentation formats is supported. The concept of “projects” is used in this farm
for highly individual, self-administrable workspaces for HU users. The CMS of the HU provides a
guarantee for at least 15 years of data and metadata longevity. The longevity of the underlying
software platform “ResourceSpace” and related software development is dependent to many
external factors. This is why a platform with a well-established and broad user base was selected
instead of other very specialized software systems. The usage scenarios start from integrating
contents in web content management systems or disseminating specific contents into the Moodle
LMS as well as capturing photos while on the go with mobile devices and up to automatized imports
of mass data with semiautomatic or even automatic extraction and enrichment of metadata.
Currently e.g. an automated optical character recognition (OCR) is integrated in the media
repository farm to better support the management of digitized media. As a well-established, still
rapidly growing service, training for the media repository farm is included into the further education
program of the HU on a regular base.
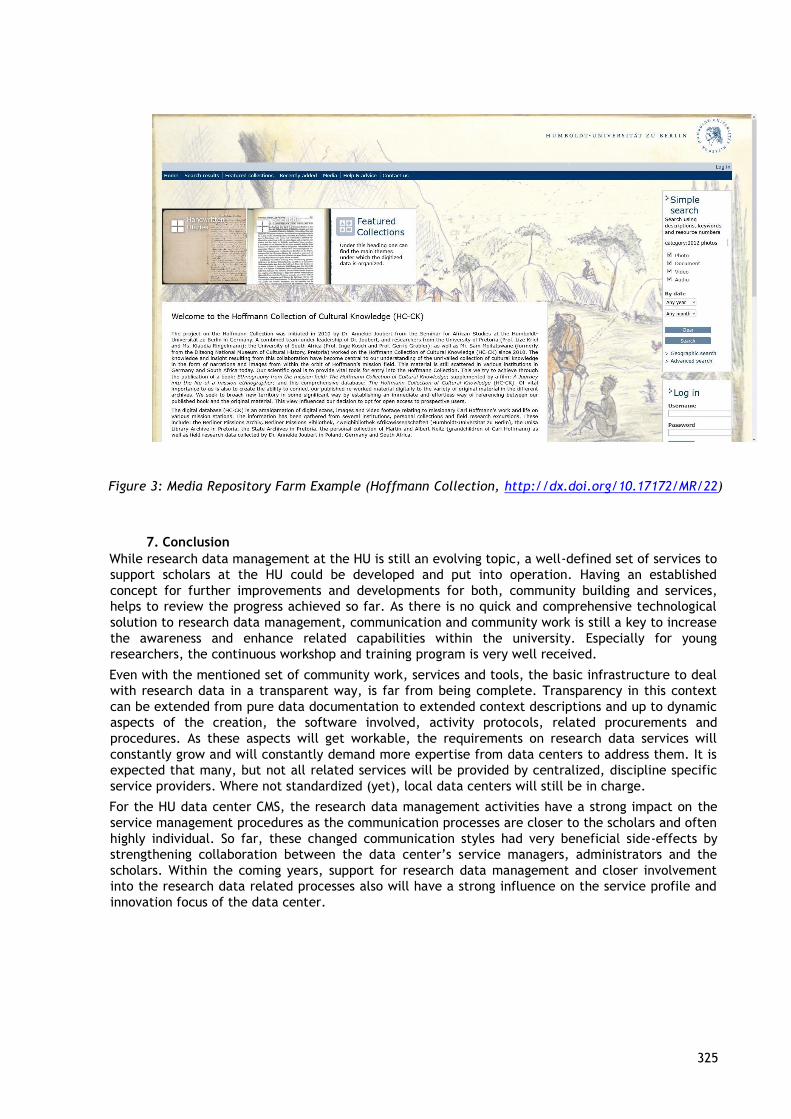
325
Figure 3: Media Repository Farm Example (Hoffmann Collection, http://dx.doi.org/10.17172/MR/22)
7. Conclusion
While research data management at the HU is still an evolving topic, a well-defined set of services to
support scholars at the HU could be developed and put into operation. Having an established
concept for further improvements and developments for both, community building and services,
helps to review the progress achieved so far. As there is no quick and comprehensive technological
solution to research data management, communication and community work is still a key to increase
the awareness and enhance related capabilities within the university. Especially for young
researchers, the continuous workshop and training program is very well received.
Even with the mentioned set of community work, services and tools, the basic infrastructure to deal
with research data in a transparent way, is far from being complete. Transparency in this context
can be extended from pure data documentation to extended context descriptions and up to dynamic
aspects of the creation, the software involved, activity protocols, related procurements and
procedures. As these aspects will get workable, the requirements on research data services will
constantly grow and will constantly demand more expertise from data centers to address them. It is
expected that many, but not all related services will be provided by centralized, discipline specific
service providers. Where not standardized (yet), local data centers will still be in charge.
For the HU data center CMS, the research data management activities have a strong impact on the
service management procedures as the communication processes are closer to the scholars and often
highly individual. So far, these changed communication styles had very beneficial side-effects by
strengthening collaboration between the data center’s service managers, administrators and the
scholars. Within the coming years, support for research data management and closer involvement
into the research data related processes also will have a strong influence on the service profile and
innovation focus of the data center.
326
8. References
Arms, C., & Fleischhauer, C. (2005). Digital formats: Factors for sustainability, functionality, and
quality. In Archiving Conference (Vol. 2005, pp. 222–227). Society for Imaging Science and
Technology.
Berman, F., Wilkinson, R., & Wood, J. (2014). Building Global Infrastructure for Data Sharing and
Exchange Through the Research Data Alliance. D-Lib Magazine,
20(1/2). http://doi.org/10.1045/january2014-berman
Borgman, C. L. (2012). The conundrum of sharing research data. Journal of the American Society for
Information Science and Technology, 63(6), 1059–1078.
Brase, J. (2009). Datacite-a global registration agency for research data. In Cooperation and
Promotion of Information Resources in Science and Technology, 2009. COINFO’09. Fourth
International Conference on (pp. 257–261). IEEE.
DataMan – research data management portal at Humboldt-Universität zu Berlin. (2016). Retrieved
February 29, 2016, from https://www.cms.hu-berlin.de/en/ueberblick-en/projekte-
en/datamanhttps://www.cms.hu-berlin.de/en/ueberblick-en/projekte-en/dataman-
en/welcome?set_language=enen/welcome?set_language=en
Dreyer, M., Döbler, J., & Rohde, D. (2015). Building Service Platforms using OpenStack and CEPH: A
University Cloud at Humboldt University. Eunis 2015, 11, 63–68.
Gross, A. G., Harmon, J. E., & Reidy, M. S. (2002). Communicating Science: The Scientific Article
from the 17th Century to the Present. Oxford University Press. Retrieved February 29, 2016, from
https://books.google.de/books?id=ctrhBwAAQBAJ
Hey, A. J., Tansley, S., Tolle, K. M., & others. (2009). The fourth paradigm: data-intensive scientific
discovery (Vol. 1). Microsoft research Redmond, WA.
Humboldt-Universität zu Berlin Research Data Management Policy. (2014, August 7). Retrieved
February 29, 2016, from https://www.cms.hu-berlin.de/en/ueberblick-en/projekte-
en/datamanhttps://www.cms.hu-berlin.de/en/ueberblick-en/projekte-en/dataman-
en/info/policyen/info/policy
Keralis, S. D., Stark, S., Halbert, M., & Moen, W. E. (2013). Research Data Management in Policy and
Practice: The DataRes Project.
Krause, T., Lüdeling, A., Odebrecht, C., Romary, L., Schirmbacher, P., & Zielke, D. (2014).
LAUDATIORepository: Accessing a heterogeneous field of linguistic corpora with the help of an open
access repository. Digital Humanities 2014 Conference. Poster Session.
Palaiologk, A. S., Economides, A. A., Tjalsma, H. D., & Sesink, L. B. (2012). An activity-based costing
model for long-term preservation and dissemination of digital research data: the case of DANS.
International Journal on Digital Libraries, 12(4), 195–214.
Piwowar, H. (2013). Altmetrics: Value all research products. Nature, 493(7431), 159–159. Retrieved
February 29, 2016, from http://doi.org/10.1038/493159a
Schirmbacher, P., Kindling, M., & Simukovic, E. (2013). Humboldt-Universität zu Berlin Research
Data
Management Survey Results. ZENODO. Retrieved February 29, 2016,
from http://dx.doi.org/10.5281/zenodo.7448
Schirmbacher, P., Kindling, M., & Simukovic, E. (2014). Unveiling research data stocks: A case of
Humboldt-Universitaet zu Berlin. iConference 2014 Proceedings.
Schneider, R. (2013). Research Data Literacy. In S. Kurbanoğlu, E. Grassian, D. Mizrachi, R. Catts, &
S. Špiranec (Eds.), Worldwide Commonalities and Challenges in Information Literacy Research and
Practice: European Conference on Information Literacy, ECIL 2013 Istanbul, Turkey, October 22-25,
2013 Revised Selected Papers (pp. 134–140). Cham: Springer International Publishing. Retrieved
February 29, 2016, from http://dx.doi.org/10.1007/978-3-319-03919-0_16
Vines, T. H., Albert, A. Y. K., Andrew, R. L., Débarre, F., Bock, D. G., Franklin, M. T., … Rennison, D. J. (2014). The Availability of Research Data Declines Rapidly with Article Age. Current Biology, 24(1), 94–97. Retrieved February 29, 2016, from http://doi.org/10.1016/j.cub.2013.11.014

327
Warner, D., & Buschman, J. (2005). Studying the reader/researcher without the artifact: digital
problems in the future history of books.
Wessels, B., Finn, R. L., Linde, P., Mazzetti, P., Nativi, S., Riley, S., and others. (2014). Issues in the
development of open access to research data. Prometheus, 32(1), 49–66.
9. Authors´ biography
Malte Dreyer is the technical director of the Computer and Media
Service of Humboldt-Universität zu Berlin, Germany. Before, he was director for
the department of research and development at Max Planck Society, Max Planck
Digital Library.
He designed and developed research and publication data infrastructure
for the Max Planck Society’s institutes, as well as many research tools. Within
several major German, European and international projects he is active in the
areas of digital research infrastructure, repositories, virtual research
environments and software architecture across many scientific disciplines.
Providing advice on software and information architecture, he is a member of
several technical boards. He was a member of the German national alliance initiative working groups for research data and virtual research environments as well as a member of commission “Zukunft der Informationsinfrastruktur in Deutschland” and DINI member of the board.
Malte Dreyer’s interests now are in the field of scalable information management architectures and
infrastructures in the intersection of organizational perspectives on ICT from data centers and
information management organizations. Current projects are in the fields of research data
management and repositories, linguistics, as well as cloud architectures and integrated cloud
services.
Andreas Vollmer has been teaching for a decade in the Humanities at
HumboldtUniversität zu Berlin till he joined Computer and Media Service in 2002
when a new unit for the promotion of digital media in teaching and learning was
formed. He coordinated this group and a number of projects focused on the
development of services and infrastructural aspects.
He is interested in academic workflows and smooth interaction between
its processes. Research data management has been assigned to his group to
foster an integral implementation in existing infrastructure and new projects.
328
Project THOR: Persistent Identifiers in the service of open, interoperable research
Tom Demeranville ORCID EU/THOR, Josh Brown ORCID EU/THOR
Keywords Persistent Identifiers,
Interoperability
Summary
Project THOR works with persistent identifiers across discipline and infrastructure boundaries to
increase interoperability and promote open science. THOR aims to improve links between article,
data, funder, institution and researcher metadata throughout the research lifecycle.
This session will demonstrate the value of persistent identifiers, describe work done so far to
increase their utility and outline future plans. It will also explain how to get involved and realise the
benefits of persistent identifier use within your own organisation.
The THOR consortium includes ORCID, DataCite, EMBL/EBI, The British Library, CERN, PANGAEA,
DRYAD, Elsevier Labs and PLOS. It is a 30 month project funded by the European Commission under
the Horizon 2020 programme.
Extended Abstract
The THOR project (http://project-thor.eu) is a 30 month project funded by the European
Commission under the Horizon 2020 programme. THOR aims to extend the integration of persistent
identifiers (PIDs) into platforms, services and workflows. This will place PIDs at the fingertips of
researchers and institutions, building them into the services that they already use, across disciplines,
regions and systems. The aim is not to build new, standalone services, but to work with existing
systems and the community to increase interoperability, the use of PIDs and to solve shared
problems. By creating new, and improved, integrations of PIDs in the services that researchers and
institutions actually use, we aim to ensure that PIDs are embedded in research outputs and activities
from the very beginning, with no additional effort for researchers.
Persistent Identifiers (PIDs) uniquely identify entities within the research ecosystem and help define
relations between contributors, research artefacts, and organizations. They can be used to link
across disciplines and infrastructures to build clearer pictures of how research is generated. They
not only provide connections between authors and articles, but also between datasets, funders and
institutions, enabling better attribution and information on where research originated. PIDs are a
vital part of e-infrastructure that enable open and reproducible science and enhance the exchange
of research information through interoperable systems.
Information about researchers’ activities is gathered in multiple systems outside researchers’ home
institutions. Manuscript submissions systems, grant funding applications, datacentres, citation
indices, other institutional or disciplinary repositories and personal webpages are all vital sources of
information. PIDs enable the discovery and collection of this information, and ensure that data can
be compared, matched and combined with greater efficiency and accuracy. This is vital now, as
institutions work to understand their entire research portfolio. PIDs can help make research
reporting more efficient (borne out by the growing number of funders mandating ORCID iDs, for
example) and can help to demonstrate compliance with policies for research data management and
open access.
329
EUNIS-2016-paper-template.doc
This importance is only likely to grow as PIDs become embedded in even more systems, and linked to
new kinds of information (about software, data analysis or peer review for example) meaning that
institutional systems that do not make full use of these tools as they emerge risk under-serving the
institution and its researchers. THOR partners are not just working to increase the availability of
PIDs to researchers and the systems that support them, they are building tool kits, resources and
training programs to ensure that information and technology professionals across the sector are
ready to make the best use of PIDs every day.
The THOR consortium includes ORCID, DataCite, EMBL/EBI, The British Library, CERN, PANGAEA,
DRYAD, Elsevier Labs and PLOS. Alongside publishers, datacentres, research organisations and
national libraries, there are two major PID infrastructure providers; ORCID and DataCite.
ORCID provides identifiers for people involved in generating research. These identifiers are
persistent, actionable and provide links to research activities such as publications, datasets and
funding via other identifier systems such as Digital Object Identifiers (DOIs) and Fundref. ORCID
records are maintained by their owners who curate input from other systems such as publisher,
datacentres and institutional systems. ORCID iDs also help to improve the accuracy of information
held in, and shared between, systems. As of February 2016, almost 2 million ORCID identifiers have
been claimed.
DataCite is a DOI registration agency that provides identifiers for a wide range of academic outputs
with a particular focus on data. Datacite works with data centres to assign persistent identifiers to
research objects and develop infrastructure that supports simple and effective methods of data
citation, discovery, and access. As of February 2016, DataCite have minted over 7 million identifiers.
Authors’ Biographies
Tom Demeranville, Senior Technical Officer, THOR Project, ORCID EU.
Tom investigates and develops links with other identifier systems as part of the EC-funded THOR
project. Tom has a long history of working with software in the academic sector. Before joining
ORCID he was employed by the British Library as a Technical Lead on the ODIN project and prior to
that he was a Senior Software Engineer working on federated identity at Eduserv. Tom has a first
class honours degree in Software Engineering from the Open University. Contact:
Josh Brown, Regional Director, Europe, ORCID EU.
Josh directs the operations of ORCID EU. He works with stakeholders across Europe to support
understanding and engagement, and promote adoption of ORCID. Before ORCID, Josh was
consortium and operations manager for SCOAP3, programme manager for digital infrastructure at
Jisc, project officer for SHERPA-LEAP at University College London, and held positions in the library
at the University of Brighton and the University of Sussex. He earned an MA in Information
Management from the University of Brighton and a BA in Philosophy and English from the University
of Sussex.
EUNIS 2016: “Crossroads where the past meets the future”
330
How Do Researchers Manage their Data? An Empirical Comparison between Policies and Practice
Anne Thoring1, Dominik Rudolph1, Raimund Vogl1
1Westfälische Wilhelms-Universität Münster, ZIV, Röntgenstraße 7-13, 48149 Münster/Germany,
{a.thoring|d.rudolph|rvogl}@uni-muenster.de
Keywords
Research data management, open science, e-science, research infrastructure
1. ABSTRACT
Several academic organizations like the German Research Foundation (DFG) increasingly emphasize the
importance of a professional research data management for the scientific community. Regulations for secure
storage and making data available in terms of open science need to be established, to fully harness the
immense value of research data as a proof of accuracy and as a basis for future studies. With 667 completed
questionnaires by researchers at Münster University (WWU), this survey aims to provide insights on the
implementation of research data management in research practice generally and in different academic
disciplines in particular.
2. INTRODUCTION
During the research process, large amounts of valuable data are generated. Preserving it digitally and
making it available to other scientists are the two most important challenges to tackle in order to capitalize
on the advantages of e-science (Bell, 2009; Büttner, Hobohm, & Müller, 2011; Lynch, 2009). Although in this
context, a professional research data management, characterized by adequate infrastructure, regulations
and human resources, is indispensable (Bell, Hey, & Szalay, 2009, pp. 1297–1298), it is something of rarity in
the scientific practice (Rümpel & Büttner, 2010; Strathmann, 2012; Winkler-Nees & Stefan, 2012). In
research literature, an analogical lack of empirical data on the handling of research data in practice exists –
forming the starting point for this survey in 2014. A quantitative approach was used to question
approximately 1,000 scientists of Münster University (WWU) about the status quo of research data
management, in order to form a solid basis for improvement.
When discussing the accessibility of research data, it is inevitable to come across the concept of “open
science” (Fry, Schroeder, & den Besten, 2009). According to Wagner, the accessibility of primary data is
nothing less than “science’s court of appeal” (Wagner, 2000, p. 47) as it allows other scientists to carry out
independent re-analyses which can either verify and thereby strengthen the results, or uncover errors or
even manipulations. However, accessibility per se might not be enough as Marris points out: „What do you
do if you are suspicious about a paper, you ask to see the data and you get 25 cardboard boxes, 4 CDs and
would have to hire a biostatistician for three months“ (Marris, 2006, pp. 520–521)?
Clearly, to be valuable to other researchers, the data needs to be preprocessed, but on the other hand, it is
also necessary to consider how much additional effort is acceptable to do so. In the science system,
verification processes usually take place in the context of review procedures for the publication in scientific
journals (Mittler, 2007). Data accessibility is limited to those individuals involved. With a broader
accessibility of research data, numerous concerns arise, e.g. when it comes to particularly sensitive patient
records (Pfeiffenberger, 2007, pp. 207–210) or to the point that data without context or interpretation may
be misleading or useless (Rosenblum, 2009, pp. 19–22). Furthermore, researchers raise major concerns over
uncontrolled reuse and possible abuse of their data (Winkler-Nees & Stefan, 2012). The high autonomy of
researchers in Germany and the associated actual or merely perceived rights of ownership over the acquired
data are identified as further obstacles to a disclosure of research data (Winkler-Nees & Stefan, 2012).
EUNIS 2016: “Crossroads where the past meets the future”
331
Against this background, our first research question is: “What relevance does the idea of open access have
for making research data available in scientific practice?” To answer this question, the following criteria
(Open Science Criteria, OC) are examined:
• OC1 Making available of research data
• OC2 Regulation of disclosure by binding guidelines
Aside from access, archiving is another essential aspect of research data management. The German
Research Foundation (Deutsche Forschungsgemeinschaft, DFG), for example, advises every research
institution to set up clear rules not only for the accessibility of research data but also for storage (Deutsche
Forschungsgemeinschaft, 2013). According to its ‘guidelines for ensuring good scientific practice’,
“[p]rimary data as the basis for publications shall be kept for ten years on durable and secured storage
media at the institution where they were generated” (Deutsche Forschungsgemeinschaft, 2013). Against this
background and bearing in mind the general worth of data in today’s society, it is astonishing that,
according to estimates, up to 90 percent of research data are irretrievably lost shortly after finishing a
research project (Winkler-Nees, 2011). Then again, the reasons for such a low degree of implementation are
fundamental: the trustworthiness and persistence of the storage locations, the lack of adequate licensing
models to protect data proprietary rights and the lack of necessary know-how (Bertelmann & Hübner, 2007,
pp. 246–250). Professional research data management requires domain-specific, methodological and
technical expertise as well as knowledge of legal aspects and librarianship. Therefore, not only scientists
need to be involved in such a complex task, but “[…] information and computer scientists, database and
software engineers and programmers, disciplinary experts, curators and expert annotators, librarians,
archivists, and others, who are crucial to the successful management of a digital data collection“ (National
Science Board, 2005).
Our second research question focuses on the level of professionalism in the archiving of data: “How far have
researchers progressed in terms of professional archiving?“ To answer this question the following criteria
(Archiving Criteria, AC) are examined:
• AC1 Non-local storage on network drives or subject-specific repositories provided by professional IT
facilities within the university
• AC2 Long-term storage on durable media for at least 10 years
• AC3 Regular backups
• AC4 Binding regulation by directives for the safe storage and systematic recording in reference
databases
• AC5 Involvement of professional data specialists from the fields of IT and librarianship in the
archiving process
• AC6 Targeted archiving with a clear purpose of use
Our third research question focuses on the scientists’ know-how about research data management, aiming to
identify subject areas with particular need for advice: “How do researchers assess their knowledge of
dealing with research data?” To answer this question, the following (Knowledge Criteria, KC) are examined:
• KC1 Knowledge of research data management
• KC2 Need for advice
To date, there are only few empirical studies on the subject of research data management in scientific
practice (Campbell et al., 2002; Savage & Vickers, 2009; Simukovic, Kindling, & Schirmbacher, 2013) which
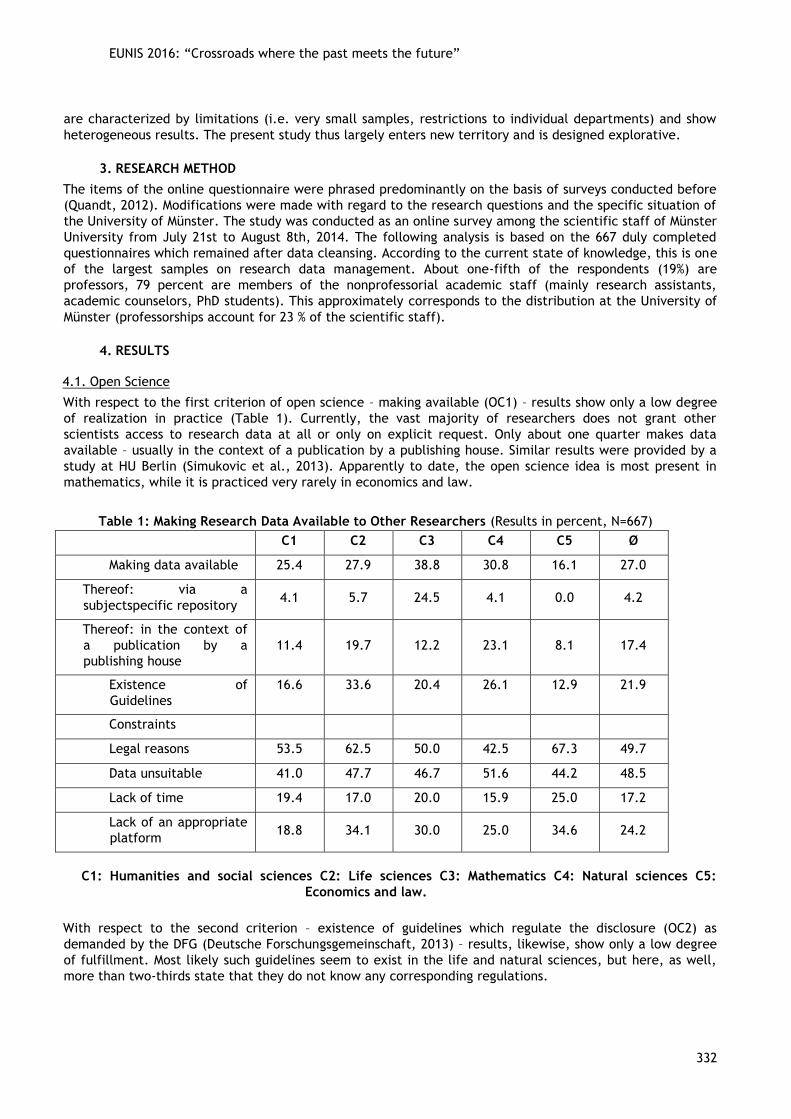
EUNIS 2016: “Crossroads where the past meets the future”
332
are characterized by limitations (i.e. very small samples, restrictions to individual departments) and show
heterogeneous results. The present study thus largely enters new territory and is designed explorative.
3. RESEARCH METHOD
The items of the online questionnaire were phrased predominantly on the basis of surveys conducted before
(Quandt, 2012). Modifications were made with regard to the research questions and the specific situation of
the University of Münster. The study was conducted as an online survey among the scientific staff of Münster
University from July 21st to August 8th, 2014. The following analysis is based on the 667 duly completed
questionnaires which remained after data cleansing. According to the current state of knowledge, this is one
of the largest samples on research data management. About one-fifth of the respondents (19%) are
professors, 79 percent are members of the nonprofessorial academic staff (mainly research assistants,
academic counselors, PhD students). This approximately corresponds to the distribution at the University of
Münster (professorships account for 23 % of the scientific staff).
4. RESULTS
4.1. Open Science
With respect to the first criterion of open science – making available (OC1) – results show only a low degree
of realization in practice (Table 1). Currently, the vast majority of researchers does not grant other
scientists access to research data at all or only on explicit request. Only about one quarter makes data
available – usually in the context of a publication by a publishing house. Similar results were provided by a
study at HU Berlin (Simukovic et al., 2013). Apparently to date, the open science idea is most present in
mathematics, while it is practiced very rarely in economics and law.
Table 1: Making Research Data Available to Other Researchers (Results in percent, N=667)
C1 C2 C3 C4 C5 Ø
Making data available 25.4 27.9 38.8 30.8 16.1 27.0
Thereof: via a
subjectspecific repository 4.1 5.7 24.5 4.1 0.0 4.2
Thereof: in the context of
a publication by a
publishing house
11.4 19.7 12.2 23.1 8.1 17.4
Existence of
Guidelines
16.6 33.6 20.4 26.1 12.9 21.9
Constraints
Legal reasons 53.5 62.5 50.0 42.5 67.3 49.7
Data unsuitable 41.0 47.7 46.7 51.6 44.2 48.5
Lack of time 19.4 17.0 20.0 15.9 25.0 17.2
Lack of an appropriate
platform 18.8 34.1 30.0 25.0 34.6 24.2
C1: Humanities and social sciences C2: Life sciences C3: Mathematics C4: Natural sciences C5:
Economics and law.
With respect to the second criterion – existence of guidelines which regulate the disclosure (OC2) as
demanded by the DFG (Deutsche Forschungsgemeinschaft, 2013) – results, likewise, show only a low degree
of fulfillment. Most likely such guidelines seem to exist in the life and natural sciences, but here, as well,
more than two-thirds state that they do not know any corresponding regulations.
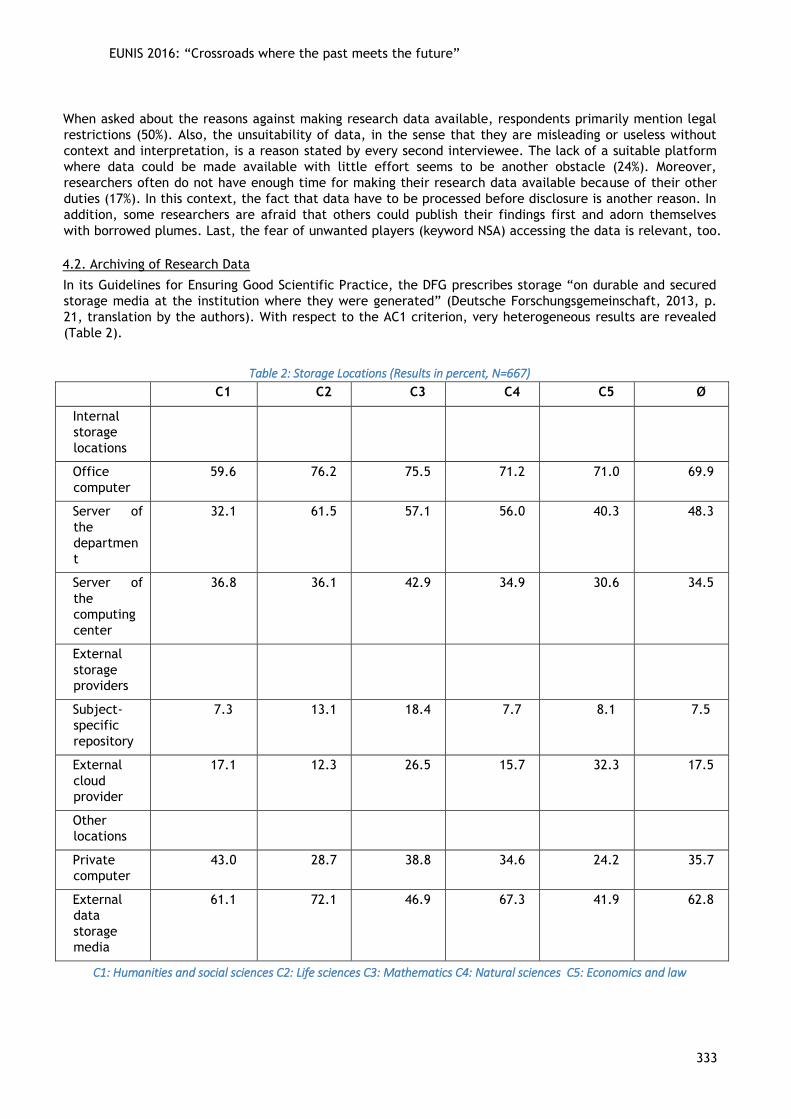
EUNIS 2016: “Crossroads where the past meets the future”
333
When asked about the reasons against making research data available, respondents primarily mention legal
restrictions (50%). Also, the unsuitability of data, in the sense that they are misleading or useless without
context and interpretation, is a reason stated by every second interviewee. The lack of a suitable platform
where data could be made available with little effort seems to be another obstacle (24%). Moreover,
researchers often do not have enough time for making their research data available because of their other
duties (17%). In this context, the fact that data have to be processed before disclosure is another reason. In
addition, some researchers are afraid that others could publish their findings first and adorn themselves
with borrowed plumes. Last, the fear of unwanted players (keyword NSA) accessing the data is relevant, too.
4.2. Archiving of Research Data
In its Guidelines for Ensuring Good Scientific Practice, the DFG prescribes storage “on durable and secured
storage media at the institution where they were generated” (Deutsche Forschungsgemeinschaft, 2013, p.
21, translation by the authors). With respect to the AC1 criterion, very heterogeneous results are revealed
(Table 2).
Table 2: Storage Locations (Results in percent, N=667)
C1 C2 C3 C4 C5 Ø
Internal
storage
locations
Office
computer
59.6 76.2 75.5 71.2 71.0 69.9
Server of
the
departmen
t
32.1 61.5 57.1 56.0 40.3 48.3
Server of
the
computing
center
36.8 36.1 42.9 34.9 30.6 34.5
External
storage
providers
Subject-
specific
repository
7.3 13.1 18.4 7.7 8.1 7.5
External
cloud
provider
17.1 12.3 26.5 15.7 32.3 17.5
Other
locations
Private
computer
43.0 28.7 38.8 34.6 24.2 35.7
External
data
storage
media
61.1 72.1 46.9 67.3 41.9 62.8
C1: Humanities and social sciences C2: Life sciences C3: Mathematics C4: Natural sciences C5: Economics and law
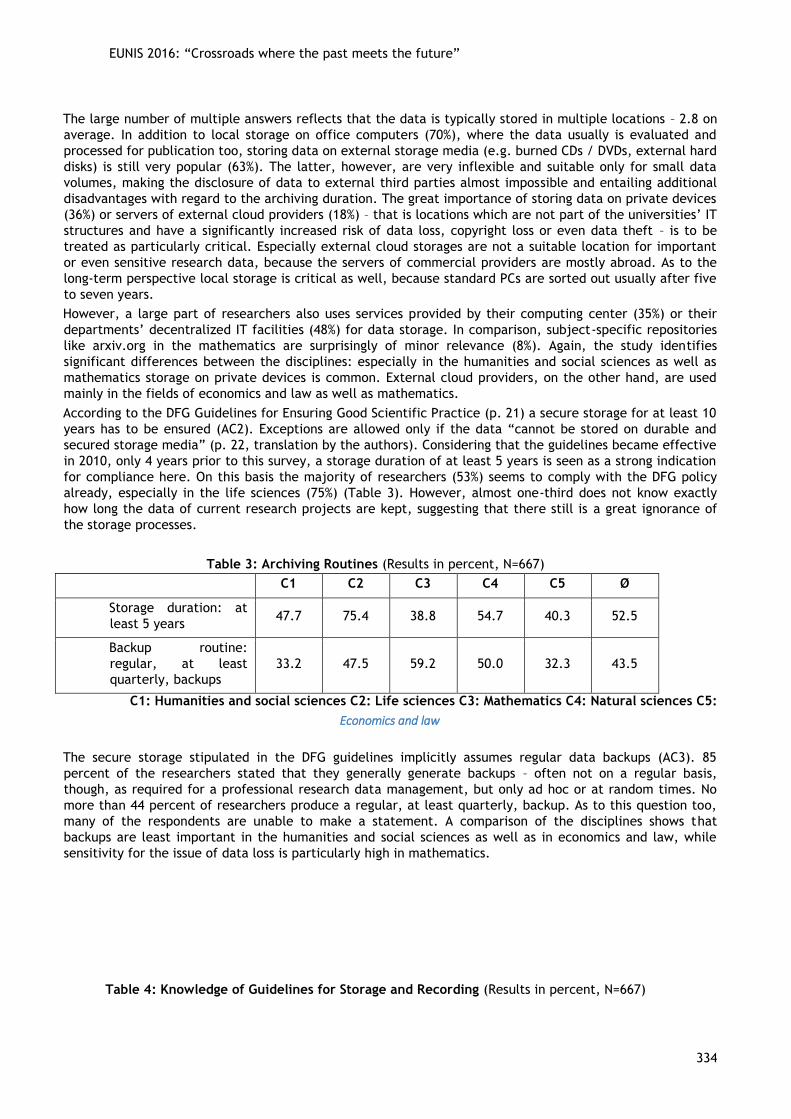
EUNIS 2016: “Crossroads where the past meets the future”
334
The large number of multiple answers reflects that the data is typically stored in multiple locations – 2.8 on
average. In addition to local storage on office computers (70%), where the data usually is evaluated and
processed for publication too, storing data on external storage media (e.g. burned CDs / DVDs, external hard
disks) is still very popular (63%). The latter, however, are very inflexible and suitable only for small data
volumes, making the disclosure of data to external third parties almost impossible and entailing additional
disadvantages with regard to the archiving duration. The great importance of storing data on private devices
(36%) or servers of external cloud providers (18%) – that is locations which are not part of the universities’ IT
structures and have a significantly increased risk of data loss, copyright loss or even data theft – is to be
treated as particularly critical. Especially external cloud storages are not a suitable location for important
or even sensitive research data, because the servers of commercial providers are mostly abroad. As to the
long-term perspective local storage is critical as well, because standard PCs are sorted out usually after five
to seven years.
However, a large part of researchers also uses services provided by their computing center (35%) or their
departments’ decentralized IT facilities (48%) for data storage. In comparison, subject-specific repositories
like arxiv.org in the mathematics are surprisingly of minor relevance (8%). Again, the study identifies
significant differences between the disciplines: especially in the humanities and social sciences as well as
mathematics storage on private devices is common. External cloud providers, on the other hand, are used
mainly in the fields of economics and law as well as mathematics.
According to the DFG Guidelines for Ensuring Good Scientific Practice (p. 21) a secure storage for at least 10
years has to be ensured (AC2). Exceptions are allowed only if the data “cannot be stored on durable and
secured storage media” (p. 22, translation by the authors). Considering that the guidelines became effective
in 2010, only 4 years prior to this survey, a storage duration of at least 5 years is seen as a strong indication
for compliance here. On this basis the majority of researchers (53%) seems to comply with the DFG policy
already, especially in the life sciences (75%) (Table 3). However, almost one-third does not know exactly
how long the data of current research projects are kept, suggesting that there still is a great ignorance of
the storage processes.
Table 3: Archiving Routines (Results in percent, N=667)
C1 C2 C3 C4 C5 Ø
Storage duration: at
least 5 years 47.7 75.4 38.8 54.7 40.3 52.5
Backup routine:
regular, at least
quarterly, backups
33.2 47.5 59.2 50.0 32.3 43.5
C1: Humanities and social sciences C2: Life sciences C3: Mathematics C4: Natural sciences C5:
Economics and law
The secure storage stipulated in the DFG guidelines implicitly assumes regular data backups (AC3). 85
percent of the researchers stated that they generally generate backups – often not on a regular basis,
though, as required for a professional research data management, but only ad hoc or at random times. No
more than 44 percent of researchers produce a regular, at least quarterly, backup. As to this question too,
many of the respondents are unable to make a statement. A comparison of the disciplines shows that
backups are least important in the humanities and social sciences as well as in economics and law, while
sensitivity for the issue of data loss is particularly high in mathematics.
Table 4: Knowledge of Guidelines for Storage and Recording (Results in percent, N=667)
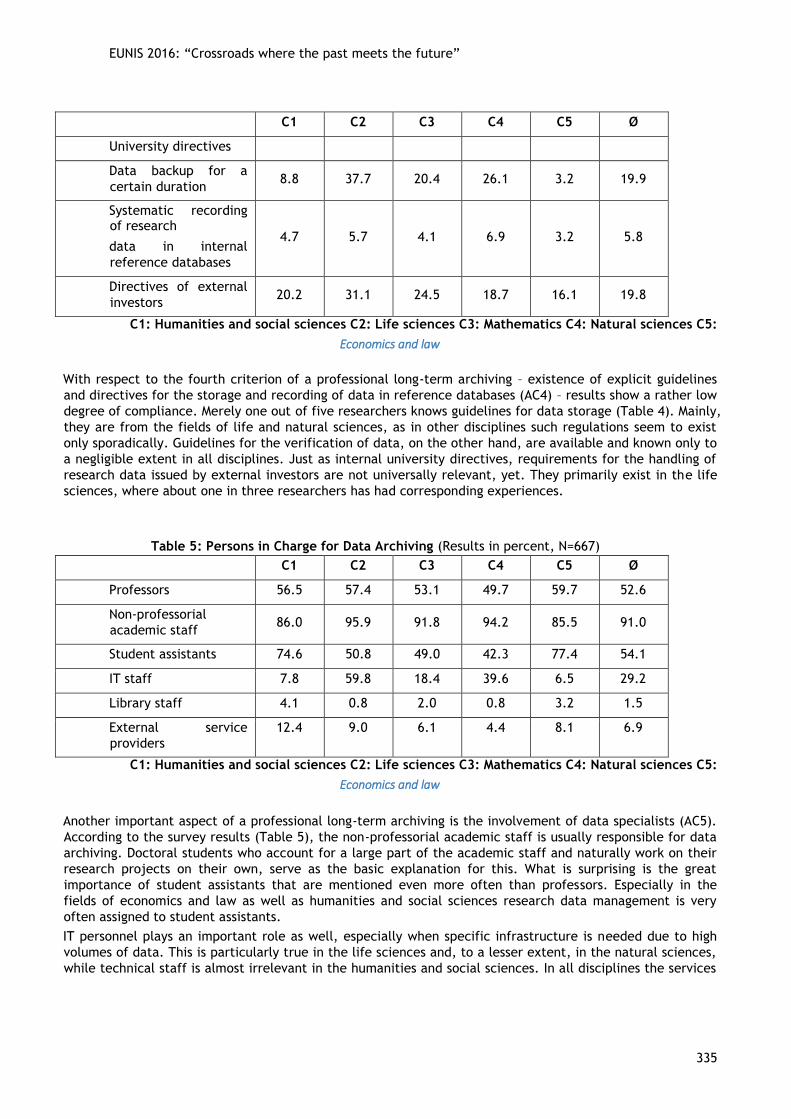
EUNIS 2016: “Crossroads where the past meets the future”
335
C1 C2 C3 C4 C5 Ø
University directives
Data backup for a
certain duration 8.8 37.7 20.4 26.1 3.2 19.9
Systematic recording of research
data in internal
reference databases
4.7 5.7 4.1 6.9 3.2 5.8
Directives of external
investors 20.2 31.1 24.5 18.7 16.1 19.8
C1: Humanities and social sciences C2: Life sciences C3: Mathematics C4: Natural sciences C5:
Economics and law
With respect to the fourth criterion of a professional long-term archiving – existence of explicit guidelines
and directives for the storage and recording of data in reference databases (AC4) – results show a rather low
degree of compliance. Merely one out of five researchers knows guidelines for data storage (Table 4). Mainly,
they are from the fields of life and natural sciences, as in other disciplines such regulations seem to exist
only sporadically. Guidelines for the verification of data, on the other hand, are available and known only to
a negligible extent in all disciplines. Just as internal university directives, requirements for the handling of
research data issued by external investors are not universally relevant, yet. They primarily exist in the life
sciences, where about one in three researchers has had corresponding experiences.
Table 5: Persons in Charge for Data Archiving (Results in percent, N=667)
C1 C2 C3 C4 C5 Ø
Professors 56.5 57.4 53.1 49.7 59.7 52.6
Non-professorial
academic staff 86.0 95.9 91.8 94.2 85.5 91.0
Student assistants 74.6 50.8 49.0 42.3 77.4 54.1
IT staff 7.8 59.8 18.4 39.6 6.5 29.2
Library staff 4.1 0.8 2.0 0.8 3.2 1.5
External service
providers
12.4 9.0 6.1 4.4 8.1 6.9
C1: Humanities and social sciences C2: Life sciences C3: Mathematics C4: Natural sciences C5:
Economics and law
Another important aspect of a professional long-term archiving is the involvement of data specialists (AC5).
According to the survey results (Table 5), the non-professorial academic staff is usually responsible for data
archiving. Doctoral students who account for a large part of the academic staff and naturally work on their
research projects on their own, serve as the basic explanation for this. What is surprising is the great
importance of student assistants that are mentioned even more often than professors. Especially in the
fields of economics and law as well as humanities and social sciences research data management is very
often assigned to student assistants.
IT personnel plays an important role as well, especially when specific infrastructure is needed due to high
volumes of data. This is particularly true in the life sciences and, to a lesser extent, in the natural sciences,
while technical staff is almost irrelevant in the humanities and social sciences. In all disciplines the services
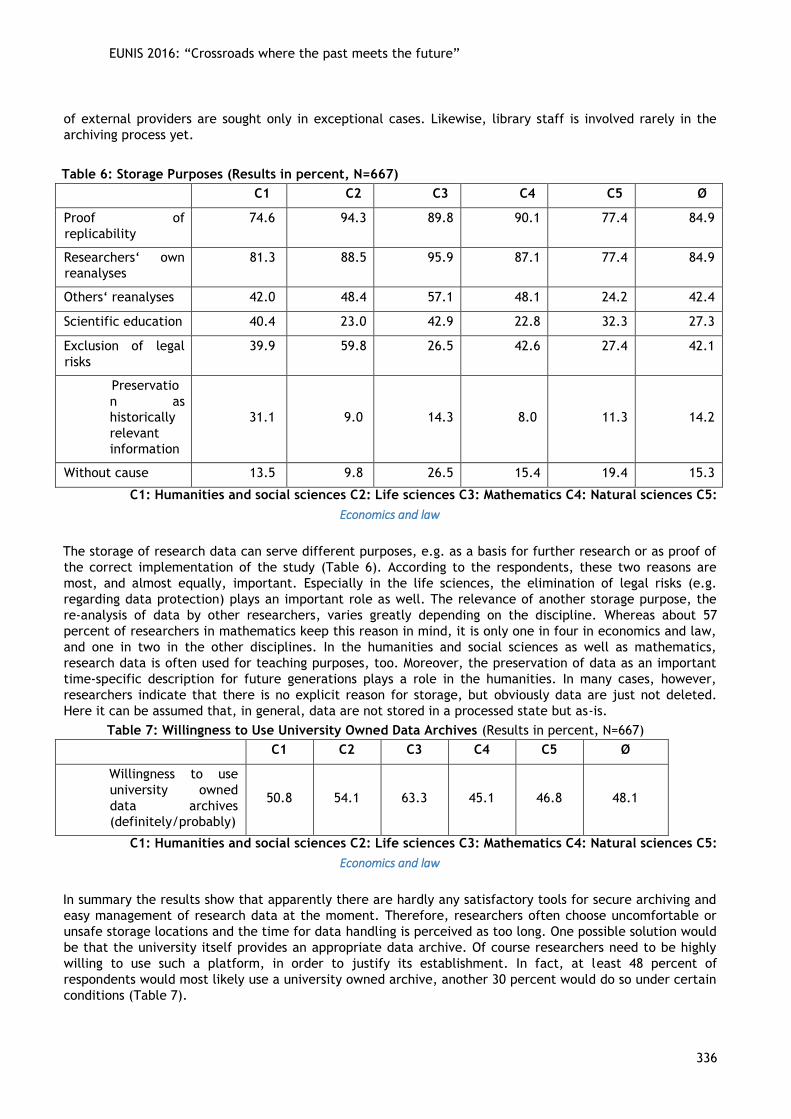
EUNIS 2016: “Crossroads where the past meets the future”
336
of external providers are sought only in exceptional cases. Likewise, library staff is involved rarely in the
archiving process yet.
Table 6: Storage Purposes (Results in percent, N=667)
C1 C2 C3 C4 C5 Ø
Proof of
replicability
74.6 94.3 89.8 90.1 77.4 84.9
Researchers‘ own
reanalyses
81.3 88.5 95.9 87.1 77.4 84.9
Others‘ reanalyses 42.0 48.4 57.1 48.1 24.2 42.4
Scientific education 40.4 23.0 42.9 22.8 32.3 27.3
Exclusion of legal
risks
39.9 59.8 26.5 42.6 27.4 42.1
Preservatio
n as
historically
relevant
information
31.1 9.0 14.3 8.0 11.3 14.2
Without cause 13.5 9.8 26.5 15.4 19.4 15.3
C1: Humanities and social sciences C2: Life sciences C3: Mathematics C4: Natural sciences C5:
Economics and law
The storage of research data can serve different purposes, e.g. as a basis for further research or as proof of
the correct implementation of the study (Table 6). According to the respondents, these two reasons are
most, and almost equally, important. Especially in the life sciences, the elimination of legal risks (e.g.
regarding data protection) plays an important role as well. The relevance of another storage purpose, the
re-analysis of data by other researchers, varies greatly depending on the discipline. Whereas about 57
percent of researchers in mathematics keep this reason in mind, it is only one in four in economics and law,
and one in two in the other disciplines. In the humanities and social sciences as well as mathematics,
research data is often used for teaching purposes, too. Moreover, the preservation of data as an important
time-specific description for future generations plays a role in the humanities. In many cases, however,
researchers indicate that there is no explicit reason for storage, but obviously data are just not deleted.
Here it can be assumed that, in general, data are not stored in a processed state but as-is.
Table 7: Willingness to Use University Owned Data Archives (Results in percent, N=667)
C1 C2 C3 C4 C5 Ø
Willingness to use
university owned
data archives
(definitely/probably)
50.8 54.1 63.3 45.1 46.8 48.1
C1: Humanities and social sciences C2: Life sciences C3: Mathematics C4: Natural sciences C5:
Economics and law
In summary the results show that apparently there are hardly any satisfactory tools for secure archiving and
easy management of research data at the moment. Therefore, researchers often choose uncomfortable or
unsafe storage locations and the time for data handling is perceived as too long. One possible solution would
be that the university itself provides an appropriate data archive. Of course researchers need to be highly
willing to use such a platform, in order to justify its establishment. In fact, at least 48 percent of
respondents would most likely use a university owned archive, another 30 percent would do so under certain
conditions (Table 7).
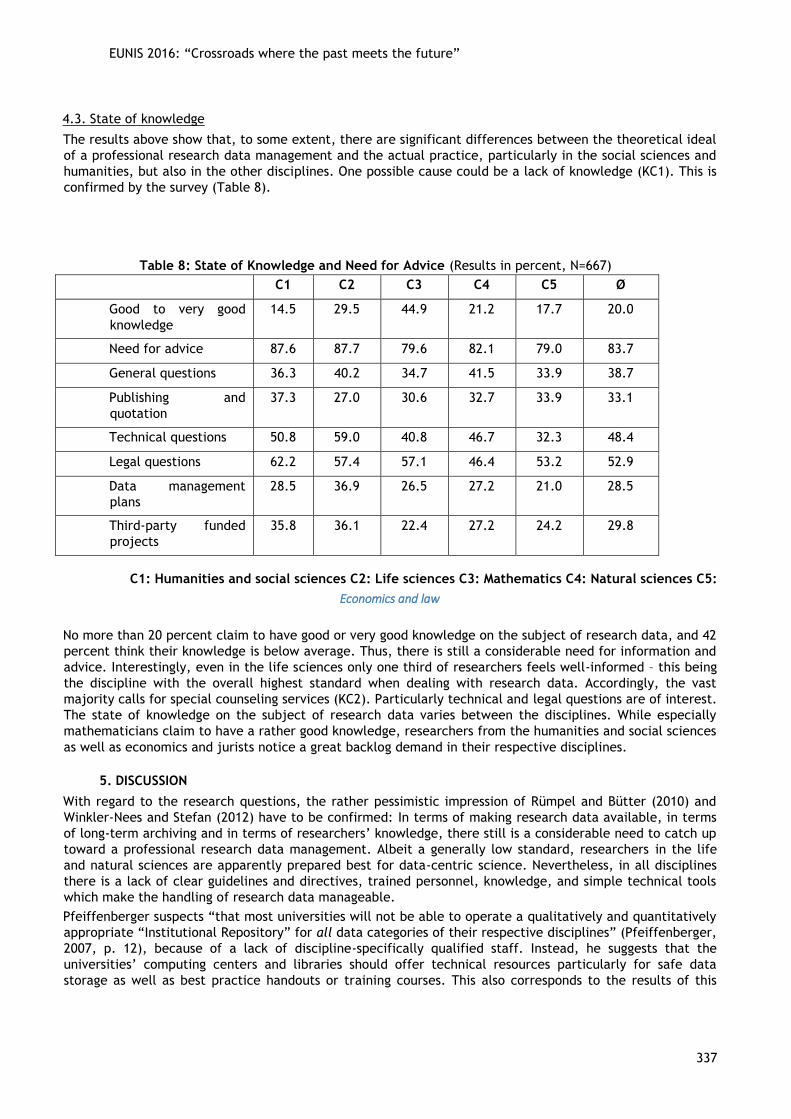
EUNIS 2016: “Crossroads where the past meets the future”
337
4.3. State of knowledge
The results above show that, to some extent, there are significant differences between the theoretical ideal
of a professional research data management and the actual practice, particularly in the social sciences and
humanities, but also in the other disciplines. One possible cause could be a lack of knowledge (KC1). This is
confirmed by the survey (Table 8).
Table 8: State of Knowledge and Need for Advice (Results in percent, N=667)
C1 C2 C3 C4 C5 Ø
Good to very good
knowledge
14.5 29.5 44.9 21.2 17.7 20.0
Need for advice 87.6 87.7 79.6 82.1 79.0 83.7
General questions 36.3 40.2 34.7 41.5 33.9 38.7
Publishing and
quotation
37.3 27.0 30.6 32.7 33.9 33.1
Technical questions 50.8 59.0 40.8 46.7 32.3 48.4
Legal questions 62.2 57.4 57.1 46.4 53.2 52.9
Data management
plans
28.5 36.9 26.5 27.2 21.0 28.5
Third-party funded
projects
35.8 36.1 22.4 27.2 24.2 29.8
C1: Humanities and social sciences C2: Life sciences C3: Mathematics C4: Natural sciences C5:
Economics and law
No more than 20 percent claim to have good or very good knowledge on the subject of research data, and 42
percent think their knowledge is below average. Thus, there is still a considerable need for information and
advice. Interestingly, even in the life sciences only one third of researchers feels well-informed – this being
the discipline with the overall highest standard when dealing with research data. Accordingly, the vast
majority calls for special counseling services (KC2). Particularly technical and legal questions are of interest.
The state of knowledge on the subject of research data varies between the disciplines. While especially
mathematicians claim to have a rather good knowledge, researchers from the humanities and social sciences
as well as economics and jurists notice a great backlog demand in their respective disciplines.
5. DISCUSSION
With regard to the research questions, the rather pessimistic impression of Rümpel and Bütter (2010) and
Winkler-Nees and Stefan (2012) have to be confirmed: In terms of making research data available, in terms
of long-term archiving and in terms of researchers’ knowledge, there still is a considerable need to catch up
toward a professional research data management. Albeit a generally low standard, researchers in the life
and natural sciences are apparently prepared best for data-centric science. Nevertheless, in all disciplines
there is a lack of clear guidelines and directives, trained personnel, knowledge, and simple technical tools
which make the handling of research data manageable.
Pfeiffenberger suspects “that most universities will not be able to operate a qualitatively and quantitatively
appropriate “Institutional Repository” for all data categories of their respective disciplines” (Pfeiffenberger,
2007, p. 12), because of a lack of discipline-specifically qualified staff. Instead, he suggests that the
universities’ computing centers and libraries should offer technical resources particularly for safe data
storage as well as best practice handouts or training courses. This also corresponds to the results of this
EUNIS 2016: “Crossroads where the past meets the future”
338
study where researchers communicated a great need for advisory services. According to Pfeiffenberger
(2007), cooperative efforts of several institutions across university boundaries and the establishment of an
appropriate technical infrastructure and corresponding expertise constitute the answer to the problem. This
would argue for the use of existing storage infrastructures which are jointly operated by several universities,
such as the cloud storage projects in Baden-Württemberg (Schlitter, Yasnogor, & Srajc, 2014) or North
Rhine-Westphalia (Stieglitz, Meske, Vogl, Rudolph, & Öksüz, 2014). Since the conditions of the individual
disciplines vary widely, subject-specific repository solutions are needed additionally (Bertelmann & Hübner,
2007). With regard to making research data available, a system that allows for flexible disclosure seems
most suitable due to the existing legal restrictions and the high reluctance of researchers to fully disclose
their data.
6. REFERENCES
Bell, G. (2009). Foreword. In T. Hey, S. Tansley, & K. Tolle (Eds.), The Fourth Paradigm. DataIntensive
Scientific Discovery (pp. xi–xv). Redmont, Washington: Microsoft Research.
Bell, G., Hey, T., & Szalay, A. (2009). Beyond the data deluge. Science, 323(5919), 1297–1298.
Bertelmann, R., & Hübner, A. (2007). Open access im Dienst der Wissenschaft: Umsetzung von freiem
Zugang in der Helmholtz-Gemeinschaft. Zeitschrift für Bibliothekswesen und Bibliographie, 54(4-5), 246–
250.
Büttner, S., Hobohm, H.-C., & Müller, L. (2011). Research Data Management. In S. Büttner, H.-C. Hobohm, &
L. Müller (Eds.), Handbuch Forschungsdatenmanagement (pp. 13–24). Bad Honnef: Bock + Herchen.
Campbell, E. G., Clarridge, B. R., Gokhale, M., Birenbaum, L., Hilgartner, S., Holtzman, N. A., & Blumenthal,
D. (2002). Data withholding in academic genetics: evidence from a national survey. Jama, 287(4), 473–
480.
Deutsche Forschungsgemeinschaft. (2013). Vorschläge zur Sicherung guter wissenschaftlicher Praxis: Denkschrift: Empfehlungen der Kommission "Selbstkontrolle in der Wissenschaft". Weinheim: Wiley VCH.
Fry, J., Schroeder, R., & den Besten, M. (2009). Open science in e-science: Contingency or policy? Journal of
Documentation, 65(1), 6–32. doi:10.1108/00220410910926103
Lynch, C. (2009). Jim Gray's Fourth Paradigm and the Construction of the Scientific Record. In T.
Hey, S. Tansley, & K. Tolle (Eds.), The Fourth Paradigm. Data-Intensive Scientific Discovery (pp. 177–183).
Redmont, Washington: Microsoft Research.
Marris, E. (2006). Should journals police scientific fraud? Nature, 439(7076), 520–521. doi:10.1038/439520a
Mittler, E. (2007). Open Access zwischen E-Commerce und E-Science. Beobachtungen zu Entwicklung und
Stand. Zeitschrift für Bibliothekswesen und Bibliographie, 54(4/5), 163–169.
National Science Board. (2005). Long-Lived Digital Data Collections: Enabling Research and Education in the
21st Century. Arlington: National Science Foundation. Retrieved from
http://www.nsf.gov/pubs/2005/nsb0540/nsb0540.pdf
Pfeiffenberger, H. (2007). Offener Zugang zu wissenschaftlichen Primärdaten. Zeitschrift für
Bibliothekswesen und Bibliographie, 54(4), 207–210.
Quandt, M. (2012, May). Leibniz-Forschungsdatenumfrage 2010/2011. Leipniz-Gesellschaft. Workshop I AK
Forschungsdaten, Berlin. Retrieved from https://escience.aip.de/akforschungsdaten/wp-
content/uploads/2013/07/Markus-Quandt-GESISPraesUmfrageergebnisse.pdf
Rosenblum, L. (2009). If Malinowski had been a Blogger. LIBREAS. Library Ideas, 19–25.
Rümpel, S., & Büttner, S. (2010). Bibliotheken und Bibliothekare im Forschungsdatenmanagement. In S.
Schomburg, C. Leggewie, H. Lobin, & C. Puschmann (Eds.), Digitale Wissenschaft: Stand und Entwicklung
digital vernetzter Forschung in Deutschland. Beiträge der Tagung (pp. 107–113).
Savage, C. J., & Vickers, A. J. (2009). Empirical study of data sharing by authors publishing in PLoS journals.
PLoS ONE, 4(9), e7078. doi:10.1371/journal.pone.0007078
Schlitter, N., Yasnogor, A., & Srajc, C. (2014). bwSync&Share: A cloud solution for academia in the state of
Baden-Wurttemberg. In O. Kao & A. Hildmann (Eds.), Cloudspeicher im Hochschuleinsatz. Proceedings
der Tagung "Cloudspeicher im Hochschuleinsatz" am 05. und 06. Mai 2014 am ITService-Center (tubIT)
der Technischen Universität Berlin (pp. 40–46). Berlin: Technische Uni Berlin.
EUNIS 2016: “Crossroads where the past meets the future”
339
Simukovic, E., Kindling, M., & Schirmbacher, P. (2013). Forschungsdaten an der HumboldtUniversität zu Berlin: Bericht über die Ergebnisse der Umfrage zum Umgang mit digitalen Forschungsdaten an der Humboldt-Universität zu Berlin. Retrieved from http://nbnresolving.de/urn:nbn:de:kobv:11-100213001
Stieglitz, S., Meske, C., Vogl, R., Rudolph, D., & Öksüz, A. (2014). Cloud Storage Services in Higher
Education – Results of a Preliminary Study in the Context of the Sync&Share-Project in Germany. In P.
Zaphiris & A. Ioannou (Eds.), Lecture Notes in Computer Science. Learning and Collaboration
Technologies. Designing and Developing Novel Learning Experiences (Vol. 8523, pp. 161– 171). Springer
International Publishing. Retrieved from http://dx.doi.org/10.1007/978-3-31907482-5_16
Strathmann, S. (2012). Stand der Diskussionen und Aktivitäten: International. In H. Neuroth, S. Strathmann,
A. Oßwald, R. Scheffel, J. Klump, & J. Ludwig (Eds.), Langzeitarchivierung von Forschungsdaten. Eine
Bestandsaufnahme (pp. 41–49). Boizenburg: vwh [u.a.].
Wagner, G. G. (2000). Selbstorganisation des Wissenschaftssystems würde Datenschutz vereinfachen und Re-
Analysen befördern: gesetzliches Forschungsdaten-Geheimnis könnte die Selbstorganisation unterstützen.
ZUMA Nachrichten, 24, 47.
Winkler-Nees. (2011). Vorwort. In S. Büttner, H.-C. Hobohm, & L. Müller (Eds.), Handbuch
Forschungsdatenmanagement (pp. 5–6). Bad Honnef: Bock + Herchen.
Winkler-Nees, & Stefan. (2012). Stand der Diskussion und Aktivitäten: National. In H. Neuroth, S. Strathmann,
A. Oßwald, R. Scheffel, J. Klump, & J. Ludwig (Eds.), Langzeitarchivierung von Forschungsdaten. Eine
Bestandsaufnahme (pp. 23–40). Boizenburg: vwh [u.a.].
7. AUTHORS’ BIOGRAPHIES
Anne Thoring is a research assistant for public relations and marketing at the Zentrum
für Informationsverarbeitung (the computing center) of the University of Münster
(Germany). She graduated from University College London (UK) and the University of
Münster with degrees in communication sciences, publishing and strategic
communication. Her research focuses on strategies and tools of corporate
communications.
Dominik Rudolph is a research assistant and executive secretary of the Zentrum für
Informationsverarbeitung (the computing center) of the University of Münster
(Germany). He received his Ph.D. from the University of Münster, where he also studied
communication sciences, economics and modern history. His graduate thesis has been
awarded as one of the best dissertations in 2014 (German Thesis Award). In his research
he focusses on the diffusion of media innovations from the user perspective.
Raimund Vogl holds a Ph.D. in elementary particle physics from the University of
Innsbruck (Austria). After completing his Ph.D. studies in 1995, he joined Innsbruck
University Hospital as IT manager for medical image data solutions and moved on to be
deputy head of IT. He served as a lecturer in medical informatics at UMIT (Hall, Austria)
and as managing director for a medical image data management software company
(icoserve, Innsbruck) and for a center of excellence in medical informatics (HITT,
EUNIS 2016: “Crossroads where the past meets the future”
340
Innsbruck). Since 2007 he has been director of the Zentrum für Informationsverarbeitung (the university
computing center) of the University of Münster (Germany). His research interests focus on management of
complex information systems and information infrastructures.
EUNIS 2016: “Crossroads where the past meets the future”
341
Author Index
Abel, Rob 248
Af Hällström, Mikael 213
Agorogianni, Angeliki 221
Alehyane, Amandine 80
Alonen, Miika 213
Alvarez, Ludivine 152
Anastasiades, Savvas 294
Angenent, Holger 19
Argiropoulos, Stauros 77
Balaouras, Pantelis 313
Berglund, Soren 47
Bergström, Johan 80, 92, 218, 223
Bernardes, Mário 200
Bertazzo, Matteo 244
Bessa, José 111
Bollini, Andrea 197
Bontomitsidis, Spyridon 63
Breiter, Andreas 40
Brito, José 111
Brown, Josh 197, 328
Buffet, Pierre 152
Busquets, Jaime 57
Cardoso, Elsa 262
Carlino, Chiara 244
Ciclosi, Francesco 101
Coelho, Hugo 111
Cordewener Bas 195
Costa, António 30, 111
Coumoul, Xavier 152
Cuní, Jordi 34
Daskopoulos, Dimitris 124
Decker, Bernd 49
Demeranville, Tom 328
Dreyer, Malte 320
Epelboin, Yves 298
Evangelista, Juan 57
Federico, Giacanelli 244
Fernández Martínez, Antonio 223
Ferrell, Gill 134, 154
Floros, Dimitrios 63
Fuentes, Juan José 34
Fuglevaag, Lars 229
Galbarczyk, Monika 142
Gentili, Giampaolo 178
EUNIS 2016: “Crossroads where the past meets the future”
342
Giovanitsa, Pinelopi 234
Gray, Lisa 134
Grzemski, Sarah 131
Gumbau Mezquita, Jose Pascual 223
Hansen, Anders Bøgebjerg 74
Harent, Marion 152
Hettrick, Simon 195
Hommel, Wolfgang 168
Ippoliti, Fabrizio 178
Kakavas, Ioannis 226
Katerbow, Matthias 195
Kealley, Anne 218
Kivi, Yvonne 221, 223
Kougioumtzakis, George 294
Krämer, Florian 184
Kučina Softić, Sandra 237
Kupila, Pauliina 127
Kuusio, Ari 44
Langfelt, Ole 223
Laude, Anne 152
Lavikainen, Mika 187
Leah Lang 218
Lehtonen, Ulla 127
Lehu, Stéphanie 152
Lindstedt, Mats 74
Linko, Lotta 44
Liolios, Nikos 77
Lopes, Pedro 30
Loukos, Fotis 124
Maas, Bruce 248
Maccari, Marco 178
Macías, Miguel 57
MacMullen, Lori 218
Maltusch, Patrik 82, 213
Martinović, Zvonko 237
Martins, Ricardo T. 200
Mathews, Anna 154
Mauri, Maurizio 101
Mengod, Raúl 57
Mennielli, Michele 80, 197, 218, 223
Merakos, Lazaros 313
Michajłowicz, Marek 231
Mincer-Daszkiewicz, Janina 70, 74, 253
Molnar, Tamas 164
Monteiro, Pedro 111
Mornati, Susanna 197
Mušica, Vedran 237
Mylonakis, Konstantinos 63
EUNIS 2016: “Crossroads where the past meets the future”
343
Navarro, Vicente Andreu 223
Niavi, Stefania 77
O’Brien, John 248
Orama, Tuomas 187
Pacheco, Osvaldo 200
Pacholak, Anna 142
Palmer, Gregory D. 266
Pereira, Francisco 30
Pereira, Rui H. 200
Pitsianis Nikos 63
Pöhn, Daniela 168
Politze, Marius 49, 184
Polzonetti, Alberto 101, 178
Price, Simon 282
Protasiewicz, Jarosław 231
Radojević, Branko 229
Rannila, Jaakko 187
Ravaioli, Simone 244
Reglund Thorsen, Asbjørn 292
Remes, Suvi 213
Ribeiro, Lígia M. 200
Ribeiro, Ricardo 262
Rudolph, Dominik 19, 330
Russo, Stefano 74
Rygielski, Wojciech 70, 253
Salmatzidis, Yiannis 221
Sampalo, Paco 223
Schaffert, Steffen 49
Schild, Christian 19
Seesto, Teemu 223
Selalmazidis, Anastasios 77
Sherlock, Paul 218
Siissalo, Ilkka 221
Steijaert, Radojević 229
Stigell, Lauri 187
Suess, Jack 248
Suominen, Esa 82
Syynimaa, Nestori 82
Szypke, Mikołaj 231
Tasala, Outi 285
Thoring, Anne 19, 330
Thorsen ,Asbjørn Reglund 100
Tinson, Peter 218
Tsimpanis, Konstantinos 313
Tsipizidis, Charalampos 124
Turro, Carlos 57
EUNIS 2016: “Crossroads where the past meets the future”
344
Van Calster, Jan 287
van der Vorst, Rens 223
Vangen, Geir 74
Vogl, Raimund 19, 330
Vollmer, Andreas 320
von der Heyde, Markus 40
Von der Heyde, Markus 218
Westerlund, Karoline 162
Wilmer, Andreas 19
Wilson, Noel 92


