Embed Size (px)
Citation preview
European Parliament Electionsand Political Representation:Policy Congruence between Votersand Parties
RORY COSTELLO, JACQUES THOMASSEN and MARTIN ROSEMA
It is often said that European Parliament elections fail as an instrument to express thewill of the European people. However, while the elections are not contested at theEuropean level and are often dominated by national issues, this does not necessarilyimply that they fail to connect policy views of voters and representatives. This articleexamines policy congruence between voters and candidates, utilising the candidate andvoter surveys of the European Election Study 2009. First, it demonstrates that policypreferences of candidates and voters are constrained by three separate policydimensions. Second, it shows that the quality of representation is high in terms ofleft/right, the main dimension of conflict in European politics, but lower on the culturaland European integration dimensions. Finally, it establishes that in some cases theaggregation of national parties in political groups in the European Parliament posesproblems for effective political representation.
The referendums on the Constitutional Treaty in 2005 in the Netherlandsand France and the referendum on the Lisbon Treaty in 2008 in Irelandrevealed a major lack of congruence between the policy views of the politicalelites and the electorate. The most extreme case was the Netherlands where aclear majority (62 per cent) of the electorate voted ‘nee’ in the referendum,against the will of the major political parties in parliament, togetheroccupying 85 per cent of the seats. Obviously, the great majority of voterswere far more Eurosceptic than their political leaders. A similarphenomenon is the sudden rise of populist parties across Western Europe.To a large extent their success is built on their crusade against non-westernimmigrants, in particular from Muslim countries, and the ‘Islamisation’ ofWestern societies. Just like the issue of Europeanisation this development
Correspondence Address: [email protected]
West European Politics,Vol. 35, No. 6, 1226–1248, November 2012
ISSN 0140-2382 Print/1743-9655 Online ª 2012 Taylor & Francis
http://dx.doi.org/10.1080/01402382.2012.713744
Dow
nloa
ded
by [
Uni
vers
iteit
Tw
ente
] at
01:
49 0
5 O
ctob
er 2
012
suggests a failure of the traditional mainstream parties to represent thepolicy views of the electorate. Our main contention in this paper is that thisis due to the fact that policy positions on such issues are not constrained bythe main dimension of contestation in European politics, the left/rightdimension.
We develop our argument as follows. In the next section we discuss themain conditions for an effective process of representation. One of theseconditions is that both at the level of political parties and the electorate issuepositions are constrained by the same ideological dimension. We argue thatin the European context this can only be the left/right dimension. Thesection that follows describes the policy dimensions that form the basis forelectoral competition in European Parliament elections. We argue thatpolicy preferences at the level of candidates as well as voters are structuredin terms of three distinct dimensions: the left/right dimension, a culturaldimension, and a European integration dimension. We hypothesise thatpolitical representation in the European Parliament will only be effective onissues constrained by the main dimension of political contestation inEuropean politics, that is, the left/right dimension.
We test this hypothesis on the basis of data on the 2009 EuropeanParliament elections. We first examine the dimensionality of the issue space ineach country using confirmatory factor analysis. The goal is to identifywhether policy issues are constrained by the left/right dimension or formseveral separate policy dimensions. Our second research goal is to examine thelevel of congruence between voters and candidates across different policydimensions at the national level. As the left/right dimension is the primarydimension of contestation in domestic European politics, we expect that therewill be a relatively high level of congruence between voters and representativeson this dimension. To the extent that issues are not related to this left/rightdimension, we expect that the level of congruence will be lower. In the last partof the analysis we examine to what extent the national parties are compatiblepolicy-wise and hence whether the process of political representation is stilleffective when we aggregate it to the level of the political groups in theEuropean Parliament. Finally, we reflect on the implications of our findingsfor the quality of representation in the European Union and its member states.
The Requirements for Effective Political Representation
What constitutes an effective process of political representation depends onone’s view on the function of this process. In modern (theories of)representative democracy there is hardly any dispute about the mainfunction of this process: it should connect, either directly or indirectly, thepolicy preferences of the citizenry to public policy. The key actors in thisprocess, in addition to the voters, are political parties. They directly orindirectly translate their electoral mandate into public policy. Directly inmajoritarian democracies where a single party gets an electoral mandate to
European Parliament Elections and Political Representation 1227
Dow
nloa
ded
by [
Uni
vers
iteit
Tw
ente
] at
01:
49 0
5 O
ctob
er 2
012
implement its policy programme, indirectly in consensus democracies whereafter the elections parties in parliament have to form a coalition governmentbased on a compromise between their policy programmes (Powell 2000). Inboth systems the first important step in connecting the policy preferences ofthe voters to public policy is that elections connect these preferences to thepolicy views of political parties and their representatives in parliament. Inthis paper we focus on this first step by examining to what degree the policyviews of political representatives match the views of the citizens in thecontext of the European Parliament and hence how well the system ofpolitical representation works on the European level.
For elections to function as instruments to link citizens’ policy preferenceswith the policy positions of representatives, two main requirements must bemet. First, the parties must offer a choice to the electorate in terms of theirpolicy proposals. Second, voters must vote according to their policypreferences. These conditions are familiar elements of the Responsible PartyModel of representation (see e.g. American Political Science Association1950; Katz 1997; Thomassen 1994). The common assumption is that if bothconditions are met, the electoral process will lead to policy congruencebetween a particular parliamentary party and the voters who voted for it.
However, as argued elsewhere (Thomassen 1994, 1999), these tworequirements do not guarantee policy congruence between voters andrepresentatives. Even when parties offer distinct policy programmes and allvoters vote according to their issue positions, the election outcome does notnecessarily convey an unequivocal electoral mandate to political parties onany given policy issue. Political parties offer a package deal to the voter. Byvoting for a particular party, voters are forced to vote for the wholepackage, even though they might favour another party on some issues.Consequently, it is possible that a party represents the view of a minority ofits voters on individual issues.
The problem is only avoided when the voters voting for a particular partybecause of their position on a particular issue(-dimension) agree with theother policy positions of that party as well. Logically, this will only occurwhen these issue positions, both at the level of political parties and at thelevel of the electorate, are highly correlated – i.e. when both political parties,in the composition of their programmes, their representatives in parliament,in their legislative behaviour, and voters, when they decide which party theywill vote for, are constrained by the same ideology. If that is the case thenvoters, by using this ideology or belief system as a shortcut, can vote for theparty that represents their policy preferences best without even knowing theposition of political parties on each and every issue (Downs 1957). Onlywhen this condition is met will elections connect the policy preferences of thevoters for a particular party across a range of issues to the policy position ofthe party of their choice.
Examining the effectiveness of political representation at the level of theEuropean Parliament is even more complicated than at the national level.
1228 R. Costello et al.
Dow
nloa
ded
by [
Uni
vers
iteit
Tw
ente
] at
01:
49 0
5 O
ctob
er 2
012
A familiar criticism of the system of political representation at the Europeanlevel is that there is no such system. European political parties as such donot compete for the votes of a European electorate. European elections arefought by national political parties and mainly on national issues, votersmake their choice on the basis of their opinions on national issues and theirperception of national political parties on these issues, and, as aconsequence, European elections fail as an instrument of democracy atthe European level, that is, they fail to link the policy preferences of theEuropean people to the decision-making process in the EuropeanParliament.
However, even though it is true that there is no European system ofpolitical representation as such, this does not necessarily mean Europeanelections fail as an instrument of linkage. If the requirements spelled outabove are met within each member state this will lead to policy congruencebetween voters and their national MEPs. Furthermore, if the variousnational systems are compatible – in terms of having similar sets of partiesputting forward similar policy programmes, based on the same ideologicaldimension – then they can be successfully aggregated at the European level iflike-minded national political parties jointly form political groups in theEuropean Parliament. This in turn would lead to congruence between thepolicy positions of these transnational political groups and the people who(indirectly) voted for them. Taking this into account is relevant, because thegeneral pattern is that MEPs vote in accordance with the majority of theirpolitical group in the European Parliament (Hix et al. 2007: 137). Therefore,the compatibility of the national political parties jointly forming politicalgroups in the European Parliament is an additional requirement to be metfor an effective process of political representation at the European level.
Policy Dimensions in European Parliament Elections
It has often been argued that party competition in European democraciescan be largely reduced to a single dimension of left/right (e.g. Sani andSartori 1983). Empirical research seems to confirm that left/right is the maindimension of contestation. Voters in general have no problem locatingthemselves on the left/right dimension; they have a clear perception of wherethe main political parties stand; and they vote in large numbers for partiesnear their own position on this dimension (van der Brug and van der Eijk1999; van der Brug et al. 2009; van der Eijk et al. 2005). Therefore, thelanguage of ‘left’ and ‘right’ seems to create a unidimensional discourseproviding the common yardstick for masses and elites that is required in amodel of political representation (Huber and Powell 1994). Research alsoshows that vote choice in European elections is strongly related to left/rightpositions (van der Eijk et al. 1996: 359).
In terms of content, the left/right dimension is most closely associatedwith economic questions, such as the redistribution of wealth and the role of
European Parliament Elections and Political Representation 1229
Dow
nloa
ded
by [
Uni
vers
iteit
Tw
ente
] at
01:
49 0
5 O
ctob
er 2
012
the state in the economy. As Hooghe et al. (2004: 164) put it, the left/rightdimension ‘constrains the positions that parties take on competing versionsof capitalism in Europe’. Support for the economic interpretation of the left/right dimension is also provided by the cross-national study of Benoit andLaver (2006). They find that in all EU countries, except for Malta andAustria, party positions on the issue of ‘taxes and spending’ weresignificantly correlated with positions on the general left/right dimension.Due to the dominance of the left/right dimension in shaping partycompetition across countries, the national systems of political representa-tion in EU member states are largely compatible. This is the case even afterthe 2004 enlargement of the European Union with 10 new member states,mainly from Central and Eastern Europe. As a consequence these nationalsystems of political representation can be aggregated to the European levelwithout losing much of their effectiveness. Even though there is not much ofa truly European system of political representation, European party groupsare remarkably distinct (competitive) and internally cohesive with regard tothe left/right dimension, while voters across member states mainly voteaccording to their position on the left/right dimension (Rosema and de Vries2011; Schmitt and Thomassen 2009; van der Brug et al. 2009).
All these studies suggest that the process of political representation islikely to be effective on the left/right dimension and therefore on issuesconstrained by this dimension. However, they do not really prove that thisprocess is effective on each and every issue. This will only be the case whenall policy issues are encompassed or constrained by this single dimension.This requirement is unlikely to be met. On the contrary, a growing body ofresearch suggests that attitudes and policy positions on issues like law andorder, European unification, immigration and the place of ethnic minoritiesin society are not constrained by the left/right dimension (Hooghe et al.2004; Kriesi et al. 2006). If this is the case, whereas at the same time thebehaviour of both political parties and voters at election time is stilldominated by the left/right dimension, elections are doomed to fail as aninstrument of linkage with regard to such issues.
The idea that the space of political conflict in most modern Westernsocieties can be reduced to a single ideological dimension was neverundisputed. In Western Europe the religious cleavage used to be a seconddimension of conflict in addition to the left/right dimension, basicallyunderstood as a class cleavage. Although it might be true that thisdimension is no longer a dimension of conflict but ‘only’ a dimension ofidentification (Sani and Sartori 1983), people might still use it as a compassguiding them on moral issues. A second more or less classic dimension is thelibertarian-authoritarian dimension (Kitschelt 1994; Lipset 1966). Lipset(1966) was the first to argue that the traditional parties on the left were notrepresentative of their voters on this dimension. Whereas these parties tendto combine a left position on the (socio-economic) left/right dimension witha libertarian position, their voters, in particular as far as they are less well
1230 R. Costello et al.
Dow
nloa
ded
by [
Uni
vers
iteit
Tw
ente
] at
01:
49 0
5 O
ctob
er 2
012
educated, tend to combine a position on the left with a traditional orauthoritarian position on non-material issues.
Recently this discussion has been brought back to life, mainly because ofthe rise of populist parties. It is difficult to understand their success in thesimple left/right framework. For example, Kriesi et al. (2006, 2008) arguethat the antagonism between winners and losers of the contemporaryprocess of globalisation leads to a conflict between integration anddemarcation. They expect that this new conflict dimension will increasinglytake on an ethnic or nationalist character. Also, they expect that new issueslike European integration and immigration will be absorbed into thiscultural dimension. The cultural dimension has been gaining in importanceas it has become the primary basis on which new parties or transformedestablished parties seek to mobilise their electorate and therefore hasdeveloped into a second dimension of conflict (Kriesi et al. 2006, 2008). Thecultural dimension is conceptually strongly related to the classic libertarian-authoritarian dimension. The same applies to the GAL-TAN dimension(green/alternative/libertarian vs. traditional/authoritarian/nationalist) intro-duced by Hooghe et al. (2004).
While the cultural dimension is distinct from the left/right dimension,most studies find that it is not entirely separate. In terms of the positions ofEuropean political parties in Western Europe, Marks et al. (2006) find amoderately strong correlation between the two dimensions, with parties onthe left typically associated with libertarian (or GAL) positions, and partieson the right associated with more authoritarian (or TAN) positions. Incontrast, the relationship was found to be in the opposite direction forparties in former communist countries of Central and Eastern Europe:parties on the right (with free market economic policies) tend to be moreliberal on cultural matters and more in favour of European integration thanparties on the left. This suggests that on this dimension the major politicalgroups in the European Parliament will have difficulty meeting therequirement of the compatibility of national party delegations (cf. van derBrug et al. 2009; Voeten 2009).
In both Kriesi’s and Hooghe’s conceptual framework the issue ofEuropean integration is part of the cultural or GAL-TAN dimensionrespectively. However, in analyses of the issue positions of both members ofthe European Parliament and members of the national parliaments of themember states, European integration clearly came out as a separatedimension, distinct from both the left/right and libertarian-authoritariandimensions (McElroy and Benoit 2007; Thomassen and Schmitt 1999).European integration appears not completely independent from left/right,though, in particular at the elite level, because parties opposing Europeanintegration are typically found relatively close to the extremes of the left/right dimension, whereas centrist parties are characterised by morefavourable attitudes towards European integration (Hooghe et al. 2004;Rosema and de Vries 2011; Schmitt and Thomassen 2009). These findings
European Parliament Elections and Political Representation 1231
Dow
nloa
ded
by [
Uni
vers
iteit
Tw
ente
] at
01:
49 0
5 O
ctob
er 2
012
lead us to expect that policy preferences can be understood best in terms ofthree distinct, but moderately correlated, dimensions of political contesta-tion: the traditional left/right dimension, which is strongly associated witheconomic issues, a cultural dimension, which strongly overlaps with GAL-TAN and incorporates issues like immigration, and a dimension related tothe issue of European integration.
The Dimensionality of the Policy Space
To test our hypotheses we use data from the Candidate Study and VoterStudy of the European Election Study 2009 (EES 2009) (Giebler et al. 2010;van Egmond et al. 2010). The Candidate Study surveyed a total of 1,576candidates from all 27 member states. The sample focused on parties thatreceived over half the national electoral threshold and excluded candidatesvery low on the party list. On average, there were 58 respondents permember state. However, this varied widely, from seven respondents inBulgaria to 258 respondents in the UK. The Voter Study surveyed 27,069individuals from all 27 member states, with a minimum of 1,000 respondentsper country. Data files and documentation are available from the projectwebsite: http://www.piredeu.eu.
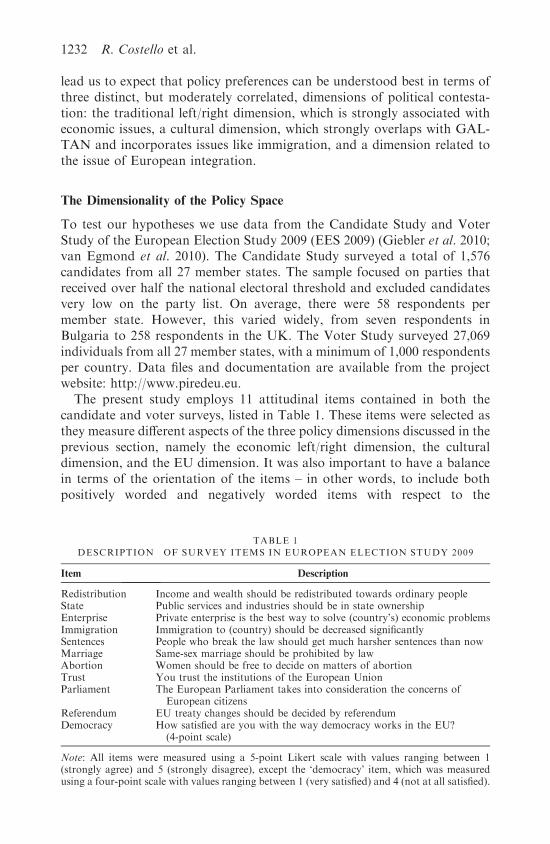
The present study employs 11 attitudinal items contained in both thecandidate and voter surveys, listed in Table 1. These items were selected asthey measure different aspects of the three policy dimensions discussed in theprevious section, namely the economic left/right dimension, the culturaldimension, and the EU dimension. It was also important to have a balancein terms of the orientation of the items – in other words, to include bothpositively worded and negatively worded items with respect to the
TABLE 1
DESCRIPTION OF SURVEY ITEMS IN EUROPEAN ELECTION STUDY 2009
Item Description
Redistribution Income and wealth should be redistributed towards ordinary peopleState Public services and industries should be in state ownershipEnterprise Private enterprise is the best way to solve (country’s) economic problemsImmigration Immigration to (country) should be decreased significantlySentences People who break the law should get much harsher sentences than nowMarriage Same-sex marriage should be prohibited by lawAbortion Women should be free to decide on matters of abortionTrust You trust the institutions of the European UnionParliament The European Parliament takes into consideration the concerns of
European citizensReferendum EU treaty changes should be decided by referendumDemocracy How satisfied are you with the way democracy works in the EU?
(4-point scale)
Note: All items were measured using a 5-point Likert scale with values ranging between 1(strongly agree) and 5 (strongly disagree), except the ‘democracy’ item, which was measuredusing a four-point scale with values ranging between 1 (very satisfied) and 4 (not at all satisfied).
1232 R. Costello et al.
Dow
nloa
ded
by [
Uni
vers
iteit
Tw
ente
] at
01:
49 0
5 O
ctob
er 2
012
dimension being measured – in order to be able to identify an acquiescencebias in the data. Ten of the selected items elicited a response to a statementon a 5-point Likert scale, while one item used a 4-point scale.
The first set of analyses examines the structure of policy views amongvoters and candidates. Confirmatory factor analysis was conducted usingSTATA version 12.0 to test our expectations regarding the policy space ineach country. Maximum Likelihood (ML) estimation was used for theanalysis, with missing data handled by listwise deletion.1 The candidate dataand voter data are examined together, in order to produce comparableestimates of their respective positions on the underlying dimensions, enablingus to determine the degree of policy congruence. We also looked at votersand candidates separately (results not presented). A comparable structurewas found for both levels, the main differences being that for candidates,positions are more tightly constrained by the underlying dimensions (indi-cated by higher factor loadings for the candidate data than the voter data)and the dimensions are somewhat more strongly correlated with each other.
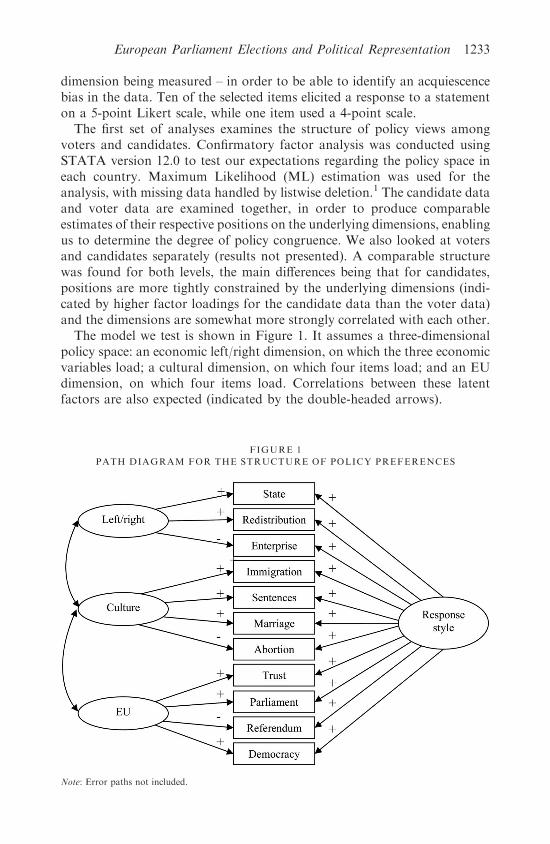
The model we test is shown in Figure 1. It assumes a three-dimensionalpolicy space: an economic left/right dimension, on which the three economicvariables load; a cultural dimension, on which four items load; and an EUdimension, on which four items load. Correlations between these latentfactors are also expected (indicated by the double-headed arrows).
FIGURE 1
PATH DIAGRAM FOR THE STRUCTURE OF POLICY PREFERENCES
Note: Error paths not included.
European Parliament Elections and Political Representation 1233
Dow
nloa
ded
by [
Uni
vers
iteit
Tw
ente
] at
01:
49 0
5 O
ctob
er 2
012
In addition to the factors corresponding to the three policy dimensions a‘response style’ factor is included in the model. We include this factor toaddress a measurement problem in the data. As is common in Likert items,there is evidence of acquiescence bias, that is, a tendency among somerespondents to agree with statements regardless of their content(McClendon 1991). This tendency is picked up by the inclusion of theresponse style factor, which follows the recommendations of Billiet andMcClendon (2000) and Welkenhuysen-Gybles et al. (2003). There is noreason to believe that different items will be affected differently byacquiescence (Welkenhuysen-Gybles et al. 2003: 707), so the style factor isconstrained to have an identical loading on all of the Likert items in themodel (but loads freely on the non-Likert item ‘democracy’). The stylefactor is further constrained to be uncorrelated with each of the three‘content’ factors (Billiet and McClendon 2000: 612).2 An additional testconfirmed that the response style factor does indeed measure acquiescence.3
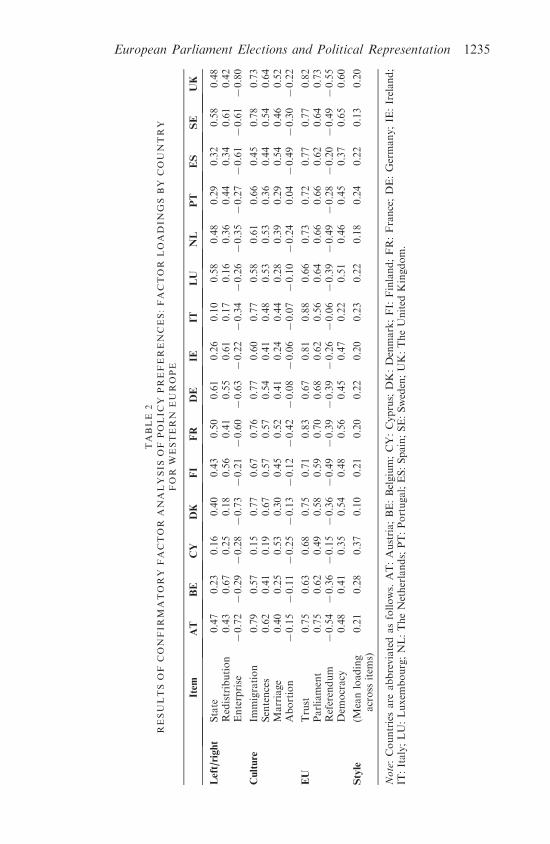
For member states in Western Europe the standardised factor loadings arepresented in Table 2. In each of these countries the four-factor model (threepolicy dimensions plus the response style factor) provided a good fit with thedata, as discussed in more detail below. In general, the factor loadings (whichhave a possible range of 71 to þ1) are reasonably strong and in theanticipated direction. Only the item about abortion has consistently lowloadings, which suggests that in most countries this issue is not incorporatedin the cultural dimension. We kept the item, though, in order to maintain amix of pro-trait and contra-trait items for each dimension.
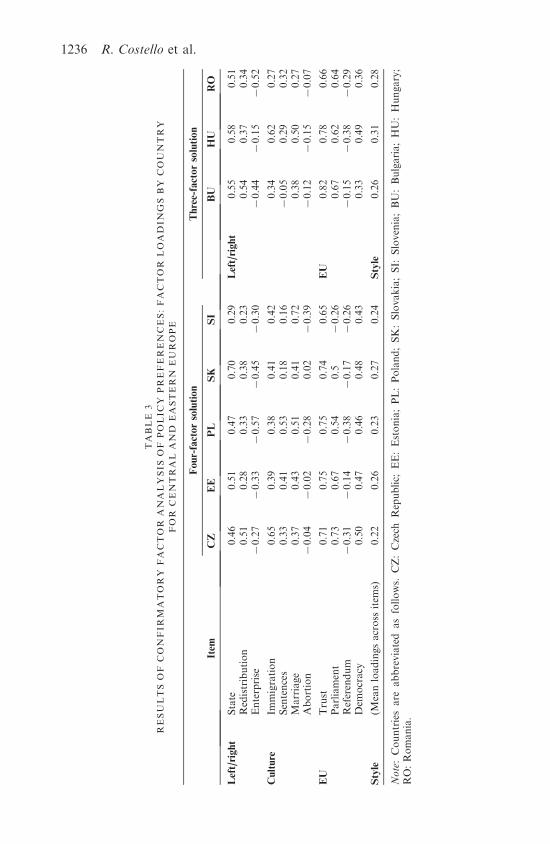
In Central and Eastern Europe our model was not always supported bythe data, as shown in Table 3. In five countries (Czech Republic, Estonia,Poland, Slovakia and Slovenia) the model that included three policydimensions plus the response style factor provided a good fit with the data.In Bulgaria, Romania and Hungary, however, a simpler model containingjust two policy factors performed better than the full model: a broad left/right factor on which the economic and cultural items load, and a separateEU factor. For four countries no acceptable model was found: Greece,Malta, Lithuania and Latvia.4 For reasons of comparability, these fourcountries are not included in the analyses below of policy congruencebetween voters and parties.
Model fit indices and the inter-factor correlations for each country arelisted in Table 4. The adequacy of the fit is evaluated using a number ofrecommended statistics (Brown 2006: 87). The standardised root meansquare residual (SRMR) measures the extent to which the correlations fromthe input matrix are adequately predicted by the model; good-fitting modelshave values below 0.08. The root mean square error of approximation(RMSEA) expresses the degree of model misspecification; values below 0.08can indicate an acceptable model fit, while values below 0.06 indicate a goodfit. The Comparative Fit Index (CFI) evaluates the fit of the model incomparison to a baseline model on a scale of 0 to 1; values above 0.90 can be
1234 R. Costello et al.
Dow
nloa
ded
by [
Uni
vers
iteit
Tw
ente
] at
01:
49 0
5 O
ctob
er 2
012
TABLE
2
RESULTSOF
CONFIR
MATORY
FACTOR
ANALYSIS
OF
POLIC
YPREFERENCES:FACTOR
LOADIN
GSBY
COUNTRY
FOR
WESTERN
EUROPE
Item
AT
BE
CY
DK
FI
FR
DE
IEIT
LU
NL
PT
ES
SE
UK
Left/right
State
0.47
0.23
0.16
0.40
0.43
0.50
0.61
0.26
0.10
0.58
0.48
0.29
0.32
0.58
0.48
Redistribution
0.43
0.67
0.25
0.18
0.56
0.41
0.55
0.61
0.17
0.16
0.36
0.44
0.34
0.61
0.42
Enterprise
70.72
70.29
70.28
70.73
70.21
70.60
70.63
70.22
70.34
70.26
70.35
70.27
70.61
70.61
70.80
Culture
Immigration
0.79
0.57
0.15
0.77
0.67
0.76
0.77
0.60
0.77
0.58
0.61
0.66
0.45
0.78
0.73
Sentences
0.62
0.41
0.19
0.67
0.57
0.57
0.54
0.41
0.48
0.53
0.53
0.36
0.44
0.54
0.64
Marriage
0.40
0.25
0.53
0.30
0.45
0.52
0.41
0.24
0.44
0.28
0.39
0.29
0.54
0.46
0.52
Abortion
70.15
70.11
70.25
70.13
70.12
70.42
70.08
70.06
70.07
70.10
70.24
0.04
70.49
70.30
70.22
EU
Trust
0.75
0.63
0.68
0.75
0.71
0.83
0.67
0.81
0.88
0.66
0.73
0.72
0.77
0.77
0.82
Parliament
0.75
0.62
0.49
0.58
0.59
0.70
0.68
0.62
0.56
0.64
0.66
0.66
0.62
0.64
0.73
Referendum
70.54
70.36
70.15
70.36
70.49
70.39
70.39
70.26
70.06
70.39
70.49
70.28
70.20
70.49
70.55
Dem
ocracy
0.48
0.41
0.35
0.54
0.48
0.56
0.45
0.47
0.22
0.51
0.46
0.45
0.37
0.65
0.60
Style
(Meanloading
across
item
s)0.21
0.28
0.37
0.10
0.21
0.20
0.22
0.20
0.23
0.22
0.18
0.24
0.22
0.13
0.20
Note:Countriesare
abbreviatedasfollows.
AT:Austria;BE:Belgium;CY:Cyprus;
DK:Denmark;FI:
Finland;FR:France;DE:Germany;IE
:Ireland;
IT:Italy;LU:Luxem
bourg;NL:TheNetherlands;PT:Portugal;ES:Spain;SE:Sweden;UK:TheUnited
Kingdom.
European Parliament Elections and Political Representation 1235
Dow
nloa
ded
by [
Uni
vers
iteit
Tw
ente
] at
01:
49 0
5 O
ctob
er 2
012
TABLE
3
RESULTSOF
CONFIR
MATORY
FACTOR
ANALYSIS
OF
POLIC
YPREFERENCES:FACTOR
LOADIN
GSBY
COUNTRY
FOR
CENTRAL
AND
EASTERN
EUROPE
Four-factorsolution
Three-factorsolution
Item
CZ
EE
PL
SK
SI
BU
HU
RO
Left/right
State
0.46
0.51
0.47
0.70
0.29
Left/right
0.55
0.58
0.51
Redistribution
0.51
0.28
0.33
0.38
0.23
0.54
0.37
0.34
Enterprise
70.27
70.33
70.57
70.45
70.30
70.44
70.15
70.52
Culture
Immigration
0.65
0.39
0.38
0.41
0.42
0.34
0.62
0.27
Sentences
0.33
0.41
0.53
0.18
0.16
70.05
0.29
0.32
Marriage
0.37
0.43
0.51
0.41
0.72
0.38
0.50
0.27
Abortion
70.04
70.02
70.28
0.02
70.39
70.12
70.15
70.07
EU
Trust
0.71
0.75
0.75
0.74
0.65
EU
0.82
0.78
0.66
Parliament
0.73
0.67
0.54
0.5
70.26
0.67
0.62
0.64
Referendum
70.31
70.14
70.38
70.17
70.26
70.15
70.38
70.29
Dem
ocracy
0.50
0.47
0.46
0.48
0.43
0.33
0.49
0.36
Style
(Meanloadingsacross
item
s)0.22
0.26
0.23
0.27
0.24
Style
0.26
0.31
0.28
Note:Countriesare
abbreviated
asfollows.
CZ:Czech
Republic;
EE:Estonia;PL:Poland;SK:Slovakia;SI:
Slovenia;BU:Bulgaria;HU:Hungary;
RO:Romania.
1236 R. Costello et al.
Dow
nloa
ded
by [
Uni
vers
iteit
Tw
ente
] at
01:
49 0
5 O
ctob
er 2
012
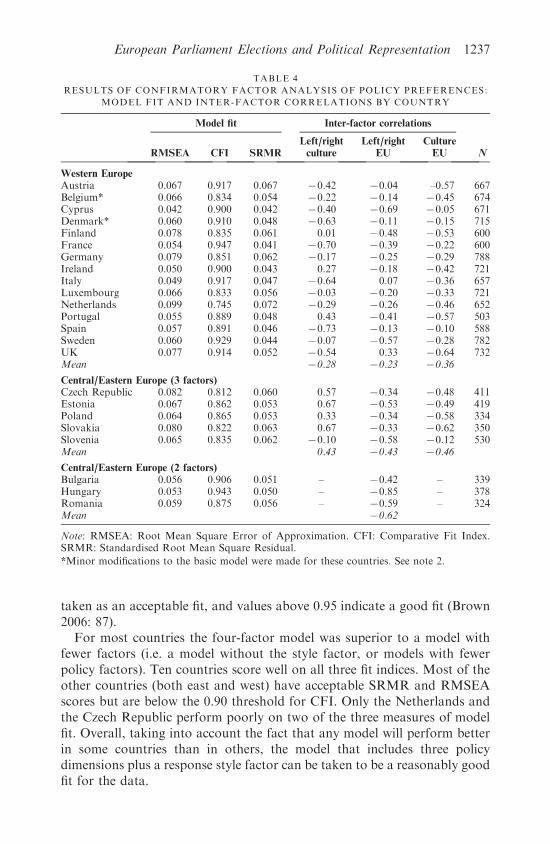
taken as an acceptable fit, and values above 0.95 indicate a good fit (Brown2006: 87).
For most countries the four-factor model was superior to a model withfewer factors (i.e. a model without the style factor, or models with fewerpolicy factors). Ten countries score well on all three fit indices. Most of theother countries (both east and west) have acceptable SRMR and RMSEAscores but are below the 0.90 threshold for CFI. Only the Netherlands andthe Czech Republic perform poorly on two of the three measures of modelfit. Overall, taking into account the fact that any model will perform betterin some countries than in others, the model that includes three policydimensions plus a response style factor can be taken to be a reasonably goodfit for the data.
TABLE 4
RESULTS OF CONFIRMATORY FACTOR ANALYSIS OF POLICY PREFERENCES:
MODEL FIT AND INTER-FACTOR CORRELATIONS BY COUNTRY
Model fit Inter-factor correlations
RMSEA CFI SRMR
Left/right
culture
Left/right
EU
Culture
EU N
Western Europe
Austria 0.067 0.917 0.067 70.42 70.04 –0.57 667Belgium* 0.066 0.834 0.054 70.22 70.14 70.45 674Cyprus 0.042 0.900 0.042 70.40 70.69 70.05 671Denmark* 0.060 0.910 0.048 70.63 70.11 70.15 715Finland 0.078 0.835 0.061 0.01 70.48 70.53 600France 0.054 0.947 0.041 70.70 70.39 70.22 600Germany 0.079 0.851 0.062 70.17 70.25 70.29 788Ireland 0.050 0.900 0.043 0.27 70.18 70.42 721Italy 0.049 0.917 0.047 70.64 0.07 70.36 657Luxembourg 0.066 0.833 0.056 70.03 70.20 70.33 721Netherlands 0.099 0.745 0.072 70.29 70.26 70.46 652Portugal 0.055 0.889 0.048 0.43 70.41 70.57 503Spain 0.057 0.891 0.046 70.73 70.13 70.10 588Sweden 0.060 0.929 0.044 70.07 70.57 70.28 782UK 0.077 0.914 0.052 70.54 0.33 70.64 732Mean 70.28 70.23 70.36
Central/Eastern Europe (3 factors)
Czech Republic 0.082 0.812 0.060 0.57 70.34 70.48 411Estonia 0.067 0.862 0.053 0.67 70.53 70.49 419Poland 0.064 0.865 0.053 0.33 70.34 70.58 334Slovakia 0.080 0.822 0.063 0.67 70.33 70.62 350Slovenia 0.065 0.835 0.062 70.10 70.58 70.12 530Mean 0.43 70.43 70.46
Central/Eastern Europe (2 factors)
Bulgaria 0.056 0.906 0.051 – 70.42 – 339Hungary 0.053 0.943 0.050 – 70.85 – 378Romania 0.059 0.875 0.056 – 70.59 – 324Mean 70.62
Note: RMSEA: Root Mean Square Error of Approximation. CFI: Comparative Fit Index.SRMR: Standardised Root Mean Square Residual.
*Minor modifications to the basic model were made for these countries. See note 2.
European Parliament Elections and Political Representation 1237
Dow
nloa
ded
by [
Uni
vers
iteit
Tw
ente
] at
01:
49 0
5 O
ctob
er 2
012
The direction and the strength of the correlations between the contentfactors are also of interest (see Table 4). The first thing to note is that thecorrelations are generally modest (there is only one instance of an inter-factor correlation above 0.80, which is sometimes taken as a cut-off point fordiscriminant validity; see Brown 2006: 32), supporting the conclusion thatthe three policy dimensions are indeed distinct. In terms of the direction ofthe relationships, there are notable differences between west and east. Fornearly all Western European countries, there is a negative correlationbetween the left/right and culture factors. Given the way the factors areoriented, this means those on the left on economic issues tend to be liberalon cultural issues, as expected. In contrast, there is a moderately strongpositive correlation between these two factors for nearly all countries inCentral and Eastern Europe (CEE). In line with the findings of Marks et al.(2006), this implies that economically leftist voters and candidates fromCEE countries are culturally conservative.
These differences between east and west are not found for the othercorrelations. For all countries, there is a negative correlation between theculture and EU factors, implying that culturally conservative respondentstend to be more Eurosceptic. There is also a negative correlation betweenthe left/right and EU factors for most countries, indicating that left-wingrespondents tend to be more opposed to EU integration. However, thisrelationship is quite weak in several Western European countries. This doesnot necessarily mean that the factors are not related, because the analysisfocuses on linear relationships and previous research identified a non-linearrelationship (Hooghe et al. 2004; Schmitt and Thomassen 2009). However,those findings concerned the EU as a whole and focused on the elite level. Atthe mass level and when focusing on individual countries, those patterns aremuch weaker (Rosema and de Vries 2011: 209).
To summarise, the confirmatory factor analysis shows that the attitudesof voters and candidates are not constrained by a single dimension. Rather,three separate policy dimensions were found to best capture the observedvariation: an economic left/right dimension, a cultural dimension and anEU dimension. In only three countries (Hungary, Bulgaria and Romania)two policy dimensions produced the best fit. Thus, the assumption implicitin the Responsible Party Model of representation – that the opinions ofvoters and representatives on all relevant issues are constrained by a singledimension – does not hold. This raises the possibility that the congruencebetween voters and representatives will be weak for certain types of issues.
Analysis of Policy Congruence between Voters and Representatives
We have argued that the level of agreement between voters and represen-tatives will vary across policy domains: issues that are related to the left/rightdimension are expected to be associated with higher levels of congruencethan issues that are independent of this dimension. To test these expectations,
1238 R. Costello et al.
Dow
nloa
ded
by [
Uni
vers
iteit
Tw
ente
] at
01:
49 0
5 O
ctob
er 2
012
we compare the positions of voters and candidates from each national partyon the three dimensions identified in the previous section. Factor scores(predicted values for each latent factor) are produced for each dimension onthe basis of the confirmatory factor analysis reported in the previous section.The advantage of using factor scores instead of additive indices is that theyenable us to control for acquiescence bias, as done in the above analysis. Thefactor scores are standardised variables with a mean of zero.
Policy congruence is analysed by determining how close each nationalparty is to its voters on each dimension.5 National party positions aremeasured as the mean position of their candidates. The proximity of partiesto their voters is measured as the mean absolute difference between theposition of each voter and the position of the party he or she voted for. Toincrease the reliability of the estimates, only parties that have at least fivecandidates and 40 voters with valid responses to all 11 items are included inthe analysis. So in countries where the response rate of the candidate surveywas low, several parties had to be excluded. This also applies to several smallparties, which did not meet the criterion of the voter survey. In addition, thefour countries for which an acceptable factor solution was not found(Greece, Malta, Lithuania and Latvia) are excluded. In total, 39 nationalparties meet all selection criteria and these are now focused on.
The policy congruence between voters and parties is presented in Figure 2.Each bar represents the mean absolute difference between a national partyand its voters on a particular dimension. The results are organised by partygroups and by country. The first panel gives the results for 12 partiesaffiliated with the centre-right European People’s Party (EPP). The differ-ence between parties and voters is smallest on the left/right dimension innearly all countries. The only exception is Slovakia, where the party isclosest to its voters on the culture dimension.
The second panel in Figure 2 shows the results for eight parties affiliatedwith the Progressive Alliance of Socialists and Democrats (S&D). Again,parties and their voters are found to match best on the left/right dimension,the only exceptions being Belgium and Germany, where parties are slightlycloser to their voters on the culture dimension. The pattern is repeated forparties affiliated with the Alliance of Liberals and Democrats for Europe(ALDE) and the Group of the Greens/European Free Alliance (Greens). Inboth cases, parties perform best on the left/right dimension in all but one ofthe countries analysed.
For the smaller party groups (the European Conservatives and ReformistsGroup (ECR), the Confederal Group of the European United Left–NordicGreen Left (EUL-NGL) and Europe of Freedom and Democracy Group(EFD)), there are very few national parties that meet our selection criteria.For four out of the five national parties included, the parties are closer totheir voters on the left/right dimension than on the other two dimensions.This is somewhat surprising, given the emphasis these parties typically placeon issues related to the other two dimensions. Because of the low number of
European Parliament Elections and Political Representation 1239
Dow
nloa
ded
by [
Uni
vers
iteit
Tw
ente
] at
01:
49 0
5 O
ctob
er 2
012
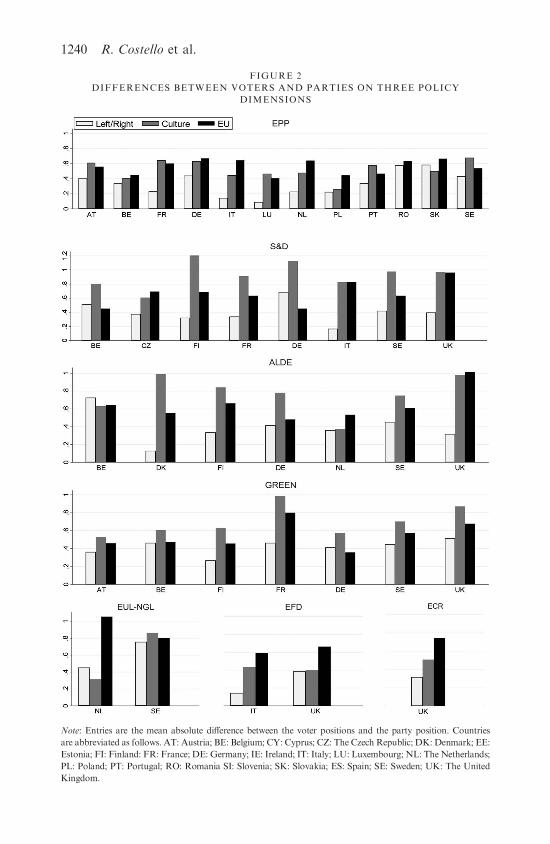
FIGURE 2
DIFFERENCES BETWEEN VOTERS AND PARTIES ON THREE POLICY
DIMENSIONS
Note: Entries are the mean absolute difference between the voter positions and the party position. Countries
are abbreviated as follows. AT: Austria; BE: Belgium; CY: Cyprus; CZ: The Czech Republic; DK: Denmark; EE:
Estonia; FI: Finland: FR: France; DE: Germany; IE: Ireland; IT: Italy; LU: Luxembourg; NL: The Netherlands;
PL: Poland; PT: Portugal; RO: Romania SI: Slovenia; SK: Slovakia; ES: Spain; SE: Sweden; UK: The United
Kingdom.
1240 R. Costello et al.
Dow
nloa
ded
by [
Uni
vers
iteit
Tw
ente
] at
01:
49 0
5 O
ctob
er 2
012
national parties, however, we cannot reach strong conclusions about theseparty groups.
The differences between positions of parties and their voters are illustratedin Figure 3, which plots the mean position of voters against the mean positionof candidates for each party on the three dimensions. When the meanpositions of candidates and voters for a particular party are the same, theparty will be placed on the 45 degree reference line. For the left/right dimen-sion, the mean positions of candidates and voters are relatively close together,with most parties placed on or close to the reference line. The differences thatexist follow a pattern, in that parties on the right (i.e. where the meancandidate has a high score on this dimension) tend to be slightly to the rightof their average voter, while parties on the left tend to be slightly to the left oftheir average voter. For the culture dimension, the mean position ofcandidates for most parties is higher than the mean position of their voters.Given the way this dimension is orientated, this indicates that candidates formost parties are more liberal than their voters on cultural issues.
For the EU dimension, the mean position of candidates is lower than thatof voters for most parties. This implies that candidates are typically more infavour of EU integration than their voters. The three outliers at the top rightcorner of the graph are parties associated with EUL-NGL and EFD, wherethe mean candidate position is strongly anti-EU. The average size of the gapbetween mean candidate and mean voter positions is 0.26 on the left/rightdimension, 0.52 on the culture dimension and 0.41 on the EU dimension.
The Compatibility of National Parties within Political Groups
So far, we have established that an important requirement for an effectiveprocess of political representation is not met. Instead of a single left/rightdimension three separate policy dimensions can be identified in most EUmember states, with different relationships between these dimensions forCEE and Western European countries. As expected, the congruencebetween parties and their voters is consistently higher on the economicleft/right dimension than on the culture and EU dimensions. In this section,we investigate whether the process of political representation is still effectivewhen transferred to the EU level. As argued above, this will only be the casewhen an additional requirement is met, i.e. when the policy positions of thenational parties from each political group are compatible. If national partiesrepresent their voters well on the left/right dimension and have similarpositions on this dimension to the other parties in their political group, thenwe can infer that the groups represent their voters well, albeit indirectly. In asimilar way, how well voters are represented on the culture and EUdimensions depends in part on how well national parties from the samepolitical group in the European Parliament match in those terms.
To estimate policy positions for national parties that are comparableacross countries, the confirmatory factor analysis model was applied to the
European Parliament Elections and Political Representation 1241
Dow
nloa
ded
by [
Uni
vers
iteit
Tw
ente
] at
01:
49 0
5 O
ctob
er 2
012
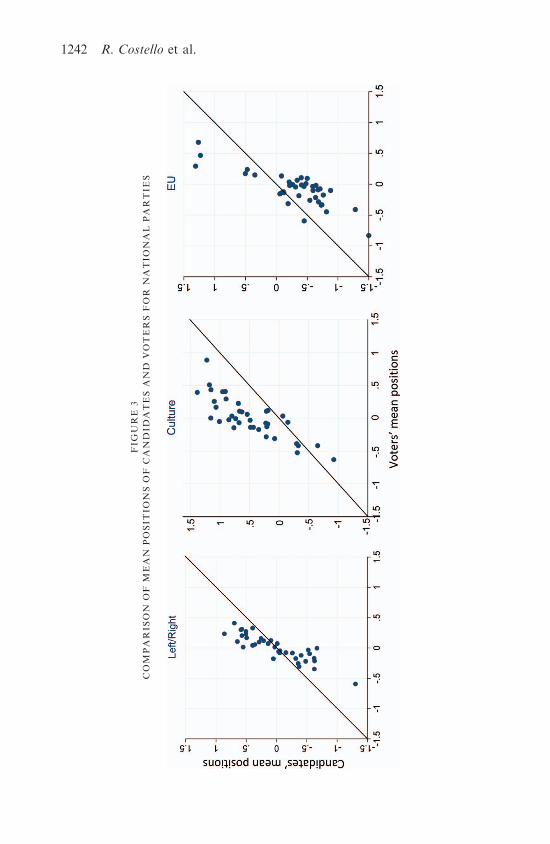
FIG
URE
3
COM
PARIS
ON
OF
MEAN
POSIT
IONSOF
CANDID
ATESAND
VOTERSFOR
NATIO
NAL
PARTIE
S
1242 R. Costello et al.
Dow
nloa
ded
by [
Uni
vers
iteit
Tw
ente
] at
01:
49 0
5 O
ctob
er 2
012
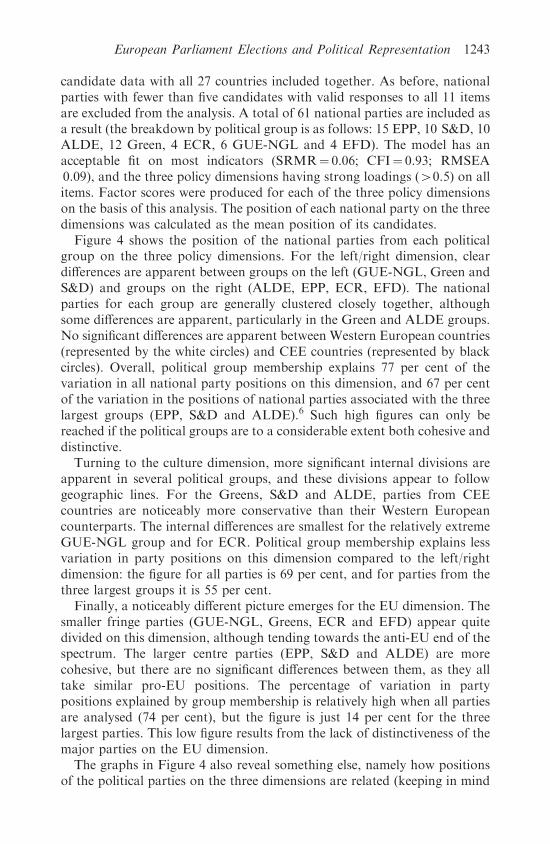
candidate data with all 27 countries included together. As before, nationalparties with fewer than five candidates with valid responses to all 11 itemsare excluded from the analysis. A total of 61 national parties are included asa result (the breakdown by political group is as follows: 15 EPP, 10 S&D, 10ALDE, 12 Green, 4 ECR, 6 GUE-NGL and 4 EFD). The model has anacceptable fit on most indicators (SRMR¼ 0.06; CFI¼ 0.93; RMSEA0.09), and the three policy dimensions having strong loadings (40.5) on allitems. Factor scores were produced for each of the three policy dimensionson the basis of this analysis. The position of each national party on the threedimensions was calculated as the mean position of its candidates.
Figure 4 shows the position of the national parties from each politicalgroup on the three policy dimensions. For the left/right dimension, cleardifferences are apparent between groups on the left (GUE-NGL, Green andS&D) and groups on the right (ALDE, EPP, ECR, EFD). The nationalparties for each group are generally clustered closely together, althoughsome differences are apparent, particularly in the Green and ALDE groups.No significant differences are apparent between Western European countries(represented by the white circles) and CEE countries (represented by blackcircles). Overall, political group membership explains 77 per cent of thevariation in all national party positions on this dimension, and 67 per centof the variation in the positions of national parties associated with the threelargest groups (EPP, S&D and ALDE).6 Such high figures can only bereached if the political groups are to a considerable extent both cohesive anddistinctive.
Turning to the culture dimension, more significant internal divisions areapparent in several political groups, and these divisions appear to followgeographic lines. For the Greens, S&D and ALDE, parties from CEEcountries are noticeably more conservative than their Western Europeancounterparts. The internal differences are smallest for the relatively extremeGUE-NGL group and for ECR. Political group membership explains lessvariation in party positions on this dimension compared to the left/rightdimension: the figure for all parties is 69 per cent, and for parties from thethree largest groups it is 55 per cent.
Finally, a noticeably different picture emerges for the EU dimension. Thesmaller fringe parties (GUE-NGL, Greens, ECR and EFD) appear quitedivided on this dimension, although tending towards the anti-EU end of thespectrum. The larger centre parties (EPP, S&D and ALDE) are morecohesive, but there are no significant differences between them, as they alltake similar pro-EU positions. The percentage of variation in partypositions explained by group membership is relatively high when all partiesare analysed (74 per cent), but the figure is just 14 per cent for the threelargest parties. This low figure results from the lack of distinctiveness of themajor parties on the EU dimension.
The graphs in Figure 4 also reveal something else, namely how positionsof the political parties on the three dimensions are related (keeping in mind
European Parliament Elections and Political Representation 1243
Dow
nloa
ded
by [
Uni
vers
iteit
Tw
ente
] at
01:
49 0
5 O
ctob
er 2
012
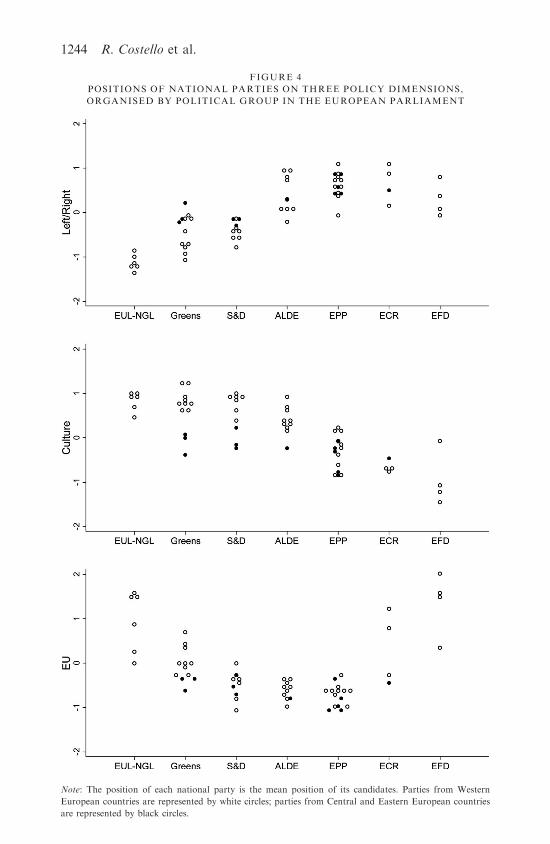
FIGURE 4
POSITIONS OF NATIONAL PARTIES ON THREE POLICY DIMENSIONS,
ORGANISED BY POLITICAL GROUP IN THE EUROPEAN PARLIAMENT
Note: The position of each national party is the mean position of its candidates. Parties from Western
European countries are represented by white circles; parties from Central and Eastern European countries
are represented by black circles.
1244 R. Costello et al.
Dow
nloa
ded
by [
Uni
vers
iteit
Tw
ente
] at
01:
49 0
5 O
ctob
er 2
012
that the positions of the groups are not always very clear due to internaldifferences). Comparing the first and second graphs, there is a generaltendency for political groups with parties that take leftist positions on theleft/right dimension to take liberal positions on the cultural dimension. Acomparison of the first and third graph reveals that at the elite level the left/right and EU dimensions are also related, though in a different way. Therelationship is not linear but follows the familiar pattern: party groups closeto the centre of the left/right dimension favour European integration morestrongly, whereas party groups further to the left and further to the righttake a more Eurosceptic position.
In conclusion, the coherence and compatibility of political groups ishighest on the left/right dimension, with most of the variation in positionsoccurring between rather than within political groups. The groups aregenerally more internally fragmented on the culture dimension, while for theEU dimension the largest groups are relatively cohesive, but not distinctive.
Conclusion
The system of political representation may be viewed as a means to establishthe democratic ideal of policy congruence between citizens and representa-tives, and ultimately congruence between citizens’ preferences and govern-ment policy (Powell 2000). In this paper we have examined how well thesystem of democratic representation works at the level of the EuropeanUnion. We have not only analysed policy congruence between voters andtheir representatives in the European Parliament, but also highlighted one ofthe conditions necessary to enable policy congruence between voters andrepresentatives: namely, that the attitudes of voters and positions of partieson the key issues are constrained by one ideological dimension. Theimplications of this were analysed in the context of the 2009 EuropeanParliament elections on the basis of voter and candidate data from theEuropean Election Study.
Confirmatory factor analysis of voters’ and candidates’ political opinionsrevealed that in fact this crucial condition is not met in the context ofelections to the European Parliament. In line with research on previousEuropean Parliament elections (Thomassen and Schmitt 1999), it was foundthat three dimensions were necessary to describe the policy attitudes ofvoters and candidates: an economic left/right dimension, a culturaldimension capturing attitudes towards a broad range of social issues, anda dimension capturing attitudes towards the EU. The correlations betweenthese dimensions are generally modest, particularly when voters alone areconsidered.
These findings have two important implications. First, the fact that policypreferences are not structured in terms of a single dimension implies that ifvoters would fully base their choice on their policy preferences, this still doesnot guarantee that parties in parliament will reflect the policy preferences of
European Parliament Elections and Political Representation 1245
Dow
nloa
ded
by [
Uni
vers
iteit
Tw
ente
] at
01:
49 0
5 O
ctob
er 2
012
their voters. Second, the fact that the dimensions are not highly correlated atthe mass level makes it difficult for political parties to organise in such a waythat citizens will find options that reflect their preferences on all threedimensions.
An analysis of the level of agreement between voters and parties on thethree policy dimensions confirms this. Congruence was found to be higheron the left/right dimension than on the culture and EU dimensions fornearly all of the national parties analysed. On the culture dimension, mostparties were found to have more liberal positions than their voters; while onthe EU dimension, most parties were found to have more pro-EU positionsthan their voters.
It has long been noted that a gap exists between political elites and theelectorate on issues of European integration. The findings here suggest thata substantial gap also exists on the cultural dimension. This may explain thesuccess of populist parties across Europe in mobilising voters on issuesrelated to this dimension. The sad news is that with policy preferences thatare weakly structured at the level of citizens, adequate representation ondifferent types of issues becomes difficult. However, representation can workwell on particular sets of issues. We found this to be the case on issuesrelated to the economic left/right dimension. As long as the majority of theEuropean Parliament’s legislative workload relates to economic issues suchas the regulation of the single market, European elections do fulfil animportant function in linking citizens’ and representatives’ policypreferences.
Notes
1. While ML assumes the data are continuous, it is generally found to work well on ordinal
data on at least 5-point scales (Harrington 2008). As a robustness check, an alternative
Weighted Least Squares estimation was also conducted. There is disagreement in the
literature as to which approach performs better in the presence of ordinal variables (Brown
2006: 388). However, the results from the two procedures were similar and the ML estimates
are reported here.
2. The exact same model was applied to each country, with two minor exceptions. For Belgium,
it was necessary to allow the ‘response style’ factor to load freely on the ‘parliament’ item in
order to achieve convergence. This might be explained by the fact that this question appeared
in a different part of the survey from most of the other items. For Denmark, it was necessary
to allow the covariation in the error terms for the ‘marriage’ and ‘abortion’ items to reach a
good model fit.
3. The items in the factor analysis are a mix of positively and negatively worded items, but a
perfectly balanced set was not available. To test if the response style factor does indeed
measure acquiescence, and not attitudes, we compare it with a balanced set of 18 items using
5-point scales in the candidate survey. We follow a procedure suggested by Billiet and
McClendon (2000: 622–3) and apply it to candidates from the UK (the country with the
highest number of candidates in the data, at 258). Acquiescence is measured using an
additive scale that identifies the number of items that respondents agreed with. When this
variable is included as an additional indicator for the response style factor in the
confirmatory factor analysis, the loading was very high (standardised loading¼70.93). This
supports the conclusion that the response style factor does indeed measure acquiescence.
1246 R. Costello et al.
Dow
nloa
ded
by [
Uni
vers
iteit
Tw
ente
] at
01:
49 0
5 O
ctob
er 2
012
4. The full model (with three policy factors plus the response style factor) did not achieve
convergence for these countries. Lack of convergence is a common problem with
confirmatory factor analysis, particularly with complex models (Brown 2006: 74). A simpler
model with two policy factors was not an acceptable fit, having several insignificant factor
loadings.
5. In a small number of cases, there are two or more parties from the same country affiliated
with a particular political group in the European Parliament. These parties are treated as one
single party in the present analysis.
6. This is based on the R2 of an analysis of variance of party positions, with party group
membership as the independent variable (cf. Schmitt and Thomassen 2009: 37).
References
American Political Science Association (1950). Toward a More Responsible Two-Party System.
New York: Rinehart & Company, Inc.
Benoit, K., and M. Laver (2006). Party Policy in Modern Democracies. Abingdon: Routledge.
Billiet, J.B., and J.M. McClendon (2000). ‘Modeling Acquiescence in Measurement Models for
Two Balanced Sets of Items’, Structural Equation Modeling, 7:4, 608–28.
Brown, T.A. (2006). Confirmatory Factor Analysis for Applied Research. New York: The
Guilford Press.
Downs, A. (1957). An Economic Theory of Democracy. New York: Harper.
Giebler, H., E. Haus, and B. Weßels (2010). 2009 European Election Candidate Study –
Codebook, Advance Release. Berlin: WZB.
Harrington, D. (2008). Confirmatory Factor Analysis. Oxford: Oxford University Press.
Hix, S., A.G. Noury, and G. Roland (2007). Democratic Politics in the European Parliament.
Cambridge: Cambridge University Press.
Hooghe, L., G. Marks, and C. Wilson (2004). ‘Does Left/Right Structure Party Positions on
European Integration?’, in G. Marks and M. Steenbergen (eds.), European Integration and
Political Conflict. Cambridge: Cambridge University Press, 120–40.
Huber, J., and G.B. Powell (1994). ‘Congruence between Citizens and Policymakers in Two
Versions of Liberal Democracy’, World Politics, 46:3, 291–326.
Katz, R.S. (1997). Democracy and Elections. New York: Oxford University Press.
Kitschelt, H. (1994). The Transformation of European Social Democracy. Cambridge:
Cambridge University Press.
Kriesi, H., H. Grande, R. Lachat, M. Dolezal, S. Bornschier, and T. Frey (2006). ‘Globalization
and the Transformation of the National Political Space: Six European Countries Compared’,
European Journal of Political Research, 45:6, 921–56.
Kriesi, H., E. Grande, R. Lachat, M. Dolezal, S. Bornschier, and T. Frey (2008). West
European Politics in the Age of Globalization. Cambridge: Cambridge University Press.
Lipset, S.M. (1966). Political Man. London: Mercury Books.
Marks, G., L. Hooghe, M. Nelson, and E. Edwards (2006). ‘Party Competition and European
Integration in the East and West: Different Structure, Same Causality’, Comparative Political
Studies, 39:4, 155–75.
McClendon, M.K. (1991). ‘Acquiescence and Recency Response-Order Effects in Interview
Surveys’, Sociological Methods and Research, 20:1, 60–103.
McElroy, G., and K. Benoit (2007). ‘Party Groups and Policy Positions in the European
Parliament’, Party Politics, 13:1, 5–28.
Powell, G.B. (2000). Elections as Instruments of Democracy. Majoritarian and Proportional
Visions. New Haven, CT: Yale University Press.
Rosema, M., and C.E. de Vries (2011). ‘Assessing the Quality of European Democracy: Are
Voters Voting Correctly?’, in M. Rosema, B. Denters and K. Aarts (eds.), How Democracy
Works: Political Representation and Policy Congruence in Modern Societies (Essays in Honour
of Jacques Thomassen). Amsterdam: Amsterdam University Press/Pallas Publications,
199–219.
European Parliament Elections and Political Representation 1247
Dow
nloa
ded
by [
Uni
vers
iteit
Tw
ente
] at
01:
49 0
5 O
ctob
er 2
012
Sani, G., and G. Sartori (1983). ‘Polarisation, Fragmentation and Competition in Western
Democracies’, in H. Daalder and P. Mair (eds.),Western European Party Systems: Continuity
and Change. Beverly Hills and London: Sage, 307–40.
Schmitt, H., and J. Thomassen (2009). ‘The European Party System after Enlargement’, in J.
Thomassen (ed.), The Legitimacy of the European Union after Enlargement. Oxford: Oxford
University Press, 23–43.
Thomassen, J.J.A. (1994). ‘Empirical Research into Political Representation: Failing
Democracy or Failing Models’, in M.K. Jennings and T.E. Mann (eds.), Elections at
Home and Abroad: Essays in Honor of Warren Miller. Ann Arbor: University of Michigan
Press, 237–64.
Thomassen, J.J.A. (1999). ‘Political Communication between Political Elites and Mass Publics:
The Role of Belief Systems’, in W. Miller, R. Pierce, J. Thomassen, R. Herrera, S. Holmberg,
P. Esaiasson and B. Wessels (eds.), Policy Representation in Western Democracies. Oxford:
Oxford University Press, 33–58.
Thomassen, J.J.A., and H. Schmitt (1999). ‘Partisan Structures in the European Parliament’, in
R.M. Katz and B. Wessels (eds.), The European Parliament, the National Parliaments, and
European Integration. Oxford: Oxford University Press, 129–48.
Van der Brug, W., and C. van der Eijk (1999). ‘The Cognitive Basis of Voting’, in H. Schmitt
and J.J.A. Thomassen (eds.), Political Representation and Legitimacy in the European Union.
Oxford: Oxford University Press, 129–60.
Van der Brug, W., M. Franklin, M. Popescu, and G. Toka (2009). ‘Towards a European
Electorate: One Electorate or Many?’, in J.J.A. Thomassen (ed.), The Legitimacy of the
European Union after Enlargement. Oxford: Oxford University Press, 65–88.
Van der Eijk, C., M. Franklin, and E. Oppenhuis (1996). ‘The Strategic Context: Party Choice’,
in C. Van der Eijk and M.N. Franklin (eds.), Choosing Europe? The European Electorate and
National Politics in the Face of the Union. Ann Arbor: University of Michigan Press, 332–65.
Van der Eijk, C., H. Schmitt, and T. Binder (2005). ‘Left–Right Orientations and Party Choice’,
in J. Thomassen (ed.), The European Voter. Oxford: Oxford University Press, 167–91.
Van Egmond, M.H., E.V. Sapir, W. van der Brug, S.B. Hobolt, and M.N. Franklin (2010). EES
2009 Voter Study Advance Release Notes. Amsterdam: University of Amsterdam.
Voeten, E. (2009). ‘Enlargement and the ‘‘Normal’’ European Parliament’, in J.J.A. Thomassen
(ed.), The Legitimacy of the European Union after Enlargement. Oxford: Oxford University
Press, 93–114.
Welkenhuysen-Gybels, J., J. Billiet, and B. Cambre (2003). ‘Adjustment for Acquiescence in the
Assessment of the Construct Equivalence of Likert-type Score Items’, Journal of Cross-
Cultural Psychology, 34:6, 702–22.
1248 R. Costello et al.
Dow
nloa
ded
by [
Uni
vers
iteit
Tw
ente
] at
01:
49 0
5 O
ctob
er 2
012