Embed Size (px)
Citation preview
ANALYST CERTIFICATIONS AND IMPORTANT DISCLOSURES ARE IN THE DISCLOSURE APPENDIX. FOR OTHER IMPORTANT DISCLOSURES, PLEASE REFER TO https://firesearchdisclosure.credit-suisse.com.
CREDIT SUISSE SECURITIES RESEARCH & ANALYTICS BEYOND INFORMATION®
Client-Driven Solutions, Insights, and Access
European Strategy and Trades Interest Rate Strategy
ECB – from hero to zero • EFSF/ESM secondary market interventions are unlikely to work. On the
other hand, primary market interventions for Spain, we believe, could be more interesting, and have the potential to allow the easier market conditions to continue for a few months. This, therefore, means that Spain will soon need a full sovereign bailout.
• The cut in both the refinancing and deposit rate by the ECB is expected to support risk-on sentiment on the margin. We expect further rate action by the end of the quarter and recommend shifting our long position from the 2y1y to the 4y1y point on the EONIA curve.
European Governments: The significant coupon and redemption cash in July supports the core and soft core over the periphery. We analyse French performance around redemptions and find that is does not necessarily outperform Germany. We keep our short in 10Y France versus 10Y Germany.
UK Strategy: The MPC extended QE by £50bn, slightly less than we expected. The buyback baskets were kept the same, which led to a sharp steepening of the curve. We recommend taking profits in long-end GBP outperformance trades versus EUR following the announcement. We also recommend taking profits in our pay 2y1y SONIA versus EONIA trade. Given the schedule of buybacks and supply next week, we expect the 10y sector to underperform the wings. We recommend selling the new UKT 1T 22s versus the 1T 17s and the 4Q 32s. Derivatives Strategy: In the long end in EUR swaps we analyze curve trades between forwards such as the 15y5y-20y15y. We find the flatteners attractive but only in a multi-year horizon. Our rationale is that over a long horizon, carry, positive convexity and current entry level are more significant than the near-term flows. We recommend an EUR 2s5s 1y fwd flattener versus a CHF steepener. We recommend closing the receiving EUR 3s7s15s, short EUR 3m2y straddles and the L-ER U3-U4 box recommendations. Money Market Strategy: We review the LIBOR submission process. We do not see a systematic bias in the submissions based on a comparison between fixings and OIS plus CDS. However, we do think that the volatility of fixings is perhaps too low. The potential uncertainty about changes in the LIBOR (or Euribor) submission mechanism as well as risks in the reform process cause an upward bias in the top-left vol grid from current levels. We recommend buying EUR 2y1y straddles outright or versus 2y10y. Covered Bonds: In the context of the debate about bail-in, it is being discussed that in order for bail-in to be a credible resolution tool, there must be a sufficient amount of bail-in-able securities. In order to address lingering concerns about insufficient bail-in-able securities, consideration may also be given to limit the use of non-bail-in-able securities or the level of asset encumbrance. We are providing an overview of the different covered bond issuance limits. Technicals: 10yr Germany to outperform 30s and 5s.
06 July 2012 Fixed Income Research
http://www.credit-suisse.com/researchandanalytics
Research Analysts
Michelle Bradley +44 20 7888 5468
Panos Giannopoulos +44 20 7883 6947
Helen Haworth +44 20 7888 0757
Thushka Maharaj +44 20 7883 0211
Marion Pelata +44 20 7883 1333
David Sneddon +44 20 7888 7173
Florian Weber +44 20 7888 3779
Sabine Winkler +44 20 7883 9398
06 July 2012
European Strategy and Trades 2
Table of Contents Summary of views 3
New trade recommendations 4
Trade Performance 5
Events Calendar 6
ECB – from hero to zero 7
Post-summit thoughts - Over-hyping the ESM ........................................ 7 ECB delivers but disappoints ................................................................ 10
European Governments 12
Coupons and Redemptions to support the core in July ......................... 12
UK Strategy 14
Repeat and rewind …..same tune from the MPC .................................. 14
Derivatives Strategy 17
Long end - EUR swaps ......................................................................... 17 EUR 2s5s 1y fwd flattener versus CHF steepener ................................ 19 Model portfolio management ................................................................. 20
Money Market Strategy 21
LIBOR story – Analyzing the Euribor fixings ......................................... 21
Covered Bonds 23
Bail-in-able debt maximum, or non-bail-in-able debt limit ..................... 23 Unlike business models, and no uniform issuance limit ........................ 23 Different recovery rates, credit ratings, and debt prices ........................ 25
Technicals 26
10yr Germany to outperform 30s and 5s ............................................... 26
EUR and UK Supply Analysis 27
Forecasts 32
06 July 2012
European Strategy and Trades 3
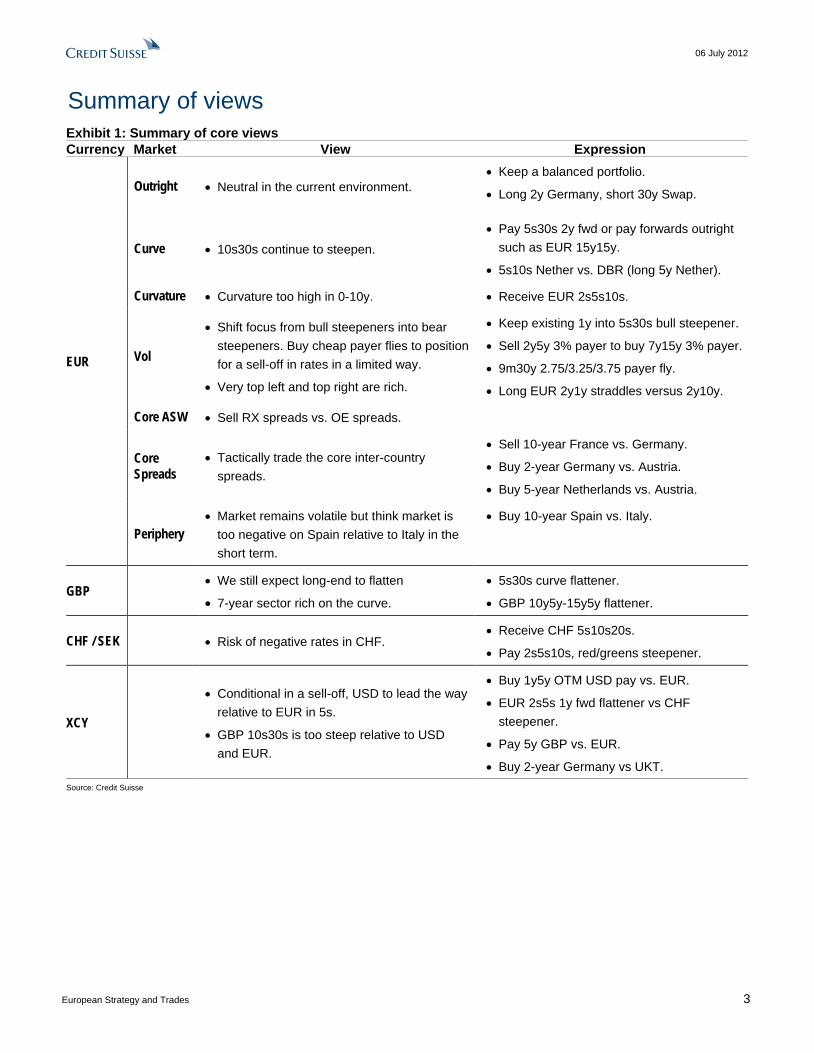
Summary of views Exhibit 1: Summary of core views Currency Market View Expression
EUR
Outright • Neutral in the current environment. • Keep a balanced portfolio.
• Long 2y Germany, short 30y Swap.
Curve • 10s30s continue to steepen. • Pay 5s30s 2y fwd or pay forwards outright
such as EUR 15y15y.
• 5s10s Nether vs. DBR (long 5y Nether).
Curvature • Curvature too high in 0-10y. • Receive EUR 2s5s10s.
Vol
• Shift focus from bull steepeners into bear steepeners. Buy cheap payer flies to position for a sell-off in rates in a limited way.
• Very top left and top right are rich.
• Keep existing 1y into 5s30s bull steepener.
• Sell 2y5y 3% payer to buy 7y15y 3% payer.
• 9m30y 2.75/3.25/3.75 payer fly.
• Long EUR 2y1y straddles versus 2y10y.
Core ASW • Sell RX spreads vs. OE spreads.
Core Spreads
• Tactically trade the core inter-country spreads.
• Sell 10-year France vs. Germany.
• Buy 2-year Germany vs. Austria.
• Buy 5-year Netherlands vs. Austria.
Periphery • Market remains volatile but think market is
too negative on Spain relative to Italy in the short term.
• Buy 10-year Spain vs. Italy.
GBP • We still expect long-end to flatten
• 7-year sector rich on the curve. • 5s30s curve flattener.
• GBP 10y5y-15y5y flattener.
CHF / SEK
• Risk of negative rates in CHF. • Receive CHF 5s10s20s.
• Pay 2s5s10s, red/greens steepener.
XCY
• Conditional in a sell-off, USD to lead the way
relative to EUR in 5s.
• GBP 10s30s is too steep relative to USD and EUR.
• Buy 1y5y OTM USD pay vs. EUR.
• EUR 2s5s 1y fwd flattener vs CHF steepener.
• Pay 5y GBP vs. EUR.
• Buy 2-year Germany vs UKT. Source: Credit Suisse

06 July 2012
European Strategy and Trades 4
New trade recommendations New trades we recommend this week
• Sell UKT 1T 22s versus 1t 17s and 4q 32s
• EUR 15y5y-20y15y flattener as a multi-year horizon trade
• EUR 2s5s 1y fwd flattener vs CHF steepener
• Long EUR 2y1y straddles versus 2y10y
• Receive 4y1y Eonia
Positions we recommend closing this week • Close pay EUR30y vs GBP
• Close pay EUR 15y15y vs GBP
• Close short EUR 3m2y straddles
• Close receiving EUR 3s7s15s
• Close ERU2H3 steepener at flat
• Close ER U3-U4 flattener versus L U3-U4 steepener
• Close 2y1y Eonia
• Close pay 2y1y Sonia vs Eonia
06 July 2012
European Strategy and Trades 5
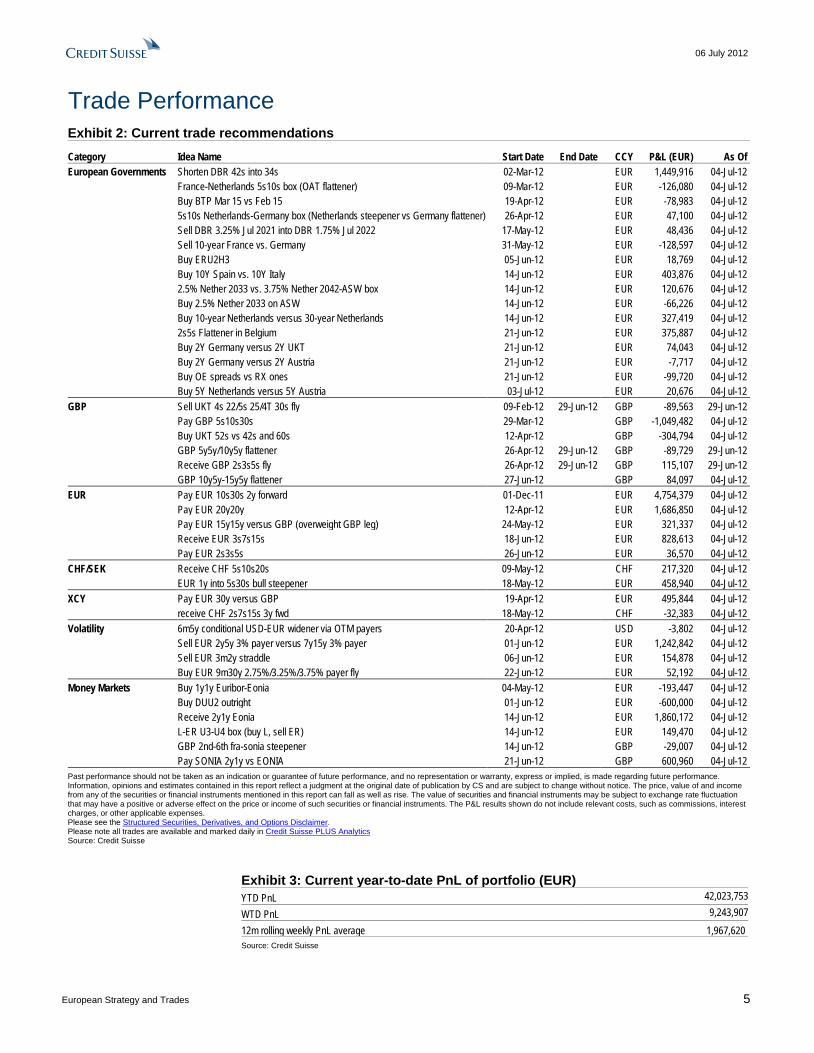
Trade Performance Exhibit 2: Current trade recommendations Category Idea Name Start Date End Date CCY P&L (EUR) As Of European Governments Shorten DBR 42s into 34s 02-Mar-12 EUR 1,449,916 04-Jul-12 France-Netherlands 5s10s box (OAT flattener) 09-Mar-12 EUR -126,080 04-Jul-12 Buy BTP Mar 15 vs Feb 15 19-Apr-12 EUR -78,983 04-Jul-12 5s10s Netherlands-Germany box (Netherlands steepener vs Germany flattener) 26-Apr-12 EUR 47,100 04-Jul-12 Sell DBR 3.25% Jul 2021 into DBR 1.75% Jul 2022 17-May-12 EUR 48,436 04-Jul-12 Sell 10-year France vs. Germany 31-May-12 EUR -128,597 04-Jul-12 Buy ERU2H3 05-Jun-12 EUR 18,769 04-Jul-12 Buy 10Y Spain vs. 10Y Italy 14-Jun-12 EUR 403,876 04-Jul-12 2.5% Nether 2033 vs. 3.75% Nether 2042-ASW box 14-Jun-12 EUR 120,676 04-Jul-12 Buy 2.5% Nether 2033 on ASW 14-Jun-12 EUR -66,226 04-Jul-12 Buy 10-year Netherlands versus 30-year Netherlands 14-Jun-12 EUR 327,419 04-Jul-12 2s5s Flattener in Belgium 21-Jun-12 EUR 375,887 04-Jul-12 Buy 2Y Germany versus 2Y UKT 21-Jun-12 EUR 74,043 04-Jul-12 Buy 2Y Germany versus 2Y Austria 21-Jun-12 EUR -7,717 04-Jul-12 Buy OE spreads vs RX ones 21-Jun-12 EUR -99,720 04-Jul-12 Buy 5Y Netherlands versus 5Y Austria 03-Jul-12 EUR 20,676 04-Jul-12 GBP Sell UKT 4s 22/5s 25/4T 30s fly 09-Feb-12 29-Jun-12 GBP -89,563 29-Jun-12 Pay GBP 5s10s30s 29-Mar-12 GBP -1,049,482 04-Jul-12 Buy UKT 52s vs 42s and 60s 12-Apr-12 GBP -304,794 04-Jul-12 GBP 5y5y/10y5y flattener 26-Apr-12 29-Jun-12 GBP -89,729 29-Jun-12 Receive GBP 2s3s5s fly 26-Apr-12 29-Jun-12 GBP 115,107 29-Jun-12 GBP 10y5y-15y5y flattener 27-Jun-12 GBP 84,097 04-Jul-12 EUR Pay EUR 10s30s 2y forward 01-Dec-11 EUR 4,754,379 04-Jul-12 Pay EUR 20y20y 12-Apr-12 EUR 1,686,850 04-Jul-12 Pay EUR 15y15y versus GBP (overweight GBP leg) 24-May-12 EUR 321,337 04-Jul-12 Receive EUR 3s7s15s 18-Jun-12 EUR 828,613 04-Jul-12 Pay EUR 2s3s5s 26-Jun-12 EUR 36,570 04-Jul-12 CHF/SEK Receive CHF 5s10s20s 09-May-12 CHF 217,320 04-Jul-12 EUR 1y into 5s30s bull steepener 18-May-12 EUR 458,940 04-Jul-12 XCY Pay EUR 30y versus GBP 19-Apr-12 EUR 495,844 04-Jul-12 receive CHF 2s7s15s 3y fwd 18-May-12 CHF -32,383 04-Jul-12 Volatility 6m5y conditional USD-EUR widener via OTM payers 20-Apr-12 USD -3,802 04-Jul-12 Sell EUR 2y5y 3% payer versus 7y15y 3% payer 01-Jun-12 EUR 1,242,842 04-Jul-12 Sell EUR 3m2y straddle 06-Jun-12 EUR 154,878 04-Jul-12 Buy EUR 9m30y 2.75%/3.25%/3.75% payer fly 22-Jun-12 EUR 52,192 04-Jul-12 Money Markets Buy 1y1y Euribor-Eonia 04-May-12 EUR -193,447 04-Jul-12 Buy DUU2 outright 01-Jun-12 EUR -600,000 04-Jul-12 Receive 2y1y Eonia 14-Jun-12 EUR 1,860,172 04-Jul-12 L-ER U3-U4 box (buy L, sell ER) 14-Jun-12 EUR 149,470 04-Jul-12 GBP 2nd-6th fra-sonia steepener 14-Jun-12 GBP -29,007 04-Jul-12 Pay SONIA 2y1y vs EONIA 21-Jun-12 GBP 600,960 04-Jul-12 Past performance should not be taken as an indication or guarantee of future performance, and no representation or warranty, express or implied, is made regarding future performance. Information, opinions and estimates contained in this report reflect a judgment at the original date of publication by CS and are subject to change without notice. The price, value of and income from any of the securities or financial instruments mentioned in this report can fall as well as rise. The value of securities and financial instruments may be subject to exchange rate fluctuation that may have a positive or adverse effect on the price or income of such securities or financial instruments. The P&L results shown do not include relevant costs, such as commissions, interest charges, or other applicable expenses. Please see the Structured Securities, Derivatives, and Options Disclaimer. Please note all trades are available and marked daily in Credit Suisse PLUS Analytics Source: Credit Suisse
Exhibit 3: Current year-to-date PnL of portfolio (EUR) YTD PnL 42,023,753 WTD PnL 9,243,907 12m rolling weekly PnL average 1,967,620 Source: Credit Suisse

06 July 2012
European Strategy and Trades 6
Events Calendar Exhibit 4: Meetings, economic events, auctions and redemptions Date Day Meetings / Events Economic Data Auctions Redemptions Ctry Type € bn Ctry Type € bn
09/07/2012 Mon The ECB announces the amount of bonds it settled over the last week US Consumer Credit (May) SK SLOVGB 25 0.3*
Eurogroup meeting DE Current Account/Trade Balance (May) FR Bank of France Business Sentiment (Jun) EA Sentix Investor Confidence (Jul) UK Lloyds Employment Confidence (Jun)
10/07/2012 Tue FR Industrial & Manufacturing Production (May) NL DSL 2015 3.0* IT Industrial Production (May) UK BRC Sales Like-for-Like (Jun) UK Industrial Production & Trade Balance (May) UK NIESR GDP Estimate (Jun)
11/07/2012 Wed Minutes of FOMC Meeting US Trade Balance & Wholesale Inventories(May) DE Bund 2022 4.0 DE Bubill 4.0 DE/FR Consumer Price Index (Jun)
12/07/2012 Thu ECB Publishes July monthly Report US Initial Jobless Claims (July 7) FR OAT 16.15 US Import Price Index &Treasury Statement(Jun) FR BTF 7.9 EA Euro Area Industrial Production (May) BE BGB 20Y* 0.25* PT PTB 1.0
13/07/2012 Fri US PPI/Core PPI (Jun) IT BTP 7Y* 2.5* GR GTB 2.0 US University of Michigan Confidence (Jul P) IT BTP 3Y* 3.0* MA MATB 0.03 IT CPI (Jun)
16/07/2012 Mon The ECB announces the amount of bonds it settled over the last week US Empire Manufacturing (Jul) AT RAGB 10.18
US Retail Sales/Ex Autos (Jun) NL DSL 15.01 US Business Inventories (May) IT BOT 10.43 IT Trade Balance (May) EA CPI (Jun)
17/07/2012 Tue Fed’s Beige Book US CPI/Core CPI (Jun) US Industrial Prod/Cap Utilization (Jun) US Manufacturing Production (Jun) US NHB Housing Market Index (Jul) DE/EA ZEW Survey (Jul) UK CPI & RPI (Jun) UK CBI Trends Total Orders (Jul) (17-25)
18/07/2012 Wed BoE Minutes US Housing Starts/Permits (Jun) DE Schatz 2014 5.0 EA Construction Output (May) IT Current Account (May) UK Claimant Count Rate (Jun) UK Jobless Claims Change (Jun) UK Average Weekly Earnings (May) UK ILO Unemployment Rate (May) UK Employment Change (May)
19/07/2012 Thu US Initial Jobless Claims (Jul 14) FR BTAN 3Y* 1.5* BE BTB 5.02 US Philadelphia Fed (Jul) FR BTAN 4Y* 1.5* FR BTF 8.22 US Existing Home Sales (Jun) FR OAT 5Y* 1.5* US Leading Indicators (Jun) FR OATei 30Y* 1.8* EA Current Account (May) ES SPGB 5Y* 1.0* IT Industrial Orders/Sales (May) ES SPGB 10Y* 1.0* BE Consumer Confidence (Jul) UK Retail Sales (Jun)
20/07/2012 Fri DE PPI (Jun) ES SPGB 0.34 UK PSNCR/PSNB (Jun) ES SGLT 6.09 GR GTB 2.0 PT PTB 2.34 MA MATB 0.005
Source: Credit Suisse, National Treasuries, ECB, Bank of England, the BLOOMBERG PROFESSIONAL™ service

06 July 2012
European Strategy and Trades 7
ECB – from hero to zero Post-summit thoughts - Over-hyping the ESM The summit announcement that came out in the early hours of last Friday morning was largely in line with our expectations – the market had become overly pessimistic, and policymakers were able to announce something that allowed for a more constructive post-summit risk environment. As usual, and as expected, the details were rather scarce, however – and those that were disclosed do not support the more positive headlines that immediately followed the announcement, in our opinion.
Following the summit, the ECB responded with a 25bp cut in the refinancing rate and the deposit rate. On the margin, this is expected to support risk sentiment. But this is not sufficient to sustain any recovery in risk sentiment, in our view. In fact, despite the historic move by the ECB, the market reacted negatively as it was clear that the ECB is in no hurry to extend unconventional measures further. President Draghi was clear that the ECB will only react within the limits of its mandate, which is solely price stability. We maintain our view that the ECB will cut rates further this quarter and recommend shifting longs from the 2y1y point to the 4y1y point on the EONIA curve .
Despite President Draghi’s reluctance to extend a banking license to the ESM, we think that ultimately this will be needed to support the periphery. Below we discuss the futility of EFSF/ESM secondary market purchases and keep our view that Spain will soon require a sovereign bailout. We also outline the main measures announced by the ECB and discuss its evolving role as a banking supervisor.
EFSF/ESM secondary market interventions unlikely to work, in our view We continue to think that neither the EFSF nor the ESM are suitable vehicles for secondary market bond purchases – as discussed in our last two weeklies, we believe such a development would be doomed to fail due to the fact that:
• Both the EFSF and ESM need to fund to support the debt purchases – their ability to do so in size is not at all evident.
• The total capacity of both vehicles is far too small for the market to believe the intervention can work, and therefore bondholders would likely use any rally related to the announcement to sell, swamping the ability of the EFSF/ESM to buy.
• EFSF/ESM purchases will raise concerns over subordination of remaining bondholders in the event of a potential future debt restructuring based on the precedent set for Greece.
We would also caution the view that any such purchases are imminent – for a country’s debt to be eligible for primary or secondary market support, the country needs to request the support, and a Memorandum of Understanding (MoU) needs to be agreed with the European Commission, in liaison with the ECB and wherever possible, the IMF. Conditionality would be lighter for primary or secondary market support than for a full support package (such as that provided for Greece, Ireland, Portugal and shortly Cyprus) but the MoU still needs to be agreed and signed.
Intervention is more likely for Spain than Italy We think this is more likely for Spain than Italy since conditions are already being drawn up for Spain’s bank bailout facility. The fact this looks like it may be delayed beyond 9 July as originally planned highlights the risks of timetables slipping, but extending the MoU for Spain to benefit from market support, or agreeing on an additional one simultaneously, would seem feasible.
Unless Italian yields come under further pressure, however, we are not convinced that Italy is likely to want to go down a similar path – albeit the condtionality may be very light. In our mind, this would mark the first, clear step towards an Italian bailout, something we believe Italy (and others!) is keen to avoid for the time being.
Helen Haworth +44 20 7888 0757
06 July 2012
European Strategy and Trades 8
Primary market interventions are more interesting Primary market interventions for Spain, we believe, could be more interesting, and have the potential to allow the easier market conditions to continue for a few months. Since the sovereign issuance needs are (broadly) known, it is clear roughly how much the EFSF/ESM would need to underwrite for Spain not to face a liquidity crunch until year-end. Against this backdrop, secondary market price action is likely to be supportive, at least initially, with few willing to stay short while funding needs are covered.
Like every other measure so far, however, ultimately it would be purely a stop-gap measure since the EFSF/ESM do not have the capacity to fully fund Spain for the next few years while market confidence is restored. Absent something more meaningful at the euro area level, we therefore continue to think that it is a matter of when Spain needs to enter a full support package – built out from the proposed bank bailout and potentially primary/secondary market intervention packages if agreement can be reached with all concerned to go down this route. On current trends, we would expect a full Spanish bailout within three months; sooner if policy doesn’t continue to evolve.
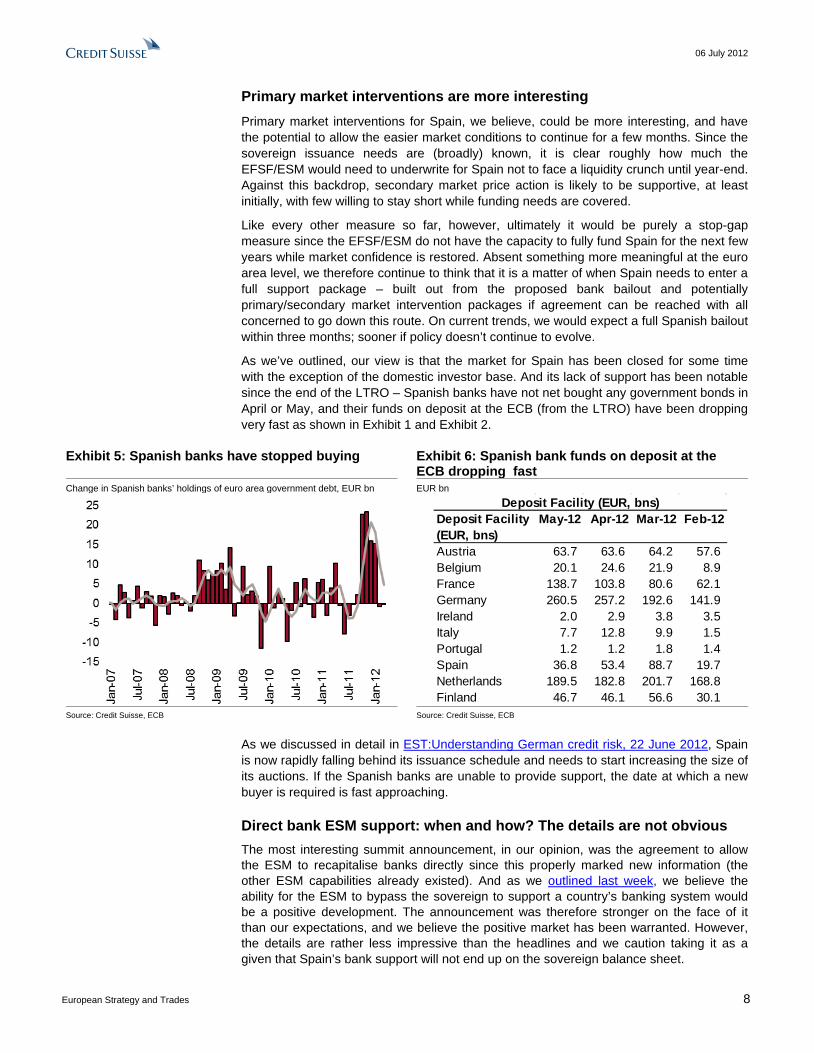
As we’ve outlined, our view is that the market for Spain has been closed for some time with the exception of the domestic investor base. And its lack of support has been notable since the end of the LTRO – Spanish banks have not net bought any government bonds in April or May, and their funds on deposit at the ECB (from the LTRO) have been dropping very fast as shown in Exhibit 1 and Exhibit 2.
Exhibit 5: Spanish banks have stopped buying Exhibit 6: Spanish bank funds on deposit at the ECB dropping fast
Change in Spanish banks’ holdings of euro area government debt, EUR bn EUR bn
Deposit Facility (EUR, bns)
May-12 Apr-12 Mar-12 Feb-12
Austria 63.7 63.6 64.2 57.6 Belgium 20.1 24.6 21.9 8.9 France 138.7 103.8 80.6 62.1 Germany 260.5 257.2 192.6 141.9 Ireland 2.0 2.9 3.8 3.5 Italy 7.7 12.8 9.9 1.5 Portugal 1.2 1.2 1.8 1.4 Spain 36.8 53.4 88.7 19.7 Netherlands 189.5 182.8 201.7 168.8 Finland 46.7 46.1 56.6 30.1
Deposit Facility (EUR, bns)
Source: Credit Suisse, ECB Source: Credit Suisse, ECB
As we discussed in detail in EST:Understanding German credit risk, 22 June 2012, Spain is now rapidly falling behind its issuance schedule and needs to start increasing the size of its auctions. If the Spanish banks are unable to provide support, the date at which a new buyer is required is fast approaching.
Direct bank ESM support: when and how? The details are not obvious The most interesting summit announcement, in our opinion, was the agreement to allow the ESM to recapitalise banks directly since this properly marked new information (the other ESM capabilities already existed). And as we outlined last week, we believe the ability for the ESM to bypass the sovereign to support a country’s banking system would be a positive development. The announcement was therefore stronger on the face of it than our expectations, and we believe the positive market has been warranted. However, the details are rather less impressive than the headlines and we caution taking it as a given that Spain’s bank support will not end up on the sovereign balance sheet.
06 July 2012
European Strategy and Trades 9
In the first instance – Spain is going to need support well before the ESM is able to act directly to support the banks. Even if the ESM is ratified within a few weeks (and we continue to expect the German Constitutional Court to rule favourably – see last week’s publication), a single supervisor first needs to be set up – which per the summit text will be considered “as a matter of urgency by the end of 2012”. Too late for Spain. We defer to another time a discussion of how the supervision may work – the details there are not obvious, with clear potential conflicts of interest and differing priorities that may make reaching an agreement difficult.
It isn’t also particularly clear, in our view, that the ESM Treaty can easily be changed to allow the ESM to support banks directly without broader parliamentary approval. The European Commission has clearly stated that changes are possible under Article 19 of the ESM Treaty allowing the Board of Governors “to make changes to the list of financial assistance instruments” – and hence expand the capabilities. However, the whole Treaty is based on the idea of “providing stability support to an ESM Member” (Article 12), and membership is open to “Member States of the European Union” (Article 2). So the issues are rather grey, in our view, and there is at the minimum the potential for some negative headlines out of some of the core euro area countries.
Contrary to expectations, there was also no mention in the summit of plans for euro area-wide deposit guarantee and resolution schemes despite the fact they were proposed beforehand. There seems to have been little focus on this point, but as we discussed last week, in our view, the bank supervision and ESM support for the banks are likely to need to proceed hand-in-hand with a deposit guarantee scheme and resolution regime to restore confidence broadly in the viable parts of the European banking sector. The details of how this would be implemented, however, are very difficult and we think the likelihood is they take considerable time, and distinct market pressure, to resolve.
Finally, it isn’t clear exactly how the ESM is supposed to “directly recapitalise banks” – and we note that the language in the summit announcement was very vague – once the single supervisory mechanism is established, … the ESM “could” have the “possibility” to recapitalise banks directly. We need to understand how this is proposed to occur – it isn’t clear the ESM will easily be able to raise the funds for this recap in the markets, in our opinion, absent the backing of, for example, the ECB, and we do not think it likely that Germany, etc. will be keen to be exposed to losses (via the ESM) to non-viable peripheral banks. The capacity of the ESM is likely to need to be further increased in addition – it seems a matter of when, not if, the ESM is allowed to become an eligible counterparty at the ECB, in our opinion. As we saw with the EFSF, other methods for increasing its firepower via leverage do not work.
The Spanish bank bailout risks remain via the sovereign for an extended period The Spanish bank bailout in the first instance will need to go via the sovereign given the timing. While this may then retroactively be restructured to go directly from the ESM to the banks, this is likely to take a considerable length of time, in our opinion – by which point it may no longer be possible to entirely separate the sovereign; and it’s possible that support for the weaker banks remains via the sovereign if a suitable mechanism to insure other countries against losses isn’t achievable.
In aggregate, we would therefore caution reading too much into the announcement until further details are available, and believe that the massive rally in Ireland based on the likelihood the Irish bank bailout will be significantly renegotiated is a bit premature. Newsflow around Ireland, as it returned to the markets for the first time since the end of 2010 with a three-month bill auction, is currently positive, but we think it sensible to look for an entry point to fade the large summit-led rally, with the easiest means of doing so by buying CDS protection.
06 July 2012
European Strategy and Trades 10
ECB delivers but disappoints The ECB cut its key policy rate under 1% to the historical low of 0.75%. and took the deposit rate down to 0%. The standing facility corridor was left at +/- 75bp. The important signal for us was that President Draghi left the door open to further monetary policy easing. He also stated that the decision to cut rates had been unanimous. We continue to expect another 25bp repo rate cut by the end of Q3 but we also anticipate this cut to then be accompanied by a narrowing of the corridor to +/- 50bp.
In our view, the 25bp cut in both the deposit and refinancing rates will support pro-risk sentiment generated from the last EU-summit on the margin. We hold our view of German curve steepening and swap spread tightening.
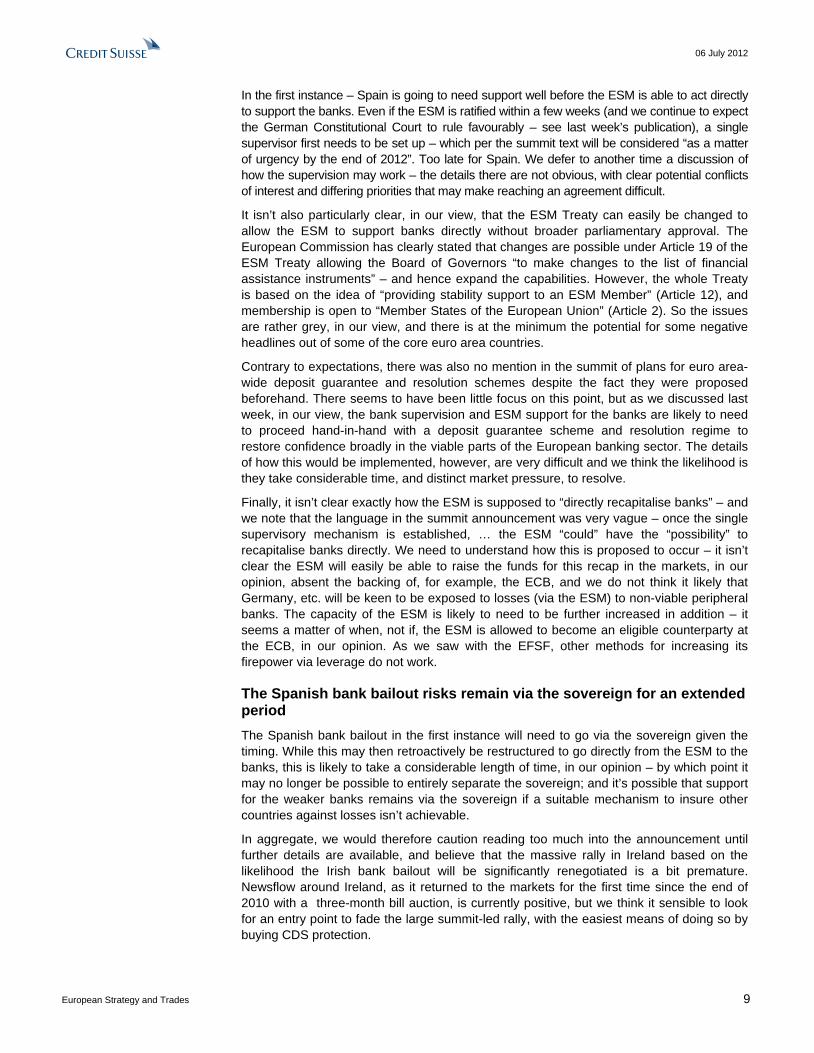
In the front end, we recommended longs in 2y1y EONIA, but now following the ECB, we recommend taking profits on this position. Exhibit 1 shows the 1y forward EONIA curve and shows that the 2y1y rate has now rallied below 0.5%. We see this as a sensible level to take profits on this position.
We now prefer shifting our long position further out the curve to receiving 4y1y EONIA. Exhibit 2 shows that the 4y1y rate is still close to 1.5% - we see further room for a rally. With the ECB now at the zerobound, the market will also start speculating on cuts below 0% on the Deposit Rate. Also, our central view is for another 25bp cut in the refinancing rate, which supports receiving 4y1y.
Exhibit 7: Forward EONIA curve has steepened around the 3y point
Exhibit 8: 4y1y EONIA had risen to 1.8% - we recommend receiving at these levels
0.0
0.5
1.0
1.5
2.0
2.5
1y 1y1y 2y1y 3y1y 4y1y 5y1y 6y1y
05/07/2012
24/05/2012
10/05/2012
Forward horizon
1.0
1.2
1.4
1.6
1.8
2.0
2.2
2.4
Dec
-11
Jan-
12
Feb-
12
Mar
-12
Apr-1
2
May
-12
Jun-
12
4y1y
Source: the BLOOMBERG PROFESSIONAL™ service, Credit Suisse Locus Source: Credit Suisse
In Euribor space, we forecast that a 0% deposit rate and a 0.75% refinancing rate will lead to a terminal level of 45bp on 3m Euribor, which is where ER U2 is currently trading. With our forecast that the refinancing rate will be cut to 50bp, we are forecasting 3m Euribor falls to 35-40bp.
It appears as if the market is already starting to price for tightening in the standing facility corridor. We expect the ECB to tighten the bands to +/- 50bp by September. Short dated FRA/EONIA spreads are flat-lining at 25bp. We think this premium is too optimistic on the level of Euribor. We expect 3m Euribor to remain sticky on the downside below 40bp.
Thushka Maharaj
+44 20 7883 0211 [email protected]

06 July 2012
European Strategy and Trades 11
Banking supervision function The ECB was also questioned on its function as a supra-national supervisor for European banks. President Draghi was clear that the ECB will work in close cooperation with national banking regulators in this function. He also stated that this new role for the ECB will be run independently of monetary policy to ensure no conflicts of interest arise between these two functions. Although details remain sketchy on the timing and implementation of this supervisory role, we see macroprudential and financial services regulation as a key function for central banks going forward.
Tightening collateral requirements on one hand, but easing on the other Earlier this week, the ECB announced tightening of collateral rules for certain government guaranteed bonds. Currently banks are allowed to use government guarantees on their own bonds as collateral at the ECB for refinancing. Going forward, the ECB will curb the use of such bonds unless explicit approval from the governing council was obtained in exceptional circumstances. In order to apply for an exemption from this rule, the counterparty has to present a funding plan that outlines how the bank will reduce reliance on the ECB.
This may be inconsistent with last week’s release on extended ABS collateral. The ECB went to great lengths to explain this supposed discrepancy. The ECB stated that it is easing conditions directly for collateral that affects the real economy - by allowing more ABS and credit claims (e.g., Loans), the ECB hopes to affect banks’ appetite for lending to the real economy. So we see this as a positive move and expect to see more measures to widen the pool of eligible collateral going forward.
06 July 2012
European Strategy and Trades 12
European Governments Coupons and Redemptions to support the core in July July is the month were most of cash comes into the market, both in terms of redemptions as well as coupons. We look at the distribution of the cash and the performance of France against Germany. In the last five years, France has underperformed Germany around its July redemptions.
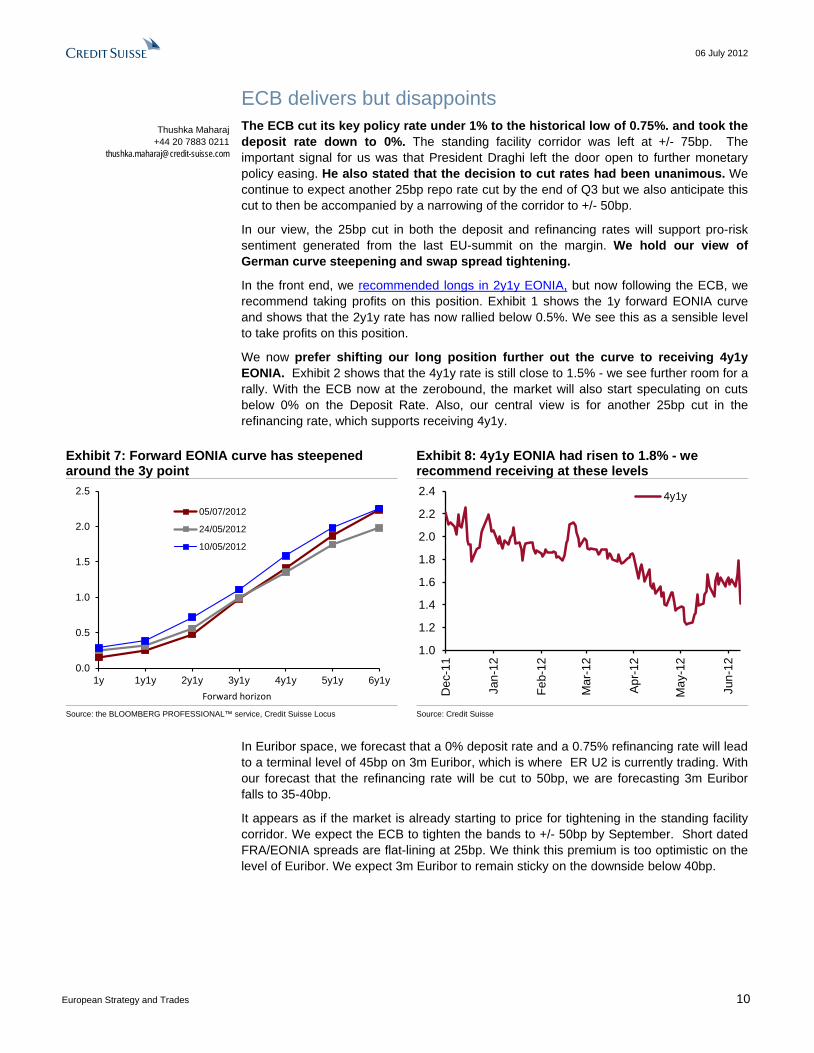
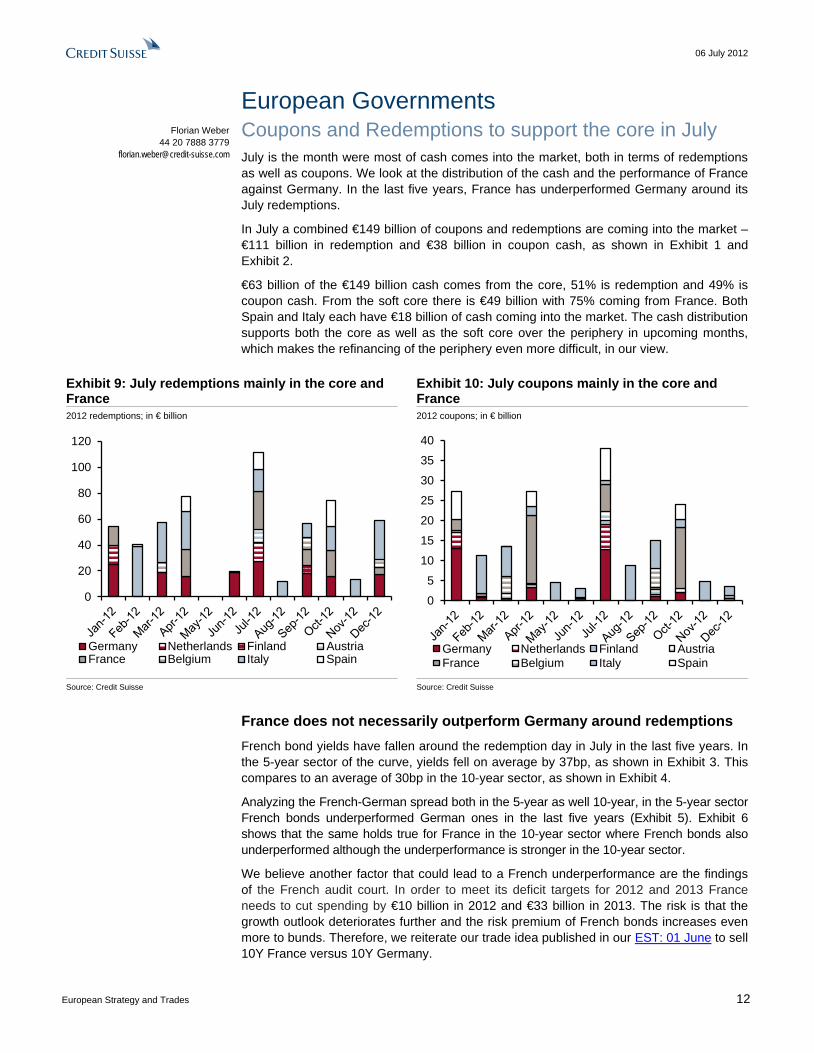
In July a combined €149 billion of coupons and redemptions are coming into the market – €111 billion in redemption and €38 billion in coupon cash, as shown in Exhibit 1 and Exhibit 2.
€63 billion of the €149 billion cash comes from the core, 51% is redemption and 49% is coupon cash. From the soft core there is €49 billion with 75% coming from France. Both Spain and Italy each have €18 billion of cash coming into the market. The cash distribution supports both the core as well as the soft core over the periphery in upcoming months, which makes the refinancing of the periphery even more difficult, in our view.
Exhibit 9: July redemptions mainly in the core and France
Exhibit 10: July coupons mainly in the core and France
2012 redemptions; in € billion 2012 coupons; in € billion
0
20
40
60
80
100
120
Germany Netherlands Finland AustriaFrance Belgium Italy Spain
0
5
10
15
20
25
30
35
40
Germany Netherlands Finland AustriaFrance Belgium Italy Spain
Source: Credit Suisse Source: Credit Suisse
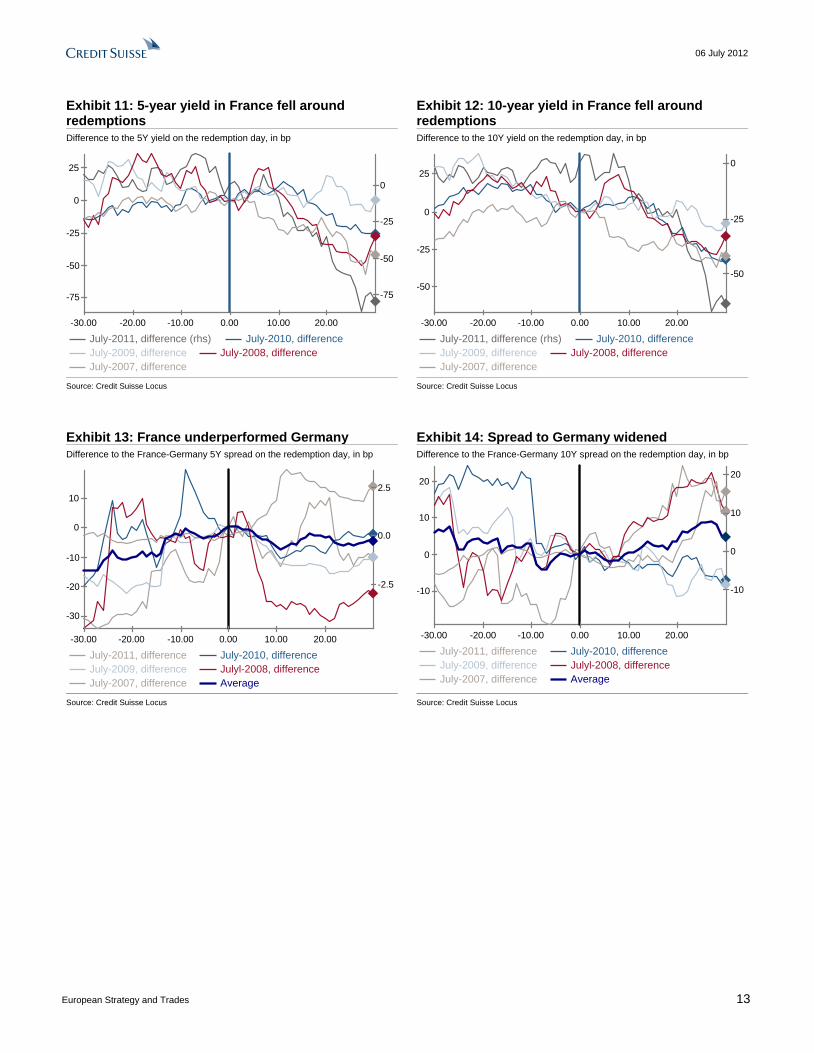
France does not necessarily outperform Germany around redemptions French bond yields have fallen around the redemption day in July in the last five years. In the 5-year sector of the curve, yields fell on average by 37bp, as shown in Exhibit 3. This compares to an average of 30bp in the 10-year sector, as shown in Exhibit 4.
Analyzing the French-German spread both in the 5-year as well 10-year, in the 5-year sector French bonds underperformed German ones in the last five years (Exhibit 5). Exhibit 6 shows that the same holds true for France in the 10-year sector where French bonds also underperformed although the underperformance is stronger in the 10-year sector.
We believe another factor that could lead to a French underperformance are the findings of the French audit court. In order to meet its deficit targets for 2012 and 2013 France needs to cut spending by €10 billion in 2012 and €33 billion in 2013. The risk is that the growth outlook deteriorates further and the risk premium of French bonds increases even more to bunds. Therefore, we reiterate our trade idea published in our EST: 01 June to sell 10Y France versus 10Y Germany.
Florian Weber 44 20 7888 3779
06 July 2012
European Strategy and Trades 13
Exhibit 11: 5-year yield in France fell around redemptions
Exhibit 12: 10-year yield in France fell around redemptions
Difference to the 5Y yield on the redemption day, in bp Difference to the 10Y yield on the redemption day, in bp
-30.00 -20.00 -10.00 0.00 10.00 20.00
-75
-50
-25
0
25
-75
-50
-25
0
July-2011, difference (rhs) July-2010, differenceJuly-2009, difference July-2008, differenceJuly-2007, difference
-30.00 -20.00 -10.00 0.00 10.00 20.00
-50
-25
0
25
-50
-25
0
July-2011, difference (rhs) July-2010, differenceJuly-2009, difference July-2008, differenceJuly-2007, difference
Source: Credit Suisse Locus Source: Credit Suisse Locus
Exhibit 13: France underperformed Germany Exhibit 14: Spread to Germany widened Difference to the France-Germany 5Y spread on the redemption day, in bp Difference to the France-Germany 10Y spread on the redemption day, in bp
-30.00 -20.00 -10.00 0.00 10.00 20.00
-30
-20
-10
0
10
-2.5
0.0
2.5
July-2011, difference July-2010, differenceJuly-2009, difference Julyl-2008, differenceJuly-2007, difference Average
-30.00 -20.00 -10.00 0.00 10.00 20.00
-10
0
10
20
-10
0
10
20
July-2011, difference July-2010, differenceJuly-2009, difference Julyl-2008, differenceJuly-2007, difference Average
Source: Credit Suisse Locus Source: Credit Suisse Locus

06 July 2012
European Strategy and Trades 14
UK Strategy Exhibit 15: Summary of views Metric View Outright level of yields Low yields remain – we expect gilts to trade in range Curve Flattening bias in 5s30s Curvature GBP 2s5s10s to remain driven by European sovereign performance – pay GBP 2s5s versus EUR Long end curve/ASW Possibility of credit easing/SLS supports tighter spreads in <3y maturities; 5s30s ASW curve steepeners GBP-EUR spreads Take profits in GBP 30y outperformance versus EUR Source: Credit Suisse
Repeat and rewind …..same tune from the MPC The BoE announced a £50bn extension of QE over four months, with the maturity buckets kept unchanged (3-7y, 7-15y, 15y+). As discussed last week, we were expecting between £50-75bn with an increasing probability of baskets changing if the BoE extended QE by more than £50bn. The BoE will run the program until the November Inflation Report. This will take BoE holdings to over 40% of conventional gilts outstanding and 30% of market value of all gilts outstanding.
The main reasons cited for the extension of QE were weak growth expectations and falling inflation. The MPC stated: “Business indicators point to a continuation of that weakness in the near term, both at home and abroad ” and that it “was more likely than not that inflation would undershoot the target in the medium term.” We do not rule out the MPC extending QE at the August Inflation Report if we see inflation falling faster than expected.
The buybacks will start on Monday with the same pattern as before:
o 3-7y buybacks on Mondays,
o 15y+ on Tuesdays, and
o 7-15y on Wednesdays.
The BoE will exclude the UKT 8s 15s and the 8s 21s from future buybacks as the Bank holdings of both bonds exceed 70% of the “free float.” The new UKT 1T 22s will be excluded from next week’s buybacks as its outstanding size is below £4bn.
The size of each auction will be £1bn for each maturity with the program running over 17 weeks. The Bank will not hold purchase operations on the bank holiday on 27 August, but we expect it to continue buying gilts over the Olympics. We expect gilts to outperform Europe during that illiquid period as the DMO also cancelled auctions during that time.
The gilt 5s30s curve steepened by 10bp following the announcement and hurt our recommendation to enter curve flatteners. Although this choice of buyback baskets will cause the 5y sector to outperform, we still favour flatteners from a structural perspective. Weak growth, falling inflation, and the possibility that rules governing banks’ liquidity buffers are relaxed are likely to lead to curve flattening.
Thushka Maharaj +44 20 7883 0211
06 July 2012
European Strategy and Trades 15
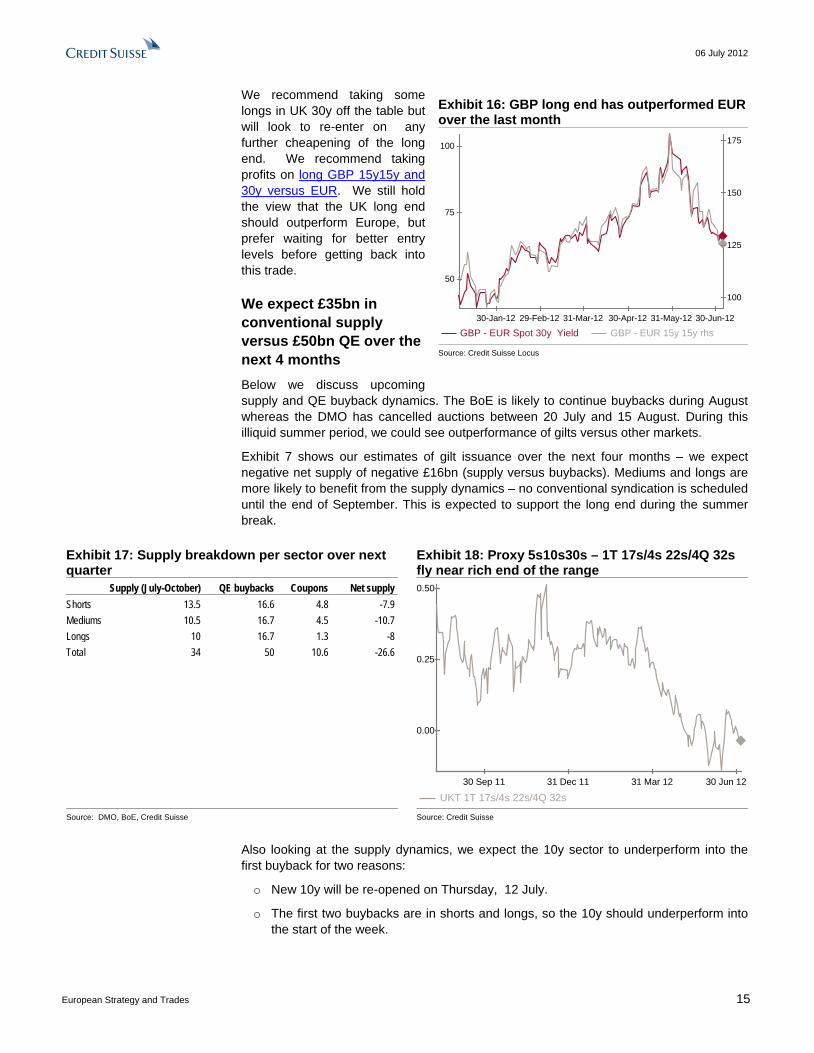
We recommend taking some longs in UK 30y off the table but will look to re-enter on any further cheapening of the long end. We recommend taking profits on long GBP 15y15y and 30y versus EUR. We still hold the view that the UK long end should outperform Europe, but prefer waiting for better entry levels before getting back into this trade.
We expect £35bn in conventional supply versus £50bn QE over the next 4 months Below we discuss upcoming supply and QE buyback dynamics. The BoE is likely to continue buybacks during August whereas the DMO has cancelled auctions between 20 July and 15 August. During this illiquid summer period, we could see outperformance of gilts versus other markets.
Exhibit 7 shows our estimates of gilt issuance over the next four months – we expect negative net supply of negative £16bn (supply versus buybacks). Mediums and longs are more likely to benefit from the supply dynamics – no conventional syndication is scheduled until the end of September. This is expected to support the long end during the summer break.
Exhibit 17: Supply breakdown per sector over next quarter
Exhibit 18: Proxy 5s10s30s – 1T 17s/4s 22s/4Q 32s fly near rich end of the range
Supply (July-October) QE buybacks Coupons Net supply Shorts 13.5 16.6 4.8 -7.9 Mediums 10.5 16.7 4.5 -10.7 Longs 10 16.7 1.3 -8 Total 34 50 10.6 -26.6
30 Sep 11 31 Dec 11 31 Mar 12 30 Jun 12
0.00
0.25
0.50
UKT 1T 17s/4s 22s/4Q 32s Source: DMO, BoE, Credit Suisse Source: Credit Suisse
Also looking at the supply dynamics, we expect the 10y sector to underperform into the first buyback for two reasons:
o New 10y will be re-opened on Thursday, 12 July.
o The first two buybacks are in shorts and longs, so the 10y should underperform into the start of the week.
Exhibit 16: GBP long end has outperformed EUR over the last month
30-Jan-12 29-Feb-12 31-Mar-12 30-Apr-12 31-May-12 30-Jun-12
50
75
100
100
125
150
175
GBP - EUR Spot 30y Yield GBP - EUR 15y 15y rhs Source: Credit Suisse Locus
06 July 2012
European Strategy and Trades 16
Exhibit 8 shows a proxy 5s10s30s fly. We use the 1T 17s as this is unlikely to be tapped, the 32s, and we recommend selling the new 1T 22s as this bond will be excluded from buybacks next week. So we recommend selling 10s on this fly. The risks include a further gilt rally led by the belly of the curve.
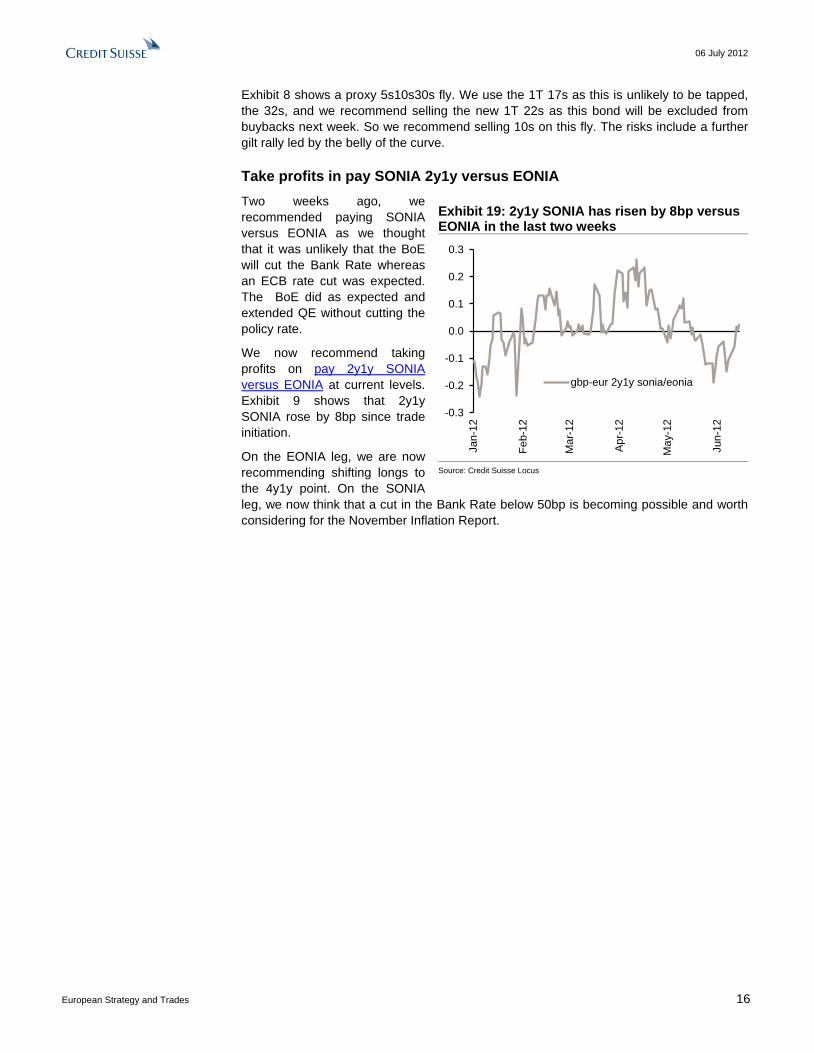
Take profits in pay SONIA 2y1y versus EONIA Two weeks ago, we recommended paying SONIA versus EONIA as we thought that it was unlikely that the BoE will cut the Bank Rate whereas an ECB rate cut was expected. The BoE did as expected and extended QE without cutting the policy rate.
We now recommend taking profits on pay 2y1y SONIA versus EONIA at current levels. Exhibit 9 shows that 2y1y SONIA rose by 8bp since trade initiation.
On the EONIA leg, we are now recommending shifting longs to the 4y1y point. On the SONIA leg, we now think that a cut in the Bank Rate below 50bp is becoming possible and worth considering for the November Inflation Report.
Exhibit 19: 2y1y SONIA has risen by 8bp versus EONIA in the last two weeks
-0.3
-0.2
-0.1
0.0
0.1
0.2
0.3
Jan-
12
Feb-
12
Mar
-12
Apr
-12
May
-12
Jun-
12
gbp-eur 2y1y sonia/eonia
Source: Credit Suisse Locus

06 July 2012
European Strategy and Trades 17
Derivatives Strategy Long end - EUR swaps Long end – convexity, roll-down versus expected flows For a regulatory overview of the long end as well as drivers of the long end, see our thematic piece, 02 July 2012, titled Drivers of the EUR long end.
One aspect of the analysis worth going through in more detail here is the subject of ‘convexity adjustment’. Swaps are ‘convex’ products, in other words their DV01 increases as rates fall and vice versa. Therefore, the positive PNL of receiving fixed would be higher for a certain move lower in yields than the negative PNL associated with the same move higher in yields. This asymmetry in PNL (convexity) is proportional to duration squared, hence matters a lot more for positions in the long end. In fact, convexity is the side of the coin when analyzing the carry/rolldown aspect. When looking at the long end, rolldown cannot be looked in isolation, it has to be looked in conjunction with convexity.
In a curve where yields are not expected to move very much, the benefit of convexity is small. In an environment where yields are expected to move a lot, then investors would be more willing to enter into long convexity positions. Therefore, 10s30s is also driven by the level of volatility. 10s30s is also driven by many other drivers, so the relationship between 10s30s and vol is less clear. However, the slope between long-end forwards and vol becomes clearer.
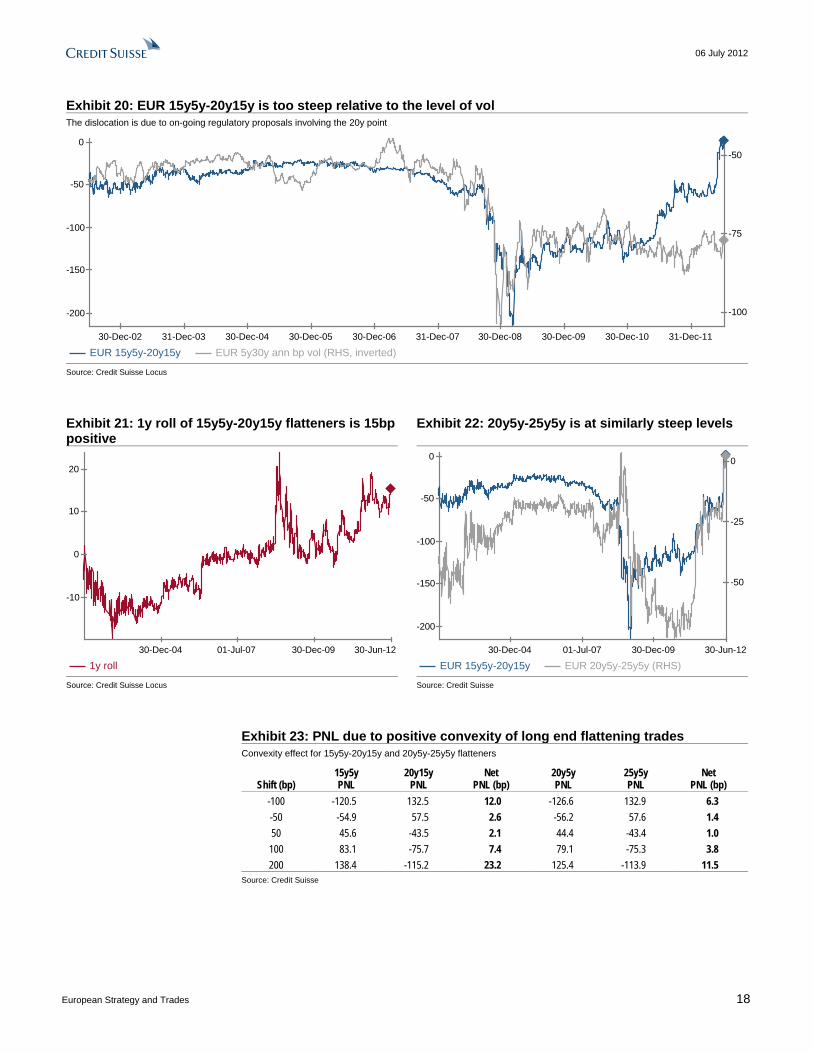
Exhibit 10 shows the EUR 15y5y-20y15y slope versus 5y30y vol. There is a reasonable relationship between the slope and vol. It has recently broken down completely as a result of the richening of 20s due to on-going regulatory changes. The 20y point is rich on the curve, but for a very important reason in our view. The question is, will it richen further in the near term or has the richness of 20s run its course? Should we expect any near-term reversal? How about over a multi-year horizon?
Our sense is that the 20y point is likely to remain rich in the near term, so we wouldn’t recommend paying it if the horizon of the trade is tactical. In fact our sense is that the curve can continue to steepen in the near term.
How about over a multi-year horizon? Let us look at 15y5y-20y15y for example (where flatteners appear to be at very attractive levels) and analyze the various aspects of the trade.
• Flows: As discussed above, the near-term flows (receiving in 20s) would go against a 15y5y-20y15y flattening position. However, over time, as the position rolls down the curve, even if receiving in 20s persists, the flow is less harmful (matters less) for the trade. Eventually, it can even be beneficial for the trade.
• Roll-down: The trade does roll down the curve 15bp positively per annum (Exhibit 11). The roll is positive as the curve is inverted between the 12y and 20y area and positively sloped afterwards.
• Convexity (long gamma): This is an aspect that not often gets the attention it deserves. In Exhibit 13 we highlight the PNL (in bp) of 15y5y-20y15y and 20y5y-25y5y flattening positions if the curve was to move in parallel fashion (a scenario that is not always realistic but nonetheless worth looking into). If yields were to rise by 200bp then the 15y5y-20y15y flattener would outperform by 23.2bp even if the 15y5y-20y15y slope remained unchanged (simply because of the change of DV01 of the two swaps the investor would end up long the market in a rally and short the market in a sell-off).
Panos Giannopoulos +44 20 7883 6947
06 July 2012
European Strategy and Trades 18
Exhibit 20: EUR 15y5y-20y15y is too steep relative to the level of vol The dislocation is due to on-going regulatory proposals involving the 20y point
30-Dec-02 31-Dec-03 30-Dec-04 30-Dec-05 30-Dec-06 31-Dec-07 30-Dec-08 30-Dec-09 30-Dec-10 31-Dec-11
-200
-150
-100
-50
0
-100
-75
-50
EUR 15y5y-20y15y EUR 5y30y ann bp vol (RHS, inverted) Source: Credit Suisse Locus
Exhibit 21: 1y roll of 15y5y-20y15y flatteners is 15bp positive
Exhibit 22: 20y5y-25y5y is at similarly steep levels
30-Dec-04 01-Jul-07 30-Dec-09 30-Jun-12
-10
0
10
20
1y roll
30-Dec-04 01-Jul-07 30-Dec-09 30-Jun-12
-200
-150
-100
-50
0
-50
-25
0
EUR 15y5y-20y15y EUR 20y5y-25y5y (RHS) Source: Credit Suisse Locus Source: Credit Suisse
Exhibit 23: PNL due to positive convexity of long end flattening trades Convexity effect for 15y5y-20y15y and 20y5y-25y5y flatteners
Shift (bp)
15y5y PNL
20y15y PNL
Net PNL (bp)
20y5y PNL
25y5y PNL
Net PNL (bp)
-100 -120.5 132.5 12.0 -126.6 132.9 6.3 -50 -54.9 57.5 2.6 -56.2 57.6 1.4 50 45.6 -43.5 2.1 44.4 -43.4 1.0 100 83.1 -75.7 7.4 79.1 -75.3 3.8 200 138.4 -115.2 23.2 125.4 -113.9 11.5
Source: Credit Suisse
06 July 2012
European Strategy and Trades 19
Investment recommendation: EUR flatteners such as 15y5y-20y15y or 20y5y-25y5y make sense over a multi-year horizon Taking into account all of the above, we think that near term flows are too powerful to fade if the investment horizon is short. However, over a longer-term horizon, we think that the long end flatteners such as 15y5y-20y15y make perfect sense. The positive roll-down and convexity are simply too powerful to ignore. Especially in an environment where the uncertainty is high, positive convexity becomes more desirable. The risk to the trade is near-term flows. Acknowledging the near-term mark-to-market risk, our recommendation is to start scaling into this theme of trades gradually. Enter into the position now in a partial size and add at a later stage if the entry levels become more attractive.
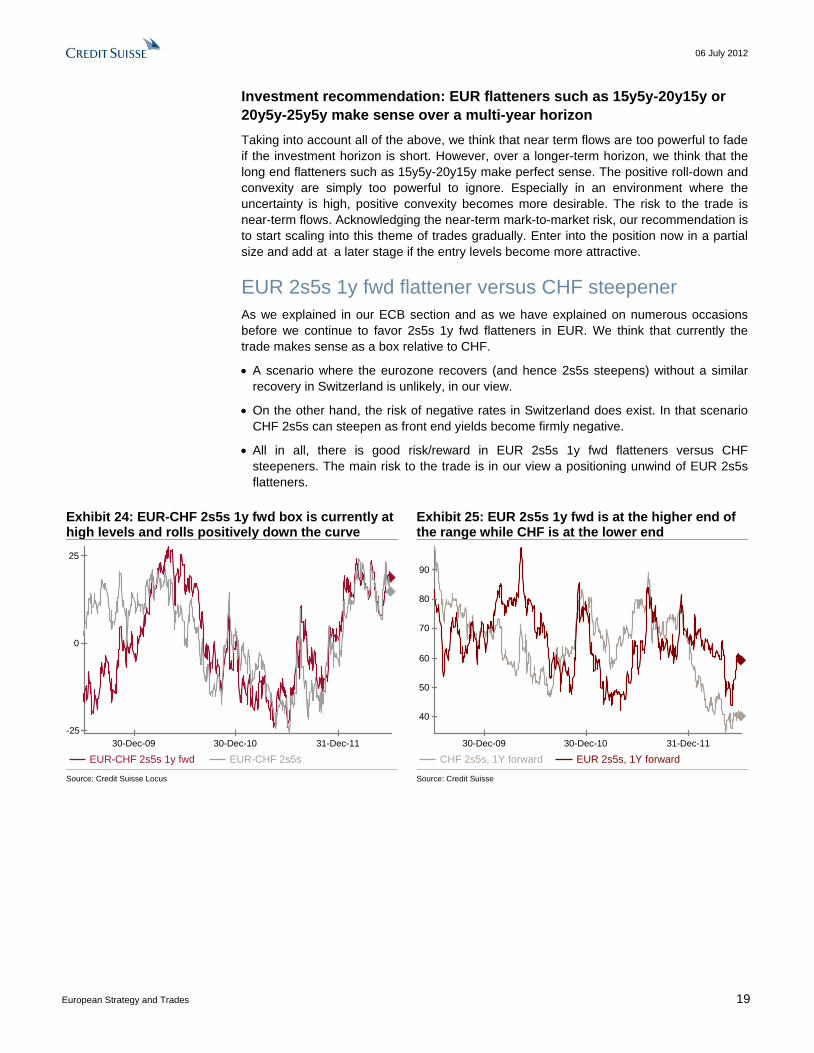
EUR 2s5s 1y fwd flattener versus CHF steepener As we explained in our ECB section and as we have explained on numerous occasions before we continue to favor 2s5s 1y fwd flatteners in EUR. We think that currently the trade makes sense as a box relative to CHF.
• A scenario where the eurozone recovers (and hence 2s5s steepens) without a similar recovery in Switzerland is unlikely, in our view.
• On the other hand, the risk of negative rates in Switzerland does exist. In that scenario CHF 2s5s can steepen as front end yields become firmly negative.
• All in all, there is good risk/reward in EUR 2s5s 1y fwd flatteners versus CHF steepeners. The main risk to the trade is in our view a positioning unwind of EUR 2s5s flatteners.
Exhibit 24: EUR-CHF 2s5s 1y fwd box is currently at high levels and rolls positively down the curve
Exhibit 25: EUR 2s5s 1y fwd is at the higher end of the range while CHF is at the lower end
30-Dec-09 30-Dec-10 31-Dec-11-25
0
25
EUR-CHF 2s5s 1y fwd EUR-CHF 2s5s
30-Dec-09 30-Dec-10 31-Dec-11
40
50
60
70
80
90
CHF 2s5s, 1Y forward EUR 2s5s, 1Y forward Source: Credit Suisse Locus Source: Credit Suisse

06 July 2012
European Strategy and Trades 20
Model portfolio management Close short EUR 3m2y straddles On 6 June, after last month’s ECB meeting we recommended selling EUR 3m2y straddles. After today’s 9bp fall in 3m2y annual bp vol, we see no value in staying short 3m2y straddles and hence recommend closing the trade.
Close receiving EUR 3s7s15s On 18 June 2012, we recommended receiving 3s7s15s as a cheaper alternative to 2s5s10s. The fly has moved from +10bp to -5bp currently. We now think the fly is pretty fair and recommend closing the trade.
Close ERU2H3 steepener at flat On 6 June, after last month’s ECB meeting we recommended buying ERU2H3 spreads. The rationale was that cuts would probably happen sooner rather than later and that a risk of FRA-Eonia widening ought to be priced further out the curve. The rationale is still valid, however the trade is marginal in our view. We recommend closing the trade at current levels (@ -1bp which is roughly flat relative to the original entry levels).
Close ER U3-U4 flattener versus L U3-U4 steepener On 14 June, we recommended an L-ER U3-U4 box (L steepener, ER flattener). ERU3-U4 has flattened from 33bp down to 21bp while L U3-U4 has flattened 6bp. Even though on a structural perspective we still like ER flatteners versus L steepeners, we think it is worth closing the trade currently and looking for better entry points going forward.
06 July 2012
European Strategy and Trades 21
Money Market Strategy LIBOR story – Analyzing the Euribor fixings Much has been said about the on-going LIBOR investigation. We also think that much more will be said going forward. We think this is a good time to express our current thoughts. We look at the Euribor fixings (the conclusions are similar in USD and GBP LIBOR). At this stage, it is worth highlighting a key difference between LIBOR and Euribor. Submitted fixings for the former are the rate where the individual bank can borrow unsecured funds. The latter depends on where term deposits are offered by one prime bank to another. Hence in the former case, when a bank’s credit profile deteriorates, it ought to submit a higher fixing. In the latter case, as long as there is a set of prime banks that can lend to each other at prime rates, the fact that certain panel banks become subprime doesn’t immediately impact the fixings.
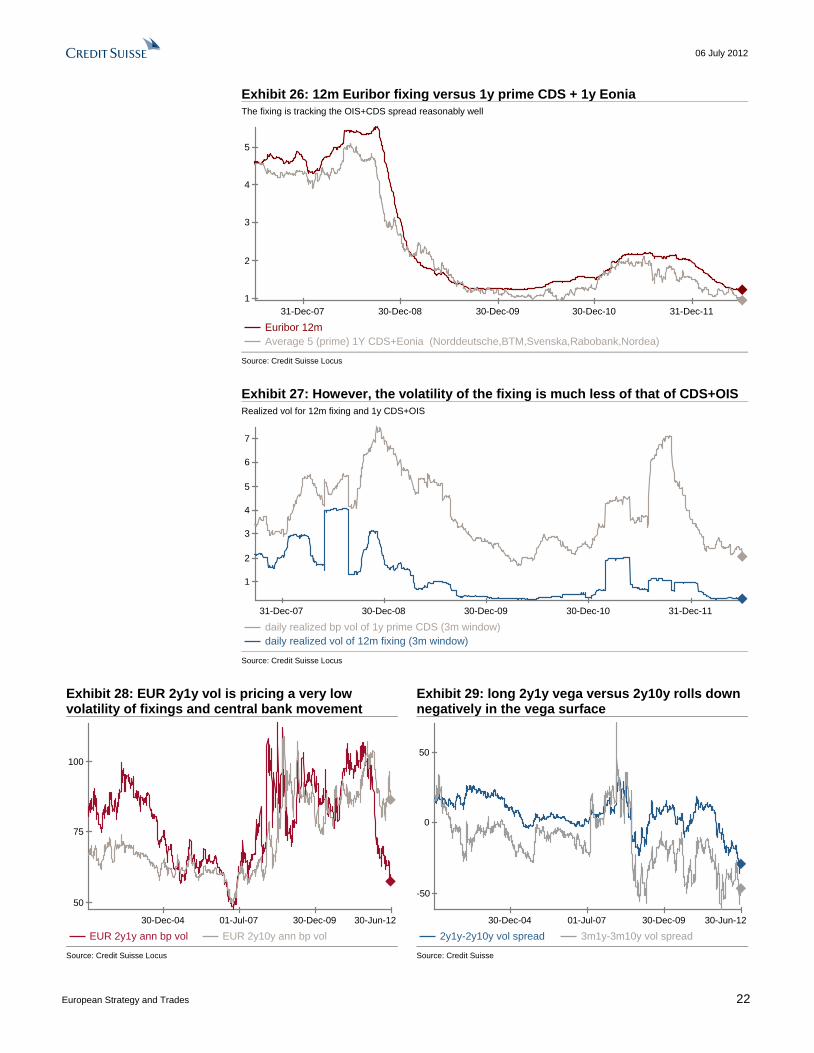
• We think a rough proxy for fixing should be the risk-free rate (OIS) plus the term credit-risk (CDS). Note that we think this ought to be a guide in terms of where the fixing should be and not an exact formula. In Exhibit 1, we compare the 12m Euribor fixing to the sum of 1y Eonia and an average of 1y CDS of prime banks within the Euribor panel. Based on this analysis, we can conclude that current fixings are reasonable or at least we cannot conclude the contrary.
• The difficulty with trying to determine the exact value of fixings is due to the fact that unsecured cash transactions do not happen frequently. The guidance that CFTC offered to Barclays can in its current form only complicate things, in our view. We find the suggestion of using futures to determine the fair value of fixings as circular.
• We are not biased (neither higher nor lower) in terms of the direction of any new potential methodology of determining fixings. In fact, we think the process of reforming LIBOR is a very gradual one and it isn’t even clear that anything changes. Having said that, we still like FRA-Eonia wideners in the reds @ 25bp from a simple risk/reward perspective. FRA-Eonia does not react immediately as the crisis intensifies (while there are still some prime banks left), but could eventually spike higher in a tail scenario where trust between banks is lost completely.
• The level of fixings is fair in our view, however, we think the volatility of fixings is too low. Exhibit 2 highlights that the volatility of the fixing is much lower than that of OIS+CDS. While we do not think that the fixing should track OIS+CDS on a 1:1 basis, we do think that fixings ought to react quicker in changes of funding conditions. If the reform process encouraged banks to be more precise in terms of their funding capability as market conditions change , the risk to the fixings volatility is to the upside.
• Central banks/politicians do not like market volatility in general so a possibility would be to set LIBOR (or Euribor) as a fixed spread to the OIS rate. This would reduce fixing volatility. We can debate how likely this is. The point though is that even if ultimately the reform reduces volatility, the uncertainty about the reform outcome ought to increase volatility in the meantime, in our view.
• All in all, we think there is good risk reward in buying top left vol, for example, 2y1y outright @ 54bp annual bp vol or versus 2y10y (@ a spread of -30bp). 2y1y vol is pricing a low ECB activity in terms of the refi rate as well as low fixing volatility. While that outcome could well turn out to be correct, the risk is biased to the upside.
• Being long 2y1y straddles versus 2y10y slides negatively in the vega surface (Exhibit 4); however, the theta is positive (due to the fact that we are selling the higher vol) and the delta ought to carry a small positive, so all in all, the carry is roughly flat.
• The risk to the trade is a further fall in vol in the top left corner coupled with an increase in vol further out the curve.
Panos Giannopoulos +44 20 7883 6947
Marion Pelata +44 20 7883 1333
06 July 2012
European Strategy and Trades 22
Exhibit 26: 12m Euribor fixing versus 1y prime CDS + 1y Eonia The fixing is tracking the OIS+CDS spread reasonably well
31-Dec-07 30-Dec-08 30-Dec-09 30-Dec-10 31-Dec-111
2
3
4
5
Euribor 12mAverage 5 (prime) 1Y CDS+Eonia (Norddeutsche,BTM,Svenska,Rabobank,Nordea)
Source: Credit Suisse Locus
Exhibit 27: However, the volatility of the fixing is much less of that of CDS+OIS Realized vol for 12m fixing and 1y CDS+OIS
31-Dec-07 30-Dec-08 30-Dec-09 30-Dec-10 31-Dec-11
1
2
3
4
5
6
7
daily realized bp vol of 1y prime CDS (3m window)daily realized vol of 12m fixing (3m window)
Source: Credit Suisse Locus
Exhibit 28: EUR 2y1y vol is pricing a very low volatility of fixings and central bank movement
Exhibit 29: long 2y1y vega versus 2y10y rolls down negatively in the vega surface
30-Dec-04 01-Jul-07 30-Dec-09 30-Jun-12
50
75
100
EUR 2y1y ann bp vol EUR 2y10y ann bp vol
30-Dec-04 01-Jul-07 30-Dec-09 30-Jun-12
-50
0
50
2y1y-2y10y vol spread 3m1y-3m10y vol spread Source: Credit Suisse Locus Source: Credit Suisse

06 July 2012
European Strategy and Trades 23
Covered Bonds Bail-in-able debt maximum, or non-bail-in-able debt limit New regulations and some financial institutions’ difficulties to issue unsecured debt led to a rise in the use of asset-backed funding instruments. Covered bonds are one of a variety of funding instruments implying asset encumbrance. Asset encumbrance for the benefit of selected creditors is prejudicial to the interests of the other stakeholders, be it directly via structural subordination and lower recovery rates in the event of an (ordinary) wind-up of the financial institution, or indirectly via pressure on the institution’s (unsecured) credit ratings and funding costs. Increased use of asset-backed funding instruments may also affect an institution’s future funding mix, and the availability of different parts of the capital markets for its future issuance. The use of covered bonds in the funding mix of a lender typically depends on its business model, and is often higher for specialised lenders compared with universal banks.
The introduction of and discussions about resolution regimes are putting more emphasis on the existing waterfall structures and the preferred position of selected creditors, such as covered bond investors. They also result in an increased focus on the amount and quality of unencumbered assets on a financial institutions’ balance sheet available to unsecured debt holders in the event of an (ordinary) wind-up, the preferential claim of covered bond investors against a dedicated pool of collateral, the strength of a covered bond legislation and contractual arrangements, and the trigger mechanisms within contractual agreements and covered bond structures. Despite the popularity of asset-backed funding instruments, some market participants are starting to question the limits to their use.
In the context of the debate about bail-in, it is being discussed that in order for bail-in to be a credible resolution tool, there must be a sufficient amount of bail-in-able securities. The European Commission proposed that a minimum amount of bail-in-able securities can be defined as a proportion and for each type of institutions based on an institution’s credit risk and funding mix. The national policymakers would retain the discretion of defining the minimum amount of bail-in-able securities. In order to address lingering concerns about insufficient bail-in-able securities, consideration may also be given to constrain the use of non-bail-in-able securities or the level of asset encumbrance. Such an approach would likely need to be effected as part of a more holistic way to managing asset-backed funding instruments rather than by singling out covered bonds for disparate treatment.
Whilst covered bonds present risks to the claims of unsecured creditors, in particular when they are a key source of funding, other asset-backed instruments such as securitisations, derivatives, and repurchase transactions, for example, with central banks, also pose risks to the unsecured creditors. Many aspects of asset encumbrance may not be adequately addressed in legislations or fully appreciated by the market participants. Investor attitude towards asset-backed instruments is shifting, and the scrutiny on the financial industry by the regulators and investors is growing. Although the risks posed by asset encumbrance for the benefit of selected stakeholders are widely accepted as a threat to the interests of the other stakeholders of a financial institution, the regulators address these risks in different ways, if at all.
Unlike business models, and no uniform issuance limit The covered bond legislation in some countries imposes a special banking principle and/or covered bond issuance limit. However, the regulators’ concerns about asset encumbrance relate more to unsecured and insured creditors than to unsecured and uninsured creditors. In most countries with covered bond legislation, there is no uniform issuance limit. In Italy, it depends on the issuer’s capitalisation. In countries, such as the US, the UK, the Netherlands, Spain, New Zealand, Italy, Greece, Canada, and Australia, there are hard
Sabine Winkler +44 20 7883 9398

06 July 2012
European Strategy and Trades 24
covered bond issuance limits. They range between 4% and 80%, and are expressed as a percentage of the issuer’s total liabilities, total assets, or eligible collateral. Covered bond issuance is finite as there is a limited amount of eligible collateral on the balance sheet of a financial institution.
• AU: An authorised deposit-taking institution (ADI) must limit the value of its cover pools to a maximum of 8% of its total assets in Australia.
• CA: The Office of the Superintendent of Financial Institutions Canada has placed a limit on covered bonds issuances by deposit-taking federally regulated financial institutions of 4% of total assets.
• ES: The total amount of outstanding cédulas hipotecarias must not exceed 80% of the non-amortised amount of the eligible ordinary collateral on the issuer’s balance sheet less the amount of collateral for participaciónes hipotecarias and bonos hipotecarios. The total amount of outstanding cédulas territoriales must not exceed 70% of the non-amortised amount of the eligible collateral for those securities.
• GB: In 2008, the Financial Services Authority (FSA) announced that the notification requirements based on covered bond issuance thresholds of 4% and 20% of an issuer’s total assets were no longer valid. The FSA now requires issuers to discuss, in advance, their plans for the use of funding methods encumbering assets.
• GR: The covered bond collateral must not exceed 20% of the available assets of a bank. In the event that the covered bond collateral exceeds the 20% limit, the Bank of Greece can impose further capital requirements.
• IT: Covered bond issuance limits depend on the capitalisation of the issuer, though there is no ceiling if the total capital ratio is at least 11% and the Tier 1 capital ratio is at least 7%. If the total capital ratio is at least 10% and the Tier 1 capital ratio is at least 6.5%, the ceiling is 60% of the assets fundable through covered bonds. If the total capital ratio is at least 9% and the Tier 1 capital ratio is at least 6%, it is 25% of the assets fundable through covered bonds.
• NL: The ratio of the total nominal value of the covered bonds (issued or to be issued) to the consolidated balance sheet total of an issuer needs to be healthy. This ratio is set by the Dutch central bank in consultation with an issuer and on an ad-hoc basis.
• NZ: The Reserve Bank imposed an issuance limit of 10% of total assets of an issuer, with the limit calculated on the value of the assets encumbered for the benefit of covered bond investors.
• US: In accordance with the FDIC’s Final Covered Bond Policy Statement and the US Treasury’s Best Practices Guide, an issuer requires approval by its respective primary regulator to launch covered bonds. Covered bonds may account for no more than 4% of an issuer’s total liabilities after issuance.
Although an issuance limit may be aimed at protecting unsecured creditors’ interests, it is also in the interest of covered bond investors as the risk of a dilution of the collateral by rising covered bond issuance is lower, the issuer’s ability to meet its obligations under the debt programme is higher, and the economic value of a full recourse of the covered bond investors may not lose substance. In general, the more unencumbered assets there are on the balance sheet of a gone-concern financial institution, the more valuable a full recourse of the covered bond investors, and the less the structural subordination of the unsecured creditors. In addition, the more unencumbered assets there are on the balance sheet of a going-concern financial institution, the easier it should be for the institution to maintain the required quality and size of the cover pool.

06 July 2012
European Strategy and Trades 25
Different recovery rates, credit ratings, and debt prices The higher the use of asset-backed instruments, the higher the structural subordination of unsecured creditors, and the lower the potential recovery on unsecured securities in the event of an (ordinary) wind-up of a financial institution. As our Covered Bond Issuers & Products Overview shows, 34% of the benchmark issuers with sufficient data disclosure had a cover pool to total assets ratio above 50%. Decreasing recovery rates on unsecured debt due to the increasing use of asset-backed instruments may result in pressure on the financial institution’s unsecured debt ratings. In our view, as the level and quality of the unencumbered assets on the balance sheet of an institution falls, a wider price differential between its senior unsecured debt and covered bonds is justified on a credit fundamental basis. In addition, the introduction of resolution regimes may result in further fragmentation of the covered bond market.
06 July 2012
European Strategy and Trades 26
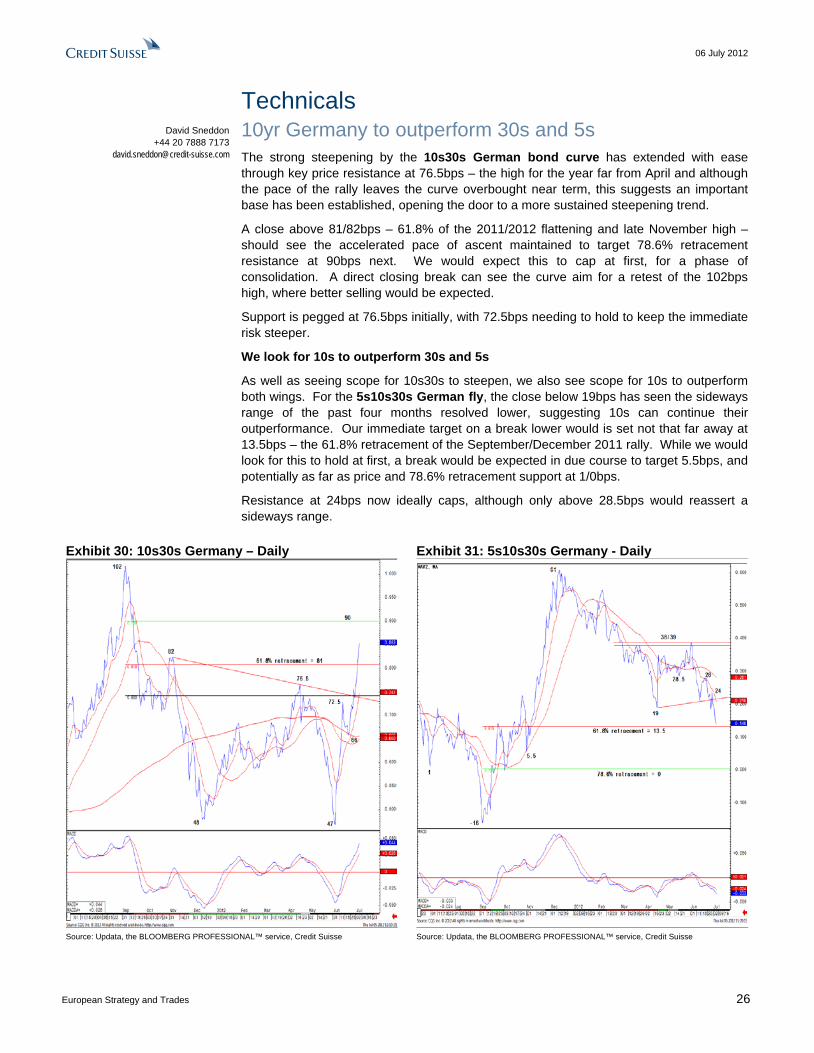
Technicals 10yr Germany to outperform 30s and 5s The strong steepening by the 10s30s German bond curve has extended with ease through key price resistance at 76.5bps – the high for the year far from April and although the pace of the rally leaves the curve overbought near term, this suggests an important base has been established, opening the door to a more sustained steepening trend.
A close above 81/82bps – 61.8% of the 2011/2012 flattening and late November high – should see the accelerated pace of ascent maintained to target 78.6% retracement resistance at 90bps next. We would expect this to cap at first, for a phase of consolidation. A direct closing break can see the curve aim for a retest of the 102bps high, where better selling would be expected.
Support is pegged at 76.5bps initially, with 72.5bps needing to hold to keep the immediate risk steeper.
We look for 10s to outperform 30s and 5s
As well as seeing scope for 10s30s to steepen, we also see scope for 10s to outperform both wings. For the 5s10s30s German fly, the close below 19bps has seen the sideways range of the past four months resolved lower, suggesting 10s can continue their outperformance. Our immediate target on a break lower would is set not that far away at 13.5bps – the 61.8% retracement of the September/December 2011 rally. While we would look for this to hold at first, a break would be expected in due course to target 5.5bps, and potentially as far as price and 78.6% retracement support at 1/0bps.
Resistance at 24bps now ideally caps, although only above 28.5bps would reassert a sideways range.
Exhibit 30: 10s30s Germany – Daily Exhibit 31: 5s10s30s Germany - Daily
Source: Updata, the BLOOMBERG PROFESSIONAL™ service, Credit Suisse Source: Updata, the BLOOMBERG PROFESSIONAL™ service, Credit Suisse
David Sneddon +44 20 7888 7173

06 July 2012
European Strategy and Trades 27
EUR and UK Supply Analysis Exhibit 32: Forward supply calendar
Week Day Date T-bills Issues Bonds Issues 2/3y 5/7y 10y 15/20y >=30y Linkers
28 Mon 09-Jul BTF 7.5* SK SLOVGB 25 0.3* 28 Mon 09-Jul Bubill 6M 4.0 28 Mon 09-Jul SLOVTB 12M 1.5 28 Tue 10-Jul SLVNTB 6M&12M 0.2* US/UK 3Y Note 32* UKTi 50 0.9 28 Tue 10-Jul NL DSL 15 3.0* 28 Wed 11-Jul DE Bund 22 5.0 28 Wed 11-Jul US 10Y Note 24* 28 Thu 12-Jul BOT 7.5* US/UK UKT 1T 22s 3.5 30Y Bond 16* 28 Thu 12-Jul 28 Fri 13-Jul UK BE/IT BTP 3Y* 3.0* BTP 7Y* 2.5* BGB 20Y* 0.25*
EUR total 20.7 EUR total 6.0 2.5 5.3 0.25 29 Mon 16-Jul BTF 7.5* 29 Mon 16-Jul DTC 3M & 6M 1.7* 29 Tue 17-Jul BTB 3M & 12M 3.0* 29 Tue 17-Jul SGLT 5.5* 29 Tue 17-Jul GTB 1.6* 29 Wed 18-Jul DE Schatz 14 5.0 29 Thu 19-Jul FR/UK BTAN 3Y* 1.5* BTAN 4Y* 1.5* UKT 52 2.0* OATei 30Y* 1.8* 29 Thu 19-Jul FR/US OAT 5Y* 1.5* 10Y Tips 24 29 Thu 19-Jul ES SPGB 5Y* 1.0* SPGB 10Y* 1.0* 29 Fri 20-Jul UK
EUR total 19.3 EUR total 6.5 4.0 1.0 1.8
30 Mon 23-Jul BTF 7.5* UK New UKTi 30Y** 4.0*
30 Mon 23-Jul Bubill 12M 3.0 30 Tue 24-Jul SGLT 3M & 6M 3.0* NL DSL 14 1.2* DSL 28 0.8* 30 Tue 24-Jul US 2Y Note 35* 30 Wed 25-Jul DE/US 5Y Note 35* Bund 44 3.0 30 Thu 26-Jul IT/US CTZ 2Y* 2.9* 7Y Note 29* BTPei 10Y* 1.4* 30 Fri 27-Jul UK
EUR total 13.5 EUR total 4.1 0.8 3.0 1.4 31 Mon 30-Jul BTF 7.5* BE BGB 3Y* 0.7* BGB 5Y* 0.8* BGB 10Y* 0.5* 31 Mon 30-Jul IT BTP 5Y* 3.5* BTP 10Y* 2.5* 31 Tue 31-Jul BTB 3M* & 6M* 3.0* 31 Wed 01-Aug DE Bobl 17 4.0 31 Thu 02-Aug ES SPGB 3Y* 1.0* SPGB 5Y* 1.0* 31 Fri 03-Aug UK
EUR total 10.5 EUR total 8.2 7.8 5.0 32 Mon 06-Aug BTF 7.5* 32 Mon 06-Aug DTC 3M & 6M 1.7* 32 Tue 07-Aug AT/US 3Y Note 32* RAGB 5Y* 0.9* RAGB 10Y* 0.7* 32 Wed 08-Aug DE Bund 22 4.0 32 Wed 08-Aug US 10Y Note 24* 32 Fri 10-Aug UK BE/US BGB 20Y* 0.25 30Y Bond 16*
EUR total 9.2 EUR total 0.9 4.7 0.25
*Estimates/Likely auction dates, **Syndications/Tenders/Mini-Tenders, *** USD denominated; Source: Credit Suisse, National Treasuries
06 July 2012
European Strategy and Trades 28
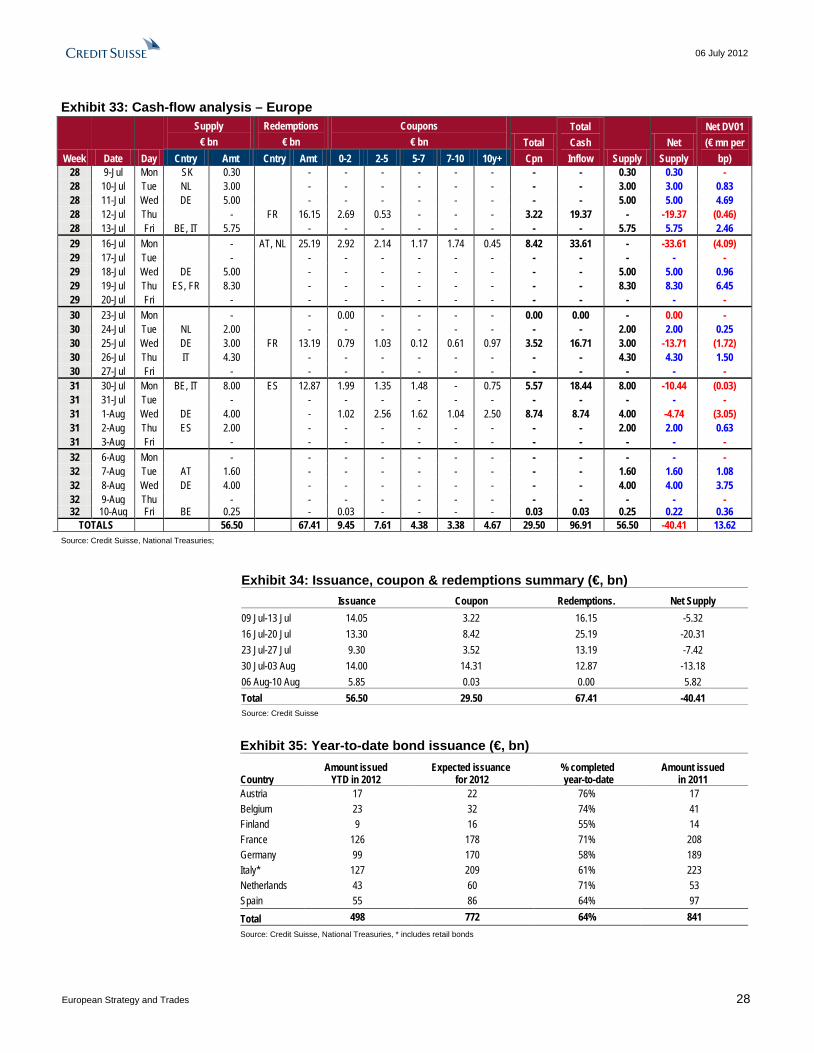
Exhibit 33: Cash-flow analysis – Europe
Week Date Day
Supply € bn
Redemptions € bn
Coupons € bn Total
Cpn
Total Cash Inflow Supply
Net Supply
Net DV01 (€ mn per
bp) Cntry Amt Cntry Amt 0-2 2-5 5-7 7-10 10y+ 28 9-Jul Mon SK 0.30 - - - - - - - - 0.30 0.30 - 28 10-Jul Tue NL 3.00 - - - - - - - - 3.00 3.00 0.83 28 11-Jul Wed DE 5.00 - - - - - - - - 5.00 5.00 4.69 28 12-Jul Thu - FR 16.15 2.69 0.53 - - - 3.22 19.37 - -19.37 (0.46) 28 13-Jul Fri BE, IT 5.75 - - - - - - - - 5.75 5.75 2.46 29 16-Jul Mon - AT, NL 25.19 2.92 2.14 1.17 1.74 0.45 8.42 33.61 - -33.61 (4.09) 29 17-Jul Tue - - - - - - - - - - - - 29 18-Jul Wed DE 5.00 - - - - - - - - 5.00 5.00 0.96 29 19-Jul Thu ES, FR 8.30 - - - - - - - - 8.30 8.30 6.45 29 20-Jul Fri - - - - - - - - - - - - 30 23-Jul Mon - - 0.00 - - - - 0.00 0.00 - 0.00 - 30 24-Jul Tue NL 2.00 - - - - - - - - 2.00 2.00 0.25 30 25-Jul Wed DE 3.00 FR 13.19 0.79 1.03 0.12 0.61 0.97 3.52 16.71 3.00 -13.71 (1.72) 30 26-Jul Thu IT 4.30 - - - - - - - - 4.30 4.30 1.50 30 27-Jul Fri - - - - - - - - - - - - 31 30-Jul Mon BE, IT 8.00 ES 12.87 1.99 1.35 1.48 - 0.75 5.57 18.44 8.00 -10.44 (0.03) 31 31-Jul Tue - - - - - - - - - - - - 31 1-Aug Wed DE 4.00 - 1.02 2.56 1.62 1.04 2.50 8.74 8.74 4.00 -4.74 (3.05) 31 2-Aug Thu ES 2.00 - - - - - - - - 2.00 2.00 0.63 31 3-Aug Fri - - - - - - - - - - - - 32 6-Aug Mon - - - - - - - - - - - - 32 7-Aug Tue AT 1.60 - - - - - - - - 1.60 1.60 1.08 32 8-Aug Wed DE 4.00 - - - - - - - - 4.00 4.00 3.75 32 9-Aug Thu - - - - - - - - - - - - 32 10-Aug Fri BE 0.25 - 0.03 - - - - 0.03 0.03 0.25 0.22 0.36
TOTALS 56.50 67.41 9.45 7.61 4.38 3.38 4.67 29.50 96.91 56.50 -40.41 13.62 Source: Credit Suisse, National Treasuries;
Exhibit 34: Issuance, coupon & redemptions summary (€, bn) Issuance Coupon Redemptions. Net Supply 09 Jul-13 Jul 14.05 3.22 16.15 -5.32 16 Jul-20 Jul 13.30 8.42 25.19 -20.31 23 Jul-27 Jul 9.30 3.52 13.19 -7.42 30 Jul-03 Aug 14.00 14.31 12.87 -13.18 06 Aug-10 Aug 5.85 0.03 0.00 5.82 Total 56.50 29.50 67.41 -40.41 Source: Credit Suisse
Exhibit 35: Year-to-date bond issuance (€, bn)
Country Amount issued
YTD in 2012 Expected issuance
for 2012 % completed year-to-date
Amount issued in 2011
Austria 17 22 76% 17 Belgium 23 32 74% 41 Finland 9 16 55% 14 France 126 178 71% 208 Germany 99 170 58% 189 Italy* 127 209 61% 223 Netherlands 43 60 71% 53 Spain 55 86 64% 97 Total 498 772 64% 841 Source: Credit Suisse, National Treasuries, * includes retail bonds
06 July 2012
European Strategy and Trades 29
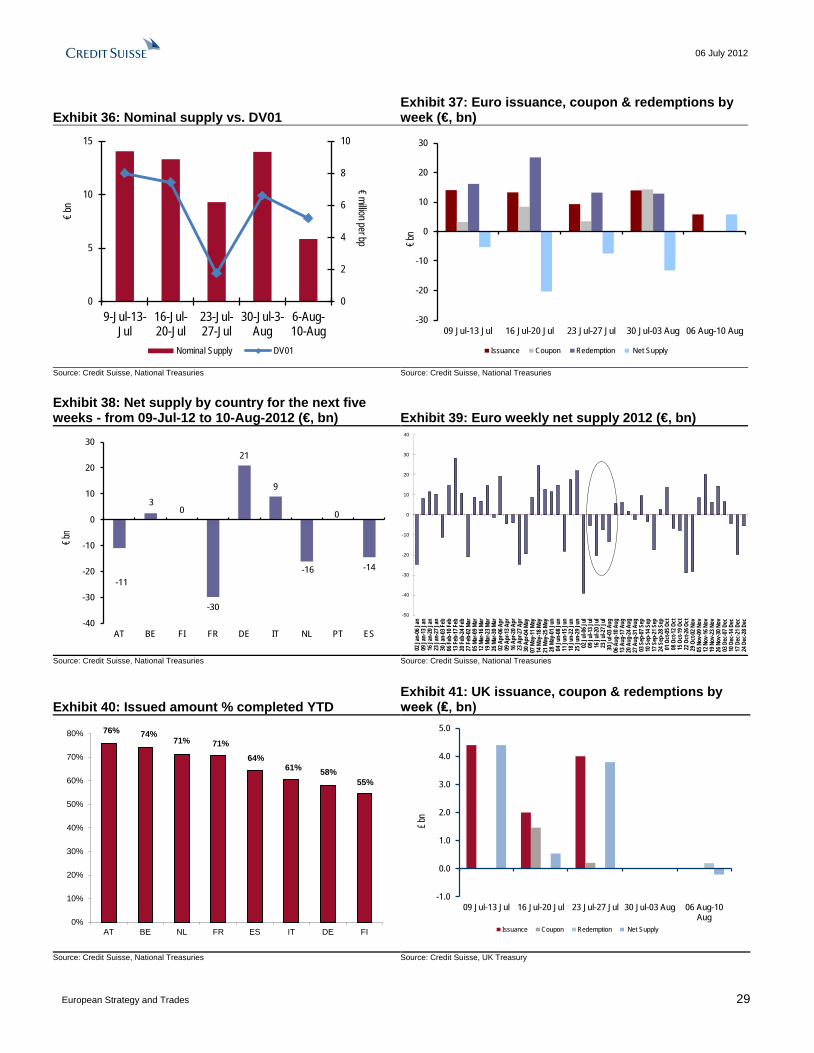
Exhibit 36: Nominal supply vs. DV01 Exhibit 37: Euro issuance, coupon & redemptions by week (€, bn)
0
2
4
6
8
10
0
5
10
15
9-Jul-13-Jul
16-Jul-20-Jul
23-Jul-27-Jul
30-Jul-3-Aug
6-Aug-10-Aug
€million per bp
€bn
Nominal Supply DV01
-30
-20
-10
0
10
20
30
09 Jul-13 Jul 16 Jul-20 Jul 23 Jul-27 Jul 30 Jul-03 Aug 06 Aug-10 Aug
€bn
Issuance Coupon Redemption Net Supply
Source: Credit Suisse, National Treasuries Source: Credit Suisse, National Treasuries
Exhibit 38: Net supply by country for the next five weeks - from 09-Jul-12 to 10-Aug-2012 (€, bn) Exhibit 39: Euro weekly net supply 2012 (€, bn)
-11
30
-30
21
9
-16
0
-14
-40
-30
-20
-10
0
10
20
30
AT BE FI FR DE IT NL PT ES
€bn
-50
-40
-30
-20
-10
0
10
20
30
40
02 Ja
n-06
Jan
09 Ja
n-13
Jan
16 Ja
n-20
Jan
23 Ja
n-27
Jan
30 Ja
n-03
Feb
06 Fe
b-10
Feb
13 Fe
b-17
Feb
20 Fe
b-24
Feb
27 Fe
b-02
Mar
05 M
ar-09
Mar
12 M
ar-16
Mar
19 M
ar-23
Mar
26 M
ar-30
Mar
02 A
pr-06
Apr
09 A
pr-13
Apr
16 A
pr-20
Apr
23 A
pr-27
Apr
30 A
pr-04
May
07 M
ay-11
May
14 M
ay-18
May
21 M
ay-25
May
28 M
ay-01
Jun
04 Ju
n-08
Jun
11 Ju
n-15
Jun
18 Ju
n-22
Jun
25 Ju
n-29
Jun
02 Ju
l-06 J
ul09
Jul-1
3 Jul
16 Ju
l-20 J
ul23
Jul-2
7 Jul
30 Ju
l-03 A
ug06
Aug
-10 A
ug13
Aug
-17 A
ug20
Aug
-24 A
ug27
Aug
-31 A
ug03
Sep
-07 S
ep10
Sep
-14 S
ep17
Sep
-21 S
ep24
Sep
-28 S
ep01
Oct-
05 O
ct08
Oct-
12 O
ct15
Oct-
19 O
ct22
Oct-
26 O
ct29
Oct-
02 N
ov05
Nov
-09 N
ov12
Nov
-16 N
ov19
Nov
-23 N
ov26
Nov
-30 N
ov03
Dec
-07 D
ec10
Dec
-14 D
ec17
Dec
-21 D
ec24
Dec
-28 D
ec
Source: Credit Suisse, National Treasuries Source: Credit Suisse, National Treasuries
Exhibit 40: Issued amount % completed YTD Exhibit 41: UK issuance, coupon & redemptions by week (₤, bn)
76% 74%71% 71%
64%61% 58%
55%
0%
10%
20%
30%
40%
50%
60%
70%
80%
AT BE NL FR ES IT DE FI
-1.0
0.0
1.0
2.0
3.0
4.0
5.0
09 Jul-13 Jul 16 Jul-20 Jul 23 Jul-27 Jul 30 Jul-03 Aug 06 Aug-10Aug
£ bn
Issuance Coupon Redemption Net Supply
Source: Credit Suisse, National Treasuries Source: Credit Suisse, UK Treasury
06 July 2012
European Strategy and Trades 30
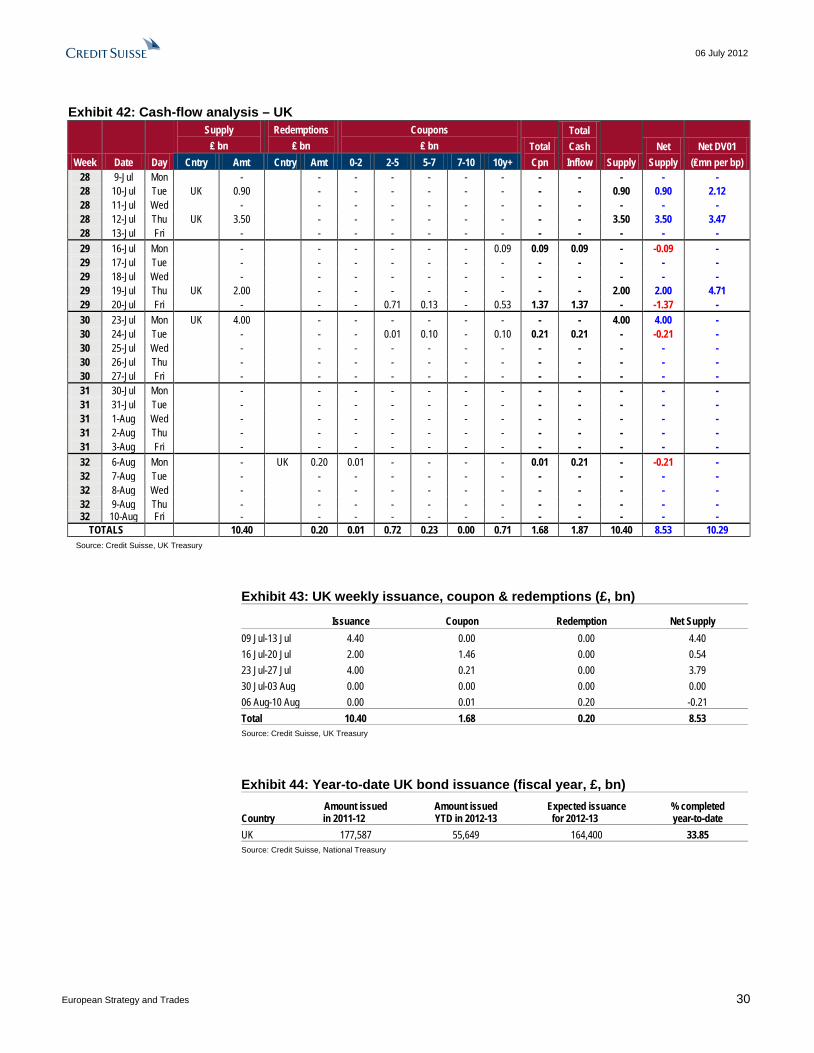
Exhibit 42: Cash-flow analysis – UK
Week Date Day
Supply ₤ bn
Redemptions ₤ bn
Coupons ₤ bn Total
Cpn
Total Cash Inflow Supply
Net Supply
Net DV01 (₤mn per bp) Cntry Amt Cntry Amt 0-2 2-5 5-7 7-10 10y+
28 9-Jul Mon - - - - - - - - - - - - 28 10-Jul Tue UK 0.90 - - - - - - - - 0.90 0.90 2.12 28 11-Jul Wed - - - - - - - - - - - - 28 12-Jul Thu UK 3.50 - - - - - - - - 3.50 3.50 3.47 28 13-Jul Fri - - - - - - - - - - - - 29 16-Jul Mon - - - - - - 0.09 0.09 0.09 - -0.09 - 29 17-Jul Tue - - - - - - - - - - - - 29 18-Jul Wed - - - - - - - - - - - - 29 19-Jul Thu UK 2.00 - - - - - - - - 2.00 2.00 4.71 29 20-Jul Fri - - - 0.71 0.13 - 0.53 1.37 1.37 - -1.37 - 30 23-Jul Mon UK 4.00 - - - - - - - - 4.00 4.00 - 30 24-Jul Tue - - - 0.01 0.10 - 0.10 0.21 0.21 - -0.21 - 30 25-Jul Wed - - - - - - - - - - - - 30 26-Jul Thu - - - - - - - - - - - - 30 27-Jul Fri - - - - - - - - - - - - 31 30-Jul Mon - - - - - - - - - - - - 31 31-Jul Tue - - - - - - - - - - - - 31 1-Aug Wed - - - - - - - - - - - - 31 2-Aug Thu - - - - - - - - - - - - 31 3-Aug Fri - - - - - - - - - - - - 32 6-Aug Mon - UK 0.20 0.01 - - - - 0.01 0.21 - -0.21 - 32 7-Aug Tue - - - - - - - - - - - - 32 8-Aug Wed - - - - - - - - - - - - 32 9-Aug Thu - - - - - - - - - - - - 32 10-Aug Fri - - - - - - - - - - - -
TOTALS 10.40 0.20 0.01 0.72 0.23 0.00 0.71 1.68 1.87 10.40 8.53 10.29 Source: Credit Suisse, UK Treasury
Exhibit 43: UK weekly issuance, coupon & redemptions (£, bn)
Issuance Coupon Redemption Net Supply 09 Jul-13 Jul 4.40 0.00 0.00 4.40 16 Jul-20 Jul 2.00 1.46 0.00 0.54 23 Jul-27 Jul 4.00 0.21 0.00 3.79 30 Jul-03 Aug 0.00 0.00 0.00 0.00 06 Aug-10 Aug 0.00 0.01 0.20 -0.21 Total 10.40 1.68 0.20 8.53 Source: Credit Suisse, UK Treasury
Exhibit 44: Year-to-date UK bond issuance (fiscal year, £, bn)
Country Amount issued in 2011-12
Amount issued YTD in 2012-13
Expected issuance for 2012-13
% completed year-to-date
UK 177,587 55,649 164,400 33.85 Source: Credit Suisse, National Treasury

06 July 2012
European Strategy and Trades 31
Exhibit 45: Total issuance fiscal year-to-date (£, mn) Short Term Medium Term Long Term Total Conventional Index Linked YTD Total Sales 20,427 11,442 14,623 46,492 9,157 Target for the Year 50,400 34,500 37,200 122,100* 35,300* % completed 41% 33% 39% 38% 26% % Remaining 59% 67% 61% 62% 74% Source: Credit Suisse, * total conventional and index linked issuance does not include £7bn in mini-tender
Exhibit 46: DMO issuance calendar
Operation Date Gilt Name Nominal Amount Issue (₤, mn) 10-Jul-2012 0½% Index-linked Treasury Gilt 2050 900 12-Jul-2012 1¾% Treasury Gilt 2022 3,500 19-Jul-2012 3¾% Treasury Gilt 2052 2,000* 23-Jul-2012 New UKTi 30Y* (syndication) 4,000* 16-Aug-2012 4½% Treasury Gilt 2034 2,000* 21-Aug-2012 0⅛% Index-linked Treasury Gilt 2029 1,400* 23-Aug-2012 5% Treasury Gilt 2018 4,000* 05-Sep-2012 4½% Treasury Gilt 2042 2,000* 11-Sep-2012 0¾% Index-linked Treasury Gilt 2034 1,400* 13-Sep-2012 1¾% Treasury Gilt 2022 3,500* 20-Sep-2012 1% Treasury Gilt 2017 4,000*
Source: DMO, Credit Suisse, * forecasts
06 July 2012
European Strategy and Trades 32
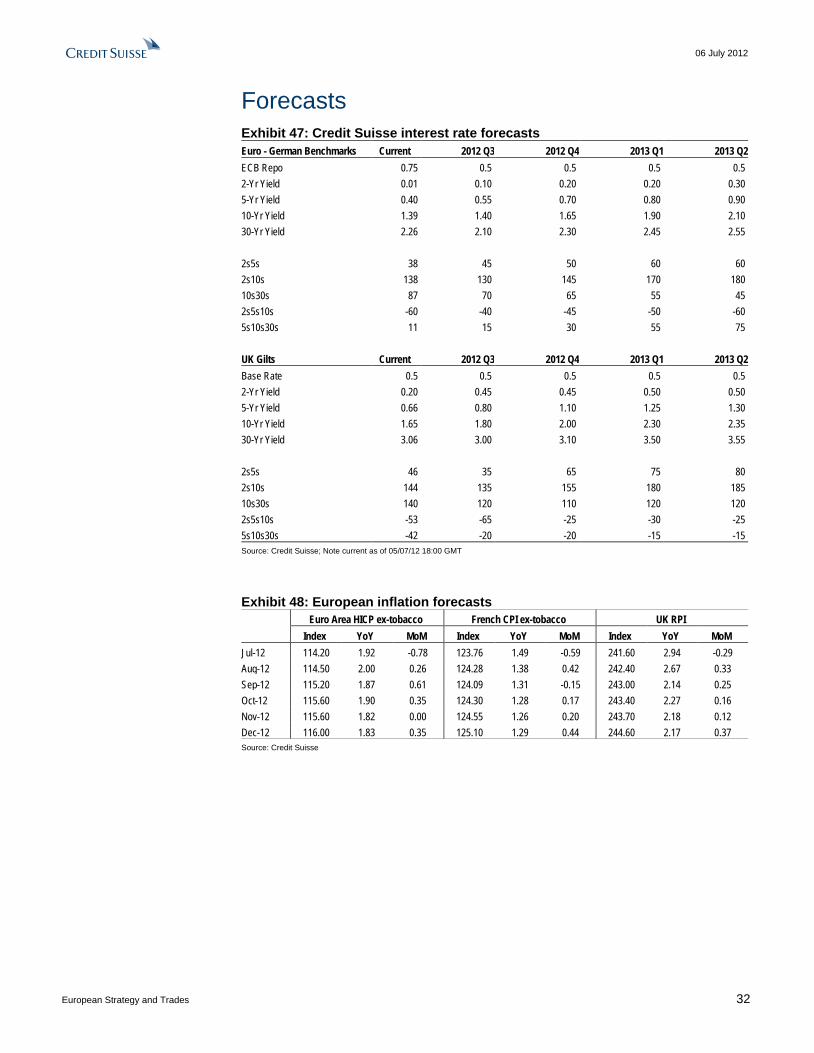
Forecasts Exhibit 47: Credit Suisse interest rate forecasts Euro - German Benchmarks Current 2012 Q3 2012 Q4 2013 Q1 2013 Q2 ECB Repo 0.75 0.5 0.5 0.5 0.5 2-Yr Yield 0.01 0.10 0.20 0.20 0.30 5-Yr Yield 0.40 0.55 0.70 0.80 0.90 10-Yr Yield 1.39 1.40 1.65 1.90 2.10 30-Yr Yield 2.26 2.10 2.30 2.45 2.55 2s5s 38 45 50 60 60 2s10s 138 130 145 170 180 10s30s 87 70 65 55 45 2s5s10s -60 -40 -45 -50 -60 5s10s30s 11 15 30 55 75
UK Gilts Current 2012 Q3 2012 Q4 2013 Q1 2013 Q2 Base Rate 0.5 0.5 0.5 0.5 0.5 2-Yr Yield 0.20 0.45 0.45 0.50 0.50 5-Yr Yield 0.66 0.80 1.10 1.25 1.30 10-Yr Yield 1.65 1.80 2.00 2.30 2.35 30-Yr Yield 3.06 3.00 3.10 3.50 3.55 2s5s 46 35 65 75 80 2s10s 144 135 155 180 185 10s30s 140 120 110 120 120 2s5s10s -53 -65 -25 -30 -25 5s10s30s -42 -20 -20 -15 -15 Source: Credit Suisse; Note current as of 05/07/12 18:00 GMT
Exhibit 48: European inflation forecasts Euro Area HICP ex-tobacco French CPI ex-tobacco UK RPI Index YoY MoM Index YoY MoM Index YoY MoM Jul-12 114.20 1.92 -0.78 123.76 1.49 -0.59 241.60 2.94 -0.29 Aug-12 114.50 2.00 0.26 124.28 1.38 0.42 242.40 2.67 0.33 Sep-12 115.20 1.87 0.61 124.09 1.31 -0.15 243.00 2.14 0.25 Oct-12 115.60 1.90 0.35 124.30 1.28 0.17 243.40 2.27 0.16 Nov-12 115.60 1.82 0.00 124.55 1.26 0.20 243.70 2.18 0.12 Dec-12 116.00 1.83 0.35 125.10 1.29 0.44 244.60 2.17 0.37 Source: Credit Suisse

INTEREST RATE STRATEGY
Eric Miller, Managing Director Global Head of Fixed Income and Economic Research
+1 212 538 6480 [email protected]
US RATES EUROPEAN RATES US DERIVATIVES Carl Lantz, Director US Head +1 212 538 5081 [email protected]
Helen Haworth, CFA, Director European Head +44 20 7888 0757 [email protected]
George Oomman, Managing Director Derivatives Head +1 212 325 7361 [email protected]
Ira Jersey, Director +1 212 325 4674 [email protected]
Michelle Bradley, Director +44 20 7888 5468 [email protected]
TECHNICAL ANALYSIS
David Sneddon, Managing Director +44 20 7888 7173 [email protected]
Steve Miley, Director +44 20 7888 7172 [email protected]
Christopher Hine, Vice President +1 212 538 5727 [email protected]
Pamela McCloskey, Vice President +44 20 7888 7175 [email protected]
Cilline Bain, Associate +44 20 7888 7174 [email protected]
Scott Sherman, Vice President +1 212 325 3586 [email protected]
Sabine Winkler, Director +44 20 7883 9398 [email protected]
Michael Chang, Vice President +1 212 325 1962 [email protected]
Panos Giannopoulos, Director +44 20 7883 6947 [email protected]
Carlos Pro, Associate +1 212 538 1863 [email protected]
Thushka Maharaj, Vice President +44 20 7883 0211 [email protected]
Eric Van Nostrand, Associate +1 212 538 6631 [email protected]
Florian Weber, Associate +44 20 7888 3779 [email protected]
Marion Pelata, Analyst +44 20 7883 1333 marion.pelata @credit-suisse.com
LOCUS ANALYTICS (US AND EUROPE)
Jennifer Drag, Director Locus Analytics Specialist +1 212 538 4303 [email protected]
PARIS SINGAPORE TOKYO
Giovanni Zanni, Director European Economics – Paris +33 1 70 39 0132 [email protected]
Jarrod Kerr, Director +65 6212 2078 [email protected]
Tomohiro Miyasaka, Director Japan Head + 81 3 4550 7171 [email protected]
Shinji Ebihara, Vice President +81 3 4550 9619 [email protected]

Disclosure Appendix
Analyst Certification The analysts identified in this report each certify, with respect to the companies or securities that the individual analyzes, that (1) the views expressed in this report accurately reflect his or her personal views about all of the subject companies and securities and (2) no part of his or her compensation was, is or will be directly or indirectly related to the specific recommendations or views expressed in this report.
Important Disclosures Credit Suisse's policy is only to publish investment research that is impartial, independent, clear, fair and not misleading. For more detail, please refer to Credit Suisse's Policies for Managing Conflicts of Interest in connection with Investment Research: http://www.csfb.com/research-and-analytics/disclaimer/managing_conflicts_disclaimer.html Credit Suisse’s policy is to publish research reports as it deems appropriate, based on developments with the subject issuer, the sector or the market that may have a material impact on the research views or opinions stated herein. The analyst(s) involved in the preparation of this research report received compensation that is based upon various factors, including Credit Suisse's total revenues, a portion of which are generated by Credit Suisse's Investment Banking and Fixed Income Divisions. Credit Suisse may trade as principal in the securities or derivatives of the issuers that are the subject of this report. At any point in time, Credit Suisse is likely to have significant holdings in the securities mentioned in this report. As at the date of this report, Credit Suisse acts as a market maker or liquidity provider in the debt securities of the subject issuer(s) mentioned in this report. For important disclosure information on securities recommended in this report, please visit the website at https://firesearchdisclosure.credit-suisse.com or call +1-212-538-7625. For the history of any relative value trade ideas suggested by the Fixed Income research department as well as fundamental recommendations provided by the Emerging Markets Sovereign Strategy Group over the previous 12 months, please view the document at http://research-and-analytics.csfb.com/docpopup.asp?ctbdocid=330703_1_en. Credit Suisse clients with access to the Locus website may refer to http://www.credit-suisse.com/locus. For the history of recommendations provided by Technical Analysis, please visit the website at http://www.credit-suisse.com/techanalysis. Credit Suisse does not provide any tax advice. Any statement herein regarding any US federal tax is not intended or written to be used, and cannot be used, by any taxpayer for the purposes of avoiding any penalties.
Emerging Markets Bond Recommendation Definitions Buy: Indicates a recommended buy on our expectation that the issue will deliver a return higher than the risk-free rate. Sell: Indicates a recommended sell on our expectation that the issue will deliver a return lower than the risk-free rate.
Corporate Bond Fundamental Recommendation Definitions Buy: Indicates a recommended buy on our expectation that the issue will be a top performer in its sector. Outperform: Indicates an above-average total return performer within its sector. Bonds in this category have stable or improving credit profiles and are undervalued, or they may be weaker credits that, we believe, are cheap relative to the sector and are expected to outperform on a total-return basis. These bonds may possess price risk in a volatile environment. Market Perform: Indicates a bond that is expected to return average performance in its sector. Underperform: Indicates a below-average total-return performer within its sector. Bonds in this category have weak or worsening credit trends, or they may be stable credits that, we believe, are overvalued or rich relative to the sector. Sell: Indicates a recommended sell on the expectation that the issue will be among the poor performers in its sector. Restricted: In certain circumstances, Credit Suisse policy and/or applicable law and regulations preclude certain types of communications, including an investment recommendation, during the course of Credit Suisse's engagement in an investment banking transaction and in certain other circumstances. Not Rated: Credit Suisse Global Credit Research or Global Leveraged Finance Research covers the issuer but currently does not offer an investment view on the subject issue. Not Covered: Neither Credit Suisse Global Credit Research nor Global Leveraged Finance Research covers the issuer or offers an investment view on the issuer or any securities related to it. Any communication from Research on securities or companies that Credit Suisse does not cover is factual or a reasonable, non-material deduction based on an analysis of publicly available information.
Corporate Bond Risk Category Definitions In addition to the recommendation, each issue may have a risk category indicating that it is an appropriate holding for an "average" high yield investor, designated as Market, or that it has a higher or lower risk profile, designated as Speculative and Conservative, respectively.
Credit Suisse Credit Rating Definitions Credit Suisse may assign rating opinions to investment-grade and crossover issuers. Ratings are based on our assessment of a company's creditworthiness and are not recommendations to buy or sell a security. The ratings scale (AAA, AA, A, BBB, BB, B) is dependent on our assessment of an issuer's ability to meet its financial commitments in a timely manner. Within each category, creditworthiness is further detailed with a scale of High, Mid, or Low – with High being the strongest sub-category rating: High AAA, Mid AAA, Low AAA – obligor's capacity to meet its financial commitments is extremely strong; High AA, Mid AA, Low AA – obligor's capacity to meet its financial commitments is very strong; High A, Mid A, Low A – obligor's capacity to meet its financial commitments is strong; High BBB, Mid BBB, Low BBB – obligor's capacity to meet its financial commitments is adequate, but adverse economic/operating/financial circumstances are more likely to lead to a weakened capacity to meet its obligations; High BB, Mid BB, Low BB – obligations have speculative characteristics and are subject to substantial credit risk; High B, Mid B, Low B – obligor's capacity to meet its financial commitments is very weak and highly vulnerable to adverse economic, operating, and financial circumstances; High CCC, Mid CCC, Low CCC – obligor's capacity to meet its financial commitments is extremely weak and is dependent on favorable economic, operating, and financial circumstances. Credit Suisse's rating opinions do not necessarily correlate with those of the rating agencies.

Structured Securities, Derivatives, and Options Disclaimer Structured securities, derivatives, and options (including OTC derivatives and options) are complex instruments that are not suitable for every investor, may involve a high degree of risk, and may be appropriate investments only for sophisticated investors who are capable of understanding and assuming the risks involved. Supporting documentation for any claims, comparisons, recommendations, statistics or other technical data will be supplied upon request. Any trade information is preliminary and not intended as an official transaction confirmation. OTC derivative transactions are not highly liquid investments; before entering into any such transaction you should ensure that you fully understand its potential risks and rewards and independently determine that it is appropriate for you given your objectives, experience, financial and operational resources, and other relevant circumstances. You should consult with such tax, accounting, legal or other advisors as you deem necessary to assist you in making these determinations. In discussions of OTC options and other strategies, the results and risks are based solely on the hypothetical examples cited; actual results and risks will vary depending on specific circumstances. Investors are urged to consider carefully whether OTC options or option-related products, as well as the products or strategies discussed herein, are suitable to their needs. CS does not offer tax or accounting advice or act as a financial advisor or fiduciary (unless it has agreed specifically in writing to do so). Because of the importance of tax considerations to many option transactions, the investor considering options should consult with his/her tax advisor as to how taxes affect the outcome of contemplated options transactions. Use the following link to read the Options Clearing Corporation's disclosure document: http://www.theocc.com/publications/risks/riskstoc.pdf Transaction costs may be significant in option strategies calling for multiple purchases and sales of options, such as spreads and straddles. Commissions and transaction costs may be a factor in actual returns realized by the investor and should be taken into consideration.

References in this report to Credit Suisse include all of the subsidiaries and affiliates of Credit Suisse AG operating under its investment banking division. For more information on our structure, please use the following link: https://www.credit-suisse.com/who_we_are/en/. This report is not directed to, or intended for distribution to or use by, any person or entity who is a citizen or resident of or located in any locality, state, country or other jurisdiction where such distribution, publication, availability or use would be contrary to law or regulation or which would subject Credit Suisse AG or its affiliates (“CS”) to any registration or licensing requirement within such jurisdiction. All material presented in this report, unless specifically indicated otherwise, is under copyright to CS. None of the material, nor its content, nor any copy of it, may be altered in any way, transmitted to, copied or distributed to any other party, without the prior express written permission of CS. All trademarks, service marks and logos used in this report are trademarks or service marks or registered trademarks or service marks of CS or its affiliates. The information, tools and material presented in this report are provided to you for information purposes only and are not to be used or considered as an offer or the solicitation of an offer to sell or to buy or subscribe for securities or other financial instruments. CS may not have taken any steps to ensure that the securities referred to in this report are suitable for any particular investor. CS will not treat recipients of this report as its customers by virtue of their receiving this report. The investments and services contained or referred to in this report may not be suitable for you and it is recommended that you consult an independent investment advisor if you are in doubt about such investments or investment services. Nothing in this report constitutes investment, legal, accounting or tax advice, or a representation that any investment or strategy is suitable or appropriate to your individual circumstances, or otherwise constitutes a personal recommendation to you. CS does not advise on the tax consequences of investments and you are advised to contact an independent tax adviser. Please note in particular that the bases and levels of taxation may change. Information and opinions presented in this report have been obtained or derived from sources believed by CS to be reliable, but CS makes no representation as to their accuracy or completeness. CS accepts no liability for loss arising from the use of the material presented in this report, except that this exclusion of liability does not apply to the extent that such liability arises under specific statutes or regulations applicable to CS. This report is not to be relied upon in substitution for the exercise of independent judgment. CS may have issued, and may in the future issue, other reports that are inconsistent with, and reach different conclusions from, the information presented in this report. Those reports reflect the different assumptions, views and analytical methods of the analysts who prepared them and CS is under no obligation to ensure that such other reports are brought to the attention of any recipient of this report. CS may, to the extent permitted by law, participate or invest in financing transactions with the issuer(s) of the securities referred to in this report, perform services for or solicit business from such issuers, and/or have a position or holding, or other material interest, or effect transactions, in such securities or options thereon, or other investments related thereto. In addition, it may make markets in the securities mentioned in the material presented in this report. CS may have, within the last three years, served as manager or co-manager of a public offering of securities for, or currently may make a primary market in issues of, any or all of the entities mentioned in this report or may be providing, or have provided within the previous 12 months, significant advice or investment services in relation to the investment concerned or a related investment. Additional information is, subject to duties of confidentiality, available on request. Some investments referred to in this report will be offered solely by a single entity and in the case of some investments solely by CS, or an associate of CS or CS may be the only market maker in such investments. Past performance should not be taken as an indication or guarantee of future performance, and no representation or warranty, express or implied, is made regarding future performance. Information, opinions and estimates contained in this report reflect a judgement at its original date of publication by CS and are subject to change without notice. The price, value of and income from any of the securities or financial instruments mentioned in this report can fall as well as rise. The value of securities and financial instruments is subject to exchange rate fluctuation that may have a positive or adverse effect on the price or income of such securities or financial instruments. Investors in securities such as ADR’s, the values of which are influenced by currency volatility, effectively assume this risk. Structured securities are complex instruments, typically involve a high degree of risk and are intended for sale only to sophisticated investors who are capable of understanding and assuming the risks involved. The market value of any structured security may be affected by changes in economic, financial and political factors (including, but not limited to, spot and forward interest and exchange rates), time to maturity, market conditions and volatility, and the credit quality of any issuer or reference issuer. Any investor interested in purchasing a structured product should conduct their own investigation and analysis of the product and consult with their own professional advisers as to the risks involved in making such a purchase. Some investments discussed in this report may have a high level of volatility. High volatility investments may experience sudden and large falls in their value causing losses when that investment is realised. Those losses may equal your original investment. Indeed, in the case of some investments the potential losses may exceed the amount of initial investment and, in such circumstances, you may be required to pay more money to support those losses. Income yields from investments may fluctuate and, in consequence, initial capital paid to make the investment may be used as part of that income yield. Some investments may not be readily realisable and it may be difficult to sell or realise those investments, similarly it may prove difficult for you to obtain reliable information about the value, or risks, to which such an investment is exposed. This report may provide the addresses of, or contain hyperlinks to, websites. Except to the extent to which the report refers to website material of CS, CS has not reviewed any such site and takes no responsibility for the content contained therein. Such address or hyperlink (including addresses or hyperlinks to CS’s own website material) is provided solely for your convenience and information and the content of any such website does not in any way form part of this document. Accessing such website or following such link through this report or CS’s website shall be at your own risk. This report is issued and distributed in Europe (except Switzerland) by Credit Suisse Securities (Europe) Limited, One Cabot Square, London E14 4QJ, England, which is regulated in the United Kingdom by The Financial Services Authority (“FSA”). This report is being distributed in Germany by Credit Suisse Securities (Europe) Limited Niederlassung Frankfurt am Main regulated by the Bundesanstalt fuer Finanzdienstleistungsaufsicht ("BaFin"). This report is being distributed in the United States and Canada by Credit Suisse Securities (USA) LLC; in Switzerland by Credit Suisse AG; in Brazil by Banco de Investimentos Credit Suisse (Brasil) S.A; in Mexico by Banco Credit Suisse (México), S.A. (transactions related to the securities mentioned in this report will only be effected in compliance with applicable regulation); in Japan by Credit Suisse Securities (Japan) Limited, Financial Instruments Firm, Director-General of Kanto Local Finance Bureau (Kinsho) No. 66, a member of Japan Securities Dealers Association, The Financial Futures Association of Japan, Japan Securities Investment Advisers Association, Type II Financial Instruments Firms Association; elsewhere in Asia/ Pacific by whichever of the following is the appropriately authorised entity in the relevant jurisdiction: Credit Suisse (Hong Kong) Limited, Credit Suisse Equities (Australia) Limited, Credit Suisse Securities (Thailand) Limited, Credit Suisse Securities (Malaysia) Sdn Bhd, Credit Suisse AG, Singapore Branch, and elsewhere in the world by the relevant authorised affiliate of the above. Research on Taiwanese securities produced by Credit Suisse AG, Taipei Branch has been prepared by a registered Senior Business Person. Research provided to residents of Malaysia is authorised by the Head of Research for Credit Suisse Securities (Malaysia) Sdn Bhd, to whom they should direct any queries on +603 2723 2020. This research may not conform to Canadian disclosure requirements. In jurisdictions where CS is not already registered or licensed to trade in securities, transactions will only be effected in accordance with applicable securities legislation, which will vary from jurisdiction to jurisdiction and may require that the trade be made in accordance with applicable exemptions from registration or licensing requirements. Non-U.S. customers wishing to effect a transaction should contact a CS entity in their local jurisdiction unless governing law permits otherwise. U.S. customers wishing to effect a transaction should do so only by contacting a representative at Credit Suisse Securities (USA) LLC in the U.S. This material is not for distribution to retail clients and is directed exclusively at Credit Suisse's market professional and institutional clients. Recipients who are not market professional or institutional investor clients of CS should seek the advice of their independent financial advisor prior to taking any investment decision based on this report or for any necessary explanation of its contents. This research may relate to investments or services of a person outside of the UK or to other matters which are not regulated by the FSA or in respect of which the protections of the FSA for private customers and/or the UK compensation scheme may not be available, and further details as to where this may be the case are available upon request in respect of this report. CS may provide various services to US municipal entities or obligated persons ("municipalities"), including suggesting individual transactions or trades and entering into such transactions. Any services CS provides to municipalities are not viewed as “advice” within the meaning of Section 975 of the Dodd-Frank Wall Street Reform and Consumer Protection Act. CS is providing any such services and related information solely on an arm’s length basis and not as an advisor or fiduciary to the municipality. In connection with the provision of the any such services, there is no agreement, direct or indirect, between any municipality (including the officials, management, employees or agents thereof) and CS for CS to provide advice to the municipality. Municipalities should consult with their financial, accounting and legal advisors regarding any such services provided by CS. In addition, CS is not acting for direct or indirect compensation to solicit the municipality on behalf of an unaffiliated broker, dealer, municipal securities dealer, municipal advisor, or investment adviser for the purpose of obtaining or retaining an engagement by the municipality for or in connection with Municipal Financial Products, the issuance of municipal securities, or of an investment adviser to provide investment advisory services to or on behalf of the municipality. Copyright © 2012 CREDIT SUISSE GROUP AG and/or its affiliates. All rights reserved. Investment principal on bonds can be eroded depending on sale price or market price. In addition, there are bonds on which investment principal can be eroded due to changes in redemption amounts. Care is required when investing in such instruments. When you purchase non-listed Japanese fixed income securities (Japanese government bonds, Japanese municipal bonds, Japanese government guaranteed bonds, Japanese corporate bonds) from CS as a seller, you will be requested to pay purchase price only.


