Embed Size (px)
Citation preview

1
Paper prepared for WRSA:s 51th Annual Meeting in Kauai, Hawaii, February 8-11, 2012
Revised version
Mats Johansson & Daniel Rauhut
Royal Institute of Technology (KTH) Division of Urban and Regional Studies
Drottning Kristinas väg 30 SE-100 44, Stockholm, Sweden
Contact: [email protected]
EUROPEAN URBAN-RURAL RELATIONS – A MULTI-FACETED CONCEPT
Abstract. This paper is based on and developed from the EDORA project (European Development Opportunities for Rural Areas), part of the ESPON 2013 Programme, where a new delimitation of the European regions, based on economic and structural variables, were constructed.1 Two regional typologies play a central role in the analysis: The first is a typology of demographic change based on the demographic equation and developed in the context of both the ESPON Programme, and DG Agriculture’s SERA (Study on Employment in Rural Areas) project. The second is a structural typology and focused on economic transformation and restructuring, a typology that was developed in the EDORA project. These two typologies will be used as a framework to explore patterns of demographic and economic change within urban and rural areas at different stages in the process of transformation, from more or less pure agrarian economies to the new rural economy or the “new rurality”, with its orientation towards market service activities, where the location to urban areas is of great importance. Four types of rural regions are founded and analyzed from a demographic and structural point of view. The distribution of the demographic types allows the roles of natural population increase, migration and total population change in different kinds of rural areas to be distinguished.
Keywords: urban and rural types, new rurality, demographic development, fertility, ageing, reproduction potentials
Acknowledgements. This paper is based on the typologies that were constructed in the ESPON-project European Development Opportunities for Rural Areas (EDORA) headed by Andrew Copus at University of Highlands and Islands (UHI) and Nordregio where Mats Johansson also participated. These typologies have been cross-tabulated with the typologies from ESPON 1.1.4 and the following updated version (Johansson 2009). See also Copus and Johansson (2010) for more detailed descriptions of the urban/rural types.
1 ESPON is an EU-financed research programme. ESPON was an abbreviation of European Spatial Planning Observation Network (ESPON 2006 Programme) but is today an abbreviation of European Observation Network for Territorial Development and Cohesion (ESPON 2013 Programme).

2
URBAN-RURAL RELATIONS – NON-STATIC CONCEPTS The regional development during the past decades in Europe has favoured regions in the core of Europe. The losers are often old factory towns and remote sparsely populated rural areas - the rural exodus is still a reality. This changed urban/rural hierarchy has also had positive effects on the rural areas in rural areas in the neighbourhood of expansive metropolitan areas. These peri-urbanization processes are often connected to the concepts of the “new rural economic order” or “new rurality” with new settlement patterns, new employment opportunities and more urban activities (see e.g. Beale 1975; Berry 1976; Champion 1989, 1992, 1998; Fielding 1982, 1989; Westlund and Pichler 2006; Eliasson, Johansson and Westlund 2008; Copus, Johansson, and McQuaid 2007; Johansson and Kupsiszwiski 2009).
The EDORA-typology was developed in the ESPON-project “European Development Opportunities for Rural Areas (EDORA)” that was a part of the ESPON 2013 programme, where new delimitations of the European regions, based on economic and structural variables, were constructed. Urban-rural delimitations of the European regions, based on 13 economic and structural variables, were identified and five new types of urban-rural regions were distinguished (for more detailed descriptions, see Copus et. al. 2010, Copus and Johansson 2010):2 0. Predominately Urban,
1. Agrarian, 2. Consumption Countryside, 3. Diversified with Strong Secondary Sector 4. Diversified with Strong Market Services Sector
This typology is also central in this paper as it seems to be most useful in characterizing and analyzing expanding and retarding rural areas, the “new rurality” and the new rural economic order. The EDORA-typology - Geographic Patterns
The principal findings with regard to the EDORA-types are (see also Maps 2 and 4): 3
Predominantly urban regions are primarily localized in the Pentagon – the area that is delimited by London-Paris-Milan-Munich-Hamburg-London. Other predominantly urban regions are often to be found in capital regions and larger city regions as at the Spanish east coast (Barcelona and Valencia) or in the “old” British industrial districts (e.g. Liverpool, Manchester, Newcastle and Birmingham) – cities and regions that are in huge transformations economically as well as socially.
Agrarian regions are concentrated in a peripheral eastern and southern arc, stretching from the Baltic States, through Poland, Slovakia, Romania, Bulgaria and Greece, Southern Italy, southern France, southern and western Spain, and eastern Portugal (Alentejo).
The rest of the European space seems to be characterized by a patchwork of three types of rurality, Consumption Countryside, Diversified (with Strong Secondary Sector) and Diversified (with Strong Private Services Sector). Of these the last one seems to be to some
2 For a complementary delimitation, see Dijkstra and Poelman 2008. 3 This part is based on Copus and Johansson 2010.

3
extent associated with the most accessible areas and also the one that is most associated with the new rurality.
Consumption Countryside regions are often closely associated with Agrarian ones. It has also ingredients of the new rurality especially then in regions surrounding large cities. Indeed some Mediterranean regions, especially in Greece, meet according to the EDORA-estimations and rural delimitations the criteria for both types. Consumption Countryside regions cover much of Sweden and Finland, more accessible coastal areas of the Baltic States, parts of Slovenia, Austria, much of eastern and southern Germany, much of central and southern Italy, Corsica, southern and central France, eastern and northern Spain, the coastal regions of Portugal, and most of the less densely populated parts of the UK and Ireland.
Map 1. The EDORA Structural Typology. Source: EDORA; Copus and Johansson, 2010.

4
The Diversified (Strong Secondary Sector) regions are found in the Czech Republic, Slovenia, and Slovakia, northern and Eastern Germany, around Madrid, and in northern Spain, and the English Midlands. These regions can also be seen as industrial regions that in many cases are in a state of deindustrialization and transformation. Especially in the new member states they seems to be in a stagnating or retarding phase and lose people both as a consequence of natural population decrease and out-migration.
The last category – Diversified (Strong Market Services) is evident in northern and central France, northern Germany, southern Denmark, the Skåne region in the south of Sweden, parts of central England, southern Scotland, and in a few regions of Spain and Italy. In the New Member States this type of region is associated with regions close to national capitals (Budapest, Bucharest, Vilnius). As mentioned above this category is the one that is most associated with the new rurality or the new rural economy.
A Demographic Typology
In the ESPON 2006 project 1.1.4; “Spatial effects of demographic trends and migration”, a typology based on the demographic equation (i.e. regional population change = natural population change + net-migration) was produced. The six-fold typology comprised each combination of the three demographic components. The result is a summary of the demographic situation in each region and the preconditions with regard to future population trends, shedding light on issues such as sustainability, population growth, depopulation and ageing. The typology that was presented in ESPON 1.1.4 covered the period 1996-1999. It has since then been updated, developed and extended in relation to the period 2000-2005, in Copus et.al. (2006), Johansson (2009) and in combination with the EDORA Strucural Typology in Copus and Johansson (2010). In this study the estimations have been developed to include almost every NUTS3-region (1343) within the “ESPON space”4. In order to avoid confusion between the two typologies and their constituent types they will hereafter be referred to as the “Structural” and “Demographic” typologies.
The method that is used concerning annual total population change is estimations based on the demographic equation. The demographic equation is usually expressed as:
Total population change = (births – deaths) + (in-migration – out-migration).
The estimations of natural population development are based on the number of births and deaths during the investigated period. Both total and natural population development include consequently the same number of years. The same will also be the case concerning the estimations of the migration balances. At regional level – in this case NUTS3 – it is, however, difficult to separate international migration from internal regional migration as the migration variable is estimated as a residual.
Most of the data derives from Eurostat. The 2006 NUTS region definitions have been used. For the great majority of countries and their regions the required data is available. However, some data problems arose due to revisions of the NUTS-delimitations, or because data has not been delivered to Eurostat. In particular the data for Denmark 2000-2005 are not in line with the data for the other countries. In order to integrate Denmark and its new NUTS3-regions into the analyses some estimations were carried out. As the demographic equation is based upon relative processes – annual changes in percent – estimation is relatively easy. In 4 ESPON covers the EU27 plus “partner countries”, the principal ones being Norway, Switzerland, Liechtenstein and Iceland.

5
other cases where data is missing for single years interpolation or extrapolation, based on the annual development has been used in order to construct a consistent series. This will, however, not disturb the results in any significant way.
Table 1: A schematic typology with regard to sustainable demographic development
Type PT PM PN Regional characteristics
1 PT>0 PM>0 PN>0
Double positive regions - In-migration and young
population/”high” TFR. High sustainability both in short and
long term. The most favorable case
2 PT>0 PM>0 PN<0
Growth regions with natural decrease - In-migration of people
with low TFR. Natural population decrease because of lopsided
age structure and/or low TFR. Dependent on in-migration. No
sustainability in long term – weak reproduction potential.
3 PT>0 PM<0 PN>0
Growth regions with out-migration - Out-migration and young
population/”high” TFR and natural population increase. Short
term – sustainability. Long term – eroding sustainability
because of lopsided age structure (out-migration).
4 PT<0 PM<0 PN>0
Declining regions with natural increase - Out-migration but
still young population/”high” TFR. Traditionally high fertility
regions. Falling TFR -> low sustainability
5
PT<0
PM>0
PN<0
Declining regions with in-migration - In-migration and lop-
sided age structure (old population)/low TFR. In-migration of
elderly people and/or singles, low reproduction potential.
Dependent on in-migration. Low sustainability both in short
and long run.
6 PT<0 PM<0 PN<0
Double negative regions - Out-migration and lop-sided age
structure with old population/low TFR. No sustainability in
short as well as long term. Depopulation. The worst case.
PT= Total population change
PM= Migratory balance, net-migration
PN= Natural population change
TFR = Total Fertility Rate Source: ESPON 1.1.4, Copus et.al. 2006, Johansson 2009, Copus and Johansson 2010.
The Demographic typology and the distribution of the differing types are presented in Map 3 and Table 2. In Table 2 the population size of the types are also estimated and related to the number of regions. From these figures it is also possible to see if large and small regions are over- or underrepresented within the six types. One way to analyze if various large regions are over- or underrepresented in the different types is to relate the relative distribution of the total population to the relative distribution of the number of regions. An index is then created by calculating the share of people in the relevant types in types i divided with the share of total number of regions in types i, and then multiply it with 100. If the result is over/under 100 the share of the population is higher/lower in the type i compared to the distribution of the total number of regions and vice versa. The size index (SI) can thus be written as:

6
SI = (Pi/Ri) *100 (F1) SI (Size Index) = weighted index according to size
Pi = share of the total population in type i (percent) Ri = share of all regions in type i (percent) The over- and underrepresentation with relation to population size is shown in Table 2.
Map 2. The demographic typology for the period 2000-2005 (NUTS3, N=1343)

7
Table 2: The distribution among the types with regard to number of regions and population size. (Iceland and two UK regions excluded).
2000-2005 Type 1 Type 2 Type 3 Type 4 Type 5 Type 6
Number of regions (N=1343) 31,1 29,5 4,5 4,5 10,3 20,0
Population Size (N=1343) 42,1 23,1 8,9 4,6 6,5 14,7
Size/numbers
Index: 100 135,4 78,4 196,4 100,7 63,5 73,6
Source: Source: Estimations based on data from Eurostat and Statistics Denmark.
Geographic Patterns5
Type 1: Double Positive Regions
The first three categories of regions have all experienced a positive population development in the sense that population has increased. The most favorable case is Type 1, where both natural population change and net-migration were positive and they reinforced each other, with population increase as a consequence. The regions in Type 1 do not necessarily have the fastest population increase – but it is a function of both natural population change and net-migration. From a sustainable point of view this case is, however, the most favorable combination and the only one that is sustainable in the long term. Long-term sustainability depends to a great extent on the mix and relationship between natural population change and in-migration.
From Table 2 it seems obvious that Type 1 is the most frequent type (both with regard to the number of regions and size of population). Type 1 is frequent in the Pentagon, metropolitan areas in the Nordic countries and regions with good climate, amenities and living conditions such as the southern part of Spain and parts of Greece.
Almost one third of the regions were represented in this type 2000-2005. Compared to the situation during the second half of the 1990s Type 1 has become more dominant over time (Johansson 2009). This is also more pronounced concerning population concentration – in 2005 42 percent of the population within the ESPON space was in this category. This indicates that the largest regions have better preconditions to grow and expand than the smaller ones. This is also an indication that the largest regions have grown as a consequence of both in-migration and positive natural population change and even if migration is the prime driver behind population change it also has effects on natural population increase. It must be kept in mind that differing migratory movements with regard to gender and age have consequences for the natural population changes and reproduction potentials in differing kinds of regions. In short, in-migration areas are in a better situation both with regard to natural population increase and reproduction potential than out-migration areas. This is a consequence of the higher share of fertile women in the in-migration areas just as a consequence of net in-migration.
Type 2: Growth regions with natural decrease In the second type population increase is still dependent on in-migration but contrary to Type 1 the negative natural population change hampers the population increase but not so much
5 This chapter is partly based on Johansson 2009.

8
that it results in population decrease. This phenomenon is often the case in “dynamic” regions where many households, especially among the in-movers, consist of singles and small households. The result is weak and eroding reproduction potentials and a low sustainability in long term as a consequence of low fertility rates. This phenomenon is apparent in the expanding parts of Northern Italy as well as metropolitan areas in the Eastern Europe as the Warsaw, Prague, Bratislava, Budapest regions and even the Sophia area located in a country with a problematic population development. Even growing areas in Spain, France and United Kingdom and Germany have regions that are characterized by in-migration in combination with negative natural population change. This development seems also to have been accentuated during 2000-2005 compared to 1996-1999 (Johansson 2009).
Comparing to Type 2 the relation between the shares of regions and population concentration 2000-2005 was contrary to the relation in Type 1. The number of regions was overrepresented compared to the share of population concentration – 23 percent of the ESPON inhabitants were living in 30 percent of the regions (see Table 2). Even in this case positive migratory movements may stimulate natural population change even if the latter still is negative.
Type 3: Growth regions with out-migration In this type, the positive effect of natural population change neutralizes a negative migration effect. Even in this case, preconditions for a sustainable population development are good – at least in short term – as the population base is still favorable because of natural population increase. In the long term, one of the likely results of out-migration is a drain of younger people, a skewed age structure, a weak reproduction potential, and in the end an undermining of a sustainable population development.
Type 3 is not frequently represented within the ESPON space, accounting for around 5 percent of the regions 2000-2005. The low level has been accentuated since the second half of the 1990s when 10 percent of the regions were in type 3 (Johansson 2009). This is perhaps not surprising as natural population increase is seldom as large as or larger than total change due to net in-migration.
Type 3 regions are represented in the north-eastern parts of Poland and the north-western parts of France, western parts of Switzerland, northern Slovakia and some parts of Finland (Map 3). Compared to the second half of the 1990s the share of regions within this type has almost been halved and many regions have changed position. Still Poland – even if there has been a shift westwards – and France are most frequently represented within this type and the same is valid for northern Slovakia.
Even for Type 3 there seems to be an overrepresentation of large regions despite the negative net-migration. Even if the shares in Type 3 were halved since the mid 1990s – probably as an effect of out-migration – a natural population increase could still be observed but not as important as in the second half of the 1990s. The overrepresentation of the large regions is – perhaps surprisingly – most pronounced in this category. One explanation to this phenomenon can be an effect of the small number of regions in this type. It must be kept in mind that small number of regions implies that changes with regard to numbers and size must be interpreted with some caution. Small changes may well result in considerable redistribution effects.
Type 4: Declining regions with natural increase Type 4 regions are similar to Type 3, combining negative net migration with positive natural population change, but in this case the impact on total population development is negative. In

9
the long term there is an obvious risk for this group that migration induced changes in age structure and fertility will result in natural change turning negative, and shifting the regions into Type 6. There is thus a threat that the vulnerable situation of Type 4 will worsen and the preconditions for a sustainable population development will disappear.
The Type 4 regions are predominantly localized in the peripheral and sparsely populated rural areas of the ESPON space - parts of Finland and Norway, eastern Poland, southern Italy, France, Spain and Bulgaria. Type 4 has the same signs of the components – but of different relative size – as Type 3 with differing outcome concerning the effects on total population. Then it would not be surprising if they should alter between each other over time. This seems, however, not to have been the case as the shares with respect to the signs seem to be very similar regarding the number of regions during the two periods and this is also underlined by data. That something has happened seems, however, obvious if the share of population is compared over time as the population shares have decreased dramatically. The drop in the number of regions in Type 4 resulted in a rather balanced relation 2000-2005. This implies that it was the largest regions with natural population increase that changed signs from net out-migration to net in-migration.
This is of course only one explanation but the tendencies towards increased importance of Type 1 don’t work against this hypothesis even if there are a lot of other alterations. The hypothesis of changing positions from Type 3 and Type 4 to Type 1 is also confirmed by analyzing the alterations of differing types from the data set that show that a large part of the above discussed types changed positions between the periods 1995-1999 and 2001-2005 (see Johansson 2009, Table 3). In both cases the strategic variable is the changed sign of net-migration.
Type 5: Declining regions with in-migration Type 5 is characterized by in-migration in combination with negative natural population change. This is typical for regions that are attractive in terms of settlement patterns and living conditions for elderly people, but also for areas that are dynamic with a lot of singles and highly educated people among the in-migrants. This results in a negative natural population development that is large enough to counteract the positive sign of net migration. These regions are similar to those of Type 2, which are distinguished by their positive total population development. Type 5 regions are, however, in a more problematic long term situation with regard to sustainable population development as the lopsided age structure combined with low fertility rates might result in accentuated population decline and depopulation. Regions where retirement migration is a central ingredient for the total population development will then accentuate the development towards a non-sustainable population development.
Even if there are some regions in Southern Europe most of the regions in Type 5 seem, however, not to be “retirement paradises”. Instead, most regions are predominately localised in Eastern Europe and Germany. By comparing Spain and Germany between 1995-1999 and 2000-2005 it is obvious that many Type 5 regions have converted to Type 2. This means that the net-migration has been more important than the natural population change with regard to total population change with the result that total population development has changed from being negative to positive. The natural population decrease indicates, however, for these altering regions that the potentials for a sustainable population development with good reproduction potentials still are shaky.

10
Type 6: Double negative regions Type 6, where the natural population decrease reinforces the effects of out-migration is the least favorable in terms of sustainability. This is the infamous “vicious circle” or “negative spiral” process. This is also the worst case and these regions are in a very bad situation with unsustainable population development and the chances of changing this process are not good.
From Map 3 it seems apparent that many of the Type 6 regions are located in the European periphery. Large parts of Sweden, Baltic States, Hungary, but even parts of Spain and Germany are in this category. It can also be seen from Table 2 that it is predominantly small regions that are localized in Type 6. It is also obvious that small regions are overrepresented in this category – a phenomenon that has been accentuated since the second half of the 1990s. On the other hand history is witness of a lot of cases of reversal processes regarding negative economic, social and demographic development.
There are, however, signs of changing development paths from viscous circle to a virtuous one for some regions in this category. From a non-static point of view it is also a fact that regions that seem to have bad preconditions – at least at a first glance – instead have changed this backward situation to a favorable situation with respect to change and development. All these changes are results of the shifting regional migratory balance from negative to positive signs. This underlines the great impact of migration on and its role as the prime driver for regional demographic development. It is also symptomatic that only in a few cases the advancement from Type 6 was a function of a positive natural population development (Johansson 2009, Table 3).
Comparing with the situation during the second half of the 1990s it is still obvious that at least the Eastern European countries have considerable demographic problems that weaken the preconditions for a sustainable demographic development with eroding territorial cohesion as one consequence. Population decrease combined with negative natural population change is not a good and promising mix from a sustainable development point of view.
THE DEMOGRAPHIC AND THE EDORA STRUCTURAL TYPOLOGY – DIFFERENT TYPES, DIFFERENT OUTCOMES
In this part of the study the Demographic types are cross-tabulated against the Structural types in order to investigate the differences between the five Structural types for sustainable population development and depopulation. Some conclusions can be drawn based on the tables below and consisting of almost all regions within the ESPON Space with the exception of Iceland. The number of regions and the size of the different Structural types are shown in Table 3 below.
Table 3: The distribution of the five Structural types. Based on numbers of regions (NUTS3) and population size (%). Size index (F1), over- or underrepresented with regard to size (index=100, neither nor).
Structural Types, N=1343 %N %size Size index
0. Predominantly Urban 31,9 43,9 137,6 1. Agrarian 15,6 13,1 84,0 2. Consumption Countryside 34,2 23,7 69,3 3. Diversified (strong secondary sector) 7,0 6,3 90,0 4. Diversified (strong market services) 11,2 13,0 116,1

11
In Table 4 (number of regions) and Table 6 (population size) the Demographic types are distributed with respect to the Structural types. As can be seen in Table 5 it is obvious that the Structural types only to some degree follow the Demographic distribution.
Three Structural types are “overrepresented” in Type 1 – the most favorable type from a sustainable demographic point of view. These are the ”Predominantly Urban” and the two “Diversified rural types”. All three have a higher share of regions in Type 1 compared to the total share of all ESPON regions (see Table 7). The predominantly urban areas show the expected pattern overrepresentations in Type 1 and Type 3.
The relatively good population development in the diversified countryside with a strong secondary sector is perhaps less expected. This type of region accounts for only 7 percent of the regions and 6 percent of the population within the ESPON space, and are concentrated in the Czech Republic, Poland and Spain. The diversified countryside with a strong secondary sector has also gone through a deindustrialization process with the result that these regions have experienced a vicious circle with regard to migration and natural population development. Almost 28 percent of these regions experienced net out-migration during the period 2000-2005 – perhaps a surprisingly low figure for regions dependent on the declining manufacturing industries. The situation is, however, more precarious when the natural population development is taken into consideration – 50 percent of the regions with 60 percent of the population in this structural type experienced natural population decrease. In many cases this hampered the positive effects of the net in-migration. Thus around 20 percent of these regions, consisting of 26 percent of the population were in the worst performing Demographic category (Type 6) where the natural population decrease reinforces the negative effects of net out-migration (Table 4 and Table 6). From Map 4 it can be seen that the development in the diversified countryside with a strong secondary sector seems to show a polarized geographical localization. The expanding areas are to be found in the central or western parts of the ESPON space while the retarding and declining ones are to be found in the old industrial districts in the new eastern member states. This implies that the first category already had been reconstructed and changed the viscous circle to a virtuous one with population increase as one result. This seems, however, to have taken place during the deindustrialization period the decades before the new century. The most unproductive units were closed down during the deindustrialization process and the most productive and knowledge-based survived even if the employment decreased. This was not the fact in the old state-owned factories in the former centrally planned economies. Instead of renewal and reconstruction the development was in many cases characterized by rigidity and “lock-in” mechanisms that prolonged the negative development as one result. The new rurality or the new rural economy seems neither to have an alternative to the retarding and stagnating economic development. These phenomena might be some of the reasons to the unstable and unsustainable demographic situation in some of these rural areas.
The diversified countryside with strong market services structural type accounts for 11 percent of the regions within the ESPON Space and 13 percent of the population. This category shows good population development, as does the Consumption Countryside group which accounts for 34 percent of the regions and 24 percent of the population. The prime driver behind the good demographic development in these categories is – as usual – in-migration. The net in-migration figures with regard to the number of regions were 80 and 71

12
percent correspondingly (see Table 4). The figures with regard to size are 77 respectively 79 percent (see Table 6). The latter figure is, by the way, higher than the corresponding one for the predominantly urban category.
Map 3. The Demographic Typology of the four non-urban EDORA Structural types for the period 2000-2005 (NUTS3).

13
These high figures might be an effect of the “new rurality” or the “new rural economic order” that has changed the performance of the countryside in many European countries and especially then in densely populated rural areas in the surroundings of big urban agglomerations. The densely populated rural regions are in a more favorable position with regard to population change than other more peripheral rural regions. This is not especially surprising as densely populated rural regions have experienced a relatively positive population development during the past decades (Copus et.al., 2006; Johansson & Kupiszewski 2009, Edora, Activity 2.11, Demography).
Despite the high in-migration figures in the categories “Consumption Countryside” and “Diversified (strong market services)” the effects of the natural population decrease hamper the positive population change. In the first case 66 percent of the regions consisting of 55 percent of the population showed a negative natural population development during the period 2000-2005. It was, thus, the small regions that had the weakest reproduction potentials and this can be an effect of differing migration patterns with regard to large and small regions. Out-migration often results in natural population decrease as a consequence of shortage of young and fertile women. This seems to be a fact especially in Demographic Type 6 with both out-migration and natural population decrease (see Tables 4 and 6). It is not a qualified guess that many of these regions might be sparsely populated and localized far away from the metropolitan areas. From Map 3 it seems obvious that it is the peripheral areas in the northern part of Europe that seems to be in the most troublesome situation but even central parts of Germany and some parts in the new member states are characterized by both natural population decrease and negative migratory balance. Here, it must also be noticed that in 23 percent of the regions live only 15 percent of the population. The regions in the eastern part of Europe show similarities with the agrarian regions in the same areas. This will result in a future precarious situation for these regions in general and for the rural ones especially.
This can be contrasted to the figures in the diversified countryside with strong market services where only 8 percent of the regions with 6 percent of the population are in Demographic Type 6 (see Tables 4 and 6). In this category there were 53 percent of the regions with only 38 percent of the population that was hurt by a negative natural population development in 2000-2005. These rural areas are predominantly localized in the western part of Europe – and then especially in France – and it might also be in this kind of rural areas that the “new rurality” has been established. It seems, however, also in this case to be small peripheral and sparsely populated rural regions that is hurt mostly by the demographic development with ageing and depopulation as one result (Johansson 2009, see also Map 3 and Tables 4 and 6). The few blue spots are to be found predominantly in the eastern part of Europe.
The rural category with the most negative demographic development was the Agrarian. Only 36 percent of the regions with a population share of 34 percent showed population increase between the years 2000 and 2005. This negative development can also be illustrated by the fact that only 14 percent of the regions were to be found in Demographic Type 1 and as many as 36 percent of the regions and 39 percent of the agrarian population within the ESPON Space in Type 6. In other words, the Agrarian regions are in a very problematic situation from a sustainable demographic point of view. These regions are mainly found in Eastern Europe and parts of Spain and are associated with transformation problems. These regions are still waiting for the effects of the “new rurality” or the “new economic rural order” and this situation is in many cases also reinforced by the economic transformation in other sectors that

14
hamper the population development as a consequence of natural population decrease as well as net out-migration.
Even with regard to agrarian regions most of the rural regions in Eastern Europe are among the “degrading” ones. The overwhelming majority of these regions are in Bulgaria and Romania – countries that are characterized by a very deep and hard population crisis with population decline in both countries. The active component here is once again migration – internal as well as external – that is the prime driver in this downgrading process. Despite
this precarious situation it seems that it is mainly the metropolitan areas that experience positive population development. In Bulgaria three NUTS3-regions had a positive population development and in Romania the corresponding figure was two. The regions in Bulgaria are Varna and Sofia and its surroundings and in Romania it is the environs of Bucharest and the other is Ilfov – a region characterized by diversified countryside with strong market services. The agrarian regions seem here – as in many other countries – to be involved in processes dominated by viscous circles and negative development spirals.
Table 4: The distribution of the Demographic types with regard to the five Structural types. Number of regions (%). Period 2000-2005. Combinations highlighted in yellow are those where the share (%) exceeds the average for all relevant Structural types.
Structural Types % Demographic Types, N=1343
Type 1 Type 2 Type 3 Type 4 Type 5 Type 6
Structural Types Total 31,1 29,5 4,5 4,5 10,3 20,0
0. Predominantly Urban 39,4 28,9 6,3 3,5 8,9 13,1
1. Agrarian 14,3 17,1 4,3 10,5 18,1 35,7
2. Consumption Countryside 28,5 33,3 2,4 2,8 9,6 23,3
3. Diversified (strong secondary sector) 37,2 25,5 2,1 5,3 9,6 20,2
4. Diversified (strong market services) 35,1 39,1 7,9 4,0 6,0 7,9
Table 5: Over- and underrepresentation of the various Demographic types with regard to number of regions in the Structural types. Period 2000-2005.
Over-/underrepresentation. Index = 100 neither/nor
Structural/Demographic Types totally, N=1343, NUTS3
Type 1 Type 2 Type 3 Type 4 Type 5 Type 6
0. Predominantly Urban 126,7 98,0 139,9 77,7 86,0 65,3
1. Agrarian 45,9 58,1 95,2 232,8 175,7 178,6
2. Consumption Countryside 91,8 113,0 53,3 62,9 93,1 116,6
3. Diversified (strong secondary sector) 119,7 86,5 47,3 118,2 93,0 101,1
4. Diversified (strong market services) 112,9 132,5 176,6 88,3 57,9 39,7

15
Table 6: The distribution of the Demographic types with regard to the five Structural types. Based on population size (%) 2005. Period 2000-2005. Combinations highlighted in yellow are those where the share (%) exceeds the average for all relevant Structural types.
Size: % Structural and Demographic Types, N=1343, NUTS3
Type 1 Type 2 Type 3 Type 4 Type 5 Type 6
Structural Types Total 42,1 23,1 8,9 4,6 6,5 14,7
0. Predominantly Urban 51,5 20,7 12,1 2,9 4,7 8,2
1. Agrarian 15,5 12,1 6,3 15,7 11,2 39,1
2. Consumption Countryside 38,5 32,2 3,9 2,4 7,9 15,1
3. Diversified (strong secondary sector) 33,7 23,6 2,2 4,5 10,5 25,6
4. Diversified (strong market services) 45,4 27,9 13,5 3,2 3,6 6,4
Large regions – better preconditions
The size index (SI) used here (Table 7) in order to investigate if the size has importance for the demographic development in the differing Structural types is constructed in same way as formula F1 above. By combining Tables 4 – 6 and the discussion above it seems obvious that large regions are in better positions concerning sustainable demographic development than small ones and this can also be seen in Table 7 where the over- or underrepresentation of large regions is presented.
The overrepresentation in the growing Demographic types is valid for almost all Structural types except the diversified countryside with a strong secondary sector – all other types are overrepresented in the growing Demographic types 1 and 3 (Table 7). In this case it is instead the types 5 and 6 where the large regions are overrepresented. This is an indication of the large transformation problems these regions have experienced with deindustrialization and depopulation as one obvious result.
It can also be noticed that large regions are overrepresented in Demographic Type 3. It must here be kept in mind that Type 3 is a small category both within all regions and the Structural categories. The highest share is to be found in the category diversified countryside with strong market services with 8 percent of the regions and 14 percent of the population in this Structural category (see Tables 4 and 6). The total distribution in relative terms is 5 and 9 percent respectively. This means also that small absolute changes may result in large relative effects with regard to the size index and the results ought to be interpreted with some care. One illustration of these shaky results is the large overrepresentation of almost all Structural types for the Demographic type 3. The same reasoning is also applicable with respect to Demographic type 4. This type shows, however, declining regions and this is also a hint that large regions have better demographic development preconditions than small ones. It is only the agrarian regions that are overrepresented in this type. As can be seen, large agrarian regions are overrepresented also in Demographic type 3. These large agrarian regions are thus characterized by a combination of out-migration and natural population increase. This is also an indication of the old truth that agrarian regions have higher fertility than the more urban ones were children is more likely a consumption product than a production factor (Becker 1993). This gap has, however, diminished as a consequence of the economic and social transformation, out-migration and “defamilization” even in peripheral agrarian areas (ESPON 1.1.4 2005).

16
Table 7: Over- and underrepresentation of the various demographic (ESPON) types with regard to population size 2005 in the differing Structural types. Period 2000-2005. Size/numbers: Edora/Demographic Types, N=1343. NUTS3.
Over 100 = large regions overrepresented, under 100 = large regions underrepresented
Demographic Types Type 1 Type 2 Type 3 Type 4 Type 5 Type 6
Structural Types Total 135,4 78,4 196,4 100,7 63,5 73,6
0. Predominantly Urban 130,8 71,6 191,8 81,6 52,7 62,6
1. Agrarian 108,8 70,8 147,1 150,1 61,9 109,5
2. Consumption Countryside 134,9 96,6 160,7 84,4 82,8 64,9
3. Diversified (strong secondary sector) 90,5 92,4 101,3 84,2 109,2 126,7
4. Diversified (strong market services) 129,2 71,5 169,6 81,3 61,0 80,2
RURALITY, FERTILITY, MIGRATION AND AGEING
Rural areas are often associated with ageing areas. This is – at least partly – a consequence of out-migration of younger people from these areas to the urban ones. Despite the higher fertility rates (TFRs) in rural areas the out-migration of younger people has resulted in a lopsided age structure that eroded the reproduction potential (too few women in fertile ages) with slow or negative natural population result as one result. This process seems to have been reinforced today as the fertility rates have dropped even in the out-migration (rural) areas. It has also been argued that with the change of the economic structure from the agrarian to the industrial and post-industrial societies, the value of having many children has fundamentally changed. In the pre-industrial period children were useful and welcome additions to the work force. In the industrial and post-industrial societies children are cost factors in a twofold way: there are direct costs for schooling and maintaining children up to the time when they leave the common household and there are indirect costs when the mother (and in rare cases the father) has to give up their employment to stay at home and take care of the child. With the ongoing rationalisation and structural transformation process, the changing function and societal value of children has become apparent and the reduction of births is the consequence in urban as well as rural regions (see e.g. Becker 1960, 1965, 1993; Schultz 1974). Population increase/decrease is thus not only dependent of the total fertility rates (TFRs) but also of the age structure of women – a precondition for natural population growth - which is, in itself, dependent of the number of women of childbearing age.
The ongoing transformation process does not lead to the reduction of fertility alone, but also to the postponement of the first birth. The average age of women having their first baby has thus increased in recent decades. Women consciously avoid childbearing and thus ‘child-dependency’ in young ages in order to improve their career possibilities, investment in higher education and a more independent life-style. The rise in female labour force participation rates and general investments in higher education have resulted in higher family incomes while also having two contradictory effects with regard to childbearing – an income effect and a price or substitution effect. According to the Noble Prize winner Gary Becker, the income effect should result in higher fertility as households with higher incomes have more money to spend on children than households with lower incomes. The price or substitution effect, however, implies that higher incomes also result in an increase in the relative price of children. This, in its turn, reduces the demand for children and increases the demand for other commodities (Becker 1960, 1965, 1993).

17
In reality, the substitution effect seems to have had a greater impact on childbirth than the income effect, at least in the recent past. Investment in higher education has also had a decreasing effect of its own: having invested in a higher education, one is more oriented towards capitalising on ones investment in human capital, even if the return is not as high, ex post, as it was supposed to be, ex ante. Another trend factor here is the increase of single people or one-person households. The proportion of ‘singles’ or one-person households is thus significantly higher in the post-industrial than in the industrial and agrarian eras – the share of one-person households has increased in recent decades across most parts of Europe, while the social institution of life-long marriage has declined as a consequence of the rise in the number of divorces. On the other hand, there has been a sharp rise in non-marital cohabitation. This looser type of relationship results in a rise in the share of ‘singles’, as many of these relationships are not as long-lived as those of traditional marital cohabitation. For this category the substitution effect seems to be higher than for married or cohabiting people. The obvious significant negative correlation between the share of singles and childbirth, for this reason alone, is not surprising.6 From at least a theoretical point of view, there is also a connection between natural population development and migration as the most mobile people also are in the ages 20-30. This relation is often neglected or downgraded in the analyses of the “population crisis” that generally focuses on low TFRs. The natural population development often is, however, a cohort phenomenon – large cohorts reproduce large cohorts and vice versa. The strategic variable here is then TFR that varies both with regard to time and place and changes in population size and structure are often connected to long-term changes in economic and social conditions. If the fertility rates will be around or below the reproduction rate – that is around 2.1 - in the future natural population change will be a cohort phenomenon and a consequence of migratory movements. This implies also that migration even in the future will be the prime driver behind regional population change – both positive and negative. This is valid for the development in urban as well as rural areas of differing character. The differences in the population structure are thus not only a function of the differences in fertility rates. It is rather the migratory movements that cause the regional differences in age structure. Migration intensities are highest in ages 20-30, which have differing impacts on in- or out-migration regions. In some regions, low fertility rates have traditionally dominated, while in others, the problems have been connected with out-migration and lopsided age structures, and particularly the out-migration of younger women with natural population decrease as one consequence. During the past decades, declining fertility rates (TFRs) and out-migration have, however, reinforced each other in many European regions and communities resulting in an accentuated population decrease. The opposite is, however, also valid – traditional in-migration areas have low TFRs as a consequence of a high share of singles and in some cases high female labour force participation rates. This results in a situation where the reproduction potential is eroded and population growth is dependent on 6 This at least is very obvious in Sweden, but ought to be valid even in other parts of Europe. In the Swedish case, there are differences between various regions. In metropolitan areas and university regions, the share of “singles” is higher than in industrial or rural areas especially in the childbearing ages. The ‘single’ gap has, however, also diminished in recent decades as a consequence of the societal transformation occurring in all regions. The fact that rural families have always been larger than urban ones is partly a consequence of a higher share of “singles” in urban areas, particularly in the metropolitan ones (see e.g. Johansson, 1999, Statistics Sweden various years. For the ESPON space, see ESPON 2005).
18
continuous in-migration. This is an obvious fact in many expansive in-migration areas in Europe where the future reproduction potential remains weak. There is then a connection between natural population development and migration. Low birth rates and migratory movements have thus resulted in population redistribution within the European territory. One result is that ageing has progressed to various stages in different regions and nations and especially remote rural regions where huge out-migration has hurt this process.
The concept of depopulation is neither far from clear. Most often the concept is used almost synonymously with population decline, but sometimes it is reserved for population decline of a certain enduring nature, or even more narrowly confined to processes that carry ominous signs of socio-economic impacts. These kinds of concern may, as already indicated, relate to socio-economic implications of distortions of the age-pyramid, or of demographic ‘thinning-out’ of already sparsely populated (and often remotely located) areas. Depopulation may, thus, be regarded as a special course of development in the process of population change, often indicated by certain probable demographic implications or impacts with a problem potential (for instance ageing of the population and the labour force, increasing dependency ratios, labour shortage, decreasing demographic vitality and natural growth potential etc.,) and associated with long-term demographic process (notably the “modern” fertility decline and sometimes – and even combined with – enduring territorial patterns of uneven selective migration). This process is also a cohort phenomenon as a consequence of cohorts moving up through the age pyramid over time. Large cohorts will have more children than small ones and vice versa with the age-specific fertility rates. Ageing in Europe is thus, at least in part, an effect of the falling and generally low TFRs of recent decades, and of the fact that cohorts in reproductive ages have diminished. Ageing is thus a long-term process and without migratory movements it is, as such, a cohort phenomenon. As indicated above, long-term out-migration seems to imply accelerating depopulation and ageing in sparsely populated rural and peripheral regions and in regions lagging in economic and labour market performance. Even consumer needs and preferences probably change in the wake of demographic transformation while certain areas will be relatively more influenced by the upper segment of the age-pyramid. Ageing will not however impact uniformly on regions. Given the diversity of the impact on regions, the necessity to “adapt to their demographic circumstances” will require different measures in different regions. Even if ageing is a more or less a general ingredient in the population development in Europe, this process has progressed to various stages in different regions and nations. Ageing and its relation to the labor force is also one of the most discussed topics today in respect of current and future labor market problems. On the other hand, many regions with a high share of elderly people are also in-migration areas with regard to this category – many of these regions can be characterized as ‘retirement paradises’ that attract people who are pensioners who then move to areas where the climate and other amenities are favorable for elderly people. These areas thus differ significantly from the traditional ageing areas that instead may be characterized as de-population areas. By combining Map 3 and Map 5 it can be seen that ageing is a phenomenon that exists both in expansive in-migration areas and traditional out-migration ones (for a more thorough discussion, see ESPON 2005).

19
At a regional level, however, European narratives tell us many different stories. This requires statistical analysis and research to be carried out at a more detailed territorial scale taking into account the fact that demographic trends are only one single factor among a very large and complex set of factors influencing socio-economic development, and – after all – probably the slowest and most predictable factor, traditionally considered to be the outcome rather than the cause of socio-economic change.
Map 5. Ageing (65 years and over) in Europe (ESPON Space), 2008. NUTS3. Quartiles. Source: Eurostat.
Min Max
Q1 4,1 15,6
Q2 15,7 18,4
Q3 18,4 20,8
Q4 20,8 30,7

20
Ageing Europe – geographic and structural patterns
One method to investigate the distribution of the EU elderly people – 65 years and over – is to divide them in quartiles. Q4 has the oldest population and Q1 the lowest share. In Table 8 and Table 9 the population has been distributed as regards their structural types both with regard to numbers of regions and the size of the regions. It must be kept in mind that the presented shares in the quartiles are based on the ESPON space ranking in order to standardize for the various sizes between the different structural types. The distribution of the Qs within the five structural types indicates, however, the types’ various position as “old” or “young” types or regions. In Table 10 the over- or underrepresentation is presented according to size and numbers. The general geographic pattern at NUTS3-level is illustrated in Map 5.
From Table 8 it is obvious that structural type Predominantly Urban has the most equal distribution of elderly people – 23 percent is localized in the oldest category (Q4) and 29 percent in the “youngest” category (Q1). The type Agrarian has almost one third of its population in Q1 – a fact that perhaps is surprising as agrarian and rural areas often have the image of ageing regions. This can, however, been explained by the fact that most of the regions in the new member states can be characterized as Agrarian. These regions have still a relatively “young” population despite the low fertility rates (see Maps 1 and 5) and the life expectancy is neither in level with the ones in the old EU-countries. This means that even if the share of children is falling the share of people in active ages is still high and the age pyramid has not yet been lop-sided like the age structure in the old EU-members such as most parts of Portugal, Spain, Italy, Greece, Germany and Sweden.
The structural type Consumption Countryside shows a quite different age structure. More than one third of the EU-regions are to be found in this type and of them the overwhelming parts are placed in Q4 and Q3. By combining Maps 2, 4 and 5 it is obvious that those regions are characterized by ageing and lop-sided age structures. The low fertility rates during the past decades have now resulted in high shares of elderly people in these countries and in a lot of their regions. Portugal, parts of Spain and Italy, large part of Germany and the Nordic countries, UK and Ireland can be characterized as Consumption Countryside and many of these have for a long time been in a process of ageing even if the causes differ somewhat. In e.g. the Italian regions, it is primarily an effect of low fertility rates and in the Portuguese and Spanish regions it is often a combination of low fertility and out-migration that have eroded the reproduction potential. In the Nordic ageing regions it is, however, the out-migration of fertile women that can explain the regional ageing processes. In Germany, and especially in the eastern part, it is the redistribution of the population that is the prime driver as regards the ageing process – a process that during the last decades has been reinforced by the sharp drop in fertility. The type Consumption Countryside can in many cases be seen as typical for the migratory movements’ impact on ageing and eroding reproduction potential.
Another extreme type is the Diversified Regions with a strong secondary sector that only represent 7 percent of the regions and 6,5 percent of the population 2008. The type consists of “young oldies” in the sense that Q1 and Q2 take the major part; around three fourth of the population is to be found in the lower quartiles. One explanation might be that these regions are characterized by low life expectancy like many deprived industrial areas in the Eastern Europe. As mentioned earlier this structural type is localized here and there but mainly concentrated in Central Europe around Vienna, Bratislava, Prague and Southern Poland. Most of these regions can be characterized as stagnating and retarding as a consequence of deindustrialization and transformation. Other Diversified Regions with a strong secondary

21
sector in the western part of Europe experience, however, a contrary population development with both natural population increase and net in-migration. The interpretation of this geographic pattern shall be taken with some care as the type consists of only a small share of the regions and total population. One conclusion can, however, be drawn and it is that the eastern regions seem to be more delayed in the development and transformation process compared to the western regions. This type seems also to be the most dual with regard to development and deindustrialization.
Type 4, Diversified Rural Regions with strong market services is probably the one that has most in common with the new rurality. The type is concentrated to western part of Europe in many cases around large city agglomerations. The population development is good and the population is neither especially old nor young based on the quartile estimations. The both extreme quartiles take the same part of the population and Q2 has the largest share – the next “youngest” quartile with regard to the population aged 65 and more. The type is also expanding in the sense that it is often characterized by both natural population increase (families) and net in-migration – two components that are associated with a relatively young population. This type will probably also result in better growth opportunities than types with a more ageing population that is characterized by natural population decrease and net out-migration such as Type 6 even if the population is relatively “young” in this type compared to many others, perhaps as consequence of lower life expectancy rates and higher TFRs during the 19760s and 1980s. This conclusion can be indicated by combining Maps 3 and 4 with Tables 8 and 9.
Table 8. Ageing, 65 years and over. Numbers of regions 2008, EDORA structural types, quartiles, N=1345. Source: Estimations Based on regional population data from Eurostat
Structural Types Q1 Q2 Q3 Q4 % N Numbers% 0. Predominantly Urban 28,8 22,6 25,8 22,8 100,0 430 32,0 1. Agrarian 32,4 27,6 15,7 24,3 100,0 210 15,6 2. Consumption Countryside 15,3 22,0 32,2 30,5 100,0 459 34,1 3. Diversified (strong secondary sector) 38,3 35,1 13,8 12,8 100,0 94 7,0 4. Diversified (strong market services) 24,3 30,3 21,1 24,3 100,0 152 11,3
1345 100
Table 9. Ageing, 65 years and over. Size of the regions 2008, EDORA structural types, quartiles, N=1345. Source:Estimations based on Eurostat
Structural Types Q1 Q2 Q3 Q4 % Size Size% N Numbers% 0. Predominantly Urban 40,2 29,0 19,8 11,0 100,0 216188064 42,5 430 32,0 1. Agrarian 51,3 26,7 11,3 10,7 100,0 71588396 14,1 210 15,6 2. Consumption Countryside 26,6 23,3 27,8 22,3 100,0 119332748 23,5 459 34,1 3. Diversified (strong secondary sector) 50,4 33,2 8,4 7,9 100,0 33224744 6,5 94 7,0 4. Diversified (strong market services) 34,1 32,4 16,9 16,6 100,0 67845977 13,4 152 11,3
508179929 100 1345 100

22
Table 10. Ageing, 65 years and over. Size/numbers: Edora/Demographic Types, N=1345. NUTS3. Over 100 = large regions overrepresented, under 100 = large regions underrepresented. Source:Estimations based on Eurostat
Structural Types Q1 Q2 Q3 Q4
0. Predominantly Urban 139,5 128,4 76,6 48,3 1. Agrarian 158,3 96,8 72,2 43,9 2. Consumption Countryside 174,4 106,1 86,2 73,0 3. Diversified (strong secondary sector) 131,7 94,7 61,0 61,9 4. Diversified (strong market services) 140,1 107,1 80,2 68,2
Young Europe – split geographic and structural patterns
The ageing process in the European regions corresponds to a similar process concerning the decreasing share of children – here defined as less than 15 years old. This is a function of low TFRs and lop-sided age structures as well as changed preferences with regard to childbearing.
TFR has declined in almost every part of Europe since the 1960s and is now below the reproduction rate (2.1) in almost every country. Since the 1960s a drastic change in the position with regard to TFR-levels has occurred. Countries with traditionally high fertility rates became low-level countries and vice versa. The Nordic countries with low levels in the 1960s became relatively high-level countries by the turn of the century while Southern and Eastern Europe had taken up a position at the bottom in the “fertility league”. Regions with extremely low fertility rates are to be found in Portugal, Spain, Italy, Bulgaria, Slovenia, Hungary, Germany and Latvia. Within these countries wide “depopulation” areas exist, and in some of them regional polarisation seems to be on the increase, with declining and growing areas existing side by side. This is the case in e.g. Spain and Italy. The countries of Southern and Eastern Europe have also experienced substantial demographic changes during the past centuries and are becoming particularly vulnerable particularly in respect of the demographic prospects of certain regions. In many of these depopulation regions the drop in TFR, with this being a common feature concerning both urban and rural areas in these regions, has reinforced the effects of out-migration during the 1990s and the first decade of the new century (see e.g. ESPON 1.1.4, Johansson 2009). In Map 6 it is obvious that peripheral and depressed regions in Eastern Germany (former GDR), Spain, Portugal, Greece and Bulgaria have a small share of children. The common denominators for these regions are low fertility rates (see Map 7) and out-migration of people – especially then young women in fertile and household creating ages that erode the reproduction potentials. In 2008 only around 3 percent of the NUTS3-regions in the ESPON space show a TFR above the reproduction rate (2.1) and 9 percent over 2.0. This can, however, be an undervaluation as the estimations are based on NUTS2 data. Even if so, the reality tells that the overwhelming majority of the European regions (within the ESPON space) are in a very precarious situation concerning the reproduction in the long term. The population increase is dependent of in-migration as the reproduction potential is too low. In-and out-migration have impact on both population size and age structure and this is valid both for urban and rural areas. Especially the pure agrarian in the Eastern Europe with low TFRs and huge out-migration and the Consumption Countryside in the northern parts of Nordic countries and eastern part of Germany are in a problematic situation with depopulation as one apparent risk (see Map 3).

23
Another case is the more expansive regions in Northern Italy and large parts of Spain where the population increase to a large extent is dependent of continuous in-migration, both internal and external. The similarities with depopulation areas are the low TFRs but this is compensated by the in-migration and its positive effects on the population increase even if the fertility rates are below the reproduction level and the natural population change is negative. In the coastal areas of Spain the natural population change is even positive as a consequence of in-migration and its impact on the age structure of the population. These migratory flows consist also to a large degree of one person households that accentuate the skewed age structure with a high share of people in active ages with few children. In line with this process is the defamilization that is a consequence of the huge migration among the young adults that has loosen the family ties in e.g. the Italian society, in rural as well as urban areas (Vogel 2003, ESPON 2005). Another consequence of the rural-urban migration patterns is then that families with a lot of children hesitate to move away to new settlement areas. It is also a well-known fact that singles are more motivated to migrate than families and especially the families with children. One effect of this is the relatively high shares of children in the Southern parts of Italy and Spain where the family ties still are strong.
Growth zones are, thus, in general affected by a surplus of migration. Migration – internal as external – has a more dominant impact on regional population change today as a consequence of low fertility rates and lopsided age structure in many regions. Once again, it must be kept in mind that there is a connection between migratory movements and natural population change. Even if the total fertility rates in out-migration areas – often rural – traditionally have been high the age structure among women is skewed with a shortage of women in fertile ages. The result will be natural population decrease. The contrary is then also valid for in-migration areas – even if the fertility rates are low the age structure is positive from a reproduction point of view. Population growth can only be explained by migration – including immigration – because the balance of births and deaths is negative or very small with regard to natural population change. In these areas the population dynamic is increasingly driven by migration and less by the surplus of births. At regional and local levels migratory movements are, thus, the prime driver behind population change and they have also been of more importance at the national level in recent decades as a consequence of the increased inflow of immigrants and refugees (Johansson 2009). Natural population change is, thus, not only dependent of the level of TFR but also on the age structure of women – a precondition for natural population growth is the number of women in the childbearing ages. Estimations have also shown that there exists a positive correlation between TFR on the one hand and total population change as well as natural population change on the other, even if this correlation is not especially strong. The correlation between net-migration and total population change is however much stronger (see e.g. ESPON 1.1.4 and estimations based on Eurostat data 2005-2009). Based on cross-section analysis for the ESPON space, the connection between ageing and natural population development seems to be non-existent. Even here it is, however, obvious that there are regional variations. In Southern Europe there is a high correlation between ageing and natural population change in the expected negative way. The same can be said for the new EU-members in Central Europe and for the countries in Southeastern part of Europe – Bulgaria, Romania and Slovenia – even if the correlations are not strong. In Northern Europe there is also a significant correlation between natural population decline and ageing

24
(ESPON 1.1.4, Johansson 2009). This indicates that out-migration has a negative impact on natural population development and subsequently also on ageing in the out-migration area and consequently vice versa in the in-migration areas. It must also be kept in mind that ageing also is a consequence of the fact that people are living longer than before – the life expectancy has increased in most parts of Europe. The above mentioned discussion indicates that there is no straightforward connection between ageing and natural population change at the aggregate level, though in many cases they exist at more disaggregated regional levels.
Map 6. The share of children (percent, less than 15 years old) in Europe (ESPON Space) 2008. Quartiles. Source: Eurostat.
Min Max
Q1 5,6 13,5
Q2 13,5 15,2
Q3 15,2 16,7
Q4 16,7 24,7

25
Map 7. Total fertility rates (TFRs) in Europe (ESPON Space) 2008. NUTS3 based on NUTS2-figures. Source: Eurostat.
By comparing the five structural types some differences can be found concerning the share of children in the differing regions. The same kind of tables as were presented in the ageing part are reproduced but with focus on settlement pattern of children (Tables 9-11). This is also an indication of the settlement pattern of families and a high share of children indicates that these areas are attractive for families with children. From five bivariate regressions it can be shown that there exits also a significant positive correlation between in-migration 2005-2009 and the shares of children younger than 15 years old. Table 11 shows the regression equations for the five structural types and for all regions:
Number of children per women0.75 - 1.171.17 - 1.451.45 - 1.691.69 - 2.022.02 - 2.42

26
Table 11. Bivariate regression equations between migration and the shares of children (younger than 15 years) in the differing types. Source: Estimations based on data from Eurostat.
Type Trend line R2 T-value N
All Y=1,37X + 14,913 0,191 17,74 1338
1.Urban Y=1,58X + 14,545 0,159 8,94 424
2. Agrarian Y=1,02X + 15,221 0,117 5,26 210
3. Cons. Country Y=1,43X + 14,726 0,277 13,23 459
4. Strong secondary sector Y=0,89X + 15,021 0,119 3,52 94
5. Market services Y=1,57X + 15,742 0,161 5,35 151
From these estimations some tentative – and hypothetical – conclusions can be drawn. It must, however, be kept in mind that in these comparisons the general migration development and its impact on differing population category is not analyzed. One conclusion is, however, that rural regions that have been transformed towards a more service-based economy often in the surroundings of large cities have shown the most positive population development (see e.g. Copus et. al., 2006). From Tables 4 and 6 it is also obvious that this type of region has experienced a fast population growth during the beginning of this century. It can, however, not hide the divergent development paths in different parts of Europe. The settlement pattern in Consumption Countryside seems then to have been polarized during the past decades. Many of these retarding regions are also remotely localized in the European periphery and especially then in the Eastern part of Europe (Johansson 2009). With regard to families’ settlement patterns it is not probable that it is the remote and retarding rural areas that have attracted these kinds of people. The dual character of this structural type is also indicated by comparing the number of regions and the population size of the regions. The dual character of this structural type might also be an effect of the different kinds of work and employment. In some remote areas the more traditional rural life styles and employment are still relatively frequently going on. In other more city surrounding areas the new rurality with new kind of living and employment seems more or less to be a fact. It seems also to be obvious that large regions with good accessibility have a higher share of children than smaller ones probably as a consequence of in-migration of families (Johansson 2011).
As can be seen in Tables 12-13 even the structural type 4 “Diversified rural areas with strong market services” show signs that are typical for the “new rurality”. A high share of children corresponds to the low shares of elderly people (see Tables 8-9). The regions are also to a large degree in-migration areas and there are signs that many of these regions are attractive from a family settlement point of view. Even in this case the accessibility factor is of central importance as many of the newcomers seem to work in knowledge-based activities. This rural gentrification process is most pronounced in areas surrounding large cities with a good supply of educational and cultural activities. The category number 3 “Diversified rural with a strong secondary sector” shows – as mentioned earlier – a split pattern. The type is characterized by retarding regions with a relatively large industrial production in the Eastern part of Europe – industries that are going through a deindustrialization process. On the other side, there is also more expanding patches

27
in the Central (Switzerland) and Southern parts of Europe (Spain) that has a good population development with in-migration as one result. With regard to the low TFRs in this type it is not surprising that the shares of children show a pattern where the extreme values are relatively small. The interpreting of the distribution of young people within this category ought, however, to be done with utmost care as a consequence of the small population share. An indication of the dual character and its impact on the settlement pattern on aggregate level is the low correlation between in-migration and the share of children. The “Agrian structural type” has some similarities with “Rural areas with a strong secondary sector” with respect to the population structure. Both have a high share of its elderly population in the younger quartiles (Q1 and Q2) and a high share of children around the medium (Q2 and Q3). This might be an illustration of the out-migration effects from the Eastern European areas. As many of the people that are leaving these regions are young adults and “singles” the shares of young and elderly people increase. One hampering factor with regard to elderly people’s growing importance and the concentration in the lower quartiles might, however, be the low life expectancy in this structural type. The “Predominantly urban” types show the typical pattern of the relations between the number of regions and the size. Even in this case it can be shown that the larger regions have higher share of children than the smaller ones. It is not a qualified guess that this is an effect of the more positive population development in these areas with a better age structure from a reproduction point of view even if the TFRs are not higher. In-migration has, as mentioned several times before, a positive effect on the age structure from a reproduction point of view. The contrary is of course also true and reinforce the depopulation tendencies that exist in the out-migration areas. Table 12. Children, less than 15 years. Numbers of regions 2008, EDORA structural types, quartiles, N=1345. NUTS3. Source: Estimations Based on regional population data from Eurostat
Structural Types Q1 Q2 Q3 Q4 % N Numbers% 0. Predominantly Urban 29,6 27,7 16,5 26,2 100,0 430 32,0 1. Agrarian 25,2 28,1 28,6 18,1 100,0 210 15,6 2. Consumption Countryside 27,0 24,6 28,3 20,0 100,0 459 34,1 3. Diversified (strong secondary sector) 12,8 31,9 35,1 20,2 100,0 94 7,0 4. Diversified (strong market services) 13,9 11,3 29,8 45,0 100,0 152 11,3
1345 100
Table 13. Children, less than 15 years. Size of the regions 2008, EDORA structural types, quartiles, N=1345. NUTS3. Source: Estimations based on Eurostat
Structural Types Q1 Q2 Q3 Q4 % Size Size% N Numbers% 0. Predominantly Urban 17,4 25,2 18,7 38,7 100,0 216188064 42,5 430 32,0 1. Agrarian 11,7 24,0 37,8 26,5 100,0 71588396 14,1 210 15,6 2. Consumption Countryside 15,4 22,6 30,3 31,8 100,0 119332748 23,5 459 34,1 3. Diversified (strong secondary sector) 6,6 44,7 27,7 21,0 100,0 33224744 6,5 94 7,0 4. Diversified (strong market services) 6,2 9,0 20,1 64,6 100,0 67845977 13,4 152 11,3
508179929 100 1345 100
28
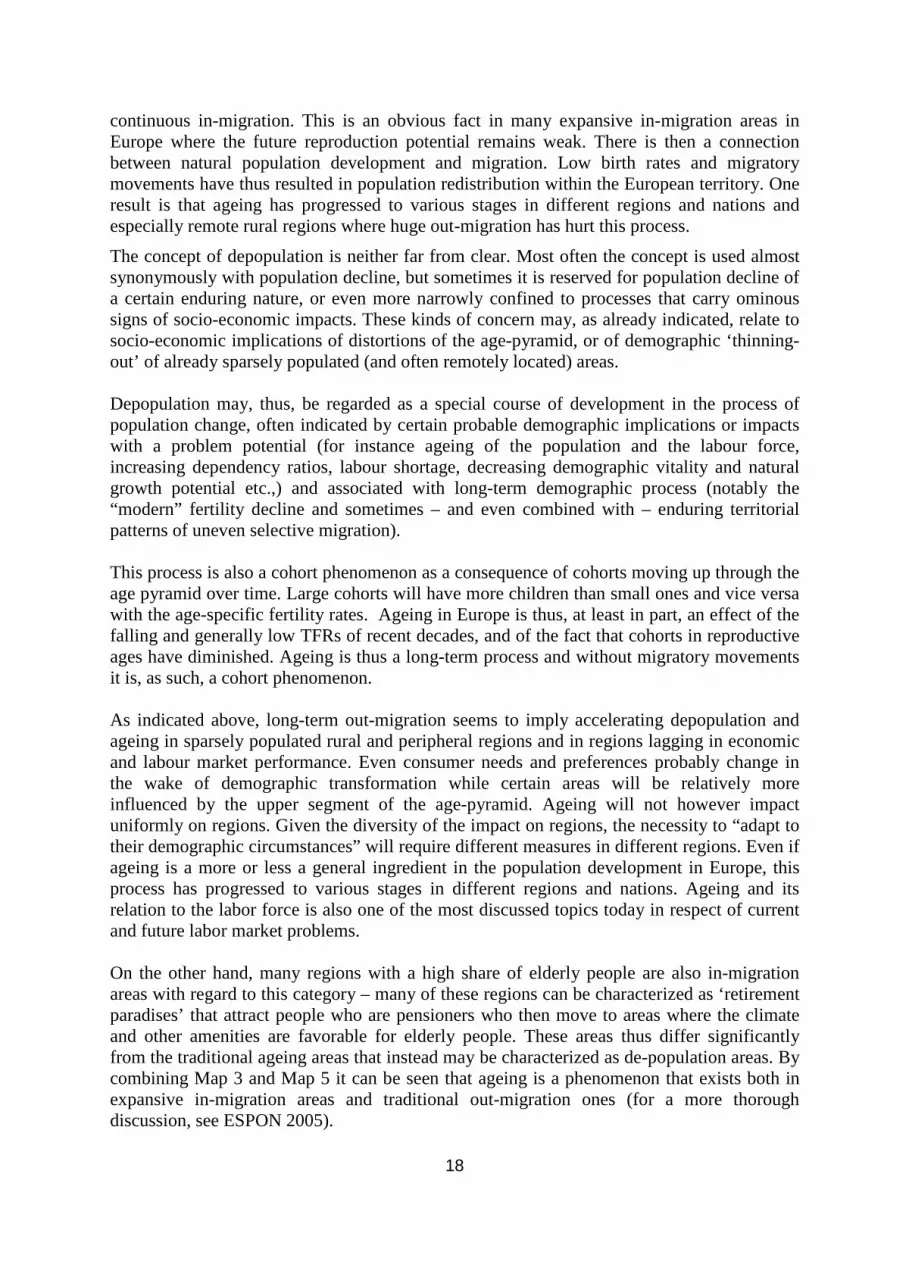
Table 14. Children, less than 15 years. Size/numbers: Edora/Demographic Types, N=1345. NUTS3. Over 100 = large regions overrepresented, under 100 = large regions underrepresented. Source: Estimations based on Eurostat
Structural Types Q1 Q2 Q3 Q4
0. Predominantly Urban 58,7 91,1 113,0 147,7
1. Agrarian 46,5 85,4 132,3 146,3
2. Consumption Countryside 56,9 91,7 107,0 158,5
3. Diversified (strong secondary sector) 51,9 139,9 79,0 103,8
4. Diversified (strong market services) 44,9 80,3 67,4 143,5
THE “NEW RURALITY” – A WAY OUT OF THE RURAL CRISIS ? For much of the twentieth century the regional pattern of population change in most European countries was, thus, characterized by a “rural exodus”, and increasing urbanization. Rural populations declined as especially young people and families left to seek better employment prospects in urban areas. Those remaining formed an increasingly ageing population, with declining local services. This is a well-known story and connected with the new era of the industrial and post-industrial societies and the urbanization process.
In the 1970s there was, however, a break in the development of the urban-rural relations (see e.g. Beale 1975, Berry 1976). The populations of metropolises and big industrial cities declined in favor of smaller places and more or less purely rural areas. From the 1970s the urban lifestyle has increasingly been rejected in favor of residence in accessible rural areas and commuting (see Copus et al 2006). During recent decades the numbers of people migrating away from cities into the nearby countryside or rural areas has increased and contributed to rising rural populations in many “intermediate” rural regions in Europe. The “rural exodus” has instead been more focused to sparsely, remote and less prosperous regions, and primarily involves young people who are still moving to cities and then to the big city regions.
These results are only contradictory in appearance. Counterurbanization and suburbanization entail large contrasts in migratory behaviors by ages. For example, the flow of young people to urban centers is in many cases more than compensated by the opposite flows of all other age classes, especially middle aged active households with children. For example, metropolitan regions such as London, Birmingham, Manchester, Vienna, Roma and Budapest were out-migration regions during the second half of the 1990s.
Suburbanization is only one, but probably the main aspect of counterurbanization, since it concerns more people and provokes large contrasts in terms of migratory balances within short distances. It should, however, not be seen as a rural revival as it is more dependent on urban than rural development, and differs also with respect to geographical location and remoteness. Suburbanization is closer to urban sprawl than counterurbanization or rural revival and a more natural ingredient in the expansion of urban areas – a process that remains a central ingredient in the expansion of European urban areas. Rural revival is, thus, an urban phenomenon in the sense that accessibility and closeness to urban areas seem to be preconditions for its existence and continuation.
A lot of studies have also shown a monocentric development in the peripheral areas of Europe with an increased concentration of people in the metropolitan areas and leaving the peripheral rural areas in a state of ageing and stagnation (see e.g. ESPON 1.1.1, ESPON

29
1.1.2, ESPON 1.1.4 and ESPON 1.4.3). Most of the disadvantaged regions in Europe can be characterized as rural areas or traditional raw-material based industrial towns in rural surroundings. Until recently the prevailing notion has been that rural areas are usually lagging behind urban ones due to disadvantages traditionally associated with “rurality”; such as physical remoteness, lower accessibility, and traditionalism in socio-economic and cultural spheres. Almost regardless of the definition, delimitation and classification of “rural areas” this notion has been proven vastly to simplify and over-generalize the actual characteristics, similarities and performances of rural areas.
Behind these processes it is obvious that the concept of functional regions is becoming more and more frequent with respect to the discussion of regional development and that the traditional dualism regarding urban and rural is becoming increasingly insignificant. Rather this is more a reminiscence of the industrial society though of course still valid between differing regions where distance is of great importance. As the functional regions are expanding, the rural parts within a local labor market will be gradually more dependent of and interconnected with the development and transformation in the urban areas. This has also been accentuated during the past decades as a consequence of deindustrialization and renewal in some old factory towns.
The definitions of rural areas are, thus, manifold and this results also in differing development paths concerning their localization and economic structure. Many rural areas have more in common with urban areas and the dividing line is more the population density than the employment structure. These regions that have taken advantage of the possibilities connected to the development towards the “new rurality” are often well-being regions characterized by gentrification and growth and localized close to metropolitan and big city areas. Increasingly rural development policy thinking has been evolving according to far more complex notions of rural territories and rural economic life, taking into consideration the great variety of rural situations and contexts and the profound changes that have been taking place in rural Europe during the last decades. Many rural areas have also been shown to “out-perform” urban areas, many rural areas have been transforming in profound ways regarding socio-economic structure and economic base as well as regarding their regional contexts and roles, and in many cases the very notion and concept of rurality as a territorial quality is challenged.
Despite these tendencies, rural areas in peripheral areas in sparsely populated areas with a high share of the population dependent of the primary sector are in a quite another situation characterized by low incomes and lagging economic structure and small or no potentials to endogenous economic growth. Instead, rural exodus and depopulation characterize still these types of rural areas. The slow-down of the metropolitan population growth has not stimulated the development in these kinds of rural areas. The peri-urbanization process is quite another thing and seems more or less absent in these disadvantaged rural regions.
It is, however, important to emphasize that the reasons for population increase or decrease vary between differing parts of (rural) Europe. Although for the majority of the rural areas the most important factor behind demographic change is migration, low and falling fertility rates is an increasingly important ingredient especially in the new member states. During recent decades, the decline in the fertility rates has in many rural regions either reinforced the negative effects of out-migration or counteracted the positive effects of in-migration (Johansson 2009).
In sum, one can conclude that the existence of a counterurbanization process, i.e. a general movement of deconcentration from the urban areas, especially from the largest ones is taking

30
place. This process fuels the revival of rural areas, especially those well located in the dense urban networks of Central and North-Western Europe. In Southern Europe and the Nordic countries, the same process is clearly at play, but is still counter-balanced by the out-migration of young people from remote and isolated rural areas, for example in respect of central Spain, interior Portugal, and the monocentric tendencies in Finland, Norway and Sweden. At least as regards Sweden counterurbanization tendencies among people over 30 can be observed, but even in this case they are concentrated to the large city areas where accessibility is a precondition and a central ingredient (Johansson 2011). Hereby, differing kinds of social capital can support or hamper the changes depending on development preconditions and their effects on the transformation processes concerning dissimilar types of regions.
REFERENCES
Beale, C. L., (1975), The revival of population growth in non-metropolitan America. Economic Research Service, publication 605, US Department of Agriculture, Washington, DC
Becker, G. S., (1960) An Economic Analysis of Fertility. NBER: USA. Becker, G. S., (1965) “A Theory of the Allocation of Time”. The Economic Journal, vol 75,
no 299. Becker, G. S., (1993) A Treatise on the Family. First Harvard University Press. USA. Berry, B. J. L., (1976) “The Counterurbanization Process: Urban America since 1970”, in
Urban Affairs Annual Review volume 11 Ed. B J L Berry (Sage, Beverly Hills, CA) pp. 17-30
Champion, A., (ed.) (1989) Counterurbanisation: The Changing Pace and Nature of Population Deconcentration. Edward Arnold, London.
Champion, A., (1992) “Urban and regional demographic trends in the developed world”. Urban studies, vol 29.
Champion, A. G., (1998), “Studying counterurbanisation and the rural population turnaround”, in Migration into rural areas. Theories and issues Eds. P Boyle, K Halfacree (John Wiley & Sons, Chichester) pp 21-40.
Copus, A. K. et.al., (2006) Study on Employment in Rural Areas. A study Commisioned by Eurpean Commission, Directorate General for Agriculture. SAC (Scottish Agricuatural College).
Copus, A. K., Johansson, M. and McQuaid, R. W. (2007), “One Size Fits All? Regional Differentiation and Rural Development Policy”. EuroChoices 6(3). 2007
Copus, A. K. and Johansson, M. (2010) Relationships between Demographic Change and Economic Restructuring in Rural Europe at the beginning of the 21sts Century. Paper presented
at the European Population Conference, Vienna, 1-4 September 2010 Dijkstra, L. and Poelman. H, (2008) “Remote Rural Regions, How proximity to a city
influences the performance of rural regions”. Regional Focus No1, DG Regio, European Commission http://ec.europa.eu/regional_policy/sources/docgener/focus/2008_01_rural.pdf
Eliasson, K., Johansson, M. and Westlund, H. (2008), Labour Market Aspects of the “New Rurality: Employment, Commuting and Entrepreneurship in Rural Sweden. In In Westlund, H. and Kobayashi, K. (eds). Social Capital and Development Trends in Rural Areas, Vol 5. MARG/RUREG.

31
ESPON 1.1.1. (2004) Potentials for polycentric development in Europe. Final Report. Luxembourg: ESPON 2004, www.espon.eu.
ESPON 1.1.2 (2004), Urban-rural relations in Europe. Edited by Bengs, C. & Schmidt-Thomé, K. Luxembourg: European Spatial Planning Observation Network. www.espon.eu
ESPON 1.1.3. (2005) Spatial effects of the EU-enlargement. Edited by Snickars, F. & Van Well, L. Luxembourg: European Spatial Planning Observation Network.www.espon.eu
ESPON 1.1.4 (2005) The Spatial Effects of Demographic Change and Migration, Final Report Project 1.1.4 Edited by Johansson, M. & Rauhut, D. Luxembourg: European Spatial Planning Observation Network. www.espon.eu
ESPON 1.4.3 (2006) Functional Urban Regions. Final Report Project 1.4.3. Luxembourg: European Spatial Planning Observation Network. www.espon.eu
Fielding, A.J., (1982) “Counterurbanization in Western Europe”. Progress in Planning 17(1), 1-52.
Fielding, A.J., (1986) “Counterurbanization in Western Europe”. In A. Findlay and P. White (eds.) Western European population change. Croom Helm, London. Pp.35-49.
Fielding, A.J., (1989) “Migration and urbanization in Western Europe since 1950”. The Geographical Journal 155, 60-69.
Johansson, M., (2005), “Rural Areas, Demographic Change”, in Kobayashi, K., Westlund, H., and Matsushima, K., (eds), Social Capital and Development Trends in Rural Areas. MARG, Kyoto University, 2005.
Johansson, M. (2009), Update of The Demography/Migration Typology Map. Revised Version 2009. Luxemburg. www.espon.eu.
Johansson, M. (2011), “Migration and Settlement Patterns among Young People in Swedish Rural and Urban Areas”. In Kobayashi, K., Westlund, H. and Jeong, H. (eds). Social Capital and Development Trends in Rural Areas, Vol 6. Kyoto: MARG, Kyoto University.
Johansson, M. and Kupsiszwski, M. (2009), “Demography”. Thematic Report to the Edora-project. Copus A. K (ed). European Development Opportunities for Rural Areas. www.espon.eu.
Schultz, T. W. (1974), (ed): Economics of Family. Chicago. Westlund, H., (2002), “An Unplanned Green Wave: Settlement Patterns in Sweden During
the 1990s”. Environment and Planning A 34 1395-1410. Westlund, H. & Pichler, W., (2006), “Settlement Patterns on the Swedish Countryside in the
Emerging Knowledge Society”. In Ito, K., Kobayashi, K., Westlund, H. & Hatori, T., (eds.) Social Capital and Development Trends in Rural Areas Vol. 2. Kyoto: MARG, Kyoto University 2006, pp. 103-114.
Westlund, H. 2006, Social Capital in the Knowledge Economy. Theory and Empirics. Springer-Verlag, Berlin, Heidelberg.
Wolcock, M. (1998), Social Capital and Economic Development: Towards a Theoretical Synthesis and Policy Framework. Theory and Society 27.
Vogel, J., (2003), ”The Family”, Social Indicators Research 64, pp. 393-435. Kluwer Academic Publishers.


