Embed Size (px)
Citation preview

Citation: Maldonado-García, B.E.;
Ocampo-Díaz, A.; Portuguez-Castro,
M. Evaluating Differences in
Mathematical Competencies in
Middle School Students during
Pandemic Conditions through
Preparatec Platform. Educ. Sci. 2022,
12, 546. https://doi.org/10.3390/
educsci12080546
Academic Editor: Miklos Hoffmann
Received: 27 June 2022
Accepted: 3 August 2022
Published: 12 August 2022
Publisher’s Note: MDPI stays neutral
with regard to jurisdictional claims in
published maps and institutional affil-
iations.
Copyright: © 2022 by the authors.
Licensee MDPI, Basel, Switzerland.
This article is an open access article
distributed under the terms and
conditions of the Creative Commons
Attribution (CC BY) license (https://
creativecommons.org/licenses/by/
4.0/).
education sciences
Article
Evaluating Differences in Mathematical Competencies inMiddle School Students during Pandemic Conditions throughPreparatec PlatformBlanca Estela Maldonado-García 1, Alejandra Ocampo-Díaz 1 and May Portuguez-Castro 2,*
1 Department of Mathematics, Tecnologico de Monterrey, Xochitepec 62790, MR, Mexico2 Institute for the Future of Education, Tecnologico de Monterrey, Monterrey 64849, NL, Mexico* Correspondence: [email protected]
Abstract: This research proposes to evaluate the difference in essential mathematical competencies ofmiddle school students transitioning to high school level under pandemic conditions (COVID-19)using the PreparaTec platform and Programme for International Student Assessment (PISA) releaseditems as an evaluation instrument. The study was conducted with 84 students from first semester highschool at Prepa Tec (Tecnologico de Monterrey, Campus Cuernavaca) aged 14 and 15. The studentswere divided into three experimental groups and a control group. Three levels of mathematicalcompetencies: reproduction, definitions, and calculations (level 1), connections and integration tosolve problems (level 2), and reflection (level 3) were evaluated. We applied a pre-test at the beginningof the semester and a post-test at the end after using the PreparaTec platform. Both tests were writtenand applied in a face-to-face format. The study presents the findings regarding the impact of usingthe PreparaTec platform during the first semester in the three levels of mathematical competenciesmentioned. The results obtained are presented in two analyses. The first analysis involves the resultsobtained per experimental group and according to the number of correct answers per group. Thesecond analysis represents a comparison between the percentage of correct answers and the levelof difficulty per question per student regarding the percentage, determined by the Organisation forEconomic Cooperation and Development (OECD) and Spain in the format presented by PISA. Thepre-test and post-test consisted of 23 questions from items released from PISA, which contemplatedmeasuring the three levels of mathematical competence. The results showed an improvement of 57%in level 1 proficiency questions, 63.6% in level 2 proficiency, and 100% in level 3 proficiency. Thefindings indicate that new teaching strategies based on Information and Communication Technologies(ICT) and more meaningful assessment forms further develop students’ mathematical competencies.
Keywords: educational innovation; professional education; PISA; mathematical competencies;COVID-19; mathematical reasoning; flipped learning; Tec de Monterrey
1. Introduction
With the arrival of the COVID-19 pandemic, the teaching-learning process has beenunexpectedly transformed. Education has been one of the most affected areas in humanactivity due to the pandemic. In this sense, almost every school worldwide went into alockdown starting in Spring 2020, replacing academy activities with distance learning,laying the responsibility of teaching on to parents and the availability of digital devices athome. As a result, it brought less effective learning, like the case study in the province ofTorino (Italy), which was the first Western European country hit by the COVID-19 pandemic.In this context, the learning loss was greater for girls and high-achieving children of low-educated parents, and the impact was harshest in schools with a disadvantaged socialcomposition [1,2].
The Mexican government also declared a sanitary emergency during the epidemicgenerated by this disease, taking social isolation measures that required staying home and
Educ. Sci. 2022, 12, 546. https://doi.org/10.3390/educsci12080546 https://www.mdpi.com/journal/education

Educ. Sci. 2022, 12, 546 2 of 20
the emergence of “healthy distance” as preventive measures to control its expansion [3].This measure implied that millions of students of all educational levels were affected bythe closure of schools, causing a change in the way of bringing learning to learners [4].Not only were the primary and middle schools affected by the arrival of COVID-19, but itwas also the higher education that was disrupted in many ways, contrary to the detrimentof the basic levels of education. In some cases, the confinement significantly positivelyaffected higher education students’ performance, changing their learning strategies to moreautonomous and continuous habits, improving their efficiency, and having better studentassessment scores [5]. However, in other cases, some groups were more vulnerable topsychological effects during the pandemic lockdown. This was the case for many middleschool students, where anxiety and stress were associated with mathematical tasks [6].
The pandemic lockdown has led to the transition of a pedagogical model in which theteaching-learning process is through not only virtual environments, but also through usingnew learning strategies, which has become a challenge for educational centers to adapt toeconomic and social conditions around the world [7–9].
The pandemic transformed the entire teaching system at all levels [10]. Not onlybecause of the use of platforms and the need to consider different conditions [11] to thosesubjects of utmost importance in the student life of any child, but also because there arelearning and competencies that became more relevant in the context in which they wereliving [12]. Combining face-to-face teaching with virtual teaching (blended learning) forcesus to consider the characteristics of information communication technologies (ICTs) inmore detail. The lack of access to educational technologies and innovations is challengingfor educational institutions and students. At this time, computer-assisted learning helpedteachers adapt to the pandemic and enhance motivation, critical thinking, and studentlearning, so analyzing the use of ICT and its variables is essential to identify the effects of itsuse during this period [8,13,14]. This situation also led to the development of digital skills inteachers, who could discover and develop new alternatives to diversify the way of learning.The COVID-19 pandemic caused the closure of schools and universities and changedthe traditional teaching-learning process to online teaching, placing more responsibilityfor learning on parents and guardians. Mathematics teaching is traditionally stronglyconnected to the content and the transmission of knowledge, that is, facts to remember andskills to acquire [10,15].
Regarding teaching mathematics, it is crucial to encourage the application of conceptsand that the student makes sense of what has been learned and the solution to challengesthat arise [16]. However, applying mathematical knowledge is not only the use of formulasbut also the use of logical reasoning for problem-solving, which requires pedagogicalstrategies not based solely on memorization. Although many teachers recognize thepower of digital tools to motivate and encourage students to participate more in learningprocedures, they do not use them in teaching practices. Teachers use digital tools to teachmathematics more as a drill-and-practice tool and less as a tool for supporting activitieswith real-life situations and exploration [17,18].
Mathematical competence, therefore, goes beyond just the mathematical processes ofreproduction [19]. It establishes whether students can use what they have learned in typicaldaily situations. According to Yusupova and Skudareva [20], mathematical competence isan individual’s ability to formulate, apply, and interpret mathematics in various contexts.It helps individuals understand mathematics’ role in the world and draw well-foundedconclusions and decisions for constructive, active, and reflective citizenship development.
Since the pandemic has led to a lag in student learning, this study proposes thePreparaTec platform to strengthen basic mathematical skills in first-semester high schoolstudents and contribute to developing new methodologies for distance learning. ThePreparaTec platform was designed considering the flipped learning methodology, whichcompensates for the fact that students do not attend face-to-face classes. The intentionis to use it as a technological tool to bring education closer to the students, facilitate

Educ. Sci. 2022, 12, 546 3 of 20
the continuity of their education, and investigate the impact its use can have on thedevelopment of mathematical competencies.
Positive effects on math achievement occurred only when using online learning soft-ware already familiar to students. So, online learning could offer a wide range of opportu-nities for students to learn if they have the necessary technology, positive attitudes towardsit, and prerequisite skills [21–23].
With the use of flipped learning, students can review the class material in their ownspace and at their own pace, take notes, and practice reflection and analysis of information,which favors those students who have problems with the content of the subject [24].However, to make the most of the advantages offered using flipped learning, it is necessarythat the student reviews the material before the class and performs the related activities.Otherwise, there will be no significant learning for the student [25]; in this way, in virtualsessions, it is possible to have better use of the class.
We used the Programme for International Student Assessment (PISA) [19] as anevaluation instrument for this study. The Organisation for Economic Co-operation andDevelopment (OECD) conducted this standardized test [26], and the objective of the test isto evaluate the training of students when they reach the end of the compulsory educationstage (secondary school). The use of PISA is appropriate as it focuses on the competenciesthat students should have developed by the age of 15, regardless of the curriculum they arestudying [27,28]. This test is conducted every three years in 79 different countries. It evalu-ates the areas of reading, mathematics, and scientific competence, emphasizing the masteryof processes, understanding concepts, and ability to apply them in different contexts ofeveryday life. [29] This research aims to show an alternative to evaluate mathematicalcompetencies in the classroom, using as an evaluation instrument the percentage of successunder the PISA scheme in conjunction with the percentages suggested by the OECD andthe results of the PISA tests in Spain.
1.1. Mathematics Teaching-Learning Process
When teaching mathematics to first-semester high school students, the experienceof those who write this has shown that new high school students arrive with differentdegrees of learning in mathematics. Although the syllabus for the subject of mathematics isregulated by the Secretary of Public Education (SEP), the degree of depth in the teaching-learning process varies from school to school. Therefore, at the beginning of the firstsemester of high school, it is necessary to consider the leveling in learning mathematicalconcepts so that the following mathematics subjects are better understood [30]. The levelingof these gaps in knowledge involves using strategies that motivate the student to achieve it.However, a new way of working on learning may not be so welcome by students, especiallyduring this period of a pandemic.
The purpose of teaching mathematics should be that students can apply and use it.Hence, the student must find the relationship between what has been learned and thechallenge to be solved [16]. Likewise, as described by some authors, the change in theprocess of student-centered teaching involves changes in the preparation and the way ofteaching the class [31]. Therefore, this innovation proposal arises from the need to improvetwo aspects: the development of mathematical competencies and autonomy in the learningprocess by the student, both using the PreparaTec platform.
Multiple factors are involved in the teaching-learning process of mathematics in theclassroom. For example, the training of the teachers, their confidence in the discipline, thedidactics used in the classroom, the autonomy of work, the cultural level of the parents,the school climate, and the educational proposal of the establishment [32], to mention afew. Pekrun talks about emotions, where students can experience a series of moods, suchas enthusiasm, admiration, empathy, envy towards peers, boredom, persistence, etc. [33].Taking this into account is of utmost importance; therefore, the teacher has the tools tounderstand and identify students’ moods.

Educ. Sci. 2022, 12, 546 4 of 20
Such is the number of factors and agents involved. So intricate is their interrelationshipthat it becomes difficult to explain, in simple terms, the differences in the levels observed intests such as PISA [34]. This finding may explain why some attempts to adopt part or allof the mathematics teaching methodologies have not had the same successful results thatthey have had in the country of origin [32].
1.2. PISA Test to Assess Mathematical Competencies
PISA defines mathematical competence (or literacy) as “ . . . an individual’s ability toreason mathematically and formulate, use and interpret mathematics to solve problemsin various real-life contexts. This literacy includes concepts, procedures, data, and toolsto describe, explain, and predict phenomena. It helps individuals learn about the role ofmathematics in the world and make the informed judgments and decisions needed bythoughtful, constructive, and engaged citizens of the 21st century” [35] (p. 3).
The contents of the PISA mathematical competence assessment contemplate items thatpresent problems of quantity, space, and form, change and relationships, and probability;located in four different contexts: personal situation, educational or work situation, publicsituation, and the scientific situation; which evaluate three levels of competence; thefirst is level 1 (reproduction, definitions, and calculations) where the student works witheveryday operations, simple calculations in the context of their immediate environment ordaily routine; level 2 (Connections and integration to solve problems) where they involvemathematical ideas and procedures to solve problems that are not in their immediateenvironment but are familiar to them, where they must elaborate models to solve them; andfinally, level 3 (reflection), where they must solve complex problems where the student mustconceptualize and provide a solution through an original mathematical approach [36–38].
Although PISA test results have been used to identify student achievement levels indifferent countries [39,40], most studies seek to determine how different factors impacttest results at the national level or by comparing results across countries. One such studywas developed by Boman [41], who analyzed the relationship of sociodemographic andsocioeconomic variables on the performance of Swedish students compared to 31 countries.Another research by Basarkod [42] identified the immigration effects on the PISA testresults in Italy from 2003 to 2021. In Spain, scores from the 2006–2018 PISA test were usedto analyze the relationship between cell phone use with bullying and test scores [43].
In these and other studies, we did not find the application of the test questions tospecific cases in a classroom or school sector. So, it is considered that this study is noveland can contribute to knowledge by presenting a methodology that uses the questionsreleased from PISA that have to do with the achievement of different levels of learning ofmathematical competencies to evaluate the results of the application of new pedagogicalstrategies. This study may be helpful for teachers and managers seeking to improvepedagogical mediation strategies in the classroom, using new technologies and activepedagogies such as flipped learning.
1.3. Flipped Learning
During the COVID-19 pandemic, technological tools generated a large amount ofonline teaching, giving rise to teaching-learning basic knowledge. Therefore, it is necessaryto develop new strategies for students to create learning outcomes coherently with the latestsocial conditions beyond superficial learning. Quality education in online environments isbroad and have become essential, allowing for variability in implementing activities insideand outside the classroom [44].
According to Ospina Espinal and Galvis López [45], “education based on virtualenvironments allows having elements and tools that contribute to the performance of thestudent as the protagonist of his training process” [45] (p. 11), hence the importance of usingstrategies such as flipped learning to generate the learning environment and encourage thestudent to be this protagonist.

Educ. Sci. 2022, 12, 546 5 of 20
Nederveld comments that flipped learning is a pedagogical approach where theteaching-learning process is “inverted,” i.e., what the student did as homework is nowdone in class, and what they did in class is now done at home [46]. Flipped learning refersto the fact that students learn the class topics independently, i.e., they review videos or othermaterial proposed by the teacher before the class. Then, the teaching-learning process willinvolve student participation in solving problems using the previously learned conceptsin the classroom. The teacher’s role is to guide the student in solving the questions. Thus,class time is used to create, evaluate, and analyze and stop it from being only an expositoryspace for the teacher [47]. This way, class time becomes a flexible process that does notprioritize only the contents [48].
According to a systematic review of the literature analyzing the relationship betweenflipped learning and mathematics teaching, studies show that using this pedagogicalstrategy improves students’ academic results [49–51]. In addition, there is an increase in theconfidence and satisfaction of students who become more active as they have more time tocarry out their activities and participate in class [52,53]. Mathematical competence involvesthese components, which is why it is essential to use standardized tests to measure thedevelopment of these skills.
For the implementation of the flipped classroom, Bergman and Sams recommendedperforming the following actions [54]:
• Define the tasks to be performed by the student and encourage self-learning byintroducing students to the pedagogical strategy;
• Accompany the student in determining the educational resources’ actual content;• Check that students have seen the resources by asking interesting questions to help
them understand the topic;• In the classroom, prepare the space to encourage collaboration and the development
of activities;• Encourage the student to organize his or her time;• Encourage collaboration working in teams;• Use instruments of formative evaluation;
In recent years, there has been significant interest in developing the inverted classroomas a pedagogical strategy because it has come to complement the methodologies used foracademic continuity during the pandemic [55]. In this sense, this research aimed to identifythe difference in basic mathematical competencies in middle school students when movingto the high school level under pandemic conditions through the practice of PreparaTec, atechnological tool designed following flipped learning as a pedagogical strategy. This studyis considered novel because, as mentioned above, we found no studies using the PISA testto measure mathematical competencies in specific environments. So, this study seeks tocontribute with a methodology that teachers can apply in contexts in which teachers striveto implement educational innovations in the teaching of mathematics, and to check if thereare differences in the competencies of their students at different learning challenging levels.
2. Materials and Methods
The research methodology is quantitative, descriptive, quasi-experimental, and chrono-logical. The study was carried out with 84 students between 14 and 15 years of age fromthe first semester of high school at Prepa Tec of Tecnológico de Monterrey campus in Cuer-navaca, organized into three experimental groups and a control group. The class contentrelates to the fundamentals of mathematics. There were 64 students in the experimentalgroup and 20 students in the control group. It is worth mentioning that this was the firstsemester that the students returned to the classroom after completing the last year of highschool virtually. The control group did not have access to the PreparaTec platform, whereasthe experimental groups had access throughout the semester. This semester, the studentsattended classes twice a week in person and three days a week in virtual format.
The study contemplated 108 students enrolled in the Bicultural program in PrepaTecin Cuernavaca. The sample selection was intentional, so researchers invited 108 students

Educ. Sci. 2022, 12, 546 6 of 20
to participate in this study. However, the parents’ authorization was requested since theparticipants were between 14 and 15 years of age. Once the permission was obtained, theremaining sample was 84 students out of the 108 participants, representing a statisticallysignificant sample at a 95% confidence level.
The application of the pre-test and post-test was carried out on face-to-face days. Thetests were taken without a calculator, and teachers contemplated 40 min for 23 questions inthe evaluation instrument. As part of the application and analysis of the results, writtenauthorization was requested from the parents to publish the research results. After applyingthe pre-test, students worked on the PreparaTec platform throughout the semester, insideand outside the classroom. The data were analyzed using the Kruskal-Wallis H test andMann-Whitney U test with a significance level of α = 0.05.
The control and test groups received the information through the teachers of eachof the groups. The two teachers in charge made a short presentation about the Novusresearch project at the beginning of the class. Novus is an initiative of the Institute for theFuture of Education that seeks to strengthen the culture of educational innovation basedon evidence from the professors of the Tecnológico de Monterrey. Furthermore, teachersinformed students that they would be participating in two tests at the beginning (pre-test)and the end (post-test) of the semester. Their parents signed a confidentiality and data useagreement, where the teachers can use test scores without publishing the personal data ofeach student.
2.1. Innovation Description
PreparaTec is a platform created under the flipped learning strategy to investigatethe impact that its use can have on the development of mathematical competencies. Theplatform consists of three modules. The first module corresponds to the organization ofthe semester’s topics and contains all the related subtopics. The second module containsvideos explaining exercises for each topic, which students can review as often as theyconsider necessary. The videos have an average duration of 1.5 to 5 min and considervarious problems on the same topic. The third module includes a series of activities withexercises of different degrees of difficulty. These exercises are mostly application problemsrelated to problems of everyday life. Table 1 shows the topics, learning objectives, resources,and evaluation handled in the PreparaTec platform.
Table 1. Topics, learning objectives, resources, and evaluation that are handled in the PreparaTecplatform (Source: Authors’ own creation).
Area Topics Learning Objectives Learning and AssessmentResource for all topics
Arithmetic and Algebra
Basic operations, fractions,real numbers, decimals,successions, equations,percentages, hierarchyof operations
Reproducing representations,definitions and facts.
• Multiple choice exercises• Videos by topic• Team analysis exercises• The evaluation of the
exercises is one point bycorrect answer
Functions and Graphs Linear functions,table analysis
Interpretation of problemsituations and mathematicalstatements, using multiplewell-defined methods.
Geometry Areas, perimeters and volume Engaging in simplemathematical Reasoning.
Descriptive statistics Histograms, mean, medianand mode
Reflecting on, and gaininginsight into, mathematics andconstructing originalmathematical approaches.Combinations and Probability Combinations, estimation
of quantities

Educ. Sci. 2022, 12, 546 7 of 20
The practice material was designed by the teachers who teach the “Fundamentals ofmathematics” class, considering the structure of the PISA items, contemplating levels ofcompetencies and degrees of difficulty from levels 1 to 6. The PreparaTec platform wasused throughout the semester and contemplated collaborative work sessions in class toresolve doubts and encourage discussion among students about possible ways to solvea problem. The platform’s math exercises explore a variety of real-life contexts. Thisinvolves translating mathematical solutions or reasoning into the context of the problemand determining whether the results are reasonable and make sense in the context of theproblem. For example, purchase decisions, savings simulations, route planning, furnituredesign, exchange rate, summertime, floor tiling, etc. The videos contain mathematicalconcepts necessary to solve the requested problems, such as basic operations, fractions,real numbers, decimals, sequences, equations, percentages, the hierarchy of operations, etc.Students can access multiple choice exercises which have feedback for incorrect answers.Figures 1 and 2 show the student’s view of both the math exercises and the videos ofbasic concepts.
Educ. Sci. 2022, 12, x FOR PEER REVIEW 8 of 20
Figure 1. Student view of the PreparaTec platform (Source: Authors’ own elaboration).
Figure 2. Basic concepts videos (Source: Authors’ own elaboration).
2.2. Instrument The research evaluation instrument was a pre-test and post-test of 23 questions taken
from the items released by PISA [56]. We selected these items according to the level of competence they assess, i.e., according to level 1 (reproduction, definitions, and calcula-tions), level 2 (connections and integration to solve problems), and level 3 (reflection). Each proficiency level has associated levels of degrees of difficulty per question. The ques-tions can be open or closed and have an associated score per answer that can be 0, 1, 2, or 3 according to what is demanded in the question. The maximum pre-test and post-test scores are 69 points, considering complete, correct answers with a value of 3 points. Table 2 shows the 15 selected PISA items with which the test constructed the 23 questions of the evaluation instrument. Each item is related to one of the course topics, measured profi-ciency levels, and their associated difficulty levels.
Figure 1. Student view of the PreparaTec platform (Source: Authors’ own elaboration).
Educ. Sci. 2022, 12, x FOR PEER REVIEW 8 of 20
Figure 1. Student view of the PreparaTec platform (Source: Authors’ own elaboration).
Figure 2. Basic concepts videos (Source: Authors’ own elaboration).
2.2. Instrument The research evaluation instrument was a pre-test and post-test of 23 questions taken
from the items released by PISA [56]. We selected these items according to the level of competence they assess, i.e., according to level 1 (reproduction, definitions, and calcula-tions), level 2 (connections and integration to solve problems), and level 3 (reflection). Each proficiency level has associated levels of degrees of difficulty per question. The ques-tions can be open or closed and have an associated score per answer that can be 0, 1, 2, or 3 according to what is demanded in the question. The maximum pre-test and post-test scores are 69 points, considering complete, correct answers with a value of 3 points. Table 2 shows the 15 selected PISA items with which the test constructed the 23 questions of the evaluation instrument. Each item is related to one of the course topics, measured profi-ciency levels, and their associated difficulty levels.
Figure 2. Basic concepts videos (Source: Authors’ own elaboration).

Educ. Sci. 2022, 12, 546 8 of 20
2.2. Instrument
The research evaluation instrument was a pre-test and post-test of 23 questions takenfrom the items released by PISA [56]. We selected these items according to the level ofcompetence they assess, i.e., according to level 1 (reproduction, definitions, and calcula-tions), level 2 (connections and integration to solve problems), and level 3 (reflection). Eachproficiency level has associated levels of degrees of difficulty per question. The questionscan be open or closed and have an associated score per answer that can be 0, 1, 2, or 3according to what is demanded in the question. The maximum pre-test and post-test scoresare 69 points, considering complete, correct answers with a value of 3 points. Table 2 showsthe 15 selected PISA items with which the test constructed the 23 questions of the evaluationinstrument. Each item is related to one of the course topics, measured proficiency levels,and their associated difficulty levels.
Table 2. Evaluation instrument with the mathematical competencies and their relationship with theareas to be evaluated. Adapted from [56].
Item Name Number ofQuestions Level of Competence Proficiency Level Area
Walking 2 Level 1 (Reproduction),level 2 (Connections)
level 5 (611), level 6 (723),level 5 (666) Arithmetic and Algebra
Cubes 1 Level 1 (Reproduction level 2 (478) Arithmetic and Algebra
Coloured Candies 1 Level 1 (Reproduction level 4 (549) Combinations andProbability
Science Tests 1 Level 1 (Reproduction level 4 (556) Descriptive statistics
Growing Up 3 Level 1 (Reproduction),level 2 (Connections)
level 2 (477), level 4 (574),level 3 (525), level 1 (420) Functions and Graphs
Exchange Rate 3Level 1 (Reproduction),level 2 (Connections),Level 3 (Reflection)
level 1 (406), level 2(439), leve 4 (586) Arithmetic and Algebra
Skateboard 3 Level 1 (Reproduction),level 2 (Connections)
Level 3 (496), level 2 (464),level 4 (570), level 4 (554)
Combinations andProbability
Table TennisTournament 1 Level 1 (Reproduction Pilot test Combinations and
Probability
Shoes for Kids 1 Level 1 (Reproduction Pilot test Arithmetic and Algebra
Robberies 1 Level 2 (Connections) Level 6 (694), level 4 (577) Functions and Graphs
Carpenter 1 Level 2 (Connections) level 6 (687) Functions and Graphs
Chat 2 Level 2 (Connections),Level 3 (Reflection) Level 3 (533), level 5 (636) Arithmetic and Algebra
Shelving 1 Level 2 (Connections) level 3 (499) Arithmetic and Algebra
Fair 1 Level 2 (Connections) Pilot Test Combinations andProbability
Earthquake 1 Level 3 (Reflection) level 4 (557) Combinations andProbability
Table 3 shows the six levels of proficiency difficulty that PISA establishes for evaluatingeach item. Each question is associated with a difficulty degree, representing what a studentis expected to achieve at that level.

Educ. Sci. 2022, 12, 546 9 of 20
Table 3. Proficiency levels of mathematical competence established by PISA. Adapted with permis-sion from Ref. [56], 2013, OECD, INEE.
Proficiency Level Example of a PISA Item What Is Assessed at Each Level
Level 6more than 668 points
WalkingQuestion 2
scoring 3 (723)
Conceptualise, generalise, and utilise information; arecapable of advanced mathematical thinking and reasoning;
have a mastery of symbolic and formal mathematicaloperations and relationships; formulate and precisely
communicate their findings, interpretations, and arguments.Example: Bernard knows his pacelength is 0.80 metres. Theformula applies to Bernard’s walking. Calculate Bernard’s
walking speed in metres per minute and in kilometres per hour.Show your working out.
Level 5607 to 668 points
WalkingQuestion 1
scoring 2 (666)
Develop and work with models for complex situations;select, compare, and evaluate appropriate problem-solving
strategies for dealing with complex problems; workstrategically using broad, well-developed thinking and
reasoning skills; reflect on their actions and formulate andcommunicate their interpretations and reasoning. Example:
¿If the formula applies to Heiko’s walking and Heiko takes 70 stepsper minute, what is Heiko’s pacelength? Show your work.
Level 4545 to 606 points
Coloured CandiesQuestion 1
Scoring 3 (549)
Work effectively with explicit models for complex concretesituations; select and integrate different representations,
including symbolic ones; utilise well-developed skills andreason flexibly; construct and communicate explanationsand arguments. Example: Robert’s mother lets him pick one
candy from a bag. He can’t see the candies. The number of candiesof each colour in the bag is shown in the following graph.
Level 3483 to 544 points
SkateboardQuestion 1
Scoring 3 (496)
Execute clearly described procedures, including those thatrequire sequential decisions; select and apply simple
problem-solving strategies; interpret and userepresentations; develop short communications reportingthese. Example: Eric is a great skateboard fan. He visits a shop
named SKATERS to check some prices. At this shop you can buya complete board. Or you can buy a deck, a set of 4 wheels, a set of2 trucks and a set of hardware and assemble your own board. Eric
wants to assemble his own skateboard. What is the minimumprice and the maximum price in this shop for
self-assembled skateboards?
Level 2421 to 482 points
Exchange RateQuestion 2Scoring 3
(439)
Interpret and recognise situations in contexts that require nomore than direct inference; extract relevant information
from a single source and make use of a singlerepresentational mode; employ basic procedures; make
literal interpretations of the results. Example: On returning toSingapore after 3 months, Mei-Ling had 3 900 ZAR left. She
changed this back to Singapore dollars, noting that the exchangerate had changed to: 1 SGD = 4.0 ZAR How much money in
Singapore dollars did Mei-Ling get?
Level 1358 to 420 points
Growing UpQuestion 3Scoring 2
(420)
Answer questions involving familiar contexts where allrelevant information is present, and the questions are clearly
defined; identify information and carry out routineprocedures according to direct instructions in explicit
situations; perform actions that are obvious and followimmediately from the given stimuli. Example: Explain howthe graph shows that on average the growth rate for girls slows
down after 12 years of age.
Below Level 1 less than 358 pointsNot demonstrate even the most basic types of mathematicalliteracy that PISA measures. These students are likely to be
seriously disadvantaged in their lives beyond school.

Educ. Sci. 2022, 12, 546 10 of 20
2.3. Analysis of Results
The results obtained are presented in two analyses. The first analysis involves theresults of each experimental group according to the number of correct answers. The numberof correct answers is the study variable of the first analysis. The number of correct answersis the study variable of the first analysis. Since some of the data are not normal, the Kruskal-Wallis H non-parametric test was used to compare the differences between the four studygroups (the control group and the three experimental groups) for both the pre-test andthe post-test. Likewise, each group’s pre- and post-test results will be presented using theMann-Whitney U test.
The second analysis represents a comparison between the percentage of correct an-swers per item of the 84 students concerning the percentage of correct answers determinedby the OECD and Spain as a reference country for being one of the first to apply the PISAtests [16]. For both analyses, 15 items released by PISA in all editions [16] were consideredand designed based on closed or open questions, where each item has a score establishedfor each correct answer.
3. Results3.1. Sociodemographic Characteristics of Students
The study sample included 84 students starting their first semester of high schoolbetween the ages of 14 and 15, of whom 40 are male and 44 are female. The socioeco-nomic level of the students is upper middle class even though 35% of the students have ascholarship based on financial need. The 84 students were distributed into four groups,64 participants in three experimental groups and 20 in the control group. Of the experi-mental groups, 30 are male and 34 are female, and in the control group, male and femalestudents are evenly distributed. As a distinctive characteristic of the four groups, all theparticipants attended the final grade of middle school in the virtual format and the lastthree months of the previous grade of middle school, indicating that half of their middleschool attendance was in virtual format due to the pandemic of COVID-19.
When applying for the pre-test, students showed great nervousness because it wasone of the first evaluations they had to take in a face-to-face format during the pandemic.It is worth mentioning that during the experimentation period, the students were in apandemic, with capacity restrictions in the classrooms and the protocol of healthy distanceand use of masks on campus implemented.
During the high school semester where this study took place, students came to campustwice a week for face-to-face classes and continued with virtual classes three times a week.After the pre-test, the PreparaTec platform began to be used in the classroom on face-to-faceformat days to encourage its use so that students could find value in the informationprovided by the platform, and they could later practice it outside the classroom under theflipped learning methodology.
In particular, group 3 showed more enthusiasm when performing the post-test thanthe other experimental groups. The relationship formed in this group with their teacherwas very close, so the motivation of the students to support the research had a significantimpact on the group’s results. However, it was the experimental group with the lowestscore in the pre-test evaluation.
3.2. Differences between Pre-Test and Post-Test
The first analysis involved three experimental groups (1, 2, and 3) and a control group.A pre-test of 23 questions was administered at the beginning of the semester, and a post-testat the end. The points assigned for each correct answer per item, established by PISA, are0 or 3 for closed questions and 0, 1, 2, or 3 for open questions. The maximum score forthis study is 69 points per student, considering that all answers are correct and that themaximum score of 3 points per correct answer is obtained. Students took a pre-test toevaluate the level of mathematical skills they had at the beginning of their first high school

Educ. Sci. 2022, 12, 546 11 of 20
semester and after taking classes online in the virtual format during about 12 months ofmiddle school.
Figure 3 shows the comparison between groups in relation to the number of correctanswers per group, (x represents the mean, the line represents the median and the bulletsrepresent the outliers). The maximum number of correct answers is 69 points, consideringa maximum of 3 points per correct answer.
Educ. Sci. 2022, 12, x FOR PEER REVIEW 11 of 20
impact on the group’s results. However, it was the experimental group with the lowest score in the pre-test evaluation.
3.2. Differences between Pre-Test and Post-Test The first analysis involved three experimental groups (1, 2, and 3) and a control
group. A pre-test of 23 questions was administered at the beginning of the semester, and a post-test at the end. The points assigned for each correct answer per item, established by PISA, are 0 or 3 for closed questions and 0, 1, 2, or 3 for open questions. The maximum score for this study is 69 points per student, considering that all answers are correct and that the maximum score of 3 points per correct answer is obtained. Students took a pre-test to evaluate the level of mathematical skills they had at the beginning of their first high school semester and after taking classes online in the virtual format during about 12 months of middle school.
Figure 3 shows the comparison between groups in relation to the number of correct answers per group, (x represents the mean, the line represents the median and the bullets represent the outliers). The maximum number of correct answers is 69 points, considering a maximum of 3 points per correct answer.
Figure 3. Pre-test scores of students in control and experimental groups.
Following these results, the Kruskal-Wallis H test shows that there was a statistical difference in the median pre-test score (p-value = 0.02) among all groups, and that there is variability concerning the essential mathematical competencies. Table 4 shows the pre-test results of the median between groups.
Table 4. Analysis of the median using the Kruskal-Wallis H test after applying the pre-test. (Source: Authors’ elaboration).
Pre-Test Data Analysis
Control Group Group 1 Group 2 Group 3
median 27 33 33 19.5 rank sum 905 928.5 1181 555.5
count 20 19 25 20 84 r2/n 40,951.25 45,374.3289 55,790.44 15,429.0125 157,545.031
H-stat 9.78156546 H-ties 9.80628719
df 3 p-value 0.02028661 α 0.05
sig yes
Figure 3. Pre-test scores of students in control and experimental groups.
Following these results, the Kruskal-Wallis H test shows that there was a statisticaldifference in the median pre-test score (p-value = 0.02) among all groups, and that there isvariability concerning the essential mathematical competencies. Table 4 shows the pre-testresults of the median between groups.
Table 4. Analysis of the median using the Kruskal-Wallis H test after applying the pre-test. (Source:Authors’ elaboration).
Pre-Test DataAnalysis
ControlGroup Group 1 Group 2 Group 3
median 27 33 33 19.5rank sum 905 928.5 1181 555.5
count 20 19 25 20 84r2/n 40,951.25 45,374.3289 55,790.44 15,429.0125 157,545.031
H-stat 9.78156546H-ties 9.80628719
df 3p-value 0.02028661
α 0.05sig yes
The Nemenyi test determined that there was a statistical difference in the mean pre-test score of Group 3 compared to the pre-test scores of Groups 1 (p value = 0.036) and2 (p value = 0.040), which means that group 3 shows a deficiency in the development ofessential mathematical skills than the other groups. Table 5 shows the pre-test results of themean per group using the Nemenyi test.

Educ. Sci. 2022, 12, 546 12 of 20
Table 5. Analysis of the mean using the Nemenyi test after applying the pre-test (Source: Authors’own elaboration).
Group A Group B R Mean Std Err Q-Stat p-Value R-Crit
Control Group Group 1 3.61842105 5.52565786 0.65483987 0.96703761 20.1465485Control Group Group 2 1.99 5.17445649 0.38458145 0.99296408 18.8660684Control Group Group 3 17.475 5.45435606 3.20386125 0.1076538 19.8865822
Group 1 Group 2 1.62842105 5.24956139 0.31020135 0.99627179 19.1399008Group 1 Group 3 21.0934211 5.52565786 3.81735924 0.03608361 20.1465485Group 2 Group 3 19.465 5.17445649 3.76174774 0.04018029 18.8660684
After a semester of taking classes using the PreparaTec platform (except for the controlgroup), the post-test was taken by all groups at the end of the course. The experimentalgroups worked with the PreparaTec platform throughout the semester, inside and outsidethe classroom. During this semester, given the pandemic conditions, the 64 students inthe experimental groups took the mathematics course in hybrid format, attending twicea week to face-to-face classes and three days a week in virtual format by zoom. With theuse of flipped learning (considered in the construction of PreparaTec), students were ableto review the class material in their own space and at their own pace, take notes, practicereflection, and analysis of the information on all those students who had problems withthe content of the subject (10). Figure 4 shows the results of the post-test (x represents themean, the line represents the median and the bullet represents the outlier).
Educ. Sci. 2022, 12, x FOR PEER REVIEW 12 of 20
The Nemenyi test determined that there was a statistical difference in the mean pre-test score of Group 3 compared to the pre-test scores of Groups 1 (p value = 0.036) and 2 (p value = 0.040), which means that group 3 shows a deficiency in the development of essential mathematical skills than the other groups. Table 5 shows the pre-test results of the mean per group using the Nemenyi test.
Table 5. Analysis of the mean using the Nemenyi test after applying the pre-test (Source: Authors’ own elaboration).
Group A Group B R Mean Std Err Q-Stat p-Value R-Crit Control Group Group 1 3.61842105 5.52565786 0.65483987 0.96703761 20.1465485 Control Group Group 2 1.99 5.17445649 0.38458145 0.99296408 18.8660684 Control Group Group 3 17.475 5.45435606 3.20386125 0.1076538 19.8865822
Group 1 Group 2 1.62842105 5.24956139 0.31020135 0.99627179 19.1399008 Group 1 Group 3 21.0934211 5.52565786 3.81735924 0.03608361 20.1465485 Group 2 Group 3 19.465 5.17445649 3.76174774 0.04018029 18.8660684
After a semester of taking classes using the PreparaTec platform (except for the con-trol group), the post-test was taken by all groups at the end of the course. The experi-mental groups worked with the PreparaTec platform throughout the semester, inside and outside the classroom. During this semester, given the pandemic conditions, the 64 stu-dents in the experimental groups took the mathematics course in hybrid format, attending twice a week to face-to-face classes and three days a week in virtual format by zoom. With the use of flipped learning (considered in the construction of PreparaTec), students were able to review the class material in their own space and at their own pace, take notes, practice reflection, and analysis of the information on all those students who had prob-lems with the content of the subject (10). Figure 4 shows the results of the post-test (x represents the mean, the line represents the median and the bullet represents the outlier).
Figure 4. Post-test scores of students in control and experimental groups.
The Kruskal-Wallis H test indicates no statistical difference in median test scores after the post-test, not even with the control group (p-value = 0.4362), indicating that all groups reached the same level of mathematical competence at the end of the semester. Table 6 shows the post-test results of the median between groups.
Figure 4. Post-test scores of students in control and experimental groups.
The Kruskal-Wallis H test indicates no statistical difference in median test scores afterthe post-test, not even with the control group (p-value = 0.4362), indicating that all groupsreached the same level of mathematical competence at the end of the semester. Table 6shows the post-test results of the median between groups.
The Nemenyi test determined that there was no statistical difference in the meanpost-test score of Group 3 compared to the pre-test scores of Groups 1 (p value = 0.7503) and2 (p value = 0.9972), which means that group 3 showed an improvement in the developmentof essential mathematical skills than the other groups. Table 7 shows the pre-test results ofthe mean per group using the Nemenyi test.

Educ. Sci. 2022, 12, 546 13 of 20
Table 6. Analysis of the median using the Kruskal-Wallis H test after applying the post-test. (Source:Authors’ own elaboration).
Post-Test DataAnalysis
ControlGroup Group 1 Group 2 Group 3
median 30 36 27 30rank sum 754 951 1020 845
count 20 19 25 20 84r2/n 28,425.8 47,600.0526 41,616 35,701.25 153,343.103
H-stat 2.71950022H-ties 2.72371941
df 3p-value 0.43621147
α 0.05sig no
Table 7. Analysis of the mean using the Nemenyi test after applying the post-test (Source: Authors’own elaboration).
Group 1 Group 2 R Mean Std Err Q-Stat p-Value R-Crit
Control Group Group 1 12.3526316 5.52565786 2.23550424 0.39059675 20.1465485Control Group Group 2 3.1 5.17445649 0.59909674 0.97442956 18.8660684Control Group Group 3 4.55 5.45435606 0.83419563 0.93513002 19.8865822
Group 1 Group 2 9.25263158 5.24956139 1.76255327 0.59765036 19.1399008Group 1 Group 3 7.80263158 5.52565786 1.41207288 0.75033384 20.1465485Group 2 Group 3 1.45 5.17445649 0.28022267 0.99724245 18.8660684
To compare the pre-test and post-test scores for each group, we used the Mann-Whitney Test for two independent samples for each group, for one and two tails. Therewere no statistical differences in the means of pre-test and post-tests for the control group(p-value = 0.2915), group 1 (p-value = 0.1060), and group 2 (p-value = 0.3864). Nevertheless,group 3 had a statistical difference with an improvement in mean from pre-test to post-test(p-value = 0.0056), indicating that it reached the same level of mathematical competence atthe end of the semester as the other groups. Table 8 shows the pre-test and post-test resultsof the mean between groups.
Table 8. Analysis of the mean using the Mann-Whitney Test after applying the pre and post-test(Source: Authors’ own elaboration).
DataAnalysis
ControlGrupoPre-test
ControlGroup
Post-test
Group 1Pre-Test
Group 1Post-Test
Group 2Pre-Test
Group 2Post-Test
Group 3Pre-Test
Group 3Post-Test
count 20 20 19 19 25 25 20 20median 27 30 33 36 33 27 19.5 30
rank sum 430.5 389.5 327.5 413.5 652.5 622.5 317.5 502.5U 179.5 220.5 223.5 137.5 297.5 327.5 292.5 107.5
one tail two tails one tail two tails one tail two tails one tail two tailsU 179.5 137.5 297.5 107.5
mean 200 180.5 312.5 200std dev 36.879916 ties 34.1795735 ties 51.5016841 ties 36.8068416 tiesz-score 0.54230058 yates 1.24343272 yates 0.28154419 yates 2.4995353 yateseffect r 0.08574525 0.20171142 0.03981636 0.39521123p-norm 0.29380573 0.58761145 0.10685421 0.21370842 0.38914652 0.77829304 0.00621782 0.01243563p-exact 0.29155711 0.58311423 0.10600238 0.21200475 0.38649309 0.77298618 0.00560338 0.01120677
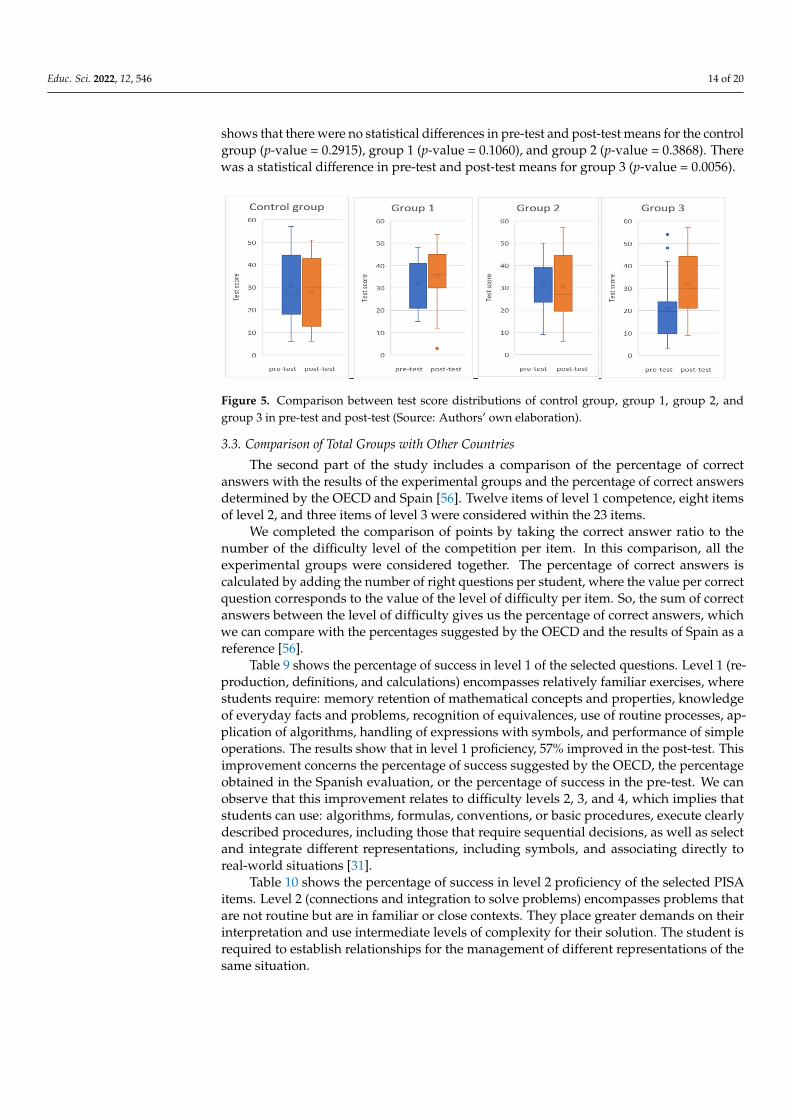
Figure 5 shows the pre-test and post-test for each group (x represents the mean, the linerepresents the median and the bullet represents the outlier). Comparison between groups
Educ. Sci. 2022, 12, 546 14 of 20
shows that there were no statistical differences in pre-test and post-test means for the controlgroup (p-value = 0.2915), group 1 (p-value = 0.1060), and group 2 (p-value = 0.3868). Therewas a statistical difference in pre-test and post-test means for group 3 (p-value = 0.0056).
Educ. Sci. 2022, 12, x FOR PEER REVIEW 14 of 20
Table 8. Analysis of the mean using the Mann-Whitney Test after applying the pre and post-test (Source: Authors’ own elaboration).
Data Analy-sis
Control Grupo Pre-
test
Control Group Post-
test
Group 1 Pre-Test
Group 1 Post-Test
Group 2 Pre-Test
Group 2 Post-Test
Group 3 Pre-Test
Group 3 Post-Test
count 20 20 19 19 25 25 20 20 median 27 30 33 36 33 27 19.5 30
rank sum 430.5 389.5 327.5 413.5 652.5 622.5 317.5 502.5 U 179.5 220.5 223.5 137.5 297.5 327.5 292.5 107.5 one tail two tails one tail two tails one tail two tails one tail two tails
U 179.5 137.5 297.5 107.5 mean 200 180.5 312.5 200
std dev 36.879916 ties 34.1795735 ties 51.5016841 ties 36.8068416 ties z-score 0.54230058 yates 1.24343272 yates 0.28154419 yates 2.4995353 yates effect r 0.08574525 0.20171142 0.03981636 0.39521123 p-norm 0.29380573 0.58761145 0.10685421 0.21370842 0.38914652 0.77829304 0.00621782 0.01243563 p-exact 0.29155711 0.58311423 0.10600238 0.21200475 0.38649309 0.77298618 0.00560338 0.01120677
Figure 5 shows the pre-test and post-test for each group (x represents the mean, the line represents the median and the bullet represents the outlier). Comparison between groups shows that there were no statistical differences in pre-test and post-test means for the control group (p-value = 0.2915), group 1 (p-value = 0.1060), and group 2 (p-value = 0.3868). There was a statistical difference in pre-test and post-test means for group 3 (p-value = 0.0056).
Figure 5. Comparison between test score distributions of control group, group 1, group 2, and group 3 in pre-test and post-test (Source: Authors’ own elaboration).
3.3. Comparison of Total Groups with Other Countries The second part of the study includes a comparison of the percentage of correct an-
swers with the results of the experimental groups and the percentage of correct answers determined by the OECD and Spain [56]. Twelve items of level 1 competence, eight items of level 2, and three items of level 3 were considered within the 23 items.
We completed the comparison of points by taking the correct answer ratio to the number of the difficulty level of the competition per item. In this comparison, all the ex-perimental groups were considered together. The percentage of correct answers is calcu-lated by adding the number of right questions per student, where the value per correct question corresponds to the value of the level of difficulty per item. So, the sum of correct answers between the level of difficulty gives us the percentage of correct answers, which we can compare with the percentages suggested by the OECD and the results of Spain as a reference [56].
Figure 5. Comparison between test score distributions of control group, group 1, group 2, andgroup 3 in pre-test and post-test (Source: Authors’ own elaboration).
3.3. Comparison of Total Groups with Other Countries
The second part of the study includes a comparison of the percentage of correctanswers with the results of the experimental groups and the percentage of correct answersdetermined by the OECD and Spain [56]. Twelve items of level 1 competence, eight itemsof level 2, and three items of level 3 were considered within the 23 items.
We completed the comparison of points by taking the correct answer ratio to thenumber of the difficulty level of the competition per item. In this comparison, all theexperimental groups were considered together. The percentage of correct answers iscalculated by adding the number of right questions per student, where the value per correctquestion corresponds to the value of the level of difficulty per item. So, the sum of correctanswers between the level of difficulty gives us the percentage of correct answers, whichwe can compare with the percentages suggested by the OECD and the results of Spain as areference [56].
Table 9 shows the percentage of success in level 1 of the selected questions. Level 1 (re-production, definitions, and calculations) encompasses relatively familiar exercises, wherestudents require: memory retention of mathematical concepts and properties, knowledgeof everyday facts and problems, recognition of equivalences, use of routine processes, ap-plication of algorithms, handling of expressions with symbols, and performance of simpleoperations. The results show that in level 1 proficiency, 57% improved in the post-test. Thisimprovement concerns the percentage of success suggested by the OECD, the percentageobtained in the Spanish evaluation, or the percentage of success in the pre-test. We canobserve that this improvement relates to difficulty levels 2, 3, and 4, which implies thatstudents can use: algorithms, formulas, conventions, or basic procedures, execute clearlydescribed procedures, including those that require sequential decisions, as well as selectand integrate different representations, including symbols, and associating directly toreal-world situations [31].
Table 10 shows the percentage of success in level 2 proficiency of the selected PISAitems. Level 2 (connections and integration to solve problems) encompasses problems thatare not routine but are in familiar or close contexts. They place greater demands on theirinterpretation and use intermediate levels of complexity for their solution. The student isrequired to establish relationships for the management of different representations of thesame situation.

Educ. Sci. 2022, 12, 546 15 of 20
Table 9. Comparison of the percentage of success for level 1 of competence of the experimental group,compared to the OECD and Spain. Adapted from [56].
Item Name Scoring Levels ofPerformance
% CorrectOECD
% CorrectSpain
% CorrectPre-Test
% CorrectPost-Test
Cubes 3 level 2 (478) 69.0% 72.5% 76.56% 82.81%(Q1) Growing Up 3 level 2 (477) 67.0% 66.5% 81.25% 70.31%
Shoes for Kids 3 Pilot Test Pilot Test Pilot Test 51.56% 68.75%Coloured Candies 3 level 4 (549) 50.2% 42.1% 50.00% 64.06%(Q3) Growing Up 3 level 3 (525) 54.7% 62.4% 70.31% 62.50%
Science Tests 3 level 4 (556) 46.8% 30.4% 29.69% 40.63%Table TennisTournament 3 Pilot Test Pilot Test Pilot Test 32.81% 40.63%
(Q1) Skateboard 2 level 2 (464) 10.6% 10.1% 7.81% 14.06%
(Q1) Walking 3 level 5 (611) 36.3% 38.4% 18.75% 12.50%(Q3) Growing Up 2 level 1 (420) 28.1% 19.2% 0.00% 0.00%(Q1) Skateboard 3 level 3 (496) 66.7% 66.6% 23.44% 29.69%(Q2) Skateboard 3 level 4 (570) 45.5% 43.0% 15.63% 35.94%
(Q1) Exchange Rate 2 level 1 (406) 79.7% 79.0% 64.06% 56.25%(Q2) Exchange Rate 3 level 2 (439) 73.9% 72.0% 51.56% 46.88%
Table 10. Comparison of the percentage of success for level 2 of competence of the experimentalgroup, compared to the OECD and Spain. Adapted from [56].
Item Name Scoring Levels ofPerformance
% CorrectOECD
% CorrectSpain
% CorrectPre-Test
% CorrectPost-Test
(Q2) Walking 2 level 5 (666) 9.00% 8.30% 7.81% 15.63Shelving 3 level 3 (499) 60.90% 57.00% 42.19% 60.94%(Q1) Chat 3 level 3 (533) 53.70% 46.00% 50.00% 48.40%
(Q2) Growing Up 3 level 4 (574) 44.80% 36.50% 29.69% 43.75%Robberies 3 level 6 (694) 15.40% 9.90% 31.25% 35.94%Carpenter 3 level 6 (687) 20.00% 12.90% 9.38% 14.06%
Fair 3 Pilot Test Pilot Test Pilot Test 40.63% 73.44%
(Q3) Skateboard 3 level 4 (554) 49.80% 46.00% 17.19% 34.38%(Q2) Walking 1 level 4 (605) 19.90% 23.70% 0% 6.25%
Robberies 2 level 4 (577) 28.10% 31.30% 1.56% 6.24%(Q2) Walking 3 level 6 (723) 8.00% 7.50% 9.38% 0%
The results show a 63.6% improvement in the questions with level 2 of competencein the post-test, regarding the percentage of correct answers suggested by the OECD, tothe percentage obtained in the Spanish evaluation or relation to the percentage of correctanswers in the pre-test. We also observed that the improvement relates to levels 3, 4,5, and 6 of the degree of difficulty, which implies that students can relate to differentsources of information, demonstrate advanced mathematical thinking and reasoning, aswell as compare and evaluate adequate strategies for solving complex problems. Theycan execute clearly described procedures requiring sequential decisions and select andintegrate different representations, including symbols and associating directly to real-worldsituations [31].
Table 11 shows the percentage of success in proficiency level 3 of the selected PISAitems. Level 3 (reflection) encompasses understanding, reflection, and creativity on the partof the student to identify and link knowledge from different sources. It involves the expla-nation or justification of the solution obtained. The results show an improvement of 100%with the questions concerning the percentage of correct answers suggested by the OECDcompared to the percentage obtained in the Spanish assessment [18]. We also observedthat the improvement relates to levels 4 and 5 of the degree of difficulty, which implies thatthe student can compare and evaluate adequate strategies for solving complex problems,

Educ. Sci. 2022, 12, 546 16 of 20
selecting and integrating different representations, including symbols, and associatingdirectly to real-world situations. However, the improvement in the percentage of successin the questions of level 6 of the degree of difficulty was only reflected in one questionout of three, so according to [16], the experiential practice in the solution of problems ofeveryday life will enable the application of knowledge and skills of mathematics to facenovel situations.
Table 11. Comparison of the percentage of success for level 3 of competence of the experimentalgroup, compared to the OECD and Spain. Adapted from [56].
Item Name Scoring Levels ofPerformance
% CorrectOECD
% CorrectSpain
% CorrectPre-Test
% CorrectPost-Test
(Q2) Chat 3 level 5 (636) 28.80% 21.60% 40.63% 28.13%(Q3) Exchange Rate 3 level 4 (586) 40.30% 30.30% 45.31% 39.06%
Earthquake 3 level 4 (557) 46.50% 38.80% 34.38% 43.75%
4. Discussion
Teaching mathematics requires students to analyze the knowledge acquired and applyit to their real environment. However, this is not easy to achieve. Especially in the currenttimes of contingency, teaching abstract concepts and acquiring these competencies becomeschallenging for teachers and educational institutions [13]. In addition, using ICTs becamea key tool to maintain distance education during the pandemic, which is necessary tostudy their impact on student learning [12]. This research aimed to identify the differencein basic mathematical competencies of middle school students when moving to the highschool level under pandemic conditions through the practice in the technological platformPreparaTec.
In the first part of the research, the students gradually learned to work autonomouslyon practice-oriented mathematics activities since, after the pre-test, they worked with theplatform in the classroom to show the benefits of its use. The students accepted flippedlearning and the fact that learning can be ubiquitous (it can be done anywhere and at anytime), which allowed flexibility for the student to access information as often as requiredat the time needed. Thus, this helped with supporting students who find it difficult tounderstand certain subjects [54].
In this research, we found that for this study group, in times of pandemic, the student-centered teaching-learning process, combined with innovative educational strategies(flipped learning) mediated by technology (PreparaTec platform), facilitated the devel-opment of mathematical competencies. They allowed the student to find the relationshipbetween what was learned and the problem to be solved. These findings coincide withstudies by other authors who indicate that this pedagogical strategy favors student learn-ing [49–51,53].
As a first finding, the development of mathematical competencies in the classroomcould be measured with PISA test items and compared with the OECD percentages ofcorrect answers per question. This comparison can also be made based on points per correctanswer per student, with the three proficiency levels of PISA and the six difficulty levels.In this case, we selected the item from a sample of the bank of items released by PISA [56].The study compared the post-test results with the average percentage determined by theOECD and the results obtained in the Spanish application [56], and the comparison withthe results obtained in the pre-test. Under this method, the study shows an improvementin the three proficiency levels under the PISA evaluation scheme. The second findingshows that we found an improvement in the percentage of correct answers in 57% ofthe level 1 proficiency questions (reproduction, definitions, and calculations), 63.6% inlevel 2 proficiency (connections and integration to solve problems), and 100% in level 3proficiency (reflection). Although we found no studies with the PISA test as an instrumentfor evaluating specific interventions in the classroom, the test measures the recognition andassessment of the skills acquired by the students [28].

Educ. Sci. 2022, 12, 546 17 of 20
The third finding was in experimental group 3, which obtained higher scores in thepost-test. Differences between the groups could be seen in the analysis of the median andmean for each group. We observed that experimental group 3 had a significant difference,with an improvement in the mean from pre-test to post-test (p-value = 0.0056), indicatingthat it reached the same level of mathematical competence at the end of the semester as theother groups.
We consider that this result was due to the teacher–student relationship created inthe group throughout the semester. The fact that the students were part of an investi-gation and the importance this would leave on resuming classes during the pandemicwere motivating factors for the students. This relationship influenced the students to dotheir best in the semester and use the PreparaTec platform. In theory, we could call it“achievement emotions,” directly linked to achievement activities or outcomes [33]. Teach-ers’ interest in students leads to higher achievement in mathematics teaching, as occurs inhigh-performing countries [29]. According to Retnawati [57], within the learning process,students should master the development of mathematical skills gradually; the expectationis that the students’ literacy level increases over time.
5. Conclusions
The PISA test is a standardized test measure that compares the results of the educationof high school students. Its analysis is generally performed in a macro manner, com-paring countries or regions according to different socioeconomic and sociodemographicvariables [27]. In this study, we sought to use the questions from the test to identify the com-petencies obtained by students when participating in an educational experiment throughthe use of the PreparaTec platform. The results can be valuable for managers, teachers,and mathematics specialists because they propose using active pedagogical strategies fa-cilitated by technologies, and they present an example of how teachers can evaluate thecompetencies obtained by students once they have received training through these media.The use of the PISA test as an instrument to measure the results of educational innovationis considered novel and appropriate, since no similar studies were found that allowedidentifying the change in the achievement of competencies in specific study contexts underpandemic conditions (COVID-19).
It is recommended to review the level 6 degree of difficulty for future studies sincethe expected results suggested by the OECD were not achieved, at least in the selectedPISA items. We believe that the level 6 degree of difficulty leads to the realization ofexperiential practices to facilitate both the application of mathematical concepts and theirunderstanding of the solution of a real problem [16]. Among the limitations, we have notfound studies comparing the results of this level of competence with PISA in the classroom.
Limitations
The results of this study are for this context and this study population and are notintended for generalizations. The study sample comprised 84 participants from a popula-tion of 108 students enrolled in the bicultural program at PrepaTec. However, for futureresearch, it would be interesting to consider a more extensive study with a broader pop-ulation considering the requirements for participants, including parental consent sincethe students are underage, at 14 to 15 years of age. It must be considered that for thisstudy, we were in a pandemic, and the data collection for the pre-test and post-test waslimited to the days when the students were on campus to ensure the same applicationconditions for all participants. Even though the pandemic conditions did not allow fora more extensive study, we believe that this experimentation sheds light on the use ofstandardized tests in seeking to measure the impact of an educational innovation such asthe PreparaTec platform.

Educ. Sci. 2022, 12, 546 18 of 20
Author Contributions: Conceptualization, B.E.M.-G., A.O.-D. and M.P.-C.; Formal analysis, A.O.-D.;Funding acquisition, B.E.M.-G.; Methodology, B.E.M.-G., A.O.-D. and M.P.-C.; Software, B.E.M.-G.;Supervision, B.E.M.-G. and M.P.-C.; Writing—original draft, B.E.M.-G., A.O.-D. and M.P.-C.; Writing—review & editing, B.E.M.-G., A.O.-D. and M.P.-C. All authors have read and agreed to the publishedversion of the manuscript.
Funding: The authors would like to acknowledge the financial support of NOVUS (Grant number:N19-45), Institute for the Future of Education, Tecnologico de Monterrey, Mexico, in the production ofthis work. The authors would like to acknowledge the financial support of the Writing Lab, Institutefor the Future of Education, Tecnologico de Monterrey, Mexico, in the production of this paper.
Institutional Review Board Statement: Not applicable.
Informed Consent Statement: Informed consent was obtained from all subjects involved in the study.
Data Availability Statement: Not applicable.
Acknowledgments: We acknowledge Maria Elena Cano Ruiz for helping us with the statisticalmeasurements of the investigation, and Karen Astrid Wagner Sinniger for helping us with thespelling and grammar of this manuscript.
Conflicts of Interest: The authors declare no conflict of interest.
References1. Contini, D.; Di Tommaso, M.L.; Muratori, C.; Piazzalunga, D.; Schiavon, L. Who lost the most? Mathematics achievement during
the COVID-19 pandemic. BE J. Econ. Anal. Policy 2022, 22, 399–408. [CrossRef]2. García, L. COVID-19 y educación a distancia digital: Preconfinamiento, confinamiento y posconfinamiento. RIED 2021, 24, 9–32.
[CrossRef]3. Government of Mexico. Available online: https://coronavirus.gob.mx/medidas-de-seguridad-sanitaria/ (accessed on
20 March 2022).4. Statista. Available online: https://es.statista.com/estadisticas/1196749/estudiantes-afectados-cierre-escuelas-covid-mexico-
nivel-educativo/ (accessed on 15 March 2022).5. Gonzalez, T.; de la Rubia, M.; Hincz, K.; Comas-Lopez, M.; Subirats, L.; Fort, S.; Sacha, G. Influence of COVID-19 confinement on
students’ performance in higher education. PLoS ONE 2020, 15, e0239490. [CrossRef] [PubMed]6. Pirrone, C.; Di Corrado, D.; Privitera, A.; Castellano, S.; Varrasi, S. Students’ mathematics anxiety at distance and in-person
learning conditions during COVID-19 pandemic: Are there any differences? An Exploratory Study. Educ. Sci. 2022, 12, 379.[CrossRef]
7. Rincón-Flores, E.; Mena, J.; López-Camacho, E. Gamification as a teaching method to improve performance and motivation intertiary education during COVID-19: A research study from Mexico. Educ. Sci. 2022, 12, 49. [CrossRef]
8. Martínez, F.; Jacinto, E.; Montiel, H. The use of online learning environments in higher education as a response to the confinementcaused by COVID-19. J. E-Learn. Knowl. Soc. 2021, 17, 10–17. [CrossRef]
9. Condor, H. Educating in times of COVID-19. CienciAmérica 2020, 9, 1–7. [CrossRef]10. Zhao, Y. COVID-19 as a catalyst for educational change. Prospects 2020, 49, 29–33. [CrossRef]11. Espinosa, M.P.P.; Cartagena, F.C. Advanced technologies to face the challenge of educational innovation. RIED 2021, 24, 35–53.
[CrossRef]12. Palomares-Ruiz, A.; Cebrián, A.; López-Parra, E.; García-Toledano, E. Influence of ICTs on math teaching–learning processes and
their connection to the digital gender gap. Sustainability 2020, 12, 6692. [CrossRef]13. Dziuban, C.; Graham, C.R.; Moskal, P.D.; Norberg, A.; Sicilia, N. Blended learning: The new normal and emerging technologies.
Int. J. Educ. Technol. High Educ. 2018, 15, 38. [CrossRef]14. Dúo-Terrón, P.; Moreno-Guerrero, A.-J.; Marín-Marín, J.A. ICT motivation in sixth-grade students in pandemic times-the influence
of gender and age. Educ. Sci. 2022, 12, 183. [CrossRef]15. Brunetto, D.; Bernardi, G.; Abdrá, C.; Liljedahl, P. Teaching as a system: COVID-19 as a lens into teacher change. Educ. Stud. Math.
2022, 110, 65–81. [CrossRef] [PubMed]16. Martínez-Sierra, G.; García-García, J.; Dolores Flores, C. Mathematics should be applied: The mathematical beliefs of secondary
school mathematics teachers. Math. Educ. 2019, 31, 92–120. [CrossRef]17. Lavidas, K.; Apostolou, Z.; Papadakis, S. Challenges and opportunities of mathematics in digital times: Preschool teachers’ views.
Educ. Sci. 2022, 12, 459. [CrossRef]18. Pérez Rojas, F.J. El razonamiento lógico en la enseñanza de las matemáticas. Nextia 2018, 5, 26–28.19. PISA 2022 Mathematics Framework. Available online: https://pisa2022-maths.oecd.org/ (accessed on 15 April 2022).20. Yusupova, N.G.; Skudareva, G.N. Quality Accordingly PISA: From Math Teachers’ Continuing Education to Students’ Mathemat-
ical Literacy. In Proceedings of the VI International Forum on Teacher Education (IFTE-2020), Kazan, Russia, 25 November 2020.[CrossRef]

Educ. Sci. 2022, 12, 546 19 of 20
21. Žnidaršic, A.; Brezavšcek, A.; Rus, G.; Jerebic, J. Has the COVID-19 pandemic affected mathematics achievement? A case study ofuniversity students in social sciences. Mathematics 2022, 10, 2314. [CrossRef]
22. Segbenya, M.; Bervell, B.; Minadzi, V.M.; Asante Somuah, B. Modelling the perspectives of distance education students towardsonline learning during COVID-19 pandemic. Smart Learn. Environ. 2022, 9, 13. [CrossRef]
23. Sampedro Requena, B.E.; Maldonado Berea, G.A. Valoraciones de los estudiantes mexicanos y españoles sobre el uso de las TICcomo recurso para trabajar la educación inclusiva. Bordón 2017, 69, 89–106. [CrossRef]
24. Huang, H.K. Implementing a theory-driven gamification model in higher education flipped courses: Effects on out-of-classactivity completion and quality of artifacts. Comput. Educ. Int. J. 2018, 125, 255–257. [CrossRef]
25. Mahfuzah, M.S. Gamification approaching education to increase learning engagement. Int. J. Humanit. Soc. Sci. 2018, 4, 22–32.[CrossRef]
26. OECD. PISA 2012 Results: What Students Know and Can Do—Student Performance in Mathematics, Reading and Science (Volume I,Revised edition, February 2014); OECD Publishing: Paris, France, 2014. [CrossRef]
27. OECD. PISA 2012 Results in Focus. What Students Know at Age 15 and What They Can Do with What They Know. Availableonline: https://www.oecd.org/pisa/keyfindings/PISA2012_Overview_ESP-FINAL.pdf (accessed on 30 July 2022).
28. Hernández-Fernández, J. Admission and academic selection in upper secondary education. Arch. Analíticos Políticas Educ. 2021,29, 1–29. [CrossRef]
29. Skipp, C.S.; Dommett, E.J. Understanding and addressing the deficiencies in UK mathematics education: Taking an internationalperspective. Educ. Sci. 2021, 11, 141. [CrossRef]
30. Mora, C.D. Strategies for learning and teaching mathematics. J. Pedagogy 2003, 24, 181–272.31. Ramírez-Montoya, M.S.; Loaiza-Aguirre, M.I.; Zúñiga-Ojeda, A.; Portuguez-Castro, M. Characterization of the teaching profile
within the framework of education 4.0. Future Internet 2021, 13, 91. [CrossRef]32. Gamal, C.E.; Casas, J.A.; Pérez, C.; Ortega-Ruíz, R. Teaching and learning Mathematics: The need for a multidisciplinary analysis.
Psychol. Soc. Educ. 2017, 9, 1–10. [CrossRef]33. Pekrun, R. The control-value theory of achievement emotions: Assumptions, corollaries, and implications for educational research
and practice. Educ. Psychol. Rev. 2006, 18, 315–341. [CrossRef]34. Robertson, S.L. Provincializing the OECD-PISA global competences project. Glob. Soc. Educ. 2021, 19, 167–182. [CrossRef]35. Osuna, C.; Díaz, K. Mathematics learning achievement in PISA, ENLACE and PLANEA in Mexican adolescents. A retrospective
analysis. Arch. Analíticos Políticas Educ. 2019, 28, 3. [CrossRef]36. PISA 2013, Prueba de Matemáticas y Solución de Problemas. Available online: https://drive.google.com/file/d/16
fYvZGzBUVRgje5pB_8Lr-ZKGwE4LjvM/view (accessed on 26 June 2022).37. OECD’s PISA Program. Available online: https://www.oecd.org/pisa/39730818.pdf (accessed on 10 March 2022).38. Programa para la Evaluación Internacional de Alumno. Informe PISA 2003, Aprender Para el Mundo del Mañana. Available
online: https://www.oecd.org/pisa/39732493.pdf (accessed on 26 June 2022).39. Green, A.; Pensiero, N. The effects of upper-secondary education and training systems on skills inequality. A quasi-cohort
analysis using PISA 2000 and the OECD survey of adult skills. Br. Educ. Res. J. 2016, 42, 756–779. [CrossRef]40. Sortkær, B.; Reimer, D. Classroom disciplinary climate of schools and gender—Evidence from the Nordic countries. Sch. Eff. Sch.
Improv. 2018, 29, 511–528. [CrossRef]41. Boman, B. PISA Achievement in Sweden from the perspective of both individual data and aggregated cross-country data. Front.
Educ. 2022, 6, 753347. [CrossRef]42. Basarkod, G.; Marsh, H.W.; Parker, P.D.; Dicke, T.; Guo, J. The immigrant paradox and math self-concept: An SES-of-origin-country
hypothesis. Learn. Instr. 2022, 77, 101539. [CrossRef]43. Beneito, P.; Vicente-Chirivella, Ó. Banning mobile phones in schools: Evidence from regional-level policies in Spain. Appl. Econ.
2022; Ahead of print. [CrossRef]44. Divjak, B.; Rienties, B.; Iniesto, F.; Vondra, P.; Zızăk, M. Flipped classrooms in higher education during the COVID-19 pandemic:
Findings and future research recommendations. Int. J. Educ. Technol. High Educ. 2022, 19, 9. [CrossRef]45. Ospina Espinal, Y.A.; Galvis López, J. The paradigm of traditional education towards a virtual curricular approach. Virtualmente
2016, 3, 4–29.46. Nederveld, A.B. Flipped learning in the workplace. J. Workplace Learn. 2015, 27, 162–172. [CrossRef]47. Prieto, M.A. Flipped Learning: Aplicar el Modelo de Aprendizaje Inverso; Narcea: Madrid, Spain, 2017.48. Ramírez-Montoya, M.S.; Andrade-Vargas, L.; Rivera-Rogel, D.; Portuguez-Castro, M. Trends for the future of education programs
for professional development. Sustainability 2021, 13, 7244. [CrossRef]49. Strelan, P.; Osborn, A.; Palmer, E. The flipped classroom: A meta-analysis of effects on student performance across disciplines
and education levels. Educ. Res. Rev. 2020, 30, 100314. [CrossRef]50. Van Alten, D.C.D.; Phielix, C.; Janssen, J.; Kester, L. Effects of flipping the classroom on learning outcomes and satisfaction: A
meta-analysis. Educ. Res. Rev. 2019, 28, 100281. [CrossRef]51. Zainuddin, Z.; Haruna, H.; Li, X.; Zhang, Y.; Chu, S.K.W. A systematic review of flipped classroom empirical evidence from
different fields: What are the gaps and future trends? Horizon 2019, 27, 72–86. [CrossRef]52. Yang, Q.F.; Lin, C.J.; Hwang, G.J. Research focuses and findings of flipping mathematics classes: A review of journal publications
based on the technology-enhanced learning model. Interact. Learn. Environ. 2021, 29, 905–938. [CrossRef]

Educ. Sci. 2022, 12, 546 20 of 20
53. Fornons, J.V.; Palau, M.R. Flipped classroom in mathematics education: A systematic review. Educ. Knowl. Soc. (EKS) 2021, 22,1–11. [CrossRef]
54. Bergmann, J.S.; Sams, A. Flip Your Classroom: Reach Every Student in Every Classroom Every Day, 1st ed.; International Society forTechnology in Education: Eugene, OR, USA, 2012.
55. Portuguez Castro, M. El aula invertida como estrategia didáctica en educación superior. In Educación y Aprendizaje SignificativoDurante la Pandemia de COVID 19; Venteño Jaramillo, G., Bethzabe, R.T., Eds.; UNAM: Oaxaca, Mexico, 2021; pp. 89–94.
56. Inee, PISA Stimuli Released. Available online: http://recursostic.educacion.es/inee/pisa/ (accessed on 26 June 2022).57. Retnawati, H.; Wulandari, N.F. The development of students’ mathematical literacy proficiency. Probl. Educ. 21st Century 2019, 77,
502–514. [CrossRef]