Embed Size (px)
Citation preview
Running head: GROWTH MODELS AND ELL STUDENTS
Evaluating Growth for ELL Students: Implications for Accountability Policies
Joni M. Lakin
Auburn University
John W. Young
Educational Testing Service, Princeton, New Jersey
Author Note
Joni M. Lakin, Department of Educational Foundations, Leadership, and Technology,
Auburn University; John W. Young, Educational Testing Service, Princeton, NJ.
Joni Lakin was an AERA-ETS postdoctoral fellow at Educational Testing Service for
part of this project. Any opinions expressed in this paper are those of the authors and not
necessarily of Educational Testing Service. We gratefully acknowledge the helpful comments
and assistance provided by Heather M. Buzick, Katherine E. Castellano, and Dianne Henderson-
Montero in the development of this paper. We are also grateful for the assistance of several of
our ETS colleagues in data analysis, including Steven Holtzman and Chen Li.
Correspondence concerning this article should be addressed to Joni Lakin, Department of
Educational Foundations, Leadership, and Technology, Auburn University, Auburn, AL 36849.
Email: [email protected]
The definitive version of this article is available at www.blackwell-synergy.comor http://onlinelibrary.wiley.com/doi/10.1111/emip.12012/abstract
Running head: GROWTH MODELS AND ELL STUDENTS 2
Abstract
In recent years, many U.S. states have introduced growth models as part of their educational
accountability systems. Although the validity and fairness of growth-based accountability
models have been evaluated for the general population, the impact of those models for English
language learner (ELL) students, a growing segment of the student population, has not received
sufficient attention. We evaluated three commonly used growth models: value tables or transition
matrices, projection models, and student growth percentiles (SGP). The value table model
identified more ELL students as on-track to proficiency, but with lower accuracy for ELL
students. The projection and SGP models were more accurate overall, but classified the fewest
ELL students as on-track and were less likely to identify ELL students who would later be
proficient. We found that each model had significant trade-offs in terms of the decisions made
for ELL students. These findings should be replicated in additional state contexts and considered
in the development of future growth-based accountability policies.
Running head: GROWTH MODELS AND ELL STUDENTS 3
Evaluating Growth for ELL Students: Implications for Accountability Policies
Since the U.S. Department of Education (2005) introduced the Growth Model Pilot
Project (GMPP), many U.S. states have used accountability-focused growth models as part of
their district, school, and educator accountability systems under No Child Left Behind (NCLB).
The stated purpose of introducing the growth models to NCLB accountability included
monitoring states’ progress in closing achievement gaps for all students and setting high
expectations for annual gains in achievement for all students. Furthermore, the implementation
of growth models in many states created an alternative mechanism for schools to make adequate
yearly progress without meeting the ever-increasing status-based proficiency cutoffs for all
student groups (a requirement of the original NCLB program). In the system under GMPP,
schools that failed to meet status-based proficiency cutoffs could make adequate yearly progress
by showing that students met growth targets indicating that they were “on track” to proficiency
(also known as showing “growth to proficiency” or “growth to standards”). In recent years, other
states have adopted growth models that set meeting growth targets as an equal requirement to
status (Jones, 2008).
As of 2011, four growth models were in use by various state assessment programs (U.S.
Department of Education, 2009b; O’Malley, Murphy, McClarty, Murphy, & McBride, 2011):
value tables or transition matrix models, trajectory models, projection models, and student
growth percentile models (for details refer to Betebenner, 2009; Council of Chief State School
Officers [CCSSO], 2009; Hoffer et al., 2011; O’Malley et al., 2011). Differences in how these
models set growth targets for students result in differences in the proportion of students the
models classify as on track (CCSSO, 2009; Dunn & Allen, 2009; Hoffer et al., 2011).
Running head: GROWTH MODELS AND ELL STUDENTS 4
Current accountability regulations require that states track the proficiency of key
subgroups of students, one of which is English-language learner (ELL) students. ELL students
comprise a large and growing segment of the U.S. student population (Federal Interagency
Forum on Child and Family Statistics, 2011). Although there have been evaluations of the
effectiveness of the growth models introduced through the GMPP (Dunn & Allen, 2009; Hoffer
et al., 2011), there has been less attention to the effectiveness and validity of the growth model
system for specific student subgroups. Thus, the purpose of this study was to explore the
variations among several accountability-focused growth models in terms of the number of on-
track classifications made and the predictive accuracy of those classifications when applied to
the ELL student population. We were specifically interested in the number of ELL and non-ELL
students identified as on-track, the concordance between those classification decisions and later
proficiency, and the magnitude of the growth targets set by each model.
This study has important implications for the use of growth models in accountability
systems especially as many states struggle to promote the academic achievement of large or
growing proportions of ELL students (Olsen, 2010). Furthermore, growth models appear poised
to maintain or increase their role in educational accountability policy through the work of the
two general assessment consortia formed under Race to the Top legislation. Both the Smarter
Balanced Assessment Consortia (SBAC) and Partnership for Assessment of Readiness for
College and Careers (PARCC) include growth determinations as an important feature of their
assessment systems (Center for K–12 Assessment & Performance Management, 2011).
Considering the implications of growth models for ELL students is therefore critical.
Running head: GROWTH MODELS AND ELL STUDENTS 5
Considerations in applying growth models to ELL students
Buzick and Laitusis (2010) identified a number of concerns with the use of
accountability-focused growth models for students with disabilities. These include changing test
accommodations1 from year to year, the use of modified assessments without established links to
the unmodified tests, and the heterogeneity of this population. We likewise believe that the
application of growth models to ELL students could raise important questions about the validity
and fairness of the model for both the students and the schools evaluated on the basis of these
models.
Some issues are critical to the assessment of ELL students regardless of whether status-
based, growth-based, or other accountability models are being used. First, it must be
acknowledged that the population of ELL students is remarkably heterogeneous. ELL students
vary along a number dimensions including current English proficiency, native language and
country of origin, native language literacy when entering U.S. schools, and amount of formal
education in home country prior to entering U.S. schools. Treating ELL students as a
homogeneous group with similar needs is widely considered a critical limitation to improving
their instruction through accountability (Abedi & Dietel, 2004; Stevens, Butler, & Castellon-
Wellington, 2000).
A second issue is the accuracy and consistency with which students are identified as
ELL. ELL services and designations are dependent on identification which varies by state and
sometimes by school district (Abedi & Dietel, 2004). Changes in ELL classification either due to
real changes in instructional need (i.e., reclassification as English proficient) or due to changes in
identification procedures can result in changes to the accommodations a student receives from
1 Test accommodations consist of modifications to the content, format, or administration of tests intended to reduce the influence of construct-irrelevant demands on test performance (AERA, APA, NCME, 1999; Pitoniak, Young, Martiniello, King, Buteux, & Ginsburgh, 2009).
Running head: GROWTH MODELS AND ELL STUDENTS 6
one assessment to the next. Importantly, it also changes whether a student’s performance is
reported as part of the ELL subgroup. Exiting high performing students from the reported
subgroup leads to a “moving target” for improving the achievement of ELL students (Abedi,
2004).
Third, a number of researchers have addressed the serious issue of the validity of
achievement tests for ELL students, specifically the concern that the measured constructs are
overly influenced by language proficiency and may not reflect ELL students’ academic
knowledge (e.g., Abedi & Lord, 2001; Stevens et al., 2000; Wright & Li, 2008). A fourth issue is
the typically low scores received by ELL students compared to other reported groups (Abedi &
Dietel, 2004). Performance that is far below the level of performance for which tests were
designed can impact the reliability and diagnostic value of test results (Cronbach, 1990; see also
Buzick & Laitusis, 2010).
In addition to the concerns above, there are other issues critical to the assessment of ELL
students that are specific to accountability models that rely on indices of growth. First, the
amount of missing data may vary for ELL students compared to non-ELL students because ELL
students have greater levels of mobility and are sometimes excused from taking the English
versions of the achievement tests that are used for accountability purposes (Auty et al., 2008;
Gándara, 2004; Olsen, 2010). Missing data can result in ELL students not being included in
growth-based accountability indices. The typical solution reached by states in the GMPP is to
use whatever years of data are available (Hoffer et al., 2011). At a minimum, with just one year’s
results, students are only evaluated based on status. For uses of growth models that treat growth
as an extra-credit approach to showing Adequate Yearly Progress (AYP; true of all states in the
original GMPP; Hoffer et al., 2011), falling back on status-only for students with insufficient
Running head: GROWTH MODELS AND ELL STUDENTS 7
data is adequate. However, for systems like Colorado’s student growth percentiles model, where
schools are evaluated on the basis of growth and status (Betebenner & Linn, 2009). schools will
not be held accountable for growth for students with incomplete data. This policy would affect
ELL students disproportionately.
As part of their application to join the GMPP, many states reported the rates at which
students’ data were matched across two or more years in their state data systems (U.S.
Department of Education, 2009b). We compiled their reports in Table 1 where it is clear that
ELL students are missing data at a rate higher than the overall population in most states. They
also have lower match rates than White students and in some cases lower than the Hispanic
population (which in most states also includes a large number of ELL students). Thus, it appears
that the issue of matching data and the solutions applied to incomplete data will
disproportionately affect ELL students.
[Table 1 here]
A second concern in the assessment of ELL students for growth-based accountability
models is changes in the use of accommodations (which are known to be implemented in less
than ideal ways for ELL students in general; Kopriva, 2008; Solano-Flores, 2008). The addition
or removal of accommodations across grades can create spurious growth or mask real growth in
students’ achievement.2 Buzick (2011) found that changes in the provision of accommodations
for students with disabilities appear to cause such spurious effects and it seems likely that this
would apply to ELL students as well.
A third concern is whether “normal” growth is different for ELL students compared to
non-ELL students. This issue has important implications for the fairness and validity of growth
2 O’Malley et al. (2009) found that about half of the 11 states initially approved for the GMPP did not have systems in place to include alternate assessments designed for ELL students in their growth determinations.
Running head: GROWTH MODELS AND ELL STUDENTS 8
models when applied to these students, because federal regulations restrict the consideration of
student background variables in state growth models (U.S. Department of Education, 2005).
Research has shown that the growth patterns likely do differ for ELL and non-ELL students,
though the research is mixed in terms of the direction of differences. Some researchers have
found that ELL students show slower improvement in academic content skills than non-ELL
students, even when compared to other low-scoring students (Abedi & Dietel, 2004; Olsen,
2010). Other researchers, like Han (2008) found a range of relative growth trajectories in
mathematics and reading for immigrant students from various cultural backgrounds—some
groups gaining relative to non-immigrant students and other groups losing ground. Likewise,
Mancilla-Martinez and Lesaux (2011) found that the rate of growth in vocabulary and word
reading for minority language students sometimes exceeded that of national norms, depending on
their parents’ use of native vs. English language in the home. Variation in the typical growth
patterns of students in different subgroups indicates that the application of a common growth
model to ELL and non-ELL students may lead to misclassifications by growth models for both
individuals and schools or districts, because all students are held to a single “normal” path.
Although the regulations against including student background variables in growth models is
well-intentioned and meant to prevent schools from holding disadvantaged groups to a lower
standard, it may possibly have the unintended effect of setting growth standards too low.
A fourth concern (motivated by the third) is whether and how the different growth
models currently available for growth-based accountability affect the proficiency classifications
made for ELL students. This is the most complex issue to address because it is affected by the
other issues list above. In this study, we take the first step in exploring whether there are
differences in the behavior of growth models that might have important implications for their use
Running head: GROWTH MODELS AND ELL STUDENTS 9
in accountability policy. Early identification of students whose levels of growth are insufficient
to reach proficiency in the elementary grades is particularly important for ELL students because
of growing achievement gaps on content tests in later grades (Olsen, 2010). Furthermore,
because these growth models have high stakes implications (at least for schools at this time), it is
critical that their behavior be evaluated when the growth models are applied to critical subgroups
like ELL students. It is this latter concern that this study addresses.
The current study
The purpose of this study was to explore differences in the classifications made by
growth models for ELL and non-ELL students by various growth models. The growth models
considered were three of the models in use by various U.S. states in 2011: value table, projection,
and student growth percentile (SGP) models. A fourth commonly used growth model, the
trajectory model, was not considered because it requires a vertical scale or other means of
comparing scores across grade levels that could not be replicated in our dataset. However, Hoffer
et al. (2011) found that the trajectory and value table models performed comparably due to the
strong similarity between the models (with value tables basically acting as a rudimentary version
of the trajectory model3). Thus, we expect that our findings for the value table model will
generalize to the trajectory model.
We compared the models in several ways. The most basic comparison was whether each
model identified consistent numbers of ELL and non-ELL students as on-track. The second was
a predictive comparison—if the model classified a student as on-track to proficiency, how likely
was it that the student would actually be classified as proficient in the target grade? The
classification accuracy of each model was compared to other models and across ELL and non-
3 Hoffer et al. (2011) concluded that the value table model was basically a rudimentary version of the trajectory model because the growth targets for each year in the value table model are set at the cut scores for sub-proficiency levels rather than absolute distance from the proficient cut score (as is done for the trajectory model). Their study found over 90% agreement in classifications of students across the two models.
Running head: GROWTH MODELS AND ELL STUDENTS 10
ELL samples. Finally, for the two models that set growth targets (value table and SGP), we
compared the stringency of the targets set across ELL and non-ELL students. Although ELL
students would be logically expected to have higher growth targets if they have lower scores on
average, we sought to quantify the size of the growth targets and evaluate how realistic the
targets appeared. To summarize, the following research questions were addressed:
1. How much agreement is there between the value table, projection, and student growth
percentile models in terms of the proportion of ELL and non-ELL students classified as
on track to proficiency?
2. How much agreement is there between on-track classifications made by each of the
models in grade 4 with students’ actual grade 7 proficiency classification? Does this
agreement vary by ELL status?
a. For the projection model, are regression residuals comparable for ELL and non-
ELL students?
3. For the two models that set growth targets (value table and SGP), are the growth targets
set equally demanding, on average, for ELL and non-ELL students?
Growth models and classification accuracy
Conceptualizing growth model behavior in terms of classification accuracy is warranted
because one underlying goal of growth models is to give schools credit in early grades for
students who will reach proficiency in later grades. Thus, these models should be evaluated in
terms of whether students who are classified as being on-track to later proficiency actually reach
proficiency in later grades.
In this study, we compared the accuracy of model classifications in grade 4 relative to
actual proficiency in the horizon year (grade 7). That is, we compared whether ELL and non-
ELL students who are designated as on track in grade 4 were actually classified as proficient in
Running head: GROWTH MODELS AND ELL STUDENTS 11
grade 7. The decisions were classified as “accurate” decisions, “false positive” errors, and “false
negative” errors (Streiner & Cairney, 2007). Accurate decisions were a combination of true
positives (students who are on track and proficient in grade 7) and true negatives (students who
are not on track and are not proficient in grade 7). False positive errors were classification errors
where students who were classified as on track in early grades were not proficient in grade 7.
False negatives were classification errors where students who were not classified as on track in
early grades were proficient in grade 7.
It should be noted that “false positives” and “false negatives” are not necessarily true or
random errors made by the model. In measuring growth, false negatives may include students on
any number of trajectories. First, they may represent successful interventions where students who
initially perform poorly increase their performance due to appropriate instruction (a success for
the school and teachers, but one that may not be rewarded until later). Second, false negatives
may represent real errors by the model in failing to predict which students will later be proficient
because some students increase their performance after early poorer scores because of
developmental effects or, in the case of ELL students, gains in English proficiency. In these
cases, Jerald, Doorey, and Forgione (2011) point out that false negatives represent unnecessary
opportunity and real costs to schools who expend resources to intervene with students who really
are on track to proficiency but do not receive an on-track classification in earlier grades. False
negatives also magnify the problem that Ho (2011) identified in that growth models can
unintentionally create incentives for schools and teachers to ignore students who are not
expected to ever reach proficiency. False negative errors represent a misleading degree of the
“inertial effect” that Ho identified.
Running head: GROWTH MODELS AND ELL STUDENTS 12
In contrast, false positives would almost always be a detriment to students. False
positives are missed opportunities where students who will struggle later on are not identified in
time. For ELL students, this could be caused by differences in the way that ELL students
progress towards proficiency compared to non-ELL students or by a gap between their growth in
English proficiency and the language demands of instruction (which increases rapidly across
grades). This possibility of model misfit was anticipated by the National Center for Learning
Disabilities (2009), which stated that “performance may be masked by assumptions about
previous performance and predicting future performance” (p. 3) and that growth trajectories may
differ for a particular subgroup of students. Both false positives and false negatives can represent
the impact of instructional effectiveness of schools or a mismatch between the growth of the
typical student and the growth of specific students.
Regardless of the source of false positives and negatives, the important consideration is
the differences in the number of errors between ELL and non-ELL students rather than the
absolute number of errors made. Differences in the numbers of errors for the two groups could
reflect misfits between the way the models track growth towards proficiency and the ways that
ELL students develop academically. These differences would have critical implications for both
ELL students and the teachers and schools that serve them.
Methods
Sample
The data for this study came from a large California school district which provided the
research team with longitudinal data on all students in the district. The students in the district as a
whole are predominantly low socioeconomic status with over 80% eligible for free or reduced
lunch and predominantly Hispanic (over 50%), with the remaining portion divided among
Running head: GROWTH MODELS AND ELL STUDENTS 13
African American, Asian, and White ethnic/racial backgrounds. In the district, over one-quarter
of the students are ELLs.
We requested all archival academic records for students enrolled in the district as of
January 1, 2010, including test scores up to the end of the 2009-2010 school year. The
demographic information available for individual students in the sample was limited to the data
collected as part of the California Basic Educational Data System (CBEDS) in 2010-2011.4
During data cleanup, 1.9% of student cases were dropped because students repeated grades.
Another 3.7% were dropped because they had test data for non-sequential grades which appeared
to be database and/or ID-number matching errors. The number of ELL and non-ELL students
dropped during data cleanup for repeated and non-sequential grades were proportional to their
representation in the total sample.
For this study, we used data from students in the high school graduating classes of 2012-
2015 who had either Mathematics or English Language Arts (ELA) scores and who had data
from the CBEDS system (required to classify students by ELL status).5 The data from the 2012
cohort were used as the calibration year for the projection and SGP models. Therefore, results of
the growth models are reported only for the 2013-2015 cohorts. Table 2 shows the demographic
breakdown for the sample by ELL status. A majority of the students in the sample were
Hispanic. Among those for whom English was not their first language, there were large
populations of Spanish and Hmong speakers. It is also important to note that there were similar
percentages of students in both ELL and non-ELL groups who were receiving special education
4 CBEDS is designed for reporting demographic information at the school, district, county, and state level. The student level variables gathered include gender, race, ethnicity, parent education, and primary home language as well as general information about school assignment and program assignment (e.g., special education, foster care). We were only able to obtain CBEDS data for the 2010-11 school year. 5 The requirement of being in the CBEDS system in 2010-2011 did not require that the students still be enrolled in a California school in 2010.
Running head: GROWTH MODELS AND ELL STUDENTS 14
services. Thus, the documented effects of special education or disability status on growth
models, as summarized in the literature review, would affect both groups.
[Table 2 here]
ELL status was determined based on 2010-2011 CBEDS data which reflected whether
each student was currently (or at time of last attendance) classified as having limited English
proficiency (LEP), reclassified as fully English proficient (RFEP), or had never been classified
as LEP. We were unable to attain year-by-year district-level ELL classifications, so every
student who was currently or previously classified as having LEP was categorized as an ELL
student for the purposes of this study. This likely had the effect of making the ELL sample in this
study higher performing than the true ELL population in the district, which in all accountability
models as of 2011 consists only of students still classified as having LEP.
To further describe the ELL sample, we report additional details about these students in
Table 3. ELL status in California is partly based on the California English Language
Development Test (CELDT), which is administered annually to ELL-classified students
(California Department of Education, 2011). Scores on the four batteries—speaking, listening,
reading, and writing—as well as overall performance are used to group students into one of five
levels of proficiency: Beginning, Early Intermediate, Intermediate, Early Advanced, and
Advanced. In the school district under consideration, students are reclassified as fully English
proficient when their overall scores and subtest scores on the CELDT reach at least the Early
Advanced category and their performance on the English Language Arts section of the California
Standards Tests (see below) is at least at the Basic level.
Running head: GROWTH MODELS AND ELL STUDENTS 15
In 2010-2011, 27% of our sample was classified as RFEP and 19% was classified as
LEP, so almost half of the sample was combined into the ELL category for our study.6 Although
we did not have year-to-year information about district ELL classifications, we did have some
information about the ELL students’ level of English proficiency each year. Table 3 shows that
in grade 3, where most of our ELL sample7 was still taking the CELDT to assess their
developing English proficiency, large numbers of the ELL students were classified as having
Beginning or Early Intermediate levels of proficiency, meaning they spoke and understood only
simple English phrases (California Department of Education, 2009). By grade 7, of the students
still required to take the CELDT (i.e., more recent arrivals as well as those not transitioned out of
ELL services), most were scoring at the intermediate and early advanced levels, meaning they
were beginning to use increasingly more complex English effectively in the classroom.
[Table 3 here]
Instrument
This study focused on the California Standards Tests (CST) in Mathematics and English
language arts (ELA). These tests were being used by the state during the time period studied to
measure student academic achievement for school accountability purposes. The tests are
administered in grades 2-11 to measure students’ achievement of California’s academic content
standards in a number of content areas. The scores are reported on a scale that is consistent
across grades, where the cut points for each level of proficiency are consistent across grade
levels. Thus, at each grade level, scores of 150 to 259 are classified as Far Below Basic8, scores
6 The rates of ELL are higher in our study than in the district overall because we counted all students ever classified as ELL and because elementary grades typically have higher proportions of ELL students than higher grades. 7 All students currently classified as ELL take the CELDT each year. The only students in our “ELL” sample who would not have CELDT scores would be those who had been reclassified in grades K-2. 8 This is the only cut score that varies by grade, ranging from 236-262. We used the cut score for grade 3 ELA for all comparisons, which overestimates the number of “far below basic” students at other grades in this study relative
Running head: GROWTH MODELS AND ELL STUDENTS 16
of 260 to 299 are Below Basic, scores of 300 to 349 are Basic, and scores of 350 and above are
Proficient (California Department of Education, 2009). The Advanced proficiency category used
by California was not used in this study.
Generic growth models
In this study, we compared three of the four types of models approved under the Growth
Model Pilot Program in 2011 (value tables, projection models, and student growth percentiles).
As discussed above, trajectory models could not be studied. Within the classes of models, states
vary in the specifics of their implementations. For example, some states give the same weights to
all transitions under the Value Table model (see specifics below) while others weight some
changes more heavily, and some states combine both ELA and Mathematics scores into the same
projection model. To simplify the comparison process, Hoffer et al. (2011) created generic
versions for the three models initially approved for use by the GMPP (value tables, trajectory,
and projection). This study also uses their generic versions of the value tables and projection
models and introduces a generic form of the student growth percentiles model as the basis for
comparing the models. The specifics of these generic models are specified below.
For each model, the horizon year (i.e., the year at which all students must meet the status
proficiency goal) was set at grade 7. Grade 3 and 7 scores were evaluated for status only.
Students were evaluated for status and growth targets in grades 4 to 6.
Value Table. The value table (or transitions matrix) growth model defines growth to
proficiency in terms of whether a student has made an upward transition between levels of
proficiency since the previous test. Students making upward transitions (e.g., moving from
Below Basic to Basic or Far Below Basic to Basic) since the previous year are deemed on track
to their true classifications for California’s system, but does not affect the comparisons made across groups in this study.
Running head: GROWTH MODELS AND ELL STUDENTS 17
to proficiency. Thus, in grades 4 to 6, if a student was not classified as proficient based on status
(i.e., score above 350), the student’s current proficiency classification was compared to the
previous year’s classification. All students who made a positive transition were counted as on
track.
Projection Model. The projection model uses regression methods to make predictions
about the future proficiency of a current cohort of students based on the past performance of
other cohorts of students. Specifically, the projection model uses a previous cohort of students
with complete data from grade 3 to 7, in this case, to define a regression model to predict grade 7
test scores using two or more previous years of data. The comparison group’s regression model
is then applied to later cohorts of students for whom grade 7 data are normally not yet available.
Students who are predicted to have scores of 350 or above in grade 7 using the comparison
group’s regression coefficients are classified as on track under this model.
The number of years used in the prediction model varies by state. For example, Ohio uses
from three to five years of data to make predictions (State of Ohio & Ohio Department of
Education, 2006). To maximize comparability of models, we used only two years of data at a
time (e.g., grade 3 and 4) to predict students’ horizon year scores. An example of the regression
model for a student who is not proficient in grade 4 is
Where y7 is the student’s predicted score in grade 7, X3 and X4 are the student’s scores in grade 3
and 4, and β0, β1, and β2 are regression coefficients defined by the comparison cohort data.
For the projection model, Hoffer et al. (2011) used a regression model based on district-
centered means. Using district means allows the model to incorporate more cases even when
Running head: GROWTH MODELS AND ELL STUDENTS 18
students are missing data. Because of limitations of the available data9, we were only able to use
an ordinary least squares (OLS) regression model without district-centering. Thus, our model has
more casewise deletions due to missing data.
Student Growth Percentiles. The student growth percentiles (SGP) model uses quantile
regression to make determinations about a student’s growth towards a proficiency standard (U.S.
Department of Education, 2009a). Quantile regression is similar to the familiar OLS regression
(used in the generic form of the projection model in this study), but instead of estimating
conditional means for the dependent variable using a single equation based on the predictor
variables, it estimates a number of conditional quantiles (100 percentiles in this case) in separate
regression equations. The SGP model uses prior test scores as predictors (effectively grouping
students based on prior scores; Betebenner, 2007; 2009). The end result is a percentile rank (a
student growth percentile ranking or SGP) expressing a student’s current test score status in
terms of how much gain the student has made relative to peers with similar to prior test scores.
The SGP model yields two indices of a student’s relative performance which are used in
determining which students are on-track to proficiency. First, the “current SGP” is a student’s
percentile rank of current score relative to their past scores, which is calculated by comparing the
student’s current status to students with similar scores from prior grade levels (Betebenner,
2009). The current SGP score can thus be interpreted as an index of how much growth a student
has made compared to his or her peers with the same past performance (Betebenner, 2009).10
9 The obvious limitation is that we have only one district in our data. However, even school-centered models were not possible in this study because we only had students’ school assignment for the 2010-2011 school year, when most students had moved on to middle and high schools. 10 It should be noted that researchers such as Castellano and Ho (in press) disagree with the use of the term “growth” with respect to the SGP model. Fundamentally, SGPs are purely normative and descriptions of relative change compared to peers. Thus, it is possible for a student to lose ground in absolute terms of achievement but still attain a high SGP if she simply lost less than her peers. We refer to SGPs as indices of growth in this study because that is the policy-related terminology used with respect to these models. See Ho (2011) for a similar concern regarding projection models.
Running head: GROWTH MODELS AND ELL STUDENTS 19
Second, the “projected SGP” is an estimation of the minimum growth percentile rank the student
will need to attain in future years to reach proficiency by a target horizon year. Similar to the
projection model, this prediction is based on the trajectory of a previous cohort with complete
data up through the horizon year, data which is not normally available for the focal cohort of
students.
In Colorado’s implementation of the SGP model, current and projected SGPs are
compared to make the on-track determinations. Students are classified as on track11 when their
current SGP for a given year exceeds their projected SGP for the horizon year (Colorado
Department of Education, 2009). That is, students are on track when their observed growth
percentile in a given year exceeds the model’s estimate of what level of growth the student needs
to reach proficiency by the horizon year. For example, consider a student who received a current
SGP estimate of 50 and a projected SGP of 45 in grade 4. A current SGP of 50 indicates that this
student has a current (grade 4) test score equal to the median score of all students who had the
same test scores in the prior grade (grade 3), which could be interpreted as that student showing
typical/median growth from the prior to the current year compared to students with similar prior
scores. The projected SGP of 45 indicates that in order to reach the proficient standard in the
horizon year (grade 7, three years away), the student needs to reach a minimum current SGP of
45 in grade 4, 5, and 6 to show adequate growth towards proficiency by grade 7. In this case,
since the student’s current SGP (50) exceeds the minimum projected SGP to reach proficiency
(45), she is classified as on-track to proficiency in grade 4 (Colorado Department of Education,
2009; U.S. Department of Education, 2009b). In practice, states can vary the number of years
11 Colorado uses the term “catching up” for students who are not currently proficient based on status but are achieving adequate growth. “Catching up” is analogous to “on track” as we use it in this study. Colorado also uses the term “keeping up” to designate students who are both currently proficient based on status and achieving their growth targets.
Running head: GROWTH MODELS AND ELL STUDENTS 20
forward they project the SGPs, the number of prior years’ data used, and can recalculate or
maintain the projected SGP across grades for individual students (U.S. Department of Education,
2009b).
The R (R Development Core Team, 2011) package developed for this model (SGP,
Betebenner & Van Iwaarden, 2011b) was used to calculate students’ current year SGP and
projected SGP scores for grades 4 to 6. Current SGPs were estimated within each cohort, so that
the percentile ranks only refer to students within the same cohort. In order to estimate the
projected SGPs for the horizon year, grade 7, SGP models require a comparison cohort with
complete data up to the target grade level to specify the parameters of the needed quantile
regression models. As with the projection model, we used the 2012 cohort as the comparison
cohort. For each grade level where we estimated projected SGP (grades 4 to 6), the current and
previous year’s scores for each of the focal cohorts (2013-2015) were combined with the
comparison cohort’s data. To illustrate, the dataset for the grade 4 projected SGP calculations for
a given focal cohort is represented in Table 4. In this case, grade 3 and 4 data for the focal cohort
(a cohort that, in practice, does not yet have grade 5 to 7 data) are combined with grade 3 to 7
data from the 2012 cohort in order to estimate the projected SGPs for grade 7 for the focal
cohort. This is necessary because separate quantile regressions are used to project grade 3 scores
(the “prior score” for grade 4 as the focal year) all the way up to grade 7 scores (always the
horizon year in this study). To do this, we need to project grade 3 scores to grade 4 scores, grade
3 scores to grade 5, grade 3 scores to grade 6, and, finally, grade 3 scores to grade 7. All of these
quantile regressions are used in the final calculation of projected SGPs (Betebenner & Van
Iwaarden, 2011b).
Running head: GROWTH MODELS AND ELL STUDENTS 21
In order to maximize the comparability of the SGP model to the other models in this
study as well as to current state-level applications of SGP, some constraints were placed on the
model. First, as with the other models, only two years of data (one “prior” score and one
“current” score) from the focal group were used to create the current and projected SGPs. In
practice, more years can be used and may increase precision (Betebenner, 2009). The second
constraint concerned the parameters of the estimation process. In Betebenner’s implementation
of SGP, the conditional quantile functions used by the model are parameterized using B-spline
cubic basis functions (Betebenner, 2007, 2009). B-spline functions require the specification or
estimation of knots, which in the default SGP code (Betebenner & Van Iwaarden, 2011b) are the
.2, .4, .6 and .8 quantiles of each grade-level observed scores, and boundaries, which are the
minimum and maximum observed scores. Consistent with many existing implementations of the
SGP model12, rather than re-estimating the knots and boundaries for each cohort separately, we
pre-specified the knots and boundaries for the B-spline parameters for all analyses. The knots
and boundaries values were calculated from the combined 2012-2015 cohort data and were
constant across all SGP calculations.
Analyses
The three models were compared on a number of dimensions. First, we compared the
absolute number of ELL and non-ELL students classified as on track under each growth model.
Second, we compared the accuracy of their classifications in grade 4 relative to actual
proficiency in the horizon year (grade 7).13 That is, we compared whether ELL and non-ELL
students who are designated as on track in grade 4 were actually classified as proficient in grade
12 For the SGP software package, Betebenner and Van Iwaarden (2011b) have gathered information about the test scale and score distributions for 24 states to determine fixed knots and boundaries which can be selected in the SGP package to estimate current and projected SGPs. 13 Accuracy classification rates could be calculated for grades 5 and 6 as well. However, in the interest of brevity and maximizing the contrasts, only grade 4 results are reported here.
Running head: GROWTH MODELS AND ELL STUDENTS 22
7. The decisions were classified as “accurate” decisions, “false positive” errors, and “false
negative” errors (Streiner & Cairney, 2007; see also discussion above). The accuracy rate was
calculated as the number of accurate decisions divided by the number of all decisions. False
positive rates were calculated as the number of false positives divided by the number of students
proficient in grade 7. False negative rates were calculated as the number of false negative errors
made divided by the number of students not proficient in grade 7.
For the projection model, an additional check of model accuracy was possible through an
analysis of the regression residuals. Specifically, we looked for a significant difference in the
residuals for ELL and non-ELL students using a two-way ANOVA of regression residuals,
crossing ELL status with cohort year. Reynolds (1982) suggested this ANOVA approach for
detecting consistent under- or over-prediction for subgroups as a more sensitive test of predictive
bias than using an interaction term for group membership in an OLS regression.
In an additional set of analyses, we were also interested in differences in the level of
difficulty or rigor of the growth targets set for ELL and non-ELL students under the two models
(value table and SGP) that set annual growth targets for the years between the first non-proficient
year and the horizon year. For the value table model, we compared the proportion of ELL and
non-ELL students making the different types of transitions of proficiency (e.g., below basic to
basic transitions vs. basic to proficient transitions). We were interested in whether ELL students
were more likely to receive credit for being on-track by making lower-level transitions than non-
ELL students. For the SGP model, we compared the median projected SGP of ELL and non-ELL
students to see if the year-to-year growth required relative to their peers was similar for each
group.
Running head: GROWTH MODELS AND ELL STUDENTS 23
Results
Figure 1a-b shows the percent of ELL and non-ELL students falling into the four
proficiency categories in grade 3. For each of the three cohorts, ELL students were more likely to
be in one of the three below-proficiency categories (far, below basic, and basic) with only 11-
16% reaching the proficient category in ELA. Non-ELL students had higher proficiency rates
with between 25-31% of students from each cohort falling into the proficient category. For
reference, the statewide proficiency rate in California in 2010 was 54% in ELA and 56% in
mathematics, so this is a low-performing district. ELL students appear to be performing more
poorly than their non-ELL classmates, particularly in ELA: χ2 tests of proportions of students in
each category indicate that differences between FEP and ELL are significant for ELA.
Differences in proportions were not significant for math, but there is a noticeable trend of fewer
ELL students reaching proficiency in mathematics relative to their non-ELL classmates.
[Figure 1 here]
Classification Rates
Once the generic growth models were applied to individual students’ test scores in grades
4 to 6, students were categorized as on-track to proficiency if they did not meet the status cutoff
in a given grade level but did meet the growth target set by a particular growth model. Table 5,
which shows all cohorts, and Figures 2a-b, which illustrates the 2015 cohort as an example, show
the percent of students who were not proficient in grade 4 to 6 but were classified as on track by
the value table, projection, and SGP models in ELA (2a) and Mathematics (2b). Overall, models
showed distinct differences. The projection model identified the lowest proportion of students as
on track (2-6% of non-ELL students and 1-4% of ELL students classified as on-track),
replicating the findings of Hoffer et al. (2011) where few students and especially few schools
Running head: GROWTH MODELS AND ELL STUDENTS 24
reached growth targets under this model. In contrast, the value table model identified a relatively
large number of students as on track, particularly in grade 4 (38-52% for non-ELL students and
42-52% for ELL students in ELA). The SGP model fell in the middle of the other models,
identifying between 12-15% of both ELL and non-ELL students as on-track in ELA,
[Figure 2 here]
[Table 5 here]
It is unclear from the available data why the classification rates vary so much by grade
level.14 Although Hoffer et al. (2011) found fairly consistent rates across grades, Dunn and Allen
(2009) observed variability and concluded that changing stringency in the standards for the test
across grades may play a role. The greater variability we observed compared to Hoffer et al.
study may be due to using California’s data and proficiency cut scores rather than North Carolina
data with cut scores based on the z-scale (making it more likely that proportions will be similar
across grades).
Differences between ELL and non-ELL students by model were found as well. Looking
at the ELA assessment, the ELL students were more likely to be classified as on track by the
value table model than non-ELL students were, particularly in grade 4 for most of the cohorts.
The projection model was somewhat less likely to classify ELL students as on track compared to
non-ELL students, though with the exception of cohort 2014 in grade 4, the differences were
slight. Similarly, the differences in classification rates for the SGP model were quite small, with
the exception perhaps of grade 4 for cohort 2014.
For the Mathematics assessment, again we found that ELL students were more likely to
be classified as on track by the value table model than non-ELL students were, particularly in
14 In this district, the typical elementary school has a K-6 configuration, so transitions in schools cannot explain the drop in grade 5.
Running head: GROWTH MODELS AND ELL STUDENTS 25
grade 4 and for most of the cohorts. Only negligible differences were found for the Mathematics
assessment for the projection model. However, the SGP model consistently classified more ELL
students as on-track in grade 4. Overall, the most pronounced differences in on-track
classification rates were for the value table model which generally tended to identify more ELL
students than non-ELL as on-track across content domains, grades, and cohorts. SGP showed
smaller but similar trends for mathematics at grade 4.
Classification Accuracy
In this district, about 23% of ELL and 25% of non-ELL students who were not proficient
in grade 3 were proficient by grade 7. We were interested in how well the models identified these
students. The accuracy with which on-track classifications in grade 4 predicted actual grade 7
proficiency was calculated in terms of three decision categories described in the analysis section:
accurate decisions, false positives, and false negatives. All of these decisions were calculated in
fourth grade for students who were not proficient in third grade. The results are presented in
Table 6 (all cohorts) and Figure 3a-b (2015 cohort as an illustration). As an illustration, the first
three columns (2013 cohort) indicate that the number of false positives (first two rows) for non-
ELL students ranged from 17% for the projection model to 60% for the value table model. For
ELL students, the same models made 8% and 57% errors, respectively.
The results indicate that, as Hoffer et al. (2011) found, the projection model is the most
accurate model overall with accuracy rates consistently around 80%. We also found that the SGP
model was nearly as accurate as the projection model and for the same apparent reason—it
classifies few students as on-track who are not currently proficient (see Table 5) compared to the
value table model. Because few students in this district actually reach proficiency (around 28%
proficient in both ELA and Mathematics in grade 7), the models that identify the fewest non-
Running head: GROWTH MODELS AND ELL STUDENTS 26
proficient students as on track are likely to be more accurate. Importantly, we found that these
two models do not show differences in accuracy between ELL and non-ELL students. The same
cannot be said for the value table model which showed somewhat lower accuracy for ELL
students compared to non-ELL students across most cohorts and both mathematics and ELA
content areas.
[Figure 3 here]
[Table 6 here]
Accuracy referred to the two types of “correct” decisions: students who were not on track
and did not reach proficiency in grade 7 and students who were on track and did reach
proficiency in grade 7. We were also interested in two erroneous decisions: false negatives,
where students are not classified as on-track but later reach proficiency, and false positives,
where students are classified as on-track in early grades but are not proficient in grade 7. All
three of the models made more false negative errors for ELL students (approximately 16% across
cohorts and models) compared to non-ELL students (approximately 20%). For the projection
model for both ELA and math, these differences were the largest (up to 11% higher), but all
three models made a substantial number of false negative errors for ELL students.
In terms of false positives, the projection model showed the biggest difference in the
number of false positives, making fewer false positive errors for ELL students than non-ELL
students (on average, 6% lower). The SGP model showed a similar, though smaller, trend. The
value table model made similar numbers of false positive errors for ELL and non-ELL students.
To summarize, for the value table model, the large number of on-track decisions led to
unsurprisingly high rates of false positives for both ELL and non-ELL students, given that
relatively few students reached proficiency in grade 7 in this district. The high rate of false
Running head: GROWTH MODELS AND ELL STUDENTS 27
positives did not prevent the model from failing to identify many ELL students who would later
be proficient (false negatives) as well. In contrast, the projection and SGP models made fewer
errors overall, but in both cases the errors made tended to favor non-ELL students, with fewer
false negatives and more false positives for non-ELL students.
Projection model: Regression residuals. The accuracy comparisons above indicated
that the projection model was similarly accurate for ELL and non-ELL students. However, a
more sensitive test of the predictive accuracy of this model (which is not possible for the other
models) was made using regression residuals, comparing predicted grade 7 scores to actual grade
7 scores. See Figure 4a-b for an illustration of the average residuals for ELL and non-ELL
students by grade (x-axis) and cohort (lines). In this case, most students’ scores were
overpredicted (negative residuals) using the model calibrated on the 2012 cohort. We found the
clearest trend for math, where overprediction was much smaller for ELL than non-ELL students,
indicating that the model was most accurate for ELL students. However, another way to interpret
these findings is that, because non-ELL students had larger negative residuals on average, the
model effectively underpredicts the future achievement of ELL students relative to non-ELL
students from their own cohorts.15 That is, although the model is technically more accurate for
ELL students, there is an advantage given to non-ELL students in that the model is more likely to
overestimate their grade 7 scores and more likely to make a false positive error (consistent with
the findings in Table 6). A two-way ANOVA (ELL status X cohort) for each grade level (4 to 6)
confirmed that the differences in residuals between ELL and non-ELL samples were significant
15 Recall that the regression coefficients were based on the 2012 cohort, so the residuals do not sum to zero in the 2013-2015 cohorts.
Running head: GROWTH MODELS AND ELL STUDENTS 28
for each cohort at each grade level (p<.001 for ELL main effect at each grade level analyzed
separately).16
[Figure 4 here]
For ELA scores, Figure 4a indicates that overall, the model was more accurate for ELL
and non-ELL students than math. The trends for over- vs. under-prediction for ELA appear more
mixed with average residuals hovering around zero. However, two-way ANOVAs of these
residuals indicate that there is greater underprediction of scores for ELL compared to non-ELL
students in grades 4 and 5. In grade 6, the differences in ELA residuals were not significant,
indicating that for the shortest predictive gap (grade 6 to 7), there were no significant differences
in the regression residuals for ELA.
Again, the ELA results indicate that ELL students tend to reach a relatively higher level
of achievement in grade 7 than the regression model predicted compared to non-ELL students.
Although the residuals were generally small (5-15 points on a 600 point scale), these residuals
may have practical importance for some students because the difference in cutoff scores for
proficiency levels is 40-50 points.
Growth Targets Set by Value Table and SGP models
To further explore the behavior of each model when applied to ELL and non-ELL
students, we conducted model-specific analyses for the two models that set annual growth targets
(value table and SGP). These analyses assessed whether the growth targets set by each of the
models created greater barriers for ELL students being classified as on-track relative to their non-
ELL classmates. We expected that differences in the growth targets might explain differences in
on-track classification rates and/or predictive accuracy.
16 The main effects of cohorts were all statistically significant as well, but not of substantive interest. Interactions of cohort membership and ELL status were not significant across grades.
Running head: GROWTH MODELS AND ELL STUDENTS 29
Value table model: Similarity in transitions. For the value table, we were interested in
whether the large number of on-track decisions for ELL students could be attributed to their
greater numbers at the lowest levels of proficiency (i.e., with the most possible level changes to
make). Table 7 reports the number of ELL and non-ELL students making the transition between
various levels of proficiency. Chi-square comparisons of non-ELL and ELL students in terms of
the proportions of transitions made for each grade were non-significant. Thus, it does not appear
that the types of transitions that need to be made by ELL and non-ELL students differ. Therefore,
differences in the on-track classifications are not likely to be due to differences in initial
proficiency classification or, in other words, due to effectively setting low growth targets for
ELL students.
[Table 7 here]
SGP model: Median growth percentiles. For the SGP model, we were interested in
whether ELL and non-ELL students differed in their typical projected SGPs from non-ELL
students, effectively setting a higher bar for growth for these students. Few differences, small in
magnitude, were found in the average current SGP (i.e., ranking of growth attained relative to
peers) for ELL and non-ELL students. Thus, ELL and non-ELL students appeared to make
similar gains when they had similar earlier test scores.
In contrast, projected SGPs (the growth percentile needed to reach proficiency by grade
7) were significantly higher on average for ELL students, indicating that the growth targets they
needed to reach in order to be classified as on-track were much higher. See Table 8. These
differences appear to be meaningful, especially for ELA where ELL students had projected SGPs
that were 12 points higher than non-ELL students (averaging across grades and cohorts).
Running head: GROWTH MODELS AND ELL STUDENTS 30
Mathematics had smaller differences, with an average projected SGP that was 5 points higher for
ELL students.
These differences in growth targets, especially for ELA, are likely to make it more
difficult for ELL students to meet growth targets and be classified as on-track compared to non-
ELL students under the SGP model. Projected SGPs much higher than 50 indicate that students
need to make substantially greater gains in the future than have been typically seen in the past for
students with similar test scores. For example, the average ELL student in the 2013 cohort is
asked to make growth gains each year that would put them at or above the 70th percentile in
terms of growth. Many ELL students are asked to make much more impressive levels of growth
to be classified as on-track. Although the high projected SGPs are a function of initial lower
performance for ELL students, the large number of false negatives for ELL students and false
positives for non-ELL students indicates that there is some discrepancy between the
classifications made by the SGP model and the later proficiency of students.
[Table 8 here]
Discussion
This study found a number of differences in the classifications made by the three
accountability-focused growth models as well as accuracy of those models for ELL and non-ELL
students. We also explored two erroneous model decisions: false negatives, where students are
not on-track in early grades but later reach proficiency, and false positives, where students are
on-track in early grades but are not proficient in grade 7. Both types of errors have potentially
important consequences for both students and teachers.
The value table model identified many more students as on track to proficiency than the
other two models and was more likely to classify ELL students as on track than non-ELL
Running head: GROWTH MODELS AND ELL STUDENTS 31
students. This model could be termed “optimistic” with respect to the future proficiency of
students. Further analyses demonstrated that ELL students made the growth targets set by this
model by making similar transitions compared to non-ELL students, so their typically low
proficiency classification was not responsible for the high on-track rates (i.e., through making
only low proficiency transitions). However, the high rate of on-track decisions resulted in lower
accuracy rates for the model and somewhat higher false negative rates for ELL students
compared to non-ELL students, indicating that this model does not capture the growth of ELL
students as effectively as for non-ELL students. Overall, the value table seems to yield
problematic classifications for ELL students—it identifies a larger number of ELL students as
on-track, but those that it identified were less likely to be proficient at grade 7 than the non-ELL
students who were identified.
The projection model identified the fewest students as on track, with ELL students taking
the ELA assessment somewhat less likely than non-ELL students to be classified as on track by
this model. The projection model was also the most accurate of the three models, consistent with
previous findings in the general student population (Hoffer et al., 2011). However, we found that
the projection model achieved slightly higher accuracy for ELL students at the cost of making
substantially more false negative decisions and fewer false positive decisions for both ELA and
mathematics tests for ELL students.
This finding was further supported by the analyses of regression residuals which showed
relative underprediction (or less overprediction) of ELA and Mathematics scores for ELL
students compared to non-ELL students. That is, especially for mathematics achievement, ELL
students were performing better by grade 7 by a greater margin than non-ELL students based on
a regression model derived from the overall student population. Thus, in many cases, ELL
Running head: GROWTH MODELS AND ELL STUDENTS 32
students were not given credit in early grades for their future success when evaluated under the
projection model. Unlike the value table or SGP models, the false positive and negative errors
for the projection model can almost certainly be considered true errors made by the model,
because the goal of the projection model is simply to predict later proficiency, regardless of the
shape or direction of the actual growth pattern (Ho, 2011). Thus, these errors are detrimental to
both students and the schools being evaluated for effectiveness in teaching ELL students.
The SGP model identified more students as on-track than the projection model, with
similar numbers of ELL and non-ELL students identified. In terms of accuracy, the SGP model
had only slightly lower accuracy than the projection model and showed few differences in
accuracy for ELL and non-ELL students. However, the SGP model showed trends similar to the
projection model in terms of greater numbers of false negative decisions and fewer false positive
decisions for ELL students, though these trends were muted, especially for mathematics. Thus,
like the projection model, the SGP model makes errors that may unfairly penalize schools with
large numbers of ELL students because it fails to identify accurately all of the ELL students who
will later be successful.
In further analyses, we found that the SGP model set growth targets (projected SGPs) that
were much higher for ELL than non-ELL students. At first glance, this may seem reasonable
given that ELL students face significant challenges in reaching proficiency because they often
start off with lower scores on achievement tests relative to their non-ELL peers. However, the
higher rates of false negatives for ELL students under the SGP model indicate that many of the
ELL students who are not making growth targets in early grades were reaching proficiency by
grade 7, potentially indicating that the model does not give the students (or schools) credit for
early gains that will lead to later proficiency. Again, if these are errors (and not reflecting true
Running head: GROWTH MODELS AND ELL STUDENTS 33
changes in instructional effectiveness across grades), they are detrimental to both students and
the schools being evaluated.
It is important to note that in this district, the ELL population comprised a large segment
of the student sample (almost 50%). Thus, these estimates are a best-case scenario where ELL
students contribute heavily to the establishment of the regression model. In states or districts
where ELL students comprise a smaller proportion of the population, many errors made by the
models will be exacerbated.
Accuracy as a desirable feature
It may seem obvious that accuracy for a growth model would be desirable. Jerald et al.
(2011) confirm that accuracy is important to the extent that it minimizes expenditures on
unnecessary interventions for students or avoids undeserved penalties for school personnel.
However, model accuracy can also indicate that schools are not radically improving instruction
over time and that early non-proficiency accurately predicts later non-proficiency. This is
particularly true for the projection model and to a lesser degree for the SGP model, both of which
achieve high accuracy by classifying very few currently non-proficient students as on track. For
this reason, Ho (2011) argued that the projection model is most accurate (compared to trajectory
or value table models) because it reflects the unfortunate reality of the current educational system
where few students who struggle early on later reach proficiency (an “inertial effect”). Jerald et
al. (2011) add that this inertial effect is exactly what accountability policies are intended to
disrupt. Radical changes in the effectiveness of instruction should result in making projection
models (and by extension, SGP models) much less accurate, because early non-proficiency
would no longer predict later non-proficiency. Thus, a good goal for schools in the short run
might be to make projection models as inaccurate as possible!
Running head: GROWTH MODELS AND ELL STUDENTS 34
It should be noted that the SGP identified 2-3 times as many students as on-track
compared to the projection model without an appreciable increase in the number of false
positives (in fact, the false positives rates are mostly higher for the projection model). This may
indicate that the SGP model may be a good compromise between the overly “optimistic” value
table and trajectory models, which over-identify students as on-track in this and other studies,
and the overly “pessimistic” or inertial projection model, which classified few students as on-
track. The fact that SGP offers predictions of future proficiency with high accuracy (as the
projection model does) coupled with readily interpreted intermediate growth targets (as
trajectory and value table models do) further sets this model apart in supporting the types of
inferences that stakeholders want to make using accountability-focused growth models
(Betebenner & Linn, 2009; Ho, 2011; Jones, 2008).
Considering student background characteristic in growth models
A recurring issue in this study was the ambiguity of interpreting classification accuracy—
do ELL students received more erroneous classifications because of the models or because ELL
students make gains that defy early prediction? To address this issue, a particularly important
area of future research will be to compare the empirical growth curves of ELL and non-ELL
students to ascertain whether common growth target models are warranted or appropriate.
Currently, growth models are prohibited from considering student background characteristics in
setting growth targets (U.S. Depart of Education, 2005). This is certainly intended as a safeguard
for low-performing groups, who should not be relegated to lower standards than other students,
but in this case may not optimally serve ELL students who could achieve more. In fact,
differences in the regression residuals for the projection model indicate that perhaps schools
should be held to a higher growth standard for ELL students compared to non-ELL students
Running head: GROWTH MODELS AND ELL STUDENTS 35
because ELL students’ lower scores in early grades translate into relatively higher scores by
grade 7 (compared to non-ELL students) than a common model predicts. Although legislation
may prohibit the use of student background characteristics in growth models, these findings
should be considered as potential hazards in the widespread use of growth models for various
high stakes purposes, from school accountability to teacher evaluation.
Limitations
ELL classifications. One limitation of this study is our decision to classify students who
were ever designated as LEP by the district as ELL students for the purposes of this study. In
fact, many students were reclassified as RFEP before or during the grade span we considered.
This has the effect of creating an ELL sample that is higher performing than the usual ELL
sample, which is sometimes called a “moving target” because high performing students are
transitioned out of the ELL classification and replaced with new, low performing students each
year. For this study, using one group of ELL students is appropriate in one sense because this
reflects the reality of accountability policies which do not consider the heterogeneity of the ELL
population. In other sense, our classification approach has created a best-case scenario, and the
differences we observe here would only be exacerbated if ELL status could be more carefully
tracked.
Limitations in the generalizability of the models. Each of the growth models used in
this study were generic versions of the models that are implemented somewhat differently in
each state. Some states using the value table or transitions matrix model (notably Delaware, but
not Iowa) assign weights to the transitions being made in order to place a higher value on
students making large gains and reaching (or maintaining) proficiency in a given year than
students making smaller upward transitions to levels that are still non-proficient. This policy has
Running head: GROWTH MODELS AND ELL STUDENTS 36
implications for school and teacher accountability decisions, but not for individual students’ on-
track designations as they were determined here. However, if other studies replicate our finding
of few differences in the types of transitions being made by ELL and non-ELL students, then
weighting transitions is unlikely to lead to large disparities in the decisions made for schools
with larger numbers of ELL students.
The SGP model required the fewest modifications from the models used in practice by
Colorado, Massachusetts, and other states. We used all four cohorts to estimate the knots and
boundaries for the b-spline cubic functions used by the model, which is similar to the procedure
of states using this model. The primary limitation is the use of data from only two grades (one
prior and one current) in the model. In practice, states using the SGP model include as many
years of prior data as possible (given the years of data available and missing data for individual
students). Thus, the estimates of accuracy in this study may be lower than in practice, though
there are diminishing returns of adding more data points to the model (Betebenner & Van
Iwaarden, 2011a). It is unclear whether ELL students would have more or less error in their
estimates if additional years of data were added, but one could imagine that the earlier scores that
could be added for ELL students would be decreasingly reliable as their English proficiency
would be lower.
The other key limitation in the generalizability of the SGP model used here is that most
states using this model set both growth and status targets for schools rather than using growth as
a back-up method to achieving AYP, which is the policy model studied here. Because of this, we
also excluded currently proficient students from the model, while many states allow for the
possibility that currently proficient students may be predicted to fall below proficiency in future
Running head: GROWTH MODELS AND ELL STUDENTS 37
years (i.e., meeting status but not growth targets). Additional analyses considering growth-only
decisions would address both of these issues.
As with the SGP model, the projection model was limited by the use of only two grades
in the predictive model, which may lower the true accuracy of this model. A greater limitation is
the use of traditional multiple linear regression for the projection model instead of the district-
centered models (which permit more accurate district estimates when students have missing data)
that are more widely used (Hoffer et al., 2011). This simplification may limit the generalizability
of these findings to the district-centered models and particularly the value-added models that are
based on that model. However, there is reason to believe that our findings (of low rates of on-
track classifications and underprediction of ELL students’ performance) would generalize
because our findings for non-ELL students were comparable to Hoffer et al.’s (2011) evaluation
which used the district-centered regression models. If our additional findings regarding ELL
students also generalize, this would add yet another reason to be cautious in interpreting the
results of value-added models (Braun, 2005).
Conclusions
If the two national assessment consortia, SBAC and PARCC, continue with their current
assessment plans (Center for K–12 Assessment & Performance Management, 2011), growth
models will continue to play an important role in school accountability programs throughout the
United States. Thus, the need to evaluate growth models’ fairness and accuracy for all key
subgroups is increasing. Because the ELL student population is also increasing and has
historically shown large achievement gaps, it is especially critical to evaluate the behavior of
growth models for this population. Growth models, if accurate for ELL students, could be an
important tool in holding schools accountable for closing the achievement gap for this group of
Running head: GROWTH MODELS AND ELL STUDENTS 38
students. This study showed evidence that growth models are sensitive to ELL status in terms of
accuracy of classifications and may not optimally represent the future achievement levels of ELL
students, leading to important implications for accountability policies.
All three models studied here showed worrisome differences either in accuracy or the
types of errors made for ELL students compared to non-ELL students. If replicated in other data,
this indicates that additional research is needed to develop a growth model accountability system
that is fair and valid for all major subgroups of students, including, but not limited to, ELL
students. In this study, we found that the SGP model offered the best compromise of the three
models studied between the number of students identified as on-track and the rate of errors made
for ELL and non-ELL students. However, the model may set unrealistic growth targets that are
much higher for ELL students.
The number of non-proficient students identified by all three models who were classified
as on-track and later reached proficiency (the non-proficient “true positives”) is a sign that
growth models offer a beneficial contrast to status-only accountability models. The slightly
greater number of ELL students classified as on-track (particularly in the context of their overall
low status-based proficiency) indicates that, if replicated, growth models might be especially
beneficial in helping schools identify teachers and instructional programs that help ELL students
move towards proficiency. On the other hand, the incentive structures and decisions made by
growth models may also differentially harm ELL students if not properly accounted for. ELL
students appear to have substantially different starting points and paths towards proficiency
compared to their non-ELL classmates. Future research should focus on accounting for these
differences and establishing reasonable but stringent standards for the growth of ELL students
towards proficiency.
Running head: GROWTH MODELS AND ELL STUDENTS 39
References
Abedi, J. (2004). The No Child Left Behind Act and English language learners: Assessment and
accountability issues. Educational Researcher, 33(1), 4-14.
Abedi, J., & Dietel, R. (2004). Challenges in the No Child Left Behind Act for English-language
learners. Phi Delta Kappan, 85, 782-785.
American Educational Research Association (AERA), American Psychological Association
(APA), & National Council on Measurement in Education (NCME). (1999). Standards
for educational and psychological testing. Washington, DC: Authors.
Auty, W., Bielawski, P., Deeter, T., Hirata, G., Hovanetz-Lassila, C., Rheim, J., … Williams, A.
(2008, January). Implementer’s Guide to Growth Models. Retrieved from
http://www.ccsso.org/Documents/2008/Implementers_Guide_to_Growth_2008.pdf
Betebenner, D. (2007). Estimation of student growth percentiles for the Colorado Student
Assessment Program. Retrieved from
http://www.cde.state.co.us/cdedocs/Research/PDF/technicalsgppaper_betebenner.pdf
Betebenner, D. (2009). Norm- and criterion-referenced student growth. Educational
Measurement: Issues and Practice, 28(4), 42-51.
Betebenner, D.W., & Linn, R.L. (2009). Growth in student achievement: Issues of measurement,
longitudinal data analysis, and accountability. Princeton, NJ: Educational Testing
Service, Center for K–12 Assessment & Performance Management.
Betebenner, D.W., & Van Iwaarden, A. (2011a, April). An introduction to Student Growth
Percentiles: Concepts, calculation, and use. Workshop presented at the annual
conference of the National Council on Measurement in Education, New Orleans, LA.
Betebenner, D.W., & Van Iwaarden, A. (2011b, October). SGP (Version 0.7-1.0) [Computer
Software and Documentation]. Retrieved from
Running head: GROWTH MODELS AND ELL STUDENTS 40
http://cran.r-project.org/web/packages/SGP/SGP.pdf
Braun, H.I. (2005). Using student progress to evaluate teachers: A primer on value-added
models. Princeton, NJ: Educational Testing Service.
Buzick, H.M. (2011, April). A comparison of regression-based growth models for students with
disabilities taking a state general accountability assessment. Paper presented at the
annual conference of the National Council on Measurement in Education, New Orleans,
LA.
Buzick, H.M., & Laitusis, C.C. (2010, June). A summary of models and standards-based
applications for grade-to-grade growth on statewide assessments and implications for
students with disabilities. (ETS RR-10-14). Princeton, NJ: Educational Testing Service.
California Department of Education (2011). California English Language Development Test
[CELDT]. Retrieved from
http://www.cde.ca.gov/ta/tg/el/documents/celdttechreport10-11.pdf
Castellano, K.E., & Ho, A.D. (in press). Contrasting OLS and quantile regression approaches to
student “growth” percentiles. Journal of Educational and Behavioral Statistics.
Center for K–12 Assessment & Performance Management (2011, July). Coming together to raise
achievement: New assessments for the Common Core State Standards. Princeton, NJ:
Educational Testing Service.
Colorado Department of Education (2009, October). Catch up, keep up, and move up definitions.
Retrieved from http://www.cde.state.co.us/cdeassess/documents/growth/CUKUMU.pdf
Council of Chief State School Officers (2009). Guide to United States Department of Education
Growth Model Pilot Program 2005-2008. Washington, D.C.: Author.
Running head: GROWTH MODELS AND ELL STUDENTS 41
Federal Interagency Forum on Child and Family Statistics. (2011). America’s children: Key
national indicators of well-being. Washington, DC: U.S. Government Printing Office.
Gándara, P. (2004). Latino achievement: Identifying models that foster success. Storrs, CT:
National Research Center on the Gifted and Talented, University of Connecticut.
Han, W.-J. (2008). The academic trajectories of children of immigrants and their school
environments. Developmental Psychology, 44, 1572-1590.
Ho, A.D. (2011). Supporting growth interpretations using through-course assessments.
Princeton, NJ: Center for K–12 Assessment & Performance Management.
Hoffer, T.B., Hedberg, E.C., Brown, K.L., Halverson, M.L., Reid-Brossard, P., Ho, A.D., &
Furgol, K. (2011). Final report on the evaluation of the Growth Model Pilot Project.
Washington, DC: U.S. Department of Education.
Jerald, C.D., Doorey, N.A., & Forgione, P.D., Jr. (2011). Putting the pieces together: Summary
report of the Invitational Research Symposium on Through-Course Summative
Assessments. Princeton, NJ: Educational Testing Service, Center for K–12 Assessment &
Performance Management.
Jones, D.D. (2008, October). The Colorado Growth Model: Higher expectations for all students.
Retrieved from http://www2.ed.gov/admins/lead/account/growthmodel/co/index.html
Kopriva, R.J. (2008). Improving Testing for English Language Learners. New York, NY:
Routledge.
Mancilla-Martinez, J., & Lesaux, N.K. (2011). Early home language use and later vocabulary
development. Journal of Educational Psychology, 103(3), 535–546.
Running head: GROWTH MODELS AND ELL STUDENTS 42
Olsen, L. (2010). Reparable harm: Fulfilling the Unkept promise of educational opportunity for
long term English learners. Long Beach, CA: Californians Together 2010. Retrieved
from www.californianstogether.org
O’Malley, K.J., Auty, W., Bielawski, P., Bernstein, T., Deeter, T., Goldschmidt, P., … Blank, R.
(2009, March). Guide to United States Department of Education Growth Model Pilot
Program 2005-2008. Retrieved from
http://www.ccsso.org/Documents/2009/Guide_to_United_States_2009.pdf
O’Malley, K.J., Murphy, S., McClarty, K.L., Murphy, D. & McBride, Y. (2011, September).
Overview of student growth models. Retrieved from
http://www.pearsonassessments.com/hai/
Images/tmrs/Student_Growth_WP_083111_FINAL.pdf
Pitoniak, M.J., Young, J.W., Martiniello, M., King, T.C., Buteux, A., & Ginsburgh, M. (2009).
Guidelines for the assessment of English language learners. Princeton, New Jersey:
Educational Testing Service.
R Development Core Team (2011). R: A language and environment for statistical computing.
Vienna, Austria: R Foundation for Statistical Computing. Retrieved from
http://www.R-project.org/
Reynolds, C.R. (1982). Methods for detecting construct and predictive bias. In R.A. Berk,
Handbook of methods for detecting test bias (pp. 199-227). Baltimore, MD: Johns
Hopkins University Press.
Solano-Flores, G. (2008). Who is given tests in what language by whom, when, and where? The
need for probabilistic views of language in the testing of English language learners.
Educational Researcher, 37(4), 189-199.
Running head: GROWTH MODELS AND ELL STUDENTS 43
State of Ohio & Ohio Department of Education (October 31, 2006). Proposal to the United
States Department Of Education for employing a growth model for No Child Left Behind
accountability purposes. Retrieved from
http://www2.ed.gov/admins/lead/account/growthmodel/oh/index.html
Streiner, D. L., & Cairney, J. (2007). What’s under the ROC? An introduction to receiver
operating characteristics curves. Canadian Journal of Psychiatry, 52, 121–128.
Stevens, R. A., Butler, F. A., & Castellon-Wellington, M. (2000). Academic language and
content assessment: Measuring the progress of English language learners. Los Angeles,
CA: University of California, National Center for Research on Evaluation, Standards, and
Student Testing.
U.S. Department of Education (2005, November 18). Secretary Spellings announces Growth
Model Pilot, addresses Chief State School Officers' Annual Policy Forum in Richmond.
Retrieved from http://www2.ed.gov/news/pressreleases/2005/11/11182005.html
U.S. Department of Education (2009a, March). The Colorado Growth Model: Operationalizing
growth-to-standard for AYP using growth percentiles. Retrieved from
http://ksde.org/LinkClick.aspx?fileticket=zkm59YF26OI%3D
U.S. Department of Education (2009b, May). State Applications, Decision Letters and Additional
Information. Retrieved from http://www2.ed.gov/admins/lead/account/growthmodel/
Wright, W.E., & Li, X. (2008). High-stake math tests: How No Child Left Behind leaves
newcomer English language learners behind. Language Policy, 7, 237-266.
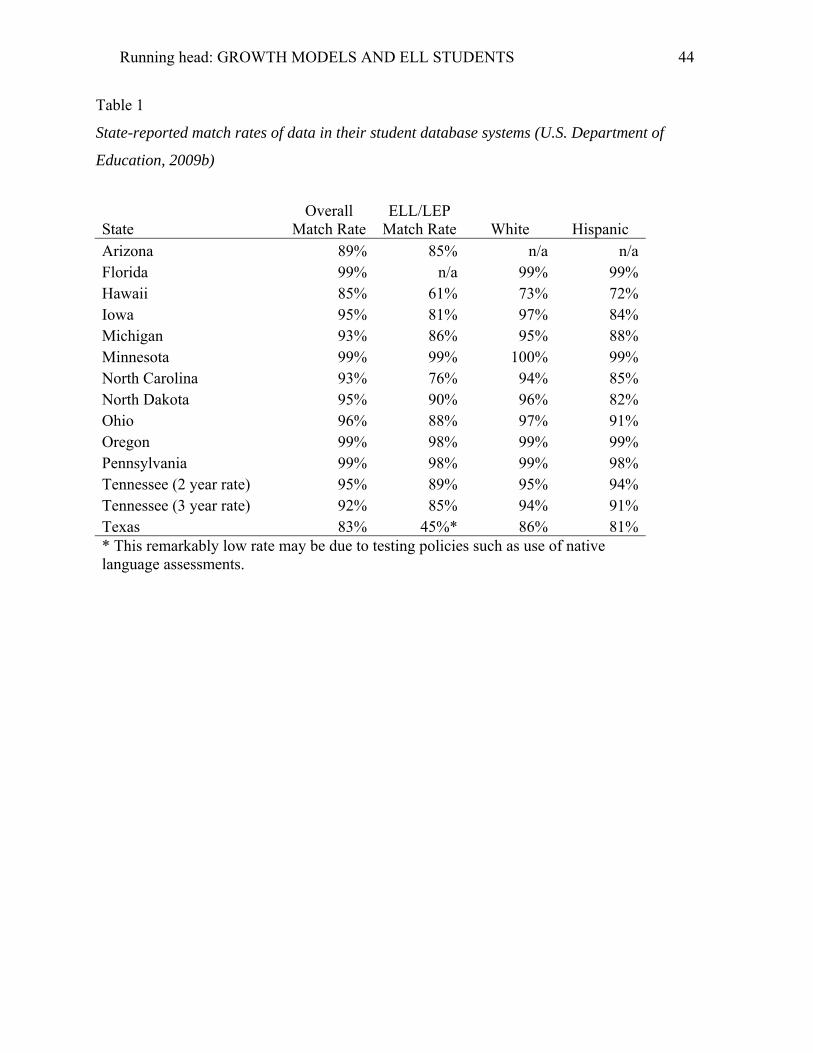
Running head: GROWTH MODELS AND ELL STUDENTS 44
Table 1
State-reported match rates of data in their student database systems (U.S. Department of
Education, 2009b)
State Overall
Match Rate ELL/LEP
Match Rate White Hispanic Arizona 89% 85% n/a n/a Florida 99% n/a 99% 99% Hawaii 85% 61% 73% 72% Iowa 95% 81% 97% 84% Michigan 93% 86% 95% 88% Minnesota 99% 99% 100% 99% North Carolina 93% 76% 94% 85% North Dakota 95% 90% 96% 82% Ohio 96% 88% 97% 91% Oregon 99% 98% 99% 99% Pennsylvania 99% 98% 99% 98% Tennessee (2 year rate) 95% 89% 95% 94% Tennessee (3 year rate) 92% 85% 94% 91% Texas 83% 45%* 86% 81% * This remarkably low rate may be due to testing policies such as use of native language assessments.
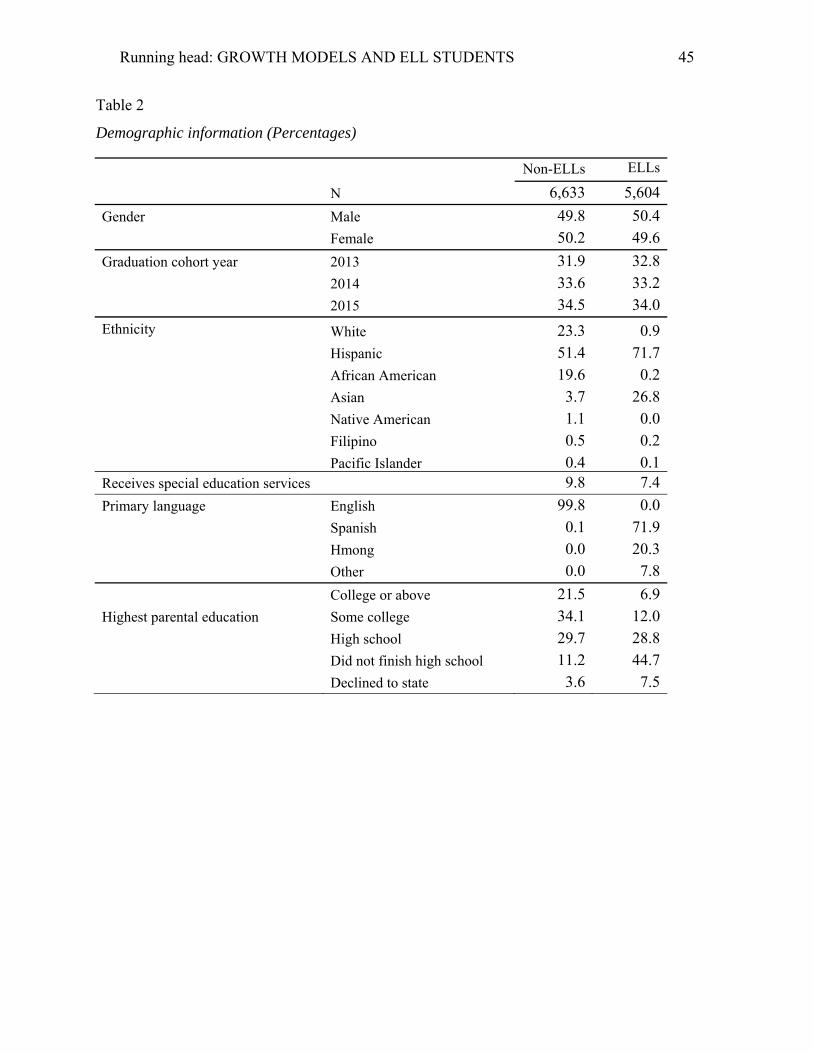
Running head: GROWTH MODELS AND ELL STUDENTS 45
Table 2
Demographic information (Percentages)
Non-ELLs ELLs
N 6,633 5,604
Gender Male 49.8 50.4
Female 50.2 49.6
Graduation cohort year 2013 31.9 32.8
2014 33.6 33.2
2015 34.5 34.0
Ethnicity White 23.3 0.9
Hispanic 51.4 71.7
African American 19.6 0.2
Asian 3.7 26.8
Native American 1.1 0.0
Filipino 0.5 0.2
Pacific Islander 0.4 0.1Receives special education services 9.8 7.4
Primary language English 99.8 0.0
Spanish 0.1 71.9
Hmong 0.0 20.3
Other 0.0 7.8
Highest parental education College or above 21.5 6.9
Some college 34.1 12.0
High school 29.7 28.8
Did not finish high school 11.2 44.7
Declined to state 3.6 7.5
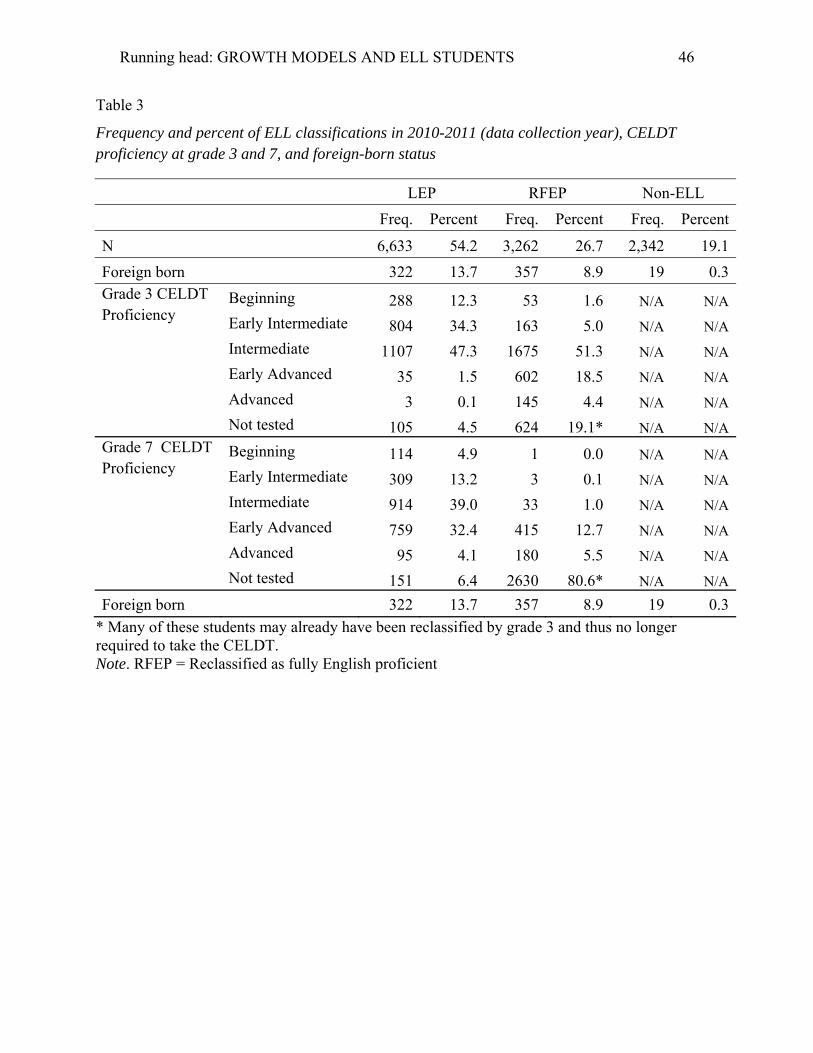
Running head: GROWTH MODELS AND ELL STUDENTS 46
Table 3
Frequency and percent of ELL classifications in 2010-2011 (data collection year), CELDT proficiency at grade 3 and 7, and foreign-born status
LEP RFEP Non-ELL
Freq. Percent Freq. Percent Freq. Percent
N 6,633 54.2 3,262 26.7 2,342 19.1
Foreign born 322 13.7 357 8.9 19 0.3Grade 3 CELDT Proficiency
Beginning 288 12.3 53 1.6 N/A N/A
Early Intermediate 804 34.3 163 5.0 N/A N/A Intermediate 1107 47.3 1675 51.3 N/A N/A Early Advanced 35 1.5 602 18.5 N/A N/A Advanced 3 0.1 145 4.4 N/A N/A Not tested 105 4.5 624 19.1* N/A N/AGrade 7 CELDT Proficiency
Beginning 114 4.9 1 0.0 N/A N/A
Early Intermediate 309 13.2 3 0.1 N/A N/A
Intermediate 914 39.0 33 1.0 N/A N/A
Early Advanced 759 32.4 415 12.7 N/A N/A
Advanced 95 4.1 180 5.5 N/A N/A
Not tested 151 6.4 2630 80.6* N/A N/A
Foreign born 322 13.7 357 8.9 19 0.3
* Many of these students may already have been reclassified by grade 3 and thus no longer required to take the CELDT. Note. RFEP = Reclassified as fully English proficient
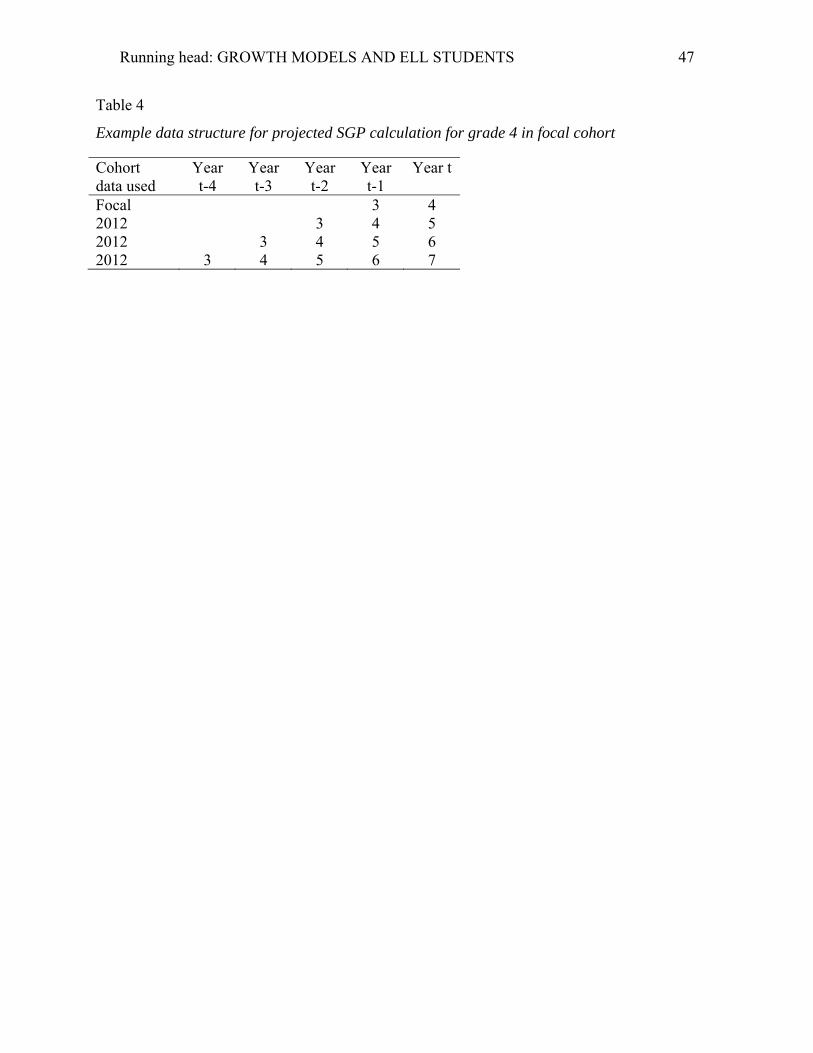
Running head: GROWTH MODELS AND ELL STUDENTS 47
Table 4
Example data structure for projected SGP calculation for grade 4 in focal cohort
Cohort data used
Year t-4
Year t-3
Year t-2
Year t-1
Year t
Focal 3 4 2012 3 4 5 2012 3 4 5 6 2012 3 4 5 6 7
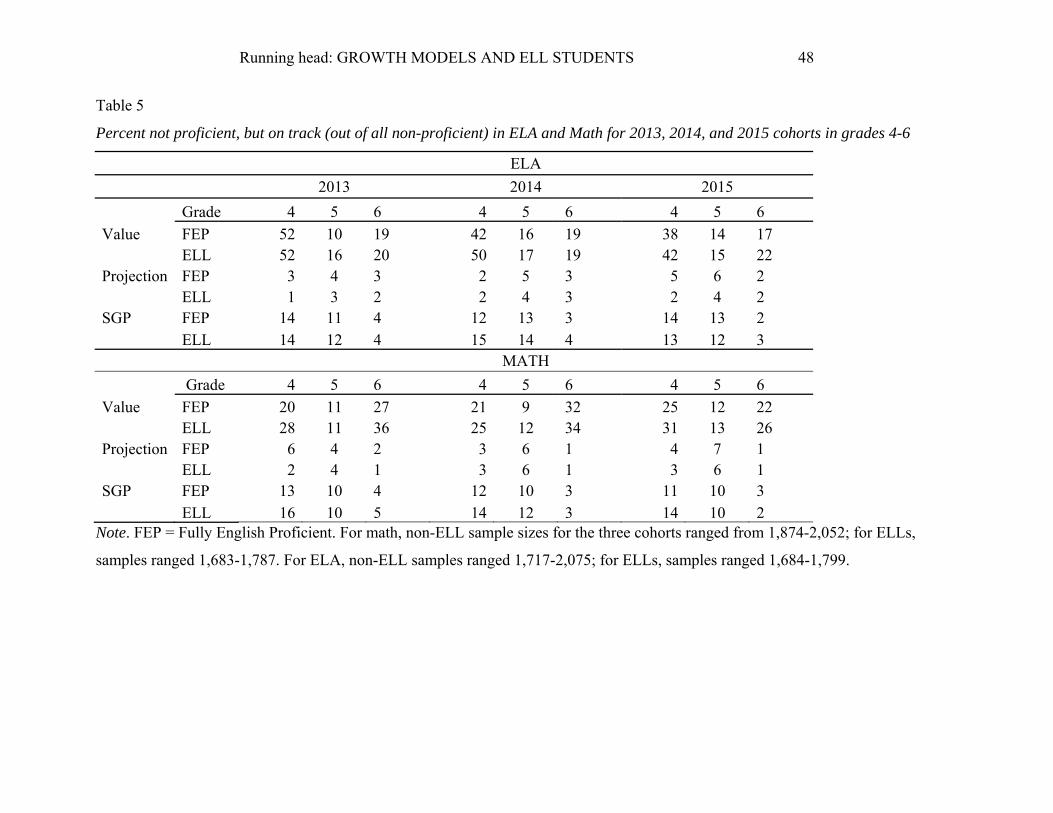
Running head: GROWTH MODELS AND ELL STUDENTS 48
Table 5
Percent not proficient, but on track (out of all non-proficient) in ELA and Math for 2013, 2014, and 2015 cohorts in grades 4-6
ELA
2013 2014 2015
Grade 4 5 6 4 5 6 4 5 6
Value FEP 52 10 19 42 16 19 38 14 17 ELL 52 16 20 50 17 19 42 15 22
Projection FEP 3 4 3 2 5 3 5 6 2 ELL 1 3 2 2 4 3 2 4 2
SGP FEP 14 11 4 12 13 3 14 13 2 ELL 14 12 4 15 14 4 13 12 3
MATH
Grade 4 5 6 4 5 6 4 5 6
Value FEP 20 11 27 21 9 32 25 12 22 ELL 28 11 36 25 12 34 31 13 26
Projection FEP 6 4 2 3 6 1 4 7 1 ELL 2 4 1 3 6 1 3 6 1
SGP FEP 13 10 4 12 10 3 11 10 3 ELL 16 10 5 14 12 3 14 10 2
Note. FEP = Fully English Proficient. For math, non-ELL sample sizes for the three cohorts ranged from 1,874-2,052; for ELLs,
samples ranged 1,683-1,787. For ELA, non-ELL samples ranged 1,717-2,075; for ELLs, samples ranged 1,684-1,799.
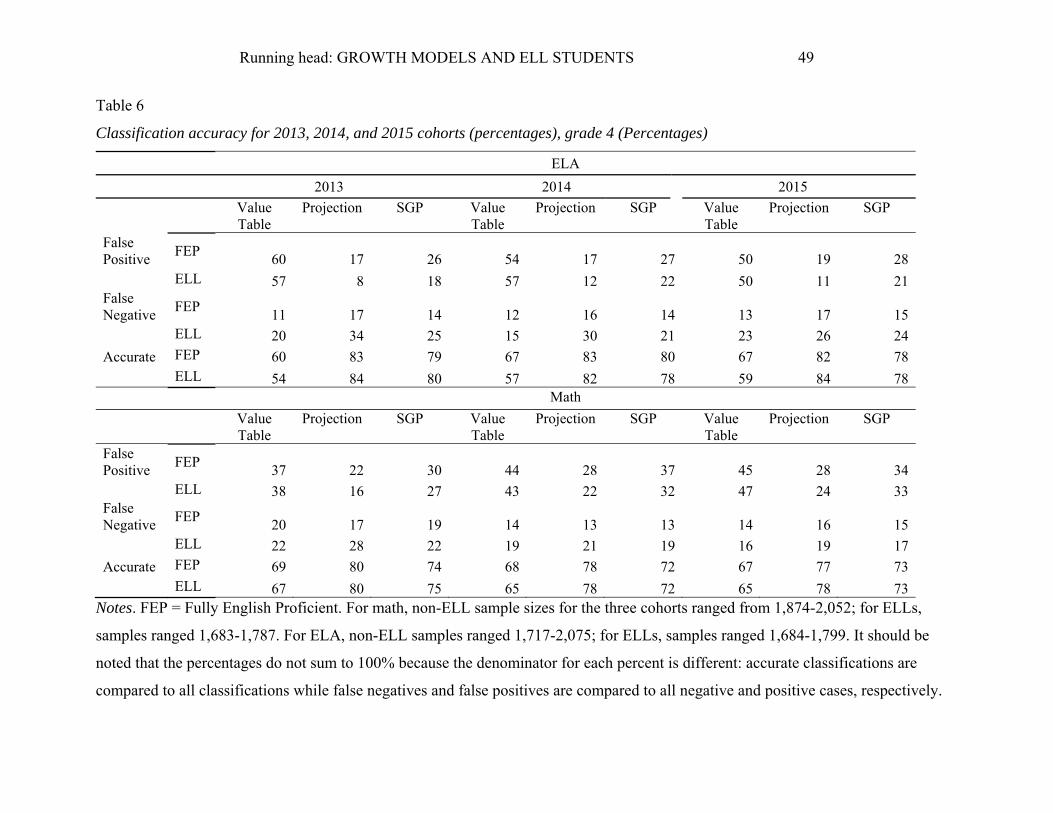
Running head: GROWTH MODELS AND ELL STUDENTS 49
Table 6
Classification accuracy for 2013, 2014, and 2015 cohorts (percentages), grade 4 (Percentages)
ELA
2013 2014 2015
Value Table
Projection SGP Value Table
Projection SGP Value Table
Projection SGP
False Positive
FEP 60 17 26 54 17 27 50 19 28
ELL 57 8 18 57 12 22 50 11 21False Negative
FEP 11 17 14 12 16 14 13 17 15
ELL 20 34 25 15 30 21 23 26 24
Accurate FEP 60 83 79 67 83 80 67 82 78
ELL 54 84 80 57 82 78 59 84 78
Math
Value Table
Projection SGP Value Table
Projection SGP Value Table
Projection SGP
False Positive
FEP 37 22 30 44 28 37 45 28 34
ELL 38 16 27 43 22 32 47 24 33False Negative
FEP 20 17 19 14 13 13 14 16 15
ELL 22 28 22 19 21 19 16 19 17
Accurate FEP 69 80 74 68 78 72 67 77 73
ELL 67 80 75 65 78 72 65 78 73Notes. FEP = Fully English Proficient. For math, non-ELL sample sizes for the three cohorts ranged from 1,874-2,052; for ELLs,
samples ranged 1,683-1,787. For ELA, non-ELL samples ranged 1,717-2,075; for ELLs, samples ranged 1,684-1,799. It should be
noted that the percentages do not sum to 100% because the denominator for each percent is different: accurate classifications are
compared to all classifications while false negatives and false positives are compared to all negative and positive cases, respectively.
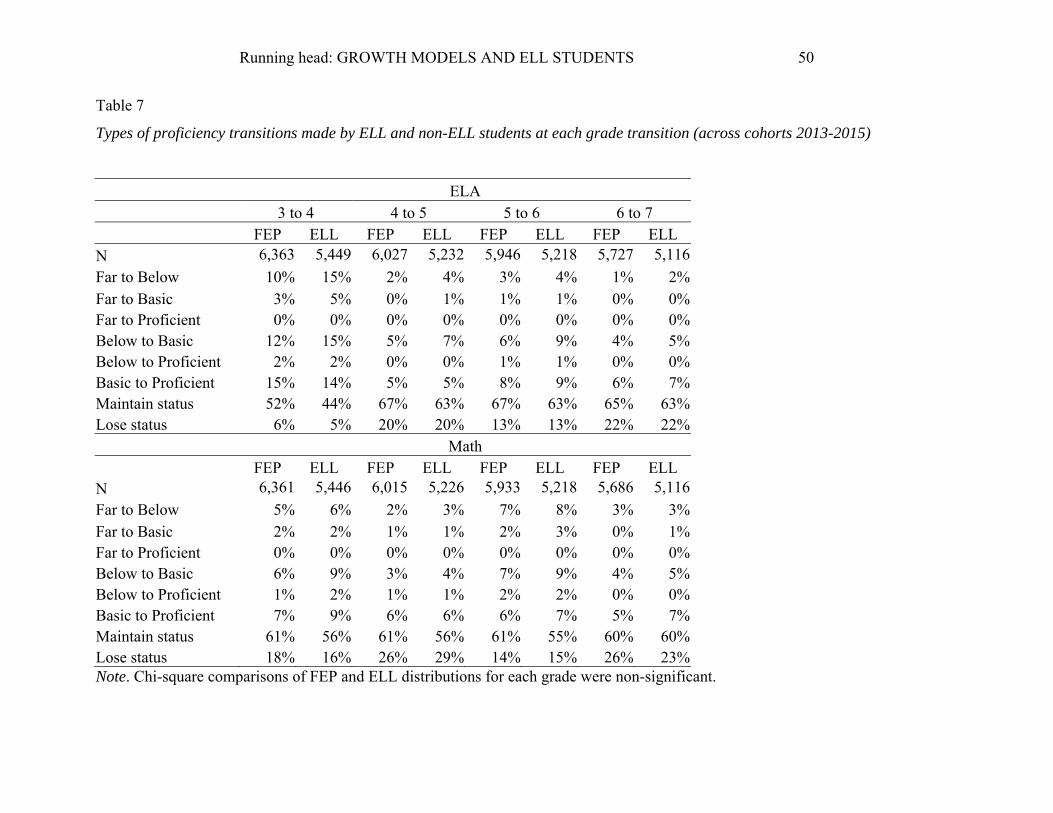
Running head: GROWTH MODELS AND ELL STUDENTS 50
Table 7
Types of proficiency transitions made by ELL and non-ELL students at each grade transition (across cohorts 2013-2015)
ELA 3 to 4 4 to 5 5 to 6 6 to 7
FEP ELL FEP ELL FEP ELL FEP ELL N 6,363 5,449 6,027 5,232 5,946 5,218 5,727 5,116
Far to Below 10% 15% 2% 4% 3% 4% 1% 2%Far to Basic 3% 5% 0% 1% 1% 1% 0% 0%Far to Proficient 0% 0% 0% 0% 0% 0% 0% 0%Below to Basic 12% 15% 5% 7% 6% 9% 4% 5%Below to Proficient 2% 2% 0% 0% 1% 1% 0% 0%Basic to Proficient 15% 14% 5% 5% 8% 9% 6% 7%Maintain status 52% 44% 67% 63% 67% 63% 65% 63%Lose status 6% 5% 20% 20% 13% 13% 22% 22%
Math FEP ELL FEP ELL FEP ELL FEP ELL
N 6,361 5,446 6,015 5,226 5,933 5,218 5,686 5,116
Far to Below 5% 6% 2% 3% 7% 8% 3% 3%Far to Basic 2% 2% 1% 1% 2% 3% 0% 1%Far to Proficient 0% 0% 0% 0% 0% 0% 0% 0%Below to Basic 6% 9% 3% 4% 7% 9% 4% 5%Below to Proficient 1% 2% 1% 1% 2% 2% 0% 0%Basic to Proficient 7% 9% 6% 6% 6% 7% 5% 7%Maintain status 61% 56% 61% 56% 61% 55% 60% 60%Lose status 18% 16% 26% 29% 14% 15% 26% 23%Note. Chi-square comparisons of FEP and ELL distributions for each grade were non-significant.
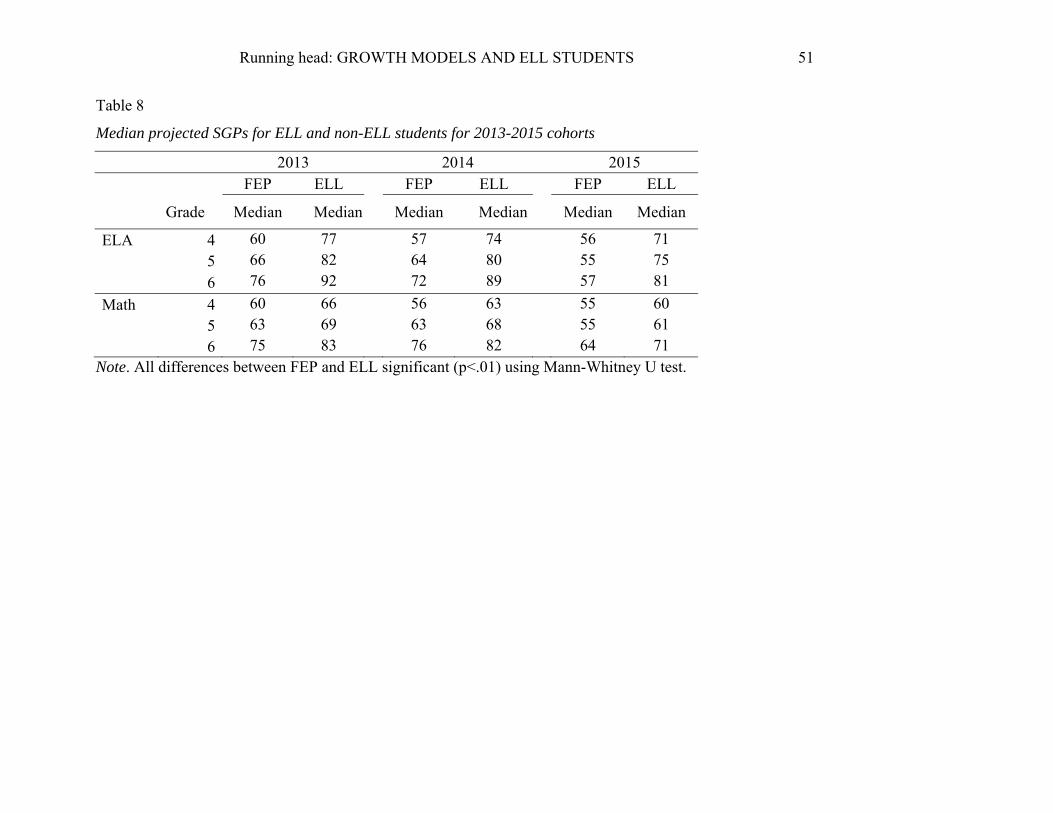
Running head: GROWTH MODELS AND ELL STUDENTS 51
Table 8
Median projected SGPs for ELL and non-ELL students for 2013-2015 cohorts
2013 2014 2015 FEP ELL FEP ELL FEP ELL
Grade Median Median Median Median Median Median
ELA 4 60 77 57 74 56 71
5 66 82 64 80 55 75
6 76 92 72 89 57 81
Math 4 60 66 56 63 55 60
5 63 69 63 68 55 61
6 75 83 76 82 64 71 Note. All differences between FEP and ELL significant (p<.01) using Mann-Whitney U test.
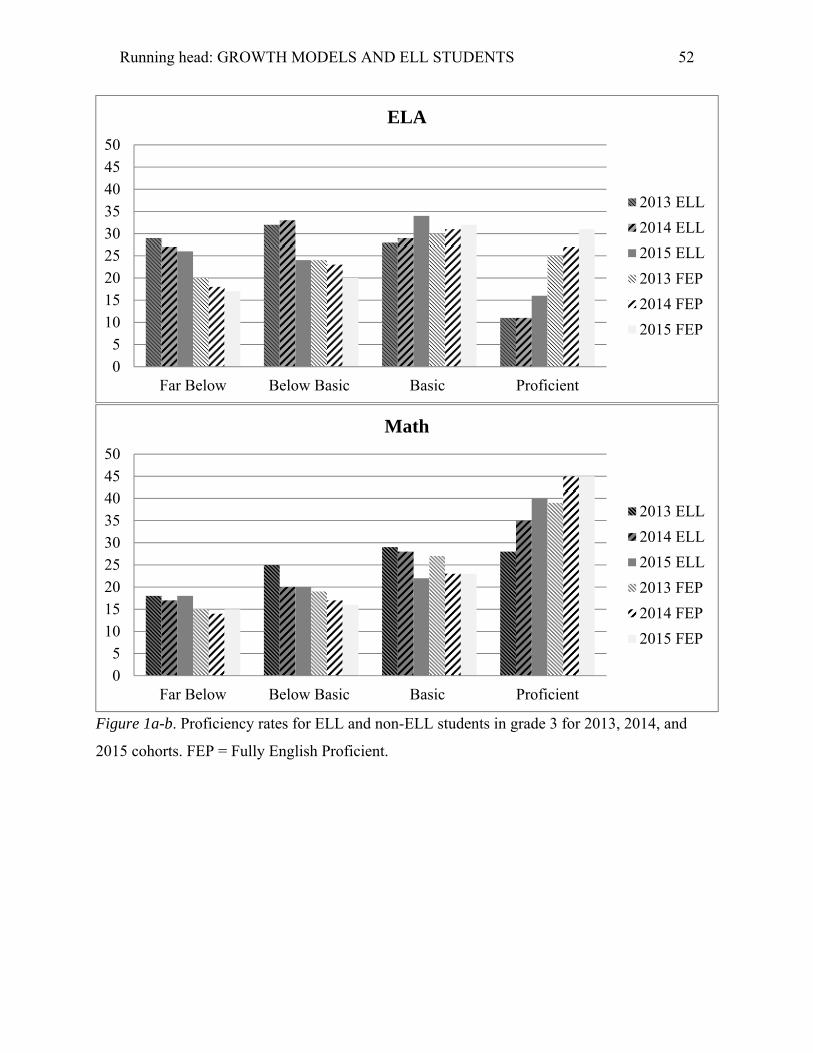
Running head: GROWTH MODELS AND ELL STUDENTS 52
Figure 1a-b. Proficiency rates for ELL and non-ELL students in grade 3 for 2013, 2014, and
2015 cohorts. FEP = Fully English Proficient.
0
5
10
15
20
25
30
35
40
45
50
Far Below Below Basic Basic Proficient
ELA
2013 ELL
2014 ELL
2015 ELL
2013 FEP
2014 FEP
2015 FEP
0
5
10
15
20
25
30
35
40
45
50
Far Below Below Basic Basic Proficient
Math
2013 ELL
2014 ELL
2015 ELL
2013 FEP
2014 FEP
2015 FEP
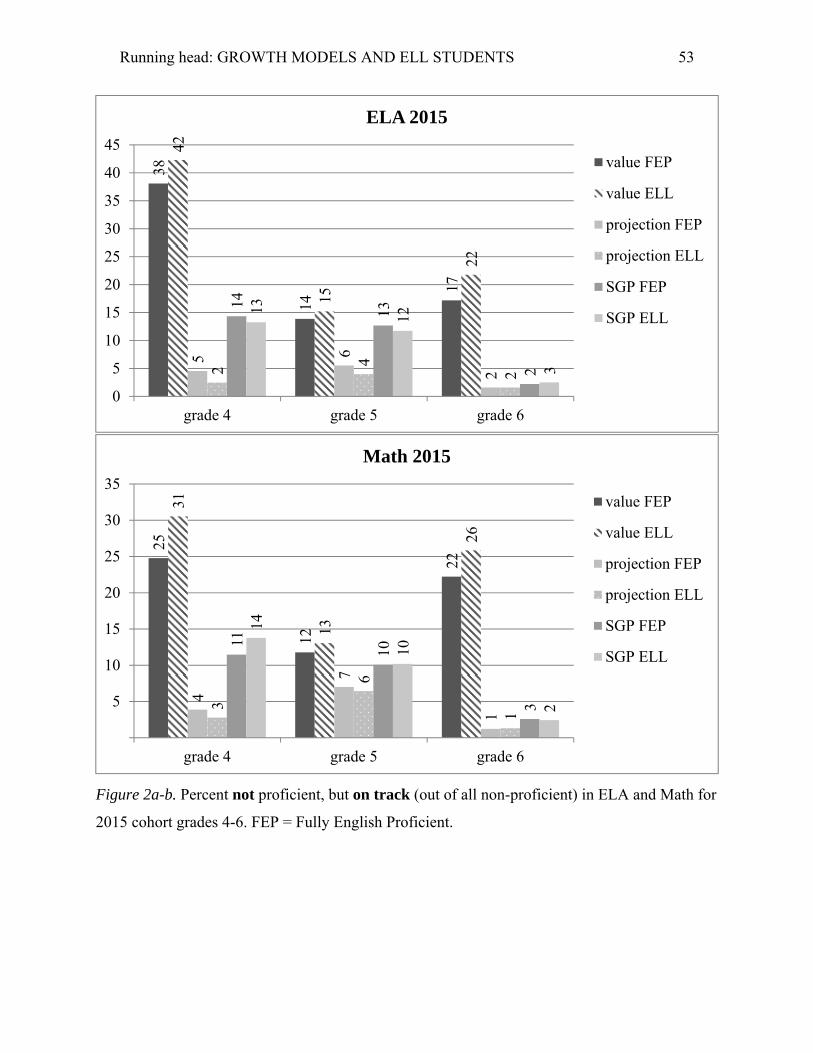
Running head: GROWTH MODELS AND ELL STUDENTS 53
Figure 2a-b. Percent not proficient, but on track (out of all non-proficient) in ELA and Math for
2015 cohort grades 4-6. FEP = Fully English Proficient.
38
14
17
42
15
22
5 6
22 4
2
14
13
2
13 12
3
0
5
10
15
20
25
30
35
40
45
grade 4 grade 5 grade 6
ELA 2015
value FEP
value ELL
projection FEP
projection ELL
SGP FEP
SGP ELL
25
12
22
31
13
26
4
7
1
3
6
1
11
10
3
14
10
25
10
15
20
25
30
35
grade 4 grade 5 grade 6
Math 2015
value FEP
value ELL
projection FEP
projection ELL
SGP FEP
SGP ELL
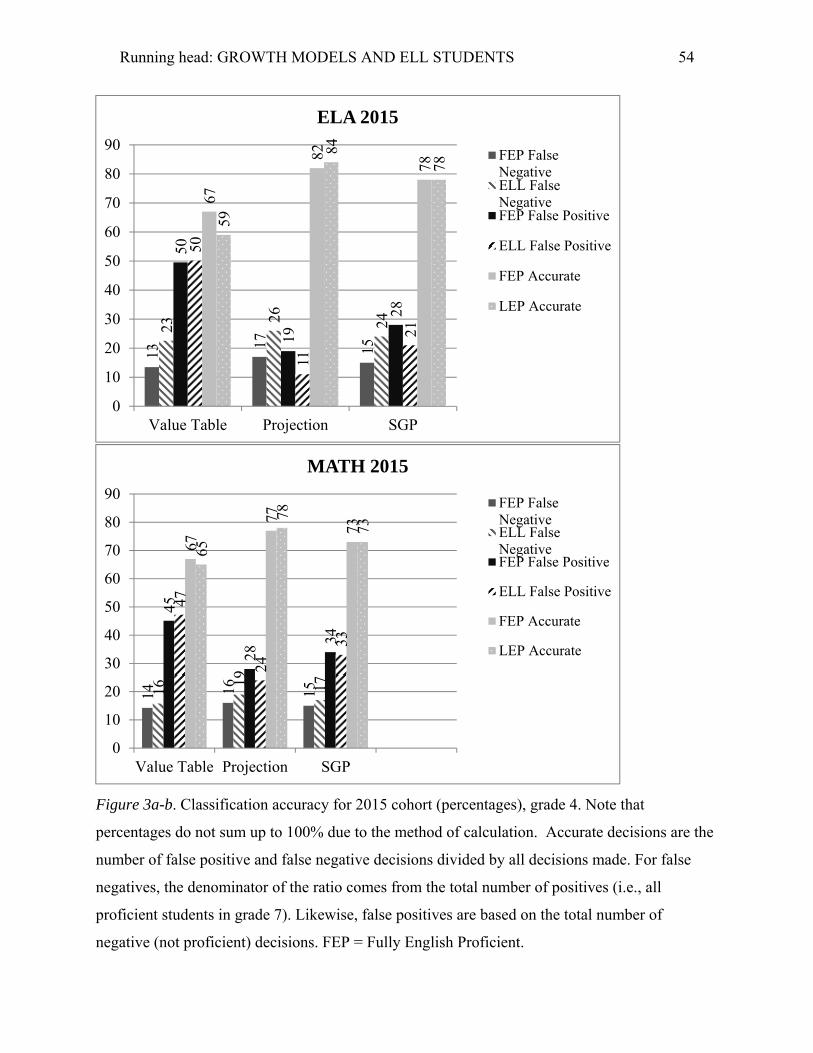
Running head: GROWTH MODELS AND ELL STUDENTS 54
Figure 3a-b. Classification accuracy for 2015 cohort (percentages), grade 4. Note that
percentages do not sum up to 100% due to the method of calculation. Accurate decisions are the
number of false positive and false negative decisions divided by all decisions made. For false
negatives, the denominator of the ratio comes from the total number of positives (i.e., all
proficient students in grade 7). Likewise, false positives are based on the total number of
negative (not proficient) decisions. FEP = Fully English Proficient.
13
17 15
23
26 24
50
19
28
50
11
21
67
82
78
59
84
78
0
10
20
30
40
50
60
70
80
90
Value Table Projection SGP
ELA 2015
FEP FalseNegativeELL FalseNegativeFEP False Positive
ELL False Positive
FEP Accurate
LEP Accurate
14 16 1516
19 17
45
28
34
47
24
33
67
77
73
65
78
73
0
10
20
30
40
50
60
70
80
90
Value Table Projection SGP
MATH 2015
FEP FalseNegativeELL FalseNegativeFEP False Positive
ELL False Positive
FEP Accurate
LEP Accurate
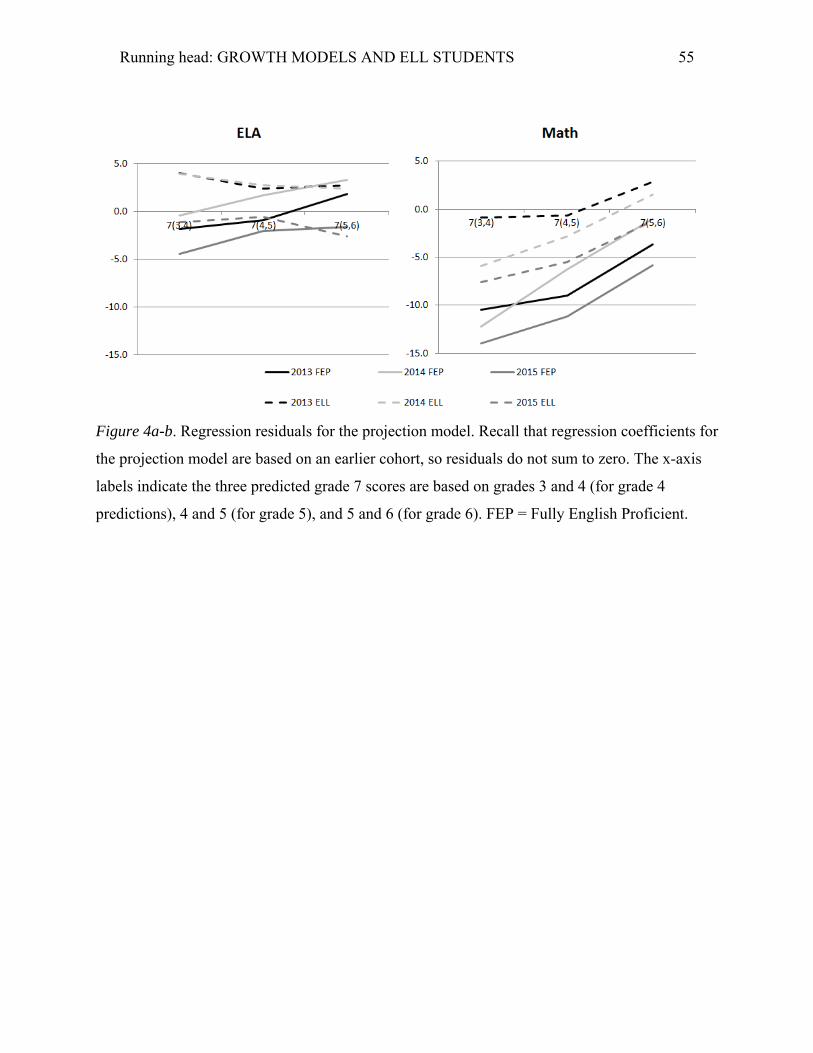
Running head: GROWTH MODELS AND ELL STUDENTS 55
Figure 4a-b. Regression residuals for the projection model. Recall that regression coefficients for
the projection model are based on an earlier cohort, so residuals do not sum to zero. The x-axis
labels indicate the three predicted grade 7 scores are based on grades 3 and 4 (for grade 4
predictions), 4 and 5 (for grade 5), and 5 and 6 (for grade 6). FEP = Fully English Proficient.