Embed Size (px)
Citation preview
EARTHQUAKE ENGINEERING AND STRUCTURAL DYNAMICSEarthquake Engng Struct. Dyn. 2005; 34:1427–1443Published online 1 June 2005 in Wiley InterScience (www.interscience.wiley.com). DOI: 10.1002/eqe.499
Evaluation of damping reduction factors for estimating elasticresponse of structures with high damping
Yu-Yuan Lin1;∗;†;‡, Eduardo Miranda2 and Kuo-Chun Chang3
1Department of Civil and Water Resources Engineering; National Chiayi University; Chiayi; Taiwan2Department of Civil and Environmental Engineering; Stanford University; Stanford; CA; U.S.A.
3Department of Civil Engineering; National Taiwan University; Taipei; Taiwan
SUMMARY
The damping reduction factors are used in a few building codes in order to estimate the elastic responsespectrum with high damping ratios from its 5%-damped counterpart. At present, much research regardingthis factor has been published. The purpose of this paper is to evaluate the accuracy of �ve di�erentmodels of damping reduction factors. In addition, the damping reduction factors adopted in the recentU.S.A. seismic codes are also evaluated. Statistical studies are carried out according to a total of 216earthquake ground motions recorded on �rm sites in California. Considered here are elastic single-degree-of-freedom (SDOF) systems with natural vibrating periods between 0.1 and 6:0 s. Mean ratiosand dispersion of approximate to exact maximum elastic displacement demands corresponding to variousdamping reduction factors are computed as functions of the natural vibrating period and the viscousdamping ratio. Copyright ? 2005 John Wiley & Sons, Ltd.
KEY WORDS: dampingreduction factors; evaluation; elastic displacement responses of structures withhigh damping
1. INTRODUCTION
Although the maximum elastic responses of a high-damped SDOF system subjected to groundaccelerations can be obtained by conducting the linear response-history analyses of motionequations, simpli�ed methods are required for earthquake-resistant design of structures. Be-sides, when a design spectrum is speci�ed for a certain damping ratio, it becomes necessaryto modify it to the values corresponding to the desired damping ratios. According to the needs
∗Correspondence to: Yu-Yuan Lin, 300 University Road, Department of Civil and Water Resources Engineering,National Chiayi University, Chiayi 600, Taiwan.
†E-mail: [email protected]‡Assistant Professor.
Contract=grant sponsor: National Science Council; contract=grant number: NSC-90-2811-Z-002-003Contract=grant sponsor: Sinotech Engineering Consultant Inc.; contract=grant number: 6120
Received 12 May 2003Revised 9 March 2005
Copyright ? 2005 John Wiley & Sons, Ltd. Accepted 9 March 2005
1428 Y.-Y. LIN, E. MIRANDA AND K.-C. CHANG
0
5
10
15
20
25
30
35
0.0 1.0 2.0 3.0 4.0 5.0 6.0
PERIOD [s]
Sd
[cm
]
ξ =5%
20%
30%
50%
10%
0.2
0.4
0.6
0.8
1
0.0 1.0 2.0 3.0 4.0 5.0 6.0
PERIOD [s]
B
ξ=10%
20%
30%
50%
(a) (b)
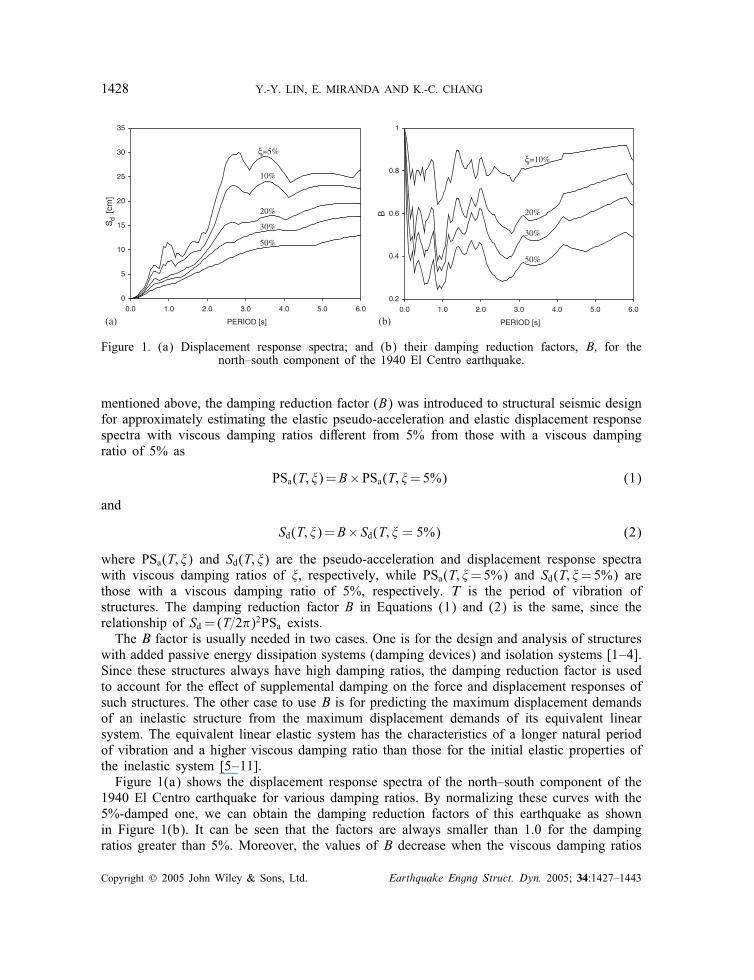
Figure 1. (a) Displacement response spectra; and (b) their damping reduction factors, B, for thenorth–south component of the 1940 El Centro earthquake.
mentioned above, the damping reduction factor (B) was introduced to structural seismic designfor approximately estimating the elastic pseudo-acceleration and elastic displacement responsespectra with viscous damping ratios di�erent from 5% from those with a viscous dampingratio of 5% as
PSa(T; �)=B×PSa(T; �=5%) (1)
and
Sd(T; �)=B× Sd(T; � = 5%) (2)
where PSa(T; �) and Sd(T; �) are the pseudo-acceleration and displacement response spectrawith viscous damping ratios of �, respectively, while PSa(T; �=5%) and Sd(T; �=5%) arethose with a viscous damping ratio of 5%, respectively. T is the period of vibration ofstructures. The damping reduction factor B in Equations (1) and (2) is the same, since therelationship of Sd = (T=2�)2PSa exists.The B factor is usually needed in two cases. One is for the design and analysis of structures
with added passive energy dissipation systems (damping devices) and isolation systems [1–4].Since these structures always have high damping ratios, the damping reduction factor is usedto account for the e�ect of supplemental damping on the force and displacement responses ofsuch structures. The other case to use B is for predicting the maximum displacement demandsof an inelastic structure from the maximum displacement demands of its equivalent linearsystem. The equivalent linear elastic system has the characteristics of a longer natural periodof vibration and a higher viscous damping ratio than those for the initial elastic properties ofthe inelastic system [5–11].Figure 1(a) shows the displacement response spectra of the north–south component of the
1940 El Centro earthquake for various damping ratios. By normalizing these curves with the5%-damped one, we can obtain the damping reduction factors of this earthquake as shownin Figure 1(b). It can be seen that the factors are always smaller than 1.0 for the dampingratios greater than 5%. Moreover, the values of B decrease when the viscous damping ratios
Copyright ? 2005 John Wiley & Sons, Ltd. Earthquake Engng Struct. Dyn. 2005; 34:1427–1443
EVALUATION OF DAMPING REDUCTION FACTORS 1429
increase, and the decrements reduce as increasing the level of the viscous damping ratios. Todate, several expressions of the damping reduction factor have been proposed [12–17]. Allof them are based on SDOF systems subjected to earthquake excitation. Results derived fromNewmark and Hall [12] have been implemented in the ATC-40 [9] and FEMA-273 [3] for thedisplacement-based evaluation design of existing buildings and in the UBC-97 [2], NEHRP-97[1] and IBC 2000 [4] for the design of buildings with seismic isolation systems and passiveenergy dissipation systems. In addition, results obtained from Ashour [13] were adopted in theUBC-94 [2] and NEHRP-94 [1] for the design of buildings with passive energy dissipationsystems. Moreover, results from Ramirez et al. [15, 16] have been used in the NEHRP 2000[1] for the design of buildings with damping systems.The objective of this study is to evaluate the accuracy of �ve approximate methods (damp-
ing reduction factors) to estimate the maximum elastic deformation demands of structureswith viscous damping ratios other than 5% from those of structures with a viscous dampingratio of 5%. Statistical results obtained from the approximate methods are compared withthose obtained from the linear response-history analyses. Mean ratios of approximate to ex-act maximum elastic displacements and their standard errors (dispersions) derived from 216earthquake ground motions recorded on �rm sites in California are presented as functions ofthe viscous damping ratio and the period of vibration. The periods of vibration of the linearelastic SDOF systems considered here are between 0.1 and 6:0 s with an increment of 0:05 s,while the viscous damping ratios discussed are from 2 to 50%. At the end of this paper, thedamping reduction factors implemented in recent seismic design codes of the U.S.A. are alsoevaluated because they are slightly di�erent from the Newmark and Hall [12], Ashour [13],or Ramirez et al. [15, 16] method. All the damping reduction factors discussed in the studyare assessed by the displacement responses. These results will be the same as those obtainedfrom the pseudo-acceleration responses.
2. APPROXIMATE METHODS
2.1. Newmark and Hall [12]
Of the various approximate methods evaluated here to estimate the elastic response spectrumwith high damping ratios, the method proposed by Newmark and Hall [12] is not only theearliest but also the best known. Their results have been adopted by most design codes andguidelines. In this method, the damping reduction factors (B) for median estimates of response(i.e. 50% probability of exceedance) are expressed as
B=
⎧⎪⎪⎨⎪⎪⎩1:514− 0:321 ln(�) for constant acceleration region
1:400− 0:248 ln(�) for constant velocity region
1:309− 0:194 ln(�) for constant displacement region
(3)
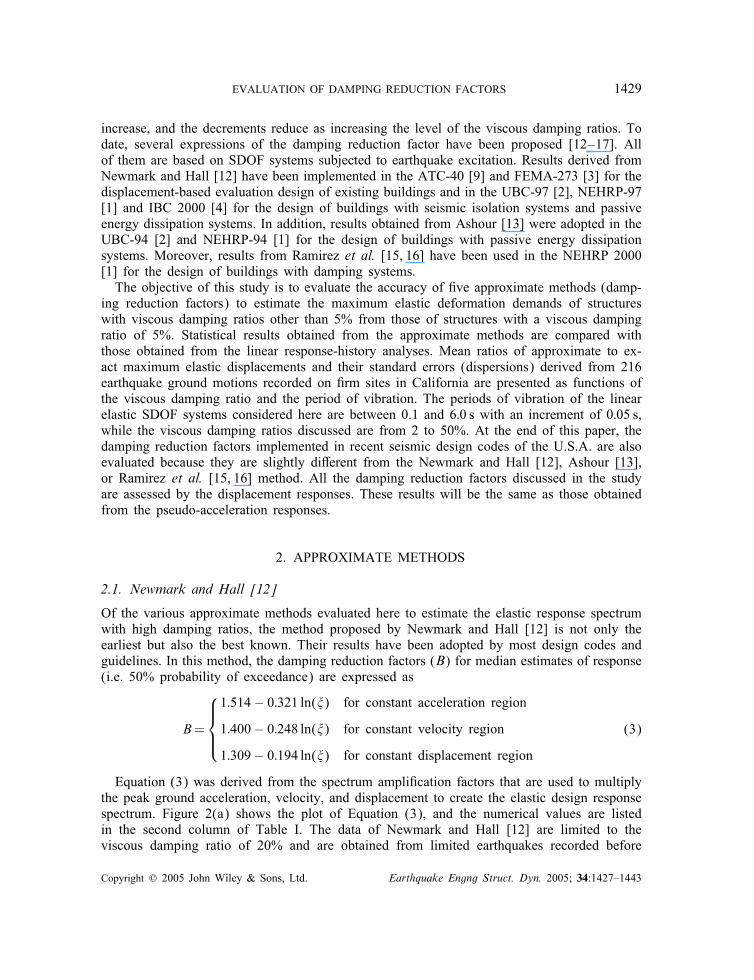
Equation (3) was derived from the spectrum ampli�cation factors that are used to multiplythe peak ground acceleration, velocity, and displacement to create the elastic design responsespectrum. Figure 2(a) shows the plot of Equation (3), and the numerical values are listedin the second column of Table I. The data of Newmark and Hall [12] are limited to theviscous damping ratio of 20% and are obtained from limited earthquakes recorded before
Copyright ? 2005 John Wiley & Sons, Ltd. Earthquake Engng Struct. Dyn. 2005; 34:1427–1443
1430 Y.-Y. LIN, E. MIRANDA AND K.-C. CHANG
0.2
0.4
0.6
0.8
1.0
0.0 1.0 2.0 3.0 4.0 5.0 6.0
ξ=10%
20%
0.2
0.4
0.6
0.8
1.0
0.0 1.0 2.0 3.0 4.0 5.0 6.0PERIOD [s]
BBB B
B
ξ =10%
20%
30%
40%50%
0.2
0.4
0.6
0.8
1.0
0.0 1.0 2.0 3.0 4.0 5.0 6.0
ξ=10%
20%
30%
40%50%
0.2
0.4
0.6
0.8
1.0
0.0 1.0 2.0 3.0 4.0 5.0 6.0PERIOD [s]
ξ=10%
20%
30%
40%
50%
0.2
0.4
0.6
0.8
1.0
0.0 1.0 2.0 3.0 4.0 5.0 6.0
=10%
20%
30%
40%
50%
PERIOD [s]
PERIOD [s]
PERIOD [s]
ξ
(a) (b)
(c) (d)
(e)
Figure 2. Damping reduction factors (B) proposed by various researchers: (a) Newmark-Hall 1982;(b) Ashour 1987; (c) Wu and Hanson 1989; (d) Ramirez et al. 2000; and (e) Lin and Chang 2003.
1973 [18, 19]. In addition, they were derived from the displacement response spectrum (Sd)or pseudo-acceleration response spectrum (PSa).
2.2. Ashour [13]
In 1987, Ashour developed a relationship that described the decrease in displacement responsespectrum for elastic systems with changes in viscous damping. Natural vibrating periods (T)
Copyright ? 2005 John Wiley & Sons, Ltd. Earthquake Engng Struct. Dyn. 2005; 34:1427–1443
EVALUATION OF DAMPING REDUCTION FACTORS 1431
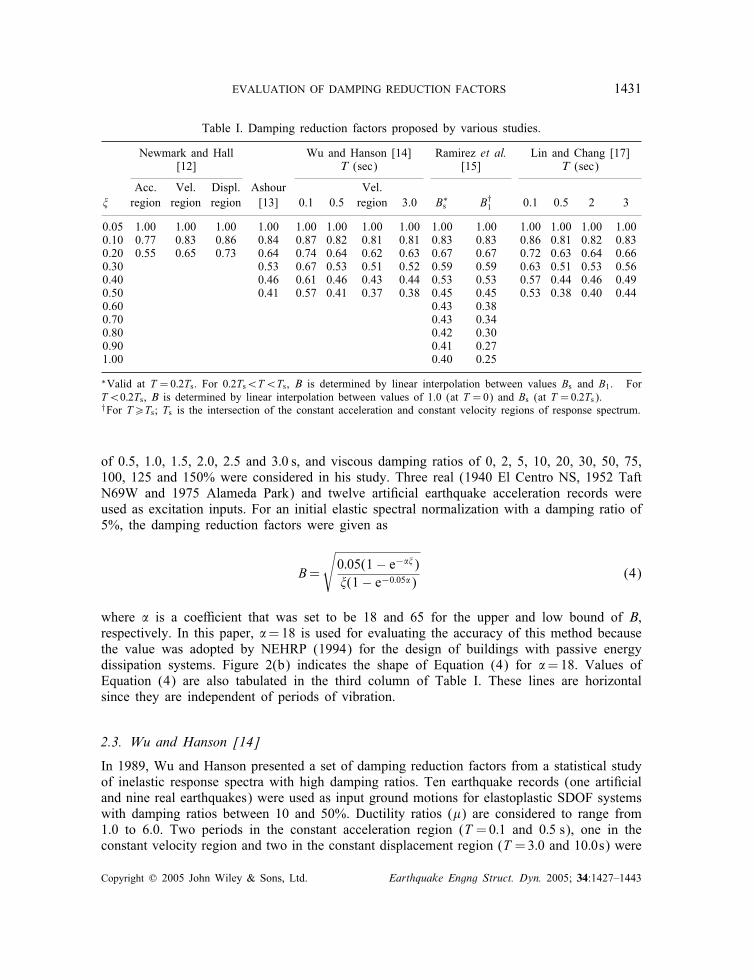
Table I. Damping reduction factors proposed by various studies.
Newmark and Hall Wu and Hanson [14] Ramirez et al. Lin and Chang [17][12] T (sec) [15] T (sec)
Acc. Vel. Displ. Ashour Vel.� region region region [13] 0.1 0.5 region 3.0 B∗
s B†1 0.1 0.5 2 3
0.05 1.00 1.00 1.00 1.00 1.00 1.00 1.00 1.00 1.00 1.00 1.00 1.00 1.00 1.000.10 0.77 0.83 0.86 0.84 0.87 0.82 0.81 0.81 0.83 0.83 0.86 0.81 0.82 0.830.20 0.55 0.65 0.73 0.64 0.74 0.64 0.62 0.63 0.67 0.67 0.72 0.63 0.64 0.660.30 0.53 0.67 0.53 0.51 0.52 0.59 0.59 0.63 0.51 0.53 0.560.40 0.46 0.61 0.46 0.43 0.44 0.53 0.53 0.57 0.44 0.46 0.490.50 0.41 0.57 0.41 0.37 0.38 0.45 0.45 0.53 0.38 0.40 0.440.60 0.43 0.380.70 0.43 0.340.80 0.42 0.300.90 0.41 0.271.00 0.40 0.25
∗Valid at T =0:2Ts. For 0:2Ts¡T¡Ts, B is determined by linear interpolation between values Bs and B1. ForT¡0:2Ts, B is determined by linear interpolation between values of 1.0 (at T =0) and Bs (at T =0:2Ts).†For T¿Ts; Ts is the intersection of the constant acceleration and constant velocity regions of response spectrum.
of 0.5, 1.0, 1.5, 2.0, 2.5 and 3:0 s, and viscous damping ratios of 0, 2, 5, 10, 20, 30, 50, 75,100, 125 and 150% were considered in his study. Three real (1940 El Centro NS, 1952 TaftN69W and 1975 Alameda Park) and twelve arti�cial earthquake acceleration records wereused as excitation inputs. For an initial elastic spectral normalization with a damping ratio of5%, the damping reduction factors were given as
B=
√0:05(1− e−��)�(1− e−0:05�) (4)
where � is a coe�cient that was set to be 18 and 65 for the upper and low bound of B,respectively. In this paper, �=18 is used for evaluating the accuracy of this method becausethe value was adopted by NEHRP (1994) for the design of buildings with passive energydissipation systems. Figure 2(b) indicates the shape of Equation (4) for �=18. Values ofEquation (4) are also tabulated in the third column of Table I. These lines are horizontalsince they are independent of periods of vibration.
2.3. Wu and Hanson [14]
In 1989, Wu and Hanson presented a set of damping reduction factors from a statistical studyof inelastic response spectra with high damping ratios. Ten earthquake records (one arti�cialand nine real earthquakes) were used as input ground motions for elastoplastic SDOF systemswith damping ratios between 10 and 50%. Ductility ratios (�) are considered to range from1.0 to 6.0. Two periods in the constant acceleration region (T =0:1 and 0:5 s), one in theconstant velocity region and two in the constant displacement region (T =3:0 and 10:0s) were
Copyright ? 2005 John Wiley & Sons, Ltd. Earthquake Engng Struct. Dyn. 2005; 34:1427–1443
1432 Y.-Y. LIN, E. MIRANDA AND K.-C. CHANG
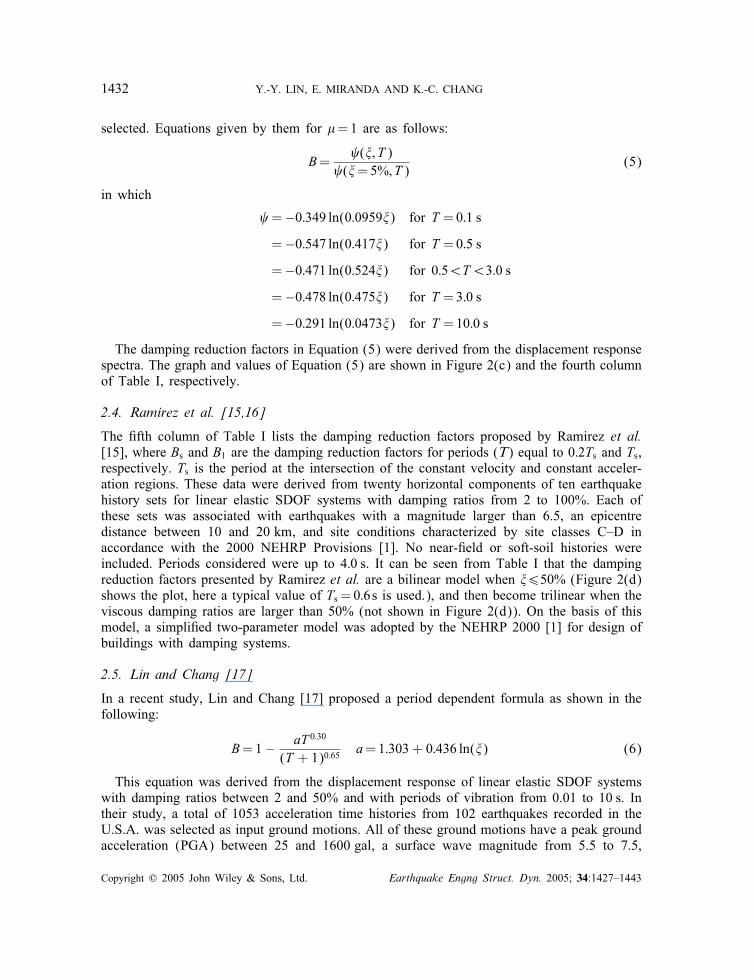
selected. Equations given by them for �=1 are as follows:
B= (�; T )
(�=5%; T )(5)
in which
=−0:349 ln(0:0959�) for T =0:1 s
=−0:547 ln(0:417�) for T =0:5 s
=−0:471 ln(0:524�) for 0:5¡T¡3:0 s
=−0:478 ln(0:475�) for T =3:0 s
=−0:291 ln(0:0473�) for T =10:0 s
The damping reduction factors in Equation (5) were derived from the displacement responsespectra. The graph and values of Equation (5) are shown in Figure 2(c) and the fourth columnof Table I, respectively.
2.4. Ramirez et al. [15,16]
The �fth column of Table I lists the damping reduction factors proposed by Ramirez et al.[15], where Bs and B1 are the damping reduction factors for periods (T) equal to 0:2Ts and Ts,respectively. Ts is the period at the intersection of the constant velocity and constant acceler-ation regions. These data were derived from twenty horizontal components of ten earthquakehistory sets for linear elastic SDOF systems with damping ratios from 2 to 100%. Each ofthese sets was associated with earthquakes with a magnitude larger than 6.5, an epicentredistance between 10 and 20 km, and site conditions characterized by site classes C–D inaccordance with the 2000 NEHRP Provisions [1]. No near-�eld or soft-soil histories wereincluded. Periods considered were up to 4:0 s. It can be seen from Table I that the dampingreduction factors presented by Ramirez et al. are a bilinear model when �650% (Figure 2(d)shows the plot, here a typical value of Ts = 0:6s is used.), and then become trilinear when theviscous damping ratios are larger than 50% (not shown in Figure 2(d)). On the basis of thismodel, a simpli�ed two-parameter model was adopted by the NEHRP 2000 [1] for design ofbuildings with damping systems.
2.5. Lin and Chang [17]
In a recent study, Lin and Chang [17] proposed a period dependent formula as shown in thefollowing:
B=1− aT 0:30
(T + 1)0:65a=1:303 + 0:436 ln(�) (6)
This equation was derived from the displacement response of linear elastic SDOF systemswith damping ratios between 2 and 50% and with periods of vibration from 0.01 to 10 s. Intheir study, a total of 1053 acceleration time histories from 102 earthquakes recorded in theU.S.A. was selected as input ground motions. All of these ground motions have a peak groundacceleration (PGA) between 25 and 1600 gal, a surface wave magnitude from 5.5 to 7.5,
Copyright ? 2005 John Wiley & Sons, Ltd. Earthquake Engng Struct. Dyn. 2005; 34:1427–1443
EVALUATION OF DAMPING REDUCTION FACTORS 1433
a distance closest to fault rupture between 0.1 and 180 km, and site conditions characterizedby site classes B–D in accordance with the 2000 NEHRP Provision. Figure 2(e) presents theplots of Equation (6). In addition, numerical values at periods (T) of 0.1, 0.5, 2.0, and 3:0 sare also listed in the sixth column of Table I.
3. COMPARISON OF METHODS
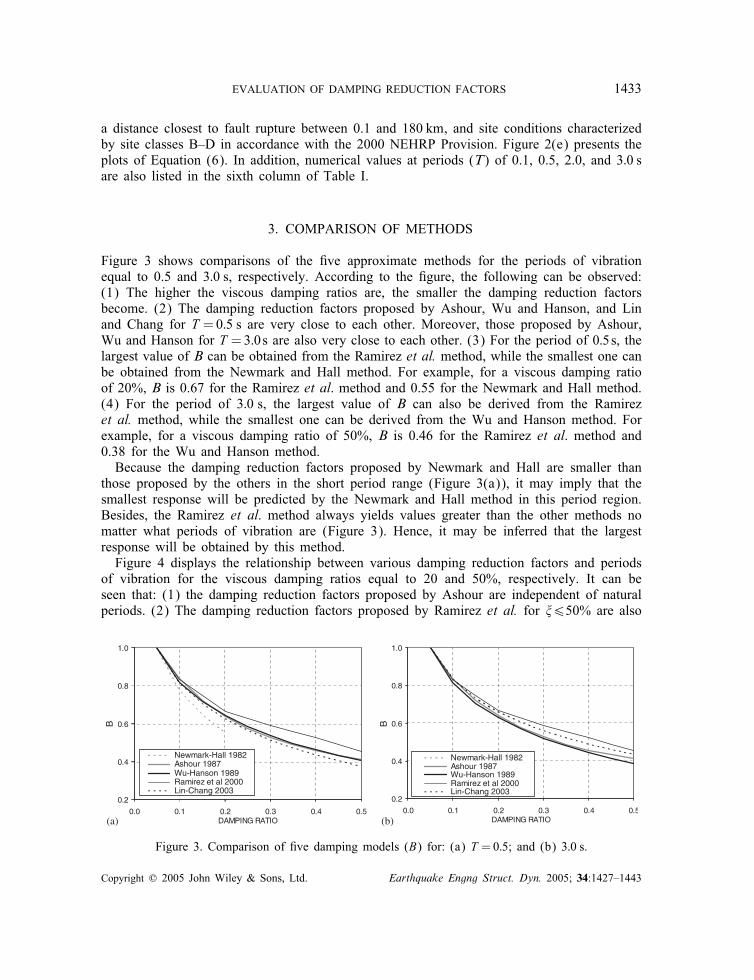
Figure 3 shows comparisons of the �ve approximate methods for the periods of vibrationequal to 0.5 and 3:0 s, respectively. According to the �gure, the following can be observed:(1) The higher the viscous damping ratios are, the smaller the damping reduction factorsbecome. (2) The damping reduction factors proposed by Ashour, Wu and Hanson, and Linand Chang for T =0:5 s are very close to each other. Moreover, those proposed by Ashour,Wu and Hanson for T =3:0s are also very close to each other. (3) For the period of 0:5s, thelargest value of B can be obtained from the Ramirez et al. method, while the smallest one canbe obtained from the Newmark and Hall method. For example, for a viscous damping ratioof 20%, B is 0.67 for the Ramirez et al. method and 0.55 for the Newmark and Hall method.(4) For the period of 3:0 s, the largest value of B can also be derived from the Ramirezet al. method, while the smallest one can be derived from the Wu and Hanson method. Forexample, for a viscous damping ratio of 50%, B is 0.46 for the Ramirez et al. method and0.38 for the Wu and Hanson method.Because the damping reduction factors proposed by Newmark and Hall are smaller than
those proposed by the others in the short period range (Figure 3(a)), it may imply that thesmallest response will be predicted by the Newmark and Hall method in this period region.Besides, the Ramirez et al. method always yields values greater than the other methods nomatter what periods of vibration are (Figure 3). Hence, it may be inferred that the largestresponse will be obtained by this method.Figure 4 displays the relationship between various damping reduction factors and periods
of vibration for the viscous damping ratios equal to 20 and 50%, respectively. It can beseen that: (1) the damping reduction factors proposed by Ashour are independent of naturalperiods. (2) The damping reduction factors proposed by Ramirez et al. for �650% are also
0.2
0.4
0.6
0.8
1.0
0.0 0.1 0.2 0.3 0.4 0.5DAMPING RATIO
B B
Newmark-Hall 1982 Ashour 1987 Wu-Hanson 1989 Ramirez et al 2000 Lin-Chang 2003
0.2
0.4
0.6
0.8
1.0
0.0 0.1 0.2 0.3 0.4 0.5DAMPING RATIO
Newmark-Hall 1982 Ashour 1987 Wu-Hanson 1989 Ramirez et al 2000 Lin-Chang 2003
(a) (b)
Figure 3. Comparison of �ve damping models (B) for: (a) T =0:5; and (b) 3:0 s.
Copyright ? 2005 John Wiley & Sons, Ltd. Earthquake Engng Struct. Dyn. 2005; 34:1427–1443
1434 Y.-Y. LIN, E. MIRANDA AND K.-C. CHANG
B B
0.3
0.4
0.5
0.6
0.7
0.8
0.0 1.0 2.0 3.0 4.0 5.0 6.0
PERIOD [s]
Newmark-Hall 1982 Ashour 1987 Wu-Hanson 1989 Ramirez et al 2000 Lin-Chang 2003
0.3
0.4
0.5
0.6
0.7
0.8
0.0 1.0 2.0 3.0 4.0 5.0 6.0
PERIOD [s]
Ashour 1987 Wu-Hanson 1989 Ramirez et al 2000 Lin-Chang 2003
(b)(a)
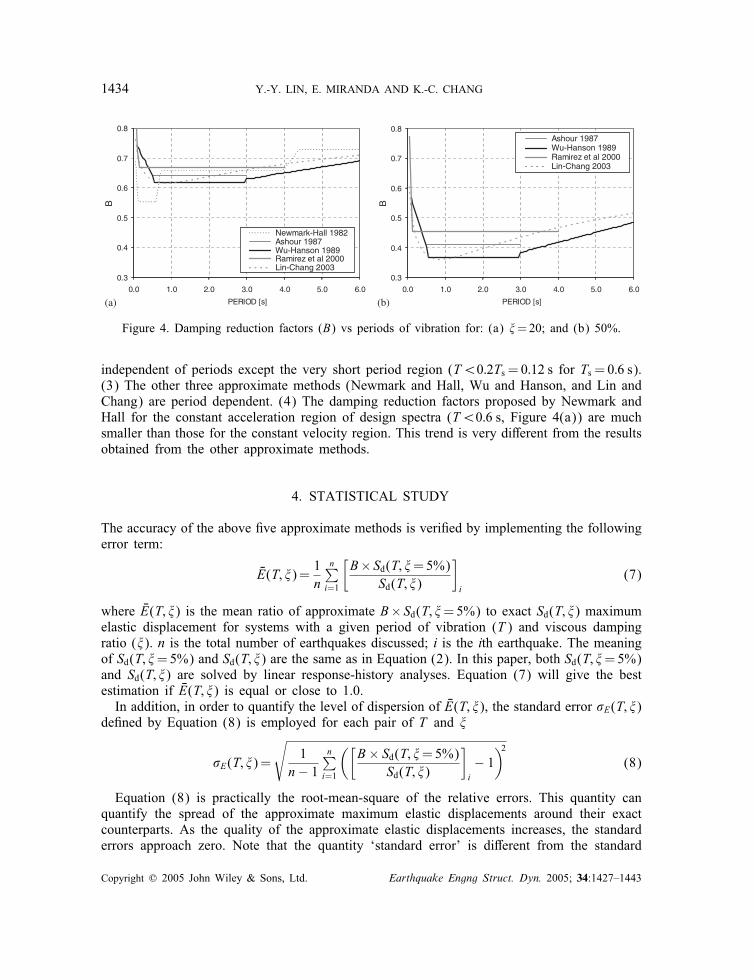
Figure 4. Damping reduction factors (B) vs periods of vibration for: (a) �=20; and (b) 50%.
independent of periods except the very short period region (T¡0:2Ts = 0:12 s for Ts = 0:6 s).(3) The other three approximate methods (Newmark and Hall, Wu and Hanson, and Lin andChang) are period dependent. (4) The damping reduction factors proposed by Newmark andHall for the constant acceleration region of design spectra (T¡0:6 s, Figure 4(a)) are muchsmaller than those for the constant velocity region. This trend is very di�erent from the resultsobtained from the other approximate methods.
4. STATISTICAL STUDY
The accuracy of the above �ve approximate methods is veri�ed by implementing the followingerror term:
�E(T; �)=1n
n∑i=1
[B× Sd(T; �=5%)
Sd(T; �)
]i
(7)
where �E(T; �) is the mean ratio of approximate B× Sd(T; �=5%) to exact Sd(T; �) maximumelastic displacement for systems with a given period of vibration (T ) and viscous dampingratio (�). n is the total number of earthquakes discussed; i is the ith earthquake. The meaningof Sd(T; �=5%) and Sd(T; �) are the same as in Equation (2). In this paper, both Sd(T; �=5%)and Sd(T; �) are solved by linear response-history analyses. Equation (7) will give the bestestimation if �E(T; �) is equal or close to 1.0.In addition, in order to quantify the level of dispersion of �E(T; �), the standard error �E(T; �)
de�ned by Equation (8) is employed for each pair of T and �
�E(T; �)=
√1
n − 1n∑
i=1
([B × Sd(T; �=5%)
Sd(T; �)
]i− 1
)2(8)
Equation (8) is practically the root-mean-square of the relative errors. This quantity canquantify the spread of the approximate maximum elastic displacements around their exactcounterparts. As the quality of the approximate elastic displacements increases, the standarderrors approach zero. Note that the quantity ‘standard error’ is di�erent from the standard
Copyright ? 2005 John Wiley & Sons, Ltd. Earthquake Engng Struct. Dyn. 2005; 34:1427–1443
EVALUATION OF DAMPING REDUCTION FACTORS 1435
deviation, which quanti�es the spread of the data around the mean (not around the exactvalue). In this paper, Equations (7) and (8) are computed for linear elastic SDOF systemswith eight levels of viscous damping ratios (2, 5, 10, 15, 20, 30, 40 and 50%), and with aset of 120 periods of vibration between 0.1 and 6:0 s with an increment of 0:05 s.
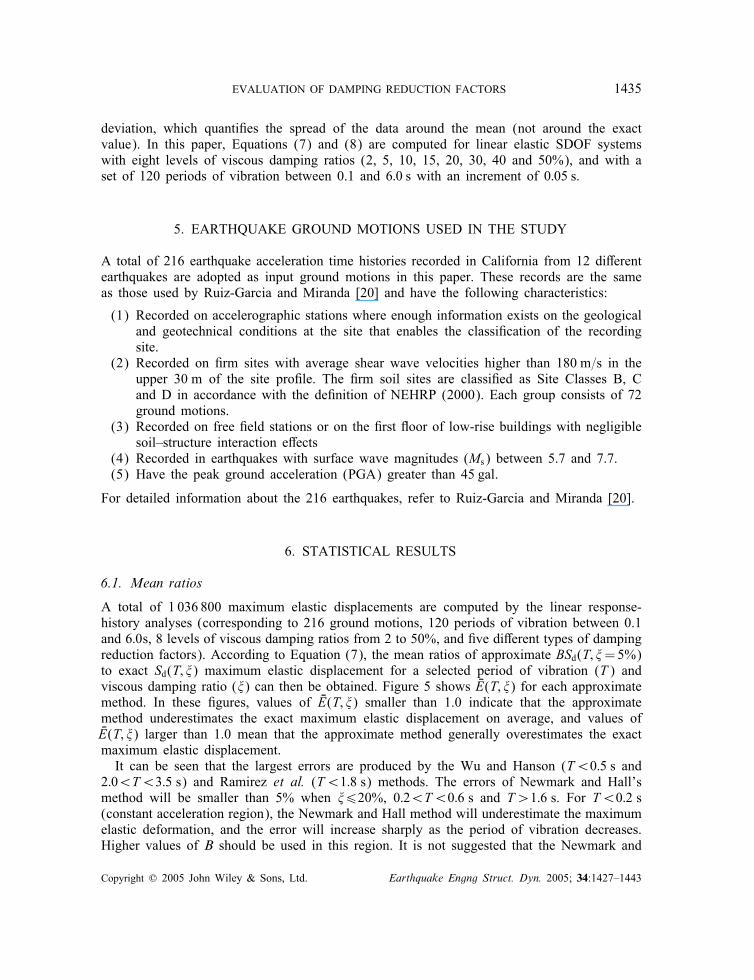
5. EARTHQUAKE GROUND MOTIONS USED IN THE STUDY
A total of 216 earthquake acceleration time histories recorded in California from 12 di�erentearthquakes are adopted as input ground motions in this paper. These records are the sameas those used by Ruiz-Garcia and Miranda [20] and have the following characteristics:
(1) Recorded on accelerographic stations where enough information exists on the geologicaland geotechnical conditions at the site that enables the classi�cation of the recordingsite.
(2) Recorded on �rm sites with average shear wave velocities higher than 180 m=s in theupper 30 m of the site pro�le. The �rm soil sites are classi�ed as Site Classes B, Cand D in accordance with the de�nition of NEHRP (2000). Each group consists of 72ground motions.
(3) Recorded on free �eld stations or on the �rst �oor of low-rise buildings with negligiblesoil–structure interaction e�ects
(4) Recorded in earthquakes with surface wave magnitudes (Ms) between 5.7 and 7.7.(5) Have the peak ground acceleration (PGA) greater than 45 gal.
For detailed information about the 216 earthquakes, refer to Ruiz-Garcia and Miranda [20].
6. STATISTICAL RESULTS
6.1. Mean ratios
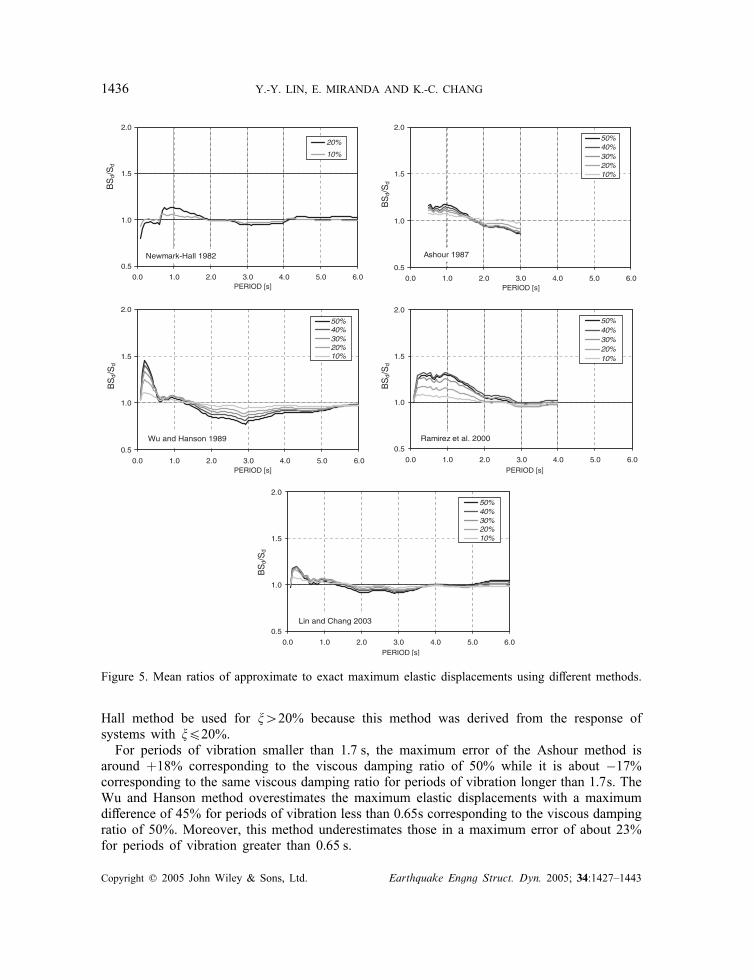
A total of 1 036 800 maximum elastic displacements are computed by the linear response-history analyses (corresponding to 216 ground motions, 120 periods of vibration between 0.1and 6:0s, 8 levels of viscous damping ratios from 2 to 50%, and �ve di�erent types of dampingreduction factors). According to Equation (7), the mean ratios of approximate BSd(T; �=5%)to exact Sd(T; �) maximum elastic displacement for a selected period of vibration (T ) andviscous damping ratio (�) can then be obtained. Figure 5 shows �E(T; �) for each approximatemethod. In these �gures, values of �E(T; �) smaller than 1.0 indicate that the approximatemethod underestimates the exact maximum elastic displacement on average, and values of�E(T; �) larger than 1.0 mean that the approximate method generally overestimates the exactmaximum elastic displacement.It can be seen that the largest errors are produced by the Wu and Hanson (T¡0:5 s and
2:0¡T¡3:5 s) and Ramirez et al. (T¡1:8 s) methods. The errors of Newmark and Hall’smethod will be smaller than 5% when �620%, 0:2¡T¡0:6 s and T¿1:6 s. For T¡0:2 s(constant acceleration region), the Newmark and Hall method will underestimate the maximumelastic deformation, and the error will increase sharply as the period of vibration decreases.Higher values of B should be used in this region. It is not suggested that the Newmark and
Copyright ? 2005 John Wiley & Sons, Ltd. Earthquake Engng Struct. Dyn. 2005; 34:1427–1443
1436 Y.-Y. LIN, E. MIRANDA AND K.-C. CHANG
Newmark-Hall 19820.5
1.0
1.5
2.0
0.0 1.0 2.0 3.0 4.0 5.0 6.0
BS
d/S
d
20%
10%
Ashour 1987
0.5
1.0
1.5
2.0
0.0 1.0 2.0 3.0 4.0 5.0 6.0PERIOD [s]PERIOD [s]
PERIOD [s] PERIOD [s]
PERIOD [s]
50%40%30%20%10%
Wu and Hanson 1989
0.5
1.0
1.5
2.0
0.0 1.0 2.0 3.0 4.0 5.0 6.0
BS
d/S
d
BS
d/S
dB
Sd/
Sd
BS
d/S
d
50%40%30%20%10%
Ramirez et al. 20000.5
1.0
1.5
2.0
0.0 1.0 2.0 3.0 4.0 5.0 6.0
50%40%30%20%10%
Lin and Chang 20030.5
1.0
1.5
2.0
0.0 1.0 2.0 3.0 4.0 5.0 6.0
50%40%30%20%10%
Figure 5. Mean ratios of approximate to exact maximum elastic displacements using di�erent methods.
Hall method be used for �¿20% because this method was derived from the response ofsystems with �620%.For periods of vibration smaller than 1:7 s, the maximum error of the Ashour method is
around +18% corresponding to the viscous damping ratio of 50% while it is about −17%corresponding to the same viscous damping ratio for periods of vibration longer than 1:7s. TheWu and Hanson method overestimates the maximum elastic displacements with a maximumdi�erence of 45% for periods of vibration less than 0:65s corresponding to the viscous dampingratio of 50%. Moreover, this method underestimates those in a maximum error of about 23%for periods of vibration greater than 0:65 s.
Copyright ? 2005 John Wiley & Sons, Ltd. Earthquake Engng Struct. Dyn. 2005; 34:1427–1443
EVALUATION OF DAMPING REDUCTION FACTORS 1437
Newmark-Hall 1982
0.0
0.2
0.4
0.6
0.8
1.0
0.0 1.0 2.0 3.0 4.0 5.0 6.0
σ E
σ E
σ E
σ E
σ E
20%
10%
Ashour 1987
0.0
0.2
0.4
0.6
0.8
1.0
0.0 1.0 2.0 3.0 4.0 5.0 6.0
PERIOD [s]PERIOD [s]
PERIOD [s] PERIOD [s]
PERIOD [s]
50%40%30%20%10%
Wu and Hanson 1989
0.0
0.2
0.4
0.6
0.8
1.0
0.0 1.0 2.0 3.0 4.0 5.0 6.0
50%40%30%20%10%
Ramirez et al. 2000
0.0
0.2
0.4
0.6
0.8
1.0
0.0 1.0 2.0 3.0 4.0 5.0 6.0
50%40%30%20%10%
Lin and Chang 2003
0.0
0.2
0.4
0.6
0.8
1.0
0.0 1.0 2.0 3.0 4.0 5.0 6.0
50%40%30%20%10%
Figure 6. Standard errors (�E) derived from various damping reduction factors.
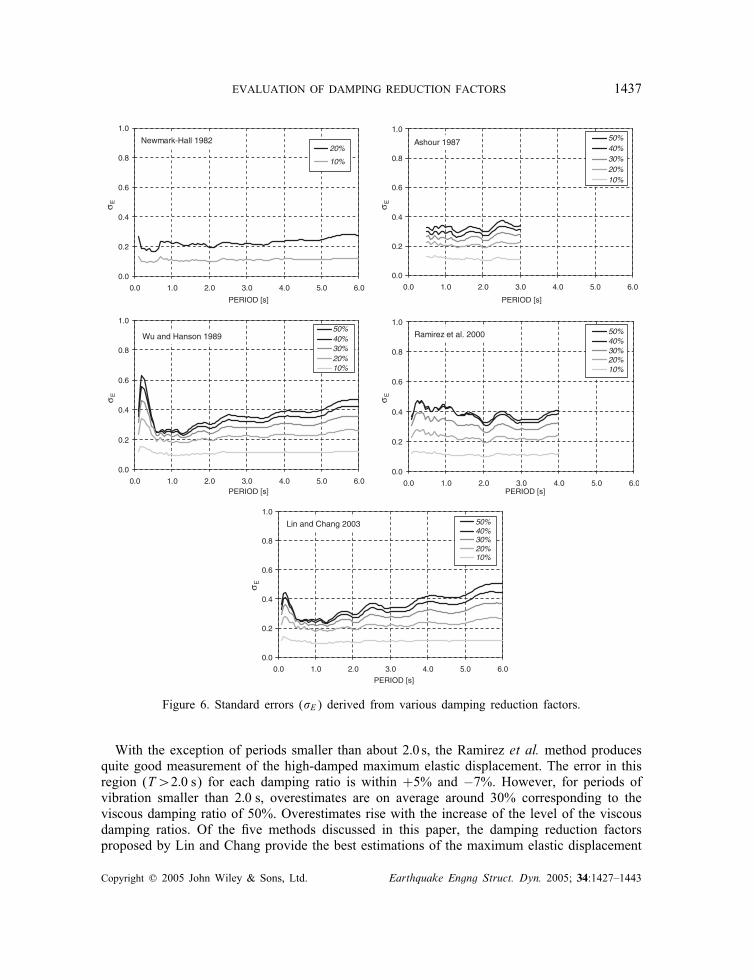
With the exception of periods smaller than about 2:0 s, the Ramirez et al. method producesquite good measurement of the high-damped maximum elastic displacement. The error in thisregion (T¿2:0 s) for each damping ratio is within +5% and −7%. However, for periods ofvibration smaller than 2:0 s, overestimates are on average around 30% corresponding to theviscous damping ratio of 50%. Overestimates rise with the increase of the level of the viscousdamping ratios. Of the �ve methods discussed in this paper, the damping reduction factorsproposed by Lin and Chang provide the best estimations of the maximum elastic displacement
Copyright ? 2005 John Wiley & Sons, Ltd. Earthquake Engng Struct. Dyn. 2005; 34:1427–1443
1438 Y.-Y. LIN, E. MIRANDA AND K.-C. CHANG
for all levels of viscous damping ratios. Even in the short period region where the maximumelastic displacements are very di�cult to predict well, the errors are controlled within anacceptable range.
6.2. Dispersion
Figure 6 presents the standard error �E(T; �) of the relative ratios for the �ve approximatemethods. For all methods, the standard errors increase as increasing the level of viscousdamping ratios. The standard errors for the �ve methods are similar, especially for systemswith intermediate and long periods. In general, the standard errors obtained by Ashour andRamirez et al. are relatively uniform. However, the minimum values of �E(T; �) in periodsbetween 0.25 and 3:7 s can be obtained by the Wu and Hanson method and the Lin andChang method.
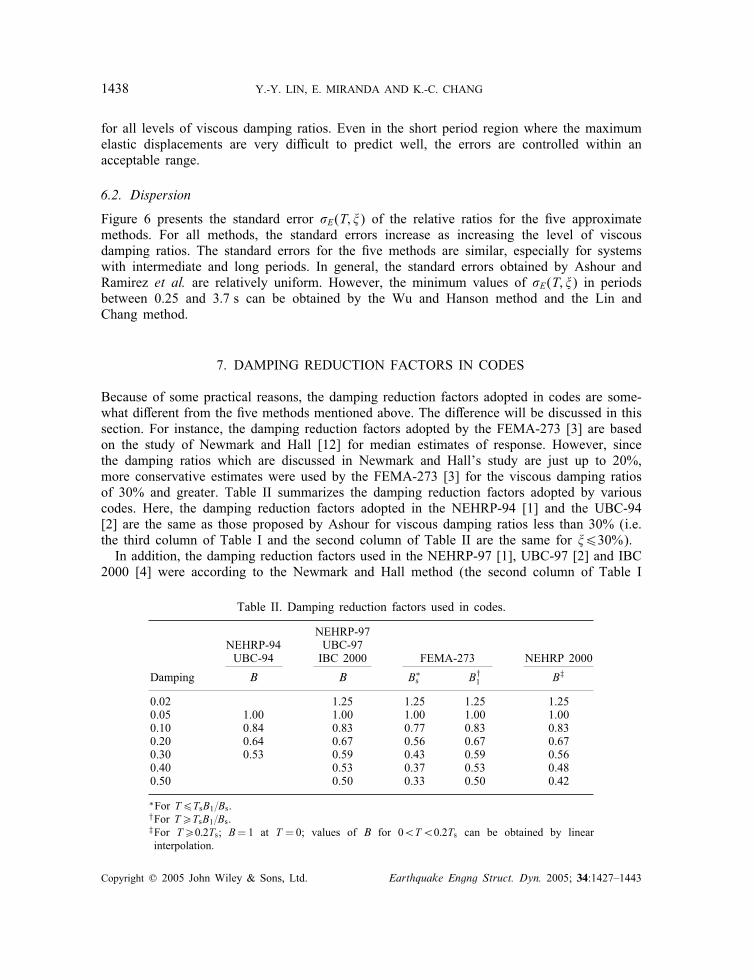
7. DAMPING REDUCTION FACTORS IN CODES
Because of some practical reasons, the damping reduction factors adopted in codes are some-what di�erent from the �ve methods mentioned above. The di�erence will be discussed in thissection. For instance, the damping reduction factors adopted by the FEMA-273 [3] are basedon the study of Newmark and Hall [12] for median estimates of response. However, sincethe damping ratios which are discussed in Newmark and Hall’s study are just up to 20%,more conservative estimates were used by the FEMA-273 [3] for the viscous damping ratiosof 30% and greater. Table II summarizes the damping reduction factors adopted by variouscodes. Here, the damping reduction factors adopted in the NEHRP-94 [1] and the UBC-94[2] are the same as those proposed by Ashour for viscous damping ratios less than 30% (i.e.the third column of Table I and the second column of Table II are the same for �630%).In addition, the damping reduction factors used in the NEHRP-97 [1], UBC-97 [2] and IBC
2000 [4] were according to the Newmark and Hall method (the second column of Table I
Table II. Damping reduction factors used in codes.
NEHRP-97NEHRP-94 UBC-97UBC-94 IBC 2000 FEMA-273 NEHRP 2000
Damping B B B∗s B†
1 B‡
0.02 1.25 1.25 1.25 1.250.05 1.00 1.00 1.00 1.00 1.000.10 0.84 0.83 0.77 0.83 0.830.20 0.64 0.67 0.56 0.67 0.670.30 0.53 0.59 0.43 0.59 0.560.40 0.53 0.37 0.53 0.480.50 0.50 0.33 0.50 0.42
∗For T6TsB1=Bs.†For T¿TsB1=Bs.‡For T¿0:2Ts; B=1 at T =0; values of B for 0¡T¡0:2Ts can be obtained by linearinterpolation.
Copyright ? 2005 John Wiley & Sons, Ltd. Earthquake Engng Struct. Dyn. 2005; 34:1427–1443
EVALUATION OF DAMPING REDUCTION FACTORS 1439
Newmark-Hall 1982NEHRP-97FEMA-273
0.2
0.4
0.6
0.8
1.0
0.0 1.0 2.0 3.0 4.0 5.0 6.0
PERIOD [s]
B B
ξ =10%
30%
50%
(a)
Ramirez et al. 2000NEHRP 2000
0.2
0.4
0.6
0.8
1.0
0.0 1.0 2.0 3.0 4.0 5.0 6.0
PERIOD [s]
ξ=10%
30%
50%
(b)
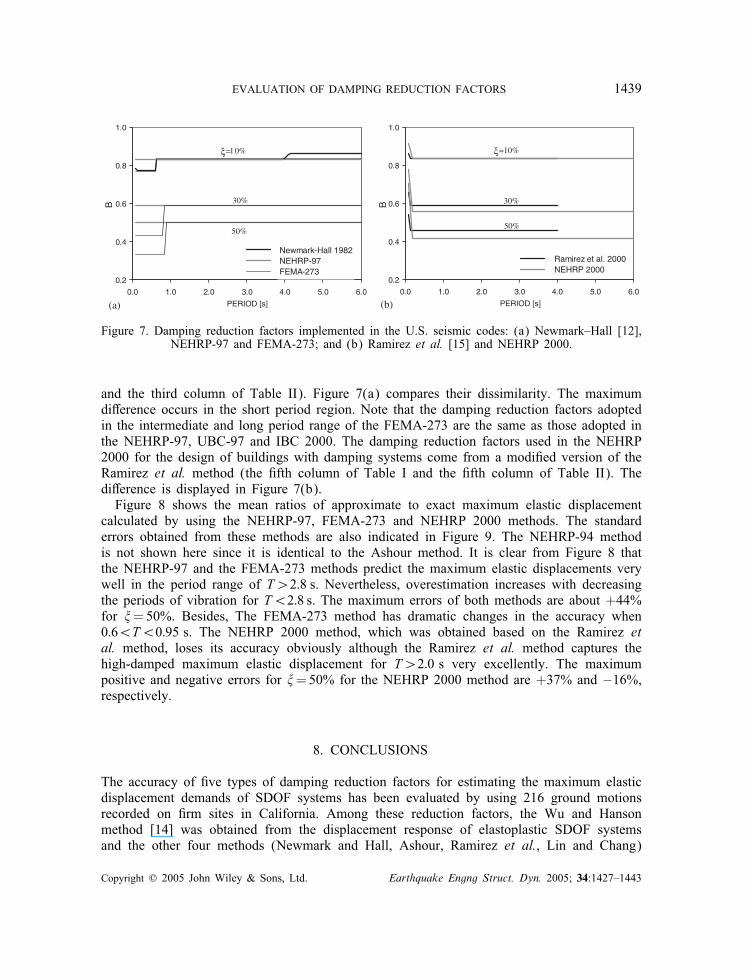
Figure 7. Damping reduction factors implemented in the U.S. seismic codes: (a) Newmark–Hall [12],NEHRP-97 and FEMA-273; and (b) Ramirez et al. [15] and NEHRP 2000.
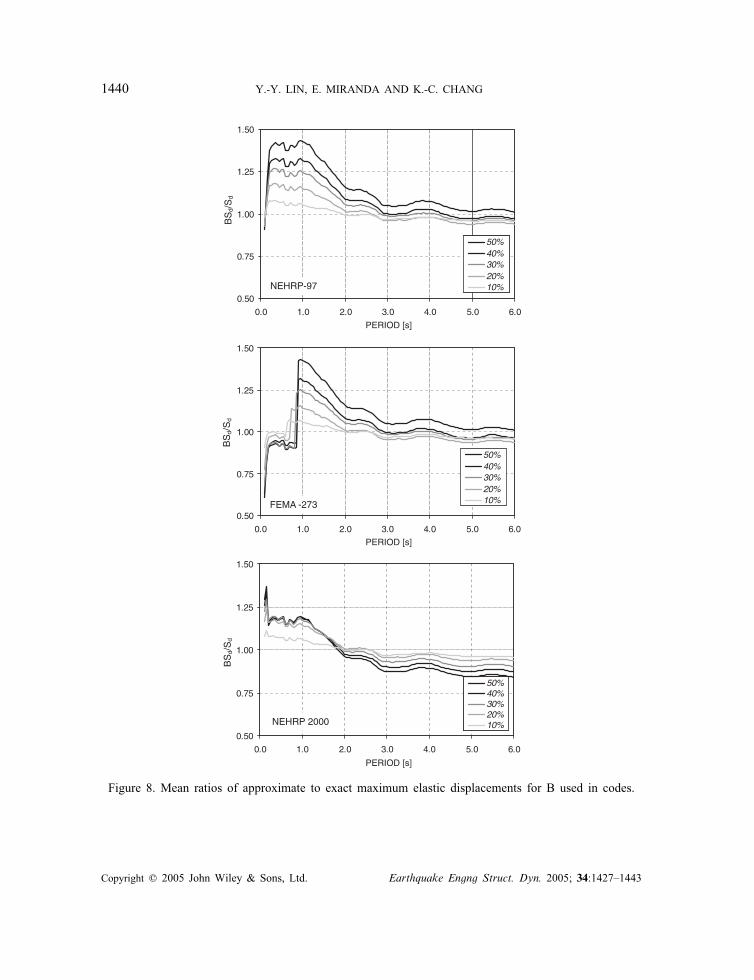
and the third column of Table II). Figure 7(a) compares their dissimilarity. The maximumdi�erence occurs in the short period region. Note that the damping reduction factors adoptedin the intermediate and long period range of the FEMA-273 are the same as those adopted inthe NEHRP-97, UBC-97 and IBC 2000. The damping reduction factors used in the NEHRP2000 for the design of buildings with damping systems come from a modi�ed version of theRamirez et al. method (the �fth column of Table I and the �fth column of Table II). Thedi�erence is displayed in Figure 7(b).Figure 8 shows the mean ratios of approximate to exact maximum elastic displacement
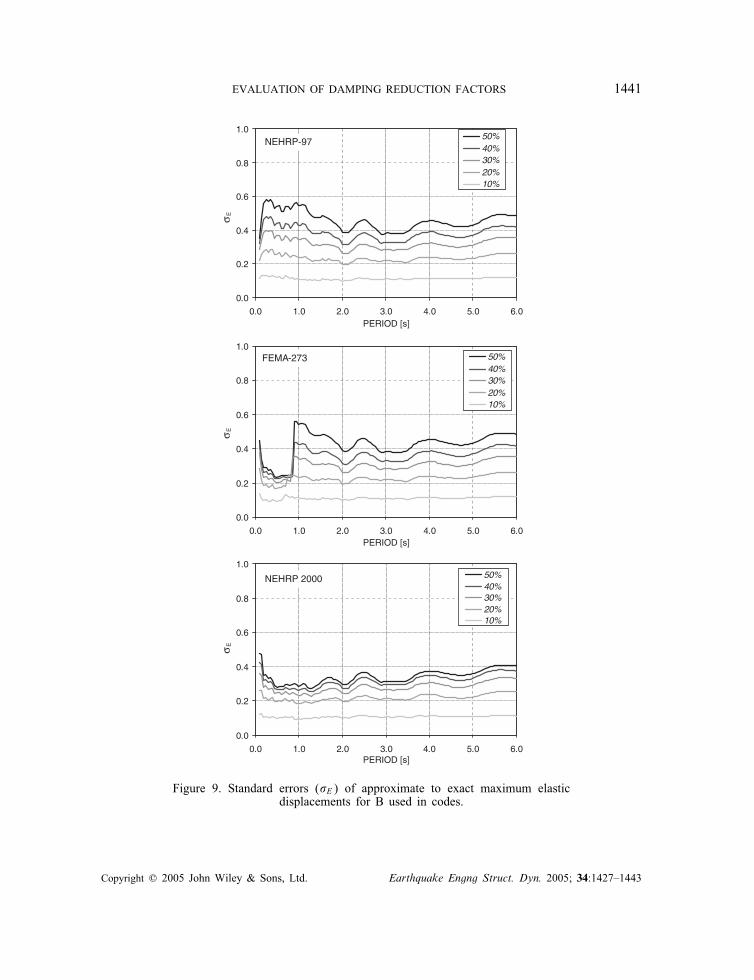
calculated by using the NEHRP-97, FEMA-273 and NEHRP 2000 methods. The standarderrors obtained from these methods are also indicated in Figure 9. The NEHRP-94 methodis not shown here since it is identical to the Ashour method. It is clear from Figure 8 thatthe NEHRP-97 and the FEMA-273 methods predict the maximum elastic displacements verywell in the period range of T¿2:8 s. Nevertheless, overestimation increases with decreasingthe periods of vibration for T¡2:8 s. The maximum errors of both methods are about +44%for �=50%. Besides, The FEMA-273 method has dramatic changes in the accuracy when0:6¡T¡0:95 s. The NEHRP 2000 method, which was obtained based on the Ramirez etal. method, loses its accuracy obviously although the Ramirez et al. method captures thehigh-damped maximum elastic displacement for T¿2:0 s very excellently. The maximumpositive and negative errors for �=50% for the NEHRP 2000 method are +37% and −16%,respectively.
8. CONCLUSIONS
The accuracy of �ve types of damping reduction factors for estimating the maximum elasticdisplacement demands of SDOF systems has been evaluated by using 216 ground motionsrecorded on �rm sites in California. Among these reduction factors, the Wu and Hansonmethod [14] was obtained from the displacement response of elastoplastic SDOF systemsand the other four methods (Newmark and Hall, Ashour, Ramirez et al., Lin and Chang)
Copyright ? 2005 John Wiley & Sons, Ltd. Earthquake Engng Struct. Dyn. 2005; 34:1427–1443
1440 Y.-Y. LIN, E. MIRANDA AND K.-C. CHANG
NEHRP-970.50
0.75
1.00
1.25
1.50
0.0 1.0 2.0 3.0 4.0 5.0 6.0
PERIOD [s]
PERIOD [s]
PERIOD [s]
BS
d/S
dB
Sd/S
d
50%40%30%20%10%
FEMA -2730.50
0.75
1.00
1.25
1.50
0.0 1.0 2.0 3.0 4.0 5.0 6.0
50%40%30%20%10%
NEHRP 2000
0.50
0.75
1.00
1.25
1.50
0.0 1.0 2.0 3.0 4.0 5.0 6.0
BS
d/S
d
50%40%30%20%10%
Figure 8. Mean ratios of approximate to exact maximum elastic displacements for B used in codes.
Copyright ? 2005 John Wiley & Sons, Ltd. Earthquake Engng Struct. Dyn. 2005; 34:1427–1443
EVALUATION OF DAMPING REDUCTION FACTORS 1441
NEHRP-97
0.0
0.2
0.4
0.6
0.8
1.0
0.0 1.0 2.0 3.0 4.0 5.0 6.0PERIOD [s]
PERIOD [s]
PERIOD [s]
σ E
σ E
σ E
50%40%30%20%10%
FEMA-273
0.0
0.2
0.4
0.6
0.8
1.0
0.0 1.0 2.0 3.0 4.0 5.0 6.0
50%40%30%20%10%
NEHRP 2000
0.0
0.2
0.4
0.6
0.8
1.0
0.0 1.0 2.0 3.0 4.0 5.0 6.0
50%40%30%20%10%
Figure 9. Standard errors (�E) of approximate to exact maximum elasticdisplacements for B used in codes.
Copyright ? 2005 John Wiley & Sons, Ltd. Earthquake Engng Struct. Dyn. 2005; 34:1427–1443
1442 Y.-Y. LIN, E. MIRANDA AND K.-C. CHANG
were derived from the maximum displacement response of linear elastic SDOF systems. Thefollowing conclusions can be drawn from the statistical results of this study.Generally, the ratios of approximate to exact maximum elastic displacements go up as the
level of the viscous damping ratio increases (Figure 5), i.e. the errors of estimates rise withincreasing the viscous damping ratio. Moreover, the maximum error of each method alwaysoccurs in the short period region. Although the smallest values of the damping reductionfactors are derived from the Newmark and Hall method (Figures 3(a) and 4), the accuracyof this method is acceptable for �620% and T¿0:2 s.The Wu and Hanson method apparently overestimates the maximum elastic displacements
for systems with T¡0:5 s, and simply underestimates those for systems with 2:0¡T¡3:5 s.The estimates predicted by the Ramirez et al. method for systems with periods of vibrationgreater than 2:0 s are quite accurate. However, this method overestimates the elastic high-damped displacement response monotonically when the periods of vibration are smaller than2:0 s. In this period region, overestimates are on average about 30% corresponding to theviscous damping ratio of 50%. The method proposed by Lin and Chang gives quiet goodpredictions of the maximum elastic displacements for all levels of viscous damping ratios andall values of periods of vibration.The damping reduction factors adopted by NEHRP-97, UBC-97, FEMA-273 and IBC 2000
are modi�ed from the Newmark and Hall method. The maximum di�erence is in the constantacceleration region (Figure 7(a)). The accuracy of the reduction factors used by codes isimproved for periods greater than 2:8 s (Figure 8). Nevertheless, the displacement responsesare conversely overestimated in an obvious tendency for periods less than 2:8 s. In addition,although the damping reduction factors implemented in NEHRP 2000 for the design of build-ings with damping systems were obtained based on the Ramirez et al. method, the formerbecomes more inaccurate (underestimation) than the latter especially for periods greater than2:0 s. For code use, Lin and Chang’s method is suggested for all period ranges. Moreover,the Ramirez et al. method also is recommended for T¿2:0 s.
ACKNOWLEDGEMENTS
This study was sponsored by the National Science Council (NSC-90-2811-Z-002-003) and the SinotechEngineering Consultant Inc. (Grant No. 6120) of Taiwan, ROC. The �nancial support to the writers isgreatly acknowledged.
REFERENCES
1. NEHRP. Recommended Provisions for Seismic Regulations for New Buildings. Federal Emergency ManagementAgency: Washington, DC, 1994, 1997, 2000.
2. UBC. Uniform Building Code. International Conference of Building O�cials, Whittier, CA, 1994, 1997.3. FEMA-273. NEHRP Guidelines for the Seismic Rehabilitation of Buildings. Federal Emergency ManagementAgency: Washington, DC, 1997.
4. IBC. International building code. International Conference of Building o�cials, Whittier, CA, 2000.5. Gulkan P, Sozen M. Inelastic response of reinforced concrete structures to earthquakes motions. ACI Journal1974; 71:604–610.
6. Shibata A, Sozen M. Substitute structure method for seismic design in R/C. Journal of Structural Division(ASCE) 1976; 102:1–18.
7. Iwan WD. Estimating inelastic response spectra from elastic spectra. Earthquake Engineering and StructuralDynamics 1980; 8:375–388.
8. Kowalsky MJ. Displacement-based design—a methodology for seismic design applied to RC bridge columns.Master’s Thesis, University of California at San Diego, La Jolla, CA, 1994.
Copyright ? 2005 John Wiley & Sons, Ltd. Earthquake Engng Struct. Dyn. 2005; 34:1427–1443
EVALUATION OF DAMPING REDUCTION FACTORS 1443
9. ATC-40. Seismic Evaluation and Retro�t of Concrete Building. Applied Technology Council: Redwood City,CA, 1996.
10. Iwan WD, Guyader AC. An improved equivalent linearization procedure for the capacity spectrum method.Proceedings of the International Conference on Advanced and New Challenges in Earthquake EngineeringResearch, Harbin, China, August 15–17, 2002.
11. Miranda E, Lin YY. Non-iterative equivalent linear method for evaluation of existing structures. Journal ofStructural Engineering 2003, submitted for publication.
12. Newmark NM, Hall WJ. Earthquake Spectra and Design. EERI Monograph Series, Earthquake EngineeringResearch Institute: Oakland, CA, 1982.
13. Ashour SA. Elastic seismic response of buildings with supplemental damping. Ph.D. Dissertation, Departmentof Civil Engineering, University of Michigan, January 1987.
14. Wu JP, Hanson RD. Inelastic response spectra with high damping. Journal of the Structural Division (ASCE)1989; 115(6):1412–1431.
15. Ramirez OM, Constantinou MC, Kircher CA, Whittaker AS, Johnson MW, Gomez JD, ChrysostomouCZ. Development and Evaluation of Simpli�ed Procedures for Analysis and Design of Buildings withPassive Energy Dissipation Systems. Report No: MCEER-00-0010, Multidisciplinary Center for EarthquakeEngineering Research (MCEER), University of New York at Bu�alo, New York, 2000.
16. Ramirez OM, Constantinou MC, Whittaker AS, Kircher CA, Chrysostomou CZ. Elastic and inelastic seismicresponse of buildings with damping systems. Earthquake Spectra 2002; 18(3):531–547.
17. Lin YY, Chang KC. A study on damping reduction factor for buildings under earthquake ground motions.Journal of Structural Engineering (ASCE) 2003; 129(2):206–214.
18. Newmark NM, Blume JA, Kapur KK. Seismic design spectra for nuclear power plants. Journal of PowerDivision (ASCE) 1973; 99(P02):287–303.
19. Newmark NM, Hall WJ. Seismic Design Criteria for Nuclear Reactor Facilities. Report No. 46, BuildingPractices for Disaster Mitigation, National Bureau of Standards, U.S. Department of Commerce, 1973;209–236.
20. Ruiz-Garcia J, Miranda E. Inelastic displacement ratios for evaluation of existing structures. EarthquakeEngineering and Structural Dynamics 2003; 32(8):1237–1258.
Copyright ? 2005 John Wiley & Sons, Ltd. Earthquake Engng Struct. Dyn. 2005; 34:1427–1443


