Embed Size (px)
Citation preview
EVALUATION OF FIRE SAFETY COMPLIANCE IN
PAINT INDUSTRY IN NAIROBI COUNTY
VALENTINAH NGENYI MUTUKU
MASTERS OF SCIENCE
(Occupational Safety and Health)
JOMO KENYATTA UNIVERSITY OF
AGRICULTURE AND TECHNOLOGY
2020
Evaluation of Fire Safety Compliance in Paint Industry in Nairobi
County
Valentinah Ngenyi Mutuku
A Thesis submitted in partial fulfillment for the Degree of Masters
of Science in Occupational Safety and Health in the Jomo Kenyatta
University of Agriculture And Technology
2020
ii
DECLARATION
This thesis is my original work and has not been presented for a degree in any other
University
Signature……………………………………….. Date……………………………..
Valentina Ngenyi Mutuku
This thesis has been submitted for examination with our approval as University
supervisors
Signature……………………………………….. Date……………………………..
Prof. Erastus Gatebe, PhD
KIRDI, Kenya.
Signature……………………………………….. Date……………………………..
Dr Leonard Gitu, PhD
JKUAT, Kenya.

iii
DEDICATION
I would like to dedicate this work to my father Benjamin Mutuku Kaleli, my dear
husband James Kimutai Koech and my children Bill Kiprono, Claire Cheptoo,
Benjamin Kipruto and Elizabeth Cherotich for encouragement and their continued
support morally, socially and financially during my entire studies.

iv
ACKNOWLEGMENT
I would like to convey my gratitude to the following for providing me with
inspiration and constant motivation to embark and complete this research thesis. My
deepest thanks go to my first supervisor, Professor Erastus Gatebe who vigorously
but kindly gave me the motivation to perform to my maximum ability. Special
gratitude goes to my second supervisor, Dr Leonard Gitu for his constant help and
precious advice. Their detailed and constructive comments were vital to the
formulation, development and subsequent research on this thesis. I would also thank
the management and staff of paint industries within Nairobi area who were generous
and kind in providing information for the study. To my research assistants, Gerald
Kamau and Kiplimo Rono thank you for going out of your way to make data
collection and validation successful. I am indebted to my colleagues at JKUAT and
at work (Infinity Plastics and Megablow Plastics Industries limited) for being a great
source of support in encouragement and sharing literature. To all of the above, I say
much thanks and God bless.

v
TABLE OF CONTENTS
DECLARATION ....................................................................................................... II
DEDICATION ......................................................................................................... III
ACKNOWLEGMENT ............................................................................................ IV
TABLE OF CONTENTS .......................................................................................... V
LIST OF TABLES ................................................................................................... IX
LIST OF FIGURES .................................................................................................. X
LIST OF PLATES ................................................................................................... XI
LIST OF APPENDICES ....................................................................................... XII
LIST OF ABBREVIATIONS AND ACRYONMS ............................................ XIII
ABSTRACT ........................................................................................................... XIV
CHAPTER ONE ........................................................................................................ 1
INTRODUCTION ...................................................................................................... 1
1.1 Background of the study .................................................................................... 1
1.2 Problem statement .............................................................................................. 2
1.3 Hypothesis .......................................................................................................... 3
1.3.1 Null Hypothesis ........................................................................................... 3
1.4 Justification and significance of the study ......................................................... 4
1.5 Research questions ............................................................................................. 4
1.6 Research Objectives ........................................................................................... 5
1.6.1 General objectives ....................................................................................... 5
1.6.2 Specific Objectives...................................................................................... 5
vi
1.7 Scope of the study .............................................................................................. 5
1.8 Conceptual framework ....................................................................................... 5
CHAPTER TWO ....................................................................................................... 7
LITERATURE REVIEW .......................................................................................... 7
2.1 History of Fire Occurrences ............................................................................... 7
2.2 Nature of Paints .................................................................................................. 8
2.3 History of Fire .................................................................................................. 12
2.4 The Science of Fire .......................................................................................... 13
2.5 Classes of Fire .................................................................................................. 14
2.6 Fire Extinguishing ............................................................................................ 14
2.7 Fire Prevention and Protection ......................................................................... 16
2.8 Legislative Provisions on Fire safety. .............................................................. 17
2.9 Fire risks Assessment. ...................................................................................... 20
2.10 Possible causes of fire in paint industries. ..................................................... 23
CHAPTER THREE ................................................................................................. 26
MATERIALS AND METHODS ............................................................................ 26
3.1 Study design ..................................................................................................... 26
3.2 Study area and target Population...................................................................... 26
3.2.1 Geographical location of paint industries in Nairobi ................................ 26
3.2.2 Geographical location ............................................................................... 27
3.2.3 Sample Population .................................................................................... 27
3.2.4 Sample size for questionnaire distribution ................................................ 28
3.3 Research instrument ......................................................................................... 30
vii
3.4 Data Collection. ............................................................................................... 30
3.5 Data Processing and Analysis .......................................................................... 32
3.6 Pilot testing ...................................................................................................... 33
3.7 Ethical considerations ...................................................................................... 34
CHAPTER FOUR .................................................................................................... 35
RESEARCH FINDINGS AND DISCUSSION ...................................................... 35
4.1 Population characteristics ................................................................................ 35
4.1.1 Response Rate ........................................................................................... 35
4.1.2 Demographic characteristics of the Management and Workforce ............ 35
4.2 Fire risks ........................................................................................................... 39
4.2.1 Fire incidences .......................................................................................... 41
4.3 Essential fire safety measures in paint Industries ............................................ 43
4.3.1 Comparison of fire safety measures in industries ..................................... 46
4.4 Fire safety awareness ....................................................................................... 46
4.4.1 Comparison of fire safety awareness ........................................................ 48
4.5 Fire safety preparedness ................................................................................... 49
4.5.1 Statistical significance comparison for fire safety preparedness .............. 51
4.6 Fire safety compliance ..................................................................................... 52
4.6.1 Statistical significance comparison for fire safety compliance ................. 54
4.7 Factors affecting implementation of fire risk reduction rules .......................... 55
4.7.1 Statistical significance of workplaces location and compliance factors ... 56
4.7.2 Comparison between the various responses between management and
workforce ........................................................................................................... 56
viii
4.7.3 Statistical significance on workforce responses to fire safety. ................. 57
4.8 Compliance level in observing FRRR ............................................................. 58
4.8.1 Fire risks compliance ................................................................................ 59
4.8.2 Fire measures in place ............................................................................... 59
4.8.3 Fire preparedness ...................................................................................... 60
4.8.4 Management Compliance ......................................................................... 61
CHAPTER FIVE ...................................................................................................... 63
CONCLUSION AND RECOMMENDATION ..................................................... 63
5.1 Conclusion ....................................................................................................... 63
5.2 Recommendation ............................................................................................. 66
REFERENCES ......................................................................................................... 69
APPENDICES .......................................................................................................... 74
ix
LIST OF TABLES
Table 2.1: Fire incidences data of paint industries within Nairobi area. ..................... 8
Table 2.2: Fire Risk Assessment Matrix Reference .................................................. 23
Table 3.1: Sample size distribution ........................................................................... 29
Table 4.1: Respondents’ Demographics.................................................................... 36
Table 4.2: Education level ......................................................................................... 37
Table 4.3: Essentials fire safety awareness ............................................................... 46
Table 4.4: Workers response on fire preparedness ................................................... 50
Table 4.5: Group Statistics for management and workforce ..................................... 56
Table 4.6: Statistical significance between management and Workforce ................. 57
Table 4.7: Group Statistics for different industries ................................................... 57
Table 4.8: Statistical significance for different industries......................................... 58
Table 4.9: Fire risks compliance ............................................................................... 59
Table 4.10: Fire compliance measures ...................................................................... 60
Table 4.11: Compliance in fire preparedness ............................................................ 61
Table 4.12: Management Compliance ...................................................................... 62
x
LIST OF FIGURES
Figure 1.1: Conceptual framework ............................................................................. 6
Figure 2.1: Fire Triangle. .......................................................................................... 13
Figure 2.2: Fire Extinguishing Triangle .................................................................... 15
Figure 3.1: Industrial area and Kariobangi light industries ...................................... 27
Figure 4.1: Management number of years at workplace ........................................... 38
Figure 4.2: Workforce number of years at workplace .............................................. 38
Figure 4.3: Fire risks in the workplaces. ................................................................... 40
Figure 4.5: Fire incidences and recording in workplaces ......................................... 42
Figure 4.6: Fire safety measures in workplaces ........................................................ 43
Figure 4.7: Workers response to fire safety measures .............................................. 44
Figure 4.8: Management response to fire safety measures ....................................... 45
Figure 4.9: Workforce response on fire extinguishers .............................................. 47
Figure 4.10: Workers response on presence of fire policy and reading. ................... 48
Figure 4.11: Workplace fire safety preparedness...................................................... 49
Figure 4.12: Workers response to presence of escape routes and their obstruction. 52
Figure 4.13: Compliance with fire risk reduction rules. ........................................... 53
Figure 4.14: Management response to fire safety compliance.................................. 54
Figure 4.15: Factors affecting implementation of FRRR ......................................... 55
xi
LIST OF PLATES
Plate 2.1: Fire incidence in a factory, Industrial area .................................................. 7
Plate 2.2: Cans of paints .............................................................................................. 9
Plate 2.3: Paint production Process ........................................................................... 11
Plate 2.4: Paints stored after production.................................................................... 12
Plate 2.5: Fire brigade extinguishing fire. ................................................................. 15
Plate 3.1: Overseeing data filling. ............................................................................. 31
Plate 3.2: Explaining questions to workers. .............................................................. 31
Plate 3.3: Confirming completion of data filling. ..................................................... 32
xii
LIST OF APPENDICES
Appendix I: Statistical significance of workplace location and compliance factors 74
Appendix II: Check List ........................................................................................... 75
Appendix III: Workforce Questionaire .................................................................... 77
Appendix IV: Management Questionnaire ............................................................... 81
Appendix V: Cronbach’s Alpha on Checklists ......................................................... 84
Appendix VI: Cronbach’s Alpha On Management .................................................. 87
Appendix VII: Cronbach Alpha On Workforce ....................................................... 93
Appendix VIII: Social Demographic Association ................................................... 99
Appendix IX: Fire Risks Associations ................................................................... 101
Appendix X: Fire Measures Associations ............................................................... 103
Appendix XI: Fire Awareness Measures Associations........................................... 105
Appendix XII: Fire Safety Preparedness Associations .......................................... 107
Appendix XIII: Fire Safety Compliance Associations ........................................... 109
Appendix XIV: Letter of Introduction .................................................................... 110
Appendix XV: University Recommendation Letter ............................................... 111
Appendix XVI: Published Journal Paper ................................................................ 112
xiii
LIST OF ABBREVIATIONS AND ACRYONMS
AKI Association of Kenya Insurance
CBD Central business district
CFOA Chief fire officer association
CO2 Carbon Dioxide
DOSHS Directorate of Occupational Safety and Health Services
FRRR Fire Risk Reduction Rules
GNP Gross Net Profit
GOK Government of Kenya
HSE Health Safety Executive
KLR Kenya Law Reforms
LN Legal Notice
LPG Liquefied Petroleum Gas
NCC Nairobi City Council
OSHA Occupational Safety and Health Act
xiv
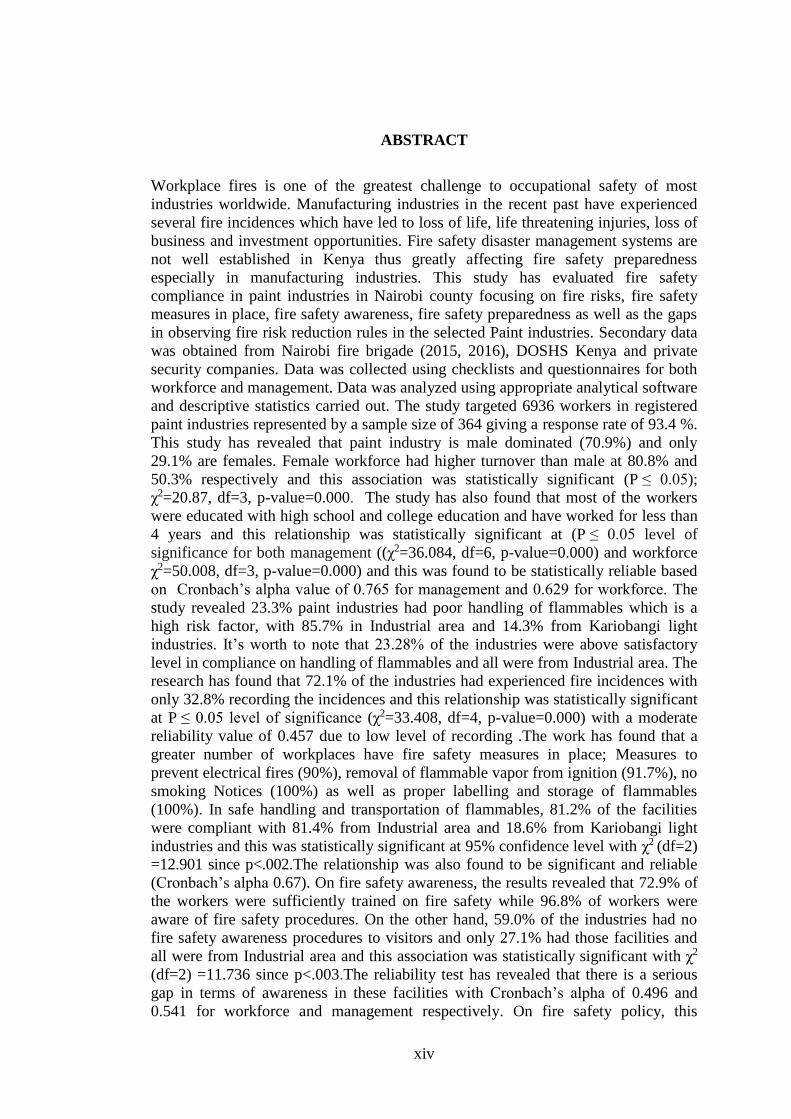
ABSTRACT
Workplace fires is one of the greatest challenge to occupational safety of most
industries worldwide. Manufacturing industries in the recent past have experienced
several fire incidences which have led to loss of life, life threatening injuries, loss of
business and investment opportunities. Fire safety disaster management systems are
not well established in Kenya thus greatly affecting fire safety preparedness
especially in manufacturing industries. This study has evaluated fire safety
compliance in paint industries in Nairobi county focusing on fire risks, fire safety
measures in place, fire safety awareness, fire safety preparedness as well as the gaps
in observing fire risk reduction rules in the selected Paint industries. Secondary data
was obtained from Nairobi fire brigade (2015, 2016), DOSHS Kenya and private
security companies. Data was collected using checklists and questionnaires for both
workforce and management. Data was analyzed using appropriate analytical software
and descriptive statistics carried out. The study targeted 6936 workers in registered
paint industries represented by a sample size of 364 giving a response rate of 93.4 %.
This study has revealed that paint industry is male dominated (70.9%) and only
29.1% are females. Female workforce had higher turnover than male at 80.8% and
50.3% respectively and this association was statistically significant (P ≤ 0.05);
χ2=20.87, df=3, p-value=0.000. The study has also found that most of the workers
were educated with high school and college education and have worked for less than
4 years and this relationship was statistically significant at (P ≤ 0.05 level of
significance for both management ((χ2=36.084, df=6, p-value=0.000) and workforce
χ2=50.008, df=3, p-value=0.000) and this was found to be statistically reliable based
on Cronbach’s alpha value of 0.765 for management and 0.629 for workforce. The
study revealed 23.3% paint industries had poor handling of flammables which is a
high risk factor, with 85.7% in Industrial area and 14.3% from Kariobangi light
industries. It’s worth to note that 23.28% of the industries were above satisfactory
level in compliance on handling of flammables and all were from Industrial area. The
research has found that 72.1% of the industries had experienced fire incidences with
only 32.8% recording the incidences and this relationship was statistically significant
at P ≤ 0.05 level of significance (χ2=33.408, df=4, p-value=0.000) with a moderate
reliability value of 0.457 due to low level of recording .The work has found that a
greater number of workplaces have fire safety measures in place; Measures to
prevent electrical fires (90%), removal of flammable vapor from ignition (91.7%), no
smoking Notices (100%) as well as proper labelling and storage of flammables
(100%). In safe handling and transportation of flammables, 81.2% of the facilities
were compliant with 81.4% from Industrial area and 18.6% from Kariobangi light
industries and this was statistically significant at 95% confidence level with χ2 (df=2)
=12.901 since p<.002.The relationship was also found to be significant and reliable
(Cronbach’s alpha 0.67). On fire safety awareness, the results revealed that 72.9% of
the workers were sufficiently trained on fire safety while 96.8% of workers were
aware of fire safety procedures. On the other hand, 59.0% of the industries had no
fire safety awareness procedures to visitors and only 27.1% had those facilities and
all were from Industrial area and this association was statistically significant with χ2
(df=2) =11.736 since p<.003.The reliability test has revealed that there is a serious
gap in terms of awareness in these facilities with Cronbach’s alpha of 0.496 and
0.541 for workforce and management respectively. On fire safety policy, this
xv
research has found that 72.9% of industries had developed fire safety policy though
only 23.9% of the workers knew the content of the policy document and this were
from Industrial area only. Statistically the association between having the policy
document and knowing the content was significant with χ2= 22.464; df=2 and p at
0.000. This research has reported good fire safety preparedness with presence of
escape routes and enough fire extinguishers at 100% as well as presence of assembly
point and alarm system at 99%. On establishment of firefighting team, this study has
found that 71.4% of managers had put the teams in place with 90.0% from Industrial
area and 10.0% from Kariobangi light industries, this relationship had statistical
significance of χ2 (df=2) =17.52 since p<.000 at 95% confidence level and the
obtained data was found to be reliable (Cronbach’s alpha of 0.842) On the other
hand, there was poor preparedness in evacuation of disabled (18.8%), installation of
fire suppression (23.9%), fire detection (37.6%) and emergency lighting (31.2%).The
reliability test Cronbach’s alpha of 0.648 has shown that the above factors had direct
impact on the factories preparedness in case of fire incidence and non- adherence
will result to a major catastrophe which the DOSHS should address immediately.
The study also revealed that all workplaces (100%) had escape routes but 11.9% of the
industries had obstructed the escape routes which is a fire risk factor during
evacuation. On Compliance to DOSHS fire safety regulations, the study revealed that
over 60% of industries had poor compliance but on fire audit slightly more than half
(58.20%) carries out fire audits annually and inspects fire alarm system regularly
(66.4%).This data was found to be reliable (Cronbach’s alpha of 0.819) in terms of
the data obtained from the factories on how the sector was run and the only
challenges were found to be on enforcement. On factors affecting implementation of
fire risk reduction rules, the respondent reported that there was lack of; Information
on fire safety, comprehensive fire safety policy, support from management,
appropriate technology as well as skilled workforce and this was found to be
statistically reliable based on Cronbach’s alpha value of 0.830. The overall level of
compliance to fire risk reduction rules was found to be average on fire safety measures,
awareness and preparedness. However, significant number of industries had low
compliance levels hence regular inspection by the relevant agencies is recommended.
Owing to high risks of fire from the flammables, it’s recommended that daily fire risks
assessments on job assigned be emphasized to help identify fire risks and control them.
1
CHAPTER ONE
INTRODUCTION
1.1 Background of the study
Workplace fires remains the single most threat to safety in majority of Workplaces
worldwide. Statistics have revealed that in the industrial world, there are still
typically 10 to 20 fire deaths per million population per year (Stellman, 2004). The
direct fire losses are 0.1 to 0.2% of GNP and the total cost of fire prevention and
consequences of fire are typically 10 times the cost of direct losses (Matti, 1996).
Fire has been identified as the greatest challenge to the safety of not only the
industrial plants but in all workplaces in Kenya (Kelvin, 2009). The exposure to fire
risk remains the single most threat to safety in majority of workplaces worldwide. In
USA, 116,500 fires occurred in non- residential structures which include retail stores
resulting to 105 deaths and 1350 injuries in 2007 (U.S. Fire Administration, 2008). In
rapidly developing countries Kenya being one of them, the number of fires is
increasing at a rate of at least as high as the growth rate of economy (Matti, 1996).
According to Thomson (2004) the causes of many fires especially in the workplace
may be accidental or as a result of a deliberate act on the part of employee. In
addition to this, carelessness at work or failure to comply with the regulations on fire
safety has been a cause of catastrophic fires that has led to destruction of properties
and loss of life.
In Kenya, there is very little information on fire incidents, most being highlighted in
the media and are available in fire brigade centers, Kenya insurers and security firms
especially when they are involved in putting off the fires and compensation of fire
losses. According to the Association of Kenya Insurers annual report (2016), the net
incurred claims for fire industrial class was at 1,145,470,394 shillings with technical
loss ratio of 48.4%. The Fire industrial claims have been rising steadily in the past
four years. In year 2012 - 2015 the net claims incurred for industrial fires was at
699,646,017 shillings, 798,299,859 shillings, 828,307,032 shillings and
1,145,470,394 respectively with technical loss ratio of 45.3%, 41.3 %, 42.1 % and
2
48.4% in that order. This shows yearly increment in industrial fire claims. (AKI,
2016). The financial cost of fires is estimated to run into billions of dollars hence the
need to manage fires at work (Schifiliti, 2003).
The shrinking of public sector resources for the fire safety management almost
everywhere means a decrease in firefighting resources and rescue personnel.
Workplaces are then left to fend for themselves and the best way is to make sure that
the fire prevention strategies are up to date and effective in the event of fire
occurrence. (Karanja, 2012)
Out of the many fire occurrences experienced in most of manufacturing industries,
paint industry is among the top according to Nairobi fire brigade database, 2016.
This can be attributed to the flammability nature of the solvents used, the products
being produced, storage of the products as well as lack of proper structured fire
safety management systems in the industry.
This study is aimed at determining fire risks; fire preventive measures in place, fire
safety awareness, and fire preparedness in paint industries and also identify fire
safety technicalities that may be causing fire.
1.2 Problem statement
Paint industry in Kenya, has been growing rapidly in recent years because of massive
construction and infrastructural development which requires paint as one of their
material/products to be used; however, the growth has not been in tandem with
growth of various aspects of safety standards. The growth has resulted to
mushrooming of unregulated paint juakali industries to catch on the high demand of
paints without following fire safety regulations. Also in the established paint
industries, there is lack of proper fire safety disaster management systems in
workplaces.
In the recent years, the Kenyan workplaces have experienced unprecedented cases of
fire disasters. This has led to loss of lives, life threatening injuries, loss of business
and investment opportunities (karanja, 2012).
3
Fire safety is a major pillar in any health and safety management system. Lack of
proper management system can be attributed to various internal and external factors
that include; lack of comprehensive legislation to manage safety and health, failure to
maximize the use of appropriate technology to prevent fire outbreaks and or
minimize fire spread. Most of the paint industries workers especially the informal
industries lack basic fire safety awareness as well as have a weak or non-existent
enforcement of statutory stipulations by authorities with the mandate to enforce fire
safety legislation. The result of this is that fire related injuries and loss of properties
continue to impact negatively to the operations of the industry.
In Kenya, the paint industry is not well regulated and as a result there are many
informal industries which pose risks to the workers, owners as well as customers.
Lack of proper safety regulation pose a risk to the standard of safety and quality. The
issue of safety in workplaces is guaranteed by the constitution of Kenya (KLR, 2010)
and as a result measures need to be put to guarantee safety to all persons. Paint
industry is part of growth in industrialization and there is need to emphasis the
creation of awareness in Occupational safety and health as stipulated in second
medium term plan, 2013-2017 of vision 20-30.
With the rapid growth in industrialization, many fire accidents have been reported
(NCC, 2016) as a result of paint manufacturing, processing or storage as well as the
mushrooming of unregulated informal paint industries and it is for this reason this
study was carried out to establish the extent to which the fire safety compliance is
being implemented.
1.3 Hypothesis
1.3.1 Null Hypothesis
Fire safety compliance measures undertaken by paint industries in Nairobi have not
led to reduction in fire incidences.
4
1.4 Justification and significance of the study
Fire has been identified as the greatest challenge to the safety of not only the
industrial plants but in all workplaces in Kenya (Kelvin, 2009). Fire Safety is an
important element of any development as people’s lives, properties and investments
are put at risk in the event of fire outbreaks.
Over 70% of paint industries in Kenya are found in Nairobi Industrial area and its
surrounding (DOSHS Data base). There has been a rise in the number of fires in
Kenya and this has resulted to damage to properties, injuries and loss of lives. Out of
the fire occurrences in manufacturing industries, paint industry fires are among the
highest (Nairobi fire brigade database) hence the need to minimize occupational fire
hazards and prevent fire injuries in these industries. This justifies the study to help
reduce the problem of fire occurrences especially in Nairobi.
A lot of research has been done on fire safety in schools, universities (Macharia,
2013), supermarkets (Karanja, 2012) among other areas, however there is no
research done on fire safety in paint industry and as a result there is little information
known in this field hence the importance of this research.
1.5 Research questions
In research, the research questions are normally used to guide in generating specific
questions and answers for a particular area where open ended questions are used to
generate data.
Since paint industry is very broad and involves both formal and informal sectors,
research questions were used to find out what fire safety risks, measures and
preparedness are in place and determine the compliance level with the fire risk
reduction rules. In the current work, the question formulated sought to establish
current practices and the regulation in place and their implementation.
1. What are the fire safety risks in paint industries?
2. What are the fire safety and awareness measures put in place to mitigate against
the fire risks?
5
3. What is the level of fire safety preparedness?
4. What are the fire safety compliance gaps with regard to the fire risk reduction
rules legal notice 59?
1.6 Research Objectives
1.6.1 General objectives
The main objective of the study is to evaluate fire safety compliance in paint
industries as stipulated in fire risks reduction rules Legal Notice 59 under
Occupational Safety and Health Act 2007
1.6.2 Specific Objectives
1. To assess the fire safety risks in Nairobi paint industries.
2. To establish the Fire safety and awareness measures put in place.
3. To determine the level of fire safety preparedness in case of fire accidents
/incidences.
4. To establish the compliance levels in adherence to the Fire Risk Reduction
Rules Legal Notice 59.
1.7 Scope of the study
The study focused on two main regions within Nairobi Region. These are Industrial
area and Kariobangi light industries which have most of the paint industries in the
county. This study commenced in August 2014.The study covered thirty registered
paint manufacturers and distributors within Nairobi. Twenty-three of them were
sampled from Industrial area while the other seven were sampled from Kariobangi
light industries.
1.8 Conceptual framework
Conceptual framework is a tool in research that aids a researcher to better
comprehend the phenomenon that is under the study (Kisilu & Tromp, 2006).
6
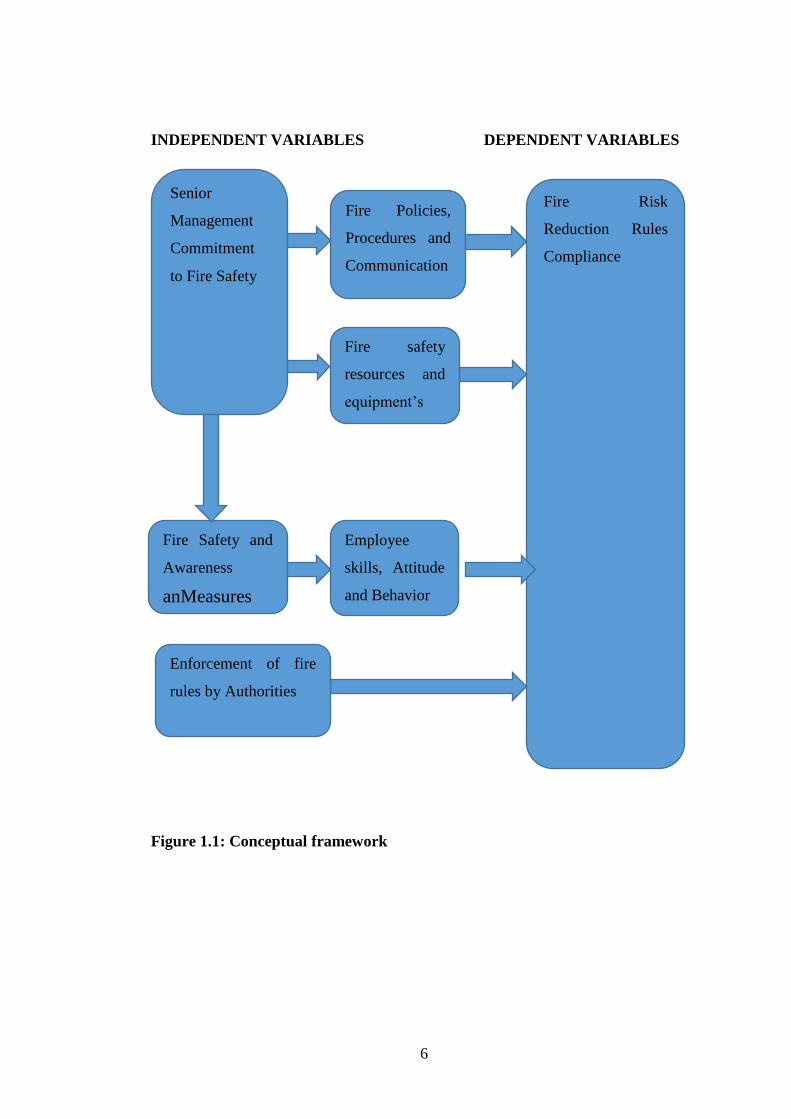
INDEPENDENT VARIABLES DEPENDENT VARIABLES
Figure 1.1: Conceptual framework
Fire Risk
Reduction Rules
Compliance
Fire Policies,
Procedures and
Communication
Senior
Management
Commitment
to Fire Safety
Fire Safety and
Awareness
anMeasures
Employee
skills, Attitude
and Behavior
Enforcement of fire
rules by Authorities
Fire safety
resources and
equipment’s
7
CHAPTER TWO
LITERATURE REVIEW
2.1 History of Fire Occurrences
Kenyan market has a number of players in the paint industry. The paint market
experiences very stiff competition with the top three companies; Crown Paints,
Basco Paints and Sadolin Paints taking a larger market share than others.
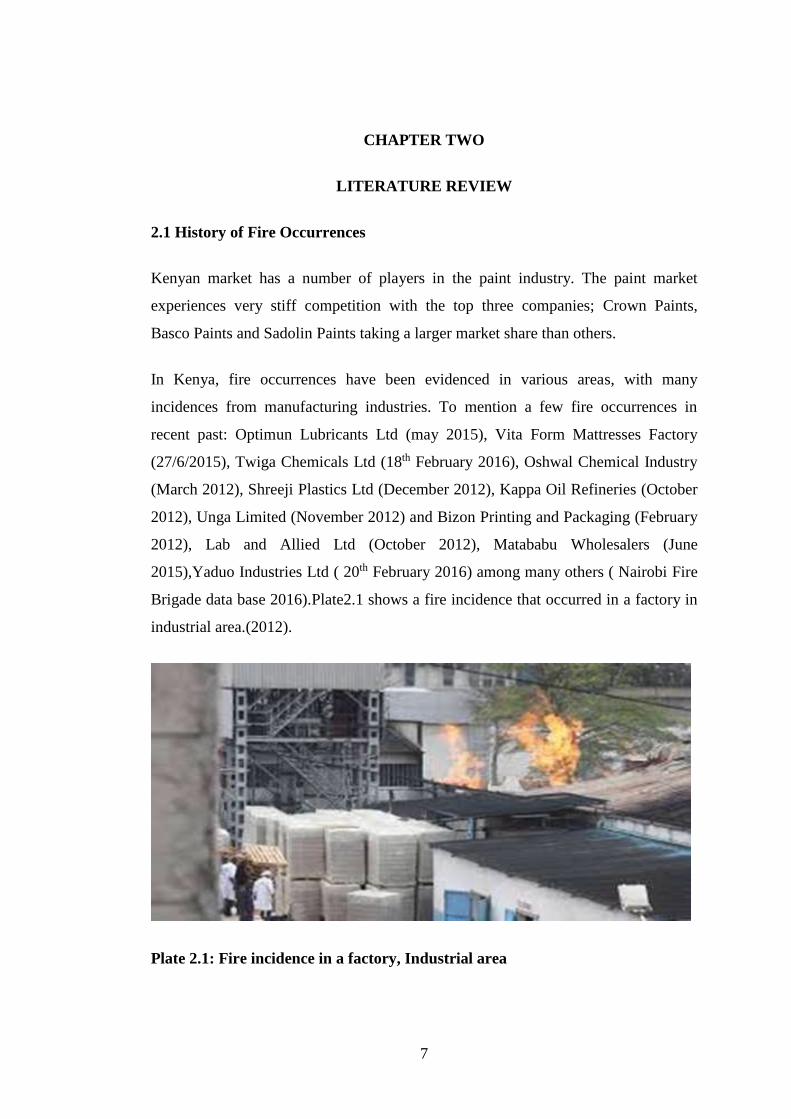
In Kenya, fire occurrences have been evidenced in various areas, with many
incidences from manufacturing industries. To mention a few fire occurrences in
recent past: Optimun Lubricants Ltd (may 2015), Vita Form Mattresses Factory
(27/6/2015), Twiga Chemicals Ltd (18th February 2016), Oshwal Chemical Industry
(March 2012), Shreeji Plastics Ltd (December 2012), Kappa Oil Refineries (October
2012), Unga Limited (November 2012) and Bizon Printing and Packaging (February
2012), Lab and Allied Ltd (October 2012), Matababu Wholesalers (June
2015),Yaduo Industries Ltd ( 20th February 2016) among many others ( Nairobi Fire
Brigade data base 2016).Plate2.1 shows a fire incidence that occurred in a factory in
industrial area.(2012).
Plate 2.1: Fire incidence in a factory, Industrial area
8
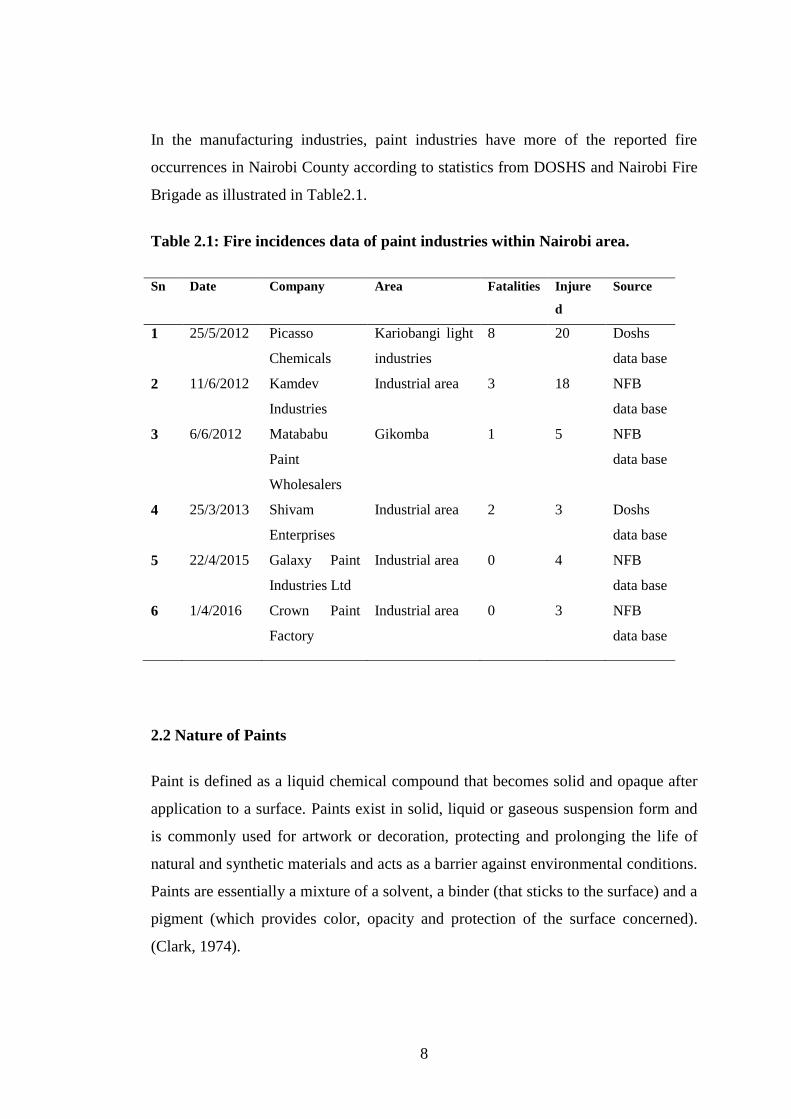
In the manufacturing industries, paint industries have more of the reported fire
occurrences in Nairobi County according to statistics from DOSHS and Nairobi Fire
Brigade as illustrated in Table2.1.
Table 2.1: Fire incidences data of paint industries within Nairobi area.
Sn Date Company Area Fatalities Injure
d
Source
1 25/5/2012 Picasso
Chemicals
Kariobangi light
industries
8 20 Doshs
data base
2 11/6/2012 Kamdev
Industries
Industrial area 3 18 NFB
data base
3 6/6/2012 Matababu
Paint
Wholesalers
Gikomba 1 5 NFB
data base
4 25/3/2013 Shivam
Enterprises
Industrial area 2 3 Doshs
data base
5 22/4/2015 Galaxy Paint
Industries Ltd
Industrial area 0 4 NFB
data base
6 1/4/2016 Crown Paint
Factory
Industrial area 0 3 NFB
data base
2.2 Nature of Paints
Paint is defined as a liquid chemical compound that becomes solid and opaque after
application to a surface. Paints exist in solid, liquid or gaseous suspension form and
is commonly used for artwork or decoration, protecting and prolonging the life of
natural and synthetic materials and acts as a barrier against environmental conditions.
Paints are essentially a mixture of a solvent, a binder (that sticks to the surface) and a
pigment (which provides color, opacity and protection of the surface concerned).
(Clark, 1974).
9
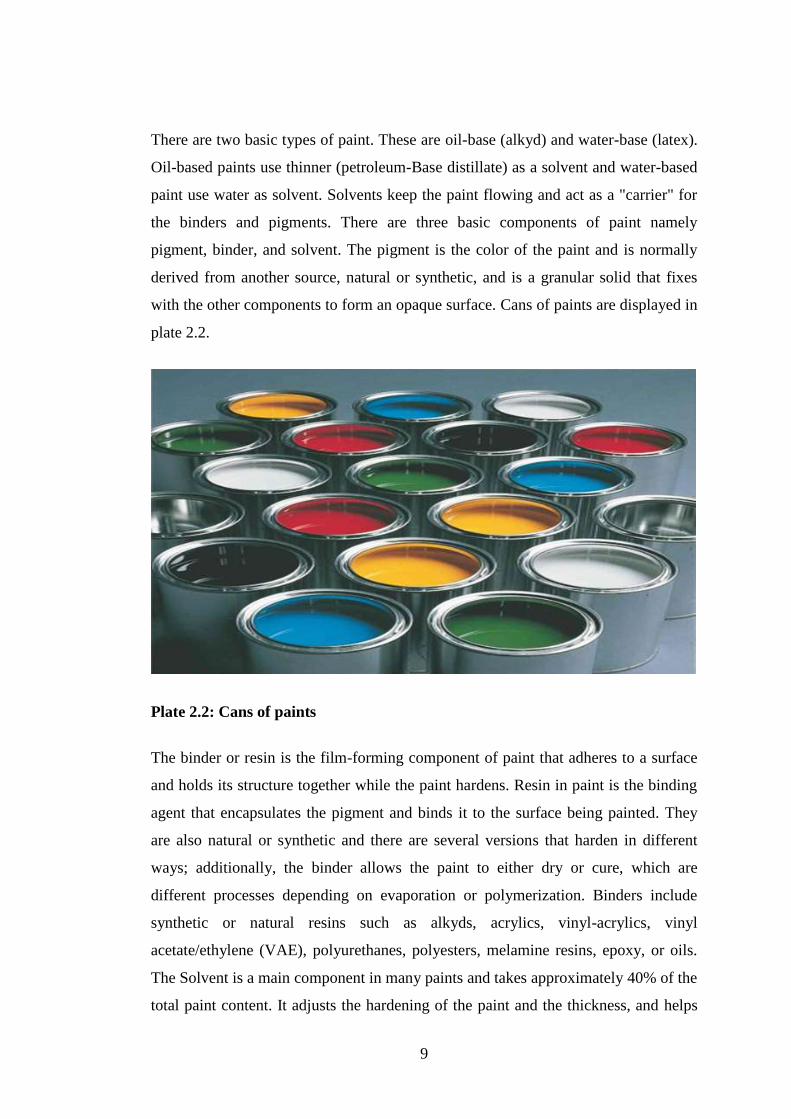
There are two basic types of paint. These are oil-base (alkyd) and water-base (latex).
Oil-based paints use thinner (petroleum-Base distillate) as a solvent and water-based
paint use water as solvent. Solvents keep the paint flowing and act as a "carrier" for
the binders and pigments. There are three basic components of paint namely
pigment, binder, and solvent. The pigment is the color of the paint and is normally
derived from another source, natural or synthetic, and is a granular solid that fixes
with the other components to form an opaque surface. Cans of paints are displayed in
plate 2.2.
Plate 2.2: Cans of paints
The binder or resin is the film-forming component of paint that adheres to a surface
and holds its structure together while the paint hardens. Resin in paint is the binding
agent that encapsulates the pigment and binds it to the surface being painted. They
are also natural or synthetic and there are several versions that harden in different
ways; additionally, the binder allows the paint to either dry or cure, which are
different processes depending on evaporation or polymerization. Binders include
synthetic or natural resins such as alkyds, acrylics, vinyl-acrylics, vinyl
acetate/ethylene (VAE), polyurethanes, polyesters, melamine resins, epoxy, or oils.
The Solvent is a main component in many paints and takes approximately 40% of the
total paint content. It adjusts the hardening of the paint and the thickness, and helps
10
to carry the other components. It usually evaporates in the drying or curing process
and does not affect the color or opacity of the paint. Some of the solvents used in
paints are toluene, xylene, carbon tetrachloride, perchloroethylene, isopropyl alcohol,
cyclohexanol, n-amyl acetate, methyl ethyl ketone, cyclohexane and methylene
chloride. Paints can have various combinations of organic solvents as the diluent,
including aliphatic, aromatics, alcohols, ketones and white spirit. Specific examples
are organic solvents such as petroleum distillate, esters, glycol ethers, and the like.
Sometimes volatile low-molecular weight synthetic resins also serve as diluents.
(Waldie & John, 1983).
The main purposes of the solvents or diluent are to dissolve the polymer and adjust
the viscosity of the paint. It is volatile and does not become part of the paint film. It
also controls flow and application properties, and in some cases can affect the
stability of the paint while in liquid state. Its main function is as the carrier for the
non-volatile components. To spread heavier oils (for example, linseed) as in oil-
based interior house paint, thinner oil is required. These volatile substances impart
their properties temporarily. Once the solvent has evaporated, the remaining paint is
fixed to the surface. A low boiling point is a desired property in many applications in
which solvents are used, because the solvent must evaporate in order to leave behind
the required film of coating, or of adhesive. But the fact that solvents may have a low
boiling point may mean that they produce vapors at ambient temperatures which can
ignite if the storage and process conditions are not suitably controlled. The volatility
nature of the paint solvents is what makes the paint industries have high fire risks.
Paint manufacturing companies seems to be fire-traps because they store a lot of
highly flammable materials. In case of a fire occurrence, it becomes a big challenge
to put it off. In addition their storage in the industries is wanting hence these kind of
buildings collapse in minutes putting not only the firefighters’ lives at risk by making
evacuation a dangerous undertaking but also the loss is monumental due to the
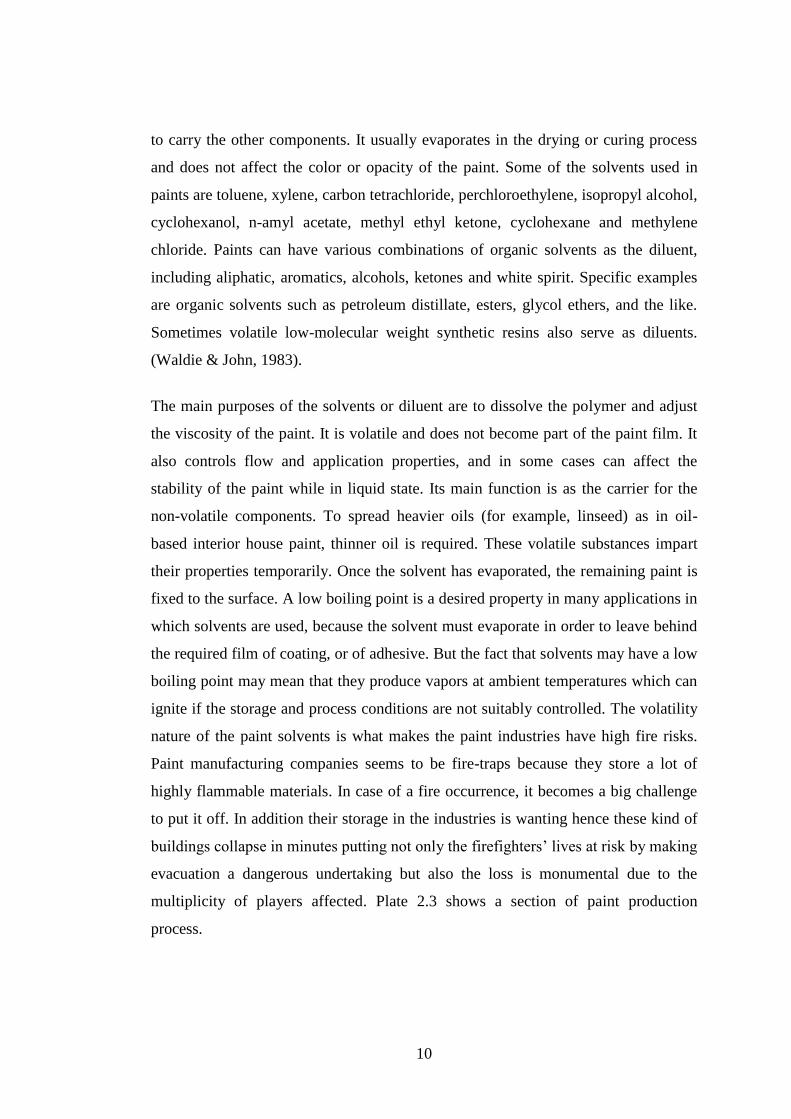
multiplicity of players affected. Plate 2.3 shows a section of paint production
process.
11
Plate 2.3: Paint production Process
Due to high volatility nature of the solvents, a catalytic reaction can create a fire or
explosion (for example, when two-pack epoxy paints are mixed and this creates
heat). Fires may also be started by incorrectly stored flammable materials, paint and
solvent soaked rags, or a buildup of paint residue in work areas or on equipment.
Other Possible sources of ignition may include lit cigarettes, abrasive grinding
wheels and other equipment that produces sparks, combustion motors, welding
torches, hot surfaces, electrical short circuits, static electricity and portable electrical
equipment like mobile phones among others. The fire-causing potential of solvents
can be classified as "extremely flammable," "flammable," combustible," or "non-
flammable." Extremely flammable means that even in cold weather (below -
6.667°C), the presence of a flame, spark, or even static electricity can cause the
solvent vapors to ignite. Flammable solvents can cause a flash fire in the range of
room temperature (below 37.778°C), while combustible solvents must be heated
above room temperature to ignite into flame. There is danger of fire and explosion
where paints which contain flammable solvents are being used. This means naked
flames, cutting and welding torches, gas fired heaters and materials which may give
off sparks, whether electrical, mechanical, friction or static should not be near the
12
paints. Also, most Paint removers are flammable, they are a mixture of different
solvents whose combined fire-causing potential is usually stated on product labels.
(Waldie & John, 1983).
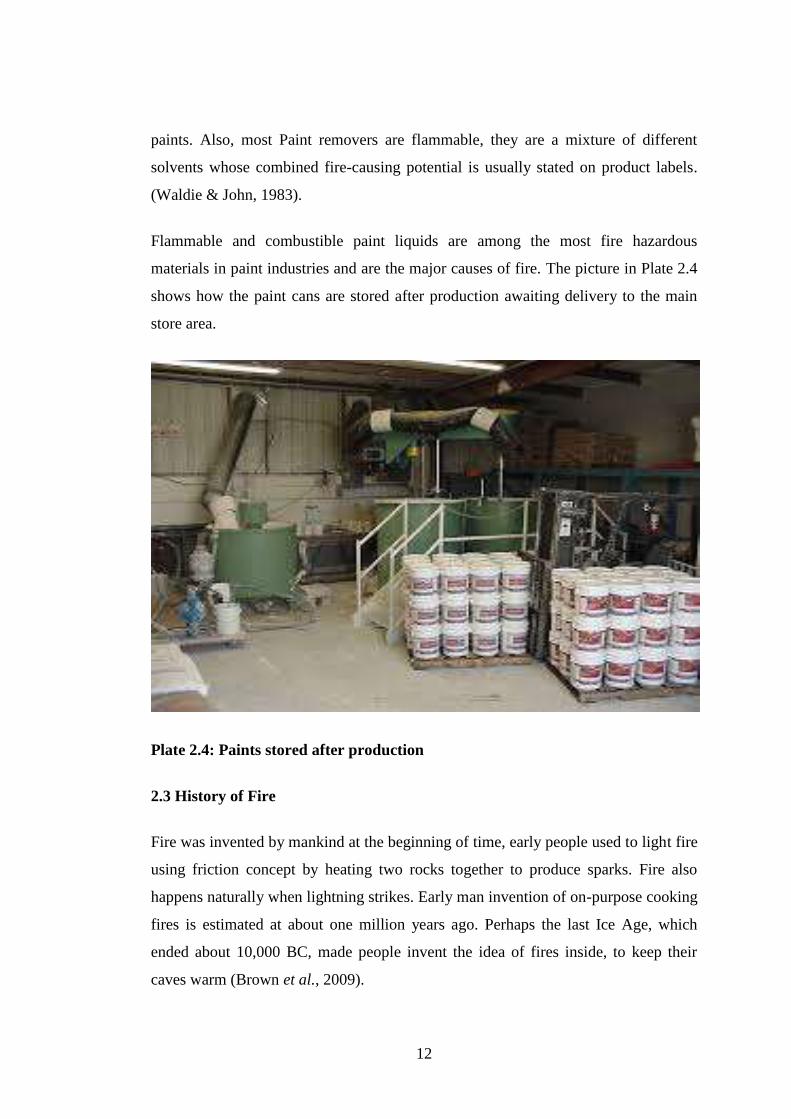
Flammable and combustible paint liquids are among the most fire hazardous
materials in paint industries and are the major causes of fire. The picture in Plate 2.4
shows how the paint cans are stored after production awaiting delivery to the main
store area.
Plate 2.4: Paints stored after production
2.3 History of Fire
Fire was invented by mankind at the beginning of time, early people used to light fire
using friction concept by heating two rocks together to produce sparks. Fire also
happens naturally when lightning strikes. Early man invention of on-purpose cooking
fires is estimated at about one million years ago. Perhaps the last Ice Age, which
ended about 10,000 BC, made people invent the idea of fires inside, to keep their
caves warm (Brown et al., 2009).
13
2.4 The Science of Fire
Fire is a process of combustion in which energy is released in form of heat and light.
Fire is the rapid oxidation of a material in the exothermic chemical process of
combustion, releasing heat, light, and various reaction products. The combination of
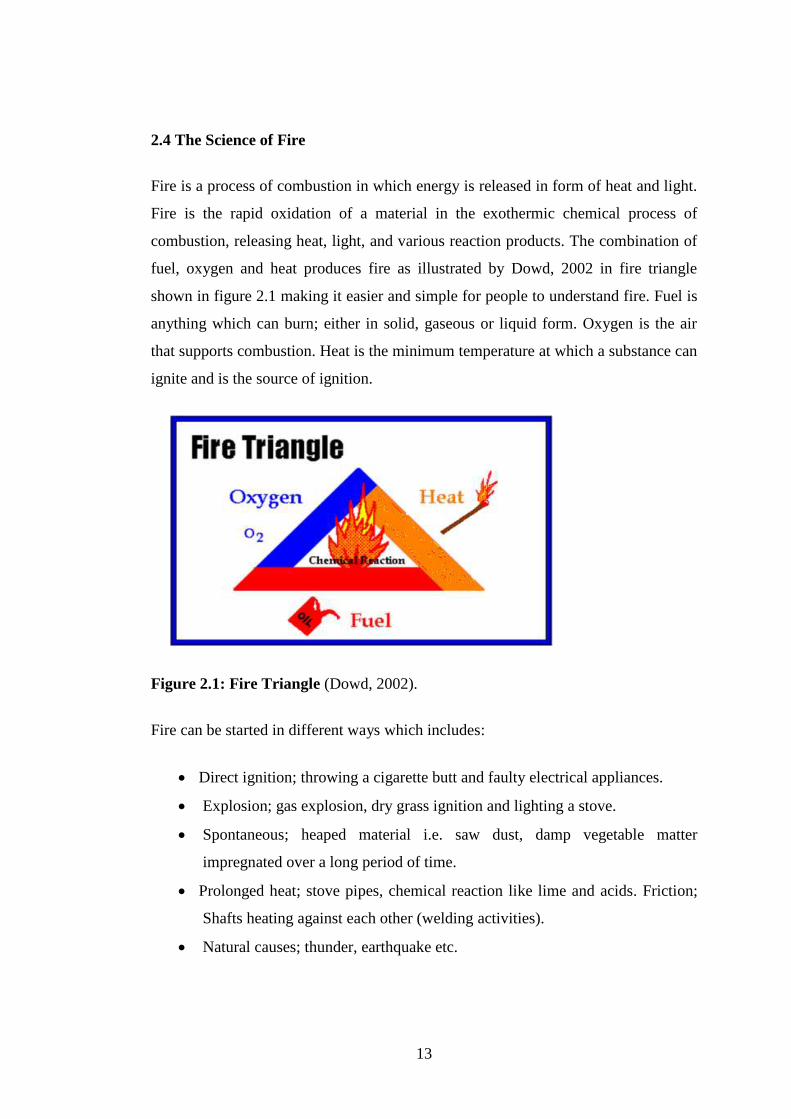
fuel, oxygen and heat produces fire as illustrated by Dowd, 2002 in fire triangle
shown in figure 2.1 making it easier and simple for people to understand fire. Fuel is
anything which can burn; either in solid, gaseous or liquid form. Oxygen is the air
that supports combustion. Heat is the minimum temperature at which a substance can
ignite and is the source of ignition.
Figure 2.1: Fire Triangle (Dowd, 2002).
Fire can be started in different ways which includes:
Direct ignition; throwing a cigarette butt and faulty electrical appliances.
Explosion; gas explosion, dry grass ignition and lighting a stove.
Spontaneous; heaped material i.e. saw dust, damp vegetable matter
impregnated over a long period of time.
Prolonged heat; stove pipes, chemical reaction like lime and acids. Friction;
Shafts heating against each other (welding activities).
Natural causes; thunder, earthquake etc.
14
2.5 Classes of Fire
Kenya has classified fire into four major classes according to fire risk reduction rules
namely A, B, C and D (GOK, 2007). Class A are fires involving ordinary
combustible materials such as wood, paper, and rubbish. Class B are fires involving
flammable liquids which includes petrol, oil, grease, paints and thinners among
others. Class C are fires involving flammable gases which include butane, acetylene
gas, L.P.G, propane among others. Class D are fires involving burning of flammable
and inflammable metals e.g. Potassium, Titanium, Zirconium, Lithium, and Sodium.
Class E are fires involving electrical equipment e.g. computers printers, photocopiers
among others.
2.6 Fire Extinguishing
Once fire has started, unless it is extinguished the next step is to spread and can do so
in the following ways: Convection; which is circulation of super-heated gases e.g.
liquids, smoke. Radiation; which is heat transmission through space e.g. from sun to
earth and Conduction; which is heat energy traveling through solid materials e.g.
through metals.
The combustion process continues in a chain reaction until one of the components is
insufficient to support the reaction that’s when the fire goes off. To suppress fire, one
of the three components that supports fire must be removed or eliminated. This may
be done by cooling (lowering temperature), smothering (separating oxygen from fuel
and heat) or by starvation (removing the fuel burning).
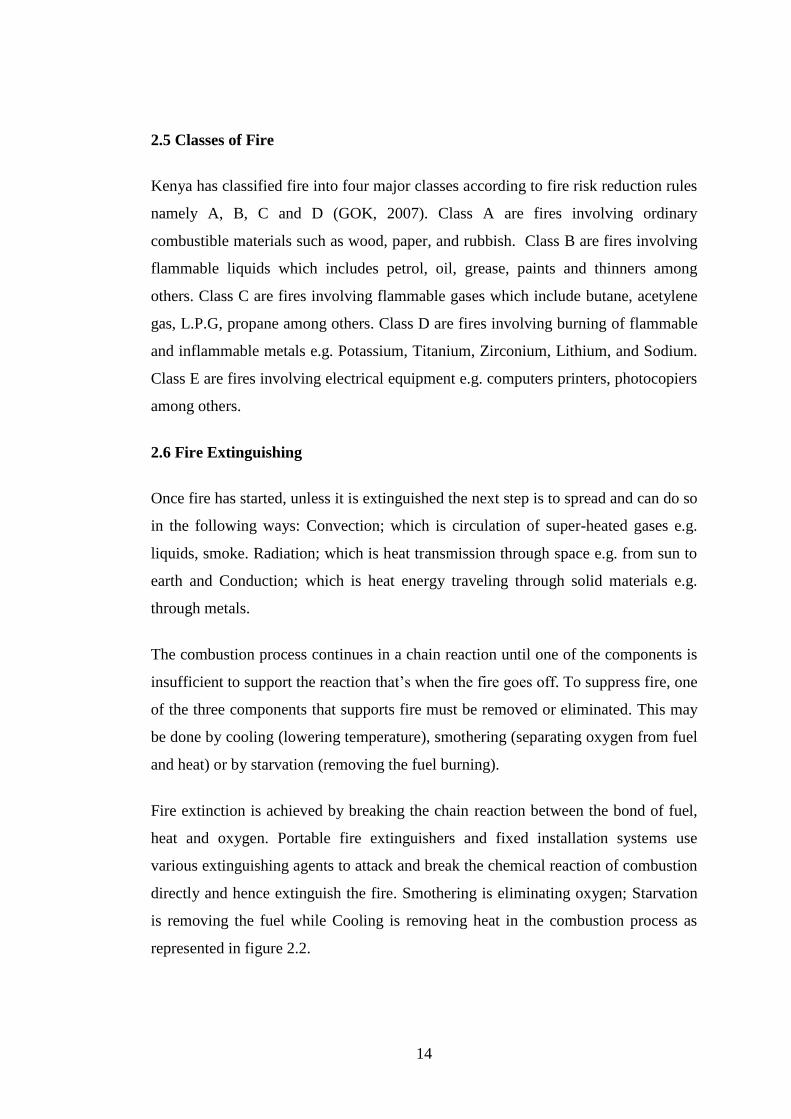
Fire extinction is achieved by breaking the chain reaction between the bond of fuel,
heat and oxygen. Portable fire extinguishers and fixed installation systems use
various extinguishing agents to attack and break the chemical reaction of combustion
directly and hence extinguish the fire. Smothering is eliminating oxygen; Starvation
is removing the fuel while Cooling is removing heat in the combustion process as
represented in figure 2.2.
15
Heat -Cooling (Water) Oxygen- Smothering
(Blanketing)
Fuel -Starvation (Physical removal)
Figure 2.2: Fire Extinguishing Triangle
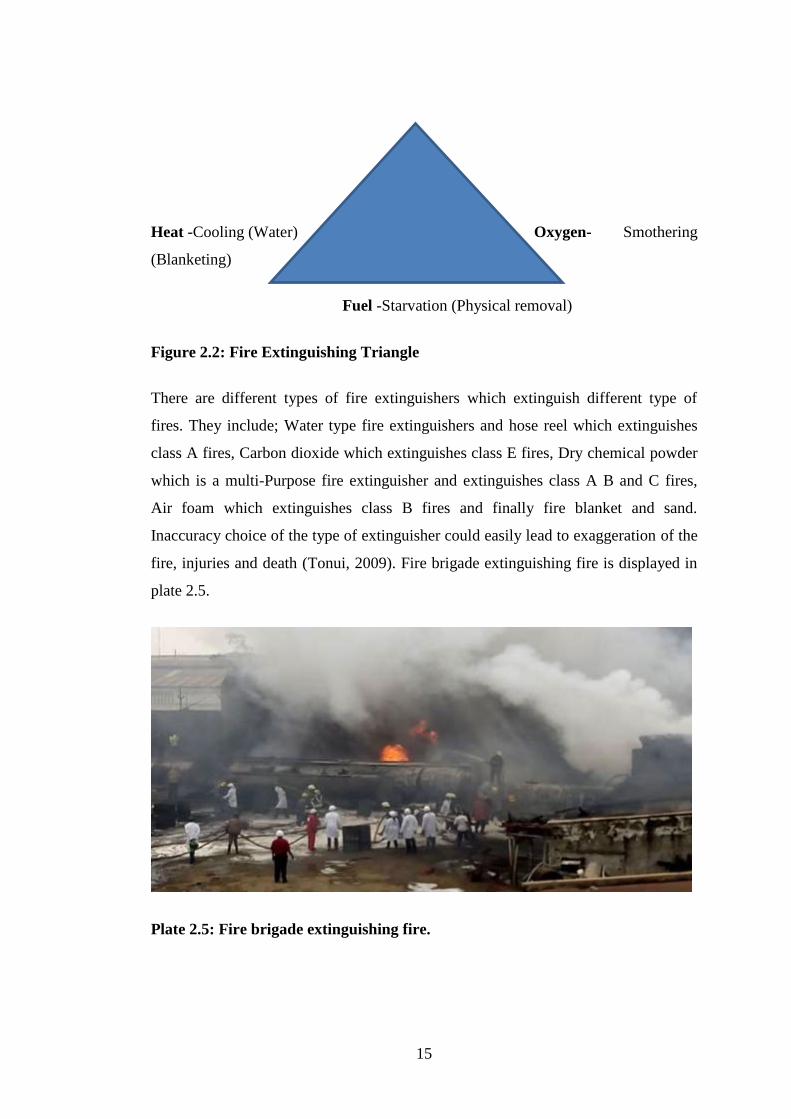
There are different types of fire extinguishers which extinguish different type of
fires. They include; Water type fire extinguishers and hose reel which extinguishes
class A fires, Carbon dioxide which extinguishes class E fires, Dry chemical powder
which is a multi-Purpose fire extinguisher and extinguishes class A B and C fires,
Air foam which extinguishes class B fires and finally fire blanket and sand.
Inaccuracy choice of the type of extinguisher could easily lead to exaggeration of the
fire, injuries and death (Tonui, 2009). Fire brigade extinguishing fire is displayed in
plate 2.5.
Plate 2.5: Fire brigade extinguishing fire.
16
2.7 Fire Prevention and Protection
Fire prevention is taking beforehand actions that may curb fire from occurring. It
involves making sure fire risks are controlled not to cause fire at any given time.
Protection involves safeguarding people or property to ensure there is no harm or
damage which may be caused by fire occurrence.
Fire prevention and protection are ways that help to control fire from happening and
incase it happens the damage is controlled as well. This can be achieved by
conducting fire risk assessments to help identify fire risks in the workplaces and put
measures in place to reduce or control fire incidences.
Some ways of preventing fires in workplaces include;
Regularly inspecting, testing and maintaining electrical installations and
appliances.
Ensuring machines are regularly inspected and maintained to avoid frictional
heat.
Keeping flammable materials in isolation and ensuring any flammables leaks
or spillages are cleaned up immediately.
Restricting smoking to suitable designated areas.
Ensuring there is adequate security to prevent arson attack.
In the event of a fire, Fire detection is very important in warning people at early stage
of fire hence able to extinguish it before it causes a lot of damage. They are designed
to both detect a fire in its early stages and provide adequate warning to all occupants
so that safe escape can be achieved (U.S. Department of Labour, 2001). Fire
detection systems, fire suppression systems, fire alarm systems together with
emergency lighting installations should be installed and well maintained in
workplaces to ensure fire protection.
Escape signage should be clearly visible from all locations in the workplace and the
signages on the fire exit doors prominently displayed (HMSO, 1999). The escape
17
routes should be clear of obstruction to ensure evacuation is easier hence protect
people and property from more damages.
The workplaces should have well trained firefighting team to assist in evacuation of
persons and help in putting off the fire. People should not be allowed back to the
building on fire or even collect personal belongings unless clear escape is obvious.
All persons should proceed to the assembly point for roll-call (Gold & Kogi, 1994).
All the above fire prevention and protection activities can easily be implemented by
establishment of a Fire Safety Programme that includes inspections, fire drills, fire
training, management procedures and communication.
Fire drill is an important exercise for instilling skills on evacuation procedures and
consequences of fire are completely avoidable if safety requirements are observed.
Training must meet the goal of reducing the number of fires and thus reduce
death and injury among workers, and the financial loss on organizations (Cote,
1991).
2.8 Legislative Provisions on Fire safety.
Fire safety in factories started long time under Factories and Other Places of Work
Act, which was then amended to occupational safety and health Act, 2007. Fire Risk
Reduction Rules Legal notice LN 59 of 2007 is a subsidiary rule in the OSH act
2007. The legislation provides fire safety guidelines to ensure enough fire safety
management to all workplaces.
On location and storage of highly flammables, the law requires to be kept in
designated areas, be in limited amounts and stored in fire resistant
receptacles.(Section four to eight of the rules).
On labelling and marking: flammable substances should be marked with bold letters
and no smoking signs placed in strategic visible positions. According to Kennedy
(2003) the purpose of stringent standards for storage of highly flammable standards
is to prevent the spread of fire either to the material or from the material during an
outbreak.
18
Ventilation is paramount and the legislation provides for adequate free flow of fresh
air in section eleven and if this is not possible, a provision of exhaust ventilation
system is necessary. The construction materials of the building should be made of
fire resisting structures and able to withstand the fire and smoke for a while for
purposes of evacuation as prescribed in section five.
On housekeeping, section thirteen and fourteen directs proper housekeeping which
should be maintained and passageways not obstructed at any given time. Finished
products, by-products and waste should be removed from the workroom immediately
they are produced. Fire exists should have clear signage’s and not obstructed.
The legislations also provide for the establishment of firefighting team in all
workplaces. The fire team together with all other workers must be trained on proper
use of firefighting appliances and evacuation procedures. The firefighting team must
also undergo basic training on firefighting and first aid as explained in section twenty
to twenty-two.
A Fire drill must be carried out at least once every Twelve months and workplaces
should have assembly point(s) where all persons can be accounted for after an
evacuation, they should be designated and known by all workers as specified in
section twenty-three and twenty-four.
The legislation directs in section twenty-nine to thirty-two that Firefighting
appliances should be maintained and inspected. Testing of fire extinguishers
cylinders to be carried out every twelve months and should be selected for the correct
class of fire depending on the type of combustible materials in the workplace.
In section thirty-three and thirty-four, the law guides on color coding of pipes for
identification purposes hence pipes carrying water should be red in color and should
be connected to a water storage tank of at least ten thousand liters of water for
fighting fire. The law also requires fire safety audit to be carried out annually in all
workplaces by an approved fire safety auditor.
19
Fire Safety policy should be formulated by all workplaces to show the commitment
of the senior management on its implementation in writing and signed. The policy
must have evacuation procedures, maintenance and inspection of firefighting
appliances, training of workers and assignment of responsibilities as directed in
section thirty-four and thirty-six. For effective evacuation procedure during a fire
emergency, means of communication in form of alarms and signage’s that do not
depend on regular power should be provided. Fire Detection Systems such as Smoke
and fire detectors should be connected to audible and visual flashing devices to easily
notify people on the fire occurrence.
Other laws with Fire Safety Provisions include Section 154 of Local Government
Act, Cap 265 which mandates local authorities to guide businesses and workplaces in
taking necessary steps for prevention and extinguishing fires.
Sections two hundred and eleven to two hundred and four of the Local Government
(Adoptive Laws) (Building) Order of 1968 provides for fire resistance in all
buildings. It gives specifications of internal walls for fire resistance and management
of fires in buildings through the provision of means of escape in case of fire. Sections
thirty-one and ninety-eight of the Energy Act, No. 12/2006 provide for safe
transportation of petroleum and petroleum products. Environmental, health and
safety laws also give permits and licenses for electrical energy, petroleum and natural
gas handlers who are subject to compliance.
Sections ninety-three to ninety-six of Explosives Act, Cap one hundred and fifteen
regulate restrictions on manufacture, storage, importation, exportation, movement
and usage of explosives and the management of fires arising from them in
accordance with the act which is enforced by the ministry of environment and
mineral resources.
Section forty-nine of the Standards Act, Cap 496 mandates Kenya Bureau of
Standards (KEBS) to assist and cooperate with the Government, Local Authorities
and any other public body in preparation, framing and securing the adoption and
practical application of any specifications or codes of practice. In regard to fire
safety, there are standards on transportation of fuel and other flammable materials
20
including safe handling of gas cylinders, firefighting equipment for example the
automatic electrical fire alarm systems standards and personal protective equipment
standards.
The Safety Standards Manual for Schools developed by the Ministry of Education in
2008 provides specifications on the building of dormitories and classrooms among
other measures to prevent deaths in schools. In the manual, every school need to set
up a safety committee to look into all safety measures and schedule practice drill
sessions for fire and other emergencies regularly (Ministry of Education, 2008).
The Public Health Act, Cap 242 under section one hundred and twenty-six A
provides that every council shall make by-laws that require adequate provision for
the escape of the occupants of any building in the event of outbreak of fire.
2.9 Fire risks Assessment.
Fire risk assessment is a careful examination of what, in an individual’s work could
cause fire harm to people so that one can weigh up whether she/he has taken enough
precautions or should do more. The purposes of assessment is to identify the extent
of the fire risk, to assess the likelihood of a fire occurring and thirdly to identify any
additional precautions that may be needed, or control systems that do not function
adequately (HSE, 2006).
Fire risks depends on various factors ranging from type of building, materials
present, people at risk, safety measures in place, people’s perception among others.
The fire risks are combination of low probability with high extent of damage and
though theoretically the damage can occur at any time, it is scarcely to be expected.
Generally, risk assessment is part and parcel of any basic risk management model
(Bischoff, 2008). It involves 4 major steps:
First step is where analysis of the risk is carried out through estimation of the
risk, source identification and evaluation.
21
The second step involves risk treatment or handling where measures dealing
with avoiding the risk, optimizing or reducing it, transferring and/or retaining
the risk are comprehensively analyzed.
The third step is risk acceptance
The fourth step is risk communication.
There are two types of fire risk assessment methods. These are quantitative and semi
quantitative or ranking methods (Engert & Lansdowne, 1999). Quantitative methods
include the CRISP (Computation of Risk Indices by Simulation Procedures),
FiRECAM (Fire Risk Evaluation and Cost Assessment Model), The Building Fire
Safety Evaluation Method (BFSEM), FIERA system (Fire Evaluation and Risk
Assessment), Petri net to Fire Safety Analysis, Fire Risk Assessment with Reliability
Index β and Probabilistic Methods which include Event tree, Fault tree, Decision tree
and Influence tree analyses (European Commission, 2003). Ranking methods or
semi-quantitative methods are used in a wide range of applications. The researcher
first identifies the factors that affect the level of safety or risk, which represents
positive features (increase the level of safety) and negative features (decrease the
level of safety). The importance of each factor has to be decided by assigning a value
then operated by some combination of arithmetic functions to achieve a single value.
The value can be called as “risk index “and is a measure of the level of safety/risk in
the object and it is possible to compare this to other similar objects and to a
stipulated minimum value (European Commission, 2003).An advantage of fire
ranking methods is their simplicity, they are considered as very cost-effective tools.
Another advantage of this method is the structured way in which the decision making
is done. This facilitates understanding of the system for persons not involved in the
development process and makes it easier to implement new knowledge and
technology into the system.
There are a number of ranking methods being used to assess fire risks in different
workplaces, buildings and processes. These includes:
Fire Safety Evaluation System (FSES) is a risk index method which treats
risk and safety separately and is used in health care facilities.
22
Specific Commercial Property Evaluation Schedule commonly used in
insurance industry for buildings.
Dow Fire and Explosion Index (FEI) method which identifies and assesses
thermodynamic properties of the dominant combustible materials in
individual operations or units of a process plant.
Hierarchical approach where Five different “decision making levels” of
hierarchy are used and a matrix of fire safety goals versus more specific fire
safety features is usually constructed.
SIA 81 – Gretener Method which is used to evaluate and compare the level of
fire risk of alternative concepts by grading the elements of a building and
their performance.
Fire Risk Assessment Method for Engineering (FRAME) is for calculating
fire risks in buildings and helps to define a sufficient and cost effective fire
safety concepts.
Fire Risk Index Method which is used for all types of ordinary apartment
buildings is a simple method of deducing the level of safety in buildings and
lastly the Risk Value Matrix Method which has been used in this research
(Mallet & Brnich, 1999).Though the Risk Value Matrix method is based on
semi-quantitative terms the numbers involved are purely relative, so that they
have no absolute significance. The risks are made up to two elements: the
probability that an event will occur and the consequences of that occurrence.
The relative contributions that these two elements make to the risk can vary
considerably.
The overall risk is called risk value and is defined by the simple formula as “Risk
value = fire hazard value x fire risk value”. The size of the risk value becomes the
basis for categorizing the building as being of high, normal or low risk (Health
Service Executive, 2007).
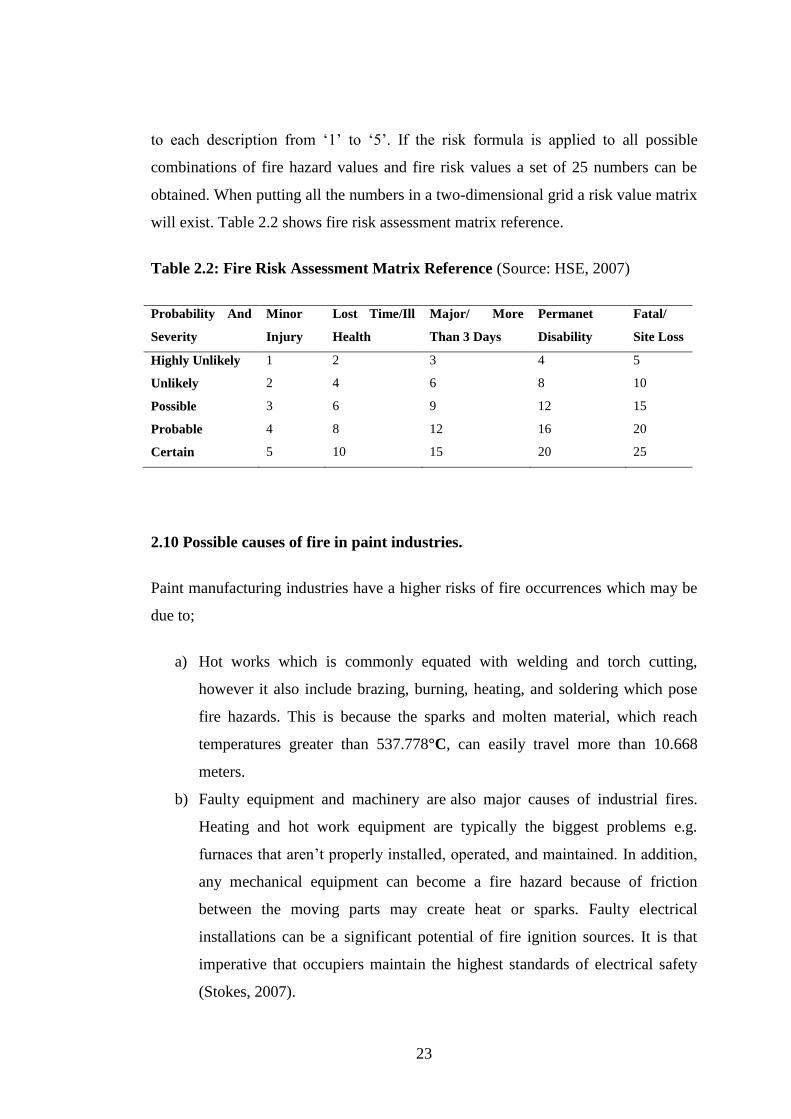
The quantification of fire hazard is done by describing it as being negligible, slight,
moderate, severe and very severe and by assigning numerical values to each
description from ‘1’ to ‘5’. In a similar way fire risks are described as being unlikely,
possible, quite possible, likely and very likely and also by assigning numerical values
23
to each description from ‘1’ to ‘5’. If the risk formula is applied to all possible
combinations of fire hazard values and fire risk values a set of 25 numbers can be
obtained. When putting all the numbers in a two-dimensional grid a risk value matrix
will exist. Table 2.2 shows fire risk assessment matrix reference.
Table 2.2: Fire Risk Assessment Matrix Reference (Source: HSE, 2007)
Probability And
Severity
Minor
Injury
Lost Time/Ill
Health
Major/ More
Than 3 Days
Permanet
Disability
Fatal/
Site Loss
Highly Unlikely 1 2 3 4 5
Unlikely 2 4 6 8 10
Possible 3 6 9 12 15
Probable 4 8 12 16 20
Certain 5 10 15 20 25
2.10 Possible causes of fire in paint industries.
Paint manufacturing industries have a higher risks of fire occurrences which may be
due to;
a) Hot works which is commonly equated with welding and torch cutting,
however it also include brazing, burning, heating, and soldering which pose
fire hazards. This is because the sparks and molten material, which reach
temperatures greater than 537.778°C, can easily travel more than 10.668
meters.
b) Faulty equipment and machinery are also major causes of industrial fires.
Heating and hot work equipment are typically the biggest problems e.g.
furnaces that aren’t properly installed, operated, and maintained. In addition,
any mechanical equipment can become a fire hazard because of friction
between the moving parts may create heat or sparks. Faulty electrical
installations can be a significant potential of fire ignition sources. It is that
imperative that occupiers maintain the highest standards of electrical safety
(Stokes, 2007).
24
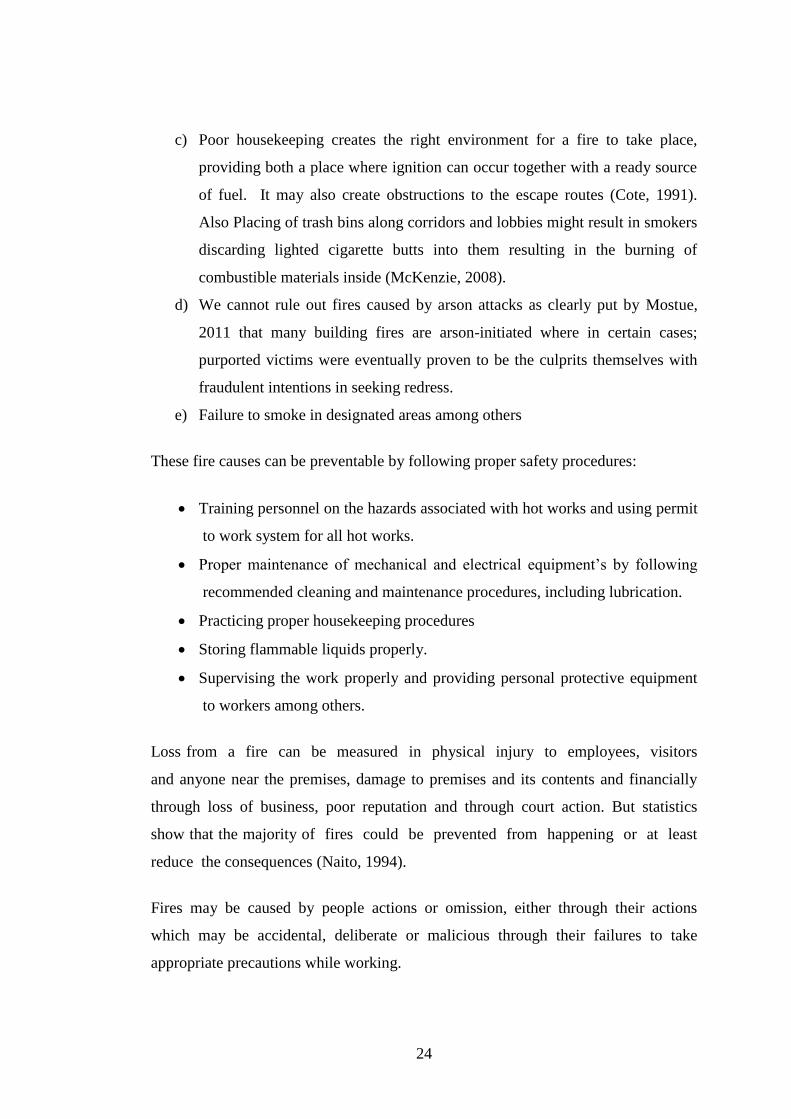
c) Poor housekeeping creates the right environment for a fire to take place,
providing both a place where ignition can occur together with a ready source
of fuel. It may also create obstructions to the escape routes (Cote, 1991).
Also Placing of trash bins along corridors and lobbies might result in smokers
discarding lighted cigarette butts into them resulting in the burning of
combustible materials inside (McKenzie, 2008).
d) We cannot rule out fires caused by arson attacks as clearly put by Mostue,
2011 that many building fires are arson-initiated where in certain cases;
purported victims were eventually proven to be the culprits themselves with
fraudulent intentions in seeking redress.
e) Failure to smoke in designated areas among others
These fire causes can be preventable by following proper safety procedures:
Training personnel on the hazards associated with hot works and using permit
to work system for all hot works.
Proper maintenance of mechanical and electrical equipment’s by following
recommended cleaning and maintenance procedures, including lubrication.
Practicing proper housekeeping procedures
Storing flammable liquids properly.
Supervising the work properly and providing personal protective equipment
to workers among others.
Loss from a fire can be measured in physical injury to employees, visitors
and anyone near the premises, damage to premises and its contents and financially
through loss of business, poor reputation and through court action. But statistics
show that the majority of fires could be prevented from happening or at least
reduce the consequences (Naito, 1994).
Fires may be caused by people actions or omission, either through their actions
which may be accidental, deliberate or malicious through their failures to take
appropriate precautions while working.
25
The prevention of fire therefore depends majorly on people. When people have an
understanding of the nature and behavior of fire, they will be in a better position to
recognize fire hazards and to take preventive measures.
Fire safety in workplaces can be well achieved by establishing policies and
procedures and ensuring proper implementation of the same. It should involve
Conducting fire hazard analysis, establishing fire prevention and emergency
procedures, Providing fire safety training, Implementing regular housekeeping
routines, Inspecting and maintaining equipment’s and systems etc.
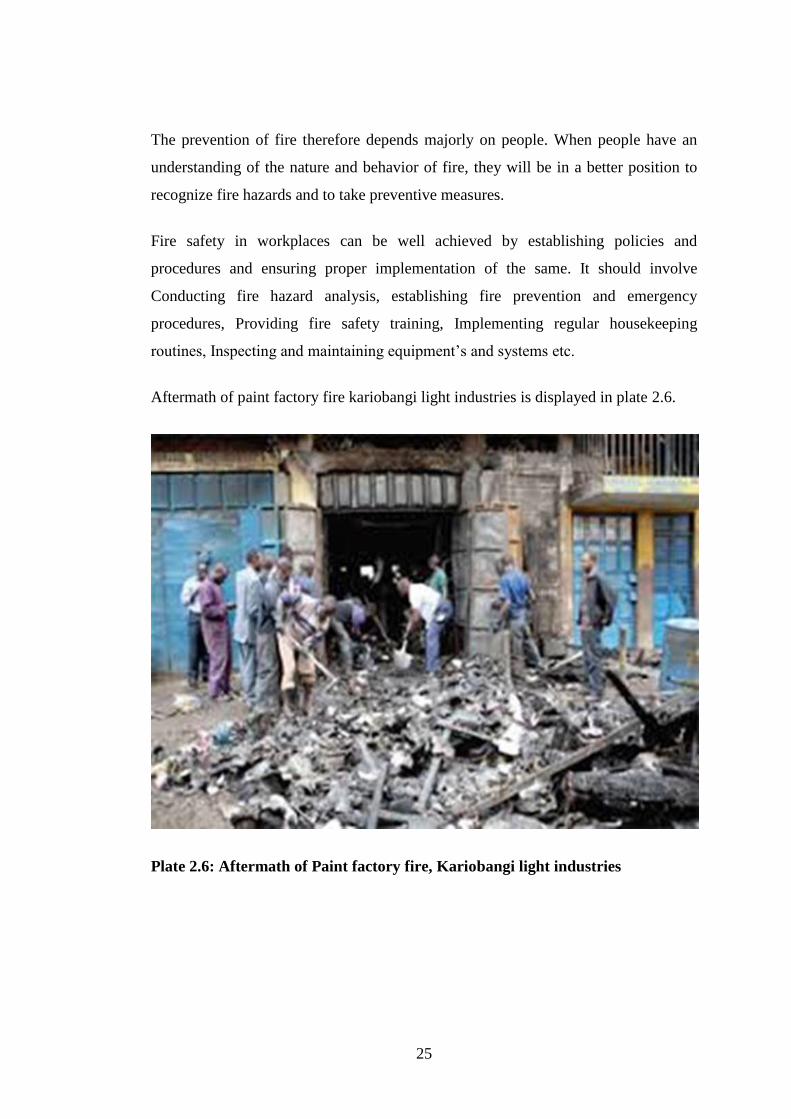
Aftermath of paint factory fire kariobangi light industries is displayed in plate 2.6.
Plate 2.6: Aftermath of Paint factory fire, Kariobangi light industries
26
CHAPTER THREE
MATERIALS AND METHODS
3.1 Study design
The study utilized descriptive research design because it is a fact-finding mission.
Descriptive research is suitable when one studies things as they are in the field
without manipulating variables and also gives views and feelings from the
respondent regarding issues like where, how and whom. (Babbie, 2002). Both
qualitative and quantitative data was collected and used for the study.
The study used the descriptive research method focusing on survey research type;
participants answered questions administered through interviews or questionnaires.
The research questions were formulated in a clear and easy to comprehend manner.
The researcher used both open-ended and closed-ended questions. Open-ended
questions allowed for a greater variety of responses from participants. The data was
then coded for ease to analyze statistically. The research focused on the management
and the workforce in all the 30 paint manufactures and distributors.
3.2 Study area and target Population
3.2.1 Geographical location of paint industries in Nairobi
Paint industries are quite a number in Nairobi County. The study focused on the paint
industries located in Industrial area and Kariobangi light industries. Nairobi
Industrial area is located approximately 7km from Nairobi CBD to the South while
Kariobangi light industries is located approximately 9 km from Nairobi CBD to the
East (Map 3.1).
27
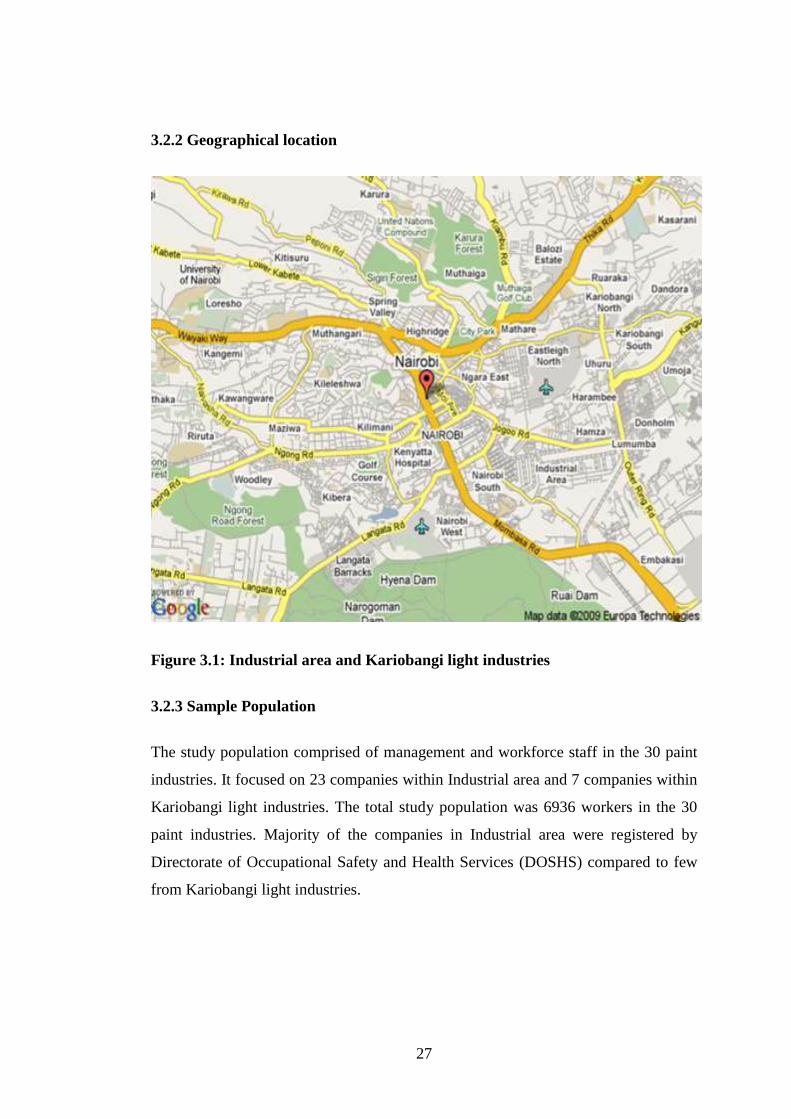
3.2.2 Geographical location
Figure 3.1: Industrial area and Kariobangi light industries
3.2.3 Sample Population
The study population comprised of management and workforce staff in the 30 paint
industries. It focused on 23 companies within Industrial area and 7 companies within
Kariobangi light industries. The total study population was 6936 workers in the 30
paint industries. Majority of the companies in Industrial area were registered by
Directorate of Occupational Safety and Health Services (DOSHS) compared to few
from Kariobangi light industries.

28
3.2.4 Sample size for questionnaire distribution
For determination of the sample size for questionnaire administration, the researcher
applied the following formula, (Bartlett et al., 2001): -
Where;
n=Sample size
X= The standard variant value at 1.96 for 95% confidence level
N= Population size of 6936
P= The half-half chance of picking a choice, expressed as decimal of 0.5
ME= The margin of error at 95% level of confidence, expressed as decimal of 0.05
Using the above formula, the sample size was determined.
Therefore
29
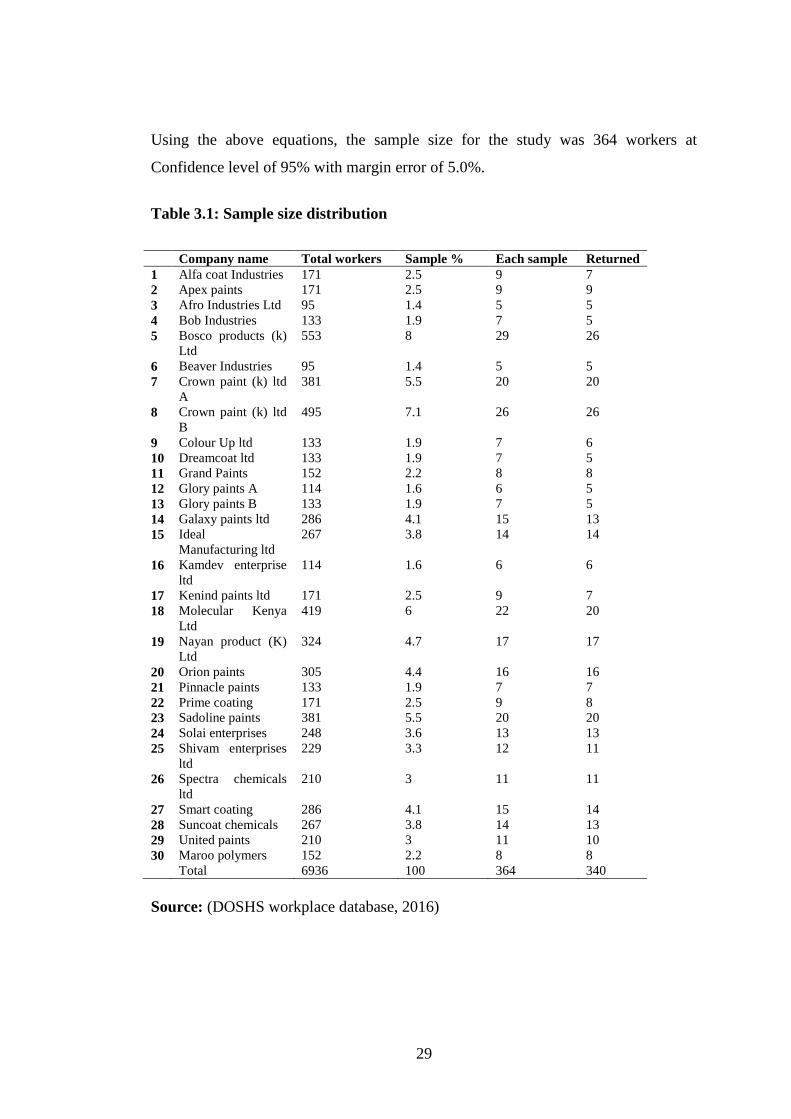
Using the above equations, the sample size for the study was 364 workers at
Confidence level of 95% with margin error of 5.0%.
Table 3.1: Sample size distribution
Company name Total workers Sample % Each sample Returned
1 Alfa coat Industries 171 2.5 9 7
2 Apex paints 171 2.5 9 9
3 Afro Industries Ltd 95 1.4 5 5
4 Bob Industries 133 1.9 7 5
5 Bosco products (k)
Ltd
553 8 29 26
6 Beaver Industries 95 1.4 5 5
7 Crown paint (k) ltd
A
381 5.5 20 20
8 Crown paint (k) ltd
B
495 7.1 26 26
9 Colour Up ltd 133 1.9 7 6
10 Dreamcoat ltd 133 1.9 7 5
11 Grand Paints 152 2.2 8 8
12 Glory paints A 114 1.6 6 5
13 Glory paints B 133 1.9 7 5
14 Galaxy paints ltd 286 4.1 15 13
15 Ideal
Manufacturing ltd
267 3.8 14 14
16 Kamdev enterprise
ltd
114 1.6 6 6
17 Kenind paints ltd 171 2.5 9 7
18 Molecular Kenya
Ltd
419 6 22 20
19 Nayan product (K)
Ltd
324 4.7 17 17
20 Orion paints 305 4.4 16 16
21 Pinnacle paints 133 1.9 7 7
22 Prime coating 171 2.5 9 8
23 Sadoline paints 381 5.5 20 20
24 Solai enterprises 248 3.6 13 13
25 Shivam enterprises
ltd
229 3.3 12 11
26 Spectra chemicals
ltd
210 3 11 11
27 Smart coating 286 4.1 15 14
28 Suncoat chemicals 267 3.8 14 13
29 United paints 210 3 11 10
30 Maroo polymers 152 2.2 8 8
Total 6936 100 364 340
Source: (DOSHS workplace database, 2016)
30
3.3 Research instrument
The study employed questionnaires and structured participatory observations using a
prepared checklist in the collection of information. There were two types of
questionnaires, for management and for workforce. The management questionnaire
was designed in two main parts. Part A relate to personal information and Part B
aimed at obtaining the opinion of the respondents about the essential fire safety
measures put in place and fire safety preparedness. The workforce questionnaire was
designed in three parts, Part A on personal information, part B on fire risks and fire
safety awareness and part C on factors affecting implementation of FRRR 2007.The
checklist was formulated from the FRRR Legal notice 59, and was used to conduct a
facility tour aided by in house safety officer looking into fire risks, safety measures
and preparedness.
Apart from the questionnaires, the researcher administered face to face interviews to
some managers and workforce and used checklist to conduct inspections on fire
safety compliance.
3.4 Data Collection.
Stratified simple random sampling procedure was used and the distribution of the
questionnaires in the individual companies was done using the tippet random table to
get the specific persons to be sampled. The number of questionnaires administered in
each workplace was based on the percentage of the workers in a workplace in
relation to the total population.
The data was collected for 12 months with the help of two research assistants. There
were two sets of questionnaires aimed at getting specific information on fire safety
from both management and workforce in the companies. The questionnaires were
dropped in the identified companies and picked up after they were filled up.
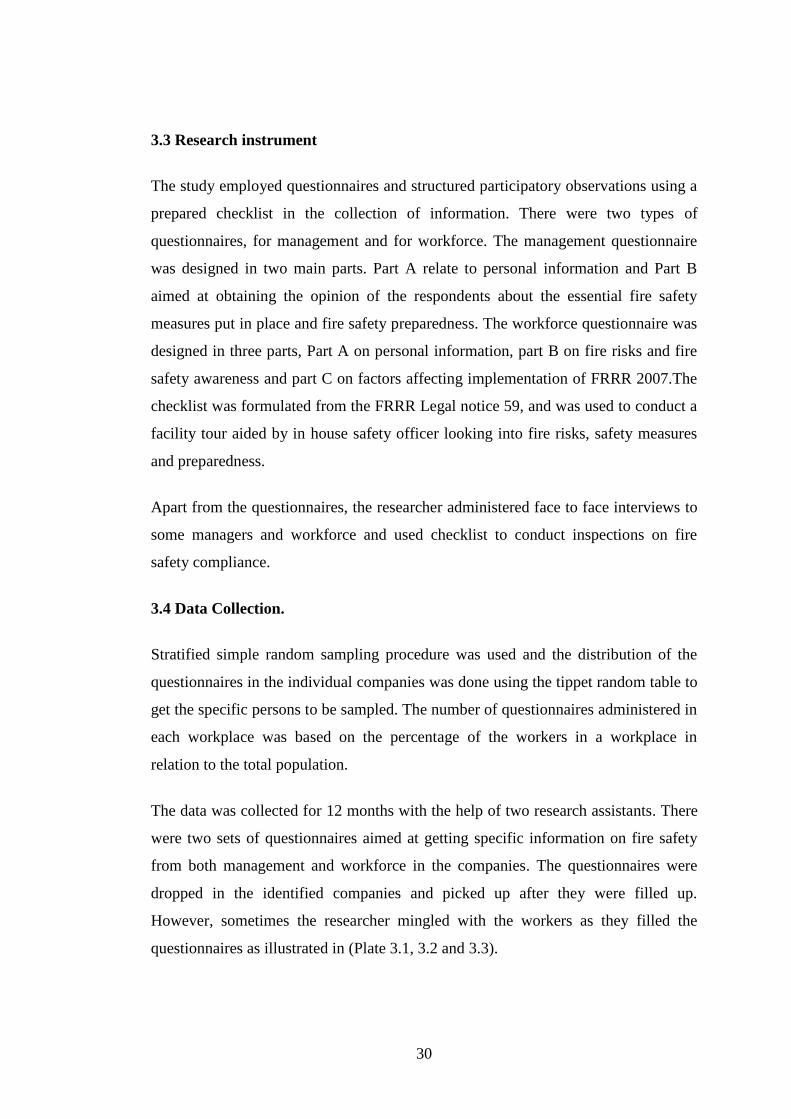
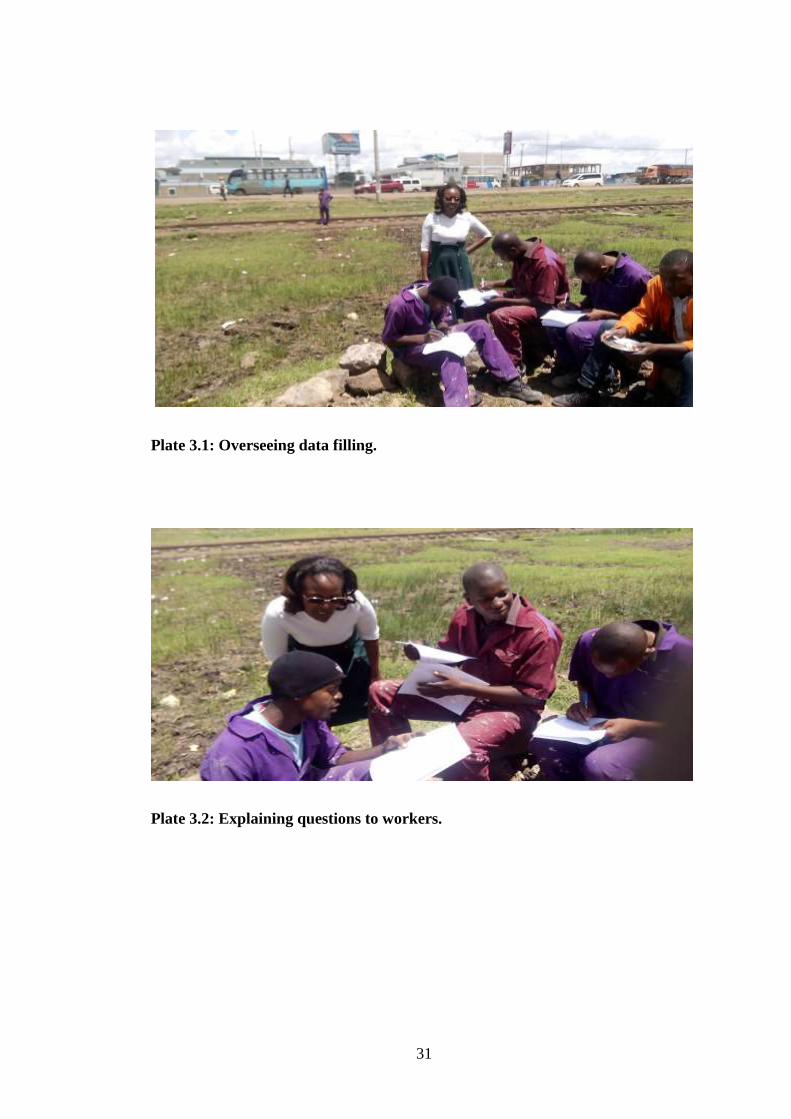
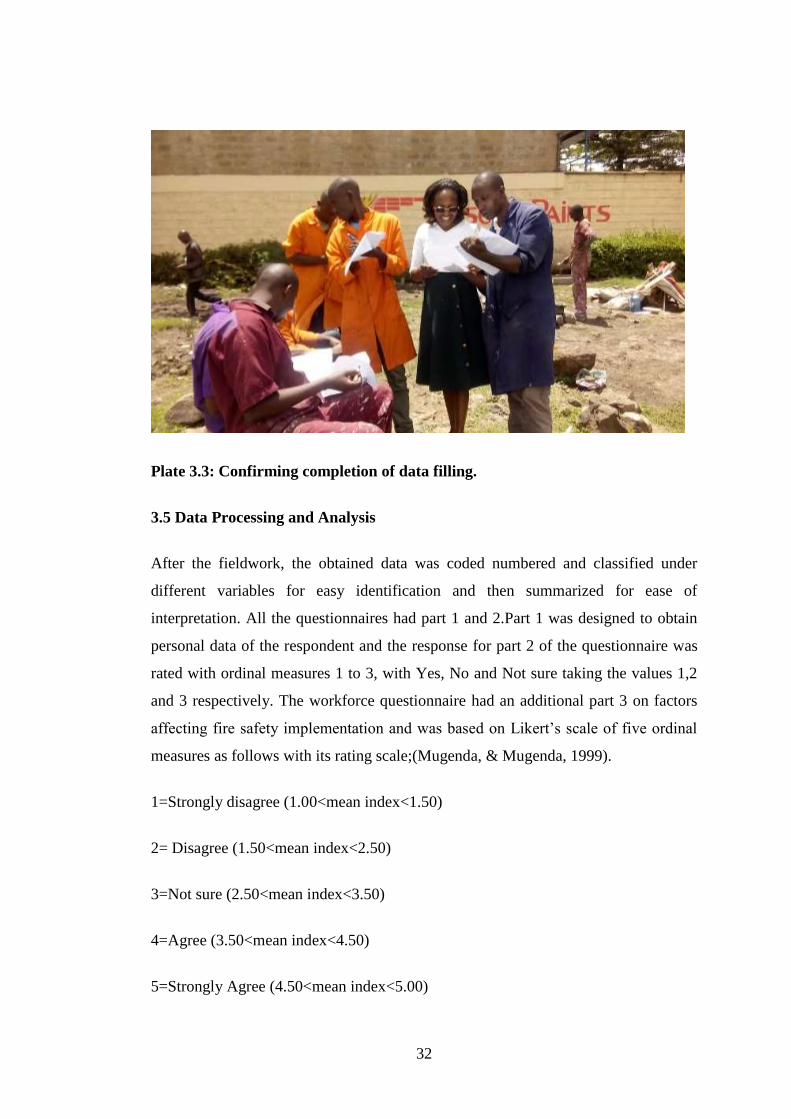
However, sometimes the researcher mingled with the workers as they filled the
questionnaires as illustrated in (Plate 3.1, 3.2 and 3.3).
31
Plate 3.1: Overseeing data filling.
Plate 3.2: Explaining questions to workers.
32
Plate 3.3: Confirming completion of data filling.
3.5 Data Processing and Analysis
After the fieldwork, the obtained data was coded numbered and classified under
different variables for easy identification and then summarized for ease of
interpretation. All the questionnaires had part 1 and 2.Part 1 was designed to obtain
personal data of the respondent and the response for part 2 of the questionnaire was
rated with ordinal measures 1 to 3, with Yes, No and Not sure taking the values 1,2
and 3 respectively. The workforce questionnaire had an additional part 3 on factors
affecting fire safety implementation and was based on Likert’s scale of five ordinal
measures as follows with its rating scale;(Mugenda, & Mugenda, 1999).
1=Strongly disagree (1.00<mean index<1.50)
2= Disagree (1.50<mean index<2.50)
3=Not sure (2.50<mean index<3.50)
4=Agree (3.50<mean index<4.50)
5=Strongly Agree (4.50<mean index<5.00)
33
The checklist was measured on scale of 4 ordinal measures rated as follows;
4= Good ((3.50<mean index<4.50)
3 = Satisfactory (2.50<mean index<3.50)
2 = Average (1.50<mean index<2.50)
1 = Poor (1.00<mean index<1.50)
The mean index was used for ranking variables as per the response rate.
Mean Index =∑ (μ* n)/N
Where; u is the weighing of each factor given by the respondents
n is the frequency of respondents
N is the total number of respondents
Correlation techniques were also used to analyze the primary data of quantitative
nature .A statistical package (SPSS) and Ms Excel was used to analyze the data.
The result of the analysis was organized, summarized and presented using tables, pie
charts, bar graphs among others. Descriptive statistics such as mean, mode, median
were used to present the characteristics of data.
3.6 Pilot testing
A pilot study was conducted in 5 paint industries to measure the validity and
reliability of the research instruments in the study. The pilot study targeted a sample
size of 59 respondents in which 52 filled the questionnaires making a response rate
of 88.1%.
34
3.7 Ethical considerations
Permission was sought from all the paint industries visited using the university
introduction letter and the researcher’s request letter to help carry out the research.
(Appendices V and VI).
The confidentiality of the respondents was protected by ensuring the respondents
were not required to put their names in the questionnaire hence no coercion or undue
influence was exercised.
35
CHAPTER FOUR
RESEARCH FINDINGS AND DISCUSSION
This chapter describes the analysis of data followed by a discussion of the research
findings. The raw data was transformed making it easy to understand and interpret.
These results are presented in various systems to make it possible to interpret
population characteristics, comparisons and associations of data.
4.1 Population characteristics
4.1.1 Response Rate
The study targeted a sample size of 364 respondents in which 340 completely filled
the questionnaires making a response rate of 93.4 %. Babbie (2002) argues that in
descriptive survey research, response rate above 50 percent is adequate for data
analysis. Mugenda (1999) also asserts that a rate of 50 percent or higher is adequate
for data analysis. This implies that 93.4% response rate was very adequate for data
analysis.
4.1.2 Demographic characteristics of the Management and Workforce
4.1.2.1 Gender of the Management and Workforce
One hundred and twenty-two management personnel were interviewed, ninety-
nine persons from Industrial area and twenty-three persons in Kariobangi light
industries. Two hundred and eighteen workforce personnel were interviewed with
one sixty-seven persons from Industrial area and fifty-one persons in Kariobangi
light industries. All the workers interviewed were on permanent employment and
were well trained for their respective job.
From the findings, a greater number (70.9%) of the respondents were male while
female were 29.1% in all the facilities with inconsiderable percentage difference in
representation between management and workforce as indicted in Table 4.1This
signifies that most of the paint industries are male dominated.
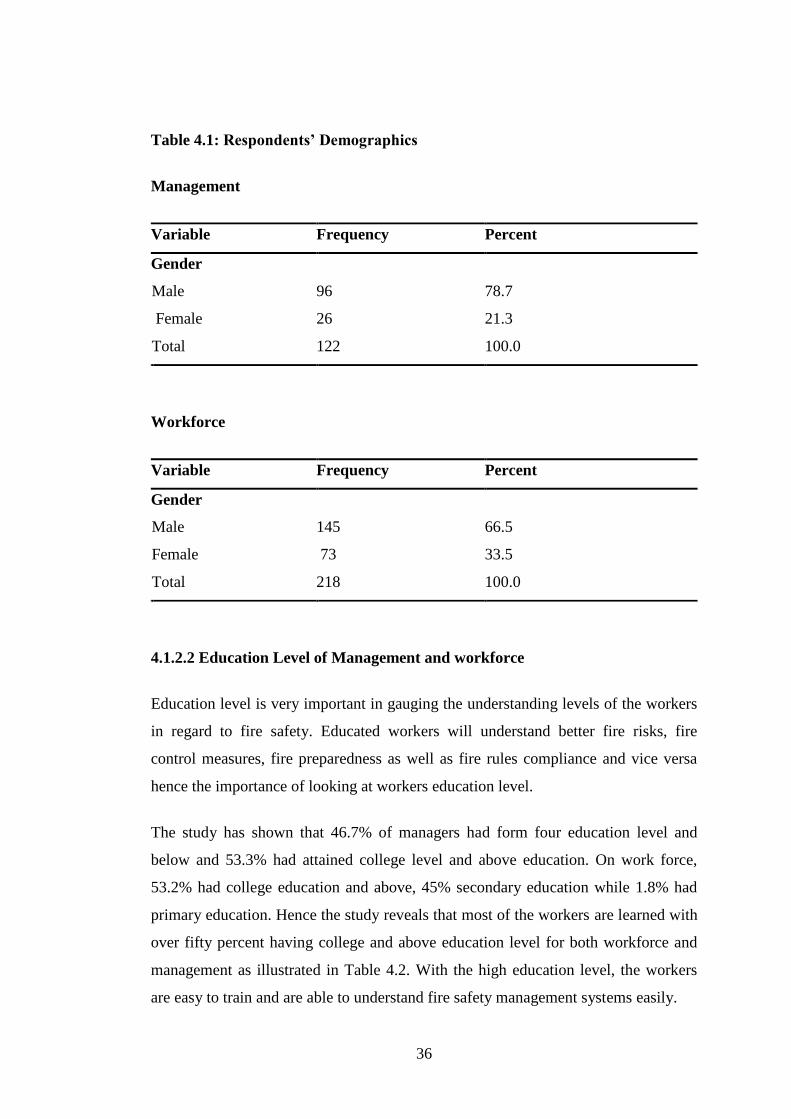
36
Table 4.1: Respondents’ Demographics
Management
Variable Frequency Percent
Gender
Male 96 78.7
Female 26 21.3
Total 122 100.0
Workforce
Variable Frequency Percent
Gender
Male 145 66.5
Female 73 33.5
Total 218 100.0
4.1.2.2 Education Level of Management and workforce
Education level is very important in gauging the understanding levels of the workers
in regard to fire safety. Educated workers will understand better fire risks, fire
control measures, fire preparedness as well as fire rules compliance and vice versa
hence the importance of looking at workers education level.
The study has shown that 46.7% of managers had form four education level and
below and 53.3% had attained college level and above education. On work force,
53.2% had college education and above, 45% secondary education while 1.8% had
primary education. Hence the study reveals that most of the workers are learned with
over fifty percent having college and above education level for both workforce and
management as illustrated in Table 4.2. With the high education level, the workers
are easy to train and are able to understand fire safety management systems easily.
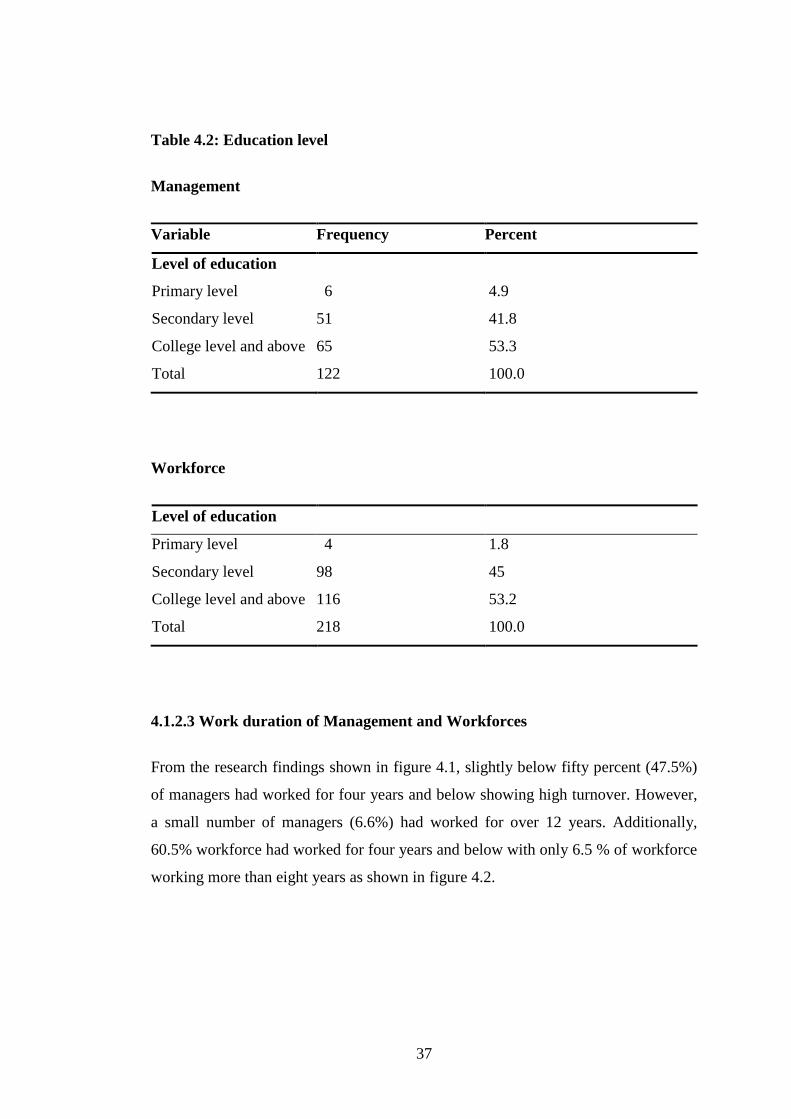
37
Table 4.2: Education level
Management
Variable Frequency Percent
Level of education
Primary level 6 4.9
Secondary level 51 41.8
College level and above 65 53.3
Total 122 100.0
Workforce
Level of education
Primary level 4 1.8
Secondary level 98 45
College level and above 116 53.2
Total 218 100.0
4.1.2.3 Work duration of Management and Workforces
From the research findings shown in figure 4.1, slightly below fifty percent (47.5%)
of managers had worked for four years and below showing high turnover. However,
a small number of managers (6.6%) had worked for over 12 years. Additionally,
60.5% workforce had worked for four years and below with only 6.5 % of workforce
working more than eight years as shown in figure 4.2.
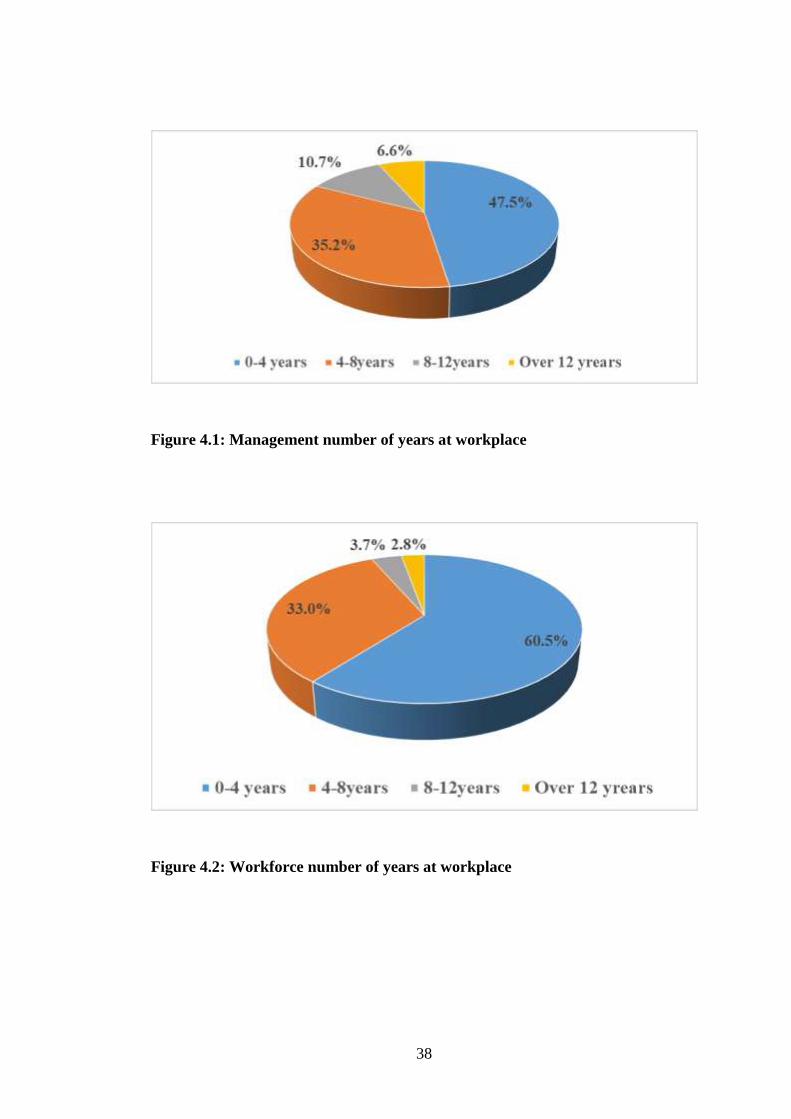
38
Figure 4.1: Management number of years at workplace
Figure 4.2: Workforce number of years at workplace
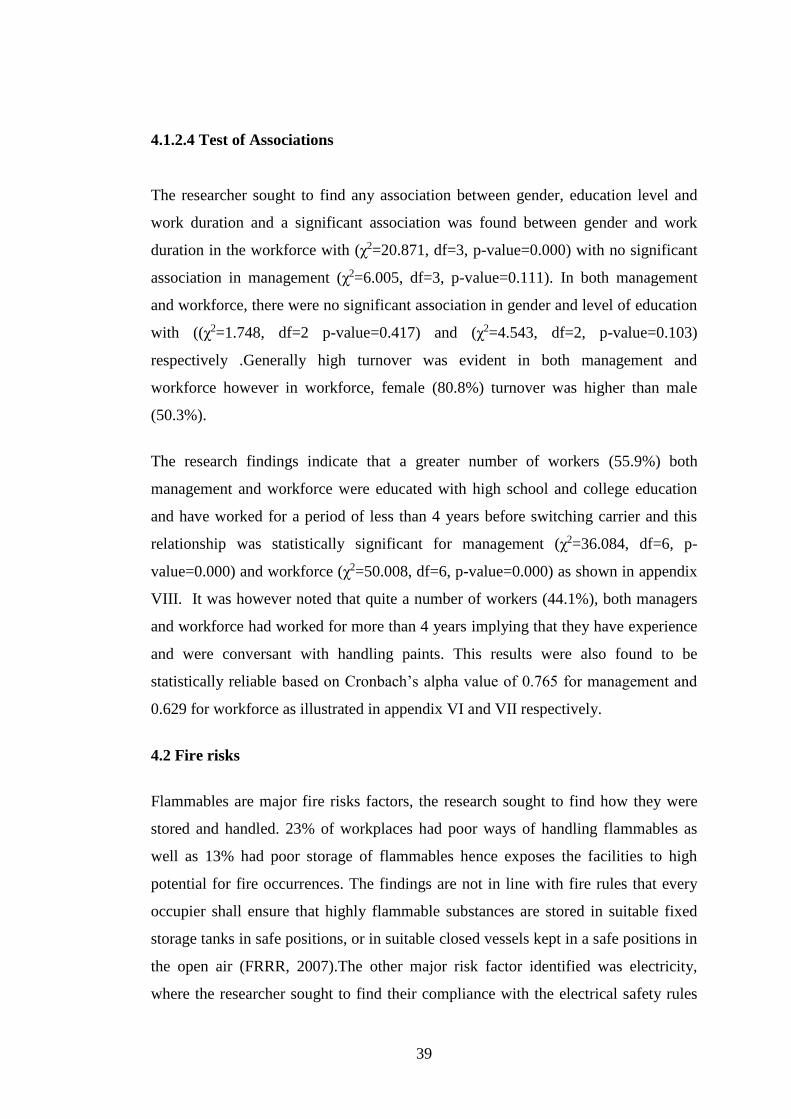
39
4.1.2.4 Test of Associations
The researcher sought to find any association between gender, education level and
work duration and a significant association was found between gender and work
duration in the workforce with (χ2=20.871, df=3, p-value=0.000) with no significant
association in management (χ2=6.005, df=3, p-value=0.111). In both management
and workforce, there were no significant association in gender and level of education
with ((χ2=1.748, df=2 p-value=0.417) and (χ2=4.543, df=2, p-value=0.103)
respectively .Generally high turnover was evident in both management and
workforce however in workforce, female (80.8%) turnover was higher than male
(50.3%).
The research findings indicate that a greater number of workers (55.9%) both
management and workforce were educated with high school and college education
and have worked for a period of less than 4 years before switching carrier and this
relationship was statistically significant for management (χ2=36.084, df=6, p-
value=0.000) and workforce (χ2=50.008, df=6, p-value=0.000) as shown in appendix
VIII. It was however noted that quite a number of workers (44.1%), both managers
and workforce had worked for more than 4 years implying that they have experience
and were conversant with handling paints. This results were also found to be
statistically reliable based on Cronbach’s alpha value of 0.765 for management and
0.629 for workforce as illustrated in appendix VI and VII respectively.
4.2 Fire risks
Flammables are major fire risks factors, the research sought to find how they were
stored and handled. 23% of workplaces had poor ways of handling flammables as
well as 13% had poor storage of flammables hence exposes the facilities to high
potential for fire occurrences. The findings are not in line with fire rules that every
occupier shall ensure that highly flammable substances are stored in suitable fixed
storage tanks in safe positions, or in suitable closed vessels kept in a safe positions in
the open air (FRRR, 2007).The other major risk factor identified was electricity,
where the researcher sought to find their compliance with the electrical safety rules
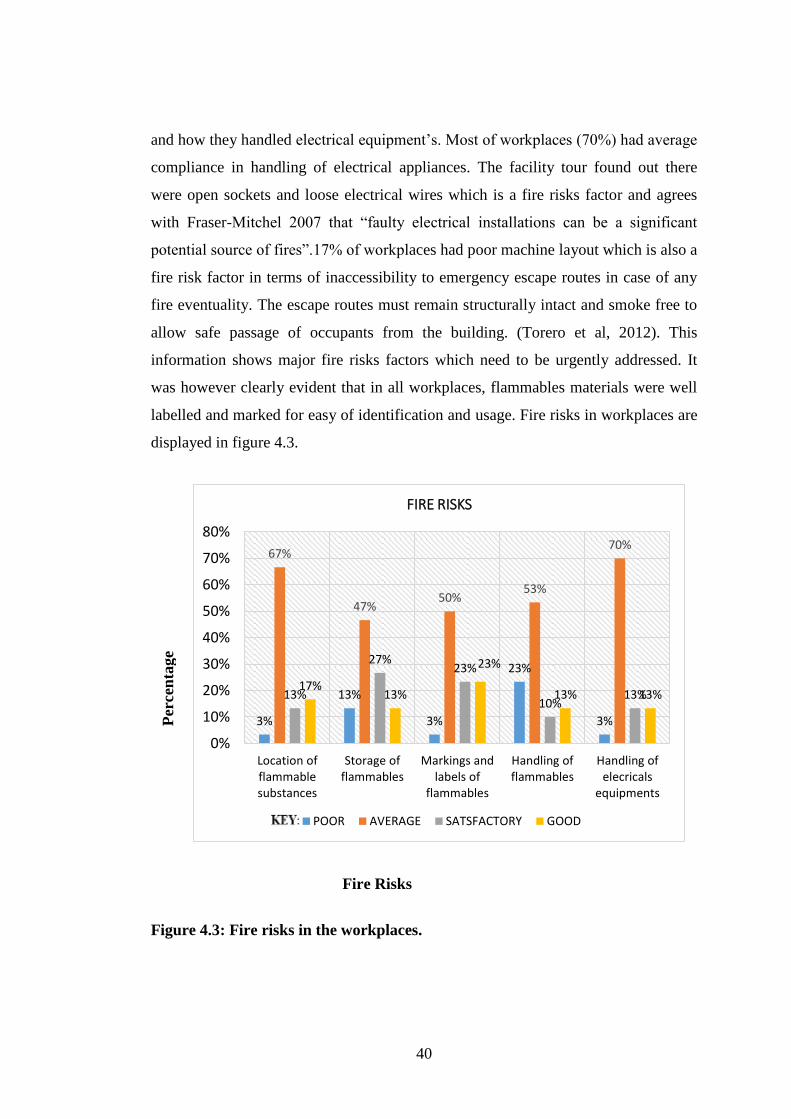
40
and how they handled electrical equipment’s. Most of workplaces (70%) had average
compliance in handling of electrical appliances. The facility tour found out there
were open sockets and loose electrical wires which is a fire risks factor and agrees
with Fraser-Mitchel 2007 that “faulty electrical installations can be a significant
potential source of fires”.17% of workplaces had poor machine layout which is also a
fire risk factor in terms of inaccessibility to emergency escape routes in case of any
fire eventuality. The escape routes must remain structurally intact and smoke free to
allow safe passage of occupants from the building. (Torero et al, 2012). This
information shows major fire risks factors which need to be urgently addressed. It
was however clearly evident that in all workplaces, flammables materials were well
labelled and marked for easy of identification and usage. Fire risks in workplaces are
displayed in figure 4.3.
3%
13%
3%
23%
3%
67%
47%50%
53%
70%
13%
27%23%
10%13%
17%13%
23%
13% 13%
0%
10%
20%
30%
40%
50%
60%
70%
80%
Location offlammablesubstances
Storage offlammables
Markings andlabels of
flammables
Handling offlammables
Handling ofelecricals
equipments
FIRE RISKS
POOR AVERAGE SATSFACTORY GOOD
Fire Risks
Figure 4.3: Fire risks in the workplaces.
Per
cen
tage
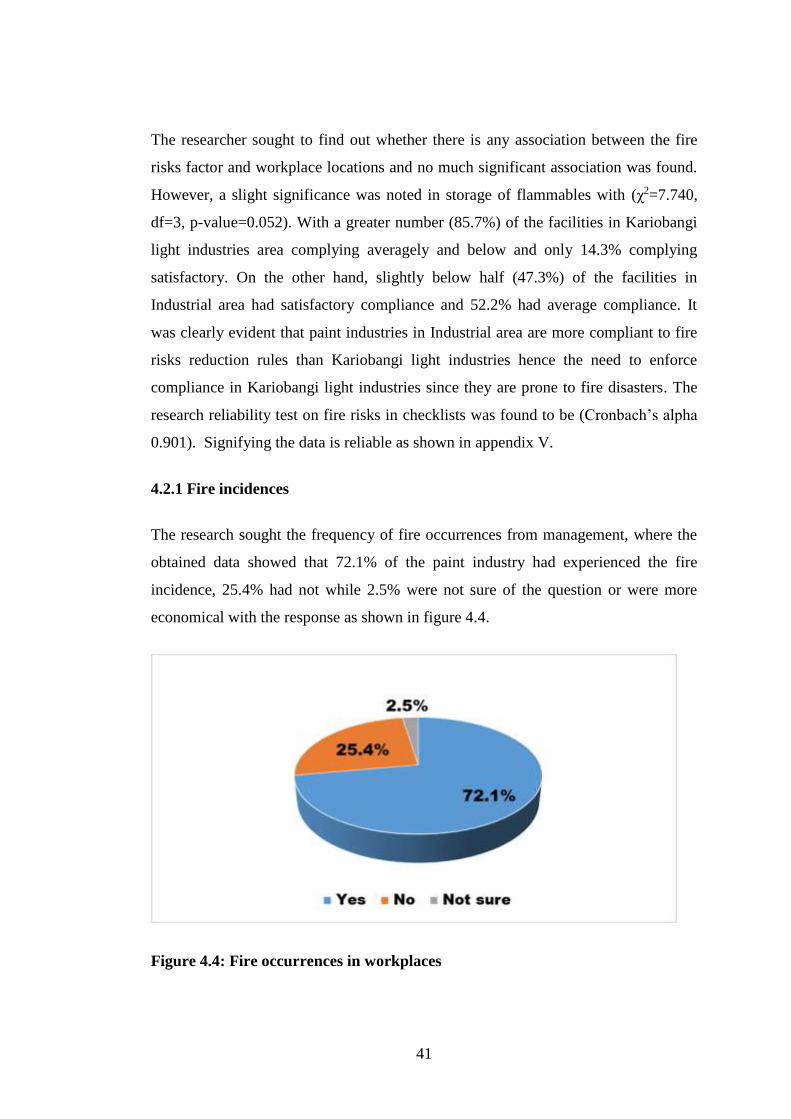
41
The researcher sought to find out whether there is any association between the fire
risks factor and workplace locations and no much significant association was found.
However, a slight significance was noted in storage of flammables with (χ2=7.740,
df=3, p-value=0.052). With a greater number (85.7%) of the facilities in Kariobangi
light industries area complying averagely and below and only 14.3% complying
satisfactory. On the other hand, slightly below half (47.3%) of the facilities in
Industrial area had satisfactory compliance and 52.2% had average compliance. It
was clearly evident that paint industries in Industrial area are more compliant to fire
risks reduction rules than Kariobangi light industries hence the need to enforce
compliance in Kariobangi light industries since they are prone to fire disasters. The
research reliability test on fire risks in checklists was found to be (Cronbach’s alpha
0.901). Signifying the data is reliable as shown in appendix V.
4.2.1 Fire incidences
The research sought the frequency of fire occurrences from management, where the
obtained data showed that 72.1% of the paint industry had experienced the fire
incidence, 25.4% had not while 2.5% were not sure of the question or were more
economical with the response as shown in figure 4.4.
Figure 4.4: Fire occurrences in workplaces
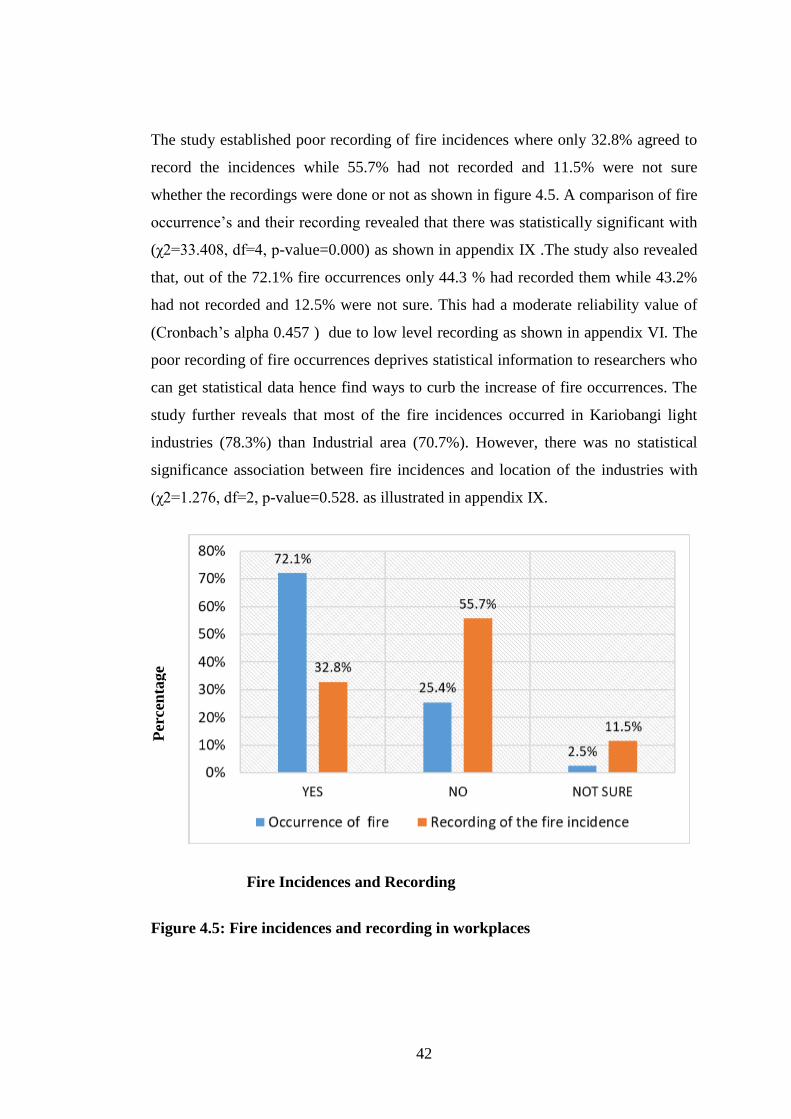
42
The study established poor recording of fire incidences where only 32.8% agreed to
record the incidences while 55.7% had not recorded and 11.5% were not sure
whether the recordings were done or not as shown in figure 4.5. A comparison of fire
occurrence’s and their recording revealed that there was statistically significant with
(χ2=33.408, df=4, p-value=0.000) as shown in appendix IX .The study also revealed
that, out of the 72.1% fire occurrences only 44.3 % had recorded them while 43.2%
had not recorded and 12.5% were not sure. This had a moderate reliability value of
(Cronbach’s alpha 0.457 ) due to low level recording as shown in appendix VI. The
poor recording of fire occurrences deprives statistical information to researchers who
can get statistical data hence find ways to curb the increase of fire occurrences. The
study further reveals that most of the fire incidences occurred in Kariobangi light
industries (78.3%) than Industrial area (70.7%). However, there was no statistical
significance association between fire incidences and location of the industries with
(χ2=1.276, df=2, p-value=0.528. as illustrated in appendix IX.
Fire Incidences and Recording
Figure 4.5: Fire incidences and recording in workplaces
Per
cen
tage
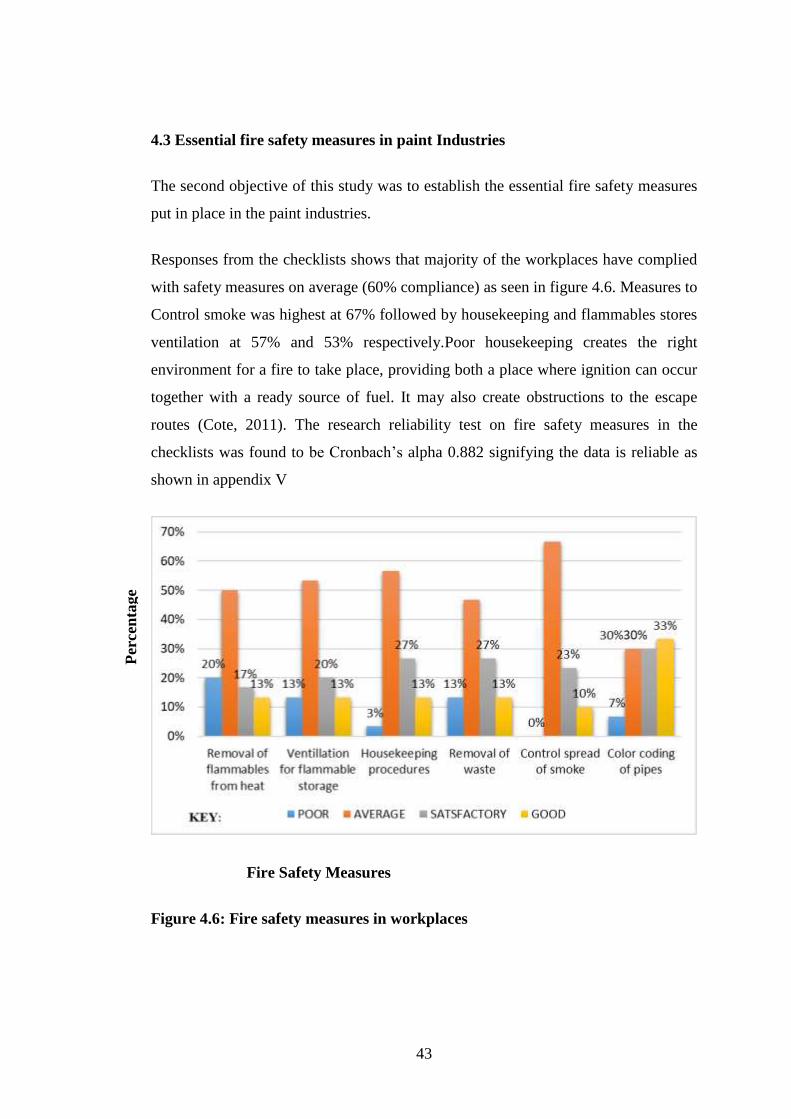
43
4.3 Essential fire safety measures in paint Industries
The second objective of this study was to establish the essential fire safety measures
put in place in the paint industries.
Responses from the checklists shows that majority of the workplaces have complied
with safety measures on average (60% compliance) as seen in figure 4.6. Measures to
Control smoke was highest at 67% followed by housekeeping and flammables stores
ventilation at 57% and 53% respectively.Poor housekeeping creates the right
environment for a fire to take place, providing both a place where ignition can occur
together with a ready source of fuel. It may also create obstructions to the escape
routes (Cote, 2011). The research reliability test on fire safety measures in the
checklists was found to be Cronbach’s alpha 0.882 signifying the data is reliable as
shown in appendix V
Fire Safety Measures
Figure 4.6: Fire safety measures in workplaces
Per
cen
tage
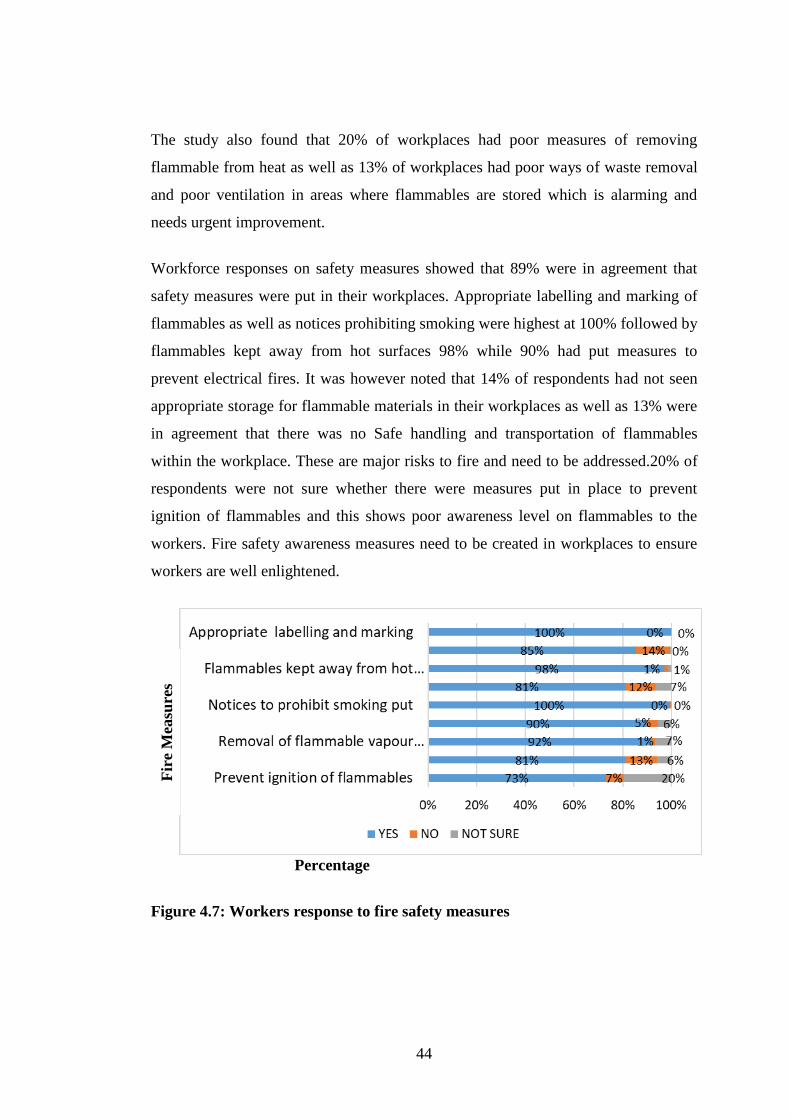
44
The study also found that 20% of workplaces had poor measures of removing
flammable from heat as well as 13% of workplaces had poor ways of waste removal
and poor ventilation in areas where flammables are stored which is alarming and
needs urgent improvement.
Workforce responses on safety measures showed that 89% were in agreement that
safety measures were put in their workplaces. Appropriate labelling and marking of
flammables as well as notices prohibiting smoking were highest at 100% followed by
flammables kept away from hot surfaces 98% while 90% had put measures to
prevent electrical fires. It was however noted that 14% of respondents had not seen
appropriate storage for flammable materials in their workplaces as well as 13% were
in agreement that there was no Safe handling and transportation of flammables
within the workplace. These are major risks to fire and need to be addressed.20% of
respondents were not sure whether there were measures put in place to prevent
ignition of flammables and this shows poor awareness level on flammables to the
workers. Fire safety awareness measures need to be created in workplaces to ensure
workers are well enlightened.
Percentage
Figure 4.7: Workers response to fire safety measures
Fir
e M
easu
res
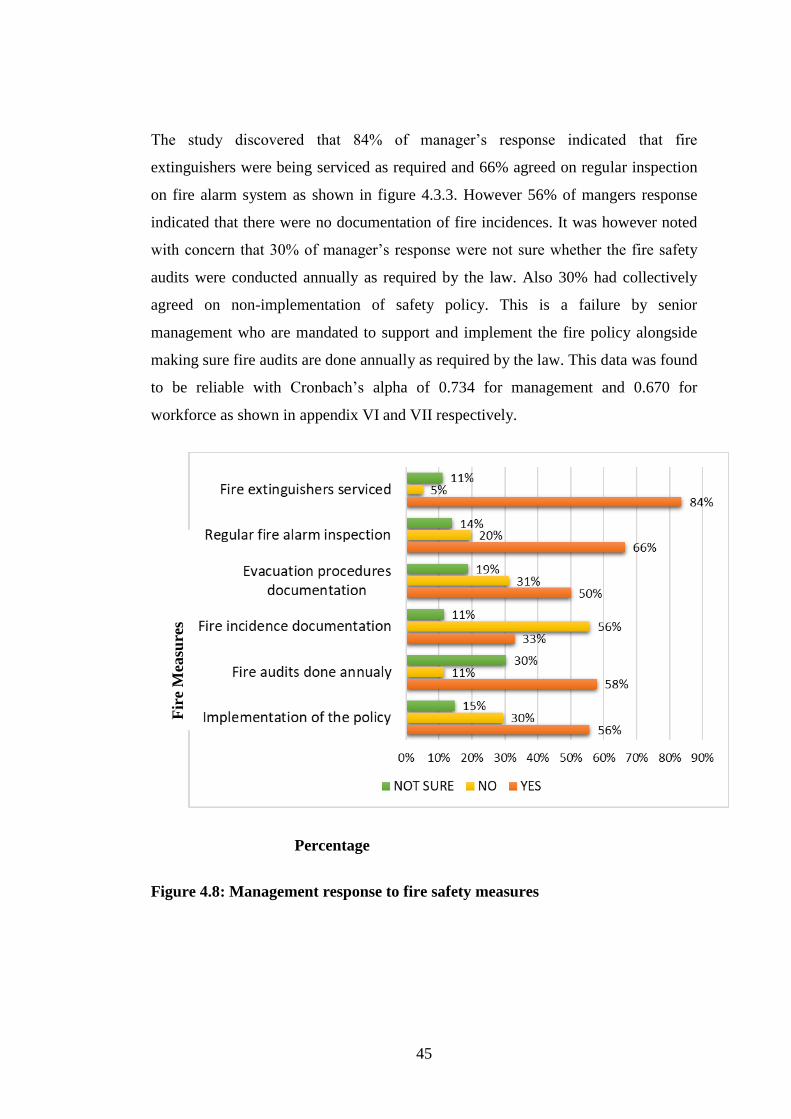
45
The study discovered that 84% of manager’s response indicated that fire
extinguishers were being serviced as required and 66% agreed on regular inspection
on fire alarm system as shown in figure 4.3.3. However 56% of mangers response
indicated that there were no documentation of fire incidences. It was however noted
with concern that 30% of manager’s response were not sure whether the fire safety
audits were conducted annually as required by the law. Also 30% had collectively
agreed on non-implementation of safety policy. This is a failure by senior
management who are mandated to support and implement the fire policy alongside
making sure fire audits are done annually as required by the law. This data was found
to be reliable with Cronbach’s alpha of 0.734 for management and 0.670 for
workforce as shown in appendix VI and VII respectively.
Percentage
Figure 4.8: Management response to fire safety measures
Fir
e M
easu
res
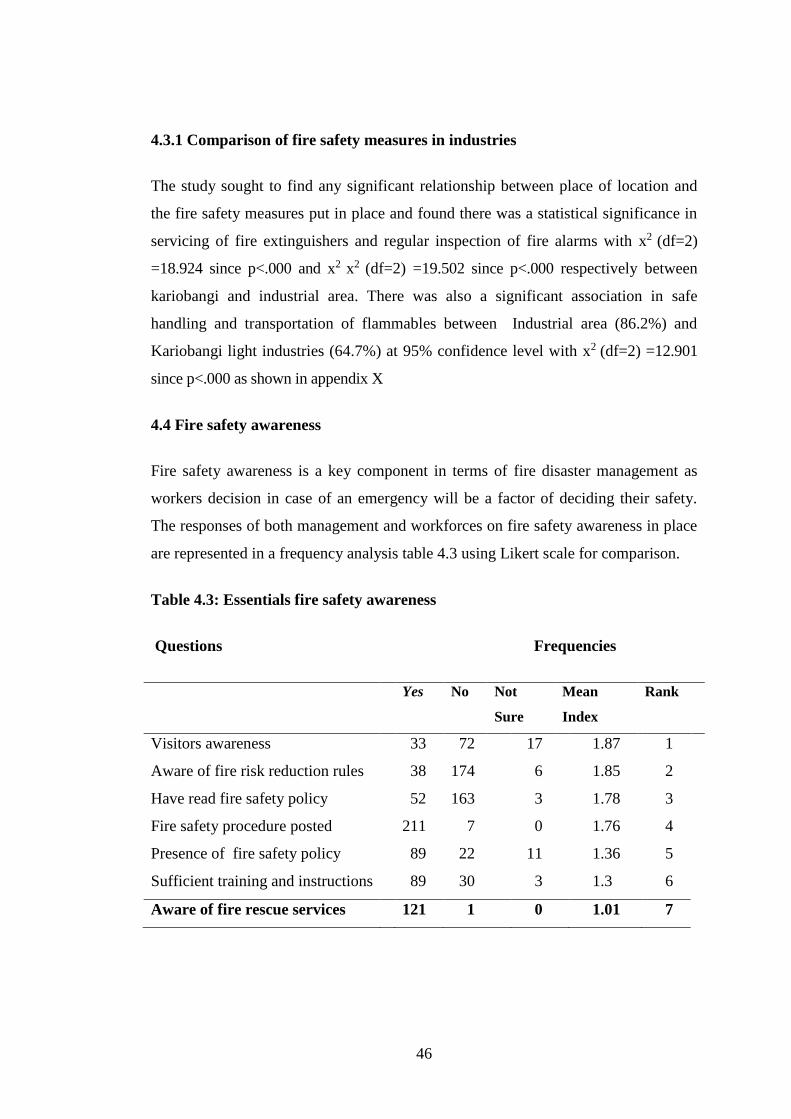
46
4.3.1 Comparison of fire safety measures in industries
The study sought to find any significant relationship between place of location and
the fire safety measures put in place and found there was a statistical significance in
servicing of fire extinguishers and regular inspection of fire alarms with x2 (df=2)
=18.924 since p<.000 and x2 x2 (df=2) =19.502 since p<.000 respectively between
kariobangi and industrial area. There was also a significant association in safe
handling and transportation of flammables between Industrial area (86.2%) and
Kariobangi light industries (64.7%) at 95% confidence level with x2 (df=2) =12.901
since p<.000 as shown in appendix X
4.4 Fire safety awareness
Fire safety awareness is a key component in terms of fire disaster management as
workers decision in case of an emergency will be a factor of deciding their safety.
The responses of both management and workforces on fire safety awareness in place
are represented in a frequency analysis table 4.3 using Likert scale for comparison.
Table 4.3: Essentials fire safety awareness
Questions Frequencies
Yes No Not
Sure
Mean
Index
Rank
Visitors awareness 33 72 17 1.87 1
Aware of fire risk reduction rules 38 174 6 1.85 2
Have read fire safety policy 52 163 3 1.78 3
Fire safety procedure posted 211 7 0 1.76 4
Presence of fire safety policy 89 22 11 1.36 5
Sufficient training and instructions 89 30 3 1.3 6
Aware of fire rescue services 121 1 0 1.01 7
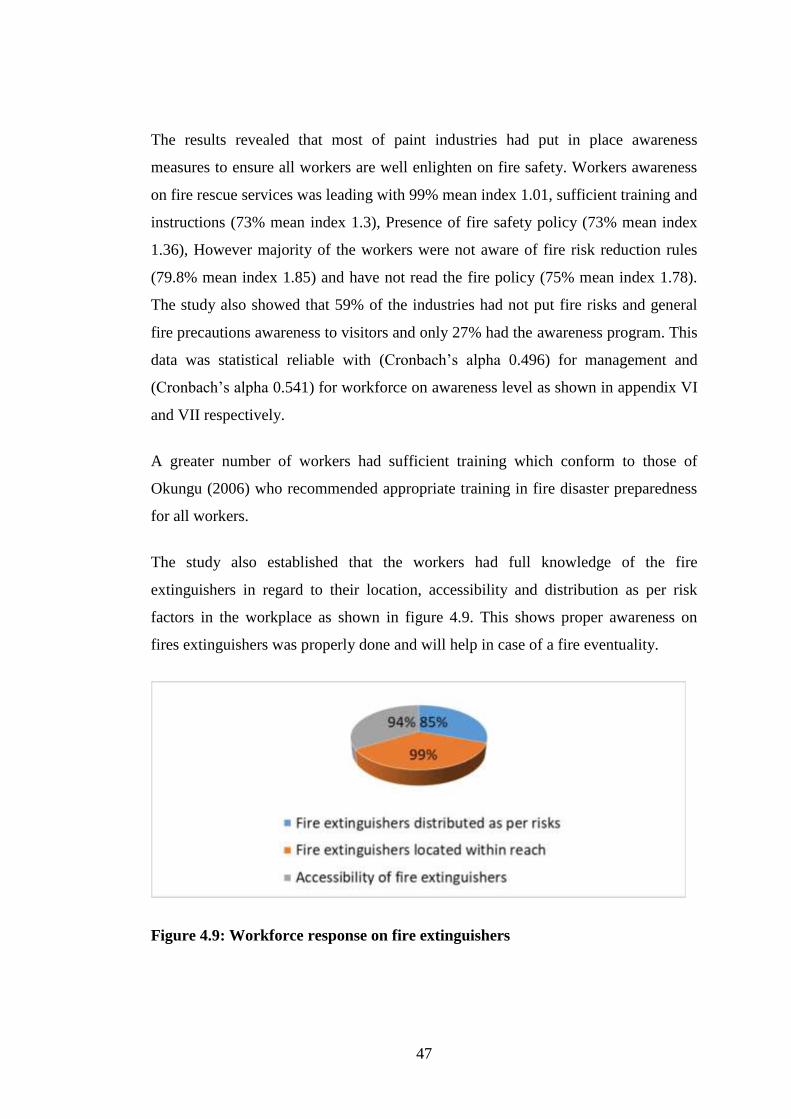
47
The results revealed that most of paint industries had put in place awareness
measures to ensure all workers are well enlighten on fire safety. Workers awareness
on fire rescue services was leading with 99% mean index 1.01, sufficient training and
instructions (73% mean index 1.3), Presence of fire safety policy (73% mean index
1.36), However majority of the workers were not aware of fire risk reduction rules
(79.8% mean index 1.85) and have not read the fire policy (75% mean index 1.78).
The study also showed that 59% of the industries had not put fire risks and general
fire precautions awareness to visitors and only 27% had the awareness program. This
data was statistical reliable with (Cronbach’s alpha 0.496) for management and
(Cronbach’s alpha 0.541) for workforce on awareness level as shown in appendix VI
and VII respectively.
A greater number of workers had sufficient training which conform to those of
Okungu (2006) who recommended appropriate training in fire disaster preparedness
for all workers.
The study also established that the workers had full knowledge of the fire
extinguishers in regard to their location, accessibility and distribution as per risk
factors in the workplace as shown in figure 4.9. This shows proper awareness on
fires extinguishers was properly done and will help in case of a fire eventuality.
Figure 4.9: Workforce response on fire extinguishers
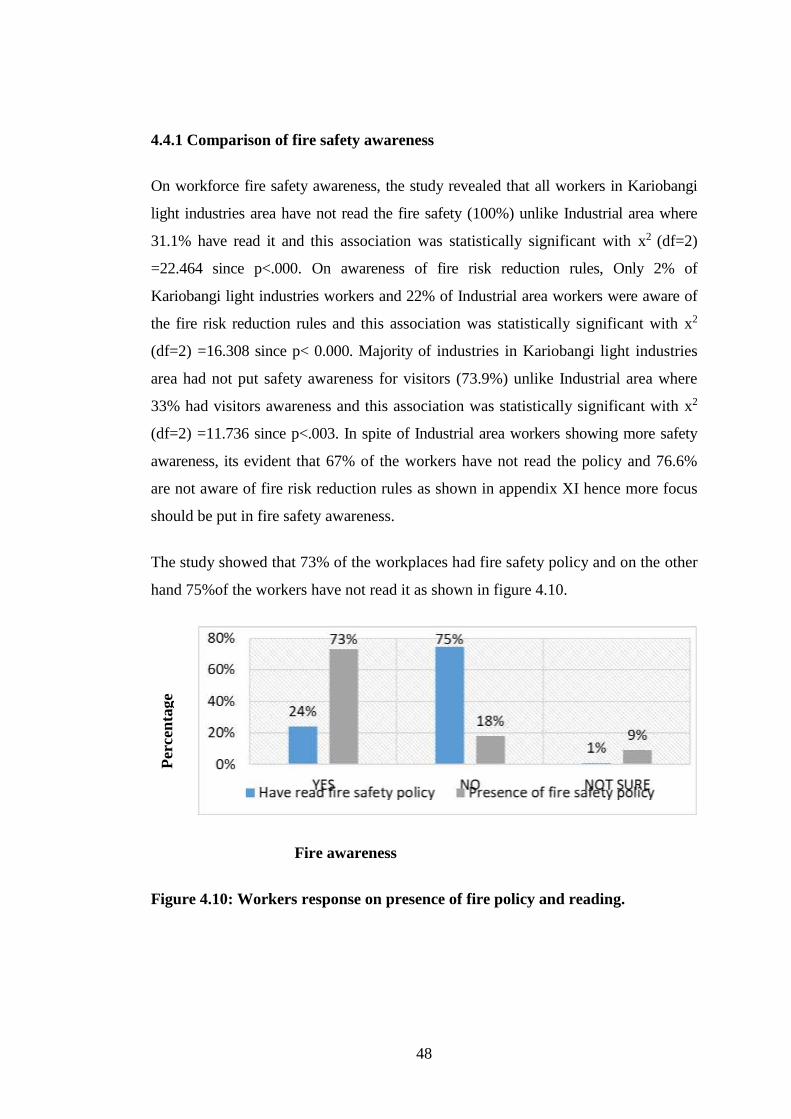
48
4.4.1 Comparison of fire safety awareness
On workforce fire safety awareness, the study revealed that all workers in Kariobangi
light industries area have not read the fire safety (100%) unlike Industrial area where
31.1% have read it and this association was statistically significant with x2 (df=2)
=22.464 since p<.000. On awareness of fire risk reduction rules, Only 2% of
Kariobangi light industries workers and 22% of Industrial area workers were aware of
the fire risk reduction rules and this association was statistically significant with x2
(df=2) =16.308 since p< 0.000. Majority of industries in Kariobangi light industries
area had not put safety awareness for visitors (73.9%) unlike Industrial area where
33% had visitors awareness and this association was statistically significant with x2
(df=2) =11.736 since p<.003. In spite of Industrial area workers showing more safety
awareness, its evident that 67% of the workers have not read the policy and 76.6%
are not aware of fire risk reduction rules as shown in appendix XI hence more focus
should be put in fire safety awareness.
The study showed that 73% of the workplaces had fire safety policy and on the other
hand 75%of the workers have not read it as shown in figure 4.10.
Fire awareness
Figure 4.10: Workers response on presence of fire policy and reading.
Per
cen
tage
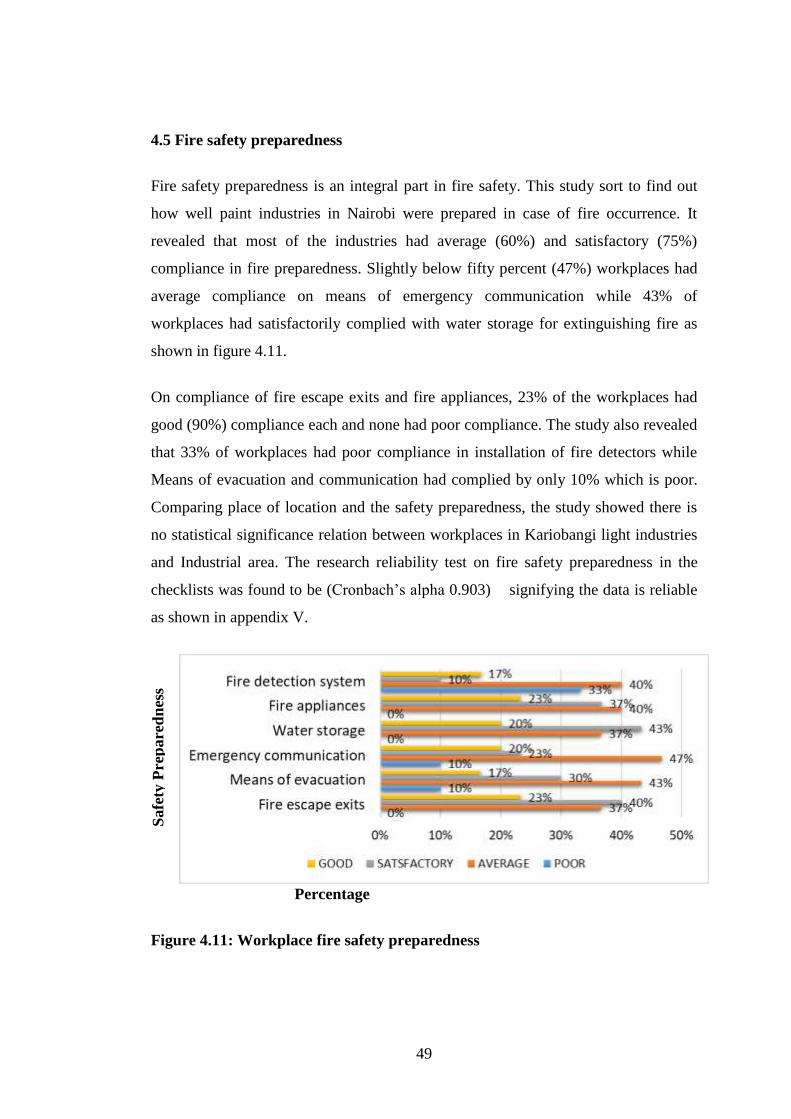
49
4.5 Fire safety preparedness
Fire safety preparedness is an integral part in fire safety. This study sort to find out
how well paint industries in Nairobi were prepared in case of fire occurrence. It
revealed that most of the industries had average (60%) and satisfactory (75%)
compliance in fire preparedness. Slightly below fifty percent (47%) workplaces had
average compliance on means of emergency communication while 43% of
workplaces had satisfactorily complied with water storage for extinguishing fire as
shown in figure 4.11.
On compliance of fire escape exits and fire appliances, 23% of the workplaces had
good (90%) compliance each and none had poor compliance. The study also revealed
that 33% of workplaces had poor compliance in installation of fire detectors while
Means of evacuation and communication had complied by only 10% which is poor.
Comparing place of location and the safety preparedness, the study showed there is
no statistical significance relation between workplaces in Kariobangi light industries
and Industrial area. The research reliability test on fire safety preparedness in the
checklists was found to be (Cronbach’s alpha 0.903) signifying the data is reliable
as shown in appendix V.
Percentage
Figure 4.11: Workplace fire safety preparedness
Safe
ty P
rep
are
dn
ess
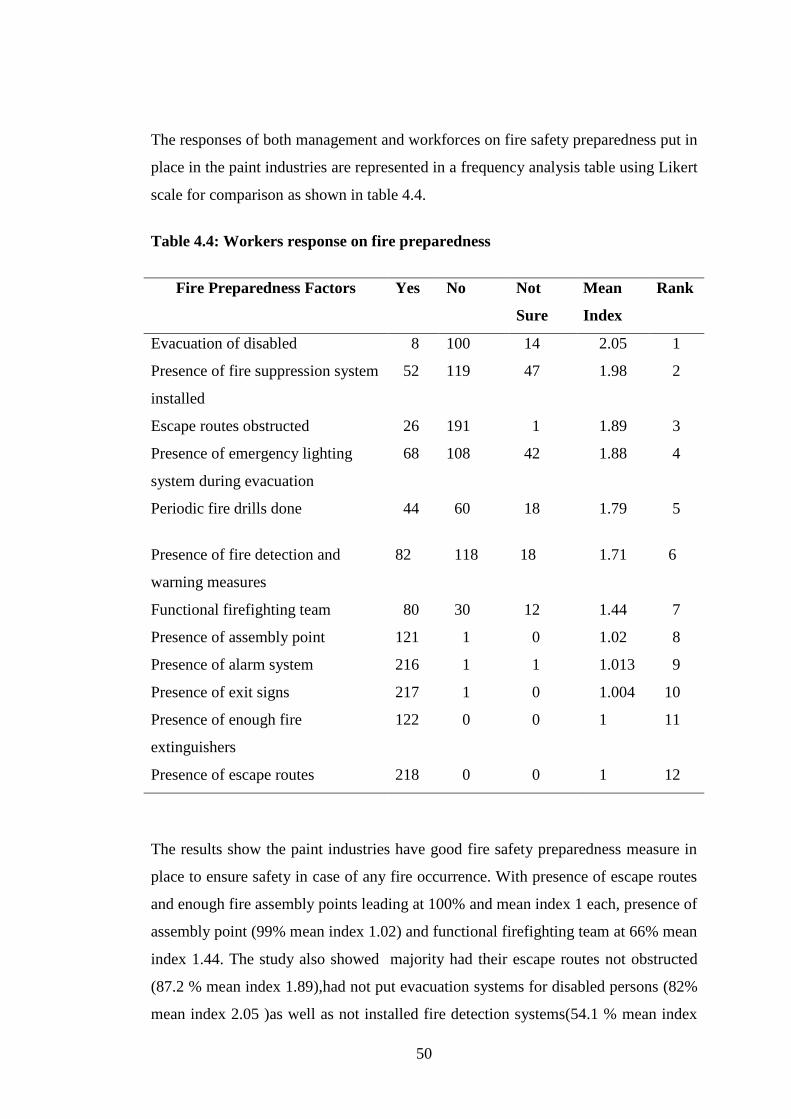
50
The responses of both management and workforces on fire safety preparedness put in
place in the paint industries are represented in a frequency analysis table using Likert
scale for comparison as shown in table 4.4.
Table 4.4: Workers response on fire preparedness
Fire Preparedness Factors Yes No Not
Sure
Mean
Index
Rank
Evacuation of disabled 8 100 14 2.05 1
Presence of fire suppression system
installed
52 119 47 1.98 2
Escape routes obstructed 26 191 1 1.89 3
Presence of emergency lighting
system during evacuation
68 108 42 1.88 4
Periodic fire drills done
Presence of fire detection and
warning measures
44
82
60
118
18
18
1.79
1.71
5
6
Functional firefighting team 80 30 12 1.44 7
Presence of assembly point 121 1 0 1.02 8
Presence of alarm system 216 1 1 1.013 9
Presence of exit signs 217 1 0 1.004 10
Presence of enough fire
extinguishers
122 0 0 1 11
Presence of escape routes 218 0 0 1 12
The results show the paint industries have good fire safety preparedness measure in
place to ensure safety in case of any fire occurrence. With presence of escape routes
and enough fire assembly points leading at 100% and mean index 1 each, presence of
assembly point (99% mean index 1.02) and functional firefighting team at 66% mean
index 1.44. The study also showed majority had their escape routes not obstructed
(87.2 % mean index 1.89),had not put evacuation systems for disabled persons (82%
mean index 2.05 )as well as not installed fire detection systems(54.1 % mean index
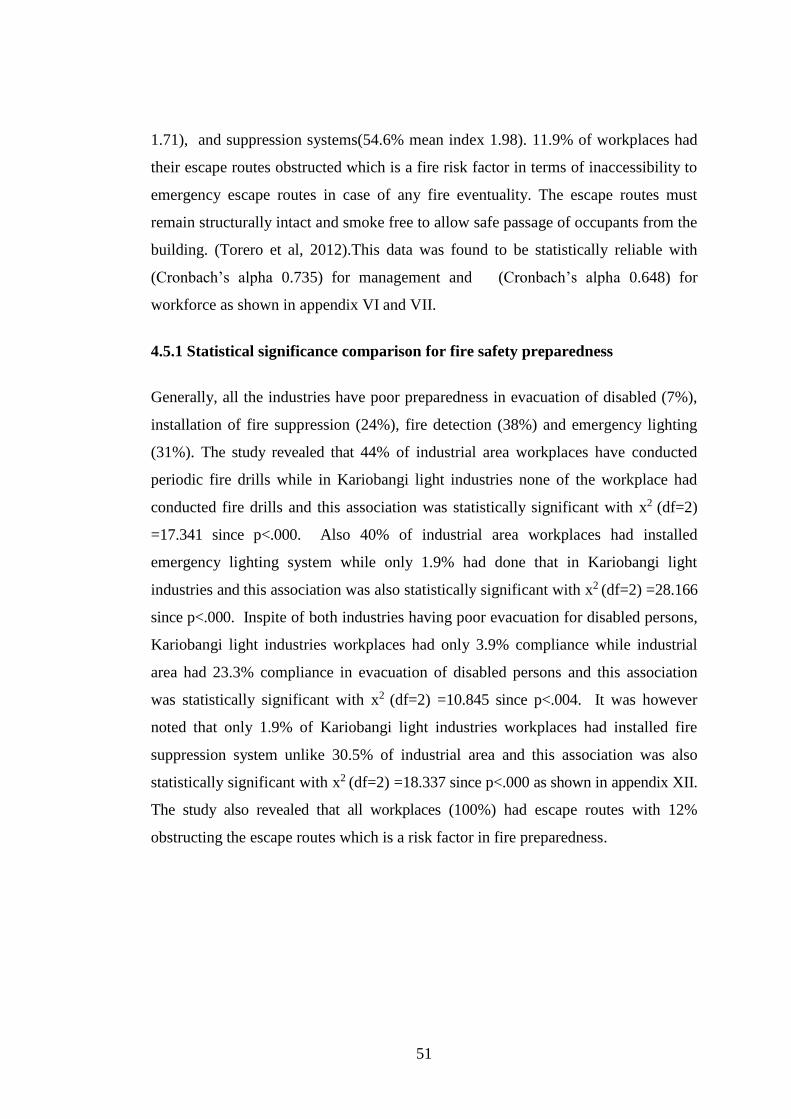
51
1.71), and suppression systems(54.6% mean index 1.98). 11.9% of workplaces had
their escape routes obstructed which is a fire risk factor in terms of inaccessibility to
emergency escape routes in case of any fire eventuality. The escape routes must
remain structurally intact and smoke free to allow safe passage of occupants from the
building. (Torero et al, 2012).This data was found to be statistically reliable with
(Cronbach’s alpha 0.735) for management and (Cronbach’s alpha 0.648) for
workforce as shown in appendix VI and VII.
4.5.1 Statistical significance comparison for fire safety preparedness
Generally, all the industries have poor preparedness in evacuation of disabled (7%),
installation of fire suppression (24%), fire detection (38%) and emergency lighting
(31%). The study revealed that 44% of industrial area workplaces have conducted
periodic fire drills while in Kariobangi light industries none of the workplace had
conducted fire drills and this association was statistically significant with x2 (df=2)
=17.341 since p<.000. Also 40% of industrial area workplaces had installed
emergency lighting system while only 1.9% had done that in Kariobangi light
industries and this association was also statistically significant with x2 (df=2) =28.166
since p<.000. Inspite of both industries having poor evacuation for disabled persons,
Kariobangi light industries workplaces had only 3.9% compliance while industrial
area had 23.3% compliance in evacuation of disabled persons and this association
was statistically significant with x2 (df=2) =10.845 since p<.004. It was however
noted that only 1.9% of Kariobangi light industries workplaces had installed fire
suppression system unlike 30.5% of industrial area and this association was also
statistically significant with x2 (df=2) =18.337 since p<.000 as shown in appendix XII.
The study also revealed that all workplaces (100%) had escape routes with 12%
obstructing the escape routes which is a risk factor in fire preparedness.
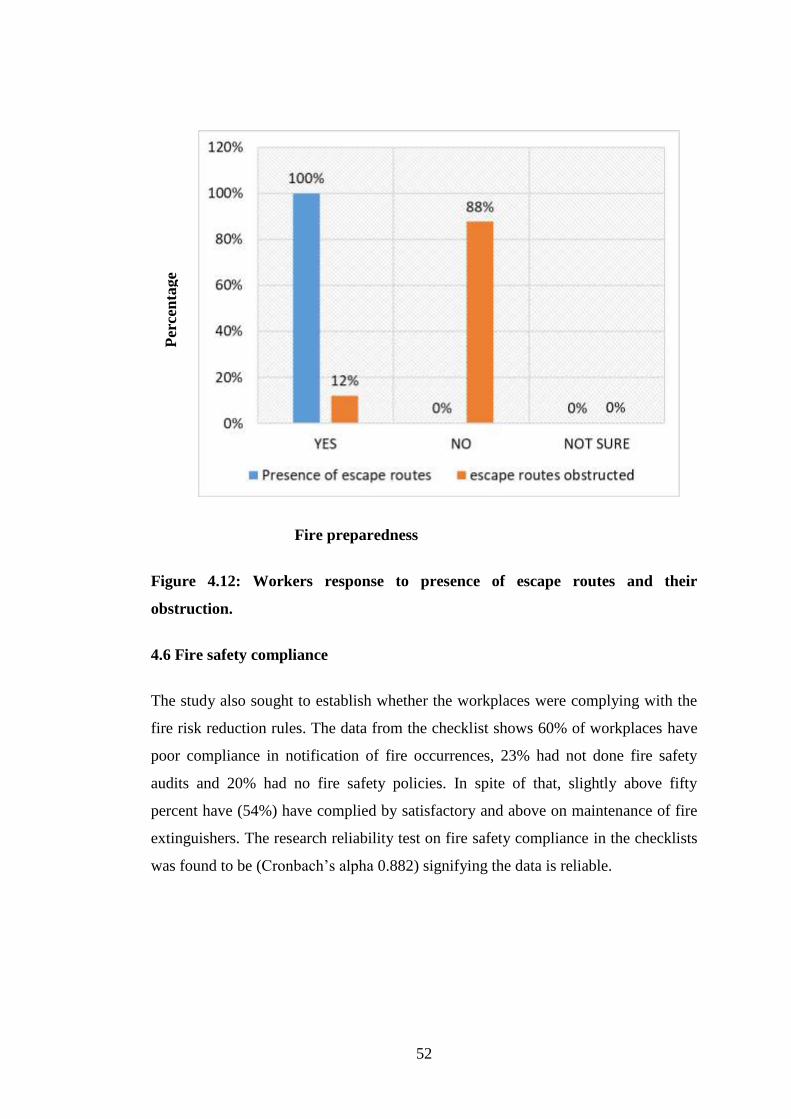
52
Fire preparedness
Figure 4.12: Workers response to presence of escape routes and their
obstruction.
4.6 Fire safety compliance
The study also sought to establish whether the workplaces were complying with the
fire risk reduction rules. The data from the checklist shows 60% of workplaces have
poor compliance in notification of fire occurrences, 23% had not done fire safety
audits and 20% had no fire safety policies. In spite of that, slightly above fifty
percent have (54%) have complied by satisfactory and above on maintenance of fire
extinguishers. The research reliability test on fire safety compliance in the checklists
was found to be (Cronbach’s alpha 0.882) signifying the data is reliable.
Per
cen
tage
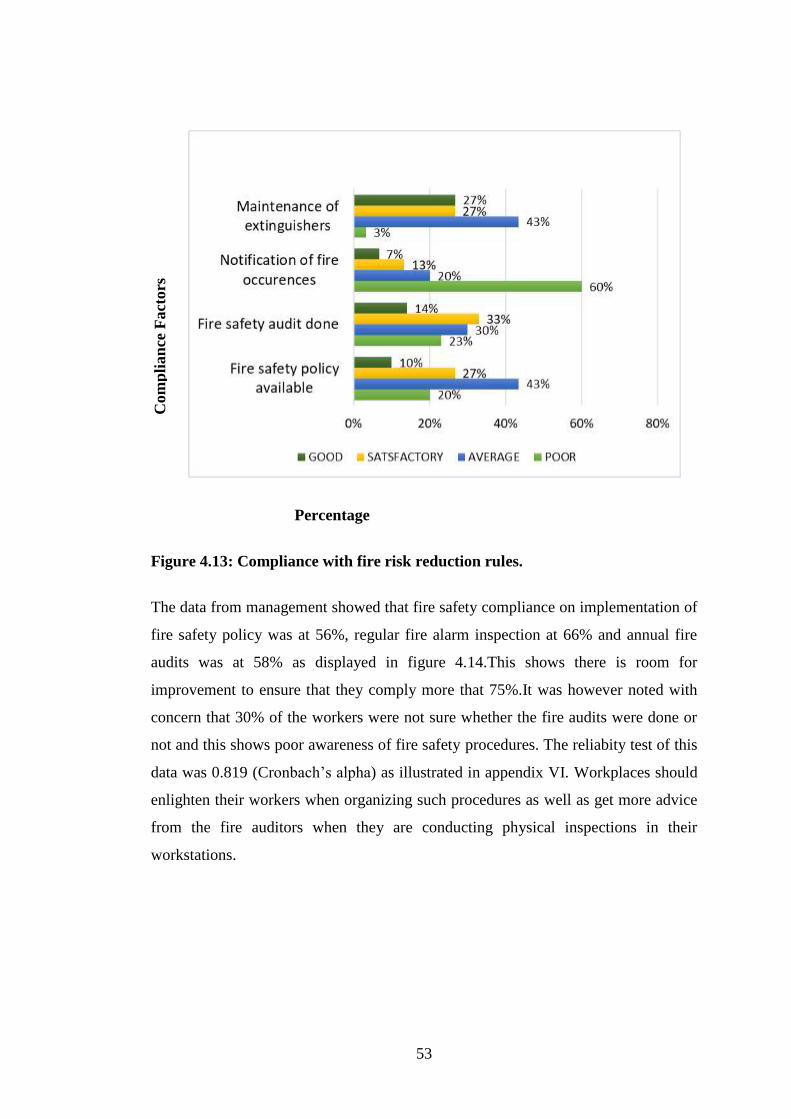
53
Percentage
Figure 4.13: Compliance with fire risk reduction rules.
The data from management showed that fire safety compliance on implementation of
fire safety policy was at 56%, regular fire alarm inspection at 66% and annual fire
audits was at 58% as displayed in figure 4.14.This shows there is room for
improvement to ensure that they comply more that 75%.It was however noted with
concern that 30% of the workers were not sure whether the fire audits were done or
not and this shows poor awareness of fire safety procedures. The reliabity test of this
data was 0.819 (Cronbach’s alpha) as illustrated in appendix VI. Workplaces should
enlighten their workers when organizing such procedures as well as get more advice
from the fire auditors when they are conducting physical inspections in their
workstations.
Com
pli
an
ce F
act
ors
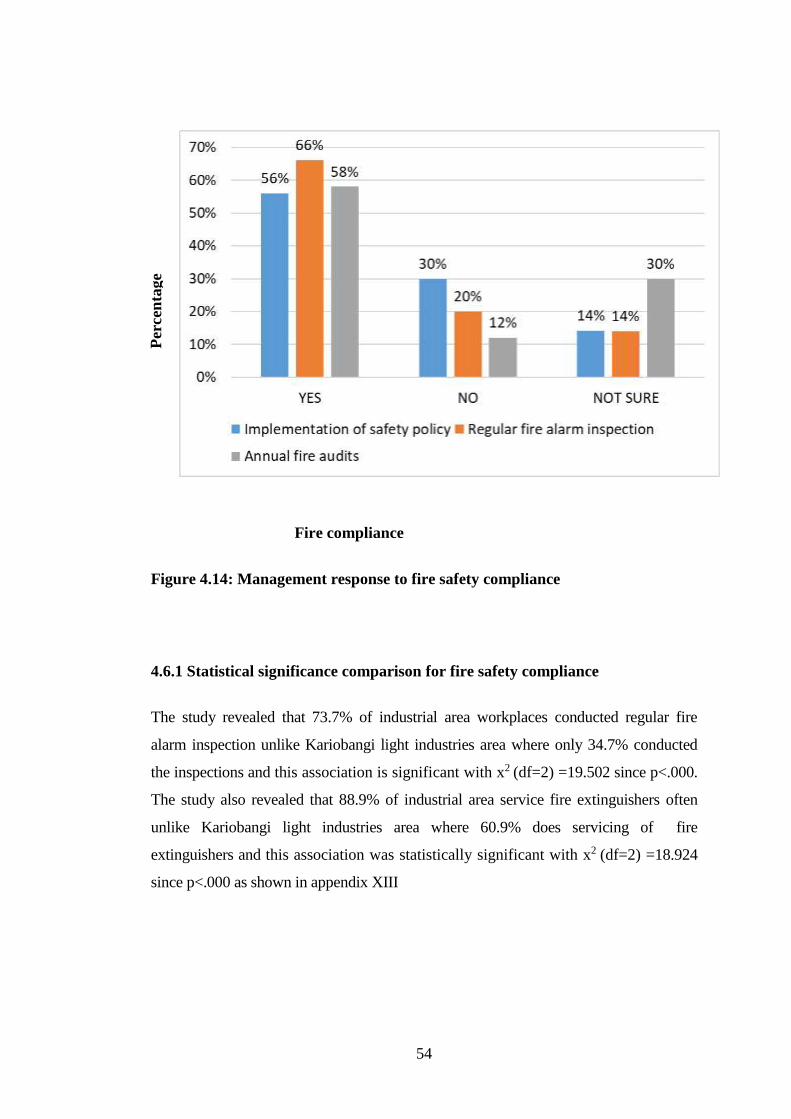
54
Fire compliance
Figure 4.14: Management response to fire safety compliance
4.6.1 Statistical significance comparison for fire safety compliance
The study revealed that 73.7% of industrial area workplaces conducted regular fire
alarm inspection unlike Kariobangi light industries area where only 34.7% conducted
the inspections and this association is significant with x2 (df=2) =19.502 since p<.000.
The study also revealed that 88.9% of industrial area service fire extinguishers often
unlike Kariobangi light industries area where 60.9% does servicing of fire
extinguishers and this association was statistically significant with x2 (df=2) =18.924
since p<.000 as shown in appendix XIII
Per
cen
tage
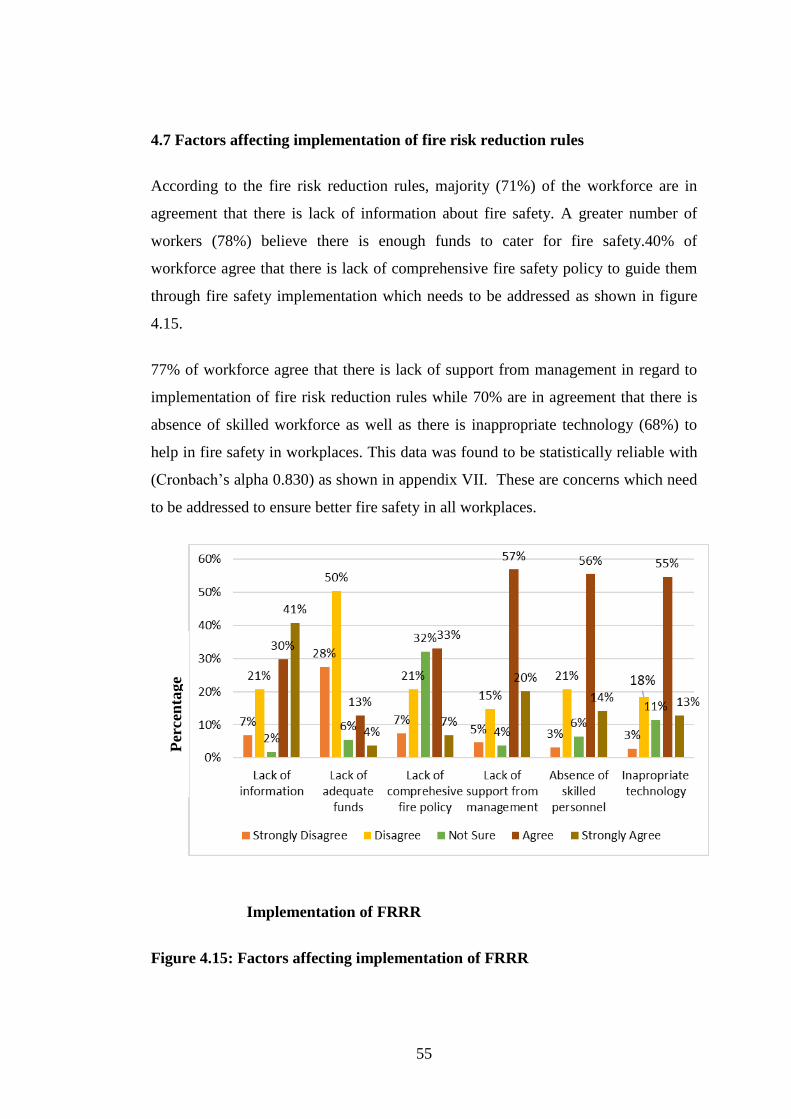
55
4.7 Factors affecting implementation of fire risk reduction rules
According to the fire risk reduction rules, majority (71%) of the workforce are in
agreement that there is lack of information about fire safety. A greater number of
workers (78%) believe there is enough funds to cater for fire safety.40% of
workforce agree that there is lack of comprehensive fire safety policy to guide them
through fire safety implementation which needs to be addressed as shown in figure
4.15.
77% of workforce agree that there is lack of support from management in regard to
implementation of fire risk reduction rules while 70% are in agreement that there is
absence of skilled workforce as well as there is inappropriate technology (68%) to
help in fire safety in workplaces. This data was found to be statistically reliable with
(Cronbach’s alpha 0.830) as shown in appendix VII. These are concerns which need
to be addressed to ensure better fire safety in all workplaces.
Implementation of FRRR
Figure 4.15: Factors affecting implementation of FRRR
Per
cen
tage
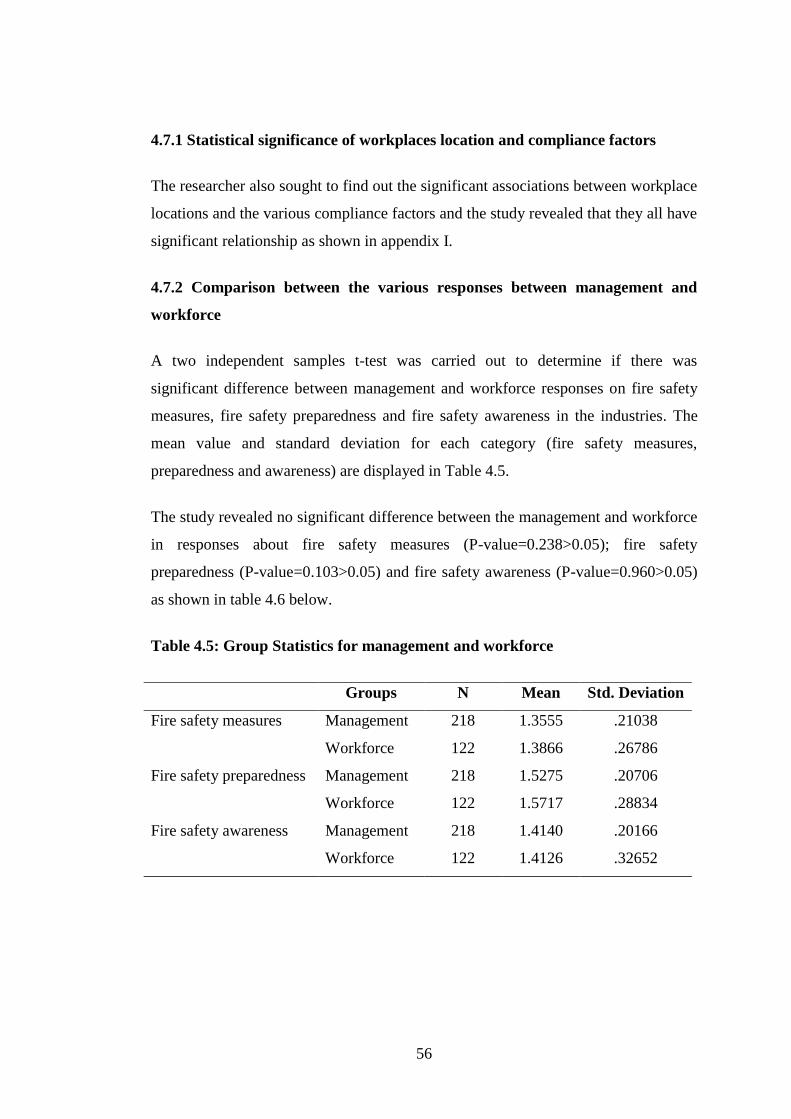
56
4.7.1 Statistical significance of workplaces location and compliance factors
The researcher also sought to find out the significant associations between workplace
locations and the various compliance factors and the study revealed that they all have
significant relationship as shown in appendix I.
4.7.2 Comparison between the various responses between management and
workforce
A two independent samples t-test was carried out to determine if there was
significant difference between management and workforce responses on fire safety
measures, fire safety preparedness and fire safety awareness in the industries. The
mean value and standard deviation for each category (fire safety measures,
preparedness and awareness) are displayed in Table 4.5.
The study revealed no significant difference between the management and workforce
in responses about fire safety measures (P-value=0.238>0.05); fire safety
preparedness (P-value=0.103>0.05) and fire safety awareness (P-value=0.960>0.05)
as shown in table 4.6 below.
Table 4.5: Group Statistics for management and workforce
Groups N Mean Std. Deviation
Fire safety measures Management 218 1.3555 .21038
Workforce 122 1.3866 .26786
Fire safety preparedness Management 218 1.5275 .20706
Workforce 122 1.5717 .28834
Fire safety awareness Management 218 1.4140 .20166
Workforce 122 1.4126 .32652
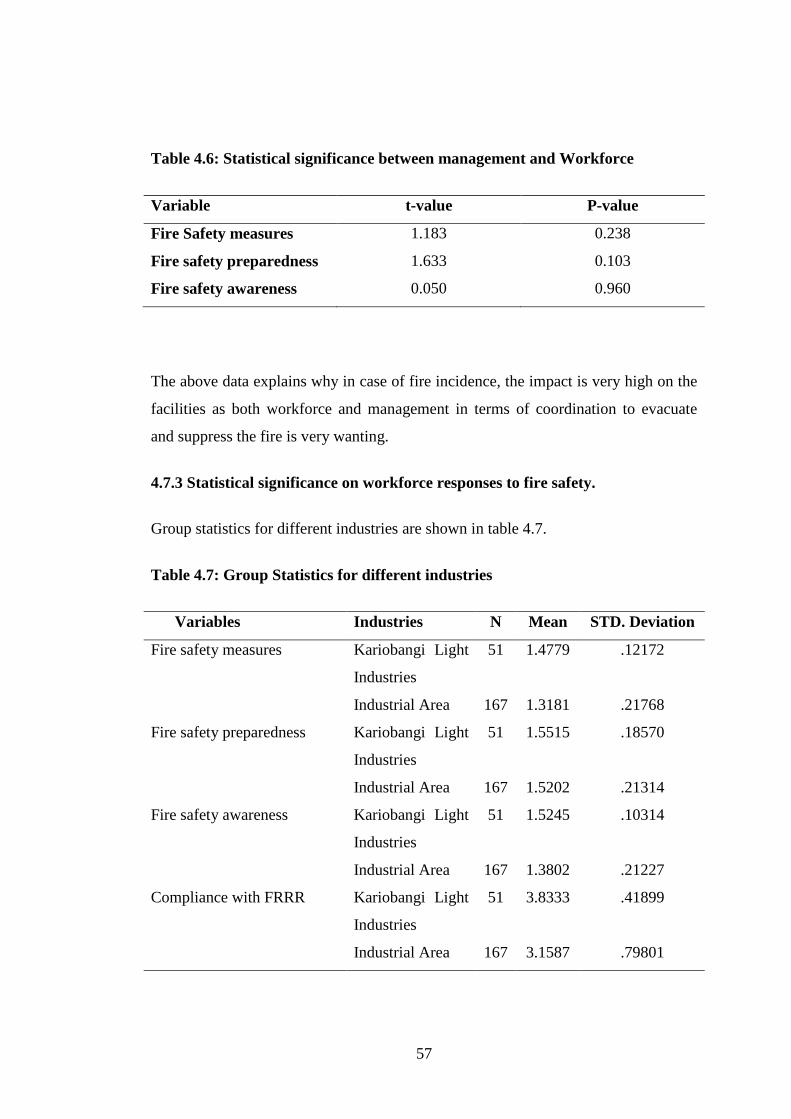
57
Table 4.6: Statistical significance between management and Workforce
Variable t-value P-value
Fire Safety measures 1.183 0.238
Fire safety preparedness 1.633 0.103
Fire safety awareness 0.050 0.960
The above data explains why in case of fire incidence, the impact is very high on the
facilities as both workforce and management in terms of coordination to evacuate
and suppress the fire is very wanting.
4.7.3 Statistical significance on workforce responses to fire safety.
Group statistics for different industries are shown in table 4.7.
Table 4.7: Group Statistics for different industries
Variables Industries N Mean STD. Deviation
Fire safety measures Kariobangi Light
Industries
51 1.4779 .12172
Industrial Area 167 1.3181 .21768
Fire safety preparedness Kariobangi Light
Industries
51 1.5515 .18570
Industrial Area 167 1.5202 .21314
Fire safety awareness Kariobangi Light
Industries
51 1.5245 .10314
Industrial Area 167 1.3802 .21227
Compliance with FRRR Kariobangi Light
Industries
51 3.8333 .41899
Industrial Area 167 3.1587 .79801
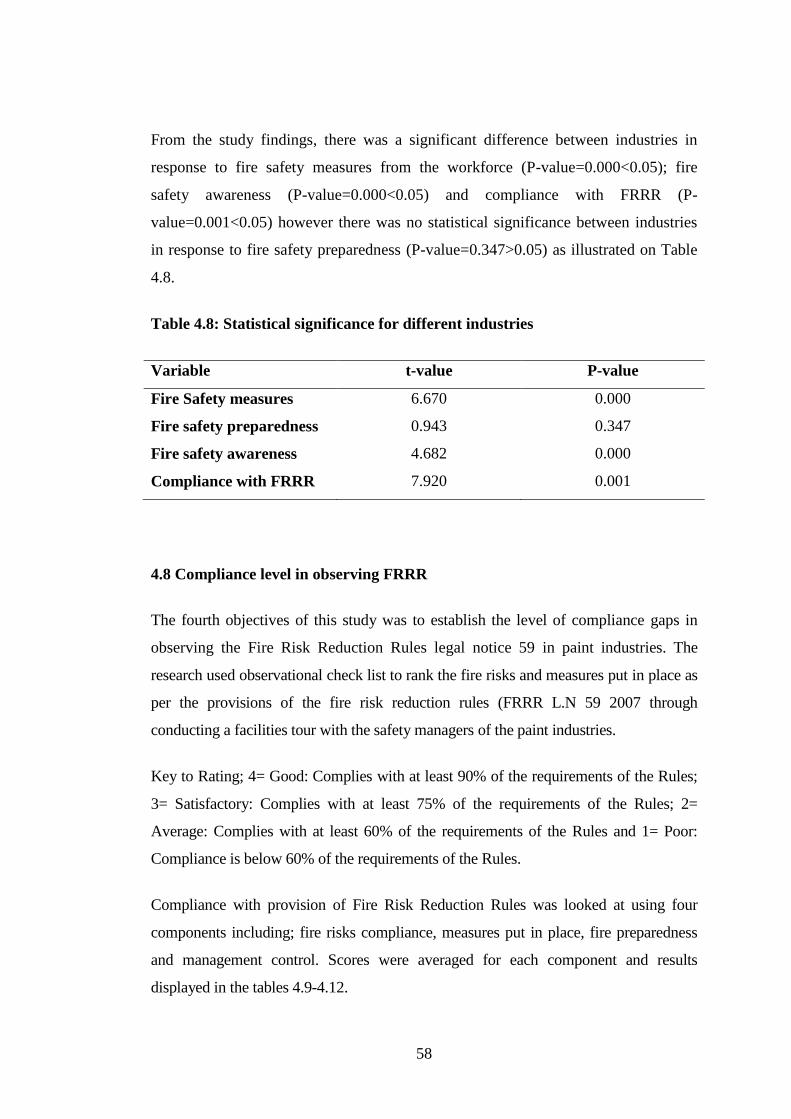
58
From the study findings, there was a significant difference between industries in
response to fire safety measures from the workforce (P-value=0.000<0.05); fire
safety awareness (P-value=0.000<0.05) and compliance with FRRR (P-
value=0.001<0.05) however there was no statistical significance between industries
in response to fire safety preparedness (P-value=0.347>0.05) as illustrated on Table
4.8.
Table 4.8: Statistical significance for different industries
Variable t-value P-value
Fire Safety measures 6.670 0.000
Fire safety preparedness 0.943 0.347
Fire safety awareness 4.682 0.000
Compliance with FRRR 7.920 0.001
4.8 Compliance level in observing FRRR
The fourth objectives of this study was to establish the level of compliance gaps in
observing the Fire Risk Reduction Rules legal notice 59 in paint industries. The
research used observational check list to rank the fire risks and measures put in place as
per the provisions of the fire risk reduction rules (FRRR L.N 59 2007 through
conducting a facilities tour with the safety managers of the paint industries.
Key to Rating; 4= Good: Complies with at least 90% of the requirements of the Rules;
3= Satisfactory: Complies with at least 75% of the requirements of the Rules; 2=
Average: Complies with at least 60% of the requirements of the Rules and 1= Poor:
Compliance is below 60% of the requirements of the Rules.
Compliance with provision of Fire Risk Reduction Rules was looked at using four
components including; fire risks compliance, measures put in place, fire preparedness
and management control. Scores were averaged for each component and results
displayed in the tables 4.9-4.12.
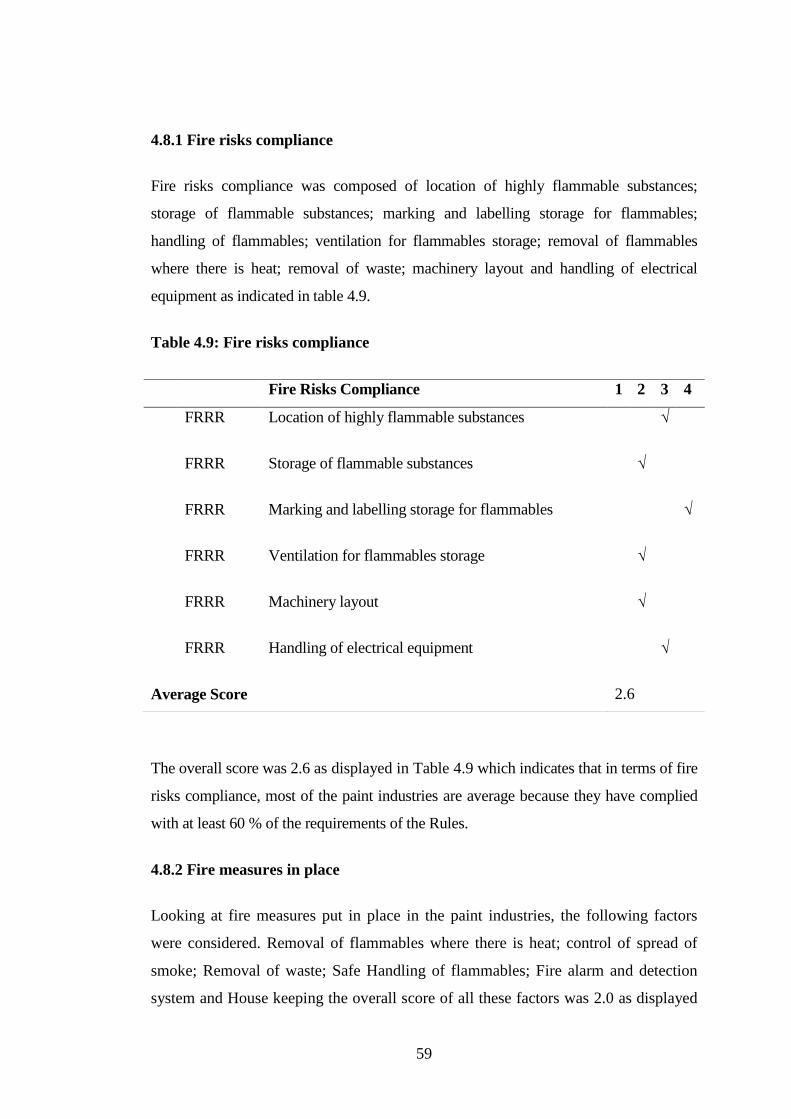
59
4.8.1 Fire risks compliance
Fire risks compliance was composed of location of highly flammable substances;
storage of flammable substances; marking and labelling storage for flammables;
handling of flammables; ventilation for flammables storage; removal of flammables
where there is heat; removal of waste; machinery layout and handling of electrical
equipment as indicated in table 4.9.
Table 4.9: Fire risks compliance
The overall score was 2.6 as displayed in Table 4.9 which indicates that in terms of fire
risks compliance, most of the paint industries are average because they have complied
with at least 60 % of the requirements of the Rules.
4.8.2 Fire measures in place
Looking at fire measures put in place in the paint industries, the following factors
were considered. Removal of flammables where there is heat; control of spread of
smoke; Removal of waste; Safe Handling of flammables; Fire alarm and detection
system and House keeping the overall score of all these factors was 2.0 as displayed
Fire Risks Compliance 1 2 3 4
i. FRRR Location of highly flammable substances √
ii. FRRR Storage of flammable substances √
iii. FRRR Marking and labelling storage for flammables √
iv. FRRR Ventilation for flammables storage √
v. FRRR Machinery layout √
vi. FRRR Handling of electrical equipment √
Average Score 2.6
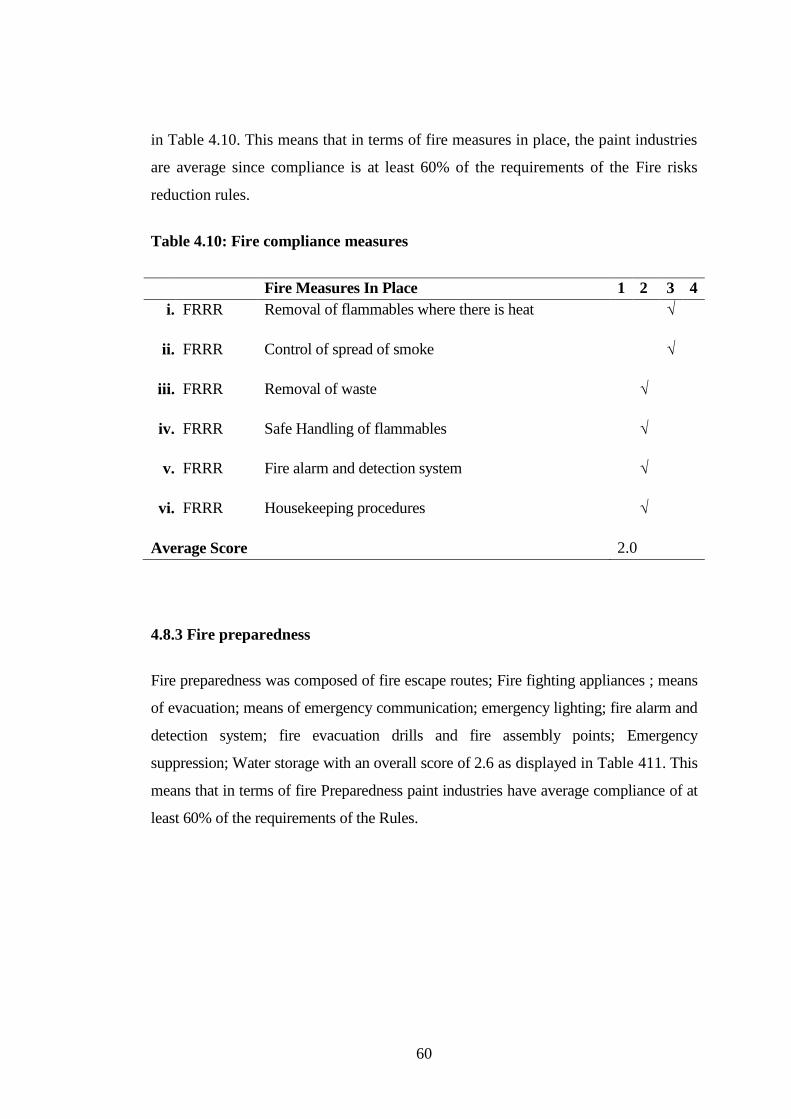
60
in Table 4.10. This means that in terms of fire measures in place, the paint industries
are average since compliance is at least 60% of the requirements of the Fire risks
reduction rules.
Table 4.10: Fire compliance measures
Fire Measures In Place 1 2 3 4
i. FRRR Removal of flammables where there is heat √
ii. FRRR Control of spread of smoke √
iii. FRRR Removal of waste √
iv. FRRR Safe Handling of flammables √
v. FRRR Fire alarm and detection system √
vi. FRRR Housekeeping procedures √
Average Score 2.0
4.8.3 Fire preparedness
Fire preparedness was composed of fire escape routes; Fire fighting appliances ; means
of evacuation; means of emergency communication; emergency lighting; fire alarm and
detection system; fire evacuation drills and fire assembly points; Emergency
suppression; Water storage with an overall score of 2.6 as displayed in Table 411. This
means that in terms of fire Preparedness paint industries have average compliance of at
least 60% of the requirements of the Rules.
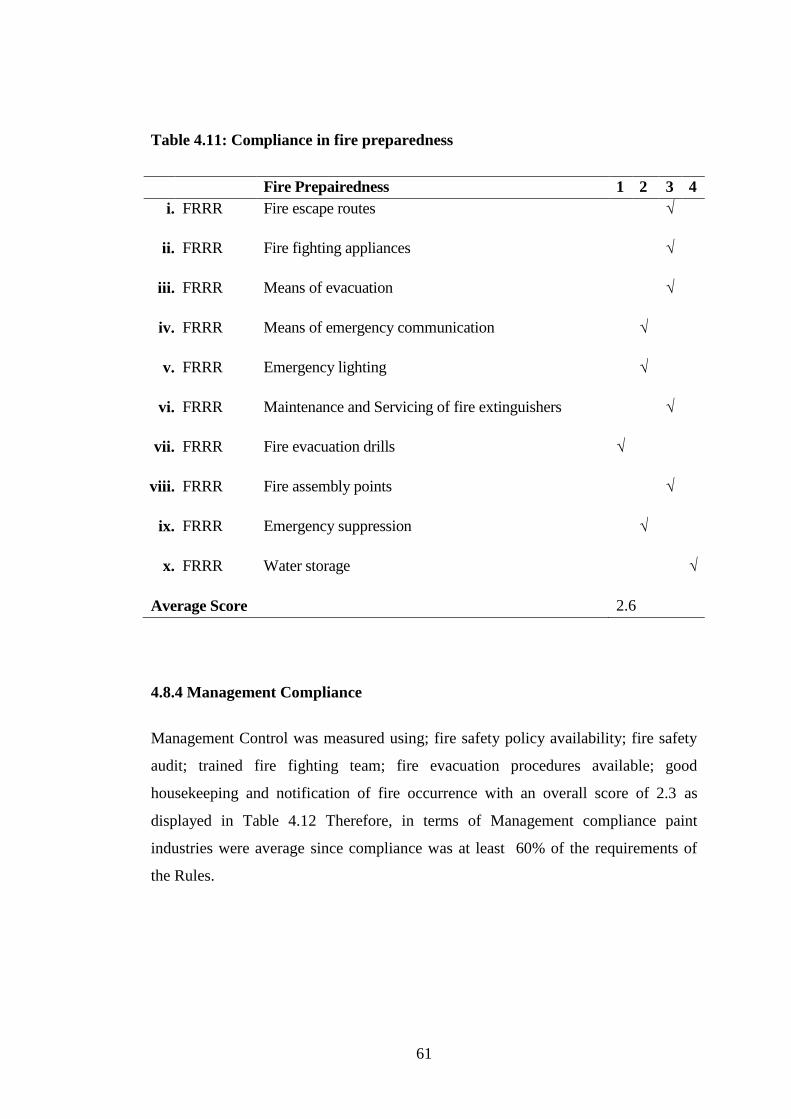
61
Table 4.11: Compliance in fire preparedness
Fire Prepairedness 1 2 3 4
i. FRRR Fire escape routes √
ii. FRRR Fire fighting appliances √
iii. FRRR Means of evacuation √
iv. FRRR Means of emergency communication √
v. FRRR Emergency lighting √
vi. FRRR Maintenance and Servicing of fire extinguishers √
vii. FRRR Fire evacuation drills √
viii. FRRR Fire assembly points √
ix. FRRR Emergency suppression √
x. FRRR Water storage √
Average Score 2.6
4.8.4 Management Compliance
Management Control was measured using; fire safety policy availability; fire safety
audit; trained fire fighting team; fire evacuation procedures available; good
housekeeping and notification of fire occurrence with an overall score of 2.3 as
displayed in Table 4.12 Therefore, in terms of Management compliance paint
industries were average since compliance was at least 60% of the requirements of
the Rules.
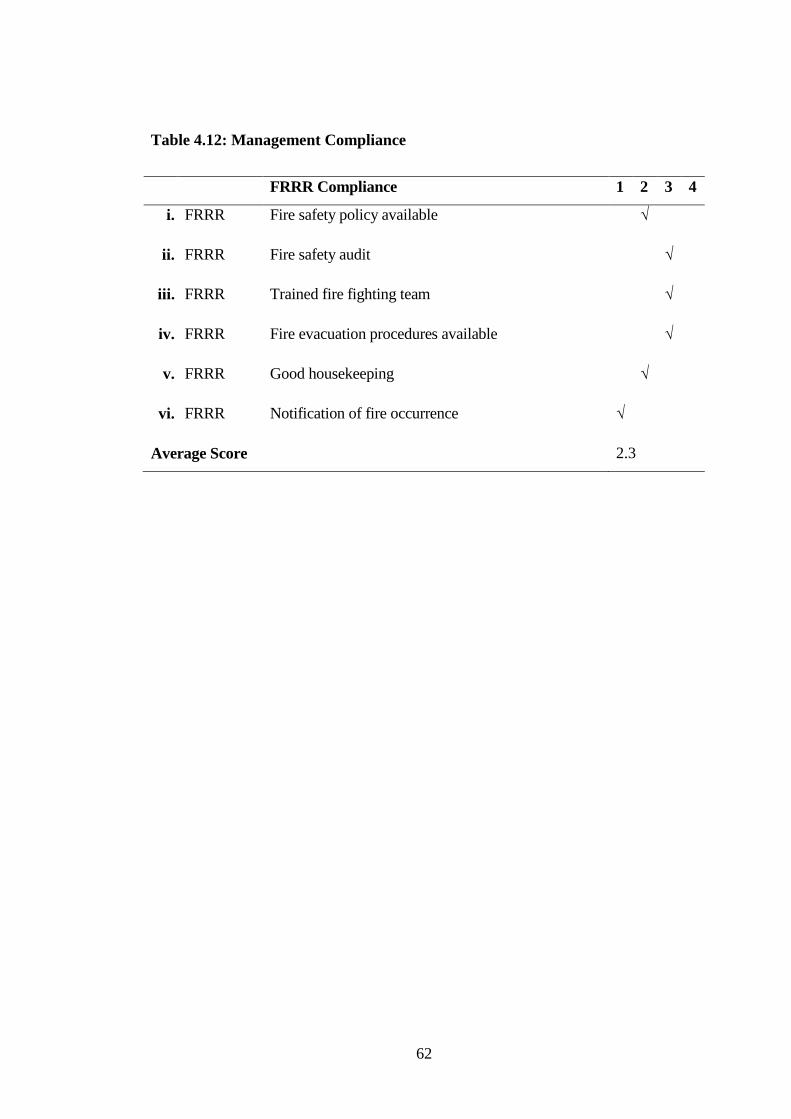
62
Table 4.12: Management Compliance
FRRR Compliance 1 2 3 4
i. FRRR Fire safety policy available √
ii. FRRR Fire safety audit √
iii. FRRR Trained fire fighting team √
iv. FRRR Fire evacuation procedures available √
v. FRRR Good housekeeping √
vi. FRRR Notification of fire occurrence √
Average Score 2.3
63
CHAPTER FIVE
CONCLUSION AND RECOMMENDATION
This chapter gives the conclusion and the recommendation of the research study
based on the findings from the collected data. Conclusions are derived from results
of the analysis.
5.1 Conclusion
This study has established that majority of workers are skewed towards male, with
more male representation in both management and workforce. It also found that most
of the workers are well educated which would make them understand OSH issues as
per the OSHA act 2007. Also, it’s significant to note that some few managers are of
primary level who have worked for more than eight years showing their experience
of work have made them experts in paints hence they are given management position
in various sections.
This study also revealed that there is high turnover in workforce and it’s high on
female than male workers. It was significantly evident that majority of the learned
workers have shown high turnover either leaving for greener pastures or change of
careers.
With the high workers turnover, it means more new workers are being recruited often
and may not have the experience of handling flammables and as a result increase the
risks of causing fires out of ignorance and negligence. Also more finance may be
required to train the new workers on fire safety which is a cost implication to the
company.
The first objective of the study sought to find out the fire risks found in the
workplaces. The study evidently showed that fire occurrences have occurred in
majority of paint industries and the major fire risks factors were mainly storage,
handling and transportation of flammables and handling electrical equipment’s in
workplaces and the fire risks are in both raw materials and end products. This study
has shown that most of the workplaces had complied with the fire risks reduction
64
rules at 60% in regard to storage of flammables, safe handling, labelling and
transportation of flammables which is average and needs to be improved. The study
has also found that handling of electrical equipment was wanting and needs to be
improved because it can be one of the causes of electrical fires and this agrees with
Gold and Koigi, 2009 who said that majority of fires in workplaces are caused by
faulty electrical appliances and exposed cables. Also, poor housekeeping methods
can increase the chances of fire occurrences hence the need to improve on
housekeeping in workplaces. On workplace comparison, it was evident that most of
workplaces in industrial area had good electrical safety and that flammables were
kept in good ventilation, well labelled and marked as well as handled and transported
safely. However, storage and handling of flammables in Kariobangi light industries
was wanting which is a major fire risk factor. The study also found that most of the
workplaces have experienced fire occurrences however, recording of fire incidences
was poor hence preventing statistical information on monitoring fire occurrences.
The second objective of the study sought to find fire safety and awareness measures
put in place in workplaces. Most of the paint industries were found to comply with
at least 50% on handling of electrical equipment’s, control of smoke, maintenance of
fire appliances, housekeeping procedures, color coding and distributing fire
appliances as per fire risks which is seen to be average compliance. Conjointly, most
had ways to prevent ignition of flammables, safe handling and transportation of
flammables and removal of flammable vapor from ignition. However compliance
was poor on machine layout resulting to blockage of pass ways and exits which is a
fire risk factor and needs to be addressed to ensure that the pass ways and exits are
cleared for easy evacuation in case of any fire eventuality.
On fire safety awareness, the study revealed that majority of workers were well
trained on fire safety and the workplaces had functional firefighting teams. However,
there was poor fire safety awareness to visitors and contractors working within the
work premises. A greater number of workers were not aware of fire risks reduction
rules and had not read the fire safety policy in spite of the policy being there. Most
workers were aware of evacuation procedure and fire rescue services as well as
locations of fire emergency exits in their workplaces since they were well marked,
65
this supports Mostue (2001) who documented that awareness level of the fire safety
management will help reduce the losses and damages suffered during fire outbreaks.
It was however noted that some of fire emergency exits were sometimes blocked by
packages of raw materials and finished products which could jeopardize evacuation
in case of any emergency.
It was significantly noted that Industrial area workplaces had put more fire safety
measures as compared to Kariobangi light industries mainly on functional fire
fighting team, safe handling and transportation of flammables hence law enforcers
should focus compliance on those areas.
The third objective of this study was to establish levels of fire safety preparedness.
The research found that majority had complied on averagely (60%) mainly in
sufficient fire exits and presence of evacuation procedures. It was evident there was
adequate water storage and enough fire fighting appliances to help fight fire and this
is in agreement with CFOA (2006) that fire safety appliances are quite essential in
fighting and lack of these facilities would lead to major disasters. On the other hand,
there was poor compliance in installation of fire detectors, emergency lighting
system, emergency suppression system and evacuation of disabled persons both
hearing and physical disability.
The study has also found that most of the workplaces do not conduct fire drills as
required by the regulation. This is a wakeup call for the enforcers to ensure all
workplaces comply with this requirement. The fire drills help eliminate mistakes that
would otherwise occur during a real emergency. Evacuation procedures were well
posted and most of the workers knew of actions to take in case of fire outbreak thus
supporting Salvano (2002) recommendation that coordination is an essential
ingredient in a disaster preparedness plan which means arrangements and
preparations should be put in place not only to prevent a disaster, but also to be
implemented once a disaster occurs. The study established most facilities had fire
alarms which were audible enough and were regularly inspected. However, there is
need to ensure the deaf persons as well are alerted in case of any fire eventuality.
They can be alerted by signages or light signals. Most of the workplaces had enough
66
fire extinguishers which were well serviced and distributed as per fire risks and were
easily accessible which is very important in fire safety preparedness.
The final objective was to find compliance levels with the fire risk reduction rules,
the study showed Most of the workplaces had Fire safety policies which were being
implemented partly and that only few workers had read the policy. This means there
is lack of proper communication which needs to be improved. Majority comply with
the requirement of conducting annual audits, however quite a number of workers
were not sure whether the audits are done annually or not. Workplaces should be
well sensitized on the importance of conducting annual fire safety audits and
rectifying the recommendations highlighted by the fire safety auditors.
The study also sought to find factors affecting implementation of fire risk reduction
rules in workplaces, majority of the workers agreed that there was lack of
information on fire safety, lack of comprehensive fire safety policy, lack of support
from management and lack of information for fire safety compliance, lack of
appropriate technology as well as skilled workforce.
Based on the results of the study we accept the hypothesis that Fire safety
compliance measures being undertaken by paint industries in Nairobi have led to
reduction of fire incidences.
5.2 Recommendation
Based on the study, the data obtained from the research was only for the Nairobi
County where most paint industries are situated. However, there is need for more
research to be done from all other counties in the country to understand the
magnitude of the fire safety concerns in the paint industry at large.
Due to high turnover of workers as the research has revealed, it’s recommended that
further studies be done to find out why there is high workers turnover and find ways
of generally maintaining workers who in turn will gain experience in handling paints
hence prevent and control fire occurrences.
67
Its recommended that with the high risk of fire from the storage, transportation and
handling of flammables, daily fire risk assessments on job assigned should be
emphasized to help identify the fire risks and prevent or/and control them as
emphasized by The Health and safety executive (2006) stating that Fire risk
assessment is a critical activity that helps in the protection of workers as well as
bringing an institution to be in compliance with the law of the land.
The study suggests that paint workplaces to have daily, weekly and monthly
electrical inspection/maintenance schedules done by the electricians so that they can
be able to correct faulty electrical appliances and electrical exposed cables which can
cause electrical fires. Also Workplaces should record all fire incidences to help
researchers get statistical information and also help monitoring fire incidences with
the aim of finding root causes of fire and preventing future occurrences.
The study advocates for proper monitoring of measures put in place to control
/prevent fire occurrences by both managements and government officials in regard to
fire safety. Regular inspection should be done often by the relevant government
agencies responsible for fire safety in paint industries as significant facilities had low
compliance levels. Majorly law enforcers to focus on the few facilities which do not
have adequate fire extinguishers and are not well serviced as well as not distributed
as per the fire risks to ensure they comply.
The study proposes paint industries to institute mandatory fire safety induction
programs to all new workers as well as to visitors and outside contractors to ensure
fire safety awareness is achieved. Workplaces should also ensure continuous fire
safety training to enhance awareness for both new and old employees, provide fire
safety information to workers as well as having appropriate technology to enhance
fire safety at work.
The study suggests proper systems to be put to aid evacuation of disabled persons
both hearing and physical disability. There is need for law enforcers to ensure all
paint industries have emergency lighting systems, alarm system, fire suppression
systems and fire detection installed as well as ensure their routine inspection as per
the law, this will help in evacuation as well as putting off fires as soon as it occurs
68
and ensure good fire safety preparedness. Also workplaces should ensure all
emergency exits are not blocked but clear for easy movement.
The study urges the managements to ensure all workers read and understand the fire
safety policy so they can be part of the implementation process which will enhance
fire safety in the workplaces.
The study recommends that DOSHS officers to enforce the law as per fire risks
reduction rules legal notice 59 and strategize on compliance campaign including
conducting workshops, publishing essential fire safety rules among others in all paint
industries within Nairobi County. It is further recommended that the officers inspect
workplaces to ensure they comply with conducting annual fire audits, fire safety
training and periodic fire drills because these will help the employees understand
what to do in case of any fire emergencies.
69
REFERENCES
Association of Kenya insurance, (2012). Insurance industry annual report, Retrieved
from: www.akinsure.or.ke/
Babbie, E. (2002). Survey research methods. Belmont, CA: Wadsworth
Bartlett, J., Kotrlik, J. & Higgins, C. (2001). Organizational Research: Determining
appropriate sample size in Survey Research Information Technology,
Learning and Performance Journal, 19(1), 49.
Bischoff, H. (2008). Risks in Modern Society, London: Springer
Boon, J. J., & Oberthaler, E. (2013). Mechanical weakness and chemical reactivity
observed in the paint structure and surface of The Art of Painting by
Vermeer. Vermeer, die Malkunst–Spurensicherung an einem
Meisterwerk: Ausstellungskatalog des Kunsthistorischen Museums Wien.
Vienna: Residenz Verlag, 235-253.
Brown, K. S., Marean, C. W., Herries, A. I., Jacobs, Z., Tribolo, C., Braun, D., ... &
Bernatchez, J. (2009). Fire as an engineering tool of early modern
humans. Science, 325(5942), 859-862.
Brown, K., Marean, C., Herries, A., Jacobs, Z., Tribolo, C., Braun, D., Roberts, D.,
Meyer, M., & Bernatchez, J. (2009). Fire as an Engineering Tool of Early
Modern Humans, Science, 325(5942), 859-62.
Chief fire Officers Association, (2006). Guidance on the provision of sprinklers in
schools. Nairobi: Chief fire Officers Association
Cote, A. (1991). Fire Protection Handbook, Quincy, Mass: NFPA.
Cote, A. (2011). Fire Protection Handbook, Quincy, Mass: NFPA. Retrieved from
http://catalog.nfpa.org/Fire-Protection-Handbook-20th-Edition-
P13860.aspx
70
Davies, A. (2008). Access code, Fire risk management, 18-21.
Dowd, K. (2002). In case of a fire: Can you guess the number one way to protect
yourself and your family from being killed or injured in a home fire?
Current Health, 29(3), 27.
Engert, P. & Lansdowne, Z. (1999) “Risk Matrix User’s Guide, Version 2.2” MITRE
European Commission (2003) “Fire Risk Assessment Methods: Report
on the study into the fire risk to European Cultural Heritage” FiRE-
TECH.”
Fire protection association, (2007). Approved document B: fire safety (volume 2)
incorporating insurers’ requirement for property protection’ London:
RIBA publishing
Fraser-Mitchel, J. Shipp, M. & Martin, B. (2007). Building Bulletin 100: Design For
fire safety in schools. London: NBS
GoK, OSHA, (2007). Kenya Gazette Supplement No. 111 (Acts No. 15) The
Occupational Safety and Health Act, 2007, Laws of Kenya, Nairobi:
Government Printers.
Gold, D. & Koigi, K. (2009). Fire protection Checklist, FINNIDA-ILO.
Government of Kenya, (2007). Factories and other places of work (fire risk
reduction rules. Nairobi, Kenya: Government printer
Haessler, W. (1989). Fire: Fundamentals and Control, Routledge: CRC press.
Health Service Executive, (2006). Five steps to risk assessment. London: HSE
Health Service Executive. (2007). Risk Management in the HSE: An Information
Handbook. London: HSE.
HMSO, (1999). Home Office, Scottish Executive Department of Environment,
Northern Ireland. Fire Safety: An Employer’s Guide, London: HSE.
71
http://www.buildings.com/article-details/articleid/2846/t
http://www.chacha.com/question/what-three-basic-ingredients-are-all-paints-made-
up-of#sthash.YW7l1so2.dpuf
Ingason, H. Tuovinen, H. & Lönnermark, A. (2010). Industrial fires – An Overview
SP Technical Research Institute of Sweden. Brandforsk Project, 601-671.
Karanja, I (2012). Workplace Fires: An Assessment of Fire Safety Measures in
Supermarkets within Nairobi, Kenya, Journal Of Agriculture, Science
And Technology, 18(2), 63-96.
Kelvin, K. (2009). Occupational Health and Safety management in Kenya: Lessons
from the Japanese Experience with OHSAS 18001/18002, Nairobi: ACTS
press.
Kennedy, R.C. (2003). Applying principals of adult learning: The key to more
effective training programs, FBI Law Enforcement Bulletin, 72(4), 5.
Kisilu, D.K. &Tromp, D.L.A. (2006). Proposal and thesis writing: An Introduction.
Nairobi: Pauline’s publications Africa.
Macharia, G. (2013). Evaluation of Fire Safety Status of Selected Public and Private
Universities in Kenya with Reference to Fire Risk Reduction Rules, 2007,
Unpublished MSc thesis, Juja: JKUAT.
Mackenzie, S., (2008).Virtuous Circle Fire Safety Engineering. Fire
technology, 53(3), 1011-1037.
Mallet, L. & Brnich M. (1999). Focus on prevention: Conducting a Fire Risk
Assessment National Institute of OSH., US: CDC.
Matti K. (1996). Fire Safety of Buildings, Trends and the Role of CIB W14. NIS,
Finland: Seinajoki Polytechnic
72
Michael, D. & Clark, T. (1974). Metal Protection Section, the Paint Research
Association Teddington, U.K: X-Polymers-D-Paints and Pigments.
Ministry of education, (2008). The safety standards manual for schools. Nairobi:
Ministry of education.
Ministry of Education. (2008). Safety standards manual for schools in Kenya.
Nairobi: Church World Service
Mostue, B., Hansen, A. S., & Pedersen, K. S. (2001). Smoke detectors and fire
extinguishing equipment in residences-Evaluation after ten year with
prescriptions. In Proceedings from the 9th International Fire Science and
Engineering Conference (INTERFLAM), Edinburgh, Inter science
Communications.
Mugenda O.M. & Mugenda, A.G. (1999). Research methods: quantitative and
qualitative approaches. (pp. 46 - 48). Nairobi: Africa Centre for
Technology Studies.
Mutai, B (2000). How to write quality research proposals: a complete and simplified
guide. Edinburg, scortland: Thelley publications.
Naito, M. (1994). Fire prevention and protection, Geneva: FINNIDA-ILO.
NCC (2016). Fire Occurrence books. Australia: NCC.
Okungu, J. (2006). Endless national tragedies in Kenya: For how long can we put up
with a negligent and an uncaring social system? Retrieved from
http://www.afroarticles.com/article-dashboard
Salvano, B. (2002). Gender mainstreaming in disaster reduction. International
strategy for disaster reduction. Retrieved from www.unisdr.org
Schifiliti, R. (2003). Notification appliances. In A. Cote (Ed.), Fire protection
handbook (19th ed., Vol. 2, Section 9, pp. 35-42). Quincy, MA: National
Fire Protection Association.
73
Second medium term plan (2013-2017). Transforming Kenya: pathway to
devolution, socio-economic development, equity and national unity.
Stellman, J. (2004). Encyclopedia of Occupational Health and Safety, CD Version,
Geneva: ILO.
Stokes, L. (2007). Towering Inferno Costs., New York: Random House.
Thomson, D, (2004).The fire fighter’s hand book: Essentials of firefighting and
emergency. The Journal of Strength & Conditioning Research, 25(4),
956-965
Tonui, W. (2009). Basic Fire Safety and Prevention Guide, Nairobi: Masola
Publishers.
Torero, T.L, Usmani, A., Welch, S., Bisby, L.A, & Rein, G., (2012). Real fires for
the safe Design of tall buildings. UK: Engineering and Physical Science
Research Council.
U.S. Department of Labor (2006). Fire Service Features of Buildings and Fire
Protection Systems, US: Occupational Safety and Health Administration.
U.S. Department of Labor, (2001). How to plan for workplace emergencies and
evacuations, US: Occupational Safety and Health Administration.
U.S. Fire Administration. (2008). Nonresidential Building Fire. New York: Federal
Emergency Management Agency (FEMA)
Waldie, J. M, (1974, 1983). (Chairman, textbook editing committee); Surface
Coatings. Volume 1 - Raw Materials and Their Usage, Australia: Oil and
Colour Chemists' Association.
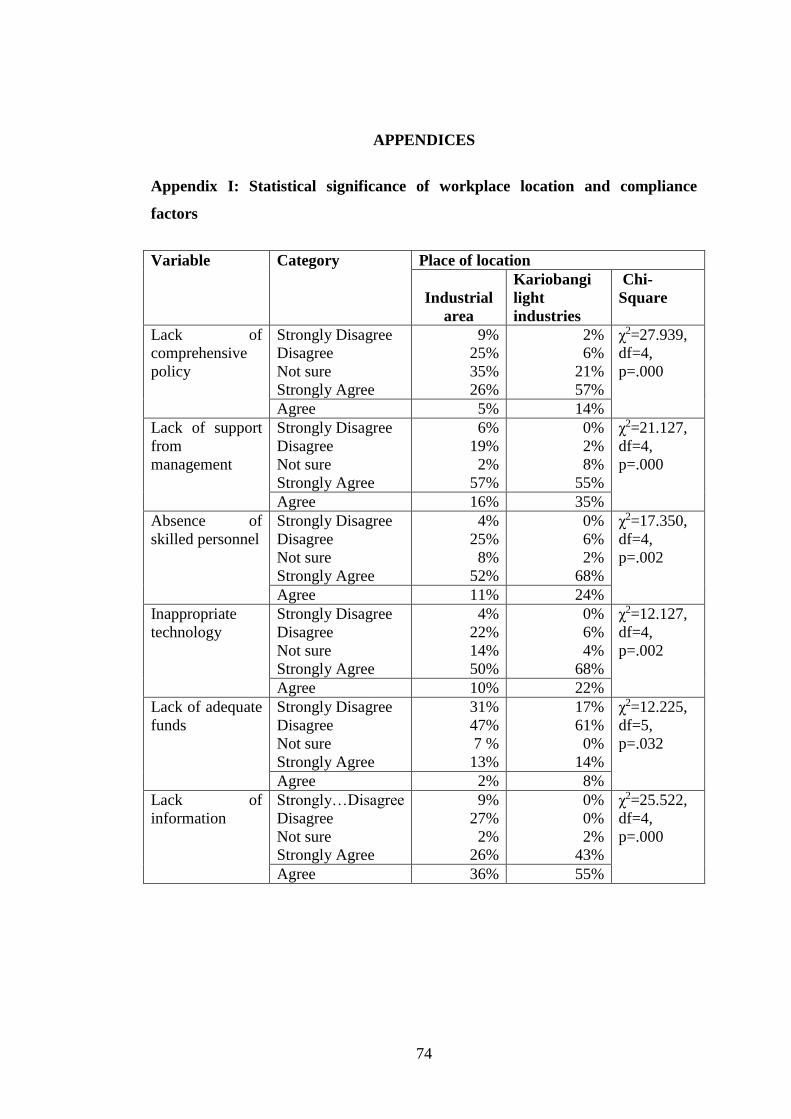
74
APPENDICES
Appendix I: Statistical significance of workplace location and compliance
factors
Variable Category Place of location
Industrial
area
Kariobangi
light
industries
Chi-
Square
Lack of
comprehensive
policy
Strongly Disagree
Disagree
Not sure
Strongly Agree
9%
25%
35%
26%
2%
6%
21%
57%
χ2=27.939,
df=4,
p=.000
Agree 5% 14%
Lack of support
from
management
Strongly Disagree
Disagree
Not sure
Strongly Agree
6%
19%
2%
57%
0%
2%
8%
55%
χ2=21.127,
df=4,
p=.000
Agree 16% 35%
Absence of
skilled personnel
Strongly Disagree
Disagree
Not sure
Strongly Agree
4%
25%
8%
52%
0%
6%
2%
68%
χ2=17.350,
df=4,
p=.002
Agree 11% 24%
Inappropriate
technology
Strongly Disagree
Disagree
Not sure
Strongly Agree
4%
22%
14%
50%
0%
6%
4%
68%
χ2=12.127,
df=4,
p=.002
Agree 10% 22%
Lack of adequate
funds
Strongly Disagree
Disagree
Not sure
Strongly Agree
31%
47%
7 %
13%
17%
61%
0%
14%
χ2=12.225,
df=5,
p=.032
Agree 2% 8%
Lack of
information
Strongly…Disagree
Disagree
Not sure
Strongly Agree
9%
27%
2%
26%
0%
0%
2%
43%
χ2=25.522,
df=4,
p=.000
Agree 36% 55%
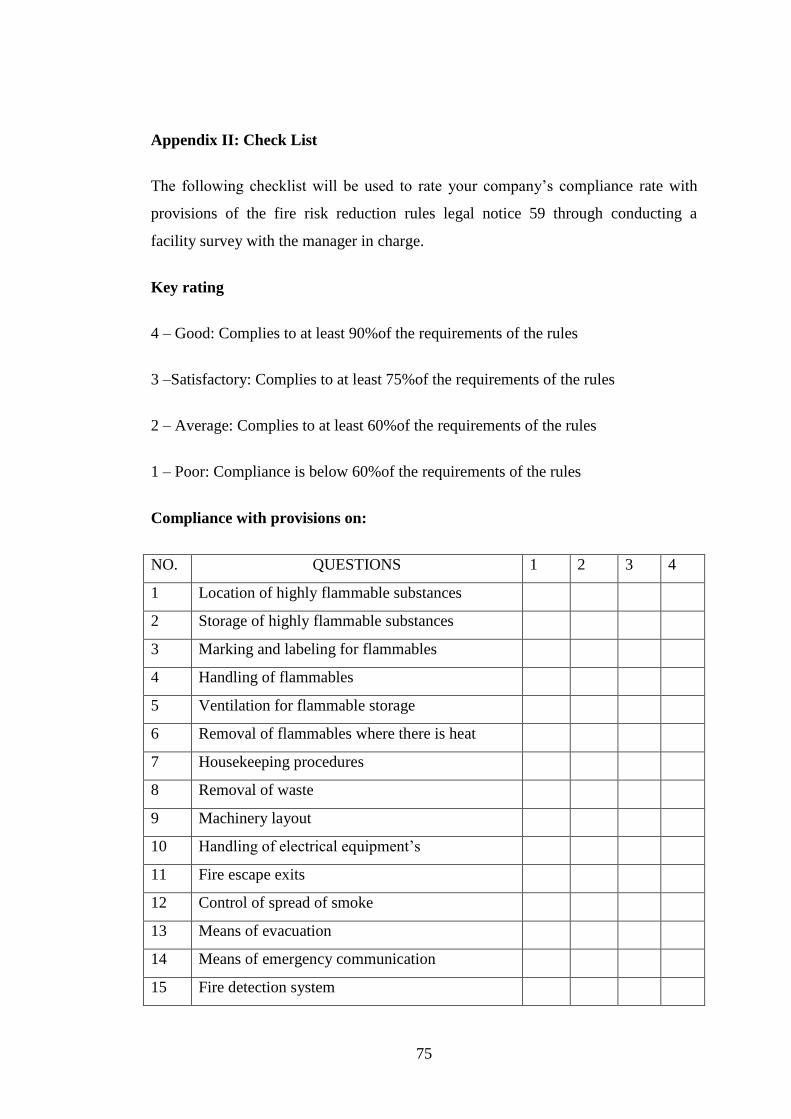
75
Appendix II: Check List
The following checklist will be used to rate your company’s compliance rate with
provisions of the fire risk reduction rules legal notice 59 through conducting a
facility survey with the manager in charge.
Key rating
4 – Good: Complies to at least 90%of the requirements of the rules
3 –Satisfactory: Complies to at least 75%of the requirements of the rules
2 – Average: Complies to at least 60%of the requirements of the rules
1 – Poor: Compliance is below 60%of the requirements of the rules
Compliance with provisions on:
NO. QUESTIONS 1 2 3 4
1 Location of highly flammable substances
2 Storage of highly flammable substances
3 Marking and labeling for flammables
4 Handling of flammables
5 Ventilation for flammable storage
6 Removal of flammables where there is heat
7 Housekeeping procedures
8 Removal of waste
9 Machinery layout
10 Handling of electrical equipment’s
11 Fire escape exits
12 Control of spread of smoke
13 Means of evacuation
14 Means of emergency communication
15 Fire detection system
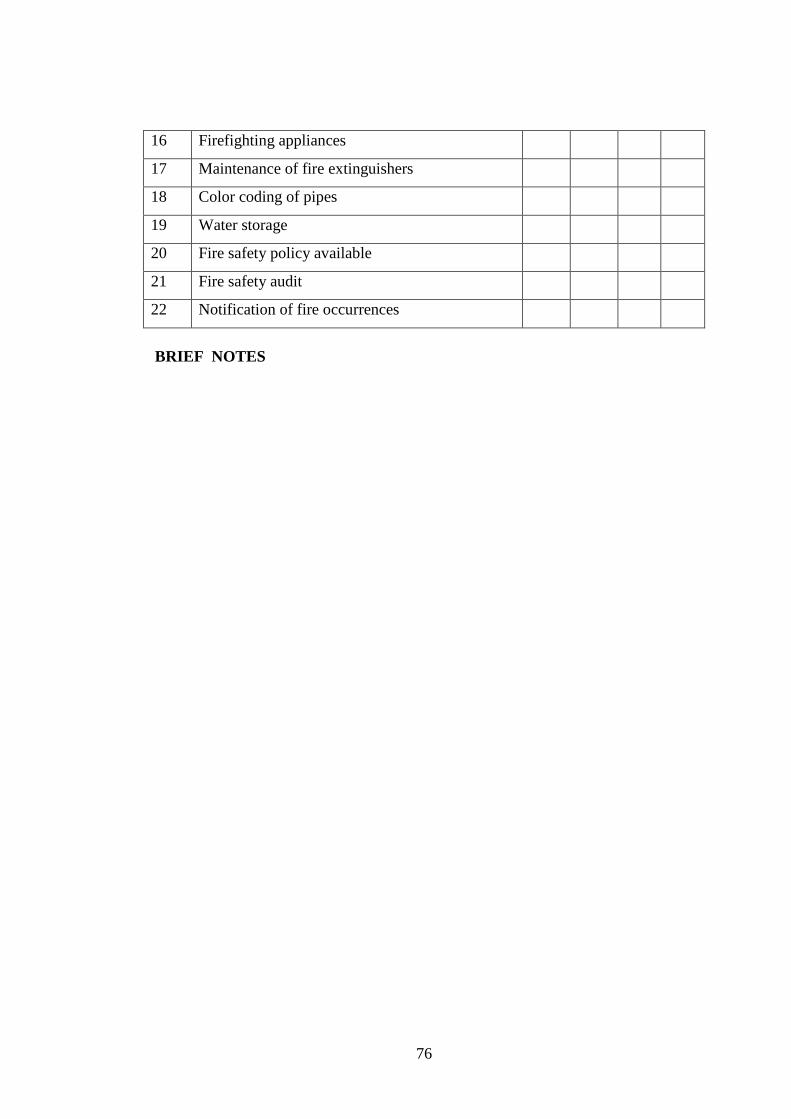
76
16 Firefighting appliances
17 Maintenance of fire extinguishers
18 Color coding of pipes
19 Water storage
20 Fire safety policy available
21 Fire safety audit
22 Notification of fire occurrences
BRIEF NOTES

77
Appendix III: Workforce Questionaire
QUESTIONNAIRE ON EVALUATION OF FIRE SAFETY COMPLIANCE
IN PAINT INDUSTRY, NAIROBI COUNTY
Consent to participate in the study
Am valentine Ngenyi Mutuku, a student at Jomo Kenyatta University of Agriculture
and Technology (JKUAT), Kenya. I’m conducting a study on Evaluation of fire
safety compliance in paint industry in Nairobi County in fulfilment of masters’
degree in Occupational Safety and Health.
Your Company has been chosen among those to give a true representation in this
study. I would appreciate if you participate in providing honest answers on the
awareness and practice on fire safety compliance. This information is for academic
purposes and is expected to provide information in regard to fire safety in the
workplace. Whatever information you provide, will be treated with strict confidence
and will not be shared with other participants, individuals or company. Participation
in this study is voluntary and you may choose not to answer any individual question
or all the questions. However I hope that you will participate in this study since your
answer as one of the identified respondent is very important. Please feel free to ask
any questions that you may have regarding the survey.
Signature of Respondent ……………………………… Date……………………….
Please return filled
questionnaire to:
Valentine Ngenyi Mutuku
MSc Occupational Safety
and Healthy
IEET
Phone : 0723324307
Kindly answer the following questions
NAME:
INSTITUTION:
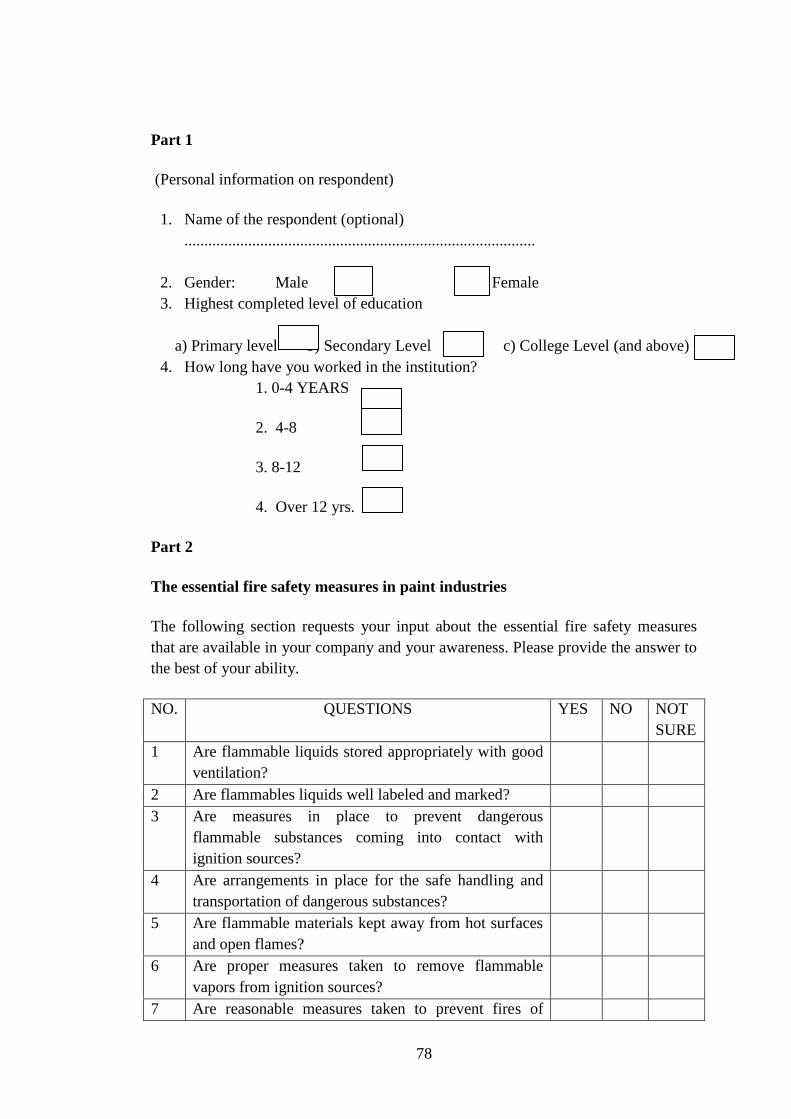
78
Part 1
(Personal information on respondent)
1. Name of the respondent (optional)
........................................................................................
2. Gender: Male Female
3. Highest completed level of education
a) Primary level b) Secondary Level c) College Level (and above)
4. How long have you worked in the institution?
1. 0-4 YEARS
2. 4-8
3. 8-12
4. Over 12 yrs.
Part 2
The essential fire safety measures in paint industries
The following section requests your input about the essential fire safety measures
that are available in your company and your awareness. Please provide the answer to
the best of your ability.
NO. QUESTIONS YES NO NOT
SURE
1 Are flammable liquids stored appropriately with good
ventilation?
2 Are flammables liquids well labeled and marked?
3 Are measures in place to prevent dangerous
flammable substances coming into contact with
ignition sources?
4 Are arrangements in place for the safe handling and
transportation of dangerous substances?
5 Are flammable materials kept away from hot surfaces
and open flames?
6 Are proper measures taken to remove flammable
vapors from ignition sources?
7 Are reasonable measures taken to prevent fires of
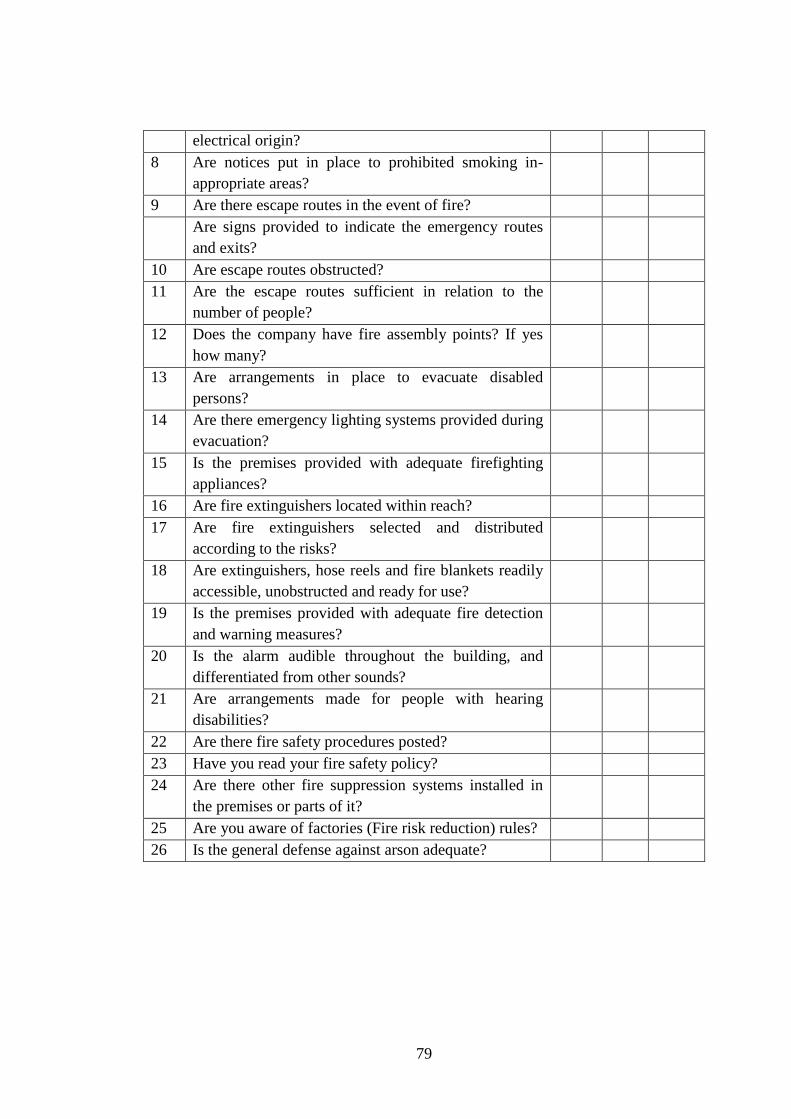
79
electrical origin?
8 Are notices put in place to prohibited smoking in-
appropriate areas?
9 Are there escape routes in the event of fire?
Are signs provided to indicate the emergency routes
and exits?
10 Are escape routes obstructed?
11 Are the escape routes sufficient in relation to the
number of people?
12 Does the company have fire assembly points? If yes
how many?
13 Are arrangements in place to evacuate disabled
persons?
14 Are there emergency lighting systems provided during
evacuation?
15 Is the premises provided with adequate firefighting
appliances?
16 Are fire extinguishers located within reach?
17 Are fire extinguishers selected and distributed
according to the risks?
18 Are extinguishers, hose reels and fire blankets readily
accessible, unobstructed and ready for use?
19 Is the premises provided with adequate fire detection
and warning measures?
20 Is the alarm audible throughout the building, and
differentiated from other sounds?
21 Are arrangements made for people with hearing
disabilities?
22 Are there fire safety procedures posted?
23 Have you read your fire safety policy?
24 Are there other fire suppression systems installed in
the premises or parts of it?
25 Are you aware of factories (Fire risk reduction) rules?
26 Is the general defense against arson adequate?
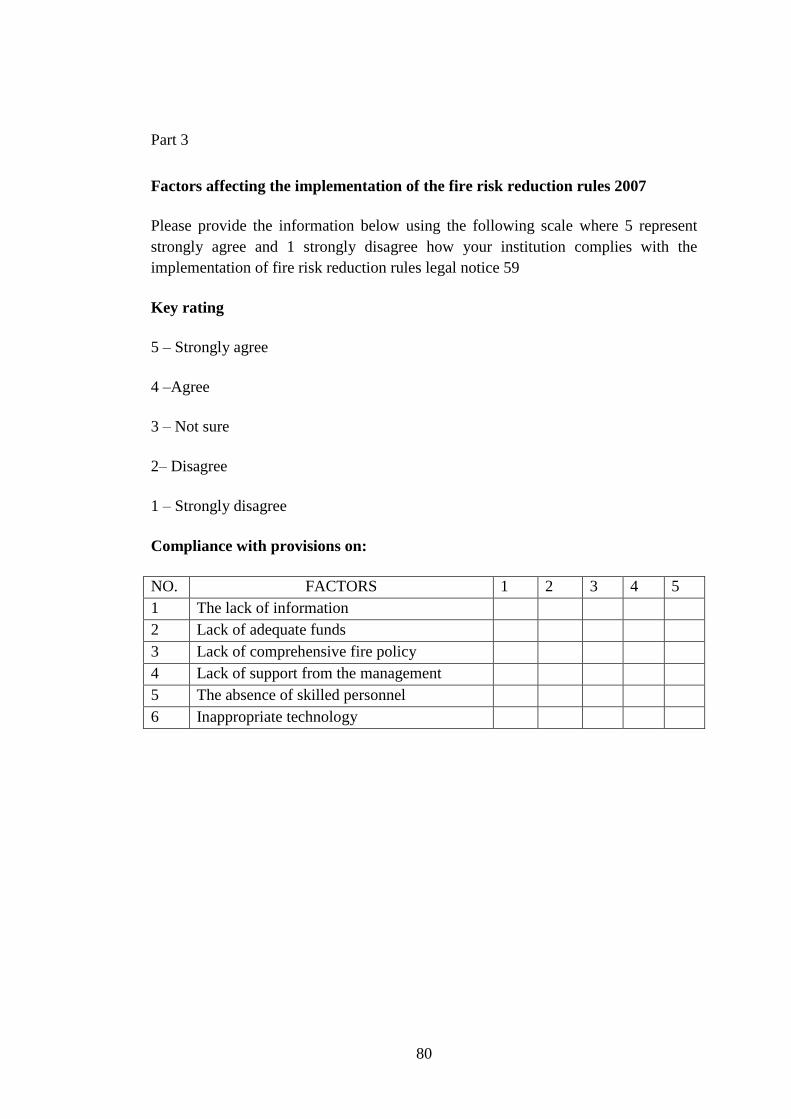
80
Part 3
Factors affecting the implementation of the fire risk reduction rules 2007
Please provide the information below using the following scale where 5 represent
strongly agree and 1 strongly disagree how your institution complies with the
implementation of fire risk reduction rules legal notice 59
Key rating
5 – Strongly agree
4 –Agree
3 – Not sure
2– Disagree
1 – Strongly disagree
Compliance with provisions on:
NO. FACTORS 1 2 3 4 5
1 The lack of information
2 Lack of adequate funds
3 Lack of comprehensive fire policy
4 Lack of support from the management
5 The absence of skilled personnel
6 Inappropriate technology
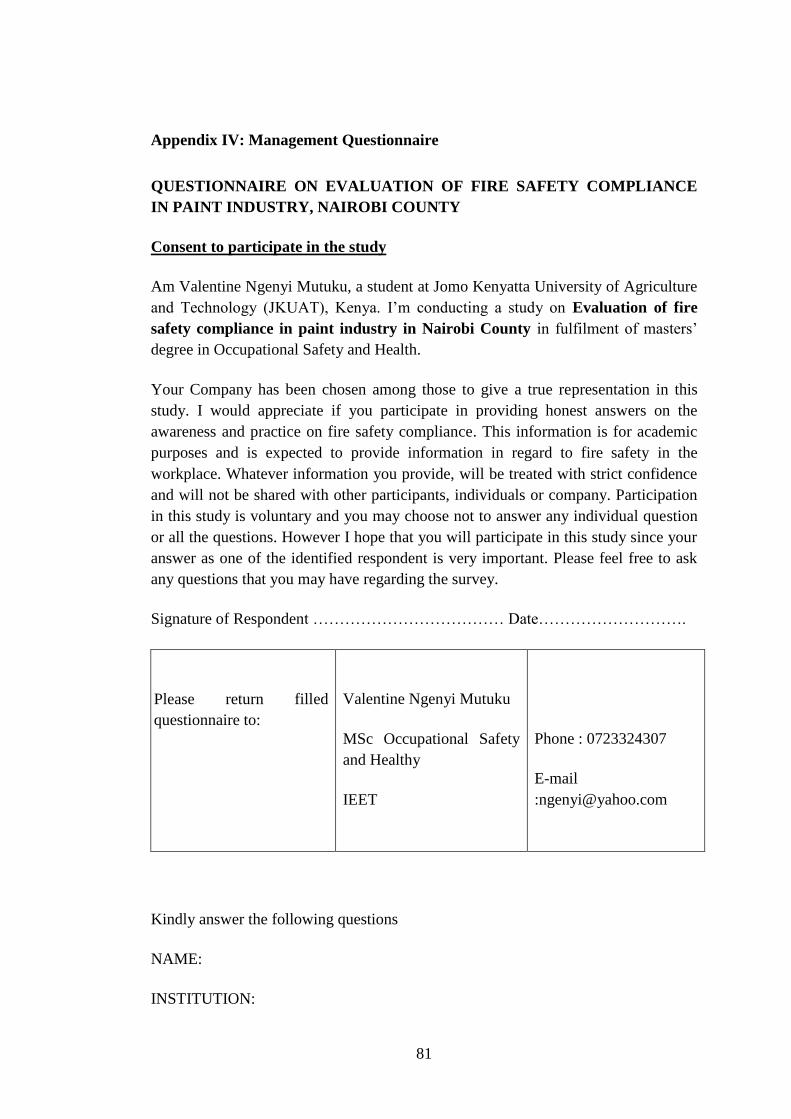
81
Appendix IV: Management Questionnaire
QUESTIONNAIRE ON EVALUATION OF FIRE SAFETY COMPLIANCE
IN PAINT INDUSTRY, NAIROBI COUNTY
Consent to participate in the study
Am Valentine Ngenyi Mutuku, a student at Jomo Kenyatta University of Agriculture
and Technology (JKUAT), Kenya. I’m conducting a study on Evaluation of fire
safety compliance in paint industry in Nairobi County in fulfilment of masters’
degree in Occupational Safety and Health.
Your Company has been chosen among those to give a true representation in this
study. I would appreciate if you participate in providing honest answers on the
awareness and practice on fire safety compliance. This information is for academic
purposes and is expected to provide information in regard to fire safety in the
workplace. Whatever information you provide, will be treated with strict confidence
and will not be shared with other participants, individuals or company. Participation
in this study is voluntary and you may choose not to answer any individual question
or all the questions. However I hope that you will participate in this study since your
answer as one of the identified respondent is very important. Please feel free to ask
any questions that you may have regarding the survey.
Signature of Respondent ……………………………… Date……………………….
Please return filled
questionnaire to:
Valentine Ngenyi Mutuku
MSc Occupational Safety
and Healthy
IEET
Phone : 0723324307
Kindly answer the following questions
NAME:
INSTITUTION:
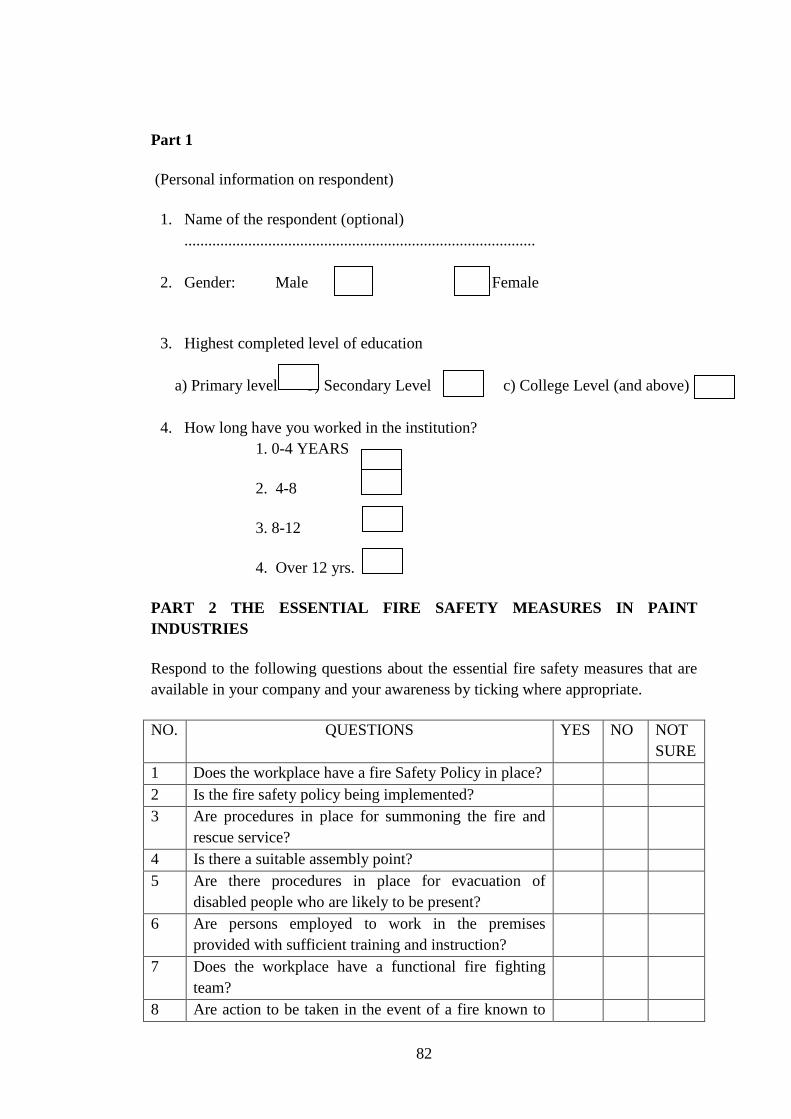
82
Part 1
(Personal information on respondent)
1. Name of the respondent (optional)
........................................................................................
2. Gender: Male Female
3. Highest completed level of education
a) Primary level b) Secondary Level c) College Level (and above)
4. How long have you worked in the institution?
1. 0-4 YEARS
2. 4-8
3. 8-12
4. Over 12 yrs.
PART 2 THE ESSENTIAL FIRE SAFETY MEASURES IN PAINT
INDUSTRIES
Respond to the following questions about the essential fire safety measures that are
available in your company and your awareness by ticking where appropriate.
NO. QUESTIONS YES NO NOT
SURE
1 Does the workplace have a fire Safety Policy in place?
2 Is the fire safety policy being implemented?
3 Are procedures in place for summoning the fire and
rescue service?
4 Is there a suitable assembly point?
5 Are there procedures in place for evacuation of
disabled people who are likely to be present?
6 Are persons employed to work in the premises
provided with sufficient training and instruction?
7 Does the workplace have a functional fire fighting
team?
8 Are action to be taken in the event of a fire known to
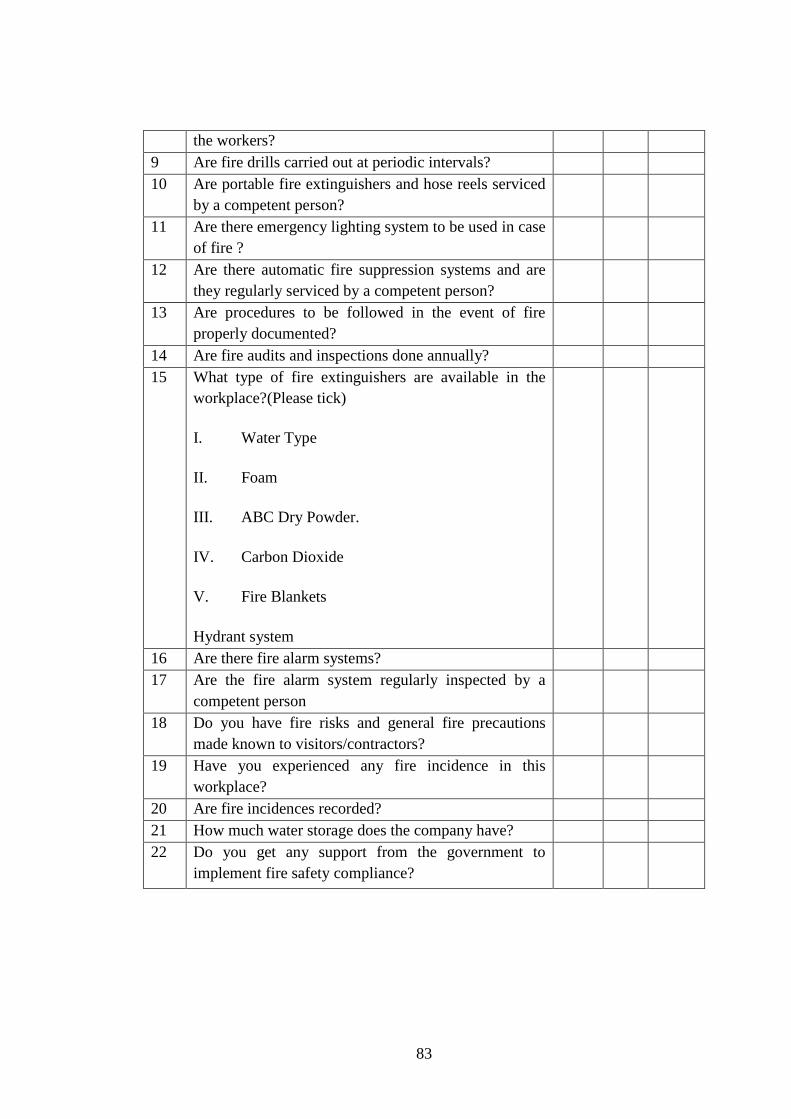
83
the workers?
9 Are fire drills carried out at periodic intervals?
10 Are portable fire extinguishers and hose reels serviced
by a competent person?
11 Are there emergency lighting system to be used in case
of fire ?
12 Are there automatic fire suppression systems and are
they regularly serviced by a competent person?
13 Are procedures to be followed in the event of fire
properly documented?
14 Are fire audits and inspections done annually?
15 What type of fire extinguishers are available in the
workplace?(Please tick)
I. Water Type
II. Foam
III. ABC Dry Powder.
IV. Carbon Dioxide
V. Fire Blankets
Hydrant system
16 Are there fire alarm systems?
17 Are the fire alarm system regularly inspected by a
competent person
18 Do you have fire risks and general fire precautions
made known to visitors/contractors?
19 Have you experienced any fire incidence in this
workplace?
20 Are fire incidences recorded?
21 How much water storage does the company have?
22 Do you get any support from the government to
implement fire safety compliance?
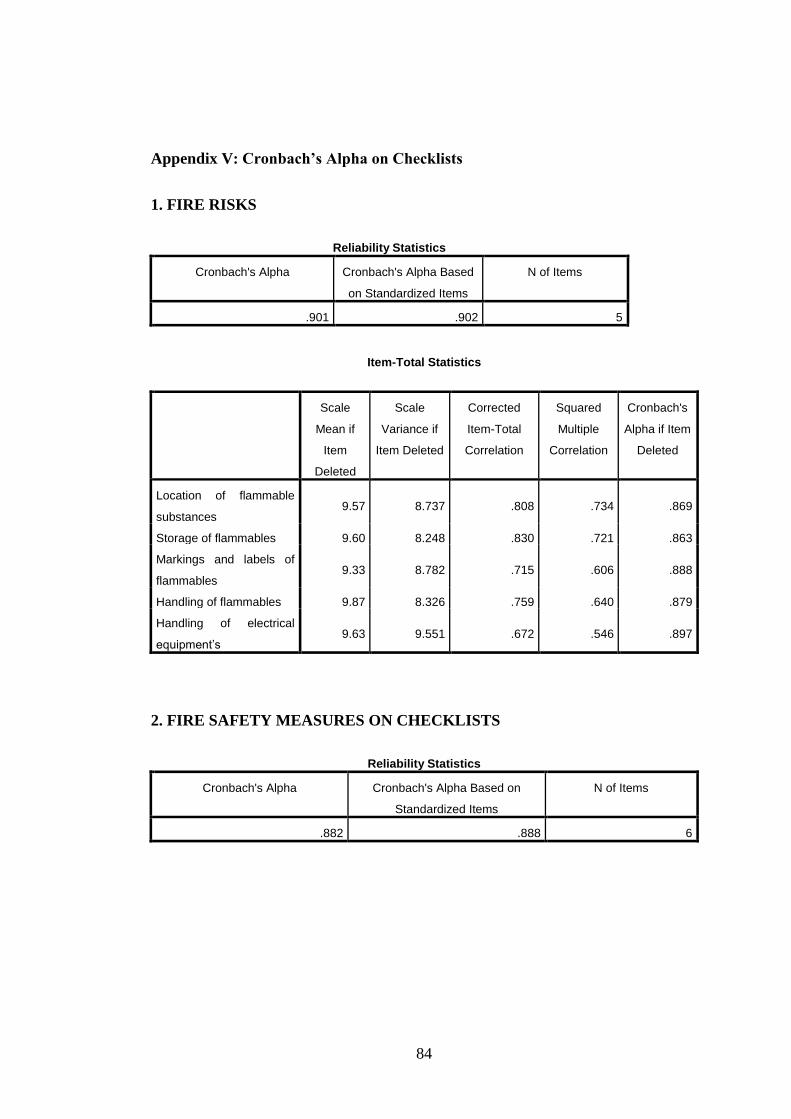
84
Appendix V: Cronbach’s Alpha on Checklists
1. FIRE RISKS
Reliability Statistics
Cronbach's Alpha Cronbach's Alpha Based
on Standardized Items
N of Items
.901 .902 5
Item-Total Statistics
Scale
Mean if
Item
Deleted
Scale
Variance if
Item Deleted
Corrected
Item-Total
Correlation
Squared
Multiple
Correlation
Cronbach's
Alpha if Item
Deleted
Location of flammable
substances 9.57 8.737 .808 .734 .869
Storage of flammables 9.60 8.248 .830 .721 .863
Markings and labels of
flammables 9.33 8.782 .715 .606 .888
Handling of flammables 9.87 8.326 .759 .640 .879
Handling of electrical
equipment’s 9.63 9.551 .672 .546 .897
2. FIRE SAFETY MEASURES ON CHECKLISTS
Reliability Statistics
Cronbach's Alpha Cronbach's Alpha Based on
Standardized Items
N of Items
.882 .888 6
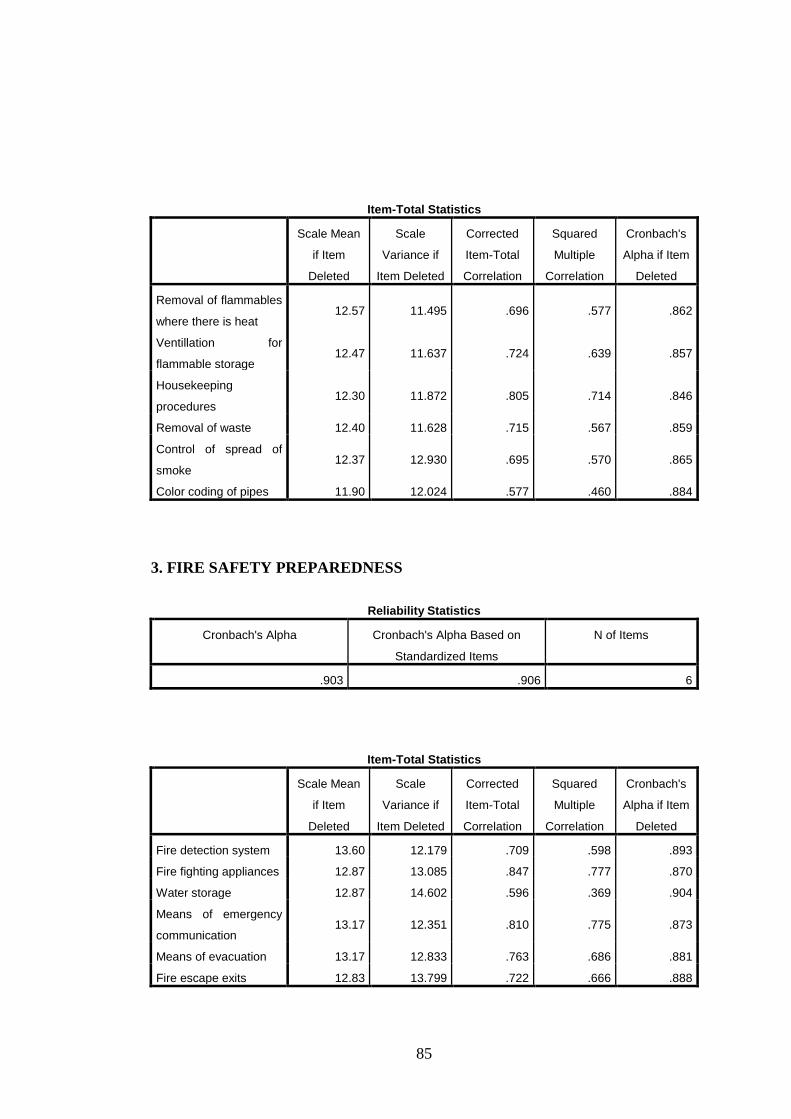
85
Item-Total Statistics
Scale Mean
if Item
Deleted
Scale
Variance if
Item Deleted
Corrected
Item-Total
Correlation
Squared
Multiple
Correlation
Cronbach's
Alpha if Item
Deleted
Removal of flammables
where there is heat 12.57 11.495 .696 .577 .862
Ventillation for
flammable storage 12.47 11.637 .724 .639 .857
Housekeeping
procedures 12.30 11.872 .805 .714 .846
Removal of waste 12.40 11.628 .715 .567 .859
Control of spread of
smoke 12.37 12.930 .695 .570 .865
Color coding of pipes 11.90 12.024 .577 .460 .884
3. FIRE SAFETY PREPAREDNESS
Reliability Statistics
Cronbach's Alpha Cronbach's Alpha Based on
Standardized Items
N of Items
.903 .906 6
Item-Total Statistics
Scale Mean
if Item
Deleted
Scale
Variance if
Item Deleted
Corrected
Item-Total
Correlation
Squared
Multiple
Correlation
Cronbach's
Alpha if Item
Deleted
Fire detection system 13.60 12.179 .709 .598 .893
Fire fighting appliances 12.87 13.085 .847 .777 .870
Water storage 12.87 14.602 .596 .369 .904
Means of emergency
communication 13.17 12.351 .810 .775 .873
Means of evacuation 13.17 12.833 .763 .686 .881
Fire escape exits 12.83 13.799 .722 .666 .888
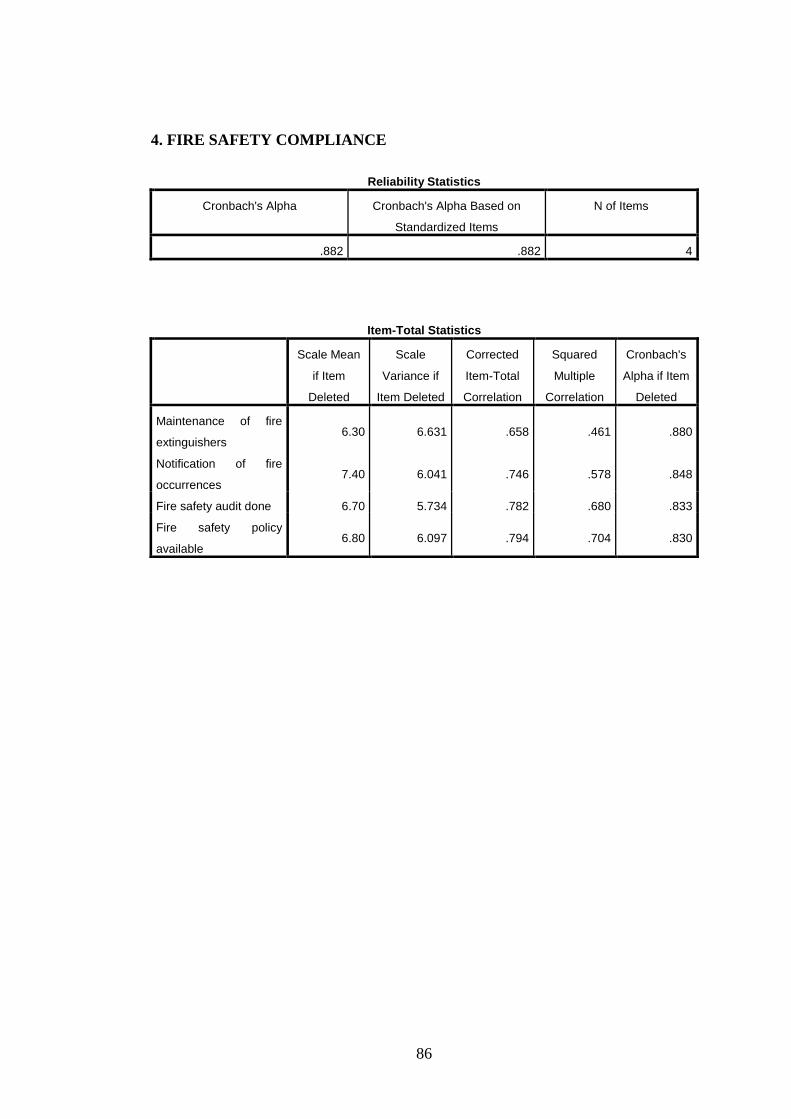
86
4. FIRE SAFETY COMPLIANCE
Reliability Statistics
Cronbach's Alpha Cronbach's Alpha Based on
Standardized Items
N of Items
.882 .882 4
Item-Total Statistics
Scale Mean
if Item
Deleted
Scale
Variance if
Item Deleted
Corrected
Item-Total
Correlation
Squared
Multiple
Correlation
Cronbach's
Alpha if Item
Deleted
Maintenance of fire
extinguishers 6.30 6.631 .658 .461 .880
Notification of fire
occurrences 7.40 6.041 .746 .578 .848
Fire safety audit done 6.70 5.734 .782 .680 .833
Fire safety policy
available 6.80 6.097 .794 .704 .830
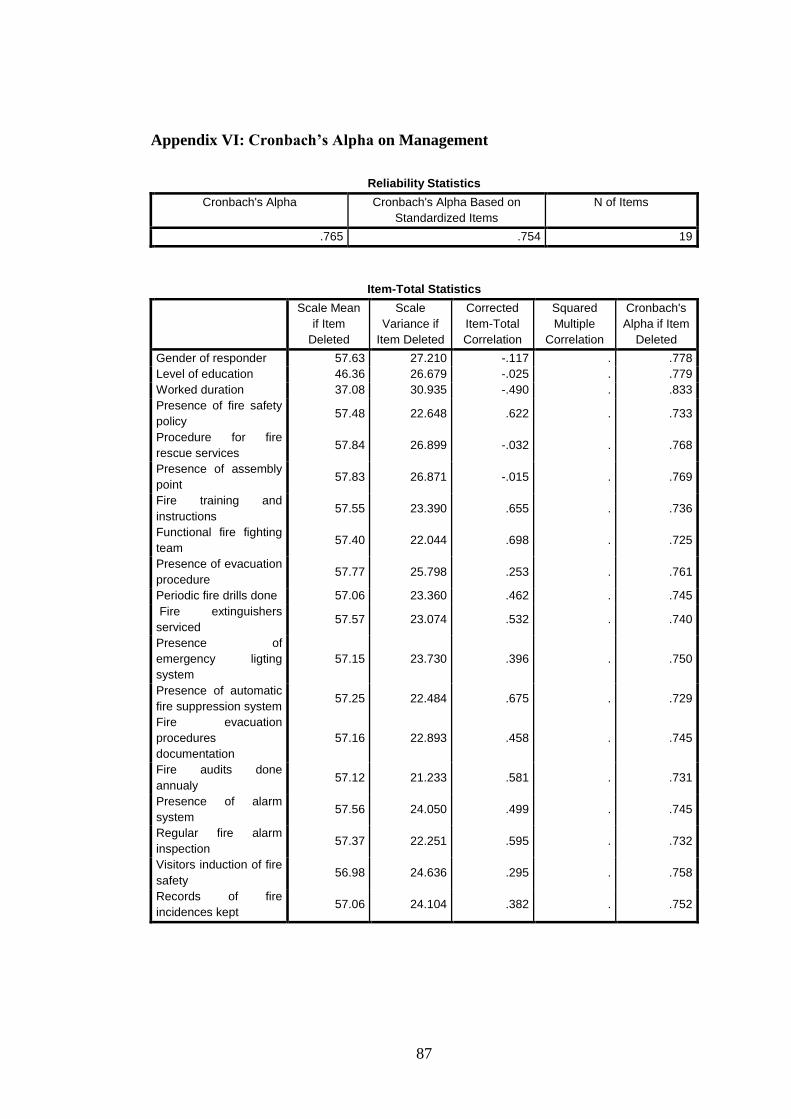
87
Appendix VI: Cronbach’s Alpha on Management
Reliability Statistics
Cronbach's Alpha Cronbach's Alpha Based on
Standardized Items
N of Items
.765 .754 19
Item-Total Statistics
Scale Mean
if Item
Deleted
Scale
Variance if
Item Deleted
Corrected
Item-Total
Correlation
Squared
Multiple
Correlation
Cronbach's
Alpha if Item
Deleted
Gender of responder 57.63 27.210 -.117 . .778
Level of education 46.36 26.679 -.025 . .779
Worked duration 37.08 30.935 -.490 . .833
Presence of fire safety
policy 57.48 22.648 .622 . .733
Procedure for fire
rescue services 57.84 26.899 -.032 . .768
Presence of assembly
point 57.83 26.871 -.015 . .769
Fire training and
instructions 57.55 23.390 .655 . .736
Functional fire fighting
team 57.40 22.044 .698 . .725
Presence of evacuation
procedure 57.77 25.798 .253 . .761
Periodic fire drills done 57.06 23.360 .462 . .745
Fire extinguishers
serviced 57.57 23.074 .532 . .740
Presence of
emergency ligting
system
57.15 23.730 .396 . .750
Presence of automatic
fire suppression system 57.25 22.484 .675 . .729
Fire evacuation
procedures
documentation
57.16 22.893 .458 . .745
Fire audits done
annualy 57.12 21.233 .581 . .731
Presence of alarm
system 57.56 24.050 .499 . .745
Regular fire alarm
inspection 57.37 22.251 .595 . .732
Visitors induction of fire
safety 56.98 24.636 .295 . .758
Records of fire
incidences kept 57.06 24.104 .382 . .752
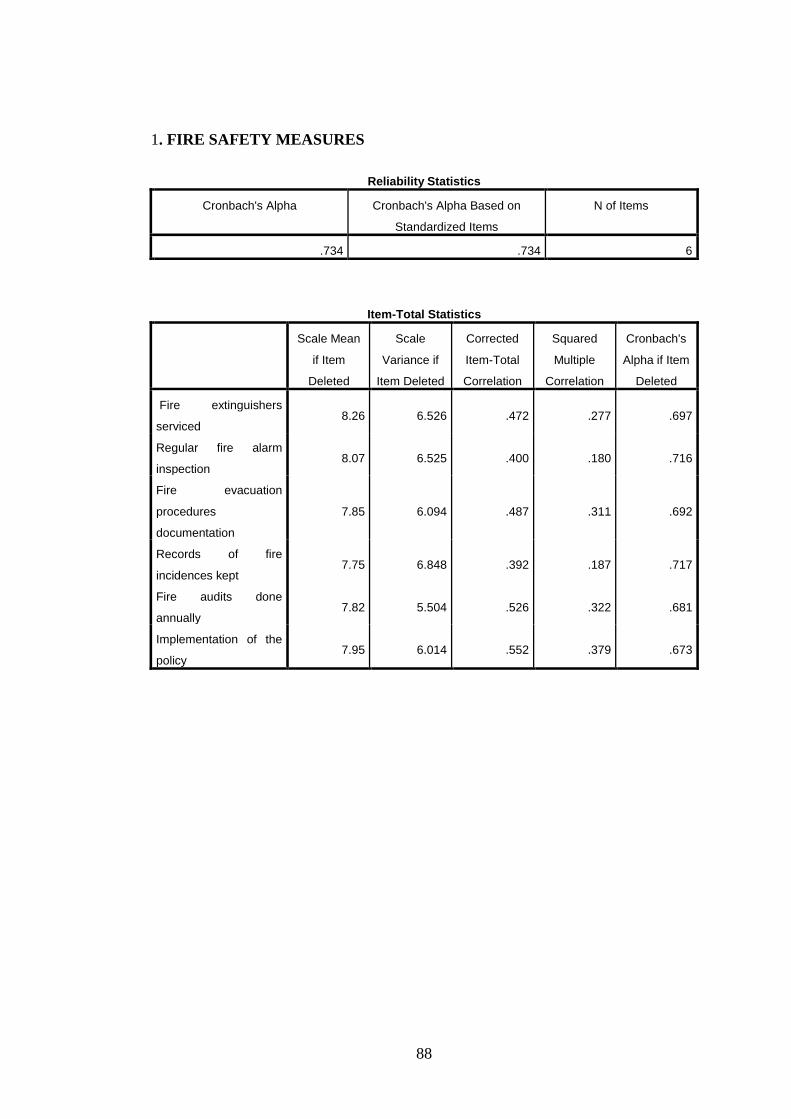
88
1. FIRE SAFETY MEASURES
Reliability Statistics
Cronbach's Alpha Cronbach's Alpha Based on
Standardized Items
N of Items
.734 .734 6
Item-Total Statistics
Scale Mean
if Item
Deleted
Scale
Variance if
Item Deleted
Corrected
Item-Total
Correlation
Squared
Multiple
Correlation
Cronbach's
Alpha if Item
Deleted
Fire extinguishers
serviced 8.26 6.526 .472 .277 .697
Regular fire alarm
inspection 8.07 6.525 .400 .180 .716
Fire evacuation
procedures
documentation
7.85 6.094 .487 .311 .692
Records of fire
incidences kept 7.75 6.848 .392 .187 .717
Fire audits done
annually 7.82 5.504 .526 .322 .681
Implementation of the
policy 7.95 6.014 .552 .379 .673
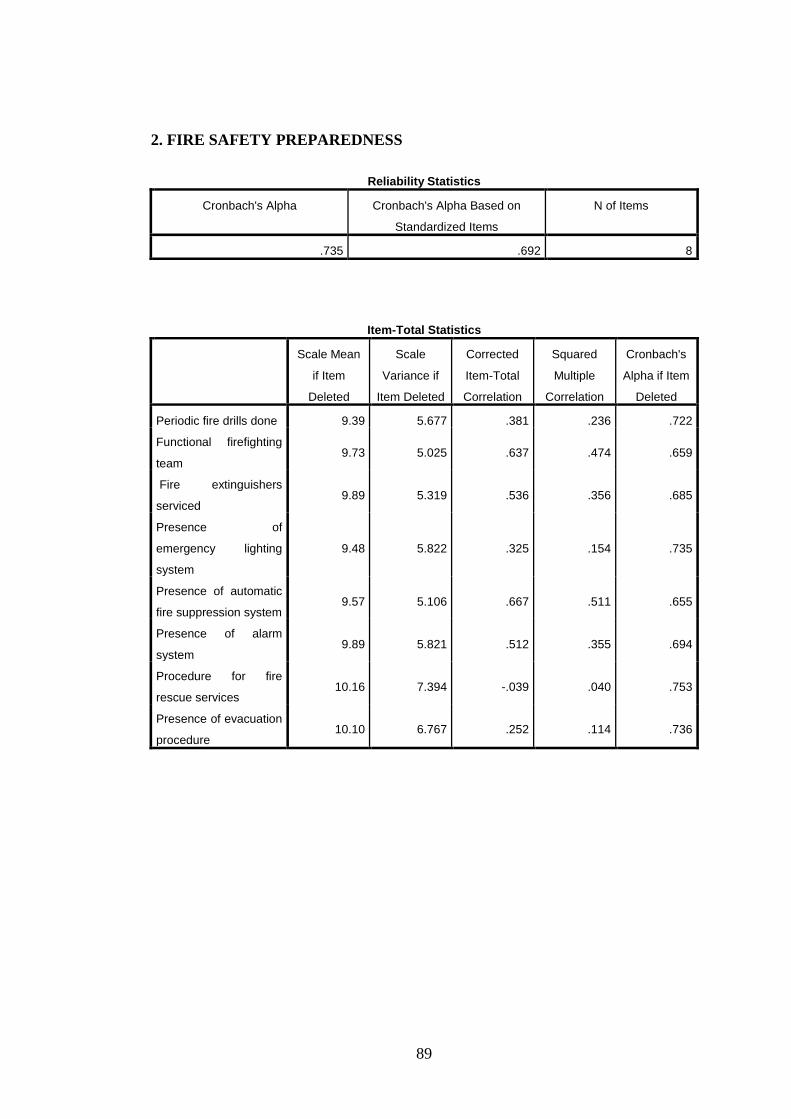
89
2. FIRE SAFETY PREPAREDNESS
Reliability Statistics
Cronbach's Alpha Cronbach's Alpha Based on
Standardized Items
N of Items
.735 .692 8
Item-Total Statistics
Scale Mean
if Item
Deleted
Scale
Variance if
Item Deleted
Corrected
Item-Total
Correlation
Squared
Multiple
Correlation
Cronbach's
Alpha if Item
Deleted
Periodic fire drills done 9.39 5.677 .381 .236 .722
Functional firefighting
team 9.73 5.025 .637 .474 .659
Fire extinguishers
serviced 9.89 5.319 .536 .356 .685
Presence of
emergency lighting
system
9.48 5.822 .325 .154 .735
Presence of automatic
fire suppression system 9.57 5.106 .667 .511 .655
Presence of alarm
system 9.89 5.821 .512 .355 .694
Procedure for fire
rescue services 10.16 7.394 -.039 .040 .753
Presence of evacuation
procedure 10.10 6.767 .252 .114 .736
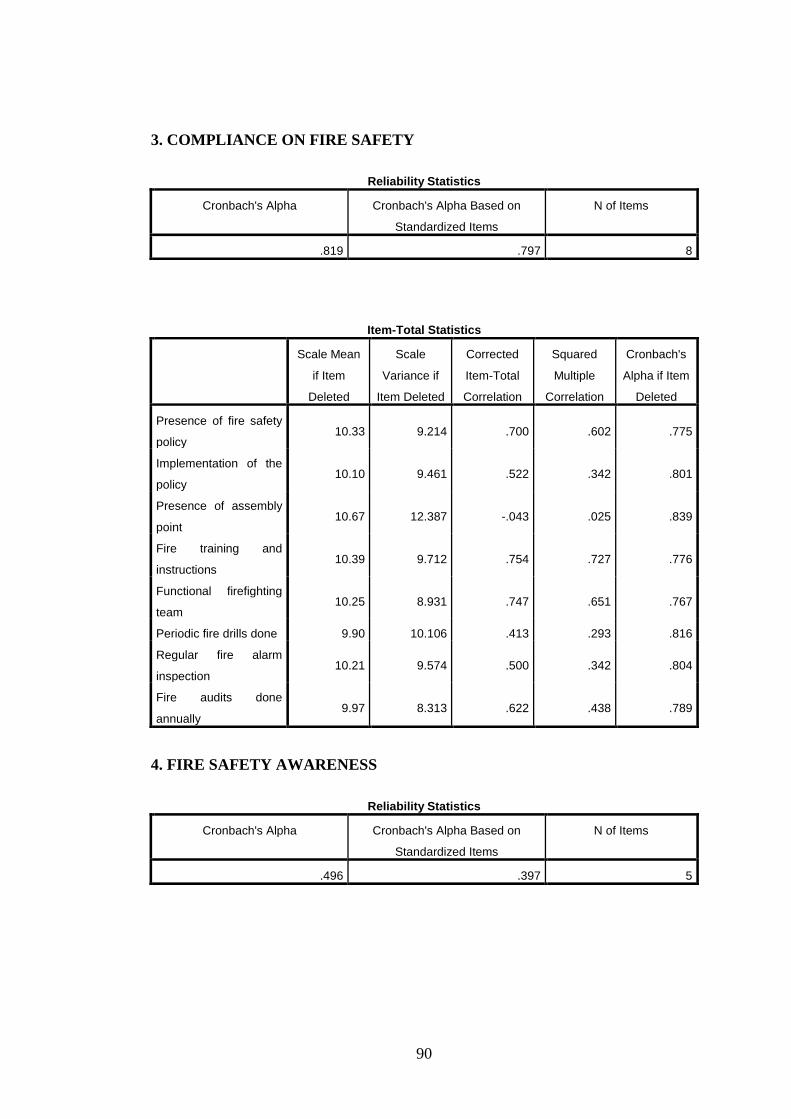
90
3. COMPLIANCE ON FIRE SAFETY
Reliability Statistics
Cronbach's Alpha Cronbach's Alpha Based on
Standardized Items
N of Items
.819 .797 8
Item-Total Statistics
Scale Mean
if Item
Deleted
Scale
Variance if
Item Deleted
Corrected
Item-Total
Correlation
Squared
Multiple
Correlation
Cronbach's
Alpha if Item
Deleted
Presence of fire safety
policy 10.33 9.214 .700 .602 .775
Implementation of the
policy 10.10 9.461 .522 .342 .801
Presence of assembly
point 10.67 12.387 -.043 .025 .839
Fire training and
instructions 10.39 9.712 .754 .727 .776
Functional firefighting
team 10.25 8.931 .747 .651 .767
Periodic fire drills done 9.90 10.106 .413 .293 .816
Regular fire alarm
inspection 10.21 9.574 .500 .342 .804
Fire audits done
annually 9.97 8.313 .622 .438 .789
4. FIRE SAFETY AWARENESS
Reliability Statistics
Cronbach's Alpha Cronbach's Alpha Based on
Standardized Items
N of Items
.496 .397 5
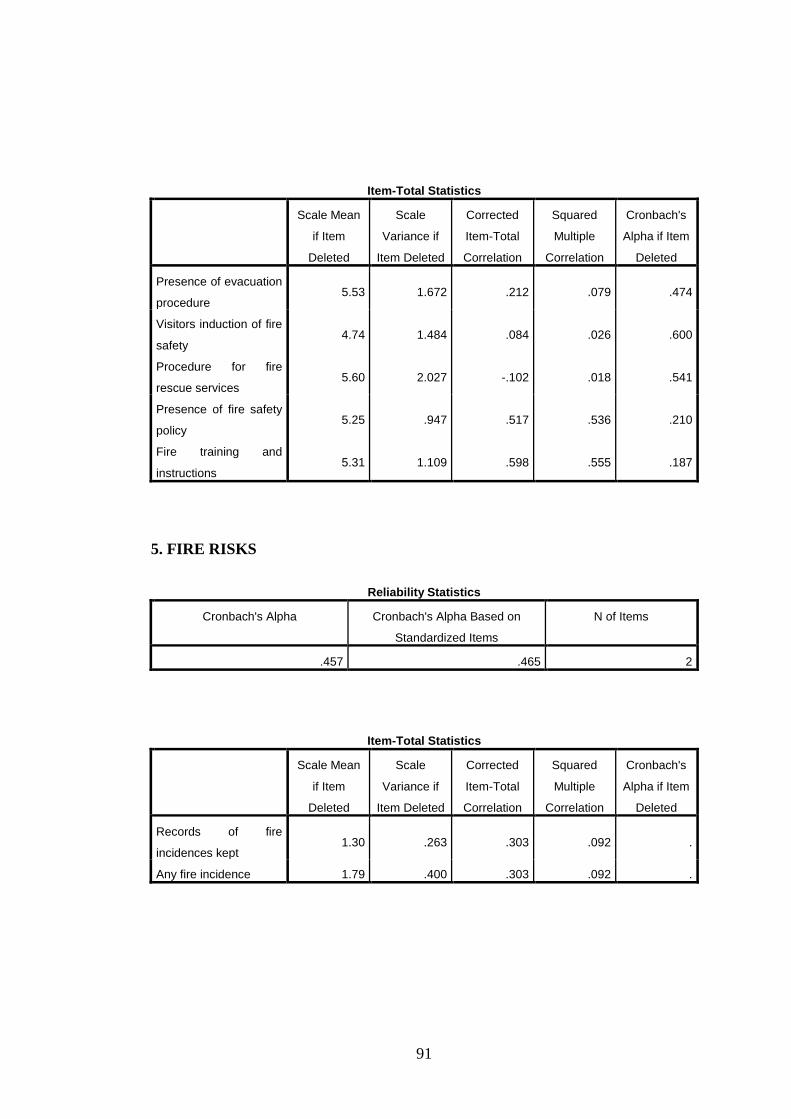
91
Item-Total Statistics
Scale Mean
if Item
Deleted
Scale
Variance if
Item Deleted
Corrected
Item-Total
Correlation
Squared
Multiple
Correlation
Cronbach's
Alpha if Item
Deleted
Presence of evacuation
procedure 5.53 1.672 .212 .079 .474
Visitors induction of fire
safety 4.74 1.484 .084 .026 .600
Procedure for fire
rescue services 5.60 2.027 -.102 .018 .541
Presence of fire safety
policy 5.25 .947 .517 .536 .210
Fire training and
instructions 5.31 1.109 .598 .555 .187
5. FIRE RISKS
Reliability Statistics
Cronbach's Alpha Cronbach's Alpha Based on
Standardized Items
N of Items
.457 .465 2
Item-Total Statistics
Scale Mean
if Item
Deleted
Scale
Variance if
Item Deleted
Corrected
Item-Total
Correlation
Squared
Multiple
Correlation
Cronbach's
Alpha if Item
Deleted
Records of fire
incidences kept 1.30 .263 .303 .092 .
Any fire incidence 1.79 .400 .303 .092 .
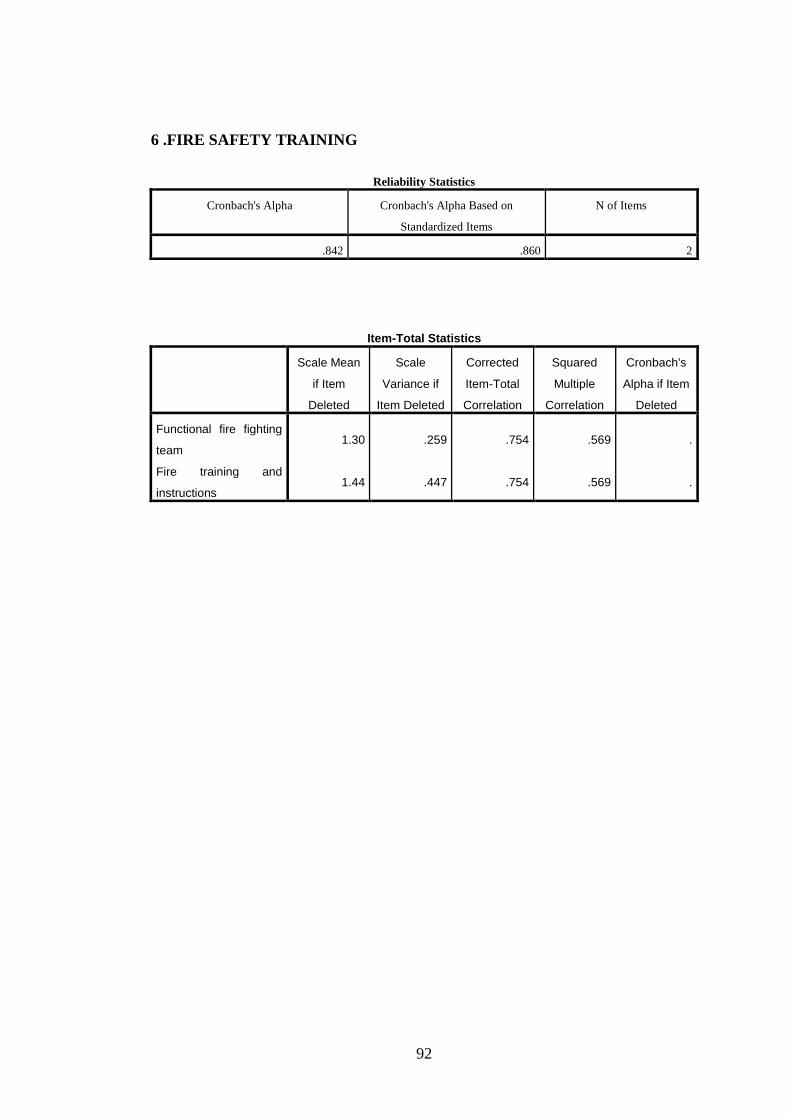
92
6 .FIRE SAFETY TRAINING
Reliability Statistics
Cronbach's Alpha Cronbach's Alpha Based on
Standardized Items
N of Items
.842 .860 2
Item-Total Statistics
Scale Mean
if Item
Deleted
Scale
Variance if
Item Deleted
Corrected
Item-Total
Correlation
Squared
Multiple
Correlation
Cronbach's
Alpha if Item
Deleted
Functional fire fighting
team 1.30 .259 .754 .569 .
Fire training and
instructions 1.44 .447 .754 .569 .
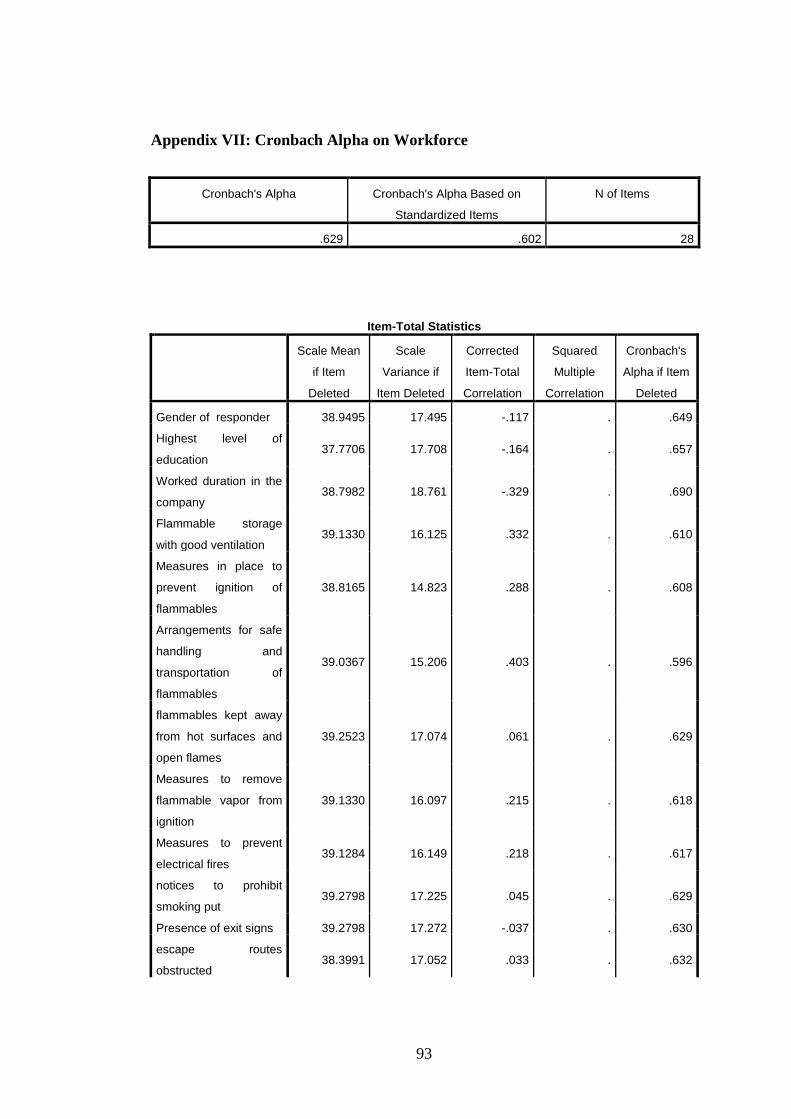
93
Appendix VII: Cronbach Alpha on Workforce
Cronbach's Alpha Cronbach's Alpha Based on
Standardized Items
N of Items
.629 .602 28
Item-Total Statistics
Scale Mean
if Item
Deleted
Scale
Variance if
Item Deleted
Corrected
Item-Total
Correlation
Squared
Multiple
Correlation
Cronbach's
Alpha if Item
Deleted
Gender of responder 38.9495 17.495 -.117 . .649
Highest level of
education 37.7706 17.708 -.164 . .657
Worked duration in the
company 38.7982 18.761 -.329 . .690
Flammable storage
with good ventilation 39.1330 16.125 .332 . .610
Measures in place to
prevent ignition of
flammables
38.8165 14.823 .288 . .608
Arrangements for safe
handling and
transportation of
flammables
39.0367 15.206 .403 . .596
flammables kept away
from hot surfaces and
open flames
39.2523 17.074 .061 . .629
Measures to remove
flammable vapor from
ignition
39.1330 16.097 .215 . .618
Measures to prevent
electrical fires 39.1284 16.149 .218 . .617
notices to prohibit
smoking put 39.2798 17.225 .045 . .629
Presence of exit signs 39.2798 17.272 -.037 . .630
escape routes
obstructed 38.3991 17.052 .033 . .632

94
Escape routes
sufficient as per no. of
people
38.9450 15.831 .212 . .618
Presence of assembly
points 39.2752 17.279 -.041 . .631
Arrangements to
evacuate disabled 38.4128 15.552 .387 . .600
Presence of
emergency lighting
system during
evacuation
38.4037 14.297 .464 . .581
Presence of adequate
firefighting appliances 39.0321 15.497 .324 . .605
Fire extinguishers
located within reach 39.2752 17.104 .180 . .627
Fire extinguishers
distributed as per risks 38.9908 15.272 .271 . .610
Accessibility of fire
extinguishers 39.2202 16.587 .304 . .617
Presence of fire
detection and warning
measures
38.5734 15.084 .367 . .598
Is alarm audible and
different from other
sounds?
39.2706 17.148 .068 . .629
Arrangements made for
people with hearing
disabilities
38.2018 17.388 -.089 . .638
Are fire safety
procedures posted? 39.2523 17.001 .153 . .625
Have you read fire
policy? 38.5092 15.302 .497 . .591
Presence of fire
suppression system
installed
38.3073 14.721 .401 . .591
Aware of fire risk
reduction rules 38.4312 15.601 .438 . .598
Is defense against
arson adequate? 38.6009 14.775 .299 . .606
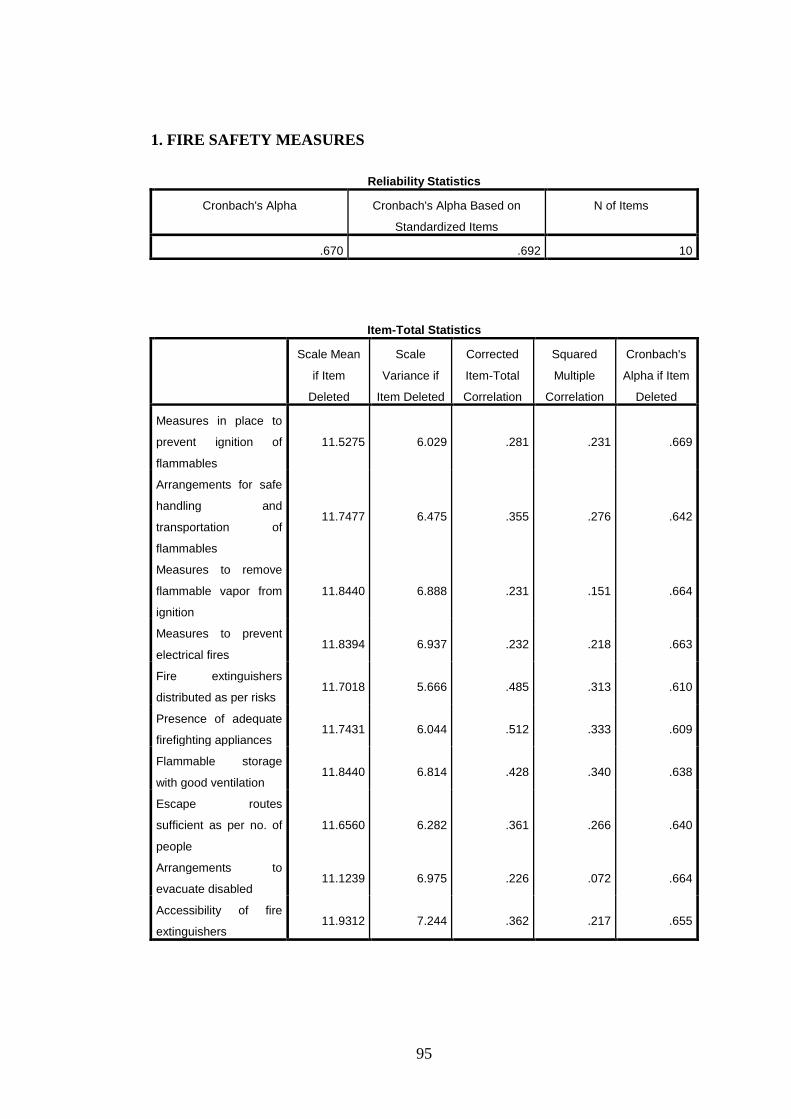
95
1. FIRE SAFETY MEASURES
Reliability Statistics
Cronbach's Alpha Cronbach's Alpha Based on
Standardized Items
N of Items
.670 .692 10
Item-Total Statistics
Scale Mean
if Item
Deleted
Scale
Variance if
Item Deleted
Corrected
Item-Total
Correlation
Squared
Multiple
Correlation
Cronbach's
Alpha if Item
Deleted
Measures in place to
prevent ignition of
flammables
11.5275 6.029 .281 .231 .669
Arrangements for safe
handling and
transportation of
flammables
11.7477 6.475 .355 .276 .642
Measures to remove
flammable vapor from
ignition
11.8440 6.888 .231 .151 .664
Measures to prevent
electrical fires 11.8394 6.937 .232 .218 .663
Fire extinguishers
distributed as per risks 11.7018 5.666 .485 .313 .610
Presence of adequate
firefighting appliances 11.7431 6.044 .512 .333 .609
Flammable storage
with good ventilation 11.8440 6.814 .428 .340 .638
Escape routes
sufficient as per no. of
people
11.6560 6.282 .361 .266 .640
Arrangements to
evacuate disabled 11.1239 6.975 .226 .072 .664
Accessibility of fire
extinguishers 11.9312 7.244 .362 .217 .655
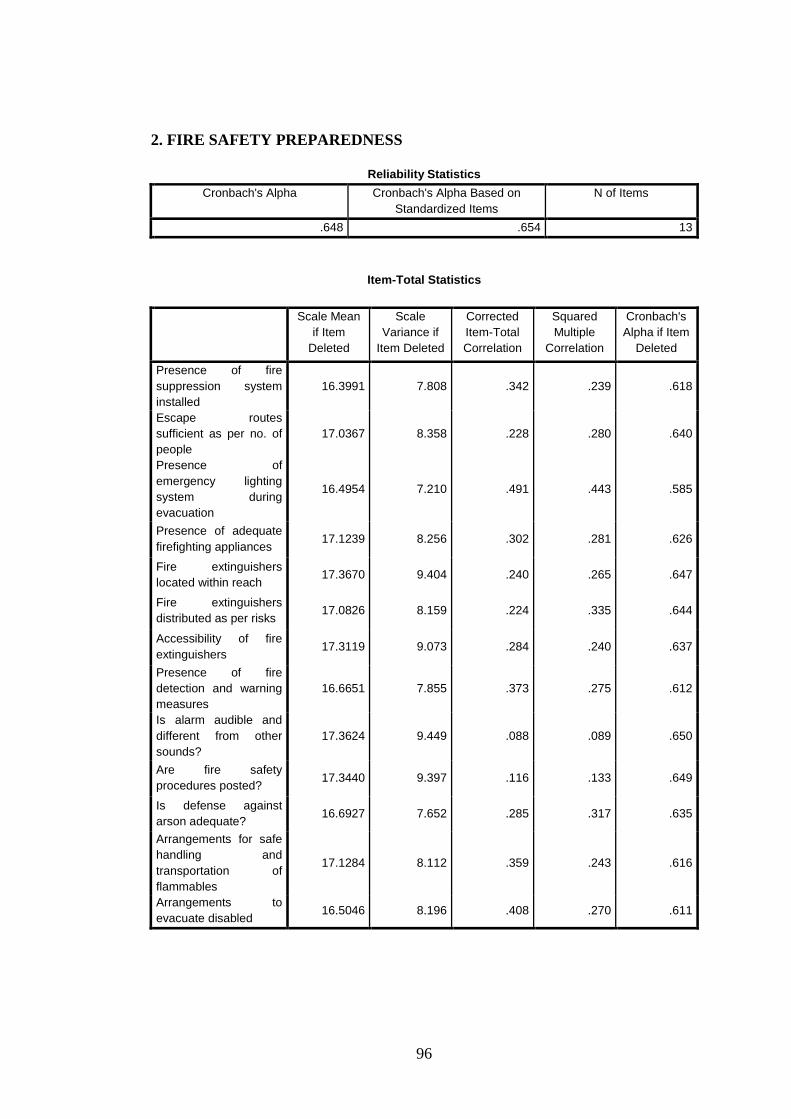
96
2. FIRE SAFETY PREPAREDNESS
Reliability Statistics
Cronbach's Alpha Cronbach's Alpha Based on
Standardized Items
N of Items
.648 .654 13
Item-Total Statistics
Scale Mean
if Item
Deleted
Scale
Variance if
Item Deleted
Corrected
Item-Total
Correlation
Squared
Multiple
Correlation
Cronbach's
Alpha if Item
Deleted
Presence of fire
suppression system
installed
16.3991 7.808 .342 .239 .618
Escape routes
sufficient as per no. of
people
17.0367 8.358 .228 .280 .640
Presence of
emergency lighting
system during
evacuation
16.4954 7.210 .491 .443 .585
Presence of adequate
firefighting appliances 17.1239 8.256 .302 .281 .626
Fire extinguishers
located within reach 17.3670 9.404 .240 .265 .647
Fire extinguishers
distributed as per risks 17.0826 8.159 .224 .335 .644
Accessibility of fire
extinguishers 17.3119 9.073 .284 .240 .637
Presence of fire
detection and warning
measures
16.6651 7.855 .373 .275 .612
Is alarm audible and
different from other
sounds?
17.3624 9.449 .088 .089 .650
Are fire safety
procedures posted? 17.3440 9.397 .116 .133 .649
Is defense against
arson adequate? 16.6927 7.652 .285 .317 .635
Arrangements for safe
handling and
transportation of
flammables
17.1284 8.112 .359 .243 .616
Arrangements to
evacuate disabled 16.5046 8.196 .408 .270 .611
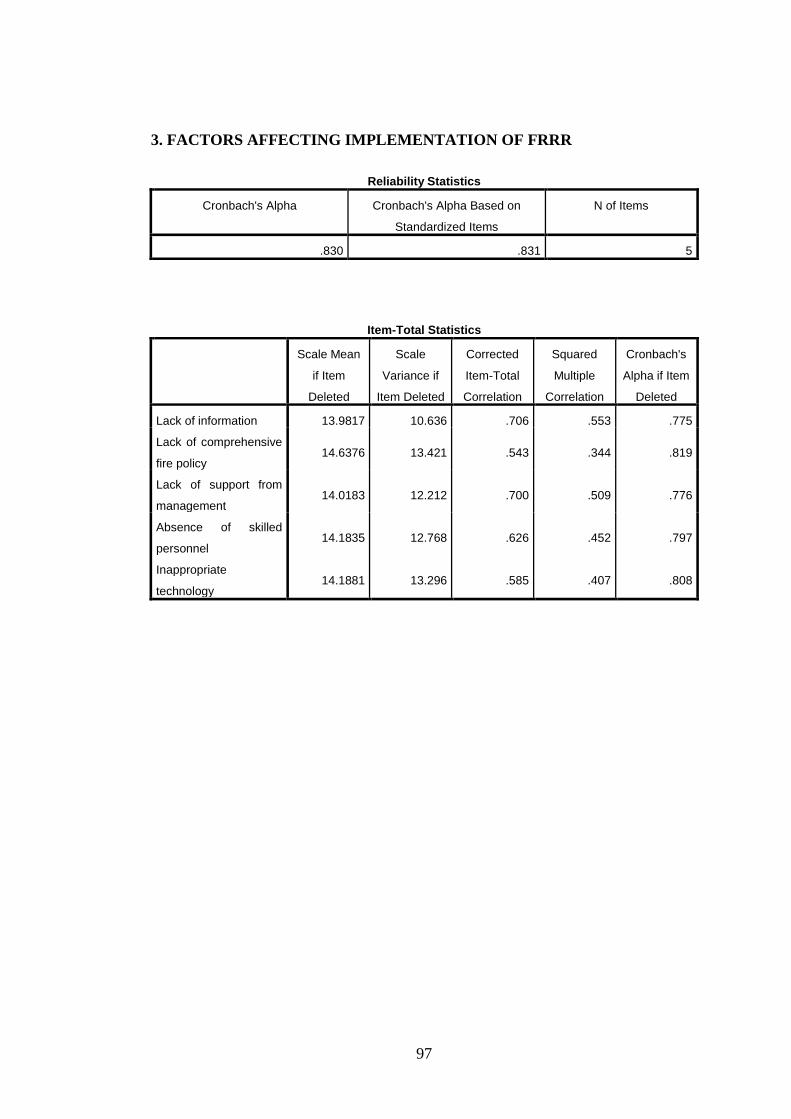
97
3. FACTORS AFFECTING IMPLEMENTATION OF FRRR
Reliability Statistics
Cronbach's Alpha Cronbach's Alpha Based on
Standardized Items
N of Items
.830 .831 5
Item-Total Statistics
Scale Mean
if Item
Deleted
Scale
Variance if
Item Deleted
Corrected
Item-Total
Correlation
Squared
Multiple
Correlation
Cronbach's
Alpha if Item
Deleted
Lack of information 13.9817 10.636 .706 .553 .775
Lack of comprehensive
fire policy 14.6376 13.421 .543 .344 .819
Lack of support from
management 14.0183 12.212 .700 .509 .776
Absence of skilled
personnel 14.1835 12.768 .626 .452 .797
Inappropriate
technology 14.1881 13.296 .585 .407 .808
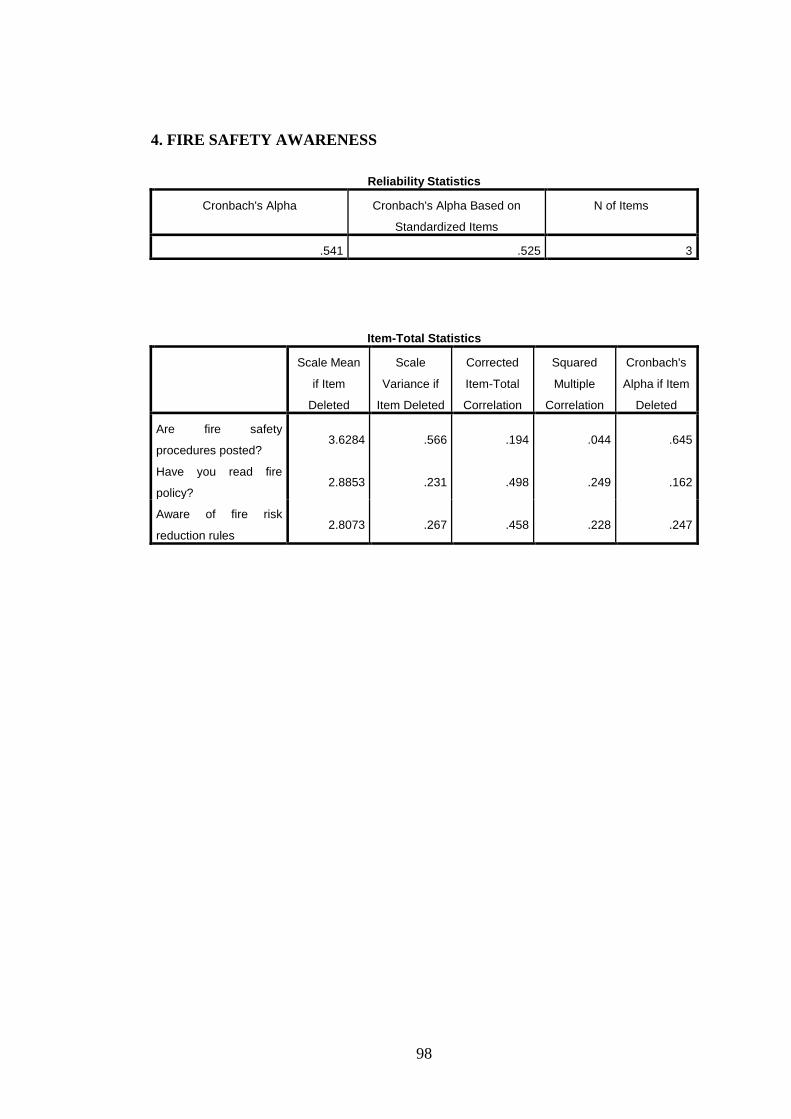
98
4. FIRE SAFETY AWARENESS
Reliability Statistics
Cronbach's Alpha Cronbach's Alpha Based on
Standardized Items
N of Items
.541 .525 3
Item-Total Statistics
Scale Mean
if Item
Deleted
Scale
Variance if
Item Deleted
Corrected
Item-Total
Correlation
Squared
Multiple
Correlation
Cronbach's
Alpha if Item
Deleted
Are fire safety
procedures posted? 3.6284 .566 .194 .044 .645
Have you read fire
policy? 2.8853 .231 .498 .249 .162
Aware of fire risk
reduction rules 2.8073 .267 .458 .228 .247
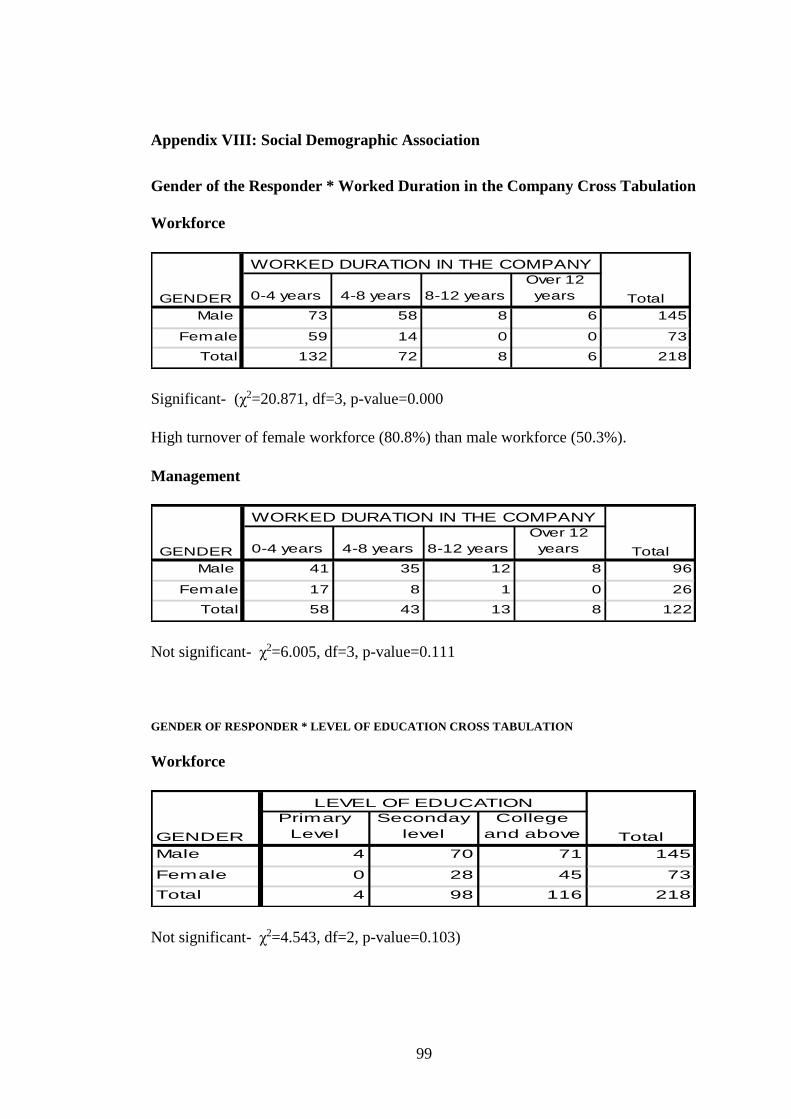
99
Appendix VIII: Social Demographic Association
Gender of the Responder * Worked Duration in the Company Cross Tabulation
Workforce
0-4 years 4-8 years 8-12 years
Over 12
years
Male 73 58 8 6 145
Female 59 14 0 0 73
Total 132 72 8 6 218
WORKED DURATION IN THE COMPANY
TotalGENDER
Significant- (χ2=20.871, df=3, p-value=0.000
High turnover of female workforce (80.8%) than male workforce (50.3%).
Management
0-4 years 4-8 years 8-12 years
Over 12
years
Male 41 35 12 8 96
Female 17 8 1 0 26
Total 58 43 13 8 122
WORKED DURATION IN THE COMPANY
TotalGENDER
Not significant- χ2=6.005, df=3, p-value=0.111
GENDER OF RESPONDER * LEVEL OF EDUCATION CROSS TABULATION
Workforce
Primary
Level
Seconday
level
College
and above
Male 4 70 71 145
Female 0 28 45 73
Total 4 98 116 218
TotalGENDER
LEVEL OF EDUCATION
Not significant- χ2=4.543, df=2, p-value=0.103)
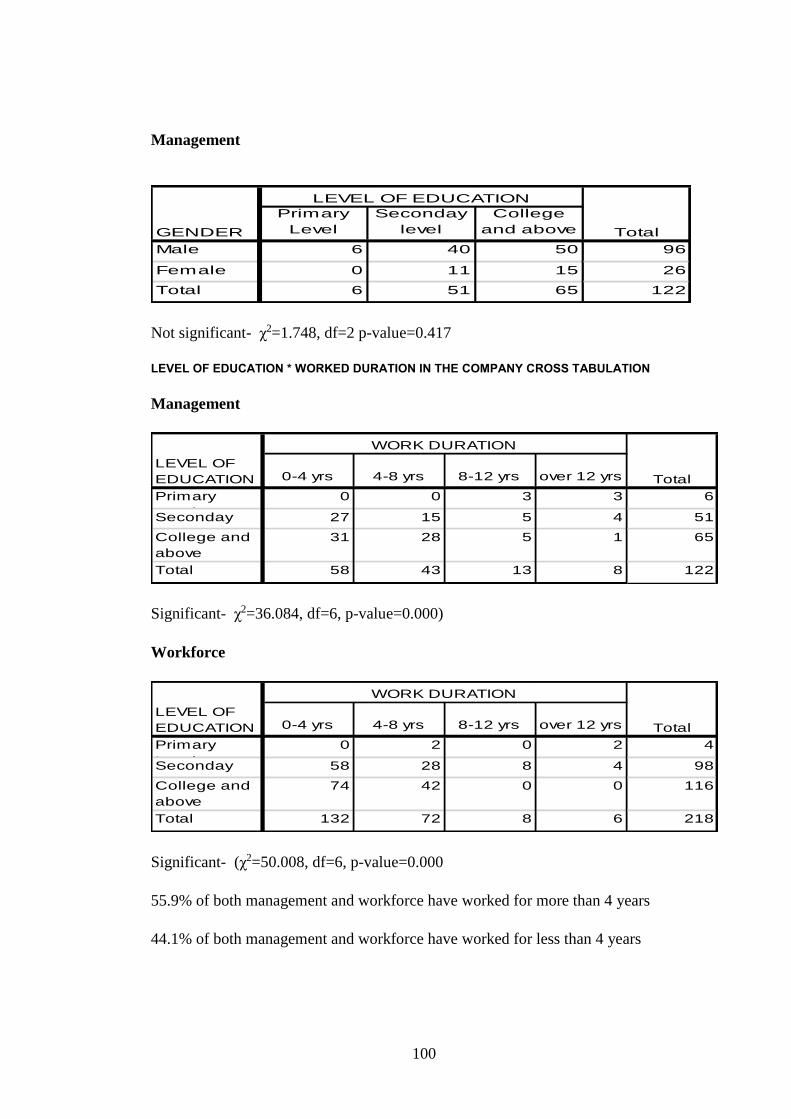
100
Management
Primary
Level
Seconday
level
College
and above
Male 6 40 50 96
Female 0 11 15 26
Total 6 51 65 122
TotalGENDER
LEVEL OF EDUCATION
Not significant- χ2=1.748, df=2 p-value=0.417
LEVEL OF EDUCATION * WORKED DURATION IN THE COMPANY CROSS TABULATION
Management
0-4 yrs 4-8 yrs 8-12 yrs over 12 yrs
Primary
Level
0 0 3 3 6
Seconday 27 15 5 4 51
College and
above
31 28 5 1 65
Total 58 43 13 8 122
LEVEL OF
EDUCATION
WORK DURATION
Total
Significant- χ2=36.084, df=6, p-value=0.000)
Workforce
0-4 yrs 4-8 yrs 8-12 yrs over 12 yrs
Primary
Level
0 2 0 2 4
Seconday 58 28 8 4 98
College and
above
74 42 0 0 116
Total 132 72 8 6 218
LEVEL OF
EDUCATION
WORK DURATION
Total
Significant- (χ2=50.008, df=6, p-value=0.000
55.9% of both management and workforce have worked for more than 4 years
44.1% of both management and workforce have worked for less than 4 years
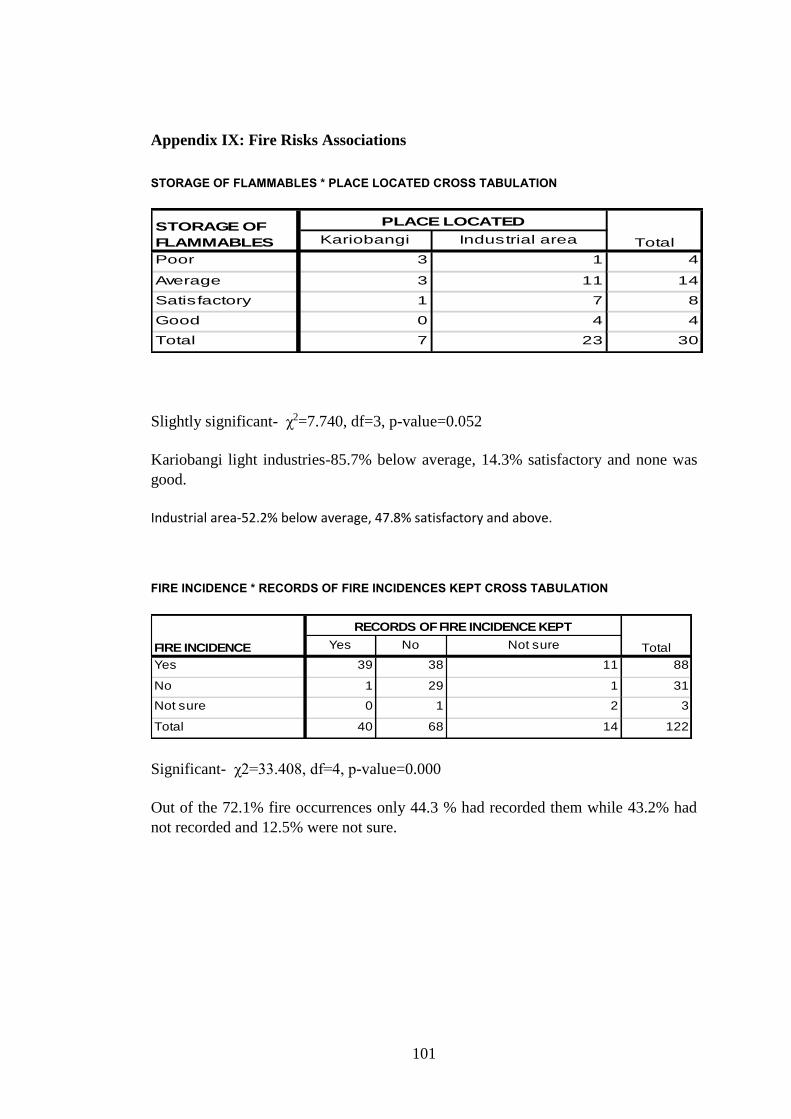
101
Appendix IX: Fire Risks Associations
STORAGE OF FLAMMABLES * PLACE LOCATED CROSS TABULATION
Kariobangi Industrial area
Poor 3 1 4
Average 3 11 14
Satisfactory 1 7 8
Good 0 4 4
Total 7 23 30
STORAGE OF
FLAMMABLES
PLACE LOCATED
Total
Slightly significant- χ2=7.740, df=3, p-value=0.052
Kariobangi light industries-85.7% below average, 14.3% satisfactory and none was
good.
Industrial area-52.2% below average, 47.8% satisfactory and above.
FIRE INCIDENCE * RECORDS OF FIRE INCIDENCES KEPT CROSS TABULATION
Yes No Not sure
Yes 39 38 11 88
No 1 29 1 31
Not sure 0 1 2 3
Total 40 68 14 122
FIRE INCIDENCE
RECORDS OF FIRE INCIDENCE KEPT
Total
Significant- χ2=33.408, df=4, p-value=0.000
Out of the 72.1% fire occurrences only 44.3 % had recorded them while 43.2% had
not recorded and 12.5% were not sure.
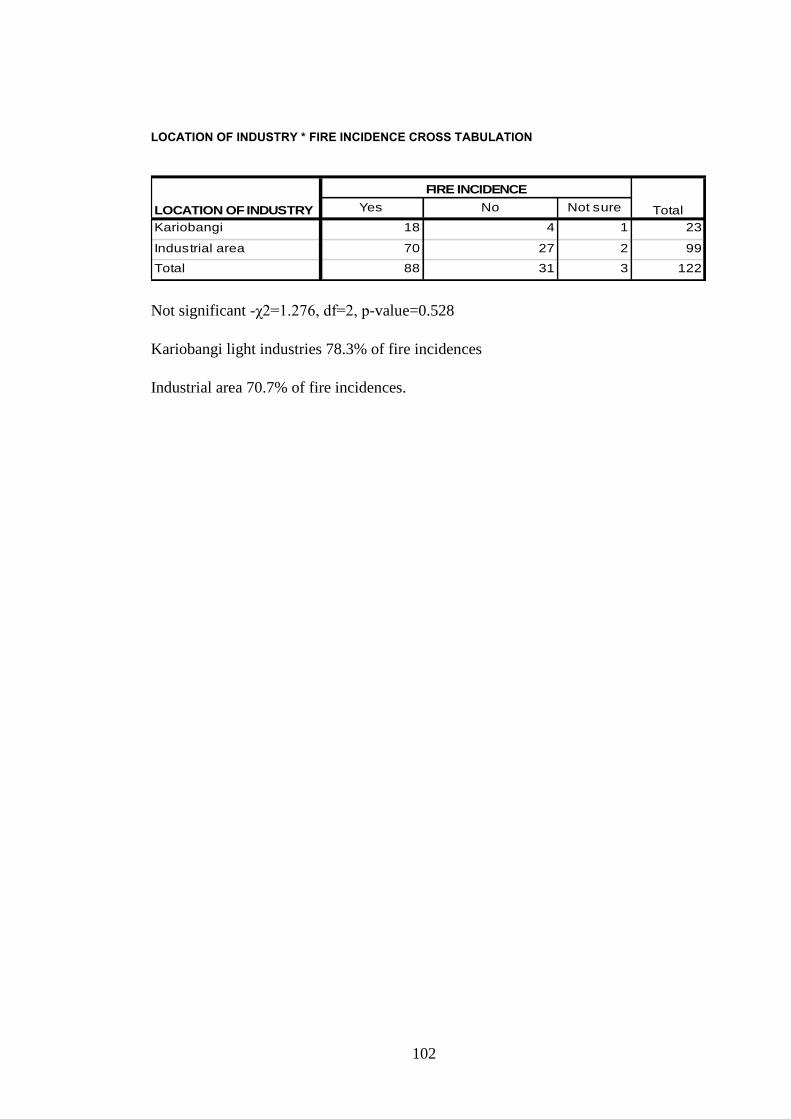
102
LOCATION OF INDUSTRY * FIRE INCIDENCE CROSS TABULATION
Yes No Not sure
Kariobangi 18 4 1 23
Industrial area 70 27 2 99
Total 88 31 3 122
LOCATION OF INDUSTRY
FIRE INCIDENCE
Total
Not significant -χ2=1.276, df=2, p-value=0.528
Kariobangi light industries 78.3% of fire incidences
Industrial area 70.7% of fire incidences.
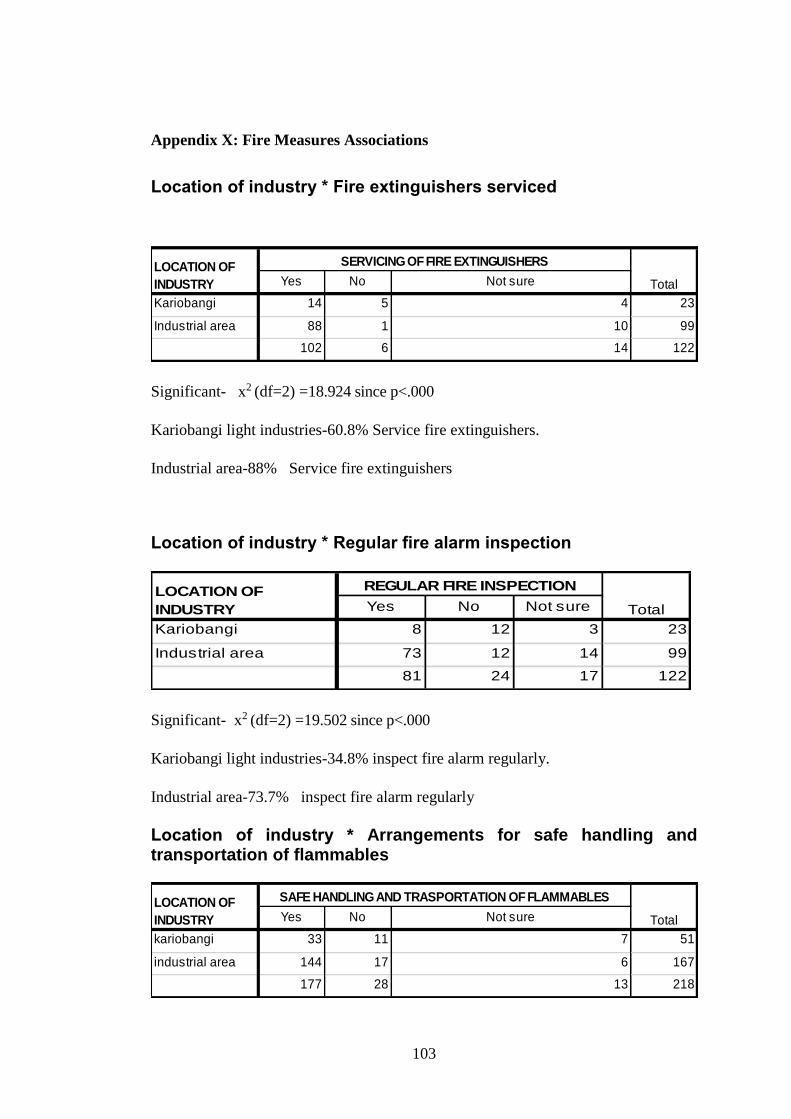
103
Appendix X: Fire Measures Associations
Location of industry * Fire extinguishers serviced
Yes No Not sure
Kariobangi 14 5 4 23
Industrial area 88 1 10 99
102 6 14 122
LOCATION OF
INDUSTRY
SERVICING OF FIRE EXTINGUISHERS
Total
Significant- x2 (df=2) =18.924 since p<.000
Kariobangi light industries-60.8% Service fire extinguishers.
Industrial area-88% Service fire extinguishers
Location of industry * Regular fire alarm inspection
Yes No Not sure
Kariobangi 8 12 3 23
Industrial area 73 12 14 99
81 24 17 122
Total
LOCATION OF
INDUSTRY
REGULAR FIRE INSPECTION
Significant- x2 (df=2) =19.502 since p<.000
Kariobangi light industries-34.8% inspect fire alarm regularly.
Industrial area-73.7% inspect fire alarm regularly
Location of industry * Arrangements for safe handling and transportation of flammables
Yes No Not sure
kariobangi 33 11 7 51
industrial area 144 17 6 167
177 28 13 218
LOCATION OF
INDUSTRY
SAFE HANDLING AND TRASPORTATION OF FLAMMABLES
Total

104
Significant- x2 (df=2) =12.901 since p<.000.
Kariobangi light industries-64.7% Have good arrangements for safe handling and
transportation of flammables
Industrial area-86.2% Have good arrangements for safe handling and transportation
of flammables.
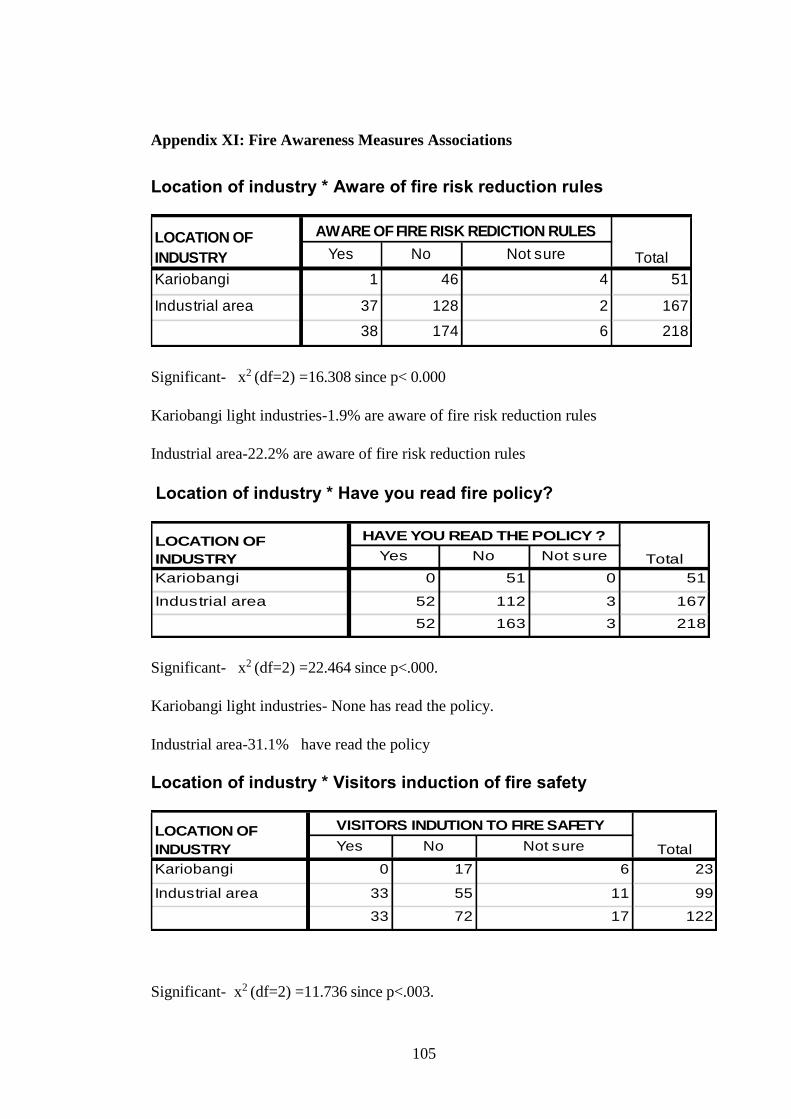
105
Appendix XI: Fire Awareness Measures Associations
Location of industry * Aware of fire risk reduction rules
Yes No Not sure
Kariobangi 1 46 4 51
Industrial area 37 128 2 167
38 174 6 218
LOCATION OF
INDUSTRY
AWARE OF FIRE RISK REDICTION RULES
Total
Significant- x2 (df=2) =16.308 since p< 0.000
Kariobangi light industries-1.9% are aware of fire risk reduction rules
Industrial area-22.2% are aware of fire risk reduction rules
Location of industry * Have you read fire policy?
Yes No Not sure
Kariobangi 0 51 0 51
Industrial area 52 112 3 167
52 163 3 218
LOCATION OF
INDUSTRY
HAVE YOU READ THE POLICY ?
Total
Significant- x2 (df=2) =22.464 since p<.000.
Kariobangi light industries- None has read the policy.
Industrial area-31.1% have read the policy
Location of industry * Visitors induction of fire safety
Yes No Not sure
Kariobangi 0 17 6 23
Industrial area 33 55 11 99
33 72 17 122
LOCATION OF
INDUSTRY
VISITORS INDUTION TO FIRE SAFETY
Total
Significant- x2 (df=2) =11.736 since p<.003.

106
Kariobangi light industries-73.9% Have No visitor’s induction on fire safety
Industrial area-33.3% Have visitor’s induction on fire safety.
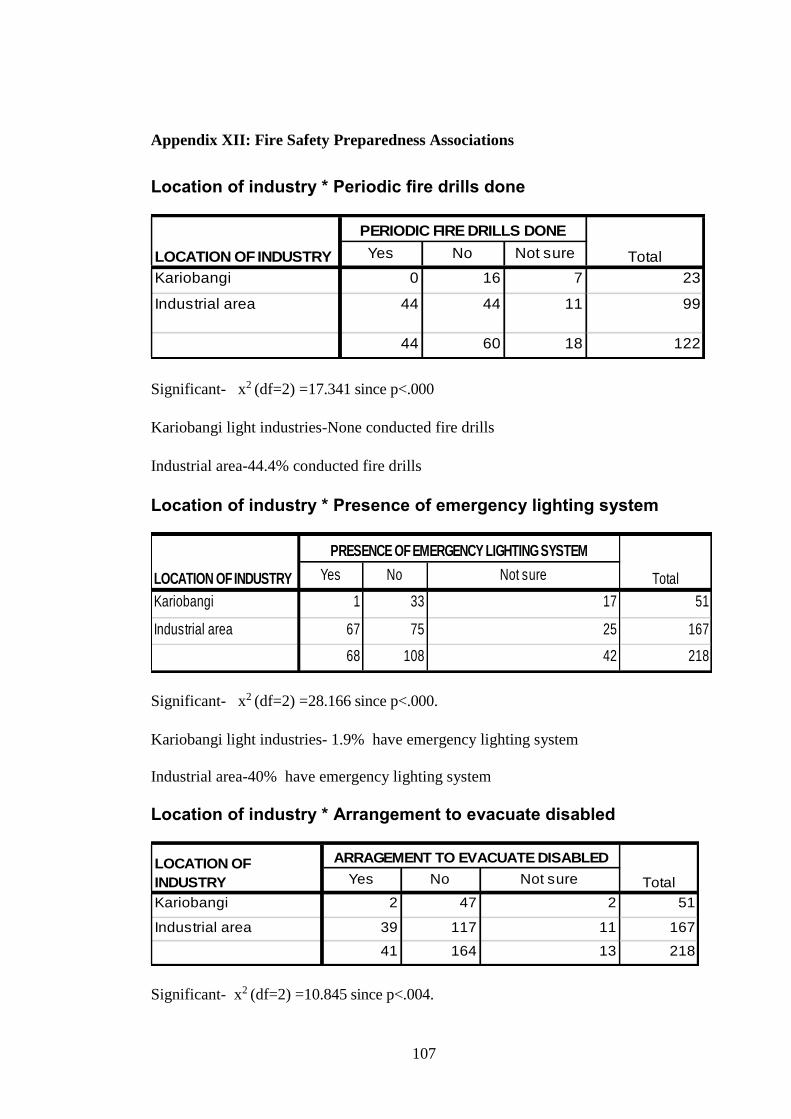
107
Appendix XII: Fire Safety Preparedness Associations
Location of industry * Periodic fire drills done
Yes No Not sure
Kariobangi 0 16 7 23
Industrial area 44 44 11 99
44 60 18 122
LOCATION OF INDUSTRY
PERIODIC FIRE DRILLS DONE
Total
Significant- x2 (df=2) =17.341 since p<.000
Kariobangi light industries-None conducted fire drills
Industrial area-44.4% conducted fire drills
Location of industry * Presence of emergency lighting system
Yes No Not sure
Kariobangi 1 33 17 51
Industrial area 67 75 25 167
68 108 42 218
LOCATION OF INDUSTRY
PRESENCE OF EMERGENCY LIGHTING SYSTEM
Total
Significant- x2 (df=2) =28.166 since p<.000.
Kariobangi light industries- 1.9% have emergency lighting system
Industrial area-40% have emergency lighting system
Location of industry * Arrangement to evacuate disabled
Yes No Not sure
Kariobangi 2 47 2 51
Industrial area 39 117 11 167
41 164 13 218
LOCATION OF
INDUSTRY
ARRAGEMENT TO EVACUATE DISABLED
Total
Significant- x2 (df=2) =10.845 since p<.004.
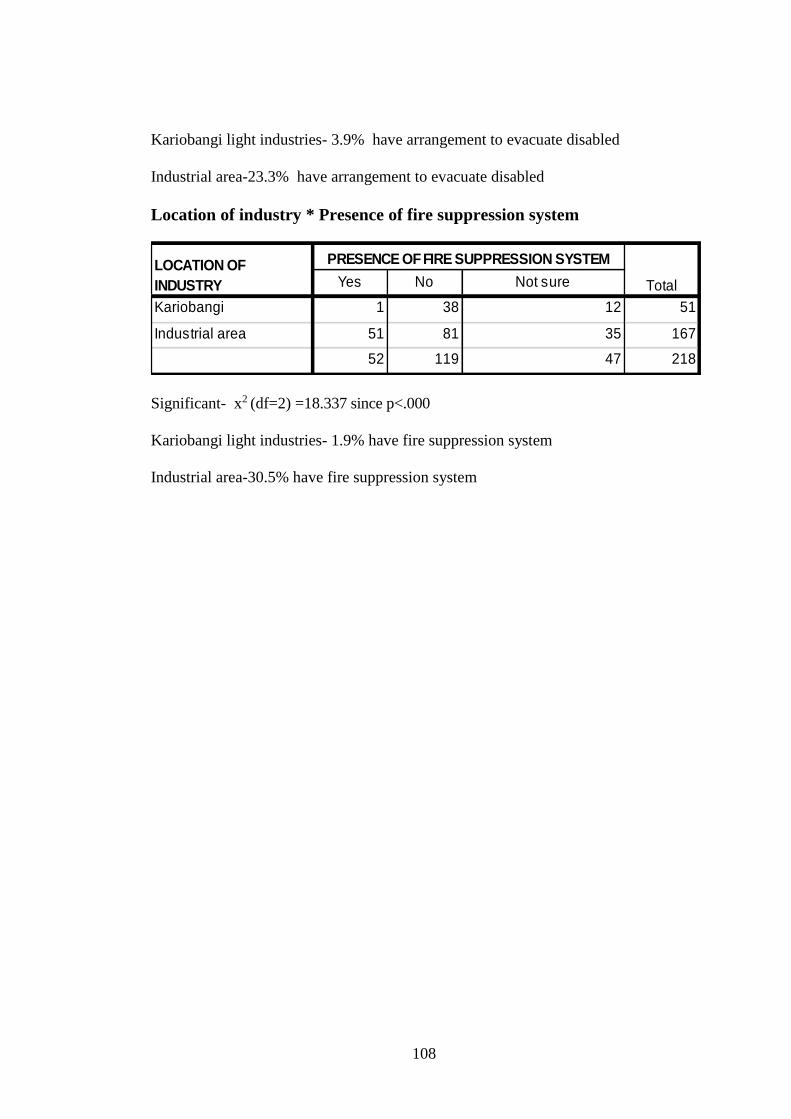
108
Kariobangi light industries- 3.9% have arrangement to evacuate disabled
Industrial area-23.3% have arrangement to evacuate disabled
Location of industry * Presence of fire suppression system
Yes No Not sure
Kariobangi 1 38 12 51
Industrial area 51 81 35 167
52 119 47 218
LOCATION OF
INDUSTRY
PRESENCE OF FIRE SUPPRESSION SYSTEM
Total
Significant- x2 (df=2) =18.337 since p<.000
Kariobangi light industries- 1.9% have fire suppression system
Industrial area-30.5% have fire suppression system
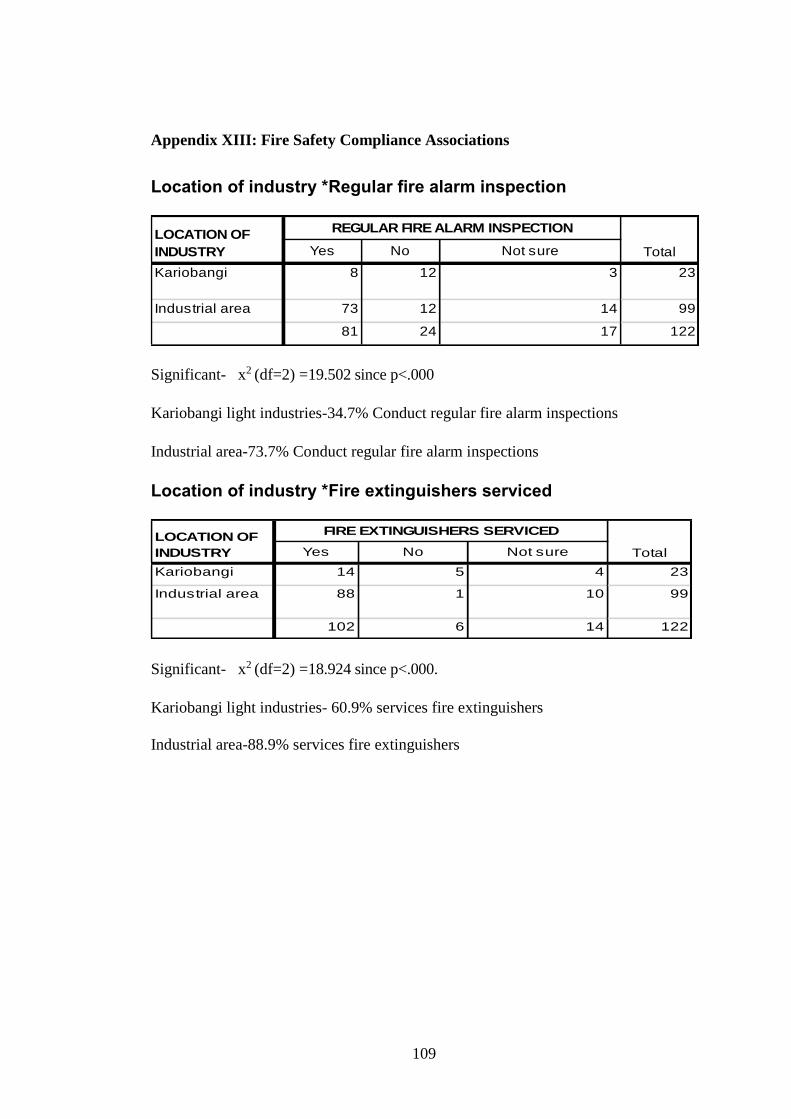
109
Appendix XIII: Fire Safety Compliance Associations
Location of industry *Regular fire alarm inspection
Yes No Not sure
Kariobangi 8 12 3 23
Industrial area 73 12 14 99
81 24 17 122
LOCATION OF
INDUSTRY
REGULAR FIRE ALARM INSPECTION
Total
Significant- x2 (df=2) =19.502 since p<.000
Kariobangi light industries-34.7% Conduct regular fire alarm inspections
Industrial area-73.7% Conduct regular fire alarm inspections
Location of industry *Fire extinguishers serviced
Yes No Not sure
Kariobangi 14 5 4 23
Industrial area 88 1 10 99
102 6 14 122
LOCATION OF
INDUSTRY
FIRE EXTINGUISHERS SERVICED
Total
Significant- x2 (df=2) =18.924 since p<.000.
Kariobangi light industries- 60.9% services fire extinguishers
Industrial area-88.9% services fire extinguishers
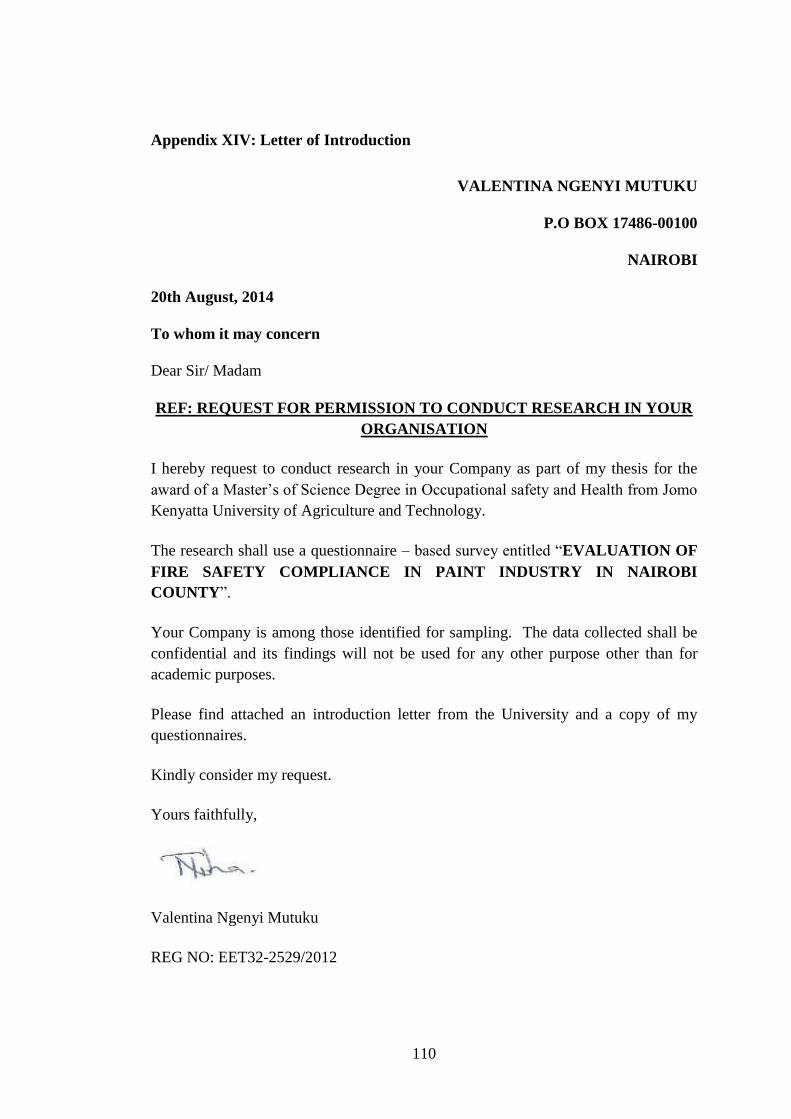
110
Appendix XIV: Letter of Introduction
VALENTINA NGENYI MUTUKU
P.O BOX 17486-00100
NAIROBI
20th August, 2014
To whom it may concern
Dear Sir/ Madam
REF: REQUEST FOR PERMISSION TO CONDUCT RESEARCH IN YOUR
ORGANISATION
I hereby request to conduct research in your Company as part of my thesis for the
award of a Master’s of Science Degree in Occupational safety and Health from Jomo
Kenyatta University of Agriculture and Technology.
The research shall use a questionnaire – based survey entitled “EVALUATION OF
FIRE SAFETY COMPLIANCE IN PAINT INDUSTRY IN NAIROBI
COUNTY”.
Your Company is among those identified for sampling. The data collected shall be
confidential and its findings will not be used for any other purpose other than for
academic purposes.
Please find attached an introduction letter from the University and a copy of my
questionnaires.
Kindly consider my request.
Yours faithfully,
Valentina Ngenyi Mutuku
REG NO: EET32-2529/2012
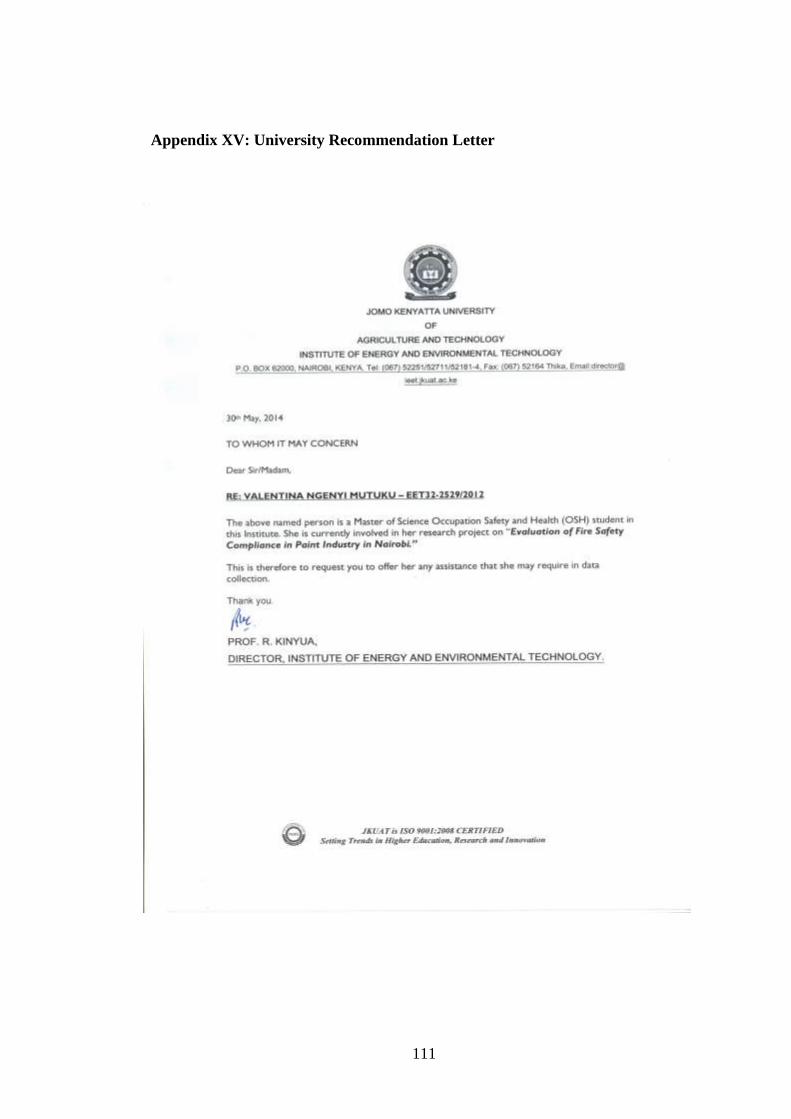
111
Appendix XV: University Recommendation Letter
112
Appendix XVI: Published Journal Paper
113

114
115


