Embed Size (px)
Citation preview

Evaluation of Interlaboratory Performance through Proficiency Testing ........ 70 MPa
79
Evaluation of Interlaboratory Performance throughProficiency Testing using Pressure Dial Gauge in the
Hydraulic Pressure Measurement up to 70 MPa
SANJAY YADAV*, OM PRAKASH, V. K. GUPTA, B.V. KUMARASWAMY andA. K. BANDYOPADHYAY
National Physical Laboratory (NPLI), CSIRDr. K.S. Krishnan Road, New Delhi - 110 012, India
*e-mail : [email protected]
[Received : 14.03.2008 ; Revised : 21.05.2008 ; Accepted : 27.05.2008]
AbstractThe present paper reports the results of the proficiency testing (PT) accomplished for 17 laboratories,accredited by National Accreditation Board for Testing and Calibration of Laboratories (NABL). Themeasurements were performed in the pressure range 10-70 MPa using pressure dial gauge as anartifact. Only laboratories having best measurement capabilities 0.25 % or coarser than 0.25 % of full-scale pressure were included in this PT. The program started in May 2006 and completed duringOctober, 2007. The comparison was carried out at 10 arbitrarily chosen pressure points i.e. 10, 20, 30,40, 45, 50, 55, 60, 65 and 70 MPa. The results thus obtained show that out of the total 159 measurementresults, 135 (84.91 %) are found in good agreement with the results of the reference laboratory. Therelative deviations between laboratories values and reference values are well within 0.15 % for 75measurement points, 0.25% for 108 measurement points and 0.50% for 148 measurement points. Thedifference of the laboratories values with reference values are found almost well within the uncertaintyband of the reference values at 71.07 % measurement results, within their reported expanded uncertaintyband at 62.26% measurement results and within the combined expanded measurement uncertaintyband at 84.91 % measurement results. Overall, the results are considered to be reasonably good, beingthe first proficiency testing for most of the participating laboratories.
MAPAN - Journal of Metrology Society of India, Vol. 23, No. 2, 2008; pp. 79-99
© Metrology Society of India, All rights reserved.
1. Introduction
The physical quantity 'pressure' is one of the mostimportant derived parameters of the physico-mechanical measurement systems in many branchesof science and industry, particularly in technologicalprocesses. The measurement of pressure and vacuumare useful in different diversified areas of research &industry e.g., space research, atomic energy, defenceapplications, semiconductor industry, plasma physicsrelated applications, thin films deposition, powergeneration, X-rays/TV tube manufacturing,
assessment of health, optimization of domesticappliances, manufacturing of chemicals, pesticides,fertilizers, drugs and pharmaceuticals, synthesis ofsuper hard materials like diamonds, forging of coldand hot steels, ventilation, filtration and processcontrol in general, etc. [1-4].
As we move in to the new millennium, theglobalization and international competitiveness intrade and commerce and introduction of qualitysystem, the international trade will continue tosignificantly impact our economy. In compliance withthe recently updated quality standards, the

Sanjay Yadav et al.
80
maintenance of pressure measuring instruments inthe accredited laboratories to obtain optimumperformance requires the periodic calibration traceableto national standards.
To meet the requirements of ISO 17025 [5] andAPLAC MR001 [6], it is mandatory for all accreditingbodies to undertake proficiency testing programmesfor its accredited laboratories in conformity with ISO/IEC Guide 43 [7]. National Accreditation Board forTesting and Calibration Laboratories (NABL),Department of Science and Technology (DST),Government of India has assigned the task ofconducting Proficiency Testing (PT) programme toNational Physical Laboratory (NPL), New Delhi. Themain objectives of this PT programme are i) to assessthe status of analytical competence of participatinglaboratories in view of laboratory accreditation, ii) toidentify the serious constraints (random & systematic)in the working environment of laboratories iii) topromote the scientific and analytical competence ofthe concerned laboratories to the level of excellencefor better output and iv) to provide laboratories withan objective means of assessing and demonstratingthe reliability of data they are producing.
During last 5 years NABL has conducted severalproficiency testing experiments in pressure metrologyin the pressure range up to 70 MPa through NationalPhysical Laboratory (NPL), New Delhi. The first PT,designated as NABL-Pressure-PT001 was organizedfor seven laboratories having measurementcapabilities better than 0.05% of full scale pressureusing dead weight tester as an artifact [8]. The secondPT i.e. NABL-Pressure-PT002 was conducted foranother seven laboratories having measurementcapabilities coarser than 0.05% and better than 0.25% of full scale pressure using digital pressurecalibrator [9-10]. NABL-Pressure-PT003, the third PTincluded eleven laboratories having measurementcapabilities 0.25% or coarse than 0.25% of full scalepressure using pressure dial gauge as an artifact [11]and the NABL-Pressure-PT007 for fourteenlaboratories having measurement capabilities 0.25%or coarser than 0.25% of full scale pressure usingpressure dial gauge as an artifact [12].
In a series of these PT experiments, the present PTprogram, designated as NABL-Pressure-PT006, isrecently completed during October 2007. This PTprogramme was designed and organized in thehydraulic pressure region covering pressure range 10
- 70 MPa (100 to 700 bar) using the pressure dial gaugeas an artifact. The seventeen NABL accreditedpressure calibration laboratories, havingmeasurement capabilities 0.25 % or coarser than 0.25% of full-scale pressure, have been covered in this PT.This report summarizes the results of measurementsof these laboratories at 10 pressure points. Thecirculation of the artifact started in July 2006 andcompleted in July 2007 in a record time.
2. Methodology
The PT programme was designed as perguidelines stipulated in ISO/IEC 17025 [5], ISO/IECGuide 43 [7] and NABL-162 [13]. A high precisionBourdon tube pressure dial gauge, 15" dial mirror type,make Heise, USA, Sl. No. - CM42041 was used as anartifact. Selection of the measurement points is animportant aspect of the PT programme. The entirepressure range of 10 to 70 MPa was divided into 10arbitrarily chosen measurement points of 10, 20, 30,40, 45, 50, 55, 60, 65 and 70 MPa. All the participantswere advised to complete the measurements in twoweeks time and dispatch the artifact to nextparticipant within next one week. All the participantsperformed their measurements well in time. The wholecirculation programme was completed in two loops.Schematic diagram of the movement of the artifact isdepicted in Fig. 1.
All the participants were advised to perform sixobservations at each pressure point, three each inincreasing and decreasing orders of pressures. Theywere also requested to report the temperatures atwhich the measurements were corrected. However,the laboratories were advised to correct the pressuremeasurements at 23º C. The characterization of theartifact was performed at the reference laboratory bydirect comparison method [1-4] against the nationalhydraulic secondary pressure standard, designatedas NPL200MPA, first at the start of the programmeduring May, 2006, second in the middle duringJanuary, 2007 and finally at the end of programmeduring September - October, 2007. The traceability ofthe NPL200MPA has been established as explainedelsewhere [14-16]. NPL200MPA has also been usedas NPL standard to calibrate the transfer standardsfor the recently concluded bilateral comparison withNIST, USA [17].
Before calibration, both the instrument i.e. theNPL200MPA and the artifact were leveled using

Evaluation of Interlaboratory Performance through Proficiency Testing ........ 70 MPa
81
leveling screws and sprit level. The necessary weightswere placed on the carrier of the NPL200MPA andadjusted as per the values of the pressure indicatedon the artifact. This was repeated several times so thatthe error due to this adjustment of the weights isminimized. Sufficient time, 10 minutes approximately,was provided between two successive observationsso that both the systems are in complete equilibrium.At this position, there was no pressure drop in theconnecting line and consequently no movement of thefluid. This procedure was repeated for all the 10pressure points i.e. 10, 20, 30, 40, 45, 50, 55, 60, 65 and70 MPa and observations were repeated six times,thrice in increasing order and thrice in decreasingorder, for each pressure point and the values ofmeasured pressure, their repeatability and expandeduncertainty were computed using computer softwaresdeveloped for this purpose [18-19]. The pressuremeasured by NPL200MPA was calculated using thefollowing equation;
i i NPL air mi
0 s n c p r
m .g (1 / ) CP pA (1 p )[1 ( )(T T )]∑ −ρ ρ + γ
= ±Δ+λ + α +α − [1]
where, mi, is the mass of the standard weight, gNPL
is the local acceleration of gravity, ρair is the density ofthe air at the temperature, barometric pressure andhumidity conditions prevailing in the laboratory, ρmiis the density of the ith weight of the standard, γ is thesurface tension of the pressure transmitting fluid, C isthe circumference of the standard piston where itemerges from the fluid, A0 is the effective area of thestandard piston-cylinder assembly at zero pressure,αc & αp are the thermal expansion coefficients of thestandard's piston and cylinder material, T is thetemperature of the standard's piston - cylinderassembly, Tr is the temperature at which A0 is referred,λs is the pressure distortion coefficient of the effectivearea for the standard and Δp = [(ρf - ρair).gNPL.H] is thehead correction in terms of pressure where H is thedifference in height between the reference levels of thestandard and the artifact and ρf is the density of thetransmitting fluid.
The details of the pressure measured (p) and theirmeasurement uncertainties are shown in Table 1 forall the three successive calibrations performed in May2006, January 2007 and September - October 2007.The reference values of pressure measured are thearithmetic mean of the data obtained during thesethree calibrations. The detailed uncertainty budgetthus prepared for the measurements performed on theartifact is shown in Table 2.
Fig. 1. Circulation and movement of the artifact during comparison. Period shown herein is the actual forwhich the artifact remained with the participating laboratory
Loop 1 (Started 20.07.2007) Loop 2 (Started 23.02.2007)
Loop 2(C
omp. 03.11.2007)
Electronics Test andDevelopment Centre Goa16-04-2007 to 03-05-2007
Loop 1 (Com
p. 09.11.2007)

Sanjay Yadav et al.
82
Tabl
e 1
Det
ails
of m
etro
logi
cal c
hara
cter
istic
s of t
he a
rtif
act a
nd a
ssig
nmen
t of r
efer
ence
val
ues
109.
9763
29.
9838
010
.006
099.
9887
4-0
.012
41-0
.004
940.
0173
50.
0136
60.
0288
80.
0173
50.
0363
50.
0727
020
19.9
7498
19.9
9076
20.0
0007
19.9
8860
-0.0
1362
0.00
215
0.01
147
0.02
216
0.02
890
0.01
363
0.03
889
0.07
777
3029
.963
4429
.950
9329
.983
9129
.966
09-0
.002
65-0
.015
170.
0178
20.
0219
30.
0289
40.
0178
30.
0404
50.
0809
040
39.9
3430
39.9
4756
39.9
9509
39.9
5898
-0.0
2468
-0.0
1142
0.03
610
0.01
357
0.02
900
0.03
612
0.04
827
0.09
654
4544
.983
2745
.002
3444
.996
8544
.994
15-0
.010
880.
0081
90.
0026
90.
0350
10.
0290
30.
0108
90.
0467
60.
0935
350
49.8
7252
49.8
8077
49.9
7861
49.9
1063
-0.0
3812
-0.0
2987
0.06
798
0.03
120
0.02
907
0.06
798
0.08
025
0.16
050
5554
.889
1254
.905
7354
.975
2954
.923
38-0
.342
6-0
.017
650.
0519
10.
0260
30.
0291
20.
0519
00.
0649
60.
1299
160
60.0
2036
60.0
0703
59.9
4948
59.9
9229
0.02
807
0.01
474
-0.0
428
0.03
714
0.02
916
0.04
283
0.06
375
0.12
751
6564
.849
5964
.858
7264
.953
5664
.887
29-0
.037
70-0
.028
570.
0662
70.
0184
20.
0292
10.
0662
50.
0747
10.
1494
270
69.8
4850
69.8
4015
69.9
6512
69.8
8459
-0.0
3609
-0.0
4444
0.08
053
0.02
850
0.02
927
0.08
051
0.09
028
0.18
055
Nom
i-na
lPr
es-
sure
(MPa
)Pres
sure
(MPa
)p 1
May
2006
Pres
sure
(MPa
)p 2
Jan.
2007
Pres
sure
(MPa
)p 3
Sept
. - O
ct.
2007
Ave
rage
Pre
ssur
ep
(MPa
)Re
fere
nce
Val
ues
Dev
.p 1-p
(MPa
)
Dev
.p 2-p
(MPa
)
Dev
.p 3-p
(MPa
)
Unc
erta
inty
Thro
ugh
Type
AM
etho
d(M
Pa)
Unc
erta
inty
Thro
ugh
Type
BM
etho
d(M
Pa)
Unc
erta
inty
Thro
ugh
Stab
ility
of
the A
rtifa
ct(M
Pa)
Com
bine
dU
ncer
-ta
inty
uc(p
)(M
Pa)
Expa
nded
Unc
er-
tain
tyU
(p)
(MPa
)
Tabl
e 2
Unc
erta
inty
Bud
get o
f the
Art
ifac
t at M
axim
um P
ress
ure
of 7
0 M
Pa
Unc
erta
inty
of t
he S
tand
ard
u B170
0.00
49N
orm
al –
Typ
e B0.
0049
10.
0049
∞U
ncer
tain
ty d
ue to
Res
olut
ion
0.1
0.05
Rect
angu
lar –
Typ
e B
/ √3
0.02
891
0.02
89∞
of th
e Art
ifact
uB2
Repe
atab
ility
in th
e thr
ee C
alib
ratio
ns0.
0698
0.06
98N
orm
al –
Typ
e A /
√n
0.02
851
0.02
855
(Max
imum
) uA
1U
ncer
tain
ty d
ue to
Sta
bilit
y (M
axim
um0.
081
0.08
1N
orm
al –
Typ
e B
/ 1
0.08
11
0.08
1∞
Dev
iatio
n fr
om th
e Ref
eren
ce V
alue
) μB3
u c(p)
k =
10.
0905
6135
EXPA
ND
ED U
NC
ERTA
INTY
U(p
)k
= 2.
00.
181
The
expa
nded
unc
erta
inty
ass
ocia
ted
with
pre
ssur
e m
easu
rem
ents
is 0
.181
MPa
.
Sour
ce o
fU
ncer
tain
ty(X
i)
Estim
ates
(xI)
(MPa
)
Lim
its±Δ
x i(M
Pa)
Prob
abili
tyD
istr
ibut
ion
- Typ
e Aor
Typ
e B F
acto
r
Stan
dard
Unc
erta
inty
U(X
i) (M
Pa)
Sens
itivi
tyC
oeffi
cien
tU
ncer
tain
tyC
ontr
ibut
ion
u i(y) (
MPa
)
Deg
ree
of F
reed
om( F
)
Evaluation of Interlaboratory Performance through Proficiency Testing ........ 70 MPa
83
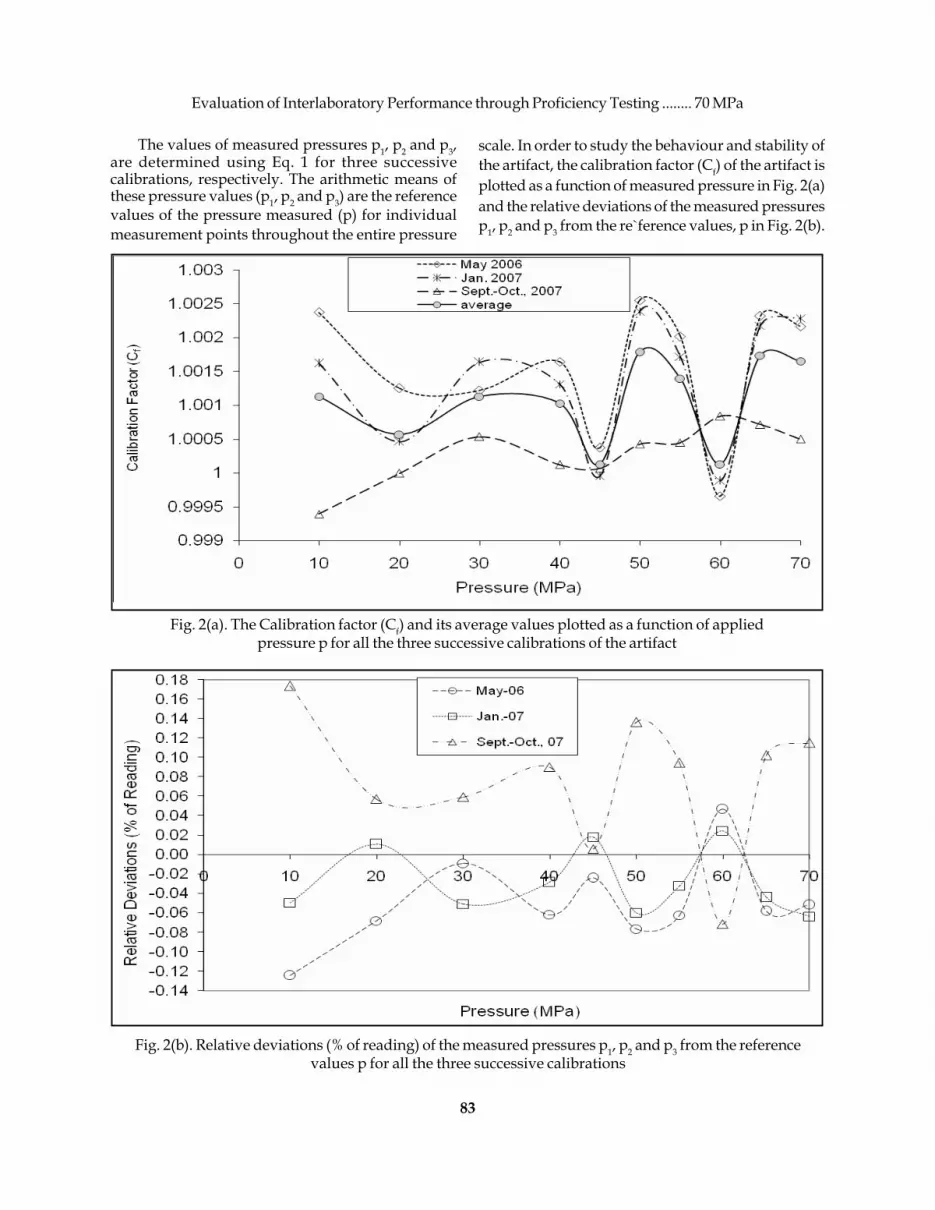
The values of measured pressures p1, p2 and p3,are determined using Eq. 1 for three successivecalibrations, respectively. The arithmetic means ofthese pressure values (p1, p2 and p3) are the referencevalues of the pressure measured (p) for individualmeasurement points throughout the entire pressure
scale. In order to study the behaviour and stability ofthe artifact, the calibration factor (Cf) of the artifact isplotted as a function of measured pressure in Fig. 2(a)and the relative deviations of the measured pressuresp1, p2 and p3 from the re`ference values, p in Fig. 2(b).
Fig. 2(a). The Calibration factor (Cf) and its average values plotted as a function of appliedpressure p for all the three successive calibrations of the artifact
Fig. 2(b). Relative deviations (% of reading) of the measured pressures p1, p2 and p3 from the referencevalues p for all the three successive calibrations

Sanjay Yadav et al.
84
The calibration factor (Cf) is determined asfollows;
gf
S
pC
p= [2]
where, pg is the reading of the artifact and pS iscorresponding pressure measured by the standardduring calibration. The behaviour of the artifact wasnot found identical in all the three calibrations. It is
clearly evident from Fig. 2(a) that during the twocalibrations of May 2006 and September - October2007, the artifact behaved almost in a similar fashion.Although, the behaviour of the artifact was slightlydifferent during January 2007 but the values ofcalibration factor were found much closer to the unitywhich indicates a close agreement between gaugereading and the standard pressure
The relative deviations of the measured pressuresp1, p2 and p3 from the reference values, p are found
Fig. 2(c). Relative deviations (% of full scale pressure) of the measured pressures p1, p2 and p3from the reference values p for all the three successive calibrations
Fig. 3. Expanded measurement uncertainty U(p) as a function of measured pressure p
U(p) = (0.00171 p + 0.042) MPa
0.00
0.02
0.04
0.06
0.08
0.10
0.12
0.14
0.16
0.18
0.20
0 10 20 30 40 50 60 70
Pressure (MPa)
Ex
pa
nd
ed
Un
ce
rta
inty
(MP
a)
Experimental U(p) Fitted U(p)

Evaluation of Interlaboratory Performance through Proficiency Testing ........ 70 MPa
85
well below ± 0.17 % of reading [Fig. 2(b)] and ± 0.1 %of full scale [Fig. 2(c)]. Although, the deviations arewell within the manufacturer specifications of 0.1 %of span (full scale) except at one pressure point. Themaximum deviation of 0.17 % of reading is taken in toconsideration to estimate the expanded uncertaintyU(p) = (0.042 + 0.00171p) MPa. The expandeduncertainty U(p) as a function of measured pressurep is shown in Fig. 3. This concludes that the artifactremained stable during the whole PT programmewithin its estimated measurement uncertainty.
3. Experimental Setup and Calibration Procedure
Total 17 laboratories participated in the programexcluding the reference laboratory, NPLI, New Delhi.In order to maintain confidentiality in the results, eachparticipating laboratory was assigned a random codenumber and only these code numbers are used hereinthereafter in this PT report. Code number assigned tothe reference laboratory, NPLI, New Delhi, is '1' (Ref.).All the laboratories were advised to install theexperimental set-up as shown in Fig. 4.
All the laboratories were asked to use cleanmineral oil as pressure transmitting fluid in the oilreservoir. The calibration of the artifact starts withleak testing, zero adjustment and the selection of areference or datum level. For leak testing, they wererequested to pressurize both the standard and the
artifact up to 700 bar with the help of hydraulic screwpump and needle valves and wait for at least 10minutes and then release the pressure slowly to zero.Laboratories were asked to repeat this process at leastthree times to ensure that there are no leaks in thesystem. In this way compressibility of the transmittingoil, packing of the valves, pump plunger and O-ringseals are stabilized to reach an optimum level.
Zero adjustment of the artifact is then performedusing the zero adjustment knob of the artifact.Participating laboratories were also requested toensure zero adjustment of their standard (in case ofdigital pressure instrument or pressure dial gauge).In case zero adjustment knobs are not provided withtheir standards, they were asked to record the initialbias in the measurements and apply necessarycorrection at the appropriate level.
The selection of appropriate and precise referenceor datum plane is very important for applying thehydrostatic head correction. Usually, reference ordatum plane is marked on the standard or noted inthe operation manuals. If no such information isavailable, the centre point of the elastic element isconsidered the reference or datum plane.
Needle setting of the artifact is also one of theimportant points to be taken into consideration duringmeasurements. The normal practice is to check the
Fig. 4. Experimental setup for the measurement using pressure dial gauge as an artifact

Sanjay Yadav et al.
86
reflection of the needle from the mirror. In order tominimize the parallax error, the best position formeasurement would be when the reflected imagecoincides with real object i.e. needle in the presentcase. Laboratories were advised to follow the sameeye estimation uniformly for all the pressure points.
In this way, the system would be ready to performcalibration. The full scale pressure (measurementrange in the present case) of 700 bar is then dividedinto 10 pressure points of 100, 200, 300, 400, 450, 500,550, 600, 650 and 700 bar. The needle of the artifact isthen brought to first measurement point bypressurizing the system and the corresponding valueof the pressure measured by the standard is recordedafter applying all corrections i.e. temperaturecorrection, hydrostatic head correction and unitconversion. Laboratories were advised to record thecorrected pressure measured by the standard only inbar or MPa. Subsequently, the needle of the artifact isfixed to the next pressure point and the pressure
measured by the standard is recorded. This process isrepeated till the full-scale pressure of 700 bar isachieved. They were asked to maintain sufficient time(approximately 10 minutes) between two successiveobservations to allow the system to reach a state ofthermal equilibrium. It was also suggested to wait forat least 10 minutes after reaching full-scale pressurebefore the observations are repeated in the decreasingorder of pressure till the pressure reaches to zero.Laboratories were requested to record at least 20observations, 10 each in the order of increasing anddecreasing pressures, to perform one pressure cycleand then to repeat the measurements for at least 3pressure cycles to make the total number of 60observations. A layout diagram shown in Fig. 5presents the sequence of measurements to be taken.
All the participants were advised to apply thetemperature and head corrections carefully beforesubmitting the results. They were requested to correct
Fig. 5. Sequence of measurements taken

Evaluation of Interlaboratory Performance through Proficiency Testing ........ 70 MPa
87
the values of the measured pressure for 23 ºC usingthermal expansion coefficient of the piston - cylinderassembly (if dead weight tester is used as standard)or elastic element (if pressure dial gauge or digitalcalibrator is used as standard) using standardequations. They were also requested to evaluate theuncertainty associated with pressure measurementsas per ISO Guide to the Expression of Uncertainty inMeasurement / NABL Document 141 on uncertaintyfollowing Type A and Type B methods of evaluation[20-21]. Each participating laboratory was requestedto prepare an uncertainty budget at the maximumpressure, considering all Type A and Type Buncertainty components.
4. Reporting of Results and Data Analysis
Laboratories were also asked to submit copies ofthe calibration certificates for the referenceinstruments used in measurements, calculation sheetsfor determining the uncertainty in measurements andcalibration certificate as issued to the customer forsuch measurements. The values of measured pressure,acceleration of local gravity and reference temperatureand the measurement traceability, reported by theparticipants are shown in Table 3. The performanceof the laboratories has been assessed on the basis ofError Normalized (En) number of each measurement.The En values are estimated for each participant ateach pressure as per guidelines in the literature [7, 13,22-23];
{ } { }
'
n 2 2'
p pEU(p ) U(p)
−=
+ [3]
where p' is the participant's measured pressure value,p is the calculated reference value, U(p') is theparticipant's claimed expanded uncertainty at acoverage factor k = 2 and U(p) is the expandedmeasurement uncertainty of the reference value at acoverage factor k = 2. An En value ±1 indicatesagreement within the combined uncertainties for theresults to be internationally acceptable. An En numberbetween -1 and +1 indicates an acceptable degree ofcompatibility between the laboratory's result and thereference value when the quoted uncertainties aretaken into account. En number outside the -1 and +1range is unacceptable and requires immediateinvestigation and corrective action by the laboratoryconcerned.
5. Results and Discussion
Details of the values of measured pressure (p')and other metrological characteristics of thelaboratory standards reported by the participants areshown in Table 3 (for all the participants). The relativedeviations of measured pressure (p') of eachparticipant from reference value (p) are shown inTable 4. The graphs plotted for the results forindividual laboratories, are depicted as Figs. 6 -17.The summaries of the reported expandedmeasurement uncertainties, combined expandedmeasurement uncertainties and the normalized error(En) values, are shown in Tables 5 to 7, respectivelyfor entire pressure scale of 10 - 70 MPa.
In general, the performance of the laboratory isconsidered satisfactory if normalized error En is≤ ±1. The tabulated data shown in Tables 5 to 7reveals that there are total 159 measurement results.Measurement results of 9 laboratories (Code No. 2, 6,7, 10, 11, 12, 13, 17 and 18) out of total 17 laboratoriesare well within acceptable limits of normalized errorover the entire pressure range of 10 - 70 MPa. However,the measurement results of another 2 laboratorieswith Code No. 8 and 16 are also quite good having Envalues ≥ ±1 only at one pressure point. En values of135 measurement results out of total 159 are
≤ ±1,
which is 84.91 %. These results are acceptable. Envalues of remaining 6 laboratories referred by CodeNo. 3, 4, 5, 9, 14 and 15 are
≥
±1 for 2 or more than 2pressure points. The larger the absolute value of theEn number, the bigger the problem. An En
≥
±1 meansthat there is a significant bias in the laboratory's resultsand that the quoted value of its associated uncertaintydoes not adequately accommodate that bias, thereforefurther investigations are needed on the part of thelaboratory.
The graphical representations in Figs. 6-15 givethe agreement between participating laboratories andthe reference laboratory for individual pressure pointsof 10 MPa, 20 MPa, 30 MPa, 40 MPa, 45 MPa, 50 MPa,55 MPa, 60 MPa, 65 MPa and 70 MPa, respectively.The summary of the normalized error values (En) as afunction of applied pressure (p') is given in Table 7and its graphical representation is depicted in Fig.16. The relative deviations of measured pressure (p')from reference values (p) are shown in Fig. 17. Thedeviations lying within the uncertainty band of thereference laboratory is an indication of satisfactory

Sanjay Yadav et al.
88
Tabl
e 3
Det
ails
of t
he re
fere
nce
valu
es o
f mea
sure
d pr
essu
re (p
), pr
essu
re m
easu
red
by th
e pa
rtic
ipan
ts (p
'), re
fere
nce
tem
pera
ture
and
oth
erm
etro
logi
cal c
hara
cter
istic
s of t
he la
bora
tori
es st
anda
rds
12
34
56
78
910
1112
1314
1516
1718
*pn
(MPa
) p(M
Pa)
#p’ (
MPa
)
109.
9887
10.0
253
10.0
575
9.97
7410
.057
010
.000
09.
9830
10.0
500
9.92
6710
.027
010
.013
69.
8930
10.0
900
10.1
450
9.97
8010
.178
9.96
2275
10.0
052
2019
.988
620
.039
20.1
070
19.9
915
20.0
690
20.0
000
19.9
830
20.0
300
19.9
567
20.0
760
20.0
471
19.9
360
20.0
830
20.0
690
19.9
140
20.0
202
19.9
8387
19.9
987
3029
.966
130
.063
730
.079
729
.938
630
.062
030
.000
029
.985
030
.030
029
.974
729
.966
030
.019
029
.916
030
.093
029
.955
29.8
990
29.9
385
29.9
602
29.9
9340
39.9
590
40.0
887
40.1
487
40.0
521
40.1
660
40.0
000
40.0
010
40.1
000
39.8
487
39.9
580
40.0
334
39.9
960
40.0
860
40.1
7239
.810
039
.97
39.9
6951
40.0
115
4544
.994
1545
.110
3345
.103
45.0
0893
45.1
2844
.993
44.9
9844
.97
44.9
1115
44.9
3945
.039
8644
.935
45.0
4145
.074
44.7
990
44.8
788
44.9
5071
44.9
868
5049
.910
650
.131
550
.095
250
.058
450
.116
049
.999
049
.987
049
.950
049
.914
549
.894
050
.029
749
.939
050
.043
050
.029
49.8
540
49.8
623
49.9
3196
49.9
892
5554
.923
455
.153
055
.153
655
.055
055
.074
055
.003
054
.988
054
.940
054
.843
654
.912
055
.038
054
.898
055
.001
054
.963
54.8
270
54.8
154
.918
0554
.970
360
59.9
923
-60
.102
060
.046
860
.160
059
.996
059
.983
059
.940
059
.810
859
.979
060
.037
759
.860
060
.006
059
.974
59.7
740
59.8
645
59.9
1085
59.9
852
6564
.887
3-
65.0
953
65.0
694
65.1
160
65.0
060
64.9
880
64.8
700
--
65.0
371
64.7
790
64.9
780
65.1
9664
.796
064
.799
564
.918
3764
.967
370
69.8
846
-70
.092
070
.085
1-
69.9
660
-69
.970
0-
-70
.024
7-
70.0
330
-69
.718
070
.002
869
.932
4469
.963
g(m
/s2 )
9.79
1239
3-
9.78
759
9.78
799.
9993
47-
9.78
7177
9.88
029.
7909
591
9.78
2939
9.78
0352
9.78
389.
784
9.78
807
9.78
553
9.78
8184
39.
7911
1017
9.78
584
Ref
.Tem
p.23
23+2
23.6
-24.
820
2323
23+1
2323
.523
.423
+125
+423
+123
+124
23+1
2023
+2 (0 C
)
Trac
-N
PLI-H
1,R
TC,
Mea
sure
NV
LAP,
NPL
,EM
C,
NPL
,N
agm
an,
-M
easu
reU
KA
S,ID
EMI,
ETD
C,
Mea
sure
IDEM
I,ER
TL,
NPL
,ID
EMI,
eabi
lity
NIS
T,N
ewTe
chni
quw
USA
New
Kol
katta
New
Che
nnai
Tech
niqu
wU
KM
umba
iC
henn
ai T
ech.
Mum
bai
Mum
bai
New
Mum
bai
USA
Del
hiC
henn
aiD
elhi
Del
hiC
henn
ai C
henn
aiD
elhi
* Nom
inal
Pre
ssur
e
#Pr
esur
e V
alue
s fo
r La
bora
tory
cod
e 2
to 1
8.
Labo
rato
ry C
ode

Evaluation of Interlaboratory Performance through Proficiency Testing ........ 70 MPa
89
Tabl
e 4
Rel
ativ
e de
viat
ions
(in
%) o
f the
mea
sure
d pr
essu
re (p
') fr
om re
fere
nce
valu
es (p
)
p (M
Pa)
12
34
56
78
910
1112
1314
1516
1718
10-
0.37
0.69
-0.1
10.
680.
11-0
.06
0.61
-0.6
20.
380.
25-0
.96
1.01
1.56
-0.1
11.
89-0
.26
0.16
20-
0.25
0.59
0.01
0.40
0.06
-0.0
30.
21-0
.16
0.44
0.29
-0.2
60.
470.
40-0
.37
0.16
-0.0
20.
0530
-0.
330.
38-0
.09
0.32
0.11
0.06
0.21
0.03
0.00
0.18
-0.1
70.
42-0
.04
-0.2
2-0
.09
-0.0
20.
0940
-0.
320.
470.
230.
520.
100.
110.
35-0
.28
0.00
0.19
0.09
0.32
0.53
-0.3
70.
030.
030.
1345
-0.
260.
240.
030.
300.
000.
01-0
.05
-0.1
8-0
.12
0.10
-0.1
30.
100.
18-0
.43
-0.2
6-0
.10
-0.0
250
-0.
440.
370.
300.
410.
180.
150.
080.
01-0
.03
0.24
0.06
0.27
0.24
-0.1
1-0
.10
0.04
0.16
55-
0.42
0.42
0.24
0.27
0.14
0.12
0.03
-0.1
5-0
.02
0.21
-0.0
50.
140.
07-0
.18
-0.2
1-0
.01
0.09
60-
-0.
180.
090.
280.
01-0
.02
-0.0
9-0
.30
-0.0
20.
08-0
.22
0.02
-0.0
3-0
.36
-0.2
1-0
.14
-0.0
165
--
0.32
0.28
0.35
0.18
0.16
-0.0
3-
-0.
23-0
.17
0.14
0.48
-0.1
4-0
.14
0.05
0.12
70-
-0.
300.
29-
0.12
-0.
12-
-0.
20-
0.21
--0
.24
0.17
0.07
0.11
Labo
rato
ry C
ode
Tabl
e 5
Sum
mar
y of
the
expa
nded
unc
erta
inty
(M
Pa) e
stim
ated
and
repo
rted
by
the
part
icip
ants
p (M
Pa)
12
34
56
78
910
1112
1314
1516
1718
100.
0727
0.26
620.
0606
0.05
770.
069
0.01
200.
1279
0.07
250.
0966
0.12
360.
0650
0.10
560.
1233
0.10
540.
0080
0.06
820.
0587
60.
062
200.
0778
0.26
640.
0634
0.07
150.
065
0.01
200.
1262
0.07
250.
0483
0.12
680.
0660
0.11
560.
1047
0.09
680.
0320
0.11
940.
0580
40.
0730
0.08
090.
2662
0.06
240.
0578
0.08
20.
0120
0.12
370.
0725
0.04
140.
1332
0.06
500.
1154
0.13
030.
1026
0.03
300.
095
0.05
850.
076
400.
0965
0.26
620.
0642
0.07
150.
067
0.01
200.
1221
0.07
250.
0487
0.12
640.
0660
0.12
440.
1095
0.09
680.
0080
0.08
480.
0587
0.08
445
0.09
350.
2662
0.06
560.
0578
0.07
30.
0146
0.12
310.
0725
0.04
120.
1196
0.07
000.
1428
0.10
400.
0961
0.01
000.
0854
0.05
876
0.08
250
0.16
050.
2668
0.06
980.
0631
0.07
10.
0146
0.13
430.
0725
0.04
130.
1238
0.06
900.
1134
0.11
730.
0966
0.04
600.
0702
0.05
884
0.08
855
0.12
990.
2660
0.06
960.
0716
0.08
10.
0172
0.13
620.
0725
0.04
750.
1370
0.07
100.
1134
0.10
950.
1029
0.00
800.
0714
0.05
888
0.09
260
0.12
75-
0.06
980.
0716
0.06
70.
0172
0.13
950.
0725
0.09
560.
1256
0.07
000.
1054
0.12
510.
1040
0.03
000.
0698
0.05
850.
165
0.14
94-
0.07
120.
0580
0.05
90.
0146
0.15
140.
0725
--
0.07
100.
1064
0.11
690.
1058
0.04
700.
0888
0.05
904
0.10
270
0.18
06-
0.07
320.
0606
-0.
0146
-0.
0725
--
0.06
80-
0.16
16-
0.03
200.
080.
0589
40.
108
Labo
rato
ry C
ode

Sanjay Yadav et al.
90
Tabl
e 6
Sum
mar
y of
the
com
bine
d ex
pand
ed u
ncer
tain
ty (M
Pa) e
stim
ated
dur
ing
com
pari
son
p (M
Pa)
12
34
56
78
910
1112
1314
1516
1718
100.
0727
0.27
590.
0946
0.09
280.
1000
0.07
370.
1472
0.10
260.
1209
0.14
340.
0975
0.12
820.
1431
0.12
800.
0731
0.09
970.
0935
0.09
5520
0.07
780.
2775
0.10
030.
1056
0.10
110.
0787
0.14
830.
1063
0.09
150.
1487
0.10
200.
1393
0.13
050.
1241
0.08
410.
1425
0.09
700.
1046
300.
0809
0.27
820.
1022
0.09
940.
1149
0.08
180.
1478
0.10
860.
0909
0.15
580.
1038
0.14
090.
1534
0.13
060.
0874
0.12
480.
0998
0.11
1040
0.09
650.
2832
0.11
590.
1201
0.11
770.
0973
0.15
570.
1207
0.10
810.
1591
0.11
690.
1575
0.14
600.
1367
0.09
690.
1285
0.11
300.
1280
450.
0935
0.28
220.
1142
0.11
000.
1184
0.09
470.
1546
0.11
830.
1022
0.15
180.
1168
0.17
070.
1398
0.13
410.
0941
0.12
670.
1105
0.12
4450
0.16
050.
3114
0.17
500.
1725
0.17
570.
1612
0.20
930.
1761
0.16
570.
2027
0.17
470.
1965
0.19
880.
1873
0.16
700.
1752
0.17
090.
1830
550.
1299
0.29
600.
1474
0.14
830.
1533
0.13
100.
1882
0.14
880.
1383
0.18
880.
1480
0.17
240.
1699
0.16
570.
1302
0.14
820.
1426
0.15
9260
0.12
75-
0.14
540.
1462
0.14
400.
1287
0.18
900.
1467
0.15
940.
1790
0.14
550.
1654
0.17
870.
1646
0.13
100.
1454
0.14
030.
1620
650.
1494
-0.
1655
0.16
030.
1605
0.15
010.
2127
0.16
61-
-0.
1654
0.18
340.
1897
0.18
310.
1566
0.17
380.
1607
0.18
0970
0.18
06-
0.19
480.
1904
-0.
1811
-0.
1945
--
0.19
29-
0.24
23-
0.18
340.
1975
0.18
990.
2104
Labo
rato
ry C
ode
Tabl
e 7
Sum
mar
y of
the
norm
aliz
ed e
rror
(En)
of e
ach
part
icip
ant
p (M
Pa)
23
45
67
89
1011
1213
1415
1617
18
100.
130.
73-0
.12
0.68
0.15
-0.0
40.
60-0
.51
0.27
0.25
-0.7
50.
711.
22-0
.15
1.90
-0.2
80.
1720
0.18
1.18
0.03
0.80
0.14
-0.0
40.
39-0
.35
0.59
0.57
-0.3
80.
720.
65-0
.89
0.22
-0.0
50.
1030
0.35
1.11
-0.2
80.
830.
410.
130.
590.
090.
000.
51-0
.36
0.83
-0.0
8-0
.77
-0.2
2-0
.06
0.24
400.
461.
640.
771.
760.
420.
271.
17-1
.02
-0.0
10.
640.
240.
871.
56-1
.54
0.09
0.09
0.41
450.
410.
950.
131.
13-0
.01
0.02
-0.2
0-0
.81
-0.3
60.
39-0
.35
0.34
0.60
-2.0
7-0
.91
-0.3
9-0
.06
500.
711.
050.
861.
170.
550.
360.
220.
02-0
.08
0.68
0.14
0.67
0.63
-0.3
4-0
.28
0.12
0.43
550.
781.
560.
890.
980.
610.
340.
11-0
.58
-0.0
60.
77-0
.15
0.46
0.24
-0.7
4-0
.76
-0.0
40.
2960
-0.
750.
371.
160.
03-0
.05
-0.3
6-1
.14
-0.0
70.
31-0
.80
0.08
-0.1
1-1
.67
-0.8
8-0
.58
-0.0
465
-1.
261.
141.
420.
790.
47-0
.10
--
0.91
-0.5
90.
481.
69-0
.58
-0.5
10.
190.
4470
-1.
061.
05-
0.45
-0.
44-
-0.
73-
0.61
--0
.91
0.60
0.25
0.37
Labo
rato
ry C
ode

Evaluation of Interlaboratory Performance through Proficiency Testing ........ 70 MPa
91
Fig. 6. Black points indicate the deviation of the measured pressure (p') by the laboratory from the referencevalue (p) and error bars show the estimated reported expanded measurement uncertainty U(p'). The gap
between two horizontal dotted lines shows the expanded uncertainty band of the reference value.
Fig. 7. Black points indicate the deviation of the measured pressure (p') by the laboratory from the referencevalue (p) and error bars show the estimated reported expanded measurement uncertainty U(p'). The gap
between two horizontal dotted lines shows the expanded uncertainty band of the reference value.
Ref.
Ref.
10 MPa
20 MPa
Sanjay Yadav et al.
92
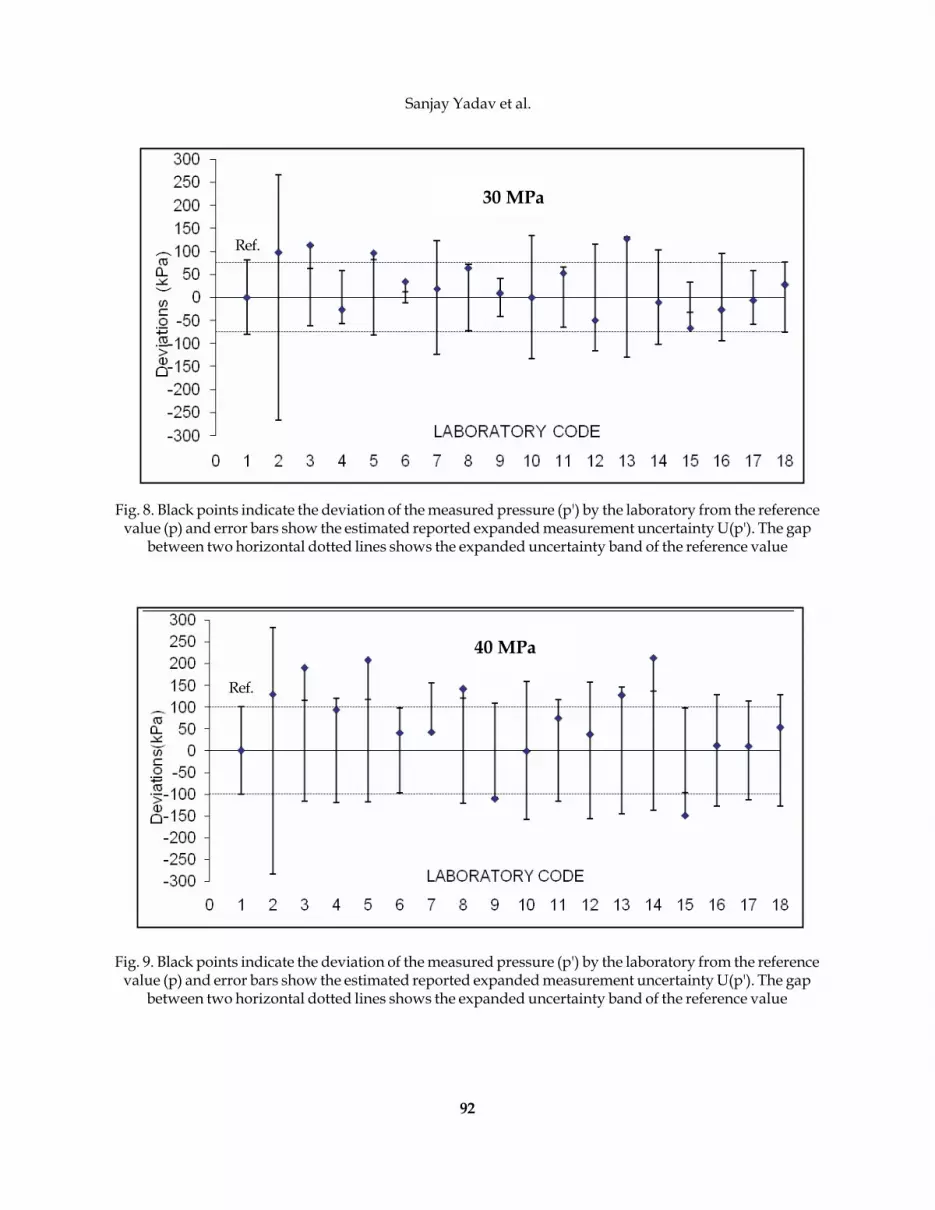
Fig. 8. Black points indicate the deviation of the measured pressure (p') by the laboratory from the referencevalue (p) and error bars show the estimated reported expanded measurement uncertainty U(p'). The gap
between two horizontal dotted lines shows the expanded uncertainty band of the reference value
Fig. 9. Black points indicate the deviation of the measured pressure (p') by the laboratory from the referencevalue (p) and error bars show the estimated reported expanded measurement uncertainty U(p'). The gap
between two horizontal dotted lines shows the expanded uncertainty band of the reference value
Ref.
Ref.
30 MPa
40 MPa
Evaluation of Interlaboratory Performance through Proficiency Testing ........ 70 MPa
93
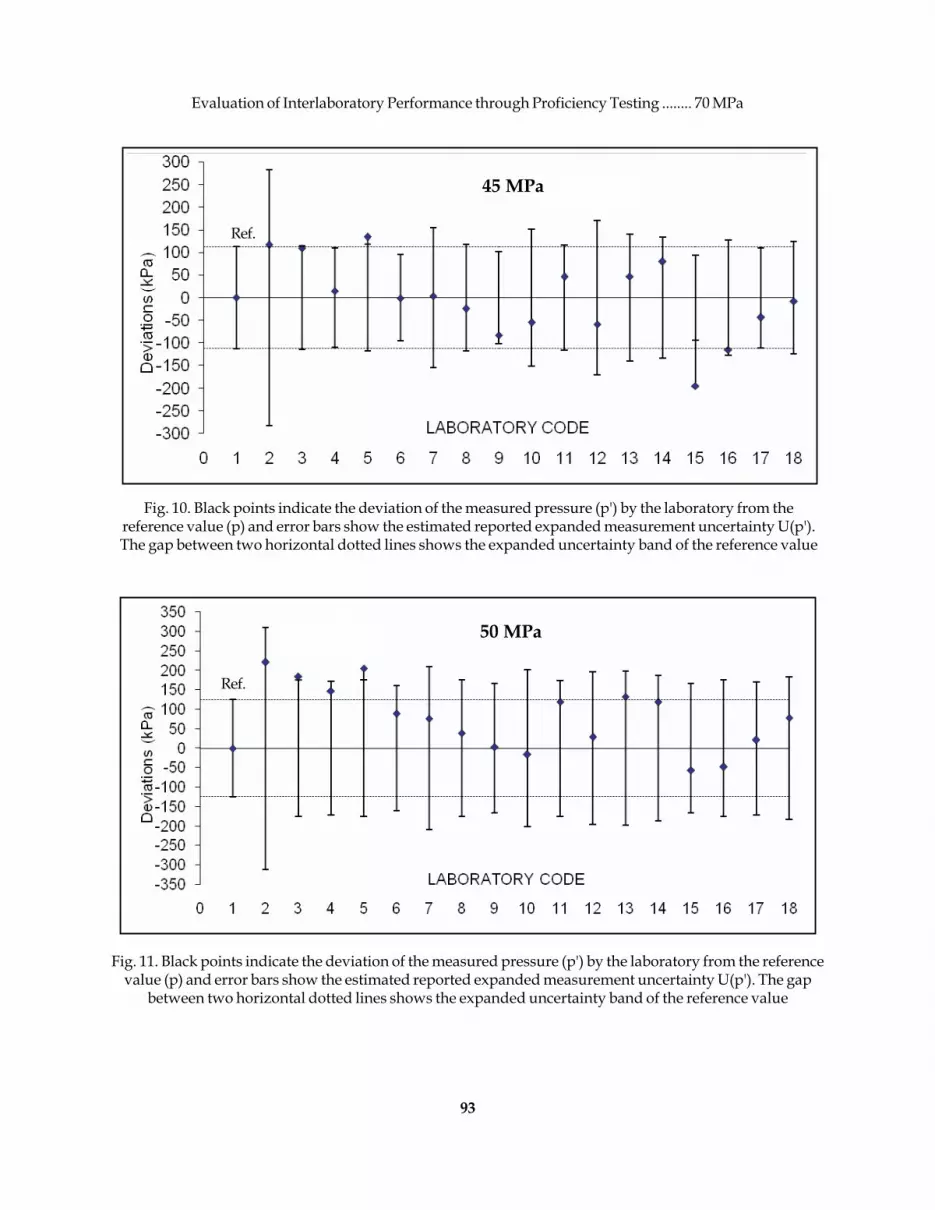
Fig. 10. Black points indicate the deviation of the measured pressure (p') by the laboratory from thereference value (p) and error bars show the estimated reported expanded measurement uncertainty U(p').The gap between two horizontal dotted lines shows the expanded uncertainty band of the reference value
Fig. 11. Black points indicate the deviation of the measured pressure (p') by the laboratory from the referencevalue (p) and error bars show the estimated reported expanded measurement uncertainty U(p'). The gap
between two horizontal dotted lines shows the expanded uncertainty band of the reference value
Ref.
Ref.
45 MPa
50 MPa

Sanjay Yadav et al.
94
Fig. 12. Black points indicate the deviation of the measured pressure (p') by the laboratory from the referencevalue p) and error bars show the estimated reported expanded measurement uncertainty U(p'). The gap
between two horizontal dotted lines shows the expanded uncertainty band of the reference value
Fig. 13. Black points indicate the deviation of the measured pressure (p') by the laboratory from the referencevalue (p) and error bars show the estimated reported expanded measurement uncertainty at k = 2. The gap
between two horizontal dotted lines shows the expanded uncertainty band of the reference value
Ref.
Ref.
55 MPa
60 MPa

Evaluation of Interlaboratory Performance through Proficiency Testing ........ 70 MPa
95
Fig. 14. Black points indicate the deviation of the measured pressure (p') by the laboratory from the referencevalue (p) and error bars show the estimated reported expanded measurement uncertainty U(p'). The gap
between two horizontal dotted lines shows the expanded uncertainty band of the reference value
Fig. 15. Black points indicate the deviation of the measured pressure (p') by the laboratory from the referencevalue (p) and error bars show the estimated reported expanded measurement uncertainty at k = 2. The gap
between two horizontal dotted lines shows the expanded uncertainty band of the reference value
Ref.
Ref.
65 MPa
70 MPa

Sanjay Yadav et al.
96
Fig. 16. The normalized error value (En) as a function of measured pressure (p') for each laboratory.The gap between two horizontal dotted lines shows the acceptable limit of the normalized error value
Fig. 17. Relative deviations of the measured pressure (p') by each laboratory from the reference value (p).The gap between two horizontal dark black solid lines represents deviations falling within ± 0.15 %,dim black lines represents deviations falling within ± 0.25 % and dotted lines represents deviations
falling within ± 0.5 %
results without any bias in the measurements. It isclearly evident from Fig. 17 that the relative deviationsbetween laboratories values and reference values arewell within the 0.15 % for 75 measurement points,0.25% for 108 measurement points and 0.50% for 148
measurement points.
Further, the difference between the pressurevalues reported by the participating laboratories andthe reference laboratory fall within the uncertainty

Evaluation of Interlaboratory Performance through Proficiency Testing ........ 70 MPa
97
band of reference laboratory at 113 measurementresults i.e. 71.07 %, within their reported estimatedexpanded uncertainty band at 99 measurementsresults i.e. 62.26 % and within the combined estimatedexpanded uncertainty band of this PT experiment at135 measurement results (84.91 %). This clearly showsthe under-estimation of measurement uncertainty bymost of the laboratories. Most of the participatinglaboratories reported better measurement uncertaintythan the reference laboratory for 120 measurementresults. The main reasons for bias in the measurementsmay be due to errors in measuring instruments or inestimation/measurement of local acceleration ofgravity, the error in applying the temperature and headcorrections and the under-estimation of measurementuncertainty. Laboratories would be able to rectify theproblems by a review of their uncertainty calculationsand other systematic effects as mentioned above.
Although all the participating laboratories wereasked to submit the copy of the formal calibrationcertificate issued to the customer and traceabilitycertificates of their standards, only 12 laboratorieshave submitted the copies of formal calibrationcertificates of the pressure dial gauge (artifact, in thepresent case) while traceability certificates weresubmitted by only 10 laboratories. Laboratories withcode numbers 2, 9, 14, 15 and 16 have not submittedsuch formal certificates. Certificates thus examinedare adequate except that there is little uniformity inthe calibration certificates issued by the participants,especially in reporting the measurement results. Thereare few common typo errors in most of the certificatesexcept the laboratories with code numbers 11, 13 and17, for example, capital 'K' for coverage factor and inpressure unit as 'Kg/cm2'. Although, these are minorerrors but should have been avoided.
As mentioned above, En numbers greater thanunity require investigations and corrective action bythe participating laboratory. The laboratory'smanagement needs to ensure that the problem isrectified and procedures are put in place to prevent arecurrence. Laboratories with Code No. 3, 4, 5, 9, 14and 15 have been asked to review the results and takeappropriate corrective actions. All these laboratorieshave been asked to improve their calibration facilitiesand to modify the measurement method and toestimate the measurement uncertainties properly.Laboratories with Code No. 8 and 16 may also review
their results at their respective unacceptablemeasurement point (one each).
6. Conclusion
This interlaboratory comparison programme(proficiency testing) is carried out in the pressurerange 10 - 70 MPa using pressure dial gauge as anartifact. Total number of seventeen laboratoriesparticipated in this programme. The comparison wasperformed at 10 pressure points selected throughoutthe entire pressure range. The proficiency testingconcludes that out of the total 159 measurementresults reported here in this report, 135 (84.91 %) arein agreement with the reference laboratory. The Envalues of 9 laboratories are within acceptable limitsthrough out the entire pressure scale. However, the Envalues of 2 other laboratories are also quite acceptableexcept only one pressure point each. The En values ofthe remaining 6 laboratories are found beyond theacceptable limit for 2 or more pressure points. Thedifference between laboratories values and referencevalues of 113 measurement points (71.07 %) are wellwithin the uncertainty bands of the reference values.Total 99 measurements results i.e. 62.26 % fall withintheir reported expanded uncertainty band. However,84.91 % measurement results are found well withincombined estimated expanded measurementuncertainty band. Since some of the laboratories haveunder-estimated their measurement uncertainties,15.09 % measurement results are found to be out ofthe combined uncertainty band during thiscomparison. Overall, the results are considered to bereasonably good being the first proficiency testing formost of the participating laboratories.
Acknowledgement
We are grateful to Dr. Vikram Kumar, Director,National Physical Laboratory, New Delhi andDr. Hari Gopal, Director, National AccreditationBoard for Testing & Calibration Laboratories, NewDelhi for their support and encouragementthroughout this program. We are also thankful toNABL-NPL PT-Coordinators, Dr. P.C. Kothari, Dr. K.KJain, Mr. A.K. Saxena and Dr. Naveen Garg for theirconstant co-operation and time to time suggestionsand discussions, which were very helpful during thecourse of this comparison. Thanks are also due to allthe seventeen accredited laboratories participating in

Sanjay Yadav et al.
98
this interlaboratory comparison exercise. Withouttheir active support and co-operation this PTprogramme would have not been completed in time.We would also like to acknowledge the help of thesecretariat of NABL for their administrative help.
References
[1] High Pressure Measurement Techniques,Edited by G.N. Peggs, Applied SciencePublishers, London, U.K. (1983).
[2] R. S. Dadson, S. L. Lewis and G. N. Peggs , ThePressure Balance: Theory and Practice, HerMajesty's Stationary Office, London (1982).
[3] F. Pavese and G. Molinar, Modern Gas BasedTemperature and Pressure Measurements,Plenum Press, New York (1992).
[4] Sanjay Yadav, Ravinder Agarwal, SurekhaBhanot, A.K. Bandyopadhyay and A.C. Gupta,Modern Instrumentation Techniques inPressure Metrology under Static Conditions,Mapan: J. Metrology Soc. India, 18 (2003) 57-82.
[5] General Requirements for the Competence ofTesting and Calibration Laboratories, ISO / IEC17025 : (1999).
[6] Procedures for Establishing and Maintainingthe APLAC Mutual Recognition ArrangementAmongst Accreditation Bodies, APLACMRA001, 13 (2007).
[7] Proficiency Testing by InterlaboratoryComparison: Part - 1: Development andOperation of Proficiency Testing Schemes. Part- 2: Selection and Use of Proficiency TestingSchemes by Laboratory Accreditation Bodies,ISO / IEC 43 : (1997).
[8] Sanjay Yadav and A.K. Bandyopadhyay,Proficiency Testing Program Under NABL inthe Pressure Range 7-70 MPa Using a DeadWeight Tester, Med. J. Meas. Contrl. (UK), 1(2005) 138-151.
[9] Sanjay Yadav and A.K. Bandyopadhyay,Proficiency Testing (PT) Program Under NABLin the Pressure Range 7 - 70 MPa, Metrologyand Measurement Systems, Poland, XII (2005)323-340.
[10] Sanjay Yadav and A.K. Bandyopadhyay,
Interlaboratory Comparison in the PressureRange 7 - 70 MPa Using Digital PressureCalibrator, MAPAN- Journal of MetrologySociety India, 20 (2005) 297-310.
[11] Sanjay Yadav, V.K. Gupta, Om Prakash andA.K. Bandyopadhyay, Proficiency TestingThrough Interlaboratory Comparison in thePressure Range 7-70 MPa Using Pressure DialGauge as an Artifact, J. Sci. and Indusl. Res.,64 (2005) 722-740.
[12] Sanjay Yadav and A.K. Bandyopadhyay,Interlaboratory Comparison in the PressureRange up to 70 MPa using Pressure Dial Gaugeas an Artifact (NABL -Pressure -PT007), carriedout during May 2006 to October 2007, ReportSubmitted to National Accreditation Board forTesting and Calibration Laboratories (NABL),New Delhi, (2008).
[13] Guidelines for Proficiency Testing Program forTesting and Calibration Laboratories, NABLDoc. 162 (2001).
[14] Sanjay Yadav, A.K. Bandyopadhyay and A.C.Gupta, Characterisation of National HydraulicPressure Standards in the Pressure Ranges upto 100 MPa, 200 MPa and 500 MPa, Callab: TheInternational J. Metrology, USA (2003) 28-35.
[15] Sanjay Yadav, A.K. Bandyopadhyay, N.Dilawar and A.C. Gupta, Re-establishment ofMeasurement Uncertainty in PressureMeasurement through In-House LaboratoryIntercomparison of National HydraulicPressure Standards up to 500 MPa, MAPAN -Journal of Metrology Society of India, Suppl., 1(2001)170-177.
[16] Sanjay Yadav, A.K. Bandyopadhyay,N. Dilawar and A.C. Gupta, Intercomparisonof National Hydraulic Pressure Standards upto 500 MPa, Measurement + Control, UK, 35(2002) 47-51.
[17] R.G. Driver, D.A. Olson, Sanjay Yadav, A.K.Bandyopadhyay, Final Report on APMP.SIM.M. P-K7: Bilateral Comparison BetweenNIST (USA) and NPLI (India) in the HydraulicPressure Region 40 MPa to 200 MPa,Metrologia Tech. Suppl., France, 43, 07003,(2006) 1-15.

Evaluation of Interlaboratory Performance through Proficiency Testing ........ 70 MPa
99
[18] Sanjay Yadav, D. Arun Vijayakumar and A.C.Gupta, Computer Software for Calibration ofIndustrial and Master Simple / Reentrant TypePiston Gauges, MAPAN - Journal of MetrologySociety of India, 12 (1997) 101-104.
[19] D. Arun Vijayakumar, Sanjay Yadav and A.C.Gupta, Quality of Measurements: a Softwarefor Estimation of Measurement Uncertainty,Presented during National Symposium onElectronics in Societal Mission, New Delhi,March 29-30 (1997).
[20] Guide to the Expression of Uncertainty inMeasurement, ISO Document - ISO/TAG/WG3 (1995) (E).
[21] Guidelines for Estimation and Expression ofUncertainty in Measurement, NABL Doc. 141,(2000).
[22] H.S. Nielsen, Determining Consensus Valuesin Interlaboratory Comparisons andProficiency Testing, Proceedings NSCLConference, August 17-18, Tampa, Florida,USA, (2003) 1-16.
[23] M. Arif Sanjid, K.P.Chaudhary and R.P.Singhal, Proficiency Testing Programme ofSurface Roughness Standard and Groove DepthStandard, MAPAN - Journal of MetrologySociety of India, 23 (2008) 11-20.


