Embed Size (px)
Citation preview

A. Carlsson, PhD, Researcher at Chalmers University of Technology, Sweden (+46 31 772 3650, [email protected]); F. Chang, PhD, is Project Manager in the CAE Department at Humanetics Innovative Solutions, USA; P. Lemmen is Manager of the European Engineering group at Humanetics, the Netherlands; A. Kullgren is head of Folksam Research and Adjunct Professor at Chalmers University of Technology, Sweden; K.‐U. Schmitt, PhD, works for AGU Zurich (Switzerland) and the Swiss Federal Institute of Technology (ETH Zurich); A. Linder, PhD, is Research Director of Traffic Safety at The Swedish National Road and Transport Research Institute (VTI), Sweden; M.Y. Svensson is Professor in Vehicle Safety in the Department of Applied Mechanics at Chalmers University of Technology, Sweden.
Abstract Neck injury due to low severity vehicle crashes is of worldwide concern and the injury risk is greater
for females than males. However, whiplash protection systems have shown to be more beneficial for males than
females. Hence there is a need for improved tools to address female protection. The objective is to develop and
evaluate a 50th percentile female rear impact crash dummy FE model.
The model was based on the same design concept as the BioRID II. A scaling approach was developed and
the first version, EvaRID V1.0, was implemented. Its dynamic response was compared to rear impact tests with
female volunteers.
The EvaRID model and volunteer tests showed good correlations until ~250 ms of the head and T1
accelerations, linear displacements and head angular displacement. Considerably less T1 angular displacement
was found for the EvaRID; similar results were obtained for the BioRID II. Thus, the EvaRID V1.0 and BioRID II
models have limitations at low v (7km/h).
The EvaRID model demonstrated the potential to become a valuable tool when evaluating and developing
seats/whiplash protection systems, however, this will require updating the joint stiffness. The model may be
used as a template for the development of a physical female dummy.
Keywords Anthropometry, Dummy, Female, FE model, Rear Impact
I. INTRODUCTION
Whiplash Associated Disorders (WAD), or ‘whiplash injuries’, sustained in vehicle crashes is a worldwide
concern. In Sweden, such injuries account for ~70 percent of all injuries leading to disability due to vehicle
crashes [1]. The majority of those who experienced initial neck symptoms following the car crash recovered
within a few weeks or months after the crash [2]. However, 5 to 10 percent of individuals experienced varying
degrees of permanent disabilities [2]–[4]. Whiplash injuries may occur at relatively low velocity changes (v), typically <25 km/h [5]–[6], and in impacts from all directions. Rear impacts occur most frequently out of all
recorded impacts in accident statistics [7].
It is well established that the whiplash injury risk is higher for females than for males, even in similar crash
conditions [8]–[22]. These studies concluded that the female injury risk was 1.5 to 3 times higher than the male
injury risk.
Females and males have different anthropometry and mass distribution, which may influence the interaction
between the upper body and the seatback/head restraint, and thus the injury risk. For example, the deflection
of the seat frame, seatback padding and springs may depend on the mass and/or the centre of mass of the
upper body with respect to the lever about the seatback hinge. The deflection of the structures of the seatback
affects the plastic deformation, energy absorption and the dynamic head‐to‐head restraint distance, as well as
the rebound of the torso [23]–[25]. The motion of the head relative to the head restraint may be affected by
seated height in relation to the head restraint geometry. It has been reported that females have a somewhat
different dynamic response in rear volunteer tests, such as a higher head forward acceleration, a higher (or
similar) T1 forward acceleration, a lesser (or similar) Neck Injury Criterion (NIC) value and a more pronounced
rebound than males [24]–[35].
Crash test dummies are used when developing and evaluating the occupant protection performance of a
vehicle. The 50th percentile male crash test dummy size corresponds to a ~90th–95th percentile female with
regards to stature and mass [36], resulting in females not being well represented by the existing low velocity
rear impact male dummies; the BioRID and the RID3D. Consequently, the current seats and whiplash protection
systems are primarily adapted to the 50th percentile male with little consideration of female properties. Existing
Anna Carlsson1, Fred Chang2, Paul Lemmen2, Anders Kullgren1,3, Kai‐Uwe Schmitt4, Astrid Linder5, Mats Y. Svensson1
EvaRID ‐ A 50th Percentile Female Rear Impact Finite Element Dummy Model
IRC-12-32 IRCOBI Conference 2012
- 249 -

whiplash protection concepts are approximately 30 percent more
effective for males than for females according to insurance claims
records (Fig. 1) [37]. The difference between females and males has
effectively increased even though the overall whiplash injury risk has
decreased in rear impacts. It is important to further investigate these
differences and to understand the reason behind them in order to
achieve better protection for both females and males.
In view of the above, the European research project ADSEAT
(Adaptive Seat to Reduce Neck Injuries for Female and Male
Occupants) was initiated. The overall objective of ADSEAT is to
provide guidance on the protective performance evaluation of
vehicle seats, aiming at reducing the incidence of whiplash injuries.
The work is focussed on evaluating the protective performance of
seats for female as well as male occupants. For this purpose the development of an average female size finite
element crash dummy model is a part of the ADSEAT project. This new research tool will be used in parallel with
the BioRID II dummy model when evaluating enhanced whiplash injury protection systems.
The objective of this study is to develop and evaluate a finite element (FE) model of a 50th percentile female
rear impact crash dummy.
II. METHODS
This study was divided into four subtasks: 1) selecting the size of the EvaRID V1.0 model 2) establishing
anthropometric specifications of the model 3) model development 4) model evaluation.
Selecting the size Different types of sources were assessed in the EvaRID dummy model size selection process, such as injury
statistics, anthropometric data and previous publications on dummy development. Injury statistics were
extracted in order to verify that a 50th percentile female dummy would correlate in size to the females most
frequently suffering whiplash injury in rear impacts. Anthropometric data and previous publications on dummy
development were studied in order to define the stature and mass of the 50th percentile female.
The injury statistics were collected from two different sources; the Working Group on Accident Mechanics
(AGU) Zurich database (Switzerland) and the insurance company Folksam´s database (Sweden). The AGU Zurich
database was initiated in 2005 and contains records of technical as well as medical information of persons who
have sustained WAD in car crashes. Insurance claims made to the Swiss Accident Insurance Fund, the largest
accident insurer in Switzerland covering most of the working population, forms the basis for these records.
Researchers at AGU follow up most insurance claims by victims suffering neck symptoms following a car crash
once the victims are absent from work for more than four weeks. Police reports, vehicle specific information as
well as medical files are added to the AGU Zurich database. These records also include basic anthropometric
measures, such as stature and mass of the injured persons. The Folksam in‐depth database consists of reported
car crashes in Sweden involving cars fitted with crash pulse recorders to record car acceleration‐time history.
Occupant data such as age, gender, stature and mass are also noted in the database. The data used for age,
gender, stature and mass distributions cover front seat occupants aged 18 years and above involved in reported
car crashes between 1992 and 2010, irrespective of crash direction or occupant injury. In total 1610 female and
2093 male front seat occupants were included. The basic anthropometry of the injured females was compared
to the average stature and mass of the female population in Switzerland (year 2007: 164.7 cm/63.4 kg, obtained
by written communication from Swiss Statistical Office) and Sweden (year 2006: 166.2 cm/66.1 kg [38]).
Two main sources were studied for reference when selecting the size for the 50th percentile female model; the
University of Michigan Transportation Research Institute (UMTRI) study [39]–[41] and the WorldSID project [45].
The purpose with the UMTRI study was to develop specifications for crash test dummies. Anthropometric data
were initially collected and analysed for four adult body sizes; the 5th and 50th percentile females, and the 50th
and 95th percentile males. The stature, mass and seated height (TABLE I) was defined based on the National
Health and Nutrition Examination Survey (HANES) of 1971–1974 [42]–[43]. These data were collected
Fig. 1. Whiplash injury reduction for
females and males including 95% CI.
Based on [37].
IRC-12-32 IRCOBI Conference 2012
- 250 -

on 13,645 individuals representing the 128 million persons aged
18–74 in the US population. Due to limited funds it was however
decided that the 50th percentile female should be excluded from
the latter part of the study. The purpose with the WorldSID
project was to design a new generation side impact crash test
dummy [45]. Based on anthropometric data (weighted by road
fatality rates) across eight regions comprising OECD countries it
was concluded that the size of a world‐harmonized 50th percentile
adult male would correspond well with the size of the 50th
percentile adult male as was defined by the UMTRI project [39]–
[41].
Anthropometric specifications The anthropometric data for the 50th percentile female was mainly collected from two references [44][46].
The study by [46] was based on data from several military and civilian sources. Emphasis was placed on the
most important surveys, giving due consideration to their accuracy, sampling size and how recently they were
performed. The study by [44] was part of a series of studies designed to obtain information about mass
distribution characteristics (including moment of inertia and centre of volume) of the living human body and its
segments, and to establish reliable means of estimating such properties from easily measured body dimensions.
Their study was based on 46 adult female subjects, selected to approximate the range of stature and mass
combinations found in the general US female population. The sampling plan was to achieve a stature and mass
distribution comparable to that found in the civilian female US population as reported in the HANES study of
1971–1974 [42]–[43].
In addition to the above sources, anthropometric data taken from the ergonomic software programmes
GEBOD [47] and RAMSIS [48] was used to validate the collected data. Product Information from Humanetics
(previously FTSS) was used to collect information on the BioRID II hardware dummy for direct comparison of
anthropometry data. Finally, parts of the 50th percentile male data [49] were used for comparative purposes.
EvaRID V1.0 – Model development The EvaRID V1.0 model was developed by scaling an existing BioRID II LS‐DYNA model (DYNAmore GmbH).
The goal of the scaling was to make sure that the mass and length data of each body segment match the
anthropometric data for the 50th percentile female [44][46]. In the present study, we choose to scale mass and
length dimensions of each body segment according to equations (1)–(2) to obtain dimensions representative of
the 50th percentile female:
Width and depth dimensions for the EvaRID were
then established based on scaling of each body
segment (TABLE II).
Apart from the geometrical scaling, stiffness and
damping properties of those parts representing the
neck and spine response (i.e. torsion pin stiffness,
bumper stiffness, discrete damping elements as well as
friction elements included in the model) were scaled to
a value of 70 percent of the original values in the
BioRID II model. The chosen reduction of the stiffness
and damping properties was based on reported
differences between females and males in static neck
flexion and extension muscle strength [50]. Due to the
non‐linear response under dynamic loadings and large
displacements, the selected reduction should be regarded as an initial estimate for further correlation against
TABLE I STATURE, MASS, AND SEATED HEIGHT OF THE FOUR ADULT BODY SIZES – UMTRI [39].
Percentile Sex Stature Mass
Seated Height
[cm] [kg] [cm]
5th Female 151.1 47.3 78.1 50th Female 161.8 62.3 84.4 50th Male 175.3 77.3 90.1 95th Male 186.9 102.3 96.6
Mass Ratio:
(1)
Scale Factor Length:
(2) TABLE II
EQUATIONS FOR SFB (SCALE FACTOR BREADTH) AND SFD (SCALE FACTOR DEPTH) FOR DIFFERENT BODY PARTS.
Body Part SFB SFD
Head
Neck = SFBupper torso = SFLneck
Upper Torso
Pelvis
Upper Arm
Lower Arm
Upper Leg
Lower Leg
IRC-12-32 IRCOBI Conference 2012
- 251 -

test data.
Model evaluation The EvaRID V1.0 model was simulated and compared to the responses in the volunteer rear impact test
conditions at v 7 km/h [35]. The data were taken from six volunteers with an average stature similar to the
EvaRID stature (161.8 cm). The average age was 23 years; the stature varied from 162 to 166 cm with an
average of 164 cm; and the mass varied from 54 to 64 kg with an average of 59 kg.
A seat model representative of the test set‐up was developed for the initial evaluation of the dynamic
response of the EvaRID V1.0 model. In the sled tests, a Volvo 850 seat‐base dating from the early 1990’s was
used. In the model, however, a public Ford Taurus seat‐base was used during the EvaRID evaluation, assuming
differences in the seat‐base having minimal influence. The
seatback consisted of four stiff panels, each suspended in the stiff
seatback frame in four coil springs (Fig. 2) [35]. The panels were
covered in a 20 mm thick layer of medium quality Tempur foam
and lined with plush fabric (Volvo 850, year model 1993). The
panels and foam were fitted according to the specified
dimensions of the Volvo seat. The stiffness of the coil springs
were measured and implemented in the finite element model.
The head restraint consisted of one coil spring suspended stiff
panel which was covered by 20 mm thick soft and 20 mm thick
medium Tempur foam. The seatback frame inclination was
adjusted to 24.3°. The volunteers wore a lap belt during the test.
An angled plate, resembling a passenger floor pan surface of a
standard car, was mounted on the target sled (Fig. 2).
Dynamic response corridors were provided for x‐accelerations, x‐displacements and angular displacements
of the head, T1, as well as head relative to T1 generated from the averages ± one standard deviation (SD) [35].
In addition, three tests with a BioRID dummy were performed in the same test setup as the tests with the
female volunteers.
III. RESULTS
EvaRID ‐ Selection of size Records involving females who have sustained whiplash injuries in rear impacts were extracted from the AGU
Zurich database, Switzerland (N=2,146), and from the Folksam database, Sweden (N=1,610). Basic
anthropometric measures were then extracted from these records. The stature and mass distributions of the
injured females are summarised in Fig. 3.
AGU ZurichFolksam
Stature Distribution [cm] Mass Distribution [kg]
a) b)
Fig. 3. The stature and mass distributions of whiplash injured female occupants in
a) Sweden (from the Folksam database) and b) Switzerland (from the AGU Zurich database).
Fig. 2. The test setup [35].
IRC-12-32 IRCOBI Conference 2012
- 252 -

In the AGU Zurich database, the injured females had an average stature/mass of 165.3 cm/65.2 kg, which is
close to the average size of the female population in Switzerland, 164.7 cm/63.4 kg (obtained by written
communication from Swiss Statistical Office). Correspondingly, in the Folksam database the average
stature/mass was 165.3 cm/65.2 kg for the injured females, which correlate well with the average size of the
female population in Sweden, 165.9 cm/65.9 kg [38]. Thus, the 50th percentile female dummy model would
correlate in size to the females that are most frequently injured in rear impacts.
We found the anthropometry study of the WorldSID project [45] to be best available for defining an
anthropometric size that is reasonably representative of the worldwide population at risk. Since it was
concluded that the size of a world‐harmonized 50th percentile adult male would correspond well with the size of
the 50th percentile adult male as defined by the UMTRI project [39]–[41], we found it reasonable to make the
same conclusion regarding the 50th percentile adult female. Thus, it was decided to base the EvaRID V1.0 model
on the anthropometric measures of the 50th percentile female from the UMTRI study (stature 161.8 cm, mass
62.3 kg, TABLE I).
Anthropometry of the 50th Percentile Female The stature, mass and seated height of the EvaRID
model was thus established and the next step was to
specify the body dimensions, mass of different body
segments and the distance between different joints of the
50th percentile female. Since the UMTRI study only
defined the stature, mass and seated height of the 50th
percentile female, the data had to be found elsewhere.
The studies [39]–[41] described in detail how the
anthropometry and properties were specified for the 5th
percentile female as well as the 50th and 95th percentile
male crash test dummies. The same method was used in
this study, when appropriate, in order to establish the
anthropometry of the 50th percentile female.
The circumferences for different parts of the body of
the 50th percentile female were summarised in TABLE III in
order to compare the data from [44] and [46] with data
from the software programmes RAMSIS and GEBOD. The
table shows that in general there are good correlations
between the different datasets.
In [44], the 50th percentile female stature was 161.2 cm
and the mass 63.9 kg; i.e. 0.4 percent shorter and 2.6
percent heavier than that of the EvaRID. In [46], the 50th
percentile female stature was 161.5 cm and the mass 65.8
kg; i.e. 0.2 percent shorter and 5.6 percent heavier than
that of the EvaRID. No scaling was performed of the
length dimensions [44][46], since the difference in stature
between these two references and the EvaRID model was
considered to be minor (0.4 percent and 0.2 percent). However, due to the somewhat greater difference in
mass (2.6 percent and 5.6 percent), the depth and width dimensions and the circumferences [44][46] was scaled
according to:
[44]: (63.9/62.3)1/3 = 1.008 => 1 percent scaling
[46]: (65.8/62.3)1/3 = 1.018 => 2 percent scaling
The mass of each body segment was estimated based on its volume, assuming constant density of the body.
The resulting masses (absolute and relative compared to overall mass) and the Mass Ratio (MR) (Eq. 1) of body
parts for the EvaRID and BioRID II dummy models are provided in TABLE IV. Additional data (input to the EvaRID
V1.0 model) can be found in the Appendix, such as distances between joints (Fig. A1); torso details (Fig. A2)
regression equations to compute segment volumes (TABLE AI); and anthropometric variables (TABLE AII).
TABLE III COMPARISON OF ANTHROPOMETRIC DATA
(CIRCUMFERENCES) OF THE 50TH PERCENTILE FEMALE.
BASED ON [44], [46], GEBOD, AND RAMSIS.
Circumference [cm]
Body Part
[46]
[44]
GEB
OD
RAMSIS
Stature [cm] 161.5 161.2 161.8 161.8
Mass [kg] 65.8 63.9 62.3 62.3
A Head 54.9 54.8 ‐ ‐
B Neck 35.1 32.9 34.3 ‐
C Shoulder 98.0 ‐ ‐ ‐
D Arm pit 89.2 ‐ ‐ ‐
E Arm3) 29.01) 28.81) 27.1 21.7
F Bust 95.8 95.4 ‐ ‐
G Chest4) 79.0 ‐ ‐ ‐
H Waist 74.2 ‐ ‐ 74.6
I Elbow 28.21) 24.42) 27.5 ‐
J Forearm 26.21) 21.22) 24.2 23.7
K Hip 100.8 100.1 ‐ ‐
L Wrist 15.5 15.7 15.2 ‐
M Thigh 59.2 59.4 58.0 ‐
N Knee 38.1 37.0 38.5 ‐
O Calf 35.8 35.8 35.3 33.8
P Ankle 21.8 21.4 21.5 ‐ 1) Flexed
2) Relaxed 3) Upper Arm
4) Below Bust 5) Upper Thigh
IRC-12-32 IRCOBI Conference 2012
- 253 -
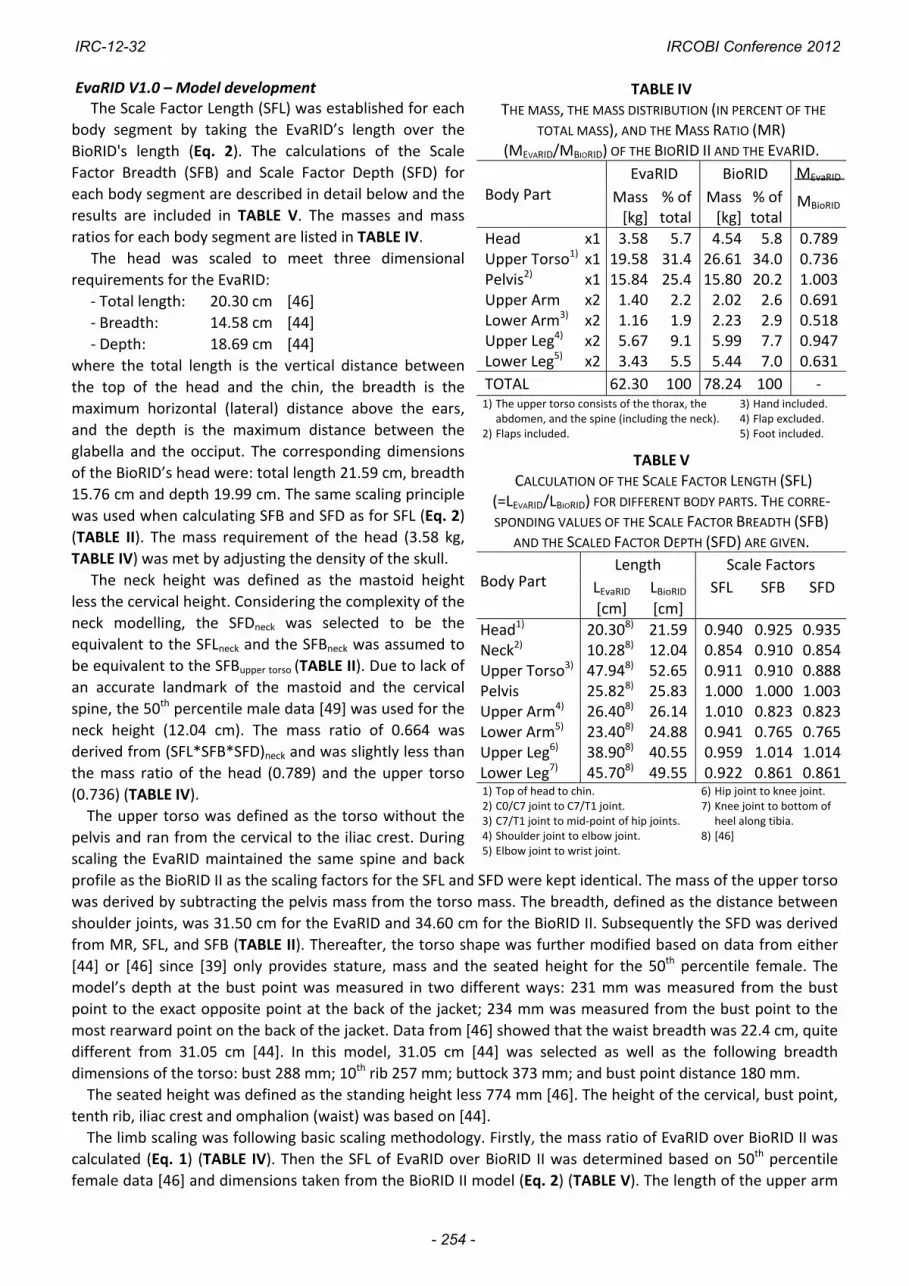
EvaRID V1.0 – Model development The Scale Factor Length (SFL) was established for each
body segment by taking the EvaRID’s length over the
BioRID's length (Eq. 2). The calculations of the Scale
Factor Breadth (SFB) and Scale Factor Depth (SFD) for
each body segment are described in detail below and the
results are included in TABLE V. The masses and mass
ratios for each body segment are listed in TABLE IV.
The head was scaled to meet three dimensional
requirements for the EvaRID:
‐ Total length: 20.30 cm [46]
‐ Breadth: 14.58 cm [44]
‐ Depth: 18.69 cm [44]
where the total length is the vertical distance between
the top of the head and the chin, the breadth is the
maximum horizontal (lateral) distance above the ears,
and the depth is the maximum distance between the
glabella and the occiput. The corresponding dimensions
of the BioRID’s head were: total length 21.59 cm, breadth
15.76 cm and depth 19.99 cm. The same scaling principle
was used when calculating SFB and SFD as for SFL (Eq. 2)
(TABLE II). The mass requirement of the head (3.58 kg,
TABLE IV) was met by adjusting the density of the skull.
The neck height was defined as the mastoid height
less the cervical height. Considering the complexity of the
neck modelling, the SFDneck was selected to be the
equivalent to the SFLneck and the SFBneck was assumed to
be equivalent to the SFBupper torso (TABLE II). Due to lack of
an accurate landmark of the mastoid and the cervical
spine, the 50th percentile male data [49] was used for the
neck height (12.04 cm). The mass ratio of 0.664 was
derived from (SFL*SFB*SFD)neck and was slightly less than
the mass ratio of the head (0.789) and the upper torso
(0.736) (TABLE IV).
The upper torso was defined as the torso without the
pelvis and ran from the cervical to the iliac crest. During
scaling the EvaRID maintained the same spine and back
profile as the BioRID II as the scaling factors for the SFL and SFD were kept identical. The mass of the upper torso
was derived by subtracting the pelvis mass from the torso mass. The breadth, defined as the distance between
shoulder joints, was 31.50 cm for the EvaRID and 34.60 cm for the BioRID II. Subsequently the SFD was derived
from MR, SFL, and SFB (TABLE II). Thereafter, the torso shape was further modified based on data from either
[44] or [46] since [39] only provides stature, mass and the seated height for the 50th percentile female. The
model’s depth at the bust point was measured in two different ways: 231 mm was measured from the bust
point to the exact opposite point at the back of the jacket; 234 mm was measured from the bust point to the
most rearward point on the back of the jacket. Data from [46] showed that the waist breadth was 22.4 cm, quite
different from 31.05 cm [44]. In this model, 31.05 cm [44] was selected as well as the following breadth
dimensions of the torso: bust 288 mm; 10th rib 257 mm; buttock 373 mm; and bust point distance 180 mm.
The seated height was defined as the standing height less 774 mm [46]. The height of the cervical, bust point,
tenth rib, iliac crest and omphalion (waist) was based on [44].
The limb scaling was following basic scaling methodology. Firstly, the mass ratio of EvaRID over BioRID II was
calculated (Eq. 1) (TABLE IV). Then the SFL of EvaRID over BioRID II was determined based on 50th percentile
female data [46] and dimensions taken from the BioRID II model (Eq. 2) (TABLE V). The length of the upper arm
TABLE IV THE MASS, THE MASS DISTRIBUTION (IN PERCENT OF THE
TOTAL MASS), AND THE MASS RATIO (MR) (MEVARID/MBIORID) OF THE BIORID II AND THE EVARID.
Body Part EvaRID BioRID MEvaRID
MBioRIDMass [kg]
% of total
Mass [kg]
% of total
Head x1 3.58 5.7 4.54 5.8 0.789Upper Torso1) x1 19.58 31.4 26.61 34.0 0.736Pelvis2) x1 15.84 25.4 15.80 20.2 1.003Upper Arm x2 1.40 2.2 2.02 2.6 0.691Lower Arm3) x2 1.16 1.9 2.23 2.9 0.518Upper Leg4) x2 5.67 9.1 5.99 7.7 0.947Lower Leg5) x2 3.43 5.5 5.44 7.0 0.631
TOTAL 62.30 100 78.24 100 ‐ 1) The upper torso consists of the thorax, the
abdomen, and the spine (including the neck). 2) Flaps included.
3) Hand included. 4) Flap excluded. 5) Foot included.
TABLE V CALCULATION OF THE SCALE FACTOR LENGTH (SFL)
(=LEVARID/LBIORID) FOR DIFFERENT BODY PARTS. THE CORRE‐SPONDING VALUES OF THE SCALE FACTOR BREADTH (SFB)
AND THE SCALED FACTOR DEPTH (SFD) ARE GIVEN.
Body Part Length Scale Factors
LEvaRID LBioRID SFL SFB SFD
[cm] [cm]
Head1) 20.308) 21.59 0.940 0.925 0.935Neck2) 10.288) 12.04 0.854 0.910 0.854Upper Torso3) 47.948) 52.65 0.911 0.910 0.888Pelvis 25.828) 25.83 1.000 1.000 1.003Upper Arm4) 26.408) 26.14 1.010 0.823 0.823Lower Arm5) 23.408) 24.88 0.941 0.765 0.765Upper Leg6) 38.908) 40.55 0.959 1.014 1.014Lower Leg7) 45.708) 49.55 0.922 0.861 0.8611) Top of head to chin. 2) C0/C7 joint to C7/T1 joint. 3) C7/T1 joint to mid‐point of hip joints. 4) Shoulder joint to elbow joint. 5) Elbow joint to wrist joint.
6) Hip joint to knee joint. 7) Knee joint to bottom of
heel along tibia. 8) [46]
IRC-12-32 IRCOBI Conference 2012
- 254 -

was measured from shoulder joint to elbow joint; the lower arm from the elbow joint to the wrist joint; the
upper leg from the hip joint to the knee joint; and the lower leg from the knee joint to the bottom of the heel
(TABLE IV). The SFB and SFD were then derived by taking the square root of mass ratio over SFL (TABLE II).
No major difference was found between the dimensions of 50th percentile female and 50th percentile male
pelvis [44][49]. The buttock depth was 241.2 mm/240.8 mm; the bitrochanteric breadth 31.63 cm/31.76 cm;
and the pelvic length 258.20 mm/258.32 mm for the female and male, respectively. Furthermore, the distance
between the hip joints was similar for the 50th percentile female and the BioRID II, 18.0 cm [46] and 17.96 cm,
respectively. Accordingly, the pelvis mass (TABLE IV) was similar for the 50th percentile male (15.80 kg) and the
50th percentile female (15.84 kg). Thus, only minor changes were made to the pelvis, for instance the shape was
adjusted to match the breadth dimensions [44]. The EvaRID V1.0 dummy model maintains the same pelvis angle
of 26.5 degrees as the BioRID II.
A comparison between the EvaRID V1.0 and the BioRID II models is shown in Fig. A3 in Appendix.
Model Evaluation A pre‐simulation was performed to establish the initial position of the
sled simulation of the dummy model by dropping the EvaRID into the
seat and allowing the gravity to find its balanced position. After the
balanced position was achieved the head panel was adjusted, in this
case closer to the head, to match the measured initial head‐to‐head
restraint distance, as estimated from film analysis. An angled plate
resembling the floor pan surface was introduced and a seatbelt was
fastened before applying the measured acceleration pulse (Fig. 4).
Simulated results were compared with the dynamic response
corridors obtained from the volunteer tests [35] (Fig. 5). In general, the
simulated results correlated well for about ~250 ms with responses
being inside or close to the corridors. However, the T1 rearward angular
displacement was substantially less with values lower than 25 percent of the requirement set by the corridor.
This may indicate that the thoracic spine is too stiff in extension. An extensive parameter study was conducted
to explore these and other causes, however, these adjustments resulted only in a minor increase of the T1
rearward angular displacement.
Fig. 5. X‐accelerations of (a) the head, (b) the T1 and (c) the head relative to T1; angular displacements of
(d) the head, (e) the T1 and (f) the head relative to T1; x‐displacements relative to the sled of (g) the head,
(h) the T1 and (i) the head relative to T1 for the 50th percentile female volunteers (grey corridor) and the EvaRID V1.0
(solid black line). The response corridors were calculated ±1SD from the average response.
Fig. 4. Test simulation with the
EvaRID V1.0 model.
a) b) c)
d) e) f)
g) h) i)
IRC-12-32 IRCOBI Conference 2012
- 255 -

To investigate the model response in more detail, simulations using the original BioRID II dummy model were
made under volunteer loading conditions. Experimental data, dynamic response corridors and simulated results
are depicted in Fig. 6. It can be observed that the BioRID II model´s responses are equivalent to the responses by
EvaRID for these loading conditions, including the notably lesser T1 rotation.
Fig. 6. X‐accelerations of (a) the head, (b) the T1 and (c) the head relative to T1; angular displacements of (d)
the head, (e) the T1 and (f) the head relative to T1; x‐displacements relative to the sled of (g) the head, (h) the
T1 and (i) the head relative to T1 for the BioRID dummy (grey corridor) and the BioRID II model (solid black
line). The response corridors were calculated ±1SD from the average response.
IV. DISCUSSION
It is well established that females have a higher whiplash injury risk in rear impacts compared to males [9]–
[10], [14]–[16], [18]–[19]. There are, for example, differences in the neck anatomy and physiology in males and
females [50]–[56], which may contribute to the greater whiplash injury risk in females. Furthermore, males and
females have different anthropometry and mass distribution which may influence the interaction of the upper
body with the seatback and head restraint, and thus the injury risk. Females tend to have greater head x‐
acceleration, greater (or similar) T1 x‐acceleration, lesser (or similar) NIC value and more pronounced rebound
compared to males in rear impact volunteer tests [24]–[35].
It has been reported that tall females have the highest whiplash injury risk in standard vehicle seats (i.e. no
advanced whiplash protection systems fitted) in rear impacts [16], [58]–[59]. However, this study found that the
females associated with the highest whiplash injury frequency in rear impacts are of average size (Fig. 3). Similar
results have previously been reported [9]. Yet, only the extremes of the female population are accounted for by
the existing dummies that may be used for rear impact crash testing; the 50th percentile male rear impact
dummy, or possibly, the 5th percentile female frontal impact dummy. This may explain why existing whiplash
protection concepts are approximately 30 percent more effective for males than females regarding permanent
medical impairment [37] (Fig. 1). The assessment and development of whiplash prevention systems may thus
benefit from an additional rear impact dummy – the 50th percentile female – since it would correlate in size to
the females that are most frequently injured.
The anthropometry and mass data of the 50th percentile female was predominantly obtained from the
UMTRI study [39] and two anthropometric studies [44][46]. The UMTRI study was based on anthropometric
data collected in the early 1970´s in the USA. Due to the secular trend (i.e. the variation in body size over time)
the average statures and body masses have increased since then. However, the selected size for the EvaRID
(stature 161.8 cm, mass 62.3 kg) correlates to the 50th percentile female in relation to the existing adult
dummies. In addition, the selected size was less than 1 percent shorter than the average female (163.2 cm)
a) b) c)
d) e) f)
g) h) i)
IRC-12-32 IRCOBI Conference 2012
- 256 -

according to the WorldSID study [45], who based their data on anthropometric studies across eight regions
comprising OECD countries (weighted by road fatality rates).
A computational rear impact dummy model, EvaRID V1.0, representing the 50th percentile female was
developed (Figs. A2, A3). The model was obtained by scaling anthropometric, geometric and mass properties of
an existing BioRID II dummy model (DYNAmore GmbH). The relative mass distribution of the EvaRID was
somewhat different from the BioRID – the EvaRID had a slightly lighter torso, a heavier pelvis and slightly
heavier thighs. Based on reported differences between females and males in neck muscle strength [50] the
stiffness and damping properties of the neck and spine were scaled to 70 percent of the original values in the
BioRID II model. Apart from the muscle strength, further factors may affect the stiffness of the spine, such as
muscle reflexes [50][60], ligament properties [57][61], support area between vertebrae [57] and ageing [62]–
[65]. These variables were not considered in the EvaRID V1.0 model.
The EvaRID model was validated with regard to rear impact tests comprising female volunteers. The
volunteers were rather young at an average age of 23 years. However, several studies have shown that the
whiplash injury risk is highest at younger (or middle) ages and tends to decrease at older ages [16][59][66]. The
volunteers were thus fairly representative of the age group most at risk of sustaining a whiplash injury.
The simulated dynamic response correlated well until ~250 ms with responses being within or close to the
corridors; however, the T1 rearward angular displacement was less than 25 percent of the requirement set by
the corridor (Fig. 5). In spite of an extensive parametric study of the T1 angular displacement, the general
response did not improve significantly. In addition to the initial reduction in stiffness and damping
characteristics, values were reduced further down to 50 percent of the original values in the BioRID II model,
stiffness of the spring coils in the lower seat segments was increased, and elements representing the breasts
were removed. Although each of these adjustments resulted in some increase of the T1 angular displacement,
the general response did not show any significant improvement, even in different combinations.
As a further check it was decided to run the BioRID II model in the same test setup as in the volunteer tests.
Experimental test data and dynamic response corridors were obtained from tests with the BioRID dummy. The
BioRID II and the EvaRID V1.0 models displayed identical trends, including the notably lesser T1 rearward
angular displacement (Fig. 6). The results suggest that the biofidelity of the EvaRID V1.0 model and the BioRID II
models have limitations at low velocity changes (7 km/h) which may be explained by the fact that the BioRID II
model was validated against dummy test results in the range of consumer test load conditions (EuroNCAP).
Based on these observations it is advisable to further evaluate and improve the BioRID II and EvaRID models
at low velocity changes. In addition, further studies of the performance of the BioRID II model at higher velocity
changes are recommended. In defining the test set‐up it is noted that the head restraint was relatively close to
the head in the volunteer tests [35], which indicates that the head response is largely governed by the head
restraint properties and not entirely by the neck properties. Thus, these volunteer tests are less suitable for fine
tuning the neck parameters, stressing the importance of using greater head restraint gap in future volunteer
tests. Once improved correlation is obtained for T1 rotational response, further fine tuning of the stiffness and
damping characteristics could be considered next. It is also advisable to establish the curvature of the spine and
its relation to the HR distance for seated 50th percentile female occupants. These results need to be
implemented to further improve the EvaRID model.
V. CONCLUSIONS
The EvaRID V1.0 model showed good correlations until ~250 ms for most parameters except for the T1
rearward angular displacement. When running the BioRID II model and comparing it with dummy data under
the same loading conditions, identical results were found for that model. This may indicate that both models
have limitations at lower velocity changes (7 km/h). Further work on the stiffness properties is needed for the
model to achieve a response fully within the corridors in the volunteer tests. This may include a profound survey
of the elemental design of the BioRID II and EvaRID models. Furthermore, additional volunteer data with a
greater initial distance between the head and the head restraint would be valuable to further improve the
dynamic response of the dummy model. Such studies are included in the ADSEAT project. Once fully validated,
the dummy model will be utilised in the design and evaluation of adaptive seat system concepts in order to
provide enhanced neck injury protection for female occupants.
IRC-12-32 IRCOBI Conference 2012
- 257 -

VI. ACKNOWLEDGEMENT
This study is part of the ADSEAT (Adaptive Seat to Reduce Neck Injuries for Female and Male Occupants)
project funded by the European Commission within the 7th Framework Programme. Additional funding has been
received from the Swedish Transport Agency.
The authors would like to thank DYNAmore GmbH for providing the BioRID II dummy model as basis for the
EvaRID model developments.
VII. REFERENCES
[1] Kullgren A, Krafft M, Lie A, Tingvall C. The Effect of Whiplash Protection Systems in Real‐Life Crashes and Their Correlation to Consumer Crash Test Programmes. Proc. 20th ESV Conf.; 2007; Lyon (France)
[2] The Whiplash Commission. The Whiplash Commission Final Report. 2005. ISBN 91‐975655‐4‐7. Available at: http://www.whiplashkommissionen.se/pdf/WK_finalreport.pdf. Accessed July 7, 2011
[3] Nygren Å. Injuries to Car Occupants ‐ Some Aspects of the Interior Safety of Cars, Akta Oto‐Laryngologica, Supplement 395, ISSN 0365‐5237; 1984; Almqvist & Wiksell, Stockholm, Sweden.
[4] Galasko CSB, Murray PA, Pitcher M. Whiplash Associated Disorders. Proc. 15th ESV Conf.; 1996; Melbourne (Australia)
[5] Eichberger A, Geigl BC, Moser A, Fachbach B, Steffan H. Comparison of Different Car Seats Regarding Head‐Neck Kinematics of Volunteers During Rear End Impact. Proc. IRCOBI Conf.; 1996; Dublin (Ireland)
[6] Kullgren A, Eriksson L, Boström O, Krafft M. Validation of Neck Injury Criteria Using Reconstructed Real‐Life Rear‐End Crashes With Recorded Crash Pulses. Proc. 18th ESV Conf.; 2003; Nagoya (Japan)
[7] Watanabe Y, Ichikawa H, Kayama O, Ono K, Kaneoka K, Inami S. Influence of Seat Characteristics on Occupant Motion in Low‐Velocity Rear‐End Impacts. Accid Anal Prev. 2000;32:243–250
[8] Narragon EA. Sex Comparisons in Automobile Crash Injury. CAL Report No. VJ‐1823‐R15; 1965; Cornell Aeronautical Laboratory, Inc. of Cornell University, Buffalo, New York, USA.
[9] Kihlberg JK. Flexion–Torsion Neck Injury in Rear Impacts. Proc. 13th AAAM Conf.; 1969; Minneapolis (Minnesota)
[10] O’Neill B, Haddon W, Kelley AB, Sorenson WW. Automobile Head Restraints—Frequency of Neck Injury Claims in Relation to the Presence of Head Restraints. Am J Public Health. 1972;62:399–405
[11] Thomas C, Faverjon G, Hartemann F, Tarriere C, Patel A, Got C. Protection Against Rear‐End Accidents. Proc. IRCOBI Conf.; 1982; Cologne, Germany
[12] Otremski I, Marsh JL, Wilde BR, McLardy Smith PD, Newman RJ. Soft Tissue Cervical Injuries in Motor Vehicle Accidents. Injury. 1989;20:349–351
[13] Maag U, Desjardins D, Bourbeau R, Laberge‐Nadeau C. Seat Belts and Neck Injuries. Proc. IRCOBI Conf.; 1990; Bron (France)
[14] Morris AP, Thomas PD. Neck Injuries in the UK Co‐operative Crash Injury Study. Proc. 40th Stapp Conf.; 1996; Albuquerque (New Mexico)
[15] Dolinis J. Risk Factors for “Whiplash” in Drivers: a Cohort Study of Rear‐End Traffic Crashes. Injury. 1997;28:173–179
[16] Temming J, Zobel R. Frequency and Risk of Cervical Spine Distortion Injuries in Passenger Car Accidents: Significance of Human Factors Data. Proc. IRCOBI Conf.; 1998; Göteborg (Sweden)
[17] Richter M, Otte D, Pohlemann T, Krettek C, Blauth M. Whiplash‐Type Neck Distortion in Restrained Car Drivers: Frequency, Causes and Long‐Term Results. Eur Spine J. 2000;9:109–117
[18] Chapline JF, Ferguson SA, Lillis RP, Lund AK, Williams AF. Neck Pain and Head Restraint Position Relative to the Driver's Head in Rear‐End Collisions. Accid Anal Prev. 2000;32:287–297
[19] Krafft M, Kullgren A, Lie A, Tingvall C. The Risk of Whiplash Injury in the Rear Seat Compared to the Front Seat in Rear Impacts. Traffic Inj Prev. 2003;4:136–140
[20] Jakobsson L, Norin H, Svensson MY. Parameters Influencing AIS 1 Neck Injury Outcome in Frontal Impacts. Traffic Inj Prev. 2004;5:156–163
[21] Storvik SG, Stemper BD, Yoganandan N, Pintar FA. Population‐Based Estimates of Whiplash Injury Using NASS CDS Data. Biomed Sci Instrum. 2009;45:244–249
[22] Carstensen TB, Frostholm L, Oernboel E, Kongsted A, Kasch H, Jensen TS, Fink P. Are There Gender Differences in Coping with Neck Pain Following Acute Whiplash Trauma? A 12‐month follow‐up study. Eur J Pain. 2011 (Epub ahead of print).
IRC-12-32 IRCOBI Conference 2012
- 258 -

[23] Svensson MY, Lövsund P, Håland Y, Larsson S. Rear‐End Collisions—A Study of the Influence of Backrest Properties on Head–Neck Motion Using a New Dummy Neck. SAE/SP‐93/963, Paper No. 930343;1993; Society of Automotive Engineers, Inc., Warrendale, PA, USA
[24] Croft AC, Haneline MT, Freeman MD. Differential Occupant Kinematics and Forces Between Frontal and Rear Automobile Impacts at Low Speed: Evidence for a Differential Injury Risk. Proc. IRCOBI Conf.; 2002; Munich (Germany)
[25] Viano DC. Seat Influences on Female Neck Responses in Rear Crashes: A Reason Why Women Have Higher Whiplash Rates. Traffic Inj Prev. 2003;4:228–239
[26] Szabo TJ, Welcher JB, Anderson RD, Rice MM, Ward JA, Paulo LR, Carpenter NJ. Human Occupant Kinematic Response to Low‐Speed Rear End Impacts. Proc. 38th Stapp Conf.; 1994; Fort Lauderdale (Florida)
[27] Siegmund GP, King DJ, Lawrence JM, Wheeler JB, Brault JR, Smith TA. Head/Neck Kinematic Response of Human Subjects in Low‐Speed Rear‐End Collisions. Proc. 41st Stapp Conf.; 1997; Orlando (Florida)
[28] Hell W, Langwieder K, Walz F, Muser M, Kramer M, Hartwig E. Consequences for Seat Design due to Rear End Accident Analysis, Sled Tests and Possible Test Criteria for Reducing Cervical Spine Injuries After Rear‐End Collision. Proc. IRCOBI Conf.; 1999; Sitges (Spain)
[29] Welcher JB, Szabo JS. Relationships Between Seat Properties and Human Subject Kinematics in Rear Impact Tests. Accid Anal Prev. 2001;33:289–304
[30] Mordaka J, Gentle RC. The Biomechanics of Gender Difference and Whiplash Injury: Designing Safer Car Seats for Women. Acta Politechnica. 2003;43:47–54
[31] Ono K, Ejima S, Suzuki Y, Kaneoka K, Fukushima M, Ujihashi S. Prediction of Neck Injury Risk Based on the Analysis of Localized Cervical Vertebral Motion of Human Volunteers During Low‐Speed Rear Impacts. Proc. IRCOBI Conf.; 2006; Madrid (Spain)
[32] Linder A, Carlsson A, Svensson MY, Siegmund GP. Dynamic Responses of Female and Male Volunteers in Rear Impacts. Traffic Inj Prev. 2008;9:592–599
[33] Schick S, Horion S, Thorsteinsdottir K, Hell W. Differences and Commons in Kinetic Parameters of Male and Female Volunteers in Low Speed Rear End Impacts. Proc 2nd TÜV SÜD Conf., Whiplash – Neck Pain in Car Crashes; 2008, Erding (Germany)
[34] Carlsson A, Siegmund GP, Linder A, Svensson M. Motion of the Head and Neck of Female and Male Volunteers in Rear Impact Car‐to‐Car Tests at 4 and 8 km/h. Proc. IRCOBI Conf.; 2010; Hanover (Germany)
[35] Carlsson A, Linder A, Davidsson J, Hell W, Schick S, Svensson M. Dynamic Kinematic Responses of Female Volunteers in Rear Impacts and Comparison to Previous Male Volunteer Tests. Traffic Inj Prev. 2011;12:347–357
[36] Welsh R, Lenard J. Male and Female Car Drivers—Differences in Collision and Injury Risks. Proc. 45th AAAM Conf.; 2001; San Antonio (Texas)
[37] Kullgren A, Krafft M. Gender Analysis on Whiplash Seat Effectiveness: Results From Real‐World Crashes. Proc. IRCOBI Conf.; 2010; Hanover (Germany)
[38] Hanson L, Sperling L, Gard G, Ipsen S, Olivares Vergara C. Swedish Anthropometrics for Product and Workplace Design. Appl Ergon. 2008;40:797–806
[39] Schneider LW, Robbins DH, Pflüg MA and Snyder RG. Development of Anthropometrically Based Design Specifications for an Advanced Adult Anthropomorphic Dummy Family. Final Report, UMTRI‐83‐53‐1; University of Michigan Transportation Research Institute; 1983; Ann Arbor, Michigan, USA.
[40] Robbins DH. Anthropometric Specifications for Mid‐Sized Male Dummy. Final Report, UMTRI‐83‐53‐2; University of Michigan Transportation Research Institute; 1983; Ann Arbor, Michigan, USA
[41] Robbins DH. Anthropometric Specifications for Small Female and Large Male Dummies. Final Report, UMTRI‐83‐53‐3; University of Michigan Transportation Research Institute; 1983; Ann Arbor, Michigan, USA
[42] Abraham S, Johnson CL, Najjar F. Weight and Height of Adults 18‐74 Years of Age. Vital Health Statistics, Series 11, Number 211; 1979; National Center for Health Statistics, Hyattsville, MD, USA
[43] Abraham S, Johnson CL, Najjar MF. Weight and Height and Age for Adults 18‐74 Years. Vital Health Statistics, Series 11, Number 208; 1979; National Center for Health Statistics, Hyattsville, MD, USA
[44] Young JW, Chandler RF, Snow CC, Robinette KM, Zehner GF, Lofberg MS. Anthropometric and Mass Distribution Characteristics of Adult Female Body Segments. Federal Aviation Administration, Civil Aeromedical Institute; 1983; Oklahoma City, OK, USA
[45] Moss S, Wang Z, Salloum M, Reed M, van Ratingen M, Beusenberg M. Anthropometry for WorldSID a World‐Harmonized Midsize Male Side Impact Crash Dummy. SAE, Paper No. 220‐01‐2202; 2000; Society of Automotive Engineers, Inc., Warrendale, PA, USA
IRC-12-32 IRCOBI Conference 2012
- 259 -

[46] Diffrient N, Tilley AR, Bardagjy JC. Humanscale 1/2/3 – A Portfolio of Information. The MIT Press; 1974; Cambridge, MA
[47] Cheng H, Obergefell L, Rizer A. Generator of Body (GEBOD) Manual. Report No. AL/CF‐TR‐1994‐0051; 1994; Human Effectiveness Directorate, Crew Surviability and Logistics Division, Write‐Patterson Air Force Base, Ohio, USA
[48] Seidl A. RAMSIS – A New CAD Tool for Ergonomic Analysis of Vehicles Developed for the German Automotive Industry. SAE Paper No. 970088; 1997; Society of Automotive Engineers, Inc., Warrendale, PA, USA
[49] McConville JT, Churchill TD, Kaleps I, Clauser CE, Cuzzi. Anthropometric Relationships of Body and Body Segment Moments of Inertia. AMRL‐TR‐80‐119; 1980; Wright‐Patterson AFB, Aerospace Medical Research Laboratory, Yellow Springs, OH, USA
[50] Foust DR, Chaffin DB, Snyder RG, Baum JK. Cervical Range of Motion and Dynamic Response and Strength of Cervical Muscles. Proc 17th Stapp Conf.; 1973; Oklahoma City (Oklahoma)
[51] Pettersson K, Kärrholm J, Toolanen G, Hildingsson C. Decreased Width of the Spinal Canal in Patients With Chronic Symptoms After Whiplash Injury. Spine. 1995;20:1664–1667
[52] Vasavada AN, Li S, Delp SL. Three‐Dimensional Isometric Strength of Neck Muscles in Humans. Spine. 2001;26:1904–1909
[53] DeSantis Klinich K, Ebert SM, Van Ee CA, Flannagan CA, Prasad M, Reed MP, Schneider LW. Cervical spine Geometry in the Automotive Seated Posture: Variations With Age, Stature, and Gender. Stapp Car Crash J. 2004;48:301–330
[54] Tatarek NE. Variation in the Human Cervical Neural Canal. Spine. 2005;5:623–631 [55] Vasavada AN, Danaraj J, Siegmund GP. Head and Neck Anthropometry, Vertebral Geometry and Neck
Strength in Height‐Matched Men and Women. J Biomech. 2008;41:114–121 [56] Stemper BD, Yoganandan N, Gennarelli TA, Pintar FA. Toward a Lower Neck Rear Impact Injury Criterion –
Correlation of Lower Neck Loads With Spinal Kinematics. Proc. IRCOBI Conf.; 2007; Maastricht (The Netherlands)
[57] Stemper BD, Yoganandan N, Pintar FA, Maiman DJ, Meyer MA, DeRosia J, Shender BS, Paskoff G Anatomical Gender Differences in Cervical Vertebrae of Size‐Matched Volunteers. Spine. 2008;33:E44‐E49
[58] Lundell B, Jakobsson L, Alfredsson B, Jernström C, Isaksson‐Hellman I. Guidelines for and the Design of a Car Seat Concept for Improved Protection Against Neck Injuries in Rear‐End car impacts. SAE, Paper No. 980301, 1998; Society of Automotive Engineers, Inc., Warrendale, PA, USA
[59] Jakobsson L, Lundell B, Norin H, Isaksson‐Hellman I. WHIPS‐Volvo’s Whiplash Protection Study. Accid Anal Prev. 2000;32:307–319
[60] Siegmund GP, Sanderson DJ, Myers BS, and Inglis JT. Awareness Effects the Response to Single Whiplash Perturbations. Spine. 2003;28:671–679
[61] Osakabe T, Hayashi M, Hasegawa K, Okuaki T, Ritty TM, Mecham RP, Wachi H, Seyama RP. Age‐ and Gender‐Related Changes in Ligament Components. Ann Clin Biochem. 2001;38:527–532
[62] Hanten WP, Lucio RM, Russell JL, Brunt D. Assessment of Total Head Excursion and Resting Head Posture. Arch Phys Med Rehabil. 1991;72:877–880
[63] Youdas JW, Garrett TR, Suman VJ, Bogard CL, Hallman HO, Carey JR. Normal Range of Motion of the Cervical Spine: an Initial Goniometric Study. Phys Ther. 1992;72:770–780
[64] Hanten WP, Olson S L, Russell JL, Lucio RM, Campbell AH. Total Head Excursion and Resting Head Posture: Normal and Patient Comparisons. Arch Phys Med Rehabil. 2000;81:62–66
[65] Seacrist T, Maltese MR, Balasubramanian S, Garcia‐Espana JF, Arbogast KB, Sterner R, Saffioti J, Kadlowec J. Comparison of Passive Cervical Spine Flexion in Children and Adults. Proc. 21st ESV Conf.; 2009; Stuttgart, (Germany)
[66] Farmer CM, Wells JK, Werner JV. Relationship of Head Restraint Positioning to Driver Neck Injury in Rear‐End Crashes. Accid Anal Prev. 1999;31:719–728
IRC-12-32 IRCOBI Conference 2012
- 260 -

VIII. APPENDIX
TABLE AI REGRESSION EQUATIONS FOR ESTIMATIONS OF THE VOLUME OF DIFFERENT BODY PARTS OF FEMALES [44].
THE CALCULATED VOLUME AND MASS OF DIFFERENT BODY PARTS OF THE 50TH PERCENTILE FEMALE.
Body Part Volume Regression Equation
Volume [cm3] Mass [kg]
From [44]
Scaled variables
Based on[44]
Based onScaled
variables
Head V=132.85Chead+163.75Hhead–13.73S–3,722.51 3,894 3,886 3.51 3.58
Neck V=9.44S+23.57Cneck+14.26Lneck–1,658.86 737 735 0.66 0.68
Thorax V=33.08M+285.77Cbust+422.96Lthorax–29,046.39 18,175 17,782 16.38 16.36
Abdomen V=572.45Labdomen+184.72Ctenth rib–323.75Btenth rib–5,727.80 2,817 2,760 2.54 2.54
Pelvis V=107.20M–84.30S+528.80Fsuprailiac+7,637.48 10,128 9,685 9.13 8.91
Upper Arm
R V=7.33M+67.89Celbow+19.49Lacrom_rad–1,714.08 1,557 1,513 1.40 1.39
L V=3.64M+65.37Cbiceps_fl_left+47.57Lacrom_rad–2,241.29 1,556 1,524 1.40 1.40
Lower Arm
R V=61.12Celbow+53.42Cwrist+18.99Lrad_stylion–1,835.29 935 912 0.84 0.84
L V=30.56Celbow+36.41Lrad_stylion+49.49Cmid forearm–1,713.20 923 932 0.83 0.86
Hand R V=25.14Cwrist+36.37Bhand+16.83Lmeta III_dact–484.95 344 337 0.31 0.31
L V=50.64Bhand+12.84Cwrist+12.67Lhand–476,78 334 328 0.30 0.30
Flap R V=90.90Cupper thigh+177.39Lthigh flap+18.77S–7,823.86 3,792 3,748 3.42 3.45
L V=98.20Cupper thigh+153.06Lthigh flap+23.37S–8,522.40 3,832 3,786 3.45 3.48
Upper Leg (flap excl)
R V=173.68Cmid thigh+57.90S+29.81Cbuttock–15,058.42 6,278 6,191 5.66 5.70
L V=253.27Cmid thigh+80.63S–141.89Bbitroch–15,450.17 6,211 6,126 5.60 5.64
Lower Leg R V=137.20Ccalf_right+47.91Cknee+33.92Lcalf–4,740,57 3,111 3,045 2.80 2.80
L V=128.09Ccalf_left+64.32Cknee+37.69Lcalf–5,166.17 3,151 3,081 2.84 2.83
Foot R V=38,27Lfoot+121.67Hsphyrion+22.70Cankle–1,475.74 673 668 0.61 0.61
L V=32.65Cball of foot+93.42Hsphyrion+32.44Lfoot–1,409.56 682 675 0.61 0.62
TOTAL: 69,130 67,714 62.3 62.3
Background Mesh Size 10×10 mm
Fig. A1. Distances (in cm) between
joints of EvaRID based on [46].
Fig. A2. Torso details – heights of major landmarks.
IRC-12-32 IRCOBI Conference 2012
- 261 -

TABLE AII ANTHROPOMETRIC DATA USED FOR CALCULATIONS OF THE VOLUME FOR DIFFERENT BODY PARTS (TABLE IV). BASED ON [44].
Measure Unit Body Part Variable1) Value2) Scale Factor
ScaledValue3)
Stature [cm] Body S 161.2 ‐ 161.8Mass [punds] Body M 140.9 ‐ 137.3
Circumference [cm]
Head Chead 54.78 1 54.78Neck Cneck 32.86 0.99 32.53Bust Cbust 95.41 0.99 94.46Tenth rib Ctenth rib 75.94 0.99 75.18Buttock Cbuttock 100.08 0.99 99.08Upper thigh Cupper thigh 59.44 0.99 58.85Mid thigh Cmid thigh 51.92 0.99 51.40Knee Cknee 36.97 0.99 36.60Calf (right) Ccalf_right 35.43 0.99 35.08Calf (left) Ccalf_left 35.79 0.99 35.43Ankle Cankle 21.45 0.99 21.24Biceps flexed (left) Cbiceps_fl_left 28.60 0.99 28.31Elbow Celbow 24.42 0.99 24.18Mid forearm Cmid forearm 21.22 0.99 21.01Wrist Cwrist 15.72 0.99 15.56Ball of foot Cball of foot 22.8 0.99 22.57
Height [cm] Head Hhead 15.59 1 15.59Sphyrion Hsphyrion 6.26 1 6.26
Length [cm]
Neck Lneck 6.98 1 6.98Thorax Lthorax 36.16 1 36.16Abdomen Labdomen 4.94 1 4.94Thigh flap Lthigh flap 17.96 1 17.96Calf Lcalf 35.95 1 35.95Foot Lfoot 23.51 1 23.51Acromion‐radiale Lacrom_rad 29.74 1 29.74Radiale‐stylion Lrad_stylion 23.07 1 23.07Metacarpale III ‐ Dactylion Lmeta III_dact 8.99 1 8.99Hand Lhand 17.08 1 17.08
Breadth [cm] Tenth rib Btenth rib 25.67 0.99 25.41Bitrochanteric Bbitroch 31.63 1 31.63Hand Bhand 7.76 0.99 7.68
Skinfold [mm] Suprailiac Fsuprailiac 1.85 0.99 1.831) Variables in the regression equations (Table A1). 2) Average values from Young et al. (1983). 3) Input to the calculations of volume/mass of the EvaRID model (Table A1)
Fig. A3. Comparison of the EvaRID and the BioRID II models.
IRC-12-32 IRCOBI Conference 2012
- 262 -


