Embed Size (px)
Citation preview

www.elsevier.com/locate/ynimg
NeuroImage 29 (2006) 822 – 837
Evidence for developmental changes in the visual word processing
network beyond adolescence
Silvia Brem,a Kerstin Bucher,b Pascal Halder,a Paul Summers,c Thomas Dietrich,b
Ernst Martin,b and Daniel Brandeisa,*
aDepartment of Child and Adolescent Psychiatry, University of Zurich, Brain Mapping Research, Neumunsterallee 9/ Fach, CH-8032 Zurich, SwitzerlandbMR-Center, University Children’s Hospital, Zurich, SwitzerlandcInstitute of Neuroradiology, University Hospital Zurich, Zurich, Switzerland
Received 15 February 2005; revised 10 June 2005; accepted 2 September 2005
Available online 28 October 2005
Late development of specialization in the visual word processing system
was examined using event-related potentials (ERP) and functional
magnetic resonance imaging (fMRI) of word and symbol string
processing in groups of adolescents (15.2–17.3 years) and adults
(19.8–30.8 years). We focused our ERP analyses on fast visual activity:
the occipital P1 (82 –131 ms) modulated by physical stimulus
characteristics and the occipito-temporal N1 (132–256 ms) reflecting
visual tuning for print. Our fMRI analyses concentrated on basal
occipito-temporal activations in the visual word form area VWFA. For
words, the correlation of fMRI activation in the VWFA and N1
amplitude confirmed the close relationship of the electrophysiological
N1 with metabolic activity in the VWFA. Further support for this
relationship came from low resolution electromagnetic tomography
localizing the word-specific N1 near the VWFA.
Both imaging techniques revealed age-independent differences
between words and symbol strings. Late development, however, was
preferentially detected with ERPs. Decreases of P1 and N1 amplitudes
with age were not limited to words and suggested further maturation of
the underlying brain microstructure and function. Following adoles-
cence, decreasing N1 latencies specific to words point to continued
specialization of the visual word processing system. Both N1 and fMRI
measures correlated with reading performance. In summary, the
similarity of global fMRI activation patterns between groups suggests
a fully established distribution of the reading network in adolescence,
while the decreasing N1 latencies for words indicate protracted fine
tuning after adolescence.
D 2005 Elsevier Inc. All rights reserved.
Introduction
Reading is one of the most important forms of human
communication in modern culture and an essential activity in
everyday life. The investigation of the normal progression of
1053-8119/$ - see front matter D 2005 Elsevier Inc. All rights reserved.
doi:10.1016/j.neuroimage.2005.09.023
* Corresponding author. Fax: +41 43 499 2604.
E-mail address: [email protected] (D. Brandeis).
Available online on ScienceDirect (www.sciencedirect.com).
reading development is key to being able to detect potential
developmental reading disorders at an early stage so that support
with established training programs, adjusted for the skills and level
of the reader, can be provided as early as possible. Although
reading is of enormous importance in our society, it is not an innate
ability and has to be learned through extensive training at school.
Children usually begin with reading exercises in their first year at
school (5–7 years), and it is during this time that specific brain
regions begin to adopt the functions necessary for processing
written language and a specialized reading network is established
(Maurer et al., 2005a). This network is devoted to fast and partly
automatic word processing steps such as orthographic coding and
the association with sound (phonology), which eventually permit
lexical access and understanding of meaning (semantics). Destruc-
tion of parts in the network through a lesion or impairments in its
functionality result in severe reading disorders (Dejerine, 1892;
Damasio and Damasio, 1983; Rumsey et al., 1992; Shaywitz,
1996; Demb et al., 1998; Shaywitz et al., 2002).
Neurophysiological magnetoencephalographic (MEG) and
electroencephalographic (EEG) studies (Nobre et al., 1994; Helen-
ius et al., 1999; Tarkiainen et al., 1999) of healthy adults indicate
that two ‘‘early’’ (<250 ms after stimulus presentation) activations
following visual presentation of words and word-like stimuli are
primarily involved in visual rather than in phonologic or semantic
word processing, although subtle effects of word class (Koenig and
Lehmann, 1996; Skrandies, 1998) are also reported. An activation
over the occipital scalp around 100 ms (P1/M100) is mainly
sensitive to physical stimulus characteristics (visual contrast,
luminance, size, etc.) and reflects activity of striate and extrastriate
visual areas (Dale et al., 2000; Dhond et al., 2001; Khateb et al.,
2002; Hauk and Pulvermuller, 2004a,b). The P1 is followed by an
occipito-temporal negative microstate around 140–220 ms (N1)
(Nobre et al., 1994; Bentin et al., 1999). In contrast to the P1, the
N1 microstate is category specific. It is the earliest component that
reliably distinguishes between word-like stimuli and visually
matched symbol strings (Schendan et al., 1998; Bentin et al.,
1999; Tarkiainen et al., 1999). The N1 amplitudes are larger to

S. Brem et al. / NeuroImage 29 (2006) 822–837 823
word-like stimuli (words, letter and pseudofont strings) than to
nonsense character strings (made from symbols, icons or other
forms), particularly over the left hemisphere (Schendan et al.,
1998; Bentin et al., 1999; Rossion et al., 2003; Brem et al., 2005;
Maurer et al., 2005a,b). The categorical specificity of the N1 to
word stimuli is also supported by its unique topography,
lateralization, and amplitude when compared with the N1 to faces
or objects (Schendan et al., 1998; Rossion et al., 2003).
Converging evidence from positron emission tomography (PET)
(Petersen et al., 1988; Petersen et al., 1990; Price et al., 1996;
Mechelli et al., 2000) and fMRI (Cohen et al., 2000; Dale et al.,
2000; Gaillard et al., 2000; Tagamets et al., 2000; Booth et al., 2001;
Dehaene et al., 2002; Schlaggar et al., 2002; Turkeltaub et al., 2003)
points to the crucial involvement of the occipito-temporal cortex in
extracting visual invariants of words and word-like stimuli. In
particular, an area in the left midfusiform gyrus (Talairach
coordinates (TC): �42, �54,�12) has been described as an
unimodal visual word form area (VWFA) activated automatically
for visually presented words (Cohen et al., 2000; Cohen et al., 2002;
Dehaene et al., 2002; Cohen and Dehaene, 2004). It is suggested to
be responsible for the computation of an abstract, ordered letter
identity representation from the visual input as a base for subsequent
higher level processing. Although most studies so far have observed
activation in the VWFA during visual word processing, some
studies indicate that this area is not exclusively activated by written
words, with activity being evoked by other types of visual stimuli
such as letter strings (Tagamets et al., 2000), falsefont strings (Price
et al., 1996; Tagamets et al., 2000; Turkeltaub et al., 2003), or even
pictures (Moore and Price, 1999) in the same area. These discrepant
results regarding the role of the VWFA have been explained by its
proximity to multimodal processing areas (Cohen and Dehaene,
2004) in lateral infero-temporal areas. Insufficient spatial resolution
of PET studies, strong smoothing of fMRI data, and interindividual
variability in the brain structures may contribute to the diverging
results. However, the discrepancies may also be due to the
insufficient temporal resolution of fMRI and PET data which are
not able to exclude contributions from later, sustained, or reentrant
activation of the same region (Dale et al., 2000). Nevertheless,
activity in the midfusiform gyrus of the language dominant left
hemisphere is thought to represent the metabolic correlate of some
aspects of the electrical N1. Support is provided by intracranial
neurophysiologic mappings of word- and face-specific ERPs
(Allison et al., 1994; Nobre et al., 1994; Puce et al., 1996), and
by noninvasive multimodal studies of word processing in the
same subjects (Cohen et al., 2000; Dale et al., 2000). Subsequent
higher level processing of visually presented words such as
grapheme–phoneme conversion or semantic access is carried out
predominantly in distinct left hemispheric brain structures of the
temporal and frontal lobes (Petersen and Fiez, 1993; Petersen et
al., 1988; Demonet et al., 1992, 1994, 2005; Paulesu et al., 1997;
Poldrack et al., 1999).
While the brain volume changes most dramatically in early
childhood, as indicated by structural and morphologic MRI studies
(Giedd, 2004), continued dynamic changes affect various sub-
components of the brain beyond adolescence. Structural and
morphologic changes in adolescence and early adulthood include
increases in gray matter volume, the amount of white matter, U-
shaped maturational curves (Giedd et al., 1999; Paus et al., 1999;
Giedd, 2004), and brain growth in regions involved in language
processing such as the dorsal frontal and occipito-temporal cortex
(Sowell et al., 2001). Ameliorations in connectivity due to synaptic
pruning are also recognized (Huttenlocher, 1979; Sowell et al.,
2001). These changes suggest continued functional development
such as accelerated neuronal processing. Following the prominent
changes in early childhood, and in parallel with late structural
maturation, late developmental changes of functional networks
during adolescence and early adulthood have been observed.
Neurophysiological ERP studies have provided clear evidence for
late development of visual word processing (Kok and Rooijakkers,
1985; Taylor, 1988; Holcomb et al., 1992; Taylor and Smith, 1995;
Grossi et al., 2001) in different tasks. These studies focused on
‘‘late’’ ERPs occurring after 250 ms, which reflect phonological
(Taylor, 1993; Grossi et al., 2001) or semantic (Taylor, 1988;
Holcomb et al., 1992) processing, rather than earlier steps such as
visual specialization for letter strings. Late activities such as the
frontal asymmetry following phonological primes, or the activity to
semantically incongruent sentence endings revealed major topo-
graphic changes beyond adolescence, consistent with continued
reorganization of language processing. Earlier visual P1 and N1
activities displayed amplitude or latency decreases with age
(Holcomb et al., 1992; Grossi et al., 2001) and paralleled similar
developmental changes for the later ERPs. Such changes are
referred to as nonspecific effects of maturation and automation in
this article since they are neither limited to a specific modality
(Holcomb et al., 1992) nor condition (Taylor et al., 1999). No late
development of the word N1 topography, which might reflect
specialization for words was reported (Holcomb et al., 1992;
Grossi et al., 2001), but such topographic changes may have gone
undetected due to insufficient analysis or coverage of posterior
temporal regions which are known to yield the largest word N1 in
adults (Nobre et al., 1994; Brandeis et al., 1995; Rossion et al.,
2003). Additionally, no control condition such as symbol strings
was used to distinguish between ongoing nonspecific ERP
maturation or specific progresses in word specialization.
Intriguingly, however, systematic developmental ERP mapping
studies focusing on visual specialization for faces have consistently
demonstrated that development and specialization of the early
visual P1 and N1 components continue beyond age 15 (Itier and
Taylor, 2004a,b; Taylor et al., 2004).
Developmental changes in visual specialization for words
during adolescence have also been examined in studies using
fMRI and PET (Petersson et al., 2000; Booth et al., 2001; Gaillard
et al., 2001; Schlaggar et al., 2002; Shaywitz et al., 2002;
Turkeltaub et al., 2003; Brown et al., 2005; Schapiro et al.,
2004). There is suggestive evidence from studies using both
implicit (Turkeltaub et al., 2003) and explicit language tasks
(Schlaggar et al., 2002; Shaywitz et al., 2002; Brown et al., 2005)
that lower level visual processing in posterior areas such as the
bilateral extrastriate cortices matures prior to higher language
processing in areas such as left parietal and frontal cortex. A
consistent developmental finding is the increase of left-anterior
activation with age, although both continued linear (Shaywitz et
al., 2002; Turkeltaub et al., 2003; Schapiro et al., 2004) and
asymptotic nonlinear (Brown et al., 2005) increases have been
found in adolescence. In addition to this posterior–anterior
maturation pattern, an attenuation of right hemispheric infero-
temporal activation (Turkeltaub et al., 2003) contributes to the
establishment of the typical left hemispheric dominance of the
language processing network. This activity decrease in posterior
regions reached adult-like levels at a slightly older age (¨15 years)
than developmental increases (<13 years) (Brown et al., 2005). Not
all developmental changes, however, follow the posterior–anterior

S. Brem et al. / NeuroImage 29 (2006) 822–837824
maturation pattern. Attenuations of activation with age noted in
sensory regions such as bilateral occipital and temporal cortex may
represent fine-tuning of lower-level mechanisms (Brown et al.,
2005).
Late development of visual specialization in the reading system
between adolescence and adulthood thus remains to be examined.
Even though the reading network seems to be established in
adolescence, minor alterations in the occipital and temporal cortex
detected after adolescence may represent protracted fine-tuning.
Moreover, no multimodal studies have examined developmental
changes using ERP and fMRI in the same subjects, and no
developmental ERP or fMRI studies have focused specifically on
late maturation of visual specialization in word processing. To
detect and understand the presumably subtle changes during late
development, it is indispensable to use imaging techniques that
allow the exact tracking of the time course as well as the precise
localization of areas involved in visual word processing. In our
study, we focus on late development of the early visual word
processing steps and implicit reading by comparing groups of
adolescents and adults performing a word and symbol string
repetition detection task using ERP and fMRI. We examine
whether the development of temporal (ERP) and spatial (fMRI)
aspects in the posterior visual word processing network is
completed prior to adolescence, or continues to display devel-
opmental changes.
We hypothesize that the topography and spatial organization of
the basic visual word processing network is fully established in
adolescence. However, since most adolescents continue training
and consolidating their reading skills, the degree and speed of
activation in the reading network should still change. N1 source
computations are expected to identify posterior brain areas
specialized for visual word processing, matching a subset of
posterior regions identified in the fMRI data. In accordance with
the literature, we anticipate that N1 latencies and amplitudes
decrease from adolescence to adulthood as words become
increasingly familiar and meaningful, but will not adapt for
unfamiliar and meaningless symbol strings.
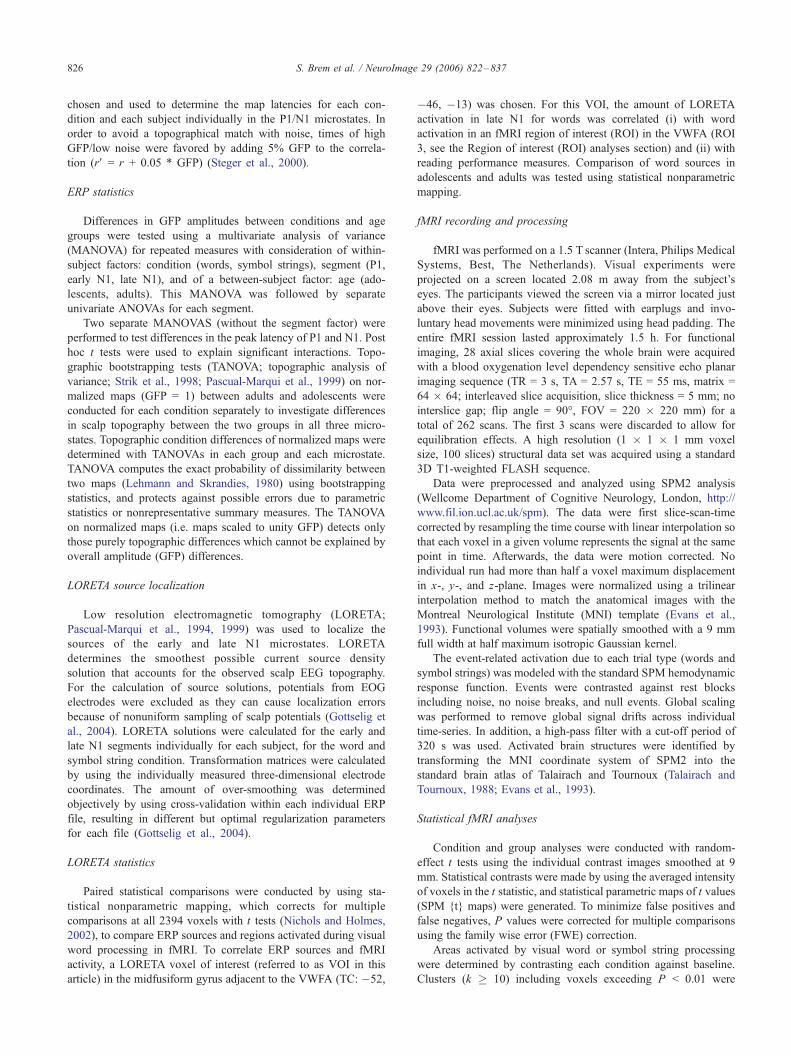
Fig. 1. Schematic illustration of the task. In the implicit reading part,
subjects were instructed to press a button after immediate repetition of a
stimulus. Within the blocks of words and symbol strings, 20% null events
were pseudorandomly intermixed with the stimuli, resulting in more
variable ISIs. Only conditions analyzed in this paper are illustrated.
Materials and methods
Participants
18 adults (9 male, 9 female, aged 19.8–30.8 years, mean age
25.2 years, right handed) and 13 adolescents (5 male, 8 female,
aged 15.2–17.3, mean age 16.2 years, right handed) volunteered to
participate in this study. All had normal or corrected to normal
vision and none had a neurological or psychiatric disease, or
reading disorder. Their native language was Swiss–German. Most
of the adults answered on advertisements placed at universities.
Adolescents were contacted by distributing handouts at schools.
Each subject (plus one parent/caretaker of the adolescents) signed
informed consent. The study was approved by the local ethical
committee.
Procedure
All subjects took part in separate EEG and fMRI sessions. The
order of the sessions was counterbalanced and the average interval
between the two sessions was 9 days (3–34 days). In both
sessions, subjects had to perform the same four tasks (three visual,
one motoric). The order of the tasks was the same in both sessions
of a given subject but was counterbalanced across subjects. The
visual field (30-) for stimulus presentation and the visual angle of
stimuli (between 1.1- and 3-) were matched across the recording
settings. In this paper, we focus on the data of the visual word and
symbol string processing task. All subjects performed a short timed
pseudoword reading test, for which local adult norms were
available (item length 4, 6, 8, 10, and 12 letters, 5 pseudowords
of each length, totalling 120 syllables).
Stimuli and task
The implicit reading and symbol string processing task is
illustrated in Fig. 1. The task was to press a button after immediate
repetition of a stimulus. Words and symbol string stimuli were
presented either as black on a white background (no noise) or black
on a noisy (noise 34%) background. Words and symbol strings
were matched for character size and number of characters in a
string (3–5 characters). Symbol strings were slightly wider
(average visual angle: 2.2-, range: 1.3–3-) than words (average
visual angle: 1.9-; range: 1.1–2.4-) due to a difference in character
spacing. All words of both parts were concrete nouns chosen for
balanced familiarity on the basis of occurrence per million words
(average: 13; range: 0.5–237) in contemporary publications
(University of Leipzig: www.wortschatz.uni-leipzig.de). The first
letter of each word was capitalized, and the remaining letters
written in lowercase.
70 stimuli and 14 target stimuli of each condition were
presented in two blocks (35 + 7 stimuli). The stimuli of each
block (4 � 2) were pseudorandomly intermixed with 20% null
events (omitted stimuli, or no-stimulus events). The duration of

Fig. 2. ERP curves (GFP) to words (solid lines) and symbol strings (dashed
lines) in adolescents (black) and adults (gray). The vertical gray lines
indicate microstate borders (P1, early N1, late N1). Clearly visible are the
larger late N1 amplitudes in adolescents for both conditions, and the longer
N1 map latency in adolescents than in adults for the word condition only.
The distinction between words and symbol strings which starts in the early
N1 becomes most pronounced in the late N1 (GFP).
S. Brem et al. / NeuroImage 29 (2006) 822–837 825
each stimulus presentation was 700 ms. During the interstimulus-
interval (ISI) which varied following an exponential distribution
(500–650 ms), a centered fixation cross was shown either on white
background (no noise blocks) or noisy background (noise blocks).
Mean stimulus onset asynchrony (SOA) added up to 1240 ms for
both real stimuli and null events. Between each task block, 15 s
rest was introduced. In half of the rest blocks, a white screen with a
centered fixation cross was shown, in the other half of the breaks,
the fixation cross was projected on a noisy background.
The order of the blocks was counterbalanced across subjects.
Word and symbol string blocks with and without noise were
alternated. The main task was followed by two silent reading
blocks (35 stimuli + 7 target stimuli + 10.5 null events). All target
stimuli were used only to maintain subjects’ attention within the
recording sessions and were excluded from ERP and fMRI
analyses. To keep the focus on implicit reading and symbol string
processing, the results from the noise conditions and from the silent
reading part are not reported in this article.
Behavioral measures
All subjects performed satisfactorily (overall accuracy, includ-
ing targets and false alarms >89%, average overall accuracy words:
99.6%; and for symbol strings: 96.5%) for inclusion in subsequent
analyses. Mean reaction time to target stimuli and target accuracy
was further analyzed. Performance in the pseudoword reading task
(performed without ERP or fMRI recordings) was also analyzed,
and correlations with N1 mean amplitudes and activity in the left
midfusiform gyrus were computed.
Behavioral analyses
Target accuracy was transformed with arcsin to compute the
subsequent multivariate analyses of variance (MANOVAs). To
examine performance differences between age groups and compare
impact of method on behavior, we computed separate MANOVAs
for reaction time and target accuracy including the within-subject
factors condition (words, symbol strings) and method (EEG,
fMRI). To examine the influence of repeating the test, we also
computed MANOVAs with the within-subject factor session (first
vs. second session) rather than method.
ERP recording and processing
Participants were seated in an electrically shielded, video
monitored, soundproofed and air-conditioned recording room in
front of a computer display (distance 60 cm). Electrode positions
on the individual scalp were measured using a 3D digitizer. The
entire EEG session lasted about 2.5 h.
The ERPs were recorded from 63 channels with a sampling rate
of 500 Hz, filters set to 0.1–70 Hz, and calibrated technical zero
baselines. Fz served as recording reference, AFz as ground. Caps,
used for the montage, included all 10–20 system electrodes plus
the following additional electrodes: FPz, FCz, CPz, POz, Oz, Iz,
AF1/2, F5/6, FC1/2, FC3/4, FC5/6, FT7/8, FT9/10, C1/2, C5/6,
CP1/2, CP3/4, CP5/6, P5/6, TP7/8, TP9/10, PO1/2, PO9/10, Ol1/2,
and two EOG electrodes below the outer canthus of the each eye.
O1V/2V and Fp1V/2V were placed at 15% (5% more laterally) for
more even coverage. Ol1 and Ol2 were placed to the left and to the
right of the midline half-way between Oz and Iz for better occipital
coverage. The impedance for >80% of all electrodes was below 20
kV. The few electrodes with high impedances (<1.5% between 40
and 60 kV) nonetheless delivered reliable EEG signals.
Ocular artifacts were removed using an independent component
analysis (ICA) on 0.3–30 Hz filtered data, where necessary. The
ICA separates the input data into a sum of temporally independent
components of fixed topography and allows components domi-
nated by blink or lateral eye artifact distributions to be removed
without topographic distortion (Jung et al., 2001). Prior to
averaging, the corrected files were digitally bandpass filtered (1–
30 Hz, 24 dB), downsampled to 256 Hz, and epoched from �125
ms pre- to 1125 ms poststimulus. Artifacts exceeding T80 AV in
any channel were automatically rejected. Averaging was done
separately for each condition. ERPs were transformed to the
average reference (Lehmann and Skrandies, 1980) for all subse-
quent analyses. For each group (adults, adolescents), the averages
of the word and symbol string conditions were computed
separately and the resulting group average ERPs were normalized
to GFP = 1 (global field power, a time varying measure of map
amplitude computed as the spatial RMS; Lehmann and Skrandies,
1980) to ensure equal weighting. Time segments (see Fig. 2) of the
P1 (82–131 ms), the early N1 (132–182 ms), and the late N1
(183–256 ms) for use in all subsequent analyses were defined by
topographic microstate clustering (Pascual-Marqui et al., 1995) on
the grand mean of the normalized ERP files of adults and ado-
lescents including both conditions. Afterwards, the mean amplitude
values of the three microstate segments were computed for the
averaged GFP values of each timeframe within the segments. These
mean amplitude values were used for further statistical analyses.
Latency maps of the P1 and N1 (132–256 ms) microstates
were determined using a topographical component recognition
(TCR) (Brandeis et al., 1992), which uses a template map to
search for the topographically most similar map in each ERP.
For each condition separately, the grand mean of adults and
adolescents was calculated using the normalized grand average
ERP curves to exclude unequal weighting of the group maps. The
map at the P1/N1 GFP peaks of these two grand means were
S. Brem et al. / NeuroImage 29 (2006) 822–837826
chosen and used to determine the map latencies for each con-
dition and each subject individually in the P1/N1 microstates. In
order to avoid a topographical match with noise, times of high
GFP/low noise were favored by adding 5% GFP to the correla-
tion (rV = r + 0.05 * GFP) (Steger et al., 2000).
ERP statistics
Differences in GFP amplitudes between conditions and age
groups were tested using a multivariate analysis of variance
(MANOVA) for repeated measures with consideration of within-
subject factors: condition (words, symbol strings), segment (P1,
early N1, late N1), and of a between-subject factor: age (ado-
lescents, adults). This MANOVA was followed by separate
univariate ANOVAs for each segment.
Two separate MANOVAS (without the segment factor) were
performed to test differences in the peak latency of P1 and N1. Post
hoc t tests were used to explain significant interactions. Topo-
graphic bootstrapping tests (TANOVA; topographic analysis of
variance; Strik et al., 1998; Pascual-Marqui et al., 1999) on nor-
malized maps (GFP = 1) between adults and adolescents were
conducted for each condition separately to investigate differences
in scalp topography between the two groups in all three micro-
states. Topographic condition differences of normalized maps were
determined with TANOVAs in each group and each microstate.
TANOVA computes the exact probability of dissimilarity between
two maps (Lehmann and Skrandies, 1980) using bootstrapping
statistics, and protects against possible errors due to parametric
statistics or nonrepresentative summary measures. The TANOVA
on normalized maps (i.e. maps scaled to unity GFP) detects only
those purely topographic differences which cannot be explained by
overall amplitude (GFP) differences.
LORETA source localization
Low resolution electromagnetic tomography (LORETA;
Pascual-Marqui et al., 1994, 1999) was used to localize the
sources of the early and late N1 microstates. LORETA
determines the smoothest possible current source density
solution that accounts for the observed scalp EEG topography.
For the calculation of source solutions, potentials from EOG
electrodes were excluded as they can cause localization errors
because of nonuniform sampling of scalp potentials (Gottselig et
al., 2004). LORETA solutions were calculated for the early and
late N1 segments individually for each subject, for the word and
symbol string condition. Transformation matrices were calculated
by using the individually measured three-dimensional electrode
coordinates. The amount of over-smoothing was determined
objectively by using cross-validation within each individual ERP
file, resulting in different but optimal regularization parameters
for each file (Gottselig et al., 2004).
LORETA statistics
Paired statistical comparisons were conducted by using sta-
tistical nonparametric mapping, which corrects for multiple
comparisons at all 2394 voxels with t tests (Nichols and Holmes,
2002), to compare ERP sources and regions activated during visual
word processing in fMRI. To correlate ERP sources and fMRI
activity, a LORETA voxel of interest (referred to as VOI in this
article) in the midfusiform gyrus adjacent to the VWFA (TC: �52,
�46, �13) was chosen. For this VOI, the amount of LORETA
activation in late N1 for words was correlated (i) with word
activation in an fMRI region of interest (ROI) in the VWFA (ROI
3, see the Region of interest (ROI) analyses section) and (ii) with
reading performance measures. Comparison of word sources in
adolescents and adults was tested using statistical nonparametric
mapping.
fMRI recording and processing
fMRI was performed on a 1.5 T scanner (Intera, Philips Medical
Systems, Best, The Netherlands). Visual experiments were
projected on a screen located 2.08 m away from the subject’s
eyes. The participants viewed the screen via a mirror located just
above their eyes. Subjects were fitted with earplugs and invo-
luntary head movements were minimized using head padding. The
entire fMRI session lasted approximately 1.5 h. For functional
imaging, 28 axial slices covering the whole brain were acquired
with a blood oxygenation level dependency sensitive echo planar
imaging sequence (TR = 3 s, TA = 2.57 s, TE = 55 ms, matrix =
64 � 64; interleaved slice acquisition, slice thickness = 5 mm; no
interslice gap; flip angle = 90-, FOV = 220 � 220 mm) for a
total of 262 scans. The first 3 scans were discarded to allow for
equilibration effects. A high resolution (1 � 1 � 1 mm voxel
size, 100 slices) structural data set was acquired using a standard
3D T1-weighted FLASH sequence.
Data were preprocessed and analyzed using SPM2 analysis
(Wellcome Department of Cognitive Neurology, London, http://
www.fil.ion.ucl.ac.uk/spm). The data were first slice-scan-time
corrected by resampling the time course with linear interpolation so
that each voxel in a given volume represents the signal at the same
point in time. Afterwards, the data were motion corrected. No
individual run had more than half a voxel maximum displacement
in x-, y-, and z-plane. Images were normalized using a trilinear
interpolation method to match the anatomical images with the
Montreal Neurological Institute (MNI) template (Evans et al.,
1993). Functional volumes were spatially smoothed with a 9 mm
full width at half maximum isotropic Gaussian kernel.
The event-related activation due to each trial type (words and
symbol strings) was modeled with the standard SPM hemodynamic
response function. Events were contrasted against rest blocks
including noise, no noise breaks, and null events. Global scaling
was performed to remove global signal drifts across individual
time-series. In addition, a high-pass filter with a cut-off period of
320 s was used. Activated brain structures were identified by
transforming the MNI coordinate system of SPM2 into the
standard brain atlas of Talairach and Tournoux (Talairach and
Tournoux, 1988; Evans et al., 1993).
Statistical fMRI analyses
Condition and group analyses were conducted with random-
effect t tests using the individual contrast images smoothed at 9
mm. Statistical contrasts were made by using the averaged intensity
of voxels in the t statistic, and statistical parametric maps of t values
(SPM {t} maps) were generated. To minimize false positives and
false negatives, P values were corrected for multiple comparisons
using the family wise error (FWE) correction.
Areas activated by visual word or symbol string processing
were determined by contrasting each condition against baseline.
Clusters (k � 10) including voxels exceeding P < 0.01 were

S. Brem et al. / NeuroImage 29 (2006) 822–837 827
considered to show significant activations. Word- or symbol
string-specific activation was computed by the contrast words–
symbol strings and symbol strings–words, respectively. A P <
0.05 and a k � 10 were used to determine significantly activated
areas in these t tests. To investigate differences in the global
activation patterns between adults and adolescents, a minimal
cluster size of k � 10, and a false discovery rate (FDR) corrected
P < 0.1 indicated a trend (Genovese et al., 2002).
Region of interest (ROI) analyses
Five bilateral spherical (radius = 6 mm) ROIs were chosen
to examine the late maturation of basic and word-specific visual
processing areas more closely. The ROIs covered the putative
VWFA of the fusiform gyrus and adjacent areas along an
anterior–posterior axes (Fig. 3): ROI 1 (TC: T42, �30, �15),
ROI 2 (TC: T42, �41, �13), ROI 3 (=VFWA proper, TC: T42,�53, �12), ROI 4 (TC: T42, �67, �12), and ROI 5 (TC: T42,�78, �8). Specifically, ROI 3 represented the center of the
putative VWFA as described (Cohen et al., 2000) in the
midfusiform gyrus. The individual percent signal change values
in these ROIs were computed using MARSBAR v0.37 (Brett et
al., 2002) on unsmoothed data and used for statistical analyses.
As with the ERP analysis, a MANOVA with within-subject
factors: condition (words, symbol strings), hemisphere (left,
right), ROI (ROI 1, 2, 3, 4, 5), and the between-subject factor
age (adults, adolescents) was computed. Correlations of word-
specific activation in each ROI with N1 microstates were
computed to investigate the relation between activity in the left
fusiform gyrus and N1 in the whole sample. Additionally,
correlations between pseudoword reading performance (accuracy
and speed) and word-specific activity in the ROIs were assessed.
For all statistical analyses, only significant results (P < 0.05) or
trends of specific interest are reported. The main group compar-
isons were also computed using only a subgroup of older adults
(24.1–30.8 years, mean 26.6 years) matching the group of
adolescents in size (n = 13) to enlarge the age difference between
the groups. Results of these additional ‘‘analyses with increased
age separation’’ are reported only, when they differed regarding the
significance level from the main analyses.
Behavioral results
The overall accuracy (average: 98%) and accuracy to target
stimuli were high (average: 94%) in both conditions (average target
accuracy: words = 98.2%; symbol strings = 89.4%; percentage of
subjects with 100% target accuracy in both sessions for words (n =
19; 61.4%) and symbol strings (n = 2; 6.4%), respectively) and both
groups (average target accuracy: adults = 97.9%; adolescents =
87.4%). Accuracy and reaction time (average reaction times adults:
words = 526 ms, symbol strings = 536 ms; adolescents: words = 526
ms, symbol strings = 548 ms) did not differ between (i) groups
(adults and adolescents), (ii) sessions (EEG, fMRI), or (iii) whether
the subjects performed the task for the first or the second time
(influence of task repetition). Repeated words were detected more
accurately (F(1,29) = 72.46, P < 0.001) than repeated symbol
strings. The performance in the pseudoword reading task did not
differ between adults and adolescents (pseudoword reading speed in
syllables/minute: 185.5 adults; 187.6 adolescents). Accuracy and
reading speed were correlated in this task (r = 0.43, P < 0.05).
ERP results
Amplitudes of P1 and N1
The multivariate GFP analysis including all three segments (P1,
early N1, late N1) and both conditions (words, symbol strings)
revealed a main effect of age (F(1,29) = 9.9 P < 0.01), an
interaction for segment and condition (F(2,28) = 7.84, P < 0.01),
and a segment � condition � age interaction (F(2,28) = 7.34, P <
0.01). Curves of GFP are illustrated in Fig. 2, the corresponding
maps of the N1 microstates in Fig. 4.
P1 (82–131 ms): Analyses of GFP amplitudes in this segment
revealed a condition main effect (GFP F(1,29) = 5.44, P < 0.05)
indicating larger P1 amplitudes for symbol strings in the GFP.
When tested with increased age separation, this condition main
effect was replaced by an age main effect (F(1,24) = 4.39, P <
0.05) indicating higher GFP amplitudes for adolescents.
Early N1 (132–182 ms): No significant effects of age or
condition were found in the GFP.
Late N1 (183–256 ms): The GFP indicated that the late N1
(Figs. 2–4) was more pronounced to words than to symbol strings
(GFP F(1,29) = 11.02, P < 0.01). The late N1 was larger for
adolescents than for adults (GFP F(1,29) = 15.77, P < 0.001). The
interaction of condition and age (GFP F(1,29) = 9.63, P < 0.01)
finally revealed that the difference between the conditions (words,
symbol strings) was more pronounced in adolescents than in
adults, thereby showing condition-specific age effects.
Map latency
Neither P1 nor N1 latencies showed significant main effects of
condition. A main effect of age (F(1,24) = 5.45, P < 0.05), showing
slower latencies for adolescents than adults, was only detected in the N1
latency range by increasing the age separation of the groups.A significant
interaction of condition and age for the N1 latency (F(1,29) = 6.14, P <
0.05; increased age separation: F(1,24) = 8.17, P < 0.01) indicated that
age had a differential effect on words and symbol strings. Post hoc t tests
revealed that, with age, the N1 latency became significantly faster for
words (P < 0.05) but not for symbol strings.
Topographical analyses (TANOVA)
While the word- and symbol string-related scalp topographies
differed in both groups in both N1 microstates (adults and
adolescents both: early N1, P < 0.001, late N1: P < 0.001), only
the P1 microstate of adults differed topographically between the
conditions (P < 0.05). The scalp topography (Fig. 3) of the P1
changed with age for symbol strings (P < 0.05) but not for words.
No topographic differences were found in the early N1 segment,
but the late N1 again showed topographic differences (P < 0.05 for
symbol strings) between adults and adolescents. An overview over
changing map topographies and strengths 50–270 ms following
stimulus presentation is given by Fig. 3.
N1 source localization with LORETA
LORETA sources (P < 0.01) for word-specific activations
(words–symbol strings) of the early and late N1 are illustrated
in Fig. 4 for each group separately. The overall maximum of
the word-specific early N1 in adolescents was located in the left
posterior middle temporal gyrus (BA37: TC �52, �60, 1) and

Fig. 3. Map series during word and symbol string processing 55–270 ms following stimulus presentation. The four top rows illustrate map topographies (AV) forboth groups and each condition separately. Rows 5 and 6 depict topographic differences between words and symbol strings in the adult and adolescent groups
(colored t values correspond to a P < 0.01 in both groups) which are most pronounced in the N1 interval. The bottom rows illustrate the subtle topographical
differences between the age groups for either word or symbol string processing (colored t values correspond to a P < 0.01 in both conditions). This illustration
also clarifies that the differences between conditions which start at the end of the P1 segment may be attributed to the beginning of the N1 effect.
S. Brem et al. / NeuroImage 29 (2006) 822–837828
extended to the superior temporal gyrus. An additional
maximum was found in the right hemispheric posterior middle
temporal gyrus. No region in the late N1 of adolescents reached
a significance level of P < 0.01. Less significant sources (P <
0.05), however, were found in the left fusiform gyrus (BA 37),
left insula (BA 13), and bilateral medial frontal gyri (BA 10).
The focus of activation in the word-specific early N1 of adults
was also localized in the left superior temporal gyrus (BA 39:
TC 52, �53, 8). This source was blurred over regions adjacent
to the temporal–parietal–occipital junction in the left hemi-
sphere such as middle temporal gyrus, inferior temporal gyrus,
superior occipital gyrus, middle occipital gyrus, angular gyrus,
cuneus, and superior parietal lobule. For the adults’ late N1, the
word-specific global maximum extended from the left para-
hippocampal gyrus (BA 36: TC �38, �25, �13) to fusiform,
infero-temporal, and middle-temporal gyri.
fMRI results
To investigate the neural systems involved in visual word or
symbol string processing, the brain activity for each stimulus type

Fig. 4. Maps of the early and late N1 for words (first row), symbol strings (second row), and topographical differences between the two conditions (words–
symbol strings, scaled to GFP = 1; third row). Maps of adolescents are illustrated on the left side, maps of adults on the right side. Reduced negativity to symbol
strings at left occipito-temporal electrode sites starts in the early N1 for both groups. LORETA (bottom row) of the corrected, paired statistical comparisons of
words and symbol strings. While the word-specific early N1 sources extended over the temporal–parietal–occipital junction in the left hemisphere, the late N1
sources were focused near the left fusiform gyrus.
S. Brem et al. / NeuroImage 29 (2006) 822–837 829
(words, symbol strings) was contrasted against baseline (Table 1).
Areas activated by either the word or the symbol string condition
as well as word- (words–symbols) and symbol string- (symbol
strings–words) specific activations are illustrated in Fig. 6 and
summarized in Table 2.
Comparing adults and adolescents
No significant differences between adults and adolescents were
found regarding their global activation pattern. This held for words,
symbol strings, and their differences. Only one area in the right
superior temporal gyrus (BA 22: TC 56, 5, 9; P < 0.1 (FDR
corrected)) tended to be more active in adults than in adolescents
for words. The activation tables (1 + 2) and Fig. 6 thus show
pooled activation over all 31 subjects.
Word activation
Consistent with previous studies (Petersen et al., 1990; Price
et al., 1996; Cohen et al., 2000; Dehaene et al., 2002;
Turkeltaub et al., 2003; Kronbichler et al., 2004), the activation
foci for words vs. baseline (Table 1) were found in left
posterior temporal areas extending from the fusiform gyrus to
the middle and inferior occipital gyri. Activation in the frontal
lobe showed maxima in the left superior, middle, and inferior
frontal gyri. Two maxima were in the left middle temporal
gyrus. In the right hemisphere, words activated the cingulate
gyrus, the superior temporal gyrus, the inferior frontal gyrus,
and middle and inferior occipital gyri. Word-specific activation
foci were determined by contrasting words with symbol strings
(Table 2). Such word-specific activations were only found in
the left hemisphere and included the inferior and superior
frontal gyri, the middle and superior temporal gyri, and the
precuneus.
Symbol string activation
We found a more bilateral activation pattern for symbol
strings compared to words (Table 1) as already described in
previous studies (Price et al., 1996; Tagamets et al., 2000). The
overall posterior maximum included the bilateral middle and
inferior occipital and inferior temporal gyri. Other maxima
specific for symbol string processing were found in left and
right inferior parietal lobule extending into the superior parietal
lobule/precuneus, respectively. The frontal lobe maxima
included the left superior and medial frontal gyri, bilateral
middle frontal gyri, and the right inferior frontal gyrus. When
contrasting symbol strings to words (Table 2), the precuneus,

Table 1
Activations for words (left) and symbol strings (right) vs. baseline at P < 0.01 (FWE corrected), k � 10, pooled over all 31 subjects
Words vs. baseline Symbol strings vs. baseline
Cluster size t value Z score x y z Location BA Cluster size t value Z score x y z Location BA
Left hemisphere
590 13.4 7.6 �42 �62 �7 FFG 37 671 16.4 >8 �48 �79 1 MOG 19
11.3 7 �45 �47 �8 FFG 37 15.1 >8 �42 �70 �7 IOG 19
10.8 6.9 �42 �73 �4 IOG 19 11.7 7.1 �39 �87 �12 IOG 18
69 10.0 6.6 �3 11 55 SFG 6 351 10.1 6.6 �33 �50 55 IPL 40
8.4 6 �6 3 58 MFG 6 9.94 6.6 �42 �38 49 IPL 40
354 9.8 6.5 �45 26 �14 IFG 47 9.8 6.5 �27 �56 50 PreCu 7
9.5 6.4 �50 29 �6 IFG 47 118 10.0 6.6 �3 14 49 SFG 6
9.4 6.4 �53 21 7 IFG 45 7.9 5.8 �6 3 61 MeFG 6
17 7.7 5.7 �56 �24 �9 MTG 21 18 8.1 5.8 �24 �68 31 PreCu 7
7.4 5.6 �56 �18 �14 MTG 21 23 7.4 5.5 �48 7 33 MFG 9
Right hemisphere
63 8.3 5.9 21 �34 24 CG 31 601 14.6 7.8 45 �67 �2 ITG 37
28 7.9 5.8 42 �38 7 STG 41 14.3 7.8 39 �87 7 MOG 19
12 7.8 5.7 48 4 27 IFG 9 12.9 7.4 42 �76 �4 IOG 19
36 7.8 5.7 39 �79 �4 IOG 19 366 10.9 6.9 48 �33 46 IPL 40
7.7 5.7 39 �90 2 MOG 18 9.4 6.4 33 �44 46 IPL 40
10 7.7 5.7 45 �67 3 MOG 37 9.1 6.3 30 �53 41 SPL 7
87 9.2 6.3 53 10 33 IFG 9
10 8.0 5.8 42 36 23 MFG 46
26 7.8 5.7 30 2 50 MFG 6
Abbreviations: x, y, z in Talairach coordinates; BA, Brodman Area; SFG, Superior frontal gyrus; MFG, Middle frontal gyrus; MeFG, Medial frontal
gyrus; IFG, Inferior frontal gyrus; STG, Superior temporal gyrus; MTG, Middle temporal gyrus; ITG, Inferior temporal gyrus; SPL, Superior parietal
lobule; IPL, Inferior parietal lobule; MOG, Middle occipital gyrus; IOG, Inferior occipital gyrus; PreCu, Precuneus; FFG, Fusiform gyrus; CG, Cingulate
gyrus.
S. Brem et al. / NeuroImage 29 (2006) 822–837830
bilateral superior and inferior parietal lobules, the right
postcentral gyrus, the bilateral middle occipital gyri including
parts of the middle temporal, and the left fusiform gyrus
exhibited more pronounced activity.
Table 2
Activations for the contrasts words–symbol strings (left) and symbol strings–wor
Words–symbol strings S
Cluster size t value Z score x y z Location BA C
Left hemisphere
97 9.6 6.5 �42 25 �16 IFG 47 3
8.7 6.1 �53 24 4 IFG 45
7.5 5.6 �50 32 1 IFG 47
200 9.4 6.4 �53 �46 5 MTG 22 1
6.0 4.9 �56 �27 �9 MTG 21
9.1 6.3 �48 �60 28 STG 39
8.2 5.9 �42 �71 42 PreCu 19
20 6.9 5.3 �18 31 45 SFG 8
6.4 5.0 �15 40 45 SFG 8
Right hemisphere
2
1
9
1
Abbreviations: x, y, z in Talairach coordinates; BA, Brodman Area; SFG, Superio
MTG, Middle temporal gyrus; SPL, Superior parietal lobule; IPL, Inferior parietal
gyrus; FFG, Fusiform gyrus.
Region of interest analyses
The MANOVA of the five ROIs revealed no significant
multivariate age-related differences. However, analyses with
ds (right) at P < 0.05 (FWe corrected), k � 10, pooled over all 31 subjects
ymbol strings–words
luster size t value Z score x y z Location BA
07 10.0 6.6 �9 �73 56 PreCu 7
9.2 6.3 �18 �64 53 SPL 7
9.1 6.3 �45 �38 54 IPL 40
30 10.0 6.6 �33 �84 12 MOG 18
7.8 5.7 �48 �75 12 MTG 39
21 6.7 5.2 �33 �65 �17 FFG 19
23 6.7 5.1 �45 �67 �7 MOG 37
93 12.0 7.2 18 �67 53 SPL 7
8.0 5.8 27 �68 39 PreCu 7
06 9.0 6.2 48 �33 49 PoCG 40
8.0 5.8 39 �38 52 IPL 40
7 8.9 6.2 36 �78 23 MTG 19
8.5 6.0 36 �81 10 MOG 19
7 7.0 5.3 48 �59 �5 MOG 19
r frontal gyrus; IFG, Inferior frontal gyrus; STG, Superior temporal gyrus;
lobule; MOG, Middle occipital gyrus; PreCu, Precuneus; PoCG, Postcentral

Fig. 5. Percent signal change in each of the five bilateral ROIs in the occipito-temporal cortex, located on an anterior–posterior axis. On the top left hand corner
of the right chart, the projection of the 5 ROIs on a single subject’s T1 image is illustrated. ROI 1 (dark gray) was located most anterior, ROI 5 (light gray) most
posterior in the occipito-temporal cortex. Words (black) and symbol strings (gray) are illustrated separately. ROI 3 corresponded to the center of the VWFA
described in previous studies.
S. Brem et al. / NeuroImage 29 (2006) 822–837 831
increased age separation showed an age main effect (F(1,24) =
9.82, P < 0.01), indicating higher signal changes in adolescents
than adults. Overall magnitude of activation in the ROIs was larger
for symbol strings than for words (F(1,29) = 17.97, P < 0.001).
The ROIs differed considerably in their activation (F(4,26) =
24.68, P < 0.001), with more posterior ROIs having larger signal
changes than anterior ROIs (Fig. 5). The amount of differential
signal change was also influenced by the location of the ROIs on
the anterior–posterior axes (condition � ROI: F(4,26) = 13.1, P <
0.001). Post hoc t tests revealed that ROIs located anterior in the
left occipito-temporal gyrus showed an enhanced signal change for
words (ROIs 1 + 2 both P < 0.05), while the opposite was observed
Fig. 6. fMRI data of words and symbol strings pooled over all 31 subjects.
Condition vs. baseline effects (top) shown for FWE corrected random effect
analyses ( P < 0.01, k � 10). Paired t tests between words and symbol
strings (bottom row) illustrate areas specifically activated for each condition
separately (FWE corrected P < 0.05, k � 10).
for the two posterior ROIs (ROI 4: P < 0.001; ROI 5: P < 0.01).
No difference between the signal change of words and symbol
strings was detected in the center of the VFWA (ROI 3). In the
right hemisphere, the middle and posterior ROIs exhibited higher
signal change for symbol strings than words (ROI 3: P < 0.01, ROI
4: P < 0.001, ROI 5: P < 0.05).
Correlation of N1 amplitudes and fMRI activations
Comparing ERP and fMRI data, word activity in the ROI of the
VWFA proper correlated significantly with GFP map amplitude in
the late N1 segment (late N1 r = 0.41, P < 0.05, see Fig. 7A).
Correlation of reading performance with N1 amplitudes LORETA
VOI and fMRI activation
As illustrated in Fig. 7B, reading accuracy but not reading
speed correlated negatively with the word-specific late N1
amplitude (difference late N1: words–symbol strings; for GFP
r = �0.39, P < 0.05). The correlation of pseudoword reading
accuracy and VOI activity (r = �0.36, P < 0.05) (Fig. 7D)
furthermore indicated that lower reading scores were related to
diminished activity in the late N1 microstate.
Percent signal change in ROI 2 of the word activity correlated
significantly with reading speed in the pseudoword reading test
(r = �0.44, P < 0.05 Fig. 7C), indicating that slow reading was
associated with low signal change in ROI 2.
Discussion
This multimodal study focused on late development of visual
word processing by using ERP, fMRI, and performance measures
and investigated whether specialization of the reading system
continues to develop from adolescence into adulthood. In keeping
with our predictions, the reading network in adolescents was found
to be already well established and functionally equivalent to the
reading network of adults in typical tests. These results were
confirmed by the equal reading accuracy and speed of both groups
in our pseudoword reading test and are consistent with normative
data. The reading test results were paralleled by the performance in
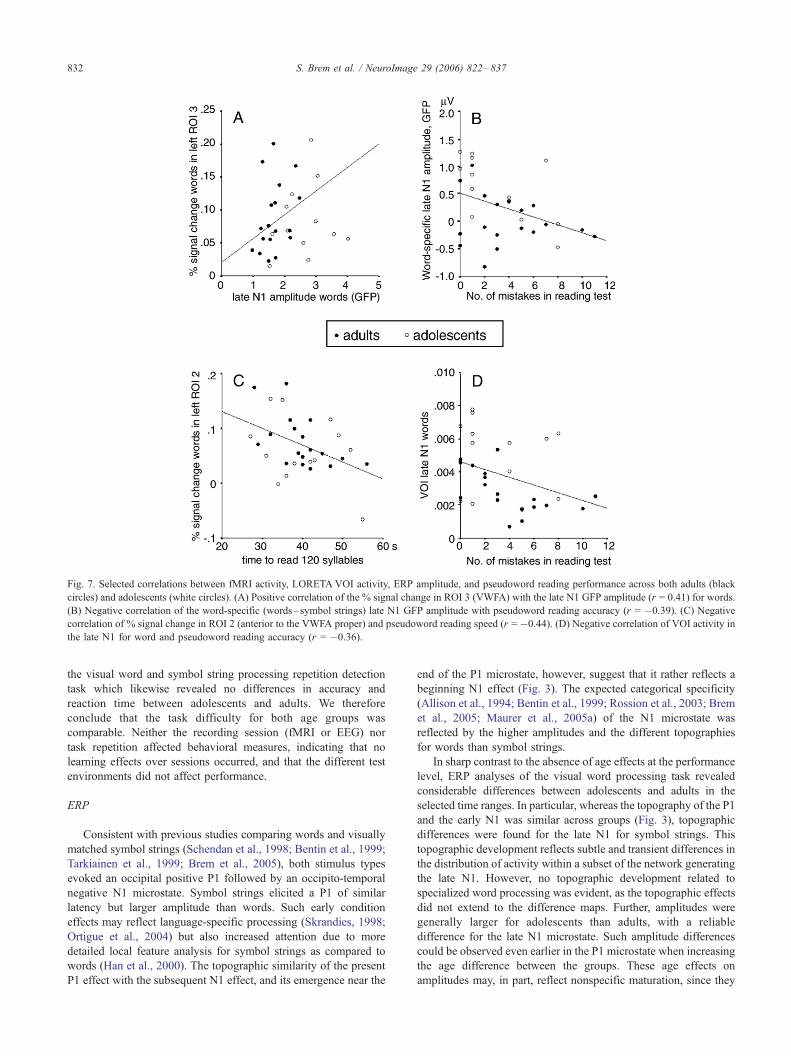
Fig. 7. Selected correlations between fMRI activity, LORETAVOI activity, ERP amplitude, and pseudoword reading performance across both adults (black
circles) and adolescents (white circles). (A) Positive correlation of the % signal change in ROI 3 (VWFA) with the late N1 GFP amplitude (r = 0.41) for words.
(B) Negative correlation of the word-specific (words–symbol strings) late N1 GFP amplitude with pseudoword reading accuracy (r = �0.39). (C) Negative
correlation of % signal change in ROI 2 (anterior to the VWFA proper) and pseudoword reading speed (r = �0.44). (D) Negative correlation of VOI activity in
the late N1 for word and pseudoword reading accuracy (r = �0.36).
S. Brem et al. / NeuroImage 29 (2006) 822–837832
the visual word and symbol string processing repetition detection
task which likewise revealed no differences in accuracy and
reaction time between adolescents and adults. We therefore
conclude that the task difficulty for both age groups was
comparable. Neither the recording session (fMRI or EEG) nor
task repetition affected behavioral measures, indicating that no
learning effects over sessions occurred, and that the different test
environments did not affect performance.
ERP
Consistent with previous studies comparing words and visually
matched symbol strings (Schendan et al., 1998; Bentin et al., 1999;
Tarkiainen et al., 1999; Brem et al., 2005), both stimulus types
evoked an occipital positive P1 followed by an occipito-temporal
negative N1 microstate. Symbol strings elicited a P1 of similar
latency but larger amplitude than words. Such early condition
effects may reflect language-specific processing (Skrandies, 1998;
Ortigue et al., 2004) but also increased attention due to more
detailed local feature analysis for symbol strings as compared to
words (Han et al., 2000). The topographic similarity of the present
P1 effect with the subsequent N1 effect, and its emergence near the
end of the P1 microstate, however, suggest that it rather reflects a
beginning N1 effect (Fig. 3). The expected categorical specificity
(Allison et al., 1994; Bentin et al., 1999; Rossion et al., 2003; Brem
et al., 2005; Maurer et al., 2005a) of the N1 microstate was
reflected by the higher amplitudes and the different topographies
for words than symbol strings.
In sharp contrast to the absence of age effects at the performance
level, ERP analyses of the visual word processing task revealed
considerable differences between adolescents and adults in the
selected time ranges. In particular, whereas the topography of the P1
and the early N1 was similar across groups (Fig. 3), topographic
differences were found for the late N1 for symbol strings. This
topographic development reflects subtle and transient differences in
the distribution of activity within a subset of the network generating
the late N1. However, no topographic development related to
specialized word processing was evident, as the topographic effects
did not extend to the difference maps. Further, amplitudes were
generally larger for adolescents than adults, with a reliable
difference for the late N1 microstate. Such amplitude differences
could be observed even earlier in the P1 microstate when increasing
the age difference between the groups. These age effects on
amplitudes may, in part, reflect nonspecific maturation, since they

S. Brem et al. / NeuroImage 29 (2006) 822–837 833
were similar for both conditions (P1), or were larger for the
condition with stronger activity (late N1). Such maturational
changes involving constant or proportional activity reductions
may be due to morphological or structural alterations of the
underlying brain regions, such as a decline in the number of
synapses. Accordingly, the P1, and particularly the late N1
microstate sources may include regions with protracted morpho-
logical maturation. Physical accounts such as increases in the
thickness or attenuation in the conductivity of the skull cannot
explain these results, as they should have affected all microstates to
a similar degree. The more pronounced developmental reduction of
the late N1 for words than symbol strings may also reflect
automation of visual word processing, considering that the N1 also
increases with discrimination demands (Vogel and Luck, 2000).
This account assumes that the categorization process needs less
attentional resources in adults than in younger subjects, probably
due to a higher grade of automation and familiarity to words.
Although simple decreasing attentional demand as a result of
reading practice and age is a likely factor, it is also arguable that
clear categorization within 200 ms should be a prerequisite for the
quality and speed of subsequent word processing and accurate
reading. This latter mechanism would favor the more pronounced
word–symbol string differences we found in the late N1, which
were associated with better reading skills, as determined by the
correlation with pseudoword reading accuracy.
Our data agree with other studies showing that development in
the late teens affects early visual processing as reflected by the P1
and the N1. Developmental studies on visual word processing
(Holcomb et al., 1992; Grossi et al., 2001) have previously reported
that P1 and N1 amplitudes diminish with age, but did not test
specifically for continued changes from adolescence to adulthood.
Such late amplitude decreases have so far only been reported for the
P1 to faces, particularly in implicit tasks (Taylor et al., 2004). While
the N170 to faces also exhibits late development, it follows a
different pattern, with prominent topographic changes preceding an
increase of occipito-temporal amplitudes after age 15 (Itier and
Taylor, 2004a,b; Taylor et al., 2004). The N1 latency changes found
herein likewise point to late development, but reveal word-specific
development. Decreasing latencies for words but not for symbol
strings were found when comparing adults and adolescents,
indicating that only specialized categorical visual word processing
on the level of the N1 continues to progress from adolescence to
adulthood. When increasing the groups’ age separation, latencies
decreased for both conditions. Still, the decrease for word latencies
remained more pronounced, and confirmed the difference in
development between the conditions. Such latency decreases of
early ERPs in development are consistent with literature on visual
processing of verbal stimuli (Holcomb et al., 1992; Grossi et al.,
2001). Postadolescent latency alterations of such low level visual
processing mechanisms have rarely been tested. Evidence for
decreasing latencies beyond childhood comes mainly from studies
investigating face development. While P1 latency accelerations
(Itier and Taylor, 2004a,b) continued until adulthood, N170
latencies reached their adult levels earlier, around age 14 (Taylor
et al., 2001, 2004). Decreasing latencies characterize maturation,
and have usually been associated with enhanced processing speed
in existing networks. Faster processing may partly be due to faster
neural transmission, more efficient connectivity, and other matura-
tional processes in the underlying networks.
The discrepancy between decreasing word N1 latencies and
less affected symbol string latencies may reflect activation of
word-specific regions with protracted maturation. Specific struc-
tural alterations beyond adolescence, such as ongoing myelina-
tion of fiber tracts and reductions in gray matter density
associated with growth (Sowell et al., 2001), have indeed been
observed in posterior temporal areas coincident with our N1
source localization. These may allow increased efficiency and
functionality in the extrastriate brain areas involved in visual
stimulus categorization and tuning for print. The discrepancy may
also be due to more cognitive factors such as the continued
practice with words but not with symbol strings due to reading.
While words may be processed faster and with less effort through
reading practice, symbol strings remain unfamiliar and more
attention demanding. We assume that ongoing explicit daily
reading training during education or implicit training through
confrontation with the immense amount of written material in
daily life drives an increase in the automation of early stage
visual categorization processes in the reading network, as
demonstrated by our ERP data. The two explanations are by
no means mutually exclusive, considering recent reports of
increasing gray matter density in posterior temporal regions after
practice (Draganski et al., 2004).
The postadolescent development observed for the P1 and the
N1 was not, however, accompanied by better performance of the
adults in either the implicit or the explicit reading tests. One may
assume that the acceleration of early processing stages allows
adults to process more information at the same time, since this time
advantage is not used for faster word processing. In that case,
adults would perform better in a multitasking experiment. Whether
the present tasks were too easy to assess subtle performance
differences between the groups, or whether reduced attentional
demand, automation of task performance, or still other aspects of
performance not tested in this study are reflected by the ERPs, thus
has to be investigated in future studies.
The different LORETA sources for the early and late part of the
N1 illustrate the progression of activation due to implicit reading
within the N1 time range in adults and adolescents (Fig. 4).
Sources for the contrast of words and symbol strings were detected
mainly in basal occipito-temporal and lateral temporal areas in
both groups in correspondence to previous localizations of N1
sources (Puce et al., 1996; Dale et al., 2000; Khateb et al., 2002).
The strongest early N1 source in both groups was located in
posterior parts of the left middle and superior temporal gyri. Only
adults’ posterior activity included low level visual processing areas
such as the striate and extrastriate cortices. The proximity of the
adolescents’ maximum to the temporal–parietal–occipital junc-
tion, however, indicated that the same process of basic visual
feature analysis was represented by the early N1 in the younger
group as well. A common ventro-temporal source of the late N1
which has been suggested to represent stimulus categorization
(Batty and Taylor, 2002) and visual tuning for print (Nobre et al.,
1994; Dehaene, 1995; Puce et al., 1996; Dale et al., 2000;
Proverbio et al., 2004; Brem et al., 2005) common to both groups
included the fusiform gyrus. These findings are in agreement with
the MEG-based source localization of visual feature analysis in
areas of the striate cortex and subsequent spreading of activation to
left occipito-temporal regions (Tarkiainen et al., 1999; Dale et al.,
2000; Salmelin et al., 2000). They also match intracranial (Allison
et al., 1994) recordings of the maximal word N1 in the occipito-
temporal cortex and fMRI-constrained results on visual word
processing (Puce et al., 1996; Dale et al., 2000) in the left ventral
occipito-temporal cortex.

S. Brem et al. / NeuroImage 29 (2006) 822–837834
fMRI
Both the common and the differential activation of words and
symbol strings followed our expectations: While word presenta-
tions evoked a more left lateralized activation pattern (Price et al.,
1996; Cohen et al., 2000; Tagamets et al., 2000; Gaillard et al.,
2001; Holland et al., 2001; Schlaggar et al., 2002; Gaillard et al.,
2003; Turkeltaub et al., 2003), the corresponding activation pattern
for symbol strings was more symmetrically distributed over both
hemispheres (Price et al., 1996; Tagamets et al., 2000). Consistent
with previous studies of visual word and false font processing
(Price et al., 1996; Tagamets et al., 2000; Turkeltaub et al., 2003),
the activated network comprised striate and extrastriate areas in the
posterior occipital and temporal cortex including the VWFA of the
left fusiform gyrus. The maxima of activation in the brain volume
for words were found in the left hemispheric VFWA of the
fusiform gyrus. The main focus of activation for symbol strings
was localized close to the posterior focus of word-related activation
in the middle and inferior occipital gyri.
The direct contrasts revealed multiple areas specifically involved
either in word or symbol string processing. Words triggered implicit
reading even though no linguistic decisions were required to perform
the task (Price et al., 1996; Tagamets et al., 2000; Turkeltaub et al.,
2003), as shown by the involvement of higher level language areas
only for words. In contrast, symbol strings evoked more activity in
the extrastriate areas of the occipital lobe implicated in low level
visual feature analysis and in parietal regions associated with
enhanced working memory involvement (Becker and Morris, 1999;
Becker et al., 1999; Turkeltaub et al., 2003). These results parallel
the performance advantage for words found in our task and
correspond to previous findings (Tagamets et al., 2000).
The networks activated in the brain during implicit reading or
symbol string processing were the same in adults and adolescents,
though the foci of activation in the clusters were not always at
exactly the same location. Direct comparisons revealed only
nonsignificant differences between the two groups outside the
typical reading network.
Systematic investigation revealed a posterior–anterior gradient
of increasing word specificity in the left hemisphere. The ROIs
anterior to the putative VWFA revealed more signal change for
words compared to symbol strings. In contrast, the posterior ROIs
were more activated by symbol strings than by words while the
VWFA proper did not distinguish between the two conditions in
line with previous studies (Price et al., 1996; Tagamets et al.,
2000). In most other studies reporting increased activity for words
in the VWFA proper, words were compared with either pictures
(Gauthier et al., 2000; Hasson et al., 2002) or checkerboards
(Cohen et al., 2000), which differ in several important visual
aspects from letter strings. Similarly to previous studies (Cohen
and Dehaene, 2004; Cohen et al., 2000, 2002; Dehaene et al.,
2002; McCandliss et al., 2003; Kronbichler et al., 2004), also in
our task, words activated a left posterior occipito-temporal network
in adults and adolescents including an activation maximum within
the VWFA. However, we found that these areas with maximal
activation were neither exclusively activated for words, nor reliably
distinguished between words and symbol strings, as previously
reported (Tagamets et al., 2000; Turkeltaub et al., 2003). Cohen et
al. (2002) have argued that the higher demands of symbol-string
processing may induce a widespread increase of visual activation
masking a preferential VWFA activation for words. The left
anterior–posterior gradient of word-specificity suggests that
increasing symbol–string processing demands should also lead
to an apparent anterior shift of word-specific processing, while
using less demanding control stimuli such as checkerboards should
have the opposite effect.
Contrary to our expectations based on the age effects of the late
N1, no word-specific age effects were observed in any of the
occipito-temporal ROIs, and nonspecific age effects were only
detected after increasing the age separation of the groups. The
higher signal changes in the younger subjects, independent of
condition and location of ROI within the occipito-temporal cortex
pointed to protracted development. This decline in the amount of
signal change parallels the N1 amplitude decreases with its basal
occipito-temporal lobe sources, and replicates the finding that age-
related decreases in activity occur mainly in posterior brain regions
(Brown et al., 2005). Direct support for the relation of ERP activity
in the N1 time range and fMRI activity in the VWFAwas provided
by their correlation. Similarly to ERP measures, the signal change
in a partly word-specific ROI anterior to the VWFA correlated with
reading performance. We therefore conclude that ERP N1 and
fMRI activation in the VWFA represents different measures of the
same process. The lack of word-specific changes with age in the
local fMRI analysis also supports our conclusion that the spatial
distribution of the reading network is fully established in
adolescence.
Conclusion
In summary, late development of the visual word processing
systemwas investigated using ERP and fMRI with a visual word and
symbol string processing task. Data analyses mainly focused on the
P1 and N1 ERP microstates, the global activation pattern of adults
and adolescents, and on functional activity in specific parts of the
occipito-temporal cortex. Commonalities as well as discrepancies
regarding late development and condition effects were observed
when comparing fMRI and ERP results. The results of both
techniques indicated that the topography of specialized word
processing, as reflected by the differential fMRI activations and
the ERP difference map topographies, is already fully established in
the adolescents. They also converged regarding the enhanced
occipital activation and increased P1 amplitude to symbol strings.
Both techniques thus suggest more intensive low level feature
processing in symbol strings compared to words. ERP and fMRI
furthermore clearly distinguished between word and symbol string
processing either in strength or scalp topography of the P1 and N1
microstates or in the global metabolic activation pattern. Focused
analyses of the lateral occipito-temporal gyrus revealed an anterior–
posterior gradient of decreasing activation specifically to words and
an increasing activation to symbol strings. This finding is in
agreement with the localization of the word-specific late N1 close
to the VFWA and confirms the close relationship between word N1
and metabolic activity in the VFWA. Behavioral performance and
reading accuracy were comparable in adults and adolescents, in line
with our fMRI data and with the difference in ERPs. Despite this,
strong ERP evidence for late development of the activation
dynamics within the reading network indicated both condition
nonspecific maturational changes and condition-specific age effects.
Maturational changes were implicated by the consistent reduction of
late N1 activity to both words and symbol strings, and was paralleled
by decreased signal changes in occipito-temporal areas in adults.
The lack of such reductions in the early N1 indicates a high temporal

S. Brem et al. / NeuroImage 29 (2006) 822–837 835
specificity of this developmental effect to neural activity within
occipito-temporal areas as reflected by late N1 sources. Protracted
morphologic and structural maturation may contribute to these
nonspecific age effects, as proportional amplitude reductions are
consistent with decreases in synaptic density or connectivity. The
high temporal specificity of the developmental ERP effects may
explain why only subtle developmental changes in the fMRI data
were observed.
N1 latency decreases only for words represent a condition-
specific age effect. It identifies postadolescent development within
the specialized visual word processing network by the LORETA
source analysis. Shorter latencies may reflect faster signal trans-
mission due to ongoing myelination at the neural level, and more
proficient and faster word processing at the cognitive level. The
finding suggests that stimulus categorization and word recognition
become more efficient and automatic with age and reading
experience. They also indicate that neural markers of specialized
visual word processing at the N1 level reflect the quality of reading.
In conclusion, this study contributes to the understanding of
developmental processes in the reading system. While confirming
the hypothesis that the visual word processing network is already
established in adolescence regarding its spatial organization, we
also show that within this network further development takes place
from adolescence to adulthood.
Acknowledgments
Special thanks go to the group of Prof. Dr. P. Bosiger at the
Institute for Biomedical Engineering, University and ETH Zurich
and to the group of Dr. S. S. Kollias at the Institute of Neu-
roradiology, University Hospital Zurich, for providing fMRI
scanner time and for their kind support during fMRI recordings.
The authors also gratefully thank Dr. Th. Koenig who provided the
ICA code for the Brain Vision Analyser software. Finally, sincere
thanks to all our subjects and their families for their participation.
This study was funded by the NCCR on Neural Plasticity and
Repair.
References
Allison, T., McCarthy, G., Nobre, A., Puce, A., Belger, A., 1994. Human
extrastriate visual cortex and the perception of faces, words, numbers,
and colors. Cereb. Cortex 4 (5), 544–554.
Batty, M., Taylor, M.J., 2002. Visual categorization during childhood: an
ERP study. Psychophysiology 39 (4), 482–490.
Becker, J.T., Morris, R.G., 1999. Working memory(s). Brain Cogn. 41 (1),
1–8.
Becker, J.T., MacAndrew, D.K., Fiez, J.A., 1999. A comment on the
functional localization of the phonological storage subsystem of
working memory. Brain Cogn. 41 (1), 27–38.
Bentin, S., Mouchetant-Rostaing, Y., Giard, M.H., Echallier, J.F., Pernier,
J., 1999. ERP manifestations of processing printed words at different
psycholinguistic levels: time course and scalp distribution. J. Cogn.
Neurosci. 11 (3), 235–260.
Booth, J.R., Burman, D.D., Van Santen, F.W., Harasaki, Y., Gitelman, D.R.,
Parrish, T.B., Marsel Mesulam, M.M., 2001. The development of
specialized brain systems in reading and oral-language. Neuropsychol.
Dev. Cogn., Sect. C, Child Neuropsychol. 7 (3), 119–141.
Brandeis, D., Naylor, H., Halliday, R., Callaway, E., Yano, L., 1992.
Scopolamine effects on visual information processing, attention, and
event-related potential map latencies. Psychophysiology 29 (3),
315–336.
Brandeis, D., Lehmann, D., Michel, C.M., Mingrone, W., 1995. Mapping
event-related brain potential microstates to sentence endings. Brain
Topogr. 8 (2), 145–159.
Brem, S., Lang-Dullenkopf, A., Maurer, U., Halder, P., Bucher, K.,
Brandeis, D., 2005. Neurophysiological signs of rapidly emerging
visual expertise for symbol strings. NeuroReport 16 (1), 45–48.
Brett, M., Anton, J.-L., Valabregue, R., Poline, J.-B., 2002. Region of
Interest Analysis Using an SPM Toolbox. (Abstract).
Brown, T.T., Lugar, H.M., Coalson, R.S., Miezin, F.M., Petersen, S.E.,
Schlaggar, B.L., 2005. Developmental changes in human cerebral
functional organization for word generation. Cereb. Cortex 15 (3),
275–290.
Cohen, L., Dehaene, S., 2004. Specialization within the ventral stream: the
case for the visual word form area. NeuroImage 22 (1), 466–476.
Cohen, L., Dehaene, S., Naccache, L., Lehericy, S., Dehaene-Lambertz,
G., Henaff, M.A., Michel, F., 2000. The visual word form area:
spatial and temporal characterization of an initial stage of reading in
normal subjects and posterior split-brain patients. Brain 123 (Pt. 2),
291–307.
Cohen, L., Lehericy, S., Chochon, F., Lemer, C., Rivaud, S., Dehaene, S.,
2002. Language-specific tuning of visual cortex? Functional properties
of the visual word form area. Brain 125 (Pt. 5), 1054–1069.
Dale, A.M., Liu, A.K., Fischl, B.R., Buckner, R.L., Belliveau, J.W.,
Lewine, J.D., Halgren, E., 2000. Dynamic statistical parametric
mapping: combining fMRI and MEG for high-resolution imaging of
cortical activity. Neuron 26 (1), 55–67.
Damasio, A.R., Damasio, H., 1983. The anatomic basis of pure alexia.
Neurology 33 (12), 1573–1583.
Dehaene, S., 1995. Electrophysiological evidence for category-specific
word processing in the normal human brain. NeuroReport 6 (16),
2153–2157.
Dehaene, S., Le Clec, H.G., Poline, J.B., Le Bihan, D., Cohen, L., 2002.
The visual word form area: a prelexical representation of visual words
in the fusiform gyrus. NeuroReport 13 (3), 321–325.
Dejerine, J., 1892. Contribution a l’etude anatomoclinique et clinique des
differentes varietes de cecite verbale. Mem. Soc. Biol. 4, 61–92.
Demb, J.B., Boynton, G.M., Heeger, D.J., 1998. Functional magnetic
resonance imaging of early visual pathways in dyslexia. J. Neurosci. 18
(17), 6939–6951.
Demonet, J.F., Chollet, F., Ramsay, S., Cardebat, D., Nespoulous, J.L.,
Wise, R., Rascol, A., Frackowiak, R., 1992. The anatomy of
phonological and semantic processing in normal subjects. Brain 115
(Pt. 6), 1753–1768.
Demonet, J.F., Price, C., Wise, R., Frackowiak, R.S., 1994. Differential
activation of right and left posterior sylvian regions by semantic and
phonological tasks: a positron-emission tomography study in normal
human subjects. Neurosci. Lett. 182 (1), 25–28.
Demonet, J.F., Thierry, G., Cardebat, D., 2005. Renewal of the neuro-
physiology of language: functional neuroimaging. Physiol. Rev. 85 (1),
49–95.
Dhond, R.P., Buckner, R.L., Dale, A.M., Marinkovic, K., Halgren, E.,
2001. Spatiotemporal maps of brain activity underlying word generation
and their modification during repetition priming. J. Neurosci. 21 (10),
3564–3571.
Draganski, B., Gaser, C., Busch, V., Schuierer, G., Bogdahn, U., May, A.,
2004. Neuroplasticity: changes in grey matter induced by training.
Nature 427 (6972), 311–312.
Evans, A.C., Collins, D.L., Mills, S.R., Brown, E.D., Kelly, R.L., Peters,
T.M., 1993. 3D statistical neuroanatomical models from 305 MRI
volumes. Proc. IEEE-Nuclear Science Symposium and Medical Imag-
ing Conference.
Gaillard, W.D., Hertz-Pannier, L., Mott, S.H., Barnett, A.S., LeBihan, D.,
Theodore, W.H., 2000. Functional anatomy of cognitive development:
fMRI of verbal fluency in children and adults. Neurology 54 (1),
180–185.
Gaillard, W.D., Pugliese, M., Grandin, C.B., Braniecki, S.H., Kondapaneni,
P., Hunter, K., Xu, B., Petrella, J.R., Balsamo, L., Basso, G., 2001.

S. Brem et al. / NeuroImage 29 (2006) 822–837836
Cortical localization of reading in normal children: an fMRI language
study. Neurology 57 (1), 47–54.
Gaillard, W.D., Sachs, B.C., Whitnah, J.R., Ahmad, Z., Balsamo, L.M.,
Petrella, J.R., Braniecki, S.H., McKinney, C.M., Hunter, K., Xu, B.,
Grandin, C.B., 2003. Developmental aspects of language processing:
fMRI of verbal fluency in children and adults. Hum. Brain Mapp. 18
(3), 176–185.
Gauthier, I., Tarr, M.J., Moylan, J., Skudlarski, P., Gore, J.C., Anderson,
A.W., 2000. The fusiform face area is part of a network that processes
faces at the individual level. J. Cogn. Neurosci. 12 (3), 495–504.
Genovese, C.R., Lazar, N.A., Nichols, T., 2002. Thresholding of statistical
maps in functional neuroimaging using the false discovery rate.
NeuroImage 15 (4), 870–878.
Giedd, J.N., 2004. Structural magnetic resonance imaging of the adolescent
brain. Ann. N. Y. Acad. Sci. 1021, 77–85.
Giedd, J.N., Blumenthal, J., Jeffries, N.O., Castellanos, F.X., Liu, H.,
Zijdenbos, A., Paus, T., Evans, A.C., Rapoport, J.L., 1999. Brain
development during childhood and adolescence: a longitudinal MRI
study. Nat. Neurosci. 2 (10), 861–863.
Gottselig, J.M., Brandeis, D., Hofer-Tinguely, G., Borbely, A.A., Acher-
mann, P., 2004. Human central auditory plasticity associated with tone
sequence learning. Learn. Mem. 11 (2), 162–171.
Grossi, G., Coch, D., Coffey-Corina, S., Holcomb, P.J., Neville, H.J., 2001.
Phonological processing in visual rhyming: a developmental erp study.
J. Cogn. Neurosci. 13 (5), 610–625.
Han, S., Liu, W., Yund, E.W., Woods, D.L., 2000. Interactions between
spatial attention and global/local feature selection: an ERP study.
NeuroReport 11 (12), 2753–2758.
Hasson, U., Levy, I., Behrmann, M., Hendler, T., Malach, R., 2002.
Eccentricity bias as an organizing principle for human high-order object
areas. Neuron 34 (3), 479–490.
Hauk, O., Pulvermuller, F., 2004a. Effects of word length and fre-
quency on the human event-related potential. Clin. Neurophysiol.
115 (5), 1090–1103.
Hauk, O., Pulvermuller, F., 2004b. Neurophysiological distinction of action
words in the fronto-central cortex. Hum. Brain Mapp. 21 (3), 191–201.
Helenius, P., Tarkiainen, A., Cornelissen, P., Hansen, P.C., Salmelin, R.,
1999. Dissociation of normal feature analysis and deficient
processing of letter-strings in dyslexic adults. Cereb. Cortex 9 (5),
476–483.
Holcomb, P.J., Coffey, S.A., Neville, H.J., 1992. Visual and auditory
sentence processing: a developmental analysis using event-related brain
potentials. Dev. Neuropsychol. 8 (2 and 3), 203–241.
Holland, S.K., Plante, E., Weber Byars, A., Strawsburg, R.H., Schmi-
thorst, V.J., Ball Jr., W.S., 2001. Normal fMRI brain activation
patterns in children performing a verb generation task. NeuroImage 14
(4), 837–843.
Huttenlocher, P.R., 1979. Synaptic density in human frontal cortex—
Developmental changes and effects of aging. Brain Res. 163 (2),
195–205.
Itier, R.J., Taylor, M.J., 2004a. Effects of repetition and configural changes
on the development of face recognition processes. Dev. Sci. 7 (4),
469–487.
Itier, R.J., Taylor, M.J., 2004b. Face recognition memory and configural
processing: a developmental ERP study using upright, inverted, and
contrast-reversed faces. J. Cogn. Neurosci. 16 (3), 487–502.
Jung, T.P., Makeig, S., Westerfield, M., Townsend, J., Courchesne, E.,
Sejnowski, T.J., 2001. Analysis and visualization of single-trial event-
related potentials. Hum. Brain Mapp. 14 (3), 166–185.
Khateb, A., Pegna, A.J., Michel, C.M., Landis, T., Annoni, J.M., 2002.
Dynamics of brain activation during an explicit word and image
recognition task: an electrophysiological study. Brain Topogr. 14 (3),
197–213.
Koenig, T., Lehmann, D., 1996. Microstates in language-related brain
potential maps show noun–verb differences. Brain Lang. 53 (2),
169–182.
Kok, A., Rooijakkers, J.A.J., 1985. Comparison of event-related potentials
of young children and adults in a visual recognition and word reading
task. Psychophysiology 22, 11–23.
Kronbichler, M., Hutzler, F., Wimmer, H., Mair, A., Staffen, W., Ladurner,
G., 2004. The visual word form area and the frequency with which
words are encountered: evidence from a parametric fMRI study.
NeuroImage 21 (3), 946–953.
Lehmann, D., Skrandies, W., 1980. Reference-free identification of
components of checkerboard-evoked multichannel potential fields.
Electroencephalogr. Clin. Neurophysiol. 48 (6), 609–621.
Maurer, U., Brem, S., Bucher, K., Brandeis, D., 2005a. Emerging neuro-
physiological specialization for letter strings. J. Cogn. Neurosci. 17
(10), 1532–1552.
Maurer, U., Brandeis, D., McCandliss, B.D., 2005b. Fast, visual special-
ization for reading in English revealed by the topography of the N170
ERP response. Behav. Brain Func. 1 (1), 13.
McCandliss, B.D., Cohen, L., Dehaene, S., 2003. The visual word form
area: expertise for reading in the fusiform gyrus. Trends Cogn. Sci. 7
(7), 293–299.
Mechelli, A., Humphreys, G.W., Mayall, K., Olson, A., Price, C.J., 2000.
Differential effects of word length and visual contrast in the fusiform
and lingual gyri during reading. Proc. R. Soc. London, Ser. B Biol. Sci.
267 (1455), 1909–1913.
Moore, C.J., Price, C.J., 1999. Three distinct ventral occipitotempo-
ral regions for reading and object naming. NeuroImage 10 (2),
181–192.
Nichols, T.E., Holmes, A.P., 2002. Nonparametric permutation tests for
functional neuroimaging: a primer with examples. Hum. Brain Mapp.
15 (1), 1–25.
Nobre, A.C., Allison, T., McCarthy, G., 1994. Word recognition in the
human inferior temporal lobe. Nature 372 (6503), 260–263.
Ortigue, S., Michel, C.M., Murray, M.M., Mohr, C., Carbonnel, S., Landis,
T., 2004. Electrical neuroimaging reveals early generator modulation to
emotional words. NeuroImage 21 (4), 1242–1251.
Pascual-Marqui, R.D., Michel, C.M., Lehmann, D., 1994. Low resolution
electromagnetic tomography: a new method for localizing electrical
activity in the brain. Int. J. Psychophysiol. 18 (1), 49–65.
Pascual-Marqui, R.D., Michel, C.M., Lehmann, D., 1995. Segmentation of
brain electrical activity into microstates: model estimation and vali-
dation. IEEE Trans. Biomed. Eng. 42 (7), 658–665.
Pascual-Marqui, R.D., Lehmann, D., Koenig, T., Kochi, K., Merlo, M.C.,
Hell, D., Koukkou, M., 1999. Low resolution brain electromagnetic
tomography (LORETA) functional imaging in acute, neuroleptic-
naive, first-episode, productive schizophrenia. Psychiatry Res. 90 (3),
169–179.
Paulesu, E., Goldacre, B., Scifo, P., Cappa, S.F., Gilardi, M.C.,
Castiglioni, I., Perani, D., Fazio, F., 1997. Functional heterogeneity
of left inferior frontal cortex as revealed by fMRI. NeuroReport 8 (8),
2011–2017.
Paus, T., Zijdenbos, A., Worsley, K., Collins, D.L., Blumenthal, J., Giedd,
J.N., Rapoport, J.L., Evans, A.C., 1999. Structural maturation of neural
pathways in children and adolescents: in vivo study. Science 283
(5409), 1908–1911.
Petersen, S.E., Fiez, J.A., 1993. The processing of single words stu-
died with positron emission tomography. Annu. Rev. Neurosci. 16,
509–530.
Petersen, S.E., Fox, P.T., Posner, M.I., Mintun, M., Raichle, M.E., 1988.
Positron emission tomographic studies of the cortical anatomy of single-
word processing. Nature 331 (6157), 585–589.
Petersen, S.E., Fox, P.T., Snyder, A.Z., Raichle, M.E., 1990. Activation of
extrastriate and frontal cortical areas by visual words and word-like
stimuli. Science 249 (4972), 1041–1044.
Petersson, K.M., Reis, A., Askelof, S., Castro-Caldas, A., Ingvar, M., 2000.
Language processing modulated by literacy: a network analysis of
verbal repetition in literate and illiterate subjects. J. Cogn. Neurosci. 12
(3), 364–382.
Poldrack, R.A., Wagner, A.D., Prull, M.W., Desmond, J.E., Glover, G.H.,
Gabrieli, J.D., 1999. Functional specialization for semantic and

S. Brem et al. / NeuroImage 29 (2006) 822–837 837
phonological processing in the left inferior prefrontal cortex. Neuro-
Image 10 (1), 15–35.
Price, C.J., Wise, R.J., Frackowiak, R.S., 1996. Demonstrating the implicit
processing of visually presented words and pseudowords. Cereb. Cortex
6 (1), 62–70.
Proverbio, A.M., Vecchi, L., Zani, A., 2004. From orthography to
phonetics: ERP measures of grapheme-to-phoneme conversion mech-
anisms in reading. J. Cogn. Neurosci. 16 (2), 301–317.
Puce, A., Allison, T., Asgari, M., Gore, J.C., McCarthy, G., 1996.
Differential sensitivity of human visual cortex to faces, letter-
strings, and textures: a functional magnetic resonance imaging study.
J. Neurosci. 16 (16), 5205–5215.
Rossion, B., Joyce, C.A., Cottrell, G.W., Tarr, M.J., 2003. Early lateraliza-
tion and orientation tuning for face, word, and object processing in the
visual cortex. NeuroImage 20 (3), 1609–1624.
Rumsey, J.M., Andreason, P., Zametkin, A.J., Aquino, T., King, A.C.,
Hamburger, S.D., Pikus, A., Rapoport, J.L., Cohen, R.M., 1992. Failure
to activate the left temporoparietal cortex in dyslexia. An oxygen 15
positron emission tomographic study. Arch. Neurol. 49 (5), 527–534.
Salmelin, R., Helenius, P., Service, E., 2000. Neurophysiology of fluent and
impaired reading: a magnetoencephalographic approach. J. Clin.
Neurophysiol. 17 (2), 163–174.
Schapiro, M.B., Schmithorst, V.J., Wilke, M., Byars, A.W., Strawsburg,
R.H., Holland, S.K., 2004. BOLD fMRI signal increases with age in
selected brain regions in children. NeuroReport 15 (17), 2575–2578.
Schendan, H.E., Ganis, G., Kutas, M., 1998. Neurophysiological evidence
for visual perceptual categorization of words and faces within 150 ms.
Psychophysiology 35 (3), 240–251.
Schlaggar, B.L., Brown, T.T., Lugar, H.M., Visscher, K.M., Miezin, F.M.,
Petersen, S.E., 2002. Functional neuroanatomical differences between
adults and school-age children in the processing of single words.
Science 296 (5572), 1476–1479.
Shaywitz, S.E., 1996. Dyslexia. Sci. Am. 275 (5), 98–104.
Shaywitz, B.A., Shaywitz, S.E., Pugh, K.R., Mencl, W.E., Fulbright, R.K.,
Skudlarski, P., Constable, R.T., Marchione, K.E., Fletcher, J.M., Lyon,
G.R., Gore, J.C., 2002. Disruption of posterior brain systems for
reading in children with developmental dyslexia. Biol. Psychiatry 52
(2), 101–110.
Skrandies, W., 1998. Evoked potential correlates of semantic meaning—A
brain mapping study. Brain Res. Cogn. Brain Res. 6 (3), 173–183.
Sowell, E.R., Thompson, P.M., Tessner, K.D., Toga, A.W., 2001. Mapping
continued brain growth and gray matter density reduction in dorsal
frontal cortex: inverse relationships during postadolescent brain
maturation. J. Neurosci. 21 (22), 8819–8829.
Steger, J., Imhof, K., Steinhausen, H.-C., Brandeis, D., 2000. Brain
mapping of bilateral interactions in attention deficit hyperactivity
disorder and control boys.
Strik, W.K., Fallgatter, A.J., Brandeis, D., Pascual-Marqui, R.D., 1998.
Three-dimensional tomography of event-related potentials during
response inhibition: evidence for phasic frontal lobe activation. Electro-
encephalogr. Clin. Neurophysiol. 108 (4), 406–413.
Tagamets, M.A., Novick, J.M., Chalmers, M.L., Friedman, R.B., 2000.
A parametric approach to orthographic processing in the brain: an fMRI
study. J. Cogn. Neurosci. 12 (2), 281–297.
Talairach, J., Tournoux, P., 1988. Co-planar Stereotaxic Atlas of the Human
Brain: 3-Dimensional Proportional System—An Approach to Cerebral
Imaging. Thieme Medical Publishers, New York.
Tarkiainen, A., Helenius, P., Hansen, P.C., Cornelissen, P.L., Salmelin, R.,
1999. Dynamics of letter string perception in the human occipitotem-
poral cortex. Brain 122 (Pt. 11), 2119–2132.
Taylor, M.J., 1988. Developmental changes in ERPs to visual language
stimuli. Biol. Psychol. 26 (1–3), 321–338.
Taylor, M.J., 1993. Maturational changes in ERPs to orthographic and
phonological tasks. Electroencephalogr. Clin. Neurophysiol. 88 (6),
494–507.
Taylor, M.J., Smith, M.L., 1995. Age-related ERP changes to verbal and
nonverbal memory tasks. J. Psychophysiol. 9, 283–297.
Taylor, M.J., McCarthy, G., Saliba, E., Degiovanni, E., 1999. ERP evidence
of developmental changes in processing of faces. Clin. Neurophysiol.
110 (5), 910–915.
Taylor, M.J., Edmonds, G.E., McCarthy, G., Allison, T., 2001. Eyes first!
Eye processing develops before face processing in children. Neuro-
Report 12 (8), 1671–1676.
Taylor, M.J., Batty, M., Itier, R.J., 2004. The faces of development: a
review of early face processing over childhood. J. Cogn. Neurosci. 16
(8), 1426–1442.
Turkeltaub, P.E., Gareau, L., Flowers, D.L., Zeffiro, T.A., Eden, G.F., 2003.
Development of neural mechanisms for reading. Nat. Neurosci. 18, 18.
Vogel, E.K., Luck, S.J., 2000. The visual N1 component as an index of a
discrimination process. Psychophysiology 37 (2), 190–203.