Embed Size (px)
Citation preview

147
Evidence of CO2-gas emission variations in the central Apennines (Italy) during the L’Aquila seismic sequence (March-April 2009)
P. BONFANTI1, N. GENZANO2, J. HEINICKE3, F. ITALIANO1, G. MARTINELLI4, N. PERGOLA5,2,L. TELESCA5 and V. TRAMUTOLI2,5
1 INGV Palermo, Italy2 DIFA, Università degli Studi della Basilicata, Potenza, Italy3 Sächsische Akademie der Wissenschaften zu Leipzig, Office TU Bergakademie Freiberg, Germany4 ARPA Emilia Romagna, Reggio Emilia, Italy5 Istituto di Metodologie per l’Analisi Ambientale, CNR, Tito Scalo (Potenza), Italy
(Received: August 30, 2010; accepted: September 1, 2011 )
ABSTRACT The occurrence of intense CO2 degassing processes generating hundreds of cold CO2-rich gas emissions is typical of the central Apennines. In 2009, significant anomalieswere detected coinciding with the L’Aquila seismic sequence as a consequence of awide degassing process. Over the same time-span, space-time anomalies in ThermalInfraRed (TIR) satellite imagery possibly related to the increase of green-house gas(such as CO2, CH4, etc.) emission rates were detected in central Italy during theseismic swarm by a Robust Satellite Technique (RST) data analysis. A gasgeochemical survey carried out in the L’Aquila area confirms the deep crustal originof the anomalous gas emission detected by ground measurements. Anomalous fluidrelated signals were recorded some days before the mainshock coinciding with themost marked TIR anomalies independently detected by the RST analysis over 3different types of satellite data. Anomalous gas emissions detected by groundmeasurements lasted some weeks, putting in evidence relationships with crustaldeformative processes associated with the seismic sequence. Together with previousground observations in the Umbria-Marche area, present ground and satellite TIRobservations, are compatible with the hypothesis that a central Apennines area, muchwider than the L’Aquila (March-April 2009) epicentral one, was actually affected byanomalous increases in CO2 release thus providing new tools to better understand theprocesses occurring behind a seismic shock.
Key words: gas emission, L’Aquila earthquake, TIR.
1. Introduction
The active deformation field of central Italy is mainly characterized by an extension in theaxial zone of the Apennines and by contraction in the frontal part of the belt, close to the AdriaticSea border (Montone and Mariucci, 1999; Pauselli et al., 2006).
The Apennine extensional seismotectonic area is a structural domain that has undergone SW-NE extension since the Middle Pliocene. It is presently characterized by active NE-and SW-dipping normal and normal-oblique faults, mainly located along the axial belt of the Apennines,
Bollettino di Geofisica Teorica ed Applicata Vol. 53, n. 1, pp. 147-168; March 2012
DOI 10.4430/bgta0043
© 2012 – OGS

148
Boll. Geof. Teor. Appl., 53, 147-168 Bonfanti et al.
with associated intramontane basins. Relatively frequent earthquakes with moderate magnitude(4.0<M<6.0) have been recorded instrumentally over the past 20 years; furthermore, largehistorical earthquakes with long recurrence intervals occurred in this province. They are mainlylocated in the upper crust, at depths less than 15 km (Pace et al., 2006). Most of the seismicity isassociated with low-angle normal faults accommodating uplift of basement culminationsgenerated by active lithospheric thrusts beneath the Apennine watershed (Finetti et al., 2001).Apart from the western sector, in the central portion of Apennine chain (along the accretionarywedge), many areas are affected by an intense CO2 degassing leading to numerous cold, CO2-richgas emissions (Minissale, 2004). Besides the main CO2 component, lesser amounts of N2, H2S,CH4, H2, Ar, He and CO are the released gas phases. Some of the degassing areas displaysignificant gas flow rates [300-1000 l/s: Italiano et al. (2001)]. One of those areas, San Faustino(SF), located close to the Martana Fault, which delimits the eastern margin of the south-westernTiber basin branch and marked by a CO2-dominated gas release (CO2, flow rate ~ 6 t/day) wasconsidered for a continuous CO2 monitoring (Heinicke et al., 2011). All data recorded in theperiod 2009-2010 display considerable modifications in the daily CO2 flow rate coinciding withthe March-April 2009 seismic sequence when a Mw =6.3 seismic event (Chiarabba et al., 2009)struck the town of L’Aquila (Abruzzo region) located about 80 km away. Similar modificationsin the degassing rate had been recorded in thermal waters located over the Umbria (Triponzo) andMarche (Acquasanta) regions (Italiano et al., 2009b) showing that the anomalous increase in theCO2 release involved a wide area of the central Apennines, much wider than the epicentral area.
In order to assess the possible link among the variations in recorded gas flow rate and seismicevents some limiting factors should be considered. Dobrovolsky et al. (1979) published a firstevaluation of a possible magnitude-distance relation for the maximal distance betweenhypocenter and the strain induced anomalous phenomena starting from available experimentaldata. According to Dobrovolsky et al. (1979) a possible pre-seismic anomalous signal in the fluidsystem can be expected if the distance between the epicenter and fluid monitoring site is, forexample, less than 19 km for events of magnitude M≤3, 52 km for M≤4 and 141 km for M≤5.Further reviews carried out by Toutain and Baubron (1999), Hartmann and Levy (2005), Ciceroneet al. (2009) show similar or smaller radii for the occurrence of possible fluid-related precursoryphenomena. In this work, a more conservative radius of 100 km has been assumed for theinclusion of seismic events in the correlation-analysis of SF site data.
The increase of green-house gas (such as CO2, CH4) emission rates is only one of the modelsproposed until now, to explain the anomalous space-time fluctuations of the Earth’s emittedThermal InfraRed (TIR) radiation observed from a satellite [see Tramutoli et al. (2001),Tramutoli et al. (2005) and reference herein] from days to weeks before strong earthquakes.Other (not alternative) models have been proposed to justify such observations, relating them toascending gas and water (Tronin et al., 2002), to Rn emanations (Pulinets et al., 2006; Yasuokaet al., 2006) causing air ionization, variations of humidity and latent heat exchange variations(Dey and Singh, 2003; Cervone et al., 2006; Pulinets et al., 2006, 2007, Singh et al., 2006),activation of positive-hole pairs in rocks under pressure during rock deformation causing mid-infrared emission at the surface (Freund, 2002, Freund et al., 2006). Note that most of theprocesses mentioned above are in some way related to gas emissions, mainly Rn, CO2 (which isa carrier of Rn) and CH4. It is well known that Earth degassing activity (and particularly for

149
Evidence of CO2-gas emission variations in the central Apennines Boll. Geof. Teor. Appl., 53, 147-168
optically active gases like CO2 and CH4) is generally more intense alongside seismogenic faults(e.g., Irwin and Barnes, 1980). Abrupt variations of such gases in near-surface atmospheric layerscould result in a local greenhouse effect1 that increases near-surface temperature and,consequently TIR emission. Following the description of the preparatory phases of an earthquakegiven, for instance, by Scholz et al. (1973), we could expect that the extensive process of micro-crack formations (consequence of the continuously increasing stress field) supports the increaseof such degassing activity that, together with deep-water rise and convective heat flow towardsthe surface, could contribute to a strongly increased TIR emission by increasing not only nearsurface temperature but also ground emissivity. When the stress field becomes locally so high asto close the cracks and an earthquake occurrence is approaching, all the above processes (and theTIR emission measured at that time) are expected to be reduced up to the time of earthquakeoccurrence. In this period of time, as a consequence of major cracks opening in the rupture zone,a new increase of degassing activity (and related phenomena) and TIR emissions is expectedbefore a gradual return to normality. It is worthwhile to remind the reader that the appearance ofan intense (from 2 to 100 times its normal concentration) CO2 degassing activity a few daysbefore strong earthquakes has been a not rare reported occurence (e.g., Qiang et al., 1991; Barka,1999) in literature. A quantitative estimate of the increase of the Earth’s TIR emission, to beexpected as a consequence of a boost of atmospheric CO2 concentration, has been performed byusing the Radiative Transfer code MODTRAN2 by Tramutoli et al. (2009) proving that theincrease of CO2 concentration in the lower atmosphere can cause a TIR signal increase (in termsof Brightness Temperature) from a few, to several tens of degrees, in so as far as CO2
concentration moves from 2 to 20 times its normal level. However, TIR signal increases, evengreater than 5 K, can be easily measured as a consequence of the change of only one of theparameters - included by Tramutoli et al. (2005) in the list of the main contributor to thenatural/observational noise - whose changes are independent from any type of seismic activity.This noise can be as large as (in some cases larger than) the TIR signal variations previouslyreported in literature, as thermal anomalies, and claimed as precursors of impending earthquakes(Tramutoli et al., 2005). For this reason, refined data analysis techniques are required todiscriminate actual TIR signal anomalies from its “normal” variations due to changes of llocal3
spatial (i.e., horography, land cover, etc.) or temporal (time of the day, season, etc.) conditions ofthe Earth’s surface (e.g., temperature, humidity, etc.) and atmosphere (e.g., water vapor contentand more generally TIR transmittance). The Robust Satellite Technique (RST) approach(Tramutoli 1998, 2007), demonstrated its capability of reducing most of the natural/observationalcontributions affecting TIR signal variability, thus permitting it to isolate significant, residual
1 Atmospheric layers of gases, like CO2 and CH4, that are mostly transparent with regard to solar radiation and activein absorbing the Earth’s emitted infrared radiation can locally operate like a greenhouse: they allow the solar radiationto reach the Earth’s surface and warm it up but they contrast the cooling of the Earth’s surface by absorbing and re-emitting, the Earth emitted infrared radiation, toward the surface. The result, depending on the local wind regimes, canbe observed even at some distance from the gas sources, and produces a warming up of the Earth’s surface and nearsurface atmospheric layers.2 MODTRAN (MODerate resolution atmospheric TRANsmission,) is a computer program designed to modelatmospheric propagation of electromagnetic radiation for spatial frequencies from far-infrared (100 cm-1) to the deepultraviolet (50000 cm-1). The MODTRAN Code (Berk et al., 1989) calculates atmospheric transmittance and radianceat moderate spectral resolution, primarily 2 cm-1 (20 cm-1 in the ultraviolet). 3 According to Tramutoli (1998) the double l was introduced, and will be hereafter used, to highlight a reference notonly to a specific place r but also to a specific time t.

150
Boll. Geof. Teor. Appl., 53, 147-168 Bonfanti et al.
anomalous transients, better than any other previous satellite data analysis technique. Theirpossible space–time relation with earthquake occurrence have always been investigated (on thebasis of several years of satellite TIR observations) by using a validation/confutation approachdevoted to verifying the presence/absence of such anomalies in the presence/absence of strongseismic events. Since its first application to the November 23, 1980, Irpinia-Basilicata earthquake(Tramutoli et al., 2001; Di Bello et al., 2004) the RST approach has been applied to dozens ofearthquakes (Filizzola et al., 2004; Corrado et al., 2005; Tramutoli et al., 2005, 2009; Aliano etal., 2007, 2008a, 2008b; Genzano et al., 2007, 2009b) that have occurred in different continents(Europe, Asia, America and Africa) with different degassing regimes.
In this paper, the space-time fluctuations of the Earth’s emitted TIR radiation, observed byGenzano et al. (2009a), Lisi et al. (2010) and Pergola et al. (2010) at the time of the Abruzzoearthquake by applying the same technique to different (polar and geostationary) satellite sensors,have been compared with ground observations of CO2 degassing in order to verify one of thegenetic models up to now proposed to explain the occurrence of TIR anomalies in relation withstrong earthquake occurrences and, possibly, to obtain further indications on the geographicalextension of CO2 anomalous degassing at the regional scale.
2. Gas geochemistry
Sedimentary rocks present in central Italy allow the intense circulation of deeply originatedfluids. In particular, anomalous CO2 discharges were identified in the area and closely related tothe extensional movements of the normal faults responsible for the 1997-1998 Umbria-Marcheseismic sequence (Italiano et al., 2009a). A multiple origin of CO2 was proposed by Chiodini etal. (2004), Minissale (2004), and Italiano et al. (2008) attributed to carbonate hydrolysis,thermometamorphic processes, mantle degassing, and to mechanochemical activity in faultedareas. In particular, the SF gas emission, (Fig. 1) was repeatedly analyzed for geochemicalmonitoring and equipped with monitoring instrumentation (Heinicke et al., 2000, 2011; Italianoet al., 2009b).
The chemical composition of SF gas emission is: CO2 98%, N2 1.5%, CH4 0.3%, while heliumconcentration is in the range 4-12 ppm. Helium and carbon isotopes allowed us to establish thatmost of the CO2 emitted is generated in the crust by thermometamorphic and mechanochemicalprocesses (Italiano et al., 2008).
Large, potential deep CO2 reservoirs were identified by Finetti et al. (2001) interpreting dataof the CROP 03 deep seismic reflection profile cross-section of central Italy. Large high porositycarbonatic reservoirs occur at depth in the range of 1-10 km and may host fluids like water andCO2 as observed in the close San Donato well where an explorative hydrocarbon wellencountered CO2 at a pressure of about 98 MPa at a depth of 4750 m (Chiodini et al., 2004). Acrustal origin is attributed to the kind of CO2, associated to helium with a clear radiogenic-derivedsignature (3He/4He = 0.02 Ra where Ra is the 3He/4He ratio in air).
Highly pressurized CO2 is characterized by a physical behaviour similar to water and can mixwith water originating poorly compressible deep supercritical fluids. Deep reservoirs filled bynon-compressible fluids, may act, in principle, as natural strain meters (Bodvarsson, 1970) andgeochemical anomalies observed in SF gas emission during the1997-1998 seismic swarm in gas

151
Evidence of CO2-gas emission variations in the central Apennines Boll. Geof. Teor. Appl., 53, 147-168
composition and flux could be related to stress-induced strain or to cracks that occurred in deepreservoirs. The peculiar sensitivity of SF gas emission to seismic events and the lack of localsources of man-derived, induced noise led us to choose that site to install instruments aimed atcontinuous gas flow rate monitoring. The site can be also considered as representative for all theother CO2-dominated vents spread over the central Apennines characterized by similargeochemical features and sensitivity to crustal deformation and seismicity. Fig. 1 shows thedistribution of the well known and already studied vents and thermal springs.
Fig. 2 shows how all samples have a significant increase in CO2 content with respect to theatmosphere. In particular, samples from the L’Aquila epicentral area (black diamonds) are CO2-enriched although they were collected from soils and from dry wells, where the air circulationshould keep the CO2 content at, or close to, the atmospheric level. Gas geochemical data and
Fig. 1 - Distribution of the main CO2-dominated vents of central Italy. Table 1 lists the sampling site locations besidethe CO2 and He data. The main seismogenic sources crossing the Apennine chain (after Valensise and Pantosti, 2001)are also reported.

152
Boll. Geof. Teor. Appl., 53, 147-168 Bonfanti et al.
Site # Site name Latitude Longitude % CO2 δ13CO2 R/Ra
1 Pieve Fosciana 4897206 132940 3.3 n.a. 0.06
2 Asciano 4851292 136601 65.6 10.31 0.09
3 Acqua Bolle 4842116 183740 94.8 -6.58 0.02
4 Caprese 4837423 256719 94.8 -4.21 0.03
5 Baccanella 4836167 153970 96.4 -7 0.04
6 Piersanti 4834130 130131 99.1 -6.71 0.14
7 Pergine 4819571 232224 96 -6.93 0.04
8 Borboi 4818901 153440 96 -9.31 0.07
9 Vagliagli 4814551 205176 94.4 -5.18 0.08
10 Acqua Borra 4801192 210303 99.2 -5.95 0.17
11 Umbertide 4800803 281548 92.9 -3.57 0.02
12 Rapolano 4799675 224437 99.3 -7.54 0.13
13 Torrite di Siena 4786346 233189 93.1 -3.87 0.11
14 Venturina 4774391 141376 95.2 -13.4 0.82
15 Pienza 4773372 229191 94.8 -3.69 0.21
16 Bagni S.Filippo 4757952 229238 96.1 -3.33 0.13
17 S.Albino 4751219 244494 96.7 -5.2 0.15
18 Zancona 4750256 217022 94.9 -4.64 0.45
19 Roselle 4746821 184431 27.3 -9.56 0.07
20 Selvena 4740856 224012 90.2 -3.37 0.4
21 Torre Alfina 4737198 250303 98.5 1.01 0.27
22 Saturnia 4728674 214311 34.7 -6.39 0.4
23 Pereta 4728234 201312 75.3 -6.27 0.89
24 S.Martino Fiora 4727675 222162 99.2 0.14 0.69
25 Bagni Osa 4718151 186046 17.7 -9.57 0.09
26 Strada Ferento 4709875 259556 97.9 -0.32 0.56
27 Muralto 4707201 284651 97.3 -0.99 0.64
28 Bagnaccio 4705009 259182 99.3 -1.94 0.54
29 Tuscania 4703754 244956 97.5 n.a. 0.43
30 Monterozzi 4702096 225945 98.4 -0.1 0.36
31 Terme Cotilia 4693510 335135 95.8 -2.1 0.11
32 Solfatara Nepi 4678936 277171 97.6 -1.3 0.26
33 Veiano 4678053 261742 98.3 -0.23 0.45
34 Borgo Pantano 4670899 232195 98 -2.15 0.31
35 Caldara 4663899 260205 98 -2.4 0.24
36 Palidoro 4650026 267870 97.7 -1.88 0.18
37 Tivoli 4647013 311168 91.6 -3.5 0.6
Table 1 - Sampling site locations with their CO2 content and their CO2 and He isotope ratios. The coordinates are givenin VTS-WG84 units.

153
Evidence of CO2-gas emission variations in the central Apennines Boll. Geof. Teor. Appl., 53, 147-168
previous literature data (e.g., Chiodini et al., 2004; Minissale, 2004; Italiano et al., 2008) indicatethat crustally derived CO2 is degassed in all of the central Apennines. Gas sampling and soildegassing measurements carried out after the main shock over the L’Aquila area, showedsignificant CO2 excess in soil gases (up to 6% by volume) that seems to be related to the seismicsequence. An enhanced CO2 degassing rate (or even a new, seismically derived, degassingprocess) is also an indication of deeply-originating gaseous components towards the surface. TheCO2 degassing activity in the L’Aquila epicentral area decreased also the helium isotopic ratio(from the atmospheric ratio R/Ra=1 down to 0.87 R/Ra; Table 2) due to the addition ofradiogenic-derived 4He after the crisis.
The origin of the degassed CO2 is normally investigated by its δ 13C value, often used toidentify the origin of C (e.g., Hoefs, 1980; Schidlowski et al., 1983) as the various CO2
sources are normally marked by different δ 13C ratios [δ 13CMORB = - 6.5‰; δ 13C Limestones = 0‰;δ 13C Marine sediments = -20‰; δ 13C Organic matter < -30‰; Faure, (1977), Javoy et al. (1986); Sano andMarty (1995)]. Although a contribution of organically-derived CO2 cannot be excluded, it isworthy of note that the gas samples have been collected from soils during the rainy season andthat the CO2 isotopic ratios of -16.5 and -17.7‰ PDB and even the lowest value detected in soilsof -26.42‰ (Table 2) are above typical, organically-derived CO2. The recorded δ 13C values,however, are consistent with fractionation processes due to gas-water interactions occurring to agaseous CO2 that crossed wet sedimentary layers during its uprising toward the Earth’s surface,preferentially loosing its heavy isotope (13C).
Both helium and carbon isotopes put in evidence the existence of a CO2 excess in fluidsreleased over the epicentral area in coincidence with the L’Aquila seismic sequence. Data from a
Fig. 2 - R/Ra-N2-CO2
triangular plot.

154
Boll. Geof. Teor. Appl., 53, 147-168 Bonfanti et al.
continuous monitoring station installed in the epicentral area after the seismic sequence and stillrecording data, show dynamic CO2 concentration constantly above 1%, sometimes up to 3%, thatcannot be justified by organic CO2 production or recycling atmospherically-derived components(Bonfanti, personal communication). Besides the main atmospheric gases circulating over anykarst area, an additional gas phase is thus released. As it cannot be of organic origin a deeper,namely crustal, origin for the degassed gases is here considered as shown by the carbon andhelium isotopic signatures.
3. Ground based instrumentation methods
CO2 degassing is a widespread phenomenon for the central Apennines showing significant
Table 2 - Analytical results of selected gases sampled in central Italy. Samples from 1 to 7 are free and soil gasescollected in the L’Aquila province (Abruzzo region). Sample 8 is a free gas collected in the Rieti province (Latiumregion). Samples from 9 to 17 are dissolved gases collected in the Perugia province (Umbria region). Sample 18 is afree gas in the Perugia province (Umbria region). The analytical results are expressed as vol. % for free and soil gasesand as cc STP/l for dissolved gases. Typical values for AIR and ASW are reported as reference (last two lines, italiccharacters). Helium isotopic ratios not corrected for atmospheric contamination. * indicates dissolved gases.
Site N date He O2 N2 CO CH4 CO2 δ13C PDB‰ R/Ra He/Ne
Paganica 1 16/04/2009 9 x 10⁻⁴ 18.6 78.7 4 x 10⁻⁴ 0.3 x 10⁻⁴ 0.94 -17.71 0.87±0.015 0.36
PaganicaAmbrosio well
2 06/05/2009 5 x 10⁻⁴ 19.5 78.1 10 x 10-4 2.4 x 10⁻⁴ 0.05 nd nd nd
Onna WP071soil gas
3 06/05/2009 5 x 10⁻⁴ 19.1 77.6 6 x 10⁻⁴ 2.0 x 10⁻⁴ 0.33 nd nd nd
WP079 Soil gas
4 08/05/2009 6 x 10⁻⁴ 14.2 77.5 10 x 10-4 1.0 x 10⁻⁴ 6.87 -26.42 nd nd
Bazzano 5 22/07/2009 5 x 10⁻⁴ 18.4 79.2 4 x 10⁻⁴ bdl 0.53 nd 1.03±0.047 0.39
San Gregorio 6 22/07/2009 3 x 10⁻⁴ 17.8 77.8 29 x 10-4 1 x 10⁻⁴ 1.52 -16.51 1.04±0.054 0.36
PaganicaAmbrosio well
7 22/07/2009 5 x 10⁻⁴ 18.3 77.6 16 x 10-4 0.9 x 10⁻⁴ 0.84 nd 1.02±0.038 0.33
Cotilia 8 16/04/2009 9.2 x 10⁻³ bdl 9.8 1.4 x 10⁻⁴ 728 x 10-4 88.71 nd 0.13±0.006 172.62
Parrano 9 16/04/2009 8.6 x 10⁻³ 7.6 55.6 0.2 x 10⁻⁴ 415 x 10-4 36.88 nd 0.12±0.006 3.67
Acquasanta* 10 17/04/2009 5.0 x 10⁻⁴ 0.02 8.1 6.3 x 10⁻⁵ 7.4 x 10⁻³ 19.79 nd 0.47±0.009 0.83
Acquasanta* 11 27/04/2009 4.0 x 10⁻⁴ 0.01 7.2 3.2 x 10⁻⁶ 8.0 x 10⁻³ 21.20 nd 0.81±0.011 0.74
Acquasanta* 12 05/05/2009 2.0 x 10⁻⁴ 0.05 4.1 4.7 x 10⁻⁵ 2.4 x 10⁻³ 6.50 nd 1.04±0.059 0.76
Triponzo * 13 17/04/2009 1.1 x 10⁻³ 0.02 9.5 9.9 x 10⁻⁵ 8.9 x 10⁻² 11.44 nd 0.08±0.016 5.01
Triponzo * 14 30/04/2009 3.9 x 10⁻⁴ 0.02 3.9 1.6 x 10⁻⁵ 3.9 x 10⁻² 3.86 nd 0.13±0.010 6.80
Triponzo * 15 08/06/2009 1.2 x 10⁻³ 2.9 8.7 1.7 x 10⁻⁴ 8.7 x 10⁻² 10.03 nd 0.05±0.004 8.80
Triponzo * 16 26/06/2009 9.7 x 10⁻⁴ 0.02 7.4 5.5 x 10⁻⁵ 6.4 x 10⁻² 8.25 nd 0.08±0.005 4.42
Triponzo * 17 23/07/2009 8.4 x 10⁻⁴ 0.02 8.9 bdl 8.6 x 10⁻² 10.85 nd 0.07±0.005 5.85
San Faustino 18 06/05/2009 5.0 x 10⁻⁴ 0.01 1.3 12 x 10-4 36 x 10-2 96.57 0.31 0.26±0.013 68.22
AIR 5.2 x 10⁻⁴ 21 78 1 x 10⁻⁴ 0.03 -8 1.00 0.32
ASW 4.1 x 10⁻⁵ 4.8 9.6 1 x 10⁻⁶ 0.24 1.00 0.29

155
Evidence of CO2-gas emission variations in the central Apennines Boll. Geof. Teor. Appl., 53, 147-168
relationships with crustal deformation and seismicity. Both the chemical composition of CO2-dominated venting and dissolved gases and their flow rate changed in coincidence with seismicevents (Italiano et al., 2001, 2009b) with a widely increased degassing rate during the 1997-98seismic crisis (Italiano et al., 2001). Both gas vents and thermal springs of the central Apenninesrelease crustal-derived CO2 with helium marked by a crustal isotopic ratio showing that a deepgas phase of crustal origin is available at shallow crustal levels, sometimes considered asresponsible for triggering aftershocks (e.g., Miller et al., 2004) also if a small amount of fluidsare available at depth (Terakawa et al., 2010). An automatic system for CO2 flow-rate continuousmonitoring was installed in a natural vent located at the SF site (Fig. 1). The site was choosenbecause of the favourable logistic position just beside a factory thus allowing the preservation ofthe site. The gas flow was measured in a plastic pipe of 30 cm in diameter for a free gas outlet.A thermo couple “hot wire” type sensor (Schmidt Company® ) recorded the gas velocity whichis then converted into flow rate. Fig. 3 shows the complete records of the period 2005-2010 withtwo gaps in 2006 and 2008-2009. The evaluation of the gas flow variation shows long termperiods with higher or lower gas flow levels. Heinicke et al. (2011) interpret the long termvariations with pore pressure perturbations in the crustal reservoirs induced by static stainvariations. Local seismic events, as expression of geodynamic processes in the near field, alwaysoccurred before and during these anomalous gas flow periods. This correlation exists only forevents that occurred east of the gas emission site close to the local major fault zone, the Martana
Fig. 3 - The complete gas flow record of SF (blue line). The gas emission was accumulated as gas flow rate per day.Two gaps indicate missing data. The long term observation can be separated into different periods with a higher orlower gas flow level. The interesting short term anomalies of March/April 2009 are in superposition with a high levelgas flow rate period in 2009, according to Heinicke et al. (2011).
156
Boll. Geof. Teor. Appl., 53, 147-168 Bonfanti et al.
fault zone. We herein consider this correlation as indication for a continuous interaction betweenthe field of static strain and the deep fluid pressure and their transport paths.
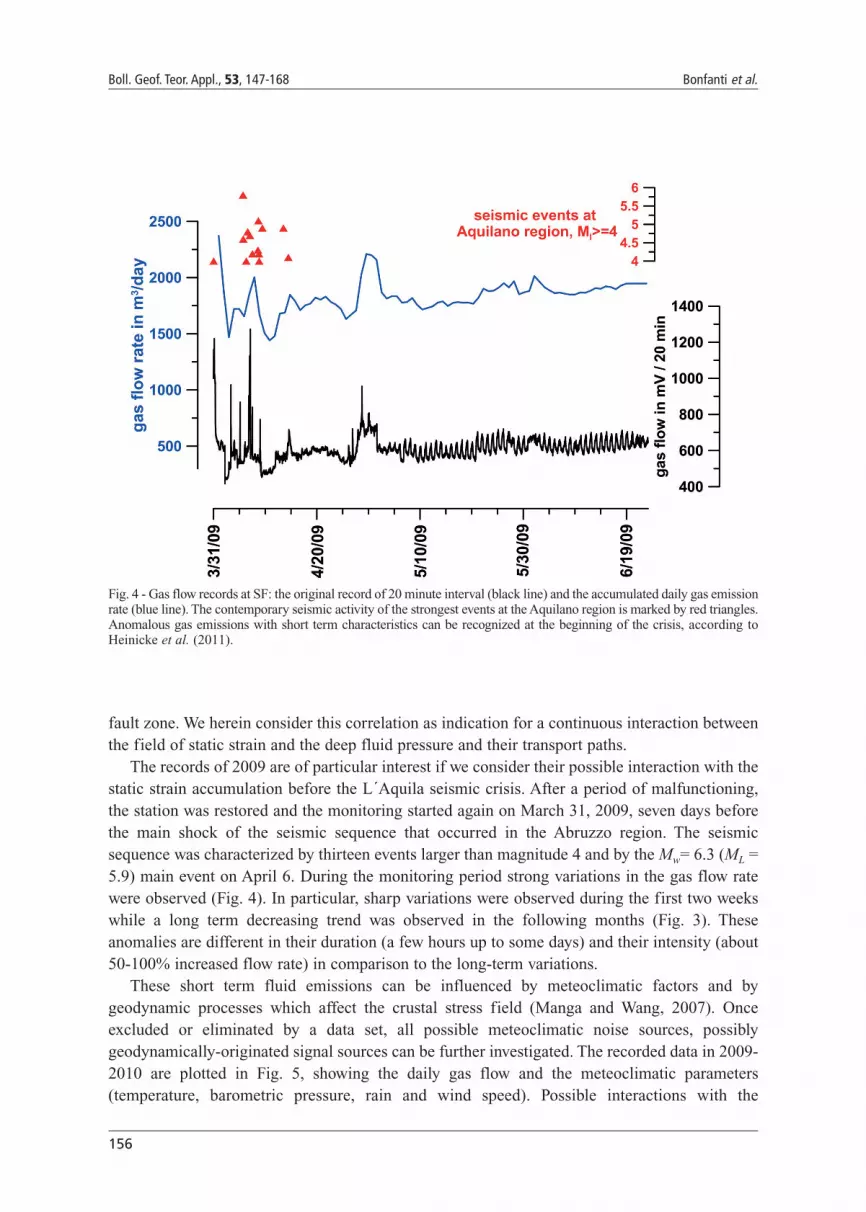
The records of 2009 are of particular interest if we consider their possible interaction with thestatic strain accumulation before the L´Aquila seismic crisis. After a period of malfunctioning,the station was restored and the monitoring started again on March 31, 2009, seven days beforethe main shock of the seismic sequence that occurred in the Abruzzo region. The seismicsequence was characterized by thirteen events larger than magnitude 4 and by the Mw= 6.3 (ML =5.9) main event on April 6. During the monitoring period strong variations in the gas flow ratewere observed (Fig. 4). In particular, sharp variations were observed during the first two weekswhile a long term decreasing trend was observed in the following months (Fig. 3). Theseanomalies are different in their duration (a few hours up to some days) and their intensity (about50-100% increased flow rate) in comparison to the long-term variations.
These short term fluid emissions can be influenced by meteoclimatic factors and bygeodynamic processes which affect the crustal stress field (Manga and Wang, 2007). Onceexcluded or eliminated by a data set, all possible meteoclimatic noise sources, possiblygeodynamically-originated signal sources can be further investigated. The recorded data in 2009-2010 are plotted in Fig. 5, showing the daily gas flow and the meteoclimatic parameters(temperature, barometric pressure, rain and wind speed). Possible interactions with the
Fig. 4 - Gas flow records at SF: the original record of 20 minute interval (black line) and the accumulated daily gas emissionrate (blue line). The contemporary seismic activity of the strongest events at the Aquilano region is marked by red triangles.Anomalous gas emissions with short term characteristics can be recognized at the beginning of the crisis, according toHeinicke et al. (2011).

157
Evidence of CO2-gas emission variations in the central Apennines Boll. Geof. Teor. Appl., 53, 147-168
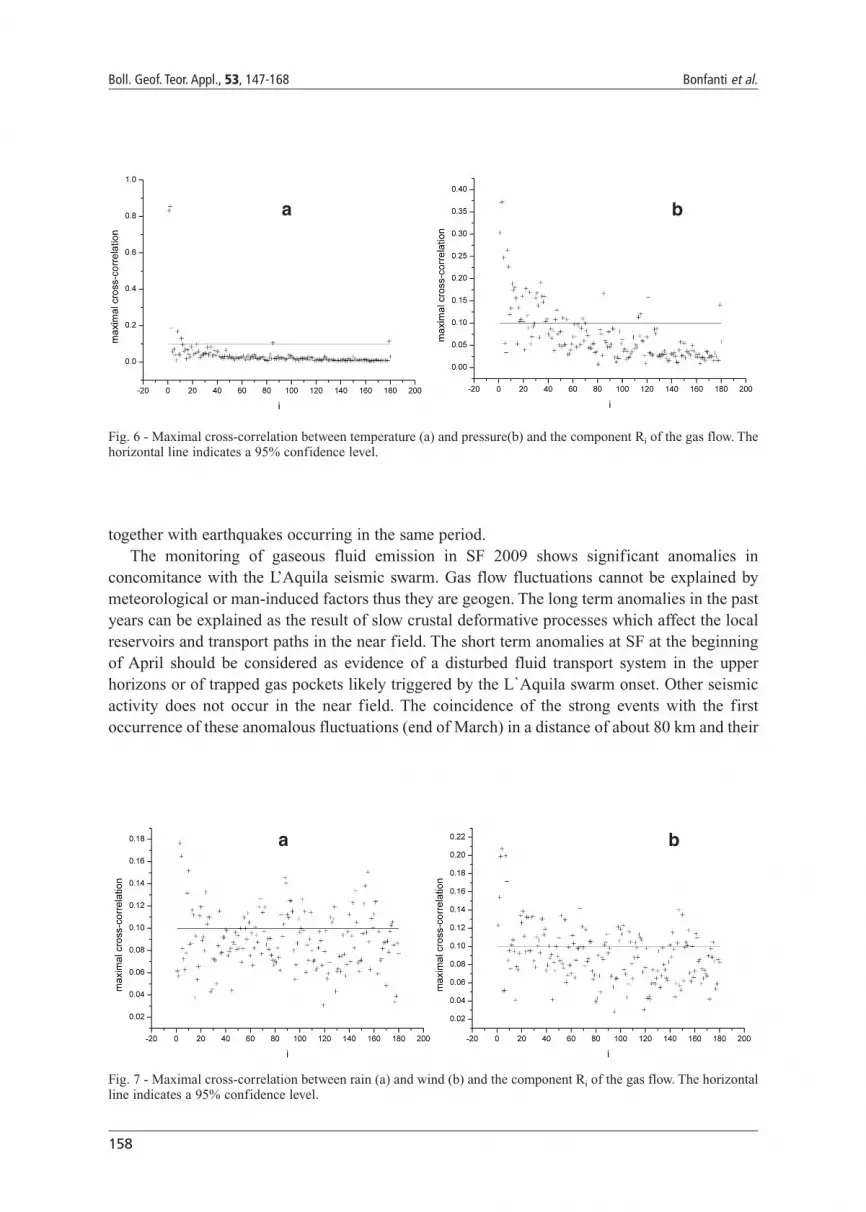
meteoclimatic parameters as cause of the fluctuations of gas flow data has to be analyzed first.The meteoclimatic factors can be removed from the daily gas flow time series by using thesingular spectrum analysis (Vautard et al., 1992), which provides a decomposition of short andapparently noisy signals. The daily gas flow is decomposed into 180 components Ri. Eachcomponent Ri is cross-correlated with one meteoclimatic variable, and the maximum of the cross-correlation function is compared with the 95% confidence level, assuming that the two series arecompletely uncorrelated. If such maximum is higher than the confidence level, the correspondingcomponent Ri is removed from the gas signal. Figs. 6 and 7 show the maximum of the cross-correlation between each component Ri and the meteoclimatic variables (temperature, pressure,rain and wind speed, respectively) along with the 95% confidence level. All the components ofthe gas flow whose maximal cross-correlation is higher than the confidence level are removedfrom the gas flow.
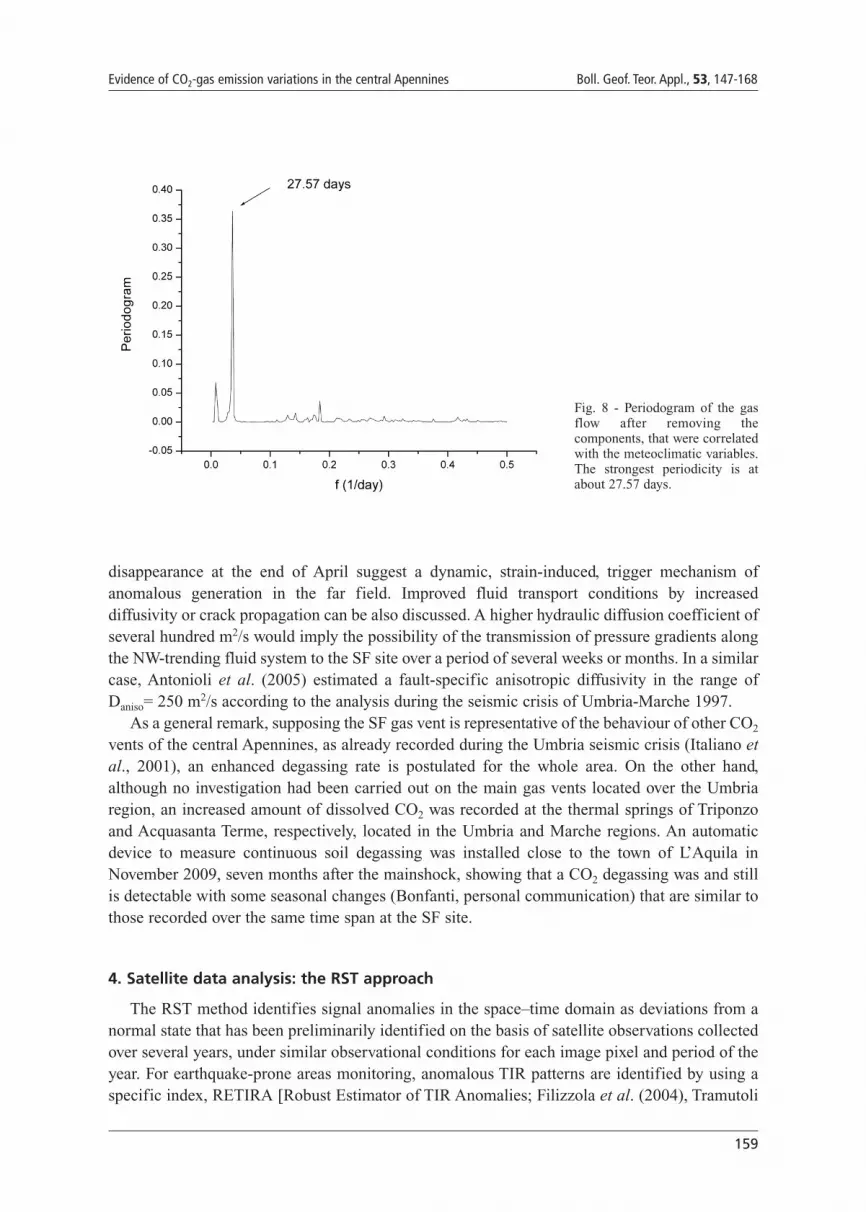
The gas flow thus filtered is investigated for the existence of strong periodicities, mainlylinked with the Earth’s tides. Fig. 8 shows the periodogram obtained, which reveals a strongperiodicity at about 27.57 days, very probably linked to the Earth’s lunar tide.
After removing the main periodicity, the residual gas flow is plotted in Fig. 9 along with theearthquakes that occurred during the observation period and the 2σ threshold to identify the gasflow anomalies. In Fig. 10≠, the residual gas flow in the first 70 days of measurement is shown
Fig. 5 - One year of daily gas flow rate (blue line), wind speed (upper black line) air temperature (lower black line),barometric pressure (red line) and rain (green bars) at SF, starting on March 31, 2009.
158
Boll. Geof. Teor. Appl., 53, 147-168 Bonfanti et al.
together with earthquakes occurring in the same period.The monitoring of gaseous fluid emission in SF 2009 shows significant anomalies in
concomitance with the L’Aquila seismic swarm. Gas flow fluctuations cannot be explained bymeteorological or man-induced factors thus they are geogen. The long term anomalies in the pastyears can be explained as the result of slow crustal deformative processes which affect the localreservoirs and transport paths in the near field. The short term anomalies at SF at the beginningof April should be considered as evidence of a disturbed fluid transport system in the upperhorizons or of trapped gas pockets likely triggered by the L`Aquila swarm onset. Other seismicactivity does not occur in the near field. The coincidence of the strong events with the firstoccurrence of these anomalous fluctuations (end of March) in a distance of about 80 km and their
Fig. 7 - Maximal cross-correlation between rain (a) and wind (b) and the component Ri of the gas flow. The horizontalline indicates a 95% confidence level.
Fig. 6 - Maximal cross-correlation between temperature (a) and pressure(b) and the component Ri of the gas flow. Thehorizontal line indicates a 95% confidence level.
a
a
b
b
159
Evidence of CO2-gas emission variations in the central Apennines Boll. Geof. Teor. Appl., 53, 147-168
disappearance at the end of April suggest a dynamic, strain-induced, trigger mechanism ofanomalous generation in the far field. Improved fluid transport conditions by increaseddiffusivity or crack propagation can be also discussed. A higher hydraulic diffusion coefficient ofseveral hundred m2/s would imply the possibility of the transmission of pressure gradients alongthe NW-trending fluid system to the SF site over a period of several weeks or months. In a similarcase, Antonioli et al. (2005) estimated a fault-specific anisotropic diffusivity in the range ofDaniso= 250 m2/s according to the analysis during the seismic crisis of Umbria-Marche 1997.
As a general remark, supposing the SF gas vent is representative of the behaviour of other CO2
vents of the central Apennines, as already recorded during the Umbria seismic crisis (Italiano etal., 2001), an enhanced degassing rate is postulated for the whole area. On the other hand,although no investigation had been carried out on the main gas vents located over the Umbriaregion, an increased amount of dissolved CO2 was recorded at the thermal springs of Triponzoand Acquasanta Terme, respectively, located in the Umbria and Marche regions. An automaticdevice to measure continuous soil degassing was installed close to the town of L’Aquila inNovember 2009, seven months after the mainshock, showing that a CO2 degassing was and stillis detectable with some seasonal changes (Bonfanti, personal communication) that are similar tothose recorded over the same time span at the SF site.
4. Satellite data analysis: the RST approach
The RST method identifies signal anomalies in the space–time domain as deviations from anormal state that has been preliminarily identified on the basis of satellite observations collectedover several years, under similar observational conditions for each image pixel and period of theyear. For earthquake-prone areas monitoring, anomalous TIR patterns are identified by using aspecific index, RETIRA [Robust Estimator of TIR Anomalies; Filizzola et al. (2004), Tramutoli
Fig. 8 - Periodogram of the gasflow after removing thecomponents, that were correlatedwith the meteoclimatic variables.The strongest periodicity is atabout 27.57 days.

160
Boll. Geof. Teor. Appl., 53, 147-168 Bonfanti et al.
et al. (2005)] to be computed on the image at hand as in the equation below:
where:∆T(r,t)=T(r,t)-T(t), T(r,t) is the punctual value of the brightness temperature at the location
r≡(x,y) and acquisition time t;T(t) is the spatial average computed in place on the image at hand considering cloud-free
pixels only, all belonging to the same, land or sea, class in the investigated area IA (i.e., T(t) iscomputed considering only sea pixels if r is located on the sea and computed considering onlyland pixels if r is located on the land). Note that the choice of such a differential variable ∆T(r,t)instead of T(r,t) is expected to reduce possible contributions (e.g., occasional warming) due today-to-day and/or year-to-year climatological changes and/or seasonal time-drifts;
µ∆T (r) and σ∆T (r) are the time average and standard deviation of ∆T(r,t) obtained for each
⊗ ( ) =
( ) − ( )( )∆
∆
∆
∆T
T
T
tT t
rr r
r,
, µσ
Fig. 9 - Residual gas flow after removing the meteoclimatic effects and the periodicity shown in Fig. 8. The verticalblue arrows indicate the earthquakes that occurred within a radius of 100 km and characterized by M ≥ 3.5 during theperiod of recording. The horizontal, dotted red line indicates the 2σ threshold for the identification of anomalies in theresidual gas flow.

161
Evidence of CO2-gas emission variations in the central Apennines Boll. Geof. Teor. Appl., 53, 147-168
location r≡(x,y) using cloud free records belonging to a homogeneous data set of observationscollected in different years in similar (same month, same time of the day, etc.) observationalconditions.
5. Satellite data evaluation
For this study, the RST approach has been implemented on MSG-SEVIRI (Meteosat SecondGeneration -Spinning Enhanced Visible and Infrared Imager) data. Five years (from 2005 to2009) of SEVIRI TIR (channel 9 at 10.8 micron) images acquired at the same time of day (24:00GMT) during the months of March and April were used to characterize the expected signalbehavior in unperturbed conditions. The geographic corners of the investigated area (IA) coveringthe whole of Italy, were 35°N; 6°E and 48°N; 19°E. On this basis the RETIRA index has beencomputed for all the MSG-SEVIRI imagery in order to perform the validation/confutationanalysis. For validation purposes, the months of March and April 2009 have been considered,while, in the confutation phase, the analysis has been performed considering the months of Marchand April 2008: the “unperturbed” (i.e., no earthquakes with M≥5, in the same region and in thesame months but in a different year) period in the considered data set. SEVIRI records
Fig. 10 - Residual gas flow after removing the meteoclimatic effects and the periodicity shown in Fig. 8 during the first70 days of recording. The vertical blue arrows indicate the earthquakes that occurred within a radius of 100 km andcharacterized by M≥3.5 during the period of recording. The horizontal dotted red line indicates the 2σ threshold for theidentification of anomalies in the residual gas flow.

162
Boll. Geof. Teor. Appl., 53, 147-168 Bonfanti et al.
corresponding to cloudy affected radiances have been identified by using OCA [One-channelCloudy-radiance-detection Approach: Tramutoli et al. (2000), Pietrapertosa et al. (2001), Cuomoet al. (2004)] and excluded from whatever subsequent processing.
For validation purposes the RETIRA index [⊗∆T (r,t)] has been computed for all availablemidnight images in the months of March and April 2009. A persistence analysis (Tramutoli et al.,2005) has been performed in order to discern significant (i.e., space–time persistent) anomalousTIR transients from outliers, possibly due to image navigation errors or to night-time cloudpassages [described by Filizzola et al. (2004)] or to the well known cold spatial average effectdue to a southern dominant cloud distribution across the scene already described by Aliano et al.(2008a) and in Genzano et al. (2009a). In this way significant TIR anomalies have been identifiedin a wide area over the Abruzzo region from March 30, 7 days before the main shock of theAbruzzo earthquake and a few hours before its strongest foreshock (ML~4.1) that occurred at13:38 UTC on April 1. Similar results [with obvious limitations from the use of polar satellitesdescribed in Filizzola et al. (2004)] were reported by Lisi et al. (2010) and Pergola et al. (2010),applying the same RST approach on NOAA/AVHRR and EOS/MODIS TIR data. In Fig. 11, TIRanomalies with a different level of intensity of RETIRA index are reported.
The confutation step was performed by considering the same period (March 15- April 15) butin a different year (2008), in order to verify the absence of TIR anomalies in a relativelyseismically unperturbed period (see Genzano et al., 2009a). It is possible to note that just onesequence of TIR anomalies appear in the period considered (Fig. 12). From March 16 to 20 space-time persistent TIR anomalies appear in southern Italy (Calabria region). A seismic event withmagnitude ML~4.0 occurred in the same area on April 8, 2008. Other anomalies appear asspatially isolated and/or not time persistent (disappearing just in one day) probably related tonight-time cloud passages and/or errors in image navigation/co-location processes (see Filizzolaet al. 2004; Aliano et al. 2008a).
During the L’Aquila seismic sequence local crustal deformations were monitored by laserstrain meters (Amoruso and Crescentini, 2010), by DInSAR satellite interferometry (Anzidei etal., 2009) and by GPS stations Anzidei et al. (2009). No significant pre-seismic signal was
Fig. 11 - Validation analysis. SEVIRI images at 00:00 GMT having pixels with RETIRA>4 are reported at a differentlevel of intensity.

163
Evidence of CO2-gas emission variations in the central Apennines Boll. Geof. Teor. Appl., 53, 147-168
detected, probably due to the limited areal significance of laser strain meters and to the lack of a
pre-main shock DInSAR data. No significant pre-main shock GPS possible anomalous data were
detected by GPS data by Anzidei et al. (2009) probably due to the reduced resolving power of the
monitoring network. Caporali (2009) recorded significant anomalous GPS signals starting at the
end of March 2009 but no definitive conclusion has yet been published about possible crustal
topographic anomalous deformations before the mainshock of the L’Aquila seismic sequence. On
Fig. 12 - Confutation: results of the RETIRA index computation over the investigated area for the relativelyunperturbed year 2008. Red boxes contour images having pixels with retira index ≥ 4. Green circles indicate the(unique) sequence of space-time persistent TIR anomalies over the Calabria region.

164
Boll. Geof. Teor. Appl., 53, 147-168 Bonfanti et al.
the other hand, an eventual deformative pattern could be difficult to detect by means of theavailable instruments. Di Luccio et al. (2010) and Plastino et al. (2010) detected pre-seismic,fluid-related signals consistent with strain occurrence at depth, probably not easily detectable atground surface. Ground-based and satellite-based, deep originated, gas monitoring data areconsistent with increased crustal permeability probably induced by strain processes at depth andsignificant signals were detected some days before the mainshock.
6. Conclusions
The one-year monitoring of gaseous fluid emission in SF shows significant anomalies inconcomitance with the L’Aquila seismic swarm. During the most intense phase of gaseousoutflow, large scale TIR anomalies were detected from 7 days before the main shock by applyingRST data analysis to MSG/SEVIRI data. Similar results were independently achieved by Lisi etal. (2010) and Pergola et al. (2010) by applying the same RST approach on TIR data acquiredfrom different (NOAA/AVHRR and EOS/MODIS) satellite sensors. No similar significant TIRanomalies have been detected from satellite observations in the seismically unperturbed periods(March-April 2008) considered for confutation purposes. It should be noted that the most intenseand extended TIR anomalies observed from the satellite, appearing in the epicentral area only afew hours before the main foreshock (ML=4.1 on March 31), are observed in coincidence withsignificant variations of different geophysical parameters independently reported by severalauthors.
In addition to the ones (Caporali 2009; Lisi et al., 2010; Pergola et al., 2010) already quotedabove, having their maximum exactly in the same day (March 31), other anomalous variations ofdifferent geophysical parameters, refering to the same period, are independently reported [e.g.,Rozhnoi et al. (2009) who report significant anomalies in VLF records starting 2 weeks beforethe main shock with a last relative maximum on March 31]. Always in the same period, furtherfluid-related anomalies were detected by Plastino et al. (2010) who observed geochemicalvariations in underground waters and by Di Luccio et al. (2010) who reported significantvariations in Vp/Vs ratios. The Vp/Vs seismological observations that Lucente et al. (2010) reportseem particularly important. The explanatory model (progressive emptying of a wide gasreservoir triggered by the event of March 31) fits perfectly with the one already proposed byTramutoli et al. (2001, 2005) correlating TIR anomalies with an abrupt increase of green-housegas emissions.
The gas geochemistry shows how a CO2-dominated gas phase has been degassed through theruptures occurring in the epicentral area. Such a phenomenon was also recognized in the mainaquifers of the area (Chiodini et al., 2011) and involved a much wider area than the epicentral(Italiano et al., 2009a) one. In order to verify the possible relation between anomalous gas releaseand crustal deformative processes (Atzori et al., 2009) due to the L’Aquila seismic sequence, astatistical data analysis (able to exclude the possible role of meteoclimatic factors) has beencarried out on a long term series of measurements of gas emission performed at the SF site in theepicentral area.
The analysis demonstrated that gas-flow fluctuations cannot be explained by meteorologicalor man-induced factors, so that spike-like and long term anomalies can be explained as the result
165
Evidence of CO2-gas emission variations in the central Apennines Boll. Geof. Teor. Appl., 53, 147-168
of crustal deformative processes and/or crack openings accompanying the L’Aquila seismicswarm. Anomalous signals recorded some days before mainshock evidence showed that crustaldeformative processes and/or crack openings started some days before the mainshock.
Acknowledgments. The authors wish to thank the Aeronautica Militare Italiana for its support to access theMSG-SEVIRI data used in this work. Luciano Telesca acknowledges the financial support received byCNR and DFG in the framework of the CNR/DFG Bilateral Agreement for Scientific and TechnologicalCooperation. Thanks are due to the Regione Umbria (Roberto Zeppetti, Idrografico Umbria) for kindcooperation in meteorological data monitoring and delivering. Thanks are also due to Andrea Dadomo[CNSAS-Corpo Nazionale Soccorso Alpino Speleologico, Fiorenzuola d’Arda (PC), Italy] for concretesupport in well monitoring and in field survey. The research leading to these results received funding fromthe European Union Seventh Framework Programme (FP7/2007-2013) under grant agreement n° 263502– PRE-EARTHQUAKES project: Processing Russian and European EARTH observations forearthQUAKE precursors Studies. The document reflects only the author’s views and the European Unionis not liable for any use that may be made from the information contained herein. Thanks are due to CarlaPetrucci for kind and fruitful cooperation in CO2 monitoring activities.
REFERENCESAliano C., Corrado R., Filizzola C., Genzano N., Pergola N. and Tramutoli V.; 2008a: Robust TIR satellite techniques
for monitoring earthquake active regions: limits, main achievements and perspectives. Ann. Geophys., 51, 303-317.
Aliano C., Corrado R., Filizzola C., Pergola N. and Tramutoli V.; 2007: Robust Satellite Techniques (RST) forseismically active areas monitoring: the case of 21st May, 2003 Boumerdes/Thenia (Algeria) earthquake. In: Proc.of Multitemp, Louven, Belgium, July 18-20, doi: 10.1109/MULTITEMP.2007.4293042.
Aliano C., Corrado R., Filizzola C., Pergola N. and Tramutoli V.; 2008b: Robust satellite techniques (RST) for thethermal monitoring of earthquake prone areas: the case of Umbria-Marche October, 1997 seismic events. Ann.Geophys., 51, 451-459.
Amoruso A. and Crescentini L.; 2010: Limits on earthquake nucleation and other pre-seismic phenomena fromcontinuous strain in the near field of the 2009 L’Aquila earthquake. Geophys. Res. Lett., 37, L10307, doi:10.1029/2010GL043308.
Antonioli A., Piccinini D., Chiaraluce L. and Cocco M.; 2005: Fluid flow and seismicity pattern: evidence from the1997 Umbria-Marche (central Italy) seismic sequence. Geophys. Res. Lett., 32, L10311.
Anzidei M., Boschi E., Cannelli V., Devoti R., Esposito A., Galvani A., Melini D., Pietrantonio G., Riguzzi F., Sepe V.and Serpelloni E.; 2009: Coseismic deformation of the destructive April 6, 2009 L’Aquila earthquake (central Italy)from GPS data. Geophys. Res. Lett., 36, L17307, doi: 1029/2009GL039145.
Atzori S., Hunstad I., Chini M., Salvi S., Tolomei C., Bignami C., Stramondo S., Trasatti E., Antonioli A. and BoschiE.; 2009: Finite fault inversion ofDInSAR coseismic displacement of the 2009 L’Aquila earthquake (Central Italy).Geophys. Res. Lett., 36, L15305, doi: 10.1029/2009GL039293.
Barka A.; 1999: The 17th August 1999 Izmit earthquake. Science, 285, 1858-1859.
Berk A., Bernstein L. and Robertson D.; 1989: MODTRAN: A moderate resolution model for LOWTRAN 7. U.S. AirForce Geophysics Laboratory Tech., Report GL-TR-89-0122, 37 pp. [Available from Geophysics Laboratory, U.S.Air Force, Hanscom AFB, MA, 01731-5000].
Bodvarsson G.; 1970: Confined fluids as strain meters. J. Geophys. Res., 75, 2711-2718.
Caporali A.; 2009: Time series coordinates of CGPS stations in the area of the Abruzzo earthquakes. In: Boncio P.,Brozzetti F., Lavecchia G. and Pizzi A. (eds), The April 2009 L’Aquila earthquake (Italy): first results and futurestrategies, Chieti, June 4, http://www.unich.it/geosis/.
Cervone M., Kafatos D., Napoletani E. and Singh R.P.; 2006: An early warning system for coastal earthquakes. Adv.Space Res., 37, 636-642.
Chiarabba C., Amato A., Anselmi M., Baccheschi P., Bianchi I., Cattaneo M., Cecere G., Chiaraluce L., Ciaccio M.G.,

166
Boll. Geof. Teor. Appl., 53, 147-168 Bonfanti et al.
De Gori P., De Luca G., Di Bona M., Di Stefano R., Faenza L., Govoni A., Improta L., Lucente F.P., Marchetti A.,Margheriti L., Mele F., Michelini A., Monachesi G., Moretti M., Pastori M., Piana Agostinetti N., Piccinini D.,Roselli P., Seccia D. and Valoroso L.; 2009: The 2009 L’Aquila (central Italy) M(W)6.3 earthquake: main shockand aftershocks. Geophys. Res. Lett., 36, L18308, doi: 10.1029/2009gl039627.
Chiodini G., Caliro S., Cardellini C., Frondini F., Inguaggiato S. and Matteucci F.; 2011: Geochemical evidence for andcharacterization of CO2 rich gas source in the epicentral area of the Abruzzo 2009 earthquakes. Earth Planet. Sci.Lett., 304, 389-398.
Chiodini G., Cardellini C., Amato A., Boschi E., Caliro S., Frondini F. and Ventura G.; 2004: Carbon dioxide Earthdegassing and seismogenesis in central and southern Italy. Geophys. Res. Lett., 31, L07615, doi:10.1029/2004gl019480.
Cicerone R.D., Ebel J.E. and Britton J.; 2009: A systematic compilation of earthquake precursors. Tectonophys., 476,371-396.
Corrado R., Caputo R., Filizzola C., Pergola N., Pietrapertosa C. and Tramutoli V.; 2005: Seismically active areamonitoring by robust TIR satellite techniques: a sensitivity analysis on low magnitude earthquakes in Greece andTurkey. Nat. Hazards Earth Syst. Sci., 5, 101-108.
Cuomo V., Filizzola C., Pergola N., Pietrapertosa C. and Tramutoli V.; 2004: A self-sufficient approach for GERBcloudy radiance detection. Atmos. Res., 72, 39-56.
Dey S. and Singh R.P.; 2003: Surface latent heat flux as an earthquake precursor. Nat. Hazards Earth Syst. Sci., 3, 749-755.
Di Bello G., Filizzola C., Lacava T., Marchese F., Pergola N., Pietrapertosa C., Piscitelli S., Scaffidi I. and TramutoliV.; 2004: Robust Satellite Techniques for volcanic and seismic hazards monitoring. Ann. Geophys., 47, 49-64.
Di Luccio F., Ventura G., Di Giovambattista R., Piscini A. and Cinti F.R.; 2010: Normal faults and thrusts reactivatedby deep fluids: the 6 April 2009 Mw 6.3 L’Aquila earthquake, Central Italy. J. Geophys. Res., 115, B06315, doi:10.1029/2009JB007190.
Dobrovolsky I.P., Zubkov S.I. and Miachkin V.I.; 1979: Estimation of the size of earthquake preparation zone. PureAppl. Geophys., 117, 1025-1044.
Faure G.; 1977: Principles of Isotope Geology. J. Wiley press, New York, 464 pp.
Filizzola C., Pergola N., Pietrapertosa C. and Tramutoli V.; 2004: Robust satellite techniques for seismically activeareas monitoring: a sensitivity analysis on September 7, 1999 Athens’s earthquake. Phys. Chem. Earth, 29, 517-527, doi: 10.1016/j.pce.2003.11.019.
Finetti I.R., Boccaletti M., Bonini M., Del Ben A., Geletti R., Pipan M. and Sani F.; 2001: Crustal section based onCROP seismic data across the North Tyrrhenian-Northern Apennines-Adriatic Sea. Tectonophys., 343, 135-163.
Freund F.T.; 2002: Charge generation and propagation in rocks. J. Geodyn., 33, 545-572.
Freund F.T., Takeuchi A. and Lau B.W.; 2006: Electric currents streaming out of stressed igneous rocks - A step towardsunderstanding pre-earthquake low frequency EM emissions. Phys. Chem. Earth, 31, 389-396.
Genzano N., Aliano C., Corrado R., Filizzola C., Lisi M., Mazzeo G., Paciello R., Pergola N. and Tramutoli V. ; 2009a:RST analysis of MSG-SEVIRI TIR radiances at the time of the Abruzzo 6 April 2009 earthquake. Nat. Hazards EarthSyst. Sci., 9, 2073-2084.
Genzano N., Aliano C., Corrado R., Filizzola C., Lisi M., Paciello R., Pergola N., Tsamalashvili T. and Tramutoli V.;2009b: Assessing of the Robust Satellite Technique (RST) in areas with moderate seismicity. In: Proc. of Multitemp,Mistic, Connecticut, USA, July 28-30, pp. 307-314.
Genzano N., Aliano C., Filizzola C., Pergola N. and Tramutoli V.; 2007: Robust satellite technique for monitoringseismically active areas: the case of Bhuj-Gujarat earthquake. Tectonophys., 431, 197-210.
Hartmann J. and Levy J.K.; 2005: Hydrogeological and gasgeochemical earthquake precursors - A review forapplication. Nat. Hazards, 34, 279-304.
Heinicke J., Italiano F., Lapenna V., Martinelli G. and Nuccio P.M.; 2000: Coseismic geochemical variations in somegas emissions of Umbria region (Central Italy). Phys. Chem. Earth Part A, 25, 289-293.
Heinicke J., Martinelli G. and Telesca L.; 2011: Geodynamically induced variations in the emission of CO2 gas at SanFaustino (Central Apennines, Italy). Geofluids, 2, 95-107.
Hoefs J.; 1980: Stable Isotope Geochemistry. Springer, Berlin, 208 pp.
Irwin W.P. and Barnes I.; 1980: Tectonic relations of carbon dioxide discharges and earthquakes. J. Geophys. Res., 85,

167
Evidence of CO2-gas emission variations in the central Apennines Boll. Geof. Teor. Appl., 53, 147-168
3115-3121.
Italiano F., Martinelli G. and Bonfanti P.; 2009a: Modifiche delle caratteristiche geochimiche dei fluidi circolantinell’Appennino Centrale indotte dal terremoto del 6 Aprile: ricadute sulla valutazione della prevedibilità di unterremoto. In: Atti 28° Convegno Nazionale GNGTS, Trieste, Novembre 16-19, riassunti estesi, pp. 384-385.
Italiano F., Martinelli G., Bonfanti P. and Caracausi A.; 2009b: Long-term (1997-2007) geochemical monitoring ofgases from the Umbria-Marche region. Tectonophys., 476, 282-296.
Italiano F., Martinelli G. and Nuccio P.M.; 2001: Anomalies of mantle-derived helium during the 1997-1998 seismicswarm of Umbria-Marche, Italy. Geophys. Res. Lett., 28, 839-842.
Italiano F., Martinelli G. and Plescia P.; 2008: CO2 degassing over seismic areas: the role of mechanochemicalproduction at the study case of Central Apennines. Pure Appl. Geophys., 165, 75-94.
Javoy M., Pineau F. and Delorme H.; 1986: Carbon and nitrogen isotopes in the mantle. Chem. Geol., 57, 41-62, doi:10.1016/0009-2541(86)90093-8.
Lisi M., Filizzola C., Genzano N., Grimaldi C.S., Lacava T., Marchese F., Mazzeo G., Pergola N. and Tramutoli V.;2010: A study on the Abruzzo 6 April 2009 earthquake by applying the RST approach to 15 years of AVHRR TIRobservations. Nat. Hazards Earth Syst. Sci., 10, 395-406.
Lucente F.P., Gori P.D., Margheriti L., Piccinini D., Bona M.D., Chiarabba C. and Agostinetti N.P.; 2010: Temporalvariation of seismic velocity and anisotropy before the 2009 MW 6.3 L’Aquila earthquake, Italy. Geology, 38, 1015-1018, doi: 10.1130/G31463.1.
Manga M. and Wang C.-Y.; 2007: Earthquake hydrology. In: Schubert G. (ed), Treatise on Geophysics, Vol. 4, pp. 293-320.
Miller S.A., Collettini C., Chiaraluce L., Cocco M., Barchi M. and Kaus B.J.P.; 2004: Aftershocks driven by a highpressure CO2 source at depth. Nature, 427, 724-727, doi: 10.1038/nature02251.
Minissale A.; 2004: Origin, transport and discharge of CO2 in central Italy. Earth Sci. Rev., 66, 89-141.
Montone P. and Mariucci M.T.; 1999: Active stress along the NE external margin of the Apennines: the Ferrara arc,northern Italy. J. Geodyn., 28, 251-265.
Pace B., Peruzza L., Lavecchia G. and Boncio P.; 2006: Layered seismogenic source model and probabilistic seismic-hazard analyses in central Italy. Bull. Seismol. Soc. Am., 96, 107-132.
Pauselli C., Barchi M.R., Federico C., Magnani M.B. and Minelli G.; 2006: The crustal structure of the NorthernApennines (central Italy): An insight by the CROP03 seismic line. Am. J. Sci., 306, 428-450.
Pergola N., Aliano C., Coviello I., Filizzola C., Genzano N., Lacava T., Lisi M., Mazzeo G. and Tramutoli V.; 2010:Using RST approach and EOS-MODIS radiances for monitoring seismically active regions: a study on the 6 April2009 Abruzzo earthquake. Nat. Hazards Earth Syst. Sci., 10, 239-249.
Pietrapertosa C., Pergola N., Lanorte V. and Tramutoli V.; 2001: Self adaptive algorithms for change detection: OCA(the Onechannel Cloud-detection Approach) an adjustable method for cloudy and clear radiances detection. In: LeMarshall J.F. and Jasper J.D. (eds), Tech. Proc. 11th International (A) TOVS Study Conference (ITSC-XI),Budapest, September 20–26, pp. 281-291.
Plastino W., Povinec P.P., De Luca G., Doglioni C., Nisi S., Ioannucci L., Balata M., Laubenstein M., Bella F. andCoccia E.; 2010: Uranium groundwater anomalies and L’Aquila earthquake, 6th April 2009 (Italy). J. Environ.Radioact., 101, 45-50.
Pulinets S.A., Kotsarenko A.N., Ciraolo L. and Pulinets I.A.; 2007: Special case of ionospheric day-to-day variabilityassociated with earthquake preparation. Adv. Space Res., 39, 970-977.
Pulinets S.A., Ouzounov D., Krelin A.V., Boyarchuk K.A. and Pokhmelnykh L.A.; 2006: The physical nature ofthermal anomalies observed before strong earthquakes. Phys. Chem. Earth, 31, 143-153.
Qiang Z.J., Xu X.D. and Dian C.G.; 1991: Thermal infrared anomaly precursor of impending earthquakes. Chin. Sci.Bull., 36, 319-323.
Rozhnoi A., Solovieva M., Molchanov O., Schwingenschuh K., Boudjada M., Biagi P.F., Maggipinto T., Castellana L.,Ermini A. and Hayakawa M.; 2009: Anomalies in VLF radio signals prior the Abruzzo earthquake (M=6.3) on 6April 2009. Nat. Hazards Earth Syst. Sci., 9, 1727-1732.
Sano Y. and Marty B.; 1995: Origin of carbon in fumarolic gas from island arc. Chem. Geol., 119, 265-274, doi:10.1016/0009-2541(94)00097-R.
Schidlowski M., Hayes J.M. and Kaplan I.R.; 1983: Isotopic inferences of ancient biochemistries: Carbon, sulfur,

168
Boll. Geof. Teor. Appl., 53, 147-168 Bonfanti et al.
hydrogen and nitrogen. In: Schopf J.W. (ed), Earth’s Earliest Biosphere, Princeton University Press, Princeton, N.J.,pp. 149-186.
Scholz C.H., Sykes L.R. and Aggarwal Y.P.; 1973: Earthquake prediction: a physical basis. Science, 181, 803-810.
Singh V., Singh B., Manoj Kumar A. and Hayakawa M.; 2006: Identification of earthquake sources responsible forsubsurface VLF electric field emissions observed at Agra. Phys. Chem. Earth, 31, 325-335.
Terakawa T., Zoporowski A., Galvan B. and Miller S.A.; 2010: High-pressure fluid at hypocentral depths in theL’Aquila region inferred from earthquake focal mechanisms. Geology, 38, 995-998, doi: 10.1130/G31457.1
Toutain J.P. and Baubron J.C.; 1999: Gas geochemistry and seismotectonics: a review. Tectonophys., 304, 1-27.
Tramutoli V.; 1998: Robust AVHRR Techniques (RAT) for environmental monitoring: theory and applications. In:Zilioli E. (ed), Proc. of SPIE, Vol. 3496, pp. 101-113.
Tramutoli V.; 2007: Robust Satellite Techniques (RST) for natural and environmental hazards monitoring andmitigation: theory and applications. In: Proc. of Multitemp, Louven, Belgium, July 18-20, doi:10.1109/MULTITEMP.2007.4293057.
Tramutoli V., Aliano C., Corrado R., Filizzola C., Genzano N., Lisi M., Lanorte V., Tsamalashvili T. and Pergola N.;2009: Abrupt change in greenhouse gases emission rate as a possible genetic model of TIR anomalies observedfrom satellite in Earthquake active regions. In: Proc. of 33rd Int. Symp. on Remote Sens. Environ. (ISRSE33),Stresa, Italy, May 4-8, pp. 567-570.
Tramutoli V., Cuomo V., Filizzola C., Pergola N. and Pietrapertosa C.; 2005: Assessing the potential of thermal infraredsatellite surveys for monitoring seismically active areas: the case of Kocaeli (‹zmit) earthquake, August 17, 1999.Remote Sens. Environ., 96, 409-426, doi: 10.1016/j.rse.2005.04.006.
Tramutoli V., Di Bello G., Pergola N. and Piscitelli S.; 2001: Robust satellite techniques for remote sensing ofseismically active areas. Ann. Geofis., 44, 295-312.
Tramutoli V., Lanorte V., Pergola N., Pietrapertosa C., Ricciardelli E. and Romano F.; 2000: Self-adaptive algorithmsfor environmetal monitoring by SEVIRI and GERB: a preliminary study. In: Proc. of the EUMETSATMeteorological Satellite data User’s Conference, Bologna, Italy, May 29 - June 2, pp. 79-87.
Tronin A.A., Hayakawa M. and Molchanov O.A.; 2002: Thermal IR satellite data application for earthquake researchin Japan and China. J. Geodyn., 33, 519-534.
Valensise G., and Pantosti D. (eds); 2001: Database of potential sources for earthquakes larger than 5.5 in Italy. Ann.Geofis., 44, Suppl. 180 pp., with CD-ROM.
Vautard R., Yiou P. and Ghil M.; 1992: Singular-spectrum analysis: A toolkit for short, noisy chaotic signals. PhysicaD, 58, 95-126.
Yasuoka Y., Igarashi G., Ishikawa T., Tokonami S. and Shinogi M.; 2006: Evidence of precursor phenomena in the Kobeearthquake obtained from atmospheric radon concentration. Appl. Geochem., 21, 1064-1072.
Corresponding author: Luciano TelescaC.N.R., Istituto di Metodologie per l’Analisi AmbientaleCorso da S. Loja, 85050 Tito Scalo (PZ), ItalyPhone: +39 0971 427277; fax: +39 0971 427271; e-mail: [email protected]


