Embed Size (px)
Citation preview
Evolution of CO2 and soil carbon dynamics in biologically
managed, row-crop agroecosystems
E.A. Paula,*, D. Harrisb, H.P. Collinsc, U. Schulthessa, G.P. Robertsond
a Department of Crop and Soil Sciences, Michigan State University, East Lansing, MI 48824, USAb Stable Isotope Facility, University of California at Davis, Davis, CA 95616, USA
c 7535 Mesplay Avenue SE, Lacey, WA 98503, USAd W.K. Kellogg Biological Station, Hickory Corners, MI 49060, USA
Received 10 November 1997; accepted 4 April 1998
Abstract
Field CO2 production was related to soil carbon pools and ¯uxes determined by laboratory incubation of soils from
agroecosystems designed to test the possibility of substituting biological for chemical inputs. Treatments included:
conventional and organic-based row crops, woody and herbaceous perennial crops and historically tilled and never tilled
successional ®elds. The CO2 ef¯ux in corn and soybeans was affected by crop residues from previous years and growing
season temperatures but not soil moisture. Overwinter cover crops and perennials such as alfalfa and poplar, resulted in fairly
uniform ¯uxes of approximately 20 kg CO2±C haÿ1 dayÿ1 throughout the non-frozen period. Highest ¯uxes occurred in
alfalfa, historically tilled successional and never tilled, grassland successional treatments, although, highest aboveground
productivity occurred in the corn and poplar. Summed, ®eld CO2 ¯uxes were similar to residue-C inputs. Measurement of CO2
mineralized in extended incubations in the laboratory made it possible to use soil enzyme activity to determine the size and
dynamics of soil C pools. The residue of acid hydrolysis de®ned the size of the resistant pool Cr. Carbon dating determined its
mean residence time (MRT). Curve analyses of CO2 evolution plotted on a per unit time basis gave the active (Ca) and slow
(Cs) pool sizes and decomposition rate constants ka and ks. Temperature correction factors provided ®eld MRTs. The active
pool of this coarse textured soil represents 2% of the soil C with a MRT of 30±66 days. The slow pool represents 40±45% of
the SOC with ®eld MRTs of 9±13 years. The poplar soil has the greatest MRT for both the active and slow pools. The system
approach to land use sustainability (SALUS) model, which predicts CO2 evolution from decomposition in the ®eld as part of a
plant growth ± soil process model, was tested using the decomposition parameters determined by incubation and 14C dating.
The model satisfactorily predicted the intra and inter year differences in ®eld CO2 but over predicted ¯uxes from residues in
the fall. It does not yet adequately consider a lag period during which the residues lose their hydrophobicity, are comminuted
and colonized. # 1999 Elsevier Science B.V.
Keywords: Carbon; Nitrogen; Soil organic fractions; Mineralization; CO2; Agroecosystem; Sustainable agriculture
1. Introduction
The evolution of CO2 under ®eld conditions repre-
sents respiration by plant roots and soil biota and is a
sensitive indicator of abiotic controls, crop residue
decomposition, soil organic carbon (SOC) turnover
and ecosystem disturbance. Other CO2 producing
reactions such as anaerobic respiration, methane
formation and carbonic acid reactions only slightly
affect the relationship between CO2 ¯ux and aerobic
Applied Soil Ecology 11 (1999) 53±65
*Corsponding author. Tel.: +517 355 0262; fax: +517 355 0270.
0929-1393/99/$ ± see front matter # 1999 Elsevier Science B.V. All rights reserved.
P I I : S 0 9 2 9 - 1 3 9 3 ( 9 8 ) 0 0 1 3 0 - 9
respiration. There is generally a good agreement
between dynamic, infrared gas analysis or static cham-
bers with a CO2 absorbent (Zibilske, 1994) and eddy
¯ux methodology (Rochette et al., 1997). In some
cases, static chamber systems show more CO2 ¯ux
than the dynamic systems at low rates of evolution; the
converse is true at high evolution rates (Jensen et al.,
1996).
Soil management in sustainable agriculture is
aimed at developing economically sound, environ-
mentally safe cropping systems that substitute biolo-
gical management for chemical inputs. It involves
differing tillage and crop rotations with different
inputs and qualities of residues. Sustainable agro-
nomic systems usually are associated with signi®cant
pools of SOC. These include both rapid and slow
release pools (Paul et al., 1995), whose size and
turnover are utilized in describing SOC dynamics.
The size and turnover rates of these pools have in
the past been dif®cult to measure. The active (Ca) and
slow (Cs) fractions now can be ascertained by analyz-
ing the rates of CO2 released during SOC decomposi-
tion under extended laboratory conditions (Nicolardot
et al., 1994; Collins et al., 1998). The residue of acid
hydrolysis has been shown to indicate the size of the
resistant pool (Cr). Carbon dating measures its mean
residence time (MRT) (Trumbore, 1993; Paul et al.,
1997a).
Comparison of ®eld CO2 evolution rates with CO2
rates determined in the laboratory allows one to better
model ®eld data and interrelate knowledge on SOC
dynamics with the ®eld decomposition rates under
differing management. The evolution of CO2, in
extended laboratory incubations, indicates substrate
availability because the microbes and their enzymes
effectively characterize the availability of SOC pools.
Substrate availability is a function of the amount
present, its quality (Kern and Johnson, 1993), its
location (Holland and Coleman, 1986) and the degree
of physical protection within soil (Aiken et al., 1991;
Carter and Stewart, 1996). These characteristics can
best be determined under constant conditions in the
laboratory. Field CO2 evolution rates are dependent on
root respiration, moisture and temperature controls of
plant residue decomposition and mixing of both above
and beneath ground substrates. They also re¯ect
microbial biomass (Horwath et al., 1996), and diver-
sity (Klug person. comm.), plant changes (Huberty
et al., 1998), and the effect of the soil water content on
CO2 transfer rates; in situ ¯uxes of CO2 are too
complex for the determination of SOC pool sizes.
We conducted ®eld CO2 evolution measurements
and extended laboratory incubation of soils from a
long-term agroecosystem study aimed at developing
economically sound and environmentally safe crop-
ping systems that substitute biological management
for agricultural chemicals. The laboratory incubations
supplement other measurements such as carbon dating
and 13C=12C analyses used to determine SOC
dynamics on these soils (Collins et al., 1998). The
use of such related measurements on long-term plots
with known histories of climate, plant residue inputs,
and biotic diversity allows better concept development
relating soil characteristics (Sollins et al., 1996) to
ecosystem functioning. It also facilitates the testing of
models (Paustian et al., 1992; Parton and Rasmussen,
1994), and extrapolation of both the models and
concepts to other sites (Paul et al., 1997b) involved
in climate change and sustainable agriculture research
(Robertson and Paul, 1998).
2. Materials and methods
2.1. Site characteristics
This study was conducted at the W.K. Kellogg
Biological Station (KBS) Long Term Ecological
Research (LTER) site for agricultural ecology located
in southwest Michigan. Climate is characterized by
cool moist winters and warm humid summers. Pre-
cipitation averages 920 mm year evenly distributed
throughout the year. Surface soil temperatures are
usually less than 58C from December through March.
They exceed 108C by 15 April (Fig. 1). The KBS site
is located on a pitted outwash plain-moraine complex.
Upland soils are Al®sols that developed under oak-
hickory (Quercus-Carya) forests with minor areas of
elm-ash (Ulmus-Fraxinus) and beech-maple (Fagus-
Acer) (Kuchler, 1964). Current vegetation is a mixture
of forest, successional and agricultural species (Bur-
bank and Pregitzer, 1992). The principal soil types are
Kalamazoo (Fine-loamy, mixed, mesic), and Oshtemo
(Coarse-loamy, mixed, mesic), Typic Hapludalfs that
vary mainly in the thickness of the argillic (Bt) horizon
(Whiteside, 1982; Crum et al., 1988).
54 E.A. Paul et al. / Applied Soil Ecology 11 (1999) 53±65
Four annual crop and three perennial treatments
were established in 1989 on a 42 ha cultivated ®eld,
that had been in a corn/soybean (Zea mayes L./Glycine
max L.) rotation under moldboard plow tillage for >50
years. Treatments consisted of: (1) a moldboard plo-
wed (conventional) corn/soybean rotation (CT), (2)
no-tillage (NT) corn/soybeans, (3) a corn/soybean /
wheat rotation that included legume cover crops and
low chemical inputs (LI), and (4) a treatment similar to
(3) but with zero-chemical inputs (ZI). Management
of the LI and ZI incorporated mechanical weed control
and inputs of leguminous residue to offset lower or no
inorganic fertilizer and pesticides (Robertson et al.,
1998).
The three perennial treatments consist of hybrid
poplar (Populus euramericana cv Eugenei), alfalfa
(Medicago sativa L.) and a historically tilled succes-
sional community (HTS) allowed to establish in 1989
on the previously tilled site. A never-tilled succes-
sional (NTS) plot located 200 m south of the main site
on the same soil series comprises the eighth treatment.
Old-growth trees were harvested from this site around
1956; mowing since then, has maintained a herba-
ceous community.
2.2. Field measurements
Plant biomass was measured by clipping corn,
soybeans, wheat, alfalfa, legume, and weed spp.
and by allometric measurements of the poplars. The
®eld-crop-residue returned to the soil was calculated
by subtracting the grain yield from the total above-
ground plant biomass. Alfalfa was harvested in late
May, early July, mid-August, and mid-October in
1993. It was killed by herbicide and replanted in
spring 1994. Total soil C and N were measured on
a Carlo Erba CHN analyzer. Soil moisture was deter-
mined gravimetrically during CO2 sampling. A
weather station recorded air and soil temperature,
windspeed and direction, solar radiation, and wet
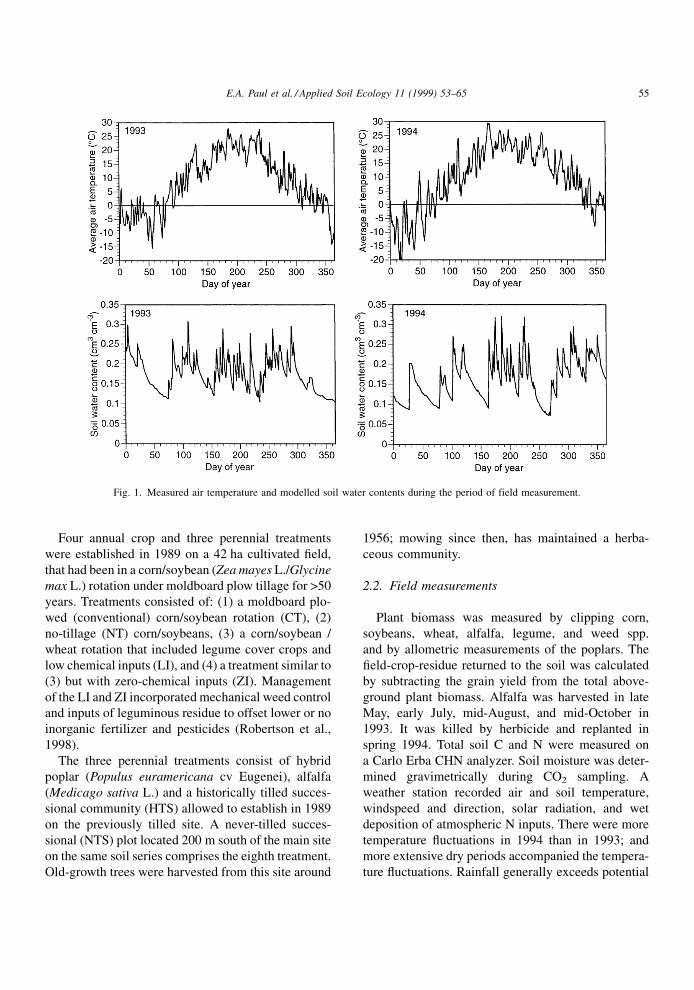
deposition of atmospheric N inputs. There were more
temperature ¯uctuations in 1994 than in 1993; and
more extensive dry periods accompanied the tempera-
ture ¯uctuations. Rainfall generally exceeds potential
Fig. 1. Measured air temperature and modelled soil water contents during the period of field measurement.
E.A. Paul et al. / Applied Soil Ecology 11 (1999) 53±65 55
evapotranspiration (PET from the middle of Septem-
ber through late April (Crum et al., 1988).
Field ¯uxes of CO2 from soil were determined by
measuring time-series changes in CO2 concentrations
in static chambers. A two-piece chamber composed of
a high impact white polystyrene lid and an aluminum
base, with a total headspace of 16.7 l and covering
0.075 mÿ2, was inserted 2.5 cm into mineral soil. At 0,
45, 90, and 135 min, 10 ml headspace air samples
were collected and stored, over-pressurized, in 3 ml
serum bottles. Carbon dioxide concentration was mea-
sured by injecting 1 ml of the sample into a helium or
N2 carrier gas ¯owing through a calibrated infrared
gas analyzer (Beckman Model 865). Linear regression
of CO2 concentration vs. elapsed sampling time pro-
vided CO2 ¯ux estimates for individual chambers.
Analysis of the CO2 ¯uxes included regression ana-
lysis using CO2 ef¯ux as the dependent variable
and independent variables such as soil and air tem-
perature and gravimetric soil moisture. Responses to
temperature were also tested using the Arrhenius
equation.
Laboratory incubations were conducted on compo-
site samples of soil sieved to 4 mm and adjusted to
50% of water holding capacity. The soils were incu-
bated in 1 l canning jars at 258C in the dark. Carbon
dioxide was trapped in NaOH (2 ml, 2 M) in a 20 ml
vial. The CO2 traps were replaced initially at 10-days
intervals and later after longer periods. Control jars
contained no soil. The average rate of CO2 evolution
for each interval was measured by titration of residual
NaOH to pH 7.0 with 0.3 M HCL, after the addition
2 ml of 2 M SrCl2 (Harris et al., 1997).
We determined pool sizes and dynamics by a com-
bination of techniques. The analyses are based on the
use of a model with three pools, which decompose
according to ®rst-order kinetics with the equation
Cmin � Caeÿkat � Cseÿkst � Cre
ÿkrt
where; Ca,ka�active pool; Cs,ks�slow pool; Cr,kr�resistant pool. Acid hydrolysis, consisting of re¯uxing
soil in 6 M HCL, determined the size of the non-
hydrolyzable, resistant pool (Cr). Carbon dating deter-
mined its MRT (Paul et al., 1997a). We determined the
size and turnover rates of the Ca and CS pools by non-
linear regression of the rate of change of CO2 evolu-
tion with time. Three parameters, Ca, ka and ks were
estimated using the non-linear regression routine
(PROC NLIN) of SAS. The Cs pool was de®ned as
the residual (Cs � Ct ÿ Ca ÿ Cr).
MRT is the reciprocal of the decomposition rate
constant in ®rst-order reactions. The MRT derived
from laboratory incubation at 258C was scaled to
average ®eld temperature (98C) by assuming a Q10
of 2�2�25ÿ9�=10 � 3�.We used the system approach to land use sustain-
ability (SALUS) model (Schulthess and Ritchie,
1996) to simulate the daily CO2±C evolution from
SOC and crop residues. The model runs on a daily
time-step. It simulates a water balance, SOC, N
dynamics, a heat balance, plant growth and plant
development. The SOC dynamics are simulated with
procedures adapted from the CENTURY-model (Par-
ton et al., 1988; Paustian et al., 1992). The model does
not predict root respiration from plants. Data from the
incubation study (Tables 5 and 6) were used to initi-
alize the soil C pools. The model was calibrated to
predict a similar amount of biomass production as
measured in the ®eld.
3. Results
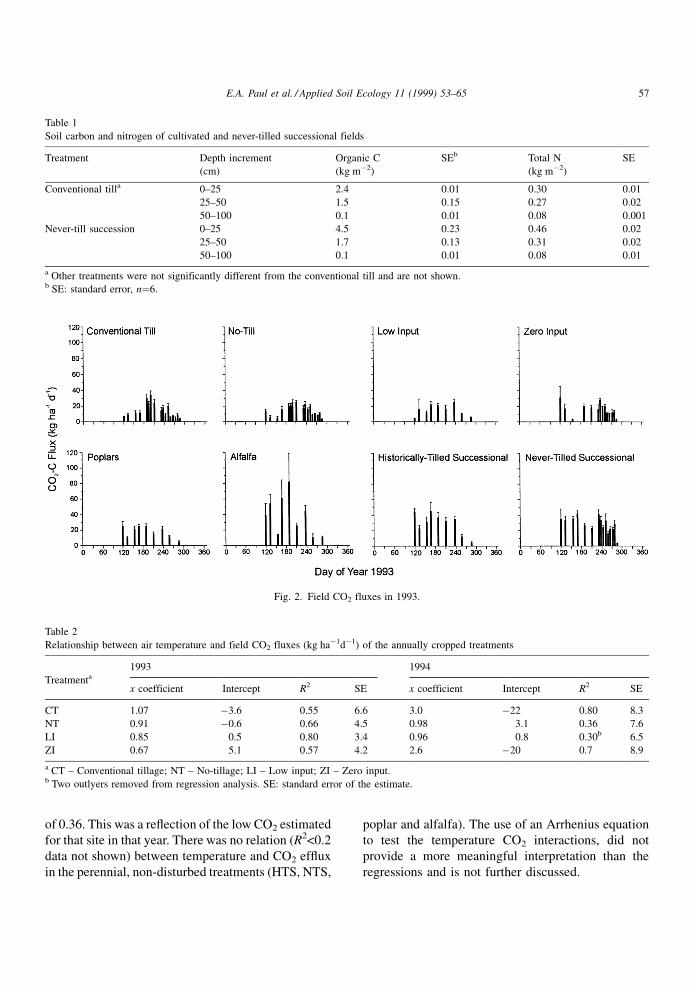
3.1. Soil CO2±C efflux rates
The 4±5 years of treatment imposed at this site prior
to the time of sampling had not yet resulted in sig-
ni®cant differences in SOC (Table 1). The ef¯ux of
CO2±C in 1993 (Fig. 2) and 1994 (Fig. 3) was sea-
sonally dependent in the cultivated crop (CT) with no
ground cover. Ef¯ux rates were more temporally uni-
form in the no-till (NT) site and even more so in the
low input (LI) and zero input (ZI) that incorporated a
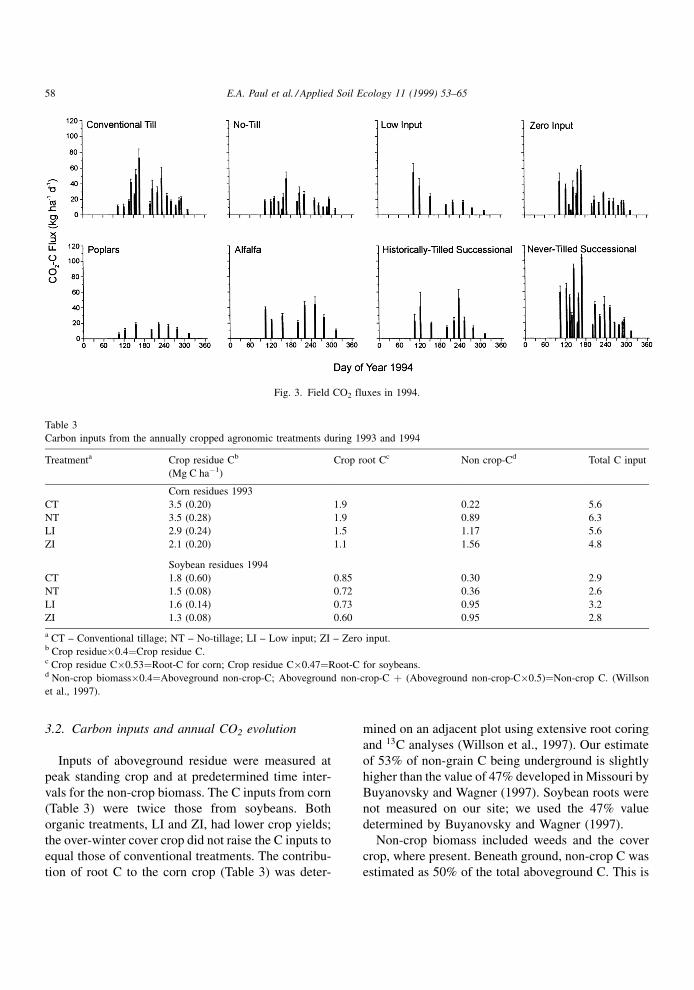
legume ground cover. Killing and reseeding of the
alfalfa in 1994 resulted in more seasonally uniform
evolution of CO2 that year. The uniformity in CO2
evolution throughout the growing season was
even more evident in the poplar, HTS and in the
NTS.
The CO2 ¯ux was not signi®cantly correlated with
soil moisture. Better correlations were obtained with
air temperature than with modeled soil temperatures
(data not shown). Linear regression models between
air temperature and evolved CO2±C for the agronomic
sites (Table 2) explained 55±80% of the variance
except for the NT treatment in 1994 that had an R2
56 E.A. Paul et al. / Applied Soil Ecology 11 (1999) 53±65
of 0.36. This was a re¯ection of the low CO2 estimated
for that site in that year. There was no relation (R2<0.2
data not shown) between temperature and CO2 ef¯ux
in the perennial, non-disturbed treatments (HTS, NTS,
poplar and alfalfa). The use of an Arrhenius equation
to test the temperature CO2 interactions, did not
provide a more meaningful interpretation than the
regressions and is not further discussed.
Table 1
Soil carbon and nitrogen of cultivated and never-tilled successional fields
Treatment Depth increment Organic C SEb Total N SE
(cm) (kg mÿ2) (kg mÿ2)
Conventional tilla 0±25 2.4 0.01 0.30 0.01
25±50 1.5 0.15 0.27 0.02
50±100 0.1 0.01 0.08 0.001
Never-till succession 0±25 4.5 0.23 0.46 0.02
25±50 1.7 0.13 0.31 0.02
50±100 0.1 0.01 0.08 0.01
a Other treatments were not significantly different from the conventional till and are not shown.b SE: standard error, n�6.
Fig. 2. Field CO2 fluxes in 1993.
Table 2
Relationship between air temperature and field CO2 fluxes (kg haÿ1dÿ1) of the annually cropped treatments
1993 1994
Treatmenta
x coefficient Intercept R2 SE x coefficient Intercept R2 SE
CT 1.07 ÿ3.6 0.55 6.6 3.0 ÿ22 0.80 8.3
NT 0.91 ÿ0.6 0.66 4.5 0.98 3.1 0.36 7.6
LI 0.85 0.5 0.80 3.4 0.96 0.8 0.30b 6.5
ZI 0.67 5.1 0.57 4.2 2.6 ÿ20 0.7 8.9
a CT ± Conventional tillage; NT ± No-tillage; LI ± Low input; ZI ± Zero input.b Two outlyers removed from regression analysis. SE: standard error of the estimate.
E.A. Paul et al. / Applied Soil Ecology 11 (1999) 53±65 57
3.2. Carbon inputs and annual CO2 evolution
Inputs of aboveground residue were measured at
peak standing crop and at predetermined time inter-
vals for the non-crop biomass. The C inputs from corn
(Table 3) were twice those from soybeans. Both
organic treatments, LI and ZI, had lower crop yields;
the over-winter cover crop did not raise the C inputs to
equal those of conventional treatments. The contribu-
tion of root C to the corn crop (Table 3) was deter-
mined on an adjacent plot using extensive root coring
and 13C analyses (Willson et al., 1997). Our estimate
of 53% of non-grain C being underground is slightly
higher than the value of 47% developed in Missouri by
Buyanovsky and Wagner (1997). Soybean roots were
not measured on our site; we used the 47% value
determined by Buyanovsky and Wagner (1997).
Non-crop biomass included weeds and the cover
crop, where present. Beneath ground, non-crop C was
estimated as 50% of the total aboveground C. This is
Fig. 3. Field CO2 fluxes in 1994.
Table 3
Carbon inputs from the annually cropped agronomic treatments during 1993 and 1994
Treatmenta Crop residue Cb Crop root Cc Non crop-Cd Total C input
(Mg C haÿ1)
Corn residues 1993
CT 3.5 (0.20) 1.9 0.22 5.6
NT 3.5 (0.28) 1.9 0.89 6.3
LI 2.9 (0.24) 1.5 1.17 5.6
ZI 2.1 (0.20) 1.1 1.56 4.8
Soybean residues 1994
CT 1.8 (0.60) 0.85 0.30 2.9
NT 1.5 (0.08) 0.72 0.36 2.6
LI 1.6 (0.14) 0.73 0.95 3.2
ZI 1.3 (0.08) 0.60 0.95 2.8
a CT ± Conventional tillage; NT ± No-tillage; LI ± Low input; ZI ± Zero input.b Crop residue�0.4�Crop residue C.c Crop residue C�0.53�Root-C for corn; Crop residue C�0.47�Root-C for soybeans.d Non-crop biomass�0.4�Aboveground non-crop-C; Aboveground non-crop-C � (Aboveground non-crop-C�0.5)�Non-crop C. (Willson
et al., 1997).
58 E.A. Paul et al. / Applied Soil Ecology 11 (1999) 53±65
substantially higher than the ratio of root C to total
aboveground C (including grain) of 0.24, we measured
for corn. Total C inputs (Table 3) re¯ect the lower
yields of the zero input (ZI) plots and the lower inputs
under soybeans.
The CO2 evolved annually on the agronomic sites
(Table 4) was calculated by integrating the daily
values over the measurement period. The CO2 evolu-
tion, during non-growing periods, when measure-
ments were not made, was estimated using the
regression constants developed for temperature and
daily rates of CO2 evolution. The less-disturbed sites
had fairly constant CO2 ¯ux over the growing season
and did not give signi®cant regressions for the daily
evolution rates. Therefore, annual ¯ux rates were not
calculated. There was a delay in CO2 evolution rela-
tive to crop growth and residue inputs. The 1993 CO2
data, when the ®eld was planted to corn, represent the
corn root respiration plus the decomposition of the
soybean residues from the previous year. The CO2
evolved in 1994, composed of soybean root respiration
and the decomposition of the corn residue from the
previous year, was 26% higher than in 1993. Compar-
ison of C inputs with CO2 evolution (Table 4) shows a
slight positive balance for CO2±C evolution values
except for the NT site which was shown earlier
(Table 2) to have low evolution rates and a poor
regression between temperature and CO2 evolution.
3.3. Carbon mineralization in the laboratory
Laboratory incubation utilizes the degradative
enzymes of the soil biota to provide an analytical
estimate of the soil C pools and ¯uxes. These can be
related to ®eld CO2 evolution and plant-C inputs in
determining the role of biological inputs in sustainable
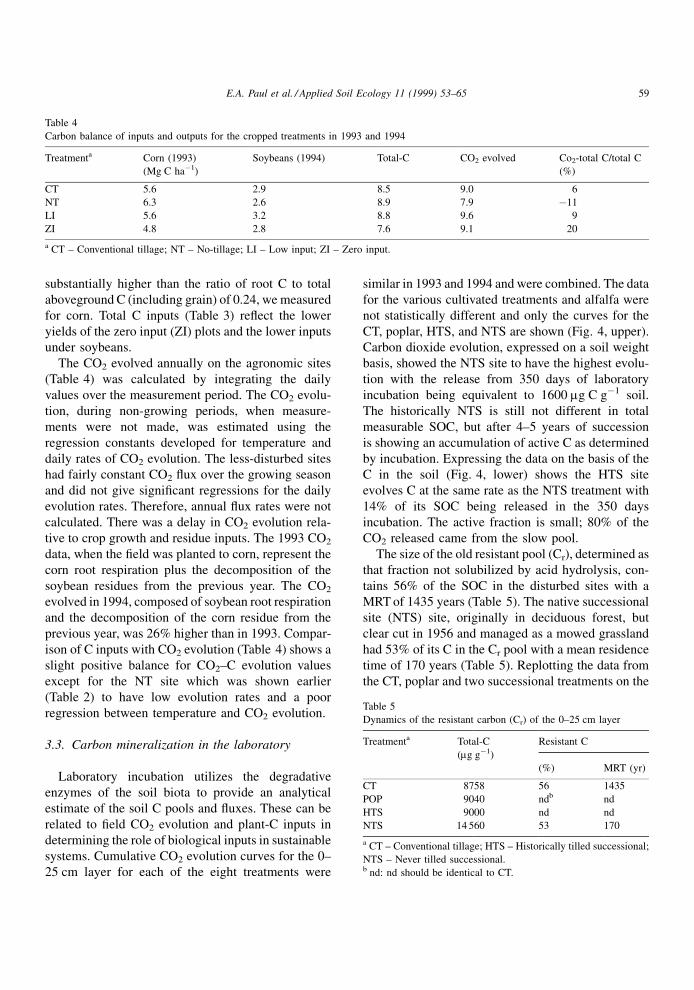
systems. Cumulative CO2 evolution curves for the 0±
25 cm layer for each of the eight treatments were
similar in 1993 and 1994 and were combined. The data
for the various cultivated treatments and alfalfa were
not statistically different and only the curves for the
CT, poplar, HTS, and NTS are shown (Fig. 4, upper).
Carbon dioxide evolution, expressed on a soil weight
basis, showed the NTS site to have the highest evolu-
tion with the release from 350 days of laboratory
incubation being equivalent to 1600 mg C gÿ1 soil.
The historically NTS is still not different in total
measurable SOC, but after 4±5 years of succession
is showing an accumulation of active C as determined
by incubation. Expressing the data on the basis of the
C in the soil (Fig. 4, lower) shows the HTS site
evolves C at the same rate as the NTS treatment with
14% of its SOC being released in the 350 days
incubation. The active fraction is small; 80% of the
CO2 released came from the slow pool.
The size of the old resistant pool (Cr), determined as
that fraction not solubilized by acid hydrolysis, con-
tains 56% of the SOC in the disturbed sites with a
MRT of 1435 years (Table 5). The native successional
site (NTS) site, originally in deciduous forest, but
clear cut in 1956 and managed as a mowed grassland
had 53% of its C in the Cr pool with a mean residence
time of 170 years (Table 5). Replotting the data from
the CT, poplar and two successional treatments on the
Table 4
Carbon balance of inputs and outputs for the cropped treatments in 1993 and 1994
Treatmenta Corn (1993) Soybeans (1994) Total-C CO2 evolved Co2-total C/total C
(Mg C haÿ1) (%)
CT 5.6 2.9 8.5 9.0 6
NT 6.3 2.6 8.9 7.9 ÿ11
LI 5.6 3.2 8.8 9.6 9
ZI 4.8 2.8 7.6 9.1 20
a CT ± Conventional tillage; NT ± No-tillage; LI ± Low input; ZI ± Zero input.
Table 5
Dynamics of the resistant carbon (Cr) of the 0±25 cm layer
Treatmenta Total-C
(mg gÿ1)
Resistant C
(%) MRT (yr)
CT 8758 56 1435
POP 9040 ndb nd
HTS 9000 nd nd
NTS 14 560 53 170
a CT ± Conventional tillage; HTS ± Historically tilled successional;
NTS ± Never tilled successional.b nd: nd should be identical to CT.
E.A. Paul et al. / Applied Soil Ecology 11 (1999) 53±65 59
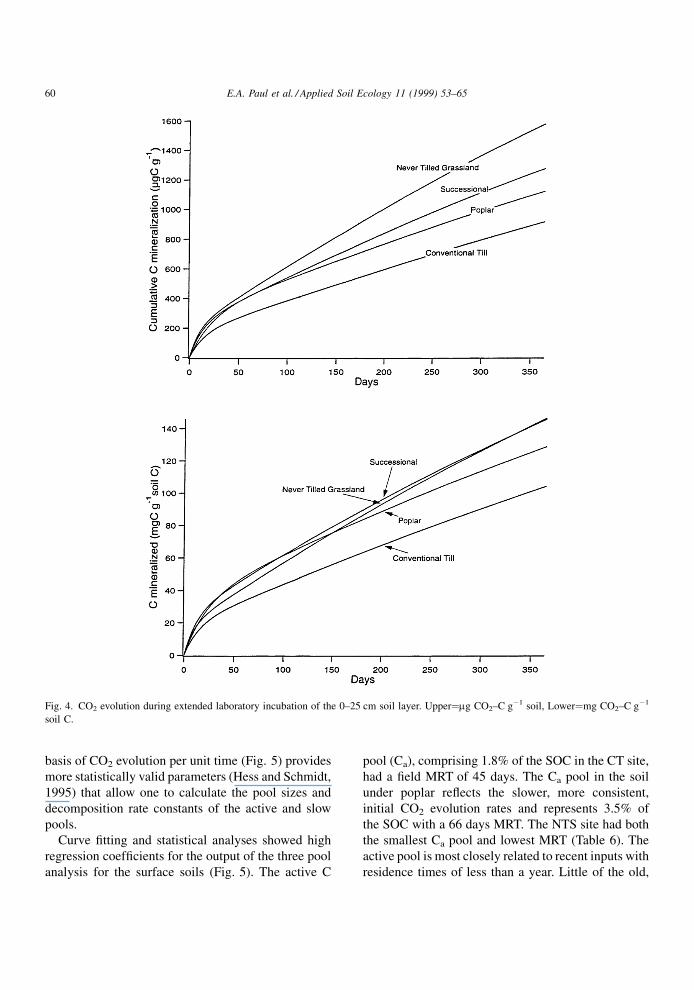
basis of CO2 evolution per unit time (Fig. 5) provides
more statistically valid parameters (Hess and Schmidt,
1995) that allow one to calculate the pool sizes and
decomposition rate constants of the active and slow
pools.
Curve ®tting and statistical analyses showed high
regression coef®cients for the output of the three pool
analysis for the surface soils (Fig. 5). The active C
pool (Ca), comprising 1.8% of the SOC in the CT site,
had a ®eld MRT of 45 days. The Ca pool in the soil
under poplar re¯ects the slower, more consistent,
initial CO2 evolution rates and represents 3.5% of
the SOC with a 66 days MRT. The NTS site had both
the smallest Ca pool and lowest MRT (Table 6). The
active pool is most closely related to recent inputs with
residence times of less than a year. Little of the old,
Fig. 4. CO2 evolution during extended laboratory incubation of the 0±25 cm soil layer. Upper�mg CO2±C gÿ1 soil, Lower�mg CO2±C gÿ1
soil C.
60 E.A. Paul et al. / Applied Soil Ecology 11 (1999) 53±65
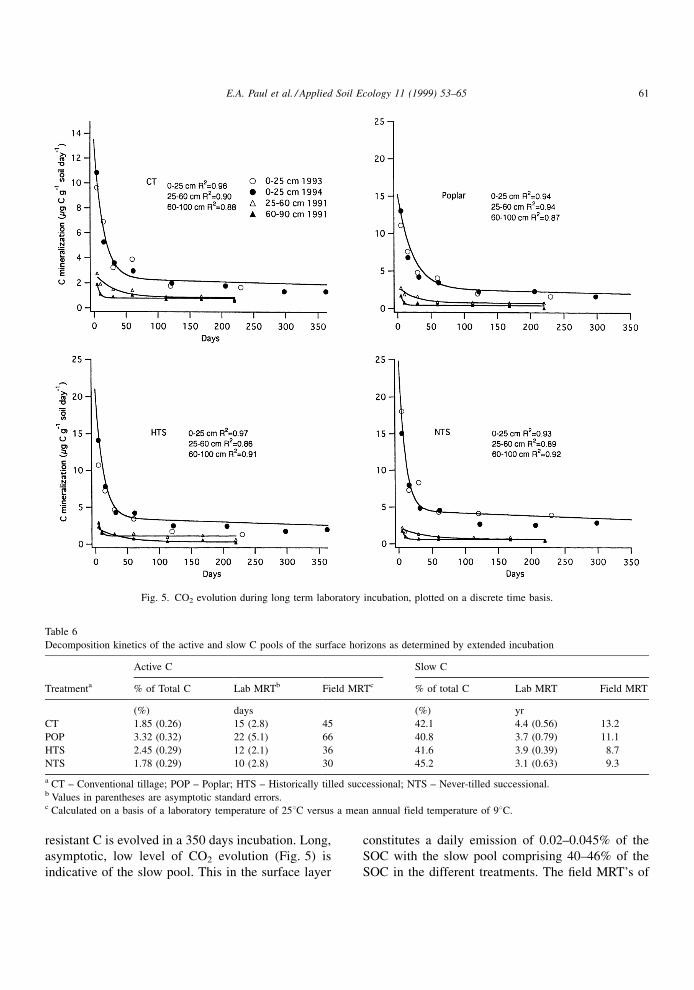
resistant C is evolved in a 350 days incubation. Long,
asymptotic, low level of CO2 evolution (Fig. 5) is
indicative of the slow pool. This in the surface layer
constitutes a daily emission of 0.02±0.045% of the
SOC with the slow pool comprising 40±46% of the
SOC in the different treatments. The ®eld MRT's of
Fig. 5. CO2 evolution during long term laboratory incubation, plotted on a discrete time basis.
Table 6
Decomposition kinetics of the active and slow C pools of the surface horizons as determined by extended incubation
Active C Slow C
Treatmenta % of Total C Lab MRTb Field MRTc % of total C Lab MRT Field MRT
(%) days (%) yr
CT 1.85 (0.26) 15 (2.8) 45 42.1 4.4 (0.56) 13.2
POP 3.32 (0.32) 22 (5.1) 66 40.8 3.7 (0.79) 11.1
HTS 2.45 (0.29) 12 (2.1) 36 41.6 3.9 (0.39) 8.7
NTS 1.78 (0.29) 10 (2.8) 30 45.2 3.1 (0.63) 9.3
a CT ± Conventional tillage; POP ± Poplar; HTS ± Historically tilled successional; NTS ± Never-tilled successional.b Values in parentheses are asymptotic standard errors.c Calculated on a basis of a laboratory temperature of 258C versus a mean annual field temperature of 98C.
E.A. Paul et al. / Applied Soil Ecology 11 (1999) 53±65 61
this pool were 9 years in the two successional plots, 11
years in the poplar and 13 years in the conventionally
tilled site (Table 6). The CO2 evolution rates from the
lower horizons were low when expressed per unit
weight of soil (Fig. 5); these become substantial when
expressed on a unit C basis (data not shown).
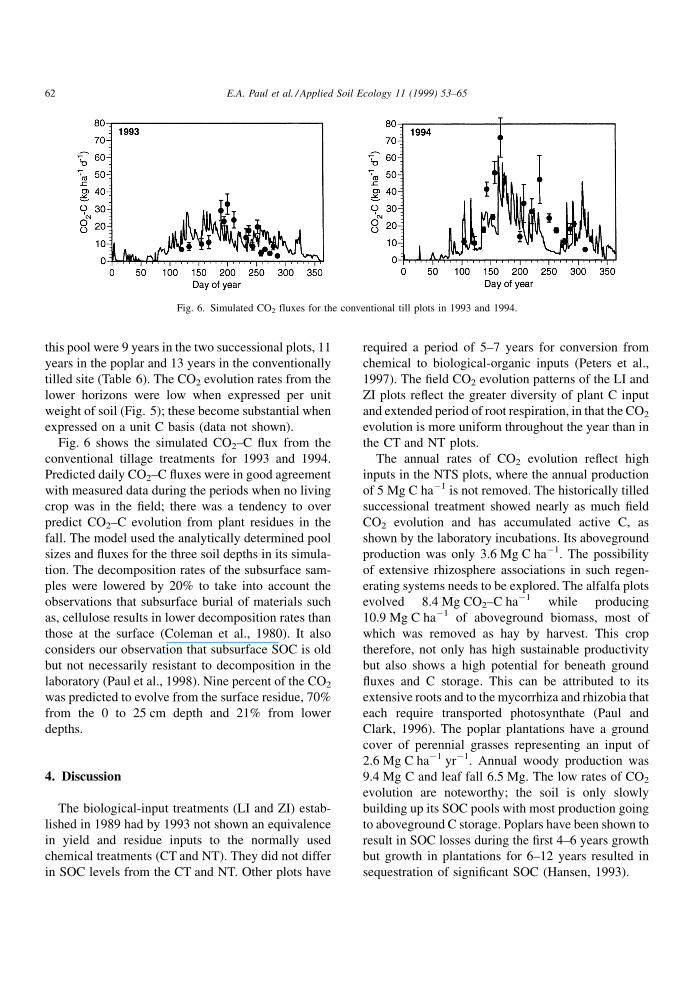
Fig. 6 shows the simulated CO2±C ¯ux from the
conventional tillage treatments for 1993 and 1994.
Predicted daily CO2±C ¯uxes were in good agreement
with measured data during the periods when no living
crop was in the ®eld; there was a tendency to over
predict CO2±C evolution from plant residues in the
fall. The model used the analytically determined pool
sizes and ¯uxes for the three soil depths in its simula-
tion. The decomposition rates of the subsurface sam-
ples were lowered by 20% to take into account the
observations that subsurface burial of materials such
as, cellulose results in lower decomposition rates than
those at the surface (Coleman et al., 1980). It also
considers our observation that subsurface SOC is old
but not necessarily resistant to decomposition in the
laboratory (Paul et al., 1998). Nine percent of the CO2
was predicted to evolve from the surface residue, 70%
from the 0 to 25 cm depth and 21% from lower
depths.
4. Discussion
The biological-input treatments (LI and ZI) estab-
lished in 1989 had by 1993 not shown an equivalence
in yield and residue inputs to the normally used
chemical treatments (CT and NT). They did not differ
in SOC levels from the CT and NT. Other plots have
required a period of 5±7 years for conversion from
chemical to biological-organic inputs (Peters et al.,
1997). The ®eld CO2 evolution patterns of the LI and
ZI plots re¯ect the greater diversity of plant C input
and extended period of root respiration, in that the CO2
evolution is more uniform throughout the year than in
the CT and NT plots.
The annual rates of CO2 evolution re¯ect high
inputs in the NTS plots, where the annual production
of 5 Mg C haÿ1 is not removed. The historically tilled
successional treatment showed nearly as much ®eld
CO2 evolution and has accumulated active C, as
shown by the laboratory incubations. Its aboveground
production was only 3.6 Mg C haÿ1. The possibility
of extensive rhizosphere associations in such regen-
erating systems needs to be explored. The alfalfa plots
evolved 8.4 Mg CO2±C haÿ1 while producing
10.9 Mg C haÿ1 of aboveground biomass, most of
which was removed as hay by harvest. This crop
therefore, not only has high sustainable productivity
but also shows a high potential for beneath ground
¯uxes and C storage. This can be attributed to its
extensive roots and to the mycorrhiza and rhizobia that
each require transported photosynthate (Paul and
Clark, 1996). The poplar plantations have a ground
cover of perennial grasses representing an input of
2.6 Mg C haÿ1 yrÿ1. Annual woody production was
9.4 Mg C and leaf fall 6.5 Mg. The low rates of CO2
evolution are noteworthy; the soil is only slowly
building up its SOC pools with most production going
to aboveground C storage. Poplars have been shown to
result in SOC losses during the ®rst 4±6 years growth
but growth in plantations for 6±12 years resulted in
sequestration of signi®cant SOC (Hansen, 1993).
Fig. 6. Simulated CO2 fluxes for the conventional till plots in 1993 and 1994.
62 E.A. Paul et al. / Applied Soil Ecology 11 (1999) 53±65
The difference between the values for total CO2
ef¯ux and plant residue C inputs in a steady-state
system should be root respiration. Our calculations for
beneath ground production re¯ect peak standing crops
and are higher than most literature values. We have
shown that the plant CO2 ¯ux is derived primarily
from the previous years residue as well as from the
large slow pool with MRT's of 10 years. The differ-
ence technique therefore is not applicable to root
respiration calculations; and tracer techniques will
have to be utilized.
Expression of the CO2 evolved during the labora-
tory incubations on a unit C basis showed the HTS
treatment, initiated in 1989, to have as great a propor-
tion of its C available for biological mineralization as
the older NTS treatment. The sharp change in the
laboratory evolution rates that occurs between 50 and
70 days demarcates the active and slow pools. The
slow pool with more than 40% of the C and a turnover
rate under these conditions of 9±13 years in the ®eld is
central to soil fertility and ecosystem sustainability.
Tracer N experiments in these soils con®rm the large
size and relatively slow turnover of the slow pool.
While, 40% of fertilizer 15N was left in the SOM after
growth of a fertilized crop, growth of a subsequent
crop removed only 5±10% of the 15N. Later crops
removed 1±2% of the stored soil N each year (Harris
et al., 1994).
The information on pool sizes and mean residence
times can best be related to ®eld measurements, by
modeling the CO2 evolution in the ®eld on the basis of
®eld abiotic conditions and known plant residue inputs
into our long term plots. Incorporation of the analy-
tically derived SOC pool sizes and ¯ux rates into the
SALUS-model predicted trends in CO2±C evolution
within a year quite well. The model, which is basically
the Century SOM model integrated with a plant
growth model under predicted CO2±C evolution dur-
ing the summer months; it does not simulate root
respiration. The tendency of SALUS to over predict
CO2±C evolution in the fall is attributable to the fact
that it does not consider a lag period until the residues
are colonized and comminuted. In accordance with
observed data, the model predicted a higher CO2±C
evolution for 1994 as compared to 1993. The higher
rates in 1994 were attributable to residues from the
previous corn crop. In 1993, the previous crop was
soybean. The SALUS-Century model has a complex
series of interpool ¯uxes. These are oversimpli®ed
when the pool sizes and decomposition rates for the
three soil pools are based only on the laboratory
derived data. The model when run for 2 years with
our pool and ¯ux rate data showed a slight accumula-
tion of crop residues and an equivalent drop in the Cs.
4.1. Implications for sustainability and global C
storage
Sustainable agriculture and the storage of C in
global change scenarios must rely on soil pools that
can accumulate C and other nutrients within reason-
able time periods. The 56% of the C in the agronomic
treatments that has a MRT of 1435 years does not
participate in short term changes but stabilizes struc-
ture, supplies exchange complexes and other adsorp-
tion sites. The active pool is of the same general size as
the microbial biomass in these plots. It is not com-
prised exclusively of this source as it is the entry point
of residues into the soil; long term incubations
decrease the active pool more rapidly than the bio-
mass-C. It is the active and slow pools that must be
managed in substituting biological management for
chemical inputs. The active pool must be managed
such that the nutrient release from the SOM is syn-
chronized temporally with the needs of a growing
crop. This ensures that N released during decomposi-
tion will be utilized by the crop and not lost to the
environment, as can happen when N is mineralized
during non-crop periods such as the late fall and early
spring. The accumulation of SOC is essential for the
possibility of enhanced transfer of atmospheric CO2 to
terrestrial pools in global change scenarios. This is
happening in the slow pool of our HTS plots and to a
lesser extent in the poplar. The HTS plots however, do
not produce an income from the land and thus are
viable only with alternate management strategies
involving government agencies or prior to develop-
ment of the land for alternate usage.
Combination of ®eld and laboratory studies have
made possible an interpretation of the ®eld CO2
evolution rates relative to SOC changes in different
cropping systems. The systems with more organic
inputs produced CO2 more evenly throughout the year
than the conventional fertilized systems. There was
enough variability in ®eld CO2 rates that speci®c
calculations of root contributions could not be made
E.A. Paul et al. / Applied Soil Ecology 11 (1999) 53±65 63
but the extended seasonal evolution should be attri-
butable to roots rather than microbial activity. This
extended activity re¯ects plant activity that should
reduce losses of nutrients such as nitrate during the
winter months.
Laboratory measurement of SOC mineralization is
a sensitive indicator of SOC changes long before they
can be measured in the ®eld. The HTS plots are
showing major SOC accumulations in the active
and slow fractions. The poplar plots have the most
distinctive laboratory evolution patterns with differing
pool sizes and ¯uxes. These should eventually lead to
a buildup of SOC although, this was not apparent at
the time of sampling. The ability to realistically model
the ®eld evolution of CO2 based on SOC pool sizes
and ¯uxes, determined by acid hydrolysis and C
dating, together with extended incubation demon-
strates that we have the techniques necessary for
the analytical determination of the SOC components
involved in SOC dynamics. Knowledge of these pools
and ¯uxes can be utilized for better decision making in
sustainable agriculture and global change calcula-
tions.
Acknowledgements
Funding was provided by the National Science
Foundation (DEB 92-02332), the Department of
Energy (DEFG02-94ER61942) and the Michigan
State Agricultural Experiment Station. We thank
S.J. Halstead, K. Baergen and other dedicated associ-
ates for help in the ®eld sampling, laboratory analyses
and data presentation.
References
Aiken, R.M., Jawson, J.D., Grahammer, K., Polymenopoulos, A.D.,
1991. Positional, spatially correlated and random components
of variability in carbon dioxide efflux. Environmental monitor-
ing. J. Environ. Qual. 20, 301±308.
Burbank, D.H., Pregitzer, K.S. et al., 1992. Vegetation of the W.K.
Kellogg Biological Station. Michigan State University, Agri-
cultural Experiment Station Research Report 510.
Buyanovsky, G.A., Wagner, G.H., 1997. Crop residue input into
soil organic matter on Sanborn field. In: Paul, E.A., Paustian,
K., Elliott, E.T., Cole, C.V. (Eds.), Soil Organic Matter in
Temperate Agroecosystem. CRC Press, Boca Raton, FL,
pp. 73±83.
Carter, M.R., Stewart, B.A. (Eds.), 1996. Structure and Organic
Matter Storage in Agricultural Soils. CRC Press, Boca Raton,
FL.
Collins, H.P., Paul, E.A., Blevins, R.L., Bundy, L.G., Christenson,
D.R., Dick, W.A., Huggins, D.R., Lyon, D.J., Peters, S.E.,
Turco, R.F., 1998. Carbon pools and dynamics in Corn Belt
agroecosystems. Soil Sci. Soc. Am. J., in press.
Coleman, D.C., Breymeyer, A.I., Dash, M.C., Dommergues, Y.,
Hunt, H.W., Paul, E.A., Sasson, A., Schaefer, R., Ulova, B.,
Zlotin, R.I., 1980. Decomposer subsystem. In: Breymeyer, A.I.,
van Dyne, G.M. (Eds.), Grasslands System Analysis and Man.
Cambridge University Press, Cambridge, UK.
Crum, J.R., Robertson, G.P., Nurnberger, F., 1988. Long-term
climate trends and agricultural productivity in southwest
Michigan. In: Greenalnd, D., Swift Jr., L.W. (Eds.), Climate
Variability and Ecosystem Response. Proc. Long-term
Ecological Research Workshop. Boulder, CO, 65, 53±
58.
Hansen, E.A., 1993. Soil carbon sequestration beneath hybrid
poplar plantations in the North Central United States. Biomass
and Bioenergy 5, 431±436.
Harris, G.H., Hesterman, O.B., Paul, E.A., Peters, S.E., Janke,
R.R., 1994. Fate of legume and fertilizer 15N in a long-term
cropping systems experiment. Agronomy J. 86, 910±915.
Harris, D., Porter, L.K., Paul, E.A., 1997. Continuous flow isotope
ratio mass spectrometry of 13CO2 trapped as strontium
carbonate. Comm. Plant and Soil Anal. 28, 747±757.
Hess, T.F., Schmidt, S.K., 1995. Improved procedure for obtaining
statistically valid parameter estimates from soil respiration
data. Soil Biol. Biochem. 27, 1±7.
Holland, E.A., Coleman, D.C., 1986. Litter placement effects on
microbial and organic matter dynamics in an agroecosystem.
Ecology 68, 425±433.
Horwath, W.R., Paul, E.A., Harris, D., Norton, J., Jagger, L.,
Horton, K.A., 1996. Defining a realistic control for the
chloroform-fumigation incubation method using microscopic
counting and 14Cÿsubstrates:Can:J:SoilSci:96; 459ÿÿ467:
Huberty, L.E., Gross, K.L., Miller, C.J., 1998. Effects of nitrogen
addition on successional dynamics and diversity in Michigan
old-fields. J. Ecol., submitted.
Jensen, L.S., Mueller, T., Tate, K.R., Ross, D.J., Magid, J., Nielsen,
N.E., 1996. Soil surface CO2 flux as an index of soil respiration
in situ: a comparison of two chamber methods. Soil Biol.
Biochem. 28, 1297±1306.
Kern, J.S., Johnson, M.G., 1993. Conservation tillage impacts on
national soil and atmospheric carbon levels. Soil Sci. Soc. Am.
J. 57, 200±210.
Kuchler, A.W., 1964. Potential natural vegetation of the con-
terminous United States. Am. Geo. Soc. Spec. Pub. 36, New
York.
Nicolardot, B., Molina, J.A.E., Allard, M.R., 1994. C and N
fluxes between pools of soil organic matter: model calibration
with long-term incubation data. Soil Biol. Biochem. 26, 235±
243.
Parton, W.J., Rasmussen, P.E., 1994. Long-term effects of crop
management in wheat-fallow: II. CENTURY model simula-
tions. Soil Sci. Soc. Am. J. 58, 530±536.
64 E.A. Paul et al. / Applied Soil Ecology 11 (1999) 53±65
Parton, W.J., Stewart, W.B., Cole, C.V., 1988. Dynamics of C, N, P
and S in grassland soil. A model Biogeochemistry 5, pp. 109±
131.
Paul, E.A., Collins, H.P., Haile-Mariam, S., 1998. Analytical
determination of soil C dynamics. 16 Int. Congr. Soil Sci.,
Montpellier, France, Trans.
Paul, E.A., Follett, R.F., Leavitt, S.W., Halvorson, A., Peterson,
G.A., Lyon, D.J., 1997a. Radio carbon dating for determination
of soil organic matter pool sizes and fluxes. Soil Sci. Soc. Am.
J. 61, 1058±1067.
Paul, E.A., Paustian, K.L., Elliott, E.T., Cole, C.V. (Eds.), 1997b.
Soil Organic Matter in Temperate Agroecosystems: Long-term
Experiments in North America. CRC Press, Boca Raton, FL,
pp. 414 plus disk.
Paul, E.A., Clark, F.E., 1996. Soil Microbiology and Biochemistry,
2nd ed. Academic Press, San Diego, CA., pp. 340.
Paul, E.A., Horwath, W.R., Harris, D., Follett, R., Leavitt, S.W.,
Kimball, B.A., Pregitzer, K., 1995. Establishing the pool sizes
and fluxes in CO2 emissions from soil organic matter turnover.
In: Lal, R., Kimble, J., Levine, E., Stewart, B. (Eds.), Advances
in Soil Science of Soils and Global Change. CRC Press, Boca
Raton, FL, pp. 297±305.
Paustian, K., Parton, W.J., Perrson, J., 1992. Modeling soil organic
matter in organic amended and N-fertilized long-term plots.
Soil Sci. Soc. Am. J. 56, 476±488.
Peters, S.E., Wander, M.M., Saporito, L.S., Harris, G.H., Friedman,
D.B., 1997. Management impacts on SOM and related soil
properties in a long-term farming systems trial in Pennsylvania.
In: Paul, E.A., Paustian, K., Elliott, E.T., Cole, C.V. (Eds.), Soil
Organic Matter in Temperate Agroecosystems. CRC Press,
Boca Raton, FL, pp. 183±196.
Robertson, G.P., Paul, E.A., 1998. Ecological research in
agricultural ecosystems: contributions to ecosystem science
and to the management of agronomic resources. In: Groffman,
P.M., Pace, M.L. (Eds.), Successes, Limitations and Frontiers in
Ecosystem Science. Cary Conference VII, Springer, NY, in
press.
Robertson, G.P., Collins, H.P., Gage, S.H., Gross, K.L., Halstead,
S.H., Harwood, R.H., Klingensmith, K.M., Klug, M.J., Paul,
E.A., 1998. Long-term research in agricultural ecology:
objectives and establishment of a site in the US Midwest.
Agric. Ecosyst. and Environ., in press.
Rochette, P., Ellert, B., Gregrovich, E.G., Desjardins, R.L., Pattey,
E., Lessard, R., Johnson, B.G., 1997. Description of a dynamic
closed respiration chamber for measuring soil respiration and
its comparison with other techniques. Can. J. Soil Sci. 77, 195±
203.
Schulthess, U., Ritchie, J., 1996. Simulation of tillage and crop
residue dynamics with the SALUS-model. 26th Annual
Crop Simulation Workshop. Fort Collins, 9±11 April, pp. 24±
25.
Sollins, P., Homann, P., Caldwell, B.A., 1996. Stabilization and
destabilization of soil organic matter: mechanism and controls.
Geoderma 74, 65±105.
Trumbore, S.E., 1993. Comparison of carbon dynamics in tropical
and temperate soils using carbon dating. Global Biogeochem.
Cycles 7, 275±290.
Whiteside, E.P., 1982. Soil survey of the Kellogg Biological
Station. Research Report XX. W.K. Kellogg Biological Station
Library, Hickory Corners, MI.
Willson, T.C., Paul, E.A., Harwood, R.R., Smucker, A.J.M., Parker,
E.M., Harris, D., 1997. Analysis of below ground productivity
and soil respiration. Agric. Abstract, 218.
Zibilske, L.M., 1994. Carbon mineralization. Methods of Soil
Analyses 2. Microbiological and Biochemical Properties. SSSA
Book Series No.5, pp. 836±864.
E.A. Paul et al. / Applied Soil Ecology 11 (1999) 53±65 65