Embed Size (px)
Citation preview

Evolution of leaf warbler songs (Aves: Phylloscopidae)Dieter Thomas Tietze1,2, Jochen Martens3, Balduin S. Fischer1, Yue-Hua Sun4, AnnetteKlussmann-Kolb1,5 & Martin P€ackert6
1Institute of Ecology, Evolution and Diversity, Goethe University, Max-von-Laue-Straße 13, 60439 Frankfurt am Main, Germany2Institute of Pharmacy and Molecular Biotechnology, Heidelberg University, Im Neuenheimer Feld 364, 69120 Heidelberg, Germany3Institute of Zoology, Johannes Gutenberg University, 55099 Mainz, Germany4Key Laboratory of Animal Ecology and Conservation, Institute of Zoology, Chinese Academy of Sciences, 100101 Beijing, China5Zoologisches Forschungsmuseum Alexander Koenig, Adenauerallee 160, 53113 Bonn, Germany6Senckenberg Natural History Collections, Museum of Zoology, K€onigsbr€ucker Landstraße 159, 01109 Dresden, Germany
Keywords
Model of evolution, Phylloscopus,
phylogenetic signal, Seicercus, song
evolution.
Correspondence
Dieter Thomas Tietze, Institute of Pharmacy
and Molecular Biotechnology, Heidelberg
University, Im Neuenheimer Feld 364, 69120
Heidelberg, Germany.
Tel: + 49 6241 6944571; Fax: + 49 6221 54-
4884; E-mail: [email protected]
Funding Information
D.T. Tietze has been supported by the
governmental program “Starker Start ins
Studium” at Goethe University Frankfurt am
Main.
Received: 5 September 2014; Revised: 17
December 2014; Accepted: 18 December
2014
Ecology and Evolution 2015; 5(3): 781–798
doi: 10.1002/ece3.1400
Abstract
Songs in passerine birds are important for territory defense and mating. Specia-
tion rates in oscine passerines are so high, due to cultural evolution, that this
bird lineage makes up half of the extant bird species. Leaf warblers are a speci-
ose Old-World passerine family of limited morphological differentiation, so that
songs are even more important for species delimitation. We took 16 sonograph-
ic traits from song recordings of 80 leaf warbler taxa and correlated them with
15 potentially explanatory variables, pairwise, and in linear models. Based on a
well-resolved molecular phylogeny of the same taxa, all pairwise correlations
were corrected for relatedness with phylogenetically independent contrasts and
phylogenetic generalized linear models were used. We found a phylogenetic sig-
nal for most song traits, but a strong one only for the duration of the longest
and of the shortest element, which are presumably inherited instead of learned.
Body size of a leaf warbler species is a constraint on song frequencies indepen-
dent of phylogeny. At least in this study, habitat density had only marginal
impact on song features, which even disappeared through phylogenetic correc-
tion. Maybe most leaf warblers avoid the deterioration through sound propaga-
tion in dense vegetation by singing from exposed perches. Latitudinal (and
longitudinal) extension of the breeding ranges was correlated with most song
features, especially verse duration (longer polewards and westwards) and com-
plexity (lower polewards). Climate niche or expansion history might explain
these correlations. The number of different element types per verse decreases
with elevation, possibly due to fewer resources and congeneric species at higher
elevations.
Introduction
Passerines sing in order to defend their territories and to
advertise for mates (Catchpole and Slater 2008). The sec-
ond reason implies that sexual selection might have a
strong impact on the evolution of such vocal behavior
(Price 2008). Nevertheless, species recognition must be
maintained for both purposes. Songbirds learn their song
from tutors (Baptista and Kroodsma 2001; Catchpole and
Slater 2008), but it consists of innate elements (Catchpole
and Slater 2008). Almost half of all bird species are passe-
rines (Dickinson 2003), which is also due to the acceler-
ated (cultural) evolution through learning and sexual
selection (Thielcke 1970; Baptista and Trail 1992; Price
2008; Verzijden et al. 2012).
As bird song is such an important behavior, we must
ask what drives the evolution of song traits (review in
Wilkins et al. 2013). At the level of ontogeny, an interplay
of genetic inheritance and social learning (Catchpole and
Slater 2008) is assumed. Various environmental and
organismic constraints act on both stages: Body size pro-
vides physical conditions for frequency range and speed
of vocalisations (e.g., Wallschl€ager 1980; Ryan and Breno-
witz 1985), while migratory behavior might enforce a
trade-off with song performance (Read and Weary 1992).
Acoustic properties of the habitat should necessitate
ª 2015 The Authors. Ecology and Evolution published by John Wiley & Sons Ltd.
This is an open access article under the terms of the Creative Commons Attribution License, which permits use,
distribution and reproduction in any medium, provided the original work is properly cited.
781

adaptations to optimize the transmission of sound (e.g.,
Morton 1975; Ryan and Brenowitz 1985). Competition
for acoustic niche space could limit the extent of such
adaptations. Sexual selection could favor more complex
songs, which on the other hand require a higher male
investment. Obvious explanations might only reflect com-
mon ancestry so that neutral evolution needs to be disen-
tangled from phylogenetically independent correlations. It
is highly likely that more than one factor is responsible
for a given trait, so that explanatory variables need to be
incorporated in more complicated statistical models than
just bivariate correlations.
Leaf warblers (Phylloscopidae sensu Alstr€om et al.
2006b) are a large family of insectivorous passerines. The
fact that external morphology differs only slightly among
taxa emphasizes the importance of vocal communication
in this clade (Alstr€om et al. 2006a; Martens 2010). Leaf
warblers live on wooden plants in Eurasia and Africa
(with one species reaching high-latitude Nearctic); a max-
imum of 16 sympatric species can co-exist on a single
Chinese mountain (Martens 2010; Fig. 1). Most species
migrate seasonally (from seasonal elevational movements
to long-distance migration between continents). Leaf war-
bler males vocalize a lot in the breeding period. Despite a
remarkable interspecific variation in leaf warbler song,
song characteristics are highly repeatable within species.
All that makes phylloscopid warblers a good model to
study vocal trait evolution.
Others have already tested various hypotheses regarding
song evolution in leaf warblers (Badyaev and Leaf 1997;
Mahler and Gil 2009), but these studies suffer from sev-
eral weaknesses that we address here, as follows. The sam-
ple size was increased, and the phylogenetic data set
improved (635 individuals of 80 taxa vs. 84 individuals of
30 species in Mahler and Gil 2009; almost fully resolved
dated molecular tree). Any arbitrary selection of taxon
sample may produce an outcome different from a fully
sampled approach (Ackerly 2000; Pollock et al. 2002).
Intraspecific genetic and acoustic variation was taken into
account and was shown to be high and significant in sev-
eral warbler species (e.g., P. [reguloides] represented by a
single lineage in the previous study despite much higher
differentiation up to species level; P€ackert et al. 2009).
A direct truly environmental measure of habitat was used
(in contrast to an approximation by tarsus/beak ratio by
Mahler and Gil 2009). Analyses that are more sophisti-
cated were applied, disentangling historical and various
ecological causes (linear models accounting for an inter-
active role played by explanatory variables, including
models taking phylogenetic relationships into account).
Figure 1. Distribution map. Breeding distribution of leaf warbler (Phylloscopidae) species according to BirdLife International & NatureServe (2011);
species richness increases from dark blue (1) via green and yellow to red (16).
782 ª 2015 The Authors. Ecology and Evolution published by John Wiley & Sons Ltd.
Evolution of Leaf Warbler Songs D. T. Tietze et al.

The following hypotheses were tested:
Hypothesis 1: Song characters show significant phylogenetic
signals, but are considerably more labile than morphologi-
cal characters (Blomberg et al. 2003) and frequency song
parameters are more conserved than temporal and struc-
tural ones (Mahler and Gil 2009).
Hypothesis 2: Body size is negatively correlated with fre-
quency characteristics (Wallschl€ager 1980; Badyaev and Leaf
1997; Mahler and Gil 2009).
Hypothesis 3: Song characters (particularly frequency
parameters) are strongly influenced by habitat characteris-
tics (Badyaev and Leaf 1997; Rheindt et al. 2004).
Hypothesis 4: Song parameters vary significantly with geo-
graphic distribution, that is, with latitudinal and longitudi-
nal extent of breeding areas (Mahler and Gil 2009) and
with elevational preferences in the breeding season (Snell-
Rood and Badyaev 2008).
Materials and Methods
Tree reconstruction
Several studies have used a modified leaf warbler phylog-
eny based on the data set by Johansson et al. (2007;
including 55 taxa) for biogeographic reconstructions
(P€ackert et al. 2012), speciation rate analysis and ecologi-
cal modeling (Price 2010). As a phylogenetic backbone,
we used the three-marker data set (cytochrome b, 12S
and myoglobin intron 2) from P€ackert et al. (2012)
including 69 taxa of Phylloscopidae and added original
sequences for 13 taxa. Newly generated sequences were
processed according to laboratory protocols given in
P€ackert et al. (2012; and references therein).
The total data set used for phylogenetic reconstructions
comprised sequence data of 80 leaf warbler taxa com-
pared with 30 taxa analyzed by Mahler and Gil (2009).
GenBank sequences of Acrocephalus dumetorum were
included in the analysis for hierarchical outgroup rooting.
The sequences for each gene were aligned by ClustalW
using MEGA v5.1 (Tamura et al. 2011) and slightly
adjusted by eye. All sequences used for the analysis were
deposited at GenBank under the accession numbers pro-
vided in Table S4. The best-fit model for each locus was
identified with the Akaike information criterion (AIC)
implemented in MrModeltest v2.3 (Nylander 2004) in
conjunction with PAUP* v4.0b10 (Swofford 2003; see
Table S5). Phylogenetic relationships were reconstructed
using Bayesian inference through BEAST v1.5.3 (Drum-
mond and Rambaut 2007). In BEAST, the following
settings were used: All three genes were treated as separate
partitions with unlinked substitution and clock models.
Substitution and heterogeneity models were set according
to Table S5, and empirical base frequencies were used.
Furthermore, cytochrome b was partitioned into three
codon positions after clipping of the stop codon, and all
parameters were unlinked. A relaxed uncorrelated log-
normal clock was used with a birth–death process
assumed as a tree prior. The reconstruction was for
10,000,000 generations. The log files were checked with
Tracer v1.5 (Drummond and Rambaut 2007) in order to
set the burn-in value. The BEAST trees were summarized
with TreeAnnotator v1.5.3 using a burn-in value of 5000
and median node heights, and the final tree visualized in
FigTree v1.3.1.
Song analysis
In the study group, song is usually composed of well-
defined periods of singing, termed verses, which are
separated from each other by pauses. In many species,
individuals exhibit different verse variants called song
types that may vary from 1 to 44. The variation among
song types is discontinuous yet slight, following the same
general species-typical song pattern. The specific set of
song types varies among individuals while the sheer num-
ber of different individual song types, also known as the
repertoire size, remains largely constant within taxa (cf.
Fig. 2A–D; Martens 1980; Martens et al. 1999; Irwin
2000; P€ackert et al. 2009; Ivanitskii et al. 2012).
Within a certain verse, further subdivisions can be
made: The smallest unit of a verse is the element that is
represented by a continuous line on the sonogram
(Fig. 2). Element types differ from each other in structure
and shape. Verses may be composed of fixed groups of
elements, termed syllables or note groups. The composi-
tion and order of elements and syllables of a verse define
the syntax. In some species, verses begin with a highly ste-
reotyped motif, the introductory note (Martens 1980;
Martens et al. 2004; Catchpole and Slater 2008, p. 9).
Seven leaf warbler species (nine taxa) exhibit two vastly
different songs of distinct structural patterns. Divergence
between distinct song patterns within a species equals the
one found between songs of well-differentiated species,
but does not result in prezygotic isolation. In most spe-
cies concerned, males display songs of a rather stereotypi-
cal and invariable pattern and others of a more variable
pattern including different song types alternately in the
same behavioral context (e.g., continuous “endless song”
vs. verse song in species of the P. proregulus group; Mar-
tens et al. 2004).
Almost all analyzed song recordings were taken from
JM’s collection (for auditory impressions of the song of
ª 2015 The Authors. Ecology and Evolution published by John Wiley & Sons Ltd. 783
D. T. Tietze et al. Evolution of Leaf Warbler Songs

10
6
2
6.05.04.03.02.01.0 s
10
6
2
10
6
2
10
6
2
10
6
2
10
6
2
10
6
2
10
6
2
10
6
2
kHz(A) (B) (C) (D)
(E) (F) (G)
(H)
(I) (J)
(K) (L)
(M) (N)
(O) (P)
(Q) (R) (S)
(T) (U)
Figure 2. Sonogram plate. Selection of sonograms highlighting variation and composition of leaf-warbler songs. Phylloscopus schwarzi a–d: four
strophes of the same individual (pauses omitted) representing three different song types (Russia, Ussuri 1990, J. Martens); P. humei mandellii e:
buzzing song pattern (China, Shaanxi 1997, J. Martens), f: call-like song pattern (China, Shaanxi 1997, J. Martens); P. forresti g: reeling song
pattern (China, Gansu 2010, J. Martens); h: part of endless song pattern (China, Sichuan 2000, J. Martens); P. sibilatrix i: reeling song pattern
(Germany, Saxony 2011, B. Fischer), j: call (Germany, Hesse 2011, B. Fischer), k: call-like song pattern (Germany, Saxony 2011, B. Fischer);
P. collybita collybita l: (Germany, Saxony 2011, B. Fischer); P. collybita tristis m: (Russia, Novosibirsk 1986, J. Martens); P. tytleri n: (India, Kashmir
1976, J. Martens); P. trochilus o: (Germany, Hesse 2011, B. Fischer); P. borealoides p: (Japan, Hokkaido 1996, M. P€ackert); P. calciatilis q: (Laos
2010, J. Martens); P. umbrovirens r: (Ethiopia, Oromia, B. Fischer); P. inornatus s: (Russia, Komi Republic 2006, A. Lindholm); P. magnirostris t:
(China, Shaanxi 1997, J. Martens); P. plumbeitarsus u: (Russia, Ussuri 1996, M. P€ackert).
784 ª 2015 The Authors. Ecology and Evolution published by John Wiley & Sons Ltd.
Evolution of Leaf Warbler Songs D. T. Tietze et al.

most taxa listen to Martens 2013), supplemented by
recordings from commercial sound carriers, sound
archives, and colleagues. For sonographic analysis, digi-
tised recordings were converted to a sampling rate of
22.1 kHz and 16 bit. Measurements were performed man-
ually on the sonograms using the software Avisoft-SASLab
Lite (www.avisoft.com). The unit used for bioacoustic
analysis was the verse. For taxa with low to medium rep-
ertoire sizes, a maximum of five verses per individual and
five individuals per taxon was measured. To account for
higher variation in taxa with large repertoires (>20 song
types/individual), the number of both verses and individ-
uals investigated was increased to a maximum of ten
verses per male. Altogether, measurements of 3347 single
verses from 635 individuals were used for analysis.
For any given verse, measurements of ten continuously
varying song parameters were taken on the sonogram
(Fig. S1). From the resulting data, six additional song
parameters were derived. Song variables fall into two dis-
tinct categories: frequency and compositional parameters.
The latter comprise temporal and structural parameters,
which mutually depend upon each other. Precise defini-
tions of all song parameters used for analysis are pre-
sented in Table 1. For each of the song parameters, taxon
means were calculated from individual averages. Songs of
the same species with different structural patterns were
measured separately, and means were calculated for each
of the two structurally different songs. However, in all
nine taxa performing songs of two distinct patterns, only
one of these patterns was used for analysis. As an exam-
ple, the so called endless song of some species does not
permit several timely song parameters to be measured.
Therefore, the typical leaf warbler song pattern with clear-
cut organization into verses was used for analysis for
P. forresti, P. chloronotus, and P. yunnanensis (cf. Fig. 2G–H; Alstr€om and Olsson 1990; Martens et al. 2004). Their
close relative P. proregulus has only one song pattern, but
distinct introductory notes delimit individual verses in its
near-continuous song and allow for measurements of dis-
tinct verse units. In the remaining taxa, songs most simi-
lar to and putatively homologous to other Phylloscopus
songs were analyzed, while those more similar to calls
were omitted (P. humei, P. pulcher, P. sibilatrix, and
P. subviridis; cf. Fig. 2E–F and I–K; Martens 1980; Irwin
et al. 2001a). Variants in the song of P. coronatus are not
considered to belong to different song patterns (cf. Mar-
tens 1980).
Explanatory variables
In order to correlate bioacoustic measures with morpho-
logical and ecological traits, data on body length and
mass, migration, horizontal and elevational distribution
as well as habitat were obtained from the literature for all
taxa. Main source for the inference of all of the parame-
ters mentioned above was Alstr€om et al. (2006a). Further
references were consulted to supplement missing data
(indicated separately for each parameter). Data on mean
total length (in centimeters) as measured from tip of bill
to tip of tail (Svensson 1992) were complemented by
Svensson et al. 2009. For recent taxonomic splits, data on
the respective taxa under which they used to be combined
were taken. Similarly, for missing subspecies, information
for the whole species was used. Length of P. calciatilis was
inferred from measurements published in Alstr€om et al.
(2010). For body mass (in grams), the mean value of the
largest series of measurements for both sexes from Dun-
ning (2008) was taken and complemented by data from
Alstr€om et al. (2006a). As before, if data on subspecies
were missing, the species value was used. For further
missing taxa, data from close relatives with similar size
and proportions were used. Migration strategy of leaf
warblers was classified into three discrete categories corre-
sponding to the average amount of migrating behavior
exhibited (data complemented by Alstr€om et al. 2010,
2011): residents that are (largely) sedentary (score 0), par-
tial migrants including altitudinal and short distance
migrants (score 1) and genuine (long-distance) migrants
with (usually) well-separated breeding and nonbreeding
grounds (score 2). To classify the horizontal distribution
of breeding grounds, two different approaches were pur-
sued: bioregion and mean coordinates. Biogeographic
regions allocated were (1) Palaearctic including Macaro-
nesia, (2) Sino-Himalayas, (3) South-east Asia and (4)
Afrotropic (according to classifications given in P€ackert
et al. 2012). Geographic coordinates of maximal extension
of breeding areas (accurate to one degree) were inferred
via Google Earth v6 from distribution maps and accounts
given in relevant literature (Alstr€om et al. 2006a; comple-
mented by Irwin et al. 2001a; Olsson et al. 2005; Martens
et al. 2008; P€ackert et al. 2009; Alstr€om et al. 2010, 2011;
Rheindt 2010). Further data were retrieved from JM’s col-
lection of sound recordings, specimens, blood samples,
and tissue samples. Mean geographic coordinates were
defined as the mean of the latitudinal and longitudinal
distribution limits, respectively, (latmean = (latmax + lat-
min)/2); longmean = (longmax + longmin)/2). In addi-
tion, the mean distance from the equator (latequator; in
degrees) was inferred from the mean latitude to better
reflect an ecological gradient from tropical to temperate
regions. Data on elevational distribution of breeding
grounds (in meters above sea level) were compiled for
minimum, maximum, and mean values (elemean = (ele-
max + elemin)/2; complemented by Vietinghoff-Scheel
1980; Glutz von Blotzheim and Bauer 1991; Clement and
Helbig 1998; Alstr€om et al. 2010, 2011; P€ackert et al.
ª 2015 The Authors. Ecology and Evolution published by John Wiley & Sons Ltd. 785
D. T. Tietze et al. Evolution of Leaf Warbler Songs

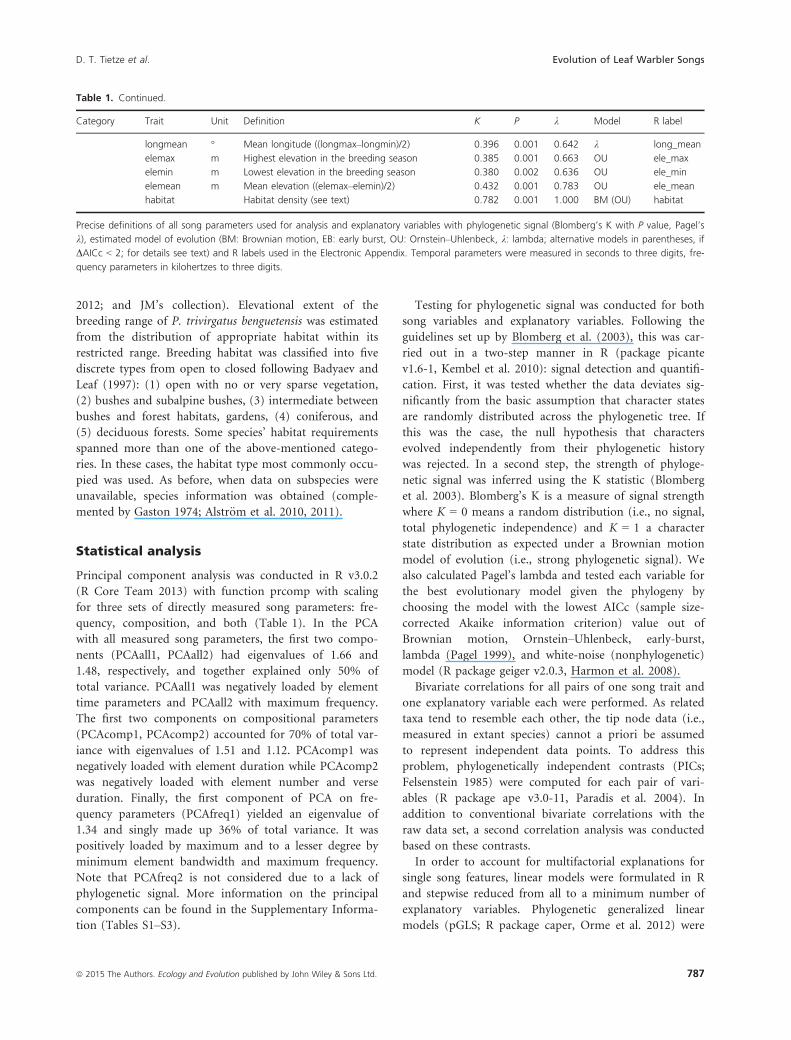
Table 1. Song parameter definition and phylogenetic signal.
Category Trait Unit Definition K P k Model R label
Composition tges s Duration of verse (song period) from
the beginning of the first to the end
of the last element
0.426 0.001 0.874 k tges
tmax s Duration of longest element 0.988 0.001 1.000 EB (BM) tmax
tmin s Duration of shortest element 0.932 0.001 0.998 BM (k, EB) tmin
zel Number of distinct elements 0.553 0.001 0.862 OU (k) zel
zel/tges s-1 Tempo defined as speed of delivery
of elements (number of elements/s)
0.533 0.001 0.808 OU (k) zeltges
zeltype Absolute element diversity defined as
the number of unique element types
0.276 0.058 0.627 k zeltype
Frequency fmax kHz Maximum frequency 0.428 0.001 0.800 k fmax
fmin kHz Minimum frequency 0.299 0.020 0.877 k fmin
fmean kHz Mean frequency ((fmin + fmax)/2) 0.371 0.001 0.966 k fmean
Mf kHz Bandwidth, measured as the difference
between maximum and minimum
frequencies (fmax � fmin)
0.142 0.356 0.743 k df
Mfmax kHz Maximum element bandwidth 0.407 0.001 0.850 k dfmax
Mfmin kHz Minimum element bandwidth 0.374 0.001 0.923 k dfmin
fmodend KHz Frequency gradient measured as the
difference between maximum frequencies
of first and last elements (fmaxend - fmax1)
0.128 0.511 0.355 k (white) fmodend
Derived complexity1 Relative element dissimilarity as apparent from
differences between maximum and minimum
measures of bandwidth and duration according
to the formula (Mfmax/Mfmin + tmax/tmin)/2
0.177 0.212 1.000 k complexity1
complexity2 Relative element diversity measured as the
fraction of unique element types (zeltype/zel)
0.646 0.001 0.977 k complexity2
complexity3 Diversity-tempo index, combining relative element
diversity and speed of element delivery according
to the formula: complexity2 + zel/tges/30.268 s.
Tempo component is adjusted to set the fastest
tempo in the data set to 1.0 (P. borealis).
0.364 0.001 0.755 k complexity3
PCall1 First principal component from an analysis of
measures 1–4, 6–8, 11–13
0.569 0.001 0.986 k HKstim1
PCall2 Second principal component from an analysis
of measures 1–4, 6–8, 11–13
0.287 0.013 0.804 k HKstim2
PCcomp1 First principal component from an analysis of
measures 1–4, 6
0.719 0.001 0.994 k HKzeit1
PCcomp2 Second principal component from an analysis of
measures 1–4, 6
0.469 0.001 0.865 k HKzeit2
PCfreq1 First principal component from an analysis of
measures 7–8, 11–13
0.410 0.001 0.979 k HKfreq1
PCfreq2 Second principal component from an analysis of
measures 7–8, 11–13
0.199 0.126 0.850 k HKfreq2
Explanatory length cm Body length from tip of bill to tip of tail 0.948 0.001 1.000 BM length
mass g Body mass 1.055 0.001 1.000 BM (EB) mass
migration Migratory behavior (see text) 0.386 0.002 0.511 OU migration
region Main biogeographic region of breeding
range (see text)
0.659 0.001 0.993 k region
latmax ° Maximal range extension to the North 0.318 0.001 0.588 k lat_max
latmin ° Maximal range extension to the South 0.119 0.552 0.990 k lat_min
latmean ° Mean latitude ((latmax–latmin)/2) 0.229 0.087 1.000 k lat_mean
latequator ° Mean latitude from absolute values of
the extremes
0.183 0.181 1.000 k lat_equator
longmax ° Maximal range extension to the East 0.320 0.002 0.469 k (OU) long_max
longmin ° Maximal range extension to the West 0.459 0.001 0.700 k long_min
786 ª 2015 The Authors. Ecology and Evolution published by John Wiley & Sons Ltd.
Evolution of Leaf Warbler Songs D. T. Tietze et al.
2012; and JM’s collection). Elevational extent of the
breeding range of P. trivirgatus benguetensis was estimated
from the distribution of appropriate habitat within its
restricted range. Breeding habitat was classified into five
discrete types from open to closed following Badyaev and
Leaf (1997): (1) open with no or very sparse vegetation,
(2) bushes and subalpine bushes, (3) intermediate between
bushes and forest habitats, gardens, (4) coniferous, and
(5) deciduous forests. Some species’ habitat requirements
spanned more than one of the above-mentioned catego-
ries. In these cases, the habitat type most commonly occu-
pied was used. As before, when data on subspecies were
unavailable, species information was obtained (comple-
mented by Gaston 1974; Alstr€om et al. 2010, 2011).
Statistical analysis
Principal component analysis was conducted in R v3.0.2
(R Core Team 2013) with function prcomp with scaling
for three sets of directly measured song parameters: fre-
quency, composition, and both (Table 1). In the PCA
with all measured song parameters, the first two compo-
nents (PCAall1, PCAall2) had eigenvalues of 1.66 and
1.48, respectively, and together explained only 50% of
total variance. PCAall1 was negatively loaded by element
time parameters and PCAall2 with maximum frequency.
The first two components on compositional parameters
(PCAcomp1, PCAcomp2) accounted for 70% of total var-
iance with eigenvalues of 1.51 and 1.12. PCAcomp1 was
negatively loaded with element duration while PCAcomp2
was negatively loaded with element number and verse
duration. Finally, the first component of PCA on fre-
quency parameters (PCAfreq1) yielded an eigenvalue of
1.34 and singly made up 36% of total variance. It was
positively loaded by maximum and to a lesser degree by
minimum element bandwidth and maximum frequency.
Note that PCAfreq2 is not considered due to a lack of
phylogenetic signal. More information on the principal
components can be found in the Supplementary Informa-
tion (Tables S1–S3).
Testing for phylogenetic signal was conducted for both
song variables and explanatory variables. Following the
guidelines set up by Blomberg et al. (2003), this was car-
ried out in a two-step manner in R (package picante
v1.6-1, Kembel et al. 2010): signal detection and quantifi-
cation. First, it was tested whether the data deviates sig-
nificantly from the basic assumption that character states
are randomly distributed across the phylogenetic tree. If
this was the case, the null hypothesis that characters
evolved independently from their phylogenetic history
was rejected. In a second step, the strength of phyloge-
netic signal was inferred using the K statistic (Blomberg
et al. 2003). Blomberg’s K is a measure of signal strength
where K = 0 means a random distribution (i.e., no signal,
total phylogenetic independence) and K = 1 a character
state distribution as expected under a Brownian motion
model of evolution (i.e., strong phylogenetic signal). We
also calculated Pagel’s lambda and tested each variable for
the best evolutionary model given the phylogeny by
choosing the model with the lowest AICc (sample size-
corrected Akaike information criterion) value out of
Brownian motion, Ornstein–Uhlenbeck, early-burst,
lambda (Pagel 1999), and white-noise (nonphylogenetic)
model (R package geiger v2.0.3, Harmon et al. 2008).
Bivariate correlations for all pairs of one song trait and
one explanatory variable each were performed. As related
taxa tend to resemble each other, the tip node data (i.e.,
measured in extant species) cannot a priori be assumed
to represent independent data points. To address this
problem, phylogenetically independent contrasts (PICs;
Felsenstein 1985) were computed for each pair of vari-
ables (R package ape v3.0-11, Paradis et al. 2004). In
addition to conventional bivariate correlations with the
raw data set, a second correlation analysis was conducted
based on these contrasts.
In order to account for multifactorial explanations for
single song features, linear models were formulated in R
and stepwise reduced from all to a minimum number of
explanatory variables. Phylogenetic generalized linear
models (pGLS; R package caper, Orme et al. 2012) were
Table 1. Continued.
Category Trait Unit Definition K P k Model R label
longmean ° Mean longitude ((longmax–longmin)/2) 0.396 0.001 0.642 k long_mean
elemax m Highest elevation in the breeding season 0.385 0.001 0.663 OU ele_max
elemin m Lowest elevation in the breeding season 0.380 0.002 0.636 OU ele_min
elemean m Mean elevation ((elemax–elemin)/2) 0.432 0.001 0.783 OU ele_mean
habitat Habitat density (see text) 0.782 0.001 1.000 BM (OU) habitat
Precise definitions of all song parameters used for analysis and explanatory variables with phylogenetic signal (Blomberg’s K with P value, Pagel’s
k), estimated model of evolution (BM: Brownian motion, EB: early burst, OU: Ornstein–Uhlenbeck, k: lambda; alternative models in parentheses, if
DAICc < 2; for details see text) and R labels used in the Electronic Appendix. Temporal parameters were measured in seconds to three digits, fre-
quency parameters in kilohertzes to three digits.
ª 2015 The Authors. Ecology and Evolution published by John Wiley & Sons Ltd. 787
D. T. Tietze et al. Evolution of Leaf Warbler Songs

used to correct for phylogeny. Only the explanatory vari-
ables from the minimal corresponding linear model were
fed into each pGLS, including those without significance.
For example, the linear model for tges started with all
potentially explanatory variables and was stepwise reduced
by R to migration and lat_equator (P < 0.001 for both),
ele_max (P < 0.05), ele_min (P < 0.1), and habitat
(P > 0.1). All these five variables were used as explanatory
variables in a pGLS, which returned only migration,
lat_equator, and ele_min as significant components of the
model with lat_equator having the highest significance
(Table 2). For the remaining song traits, see Supplemen-
tary Data S2 and S3.
Results
Phylogenetic tree
We obtained sequence data for all 80 taxa under consid-
eration (Table S4). The BEAST tree (Fig. 3) was well
resolved (48 nodes with full support). The Phylloscopidae
were split into two major clades at an early stage. One
clade with full node support contained all Seicercus spe-
cies in two nonsister clades and all Phylloscopus species
restricted to the tropics. The second clade consequently
comprised Phylloscopus species with extant temperate
distribution only. Species complexes with significant sub-
structure were found in both major lineages. Some taxa
with clearly different song had short divergence times
(e.g., P. ogilviegranti subspecies, S. grammiceps/castaniceps,
Chinese vs. Himalayan populations of P. pulcher).
Song features
The variability in phylloscopid song (Fig. 2) was reflected
in an immense variance in song parameters among leaf
warbler taxa (Supplementary Data S1): A complete verse
in leaf warbler song lasted 1.88 � 0.97 (0.46–5.31) s. Its
longest element took 0.18 � 0.20 (0.03–1.43) s, and its
shortest element took 0.11 � 0.20 (0.01–1.43) s. The
verse consisted of 16.5 � 17.7 (1.0–96.1) distinct ele-
ments. The speed was 8.4 � 6.3 (0.7–30.3) elements per
second. The number of unique element types was
3.7 � 2.5 (1.0–14.3). A maximum frequency of
7.50 � 1.18 (5.17–10.12) kHz was reached. The average
minimum frequency was 3.11 � 0.93 (1.30–6.85) kHz,
and the average mean frequency was 5.30 � 0.93 (3.41–8.33) kHz. The average verse covered a bandwidth of
4.44 � 1.07 (1.52–7.39) kHz, the maximum element cov-
ered a bandwidth of 3.80 � 1.00 (0.96–5.98) kHz, and
the minimum element covered a bandwidth of
2.05 � 0.90 (0.66–4.42) kHz. The frequency gradient
from the first to the last element was �0.11 � 0.80
(�2.90 to 2.47) kHz on average. The three complexity
measures (defined in Table 1) yielded 2.17 � 0.83 (1.00–4.83), 0.38 � 0.27 (0.02–1.00), and 0.33 � 0.12 (0.12–0.64), respectively.
The phylogenetic signal for song traits (Table 1) varied
with Blombergʼs K between slightly over 0 and almost 1:
A relatively strong signal (Blombergʼs K: 0.7–1.1) was
only detected for the duration of the longest and of the
shortest element – much larger than for any other song
parameter. A medium signal strength (Blombergʼs K: 0.4–0.8) was found for all other compositional parameters but
the element diversity, for the frequency parameters maxi-
mum frequency and maximum element bandwidth, and
for complexity2. Element diversity and the remaining fre-
quency parameters as well as complexity1 and complex-
ity3 exhibited a weak signal (Blombergʼs K: 0.1–0.4) only
and mostly failed the randomisation test (Table 1). Values
for Pagel’s k were closer to 1 except for complexity1 and
significantly correlated with K values (Table 1). Almost all
vocal traits evolved under a k model, but element dura-
tions under a Brownian motion (or early-burst) model
and element number and speed under the Ornstein–Uh-lenbeck model.
Variation in explanatory traits
Leaf warbler attributes that could explain song features
varied in variation breadth and degree of equipartition
(Table S6): Leaf warblers are small passerine birds with
11.0 � 0.8 (9.5–13.0) cm body length and 7.8 � 1.7
(5.0–11.8) g body mass. Twelve resident (score 0), 31 par-
tially migratory (score 1), and 37 long-distance migrants
(score 2) led to an average migratoriness of 1.3 � 0.7.
The breeding ranges of 26 taxa were mainly in the Palae-
arctic including Macaronesia, of 39 taxa in the Sino-
Himalayan region, of 13 taxa in South-east Asia, and of
two taxa in tropical Africa (cf. Fig. 1). Breeding leaf war-
blers could be found between 34°S and 71°N and between
18°W and 41°W (across Eurasia and North America) with
a diversity hotspot in Southwest China (Fig. 1). This
resulted in a mean latitude of 31.0 � 14.7 (�18 to 59)
and a mean longitude of 90.0 � 33.4 (�17 to 150). Leaf
warblers were found breeding from sea level up to 4880
m on average. This resulted in a mean elevation of
1945.0 � 868.5 (450–3965) m. Only three taxa were
found in sparse vegetation, seven in bushes, 13 in bushes
to forest, 13 in coniferous, and 44 in deciduous forests,
resulting in average habitat density of 4.1 � 1.2.
The phylogenetic signal for explanatory variables
(Table 1) varied with Blombergʼs K between slightly over
0 and slightly over 1: A strong signal (Blombergʼs K: 0.7–1.1) was found in body length and mass as well as habitat.
Mean elevation, maximal range extension to the West, and
788 ª 2015 The Authors. Ecology and Evolution published by John Wiley & Sons Ltd.
Evolution of Leaf Warbler Songs D. T. Tietze et al.

Table
2.Correlationbetweenvariab
les.
Coefficien
tsofcorrelationforallpairw
isecorrelations.
*P<0.05,**
P<0.01,***P
<0.001.Values
inbold
stan
dforsignificantcorrelationsin
phylogen
etically
indep
enden
tcontrasts.Underlined
values
indicatesignificantcontributionsto
minim
allinearmodels.
Values
withavertical
lineontherightsidecontributedsignificantlyto
thephylogen
etic
gen
eralized
linearmodel
(pGLS).Explan-
atory
traits
withstrongestcontributionto
thepGLS
foragiven
songtraitaremarkedin
yellow.Forfullmodel
output,seetheSu
pplemen
ts.
ª 2015 The Authors. Ecology and Evolution published by John Wiley & Sons Ltd. 789
D. T. Tietze et al. Evolution of Leaf Warbler Songs

main biogeographic region exhibited medium signal
strength (Blombergʼs K: 0.4–0.8). The remaining distri-
butional parameters and migratoriness showed a weak
signal (Blombergʼs K: 0.1–0.4), latmin, and latequator
even failed the randomisation test (Table 1). Values for
Pagel’s k were either closer to 1 (body length and mass,
region, latitudes except for maximum) or between 0.45
and 0.8 and correlated with K values (Table 1). Biogeo-
graphic region and horizontal distributional parameters
evolved under a k model, body length and mass and
habitat under a Brownian motion model and migratory
behavior and elevational distribution under the Orn-
stein–Uhlenbeck model.
Constraints on song parameters
We found a negative relationship between body size
parameters with general frequency parameters of song
across species that was backed by PICs for most bivariate
correlations (fmax, fmin, fmean, and all PCA values that
were strongly loaded by frequency parameters; Table 2).
Body mass was furthermore positively associated with
tempo (and diversity-tempo index, complexity3) with
heavier species performing more complex songs with fas-
ter repetition rates (Table 2; again both correlations were
backed by PICs). Minimal linear models supported these
findings, because body length contributed significantly to
P. subaffinis
P. amoenus
S. burkii
P. goodsoni
S. castaniceps
P. calciatilis
P. ogilviegranti disturbans
P. emeiensis
P. sindianus sindianus
P. cantator
P. hainanus
P. fuligiventer weigoldi
P. reguloides assamensis
P. bonelli
P. ijimae
P. canariensis
P. sarasinorum
P. trochiloides trochiloides
P. collybita brevirostris
P. fuscatus robustus
S. grammiceps
P. armandii perplexus
P. pulcher (Nepal)
P. forresti
P. ibericus
P. examinandus
P. poliocephalus
P. ogilviegranti ogilviegranti
P. xanthodryas
P. proregulus
P. occipitalis
P. humei humei
P. griseolus
P. tytleri
P. collybita collybita
P. orientalis
P. kansuensis
P. trivirgatus
P. occisinensis
P. borealoides
P. collybita tristis
P. benguetensis
P. reguloides ticehursti
S. omeiensis
P. borealis
P. schwarzi
P. xanthoschistos xanthoschistos
P. sindianus lorenzii
P. magnirostris
P. davisoni
S. tephrocephalus
P. subviridis
P. trochiloides viridanus
P. armandii armandii
P. collybita caucasicus
P. inornatus
P. ricketti
P. yunnanensis
S. whistleri
P. claudiae
P. humei mandellii
P. tenellipes
S. poliogenys (Himalaya)
P. chloronotus
P. coronatus
P. plumbeitarsus
P. trochiloides obscuratus
P. umbrovirens
P. fuscatus fuscatus
P. maculipennis
P. affinis affinis
P. trochilus
P. reguloides reguloides
S. soror
S. valentini
P. sibilatrix
P. pulcher (China)
P. nitidusP. ruficapilla
S. affinis
Acrocephalus dumetorum
1
1
0.93
0.55
1
0.77
0.92
1
1
1
1
0.79
1
1
1
1
1
0.990.68
1
0.87
1
10.94
0.51
1
1
1
1
1
1
1
1
1
1
1
1
0.99
1
1
0.82
0.91
0.59
0.74
0.95
0.96
1
0.63
1
0.99
0.99
0.95
1
1
0.99
1
1
0.44
0.71
1
0.96
0.85
0.86
1
1
0.48
1
1
1
0.98
1
0.83
1
11
1
1
1
0.8
1
Figure 3. Phylogeny of leaf-warblers
(Phylloscopidae). Molecular phylogeny of leaf-
warblers (Phylloscopidae) based on a 1900-bp
alignment of three genes (for details see Table
S5) reconstructed in BEAST (genes and codon
positions partitioned, GTR + Γ + I model for
cytochrome b and myoglobin, GTR + I model
for 12S rDNA, 30 million generations).
790 ª 2015 The Authors. Ecology and Evolution published by John Wiley & Sons Ltd.
Evolution of Leaf Warbler Songs D. T. Tietze et al.

the explanation of most frequency variables (and fre-
quency-dependent variables) listed above. However, only
three of those correlations between body length and fre-
quency parameters contributed significantly to pGLSs
(Table 2; strongest contribution to explanation of fmean,
Fig. 4D). In contrast, body mass showed the strongest
contribution to the explanation of tempo (and diversity-
tempo index, complexity3) with pGLSs (Table 2; Fig. 4B).
Spatial parameters of species distribution ranges (lati-
tude, longitude, and elevation) correlated with a variety
of song parameters; however, notably many of those
correlations were significant only when corrected for phy-
logeny (Table 2).
All latitudinal variables were significantly correlated with
song length (tges) and structural song variables (complex-
ity2, PCcomp2), and most of these correlations were backed
by PICs (Table 2). Mean latitude did not contribute signifi-
cantly to linear models at all, and only two correlations of
maximal range extension to the North (latmax) and song
parameters (Dfmin and complexity1) contributed to pGLSs
(Table 2; Fig. 4F). The two remaining latitudinal variables
differed greatly in their contribution to pGLSs. Correlations
x
x x
xx
x
xx xxx
x
xx
x xx
x
x
xx
x
xx
x
x
x
x
x
x
x
x
xx
x
xxx
xxx
xxx
x
x
xx
xx
x
xx
x
x
x
x
x
x
x
x xx
x
xx
x
xxx
x
x
xxx
xxx
x
x
Body length [cm]
Mea
n fre
quen
cy [k
Hz]
x x
x
x
xx
x
x
x
x
x
x
xx
xx
x
xxx
x x xx
x x x
x
x
x
x
xx
x
x
xxxx
xx
xx
x
x
x
xx
xx
x
xx
x
x
x
x
xx
xx
x xx
x
x
xx
x
x
xx
xx
x
x
x
xx
x
Distance from the equator [°]
Dur
atio
n of
ver
se
x
x
x
x
xx
xx
xxx
x
xx
xxxxx
xx
xxx
xx
xxxx
xx xxxx
xxxxx
x
xxxx
x
x
xxx
xx
x
xx
xxx
x
x
xx
x
xx
xxxxxxx xx
xx
x x
x
Body mass [g]
Song
spe
ed [e
lem
ents
/s]
xx
x
xx
x
x
x
x
x
xx
x
x
xx
x x
xx
x xx x
xx
x
xx
x
x
x
x xx
x
xx x x
x
xxx
x
xx
x xx
xx x x
xx
x
x
xxx
x x x
xx
x
x
x
x
x xx
x
x
x
x
xx x
Range extension to the East [°]
Num
ber o
f ele
men
t typ
es
xx
x
x
x
x
x
x
x
x
x
x
x
x
x
x
xxx
xxx
x
x
x
x
x
x
xxx
x
x
xxx
xx
x
xx x
x
x
x
x
x
xx
x
xx
x
xx
x x
x
x
x
x
x
x
x
x x
x
x
x
xx
x
x
xx
xx
x
x
x
Range extension to the South [°]
Max
imum
ele
men
t ban
dwid
th [k
Hz]
x
x
x
x
x
x
xx
x
xxx
x
x
xx
xx
x
x xxxx
x
xx
x
xx
x
x
x
x
x
x
x
x
xx
x x
xx
x
x
xx
x x
x
x
x
x
x
x
x
x
xx
x
x
x
x
x xxx
x
xxx
xx x
x
x
x
x
x
Range extension to the North [°]
Com
plex
ity1
x
x
xxxx
x
x
x
x
x
x
x
xx x
x
x
xxx
xx
x
x x
x
x
xx
x
x
x
xx
x
xxx x
x
x
xx
xx
xx
xx
x
xx
x
xxx
x
xx
x
xx
xx
x
x
x
x
x
x
x
xx
xx
x
xx
x
Distance from the equator [°]
Com
plex
ity2
x
xx
x
xx x
x
x
x
x
x
xxx
x
xxxx
xx xxx x
xx
x
x
x
x xx
xxxxx x
x
xx
x
x
x
x
x
x
x
x
xx
x
x
x
x
xx xxx x
x
x
x
xx
x
x
xx
xx
x
x
x
x
x
x
Distance from the equator [°]
PC 2
(stru
ctur
al P
CA)
x
xxx
x
x
xx
x
x
x
x
x
x
x
x
xx
x
xxx
x
x
x
xx
x
x
xx
x
x
xxx
xx
xxx
x
x
x
x
x
x
x
x
x xx x
x
x
x xxx
x
xx
x
x
x x
x
x
x
xx
x
x
x
x
xxx
x
x
9.5 10.0 10.5 11.0 11.5 12.0 12.5 13.0
45
67
8
0 10 20 30 40 50 60
12
34
5
5 6 7 8 9 10 11 12
05
1015
2025
30
0 50 100 150 200
24
68
1012
14
—20 0 20 40
12
34
56
0 20 40 60
12
34
0 10 20 30 40 50 60
0.0
0.2
0.4
0.6
0.8
1.0
0 10 20 30 40 50 60
—4—3
—2—1
01
—20 0 20 40
—3—2
—10
12
Range extension to the South [°]
PC 1
(fre
quen
cy P
CA)
(C)(B)(A)
(F)(E)(D)
(I)(H)(G)
Figure 4. Bivariate correlations. Selection of bivariate plots between explanatory and response variables: (A) duration of verse on distance from
the equator, (B) song speed on body mass, (C) number of elements per verse on range extension to the East, (D) mean frequency on body
length, (E) maximum element bandwidth on range extension to the South, (F) complexity1 on range extension to the North, (G) complexity2 on
distance from the equator, (H) principal component 2 from the PC analysis of structural song traits on distance from the equator, (I) principal
component 1 from the PC analysis of frequency parameters on range extension to the South. Regression lines were omitted, if direct correlations
were insignificant. For trait definitions see Table 1, for coefficients of correlation and significance levels, see Table 2.
ª 2015 The Authors. Ecology and Evolution published by John Wiley & Sons Ltd. 791
D. T. Tietze et al. Evolution of Leaf Warbler Songs

of seven song parameters with maximum range extension
to the South (latmin) contributed significantly to pGLSs,
most of them being strongest contributions to the explana-
tions of frequency or frequency-dependent variables
(Table 2; Fig. 4E, I). In contrast, four correlations of mean
range distance from the equator (latequator) with temporal
structural song variables showed strongest contributions to
pGLSs (Table 2). Generally, with increasing distance of
breeding range from the equator to temperate regions, leaf
warbler songs were longer and less complex across species
(Table 2; Fig. 4A, G, H).
Of three longitudinal explanatory variables, only corre-
lations between maximum range extension to the East
(longmax) and five song parameters contributed signifi-
cantly to pGLSs. Four of these correlations showed
strongest contributions to pGLSs explaining element
diversity (zeltype), minimum element bandwidth (Dfmin),
frequency gradient (fmodend), and the second PC for fre-
quency (Table 2; Fig. 4C).
Contribution of elevational extent of breeding ranges
to linear models was less important. Only correlations of
lower limits of elevational breeding ranges (elemin) with
four song parameters contributed significantly to pGLSs
(Table 2). Among these four, only element diversity (zel-
type) showed a significant correlation with elemin that
was backed by PICs (Table 2).
The three remaining explanatory variables did not con-
tribute strongly to linear models: Surprisingly habitat did
not show any correlations with song variables that would
have been backed by PICs nor did habitat contribute to
pGLSs for any song variable. Likewise, migratory behavior
and biogeographic region of breeding did not show any
significant correlation after phylogenetic contrasting
(except migration and maximum frequency, fmax), but
some correlations of these two variables with song param-
eters contributed to pGLSs (Table 2).
Discussion
Phylogenetic signal in song
The hypothesis that song characters show significant phy-
logenetic signals could be confirmed in general, although
a few song parameters such as element diversity slightly
and frequency bandwidth and frequency gradient clearly
missed a significant deviation from random distribution
across the phylogenetic tree.
The hypothesis that song characters are considerably
more labile than morphological characters could be con-
firmed, too (average K values of 0.5 vs. 1.0 and k values
of 0.8 vs. 1.0 in Table 1, a much clearer contrast than in
Mahler and Gil 2009). Only the length of the shortest and
the longest element per verse approached K and k values
of 1 and evolved under a Brownian motion model that
both indicates a high degree of trait conservation (such as
for body length and mass). These findings are in accor-
dance with previous studies documenting a generally low
phylogenetic signal of passerine song traits, for example,
in cardueline finches (Cardoso and Mota 2007; Cardoso
et al. 2012; except presence of harmonics) or even an
absence of phylogenetic signal in half of all parameters
analyzed of wood warbler (Parulidae) flight calls (Farns-
worth and Lovette 2008) and avian songs (or songlike vo-
calisations) in Amazon rainforest communities (Tobias
et al. 2010).
The hypothesis that frequency song parameters are
more conserved than temporal and structural ones (Mah-
ler and Gil 2009) had to be rejected (average K values of
0.3 vs. 0.6 and k values of 0.79 vs. 0.86 in Table 1). (Note
that Mahler and Gil [2009] concluded that from differ-
ences in coefficients of variation and not from differences
in K or k values). This result is in accordance with the
finding that temporal components were more congruent
with phylogeny than frequency components in oropendo-
las (Icteridae, Psarocolius; Price and Lanyon 2002) and au-
klets (Alcidae; Seneviratne et al. 2012). One possible
explanation for differences in strength of phylogenetic sig-
nal among song parameters is that some vocal traits have
a strong genetic component (thus are rather innate) while
the others are mainly learned. Such a relationship between
signal strength and heritability has been demonstrated for
syntax parameters and call-like song components in songs
of goldcrests, Regulidae, and of treecreepers, Certhiidae
(P€ackert et al. 2003; Tietze et al. 2008).
In leaf warblers trait conservation of element duration
might have a strong heritable component, too, at least
with respect to the results of experiments with na€ıve birds
reared in acoustic isolation showing that element length
is largely innate (Schubert 1976; Thielcke 1983). Although
these experiments were conducted with two leaf warbler
species only (P. collybita, P. trochilus) and thus the results
might not easily be generalized for the entire family, ele-
ment parameters in these species seem to be the relevant
song traits involved in species recognition (Schubert
1971; Helb 1973; Martens and H€anel 1981; Martens and
Meincke 1989; Martens et al. 2004) and might therefore
be more strongly conserved than other song traits.
Impact of body size on song frequency
The hypothesis that body size is negatively correlated with
frequency characteristics could be confirmed. Neverthe-
less, not all such correlations were supported by phyloge-
netically independent contrasts. Body length significantly
contributed to linear models explaining variation of maxi-
mum, minimum, and mean frequencies. At least one
792 ª 2015 The Authors. Ecology and Evolution published by John Wiley & Sons Ltd.
Evolution of Leaf Warbler Songs D. T. Tietze et al.

body measure significantly contributed to the correspond-
ing pGLS. While neither of the two was the best predictor
for the extreme frequencies, body length was for mean
frequency.
As expected, measures of overall frequency are strongly
correlated with body size in such a way that larger birds
produce songs of lower pitch. This association seems to
be a general phenomenon in avian vocalisations and has
been demonstrated across a wide range of taxa (Wall-
schl€ager 1980; Ryan and Brenowitz 1985; Wiley 1991;
Badyaev and Leaf 1997; Tubaro and Mahler 1998; Bertelli
and Tubaro 2002; Seddon 2005; Snell-Rood and Badyaev
2008; Cardoso and Price 2010; Martin et al. 2011; Gon-
zalez-Voyer et al. 2013; Greig et al. 2013). A common
explanation is that body size correlates either with the size
of vibrating structures of the syringeal membrane which
produce the sounds (Seneviratne et al. 2012) or with beak
size and shape (Podos 2001; Podos et al. 2004; Derryberry
et al. 2012). This prediction was recently shown to be
valid even within species: In Purple-crowned Fairy-wrens
(Malurus coronatus), larger males display significantly
lower pitched songs; however, only the lower frequency
bound of advertising songs was shown to be negatively
correlated with body size (Hall et al. 2013). Also in Com-
mon Chiffchaffs (P. collybita), song frequencies decrease
with male body size, and such slight individual differences
of song frequency range were even shown to have a sig-
nificant effect on the intensity of a male competitor’s ter-
ritorial reaction (Linhart et al. 2012).
In addition to effects on overall frequency, body size of
leaf warblers also explained measures of tempo in that
heavier species sang faster and more complex. Similarly,
in the Maluridae from Australia and New Guinea males
of those species with larger testes sing shorter songs
including more rapidly repeated and more variable notes
(Greig et al. 2013). This is more difficult to interpret than
frequency relationships, especially when considering beak
size as a limiting factor of vocal traits – however, Mahler
and Gil (2009) did not confirm that beak shape was a
morphological constraint of leaf warbler song. But as the
vocal apparatus and body size may not always be directly
proportional to each other (Ryan and Brenowitz 1985),
the impact of body dimensions on frequency or temporal
song traits may be more intricate than generally thought.
In fact, in other bird groups, the correlations among body
size parameters and song tempo were shown to be the
other way round: In Darwin’s finches, larger species pro-
duced slower-paced signals (Podos 2001) and in antbirds
(Thamnophilidae) beak width was shown to be a strong
predictor of song pace, such that species with broad bills
performed songs with longer notes at a lower repetition
rate (Seddon 2005). On the one hand, body mass was
regarded as a morphological constraint of respiratory fre-
quency and thus maximum note repetition rate (Suthers
2001). On the other hand, fast and complex songs require
rapid and intricate muscle contractions of the vocal appa-
ratus and hence are expected to be costly (Ballentine
2009). Likewise, a possible explanation for the negative
correlation of body size and trill tempo in leaf warblers
may be that heavier birds can produce songs of high
energetic cost more easily. Thus, considering the conflict-
ing results from bioacoustic studies, there is possibly no
generalized rule on the effect of body dimensions on the
pace of avian vocal signals, also taking into account that
some studies found no significant correlation of body
dimensions with any song parameter analyzed (Cardoso
et al. 2012).
How habitat density constrains the song
Contrary to the results by Mahler and Gil (2009), the
hypothesis that song characters (particularly frequency
parameters) vary strongly with habitat characteristics had
to be rejected for leaf warblers. We are well aware of sin-
gular adaptations to habitat such as P. magnirostris to
mountain torrents (Martens and Geduldig 1990), but we
here only considered vegetation density. The direct corre-
lation of this habitat dimension with frequency band-
width was highly significant, but due to phylogenetic
relationships among the taxa. In fact, there is mixed evi-
dence of habitat affecting vocal traits from previous stud-
ies. Mahler and Gil (2009) tested this hypothesis only
indirectly using tarsus/beak ratio as an indicator of habi-
tat use and found no effect after analysis of contrasts. In
an earlier study, Badyaev and Leaf (1997) found for Phyl-
loscopus and Hippolais warblers that temporal parameters
are strongly correlated with habitat structure while fre-
quency parameters are not. Rheindt et al. (2004; p. 385)
confirmed an effect of habitat on frequency song parame-
ters only if both traits were phylogenetically corrected
(but after complex correction for autocorrelation the hab-
itat effect was not detectable anymore!).As a generalized rule, it has been proposed that higher
frequencies (above 2 kHz) are more likely to be found in
open habitat and that rapid repetition would be avoided
in forests (Kroodsma and Miller 1982; chapter 5). Both
assumptions were not supported by our data. In Amazo-
nian bird communities, dense habitats seem to enhance
songs of lower frequencies, higher pace and including a
greater number of notes (lower pitch but higher temporal
complexity; Tobias et al. 2010). Furthermore, from meta-
analyses of 26 bioacoustic bird studies, there is no clear
evidence that closed habitat means generally lower fre-
quencies (Boncoraglio and Saino 2007).
Very plausibly, habitat characteristics other than den-
sity, not investigated here, might still be important and
ª 2015 The Authors. Ecology and Evolution published by John Wiley & Sons Ltd. 793
D. T. Tietze et al. Evolution of Leaf Warbler Songs

deliver potential ultimate causes for the correlations with
distributional and vocal traits. For example, Medina and
Francis (2012) showed that song complexity of Nearctic
passerines increases with seasonality, particularly with
precipitation (and temperature to a lesser extent) and is
apparently not correlated with sexual selection indexes
such as latitude, migration, and dichromatism. Most leaf
warbler species display their songs from perches rather
than from canopy cover or understorey like other species,
and thus song characteristics might be less affected by
habitat density. In that context, perch height was previ-
ously shown to have an effect on antbird songs in Neo-
tropical rainforest communities with a trend of a
minimization of signal degradation of songs toward lower
frequency range and slower time structure near the
ground (Nemeth et al. 2001).
Last, the frequency and temporal dimensions of song
might undergo indirect evolutionary changes as a conse-
quence of beak size changes due to ecological adaptation
(Mahler and Gil 2009; Derryberry et al. 2012).
Song variation in space
The hypothesis that song parameters vary significantly
with geographic distribution (latitudinal and longitudinal
extent of breeding areas) could be confirmed. Distribu-
tional traits were the strongest contribution to linear
models, explaining 8 of the 13 direct and 8 of the 9
derived song traits.
Song complexity (all three measures) decreased toward
higher latitudes against the trend reported by Mahler and
Gil (2009). Although it could be confirmed that species-
specific mid-latitude is a labile trait (Price et al. 1997), it
turned out to be a good predictor for various song fea-
tures (even if extreme latitudes appear more influential)
and this trait was used by Mahler and Gil (2009, p. 48) as
a surrogate for the strength of sexual selection.
Prior to any explanation of these deviating results, two
major differences between the latter study and ours have
to be outlined. Most importantly, the data set by Mahler
and Gil (2009) included almost exclusively Palaearctic
species and boreal species in the Sino-Himalayas, but
none of the subtropical and tropical species of the Afro-
tropic (n = 2 in our data set) and the Indomalaya (conti-
nental South-east Asia [n = 8] and the Greater Sundas
[n = 5]) nor any member of genus Seicercus nested in the
leaf warbler tree, also including several tropical species of
the lower latitudes (n = 10).
Second, the northward increase of song complexity
found by Mahler and Gil (2009) was inferred from a lati-
tudinal gradient of their PC1 implying that northern Pal-
aearctic species have larger repertoires, longer songs and
more highly variable and complex syllables than species
of lower latitudes. A comparable positive latitudinal gra-
dient of song elaboration was found in cardueline finches
of the Northern Hemisphere (with very similar loadings
of PC1; Cardoso et al. 2012) and in the Maluridae of the
Southern Hemisphere in such a way that “complexity
may increase in association with more temperate or
variable environments” (Greig et al. 2013). Furthermore,
similar northward clinal variation of songs along popula-
tion chains East and West of the Qinghai-Tibetan Plateau
was demonstrated before for closest relatives of the
Greenish Warbler clade (P. trochiloides and allies; Irwin
2000; Irwin et al. 2001b). In fact, one effect confirmed by
our analyses is a significant northward increase of song
duration, which was commonly interpreted as an effect of
greater sexual selection at higher latitudes (Mahler and
Gil 2009; Cardoso et al. 2012). As an example, in Willow
Warblers (P. trochilus), long songs are an apparent indica-
tor for male quality, because song length in that species
was shown to be highly correlated with extra-pair pater-
nity and paternity loss (while repertoire size was not; Gil
et al. 2007).
In contrast to previous studies, song complexity indi-
cated by both relative element dissimilarity and diversity
of leaf warbler songs decreased northwards. In more
detail, Greig et al. (2013) found the opposite latitudinal
gradient for the same complexity measure (their “song
versatility” is based on the same calculation as “element
diversity” in our study), while complexity indices (PCs)
used by Mahler and Gil (2009) and Cardoso et al. (2012)
were more strongly influenced by syllable structure rather
than by element dissimilarity and diversity (our study).
Although we did not account for repertoire sizes as a
measure of complexity in our study while Mahler and Gil
(2009) did, by far the greatest individual male repertoires
in the Phylloscopidae were documented from tropical Sei-
cercus species, with no <44 distinct verse types per male
(S. omeiensis; see Martens et al. 1999; P€ackert et al. 2004).
Thus, even considering repertoire sizes of tropical species,
our results cast some doubt on a predicted greater selec-
tive pressure at temperate latitudes on male leaf warbler
repertoires or on complexity of verse patterns.
Additionally, there is the tendency for more complex
song further East in Eurasia where the diversity hotspot
of leaf warblers is. This could be explained by some con-
trast reinforcement or acoustic niche partitioning within
this bird family.
The hypothesis that song parameters vary significantly
with elevational extent of breeding area could partially be
confirmed. Elevational impact on verse length and ele-
ment bandwidths seem to have historical reasons, but the
positive impact on mean frequency and the negative
impact on the number of element types appear to be cau-
sal since supported by PICs. That number of different ele-
794 ª 2015 The Authors. Ecology and Evolution published by John Wiley & Sons Ltd.
Evolution of Leaf Warbler Songs D. T. Tietze et al.

ment types per verse decreases with elevation maybe due
to fewer resources (Price et al. 2014) and less competition
by congeneric species at higher elevations (similar in
Gonzalez-Voyer et al. 2013).
According to our analysis, element diversity and dura-
tion of leaf warbler songs decrease with elevation. Similar
spatial variation of songs was found in cardueline finches
toward longer and more elaborated songs with higher ele-
ment diversity at lower elevations, and variation in strength
of sexual selection along an elevational gradient was dis-
cussed as a trigger of song evolution in this passerine group
(Snell-Rood and Badyaev 2008). However, elevation might
be associated with a number of ecological factors affecting
vocalisations that might not have been considered. For
example, Afrotropical Green Hylias (Hylia prasina) sing at
lower frequencies at higher elevations with reduced canopy
cover and likewise avoid masking by insect sounds in these
local habitats (Kirschel et al. 2009). In contrast, in
Neotropical Grey-breasted Wood Wrens (Henicorhina
leucophrys), local adaptation is assumed to have enhanced
ecological speciation due to a link of morphological and
acoustic variation: In this species, populations at high ele-
vations have songs of a broad bandwidth including high-
frequency notes (Caro et al. 2013). Consequently, there is
not much of a clue for a generalized effect of elevation on
avian vocal traits either (particularly for transcontinental
comparisons) because local environmental conditions and
ecological gradients affecting vocal variation might strongly
differ among mountain systems. Additionally, traits of
elevational distribution themselves evolved under a differ-
ent model than almost all other explanatory traits.
Conclusion
Basic components of leaf warbler song evolve under a
Brownian motion model, being possibly innate. Although
body size is also phylogenetically constrained, it is strongly
correlated with frequency even after phylogenetic correc-
tion. This indicates a causal correlation for physical
reasons reported earlier. The habitat variable might still be
too simplified, because it merely reflects increasing habitat
density. The impact of habitat on leaf warbler song appears
to be more complicated than could be tested in this
approach. Habitat and geographical dimensions should be
replaced by environmental-niche components in order to
work out ecological–physiological causalities. This should
be further combined with historical biogeography in order
to trace song trait evolution more realistically.
Acknowledgments
For sample sources, see P€ackert et al. (2012). DTT was
funded by the German Research Foundation DFG (Ti
679/2-1). JM received annual grants from Feldbausch
Foundation and Wagner Foundation at Fachbereich Biol-
ogie of Mainz University for fieldwork in Asia. C. Blume,
S. Emmling, D. Garceag, and C. Waßmann digitised JM’s
recordings. C. Tipp from the British Library sent addi-
tional recordings from the National Sound Archive and
K.F. Jachmann contributed two recordings of P. examin-
andus. A. Rauh provided help in the DNA laboratory.
Reviewers and the editors helped to improve the manu-
script. Many cordial thanks are due to all friends, col-
leagues, and organizations mentioned. We acknowledge
financial support by Deutsche Forschungsgemeinschaft
and Ruprecht-Karls-Universit€at Heidelberg within the
funding programme Open Access Publishing.
Conflict of Interest
None declared.
References
Ackerly, D. D. 2000. Taxon sampling, correlated evolution,
and independent contrasts. Evolution 54:1480–1492.Alstr€om, P., and U. Olsson. 1990. Taxonomy of the Phylloscopus
proregulus complex. Bull. Br. Ornithol. Club 110:38–43.
Alstr€om, P., P. Clement, and S. C. Madge. 2006a. Species
accounts of Phylloscopus and Seicercus warblers. Pp. 646–679
in J. del Hoyo, A. Elliot and J. Sargatal, eds. Handbook of
the birds of the world Vol. 11. Lynx, Barcelona.
Alstr€om, P., P. G. Ericson, U. Olsson, and P. Sundberg. 2006b.
Phylogeny and classification of the avian superfamily
Sylvioidea. Mol. Phylogenet. Evol. 38:381–397.Alstr€om, P., P. Davidson, J. W. Duckworth, J. C. Eames, T. T.
Le, C. Nguyen, et al. 2010. Description of a new species of
Phylloscopus warbler from Vietnam and Laos. The Ibis
152:145–168.Alstr€om, P., T. Saitoh, D. Williams, I. Nishiumi, Y. Shigeta, K.
Ueda, et al. 2011. The Arctic Warbler Phylloscopus borealis –
three anciently separated cryptic species revealed. The Ibis
153:395–410.
Badyaev, A. V., and E. S. Leaf. 1997. Habitat associations of
song characteristics in Phylloscopus and Hippolais warblers.
Auk 114:40–46.Ballentine, B. 2009. The ability to perform physically
challenging songs predicts age and size in male swamp
sparrows, Melospiza georgiana. Anim. Behav. 77:973–978.
Baptista, L. F., and D. E. Kroodsma. 2001. Avian bioacoustics.
Pp. 11–52 in J. del Hoyo, A. Elliot and J. Sargatal, eds.
Handbook of the birds of the world Vol. 6. Lynx, Barcelona.
Baptista, L. F., and P. W. Trail. 1992. The role of song in the
evolution of passerine diversity. Syst. Biol. 41:242–247.Bertelli, S., and P. L. Tubaro. 2002. Body mass and habitat
correlates of song structure in a primitive group of birds.
Biol. J. Linn. Soc. 77:423–430.
ª 2015 The Authors. Ecology and Evolution published by John Wiley & Sons Ltd. 795
D. T. Tietze et al. Evolution of Leaf Warbler Songs
BirdLife International & NatureServe. 2011. Bird species
distribution maps of the world. BirdLife International and
NatureServe, Cambridge.
Blomberg, S. P., T. Jr Garland, and A. R. Ives. 2003. Testing
for phylogenetic signal in comparative data: behavioral traits
are more labile. Evolution 57:717–745.Boncoraglio, G., and N. Saino. 2007. Habitat structure and
the evolution of bird song: a meta-analysis of the
evidence for the acoustic adaptation hypothesis. Funct.
Ecol. 21:134–142.Cardoso, G. C., and P. G. Mota. 2007. Song diversification
and complexity in canaries and seedeaters (Serinus spp.).
Biol. J. Linn. Soc. 92:183–194.
Cardoso, G. C., and T. D. Price. 2010. Community
convergence in bird song. Evol. Ecol. 24:447–461.
Cardoso, G. C., Y. Hu, and P. G. Mota. 2012. Birdsong, sexual
selection, and the flawed taxonomy of canaries, goldfinches
and allies. Anim. Behav. 84:111–119.Caro, L. M., P. C. Caycedo-Rosales, R. Bowie, H. Slabbekoorn,
and C. D. Cadena. 2013. Ecological speciation along an
elevational gradient in a tropical passerine bird? J. Evol.
Biol. 26:357–374.Catchpole, C. K., and P. J. B. Slater. 2008. Bird song:
biological themes and variations. University Press,
Cambridge.
Clement, P., and A. J. Helbig. 1998. Taxonomy and
identification of chiffchaffs in the Western Palearctic. Br.
Birds 91:361–376.Derryberry, E. P., N. Seddon, S. Claramunt, J. A. Tobias, A.
Baker, A. Aleixo, et al. 2012. Correlated evolution of beak
morphology and song in the neotropical woodcreeper
radiation. Evolution 66:2784–2797.Dickinson, E. C., ed. 2003. The Howard and Moore complete
checklist of birds of the world, 3rd ed. Christopher Helm,
London.
Drummond, A. J., and A. Rambaut. 2007. BEAST: Bayesian
evolutionary analysis by sampling trees. BMC Evol. Biol.
7:214.
Dunning, J. B. 2008. CRC handbook of avian body masses,
2nd ed. CRC Press, Boca Raton.
Farnsworth, A., and I. J. Lovette. 2008. Phylogenetic
and ecological effects on interspecific variation in
structurally simple avian vocalizations. Biol. J. Linn. Soc.
94:155–173.
Felsenstein, J. 1985. Phylogenies and the comparative method.
Am. Nat. 125:1–15.
Gaston, A. J. 1974. Adaptation in the genus Phylloscopus. The
Ibis 116:432–450.
Gil, D., P. J. Slater, and J. A. Graves. 2007. Extra-pair paternity
and song characteristics in the willow warbler Phylloscopus
trochilus. J. Avian Biol. 38:291–297.Glutz von Blotzheim, U. N., and K. M. Bauer. 1991.
Handbuch der V€ogel Mitteleuropas. Vol. 12, part 2.
Sylviidae. Aula, Wiesbaden.
Gonzalez-Voyer, A., R.-J. den Tex, A. Castell�o, and J. A.
Leonard. 2013. Evolution of acoustic and visual signals in
Asian barbets. J. Evol. Biol. 26:647–659.Greig, E. I., J. J. Price, and S. Pruett-Jones. 2013. Song
evolution in Maluridae: influences of natural and sexual
selection on acoustic structure. Emu 113:270–281.Hall, M. L., S. A. Kingma, and A. Peters. 2013. Male songbird
indicates body size with low-pitched advertising songs. PLoS
ONE 8:e56717.
Harmon, L. J., J. T. Weir, C. D. Brock, R. E. Glor, and W.
Challenger. 2008. GEIGER: investigating evolutionary
radiations. Bioinformatics 24:129–131.Helb, H.-W. 1973. Analyse der artisolierenden Parameter im
Gesang des Fitis (Phylloscopus t. trochilus) mit
Untersuchungen zur Objektivierung der Methode.
J. Ornithol. 114:145–206.Irwin, D. E. 2000. Song variation in an avian ring species.
Evolution 54:998–1010.Irwin, D. E., P. Alstr€om, U. Olsson, and Z. M.
Benowitz-Fredericks. 2001a. Cryptic species in the genus
Phylloscopus (Old World leaf warblers). The Ibis 143:233–247.
Irwin, D. E., S. Bensch, and T. D. Price. 2001b. Speciation in a
ring. Nature 409:333–337.
Ivanitskii, V. V., I. M. Marova, and I. M. Malykh. 2012.
Between order and chaos: Contrasting syntax in the
advertising song of dusky or Warblers (Phylloscopus
fuscatus) and Radde’s (Ph. schwarzi) warblers. J. Ornithol.
153:337–346.Johansson, U. S., P. Alstr€om, U. Olsson, P. G. Ericson, P.
Sundberg, and T. D. Price. 2007. Build-up of the Himalayan
avifauna through immigration: a biogeographical analysis of
the Phylloscopus and Seicercus warblers. Evolution 61:324–333.Kembel, S. W., P. D. Cowan, M. R. Helmus, W. K. Cornwell,
H. Morlon, D. D. Ackerly, et al. 2010. Picante: R tools for
integrating phylogenies and ecology. Bioinformatics
26:1463–1464.Kirschel, Alexander N. G., D. T. Blumstein, R. E. Cohen, W.
Buermann, T. B. Smith, and H. Slabbekoorn. 2009. Birdsong
tuned to the environment: green hylia song varies with
elevation, tree cover, and noise. Behav. Ecol. Sociobiol.
20:1089–1095.Kroodsma, D. E., and E. H. Miller, eds. 1982. Acoustic
communication in birds. Academic Press, New York.
Linhart, P., H. Slabbekoorn, and R. Fuchs. 2012. The
communicative significance of song frequency and
song length in territorial chiffchaffs. Behav. Ecol.
23:1338–1347.Mahler, B., and D. Gil. 2009. The evolution of song in the
Phylloscopus leaf warblers (Aves: Sylviidae): a tale of sexual
selection, habitat adaptation, and morphological constraints.
Adv. Study Behav. 40:35–66.Martens, J. 1980. Laut€außerungen, verwandtschaftliche
Beziehungen und Verbreitungsgeschichte asiatischer
Laubs€anger (Phylloscopus). Paul Parey, Berlin & Hamburg.
796 ª 2015 The Authors. Ecology and Evolution published by John Wiley & Sons Ltd.
Evolution of Leaf Warbler Songs D. T. Tietze et al.

Martens, J. 2010. Systematic notes on Asian birds: 72. A
preliminary review of the leaf warbler genera Phylloscopus
and Seicercus. Br. Ornithol. Club Occ. Publ. 5:41–116.Martens, J. 2013. Vocalizations of leaf-warblers and spectacled
warblers (Phylloscopus and Seicercus). Double audio CD, no.
SX 419 726, syrinx Tonstudio Berlin [http://
www.syrinx-ton.de].
Martens, J., and G. Geduldig. 1988. Acoustic adaptations of
birds living close to Himalayan torrents. pp. 123–131 in van
den Elzen R., ed. Current topics in avian biology.
Proceedings of the international centennial meeting of the
Deutsche Ornithologen-Gesellschaft. Verl. d. Deutschen
Ornithologen-Ges., Bonn.
Martens, J., and S. H€anel. 1981. Gesangsformen und
Verwandtschaft der asiatischen Zilpzalpe Phylloscopus collybita
abietinus und Ph. c. sindianus. J. Ornithol. 122:403–427.Martens, J., and C. Meincke. 1989. Der sibirische Zilpzalp
(Phylloscopus collybita tristis): Gesang und Reaktion einer
mitteleurop€aischen Population im Freilandversuch.
J. Ornithol. 130:455–473.Martens, J., S. Eck, M. P€ackert, and Y.-H. Sun. 1999. The
Golden-spectacled Warbler Seicercus burkii – a species
swarm (Aves: Passeriformes: Sylviidae). Part 1. Zool. Abh.
(Dresd.) 50:281–327.Martens, J., D. T. Tietze, S. Eck, and M. Veith. 2004. Radiation
and species limits in the Asian Pallas’s warbler complex
(Phylloscopus proregulus s.l.). J. Ornithol. 145:206–222.
Martens, J., Y.-H. Sun, and M. P€ackert. 2008. Intraspecific
differentiation of Sino-Himalayan bush-dwelling
Phylloscopus leaf warblers, with description of two new taxa
(P. fuscatus, P. fuligiventer, P. affinis, P. armandii, P.
subaffinis). Vert. Zool. 58:233–265.Martin, J. P., S. M. Doucet, R. C. Knox, and D. J. Mennill.
2011. Body size correlates negatively with the frequency of
distress calls and songs of Neotropical birds. J. Field
Ornithol. 82:259–268.Medina, I., and C. D. Francis. 2012. Environmental variability
and acoustic signals: a multi-level approach in songbirds.
Biol. Lett. 8:928–931.Morton, E. S. 1975. Ecological sources of selection on avian
sounds. Am. Nat. 109:17–34.Nemeth, E., H. Winkler, and T. Dabelsteen. 2001. Differential
degradation of antbird songs in a Neotropical rainforest:
Adaptation to perch height? J. Acoust. Soc. Am. 110:3263–
3274.
Nylander, J. A. A. 2004. MrModeltest v2. Program distributed
by the author. Evolutionary Biology Centre, Uppsala
University, Uppsala.
Olsson, U., P. Alstr€om, P. G. Ericson, and P. Sundberg. 2005.
Non-monophyletic taxa and cryptic species - evidence from
a molecular phylogeny of leaf-warblers (Phylloscopus, Aves).
Mol. Phylogenet. Evol. 36:261–276.
Orme, D., R. Freckleton, G. Thomas, T. Petzoldt, S. Fritz, N.
Isaac, et al. 2012. caper: Comparative Analyses of
Phylogenetics and Evolution in R. R package version 0.5.
http://CRAN.R-project.org/package=caper.
P€ackert, M., J. Martens, J. Kosuch, A. A. Nazarenko, and M.
Veith. 2003. Phylogenetic signal in the song of crests and
kinglets (Aves: Regulus). Evolution 57:616–629.P€ackert, M., J. Martens, Y.-H. Sun, and M. Veith. 2004. The
radiation of the Seicercus burkii complex and its congeners
(Aves: Sylviidae): molecular genetics and bioacoustics. Org.
Divers. Evol. 4:341–364.
P€ackert, M., C. Blume, Y.-H. Sun, L. Wei, and J. Martens.
2009. Acoustic differentiation reflects mitochondrial lineages
in Blyth’s leaf warbler and white-tailed leaf warbler
complexes (Aves: Phylloscopus reguloides, Phylloscopus
davisoni). Biol. J. Linn. Soc. 96:584–600.P€ackert, M., J. Martens, Y.-H. Sun, L. L. Severinghaus, A. A.
Nazarenko, T. Ji, et al. 2012. Horizontal and elevational
phylogeographic patterns of Himalayan and Southeast Asian
forest passerines (Aves: Passeriformes). J. Biogeogr. 39:556–573.
Pagel, M. 1999. Inferring the historical patterns of biological
evolution. Nature 401:877–884.
Paradis, E., J. Claude, and K. Strimmer. 2004. APE: Analyses
of phylogenetics and evolution in R language.
Bioinformatics 20:289–290.Podos, J. 2001. Correlated evolution of morphology and vocal
signal structure in Darwin’s finches. Nature 409:185–188.Podos, J., J. A. Southall, and M. R. Rossi-Santos. 2004. Vocal
mechanics in Darwin’s finches: correlation of beak gape and
song frequency. J. Exp. Biol. 207:607–619.
Pollock, D. D., D. J. Zwickl, J. A. McGuire, and D. M. Hillis.
2002. Increased taxon sampling is advantageous for
phylogenetic inference. Syst. Biol. 51:664–671.Price, T. 2008. Speciation in birds. Roberts and Company,
Greenwood Village, CO, USA.
Price, T. D. 2010. The roles of time and ecology in the
continental radiation of the Old World leaf warblers
(Phylloscopus and Seicercus). Phil. Trans. R. Soc. B
365:1749–1762.Price, J. J., and S. M. Lanyon. 2002. Reconstructing the
evolution of complex bird song in the oropendolas.
Evolution 56:1514–1529.Price, T. D., A. J. Helbig, and A. D. Richman. 1997. Evolution
of breeding distributions in the Old World leaf warblers
(genus Phylloscopus). Evolution 51:552–561.
Price, T. D., D. M. Hooper, C. D. Buchanan, U. S. Johansson,
D. T. Tietze, P. Alstr€om, et al. 2014. Niche filling slows the
diversification of Himalayan songbirds. Nature 509:222–225.R Core Team. 2013. R: a language and environment for
statistical computing. R Foundation for Statistical
Computing, Vienna, Austria. http://www.R-project.org/.
Read, A. F., and D. M. Weary. 1992. The evolution of bird song:
comparative analyses. Phil. Trans. R. Soc. B 338:165–187.
Rheindt, F. E. 2010. New biogeographic records for the
avifauna of Taliabu (Sula Islands, Indonesia), with the
ª 2015 The Authors. Ecology and Evolution published by John Wiley & Sons Ltd. 797
D. T. Tietze et al. Evolution of Leaf Warbler Songs

preliminary documentation of two previously undiscovered
taxa. Bull. Br. Ornithol. Club 130:33–51.
Rheindt, F. E., T. U. Grafe, and E. Abouheif. 2004. Rapidly
evolving traits and the comparative method: how important
is testing for phylogenetic signal? Evol. Ecol. Res. 6:377–396.Ryan, M. J., and E. A. Brenowitz. 1985. The role of body size,
phylogeny, and ambient noise in the evolution of bird song.
Am. Nat. 126:87–100.Schubert, G. 1971. Experimentelle Untersuchungen €uber die
artkennzeichnenden Parameter im Gesang des Zilpzalps,
Phylloscopus c. collybita (Vieillot). Behaviour 38:289–314.
Schubert, M. 1976. Das akustische Repertoire des
Fitislaubs€angers (Phylloscopus t. trochilus) und seine
erblichen und durch Lernen erworbenen Bestandteile. Beitr.
Vogelkd. 22:167–200.
Seddon, N. 2005. Ecological adaptation and species recognition
drives vocal evolution in Neotropical suboscine birds.
Evolution 59:200–215.Seneviratne, S. S., I. L. Jones, and S. M. Carr. 2012. Patterns of
vocal divergence in a group of non-oscine birds (auklets;
Alcidae, Charadriiformes). Evol. Ecol. Res. 14:95–112.
Snell-Rood, E. C., and A. V. Badyaev. 2008. Ecological
gradient of sexual selection: elevation and song elaboration
in finches. Oecologia 157:545–551.Suthers, R. A. 2001. Peripheral vocal mechanisms in birds: Are
songbirds special? J. Morph. 248:289–290.Svensson, L. 1992. Identification guide to European passerines,
4th ed. British Trust of Ornithology, Stockholm.
Svensson, L., K. Mullarney, and D. Zetterstr€om. 2009. Collins
bird guide, 2nd ed. HarperCollins, London.
Swofford, D. L. 2003. PAUP*. Phylogenetic analysis using
parsimony (*and other methods), vers. 4. Sinauer
Associates, Sunderland, MA.
Tamura, K., D. Peterson, N. Peterson, G. Stecher, M. Nei, and
S. Kumar. 2011. MEGA5: Molecular Evolutionary Genetics
Analysis Using Maximum Likelihood, Evolutionary
Distance, and Maximum Parsimony Methods. Mol. Biol.
Evol. 28:2731–2739.Thielcke, G. 1970. Lernen von Gesang als m€oglicher
Schrittmacher der Evolution. Z. Zool. Syst. Evolutionsforsch.
8:309–320.Thielcke, G. 1983. Entstanden Dialekte des Zilpzalps
Phylloscopus collybita durch Lernentzug? J. Ornithol.
124:333–368.
Tietze, D. T., J. Martens, Y.-H. Sun, and M. P€ackert. 2008.
Evolutionary history of treecreeper vocalisations (Aves:
Certhia). Org. Divers. Evol. 8:305–324.Tobias, J. A., J. Aben, R. T. Brumfield, E. P. Derryberry, W.
Halfwerk, H. Slabbekoorn, et al. 2010. Song divergence by
sensory drive in Amazonian birds. Evolution 64:2820–2839.Tubaro, P. L., and B. Mahler. 1998. Acoustic frequencies and
body mass in new world doves. Condor 100:54–61.
Verzijden, M. N., C. ten Cate, M. R. Servedio, G. M. Kozak, J.
W. Boughman, and E. I. Svensson. 2012. The impact of
learning on sexual selection and speciation. Trends Ecol.
Evol. 27:511–519.Vietinghoff-Scheel, E. V. 1980. Phylloscopus ijimae (Stejneger).
Atlas Verbr. palaearkt. V€ogel 8:1–3.Wallschl€ager, D. 1980. Correlation of song frequency and body
weight in passerine birds. Experientia 36:412.
Wiley, R. H. 1991. Associations of song properties with
habitats for territorial oscine birds of eastern North
America. Am. Nat. 138:973–993.
Wilkins, M. R., N. Seddon, and R. J. Safran. 2013.
Evolutionary divergence in acoustic signals: causes and
consequences. Trends Ecol. Evol. 28:156–166.
Supporting Information
Additional Supporting Information may be found in the
online version of this article:
Data S1. Additional tables:
Tables S1–3. Principal component loadings for the prin-
cipal component analyses for various, only structural and
only frequency parameters, respectively (see Table 1).
Tables S4. Taxa treated in this study in alphabetical order
with GenBank accession numbers.
Tables S5. Model settings as estimated with MrModeltest
for the different gene regions analyzed.
Tables S6 Mean values of sonographic measurements and
explanatory variables per taxon. For definitions and units
of the latter, see Table 1.
Data S2–S3. R output from the linear models and pGLSs,
respectively.
Figure S1. Measurements taken from a sonogram. Note
that fmax1 and fmaxend combine to describe fmodend
(frequency gradient; cf. Table 1).
798 ª 2015 The Authors. Ecology and Evolution published by John Wiley & Sons Ltd.
Evolution of Leaf Warbler Songs D. T. Tietze et al.


