Embed Size (px)
Citation preview

E-Mail [email protected]
Original Paper
Brain Behav Evol 2014;84:19–30 DOI: 10.1159/000362431
Evolution of the Central Sulcus Morphology in Primates
William D. Hopkins a, b Adrien Meguerditchian j Olivier Coulon k
Stephanie Bogart a, b Jean-François Mangin l Chet C. Sherwood c
Mark W. Grabowski c Allyson J. Bennett d Peter J. Pierre e Scott Fears f, g
Roger Woods f, g Patrick R. Hof h, i Jacques Vauclair m
a Neuroscience Institute, Georgia State University, and b Division of Developmental and Cognitive Neuroscience, Yerkes National Primate Research Center, Atlanta, Ga. , c Department of Anthropology and Center for the Advanced Study of Hominid Paleobiology, The George Washington University, Washington, D.C. , d Harlow Center for Biological Psychology, Psychology Department, University of Wisconsin, and e Department of Behavioral Management, Wisconsin National Primate Research Center, Madison, Wis. , f Center for Neurobehavioral Genetics and g Department of Neurology, University of California Los Angeles (UCLA), Los Angeles, Calif. , h Fishberg Department of Neuroscience and Friedman Brain Institute, Mount Sinai School of Medicine, and i New York Consortium in Evolutionary Primatology, New York, N.Y. , USA; j Laboratoire de Psychologie Cognitive, CNRS, UMR7290 and k Laboratoire des Sciences de l’Information et des Systèmes, Aix-Marseille University, Marseille , l LNAO, Neurospin, I2BM, CEA, Gif-sur-Yvette , and m Department of Psychology, Research Center in Psychology of Cognition, Language and Emotion, Aix-Marseille University, Aix-en-Provence , France
the CS along the dorsal-ventral plane. We further found that great apes have relatively large CS surface areas compared to Old World monkeys. However, relative to great apes, hu-mans have a small motor-hand area in terms of both adjust-ed and absolute surface areas. © 2014 S. Karger AG, Basel
Introduction
During primate evolution, the cerebral cortex has be-come increasingly gyrified concomitant with enlarge-ment in size. Humans show the greatest degree of cortical folding, followed by apes, then the more distantly related monkeys and strepsirrhines [Zilles et al., 1989; Rilling and Insel, 1999b; Rogers et al., 2010]. The central sulcus (CS) is a prominent cortical fold, one of the first to form in embryogenesis, which divides the pre- and postcentral
Key Words
Central sulcus · Motor-hand area · Hand functions · Gyrification · Cortical folding
Abstract
The central sulcus (CS) divides the pre- and postcentral gyri along the dorsal-ventral plane of which all motor and sen-sory functions are topographically organized. The motor-hand area of the precentral gyrus or KNOB has been de-scribed as the anatomical substrate of the hand in humans. Given the importance of the hand in primate evolution, here we examine the evolution of the motor-hand area by com-paring the relative size and pattern of cortical folding of the CS surface area from magnetic resonance images in 131 pri-mates, including Old World monkeys, apes and humans. We found that humans and great apes have a well-formed mo-tor-hand area that can be seen in the variation in depth of
Received: May 27, 2013 Returned for revision: June 22, 2013 Accepted after revision: March 20, 2014 Published online: August 13, 2014
William D. Hopkins, PhD Neuroscience Institute and Language Research Center Georgia State University PO Box 5030, Atlanta, GA 30302 (USA) E-Mail whopkin @ emory.edu
© 2014 S. Karger AG, Basel0006–8977/14/0841–0019$39.50/0
www.karger.com/bbe
Dow
nloa
ded
by:
Em
ory
Uni
vers
ity17
0.14
0.10
4.1
- 8/
17/2
014
7:35
:06
PM

Hopkins et al.
Brain Behav Evol 2014;84:19–30DOI: 10.1159/000362431
20
gyri. Motor and sensory systems are represented along the dorsal-ventral axis of these two gyri, which are some-times referred to as the ‘motor and sensory homunculi’. In Old Word monkeys and apes, the primary motor cor-tex (Brodmann area 4) is located along the anterior bank of the CS and extends onto the free surface of the precen-tral gyrus, whereas in humans the primary motor cortex is mostly restricted to the buried surface of the CS [Sher-wood et al., 2004]. In human and nonhuman primates, stimulation of the motor cortex in the mid portion of the precentral gyrus results in movement of the individual digits of the hand, whereas stimulation in more ventral regions results in movements of facial musculature, in-cluding the lips, eyes, vocal folds and tongue [Penfield and Boldrey, 1936; Bailey et al., 1950; Petrides et al., 2005].
Humans are distinct from other primates with respect to manual motor skills and control. Specifically, the hu-man hand is distinguished from that of apes by shorter fingers relative to the thumb, increased robusticity of the thumb, and a wider range of movement at the wrist [Tocheri et al., 2008]. These modifications have resulted in increased opposability of the thumb and individual control of digits [Marzke, 1996; Connolly, 1998]. It has been hypothesized that with the advent of bipedalism in early humans, the hands were subsequently freed from participating in locomotor function and became increas-ingly involved in complex manipulative actions, such as prehensile grasping, tool use, tool making and gestural communication [Bradshaw, 1997; Marzke, 1997; Corbal-lis, 2002; Young, 2003].
Because of the importance of increasing motor control of the hand found in primate evolution [Castiello, 2005], we sought to examine the evolution of the surface area and folding of the CS in primates. Comparative examina-tion of the dorsal-ventral variation in the surface area and depth of the CS in different primate species was of spe-cific interest. Recent studies in humans and chimpanzees have identified an anatomical landmark in the middle portion of the CS, referred to as the motor-hand area, or KNOB [Yousry et al., 1997; Hopkins and Pilcher, 2001]. The KNOB has been described as an epsilon- or omega-shaped formation, although there is some variation in its appearance [Caulo et al., 2007]. It has been suggested that the formation of the KNOB is attributable to the presence of a buried gyrus that connects the pre- and postcen-tral gyri, referred to as the ‘pli de passage fronto-parietal moyen’ (PPFM), originally described by Broca [Boling et al., 1999; Alkadhi and Kollias, 2004]. In the presence of the PPFM, the central portion of the CS has to fold over this gyrus, which results in the formation of the KNOB.
In humans, functional imaging studies have shown that individual movement of the digits and wrist are spatially represented along the contour of the KNOB, suggesting that this region represents the cortical substrate of the hand [Sastre-Janer et al., 1998; Boroojerdi et al., 1999; Piz-zella et al., 1999]. Indeed, though rare, occasionally the PPFM can project to the surface of the cortex, resulting in a bifurcation of the CS [Boling et al., 1999; Alkadhi and Kollias, 2004]. Interestingly, where the split in the CS oc-curs divides the motor representation of the wrist from the individual digits, further implicating this region as the cortical region controlling digit use. In chimpanzees, a positron emission tomography study showed activation in the KNOB region in the hemisphere contralateral to the hand used during a reach-and-grasp task [Hopkins et al., 2010b], suggesting that the KNOB may similarly rep-resent the cortical substrate of the hand in this species. Finally, in both humans and chimpanzees, anatomical asymmetries in the KNOB have been linked to individual differences in hand preference and skill at the level of gross morphology [Amunts et al., 1996; Foundas et al., 1998; Hopkins and Cantalupo, 2004; Li et al., 2009; Klop-pel et al., 2010] and histology [Sherwood et al., 2007, 2010]. These findings reinforce the view that the motor hand area of the precentral gyrus may represent the neu-ral substrate of the hand and possibly handedness.
In the current study, we sought to examine the evolu-tion of CS size and morphology, particularly for the KNOB, across primates in relation to the size of the cere-bral cortical surface. The motor skills of apes have been demonstrated to exceed those of other primates [Christel, 1994; Pouydebat et al., 2009]; thus, we hypothesized that the morphology and folding pattern of humans and apes would differ from those of more distantly related Old World monkeys. Given the elaboration of manual motor skill in humans, we also aimed to determine whether the human CS shows modification of its morphology or sur-face area as compared to apes. To test these hypotheses, magnetic resonance images (MRI) of the brain were ob-tained from primates representing 10 species covering 30 million years of evolutionary history (since the diver-gence of the last common ancestor of Old World mon-keys and humans). From the MRI scans, we initially quantified the surface area and depth of the CS using BrainVisa software (see below). BrainVisa analyzes corti-cal folding patterns of the brain and uses sulcus-based morphometry [Mangin et al., 2004], which differs from manual tracing approaches because it quantifies both the surface area and depth of the sulci rather than solely the linear length of the outer contour of the sulcus. The use
Dow
nloa
ded
by:
Em
ory
Uni
vers
ity17
0.14
0.10
4.1
- 8/
17/2
014
7:35
:06
PM

Evolution of the CS Morphology in Primates
Brain Behav Evol 2014;84:19–30DOI: 10.1159/000362431
21
of the BrainVisa’s morphometry tools for quantifying brain specialization is particularly interesting in compar-ison to manual tracing approaches. Indeed, BrainVisa’s tools involve automatic processes for analyzing the brain images, which avoids variation of human judgments re-lated with manual tracing and minimizes the potential observer bias.
Methods
Subjects MRI were obtained from a total of 131 primates, including hu-
mans ( Homo sapiens , n = 11, all males), chimpanzees ( Pan troglo-dytes , n = 19, 10 males and 9 females), bonobos ( Pan paniscus , n = 12, 7 males and 5 females), gorillas ( Gorilla gorilla, n = 18, 13 males and 5 females), orangutans ( Pongo pygmaeus, n = 15, 9 males and 6 females), gibbons ( Hylobates lar , n = 4, 2 males and 2 females), baboons ( Papio anubis , n = 4, 2 males and 2 females), vervet mon-keys ( Chlorocebus aethiops sabaeus , n = 12, all females), rhesus monkeys ( Macaca mulatta , n = 21, 16 males and 5 females) and bonnet monkeys ( Macaca radiata , n = 16, 8 males and 8 females). For the humans, gibbons, vervet, rhesus and bonnet monkeys, all the MRI scans were obtained in vivo (IV), while a combination of IV and postmortem (PM) scans made up the baboon (2 PM, 2 IV), orangutan (4 IV, 11 PM), gorilla (2 IV, 16 PM), chimpanzee (9 IV, 10 PM) and bonobo (4 IV, 8 PM) samples. All PM brains were col-lected following the naturally occurring death of the subjects. Thus, no subjects were sacrificed for the purposes of this study. In humans, the absence of anatomical MRI scans in females prevents us from evaluating the potential gender effect on the variation of the CS within a comparative framework with the other primate species. The vervet monkeys were members of the Vervet Research Colony at UCLA [Fears et al., 2009]. The bonnet and rhesus mon-keys were housed at Wake Forest University Primate Center. For all species, the scanning procedures were performed under the guidelines of state and federal laws, the US Department of Health and Human Services and institutional animal care and use com-mittees.
Image Collection and Procedure This study was opportunistic in terms of availability of IV and
PM MRI scans. Thus, as noted above, the magnets and scanning protocols were not identical in all species. Furthermore, in the case of humans, our sample was restricted to males. This presents some limitations for certain comparative analyses because variation in magnet strength and/or scanning protocol can influence the signal strength and sensitivity in contrast between gray matter, white matter and cerebrospinal fluid (CSF). Moreover, shrinkage in tis-sue due to fixatives can result in some distortion in the size of various structures. However, in all of the comparative analyses of CS surface area and depth, the individual values were adjusted for whole brain measures taken from the same scan either by calculat-ing a ratio measure or by regression. Thus, inherent differences in gray matter, white matter and CSF due to the scanning protocols or magnet strength were standardized within individuals when quantifying the surface area and depth of the CS (also see Discus-sion).
For IV MRI scans in all species except humans, subjects were first immobilized by ketamine injection as appropriate for the spe-cies and subsequently anesthetized with propofol (chimpanzees), midazolam and ketamine (vervets) or isofluorane (rhesus and bonnet macaques). The subjects remained anesthetized for the du-ration of the scans as well as the time needed to transport them between their home cage and the imaging facility (total time ap-prox. 2 h, MRI acquisition time ranging from 36 to 60 min). All scans were examined at the time of acquisition and any image with artifact was excluded in the subsequent image processing. After completing MRI procedures, the subjects were temporarily housed in a single cage for 6–12 h to allow the effects of the anesthesia to wear off, after which they were returned to their home cage. The archived MRI data were transferred to a PC running BrainVisa software for postimage processing. To provide an unbiased collec-tion of human subjects, a heterogeneous sample set (n = 11) was randomly assembled from the BrainVisa database. All MRI were previously processed through the software before including them in our analyses. As such, the scans originated from many different scanners and protocols over the span of 20 years, using an approx-imate gradient echo protocol (inversion time = 500 ms, pulse rep-etition = 10 ms, echo time = 2 ms, and a 256 × 256 matrix). For the PM scanning, either 4.7 or 7 T magnets were used and T2-weight-ed images were collected in the transverse plane using a gradient echo protocol (pulse repetition = 22.0 s, echo time = 78.0 ms, num-ber of signals averaged = 8–12, and a 256 × 192 matrix reconstruct-ed to 256 × 256).
Image Processing The sequence of processing steps performed on the images is
shown in figure 1 a–h. The pipeline of processing used to extract CS from the raw T1-weighted image derives from a pipeline ini-tially dedicated to the human brain and freely distributed as a BrainVISA toolbox (http://brainvisa.info) [Mangin et al., 2004]. The human-dedicated pipeline has been used previously for at least 5,000 different subjects. Some tuning of this pipeline was re-quired to account for specificities of the nonhuman primate anat-omy as well as the different protocols used to acquire the images in the IV and PM brains. Notably, for the PM MRI scans, we had to invert the intensities corresponding to gray and white matter in order for BrainVISA to run properly. The pipeline processing steps proceeded in the following manner. First, correction of the spatial inhomogeneities of the signal, which prevent direct association be-tween the signal intensity and the nature of the tissue, were per-formed. The estimation of the spatially smooth bias field used to restore the signal intensity was performed via minimization of the signal entropy [Mangin, 2000]. After correction, each tissue inten-sity distribution was stable across the brain ( fig. 1 b). Second, auto-matic analysis of the signal histogram and mathematical morphol-ogy was then used to compute a binary mask of the brain ( fig. 1 c). This approach is built on the fact that the brain is surrounded by dark areas corresponding to skull and CSF. Therefore, once the range of intensities corresponding to brain tissue had been defined by histogram analysis, brain segmentation mainly amounts to splitting the connections with external structures such as the optic nerves. For the chimpanzee anatomy, some specific tuning had to be applied relative to the human-dedicated processing performed by BrainVISA [Mangin et al., 1998]. Indeed, for some chimpanzees the largest object in the image after splitting connections turns out to be the muscles. Hence, in order to reliably select the brain, we
Dow
nloa
ded
by:
Em
ory
Uni
vers
ity17
0.14
0.10
4.1
- 8/
17/2
014
7:35
:06
PM

Hopkins et al.
Brain Behav Evol 2014;84:19–30DOI: 10.1159/000362431
22
had to introduce an additional constraint relative to the localiza-tion of the brain in the middle of the head. Once the brain mask had been defined, the mask was split into three parts correspond-ing to hemispheres and cerebellum ( fig. 1 d) [Mangin et al., 1996].
After a mask has been defined for each hemisphere, a negative mold of the white matter was computed [Mangin et al., 1996]. The outside boundary of this mold results from a 5-mm ‘closing’ of the masked hemisphere. Here, ‘closing’ is an operation of mathemati-cal morphology used to analyze shapes: the mask of the hemi-sphere is first ‘dilated’ then ‘eroded’, which results in deleting the folds that are less than 5 mm wide. The inside boundary is the gray/white interface computed with topology-preserving deformations assuring the spherical topology of the mold ( fig. 1 e). Imposing the actual topology of the cortex to the mold prevents the detection of spurious folds resulting from noisy data [Mangin et al., 1995]. The mold is finally skeletonized in order to detect the cortical fold as crest surfaces of the 3D MR image located inside the mold [Mangin et al., 2004]. Skeletonization is another standard technique in mathematical morphology. An object is eroded until its thickness is lost; for example, a door would become a flat 2D surface or a ball with a cavity would become a sphere. The crest surfaces stem from a morphological watershed process iteratively eroding the 3D mold from the lightest intensities to the darkest intensities. Topo-logical constraints guarantee that the resulting surfaces have no holes. The end result is a set of topologically elementary surfaces located along the darkest part of the fold corresponding to CSF ( fig. 1 f, g). These elementary surfaces are split further when a de-formation of the deepest part of the fold indicates the presence of a buried gyrus. The clues allowing the detection of buried gyri are embedded in the curvature of the gray/white interface [Mangin et al., 2004]. Indeed, a buried gyrus leads to a horse saddle shape in the depth of the gray/white interface, which results in a negative
Gaussian curvature providing these clues. Finally, the cortical folds comprising the sulci are presented in the 3D visualization graph ( fig. 1 h) and the folds making up the CS were selected manually by the user. The authors simply chose the CS among other folds. Note that while this selection can be ambiguous in the human brain, because of the variability of fold interruptions, no error can occur with other primates. The extracted CS from representative species in this study is shown in figure 2 .
Cortical Measures For the CS, two primary measures were obtained, including the
surface area and the depth of the CS along the entire dorsal-ventral plane ( fig. 3 , 4 a). Surface area (mm 2 ) was measured independently by the software and reflected the area of the CS as a function of the depth and length of the sulcus. Using BrainVisa, we also computed the total folded cortical sulci surface area (mm 2 ) for each hemi-sphere and subject, which includes only the surface area within cerebral sulci, excluding the gyral cortex. The total cortical folded surface area excluded the cerebellum and brain stem regions. This measure allowed us to compare the CS surface area in each species after adjusting for total folded cortical surface area. To compute the relative surface area of the CS, we divided the surface area of the CS by the total folded cortical surface area and multiplied by 100 (Percent_CS). This measure indicated the percentage of the total surface area of the brain that was comprised of the CS.
Because interspecific data should not be considered indepen-dent – i.e. relationships between species lead to relationships be-tween data points [Felsenstein, 1985] – two approaches were used to incorporate phylogenetic information in the analysis. First, we calculated phylogenetic ANOVAs [Garland et al., 1993] using the phytools R package [Revell, 2011], with monkeys as one group and apes as the other, to test if there was an effect of a grade-shift
a
b
c
d
e
fg
Fig. 1. BrainVisa’s pipeline processing steps. a MRI of a skull-stripped chimpan-zee brain. b Stable tissue intensities after bias field correction. c Binary mask of the brain. d Split mask of left and right hemi-spheres and cerebellum. e Gray and white interface. f Negative mold of the white mat-ter. g Skeletonized mold of cortical folding. h Cortical fold graph of chimpanzee sulci with the CS in red.
Dow
nloa
ded
by:
Em
ory
Uni
vers
ity17
0.14
0.10
4.1
- 8/
17/2
014
7:35
:06
PM
Evolution of the CS Morphology in Primates
Brain Behav Evol 2014;84:19–30DOI: 10.1159/000362431
23
on Percent_CS when phylogeny was taken into account. In addi-tion, to explore allometric scaling, we calculated both ordinary least squares regression coefficients and phylogenetic generalized least squares (PGLS) [Grafen, 1989; Martins and Hansen, 1997] to test for the relationship between CS surface area and total fold-ed cortical surface area (with CS surface area subtracted), assum-ing a Brownian motion model of trait evolution. The natural log of all data was used in the regression analyses. We used the PGLS function in the Caper package [Orme, 2012]. All phylogenetic analyses were conducted using R 3.0.2 [R Development Core Team, 2011].
CS Parameterization and Fold Depth For each subject, the CS was standardized into 100 equally
spaced sections along the dorsal-ventral axis and the depth of the sulcus at each point was quantified. The procedure can be briefly summarized as follows. A coordinate system is computed on the sulcus that indicates the position of each point relative to its depth (x-coordinate) and its position along the sulcus between the dorsal and ventral extremities (y-coordinate), as illustrated in figure 4 b, c. At each position, y = 0 through 100, along the sulcus length, the depth is defined as the length of the corresponding y-iso-coordi-
nate line (see fig. 4 d). Various publications provide more technical details about this procedure [Coulon et al., 2006; Cykowski et al., 2008; Davatzikos and Bryan, 2002; Hopkins et al., 2010a].
Data Analysis and Quantification of the Pli-de-Passage To explore the variation in the central CS region further, we
quantified the CS depth corresponding to the PPFM using previ-ously described methods [Coulon et al., 2006; Cykowski et al., 2008; Hopkins et al., 2010a]. Because the PPFM was only identifi-able in the great apes and humans (see below), these analyses were restricted to those species. Briefly, we recorded the largest depth measure that was superior (SP) and inferior (IP) to the central lo-cation of the CS (location 50; fig. 4 d). We then recorded the shal-lowest CS depth (PPFM) between the SP and IP locations ( fig. 4 d). The maximum depth of the PPFM was then computed following the formula: PPFM_max = ([depth(IP) + depth(SP)]/2.0) – depth(PPFM). This measure reflected the magnitude of cortical folding of the central CS region relative to the SP and IP points in each subject and species, and was used to quantify the region that included the motor hand area. For all analyses, α was set to 0.05 and, when necessary, post hoc tests were conducted using Tukey’s honestly significant difference tests.
(Time)
5–8 my
20–29 my
30–40 my
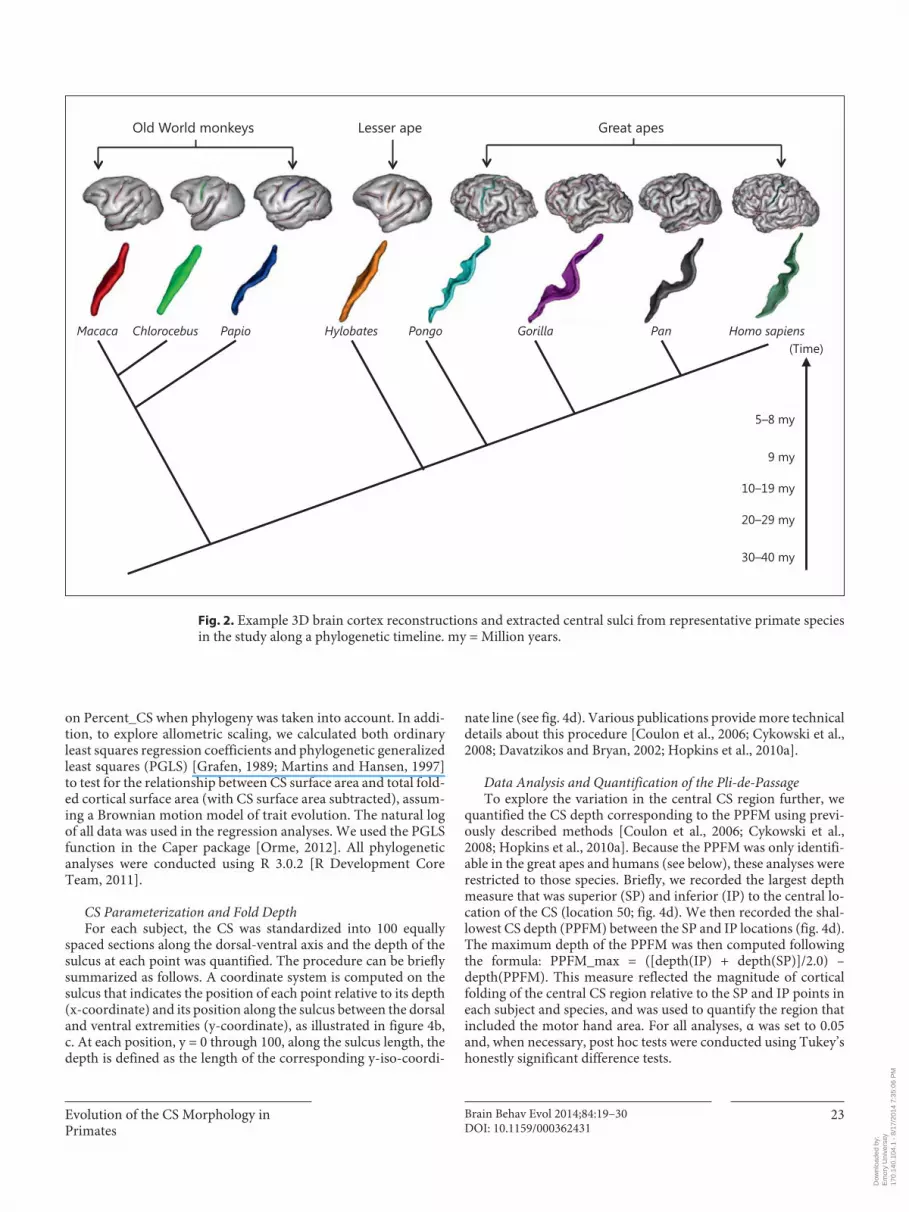
Old World monkeys Great apes Lesser ape
Macaca Chlorocebus Papio Pongo Gorilla Pan Homo sapiens Hylobates
10–19 my
9 my
Fig. 2. Example 3D brain cortex reconstructions and extracted central sulci from representative primate species in the study along a phylogenetic timeline. my = Million years.
Dow
nloa
ded
by:
Em
ory
Uni
vers
ity17
0.14
0.10
4.1
- 8/
17/2
014
7:35
:06
PM

Hopkins et al.
Brain Behav Evol 2014;84:19–30DOI: 10.1159/000362431
24
Results
CS Surface Area In the initial analysis, we compared the Percent_CS
measure between species. A one-way analysis of variance revealed a significant main effect for species ( F (9, 121) = 20.37, p < 0.001). The mean Percent_CS score for each
species is shown in figure 5 . Post hoc analysis indicated that gorillas and orangutan had significantly higher val-ues than all other species, though they did not differ from each other. Furthermore, humans, chimpanzees and bonobos had significantly higher values than all Old World monkeys and lesser ape species, but did not differ from each other. Finally, gibbons and baboons had sig-
Superior precentral cs
x
y
Fronto-orbital
Precentral inferior
Sulcus depth
Sulc
us le
ngth
Inferior frontal
Fig. 3. Labeled and extracted chimpanzee CS. The surface area and depth dimensions are shown in the extracted sulcus, as well as the x- and y-coordinates used for comput-ing differences in cortical folding of the CS along the dorsal-ventral axis.
x = 0
y = 0
y
x
y
SP IP
depth PPFM
y = 100x = 100a b
cd
Fig. 4. a Chimpanzee CS. b , c The surface area and depth dimen-sions are shown in the extracted sulcus, as well as the x-and y-co-ordinates used for computing differences in cortical folding of the CS along the dorsal-ventral axis. d Data generated from CS param-eterization. Depth of CS is plotted on the ordinate and the y-coor-
dinate along the abscissa. SP is the superior maximum CS depth before y-coordinate 50, IP is the maximum inferior depth after y-coordinate 50, and PPFM is the shallowest CS depth measure be-tween the SP and IP y-coordinates.
Dow
nloa
ded
by:
Em
ory
Uni
vers
ity17
0.14
0.10
4.1
- 8/
17/2
014
7:35
:06
PM

Evolution of the CS Morphology in Primates
Brain Behav Evol 2014;84:19–30DOI: 10.1159/000362431
25
nificantly higher values than vervet, rhesus and bonnet monkeys.
We also analyzed species mean Percent_CS using phy-logenetic ANOVA, comparing monkeys with apes. When humans are included in the ape group, the difference is not significant (F = 6.82, p = 0.30); however, when hu-mans are removed from the ape group, the difference is significant (F = 16.46, p < 0.02). These results indicate that apes, which have a larger brain size, also tend to have a larger proportion of CS surface area relative to the rest of the folded cerebral cortex, although humans depart from this trend in having a relatively smaller CS surface area as compared to great apes.
We examined the scaling of CS surface area against the rest of the folded cortical surface area using species mean data. When humans are not included, both ordinary least squares and PGLS regressions demonstrate a positive al-lometric relationship (ordinary least squares: slope = 1.29, 95% CI 1.12–1.46, r 2 = 0.98, p < 0.001; PGLS: slope = 1.20, 95% CI 1.00–1.39, r 2 = 0.96, p < 0.001). Human values for CS surface area fall below the predictions based on the nonhuman primate scaling relationship ( fig. 6 ). Conse-quently, when humans are included in the analysis, the scaling exponent is reduced and includes isometry within the 95% CIs (ordinary least squares: slope = 1.12, 95% CI 0.93–1.31, r 2 = 0.95, p < 0.001; PGLS: slope = 0.95, 95% CI 0.73–1.17, r 2 = 0.92, p < 0.001).
Overall Cortical Folding of the CS In the next analysis, we examined species differences
in folding of the CS along the dorsal-ventral axis using the parameterization methods of BrainVisa described above. As can be seen in figure 7 , in humans and great apes, the depth of the middle portion of the CS is small relative to the adjacent dorsal and ventral regions. This pattern of distinct dorsal-ventral variation in CS depth, however, is absent in gibbons and the Old World monkey species and is likely attributable to the increased size of the PPFM in great apes and humans compared to other primates.
Variability in the PPFM between Great Apes and Humans For the PPFM_max measure, significant species
differences were found between apes and humans ( F (4, 69) = 4.87, p < 0.008). The mean PPFM_max values for each species are shown in figure 8 and these findings reflect the dorsal-ventral CS patterns illustrated in fig-ure 7 . The mean PPFM_max was significantly smaller in humans and orangutans compared to bonobos, but not chimpanzees and gorillas. Thus, despite having a
0
Species
Mea
n CS
sur
face
/tot
al fo
lded
su
rfac
e ar
ea (±
SE)
1
2
3
4
5
6
7
Verve
t
Bonn
et
Rhesu
s
Baboon
Gibbon
Oranguta
nGorill
a
Chimpa
nzee
Bono
bo
Human
Fig. 5. Mean CS surface area (± SE) as a percentage of total brain surface in 10 primate species.
Chlorocebus pygerythrusGorilla gorilla gorillaHomo sapiensMacaca mulattaMacaca radiataNamascus leucogenysPan paniscusPan troglodytes verusPapio anubisPongo pygmaeus
5
ln(C
S su
rfac
e ar
ea)
8.0 8.5 9.0 9.5ln(total cortical folded surface area)
10.0 10.5 11.0
6
7
8
Fig. 6. Plot of CS surface area regressed against total cortical folded surface area in primates. All individual data from each species are plotted. The PGLS regression line shown was calculated based on species mean data from the total primate sample, excluding hu-mans.
Dow
nloa
ded
by:
Em
ory
Uni
vers
ity17
0.14
0.10
4.1
- 8/
17/2
014
7:35
:06
PM

Hopkins et al.
Brain Behav Evol 2014;84:19–30DOI: 10.1159/000362431
26
brain that is three times larger than the great apes in ab-solute size, the PPFM_max depth is small in humans compared to most other great apes, with the exception of orangutans.
Discussion
Three main findings emerged from this study. First, after the split between Old World monkeys and lesser apes, CS surface area increased in size relative to cortical surface area up to the point of the split between the genus Pan and Homo . At that point in primate evolution, the total CS surface area and corresponding motor-hand re-gion, like primary sensory cortices [de Sousa et al., 2010], did not keep pace with the expansion of other cortical as-sociation regions [Sherwood et al., 2012], resulting in hu-mans having a relatively small CS surface area after ad-justing for total folded cortical surface area.
Second, great apes and humans show a distinct dorsal-ventral pattern in CS folding compared to lesser apes and Old World monkeys. Specifically, in great apes and hu-mans, the central portion of the CS is marked by a shallow folding while being preceded and followed by deep fold-ing (see fig. 7 ). This pattern of distinct dorsal-ventral vari-ation in CS depth is likely attributable to the increased size of the PPFM in great apes and humans compared to other primates. Because the CS has to fold over the PPFM, it might further explain the anatomical presence of the KNOB or motor-hand area in great apes and humans, as has been previously described in these species [Yousry et al., 1997; Hopkins and Pilcher, 2001].
Dorsal-ventral position0 20 40 60 80 100
Mea
n CS
dep
th (m
m)
0
5
10
15
20
25
Vervet Bonnet Rhesus Baboon Gibbon Orangutan Gorilla Chimpanzee Bonobo Human
SP PPFM IP
Fig. 7. Mean CS depth along the dorsal to ventral plane in the 10 primate species. SP is the deepest superior point and IP is the deepest inferior point, and PPFM is the shallowest point between the two.
0
Mea
n PP
FM_m
ax (±
SE)
2
4
6
Species
8
Oranguta
nGorill
a
Chimpa
nzee
Bono
bo
Human
Fig. 8. Mean PPFM_max (± SE) in humans and great apes.
Dow
nloa
ded
by:
Em
ory
Uni
vers
ity17
0.14
0.10
4.1
- 8/
17/2
014
7:35
:06
PM
Evolution of the CS Morphology in Primates
Brain Behav Evol 2014;84:19–30DOI: 10.1159/000362431
27
Third, the mean PPFM_max depth was significantly smaller in humans and orangutans compared to gorillas, chimpanzees and bonobos. Paradoxically, the lower PPFM_max values may reflect increased size of the PPFM in humans and orangutans compared to the other African great apes. Assuming that the CS has to fold over the PPFM, the shallower central depths may reflect that pres-ence of a larger buried PPFM gyrus, which subsequently inhibits the CS from folding inward in that portion of the precentral gyrus. In short, because the PPFM is larger and projects closer to the cortical surface, the sulcus is inhib-ited from forming a deeper fold.
With respect to the overall CS surface area, there do not appear to be any distinct changes in the size and folding as a consequence of the evolution of increased specializations in the functional use of the hands for tool manufacture in hominins [Tocheri et al., 2008]. Thus, it does not appear that humans have a relatively large or more gyrified CS compared to other primates. We suggest that, instead of increased expansion of the CS, what likely happened after the split between the common ancestor of humans, chimpanzees and bono-bos was increasing expansion in other cortical regions, particularly within association regions, including the premotor and prefrontal cortex. This expansion would result in the increased connectivity and gyrification found in the frontal lobe regions in humans compared with nonhuman primates. Several bodies of research support this interpretation. First, Rilling and Insel [1999b] and others [Armstrong et al., 1993] have re-ported that humans are significantly more gyrified in the prefrontal cortex, after adjusting for overall brain size, than other primates. Second, a number of authors have reported that humans have a disproportionally higher amount of white compared to gray matter in the premotor and prefrontal cortex when compared to oth-er primate species [Rilling and Insel, 1999a, b; Schoen-emann et al., 2005; Smaers et al., 2011]. Presumably the increasing white matter reflects increased connectivity between the prefrontal and premotor cortex with other cortical regions in the brain. Third, cytoarchitectonic analyses of several cortical regions in humans and great apes have revealed significant changes in important premotor and prefrontal cortical regions. For example, Schenker et al. [2010] found that Brodmann area 44 and 45, constituent parts of the Broca area, were nearly 7 times larger in humans compared to chimpanzees. Sim-ilarly, Semendeferi et al. [2001] found that area 10, a portion of the prefrontal cortex thought to be involved in long-term motor planning, was 6.6 times larger in
humans compared to other apes. In contrast, area 13 within the prefrontal cortex, which is part of the limbic system, was only 1.5 times larger in humans compared to great apes [Semendeferi et al., 1998].
The relatively small CS surface area in humans as compared to great apes is consistent with some reports that humans have a relatively small precentral gyrus as well as Brodmann area 4. For example, based on previ-ously published data, Schoenemann [2006] reported that human primary motor cortex was only 33% as large as would be predicted for a primate of our brain size, indicating that it is relatively small as compared to oth-er neocortical regions. Similarly, Semendeferi et al. [2002] reported that the human precentral gyrus vol-ume, as a percentage of total brain, was within the same range as those reported in great apes, but that the orang-utans looked more similar to humans than chimpan-zees, bonobos and gorillas.
As noted above, within the CS, there are species dif-ferences in the dorsal-ventral folding patterns with the human and ape clade showing the presence of a shallow central region, presumably due to the fact that the CS must fold over the buried PPFM gyrus that connects the pre- and postcentral gyri. When considering the magni-tude of folding of the central CS region, as reflected by the PPFM_max value, we also found that humans and orangutans had significantly smaller PPFM_max values than gorillas, chimpanzees and bonobos. Assuming that the variation in central CS depths (i.e. the SP, PPFM and IP measures) reflects the need for CS to fold over the bur-ied PPFM gyrus, one interpretation of these results is that the smaller PPFM_max values reflect a larger PPFM bur-ied gyrus. In other words, smaller PPFM_max values re-flect a larger PPFM gyrus. If this is the case, humans and orangutans have large (in absolute terms) PPFM gyri, which would suggest that they have greater connectivity and presumably sensory-motor integration between the pre- and postcentral gyri. In the case of humans, this might reflect an adaptation for bipedalism and increased use of the hands for tool-use and other manual functions, which would be consistent with our hypothesis. Of course, the remaining challenge is the interpretation of the orangutan results in the context of the findings in humans, gorillas, chimpanzees and bonobos, since they are the least terrestrial living species of the great apes. We would suggest that one possible explanation for the more human-like PPFM in orangutans is their arboreal habitat and the need for power grasping with both the hands and feet for locomotion. In this scenario, the central CS re-gion between the SP and IP of the orangutan brain may
Dow
nloa
ded
by:
Em
ory
Uni
vers
ity17
0.14
0.10
4.1
- 8/
17/2
014
7:35
:06
PM

Hopkins et al.
Brain Behav Evol 2014;84:19–30DOI: 10.1159/000362431
28
control not just motor functions of the hands, but also the feet, and this requires greater integration of the sen-sory and motor regions leading to increased size of the PPFM gyrus. In the case of humans, they may also have a similarly large PPFM gyrus, but it may solely reflect sensory-motor integration of the motor functions of the hands and individual digits. This hypothesis is specula-tive but, in principle, could be tested using modern func-tional imaging technologies that focus on identifying the cortical representation of hand and feet movements in different primate species [Ehrsson et al., 2000; Hopkins et al., 2010b].
There are at least two limitations to this study. First, we used both PM- and IV-imaged brains and this vari-able was not balanced within or between species. How-ever, we do not believe this influenced the results in any substantive way. Indeed, because we used adjusted CS measures based on individual data obtained from the same brains, this presumably did not unfairly bias the data in any significant way. However, we also performed a follow-up analysis comparing the raw and adjusted CS measures from the chimpanzee sample, which was com-prised of 10 PM and 9 IV scans. The descriptive data are shown in table 1 . For the raw CS surface area, CS mean depth and total fold area, the values were significantly larger in the cadaver compared to IV scans; however, for the adjusted scores, no significant differences were found between the PM and IV specimens. Because the adjusted scores were the primary dependent measures of interest, we do not believe that the variation in scan-ning protocols and magnets had any significant impact on our findings.
Second, we did not examine asymmetries in the CS sur-face area and depth, but rather used averages between the two hemispheres. Although asymmetries could have been assessed, comparing the findings among species would be difficult for a number of reasons. Among them, because of
the rather small sample sizes within some species, we would be underpowered in detecting significant population-level asymmetries. This type of analysis is further complicated by the fact that we did not have phenotypic data on behav-ior, such as hand preferences, in many of the subjects. Stud-ies in humans, chimpanzees and, to a lesser extent mon-keys, have found the depth of the left and right CS differs between right- and left-handed subjects [Amunts et al., 1996; Hopkins and Cantalupo, 2004; Phillips and Sher-wood, 2005]. A comparison of asymmetries in the CS would be of interest given the known phylogenetic differ-ences in hand preferences that have been reported in non-human primates for certain tasks [Westergaard et al., 1998, 2001; Hopkins et al., 2011]; however, the question remains for future study of whether sufficient sample sizes within different species can be obtained.
In summary, the current study shows that the surface area, shape, and folding pattern of the CS changed during Old World anthropoid primate evolution, presumably to reflect the increasing importance of somatosensory and motor integration of hand functions. Notably, as brain size increased after the split between lesser and great apes, folding in the CS had to accommodate the increasing size of the PPFM, which resulted in the anatomical formation of the motor-hand area or KNOB that can be visibly seen on the surface projection of the CS. Among apes, humans and orangutan have a relatively small PPFM_max when considered within the context of the overall surface area of the CS, which may reflect specific adaptations to biped-alism as well as motor control of the hands and feet.
Acknowledgements
This research was supported by NIH grants NS42867, NS73134, HD56232 and HD60563, and Cooperative Agreement RR15090. Additional support was provided by Fondation Fyssen and by a French National Research Agency (ANR) grant (LangPrimate ANR-12-PDOC-0014_01) to A.M., an ANR grant (BrainMorph, ANR-09-BLAN-0038-01) to O.C., NIH grants MH084980 (to A.J.B. and P.J.P.), AA013973 (Mark L. Laudenslager), Transla-tional Center for Neurobehavioral Alcohol Research AA017056 (to A.J.B. and P.J.P.), NIH Roadmap for Biomedical Research grant U54 RR021813 to S.F. and R.W., and the James S. McDon-nell Foundation (Grant No. 22002078 and 220020293). We would like to thank Yerkes National Primate Research Center and the Wake Forest Primate Center and their respective veterinary staff for assistance in MR imaging. Further assistance was appreciated from Jamie Russell, Jennifer Schaeffer, Jared Taglialatela, JosephMcIntyre, Christopher Corcoran, Jeremy Bailoo and Cynthia Lees. American Psychological Association guidelines for the treatment of animals were followed during all aspects of this study. Assis-tance in graphic editing by K. McKee is appreciated.
Table 1. Descriptive data
PM IV F
CS surface area, mm2 1,248.78 989.14 9.26*CS depth, mm 10.15 8.62 9.61*Total cortical fold 20,465.17 16,193.43 13.26*CS/total fold, % 6.7 6.0 2.86PPFM/total CS, % 28.9 34.6 2.12 * p < 0.05.
Dow
nloa
ded
by:
Em
ory
Uni
vers
ity17
0.14
0.10
4.1
- 8/
17/2
014
7:35
:06
PM

Evolution of the CS Morphology in Primates
Brain Behav Evol 2014;84:19–30DOI: 10.1159/000362431
29
References
Alkadhi H, Kollias SS (2004): Pli de passage fron-to-pariétal moyen of Broca separates the mo-tor homoculus. Am J Neuroradiol 25: 809–812.
Amunts K, Schlaug G, Schleicher A, Steinmutz H, Drabinghaus A, Roland P, Zilles K (1996): Asymmetry in the human motor cortex and handedness. Neuroimage 4: 216–222.
Armstrong E, Zilles K, Schleicher A (1993): Corti-cal folding and the evolution of the human brain. J Hum Evol 20: 341–348.
Bailey P, von Bonin G, McCulloch WS (1950): The Isocortex of the Chimpanzee. Urbana-Champaign, University of Illinois Press.
Boling W, Olivier A, Bittar R, Reutens D (1999): Localization of hand motor activation in Bro-ca’s pli de passage moyen . J Neurosurg 91: 903–910.
Boroojerdi B, Foltys H, Krings T, Spetzger U, Thron A, Topper R (1999): Localization of the motor hand area using transcranial magnetic stimula-tion and functional magnetic resonance imag-ing. Clin Neurophysiol 110: 699–704.
Bradshaw JL (1997): Human Evolution: A Neuro-psychological Perspective. Hove, Psychology Press.
Castiello U (2005): The neuroscience of grasping. Nat Rev Neurosci 6: 726–736.
Caulo M, Briganti C, Mattei PA, Perfetti B, Fer-retti A, Romani GL, Tartaro A, Colosimo C (2007): New morphological variants of the hand motor cortex as seen with MR imaging in a large study population. Am J Neuroradiol 28: 1480–1485.
Christel MI (1994): Catarrhine primates grasping small objects: techniques and hand preferenc-es; in Anderson JR, Roeder JJ, Thierry B, Her-renschmidt N (eds): Current Primatology: Behavioral Neuroscience, Physiology and Re-production. Strasbourg, Université Louis Pas-teur, vol iii, pp 37–49.
Connolly KJ (1998): The Psychobiology of the Hand. London, Lavenham Press.
Corballis MC (2002): From Hand to Mouth: The Origins of Language. Princeton, Princeton University Press.
Coulon O, Clouchoux C, Operato G, Dauchot K, Sirigu A, Anton J-L (2006): Cortical localiza-tion via surface parameterization: a sulcus-based approach. Neuroimage 31:S46.
Cykowski MD, Coulon O, Kochunov PV, Amunts K, Lancaster JL, Laird AR, Glahn C, Fox PT (2008): The central sulcus: an observer-inde-pendent characterization of sulcal landmarks and depth asymmetry. Cerebral Cortex 18: 1999–2009.
Davatzikos C, Bryan RN (2002): Morphometric analysis of cortical sulci using parametric rib-bons: a study of the central sulcus. J Comput Assist Tomogr 26: 298–307.
de Sousa AA, Sherwood CC, Mohlberg A, Amunts K, Schleicher A, MacLeod CE, Hof PR, Frahm H, Zilles K (2010): Hominoid visual brain structure volumes and the position of the lu-nate sulcus. J Hum Evol 58: 281–292.
Ehrsson HH, Fagergren A, Jonsson T, Westling G, Johansson RS, Forssberg H (2000): Corti-cal activity in precision- versus power-grip tasks: an FMRI study. J Neurophysiol 83: 528–536.
Fears SC, Melega WP, Service SK, Lee C, Chen K, Tu ZW, Jorgensen MJ, Fairbanks LA, Cantor RM, Freimer NB, Woods RP (2009): Identify-ing heritable brain phenotypes in an extended pedigree of vervet monkeys. J Neurosci 29: 2867–2875.
Felsenstein J (1985): Phylogenies and the compar-ative method. Am Nat 125: 1–15.
Foundas AL, Hong KW, Leonard CM, Heilman KM (1998): Hand preference and magnetic resonance imaging asymmetries of the central sulcus. Neuropsychiatry Neuropsychol Behav Neurol 11: 65–71.
Garland T, Dickerman AW, Janis CM, Jones JA (1993): Phylogenetic analysis of covariance by computer stimulation. Syst Biol 42: 265–292.
Grafen A (1989): The phylogenetic regression. Philos Trans R Soc B Biol Sci 326: 119–157.
Hopkins WD, Cantalupo C (2004): Handedness in chimpanzees is associated with asymme-tries in the primary motor but not with ho-mologous language areas. Behav Neurosci 118: 1176–1183.
Hopkins WD, Coulon O, Mangin JF (2010a): Ob-server-independent characterization of sulcal landmarks and depth asymmetry in the cen-tral sulcus of the chimpanzee brain. Neurosci-ence 171: 544–551.
Hopkins WD, Phillips KA, Bania A, Calcutt SE, Gardner M, Russell JL, Schaeffer JA, Lonsdorf EV, Ross S, Schapiro SJ (2011): Hand prefer-ences for coordinated bimanual actions in 777 great apes: implications for the evolution of handedness in hominins. J Hum Evol 60: 605–611.
Hopkins WD, Pilcher DL (2001): Neuroanatomi-cal localization of the motor hand area with magnetic resonance imaging: the left hemi-sphere is larger in great apes. Behav Neurosci 115: 1159–1164.
Hopkins WD, Taglialatela JP, Russell JL, Nir T, Schaeffer JA (2010b): Cortical representation of lateralized grasping in chimpanzees (Pan troglodytes) : a combined MRI and PET study. PLoS One 5: 1–10.
Kloppel S, Mangin JF, Vongerichten A, Fracko-wiak RSJ, Siebner HR (2010): Nurture versus nature: long-term inpact of forced right-handedness on structure of pericentral cortex and basal ganglia. J Neurosci 30: 3271–3275.
Li L, Preuss TM, Rilling JK, Hopkins WD, Glasser MF, Kumar B, Nana R, Zhang X, Hu X (2009): Chimpanzee pre-central corticospinal system asymmetry and handedness: a diffusion mag-netic resonance imaging study. PLoS One 5:e12886.
Mangin JF (2000): Entropy minimization for au-tomatic correction of intensity nonuniformi-ty; in Proceedings of the IEEE Workshop on Mathematical Methods in Biomedical Image Analysis (MMBIA’00). Hilton Head Island, IEEE Press, pp 162–169.
Mangin JF, Coulon O, Frouin V (1998): Robust brain segmentation using histogram scale-space analysis and mathematical morpholo-gy; in Colchester A, Delp S (eds): Medical Im-age Computing and Computer-Assisted In-tervention – MICCAI’98. Boston, Springer, vol 1496, pp 1230–1241.
Mangin JF, Frouin V, Bloch I, Regis J, Lopez-Kra-he J (1995): From 3D magnetic resonance im-aging to structural representations of the cor-tex topography using topology preserving de-formations. J Math Imaging Vis 5: 297–318.
Mangin JF, Regis J, Frouin V (1996): Shape bottle-necks and conservative flow systems; in Kava-naugh ME (ed): Workshop on Mathematical Methods in Biomedical Image Analysis. San Francisco, IEEE Pres, pp 319–328.
Mangin JF, Riviere D, Cachia A, Duchesnay E, Cointepas Y, Papadopoulos-Orfanos D, Col-lins DL, Evans AC, Regis J (2004): Object-based morphometry of the cerebral cortex. IEEE Trans Med Imaging 23: 968–982.
Martins EP, Hansen TF (1997): Phylogenies and the comparative method: a general approach to incorporating phylogenetic information into the analysis of interspecific data. Am Nat 149: 646–667.
Marzke MW (1996): Evolution of the hand and bipedality; in Lock A, Peters CR (eds): Hand-book of Human Symbolic Evolution. New York, Wiley-Blackwell, pp 126–154.
Marzke MW (1997): Precision grips, hand mor-phology, and tools. Am J Phys Anthropol 102: 97–110.
Orme D (2012): The caper package: comparative analysis of phylogenetics and evolution in R. http://cran.r-project.org/web/packages/ca-per/.
Penfield W, Boldrey E (1936): Somatic motor and sensory representation in the cerebral cortex of man as studied by electrical stimulation. Brain 60: 389–443.
Petrides M, Cadoret G, Mackey S (2005): Orofa-cial somatomotor responses in the macaque monkey homologue of Broca’s area. Nature 435: 1235–1238.
Phillips K, Sherwood CC (2005): Primary motor cortex asymmetry correlates with handedness in capuchin monkeys (Cebus apella) . Behav Neurosci 119: 1701–1704.
Pizzella V, Tecchio F, Romani GL, Rossini PM (1999): Functional localization of the sensory hand area with respect to the motor central gyrus knob. Neuroreport 10: 3809–3814.
Pouydebat W, Gorce P, Coppens Y, Bels V (2009): Biomechanical study of grasping according to the volume of the object: human versus non-human primates. J Biomech 42: 266–272.
Dow
nloa
ded
by:
Em
ory
Uni
vers
ity17
0.14
0.10
4.1
- 8/
17/2
014
7:35
:06
PM

Hopkins et al.
Brain Behav Evol 2014;84:19–30DOI: 10.1159/000362431
30
R Development Core Team (2011): R: a language and environment for statistical computing. http://www.R-project.org/.
Revell LJ (2011): Phytools: an R package for com-parative biology (and other things). Methods Ecol Evol 3: 217–223.
Rilling JK, Insel TR (1999a): Differential expan-sion of neural projection systems in primate brain evolution. Neuroreport 10: 1453–1459.
Rilling JK, Insel TR (1999b): The primate neocor-tex in comparative perspective using magnet-ic resonance imaging. J Hum Evol 37: 191–223.
Rogers J, Kochunov PV, Zilles K, Shelledy W, Lancaster JL, Thompson P, Duggirala R, Blangero J, Fox PT, Glahn DC (2010): On the genetic architecture of cortical folding and brain volume in primates. Neuroimage 53: 1103–1108.
Sastre-Janer FA, Regis J, Belin P, Mangin JF, Dor-mont D, Masure MC, Remy P, Frouin V, Sam-son Y (1998): Three-dimensional reconstruc-tion of the human central sulcus reveals a morphological correlate of the hand area. Ce-rebral Cortex 8: 641–647.
Schenker NM, Hopkins WD, Spocter MA, Gar-rison A, Stimpson CD, Erwin JM, Hof PR, Sherwood CC (2010): Broca’s area homo-logue in chimpanzees (Pan troglodytes) : prob-abilistic mapping, asymmetry and compari-son to humans. Cerebral Cortex 20: 730–742.
Schoenemann PT (2006): Evolution of size and functional areas of the human brain. Annu Rev Anthropol 35: 379–406.
Schoenemann PT, Sheehan MJ, Glotzer LD (2005): Prefrontal white matter volume is dis-proportionately larger in humans than in oth-er primates. Nat Neurosci 8: 242–252.
Semendeferi K, Armstrong E, Schleicher A, Zilles K, Van Hoesen GW (1998): Limbic frontal cortex in hominoids: a comparative study of area 13. Am J Phys Anthropol 106: 129–155.
Semendeferi K, Armstrong E, Schleicher A, Zilles K, Van Hoesen GW (2001): Prefrontal cortex in humans and apes: a comparative study of area 10. Am J Phys Anthropol 114: 224–241.
Semendeferi K, Lu A, Schenker N, Damasio H (2002): Humans and great apes share a large frontal cortex. Nature Neurosci 5:272–276.
Sherwood CC, Bauernfeind AL, Bianchi S, Raghanti MA, Hof PR (2012): Human brain evolution writ large and small. Prog Brain Res 195; 237–254.
Sherwood CC, Duka T, Stimpson CD, Schenker NM, Garrison A, Schapiro SJ, Baze WB, McArthur MJ, Erwin JM, Hof PR, Hopkins WD (2010): Neocortical synaptophysin asym-metry and behavioral lateralziation in chim-panzees (Pan troglodytes) . Eur J Neurosci 31: 1456–1464.
Sherwood CC, Holloway RL, Erwin JM, Hof PR (2004): Cortical orofacial motor representa-tion in old word monkeys, great apes and hu-mans. II. Stereological analysis of chemoar-chitecture. Brain Behav Evol 63: 82–106.
Sherwood CC, Wahl E, Erwin JM, Hof PR, Hop-kins WD (2007): Histological asymmetries of primary motor cortex predicts handedness in chimpanzees (Pan troglodytes) . J Comp Neu-rol 503: 525–537.
Smaers JB, Steele J, Case CR, Cowper A, Amunts K, Zilles K (2011): Primate prefrontal cortex evolution: humans brains are the extreme of a lateralzied ape trend. Brain Behav Evol 77: 67–78.
Tocheri M, Orr CM, Jacofsky C, Marzke MW (2008): The evolutionary history of the hom-inin hand since the last common ancestor of pan and homo . J Anat 212: 544–562.
Westergaard GC, Kuhn HE, Suomi SJ (1998): Bi-pedal posture and hand preference in humans and other primates. J Comp Psychol 112: 56–63.
Westergaard GC, Lussier ID, Higley JD (2001): Between-species variation in the develop-ment of hand preference among macaques. Neuropsychologia 39: 1373–1378.
Young RW (2003): Evolution of the human hand: the role of throwing and clubbing. J Anat 202: 165–174.
Yousry TA, Schmid UD, Alkadhi H, Schmidt D, Peraud A, Buettner A, Winkler P (1997): Lo-calization of the motor hand area to a knob on the precentral gyrus: a new landmark. Brain 120: 141–157.
Zilles K, Armstrong E, Moser KH, Schleicher A, Stephan H (1989): Gyrification in the cerebral cortex of primates. Brain Behav Evol 34: 143–150.
Dow
nloa
ded
by:
Em
ory
Uni
vers
ity17
0.14
0.10
4.1
- 8/
17/2
014
7:35
:06
PM


