Embed Size (px)
Citation preview
arX
iv:1
011.
3315
v2 [
phys
ics.
data
-an]
17
Nov
201
0
An evolutionary method for finding communities in bipartite networks
Weihua Zhan1,∗ Zhongzhi Zhang2,3,† Jihong Guan1,‡ and Shuigeng Zhou2,31Department of Computer Science and Technology,
Z Tongji University, 4800 Cao’an Road, Shanghai 201804, China2School of Computer Science, Fudan University, Shanghai 200433, China and
3Shanghai Key Lab of Intelligent Information Processing, Fudan University, Shanghai 200433, China
(Dated: November 18, 2010)
An important step for unveiling the relation between network structure and dynamics definedon networks is to detect communities, and numerous methods have been developed separately toidentify community structure in different classes of networks, such as unipartite networks, bipartitenetworks, and directed networks. Here, we show that finding communities in these three classes ofnetworks can be unified to a general framework, viz., detecting community structure in bipartitenetworks. Moreover, we propose an evolutionary method for efficient identifying communities inbipartite networks. To this end, we show that both unipartite networks and directed networks canbe represented as bipartite networks, and their modularity is completely consistent with that forbipartite networks, the detection of modular structure on which can be reformulated as modularitymaximization. To optimize the bipartite modularity, we develop a modified adaptive genetic algo-rithm (MAGA), which is shown especially efficient for community structure detection. The highefficiency for the MAGA is based on the following three improvements we make. Firstly, we intro-duce a new measure for the informativeness of a locus instead of the standard deviation, which canexactly determine those loci to mutate. This measure is the bias between the distribution of a locusover the current population and the uniform distribution of the locus, i.e., Kull-back Divergencebetween them. Secondly, we develop a reassignment technique for differentiating the informativestate a locus has attained from the random state at initial phase. Thirdly, we present a modifiedmutation rule which incorporating related operation can guarantee the convergence of MAGA to theglobal optima and can speed up the convergence process. Experimental results on bipartite networksshow that MAGA is superior to MOGA and standard genetic algorithms, as well as the nice BRIM(bipartite, recursively induced modules) algorithm previously designed for bipartite networks.
PACS numbers: 89.75.Hc, 02.10.Ox, 02.50.-r
I. INTRODUCTION
Complex network has gain overwhelming popularity asa tool for understanding various complex systems fromdiverse fields, including technical, natural and social sci-ence, etc., which provides a unified perspective or methodfor studying these systems through modeling them asnetworks with nodes and edges respectively representingtheir units and interactions between units [1–6]. Gen-erally, networks can be classified into unipartite, bipar-tite and multipartite networks, considering types of theirnodes. As a typical class of real-world networks, bi-partite networks, compared to unipartite ones, consistof two types of nodes and edges presenting only be-tween distinct types. Examples of bipartite networkscome from various fields, including scientific collabora-tion networks, actor-movie networks and protein-proteininteraction networks [1, 2, 9–11]. Multipartite networkswith more than three types of nodes, are occasionallyseen [7, 8].
It has been discovered [9] that most of real networks
∗Electronic address: [email protected]†Electronic address: [email protected]‡Electronic address: [email protected]
share the local clustering feature, i.e., groups of tight-knit nodes mutually connected to each other with sparseredges. These groups of nodes are generally referred toas communities or modules. From a topological point ofview, a community may correspond to a function unit be-cause of its structurally relative independence. In turn,community structure can critically affect diverse dynam-ics on networks. Therefore, identification of communi-ties plays a key role in numerous related areas of com-plex networks, such as predicating protein function [12]and determining dynamics of systems [13–15]. The lastfew years have witnessed tremendous efforts in this di-rection [10, 15–26](useful reviews include Refs. [27, 28]).Most of previous studies are dedicated to deal with uni-partite networks, while little attention has been paid todirected networks [23, 24] and bipartite ones [24–26].
It is of interest that unipartite networks and directednetworks can be represented by bipartite networks as weshall show. Thus, detecting communities in unipartitenetworks or in directed networks can be transformed intothe task in bipartite networks. Given a bipartite mod-ularity, those methods based on modularity maximiza-tion [16–19], in principle, can be applied to bipartite net-works. However, they are expected to affected by theresolution limit [29, 30] as in the unipartite case, whichmay result in the degeneracy problem [31] there existingan exponential number of distinct of high-scoring divi-
2
sions. This poses a challenge for the methods returningone solution. Instead, we present a modified adaptive ge-netic algorithm to optimize the bipartite modularity [26].The evolutionary method can return a better solution ina shorter time. Moreover, the method also can returnmultiple better solutions by multiple runs, which enablesus to have a chance to evaluate the reliability of solu-tions as well as to obtain a superior solution by combin-ing several better solutions when the degeneracy problemis severe.In practice, there exist two distinct conceptual un-
derstandings of the community structure of a bipartitenetwork. A point of view for communities in the net-work is to consider each composed of two types of nodeswith dense edges across them, which is similar to thatin unipartite cases [26]. Alternative view is that anycommunity should contain only one type of nodes, whichare closely connected through co-participation in manycommunities that consist of another type of nodes [24].Guided by this view, the usual approach to identify com-munities is to project the bipartite network onto one spe-cific unipartite network as needed, and then identify com-munities in the projection. Guimera et al [24] recentlypresented a method for identifying communities of onetype of nodes against other type of nodes with a knowncommunity structure.In this paper, we focus on dealing with the problem of
identifying communities in the former view. We presenta modified adaptive genetic algorithm based on mutationonly genetic algorithm (MOGA) that are parameter-freeunlike traditional genetic algorithm. The method hasno need to know the number of communities and theirsizes in advance. In section II, we first give a short re-view on Barber’s modularity and then show unpartitenetworks and directed networks can be uniformly rep-resented by bipartite networks. In section IIIA, we de-scribe the frame of MOGA, and introduce a new measurefor selecting loci to mutate in III B, as well as we developthe reassignment technique in III C. We also discuss theproblem of selecting population size in IIID and that ofconvergence in III E. In section IV, we apply the newalgorithm to several networks including model bipartitenetwork, southern women network and Scotland interlocknetwork. At last, the conclusion is given.
II. BIPARTITE MODULARITY
Modularity introduced by Newman and Girvan [10]aims at quantifying the goodness of a particular divisionof a given network, which has been widely accepted asa benchmark index to measure and to compare accuracyof various methods of community detection. The defini-tion of this quantity is based on the idea that commu-nity structure definitely means a statistically surprisingarrangement of edges, that is, the number of actual edgeswithin communities should be significantly beyond thatof expected edges of a null model. In turn, a null model
should have the same number of nodes and degree distri-bution as the original network while edges are placed bychance.Let ki be the degree of nodes i, M be the total num-
ber of edges, then in the null model [18] the probabil-
ity for an edge presenting between nodes i and j iskikj
2M .Then modularity quantifies the extent, relative to the nullmodel network, to the number of actual edges exceedingthe expectation, which can be formulated as follows:
Q =1
2M
n∑
i=1
n∑
j=1
(
Ai,j −kikj2M
)
δ(gi, gj) (1)
where Q is the sum of the difference over all groups of theparticular division, Ai,j is the adjacent matrix element,gi represents the group the node i is assigned to, andthe δ function takes the value of 1 if gi equals to gj, 0otherwise.The maximum value of Q is 1, and values approach-
ing 1 indicate strong community structure. On the con-trary, when the number of within-community edges isno better than random, Q≤0 and values approaching 0imply weaker community structure or indivisibility. Con-sequently, community structure detection can be formu-lated as a problem of maximization of modularity, whichhas prevailed in the research area.The modularity above-mentioned is actually designed
for unipartite networks. To be suitable for various net-works, several varieties of modularity based on differentnull model has been proposed, including weighted [32],directed [23] and bipartite modularity [24, 26]. A bi-partite network with n nodes can be conveniently de-noted by a duality (p,q) (p+q=n), where p and q re-spectively represent the numbers of the two types ofnodes. We can renumber nodes such that in the sequence1, 2, · · · , p, p + 1, · · · , n, the leftmost p indices representthe first type of nodes and the remainder represent thesecond type of nodes. Then, Barber’s bipartite modular-ity [26] that considers a community composed of distincttypes of nodes in the network, can be written as
Qb =1
M
p∑
i=1
n∑
j=p+1
(
Ai,j −kikjM
)
δ(gi, gj) (2)
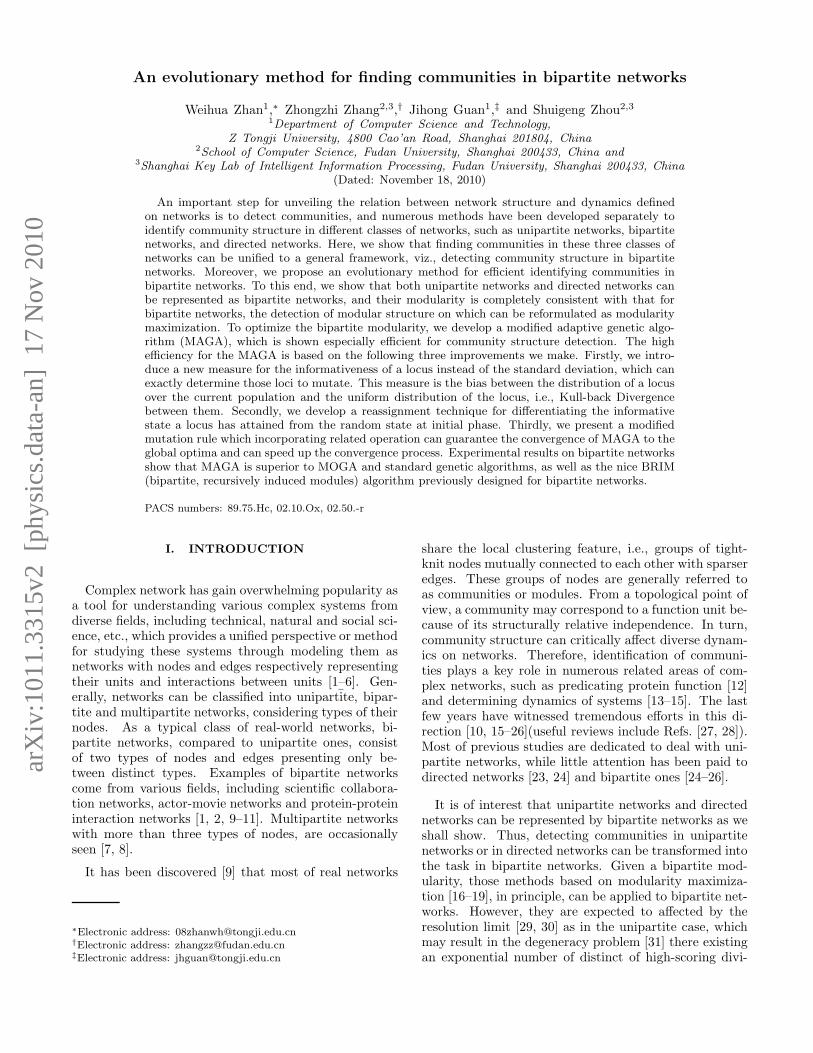
Immediately, subtle difference between the two modu-larities in (1) and (2) can be observed. It is of interestthat we will see a unipartite network can be equivalentlyrepresented as a bipartite one, and the bipartite modular-ity can recover the modularity for the original network.If each node i is represented by two nodes Ai and Bi,each edge i − j represented by two edges Ai − Bj andAj −Bi, then a unipartite network with n nodes and Medges is transformed into a corresponding bipartite net-work with 2n nodes and 2M edges. For example, thetransformation of a simple unipartite network is shownin Figs. 1. Further, if we label n nodes Ai with 1, 2,. . . ,n and label Bi with n+1, n+2, . . . , 2n, then an edgei − j in the original network corresponds to two edges,
3
FIG. 1: Transformation of a simple unipartite network intobipartite one.(a)An unipartite network with 5 nodes and 6edges.(b)The bipartite network corresponding to (a)
i− (n+ j) and j− (n+ i). Using the bipartite modularityintroduced in Eq. (2) on the induced bipartite network,we have
Qb =1
2M
n∑
i=1
2n∑
j=n+1
(
Ai,j −kikj2M
)
δ(gi, gj)
=1
2M
n∑
i=1
n∑
j′=1
(
Ai,n+j′ −kikn+j′
2M
)
δ(gi, gn+j′)
=1
2M
n∑
i=1
n∑
j′=1
(
Ai,j′ −kikj′
2M
)
δ(gi, gj′) = Q (3)
where we have made use of the facts the node Ai and Bi
should be in an identical community and have the samedegree. Thus, bipartite modularity can be also used tocommunity detection in unipartite networks after beingtransformed.
We then turn to the modularity for directed unipartitenetworks that are another important class of networks.The directed network can analogously be transformed toa bipartite network. A node i is represented by two nodesAi and Bi as that in unipartite networks, while a directededge from i to j is represented as an edge between Ai andBj , that is, set {Ai} and set {Bi} are the sources and thesinks. Again, using the Eq. (2) and the facts above, we
obtain
Qb =1
M
n∑
i=1
2n∑
j=n+1
(
Ai,j −kikjM
)
δ(gi, gj)
=1
M
n∑
i=1
n∑
j′=1
(
Ai,n+j′ −kikn+j′
M
)
δ(gi, gn+j′)
=1
M
n∑
i=1
n∑
j′=1
(
Ai,j′ −kouti kinj′
M
)
δ(gi, gj′) (4)
where the right side in the last equation is just themodularity for directed networks presented in [23]. Themethod for transforming directed networks into bipar-tite ones has been proposed by Guimera et al [24], buttheir bipartite modularity is distinct from Barber’s oneas mentioned before.Consequently, bipartite networks can be considered as
a widely representative class of networks that providesa generic case for the problem of community structuredetection. And the Barber’s bipartite modularity canbe served as a uniform objective for these methods ofidentifying communities that based on optimization.
III. EVOLUTIONARY METHOD FOR
COMMUNITY DETECTION
As a class of general-purpose tools to solve various hardproblems, genetic algorithms have found wide applicationin bioinformatics, computer science, physics, engineerand other fields. They are, based on the Darvinian prin-ciple of survival of the fittest, a kind of global optimiza-tion method simulating evolutionary process of species innature [34].The evolutionary methods are easy to be implemented,
and the process can be described as follows. They firstcreate a stochastic initial population with predefined sizewherein individuals are known as chromosomes repre-senting a set of feasible solutions to the problem at hand,with each associated with a fitness. Then select chro-mosomes in proportion to corresponding fitness so thatthose better solutions would make themselves have multi-ple copies and worse ones would be discarded in the newpopulation. Next, genetic operators such as crossoverand mutation are performed according to respective spec-ified ratios on the population. After these operations, thepopulation of next generation has been reproduced. It-erate the above process to evolve the current populationtowards better offspring until the termination criteria ismet.Since the number of divisions on any given network
grows at least exponentially in the number of nodes, theoptimization of modularity is clearly a NP hard problemthat has been given a rigid proof in [33], which has mo-tivated an array of heuristic methods including greedyagglomeration [11], simulated annealing [16], spectral re-laxation [17, 18], extremal optimization [19] and math-ematical programming [35]. All these methods perform
4
point-point search, that is, transformation from one solu-tion to a better one, which are susceptible to trapping inlocal optima. In contrast, genetic algorithms work with apopulation of solutions instead of a single solution. Thisimplies that genetic algorithms are more robust becausethey performmultiple directional search that would makethem effectively find better solutions.However, for practitioners, a fundamental important
problem is to choose appropriate parameters such ascrossover rate and mutation rate, because they wouldseriously affect the performance of genetic algorithms.Further, these parameters are closely related to the stud-ied problem, and even for the same problem, they shouldadjust themselves with the course of the search. In thefollowing, we would like to introduce an adaptive geneticalgorithm recently presented by Szeto and Zhang [36] andthen propose a modified version suited for communitystructure detection.
A. Mutation only Genetic algorithm
Traditional genetic algorithms assume that genetic op-erators indiscriminately act on each locus constituted thechromosome, but this is always not the case. Indeed,the recent research in human’s DNA [37] shows muta-tion rates at different loci are very different from oneanother. Inspired by this, Ma and Szeto [38] reportedon locus oriented adaptive genetic algorithm (LOAGA)that make use of the statistical information inside thepopulation to tune the mutation rate at individual locus.Szeto and Zhang [36] further presented a new adaptivegenetic algorithm, called MOGA (mutation only geneticalgorithm), which generalized their method by incorpo-rating the information on the loci statistics with muta-tion operator. In MOGA, mutation was the only geneticoperator, and the only required parameter is the size ofpopulation. MOGA was readdressed by Law and Szetoin [39], wherein it was extended to include crossover op-erator. Here, the description for MOGA is given on thebasis of the later version.The population matrix P is stacked by NP chromo-
somes with length L, with its entries Pij(t) representingthe allele at locus j of the chromosome i at time (or gen-eration) t. The rows of this matrix are ranked accordingto the fitness of the chromosomes in descending order,i.e., f(i) ≥ f(k) for i < k. The columns are rankedaccording to the standard deviation σt(j) (its definitionsee below) of alleles at locus j such that σt(j) ≤ σt(k)for j < k. In MOGA, the fitness cumulative probabil-ity, as an informative measure for chromosome i relativeto the landscape of fitness of the whole population, wasintroduced and can be defined as follows:
C(i) =1
NP
∑
g≤f(i)
N(g) (5)
where N(g) is the number of chromosomes whose fitnessequals to g. Subsequently, the standard deviation σt(j)
over the allele distribution, as a useful informative mea-sure for each locus j, is defined as
σt(j) =
√
√
√
√
∑NP
i=1(Pij(t)− ht(j))2 × C(i)∑NP
i=1 C(i)(6)
where the weighted factor C(i) reflects the informative
usefulness of the chromosome i, and ht(j) is the mean ofthe alleles at locus j, given by
ht(j) =1
NP
NP∑
i=1
Pij(t) (7)
A locus with a smaller allele standard deviation is con-sidered to be more informative than the other loci, viceversa. Indeed, this really makes sense in limited situa-tions. For the initial population, the alleles at each locusj should satisfy a uniform distribution, so the standarddeviation σt(j) would very high while the locus present isnot informative. A typical optimization problem gener-ally allows of a few global optima, so the loci with higherstructural information are liable to take fewer alleles thanallowed, thereby having smaller allele standard devia-tions. Therefore, the loci with higher deviations prefermutating while the other loci (informative loci) remainfor guiding the evolution process.
Now, we can describe the process of MOGA. In eachgeneration, we sweep the population matrix from topto bottom. Each row (a chromosome) is selected formutation, with probability, α(i) = 1 − C(i). Togetherwith Eq. (5), we have 1
NP≤ C(i) ≤ 1, and a chro-
mosome with higher fitness has fewer chance to be se-lected, vice versa. Particularly, the first chromosome thathas the highest fitness will never be selected for muta-tion, while the last one will almost always undergo mu-tation for large enough NP , if NP normally takes a valuefrom 50-100 as De Jong’s suggestion [43], for example,α(NP ) = 1 − 1
NP= 0.98 for NP = 50. If the current
chromosome i selected, then the number N(i) of loci formutation is prescribed with N(i) = α(i) × L. Thus, aselected chromosome with higher fitness has fewer locito mutate, thereby most of the informative loci remains;while a selected chromosome with lower fitness has moreless-informative loci to mutate. In practice, we can mu-tate the N(i) leftmost loci because they are less infor-mative relative to others according to the above arrange-ment of loci.
Overall, MOGA is expected to have a two-fold advan-tage over traditional genetic algorithms: first of all, noneed to input parameters except the population size canmake it more available for solving various problem; sec-ondly, the mechanism of adaptive adjusting parameterscan make it more effectively perform to obtain better so-lutions if it can work as expected.
5
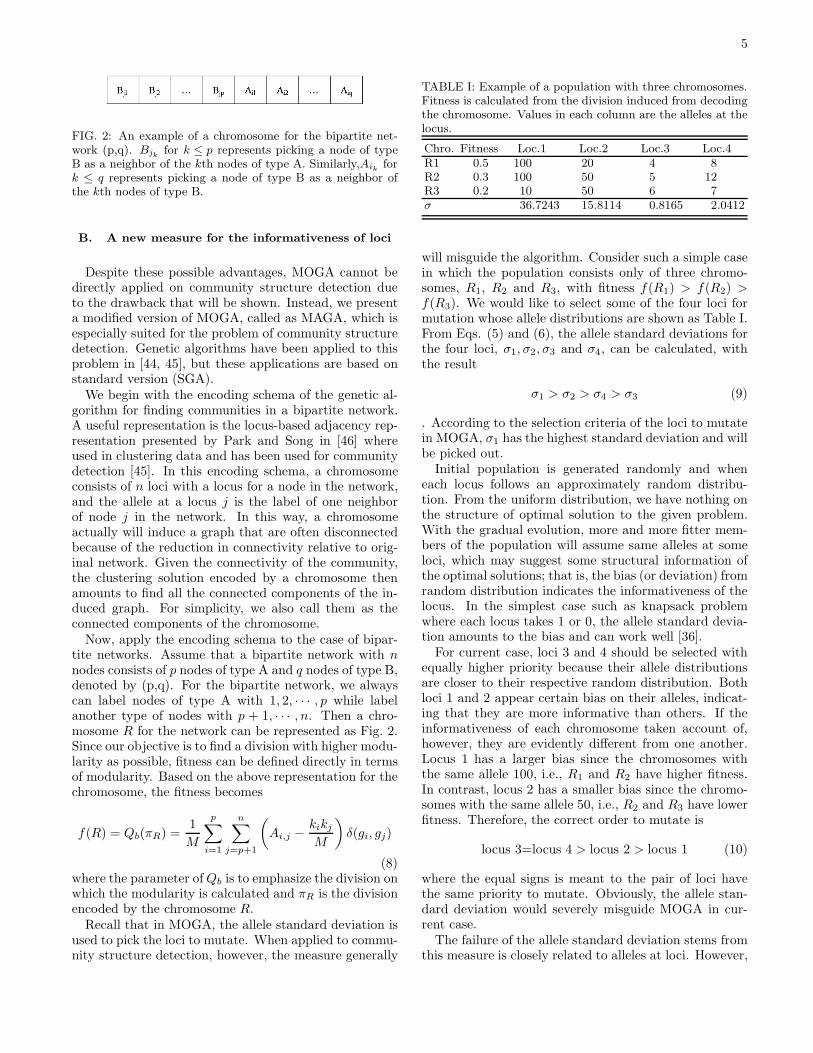
FIG. 2: An example of a chromosome for the bipartite net-work (p,q). Bjk for k ≤ p represents picking a node of typeB as a neighbor of the kth nodes of type A. Similarly,Aik fork ≤ q represents picking a node of type B as a neighbor ofthe kth nodes of type B.
B. A new measure for the informativeness of loci
Despite these possible advantages, MOGA cannot bedirectly applied on community structure detection dueto the drawback that will be shown. Instead, we presenta modified version of MOGA, called as MAGA, which isespecially suited for the problem of community structuredetection. Genetic algorithms have been applied to thisproblem in [44, 45], but these applications are based onstandard version (SGA).We begin with the encoding schema of the genetic al-
gorithm for finding communities in a bipartite network.A useful representation is the locus-based adjacency rep-resentation presented by Park and Song in [46] whereused in clustering data and has been used for communitydetection [45]. In this encoding schema, a chromosomeconsists of n loci with a locus for a node in the network,and the allele at a locus j is the label of one neighborof node j in the network. In this way, a chromosomeactually will induce a graph that are often disconnectedbecause of the reduction in connectivity relative to orig-inal network. Given the connectivity of the community,the clustering solution encoded by a chromosome thenamounts to find all the connected components of the in-duced graph. For simplicity, we also call them as theconnected components of the chromosome.Now, apply the encoding schema to the case of bipar-
tite networks. Assume that a bipartite network with nnodes consists of p nodes of type A and q nodes of type B,denoted by (p,q). For the bipartite network, we alwayscan label nodes of type A with 1, 2, · · · , p while labelanother type of nodes with p + 1, · · · , n. Then a chro-mosome R for the network can be represented as Fig. 2.Since our objective is to find a division with higher modu-larity as possible, fitness can be defined directly in termsof modularity. Based on the above representation for thechromosome, the fitness becomes
f(R) = Qb(πR) =1
M
p∑
i=1
n∑
j=p+1
(
Ai,j −kikjM
)
δ(gi, gj)
(8)where the parameter ofQb is to emphasize the division onwhich the modularity is calculated and πR is the divisionencoded by the chromosome R.Recall that in MOGA, the allele standard deviation is
used to pick the loci to mutate. When applied to commu-nity structure detection, however, the measure generally
TABLE I: Example of a population with three chromosomes.Fitness is calculated from the division induced from decodingthe chromosome. Values in each column are the alleles at thelocus.
Chro. Fitness Loc.1 Loc.2 Loc.3 Loc.4R1 0.5 100 20 4 8R2 0.3 100 50 5 12R3 0.2 10 50 6 7σ 36.7243 15.8114 0.8165 2.0412
will misguide the algorithm. Consider such a simple casein which the population consists only of three chromo-somes, R1, R2 and R3, with fitness f(R1) > f(R2) >f(R3). We would like to select some of the four loci formutation whose allele distributions are shown as Table I.From Eqs. (5) and (6), the allele standard deviations forthe four loci, σ1, σ2, σ3 and σ4, can be calculated, withthe result
σ1 > σ2 > σ4 > σ3 (9)
. According to the selection criteria of the loci to mutatein MOGA, σ1 has the highest standard deviation and willbe picked out.Initial population is generated randomly and when
each locus follows an approximately random distribu-tion. From the uniform distribution, we have nothing onthe structure of optimal solution to the given problem.With the gradual evolution, more and more fitter mem-bers of the population will assume same alleles at someloci, which may suggest some structural information ofthe optimal solutions; that is, the bias (or deviation) fromrandom distribution indicates the informativeness of thelocus. In the simplest case such as knapsack problemwhere each locus takes 1 or 0, the allele standard devia-tion amounts to the bias and can work well [36].For current case, loci 3 and 4 should be selected with
equally higher priority because their allele distributionsare closer to their respective random distribution. Bothloci 1 and 2 appear certain bias on their alleles, indicat-ing that they are more informative than others. If theinformativeness of each chromosome taken account of,however, they are evidently different from one another.Locus 1 has a larger bias since the chromosomes withthe same allele 100, i.e., R1 and R2 have higher fitness.In contrast, locus 2 has a smaller bias since the chromo-somes with the same allele 50, i.e., R2 and R3 have lowerfitness. Therefore, the correct order to mutate is
locus 3=locus 4 > locus 2 > locus 1 (10)
where the equal signs is meant to the pair of loci havethe same priority to mutate. Obviously, the allele stan-dard deviation would severely misguide MOGA in cur-rent case.The failure of the allele standard deviation stems from
this measure is closely related to alleles at loci. However,
6
the information contained in loci is actually without re-gard to the particular values but solely determined bythe bias relative to the random distribution. It is thuscrucial how to measure the bias. Fortunately, we can useKullback-Leibler divergence to describe the bias.In the formalism of MAGA, we explicitly represent a
locus j as a discrete random variables Xj , and an alleleat the locus is viewed as a value of Xj . Then the randomdistribution over the locus can formally given by
Q(Xj = x) =
{
1|Xj |
, for each x ∈ Xj
0, otherwise(11)
Let the allele distribution over the population be P , de-fined by
P(Xj = x) =
∑
Pij=x f(i)∑
i f(i). (12)
We can mathematically define the bias µ as the Kullback-Leibler divergence between the two distribution, P andQ:
µ(j) =∑
x∈NBs(j)
P(Xj = x)logP(Xj = x)
Q(Xj = x)(13)
where NBs(j) represents the set of nodes adjacent to jin the original network. It is noteworthy that the quan-tity 0log0 should be interpreted as zero. As a Kullback-Leibler divergence, the bia is always non-negative, and iszero if and only if P = Q.Assuming that there are three alleles at each of the
four locus in the above example, we obtain µ1 = 0.863,µ2 = 0.585 and µ3 = µ4 = 0.5145. As a smaller biasindicates poorer information a locus contain, the locuswould undergo mutation. Conversely, a larger bias meansricher informativeness, the locus should remain. There-fore, guided by the bias, the order of mutation is locus3,4,2,1 or 4,3,2,1, which completely match the order inEq.(10).Further, it can be observed that locus 2 has zero bias
if it has only two alleles. The difference coming from thechange of number of alleles would be normally concealedby the standard allele deviation. For these reasons, thebias appears superior to the standard allele deviation andis used in our MAGA for determining the loci to mutate.
C. The reassignment technique for locus static
It is so far acknowledged that the loci with randomdistribution should have priority for mutation. How-ever, this presupposition does not always hold. Afterthe evolution of certain generations, some communitiesor their main-bodies would have appeared at the popu-lation scale. At present, a locus with a random distribu-tion does not imply that it contains no information andshould undergo mutation immediately. Generally, there
exists in the network many nodes whose neighbors areall (or almost) in the same communities and have a simi-lar connection pattern or even are structurally equivalentnodes [42] that are connected to the same nodes. For sucha node, if all (or most) of its neighbors presenting in thesame connected component predominates on the currentpopulation, then the locus has the random distributionor a approximately random distribution. Therefore, weare required to differentiate the case to avoid such mis-guiding.The reassignment technique is designed to deal with
this problem. For a chromosome R, the element x is theallele at the locus j which is a neighbor of the node j.Check whether the component that j is assigned to in-cludes other neighbors with smaller labels. If it is trueand the neighbor with the smallest labels is y, then the
contribution from R, f(R)∑if(i) that should be assigned to
x now is reassigned to y if x 6= y. In this way, forwardsweeping the population matrix can obtain the distribu-tion of the locus over the population. Thus, the alleledistribution over the population in Eq. (12) can be refor-mulated as follows:
P∗(Xj = x) =
∑
S(i,j)=x f(i)∑
i f(i). (14)
where S(i, j) is the node j’s neighbor with the smallestlabel that lies as j in the same component of the chromo-some i.An example using the technique as shown in Table II.
Using Eq. (12), it is obvious that the locus 1 has ap-proximately random distribution and thus the bias ap-proximates 0. Recalculating the distribution with thereassignment technique, however, we have P∗(X1 = 2) =0.53,P∗(X1 = 3) = 0.47 and P∗(X1 = 4) = P∗(X1 =5) = 0, which is very different from the random distribu-tion with the bias 1.0026.
TABLE II: Example of reassignment technique. Column 1 isfour chromosomes,column 2 is fitness of the chromosome, col-umn 3 is the alleles of locus 1, and the right four columns showwhether the corresponding nodes are in the same connectedcomponent as node 1 with 1 yes and 0 no.
Chro. Fitness Loc.1 Loc.2 Loc.3 Loc.4 Loc.5R1 0.28 2 1 1 0 0R2 0.25 3 0 1 1 0R3 0.25 4 1 0 1 1R4 0.22 5 0 1 0 1
The idea behind the technique is well understood.Given a locus j, we can replace its allele present withany of other alleles (i.e. other neighbors in the origi-nal network) that lie in the same component in a suchway that does not alter the connectivity of the compo-nent hence causing no change in the division encoded bythe chromosome. To show the feasibility of this, we fo-cus on the component that j lies in. Recall that a locus
7
3
6
7
2
1
j
5
(b)
j
3
1
(a)
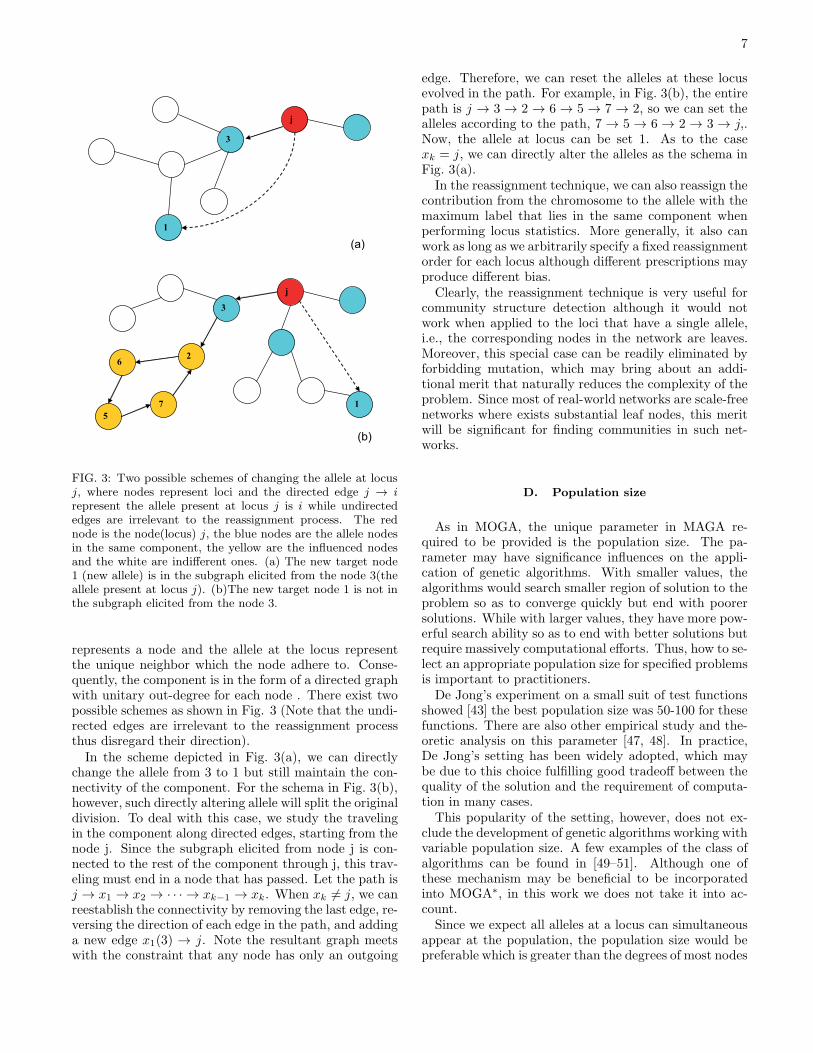
FIG. 3: Two possible schemes of changing the allele at locusj, where nodes represent loci and the directed edge j → irepresent the allele present at locus j is i while undirectededges are irrelevant to the reassignment process. The rednode is the node(locus) j, the blue nodes are the allele nodesin the same component, the yellow are the influenced nodesand the white are indifferent ones. (a) The new target node1 (new allele) is in the subgraph elicited from the node 3(theallele present at locus j). (b)The new target node 1 is not inthe subgraph elicited from the node 3.
represents a node and the allele at the locus representthe unique neighbor which the node adhere to. Conse-quently, the component is in the form of a directed graphwith unitary out-degree for each node . There exist twopossible schemes as shown in Fig. 3 (Note that the undi-rected edges are irrelevant to the reassignment processthus disregard their direction).In the scheme depicted in Fig. 3(a), we can directly
change the allele from 3 to 1 but still maintain the con-nectivity of the component. For the schema in Fig. 3(b),however, such directly altering allele will split the originaldivision. To deal with this case, we study the travelingin the component along directed edges, starting from thenode j. Since the subgraph elicited from node j is con-nected to the rest of the component through j, this trav-eling must end in a node that has passed. Let the path isj → x1 → x2 → · · · → xk−1 → xk. When xk 6= j, we canreestablish the connectivity by removing the last edge, re-versing the direction of each edge in the path, and addinga new edge x1(3) → j. Note the resultant graph meetswith the constraint that any node has only an outgoing
edge. Therefore, we can reset the alleles at these locusevolved in the path. For example, in Fig. 3(b), the entirepath is j → 3 → 2 → 6 → 5 → 7 → 2, so we can set thealleles according to the path, 7 → 5 → 6 → 2 → 3 → j,.Now, the allele at locus can be set 1. As to the casexk = j, we can directly alter the alleles as the schema inFig. 3(a).In the reassignment technique, we can also reassign the
contribution from the chromosome to the allele with themaximum label that lies in the same component whenperforming locus statistics. More generally, it also canwork as long as we arbitrarily specify a fixed reassignmentorder for each locus although different prescriptions mayproduce different bias.Clearly, the reassignment technique is very useful for
community structure detection although it would notwork when applied to the loci that have a single allele,i.e., the corresponding nodes in the network are leaves.Moreover, this special case can be readily eliminated byforbidding mutation, which may bring about an addi-tional merit that naturally reduces the complexity of theproblem. Since most of real-world networks are scale-freenetworks where exists substantial leaf nodes, this meritwill be significant for finding communities in such net-works.
D. Population size
As in MOGA, the unique parameter in MAGA re-quired to be provided is the population size. The pa-rameter may have significance influences on the appli-cation of genetic algorithms. With smaller values, thealgorithms would search smaller region of solution to theproblem so as to converge quickly but end with poorersolutions. While with larger values, they have more pow-erful search ability so as to end with better solutions butrequire massively computational efforts. Thus, how to se-lect an appropriate population size for specified problemsis important to practitioners.De Jong’s experiment on a small suit of test functions
showed [43] the best population size was 50-100 for thesefunctions. There are also other empirical study and the-oretic analysis on this parameter [47, 48]. In practice,De Jong’s setting has been widely adopted, which maybe due to this choice fulfilling good tradeoff between thequality of the solution and the requirement of computa-tion in many cases.This popularity of the setting, however, does not ex-
clude the development of genetic algorithms working withvariable population size. A few examples of the class ofalgorithms can be found in [49–51]. Although one ofthese mechanism may be beneficial to be incorporatedinto MOGA∗, in this work we does not take it into ac-count.Since we expect all alleles at a locus can simultaneous
appear at the population, the population size would bepreferable which is greater than the degrees of most nodes
8
in the network. As mentioned before, most real-worldnetworks are scale-free, so the degrees of most of nodesin these networks are less than 50. Allowing for this andthe cost of large population size, we would like to take afixed value from the interval between 50 and 200.
E. Convergence and its speeding up
MOGA and its extending to include crossover havebeen reported to perform well in the applications to solveknapsack problem [36] and to find the minimum energyof one dimensional Ising spin glass [39], where all the locihave two alleles, 0 and 1. For many cases, however, theirperformance would be hindered by two factors. One fac-tor is the misguiding from the allele standard deviationsabove-mentioned. Another factor is that in the evolutionof each generation the fittest individual(s) actually willnot participate in the mutation unless others supersedeit (them).
In fact, despite fulfilling the elite preservationstrategy[40, 41] that for SGA assures the convergencetoward the global optimum, MOGA dos not guaranteesuch convergence even it may be end with a not local op-timum solution. Consider such a case that NP -1 fittestchromosomes have identical fitness and the remaining onehas lower fitness. Those fittest should be passed to nextgeneration while the remaining one would mutate withvery high probability. If the mutation happens to repro-duce a chromosome with the same fitness as others, thiswould unexpectedly terminate the evolutionary process.
It is helpful to notice that the fittest ones present, if notlocal optimum, always can perform local search to reacha local optima. Consequently, it is preferable to mod-ify the rule for mutation so as to allow for local search.We still select the chromosome i with the same proba-bility 1-C(f(i)) as in MOGA, if chosen then perform themutation aforementioned, or randomly select a locus tomutate. Given that this may destroy the elite preser-vation strategy, MAGA first duplicates 10% the fittestchromosomes to a new generation, then select from thecurrent population the remaining in proportion to theirfitness to prepare for mutation. These individuals tem-porarily generated by selection mutate according to thenew rule to reproduce the 90% of the new generation.The fittest individuals are probably selected and performlocal search. In this way, MAGA not only can convergeto the global optima, it also speeds up the convergence.
IV. RESULTS
In this section, we empirically study the effectiveness ofMAGA by applying it to model networks with predefinedcommunity structure and several real-world networks. Inboth cases, we show that the tailored adaptive geneticalgorithm is superior to SGA and MOGA, and it also can
compete with the famous BRIM algorithm that dedicatedto bipartite network.
A. Model bipartite networks
To test how well our algorithm perform, we have ap-plied it to the model bipartite networks with a knowncommunity structure. A model network can be con-structed with two steps. First step is to determine its lay-out of nodes in the network, i.e., to specify the number ofcommunities NC, and the numbers of nodes of two typesincluded in each community NA and NB, as well as to as-sign group membership to these nodes. Next, determinethe dispersion of edges by specifying the intra-communityand intercommunity link probabilities, pin and pout, suchthat pin ≥ pout.For simplicity, all communities assume the same values
of NA and NB. We set NC=5, NA = 12 and NB = 8 asused in [26]. One may expect that as pin is markedlygreater than pout the networks instantiated from themodel have significant community structure that tendto be detected. Conversely, as pout approaches pin, thenetwork instantiations become more uniform and theirmodular structure becomes more obscured. In this ex-periment, pin is fixed with the value of 0.9 while poutvaried by tuning pout/pin from 0.1 to 1 with step 0.1. Wehave tested on such models the performance of MAGAas well as of SGA and MOGA, each instantiated with tennetworks. On each instantiation ran these algorithms tentimes.For evaluating the quality of solutions, modularity and
normalized mutual information (NMI) both are useful.But NMI is more suitable for current case since the op-timal (correct) division of the model network is knownin advance. This measure takes its maximum value of 1as the found division perfectly matches with the knowndivision while it takes 0 the minimum value as they aretotally independent of each other. Accordingly, we em-ployed the stop criteria that the algorithms reach thepredefined maximum generation or NMI reaches its max-imum value.Fig. 4 and Fig. 5 display the performance comparison
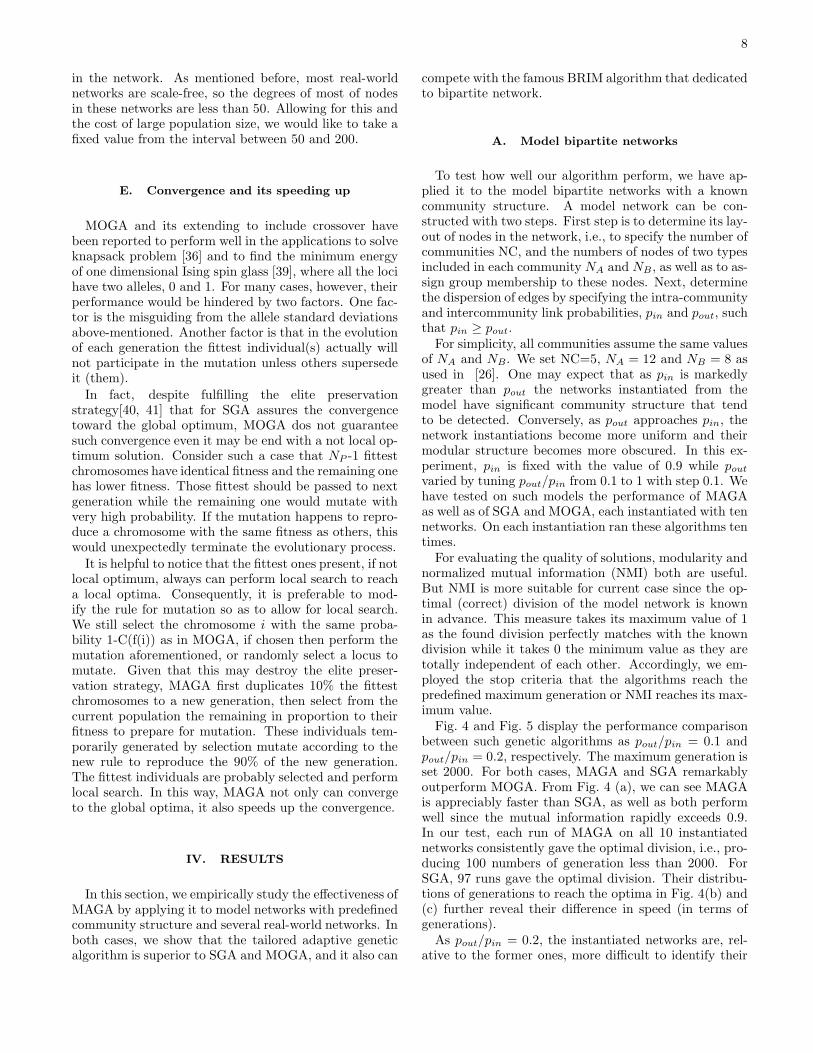
between such genetic algorithms as pout/pin = 0.1 andpout/pin = 0.2, respectively. The maximum generation isset 2000. For both cases, MAGA and SGA remarkablyoutperform MOGA. From Fig. 4 (a), we can see MAGAis appreciably faster than SGA, as well as both performwell since the mutual information rapidly exceeds 0.9.In our test, each run of MAGA on all 10 instantiatednetworks consistently gave the optimal division, i.e., pro-ducing 100 numbers of generation less than 2000. ForSGA, 97 runs gave the optimal division. Their distribu-tions of generations to reach the optima in Fig. 4(b) and(c) further reveal their difference in speed (in terms ofgenerations).As pout/pin = 0.2, the instantiated networks are, rel-
ative to the former ones, more difficult to identify their
9
0 20 40 60 80 100
50
100
150
200
250
300
350
400
450
Gen
erat
ion
0 20 40 60 80 100
0
200
400
600
800
1000
1200
1400
1600
1800Generation
Runs
Gen
erat
ion
(c)
(b)
(a)
0 100 200 300 400 5000.4
0.5
0.6
0.7
0.8
0.9
1.0
MAGA SGA MOGA
Runs M
utua
l Inf
orm
atio
n
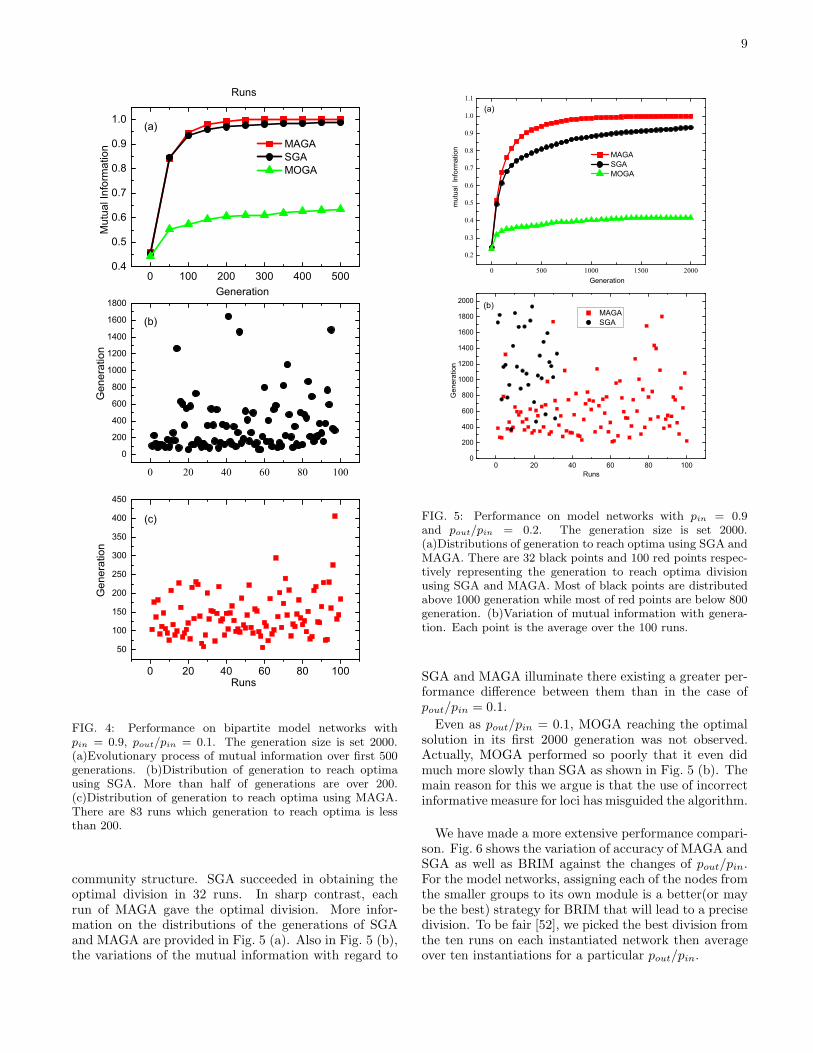
FIG. 4: Performance on bipartite model networks withpin = 0.9, pout/pin = 0.1. The generation size is set 2000.(a)Evolutionary process of mutual information over first 500generations. (b)Distribution of generation to reach optimausing SGA. More than half of generations are over 200.(c)Distribution of generation to reach optima using MAGA.There are 83 runs which generation to reach optima is lessthan 200.
community structure. SGA succeeded in obtaining theoptimal division in 32 runs. In sharp contrast, eachrun of MAGA gave the optimal division. More infor-mation on the distributions of the generations of SGAand MAGA are provided in Fig. 5 (a). Also in Fig. 5 (b),the variations of the mutual information with regard to
0 20 40 60 80 1000
200
400
600
800
1000
1200
1400
1600
1800
2000 (b)
MAGA SGA
Gen
erat
ion
Runs
0 500 1000 1500 2000
0.2
0.3
0.4
0.5
0.6
0.7
0.8
0.9
1.0
1.1(a)
MAGA SGA MOGA
mut
ual
Info
rmat
ion
Generation
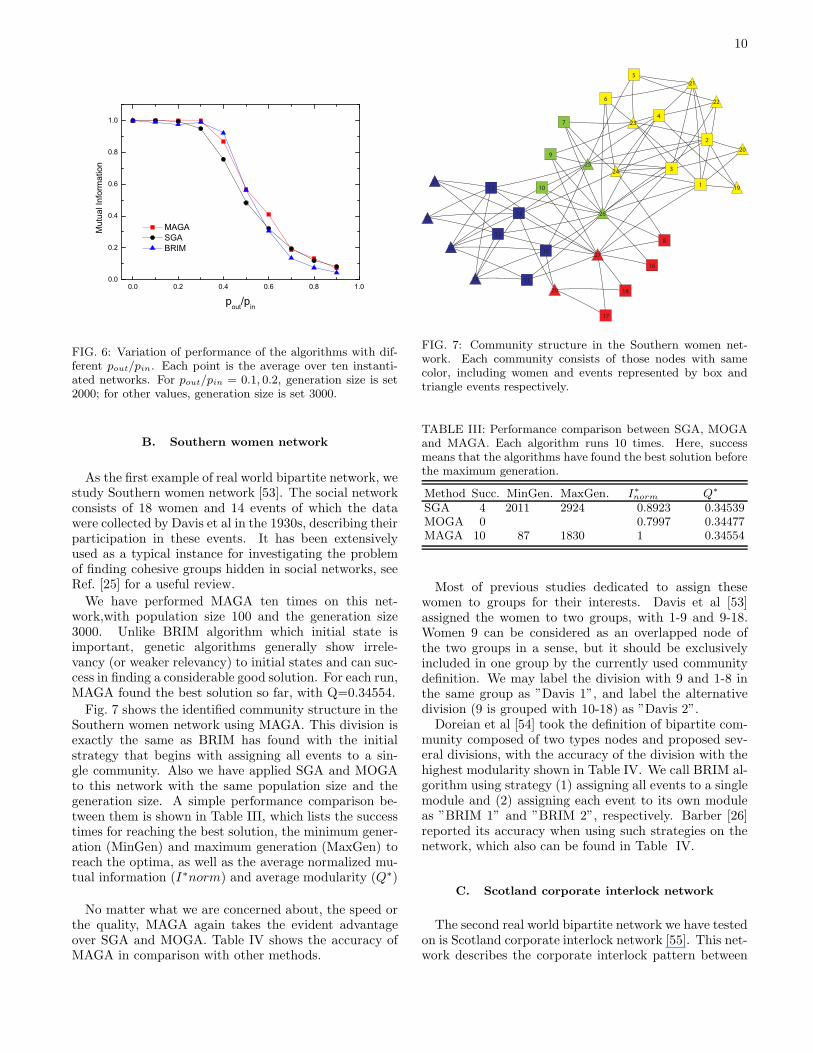
FIG. 5: Performance on model networks with pin = 0.9and pout/pin = 0.2. The generation size is set 2000.(a)Distributions of generation to reach optima using SGA andMAGA. There are 32 black points and 100 red points respec-tively representing the generation to reach optima divisionusing SGA and MAGA. Most of black points are distributedabove 1000 generation while most of red points are below 800generation. (b)Variation of mutual information with genera-tion. Each point is the average over the 100 runs.
SGA and MAGA illuminate there existing a greater per-formance difference between them than in the case ofpout/pin = 0.1.
Even as pout/pin = 0.1, MOGA reaching the optimalsolution in its first 2000 generation was not observed.Actually, MOGA performed so poorly that it even didmuch more slowly than SGA as shown in Fig. 5 (b). Themain reason for this we argue is that the use of incorrectinformative measure for loci has misguided the algorithm.
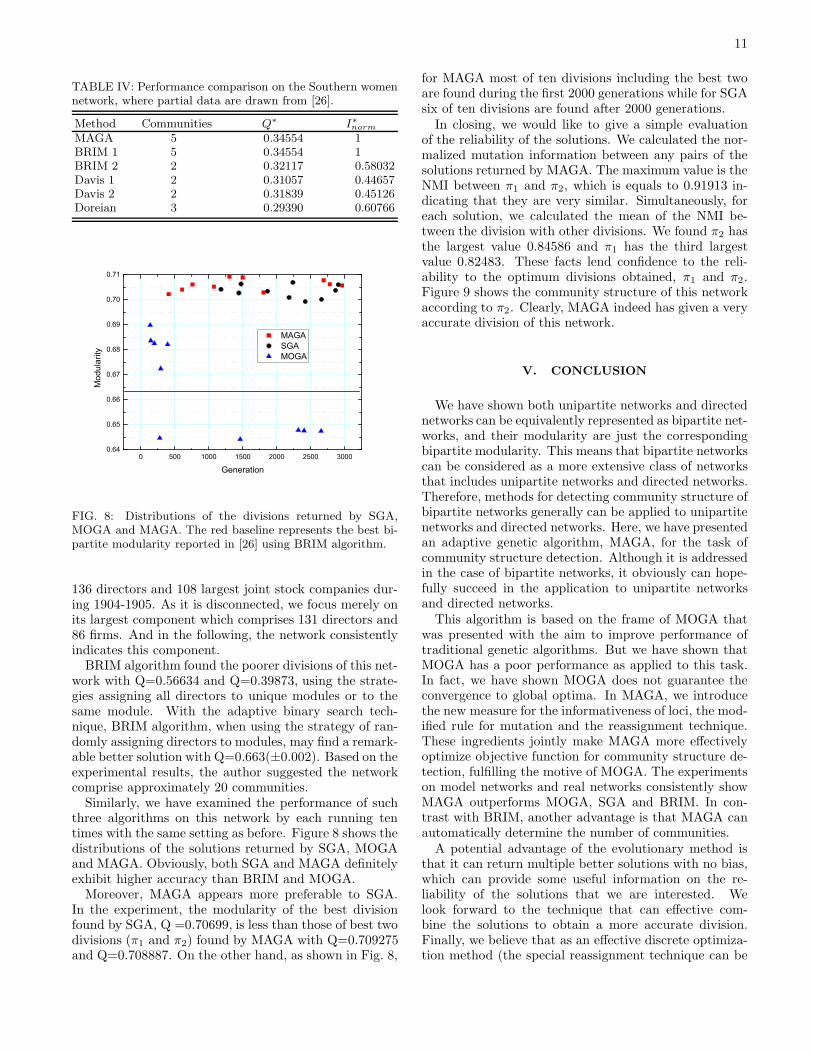
We have made a more extensive performance compari-son. Fig. 6 shows the variation of accuracy of MAGA andSGA as well as BRIM against the changes of pout/pin.For the model networks, assigning each of the nodes fromthe smaller groups to its own module is a better(or maybe the best) strategy for BRIM that will lead to a precisedivision. To be fair [52], we picked the best division fromthe ten runs on each instantiated network then averageover ten instantiations for a particular pout/pin.
10
0.0 0.2 0.4 0.6 0.8 1.00.0
0.2
0.4
0.6
0.8
1.0
M
utua
l Inf
orm
atio
n
pout/pin
MAGA SGA BRIM
FIG. 6: Variation of performance of the algorithms with dif-ferent pout/pin. Each point is the average over ten instanti-ated networks. For pout/pin = 0.1, 0.2, generation size is set2000; for other values, generation size is set 3000.
B. Southern women network
As the first example of real world bipartite network, westudy Southern women network [53]. The social networkconsists of 18 women and 14 events of which the datawere collected by Davis et al in the 1930s, describing theirparticipation in these events. It has been extensivelyused as a typical instance for investigating the problemof finding cohesive groups hidden in social networks, seeRef. [25] for a useful review.
We have performed MAGA ten times on this net-work,with population size 100 and the generation size3000. Unlike BRIM algorithm which initial state isimportant, genetic algorithms generally show irrele-vancy (or weaker relevancy) to initial states and can suc-cess in finding a considerable good solution. For each run,MAGA found the best solution so far, with Q=0.34554.
Fig. 7 shows the identified community structure in theSouthern women network using MAGA. This division isexactly the same as BRIM has found with the initialstrategy that begins with assigning all events to a sin-gle community. Also we have applied SGA and MOGAto this network with the same population size and thegeneration size. A simple performance comparison be-tween them is shown in Table III, which lists the successtimes for reaching the best solution, the minimum gener-ation (MinGen) and maximum generation (MaxGen) toreach the optima, as well as the average normalized mu-tual information (I∗norm) and average modularity (Q∗)
No matter what we are concerned about, the speed orthe quality, MAGA again takes the evident advantageover SGA and MOGA. Table IV shows the accuracy ofMAGA in comparison with other methods.
1
2
3
4
5
6
7
8
9
10
11
12
13
14
15
16
17
18
19
20
21
22
23
24
25
26
27
28
29
30
31
32
FIG. 7: Community structure in the Southern women net-work. Each community consists of those nodes with samecolor, including women and events represented by box andtriangle events respectively.
TABLE III: Performance comparison between SGA, MOGAand MAGA. Each algorithm runs 10 times. Here, successmeans that the algorithms have found the best solution beforethe maximum generation.
Method Succ. MinGen. MaxGen. I∗norm Q∗
SGA 4 2011 2924 0.8923 0.34539MOGA 0 0.7997 0.34477MAGA 10 87 1830 1 0.34554
Most of previous studies dedicated to assign thesewomen to groups for their interests. Davis et al [53]assigned the women to two groups, with 1-9 and 9-18.Women 9 can be considered as an overlapped node ofthe two groups in a sense, but it should be exclusivelyincluded in one group by the currently used communitydefinition. We may label the division with 9 and 1-8 inthe same group as ”Davis 1”, and label the alternativedivision (9 is grouped with 10-18) as ”Davis 2”.Doreian et al [54] took the definition of bipartite com-
munity composed of two types nodes and proposed sev-eral divisions, with the accuracy of the division with thehighest modularity shown in Table IV. We call BRIM al-gorithm using strategy (1) assigning all events to a singlemodule and (2) assigning each event to its own moduleas ”BRIM 1” and ”BRIM 2”, respectively. Barber [26]reported its accuracy when using such strategies on thenetwork, which also can be found in Table IV.
C. Scotland corporate interlock network
The second real world bipartite network we have testedon is Scotland corporate interlock network [55]. This net-work describes the corporate interlock pattern between
11
TABLE IV: Performance comparison on the Southern womennetwork, where partial data are drawn from [26].
Method Communities Q∗ I∗norm
MAGA 5 0.34554 1BRIM 1 5 0.34554 1BRIM 2 2 0.32117 0.58032Davis 1 2 0.31057 0.44657Davis 2 2 0.31839 0.45126Doreian 3 0.29390 0.60766
0 500 1000 1500 2000 2500 30000.64
0.65
0.66
0.67
0.68
0.69
0.70
0.71
MAGA SGA MOGA
Mod
ular
ity
Generation
FIG. 8: Distributions of the divisions returned by SGA,MOGA and MAGA. The red baseline represents the best bi-partite modularity reported in [26] using BRIM algorithm.
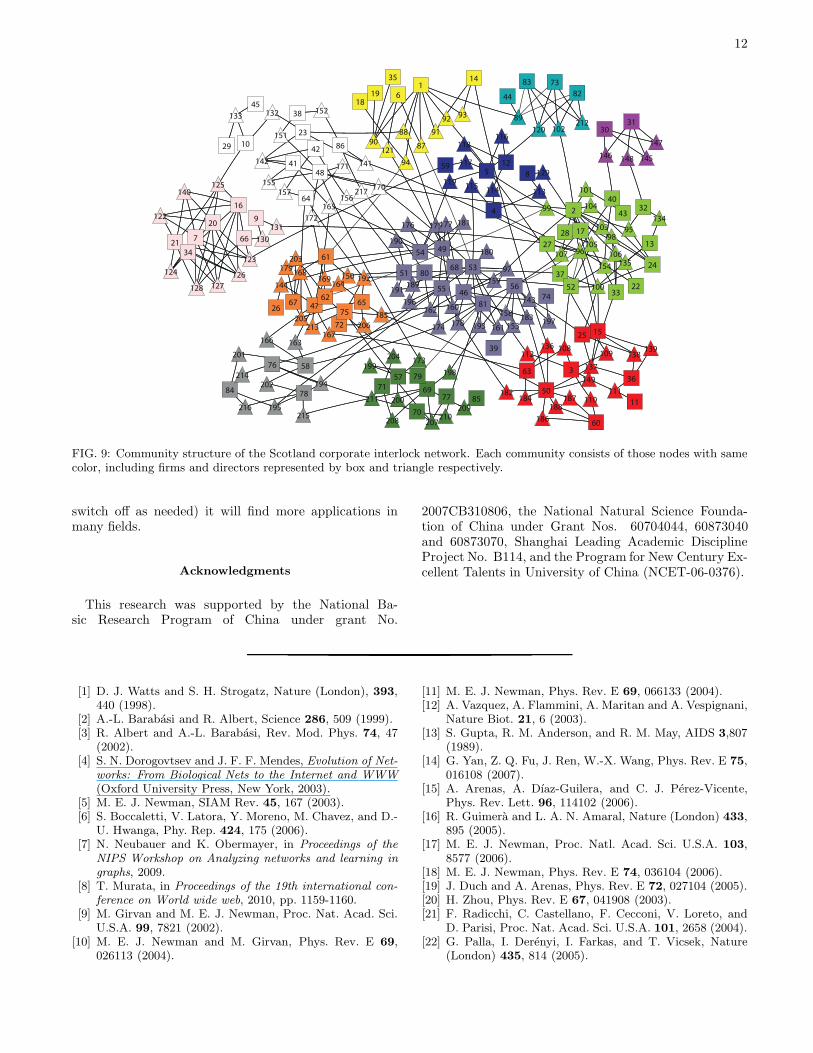
136 directors and 108 largest joint stock companies dur-ing 1904-1905. As it is disconnected, we focus merely onits largest component which comprises 131 directors and86 firms. And in the following, the network consistentlyindicates this component.BRIM algorithm found the poorer divisions of this net-
work with Q=0.56634 and Q=0.39873, using the strate-gies assigning all directors to unique modules or to thesame module. With the adaptive binary search tech-nique, BRIM algorithm, when using the strategy of ran-domly assigning directors to modules, may find a remark-able better solution with Q=0.663(±0.002). Based on theexperimental results, the author suggested the networkcomprise approximately 20 communities.Similarly, we have examined the performance of such
three algorithms on this network by each running tentimes with the same setting as before. Figure 8 shows thedistributions of the solutions returned by SGA, MOGAand MAGA. Obviously, both SGA and MAGA definitelyexhibit higher accuracy than BRIM and MOGA.Moreover, MAGA appears more preferable to SGA.
In the experiment, the modularity of the best divisionfound by SGA, Q =0.70699, is less than those of best twodivisions (π1 and π2) found by MAGA with Q=0.709275and Q=0.708887. On the other hand, as shown in Fig. 8,
for MAGA most of ten divisions including the best twoare found during the first 2000 generations while for SGAsix of ten divisions are found after 2000 generations.In closing, we would like to give a simple evaluation
of the reliability of the solutions. We calculated the nor-malized mutation information between any pairs of thesolutions returned by MAGA. The maximum value is theNMI between π1 and π2, which is equals to 0.91913 in-dicating that they are very similar. Simultaneously, foreach solution, we calculated the mean of the NMI be-tween the division with other divisions. We found π2 hasthe largest value 0.84586 and π1 has the third largestvalue 0.82483. These facts lend confidence to the reli-ability to the optimum divisions obtained, π1 and π2.Figure 9 shows the community structure of this networkaccording to π2. Clearly, MAGA indeed has given a veryaccurate division of this network.
V. CONCLUSION
We have shown both unipartite networks and directednetworks can be equivalently represented as bipartite net-works, and their modularity are just the correspondingbipartite modularity. This means that bipartite networkscan be considered as a more extensive class of networksthat includes unipartite networks and directed networks.Therefore, methods for detecting community structure ofbipartite networks generally can be applied to unipartitenetworks and directed networks. Here, we have presentedan adaptive genetic algorithm, MAGA, for the task ofcommunity structure detection. Although it is addressedin the case of bipartite networks, it obviously can hope-fully succeed in the application to unipartite networksand directed networks.This algorithm is based on the frame of MOGA that
was presented with the aim to improve performance oftraditional genetic algorithms. But we have shown thatMOGA has a poor performance as applied to this task.In fact, we have shown MOGA does not guarantee theconvergence to global optima. In MAGA, we introducethe new measure for the informativeness of loci, the mod-ified rule for mutation and the reassignment technique.These ingredients jointly make MAGA more effectivelyoptimize objective function for community structure de-tection, fulfilling the motive of MOGA. The experimentson model networks and real networks consistently showMAGA outperforms MOGA, SGA and BRIM. In con-trast with BRIM, another advantage is that MAGA canautomatically determine the number of communities.A potential advantage of the evolutionary method is
that it can return multiple better solutions with no bias,which can provide some useful information on the re-liability of the solutions that we are interested. Welook forward to the technique that can effective com-bine the solutions to obtain a more accurate division.Finally, we believe that as an effective discrete optimiza-tion method (the special reassignment technique can be
12
1
2
3
4
5
6
7
8
9
10
11
12
13
14
15
16
17
18
19
20
21
22
23
24
25
26
27
28
29
3031
32
33
34
35
36
37
38
39
40
41
42
43
4445
46
47
48
49
50
51
52
53
54
55 56
57
58
59
60
61
62
63
64
65
66
67
68
69
70
71
72
73
74
75
76
7778
79
80
81
82
83
84
85
86 87
88
89
90
91
9293
94
95
96
97
98
99
100
101
102
103
104
105
106107
108109
110
111
112
113114115
116
117
118
119
120
121
122
123
124
125
126
127128
129
130
131
132133
134
135
136
137
138139
140
141142
143
144
145146
147
148
149
150
151
152
153
154
155
156157
158
159
160
161
162
163
164
165
166167
168169
170
171
172
173
174
175176 177
178
179
180
181
182
183
184
185
186
187
188
189
190
191
192
193
194
195
196
197
198199
200
201
202
203
204
205206
207208
209
210
211
212
213
214
215
216
217
FIG. 9: Community structure of the Scotland corporate interlock network. Each community consists of those nodes with samecolor, including firms and directors represented by box and triangle respectively.
switch off as needed) it will find more applications inmany fields.
Acknowledgments
This research was supported by the National Ba-sic Research Program of China under grant No.
2007CB310806, the National Natural Science Founda-tion of China under Grant Nos. 60704044, 60873040and 60873070, Shanghai Leading Academic DisciplineProject No. B114, and the Program for New Century Ex-cellent Talents in University of China (NCET-06-0376).
[1] D. J. Watts and S. H. Strogatz, Nature (London), 393,440 (1998).
[2] A.-L. Barabasi and R. Albert, Science 286, 509 (1999).[3] R. Albert and A.-L. Barabasi, Rev. Mod. Phys. 74, 47
(2002).[4] S. N. Dorogovtsev and J. F. F. Mendes, Evolution of Net-
works: From Biological Nets to the Internet and WWW
(Oxford University Press, New York, 2003).[5] M. E. J. Newman, SIAM Rev. 45, 167 (2003).[6] S. Boccaletti, V. Latora, Y. Moreno, M. Chavez, and D.-
U. Hwanga, Phy. Rep. 424, 175 (2006).[7] N. Neubauer and K. Obermayer, in Proceedings of the
NIPS Workshop on Analyzing networks and learning in
graphs, 2009.[8] T. Murata, in Proceedings of the 19th international con-
ference on World wide web, 2010, pp. 1159-1160.[9] M. Girvan and M. E. J. Newman, Proc. Nat. Acad. Sci.
U.S.A. 99, 7821 (2002).[10] M. E. J. Newman and M. Girvan, Phys. Rev. E 69,
026113 (2004).
[11] M. E. J. Newman, Phys. Rev. E 69, 066133 (2004).[12] A. Vazquez, A. Flammini, A. Maritan and A. Vespignani,
Nature Biot. 21, 6 (2003).[13] S. Gupta, R. M. Anderson, and R. M. May, AIDS 3,807
(1989).[14] G. Yan, Z. Q. Fu, J. Ren, W.-X. Wang, Phys. Rev. E 75,
016108 (2007).[15] A. Arenas, A. Dıaz-Guilera, and C. J. Perez-Vicente,
Phys. Rev. Lett. 96, 114102 (2006).[16] R. Guimera and L. A. N. Amaral, Nature (London) 433,
895 (2005).[17] M. E. J. Newman, Proc. Natl. Acad. Sci. U.S.A. 103,
8577 (2006).[18] M. E. J. Newman, Phys. Rev. E 74, 036104 (2006).[19] J. Duch and A. Arenas, Phys. Rev. E 72, 027104 (2005).[20] H. Zhou, Phys. Rev. E 67, 041908 (2003).[21] F. Radicchi, C. Castellano, F. Cecconi, V. Loreto, and
D. Parisi, Proc. Nat. Acad. Sci. U.S.A. 101, 2658 (2004).[22] G. Palla, I. Derenyi, I. Farkas, and T. Vicsek, Nature
(London) 435, 814 (2005).
13
[23] E. A. Leicht and M. E. J. Newman, Phys. Rev. Lett. 100,118703 (2008).
[24] R. Guimera, M. Sales-Pardo, and L. A. N. Amaral, Phys.Rev. E 76, 036102 (2007).
[25] L. C. Freeman, in Dynamic Social Network Modelingand Analysis: Workshop Summary and Papers, editedby R. Breiger, C. Carley, and P. Pattison (The NationalAcademies Press, Washington, DC, 2003), pp. 39-97.
[26] M. J. Barber, Phys. Rev. E 76, 066102 (2007).[27] L. Danon, A. Dıaz-Guilera, J. Duch and A. Arenas, J.
Stat. Mech. (2005) P09008.[28] S. Fortunato, Phys. Rep. 486, 75 (2010).[29] S. Fortunato and M. Barthelemy, Proc. Nat. Acad. Sci.
U.S.A. 104, 36 (2007).[30] J. M. Kumpula, J. Saramaki, K. Kaski, and J. Kertesz,
Eur. Phys. J. B 56, 41 (2007).[31] B. H. Good, Y.-A. deMontjoye and A. Clauset, Phys.
Rev. E 81, 046106(2010).[32] A. Arenas, J. Duch, A. Fernandez, and S. Gomez, New
J. Phys. 9, 176 (2007).[33] U. Brandes, D. Delling, M. Gaertler, R. Gorke, M. Hoe-
fer, Z. Nikoloski, and D. Wagner, IEEE Tran. on Know.and Data Eng. 20, 2 (2008).
[34] J. H. Holland, Adaptation in natural and artificial sys-tems (University of Michigan Press, 1975)
[35] G. Agarwal, D. Kempe, Eur. Phys. J. B, 66, 409 (2008).[36] K. Y. Szeto and J. Zhang, in Lecture Notes in Computer
Science, edited by I. Lirkov, S. Margenov, and J. Was-niewski (Springer-Verlag, 2006), Vol. 3743, pp. 189-196.
[37] B. Brinkmann et al, Am. J. Hum. Genet 62, 1408 (1998).[38] C. W. Ma and K. Y. Szeto, in Proceedings of the Inter-
national Conference on Recent Advances in Soft Com-
puting, Nottingham, 2004, edited by L. Lofti (Springer-Verlag, 2004), pp.410-415.
[39] N. L. Law and K. Y. Szeto, in Proceeding of the Inter-
national Joint Conference on Artifical Intelligence, Hy-
derabad, 2007, edited by Manuela Veloso (AAAI Press,2007), pp. 2330-2334.
[40] J. c. Bean, ORSA J. Comput. 6, 154(1994).[41] From the discussion in IIIA, MOGA will duplicate the
fittest individual(s) to a next generation.[42] F. Lorrain and H. White, J. Math. Sociol. 1, 49 (1971).
[43] K. A. De Jong, Ph. D. thesis, University of Michigan,1975.
[44] M. Tasgin and H. Bingol, arXiv:0711.0491v1.[45] C. Pizzuti, in Lecture Notes in Computer Sciences, edited
by G. Rudolph et al (Springer-Verlag, 2008), Vol. 5199,pp. 1081-1090.
[46] Y. Park, M. Song, in Proceedings of the Annual Confer-
ence on Genetic Programming, Wisconsin, 1998, editedby J. R. Koza et al (Morgan Kaufmann, 1998), pp. 568-575.
[47] J. J. Grefenstette, IEEE T on Systems, Man, Cybernetics16, 1 (1986).
[48] D. E. Goldberg, in Proceedings of the 3rd International
Conference on Genetic Algorithms, edited by J. Schaffer(Morgan Kaufmann Publishers, Los Altos, CA, 1989),pp. 70-79.
[49] J. Arabas, Z. Michalewicz, J. Mulawka, in Proceedings of
the 1st IEEE Conference on Evolutionary Computation,edited by D.B. Fogel (IEEE Press, Los Altos, 1994), pp.73-78.
[50] M. Affenzeller, S. Wagner, and S. Winkler, in Lecture
Notes in Computer Science, edited by R. Moreno-Dıaz,F. Pichler and A. Quesada-Arencibia (Springer-Verlag,Berlin, Heidelberg 2007), Vol. 3749, pp. 820-828.
[51] T. Hu, S. Harding and W. Banzhaf, Genetic Program-ming and Evolvable Machines, 11 2 (2010).
[52] Picking the best one of the run on each instantiations isreasonable because the population size are moderate sothat it can be increased and hence improving the accu-racy of each run; that is, we adopted a better strategy asBRIM do.
[53] A. Davis, B. B. Gardner, and M. R. Gardner, Deep
South (University of Chicago Press, Chicago, 1941).[54] P. Doreian, V. Batagelj and A. Ferligoj, Soc. Networks
26, 29 (2004).[55] J. Scott and M. Hughes, The Anatomy of Scottish
Capital: Scottish Companies and Scottish Capital,1900-
1979 (Croom Helm, London, 1980).[56] A. Clauset, M. E. J. Newman and C. Moore, Phys. Rev.
E 70, 066111 (2004).


