Embed Size (px)
Citation preview

Hepatocyte Transplantation

M E T H O D S I N M O L E C U L A R B I O L O G Y TM
John M. Walker, SERIES EDITOR
502. Bacteriophages: Methods and Protocols, Volume 2: Mole-cular and Applied Aspects, edited by Martha R. J. Clokieand Andrew M. Kropinski 2009
501. Bacteriophages: Methods and Protocols, Volume 1: Isola-tion, Characterization, and Interactions, edited byMartha R. J. Clokie and Andrew M. Kropinski 2009
496. DNA and RNA Profiling in Human Blood: Methodsand Protocols, edited by Peter Bugert, 2009
493. Auditory and Vestibular Research: Methods and Proto-cols, edited by Bernd Sokolowski, 2009
490. Protein Structures, Stability, and Interactions, editedby John W. Schriver, 2009
489. Dynamic Brain Imaging: Methods and Protocols, editedby Fahmeed Hyder, 2009
485. HIV Protocols: Methods and Protocols, edited byVinayaka R. Prasad and Ganjam V. Kalpana, 2009
484. Functional Proteomics: Methods and Protocols, editedby Julie D. Thompson, Christine Schaeffer-Reiss, andMarius Ueffing, 2008
483. Recombinant Proteins From Plants: Methods and Pro-tocols, edited by Loic Faye and Veronique Gomord, 2008
482. Stem Cells in Regenerative Medicine: Methods andProtocols, edited by Julie Audet and William L.Stanford, 2008
481. Hepatocyte Transplantation: Methods and Protocols,edited by Anil Dhawan and Robin D. Hughes, 2009
480. Macromolecular Drug Delivery: Methods and Proto-cols, edited by Mattias Belting, 2008
479. Plant Signal Transduction: Methods and Protocols, edi-ted by Thomas Pfannschmidt, 2008
478. Transgenic Wheat, Barley and Oats: Production andCharacterization Protocols, edited by Huw D. Jonesand Peter R. Shewry, 2008
477. Advanced Protocols in Oxidative Stress I, edited byDonald Armstrong, 2008
476. Redox-Mediated Signal Transduction: Methods andProtocols, edited by John T. Hancock, 2008
475. Cell Fusion: Overviews and Methods, edited by Eliza-beth H. Chen, 2008
474. Nanostructure Design: Methods and Protocols, editedby Ehud Gazit and Ruth Nussinov, 2008
473. Clinical Epidemiology: Practice and Methods, editedby Patrick Parfrey and Brendon Barrett, 2008
472. Cancer Epidemiology, Volume 2: Modifiable Factors,edited by Mukesh Verma, 2008
471. Cancer Epidemiology, Volume 1: Host SusceptibilityFactors, edited by Mukesh Verma, 2008
470. Host-Pathogen Interactions: Methods and Protocols,edited by Steffen Rupp and Kai Sohn, 2008
469. Wnt Signaling, Volume 2: Pathway Models, edited byElizabeth Vincan, 2008
468. Wnt Signaling, Volume 1: Pathway Methods andMammalian Models, edited by Elizabeth Vincan, 2008
467. Angiogenesis Protocols: Second Edition, edited byStewart Martin and Cliff Murray, 2008
466. Kidney Research: Experimental Protocols, edited byTim D. Hewitson and Gavin J. Becker, 2008
465. Mycobacteria, Second Edition, edited by Tanya Par-ish and Amanda Claire Brown, 2008
464. The Nucleus, Volume 2: Physical Properties and Ima-ging Methods, edited by Ronald Hancock, 2008
463. The Nucleus, Volume 1: Nuclei and Subnuclear Com-ponents, edited by Ronald Hancock, 2008
462. Lipid Signaling Protocols, edited by BanafsheLarijani, Rudiger Woscholski, and Colin A. Rosser,2008
461. Molecular Embryology: Methods and Protocols, Sec-ond Edition, edited by Paul Sharpe and Ivor Mason,2008
460. Essential Concepts in Toxicogenomics, edited byDonna L. Mendrick and William B. Mattes, 2008
459. Prion Protein Protocols, edited by Andrew F. Hill,2008
458. Artificial Neural Networks: Methods and Applications,edited by David S. Livingstone, 2008
457. Membrane Trafficking, edited by Ales Vancura, 2008
456. Adipose Tissue Protocols, Second Edition, edited byKaiping Yang, 2008
455. Osteoporosis, edited by Jennifer J.Westendorf, 2008
454. SARS- and Other Coronaviruses: Laboratory Protocols,edited by Dave Cavanagh, 2008
453. Bioinformatics, Volume 2: Structure, Function, andApplications, edited by Jonathan M. Keith, 2008
452. Bioinformatics, Volume 1: Data, Sequence Analysis,and Evolution, edited by Jonathan M. Keith, 2008
451. Plant Virology Protocols: From Viral Sequenceto Protein Function, edited by Gary Foster, Eli-sabeth Johansen, Yiguo Hong, and Peter Nagy,2008
450. Germline Stem Cells, edited by Steven X. Hou andShree Ram Singh, 2008
449. Mesenchymal Stem Cells: Methods and Protocols, edi-ted by Darwin J. Prockop, Douglas G. Phinney, andBruce A. Brunnell, 2008
448. Pharmacogenomics in Drug Discovery and Develop-ment, edited by Qing Yan, 2008
447. Alcohol: Methods and Protocols, edited by Laura E.Nagy, 2008
446. Post-translational Modifications of Proteins: Tools forFunctional Proteomics, Second Edition, edited byChristoph Kannicht, 2008
445. Autophagosome and Phagosome, edited by VojoDeretic, 2008
444. Prenatal Diagnosis, edited by Sinhue Hahn and LairdG. Jackson, 2008
443. Molecular Modeling of Proteins, edited by AndreasKukol, 2008
M E T H O D S I N M O L E C U L A R B I O L O G YTM
Hepatocyte TransplantationMethods and Protocols
Edited by
Anil DhawanKing’s College Hospital, London, UK
Robin D. HughesKing’s College London, School of Medicine
London, UK

EditorsAnil DhawanKing’s College HospitalLondon, [email protected]
Robin D. HughesKing’s College LondonSchool of MedicineLondon, [email protected]
Series EditorJohn M. WalkerUniversity of HertfordshireHatfield, Herts.UK
ISBN: 978-1-58829-883-6 e-ISBN: 978-1-59745-201-4ISSN: 1064-3745 e-ISSN: 1940-6029DOI 10.1007/978-1-59745-201-4
Library of Congress Control Number: 2008939645
# Humana Press, a part of Springer ScienceþBusiness Media, LLC 2009All rights reserved. This work may not be translated or copied in whole or in part without the written permission of thepublisher (Humana Press, c/o Springer Science+BusinessMedia, LLC, 233 Spring Street, NewYork, NY 10013, USA),except for brief excerpts in connection with reviews or scholarly analysis. Use in connection with any form ofinformation storage and retrieval, electronic adaptation, computer software, or by similar or dissimilar methodologynow known or hereafter developed is forbidden.The use in this publication of trade names, trademarks, service marks, and similar terms, even if they are not identifiedas such, is not to be taken as an expression of opinion as to whether or not they are subject to proprietary rights.
Cover illustration: Figure 1 from chapter 15
Printed on acid-free paper
9 8 7 6 5 4 3 2 1
springer.com

Preface
Cellular therapy using human hepatocytes is being evaluated worldwide as analternative to organ transplantation in patients with liver-based metabolic disease andacute liver failure. The basis for clinical use has come from the demonstration of efficacyin animal models of acute and chronic liver disease.
Protocols have been developed for the isolation of hepatocytes from liver tissueunder GMP conditions and also for improved methods of cryopreservation, so hepa-tocytes can be stored for later clinical use. Assays are used to assess the quality andfunction of the hepatocytes prior to transplantation. There are clinical protocols foradministration of cells directly into the patient’s liver.
The engraftment of donor cells in the recipient liver can be detected by DNAtechniques or functional proteins in the case of genetic liver disorders. In vivo methodsare needed to track the fate of hepatocytes after transplantation.
Due to the shortage of donor organs, the future of hepatocyte transplantation willbe alternative sources of liver cells such as foetal hepatoblasts or stem cell-derivedhepatocytes. Methods for culture and in vitro proliferation of stem cells will beimportant for their application.
It is hoped that this volume from the experts in the field provides the reader with thepractical protocols to enable them to perform and investigate hepatocyte transplanta-tion. Needless to say this is a rapidly developing field, and new and improved techni-ques are being developed all the time.
Anil Dhawan & Robin D. Hughes
v

Acknowledgements
To my wife Anita and boys Atin and Ashish for their understanding, love andsupport that they have provided throughout my career.
Sincere thanks to all the contributors.Particular thanks to Professor Nigel Heaton, Mr Mohamed Rela, Liver Transplant
Coordinators, and Dr Ragai Mitry for helping establish the hepatocyte transplantationprogramme at King’s College Hospital.
Anil Dhawan
vii

Contents
Preface . . . . . . . . . . . . . . . . . . . . . . . . . . . . . . . . . . . . . . . . . . . . . . . . . . . . . . . . . . . . . . v
Acknowledgements . . . . . . . . . . . . . . . . . . . . . . . . . . . . . . . . . . . . . . . . . . . . . . . . . . . .vii
Contributors . . . . . . . . . . . . . . . . . . . . . . . . . . . . . . . . . . . . . . . . . . . . . . . . . . . . . . . . . xi
Color Plates . . . . . . . . . . . . . . . . . . . . . . . . . . . . . . . . . . . . . . . . . . . . . . . . . . . . . . . . . xv
1 Human Hepatocyte Transplantation Overview . . . . . . . . . . . . . . . . . . . . . . . . . . .1Juliana Puppi and Anil Dhawan
2 Isolation of Human Hepatocytes . . . . . . . . . . . . . . . . . . . . . . . . . . . . . . . . . . . . .17Ragai R. Mitry
3 An Optimised Method for Cryopreservation of Human Hepatocytes . . . . . . . . .25Claire Terry and Robin D. Hughes
4 Liver Cell Culture Techniques . . . . . . . . . . . . . . . . . . . . . . . . . . . . . . . . . . . . . . .35Jose V. Castell and Marıa Jose Gomez-Lechon
5 In Vitro Assays for Induction of Drug Metabolism . . . . . . . . . . . . . . . . . . . . . . .47Brian G. Lake, Roger J. Price, Amanda M. Giddings,and David G. Walters
6 Hepatocyte Apoptosis . . . . . . . . . . . . . . . . . . . . . . . . . . . . . . . . . . . . . . . . . . . . .59Mustapha Najimi, Francoise Smets, and Etienne Sokal
7 Small Animal Models of Hepatocyte Transplantation . . . . . . . . . . . . . . . . . . . . .75Jurgen Seppen, Ebtisam El Filali, and Ronald Oude Elferink
8 Hepatocyte Transplantation Techniques: Large Animal Models . . . . . . . . . . . . .83Anne Weber, Marie-Therese Groyer-Picard, and Ibrahim Dagher
9 Cell Transplant Techniques: Engraftment Detection of Cells . . . . . . . . . . . . . . .97Robert A. Fisher and Valeria R. Mas
10 Hepatic Preconditioning for Transplanted Cell Engraftmentand Proliferation . . . . . . . . . . . . . . . . . . . . . . . . . . . . . . . . . . . . . . . . . . . . . . . .107Yao-Ming Wu and Sanjeev Gupta
11 Ex Vivo Gene Transfer into Hepatocytes . . . . . . . . . . . . . . . . . . . . . . . . . . . . . .117Xia Wang, Prashant Mani, Debi P. Sarkar, Namita Roy-Chowdhury,and Jayanta Roy-Chowdhury
12 Sources of Adult Hepatic Stem Cells: Haematopoietic . . . . . . . . . . . . . . . . . . .141Rosemary Jeffery, Richard Poulsom, and Malcolm R. Alison
13 Production of Hepatocyte-Like Cells from Human Amnion . . . . . . . . . . . . . . .155Toshio Miki, Fabio Marongiu, Ewa C.S. Ellis, Ken Dorko,Keitaro Mitamura, Aarati Ranade, Roberto Gramignoli,Julio Davila, and Stephen C. Strom
14 Generation of Hepatocytes from Human Embryonic Stem Cells . . . . . . . . . . .169Niloufar Safinia and Stephen L Minger
ix
15 Isolation, In Vitro Cultivation and Characterisation of FoetalLiver Cells . . . . . . . . . . . . . . . . . . . . . . . . . . . . . . . . . . . . . . . . . . . . . . . . . . . . .181Yue Wu, Chetan C. Shatapathy, and Stephen L. Minger
16 Human Intrahepatic Biliary Epithelial Cell Lineages: Studies In Vitro . . . . . . .193Ruth Joplin and Stivelia Kachilele
17 Liver Cell Labelling with MRI Contrast Agents . . . . . . . . . . . . . . . . . . . . . . . .207Michel Modo, Thomas J. Meade, and Ragai R. Mitry
18 Microbiological Monitoring of Hepatocyte Isolation in the GMPLaboratory . . . . . . . . . . . . . . . . . . . . . . . . . . . . . . . . . . . . . . . . . . . . . . . . . . . . .221Sharon C. Lehec
Index . . . . . . . . . . . . . . . . . . . . . . . . . . . . . . . . . . . . . . . . . . . . . . . . . . . . . . . . . . . . .229
x Contents

Contributors
MALCOLM R. ALISON . Centre for Diabetes and Metabolic Medicine, ICMS, Bart’s andThe London School of Medicine, London, UK
JOSE V. CASTELL . Unit of Experimental Hepatology, University Hospital ‘‘La Fe’’,Valencia, Spain
IBRAHIM DAGHER . Inserm U 804; University Paris-Sud, Hopital de Bicetre,Kremlin-Bicetre, and Service de Chirurgie Generale, Hopital Beclere, Clamart,France
JULIO DAVILA . Pfizer, Inc., St. Louis Mo, USAANIL DHAWAN . Paediatric Liver Centre, King’s College Hospital, Denmark Hill,
London, UKEBTISAM EL FILALI . AMC Liver center, Amsterdam, The NetherlandsKEN DORKO . Departments of Pathology and Surgery and McGowan Institute
for Regenerative Medicine, University of Pittsburgh, USAEWA C.S. ELLIS . Departments of Pathology and Surgery and McGowan Institute
for Regenerative Medicine, University of Pittsburgh, USAROBERT A. FISHER . Department of Surgery, Transplantation Division, Virginia
Commonwealth University, Medical College of Virginia Hospitals, Richmond,Virginia, USA
DOMINIQUE FRANCO . Inserm U 804; University Paris-Sud, Hopital de Bicetre,Kremlin-Bicetre, and Service de Chirurgie Generale, Hopital Beclere, Clamart, France
AMANDA M. GIDDINGS . BIBRA International, Carshalton, Surrey and Centre forToxicology, Faculty of Health and Medical Sciences, University of Surrey, Guildford,UK
MARIA JOSE GOMEZ-LECHON . Unit of Experimental Hepatology, University Hospital ‘‘LaFe’’, Valencia, Spain
ROBERTO GRAMIGNOLI . Departments of Pathology and Surgery and McGowan Institutefor Regenerative Medicine, University of Pittsburgh, USA
MARIE-THERESE GROYER-PICARD . Inserm U 804; University Paris-Sud, Hopital de Bicetre,Kremlin-Bicetre, France
SANJEEV GUPTA . Marion Bessin Liver Research Center, Diabetes Center, Cancer ResearchCenter, Departments of Medicine and Pathology, and Institute for Clinical andTranslational Research, Albert Einstein College of Medicine, New York, USA
ROBIN D. HUGHES . Institute of Liver Studies, King’s College London School of Medicine,London, UK
ROSEMARY JEFFERY . Histopathology Unit, Cancer Research UK, London ResearchInstitute, London, UK
RUTH JOPLIN . Liver Research Laboratories, Institute of Biomedical Research, Universityof Birmingham Medical School, Birmingham, UK
xi

STIVELIA KACHILELE . Liver Research Laboratories, Institute of Biomedical Research,University of Birmingham Medical School, Birmingham, UK
BRIAN G. LAKE . BIBRA International, Carshalton, Surrey, and Centre for Toxicology,Faculty of Health and Medical Sciences, University of Surrey, Guildford, UK
SHARON C. LEHEC . Institute of Liver Studies, King’s College Hospital, London, UKPRASHANT MANI . Department of Biochemistry, Delhi University South Campus, New
Delhi, IndiaFABIO MARONGIU . Departments of Pathology and Surgery and McGowan Institute
for Regenerative Medicine, University of Pittsburgh, USAVALERIA R. MAS . Department of Surgery, Transplantation Division and Department
of Pathology, Division of Molecular Diagnostics, Virginia Commonwealth University,Medical College of Virginia Hospitals, Richmond, Virginia, USA
THOMAS J. MEADE . Departments of Chemistry, Biochemistry, Molecular and Cell Biology,Neurobiology and Physiology, Northwestern University, Evanston, USA
TOSHIO MIKI . Departments of Pathology and Surgery and McGowan Institute forRegenerative Medicine, University of Pittsburgh, USA
STEPHEN L MINGER . Stem Cell Biology Laboratory, Wolfson Centre for Age-RelatedDiseases Kings College London, London, UK
KEITARO MITAMURA . Departments of Pathology and Surgery and McGowan Institutefor Regenerative Medicine, University of Pittsburgh, USA
RAGAI R. MITRY . Institute of Liver Studies, King’s College Hospital, London, UKMICHEL MODO . Centre for the Cellular Basis of Behaviour, Institute of Psychiatry, King’s
College London, UKMUSTAPHA NAJIMI . Universite Catholique de Louvain, Laboratory of Pediatric Hepatology
& Cell Therapy, Brussels, BelgiumRONALD OUDE ELFERINK . AMC Liver Center, Amsterdam, The NetherlandsRICHARD POULSOM . Histopathology Unit, Cancer Research UK, London Research
Institute, London, UKROGER J. PRICE . BIBRA International, Carshalton, Surrey and Centre for Toxicology,
School of Biomedical and Molecular Sciences, University of Surrey, Guildford, UKJULIANA PUPPI . Institute of Liver Studies, King’s College London School of Medicine
London, UKAARATI RANADE . Departments of Pathology and Surgery and McGowan Institute
for Regenerative Medicine, University of Pittsburgh, USANAMITA ROY-CHOWDHURY . Departments of Medicine and Molecular Genetics, and the
Marion Bessin Liver Research Center, Albert Einstein College of Medicine, New York,USA
JAYANTA ROY-CHOWDHURY . Departments of Medicine and Molecular Genetics, and theMarion Bessin Liver Research Center, Albert Einstein College of Medicine, New York,USA
NILOUFAR SAFINIA . Stem Cell Biology Laboratory, Wolfson Centre for Age-RelatedDiseases Kings College London, London, UK
DEBI P. SARKAR . Department of Biochemistry, Delhi University South Campus, NewDelhi, India
JURGEN SEPPEN . AMC Liver Center, Amsterdam, The Netherlands
xii Contributors

CHETAN C. SHATAPATHY . Stem Cell Biology Laboratory, Wolfson Centre for Age-RelatedDiseases, King’s College London, London, UK
FRANCOISE SMETS . Universite Catholique de Louvain, Laboratory of Pediatric Hepatology& Cell Therapy, Brussels, Belgium
ETIENNE SOKAL . Universite Catholique de Louvain, Laboratory of Pediatric Hepatology& Cell Therapy, Brussels, Belgium
STEPHEN C. STROM . Departments of Pathology and Surgery and McGowan Institutefor Regenerative Medicine, University of Pittsburgh, USA
CLAIRE TERRY . Institute of Liver Studies, King’s College London School of MedicineLondon, UK
DAVID G. WALTERS . BIBRA International, Carshalton, Surrey, and Centrefor Toxicology, Faculty of Health and Medical Sciences, University of Surrey,Guildford, UK
XIAWANG . Departments of Medicine and Molecular Genetics, and the Marion BessinLiver Research Center, Albert Einstein College of Medicine, New York
ANNEWEBER . Inserm U 804; University Paris-Sud, Hopital de Bicetre, Kremlin-Bicetre,France
YAO-MING WU . Department of Surgery, National Taiwan University Hospital, Taipei,Taiwan
YUE WU . Stem Cell Biology Laboratory, Wolfson Centre for Age-Related Diseases, King’sCollege London, London, UK
Contributors xiii

Color Plates
Color Plate 1: Apoptotic nuclei and bodies observed in mouse primary hepatocyte cultures afterstaurosporine treatment (white arrows). Freshly isolated mouse hepatocytes wereplated for 24 h on a collagen type I-coated coverslips in well plates and treated for4 h with 1 mM staurosporine. Cells were thereafter fixed with 4% of formaldehyde for20 min at room temperature, stained with DAPI for 30 min and analyzed using afluorescence microscopy. (see discussion on p. 63)
Color Plate 2: Condensation of chromatin at the periphery of the nucleus in apoptotic mouse hepa-tocytes (black arrows). (A) Primary mouse hepatocytes were plated for 24 h in a coatedcollagen type I well plates and treated for 4 h with 1 mM staurosporine. Cells werethereafter fixed with 4% formaldehyde for 20 min at room temperature and stained withHE for 10 min. (B) slice of mouse liver prefixed with formaldehyde, paraffin-embeddedand HE-stained. (see discussion on p. 65)
Color Plate 3: Transplantation of autologous hepatocytes into Macaca mulatta after retroviral-mediated gene marking. (A) Protocol for simian hepatocyte isolation, retroviral trans-duction and transplantation. Hepatocyte transduction with HIV-1-derived lentivirusvectors avoids the culture steps. They are transduced in suspension and transplanted.(B) Hepatocytes are transplanted via the infusion chamber. (C) Freshly isolated simianhepatocytes at confluency after 3 days of culture. (D) Transduced hepatocytes inculture expressing the b-galactosidase. (E) Thawed hepatocytes after 3 days of culture.(see discussion on p. 90)
Color Plate 4: Liver preconditioning using monocrotaline (MCT) for improving cell engraft-ment in DPPIV– rats. Transplanted F344 rat hepatocytes are shown in the recipientliver 4 and 7 days after cell transplantation. Panel a shows 1–3 transplanted hepatocyteswith histochemically visualized DPPIV activity (red color, arrows) in periportal areas(Pa). By contrast, in MCT-treated rats (b) several-fold more transplanted cells arepresent. Original magnification, �200; hematoxylin counterstain. Modified fromJoseph B, et al. (20). (see discussion on p. 111)
Color Plate 5: Analysis of the kinetics of liver repopulation in DPPIV– rats preconditioned withretrorsine and partial hepatectomy. Foci of transplanted cells with DPPIV activity(red color) are seen 2 (a), 3 (b), and 4 weeks (c) after cell transplantation. Morpho-metric analysis of liver repopulation in panel d indicates linear increase in liver repopu-lation during this period. Original magnification, (a–c), �40; hematoxylincounterstain. Modified from Wu Y-M et al. 18. (see discussion on p. 112)
Color Plate 6: Effect of immunosuppressive drugs, Rapamycin (Rapa) and Tacrolimus (Tacro),on liver repopulation in DPPIV– rats preconditioned with retrorsine and partialhepatectomy. Animals were treated with drugs subsequent to the completion of cellengraftment. Rapa- but not Tacro-suppressed transplanted cell proliferation as shownby DPPIV histochemistry and morphometric analysis of either the extent of liverrepopulation (e) or individual transplanted cell foci (f). Original magnification (a–d),�100; hematoxylin counterstain. Modified from Wu Y-M et al. (18). (see discussion onp. 114)
Color Plate 7: Transfection by Amaxa Nucleofection: Expression of GFP in primary mouse hepa-tocytes (isolated from C57BL/6 mice) nucleofected using an Amaxa mouse hepatocyteNucleofector kit with a plasmid encoding maxGFP. Twenty-four hours after nucleo-fection, cells were analyzed by bright field (A) and fluorescence microscopy (B). Themerged image is shown in panel (C). (see discussion on p. 124)
xv

Color Plate 8: Transfection using liposomes containing F protein of the Sendai virus: Expressionof LacZ in cells transfected with DNA-loaded F-virosomes as described in the text.After incubation for 24 h, cells were fixed with ethanol, stained for b-galactosidase andphotographed. (magnification, �20, Nikon, Japan). Hepa1 cells (A), HEK293 cells(B). Note, only asialoglycoprotein-expressed cells are transduced by this method.Structure of histidine lipid used to enhance F-virosome-mediated genetransfer (C). (see discussion on p. 127)
Color Plate 9: Transduction of primary rat hepatocytes using a Lentiviral vector: Isolated Gunnrat hepatocytes were transduced with Lentivirus pAlb-UGT1A1 at an MOI of 10 andimmunostained with WP1, monoclonal primary antibody against UGT1A1, followedby anti mouse Alkaline Phosphatase substrate kit III as described in the text and controlhepatocytes (A) and experimental hepatocytes (B) were photographed. (see discussionon p. 132)
Color Plate 10: Lentiviral vector-mediated transduction of primary mouse hepatocytes, enhancedby Magnetofection1: Isolated mouse primary hepatocytes were transduced with Lenti-virus pAlb-LacZ at an MOI of 5 with or without Magnetofection1 as described in thetext, and were stained 48 h later for bacterial b-galactosidase activity (blue reactionproducts). (A) Untransfected control; (B) Lentiviral transduction without Magnetofec-tion1; (C) Lentiviral transduction enhanced by Magnetofection1. (see discussionon p. 133)
Color Plate 11: Revealing that bone marrow cells (BMCs) have differentiated into non-haematopoieticcells can be achieved by transplanting lethally irradiated animals with new BMCs thatcan be tracked whatever their subsequent fate. This would include male BMCs to afemale recipient, or GFP- or LacZ-positive BMCs to wild-type recipients. The malechromosome can be detected by in situ hybridisation, GFP by immunohistochemistryand b-galactosidase by X-gal histochemistry. (see discussion on p. 141)
Color Plate 12: Fluorescent and confocal microscopy. (A) Male cells (arrows) in male bone marrow-transplanted female mouse liver (green FITC dot). These cells are CK18 immunoreactive(red cytoplasm), suggestive of hepatocyte differentiation. (B) Human cell (green FITC,spotty nucleus, arrowed) in mouse liver (pink CY3 spots) after injection of humanCD133+ cells into a NOD-SCID mouse. (C) BCR/ABL probe on human liver in acase of CML showing normal ploidy, with two copies of chromosome 9 (red signals) andtwo copies of chromosome 22 (green signals) in some cells (asterisks), but multiple copies(polyploidy) in another cell (arrow). (D) BCR/ABL fusion signal (green and red overlapproducing orange, arrowed) seen in cell tentatively identified as a hepatocyte in a case ofCML. There is one native chromosome 9 (red), one native chromosome 22 (green) andone small red signal (ASS gene). (E) Confocal images demonstrating liver polyploidy in afemale mouse transplanted with male bone marrow, with multiple X chromosomes(green signals) showing that a Y chromosome (red signal, black arrow) is outside thenuclear membrane (view E), while a smaller nucleus (white arrow) has both X and Ychromosomes contained within it. (see discussion on p. 142)
Color Plate 13: Liver fibrosis in a mouse as viewed by bright field microscopy. (A) Demonstration of Ychromosome-positive cells (brown nuclear dots) in a female mouse liver after a malebone marrow transplant. (B) Demonstration of mRNA for pro(a1)I (black autoradio-graphic grains) in the same liver using a 3H-labelled antisense riboprobe. (C) Demon-stration of Y chromosome detection (brown dot, arrow) and IHC for a-SMAexpression (red staining) – a marker of myofibroblast differentiation. (D) Demonstra-tion of the expression of mRNA for pro(a1)I, the Y chromosome and a-SMA in thesame liver. One Y chromosome-positive cell is expressing neither a-SMA nor mRNAfor pro(a1)I, but another cell (asterisk) is expressing all three markers. Note thereduced grain density when techniques are combined in comparison to when ISH forthe mRNA is performed alone. (E and F) Examples of ISH for pro(a1)I mRNA
xvi Color Plates

expression and immunoreactivity for a-SMA in the same section. (see discussionon p. 147)
Color Plate 14: The appearance of a Percoll gradient following centrifugation at 800�g for 30 min isshown. Layers 2 and 3 contain biliary epithelial cells (approximately 10%) and areharvested for further purification of immature and mBEC populations by immuno-magnetic separation. The supernatant and fractions 1 and 4–6 are discarded. (seediscussion on p. 197)
Color Plate 15: Visualisation of the MRI contrast agent. (A) Adult human hepatocytes being labelledwith the bimodal Iron Oxide Green Oregon (IOGO) contrast agent (in green). Notethat some cells (cell nuclei in blue) are not labelled. It is noteworthy that the contrastagent seems strongly associated with the cell nuclei and does not fill the cytoplasm. It islikely that mainly phagocytic Kupffer cells incorporated this agent, whereas unlabelledcells represent a small fraction of undifferentiated hepatocytes. (B) In contrast, theGadolinium Rhodamine Dextran (GRID) bimodal agent (in red ) clearly labels thecytoplasm of cells that have the appearance of immature hepatocytes and is incorpo-rated into all types of cells. (see discussion on p. 212)
Color Plates xvii

Chapter 1
Human Hepatocyte Transplantation Overview
Juliana Puppi and Anil Dhawan
Abstract
The interest in hepatocyte transplantation has been growing continuously in recent years and this
treatment may represent an alternative clinical approach for patients with acute liver failure and liver-
based metabolic disorders. This chapter presents an overview of liver cell transplantation, from the basicresearch to human experience. It summarizes the pre-clinical studies and present status of clinical
hepatocyte transplantation and identifies some possible areas of future research in this area.
Key words: Hepatocyte transplantation, collagenase, cryopreservation, sources of liver tissues, GMP
laboratory, clinical experience, future use
1. Introduction
Orthotopic liver transplantation (OLT) is the accepted method oftreatment for end-stage liver disease and liver-based metabolicdisorders. The improvements in patient and graft survival havemainly resulted from the developments in immunosuppressivedrug therapy. Advances in surgical techniques now allow the useof auxiliary liver transplantation in the management of patientswith acute liver failure (ALF) and certain liver-based metabolicdefects such as Crigler–Najjar (CN) syndrome type I, urea cycledefects and familial hypercholesterolaemia. The success of auxili-ary liver transplantation in humans (1) has supported the observa-tion in animal experiments that relatively small amounts of livertissue can provide sufficient function to correct the underlyingmetabolic defects. This has further increased the interest in usinghuman hepatocytes for cell transplantation in the management ofliver-based metabolic conditions and ALF.
Anil Dhawan, Robin D. Hughes (eds.), Hepatocyte Transplantation, vol. 481� Humana Press, a part of Springer ScienceþBusiness Media, LLC 2009DOI 10.1007/978-1-59745-201-4_1 Springerprotocols.com
1

There are a number of potential advantages of hepatocytetransplantation if the technique can be proved successful. It isless expensive and less invasive than OLT. It avoids the risks andundertaking of major surgery once liver cells can be transplantedafter radiologic or surgical placement of a portal catheter. Unlikewhole organs, hepatocytes can be cryopreserved and stored in cellbanks, offering the advantage of immediate availability in emer-gencies. The transplanted cells functionally replace the hepato-cytes of the diseased organ and restore its metabolic capacity eitherfor a period of bridging to whole-organ transplantation or byengraftment and long-term function. Moreover, in hepatocytetransplantation, the recipient liver remains intact and subsequentliver-directed gene therapy would be still feasible when thisbecomes a clinical reality. With this there is the possibility of betterutilization of donor organs, which remain in short supply, parti-cularly if methods can be developed to isolate good-quality hepa-tocytes from marginal donor livers, currently rejected for clinicaltransplantation. Hepatocyte transplantation has been used as atreatment for ALF (2–4) and metabolic liver diseases such as CNsyndrome type I (5, 6), glycogen storage disease type 1a (7) andurea cycle defects (8, 9) for long-term correction of the under-lying metabolic deficiency, with variable outcome.
2. Methods forIsolation of HumanHepatocytes
2.1. Sources of Liver
Tissue
The major obstacle of liver cell therapy is the limited supply ofdonor liver tissue for hepatocyte isolation. Livers with severesteatosis, prolonged cold ischaemia time, older donors or otherfactors that make the tissue unsuitable for OLT are the mainsources of human hepatocytes. The quality and viability of cellsobtained from these livers are often poor and currently not suffi-cient for human hepatocyte transplantation.
Cell isolation can also be performed in remnants of the liverafter orthotopic transplantation of reduced or split liver graft.Significant higher cell viability is obtained from these tissueswhen compared to those rejected for OLT (10). Liver segmentIV receives blood supply by the left hepatic artery and the leftportal vein. When a liver is split between an adult and a paediatricpatient, segment IV is allocated to the right lobe. At our centre, itis usually removed during the split procedures to avoid infarctionand a potential risk of sepsis. In a study performed at our centre,three segments IV with or without the caudate lobe were usedto isolate hepatocytes. From each segment about 0.5 billion
2 Puppi and Dhawan

hepatocytes were isolated, with a high viability of 90% (11). Usingthese hepatocytes isolated from segment IV for clinical hepatocytetransplantation means that three patients can benefit from onesplit liver, effectively increasing the donor pool.
To increase the supply of tissues for OLT, non-heart-beatingdonors are being considered as an additional source of livers (12).These organs are retrieved after the heart has stopped beating andrespiration has ceased. As a result, liver tissues from this sourcehave also become available for isolation of hepatocytes. A total of20 livers or segments were perfused using the same methods as forthe conventional donor livers, and the mean viability obtained was52%. There was a significant negative correlation between hepa-tocyte viability and both warm and cold ischaemia periods. Only35% of the livers processed achieved the viability required forclinical transplantation, which probably reflects that most ofthese livers had been rejected for whole-organ transplantation.The poor viability could be improved by reducing both cold andwarm ischaemia times prior to processing (13).
Other alternative sources of hepatocytes are being studied,such as immortalized cell lines (14, 15), foetal hepatocytes (16)and stem cell-derived hepatocytes (17–19), and will be discussedelsewhere in this book.
2.2. Isolation of
Hepatocytes
There are well-established protocols for isolation of human hepa-tocytes (10, 20) based on the collagenase digestion of perfused livertissue at 378C. Once the liver tissue is digested and cells released,the hepatocytes are separated by low-speed centrifugation, and thepellets obtained are washed with ice-cold buffer solution to purifythe cells. The cell viability and yield are then assessed, and will varydepending on the quality of the tissue used. Hepatocytes need tobe used as soon as possible for cell transplantation, preferablywithin 24 h of isolation, as function deteriorates even when keptat 48C. For longer-term storage of human hepatocytes, a numberof cryopreservation protocols are available (21). In most of them,hepatocytes are maintained at 48C after isolation and cryopreservedas soon as possible. The best results are currently obtained bycryopreservation in a mixture of the organ preservation mediaUniversity of Wisconsin solution and final concentration of 10%dimethyl sulphoxide (Me2SO) using a controlled-rate cell freezer(22). There are so many steps involved in hepatocyte isolation andcryopreservation that often insufficient viable hepatocytes arerecovered on thawing. The cryopreserved hepatocytes can thenbe stored at –1408C until required for clinical use.
2.3. GMP Laboratory
and Cell Banking
An aseptic environment is required to prepare cells on a large scale inconditions of good manufacturing practice (GMP), so that theisolated cells are safe to be administered to humans. The cell isola-tion unit is a purpose-built facility consisting of interconnected
Human Hepatocyte Transplantation Overview 3

rooms. Air entering the laboratory passes through HEPA filters toremove any particles and an air-handling unit maintains a tempera-ture-controlled environment inside the unit. There is a gradient ofair pressures between the rooms, which maintains a positive airpressure differential, with the highest pressure in the aseptic room,where tissue processing is performed. Operators have to wear sterileclean-room suits. Standard operating procedures are followed for allaspects of work in the cell isolation unit. A comprehensive qualitycontrol system monitors all aspects of laboratory performance.
Cryopreserved hepatocytes for clinical use are stored in cellfreezer bags in the vapour phase of liquid nitrogen inside anautomated storage container. A cell bank permits the immediateuse of hepatocytes in urgent cases of liver disease.
All donated organs/tissues should be screened for viral infec-tion, including hepatitis and human immunodeficiency virusaccording to the National Solid Organ Transplant Service criteria.The final cell products must be screened for the presence ofmicroorganisms. For clinical transplantation, hepatocytes musthave a viability higher than 60%, a yield superior to 5�108 hepa-tocytes and the absence of microbiological contamination.
3. Pre-clinicalStudies
Extensive laboratory studies in experimental animal models ofhuman liver disease established the feasibility and efficacy of hepa-tocyte transplantation into various sites such as liver, spleen, pan-creas, peritoneal cavity and sub-renal capsule. Identification oftransplanted hepatocytes was documented by a number of differ-ent methods. Models have included the identification of normalhepatocytes transplanted into Nagase analbuminaemic or dipep-tidyl peptidase IV-deficient rats by liver (immuno)histochemistryand serum albumin levels, in the case of Nagase analbuminaemicrats. Another approach used was the use of donor cells secreting orexpressing unique reporter proteins, including the green fluores-cent protein for direct identification of transplanted cells (23, 24).
Hepatocyte transplantation improves the survival of animalmodels with ALF, induced either chemically (25–27) or surgically(28). For human metabolic disorders, there are several animalmodels, including the Gunn rat (model for CN syndrome typeI), the fumarylacetoacetate hydrolase–/– knockout mice (modelof tyrosinaemia type I), the Long Evans Cinnamon rat (model ofWilson’s disease), the mdr2 mouse (model of progressive familialintrahepatic cholestasis type 3), the spf-ash mouse (model ofcongenital ornithine transcarbamylase (OTC) deficiency), the
4 Puppi and Dhawan

Watanabe heritable hyperlipidemic rabbit (model for LDL recep-tor deficiency) and the hyperuricemic Dalmatian dog. Hepatocytetransplantation showed improvement of the biochemical abnorm-alities in metabolic models, but complete correction of the geneticabnormalities required a significant amount of engrafted cells.Repeated hepatocyte transplantation can increase the number ofengrafted liver cells (29), although better results are seen in animalmodels where donor hepatocytes have a selective advantage overthe native hepatocytes to repopulate the recipient liver (30–32).
4. ClinicalHepatocyteTransplantation
4.1. Acute Liver
Failure
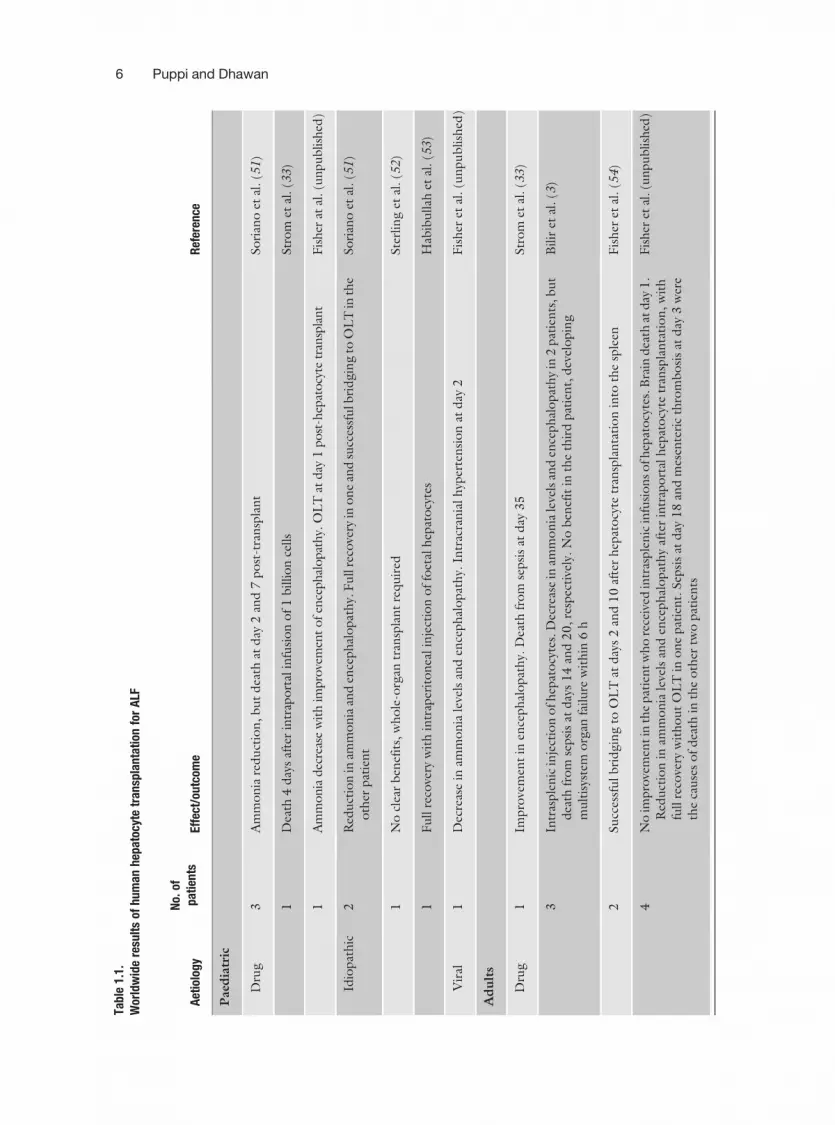
Animal studies encouraged human clinical application of hepato-cyte transplantation, initially in the treatment of patients withALF. Eighteen patients who received hepatocyte transplantationfor ALF, from six centres in the United States, were reviewed byStrom et al. (33). Infusion of 107–109 hepatocytes, either fresh orafter cryopreservation, was performed into the splenic artery orportal vein. Up to a maximum of 5% of normal liver mass wasinfused and it is questionable whether this is a sufficient quantityto replace the massive lost function in ALF. In these studies, areduction in ammonia and bilirubin levels and improvements inhepatic encephalopathy levels were reported, but liver cell trans-plantation did not significantly affect the clinical outcome of thesepatients. Table 1.1 summarizes the overall data on ALF patientstreated with hepatocyte transplantation.
4.2. Liver-Based
Metabolic Disorders
The cell requirement for transplantation may be lower in someinherited metabolic liver diseases where the aim is to replace a singledeficient enzyme. The first patients to receive hepatocyte transplan-tation for treatment of an inherited liver-based metabolic disorderwere five children with familial hypercholesterolaemia. After liverresection, autologous hepatocytes were isolated and transduced exvivo with a retroviral vector carrying the human LDL receptor andthen transplanted back into the patients. There was evidence ofengraftment and over 20% reduction in LDL cholesterol documen-ted in three of the five patients transplanted, but less than 5% oftransgene expression in donor hepatocytes after 4 months (34, 35).Since then, many other patients have been treated with hepatocyteallotransplantation to correct metabolic diseases. The overall experi-ence of hepatocyte transplantation for treatment of liver-basedmetabolic disorders, mainly in children, is shown in Table 1.2.
Human Hepatocyte Transplantation Overview 5
Tabl
e1.
1.W
orld
wid
ere
sult
sof
hum
anhe
pato
cyte
tran
spla
ntat
ion
for
ALF
Aet
iolo
gy
No.
ofpa
tien
tsEf
fect
/out
com
eR
efer
ence
Pae
dia
tric
Dru
g3
Am
mo
nia
red
uct
ion
,b
ut
dea
that
day
2an
d7
po
st-t
ran
spla
nt
So
rian
oet
al.(5
1)
1D
eath
4d
ays
afte
rin
trap
ort
alin
fusi
on
of
1b
illio
nce
lls
Str
om
etal
.(3
3)
1A
mm
onia
dec
reas
ew
ith
impro
vem
ent
ofen
cephal
opat
hy.
OL
Tat
day
1post
-hep
atocy
tetr
ansp
lant
Fis
her
atal
.(u
npublish
ed)
Idio
pat
hic
2R
edu
ctio
nin
amm
on
iaan
den
ceph
alo
pat
hy.
Fu
llre
cove
ryin
on
ean
dsu
cces
sfu
lbri
dgin
gto
OL
Tin
the
oth
erpat
ien
tSo
rian
oet
al.(5
1)
1N
ocl
ear
ben
efit
s,w
ho
le-o
rgan
tran
spla
nt
req
uir
edSte
rlin
get
al.(5
2)
1F
ull
reco
very
wit
hin
trap
erit
on
ealin
ject
ion
of
foet
alh
epat
ocy
tes
Hab
ibu
llah
etal
.(5
3)
Vir
al1
Dec
reas
ein
amm
on
iale
vels
and
ence
ph
alo
pat
hy.
Intr
acra
nia
lh
yper
ten
sio
nat
day
2F
ish
eret
al.(u
npu
blish
ed)
Adult
s
Dru
g1
Impro
vem
ent
inen
ceph
alo
pat
hy.
Dea
thfr
om
sepsi
sat
day
35
Str
om
etal
.(3
3)
3In
tras
ple
nic
inje
ctio
no
fh
epat
ocy
tes.
Dec
reas
ein
amm
on
iale
vels
and
ence
ph
alo
pat
hy
in2
pat
ien
ts,b
ut
dea
thfr
om
sepsi
sat
day
s1
4an
d2
0,re
spec
tive
ly.N
ob
enef
itin
the
thir
dpat
ien
t,d
evel
opin
gm
ult
isys
tem
org
anfa
ilu
rew
ith
in6
h
Bilir
etal
.(3
)
2Su
cces
sfu
lb
rid
gin
gto
OL
Tat
day
s2
and
10
afte
rh
epat
ocy
tetr
ansp
lan
tati
on
into
the
sple
enF
ish
eret
al.(5
4)
4N
oim
pro
vem
entin
the
pat
ien
tw
ho
rece
ived
intr
asple
nic
infu
sio
ns
ofh
epat
ocy
tes.
Bra
ind
eath
atd
ay1
.R
edu
ctio
nin
amm
on
iale
vels
and
ence
ph
alo
pat
hy
afte
rin
trap
ort
alh
epat
ocy
tetr
ansp
lan
tati
on
,w
ith
full
reco
very
wit
ho
ut
OL
Tin
on
epat
ien
t.Sep
sis
atd
ay1
8an
dm
esen
teri
cth
rom
bo
sis
atd
ay3
wer
eth
eca
use
so
fd
eath
inth
eo
ther
two
pat
ien
ts
Fis
her
etal
.(u
npublish
ed)
6 Puppi and Dhawan

Tabl
e1.
1.(c
ontin
ued)
Aet
iolo
gy
No.
ofpa
tien
tsEf
fect
/out
com
eR
efer
ence
5Sin
gle
intr
aper
ito
nea
lin
fusi
on
of6�
10
7fo
etal
hep
ato
cyte
s/kg
.Tw
oo
fth
efi
vepat
ien
tstr
eate
dsh
ow
edre
du
ctio
nin
amm
on
iale
vels
and
impro
vem
ent
inen
cep
hal
op
ath
y,w
ith
full
reco
very
Hab
ibu
llah
etal
.(5
3)
Idio
pat
hic
1In
tras
ple
nic
infu
sio
no
fh
epat
ocy
tes
wit
hd
ecre
ase
inam
mo
nia
leve
lsan
den
ceph
alo
pat
hy,
allo
win
gO
LT
atd
ay5
.D
eath
fro
mm
ult
isys
tem
org
anfa
ilu
reaf
ter
13
day
sSte
rlin
get
al.(5
2)
1In
trap
ort
altr
ansp
lan
tati
on
of
hep
ato
cyte
sfo
rtr
eatm
ent
of
Rey
e’s
syn
dro
me.
Red
uct
ion
inb
loo
dam
mo
nia
,b
ut
no
impro
vem
ent
inen
ceph
alo
pat
hy.
Dea
that
day
1po
st-t
ran
spla
nt
Fis
her
etal
.(u
npu
blish
ed)
Mu
shro
om
po
iso
nin
g1
Fu
llre
cove
ryaf
ter
intr
apo
rtal
infu
sio
no
f4
.9�
10
9h
epat
ocy
tes.
Imm
un
osu
ppre
ssio
nst
opped
afte
r1
2w
eeks
Sch
nei
der
etal
.(4
)
Post
-su
rgic
al1
No
clin
ical
impro
vem
ent
afte
rin
tras
ple
nic
tran
spla
nta
tio
no
fh
epat
ocy
tes
for
AL
Fd
ue
toa
tris
egm
ente
cto
my.
Dea
that
day
2Str
om
etal
.(3
3)
Vir
al2
Her
pes
IIan
dH
epat
itis
BV
iru
s(H
BV
)in
du
ced
AL
Ftr
eate
db
yin
trap
ort
alan
din
tras
ple
nic
live
rce
lltr
ansp
lan
tati
on
.N
ob
enef
itin
the
firs
tpat
ien
t,d
eath
afte
r1
8h
.D
ecre
ase
inam
mo
nia
wit
him
pro
vem
ent
inen
ceph
alo
pat
hy,
bu
tm
ult
iorg
ansy
stem
failu
reat
day
52
Bilir
etal
.(3
)
3T
wo
pat
ients
wit
hH
BV
AL
Ftr
eate
dby
hep
atocy
tetr
ansp
lanta
tion.O
ne
rece
ived
intr
asple
nic
infu
sion
and
show
eddec
reas
ein
blo
od
amm
onia
and
impro
vem
entin
ence
phal
opat
hy.
Succ
essf
ulb
ridgin
gto
OL
Tat
day
3.N
oben
efit
inth
eoth
eraf
ter
intr
aport
alin
fusi
on,O
LT
atday
1.Im
pro
vem
ent
inen
cephal
opat
hy
and
reduct
ion
inam
monia
leve
lsw
asobse
rved
inth
eth
ird
pat
ient
wit
hher
pes
II,tr
eate
dw
ith
intr
asple
nic
infu
sion
of
hep
atocy
tes.
Dea
thfr
om
sepsi
sat
day
5
Str
om
etal
.(3
3)
1F
ull
reco
very
inH
BV
+co
cain
eA
LF
afte
rin
tras
ple
nic
hep
ato
cyte
tran
spla
nta
tio
nF
ish
eret
al.(5
5)
1D
ecre
ase
inam
monia
leve
lsan
dim
pro
vem
entin
ence
phal
opat
hy
afte
rin
trap
ort
alin
fusi
on
ofh
epat
ocy
tesfo
rtr
eatm
ent
ofH
BV
+ly
mphom
aA
LF
.D
eath
from
multio
rgan
syst
emfa
ilure
atday
7F
ish
eret
al.(u
npu
blish
ed)
1N
ob
enef
itse
enw
ith
intr
aper
ito
nea
lin
fusi
on
of
hep
ato
cyte
sfo
rtr
eatm
ent
of
AL
Fd
ue
toH
BV
infe
ctio
n.D
eath
afte
r1
3h
Hab
ibu
llah
etal
.(5
3)
Mo
dif
ied
fro
mF
ish
eret
al.(2
00
6)
Tra
nsp
lan
tati
on8
2,4
41
–44
9.
Human Hepatocyte Transplantation Overview 7

Table 1.2
Hepatocyte transplantation: clinical studies in liver-based metabolic diseases
Liver diseaseNo. ofpatients Effect/outcome Reference
Familial
hypercholesterolaemia
5* 20% reduction in LDL cholesterol in 3 patients Grossman et al. (35)
a1 AT deficiency 1 Intraportal infusion. OLT after 4 days.Cirrhosis on explanted liver
Strom et al. (33)
Crigler–Najjarsyndrome type I
1 50% reduction in serum bilirubin Fox et al. (5)
2 40% reduction in serum bilirubin in one and noclear benefit in the other patient.Immunosuppression stopped after 5 months
Dhawan et al.(unpublished)
1 Partial correction of clinical jaundice. OLTafter 5 months due to a very poor quality oflife
Ambrosino et al. (6)
1 30% decrease in serum bilirubin andphototherapy requirement
Allen et al. (personalcommunication)
Factor VII deficiency 3 80% reduction in recombinant factor VIIrequirement
Dhawan et al. (39)
Glycogen storagedisease type Ia
1 Normal diet with no hypoglycaemia Muraca et al. (7)
1 Normal glucose 6 phosphatase activity up to 7months
Lee et al. (personalcommunication)
1 Partial response Sokal et al. (personalcommunication)
Infantile Refsum’sdisease
1 Partial correction of metabolic abnormality Sokal et al. (38)
Progressive familialintrahepaticcholestasis
2 No clear benefit – fibrosis already present. OLTat 5 and 14 months, respectively
Dhawan et al.(unpublished)
Urea cycle defect 1 Some clinical improvement. Died after 42 days Strom et al. (36)
1 Lowered blood ammonia and increased proteintolerance
Horslen et al. (8)
1 No hyperammonaemia and increase in serumurea under normal protein diet. Auxiliaryliver transplant at 7 months of age
Mitry et al. (11)
2 Decrease in ammonia levels and improvementin psychomotor development
Stephenne et al. (9, 37)
1 Ammonia and citrulline levels decreased up to 6months post-transplantation
Lee et al. (personalcommunication)
*Ex vivo gene therapy of autologous hepatocytes.
8 Puppi and Dhawan

One of the key early reports was from Fox et al. in 1998, whoreported the case of a 10-year-old girl with CN syndrome type Itreated with hepatocyte transplantation. There was a reductionin her bilirubin levels and hours of phototherapy, and an increasein measured bilirubin UDP-glucuronosyl transferase activityafter liver cell transplantation. Excretion of bilirubin conjugatesin bile persisted for 3.5 years after hepatocyte transplantation.However, clinical improvements were not enough to ameliorateher quality of life, and the patient decided to undergo orthotopicauxiliary liver transplantation 4 years after liver cell transplanta-tion (5). Subsequently, four other patients with CN type I weretreated with hepatocyte transplantation, two of them at King’sCollege Hospital. The two patients received a total of 4.3 and1.5�109 both fresh and cryopreserved hepatocytes. In the firstpatient who received nine infusions over 2 weeks and a furtherinfusion 3 months later, there was an encouraging sustainedreduction in serum bilirubin. The second child received threeinfusions of hepatocytes over a period of 3 weeks. No clearbenefit in bilirubin levels was observed, and immunosuppressionwas stopped 5 months after hepatocyte transplantation. Thepatient is now listed for whole-organ transplantation. Twoother patients with severe unconjugated hyperbilirubinaemiaand clinical diagnosis of CN type I were treated with an intra-portal infusion of 7.5 and 1.5�109 hepatocytes each, with areduction of bilirubin levels by 30–50%. Due to poor tolerabilityto nocturnal phototherapy, the first child underwent OLT (6)(Allen et al., personal communication).
Five patients with urea cycle disorders have received hepato-cyte transplantation, three of them for OTC deficiency, one forargininosuccinate lyase deficiency and one for citrullinaemia. Thefirst, a 5-year-old boy with OTC deficiency, showed some clinicalimprovement, but died with hyperammonaemia 42 days after livercell transplantation (36). The second infant with a severe OTCmutation showed biochemical and clinical improvement for ashort period after injection of hepatocytes, but activity was lost,probably because of acute rejection (8). Our first patient to receivehepatocyte transplantation was a 1-day-old boy with an antenataldiagnosis of severe OTC deficiency. Infusion of 1.6�109 hepato-cytes was performed via an umbilical vein catheter. After trans-plantation, he had no episodes of hyperammonia and showed anincrease in urea synthesis while on a normal protein diet. The childunderwent auxiliary liver transplantation at 7 months of age dueto uncertainties about the long-term efficacy of hepatocyte trans-plantation (11). Liver cell transplantation was used as a bridge toOLT in a 14-month-old boy with OTC deficiency poorly equili-brated by conventional therapy. He was maintained on a restrictedprotein diet, sodium benzoate therapy and arginine/citrullinesupplementation and received 3.5�109 cryopreserved cells into
Human Hepatocyte Transplantation Overview 9

the portal vein (10 infusions over 16 weeks). Control of theammonia levels and urea synthesis, as well as improved psycho-motor development, was observed until OLT, 6 months after thefirst infusion of cells (37). Recently, a 42-month-old girl withargininosuccinate lyase deficiency and secondary psychomotorretardation because of recurrent episodes of hyperammonaemiawas treated with hepatocyte transplantation. Repeated intraportalinjections of fresh and cryopreserved hepatocytes to reach 9% ofher total hepatic mass were performed over 5 months. A metabolicand psychomotor improvement was observed, and there was evi-dence of hepatocyte engraftment up to 12 months after celltransplantation (38). The last patient with urea cycle disorder toreceive hepatocyte transplantation was a 25-month-old child withcitrullinaemia. With intraportal hepatocyte transplantation of 10%of the calculated liver mass, a decrease in both ammonia andcitrulline levels was achieved up to 6 months post-transplant(Lee et al., personal communication).
In two adults with glycogen storage disease type Ia, hepatocytetransplantation resulted in improved glucose control on a normaldiet, and one of the patients showed normal glucose 6 phosphataseactivity for 7 months (7) (Lee et al., personal communication). Theonly child to receive intraportal infusion of human hepatocytes as atreatment for this metabolic disease showed only partial response(Sokal et al., personal communication).
The first use of hepatocyte transplantation for treatment ofinherited coagulation factor VII deficiency was at King’s CollegeLondon, in two brothers who presented a severe form of thiscondition. Both children received hepatocytes (a total of 1.1 and2.2�109) through a Hickman line inserted in the inferior mesen-teric vein. Infusion of isolated human hepatocytes improved thecoagulation defect and markedly decreased the requirement forexogenous recombinant factor VIIa (rFVIIa) to around 20% ofthat before cell transplantation. Six months post-hepatocytetransplantation in both cases higher rFVIIa doses were required,suggesting the loss of transplanted hepatocyte function, possiblyassociated with sepsis. Due to increasing problems with venousaccess and uncertainty about the long-term efficacy of hepatocytetransplantation, OLT was performed successfully in both cases(39). Subsequently, a third patient with factor VII deficiencyreceived a total of 2.8�109 hepatocytes (fresh and cryopreserved)and showed similar outcome (Dhawan et al., unpublished).
Two other children treated in 2003 were suffering from pro-gressive familial intrahepatic cholestasis (PFIC2), a genetic diseasewhere the liver is lacking the bile salt export pump (40). As a resultof this defect, bile flow is severely impaired and patients rapidlydevelop liver cirrhosis and need liver transplantation. Both chil-dren with PFIC2 received a single percutaneous transhepaticinjection of one-third of a billion fresh hepatocytes into the portal
10 Puppi and Dhawan

system. The rationale was that the injected hepatocytes wouldhave a selective growth advantage over the defective host hepato-cytes to repopulate the liver, as had been shown in a mouse modelof progressive familial intrahepatic cholestasis type 3 (30), whereup to 70% of host hepatocytes were replaced by donor cells.However, both patients had a whole-liver transplant 5 and 14months later, respectively, as their livers had continued to dete-riorate. Existing fibrosis in the hepatic sinusoids is likely to haveimpaired engraftment of transplanted hepatocytes into the liverstructure. Earlier treatment, if feasible, may be the best approachin this situation.
Among the other patients reported, a child with a1-antitrypsindeficiency was found to have cirrhosis at the time of cell infusionand underwent subsequent liver transplantation (33). Finally, achild with infantile Refsum’s disease had a partial correction in themetabolic abnormality after liver cell transplantation andpersistent evidence of peroxisomal function up to 18 monthslater (38).
4.3. Route of
Administration
The liver and the spleen are the most consistent sites for hepato-cyte engraftment and function. Intraportal injection is the pre-ferred delivery method for clinical hepatocyte transplantation.The portal venous system can be accessed using different techni-ques: percutaneous transhepatic puncture of the portal vein,transjugular approach to the right portal vein, catheterization ofthe mesenteric vein or umbilical vein catheterization in newbornbabies. Hepatic ultrasound and portal venous system Dopplerexamination should be performed before the procedure toexclude any malformation or venous thrombosis. The percuta-neous transhepatic portal vein access technique was first describedin 1967 by Aronsen and Nylander (41). Since then the techniquehas been widely used for diagnostic portography, embolizationprocedures and, most recently, for cell transplantation. It can beperformed under general anaesthesia or simple sedation com-bined to local anaesthetic agents. The potential complicationsassociated with the percutaneous transhepatic approach aremainly hepatic haematoma, portal vein thrombosis, haemorrhage,puncture of the biliary system and vasovagal reactions (42, 43).Combined ultrasound or computed tomography and fluoroscopyguidance have been performed in an attempt to reduce the num-ber of punctures to gain access to the portal vein, thus decreasingthe procedure-related risks (42, 44). The transjugular approach tothe right portal vein is another method to be considered forhepatocyte transplantation, but is more complex and cannot beperformed under ultrasound guidance (42). In any of these meth-ods, the portal venous pressure must be carefully monitoredthroughout the procedure. Repeated cell infusions are normallyrequired when a large amount of hepatocytes has to be injected.
Human Hepatocyte Transplantation Overview 11

To avoid multiple anaesthetic procedures and portal vein punctu-res, surgical placement of a long-term intravenous access in themesenteric vein should be considered. The use of an implantablemesenteric Port-a-Cath1 device was recently described as a prac-tical means to infuse hepatocytes (45).
The spleen is considered an adequate site for hepatocytetransplantation, particularly in cirrhotic patients. When injectedinto the splenic bulb, cells translocate to the liver through thesplenic vein. Another attractive site for cell transplantation is theperitoneal cavity due to its large capacity and simple access. Inspite of the fact that isolated hepatocytes do not normally engraftor survive following intraperitoneal injection, transplantation ofencapsulated or matrix-attached hepatocytes has prolonged cellsurvival in animal models (46).
4.4. Immuno
suppression
To date there is no consensus regarding the immunosuppressivetreatment, but most centres have used the protocol of liver trans-plantation. Combination of tacrolimus and steroids with or with-out sirolimus or mycophenolate mofetil has been used. Somecentres use monoclonal antibodies like basiliximab or daclizumab.The Edmonton protocol for islet cell transplantation appears to bethe most promising and our centre is beginning to follow thisregimen.
5. The Future
Considerable progress has been made in bringing hepatocytetransplantation to the bedside. However, the success of hepato-cyte transplantation from animal models experiments could notbe fully reproduced in humans. Although results in clinical studieshave been encouraging, no complete correction of any metabolicdisease in patients by hepatocyte transplantation alone has beenreported. There are still a number of areas for improvement anddevelopment.
The limited supply of livers currently available to isolate hepa-tocytes is a major problem for hepatocyte transplantation. Asdiscussed before, donor liver tissues unsuitable for OLT are cur-rently the principal source of human hepatocytes. Livers withmoderate-to-severe steatosis are those most commonly rejectedfor clinical transplantation and represent an important potentialsource of hepatocytes. The improvement of the outcome of iso-lation and purification of these hepatocytes is an important goal,so that these cells could be used for transplantation. It is not likelythat the supply of hepatocytes will increase, so a wider use ofhepatocyte transplantation will not be possible until alternativesources of cells are found. Foetal hepatocytes, liver stem/
12 Puppi and Dhawan

progenitor cells isolated from adult livers, embryos, umbilical cordblood and bone marrow, and hepatocytes conditionally immorta-lized by gene transfer are ongoing areas of investigation. There is afocus of research worldwide on liver stem cell biology and there isno doubt that there are many hurdles to cross before clinicalapplication will be possible. Xenotransplants could be a potentiallyunlimited source of fresh hepatocytes; however, there are manyconcerns regarding rejection and transmission of infectious dis-eases that need to be resolved.
Another limiting factor of the technique is the conservationand storage of isolated cells. There is a need to improve the storageof hepatocytes, both for longer periods in the cold so they can beused fresh after a number of days and also better cryopreservationprotocols for longer term storage. Viability and function on thaw-ing of cryopreserved hepatocytes can be improved by the use ofprotocols incorporating cryo/cytoprotectant agents (47).
The demonstration of engraftment and repopulation of therecipient liver by donor hepatocytes is still a major difficulty. Insome liver-based metabolic disorders, the restoration of a meta-bolic defect after liver cell transplantation can be assessed fromserum concentration of a metabolite, but this may not providereliable information on the number of surviving and functioningengrafted cells. Moreover, the distribution of the engrafted cellscannot be determined by this approach. Other techniques requirea liver biopsy to determine donor engraftment, such as shorttandem repeats analysis (48), quantitation of gene expression ofliver-specific transcripts and fluorescence in situ hybridization (9)or real-time PCR of Y chromosome (49), in cases of sex-mis-matched hepatocyte transplantation. The disadvantages of hepaticbiopsies are procedure-related morbidity and selective sampling ofthe graft at a single endpoint. For these reasons, reliable non-invasive methods are required to monitor cell survival and engraft-ment after transplantation. There is growing interest in usingmagnetic resonance imaging to track cells after in vitro labelingwith contrast agents (50).
It is also clear that many injected cells do not engraft into therecipient liver and are either cleared by the reticuloendothelialsystem or lose viability during this early phase. The outcome ofhepatocyte transplantation would benefit from methods toenhance engraftment and repopulation by the induction of aselective growth advantage over host hepatocytes, although theoptions for this in humans would be limited. Rejection of theallogeneic hepatocytes and/or eventual senescence of the cellstransplanted are probably contributing factors for the loss oflong-term function of these cells in clinical transplants. Morestudies are needed to minimize or overcome the need of immu-nosuppression in liver cell transplantation. If this could be
Human Hepatocyte Transplantation Overview 13

achieved, hepatocyte transplantation would exhibit an exceptionaladvantage over OLT.
In summary, considerable experience has been gained so far inthe handling of hepatocytes and techniques for hepatocyte trans-plantation allowing clinical hepatocyte transplantation. This willgive a good basis for the future application of new technologies,particularly those based on stem cells, which, it is hoped, willincrease the utilization of cell transplantation.
Reference
1. Pereira, S. P., McCarthy, M., Ellis, A. J., et al.(1997) Auxiliary partial orthotopic livertransplantation for acute liver failure. J Hepa-tol 26, 1010–1017.
2. Strom, S. C., Fisher, R. A., Thompson, M. T.,et al. (1997) Hepatocyte transplantation as abridge to orthotopic liver transplantation interminal liver failure. Transplantation 63,559–569.
3. Bilir, B. M., Guinette, D., Karrer, F., et al.(2000) Hepatocyte transplantation in acuteliver failure. Liver Transpl 6, 32–40.
4. Schneider, A., Attaran, M., Meier, P. N.,et al. (2006) Hepatocyte transplantation inan acute liver failure due to mushroom poi-soning. Transplantation 82, 1115–1116.
5. Fox, I. J., Chowdhury, J. R., Kaufman, S. S.,et al. (1998) Treatment of the Crigler–Najjarsyndrome type I with hepatocyte transplanta-tion. N Engl J Med 338, 1422–1426.
6. Ambrosino, G., Varotto, S., Strom, S. C.,et al. (2005) Isolated hepatocyte transplanta-tion for Crigler–Najjar syndrome type 1. CellTranspl 14, 151–157.
7. Muraca, M., Gerunda, G., Neri, D., et al.(2002) Hepatocyte transplantation as a treat-ment for glycogen storage disease type 1a.Lancet 359, 317–318.
8. Horslen, S. P., McCowan, T. C., Goertzen,T. C., et al. (2003) Isolated hepatocyte trans-plantation in an infant with a severe urea cycledisorder. Pediatrics 111, 1262–1267.
9. Stephenne, X., Najimi, M., Sibille, C., et al.(2006) Sustained engraftment and tissueenzyme activity after liver cell transplantationfor argininosuccinate lyase deficiency. Gas-troenterology 130, 1317–1323.
10. Mitry, R. R., Hughes, R. D., Aw, M. M.,et al. (2003) Human hepatocyte isolationand relationship of cell viability to earlygraft function. Cell Transpl 12, 69–74.
11. Mitry, R. R., Dhawan, A., Hughes, R. D.,et al. (2004) One liver, three recipients: seg-ment IV from split-liver procedures as asource of hepatocytes for cell transplanta-tion. Transplantation 77, 1614–1616.
12. Muiesan, P. (2003) Can controlled non-heart-beating donors provide a solution tothe organ shortage? Transplantation 75,1627–1628.
13. Hughes, R. D., Mitry, R. R., Dhawan, A.,et al. (2006) Isolation of hepatocytes fromlivers from non-heart-beating donors for celltransplantation. Liver Transpl 12, 713–717.
14. Kobayashi, N., Fujiwara, T., Westerman, K. A.,et al. (2000) Prevention of acute liver failurein rats with reversibly immortalized humanhepatocytes. Science 287, 1258–1262.
15. Cai, J., Ito, M., Nagata, H., et al. (2002)Treatment of liver failure in rats with end-stage cirrhosis by transplantation of im-mortalized hepatocytes. Hepatology 36,386–394.
16. Dan, Y. Y., Riehle, K. J., Lazaro, C., et al.(2006) Isolation of multipotent progenitorcells from human fetal liver capable of differ-entiating into liver and mesenchymallineages. Proc Natl Acad Sci USA 103,9912–9917.
17. Avital, I., Feraresso, C., Aoki, T., et al. (2002)Bone marrow-derived liver stem cell andmature hepatocyte engraftment in liversundergoing rejection. Surgery 132,384–390.
18. Miki, T., Lehmann, T., Cai, H., et al. (2005)Stem cell characteristics of amniotic epithe-lial cells. Stem Cells 23, 1549–1559.
19. Ruhnke, M., Ungefroren, H., Nussler, A.,et al. (2005) Differentiation of in vitro-mod-ified human peripheral blood monocytesinto hepatocyte-like and pancreatic islet-likecells. Gastroenterology 128, 1774–1786.
14 Puppi and Dhawan

20. Strom, S. C., Dorko, K., Thompson, M. T.,et al. (1998) Large scale isolation and cultureof human hepatocytes, in (Franco, D., et al.ed.), Ilots de Langerhans et hepatocytes: versune utilisation therapeutique, pp. 195–205.Les Editions INSERM, Paris.
21. Terry, C., Dhawan, A., Mitry, R. R., et al.(2006) Cryopreservation of isolated humanhepatocytes for transplantation: State of theart. Cryobiology 53, 149–159.
22. Diener, B., Utesch, D., Beer, N., et al.(1993) A method for the cryopreservationof liver parenchymal cells for studies of xeno-biotics. Cryobiology 30, 116–127.
23. Horslen, S. P., Fox, I. J. (2004) Hepatocytetransplantation. Transplantation 77,1481–1486.
24. Fox, I. J., Roy-Chowdhury, J. (2004) Hepa-tocyte transplantation. J Hepatol 40,878–886.
25. Krishna Vanaja, D., Sivakumar, B.,Jesudasan, R. A., et al. (1998) In vivo iden-tification, survival, and functional efficacy oftransplanted hepatocytes in acute liver fail-ure mice model by FISH using Y-chromo-some probe. Cell Transpl 7, 267–273.
26. Sutherland, D. E., Numata, M., Matas, A. J.,et al. (1977) Hepatocellular transplantationin acute liver failure. Surgery 82, 124–132.
27. Baumgartner, D., LaPlante-O’Neill, P. M.,Sutherland, D. E., et al. (1983) Effects ofintrasplenic injection of hepatocytes, hepato-cyte fragments and hepatocyte culture super-natants on D-galactosamine-induced liverfailure in rats. Eur Surg Res 15, 129–135.
28. Demetriou, A. A., Reisner, A., Sanchez, J.,et al. (1988) Transplantation of microcar-rier-attached hepatocytes into 90% partiallyhepatectomized rats. Hepatology 8,1006–1009.
29. Rozga, J., Holzman, M., Moscioni, A. D.,et al. (1995) Repeated intraportal hepatocytetransplantation in analbuminemic rats. CellTranspl 4, 237–243.
30. De Vree, J. M., Ottenhoff, R., Bosma, P. J.,et al. (2000) Correction of liver disease byhepatocyte transplantation in a mouse modelof progressive familial intrahepatic cholesta-sis. Gastroenterology 119, 1720–1730.
31. Laconi, E., Oren, R., Mukhopadhyay, D. K.,et al. (1998) Long-term, near-total liverreplacement by transplantation of isolatedhepatocytes in rats treated with retrorsine.Am J Pathol 153, 319–329.
32. Guha, C., Parashar, B., Deb, N. J., et al.(2002) Normal hepatocytes correct serumbilirubin after repopulation of Gunn ratliver subjected to irradiation/partial resec-tion. Hepatology 36, 354–362.
33. Strom, S. C., Chowdhury, J. R., Fox, I. J.(1999) Hepatocyte transplantation for thetreatment of human disease. Semin LiverDis 19, 39–48.
34. Grossman, M., Raper, S. E., Kozarsky, K., et al.(1994) Successful ex vivo gene therapy direc-ted to liver in a patient with familial hypercho-lesterolaemia. Nat Genet 6, 335–341.
35. Grossman, M., Rader, D. J., Muller, D. W.,et al. (1995) A pilot study of ex vivo genetherapy for homozygous familial hypercho-lesterolaemia. Nat Med 1, 1148–1154.
36. Strom, S. C., Fisher, R. A., Rubinstein, W. S.,et al. (1997) Transplantation of human hepa-tocytes. Transpl Proc 29, 2103–2106.
37. Stephenne, X., Najimi, M., Smets, F., et al.(2005) Cryopreserved liver cell transplanta-tion controls ornithine transcarbamylasedeficient patient while awaiting liver trans-plantation. Am J Transpl 5, 2058–2061.
38. Sokal, E. M., Smets, F., Bourgois, A., et al.(2003) Hepatocyte transplantation in a 4-year-old girl with peroxisomal biogenesisdisease: technique, safety, and metabolic fol-low-up. Transplantation 76, 735–738.
39. Dhawan, A., Mitry, R. R., Hughes, R. D.,et al. (2004) Hepatocyte transplantation forinherited factor VII deficiency. Transplanta-tion 78, 1812–1814.
40. Thompson, R., Strautnieks, S. (2001) BSEP:function and role in progressive familialintrahepatic cholestasis. Semin Liver Dis 21,545–550.
41. Aronsen, K. F., Nylander, G. (1967) Use ofdirect protography in diagnosis of liver dis-eases. Radiology 88, 40–47.
42. Goss, J. A., Soltes, G., Goodpastor, S. E.,et al. (2003) Pancreatic islet transplantation:the radiographic approach. Transplantation76, 199–203.
43. Maleux, G., Gillard, P., Keymeulen, B., et al.(2005) Feasibility, safety, and efficacy of per-cutaneous transhepatic injection of beta-cellgrafts. J Vasc Interv Radiol 16, 1693–1697.
44. Owen, R. J., Ryan, E. A., O’Kelly, K., et al.(2003) Percutaneous transhepatic pancreaticislet cell transplantation in type 1 diabetesmellitus: radiologic aspects. Radiology 229,165–170.
Human Hepatocyte Transplantation Overview 15
45. Darwish, A. A., Sokal, E., Stephenne, X.,et al. (2004) Permanent access to the portalsystem for cellular transplantation using animplantable port device. Liver Transpl 10,1213–1215.
46. Fox, I. J., Chowdhury, J. R. (2004) Hepato-cyte transplantation. Am J Transpl 4 Suppl 6,7–13.
47. Terry, C., Dhawan, A., Mitry, R. R., et al.(2005) Preincubation of rat and human hepa-tocytes with cytoprotectants prior to cryopre-servation can improve viability and functionupon thawing. Liver Transpl 11, 1533–1540.
48. Mas, V. R., Maluf, D. G., Thompson, M.,et al. (2004) Engraftment measurement inhuman liver tissue after liver cell transplanta-tion by short tandem repeats analysis. CellTranspl 13, 231–236.
49. Wang, L. J., Chen, Y. M., George, D., et al.(2002) Engraftment assessment in humanand mouse liver tissue after sex-mismatchedliver cell transplantation by real-time quanti-tative PCR for Y chromosome sequences.Liver Transpl 8, 822–828.
50. Rogers, W. J., Meyer, C. H., Kramer, C. M.(2006) Technology insight: in vivo cell
tracking by use of MRI. Nat Clin Pract Car-diovasc Med 3, 554–562.
51. Soriano, H. E., Wood, R. P., Kang, D. C.(1997) Hepatocellular transplantation inchildren with fulminant liver failure. Hepa-tology 30, 239A.
52. Sterling, R. K., Fisher, R. A. (2001) Livertransplantation: Living donor, hepatocyte,and xenotransplantation, in (Gish, R., ed.),Current Future Treatment Therapies forLiver Disease. Clinics in Liver Disease, WBSaunders, Philadelphia.
53. Habibullah, C. M., Syed, I. H., Qamar, A.,et al. (1994) Human fetal hepatocyte trans-plantation in patients with fulminant hepaticfailure. Transplantation 58, 951–952.
54. Fisher, R. A., Strom, S. C. (2000) Humanhepatocyte transplantation: Biology andtherapy, in (Berry, M. N., Edwards, A. M.,ed.), Hepatocyte Review, Kluwer AcademicPublishers, Dordrecht, The Netherlands.
55. Fisher, R. A., Bu, D., Thompson, M., et al.(2000) Defining hepatocellular chimerismin a liver failure patient bridged with hepa-tocyte infusion. Transplantation 69,303–307.
16 Puppi and Dhawan

Chapter 2
Isolation of Human Hepatocytes
Ragai R. Mitry
Abstract
Protocols for isolation of human hepatocytes have been developed. The isolated cells can be used not only
in research but also for transplantation in patients with liver disease, especially acute liver failure and liver-
based metabolic/synthetic conditions. The aim of hepatocyte transplantation is to correct the missingliver function(s) and allow either the recovery of the liver or buy the patient time until a suitable donor liver
is available for transplantation.
Key words: Hepatocyte transplantation, donor liver, collagenase.
1. Introduction
Hepatocyte transplantation is emerging as a treatment for liver-based metabolic disease and as a means of liver support in acuteliver failure patients (1). The technique is dependent on theavailability of good quality hepatocytes isolated from unused/rejected liver for transplantation on the grounds of beingseverely steatotic, or having a long cold ischaemia time, andalso the remnants of liver after transplantation of a reduced sizeor split liver graft. The level of viability and cellular activity ofisolated hepatocytes are dependent on the quality of the originaltissue. The technique used for isolation of hepatocytes from livertissue is a standard collagenase perfusion technique based on theoriginal work by Berry and Friend (2), which was later modifiedby Seglen (3).
Anil Dhawan, Robin D. Hughes (eds.), Hepatocyte Transplantation, vol. 481� Humana Press, a part of Springer ScienceþBusiness Media, LLC 2009DOI 10.1007/978-1-59745-201-4_2 Springerprotocols.com
17

2. Materials
2.1. Human Liver
Tissue
The following protocol can be used for isolation of hepatocytesfrom donor liver tissue unused/rejected for transplantation, and isbased on previously published protocols (4, 5). Appropriate ethi-cal approvals and signed consent forms must be obtained prior toprocessing of any tissues, and the appropriate rules and regula-tions for human tissue processing, cell handling and storage mustbe followed (see Note 1).
2.2. Chemicals
and Solutions
The following is a list of the chemicals and solutions used in thehepatocyte isolation procedure and cell culture:1. Hank’s Balanced Salt Solution (HBSS) without calcium or
magnesium (Cat. No. 10-547F; Cambrex Bio ScienceWokingham Ltd., Berkshire, UK)
2. Eagle’s Minimum Essential Medium containing 25 mMHEPES (4-(2-hydroxyethyl)-1-piperazineethanesulphonicacid) (EMEM/HEPES), without phenol red and calcium(Cat. No. 12-136Q; Cambrex, UK)
3. 1 M HEPES solution (Cat. No. BE17-737E; Cambrex, UK)
4. Collagenase P (Cat. No. 11213873001; Roche DiagnosticsLtd., East Sussex, UK)
5. Ethyleneglycol-bis(beta-aminoethyl ether)-N,N,N 0,N 0-tetraacetic acid (EGTA) (Cat. No. E4378; Sigma-AldrichCompany Ltd., Dorset, UK)
6. 1.0 N NaOH solution (Cat. No. 319511; Sigma-Aldrich Ltd.)
7. Bovine serum albumin (BSA), (Cat. No. A2153; Sigma-AldrichLtd.) (see Note 2)
8. DNaseI (Cat. No. DN25; Sigma-Aldrich Ltd.) (see Note 3)
9. William’s E medium (WEM) (Cat. No. E7023; Sigma-Aldrich Ltd.)
10. Foetal calf serum (FBS), heat-inactivated (Cat. No. 10108-165; Invitrogen Ltd., Paisley, UK)
11. Insulin (Cat. No. I1882; Sigma-Aldrich Ltd.)
12. Dexamethasone (Cat. No. D8893; Sigma-Aldrich Ltd.)
13. Ethanol (Cat. No. E7023; Sigma-Aldrich Ltd.)
14. Glacial acetic acid (Cat. No. A9967; Sigma-Aldrich Ltd.)
15. QuantiChromTM Urea Assay Kit (Cat. No. DIUR-500;BioAssay Systems, Hayward CA, USA)
16. 1� Phosphate-buffered saline (PBS) tablets (Cat. No. P4417;Sigma-Aldrich Ltd.)
17. Sterile deionised water
18. Distilled water
18 Mitry

2.3. Preparation
of Solutions
2.3.1. Perfusion
Solutions
The four buffer solutions required during the isolation and pre-paration of human hepatocytes are listed below. Sufficientvolumes of these solutions must be prepared under sterile condi-tions (i.e. inside a cell culture laminar flow cabinet).1. 250 mM EGTA: dissolve 1.902 g EGTA in 1.0 N NaOH
solution (final volume should be 20 ml) and sterilise byfiltration using a 0.2 mm filter inside a laminar flow cabinet.The EGTA solution should be stored as small aliquots in afridge.
2. Perfusion solution 1 (P1): for every 500 ml HBSS add 1 ml of250 mM EGTA stock solution and�2.3 ml 1 M HEPES andmix well (final pH should be 7.3–7.4).
3. Perfusion solution 2 (P2): 500 ml HBSS.
4. Perfusion solution 3 (P3): 1 l EMEM/HEPES containing0.5 g collagenase P. Collagenase should be weighed in asterile Falcon1 tube and dissolved in 50 ml of the EMEM/HEPES. The collagenase solution is sterilised by passing itthrough a 0.2 mm filter into a fresh 50 ml Falcon1 tube, thenadd to the 950 ml EMEM/HEPES and mix well.
5. Wash solution (W): 1 l EMEM/HEPES containing 50 g BSA(final concentration 5%). BSA should be weighed, dissolvedand sterilised prior to use similar to collagenase preparation(see step 3 above). Maintain the sterile solution on ice untilrequired.
Perfusion solutions (P1, P2 and P3) must be maintained at 378Cafter preparation, while the wash solution (W) should be main-tained on ice.
Example: for 100 g liver tissue prepare 500 ml of P1, 500 mlof P2, 1000 ml of P3 and 1000–1200 ml of W.
2.3.2. Preparation
of Supplements
and Culture Medium
1. Dexamethasone (40 mg/ml): dissolve 1 mg dexamethasonein 1 ml absolute alcohol (ethanol) by gentle swirling, thenadd 24 ml culture medium. Store solution in small aliquots at–208C. Avoid repeated freeze/thaw.
2. Insulin (10 mg/ml): dissolve 100 mg insulin in 10 ml acid-ified sterile water (pH�2.0; prepared by adding approx.0.1 ml glacial acetic acid to 9.9 ml water). Store solution insmall aliquots at 2–88C (stable for 1 year).
The culture medium to be used should be prepared by adding thefollowing supplements to 500 ml of WEM:
� 50 ml FBS� 5 ml of 1 M HEPES� 5 ml L-glutamine
Isolation of Human Hepatocytes 19

� 5 ml penicillin/streptomycin� 0.5 ml of dexamethasone stock solution� 28.6 ml of insulin stock solution
Mix well by gentle swirling of the medium bottle. The bottle couldbe stored at 2–88C for up to 1 month.
2.4. Other Items 1. Water bath.
2. Multi-channel perfusion pump (e.g. Masterflex1 L/S Pumppurchased from Cole-Parmer Instrument Company Ltd.,London, UK).
3. Perfusion tubes: Masterflex1 silicon rubber tubings size 16(Cat. No. 96400-16; Cole-Parmer Instrument CompanyLtd.). Short pieces (10 cm approximately) of this tubing areused for cannulating blood vessels (see Note 4).
4. Bottle top works to fit perfusion solution bottles (Cat. No.734-5043; VWR International, Leicestershire, UK). It is abottle cap with three tubes passing through it.
5. Sterile swabs (10�10 cm) type Topper 8 (Cat. No. TS8105;Johnson & Johnson Medical, Skipton, UK).
6. Refrigerated benchtop centrifuge.
7. Short connectors (Avon Medicals Cat. No. R93; SIMS PortexLtd., Kent, UK).
8. Sutures (3-0 or 4-0), e.g. Ethicon-coated Vicryl1 (Cat. No.W9130; Johnson & Johnson Medical).
9. BD BioCoatTM collagen I 24-well multiwell plates (Cat. No.356408; BD Biosciences, San Jose CA, USA).
10. Flat-bottom 96-well plates with lids (Cat. No. 734-2097;VWR International).
3. Methods
3.1. Liver Tissue
Digestion
1. Major blood vessels on the cut surface of the liver tissue arecannulated and the cannulae secured by suturing. Other smallblood vessels not used for perfusion should be closed bysuturing to minimise fluid leakage during perfusion.
2. A short connector is fitted to the free end of each cannula.
3. Long perfusion tubes are passed through the perfusion pumpheads, and using a short connector, connect one of the freeends of each perfusion tube to the bottle top works fitted tothe P1 solution bottle, which is maintained in the water bathat 378C.
20 Mitry

4. The perfusion lines are then primed with P1 solution. Theother free end of each perfusion tube is then connected to theshort connector fitted to the cannula.
5. The perfusion pump is then set to 60–80 ml/min flow rateand then switched on to start the perfusion process.
6. Following the perfusion with the three perfusion solutions(P1, P2 and P3), the digested tissue is then transferred into asterile metal bowl. The cannulae and sutures are removed,and ice-cold W solution is poured onto the digested tissueuntil the tissue is completely covered.
7. Mince digested tissue using a sterile pair of scissors or scalpelblades to release hepatocytes, followed by filtration throughtwo single layers of sterile swabs.
3.2. ‘‘Purification’’
of Hepatocytes
1. Aliquot the cell suspension obtained into 50 ml Falcon1 tubes,and pellet hepatocytes by centrifugation at 50�g, 48C for 4 min.
2. Discard supernatant, then resuspend each pellet in 50 ml ice-cold W solution, and re-centrifuge tubes. Repeat the wash/centrifugation steps two to three more times.
3. Estimate the cell count and viability using the standard Trypanblue exclusion technique (6).
4. Fresh hepatocytes are ready to use, or cryopreserved andstored in the vapour phase of liquid nitrogen storage tank orin a –1408C freezer for future use (see Chapter 3).
3.3. Synthetic/
Metabolic Activity
Assay
Several liver- or hepatocyte-specific functional assays could beused to assess or evaluate the synthetic/metabolic activity of theisolated hepatocytes such as the production of urea resulting fromthe detoxification of ammonia.
3.3.1. Urea Production Urea could be measured in the culture medium of hepatocytecultures. The isolated hepatocytes are plated in wells of collagen-coated 24-well plates, and after 24 h incubation, samples of theculture medium are collected and analysed (see Note 5).
3.3.1.1. Plating
Hepatocytes
1. Place 1 ml PBS in each well of the collagen-coated culture plate,and incubate the plate in a cell culture incubator for 10–15 min.
2. Remove PBS and place 3�105 hepatocytes in each well in 500mlWEM with supplements.
3. Incubate the plate for 24 h in the cell culture incubator.
4. Collect culture medium samples from all wells, and measurethe urea levels.
3.3.1.2. Measurement
of Urea in Culture
Medium
This assay is carried out according to the supplier’s protocol.1. Dilute the urea standard (50 mg/dl) provided in the kit to a
final concentration of 10 mg/dl. This could be done by mixing
Isolation of Human Hepatocytes 21

80 ml urea standard with 320 ml distilled water in a 1.5 mlmicrofuge tube.
2. Use the diluted urea standard (10 mg/dl) to prepare a ureastandard curve with a range of 0–10 mg/dl (Table 2.1).
3. Place the urea standards in duplicates of 50 ml in the wells of aflat-bottom 96-well plate.
4. Place duplicates of 25 ml culture medium samples in the wellsand add 25 ml distilled water to each well. A duplicate of freshsample of culture medium/distilled water (1:1) must beincluded, and its mean urea value must be subtracted fromthe mean urea values of the test samples (see Note 6).
5. Prepare enough ‘‘working reagent’’ by mixing equal volumesof Reagent A and Reagent B (provided in the kit) shortly priorto assay.
6. Add 200 ml of ‘‘working reagent’’ per well and tap the platelightly to mix.
7. Cover the plate and incubate for 30 min at room temperature.
8. Read optical density at 470–550 nm (peak absorbance at520 nm) using a plate reader.
9. Using the urea standard curve, estimate the levels of urea inyour samples. Urea values of the culture medium samples mustbe multiplied by the dilution factor of 2.
4. Notes
1. Clinical-grade hepatocytes can be prepared under strict sterileconditions using the same isolation protocol. This requires theprocessing of the liver tissue and hepatocytes in an accredited
Table 2.1Urea standard curve dilutions
Final ureaconcentration (mg/dl)
Volume of diluted ureastandard (ml)
Volume of distilledwater (ml)
0 0 50
2 10 40
4 20 30
6 30 20
8 40 10
10 50 0
22 Mitry

good manufacturing practice unit, which operates accordingto regulations set by a specialised governmental agency,e.g. in the United Kingdom, the Human Tissue Authority(see Notes 2 and 3).
2. BSA is an animal product and must not be used if the cellsisolated from unused donor liver tissue and are going to beused for clinical transplantation. Human serum albuminshould be used instead.
3. Over-digestion of the perfused tissue leads to an increasednumber of dead cells, which may release their contents. Oneof the released components is DNA, which is ‘‘sticky’’ and actsas ‘‘glue’’, making cells stick together with the formation of cellclumps. To avoid this problem, DNaseI could be added(50 mg/l) to solution P3 at the time of preparation. DNaseImust not be used if cells are going to be used for clinicaltransplantation.
4. For narrow blood vessels intravenous cannula (16–18 G) couldbe used.
5. Culture medium samples could be stored at –208C untilrequired for analysis.
6. FCS added to the culture medium contains urea and may affectthe results; therefore a duplicate of samples of diluted freshculture medium must be analysed alongside the test samples.
References
1. Fisher, R. A., Strom, S. C. (2006) Humanhepatocyte transplantation: worldwide results.Transplantation 82, 441–449.
2. Berry, M. S., Friend, D. S. (1965) High yieldpreparation of isolated rat liver parenchymalcells. J Cell Biol 43, 506–520.
3. Seglen, P. O. (1976) Preparation of rat livercells. Meth Cell Biol 13, 29–83.
4. Strom, S. C., Dorko, K., Thompson, M. T., et al.(1998) Large scale isolation and culture of
human hepatocytes, in (Franco, D., Boud-jema, K., Varet, B., eds.), Ilots de Langerhanset hepatocytes, pp. 195–205. Les EditionsINSERM, Paris.
5. Mitry, R. R., Hughes, R. D., Aw, M. M., et al.(2003) Human hepatocyte isolation and rela-tionship of cell viability to early graft function.Cell Transpl 12, 69–74.
6. Freshney, R. I. (2000) Culture of AnimalCells. Wiley-Liss, New York, NY, pp. 309–328.
Isolation of Human Hepatocytes 23

Chapter 3
An Optimised Method for Cryopreservationof Human Hepatocytes
Claire Terry and Robin D. Hughes
Abstract
Successful cryopreservation of hepatocytes is essential for their use in hepatocyte transplantation.Cryopreservation allows hepatocytes to be available for emergency treatment of acute liver failureand also for planned treatment of liver-based metabolic disorders. In addition, cryopreservation ofhuman hepatocytes can facilitate their use in metabolism and toxicity studies. Cryopreservation canadversely affect the viability and function, especially reduce the attachment efficiency, of hepatocyteson thawing.
The cryopreservation process can be divided into steps so that improvements can be made on the‘standard’ protocols that are followed in some laboratories. These steps are as follows: pre-incubation ofcells; freezing solution, cryoprotectants and cytoprotectants; freezing process; storage; thawing; post-thawing culture. This chapter presents an optimised protocol for cryopreservation of human hepatocytesas developed at King’s College Hospital.
Key words: Human hepatocytes, cryopreservation, freezing, hepatocyte function, UW solution,glucose, fructose.
1. Introduction
Human hepatocyte preparations are limited by a lack of humantissue. Sources (from rejected or unused donor tissue or fromliver resection tissue) are limited, erratic and unpredictable. How-ever, when tissue is available, often large numbers of cells can beisolated. The problem is that usually not all the cells can be usedimmediately and hepatocytes do not proliferate in vitro (1).Therefore, a reliable method for preserving hepatocytes is essen-tial. Currently, the only method for long-term preservation ofcells is cryopreservation.
Hepatocyte cryopreservation was first fully investigated andpublished in the 1980s (2, 3). Since then cryopreservation protocols
Anil Dhawan, Robin D. Hughes (eds.), Hepatocyte Transplantation, vol. 481� Humana Press, a part of Springer ScienceþBusiness Media, LLC 2009DOI 10.1007/978-1-59745-201-4_3 Springerprotocols.com
25

have been published for hepatocytes from a variety of animal species,including rat (4, 5), pig (6, 7), mouse (8, 9), monkey (10, 11) anddog (12, 13). Optimised human hepatocyte cryopreservation pro-tocols are fewer, presumably due to the limitation of human tissue toprepare hepatocytes for experiments, but there are still a largenumber of published human protocols (3, 14–22). Even with thebest of these protocols, there is still a significant loss of function andthis is related to the quality of the fresh cells and the type and natureof the liver tissue from which they were isolated (23). The state ofthe art of cryopreservation for hepatocyte transplantation hasrecently been reviewed (24).
2. Materials
2.1. Pre-incubation 1. William’s E Medium (WEM, Sigma-Aldrich Company Ltd.,Gillingham, Dorset, UK) is prepared with the following addi-tions: penicillin (50 U/ml, Life Technologies Ltd., Paisley,Scotland, UK) and streptomycin (50 mg/ml, Life Technolo-gies Ltd.), L-glutamine (2 mM, Life Technologies Ltd.) and4-(2-hydroxyethyl)-1-piperazineethanesulphonic acid (HEPES,100 mM, Sigma-Aldrich Company Ltd.).
2. Heat-inactivated foetal calf serum (FCS, Life Technologies Ltd.).
3. Falcon tubes – 50 ml sterile conical bottom (BD Biosciences,Cowley, Oxfordshire, UK).
4. Glucose, fructose, a-lipoic acid (Sigma-Aldrich Company Ltd.).
2.2. Freezing Solution 1. University of Wisconsin (UW) solution (Bristol-Myers SquibbPharma Ltd., Hounslow, UK).
2. Dimethyl sulphoxide (DMSO, Sigma-Aldrich Company Ltd.).
2.3. Cryopreservation
Process
1. Kryo 10 Controlled Rate Freezer (CRF), Series III (PlanerProducts Ltd., Middlesex, UK).
2. Cryotubes (5 ml, Nunc Nalgene, Hereford, UK).
2.4. Storage 1. –1408C freezer (Lab Impex Research Ltd., East Sussex, UK).
2.5. Thawing 1. Waterbath (Model JB2, Grant Instruments (Cambridge) Ltd.,Royston, Hertfordshire, UK).
2.6. Culture and
In Vitro Cell Assays
1. Trypan blue solution (0.4%, Sigma-Aldrich Company Ltd.).
2. Collagen-coated (BiocoatTM) flat-bottom 96-well cultureplates (BD Biosciences).
3. Culture media consists of phenol red-free WEM with theadditions in Section 2.1, Point 1, and 5% (v/v) FCS.
26 Terry and Hughes

4. An incubator for culture is used (95% O2/5% CO2, Function-Line Incubator, Heraeus Instruments, Hanau, Germany).
5. For subsequent in vitro assays of hepatocyte function, serum-free WEM is used (i.e. the above WEM without the FCSaddition).
3. Methods
3.1. Pre-incubation 1. Human hepatocytes (1.5�107 cells/tube) isolated asdescribed in this volume in Chapter 2 by Mitry are pelletedby centrifugation at 50� g for 5 min at 48C and the super-natant is removed.
2. The pellet is resuspended in 5 ml pre-incubation media con-sisting of WEM containing 10% FCS (see Note 1) and a pre-incubation compound (200 mM glucose, 200 mM fructose or2.5 mM a-lipoic acid, see Note 2) to give a final cell density of3�106 viable hepatocytes per millilitre in Falcon tubes (total of1.5�107 cells in 5 ml pre-incubation media, see Note 3).
3. The pre-incubation tubes are then placed in a 48C refrigeratorfor 2 h.
3.2. Freezing Solution 1. After 2 h of incubation, treatment tubes are mixed by inversionand centrifuged at 50� g for 5 min at 48C.
2. The supernatant is removed and cryovials are kept on ice whilethe freezing solution is added.
3. Freezing media consists of UW solution (see Note 4). A con-centration of 300 mM of glucose or 300 mM of fructose canalso be added to the freezing solution. All freezing mediashould be freshly prepared on the day of use, and the pHchecked and changed to pH 7.4 if necessary.
4. The freezing media is added, ice-cold, to the cryovials contain-ing the hepatocyte pellets to make up the final volume (cells +freezing media) of 4.5 ml.
5. A volume of 0.5 ml DMSO (see Note 5) is then added, drop-wise, to all cryovials to give a final DMSO concentration of10% (v/v).
6. The suspension can be kept on ice for a maximum of 5 minbefore the cryopreservation process begins.
3.3. Cryopreservation
Process
1. The CRF should be set up, ensuring there is sufficient liquidnitrogen in the tank for the run, so that it is ready to beginfreezing as soon as possible, or within 5 min, after the DMSOhas been added to the hepatocyte solution.
An Optimised Method for Cryopreservation of Human Hepatocytes 27

2. When the CRF has reached the start temperature (88C), sam-ples are inserted into the tube rack and the freezing protocolinitiated (see Note 6).
3. Table 3.1 shows the standard freezing protocol used, consist-ing of nine steps (see Notes 7 and 8).
4. The freezing protocol takes approximately 50 min.
3.4. Storage 1. The frozen cryovials should be immediately transferred to a–1408C freezer (see Notes 9 and 10).
3.5. Thawing 1. After storage at –1408C (see Note 11), the frozen cell suspen-sions can be rapidly thawed in a 378C water bath with gentleagitation (see Note 12).
2. When all ice has disappeared (�1–2 min), the cell suspensioncan be transferred to a fresh ice-cold tube.
3. Dilution of the cryoprotectant should be carried outimmediately with thawing media consisting of ice-coldWEM containing 20% FCS and an additional cytoprotec-tant if required (300 mM glucose, 300 mM fructose or5 mM a-lipoic acid).
4. For every 1 ml of cell suspension thawed, the following volumeof thawing medium is added drop-wise and with 5 min on icebetween each addition: 0.5, 1, 2, 3 and 6 ml (19).
Table 3.1Optimised Controlled Rate Freezer Protocol
StepStarttemperature Rate Time
Endtemperature
1 88C –18C/min 8 min 08C
2 08C HOLD 8 min 08C
3 08C –28C/min 4 min –88C
4 –88C –358C/min 33 s –288C
5 –288C –2.58C/min 2 min –338C
6 –338C +2.58C/min 2 min –288C
7 –288C –18C/min 32 min –608C
8 –608C –108C/min 4 min –1008C
9 –1008C –208C/min 2 min –1408C
28 Terry and Hughes

5. The hepatocytes are then pelleted by centrifugation at 50� g at48C for 5 min and the pellet is resuspended in a known volumeof WEM.
6. For a description of modifications of the protocol for clinicalhepatocytes (see Note 13).
3.6. Culture and
In Vitro Cell Assays
1. Cell counts and crude viability assessments can be determinedusing the trypan blue exclusion method.
2. Hepatocytes are cultured (30,000 viable cells/well) in 96-wellflat-bottomed collagen-coated plates.
3. Culture media consists of WEM containing 10% FCS, penicil-lin (50 U/ml) and streptomycin (50 mg/ml), and L-glutamine(2 mM) at 378C in 95% O2/5% CO2.
4. After 24 h of culture, attachment efficiency can be determinedby measuring the protein content (25) of attached cells andthat of the initial number of cells (30,000 total cells/well).
4. Notes
1. FCS is commonly used as an addition to cell culture media toprovide a ‘cocktail’ of factors required for cell proliferation andmaintenance (26). The complex list of components in FCSincludes growth factors (e.g. epidermal growth factor, plate-let-derived growth factor), trace elements (e.g. iron, zinc),lipids (e.g. cholesterol, linoleic acid), polyamines (e.g. putres-cine, ornithine), attachment factors (e.g. fibronectin, laminin),mechanical protection and buffering capacity (e.g. albumin),metal transporters (e.g. transferin, ceruloplasmin) and proteaseinhibitors (e.g. a1-antitrypsin, a2-macroglobulin). 10% FCS isoften used as an addition to WEM for culture of hepatocytes. Itcan also be used in cryopreservation media but cannot be usedfor cryopreserving hepatocytes for clinical transplantation.
2. Pre-incubation of hepatocytes with glucose, fructose ora-lipoic acid at 48C prior to cryopreservation has been foundto improve thawed hepatocyte viability and function (27).There was no evidence that using the three compounds incombination had an additive effect.
3. It is possible to successfully freeze cells at densities of up to1�107/ml, if larger cell numbers are required, for clinical use.For this purpose, 50 and 250 ml Cryocyte freezing bags (Bax-ter, Oxford, UK) may be more suitable than cryotubes.
4. UW solution is an intracellular fluid type electrolyte composi-tion with high potassium and low sodium content. The solu-tion aims to improve hypothermic storage by five mechanisms:
An Optimised Method for Cryopreservation of Human Hepatocytes 29

(1) minimising hypothermic-induced cell swelling; (2) prevent-ing intracellular acidosis; (3) preventing the expansion of inter-stitial space; (4) preventing injury from oxygen free radicals; and(5) providing substrates for regenerating high-energy phosphatecompounds (e.g. ATP). These aims are achieved by includinglactobionate (to prevent cell swelling and acidosis) and trisacchar-ide raffinose (to increase osmotic pressure). Hydroxyethyl starchand raffinose elevate the intracellular osmotic pressure to stabilisethe cell membrane. Mannitol is a hydroxyl radical scavenger.Glutathione, adenosine and allopurinol facilitate the productionof ATP and prevent active oxygen-induced cellular damage.
5. DMSO is able to enter the cells (a permeable cryoprotectant)and reduces cell injury by moderating the increase in soluteconcentration during freezing. The polar sulphoxide moietyof DMSO also interacts electrostatically with phospholipidmembranes (28). DMSO has been shown to decrease thetemperature at which the lamellar phases of phosphatidy-lethanolamines are induced to transform into hexagonal-IIstructures (non-lamellar structure) that preserve membraneintegrity during freeze-thaw (29). During freezing, DMSOcan keep the non-bilayer lipids in an association with intrinsicmembrane proteins and prevent phase separation of the non-bilayer lipids during the cooling phase (30).
6. To monitor the temperature changes in the cell suspension, anextra cryovial containing the standard cell suspension can beused with the CRF temperature probe inserted to record thetemperature during freezing.
7. The aim of the CRF protocol is to attain a linear decrease oftemperature in the cell suspension during freezing (Fig. 3.1).
8. The CRF protocol introduces a shock cooling step at the pointwhen crystallisation is estimated to occur, to prevent the latentheat of fusion, which is suddenly released at the point of
–150
–100
–50
0
500 5 10 15 20 25 30 35 40 45 50
Minutes
Tem
pera
ture
(de
gree
s C
)
Chamber Temperature
Ideal Temperature in Cell Suspension
Fig. 3.1. Standard Freezing Protocol Employed with the Controlled Rate Freezer. The actualtemperature decrease in the freezing chamber of the CRF (solid line) and the desiredtemperature decrease in the cell suspension (dashed line) according to the standardfreezing protocol are shown. The freezing protocol employs different rates of freezing totry and attain this linear decrease in the cell suspension temperature.
30 Terry and Hughes

crystallisation resulting in the cell sample being warmedslightly. This phenomenon has also been investigated in rathepatocytes by Houle et al. (31), who showed that the releaseof latent heat occurred at –298C with an increase of 28C. Byintroducing this shock cooling step at –88C (rapid coolingfrom –88C to –288C in 6 s), controlled nucleation of ice andimmediate crystallisation of the cell suspension were achievedand the damaging latent heat release eliminated. An additionalstep (increase in temperature to –288C in 2 min) to prevent toorapid cooling of the cell suspension complemented the proto-col. The protocol also takes advantage of the strategy to avoidcryopreservation damage by using rapid cooling interruptedwith steps of isothermal holding periods to achieve enoughcellular dehydration to prevent intracellular ice formationwhile minimising the total freezing time. The period of hold-ing the hepatocytes at 08C for 8 min allows time for transmem-brane water transport. This approach minimises the cellexposure time to solution effects while avoiding the criticalstates associated with ice formation (32, 33).
9. The storage temperature of cryopreserved hepatocytes is impor-tant. Storage at –808C, for example, gives loss of cryopreservedhuman hepatocyte viability and cellular GSH content progres-sively over 1–4 days of storage after cryopreservation (34).
10. Acceptable storage temperatures are at –1408C in a freezer,–1508C in the vapour phase of liquid nitrogen storage tanks(e.g. 14, 21, 35, 36) or at –1968C in the liquid phase of liquidnitrogen (e.g. 15, 19, 22).
11. The possible length of storage time is debatable. Our studyfound no effect on hepatocyte viability or function after up to3 years of storage. Generally, no effect of storage time is seenwhen hepatocytes are stored at <–1408C (15, 18, 35). Douet al. (15) have shown the successful storage of cryopreservedhuman hepatocytes for up to 1 year of storage at –1968C andChesne et al. (37) have found the viability and attachmentefficiency of cryopreserved human hepatocytes wereunchanged after four years of storage in these conditions.
12. The optimum thawing protocol for hepatocytes is generallyagreed to be rapid thawing at 378C (to prevent recrystallisa-tion) with slow dilution of the cryoprotectant (to reduce osmo-tic imbalances) at 48C (to reduce possible toxicity of thecryoprotectant). If the thawing rate is not rapid enough, intra-cellular ice crystals can reform and coalesce into larger, moredamaging crystals (38, 39). If the cryoprotectant is not dilutedout of the cell suspension slowly enough, osmotic shock mayoccur due to outflow of the cryoprotectant from the cells (40).If the temperature of dilution is not at 48C, toxicity may occurfrom further exposure to the cryoprotectant.
An Optimised Method for Cryopreservation of Human Hepatocytes 31

13. The protocol can be slightly adapted, using only clinicallyapproved solutions, no animal products and following MHRAguidelines, to allow the hepatocytes to be suitable for clinicaluse. The following adaptations of the protocol are required:
� Pre-incubation may not be possible due to the larger number ofcells to be cryopreserved. However, if this step is required thepre-incubation media should consist of UW solution contain-ing either 300 mM glucose or 300 mM fructose only.� Freezing bags (10 ml) can be used instead of cryovials with a
freezing density of 1�107 viable cells/ml.� Freezing media and thawing media should consist of UW solu-
tion with 10% DMSO and either glucose (300 mM) or fructose(300 mM).
Acknowledgements
We thank Merck Sharp and Dohme Ltd. and the Children’s LiverDisease Foundation for their financial support.
References
1. Strom, S. C., Fisher, R. A., Rubinstein, W. S.,et al. (1997) Transplantation of human hepa-tocytes. Transpl Proc 29, 2103–2106.
2. Fuller, B. J., Morris, G. J., Nutt, L. H., et al.(1980) Functional recovery of isolated rathepatocytes upon thawing from –1968C.Cryo Lett 1, 139–146.
3. Loretz, L. J., Li, A. L., Flye, M. W., et al.(1989) Optimization of cryopreservationprocedures for rat and human hepatocytes.Xenobiotica 19, 489–498.
4. Chesne, C., Guillouzo, G. A. (1988) Cryo-preservation of isolated rat hepatocytes: a cri-tical evaluation of freezing and thawingconditions. Cryobiology 25, 323–330.
5. De Loecker, W., Koptelov, V. A.,Grischenko, V. I., et al. (1998) Effects ofcell concentration on viability and metabolicactivity during cryopreservation. Cryobiology37, 103–109.
6. Koebe, H. G., Dahnhardt, C., Muller-Hocker, J., et al. (1996) Cryopreservationof porcine hepatocyte cultures. Cryobiology33, 127–141.
7. Naik, S., Santangini, H. A., Trenkler, D. M.,et al. (1997) Functional recovery of porcinehepatocytes after hypothermic or cryogenic
preservation for liver support systems. CellTranspl 6, 447–454.
8. Canaple, L., Nurdin, N., Angelova, N., et al.(2001) Maintenance of primary murinehepatocyte functions in multicomponentpolymer capsules – in vitro cryopreservationstudies. J Hepatol 34, 11–18.
9. Nyberg, S. L., Sreekumar, R., Yagi, T., et al.(2001) Impact of cryopreservation on hepa-tocyte gene expression. ILTS ELTA LIC-AGE Berlin 63.
10. De Sousa, G., Nicolas, F., Placidi, M., et al.(1999) A multi-laboratory evaluation ofcryopreserved monkey hepatocyte functionsfor use in pharmaco-toxicology. Chemico-Biol Interact 121, 77–97.
11. Hewitt, N. J., Fischer, T., Zuehlke, U., et al.(2000) Metabolic activity of fresh and cryo-preserved cynomolgus monkey (Macaca fas-ciculris) hepatocytes. Xenobiotica 30,665–681.
12. Kasai, S., Mito, M. (1993) Large-Scale Cryo-preservation of isolated dog hepatocytes.Cryobiology 30, 1–11.
13. Swales, N., Utesch, D. (1998) Metabolic activ-ity of fresh and cryopreserved dog hepatocytesuspensions. Xenobiotica 28, 937–948.
32 Terry and Hughes

14. Rijintes, P. J. M., Moshage, H. J., Van Gemert,P. J. L., et al. (1986) Cryopreservation of adulthuman hepatocytes: the influence of deep freez-ing storageon the viability, cell seeding, survival,fine structures and albumin synthesis in primarycultures. J Hepatol 3, 7–18.
15. Dou, M., De Sousa, G., Lacarelle, B., et al.(1992) Thawed human hepatocytes in pri-mary culture. Cryobiology 29, 454–469.
16. Diener, B., Traiser, M., Arand, M., et al.(1994) Xenobiotic metabolising enzymeactivities in isolated and cryopreservedhuman liver parenchymal cells. Toxicol InVitro 8, 1161–1166.
17. Adams, R. M., Wang, M., Crane, A. M., et al.(1995) Effective cryopreservation and long-term storage of primary human hepatocyteswith recovery of viability, differentitation,and replicative potential. Cell Transpl 4,570–586.
18. Li, A. P., Gorycki, P. D., Hengstler, J. G., et al.(1999) Present status of the application of cryo-preserved hepatocytes in the evaluation of xeno-biotics: consensus of an international expertpanel. Chemico-Biol Interact 121, 117–123.
19. Steinberg, P., Fischer, T., Kiulies, S., et al.(1999) Drug metabolizing capacity of cryo-preserved human, rat, and mouse liver par-enchymal cells in suspension. Drug MetabDisp 27, 1415–1422.
20. Hengstler, J. G., Utesch, D., Steinberg, P.,et al. (2000) Cryopreserved primary hepato-cytes as a constantly available in vitro modelfor the evaluation of human and animalsdrug metabolism and enzyme induction.Drug Metab Rev 32, 81–118.
21. Ostrowska, A., Bode, D. C., Pruss, J., et al.(2000) Investigation of functional and mor-ophological integrity of freshly isolated andcryopreserved human hepatocytes. Cell Tis-sue Bank 1, 55–68.
22. Alexandre, E., Viollon-Abadie, C., David, P.,et al. (2002) Cryopreservation of adulthuman hepatocytes obtained from resectedliver biopsies. Cryobiology 44, 103–113.
23. Terry, C., Mitry, R. R., Lehec, S. C., et al.(2005) The effects of cryopreservation onhuman hepatocytes obtained from differentsources of liver tissue. Cell Transpl 14,527–536.
24. Terry, C., Dhawan, A., Mitry, R. R., et al.(2006) Cryopreservation of isolated humanhepatocytes for transplantation: state of theart. Cryobiology 53, 149–159.
25. Lowry, O. H., Roseburgh, N. J., Farr, A. L.,et al. (1951) Protein measurement with theFolin phenol reagent. J Biol Chem 193,265–275.
26. Cartwright, T., Shah, G. P. (1994) Culturemedia. in (Davis, J. M., ed.), Basic Cell Cul-ture: A Practical Approach, pp. 57–91.Oxford University Press, New York:.
27. Terry, C., Dhawan, A., Mitry, R. R., et al.(2006) Pre-incubation of rat and humanhepatocytes with cytoprotectants prior tocryopreservation can improve viability andfunction on thawing. Liver Transpl 12,165–177.
28. Anchordoguy, T. J., Cecchini, C. A., Crowe,J. H., et al. (1991) Insights into the cryopro-tective mechanism of dimethyl sulfoxide forphospholipid bilayers. Cryobiology 28,467–473.
29. Yu, Z. W., Quinn, P. J. (1998) The modula-tion of membrane structure and stability bydimethyl sulphoxide (Review). Mol MembBiol 15, 59–68.
30. Quinn, P. J. (1985) A lipid phase separationmodel of low-temperature damage to biolo-gical membranes. Cryobiology 22, 128–146.
31. Houle, R., Raoul, J., Levesque, J. F., et al.(2003) Retention of transporter activities incryopreserved, isolated rat hepatocytes.Drug Metab Disp 31, 447–451.
32. Harris, C. L., Toner, M., Hubel, A., et al.(1991) Cryopreservation of isolated hepato-cytes: intracellular ice formation under var-ious chemical and physical conditions.Cryobiology 28, 436–444.
33. Fuller, B. J., DeLoecker, L. W. (1997) Hepa-tocyte cryopreservation. in Mito, M., Sawa,M., eds.), Hepatocyte Transplantation, pp.22–33. Karger Landes Systems, Netherlands.
34. Coundouris, J. A., Grant, M. H., Engeset, J.,et al. (1993) Cryopreservation of human adulthepatocytes for use in drug metabolism andtoxicity studies. Xenobiotica 23, 1399–1409.
35. De Sousa, G., Langouet, S., Nicolas, F., et al.(1996) Increase of cytochrome P-450 1Aand glutathione transferase transcripts in cul-tured hepatocytes from dogs, monkeys, andhuman after cryopreservation. Cell Biol Tox-icol 12, 351–358.
36. Skett, P., Roberts, P., Khan, S. (1999) Main-tenance of steroid metabolism and hormoneresponsiveness in cryopreserved dog, monkey,and human hepatocytes. Chemico-Biol Interact121, 65–76.
An Optimised Method for Cryopreservation of Human Hepatocytes 33

37. Chesne, C., Guyomard, C., Fautrel, A., et al.(1993) Viability and function in primary cul-ture of adult hepatocytes from various animalspecies and human beings after cryopreserva-tion. Hepatology 18, 406–414.
38. Karlsson, J. O. M., Toner, M. (1996)Long-term storage of tissues by cryopre-servation: critical issues. Biomaterials 17,243–256.
39. Karlsson, J. O. M., Cravalho, E. G., BorelRinkes, I. H. M., et al. (1993) Nucleationand growth of ice crystals inside culturedhepatocytes during freezing in the presenceof dimethylsulphoxide. Biophys J 65,2524–2536.
40. Pegg, D. E. (2002) The history and princi-ples of cryopreservation. Semin Reprod Med20, 5–13.
34 Terry and Hughes

Chapter 4
Liver Cell Culture Techniques
Jose V. Castell and Marıa Jose Gomez-Lechon
Abstract
Different sources of hepatic tissue, including whole or split livers from organ donors or from cadavers,
waste liver from therapeutic hepatectomies or small-sized surgical biopsies, can be successfully used to
prepare human hepatocytes cultures. The two-step collagenase perfusion remains the most effective way toisolate high yields of viable hepatocytes from human liver samples that express many typical hepatic
functions, among them drug-metabolising (detoxification) enzymes, when placed in primary culture.
Once isolated, human hepatocytes cultured in monolayer in chemically defined conditions (serum-free)survive for limited periods of time gradually losing their differentiated phenotype, in particular the drug-
metabolising enzymes. Supplementation of chemically defined media with growth factors, hormones and
other specific additives has been used with variable success to extend hepatocyte survival and functionalityin culture. Other culture improvements include the use of extracellular components to coat plates or to
entrap cells. Conditions for short-term monolayer cultures, allowing the maintenance of liver-specific
functions for approximately 1 week, are now well established. Cultures on plastic dishes coated with
extracellular matrix components (i.e. MatrigelTM, collagen, fibronectin or mixture of collagen andfibronectin) do meet many of the requirements for short-term incubation experiments, without adding
too much complexity to the system. Practical details on how to carry out these cultures and to assess their
functionality (CYP activity and ureogenesis) are discussed in this chapter.
Key words: Human hepatocytes, cell culture, collagen, fibronectin, ECOD, ureogenesis.
1. Introduction
Human hepatocytes are recognised as a closest model to humanliver (1, 2). Hepatocytes in chemically defined culture conditionsexpress most typical hepatic biochemical functions, among whichis the ability to metabolise drugs (3–5). Primary hepatocytes aredifferentiated cells able to reproduce in vitro the response ofhuman liver to chemicals and are currently considered a valuablein vitro tool for investigating drug metabolism (6) and
Anil Dhawan, Robin D. Hughes (eds.), Hepatocyte Transplantation, vol. 481� Humana Press, a part of Springer ScienceþBusiness Media, LLC 2009DOI 10.1007/978-1-59745-201-4_4 Springerprotocols.com
35

bioactivation and for assessing the potential hepatotoxicity of newdrugs in man (4, 5, 7).
1.1. Major Sources
of Tissue Suitable for
Human Hepatocyte
Culture
Human liver tissue has become more available to many labs due, inpart, to the expansion of the liver transplantation programmes.Different types of hepatic tissue, including non-implanted livergrafts (i.e. steatosis or non-identification of an adequate recipient),split livers from organ donors (8), waste liver from therapeutichepatectomies (9, 10) and, more recently, liver from non-heart-beating donors (11) have been successfully used to prepare humanhepatocyte cultures (12). The two-step collagenase perfusionremains the most effective way to isolate high yields of viablehepatocytes from human liver samples that express many typicalhepatic functions, among them drug-metabolising (detoxification)enzymes, when placed in primary culture (13).
The suitability of liver samples from different origins as asource of viable and metabolically competent human hepatocytesis variable (14). Factors related to the procurement of the liversample (warm and cold ischaemia) as well the intrinsic character-istics of liver tissue sample (sex, age, liver pathology, xenobiotictreatment, etc.) clearly influence the success of cultures (4, 5, 15).
A comparative analysis of hepatocyte cultures from differenttypes of liver tissue samples carried out in our laboratory is pre-sented in Table 4.1 (5, 16, 17). Liver samples are grouped in threedifferent categories: (a) surgical biopsy samples resected in thecourse of surgical procedures, not directly related to malignantpathology in hepatocytes; (b) liver samples obtained in the courseof partial hepatectomies of liver tissue with a malignant tumouralprocess (hepatoma or metastasis) and (c) non-implanted livergrafts (tissue discarded for transplantation or remaining aftersize reduction). The key features to explore the quality and suit-ability of the tissue source were as follows: (1) cell yield; (2)viability of isolated cells, and cell protein attached to culture platesafter 24 h of culture and (3) drug biotransformation capability ofcultured hepatocytes (Table 4.2). Differences in cell viability andsurvival of cultured cells as related to age or gender of donors weremuch less relevant than the source and procurement of the tissue.Only well-preserved and rapidly processed tissues grant hepato-cytes forming stable and functional monolayers (Fig. 4.1).
Elective surgical biopsies are by far the best quality source forhepatocytes (15). The procedure of how samples are usuallyobtained, rapidly cooled and processed ensures high cellular yieldsand high viability and metabolic function (Table 4.1).
Therapeutic hepatectomy is another source of liver tissue forhepatocyte isolation. In contrast to other procedures to obtainliver samples, the hepatectomy technique requires clamping ofvessels that irrigate the area of resection, which causes warmischaemia of the hepatic tissue. The lower yields of viable
36 Castell and Gomez-Lechon

hepatocytes obtained from therapeutic liver resections can beattributable to the fact that, in contrast to the other proceduresto obtain liver samples, the partial hepatectomy requires clampingof vessels that irrigate the area prior to resection, presumably result-ing in cell stress, the triggering of apoptosis (unpublished results)and reduced metabolic capability of hepatocytes (Table 4.1).
Livers from organ donors are usually perfused in situ with acold preservation solution and kept under these conditions forseveral hours until processed for hepatocyte isolation. Coldischaemia is a risk factor for organ function (18) and presumablyinfluences the efficiency of the isolation procedure and the meta-bolic competence of cultured cells. Preservation solutions do havean influence on hepatocyte isolation. In our hands, Wisconsinsolution (18), because of its higher density and high raffinosecontent (19), was much less suitable for hepatocyte isolationthan Celsior (16, 17, 19).
Table 4.1Isolation and culture of human hepatocytes obtained by perfusion of liver samplesfrom different sources
Yield(·10
–6)
ViabilitySuccessfulcultures
Cellprotein
ECOD 6b-OHTSource ofliver sample
(viable cells/gram liver) (%) (%) (mg/plate)
(pmol/mg/min)
(pmol/mg/min)
Surgicalbiopsy(n = 107)
14.2 – 11 92 – 8 93 0.99 – 0.27 17.2 – 7.6 88.7 – 60.8
Hepatectomy(n=18)
8.2 – 5.8 91 – 7 77 0.90 – 0.17 17.3 – 5.5 81.5 – 54.4
Liver grafts(n = 37)
5.9 – 5.6* 57 – 30* 62 0.89 – 0.45 12.9 – 10.2 54.8 – 56.0
ECOD, ethoxycoumarin O-deethylase (48); 6b-OHT, testosterone 6b-hydroxylase(48). *p<0.05
Table 4.2Individual P450 activities in human hepatocytes prepared from human liver
CultureMRODCYP1A2
COHCYP2A6
D4OHCYP2C9
M4OHCYP2C19
C6OHCYP2E1
6b-OHTCYP3A4
Mean (n = 30) 1.04 36.2 84.9 29.2 175 53.8
SD 0.63 20.5 40.7 27.2 111 40.1
Data are expressed as picomole of product formed per minute and per milligram of total cell protein.
Liver Cell Culture Techniques 37

Steatosis is one of the major causes of donor organ refusalfor transplantation, which then may become available for hepato-cyte isolation. Steatosic livers of approximately 40–60% (patholo-gist confirmation) lead to a significant reduction in cell isolationyield, cell viability and function but still may be suitable for cellisolation. Steatosis>60% makes the liver tissue fully inappropriatefor cell isolation (20, 21).
1.2. Culture Media
Composition
Human hepatocytes can adapt well to serum-free culture condi-tions. Significant advances have been made in prolonging cellsurvival and preserving liver-specific function in cultured hepato-cytes by sophistication of culture media composition. Mediumformulation influences the morphology, cell survival and func-tionality of hepatocytes in culture (13, 17, 22, 23). Supplementa-tion of chemically defined/serum-free media with growth factorsand hormones (22, 24, 25), or inhibitors of nitric oxide synthesis(26), antioxidants (17, 27) and caspase inhibitors (28), amongothers, have been used with success in an attempt to preservehepatocyte functionality as well as long-lasting cultures (29).
1.3. Culture
Configuration
Once cells have been enzymatically isolated from the liver andplaced in culture. The spatial configuration of cultures has a clearinfluence on cell survival and performance. Different culture tech-niques have been used to mimic in vitro the microenvironment ofa hepatocyte in the liver by using plates coated with extracellularmatrix components, synthetic ligands, co-cultures of hepatocyteswith other cells, as well as three-dimensional (3D) cultures inbiocompatible matrices, hepatocyte spheroids, etc.
Two-dimensional monolayer cultures. Improvements in two-dimensional (2D) monolayer cultures to favour functional
Fig. 4.1. Twenty-four hours primary cultured human hepatocytes in chemically definedmedia.
38 Castell and Gomez-Lechon
maintenance of hepatocytes include the coating of culture plateswith collagen (27), fibronectin (1), mixture of collagen and fibro-nectin (1) or Matrigel (30). Cells adhere tightly as 2D monolayercultures, but the tightly anchored hepatocytes do not remain fullyphenotypically stable (31, 32). Nevertheless, hepatocytes culturedon plastic dishes coated with extracellular matrix components domeet many of the metabolic features needed in most short-termincubation experiments, and thus represent a valuable and well-performing cellular model without adding too much complexityto the whole culture system. Practical details on how to carry outthese cultures and to assess their functionality (CYP activity andureogenesis) are given below.
3D cultures. The extracellular matrix is an important modulatorof cell polarity and function, and influences the phenotype of bothhepatocytes and non-parenchymal cells in the liver. The importanceof reconstructing the extracellular matrix spatial geometry in hepa-tocyte cultures was first recognised by Dunn (33). Sandwichingprimary hepatocytes as monolayers within two layers of extracellularmatrix is aimed at imitating its bilateral presence with respect to thesinusoidal surfaces of the hepatocytes (space of Disse). Extracellularmatrix within the space of Disse next to the central vein is predo-minantly composed of collagen type I, and this protein, togetherwith other extracellular matrix proteins (i.e. laminin, fibronectin),modulates hepatocyte growth, gene expression and stability ofliver-specific functions (14, 34–36). The morphological distinctionbetween hepatocytes seeded onto collagen-coated plates without acollagen gel overlay (conventional monolayers) and those seededonto collagen gel with a subsequent collagen gel overlay (sandwich)is visible just few hours after seeding. Conventional monolayerhepatocytes quickly adopt their polygonal shape and establishextensive cell–cell contacts, whereas in sandwich culture this takesmarkedly longer. In general, conventional monolayers appear moreflattened than sandwich-cultured cells, a result of the lack of a 3Dextracellular matrix environment. After overnight incubation, sand-wich culture hepatocytes form aggregates with a typical cuboidalshape. Cells cultured as a collagen sandwich in a serum-free med-ium do not visibly spread out, and polygonal cell formats, clearplasma membrane boundaries and stable bile canaliculi-like net-works (35, 37). Microencapsulation in alginate, a relatively inertbiocompatible matrix, also mimics the biological extracellularmatrix, allowing the 3D configuration culture to cultivate success-fully human hepatocytes (14, 38).
Co-cultures. Heterotypic interactions between cells and non-parenchymal neighbours have been reported to modulate cellgrowth, migration and/or differentiation. In both the developingand adult liver, cell–cell interactions are imperative for coordi-nated organ function. In vitro, co-cultivation of hepatocytes andnon-parenchymal cells has been used to stabilise the adult
Liver Cell Culture Techniques 39

hepatocyte phenotype. Although the precise mechanisms bywhich non-parenchymal cells act on the hepatocyte phenotyperemain non-elucidated, some new insights on the mode of cellsignalling, cell–cell interaction and the ratio of cell populations arenoted. Human hepatocytes co-cultured with an epithelial cell linederived from rat liver survived for more than 2 months andsecreted high levels of albumin even in a serum-free medium.This long-term survival appeared to correlate with the productionof an extracellular material, which is rich in collagen Type III (39).
Spheroid cultures. Microaggregates of liver cells have beensuccessfully established in an attempt to retain in vitro the typeof cellular interactions that are likely to occur in the liver. Amongthe cell types incorporated into the culture aggregates are par-enchymal and non-parenchymal liver cells (Kupffer, endothelialcells). Several reports indicate that culturing hepatocytes as multi-cellular aggregates maintain a prolonged expression of liver-spe-cific genes and achieve polarity and cell-to-cell contact, resultingin upregulation of function (40, 41). Spheroid culture systemsfavour the 3D cellular organisation and avoid the constraints ofcell attachment support (40). Spheroids of human hepatocyteshave been reported to be viable up to at least 1 month in culturewhere they express a high cell functional hepatic activity (30, 42).
Cultures on plastic dishes coated with extracellular matrixcomponents (i.e. MatrigelTM, collagen, fibronectin or mixture ofcollagen and fibronectin) do meet many of the requirements forshort-term incubation experiments, without adding too muchcomplexity to the system. Practical details on how to carry onthese cultures, starting from collagenase isolated cells, as well toassess their functionality (CYP activity and ureogenesis) aredescribed below
2. Materials
2.1. Reagents 1. Enzymes: Helix pomatia b-glucuronidase (EC. 3.2.1.31)/aryl-sulphatase (EC 3.1.6.1) preparations were obtained fromRoche Diagnostics Corp.
2. Chemicals: Inorganic compounds were obtained from Sigma-Aldrich Chemicals. Sodium acetate, 7-ethoxycoumarin,7-hydroxycoumarin, antipyrin and diacetylmonoxime werefrom Sigma-Aldrich Chemicals, as well.
3. Ureogenesis: Solution A: 19.6 mM antipyrin, 8.8 mM ferricammonia sulphate, 4.51 M H2SO4 and 3.67 M H3PO4; solu-tion B: 0.4% diacetylmonoxime in 7.5% w/v NaCl solution.
40 Castell and Gomez-Lechon
2.2. Culture Media 1. Cell seeding culture medium: Ham’s F-12/Williams (1:1 v/v)medium (Gibco BRL, Paisley, Scotland) supplemented with2% newborn calf serum (Gibco BRL), 0.1% bovine serumalbumin (BSA) fraction V (Sigma, Madrid, Spain), 10 nMinsulin (Novo Nordisk, A/S Bagsvaerd, Denmark), 25 mg/mltransferrin, 0.1 mM sodium selenite, 65.5 mM ethanolamine,7.2 mM linoleic acid, 7 mM glucose, 6.14 mM ascorbic acid,0.64 mM N–omega-nitro-L-arginine methyl ester (Sigma), and50 mU/ml penicillin and 50 mg/ml streptomycin (Gibco BRL).
2. Chemically defined culture media: The same culture mediacomposition as above, serum-free and supplemented with10 nM dexamethasone (Sigma).
3. Coating mixture for culture plates: Prepare 100 ml of DMEMsupplemented with 0.1% BSA fraction V. Dissolve 1 mg humanfibronectin (Sigma) in 97 ml of DMEM supplemented with0.1% BSA fraction V. Add to the former solution 3 ml of 0.1%collagen Type from calf skin solution in 0.1 M acetic acid.
3. Methods
3.1. Coating of Culture
Plates
1. Culture plates are coated with 10 ml/cm2 of the fibronectin/collagencoatingmixturedescribedaboveandallowtostand for1h.
2. Excess of coating mixture is removed and hepatocytes are seededonto the plates at the appropriate density (see Section 3.3).
3.2. Cell Counting
and Viability
Assessment
1. After re-suspension of the cell pellet resulting from centrifugationof collagenase-digested liver tissue in the seeding culture med-ium, viability has to be determined to adjust cell seeding density.
2. 0.4% Trypan blue in saline is added to a diluted aliquot of thecell suspension and few microliters are immediately loadedinside a cell counter chamber.
3. Viable cells (colourless) and non-viable cells (deep blue) arecounted in at least five different optical fields under the lightmicroscope. Cell viability may vary between 90 and 60%depending on the origin and handling of the sample. Cellpreparations with viability below 50% are generally not suitablefor further cultivation and should be discharged.
3.3. Culture of Human
Hepatocytes
Celldensity influences themorphologyofhepatocytes inculture(43):when seeded at a very high density, cells do not spread out signifi-cantly; rather, they start to detach from the surface after 1–2 days.1. The hepatocyte suspension is adjusted to a density of 5�103
cells/ml in seeding culture medium.
Liver Cell Culture Techniques 41

2. Hepatocytes are seeded on fibronectin/collagen-coated platesat a final density of 80�103 cells/cm2 in an appropriate volumeof culture medium.
3. One hour after cell seeding, the medium is aspirated to removeunattached cells and cell debris. Fresh culture medium is addedto plates.
4. The attachment efficiency of hepatocyte suspension to fibronectin/collagen-coated plates is usually 80% of viable cells (3, 44).
5. Twenty-four hours after cell plating, cells are shifted to serum-free/chemically defined culture medium (see Section 2.1) (Fig. 4.1).
6. Culture medium (see Section 2.1) is further renewed everyfollowing day.
7. Under these conditions, hepatocytes easily survive up to 7 days.
3.4. Quality-Control
Assessment of
Cultured Human
Hepatocytes
3.4.1. Xenobiotic
Metabolism
Competence of
Hepatocytes
The ability of hepatocytes to biotransform xenobiotics is one ofthe most relevant characteristics of differentiated hepatocytes, andneeds to be examined in culture to ensure the appropriate meta-bolic performance of cells. The 7-ethoxycoumarin O-de-ethyla-tion (ECOD) is catalysed by several CYP isoforms (45), renderingfluorescent 7-hydroxycoumarin that can be easily monitored. TheECOD activity assay can be performed in intact cells and is a goodindicator of global P450 activities. Because of it simplicity andconsistency, the ECOD activity assay should be routinely mea-sured in each hepatocyte culture preparation as quality control, inparticular for those studies addressing drug metabolism and/orbioactivation-mediated cytotoxicity.
1. Seed hepatocytes in plastic culture dishes (typically, 3.5 cmdiameter), as described in Section 3.3.
2. Twenty-four hours after cell seeding, wash plates twice withwarm phosphate-buffered saline (PBS). Initiate the enzy-matic assay by adding warm serum-free/chemically definedculture media containing 800 mM 7-ethoxycoumarin.
3. Incubate cells for about 45–60 min at 378C; stop the reactionby aspirating the incubation medium from plates.
4. The enzymatically formed 7-hydroxycoumarin may be partiallyconjugated by cells to a less fluorescent derivative. To hydro-lyse conjugates, add to a test tube 1 ml sample of cells’ incuba-tion media and 200 ml of a mixture of 200 Fishman units of b-glucuronidase and 1600 Roy units of arylsulphatase (RocheDiagnostics Corp), in an appropriate hydrolysis buffer (0.1 Msodium acetate pH 4.5); incubate for 2 h at 378C.
42 Castell and Gomez-Lechon

5. Hydrolysis is stopped by adding 1 ml chloroform and vigor-ously shaking the mixture for 5–10 min.
6. After centrifugation (2000�g for 10 min), 0.6 ml of theorganic phase is extracted with 1.2 ml of 1 M NaCl/0.01 NNaOH by vigorous vortexing.
7. Following centrifugation of the aqueous phase (2000�g,10 min), the fluorescence is measured at 340 nm excitationand 460 nm emission in a fluorimeter.
8. A calibration curve is prepared by adding increasingamounts (0–5000 pmol/ml) of 7-hydroxycoumarin to chemi-cally defined culture media. Standards are treated as describedfor regular samples (chloroform and NaOH extracted; seeSteps 4–7).
9. A control (blank sample) is prepared adding 800 mM7-ethoxycoumarin to a chemically defined culture medium.The blank is processed as described for assay samples (seeSteps 4–7) and the fluorescence measured.
10. Fluorescence values of samples are corrected by subtractingthe blank reading. The amount of 7-hydroxycoumarinformed by hepatocytes is calculated by interpolation of thecorrected fluorescence in the standard curve (see Step 8).
11. Plates, after aspirating the incubation medium (see Step 3),are washed once with PBS, and the protein content is mea-sured by the Lowry or Bradford methods. The protein con-tent of plates is used to normalise ECOD activity values.
12. The activity is expressed as picomoles of 7-hydroxycoumarinformed per minute and per milligram of cell protein.
13. Typical ECOD activities in 24-h cultured human hepatocytesrange 16.5–8.4 pmol of 7-hydroxycoumarin per minute permilligram of cell protein (n¼88).
3.4.2. Ureogenesis Ureogenesis from ammonia occurs exclusively in the liver. Ureasynthesis involves both cytosolic and mitochondrial reactions (46)and is a valuable global indicator of hepatic performance and of thedegree of mitochondrial preservation. Under basal conditions,human hepatocytes in a monolayer culture synthesize urea at a rateof 2.5–3.5 nmol per mg cell protein per min (1, 4). Urea synthesis inthe human liver can be estimated in approximately 1.2 nmol per mgcell protein per min (47). Twenty-four hour cultured hepatocytescan be maximally stimulated with ammonia to synthesise up to130 nmol urea per mg cell protein per min (1, 4).
The following procedure has been adapted for an easy mea-surement of ammonia-stimulated urea production by hepatocytesin culture and allows a rapid and convenient assessment of theirmetabolic performance:
Liver Cell Culture Techniques 43

1. Seed hepatocytes in petri culture plates (3.5 cm diameter) asdescribed in Section 3.3. After 24 h of culture, wash plates twicewith warm PBS. Initiate the assay by adding 1.5 ml of 3 mMNH4Cl dissolved in serum-free/chemically defined media.
2. Incubate cells for 2 h at 378C. Withdraw 200 ml aliquots ofincubation medium every 30 min.
3. To each aliquot add 1.5 ml of a reaction milieu containing a2:1 (v/v) mixture of solutions A and B.
4. Mix thoroughly and incubate samples for 15 min at 1008C ina water bath in the dark. Reaction develops a green colour inthe samples. To stop the reaction, cool down the samples.
5. A standard curve is prepared by adding increasing amounts ofurea (200–400 nmol/1.7 ml of reaction buffer) in 200 mL ofchemically defined culture media. Standards are treated asdescribed for samples (see Steps 4–6).
6. A control (blank sample) is taken out of chemically defined/serum-free culture media containing 3 mM ammonia, andtreated as described (see Steps 4–6).
7. The absorbance of the samples, standards and blank are readat 464 nm in a spectrophotometer.
8. Absorbance values are corrected by subtracting the blankreadings. The urea formed by hepatocytes is calculated byinterpolation of the corrected absorbance in the standardcurve (see Step 5).
9. Culture plates are washed once with PBS, and the proteincontent is measured by the Lowry or Bradford methods. Theprotein content of plates is used to normalise urea productionby cells.
10. The urea production rate is usually expressed as nanomoles ofurea formed per minute and per milligram of cell protein.
Acknowledgements
The authors are indebted to Generalitat Valenciana and FoundationLubasa for their support in the creation of the Unit ofCell Transplantation. This research is part of CIBERHED, and wassupported by EU grants ‘‘Predictomics’’ and ‘‘Carcinogenomics’’.
References
1. Gomez-Lechon, M. J. (1997) In isolation,culture and use of human hepatocytes in drugresearch: In Vitro Methods in PharmaceuticalResearch, Academic Press, London.
2. Maurel, P. (1996) The use of adult humanhepatocytes in primary culture and other invitro systes to investigate drug metabolism inman. Adv Drug Deliv Rev 22, 105–132.
44 Castell and Gomez-Lechon

3. Gomez-Lechon, M. J. (2000) Isolation and cul-ture of human hepatocytes. In: The HepatocyteReviewVol.Cap2,KluwerAcademicPublishers.
4. Gomez-Lechon, M. J., Donato, M. T.,Castell, J. V., et al. (2003) Human hepatocytesas a tool for studying toxicity and drug meta-bolism. Curr Drug Metab 4, 292–312.
5. Gomez-Lechon,M.J.,Donato,M.T.,Castell, J.V., et al. (2004) Human hepatocytes in primaryculture: the choice to investigate drug metabo-lism in man. Curr Drug Metab 5, 443–462.
6. Vermeir, M., Annaert, P., Mamidi, R. N.,et al. (2005) Cell-based models to studyhepatic drug metabolism and enzyme induc-tion in humans. Expert Opin Drug MetabToxicol 1, 75–90.
7. LeCluyse, E. L. (2001) Human hepatocyteculture systems for the in vitro evaluation ofcytochrome P450 expression and regulation.Eur J Pharm Sci 13, 343–368.
8. Mitry, R. R., Dhawan, A., Hughes, R. D.,et al. (2004) One liver, three recipients: seg-ment IV from split-liver procedures as asource of hepatocytes for cell transplantation.Transplantation 77, 1614–1616.
9. Richert, L., Alexandre, E., Lloyd, T., et al.(2004) Tissue collection, transport and iso-lation procedures required to optimizehuman hepatocyte isolation from waste liversurgical resections. A multilaboratory study.Liver Int 24, 371–378.
10. Laba, A., Ostrowska, A., Patrzalek, D., et al.(2005) Characterization of human hepatocytesisolated from non-transplantable livers. ArchImmunol Ther Exp (Warsz) 53, 442–453.
11. Hughes, R. D., Mitry, R. R., Dhawan, A.,et al. (2006) Isolation of hepatocytes fromlivers from non-heart-beating donors for celltransplantation. Liver Transpl 12, 713–717.
12. LeCluyse, E. L., Alexandre, E., Hamilton, G.A., et al. (2005) Isolation and culture ofprimary human hepatocytes. Methods MolBiol 290, 207–229.
13. Pichard, L., Raulet, E., Fabre, G., et al.(2006) Human hepatocyte culture. MethodsMol Biol 320, 283–293.
14. Bader, A. K. Haverich, A. (2000) in (Berry,M. N., Edwards, A. M., eds.), The HepatocyteReview, pp. 97–116. Kluwer AcademicPubluishers, London.
15. Serralta, A., Donato, M. T., Orbis, F., et al.(2003) Functionality of cultured humanhepatocytes from elective samples, cadaveric
grafts and hepatectomies. Toxicol In Vitro17, 769–774.
16. Serralta, A., Donato, M. T., Martinez, A.,et al. (2005) Influence of preservation solu-tion on the isolation and culture of humanhepatocytes from liver grafts. Cell Transpl14, 837–843.
17. Donato, M. T., Serralta, A., Jimenez, N.,et al. (2005) Liver grafts preserved in Celsiorsolution as source of hepatocytes for drugmetabolism studies: comparison with surgi-cal liver biopsies. Drug Metab Dispos 33,108–114.
18. Muhlbacher, F., Langer, F., Mittermayer, C.(1999) Preservation solutions for transplan-tation. Transpl Proc 31, 2069–2070.
19. Janssen, H., Janssen, P. H., Broelsch, C. E.(2003) Celsior solution compared with Uni-versity of Wisconsin solution (UW) and his-tidine-tryptophan-ketoglutarate solution(HTK) in the protection of human hepato-cytes against ischemia-reperfusion injury.Transpl Int 16, 515–522.
20. Donato, M. T., Lahoz, A., Jimenez, N., et al.(2006) Potential impact of steatosis on cyto-chrome P450 enzymes of human hepato-cytes isolated from fatty liver grafts. DrugMetab Dispos 34, 1556–1562.
21. Donato, M. T., Jimenez, N., Serralta, A.,et al. (2007) Effects of steatosis on drug-metabolizing capability of primary humanhepatocytes. Toxicol In Vitro 21, 271–276.
22. Turncliff, R. Z., Meier, P. J., Brouwer, K. L.(2004) Effect of dexamethasone treatmenton the expression and function of transportproteins in sandwich-cultured rat hepato-cytes. Drug Metab Dispos 32, 834–839.
23. Sidhu, J. S., Omiecinski, C. J. (1995) Mod-ulation of xenobiotic-inducible cytochromeP450 gene expression by dexamethasone inprimary rat hepatocytes. Pharmacogenetics 5,24–36.
24. Runge, D., Runge, D. M., Jager, D., et al.(2000) Serum-free, long-term cultures ofhuman hepatocytes: maintenance of cellmorphology, transcription factors, andliver-specific functions. Biochem Biophys ResCommun 269, 46–53.
25. Katsura, N., Ikai, I., Mitaka, T., et al. (2002)Long-term culture of primary human hepa-tocytes with preservation of proliferativecapacity and differentiated functions. J SurgRes 106, 115–123.
Liver Cell Culture Techniques 45

26. Donato, M. T., Ponsoda, X., O’Connor, E.,et al. (2001) Role of endogenous nitric oxide inliver-specific functions and survival of culturedrat hepatocytes. Xenobiotica 31, 249–264.
27. Nakajima, H., Shimbara, N. (1996) Func-tional maintenance of hepatocytes oncollagen gel cultured with simple serum-freemedium containing sodium selenite. BiochemBiophys Res Commun 222, 664–668.
28. Fujita, R., Hui, T., Chelly, M., et al. (2005)The effect of antioxidants and a caspase inhi-bitor on cryopreserved rat hepatocytes. CellTranspl 14, 391–396.
29. Pichard-Garcia, L., Gerbal-Chaloin, S.,Ferrini, J. B., et al. (2002) Use of long-termcultures of human hepatocytes to study cyto-chrome P450 gene expression. MethodsEnzymol 357, 311–321.
30. Chen, H. L., Wu, H. L., Fon, C. C., et al.(1998) Long-term culture of hepatocytesfrom human adults. J Biomed Sci 5, 435–440.
31. Du, Y., Chia, S. M., Han, R., et al. (2006)3D hepatocyte monolayer on hybrid RGD/galactose substratum. Biomaterials 27,5669–5680.
32. Richert, L., Liguori, M. J., Abadie, C., et al.(2006) Gene expression in human hepato-cytes in suspension after isolation is similar tothe liver of origin, is not affected by hepato-cyte cold storage and cryopreservation, but isstrongly changed after hepatocyte plating.Drug Metab Dispos 34, 870–879.
33. Dunn, J. C., Yarmush, M. L., Koebe, H. G.,et al. (1989) Hepatocyte function and extracel-lular matrix geometry: long-term culture in asandwich configuration. Faseb J 3, 174–177.
34. Lengyel, G., Veres, Z., Szabo, P., et al. (2005)Canalicular and sinusoidal disposition of bilir-ubin mono- and diglucuronides in sandwich-cultured human and rat primary hepatocytes.Drug Metab Dispos 33, 1355–1360.
35. Liu, X., LeCluyse, E. L., Brouwer, K. R.,et al. (1999) Biliary excretion in primary rathepatocytes cultured in a collagen-sandwichconfiguration. Am J Physiol 277, G12–21.
36. Koebe, H. G., Pahernik, S., Eyer, P., et al.(1994) Collagen gel immobilization: a usefulcell culture technique for long-term meta-bolic studies on human hepatocytes. Xeno-biotica 24, 95–107.
37. Talamini, M. A., Kappus, B., Hubbard, A.(1997) Repolarization of hepatocytes in cul-ture. Hepatology 25, 167–172.
38. Selden, C., Shariat, A., McCloskey, P., et al.(1999) Three-dimensional in vitro cell cultureleads to a marked upregulation of cell functionin human hepatocyte cell lines – an importanttool for the development of a bioartificial livermachine. Ann N Y Acad Sci 875, 353–363.
39. Clement, B., Guguen-Guillouzo, C.,Campion, J. P., et al. (1984) Long-termco-cultures of adult human hepatocytes withrat liver epithelial cells: modulation of albu-min secretion and accumulation of extracellu-lar material. Hepatology 4, 373–380.
40. Tong, J. Z., Sarrazin, S., Cassio, D., et al.(1994) Application of spheroid culture tohuman hepatocytes and maintenance oftheir differentiation. Biol Cell 81, 77–81.
41. Khalil, M., Shariat-Panahi, A., Tootle, R.,et al. (2001) Human hepatocyte cell linesproliferating as cohesive spheroid coloniesin alginate markedly upregulate both syn-thetic and detoxificatory liver function.J Hepatol 34, 68–77.
42. Ijima, H., Nakazawa, K., Mizumoto, H.,et al. (1998) Formation of a spherical multi-cellular aggregate (spheroid) of animal cellsin the pores of polyurethane foam as a cellculture substratum and its application to ahybrid artificial liver. J Biomater Sci PolymEd 9, 765–778.
43. Hamilton, G. A., Jolley, S. L., Gilbert, D.,et al. (2001) Regulation of cell morphologyand cytochrome P450 expression in humanhepatocytes by extracellular matrix and cell-cell interactions. Cell Tissue Res 306, 85–99.
44. Gomez-Lechon, M. (1998) Primary cultureof human hepatocytes, in (Doyle, A., Grif-fiths, J. B., eds.), Cell and Tissue CultureLaboratory Procedures.
45. Waxman, D. J., Lapenson, D. P., Aoyama, T., et al. (1991) Steroid hormone hydroxylasespecificities of eleven cDNA-expressedhuman cytochrome P450 s. Arch BiochemBiophys 290, 160–166.
46. Watford, M. (1991) The urea cycle: a two-compartment system.Essays Biochem 26,49–58.
47. Rafoth, R. J., Onstad, G. R. (1975) Ureasynthesis after oral protein ingestion inman. J Clin Invest 56, 1170–1174.
48. Donato, M. T., Castell, J. V. (2003) Strate-gies and molecular probes to investigate therole of cytochrome P450 in drug metabo-lism: focus on in vitro studies. Clin Pharma-cokinet 42, 153–178.
46 Castell and Gomez-Lechon

Chapter 5
In Vitro Assays for Induction of Drug Metabolism
Brian G. Lake, Roger J. Price, Amanda M. Giddings and David G. Walters
Abstract
Hepatic microsomal cytochrome P450 (CYP) forms have a major role in the metabolism of drugs andother chemicals. Primary hepatocyte cultures from humans and experimental animals are a valuable in vitrosystem for studying the effects of chemicals on CYP forms. This chapter describes methods to evaluateCYP form induction in human and rat hepatocytes cultured in a 96-well plate format. The use of a 96-wellplate format permits studies to be performed with relatively small numbers of hepatocytes and obviates theneed to harvest cells and prepare subcellular fractions prior to the assay of enzyme activities. The inductionof CYP1A and CYP3A forms in human and rat hepatocytes can be determined by measurement of7-ethoxyresorufin O-deethylase and testosterone 6b-hydroxylase activities, respectively, whereas 7-ben-zyloxy-4-trifluoromethylcoumarin (BFC) O-debenzylase can be employed to assess both CYP1A andCYP2B form induction in rat hepatocytes. An assay for determining the protein content of hepatocytescultured in a 96-well plate format is also described.
Key words: Cytochrome P450, 7-benzyloxy-4-trifluoromethylcoumarin O-debenzylase, enzymeinduction, 7-ethoxyresorufin O-deethylase, human hepatocytes, rat hepatocytes, sulphorhodamineB protein assay, testosterone 6b-hydroxylase.
1. Introduction
Primary hepatocyte cultures are a valuable in vitro model systemfor studying many aspects of liver function and also for evaluatingspecies differences in response. Mammalian hepatic cytochromeP450 (CYP) forms have a major role in the oxidative metabolismof drugs, food additives, pesticides, industrial chemicals, environ-mental contaminants and certain endogenous compounds (1, 2).In the development of new therapeutic agents, it is important toascertain whether the compound will be either an inhibitor or aninducer of hepatic CYP forms in order to exclude potential drug–drug interactions (3, 4).
Anil Dhawan, Robin D. Hughes (eds.), Hepatocyte Transplantation, vol. 481� Humana Press, a part of Springer ScienceþBusiness Media, LLC 2009DOI 10.1007/978-1-59745-201-4_5 Springerprotocols.com
47

Many studies have demonstrated that primary hepatocytecultures from humans and experimental animals (e.g. rodents)can be used to evaluate the effects of therapeutic agents andother chemicals on CYP forms (5–12). To assess the inductionof hepatic microsomal CYP forms, hepatocytes from humansand from species such as the rat can be cultured in conventionalplates (e.g. 60 or 100 mm dishes), and at the end of the treat-ment period the hepatocytes harvested and microsomal frac-tions prepared by differential centrifugation. The induction ofCYP forms can then be studied using the prepared microsomalfractions for either enzyme assays or Western immunoblottingfor selected CYP forms. As an alternative, it is also possible toculture hepatocytes from humans and experimental animals in a96-well plate format and assess enzyme induction by determin-ing CYP-dependent enzyme activities in intact hepatocytes(13–17). CYP form induction may also be assessed by assayingCYP mRNA levels in cells cultured in a 96-well plate format andin other formats.
This chapter describes three CYP-dependent enzyme assaysthat can be performed in human and rat hepatocytes cultured in a96-well plate format and an assay for hepatocyte protein contentthat can be used to normalise the results of the CYP-dependentenzyme activity measurements. The use of 7-ethoxyresorufinO-deethylase activity as a marker for induction of CYP1A formsin human and rat hepatocytes cultured in a 96-well plate formathas been previously described by Castell and co-workers(13, 14). Many studies have demonstrated that testosterone6b-hydroxylase is a specific marker for CYP3A forms in bothhuman and rodent liver and this activity may also be used as amarker for CYP3A form induction in cultured hepatocytes (2, 6,9, 10, 12). Studies with rat hepatocytes have demonstrated that7-benzyloxy-4-trifluoromethylcoumarin (BFC) O-debenzylaseactivity is a good marker for the induction of both CYP1A andCYP2B forms (16). In human hepatocytes, this enzyme activitymay be a marker for CYP1A and possibly also CYP3A forms.When using intact cells, rather than subcellular fractions,for CYP enzyme activity determinations, attention needs to bepaid to the possible phase II metabolism of the CYP substratesemployed. With the 7-ethoxyresorufin O-deethylase assay, theresorufin product can be a substrate for cytosolic quinonereductase and is also conjugated with D-glucuronic acid andsulphate (13, 14). The need for enzymatic deconjugation alsoapplies to the assay of BFC O-debenzylase activity (16), whereasno enzymatic deconjugation is required for the testosterone6b-hydroxylase assay (8, 14). This chapter also describes thesulphorhodamine B (SRB) protein assay for hepatocyte proteincontent in a 96-well plate format. This assay was developedby Boyd and co-workers for use in anti-cancer drug screening
48 Lake et al.

in cell lines (18, 19) and represents a convenient assay to normal-ise CYP-dependent enzyme activities in hepatocytes cultured in a96-well plate format. Finally, while this chapter focuses on theinduction of CYP forms, methods for assessing the inhibitionof CYP forms in cultured hepatocytes have been describedelsewhere (6).
2. Materials
2.1. Reference Items
for Hepatocyte Culture
1. Dimethyl sulphoxide (DMSO). A high-purity grade (e.g. �99.9%) should be used.
2. 0.2, 2 and 20 mM b-Naphthoflavone (BNF; Sigma-AldrichChemical Company, Poole, Dorset, UK) in DMSO. Store inaliquots at –208C, thaw only once.
3. 2 and 10 mM Rifampicin (rifampin; RIF; Sigma-Aldrich) inDMSO. Store in aliquots at –208C, thaw only once.
4. 2 and 20 mM Pregnenolone 16�-carbonitrile (PCN;Sigma-Aldrich) in DMSO. Store in aliquots at –208C, thawonly once.
5. 20 mM Sodium phenobarbitone (phenobarbital; NaPB;Sigma-Aldrich). This reference item is dissolved directly intissue culture medium and then diluted with tissue culturemedium to final concentrations of 200 and 500 mM. Prepareimmediately before use.
2.2. For
7-Ethoxyresorufin
O-Deethylase Assay
1. RPMI 1640 (phenol red free) medium (Invitrogen Ltd.,Paisley, Scotland, UK).
2. 2 mM 7-ethoxyresorufin (Sigma-Aldrich) in DMSO. Store inaliquots at –208C, thaw only once.
3. 20 mM Dicumarol (Sigma-Aldrich) in DMSO. Store in ali-quots at –208C, thaw only once.
4. 0.5 M Sodium acetate buffer, pH 5.0. Store at room tempera-ture, discard after 12 weeks.
5. b-Glucuronidase/sulphatase solution. Dilute combinedb-glucuronidase/arylsulphatase preparation (Catalogue no.10127060001, from Helix pomatia) obtained from RocheDiagnostics Ltd. (Lewes, Sussex, UK) 1:100 with deionisedwater. Prepare immediately before use.
6. 0.25 M Tris (i.e. 30.275 g/1000ml) in 60% (v/v) acetonitrile(ACN). Store at room temperature, discard after 12 weeks.
7. 2 mM Resorufin (Sigma-Aldrich) in ethanol. Store in aliquotsat –208C, thaw only once.
Induction of Drug Metabolism 49

2.3. For BFC
O-Debenzylase Assay
1. RPMI 1640 (phenol red free) medium (Invitrogen Ltd.).
2. 12.5 mM BFC (Sigma-Aldrich) in DMSO. Store in aliquotsat –208C, thaw only once.
3. 0.5 M Sodium acetate buffer, pH 5.0. Store at room tempera-ture, discard after 12 weeks.
4. b-Glucuronidase/sulphatase solution. Dilute combinedb-glucuronidase/arylsulphatase preparation (Catalogue No.10127060001, from Helix pomatia) obtained from RocheDiagnostics Ltd. (Lewes, Sussex, UK) 1:100 with deionisedwater. Prepare immediately before use.
5. 0.25 M Tris (i.e. 30.275 g/1000 ml deionised water) in60% (v/v) ACN. Store at room temperature, discard after 12weeks.
6. 0.6667 mM 7-Hydroxy-4-trifluoromethylcoumarin (HFC;Sigma-Aldrich) in DMSO. Store in aliquots at –208C, thawonly once.
2.4. For Testosterone
6b-Hydroxylase Assay
1. RPMI 1640 (phenol red free) medium (Invitrogen Ltd.).
2. [4-14C]Testosterone (e.g. specific activity around 54 mCi/mmol, CFA129, from GE Healthcare UK Ltd., Little Chal-font, Bucks, UK) and unlabelled testosterone and 6b-hydro-xytestosterone (Sigma-Aldrich).
3. High-performance liquid chromatography (HPLC) gradeACN and methanol.
2.5. For Hepatocyte
Protein Assay
1. 10% (w/v) Trichloroacetic acid (TCA). Store at room tem-perature, discard after 12 weeks.
2. 1% (v/v) Glacial acetic acid. Store at room temperature, dis-card after 12 weeks.
3. 0.4% (w/v) SRB (Sigma-Aldrich) in 1% (v/v) glacial aceticacid. Prepare immediately before use.
4. 10 mM Tris (i.e. 1.211 g/1000 ml deionised water). Store at48C, discard after 12 weeks.
3. Methods
3.1. Treatment with
Test Compounds and
Reference Items
1. The CYP form activities described in this chapter are sui-table for use with primary human and rat hepatocytescultured in a 96-well plate format, employing a seedingdensity of around 30,000 viable cells/well. The use of asandwich culture technique (e.g. use of plates coated witha suitable extracellular matrix such as collagen, fibronectin
50 Lake et al.

or Matrigel1 and the attached hepatocytes then overlaidwith extracellular matrix) is recommended (5, 7, 9, 10).Human and rat hepatocytes are normally cultured in con-trol medium for 1–3 days before being treated with CYPform inducers (5,6,7,10). To study the induction of CYPforms, primary hepatocyte cultures are treated with the testcompounds (i.e. the compounds under investigation) andreference items (see below) for a suitable period (e.g. 2 or3 days). Normally the culture medium is changed at 24 hintervals and replaced with fresh medium containing thetest compounds and reference items. Test compounds andreference items may be added to the culture medium inDMSO (see Note 1).
2. When employing 96-well plates, replicates (see Note 2) arenormally performed for both cells cultured in control mediumand for cells treated with the test compounds and referenceitems. For the 7-ethoxyresorufin O-deethylase and BFCO-debenzylase fluorescent assays, up to 12 wells/plate shouldbe controls (i.e. hepatocytes cultured in control medium con-taining the DMSO solvent) and up to 6 wells/plate for eachconcentration of each test compound and reference item. Withthe radiometric testosterone 6b-hydroxylase assay, it may benecessary to pool two or three wells for each control andtreatment in order to provide a sufficient volume of incubationmedium for HPLC analysis.
3. For all assays, suitable blanks should be run in parallel withthe treatment of the hepatocyte preparations. These consistof incubations in 96-well plates containing the overlay(e.g. collagen or Matrigel1) and control medium but nohepatocytes. For the two fluorescent assays, eight blank wellsare normally sufficient, whereas for the radiometric assay up tofour wells or four pools of two or more wells may be required.
4. To assess the functional viability of human and rat hepatocytepreparations for CYP form induction studies, the use of refer-ence items is recommended. Suitable reference item concen-trations (see Note 3) are as follows:
(a) For CYP1A form induction in human hepatocytes use 2and 10 mM BNF and for rat hepatocytes use 0.2 and 2 mMBNF.
(b) For CYP2B form induction in rat hepatocytes use 200 and500 mM NaPB.
(c) For CYP3A form induction in human hepatocytes use 2 and10 mM RIF. Studies may also be conducted with 200 and 500mM NaPB.
(d) For CYP3A form induction in rat hepatocytes use 2 and20 mM PCN.
Induction of Drug Metabolism 51

3.2. Assay of
7-Ethoxyresorufin
O-Deethylase Activity
1. Prepare sufficient 7-ethoxyresorufin substrate solution (addedat 100 ml/well) for all wells and plates to be assayed, bythawing aliquots stored at –208C of 2 mM 7-ethoxyresorufinin DMSO and 20 mM dicumarol in DMSO. Add 4 ml/ml2 mM 7-ethoxyresorufin and 0.5 ml/ml 20 mM dicumarolin DMSO per millilitre of RPMI 1640 (phenol red free)medium at 378C. Mix the substrate solution (final concentra-tions 7-ethoxyresorufin 8 mM and dicumarol 10 mM) with avortex mixer and return to the incubator.
2. At the end of the treatment period with the test compoundsand the reference items, the medium is removed and the cellswashed with 200 ml/well of RPMI 1640 (phenol red free)medium at 378C. Return the plates to the incubator.
3. Remove the RPMI 1640 (phenol red free) wash mediumfrom each plate and quickly add 100 ml/well of the 8 mM7-ethoxyresorufin/10 mM dicumarol substrate solution toeach well and mix the plates for 5 s on a gyratory shaker.
4. Return the plates to the tissue culture incubator and incubatefor a suitable period (e.g. 30 and 20 min for human and rathepatocytes, respectively) at 378C (see Note 4).
5. At the end of the incubation period, mix the plates on agyratory shaker for 5 s and remove a 75 ml aliquot of themedium from each well into a ‘‘V’’-bottomed 96-well plateand store at –808C prior to analysis.
6. Thawthe ‘‘V’’-bottomed96-well plates andadd10ml/well0.5Msodium acetate buffer pH 5.0 and 15 ml/well of the b-glucuroni-dase/sulphatase solution (see Section 2.2) to all wells, mix theplates for 5 s on a gyratory shaker and incubate for 2 h at 378C.
7. Prepare a 2 mM resorufin standard by thawing an aliquot of2 mM resorufin in DMSO and diluting 10 ml to a final volumeof 10 ml with RPMI 1640 (phenol red free) medium. Set upa standard curve by adding 0 (blank), 5, 10, 15, 20, 25, 30,40 and 50 ml aliquots of the 2 mM resorufin standard to a‘‘V’’-bottomed 96-well plate (for the standard curve use eightreplicate wells for each resorufin concentration) and add 25–75ml/well of RPMI 1640 (phenol red free) medium so that eachwell has a final volume of 75 ml. Add 10 ml/well 0.5 M sodiumacetate buffer pH 5.0 and 15 ml/well of the b-glucuronidase/sulphatase solution (see Section 2.2) to all wells, mix the platesfor 5 s on a gyratory shaker and incubate for 2 h at 378C.
8. At the end of the incubation period, add 100 ml of 0.25 MTris in 60% (v/v) ACN to all wells and mix the plates on agyratory shaker for 15 s. Transfer 150 ml from each well intoa flat-bottomed white polystyrene 96-well plate. Set up afluorescence spectrophotometer with a 96-well plate readerand determine the fluorescence of each well at excitation and
52 Lake et al.

emission wavelengths of 535 and 582 nm, respectively (seeNote 5).
9. For the resorufin standard curve, subtract the mean fluores-cence of the blank wells (no resorufin standard) and plotfluorescence units against picomole of resorufin added (inthe 150 ml sample analysed, the resorufin standards rangefrom 7.5 to 75 pmol).
10. For the hepatocyte samples, subtract the mean fluorescenceof the blank wells (i.e. the wells containing no hepatocytes)from the test wells and using the standard curve (see above)determine the picomole resorufin formed per well. By allow-ing for the incubation time, the results are expressed either aspicomole resorufin formed per minute per number of cellsper well or with the hepatocyte protein content of each well(see Section 3.5) as picomole resorufin formed per minuteper microgram hepatocyte protein.
3.3. Assay of BFC
O-Debenzylase
Activity
1. Prepare sufficient BFC substrate solution (added at 100 ml/well) for all wells and plates to be assayed, by thawing aliquotsstored at –208C of 12.5 mM BFC. Add 4 ml/ml 12.5 mMBFC per millilitre of RPMI 1640 (phenol red free) medium at378C. Mix the substrate solution (final BFC concentration50 mM) with a vortex mixer and return to the incubator.
2. At the end of the treatment period with the test compoundsand the reference items, the medium is removed and the cellswashed with 200 ml/well of RPMI 1640 (phenol red free)medium at 378C. Return the plates to the incubator.
3. Remove the RPMI 1640 (phenol red free) wash mediumfrom each plate and quickly add 100 ml/well of the 50 mMBFC substrate solution to each well and mix the plates for 5 son a gyratory shaker.
4. Return the plates to the tissue culture incubator and incubatefor a suitable period (e.g. 20 min for rat hepatocytes) at 378C(see Note 4).
5. At the end of the incubation period, mix the plates on agyratory shaker for 5 s and remove a 75 ml aliquot of themedium from each well into a ‘‘V’’-bottomed 96-well plateand store at –808C prior to analysis.
6. Thaw the ‘‘V’’-bottomed 96-well plates and add 10 ml/well0.5 M sodium acetate buffer pH 5.0 and 15 ml/well of theb-glucuronidase/sulphatase solution (see Section 2.3) to allwells, mix the plates for 5 s on a gyratory shaker and incubatefor 2 h at 378C.
7. Prepare a 6.667 mM HFC standard by thawing an aliquot of0.6667 mM HFC in DMSO and diluting 100 ml to a finalvolume of 10 ml with RPMI 1640 (phenol red free) medium.
Induction of Drug Metabolism 53

Set up a standard curve by adding 0 (blank), 5, 10, 15, 20, 25,30, 40 and 50 ml aliquots of the 6.667 mM HFC standard to a‘‘V’’-bottomed 96-well plate (for the standard curve use 8replicate wells for each HFC concentration) and add 25–75ml/well of RPMI 1640 (phenol red free) medium so that eachwell has a final volume of 75 ml. Add 10 ml/well 0.5 M sodiumacetate buffer pH 5.0 and 15 ml/well of the b-glucuronidase/sulphatase solution (see Section 2.3) to all wells, mix the platesfor 5 s on a gyratory shaker and incubate for 2 h at 378C.
8. At the end of the incubation period, add 100 ml of 0.25 MTris in 60% (v/v) ACN to all wells and mix the plates on agyratory shaker for 15 s. Transfer 150 ml from each well into aflat-bottomed white polystyrene 96-well plate. Set up a fluor-escence spectrophotometer with a 96-well plate reader anddetermine the fluorescence of each well at excitation andemission wavelengths of 410 and 510 nm, respectively (seeNote 5).
9. For the HFC standard curve, subtract the mean fluorescenceof the blank wells (no HFC standard) and plot fluorescenceunits against picomole of HFC added (in the 150 ml sampleanalysed the HFC standards range from 25 to 250 pmol).
10. For the hepatocyte samples, subtract the mean fluorescenceof the blank wells (i.e. the wells containing no hepatocytes)from the test wells and using the standard curve (see above)determine the picomole HFC formed per well. By allowingfor the incubation time, the results are expressed either aspicomole HFC formed per minute per number of cells perwell or with the hepatocyte protein content of each well (seeSection 3.5) as picomole HFC formed per minute per milli-gram hepatocyte protein.
3.4. Assay of
Testosterone
6b-Hydroxylase
Activity
1. Prepare sufficient 250 mM [4-14C]testosterone substrate solu-tion to add at 100 ml/well with each well receiving 0.4 mCiradioactivity. For example, 10 ml of substrate solution willcontain 2.5 mmol testosterone and 40 mCi radioactivity. Add40 mCi of stock [4-14C]testosterone to a tapered glass tube andremove the solvent with a stream of nitrogen. Then add 10 mlof DMSO containing unlabelled testosterone so that the tubecontains a total of 2.5 mmol of labelled and unlabelled testos-terone. For a specific activity of 54 mCi/mmol, the unlabelledtestosterone substrate solution will be 175.93 mM. Vortex thetube contents and transfer the DMSO solvent to 10 ml ofRPMI 1640 (phenol red free) medium at 378C and mix wellwith a vortex mixer. Add 10 ml of DMSO to the tapered glasstube, vortex the tube contents and transfer to the RPMI 1640(phenol red free) medium at 378C. Repeat with two further10 ml and one 5 ml washes of DMSO. Mix the 250 mM
54 Lake et al.

[4-14C]testosterone substrate with a vortex mixer and returnto the incubator.
2. At the end of the treatment period with the test compoundsand the reference items, the medium is removed and the cellswashed with 200 ml/well of RPMI 1640 (phenol red free)medium at 378C. Return the plates to the incubator.
3. Remove the RPMI 1640 (phenol red free) wash medium fromeach plate and quickly add 100 ml/well of the 250 mM[4-14C]testosterone substrate solution to each well and mixthe plates for 5 s on a gyratory shaker.
4. Return the plates to the tissue culture incubator and incubateat 378C for a suitable period (e.g. 30 and 20 min for humanand rat hepatocytes, respectively) at 378C (see Note 4).
5. At the end of the incubation period, mix the plates on a gyra-tory shaker for 5 s and remove the medium from all wells intoEppendorf tubes, pooling wells as required (see Section 3.1).Store the tubes at –808C prior to analysis.
6. Thaw the samples and analyse aliquots by HPLC, employing a150�4.6 mm column of Supelcosil-5 LC-18 (Sigma-Aldrich)protected by a 20�4.6 mm column of Supelcosil-5 LC-18 andmobile phases of ACN (A), ultrapure water (B), methanol (C)and 10% (v/v) acetic acid in ultrapure water (D). Elution isachieved at a flow rate of 2 ml/min starting with 12% A, 73% B,10% C and 5% D for 10 min, changing to 12% A, 67% B, 16% Cand 5% D over 14.2 min, changing to 14% A, 81% C and 5% Dover 1 min, holding at 14% A, 81% C and 5% D for 4 min,changing to 12% A, 73% B, 10% C and 5% D over 0.8 min,holding at 12% A, 73% B, 10% C and 5% D for 4 min andequilibrating at 12% A, 73% B, 10% C and 5% D for 4 minbefore the next injection. Retention times of testosterone and6b-hydroxytestosterone are approximately 18 and 14 min,respectively. Formation of 6b-hydroxytestosterone is quanti-fied by radiometric detection (see Note 6).
7. The amount of 6b-hydroxytestosterone formed in the sample lessany material present in the blank (no hepatocytes) incubationsis determined as a percentage of the substrate added (25 nmolper well). By allowing for the incubation time, the results areexpressed either as picomole 6b-hydroxytestosterone formedper minute per number of cells per well or with the hepatocyteprotein content of each well (see Section 3.5) as picomole 6b-hydroxytestosterone formed per minute per milligram hepato-cyte protein.
3.5. Assay of
Hepatocyte Protein
Content
1. At the end of the incubations with the CYP substrates, allremaining medium is removed and 100 ml of 10% (w/v) TCAadded to each well and the plates stored at 48C for 30 min.
Induction of Drug Metabolism 55

2. Remove the TCA solution from the plates by inverting andshaking the plates. Wash all wells of each plate four times withdeionised water, inverting the plates and tapping on a papertowel between each wash. Allow plates to air dry and store at48C prior to analysis.
3. Add 50 ml/well of 0.4% (w/v) SRB in 1% (v/v) glacial aceticacid and leave the plates for 30 min at room temperature.
4. Remove the unbound dye from the plates by inverting andshaking the plates. Rapidly wash the wells of each plate fourtimes with 1% (v/v) glacial acetic acid, inverting the plates andtapping on paper towel between each wash. Do not allow theacetic acid wash to remain on the cells for longer than a fewseconds. After the final wash allow the plates to air dry.
5. Add 200 ml/well of 10 mM Tris and place the plates on agyratory shaker for 5 min.
6. Set up a 96-well plate reader and determine the absorbance ofeach well at 490 nm, employing 630 nm as a reference wave-length. Subtract the mean of the blank wells (i.e. the wellscontaining no hepatocytes) from each of the test wells.
7. For rat hepatocytes, the absorbance values can be multiplied by102 to convert SRB assay absorbance units into microgramhepatocyte protein per well (see Note 7).
4. Notes
1. DMSO is a good solvent for many chemicals and at low con-centrations it is not cytotoxic to hepatocytes. However,DMSO is a known inducer of CYP3A4 in cultured humanhepatocytes (9, 10) and hence final medium concentrationsshould be � 0.1% (v/v).
2. The number of replicates required is dependent on a numberof factors, including the precision required and the magnitudeof the effect of the test compounds.
3. The concentrations of the reference items quoted for humanand rat hepatocytes are a guide only and are dependent on theexperimental conditions including the treatment period. For agiven set of experimental conditions, it is recommended that arange of concentrations of each reference item is examined toidentify suitable concentrations for subsequent experiments. ForCYP3A induction, RIF (not PCN) should be employed as areference item for human hepatocytes, whereas PCN (not RIF)should be selected as a reference item for rat hepatocytes (6).
4. The incubation times quoted for human and rat hepatocytesare a guide only. Enzyme activity is dependent on the plating
56 Lake et al.

density and the time period that the cells are cultured beforetreatment is commenced and the period of treatment with thetest compounds. It is recommended that the linearity of eachassay with time of incubation is established for a given set ofexperimental conditions.
5. The wavelengths cited are for use with a fluorescence spectro-photometer with a 96-well plate attachment. For filter instru-ments, select filters with the nearest available wavelengths tothose cited above.
6. Many HPLC methods are available for the separation oftestosterone and its metabolites (8, 14). As an alternative,the analysis of testosterone 6b-hydroxylase activity in hepa-tocytes cultured in a 96-well plate format can also be deter-mined with unlabelled substrate, the product being analysedby liquid chromatography–mass spectrometry–mass spectro-metry (20).
7. This factor reported for rat hepatocytes (16) may also beapplied to human hepatocytes. It is also possible to utilise theLowry assay to determine the protein content of hepatocytescultured in a 96-well plate format (15).
References
1. Lewis, D. F. V. (2001) Guide to CytochromesP450: Structure and Function, Taylor andFrancis, London.
2. Parkinson, A. (2001) Biotransformation ofxenobiotics, in (Klaassen, C. D., ed.), Casar-ett and Doull’s Toxicology: The Basic Science ofPoisons, 6th edn, pp. 133–224. McGraw Hill,New York.
3. Pelkonen, O., Maenpaa, J., Taavitsainen, P.,et al. (1998). Inhibition and induction ofhuman cytochrome P450 (CYP) enzymes.Xenobiotica 28, 1203–1253.
4. Lin, J. H., Lu, A. Y. H. (1998) Inhibitionand induction of cytochrome P450 and theclinical implications. Clin. Pharmacokinet35, 361–390.
5. Sidhu, J. S., Farin, F. M., Omiecinski, C. J.(1993) Influence of extracellular matrixoverlay on phenobarbital-mediated induc-tion of CYP2B1, 2B2 and 3A1 genes in pri-mary adult rat hepatocyte culture. Arch.Biochem Biophys 301, 103–113.
6. Maurel, P. (1996) The use of adult humanhepatocytes in primary culture and other invitro systems to investigate drug metabo-lism in man. Adv Drug Deliv Rev 22,105–132.
7. Coecke, S., Rogiers, V., Bayliss, M., et al.(1999) The use of long-term hepatocyte cul-tures for detecting induction of drug meta-bolising enzymes: the current status.ECVAM Hepatocytes and MetabolicallyCompetent Systems Task Force Report 1.ATLA 27, 579–638.
8. Kostrubsky, V. E., Ramachandran, V., Ven-kataramanan, R., et al. (1999) The use ofhuman hepatocytes to study the inductionof cytochrome P-450. Drug Metab Dispos.27, 887–894.
9. LeCluyse, E. L. (2001) Human hepatocyteculture systems for the in vitro evaluation ofcytochrome P450 expression and regulation.Eur J Pharm Sci 13, 343–368.
10. LeCluyse, E., Madan, A., Hamilton, G., et al.(2000) Expression and regulation of cyto-chrome P450 enzymes in primary culturesof human hepatocytes. J Biochem Mol Toxicol14, 177–188.
11. Gerbal-Chaloin, S., Pascussi, J.-M., Pichard-Garcia, L., et al. (2001) Induction of CYP2Cgenes in human hepatocytes in primary cul-ture. Drug Metab Dispos 29, 242–251.
12. Parkinson, A., Mudra, D. R., Johnson, C., et al.(2004) The effects of gender, age, ethnicity,
Induction of Drug Metabolism 57

and liver cirrhosis on cytochrome P450 enzymeactivity in human liver microsomes and induci-bility in cultured human hepatocytes. ToxicolAppl Pharmacol 199, 193–209.
13. Donato, M. T., Gomez-Lechon, M. J., Castell,J. V. (1993) A microassay for measuring cyto-chrome P450IA1 and P450IIB1 activities inintact human and rat hepatocytes cultured on96-well plates. Anal Biochem 213, 29–33.
14. Gomez-Lechon, M. J., Donato, T., Ponsoda,X., et al. (1997) Isolation, culture and use ofhuman hepatocytes in drug research, in (Cas-tell, J.V., and Gomez-Lechon, M.J., eds.), InVitro Methods in Pharmaceutical Research,pp.129–153. Academic Press, London.
15. Donato, M. T., Castell, J. V., Gomez-Lechon, M. J. (1998) The coumarin7-hydroxylation microassay in living cells inculture. ATLA 26, 213–223.
16. Price, R. J., Surry, D., Renwick, A. B., et al.(2000) CYP isoform induction screening in96-well plates: use of 7-benzyloxy-4-trifluoro-methylcoumarin as a substrate for studies withrat hepatocytes. Xenobiotica 30, 781–795.
17. Nicoll-Griffith, D. A., Chauret, N., Houle,R., et al. (2004) Use of a benzyloxy-sub-stituted lactone cyclooxygenase-2 inhibitoras a selective fluorescent probe for CYP3Aactivity in primary cultured rat and humanhepatocytes. Drug Metab Dispos 32,1509–1515.
18. Skehan, P., Storeng, R., Scudiero, D., et al.(1990) New colorimetric assay for antican-cer-drug screening. J Natl Cancer Inst 82,1107–1112.
19. Rubenstein, L. V., Shoemaker, R. H., Paull,K. D., et al. (1990) Comparison of in vitroanticancer-drug-screening data generatedwith a tetrazolium assay versus a proteinassay against a diverse panel of humantumor cell lines. J Natl Cancer Inst 82,1113–1118.
20. Burczynski, M. E., McMillian, M., Parker, J.B., et al. (2001) Cytochrome P450 inductionin rat hepatocytes assessed by quantitativereal-time reverse-transcription polymerasechain reaction and the RNA invasive cleavageassay. Drug Metab Dispos 29, 1243–1250.
58 Lake et al.

Chapter 6
Hepatocyte Apoptosis
Mustapha Najimi, Francoise Smets, and Etienne Sokal
Abstract
Apoptosis has been documented as a frequent hurdle phenomenon that occurs in human hepatocytesduring isolation, storage, infusion and after engraftment within the recipient liver parenchyma. Apoptosisis an active form of cell death that involves programmed cellular machineries leading to a progressive self-destruction of the cell. In contrary to necrosis, it can affect individual cells within a cell population. It ischaracterized by chronological alteration of intracellular biochemical signaling pathways followed bycellular morphological changes, DNA fragmentation, perturbation of mitochondrial membrane functionand changes in the plasma membrane. These cellular alterations can be analyzed using different meth-odologies on adherent, suspended and in situ engrafted hepatocytes. This chapter presents a brief over-view of these techniques and provides methodology for the evaluation of hepatocyte apoptosis at thestructural and biochemical levels.
Key words: Apoptosis, hepatocytes, DNA fragmentation, electrophoresis, agarose gel, caspaseactivation, immunoblotting, spectrophotometer, cell death, flow cytometry, mitochondria,TUNEL, immunohistochemistry, histology, cytology.
1. Introduction
Massive cell loss remains a limiting factor for the long-termsuccess and durability of liver cell transplantation. It is basicallythe consequence of cell detachment from the extracellular matrixduring isolation and cryopreservation/thawing steps (1, 2).Hence, the quality of hepatocytes suspension dedicated to trans-plantation is investigated before infusion for a rapid evaluation ofspecific parameters as for instance cell viability and metabolicactivity (see Note 1). Classical assays that are widely used for thatpurpose are trypan blue dye exclusion test, lactate dehydrogenaseleakage and 3-(4,5-dimethyl-2-thiazolyl)-2,5-diphenyl-2H tetra-zolium bromide assays. Intracellular ATP levels, because
Anil Dhawan, Robin D. Hughes (eds.), Hepatocyte Transplantation, vol. 481� Humana Press, a part of Springer ScienceþBusiness Media, LLC 2009DOI 10.1007/978-1-59745-201-4_6 Springerprotocols.com
59

hepatocytes are highly metabolic cells, could also be analyzed toinvestigate the quality of cell suspension. These assays are basicallyused because they are relatively quite simple and need equipmentthat could be found in all laboratories. However, they cannotspecifically inform about the presence of apoptosis but remainonly informative regarding the presence and the level of celldeath in the analyzed cell population. With respect to apoptosis,analyses conducted on attached or suspended hepatocytes, afterisolation or cryopreservation/thawing, may combine comple-mentary rapid and slow techniques. Nevertheless, evaluation ofcell morphology and nuclear staining remain the quickest and thegold standard assays for apoptosis studies and to distinguish thiscell death phenomenon from necrosis.
Apoptotic death is the result of a succession of intracellularevents that occur in response to several signals. It can be detectedat its early reversible or late irreversible stages, thanks to thecharacterization of their mechanistic pathways. With respect toliver cell transplantation, apoptosis has to be evaluated after hepa-tocyte isolation, cryopreservation/thawing and infusion withinthe recipient liver even if the classical tests detect any alterationof hepatocyte viability.
2. Materials
2.1. Nuclear Staining – Microscope coverslips of 12 mm diameter (VWR, Leuven,Belgium).
– Hoechst 33258 (Invitrogen, Merelbeke, Belgium) and 4’-6-diamino-2-phenylindole dihydrochloride (Sigma, Bornem,Belgium) are sensitive to light and can be dissolved in deionizedwater or DMSO (at 10 and 5 mg/mL, respectively).
– Propidium iodide (PI) (Sigma) can be dissolved in deionizedwater at 1 mg/mL and stored up to 6 months at 48C in the dark.
– Successive dilutions of the stock solutions of these dyes can beperformed in phosphate-buffered saline (PBS).
– For long-term storage, aliquots of stock solution of these dyescan be stored at � –208C or at 48C for short-term use(the stock solutions can be stable for up to 6 months).
– All these dyes are mutagenic and must be carefully handled.
– Paraformaldehyde (Sigma): Prepare a 4% (w/v) fresh solutionin PBS. The solution needs to be carefully heated for dissolu-tion (using a stirring hot plate in a fume hood). The preparedsolution must be cooled at room temperature before use.
60 Najimi et al.

2.2. Agarose Gel
Electrophoresis
– Hepatocyte suspension at 3–5 million cells/mL in Williams’medium (Invitrogen) supplemented with 10% fetal calf serum(AE Scientific, Marcq, Belgium), 25 ng/mL epidermal growthfactor (Peprotech, London, UK), 10 mg/mL insulin (Eli Lilly,Belgium), 1 mM dexamethasone (Sigma).
– Phosphate-citrate buffer, pH 7.8: 192 parts of 0.2 MNa2HPO4 and 8 parts of 0.1 M citric acid (pH 7.8).
– TBE buffer: prepare 10� stock with 89 mM Tris base, 89 mMboric acid, 0.5 M EDTA, pH 8 and store at room temperature.Dilute 1:10 before use.
– Ethidium bromide (EB): dissolve 50 mg in 100 mL H2O anddilute 1:1000 before use. This is a mutagenic reagent, whichmust be carefully handled.
– Electrophoresis grade agarose (Invitrogen): dissolve 1% in 1�TBE by heating until melted before adding EB.
– DNA molecular weight markers (Fermentas, St.Leon-Rot,Germany).
2.3. TUNEL Assay – Proteinase K 20 mg/mL (Roche, Brussels, Belgium).
– 2% H2O2 (Sigma) is used in non-fluorescent Terminal deoxyr-ibonucleotidyl transferase (TdT) mediated dUTP Nick EndLabeling (TUNEL) assays to inactivate the endogenousperoxidase.
– Triton X-100 at 0.1% in PBS.
– In Situ Cell Death Detection Kits (Roche).
2.4. Flow Cytometry – Cell suspension at a concentration of 500–1000 cells/mL PBS.
– BD Bioscience binding Buffer.
– FITC-labeled Annexin V (BD Bioscience): dilute at 1 mg/mLin binding buffer.
– PI (Sigma) to dilute at 10 mg/mL in binding buffer.
2.5. Determination
of Mitochondrial
Membrane Potential
– Rhodamine 123: dilute at 1 mg/mL in ethanol and storeat –208C in the dark. Handle with care.
2.6. Analysis of
Cytoplasmic Cell
Compartment
– Hepatocytes at a concentration of 1.5�107 cells/mL Williams’medium.
– Permeabilization medium: 0.25 M sucrose, 3 mM EDTA-Na+,20 mM MOPS and 110 mg/mL digitonin, pH 7.4.
– Lysis buffer: 150 mM NaCl, 50 mM Tris–HCl pH 7.5, 0.5%deoxycholate, 1% NP-40 and 0.1% SDS.
– TBS buffer: 50 mM Tris pH 8.1, 150 mM NaCl.
– Blocking buffer: TBS containing 5% non-fat dry milk.
– Antibody dilution buffer: TBS containing 0.05% Tween 20.
Hepatocyte Apoptosis 61

– Purified mouse anti-cytochrome C monoclonal antibody(Becton Dickinson, clone 7H8.2C12)
– Secondary antibody: Anti-mouse IgG conjugated to horserad-ish peroxidase (GE Healthcare, Diegem, Belgium).
– Enhanced chemiluminescent (ECL) reagents (PerkinElmer,Zaventem, Belgium).
2.7. Caspase Activity – One million hepatocytes suspended in Williams’ medium orPBS.
– 96-Well flat-bottomed plates (Greiner Bio One, Wemmel,Belgium).
– Caspase-3/CPP32 and Caspase-8/FLICE fluorometric assaykits (Gentaur, Brussels, Belgium) containing cell lysis buffer,2� reaction buffer, the corresponding labeled substrate anddithiothreitol 1 M.
2.8. Transmission
Electron Microscopy
– Hepatocytes suspended at a concentration of 1–5�106 cells inWilliams’ medium.
– 2.5% EM grade glyceraldehyde (Agar Scientific) buffered in0.1 M sodium cacodylate
– 1% osmium tetroxide (Agar Scientific).
– Epoxy Embedding Medium (Fluka Chemie, Buchs, Switzerland).
– Lead citrate, practically insoluble in water, is soluble at highconcentrations in basic solutions. The staining solution, storedin glass or polyethylene bottles, is stable up to 6 months. If longterm stored, centrifuge the solution before use.
– Zeiss EM109 transmission electron microscope (Carl ZeissInc., Oberkochem, Germany).
3. Methods
3.1. Morphological
Evaluation
3.1.1. Nuclear Staining Amongst the well-described features of apoptotic cells, nuclearchanges such as chromatin condensation and nuclear fragmenta-tion are the result of DNA cleavage by endogenous nucleases intooligonucleosomal fragments. This leads to the formation of denseand crescent-shaped chromatin aggregates. Other events chron-ologically linked are also documented, such as nuclear shrinkageand the formation of dense and granular nuclear particles termedapoptotic bodies. Such alterations can easily be revealed using
62 Najimi et al.

specific nuclear dyes and observed by microscopy. The assay issimple, rapid and has the advantage to analyze a large number ofcells for accurate quantification.
3.1.1.1. Fluorescent
Dyes
The use of fluorescent dyes is very useful for the evaluation ofapoptosis on cultured or cytocentrifuged hepatocytes but needshigh-technology materials, such as fluorescence microscopy, forthe observation and evaluation of the staining.
3.1.1.1.1. Hoechst 33258 Hoechst 33258 (bisbenzimide) is a cell-permeant nucleic acid stain that is taken by all cells and emits bluefluorescence after UV excitation (excitation/emission maxima of360/450 nm, respectively). The reagent can preferentially beused with unfixed cells.– After washing with sterile PBS, hepatocytes cultured or cyto-
centrifuged on coated-glass coverslips are incubated withHoechst 33258 (5–10 mg/mL), for 10–30 min at 378C inthe dark.
– Wash hepatocytes with sterile PBS (see Notes 2 and 3). Nucleican immediately be observed with the fluorescence microscopeand images recorded for analysis.
A minimum of 500 nuclei have to be counted in several randomfields to determine the percentage of apoptotic cells in the ana-lyzed cell population. Positive controls for apoptosis should beused, as for instance hepatocytes treated with transforminggrowth factor b (3).
The microscopic observation of apoptotic hepatocytes mustreveal smaller size and highly fluorescent nuclei with condensedchromatin at the membrane level. Nucleolar dissolution can alsobe observed in some nuclei.
3.1.1.1.2. 4 0-6-Diamino-2-phenylindole Dihydrochloride 40-6-Diamino-2-phenylindole dihydrochloride (DAPI) has been documented toform fluorescent complexes with natural double-stranded DNA ofintact and fixed cells. Like Hoechst dyes, DAPI is a blue fluores-cent DNA stain that is considered to be stable especially for theDNA of fixed cells. Its absorption maximum is at 344 nm, whereasthe emission maximum is at 449 nm (see Note 4).– Hepatocytes grown or cytocentrifuged on glass coverslips are
washed with sterile PBS and fixed with 4% paraformaldehydefor 20 min at room temperature.
– After washing three times with sterile PBS, hepatocytes areincubated with DAPI (0.2 mg/mL in PBS) or stored at 48Cfor further analysis.
– DAPI incubation is performed for 10–25 min at room tem-perature in the dark.
Hepatocyte Apoptosis 63

– Wash the hepatocytes three to five times with sterile PBSand coverslips are mounted on slides with Fluoprep (Bio-merieux) or Mowiol and observed under a fluorescencemicroscope.
Appropriate controls must be used, for instance untreated and 4 hstaurosporine (Fig. 6.1) (or other apoptosis-inducing agents)treated-primary hepatocytes.
3.1.1.1.3. Propidium Iodide PI is a cell-impermeant dye and is usedto evaluate the proportion of dead cells within a cell population.After crossing the membranes of dead cells, PI binds the double-stranded DNA and red staining can be observed in the nucleususing fluorescence microscopy. Although this intravital dyestains damaged cells, it can also be used for the analysis of end-stage apoptotic cells. Its excitation complex at 535 nm withDNA absorption results in maximum emission at 516 nm. Theassociation of this dye with Annexin V (see Section 3.4) is used todifferentiate necrotic, apoptotic and living cells.– Hepatocytes grown or cytocentrifuged on glass coverslips are
washed with sterile PBS and fixed with 4% paraformaldehydefor 20 min at room temperature.
– Fixed hepatocytes are incubated with 10–20 mg/mL of PIsolution for 10–30 min at room temperature.
– Wash cells with sterile PBS.
– Coverslips with hepatocytes are mounted on slides using Fluo-prep or other antifade reagents and observed under a fluores-cence microscope.
Fig. 6.1. Apoptotic nuclei and bodies observed in mouse primary hepatocyte cultures after staurosporine treatment(white arrows). Freshly isolated mouse hepatocytes were plated for 24 h on a collagen type I-coated coverslips inwell plates and treated for 4 h with 1 mM staurosporine. Cells were thereafter fixed with 4% of formaldehyde for20 min at room temperature, stained with DAPI for 30 min and analyzed using a fluorescence microscopy. (see ColorPlate 1)
64 Najimi et al.

3.1.1.2. Non-
fluorescent Markers
Hematoxylin–eosin (HE) staining is another approach to examinethe presence of apoptotic cells. Hematoxylin and eosin stain thenucleus blue and the cytoplasm pink, respectively (see Note 5). Forapoptotic cells, staining will reveal pycnotic nuclei with dense stain-ing of chromatin, eosinophilic cytoplasm (see Fig. 6.2) and apop-totic bodies. HE staining is usually used for tissue sections analysisand, in contrast to fluorescent dyes, requires low-cost reagents,light microscope and microtome.
3.2. DNA
Fragmentation
DNA fragmentation, a late-stage hallmark of the apoptoticprocess, is an irreversible biochemical event that occurs as a resultof endonuclease-induced cleavage of nuclear DNA (4). Theobtained oligonucleosomal fragments with size of 180–200base pairs can be visualized using different techniques. Theanalysis of DNA fragmentation is helpful when difficulties ofDNA labeling are observed. The approach remains qualitative,as no precise information can be given regarding the amount ofdegraded DNA per cell. It is also moderately insensitive becauseof the low quality of recovered DNA. The approach may beassessed by radioactive and non-radioactive assays. In this chap-ter, we will focus only on non-radioactive assays. The techniqueis based on the lysis of hepatocytes to release the DNA, which,after precipitation and dissolution, can be directly loaded onagarose gels or spectrophotometrically analyzed using colori-metric assay.
3.2.1. Agarose Gel
Electrophoresis
To recover DNA, several treatment protocols can be used. Afterextraction from hepatocyte lysate (see Note 6), the DNA can beloaded on 1–2% agarose gel and fragmentation is revealed by aladder pattern due to DNA fragments. The timing of the assay canvary from 90 min to 2 days, whereas commercial kits without theextraction step (non-use of toxic reagents such as phenol,
A B
Fig. 6.2. Condensation of chromatin at the periphery of the nucleus in apoptotic mousehepatocytes (black arrows). (A) Primary mouse hepatocytes were plated for 24 h incoated collagen type I well plates and treated for 4 h with 1 mM staurosporine. Cellswere thereafter fixed with 4% formaldehyde for 20 min at room temperature andstained with HE for 10 min. (B) slice of mouse liver prefixed with formaldehyde,paraffin-embedded and HE-stained. (see Color Plate 2)
Hepatocyte Apoptosis 65

chloroform) are currently available. The technique is quite simpleand requires low-cost equipment. However, it does not informabout the number of apoptotic cells within the analyzed cellpopulation.
The standard protocol was described by Gong et al. (5) anddid not use toxic reagents such as chloroform and phenol.– Pellet-suspended hepatocytes after centrifugation at 200�g
for 10 min.
– Suspend the pellet in HBSS and incubate the cell suspensionwith phosphate-citrate buffer, pH 7.8 for 1 h at 378C. This stepallows extraction of low-molecular-weight DNA fragmentsafter centrifugation.
– DNA is purified after cell lysis using 0.25% Nonidet P40 andtreatment of the suspension with RNAse (1 mg/mL) andproteinase K (2 mg/mL).
– Fifteen micrograms of extracted DNA is loaded on 1–2% agarosegel and electrophoresed at 100 V for 2 h. Detection of the DNAis performed using EB and UV light (see Note 7).
Other original experimental procedures have been docu-mented (6) and adapted to hepatocyte suspension (7) but usedsolvents such as phenol and chloroform. Many steps of theprocedure are critical for the analysis of DNA fragmentation,leading to adapt several parameters for instance extraction andpurification steps and time of DNA precipitation and dissolution(see Notes 8–10).
3.3. TUNEL Assay TUNEL technique was developed to track the apoptotic cells insitu (8). The technique is based on the transfer of nucleotides,catalyzed by TdT, on the free 3� OH ends of the cleaved DNA.The insertion of tagged-nucleotides can be revealed by specificantibodies. The technique is sensitive, more specific for apoptosis,can be assessed simultaneously with the analysis of morphologyand allows the detection of a small number of apoptotic cellswithin the examined cell population. For reproducibility, accuracyand reducing time, it is highly recommended to use commerciallyavailable kits with appropriate controls. Regarding liver cells, it hasbeen documented to be aware of the false positive that could beobtained as demonstrated in mouse hepatocytes and rat livertissues (9, 10).
For isolated hepatocytes:– Hepatocyte smears, adherent on coated substrate according to
the revelation system used (fluorescence or colorimetry) orcytocentrifuged hepatocytes, are fixed using 4% paraformalde-hyde for 20 min at room temperature (see Note 11).
– After washing with sterile PBS, hepatocytes are treated withproteinase K (15 min at 378C), permeabilized with 0.1 %
66 Najimi et al.

Triton X-100 (2 min on ice) and incubated with TdT andconjugated nucleotides.
– Inserted nucleotides are revealed using specific antibodies andmicroscopes (see Note 12).
– Nuclei are counterstained with HE and DAPI for non-fluores-cent and fluorescent techniques, respectively.
– Save the digital images of several fields and score the apoptoticcells within the analyzed cell suspension (see Note 13).
For tissue sections:– If frozen, slices are fixed whereas the paraffin-embedded
ones are dewaxed and rehydrated as in standard protocols(see Note 14).
– Slices are treated for deproteinization (proteinase K, 20 mg/mL15 min at 378C) and permeabilization before incubation withTdT and coupled nucleotides.
– Inserted nucleotides are revealed using specific antibodies andmicroscopes.
3.4. Flow Cytometry The procedure allows the quantification of fluorescence intensityper cell within a cell population. Such a sensitive approachremains complementary to microscopic evaluation and may sup-ply more rapid and accurate data than manual counting. How-ever, it needs high-cost equipment and is not adapted for tissueor tissue-cultured cells. Because apoptosis could alter all the cellcompartments according to the cell death stages, strategies basedon flow cytometry were developed to analyze this phenomenonat the membrane, cytoplasmic, mitochondrial and nuclear levels.As early apoptosis may be related to membrane permeabilitychanges, fluorescent dyes (see Section 3.1.1.1) could also beused in flow cytometry, allowing the rapid quantification ofapoptotic permeant cells in a large population.
According to hepatocyte size variability, light scattering cannotbe usefully used for apoptosis evaluation. Annexin V staining,which informs about the phospholipid-like phoshatidylserine asym-metry (which could be lost before membrane integrity) in the cellmembrane, allows the analysis of early apoptotic cells within the cellpopulation. Its combination with nuclear dyes (as PI), which helpsfor the discrimination of early and late apoptotic cells, was used forhepatocyte analysis (11, 12). Another advantage is the short timerequired for cell staining and data analysis.– Hepatocytes (2.5–5�105) are suspended in specific buffer
(HBSS, PBS) or medium and are centrifuged at 1000�g,5 min at room temperature.
– Discard the supernatant and suspend the pellet in 0.5 mL ofcold sterile PBS.
Hepatocyte Apoptosis 67

– Centrifuge the cells at 1000�g 5 min at room temperature.
– Discard the supernatant and suspend the pellet in 95 mL ofAnnexin binding buffer 1� (see Note 15).
– Add 5 mL of labeled Annexin as recommended by BDBioscience.
– Incubate for 15 min at room temperature in the dark.
– Analyze the cell suspension in the flow cytometer.
3.5. Determination of
Mitochondrial
Membrane Potential
Mitochondria play a critical role in the regulation of apoptotic celldeath by mechanisms that are conserved through evolution. Mito-chondria maintain ATP production (12), mitochondrial mem-brane potential (�c) and permeability (13, 14).
�c, the electrochemical gradient across the mitochondrialmembrane, is an indicator of mitochondrial activity and mem-brane integrity. Its depolarization induces the release of apoptoticproteins to the cytosol (15). It can be analyzed using membranelipophilic cationic probes, which can be accumulated inside themitochondria because of the negative inside membrane potential.Rhodamine 123 was widely used for hepatocytes and can be usedin association with Annexin to clearly distinguish apoptotic deadand living cells within the cell population (16). The technique isquite simple and data can be analyzed using a fluorimeter or a flowcytometer.
How to proceed:– Incubate 2�106 hepatocytes with 1 mM Rhodamine 123
suspended in Williams’ or other medium for 10 min at378C in the dark and with agitation (see Note 16).
– Wash hepatocytes three times with a double volume ofsterile PBS before monitoring the fluorescence (excitationand emission wavelengths of 498 and 524 nm, respec-tively) (see Note 17).
3.6. Analysis of
Cytoplasmic Cell
Compartment
Another feature of hepatocyte apoptosis study is the analysis ofcytoplasmic compartment because intracellular apoptotic path-ways have been well characterized and described. The analysis ofthis cell compartment is important because cytoplasmic apoptoticpathways are independent from those acting in the nucleus. Pro-teins extracted from hepatocyte cytoplasm can be directly ana-lyzed at the levels of expression and activity. The study of thesubcellular expression of specific markers can also inform aboutthe apoptosis induction but the data remain correlative and haveto be confirmed by complementary analyses.
3.6.1. Release of
Cytochrome C
Cytochrome C remains one of the well-studied markers besidescaspases. The cytosolic release of this electron-transporting pro-tein of the mitochondrial peripheral membrane leads to the
68 Najimi et al.

activation of caspase 3 and the induction of apoptosis. Theexpression of cytochrome C could be analyzed by specific anti-bodies using Western blotting after cellular fractionation andimmunocytochemistry.
The first step of the procedure consists in homogenizinghepatocytes using chemicals, enzymes or sound waves (sonica-tion process). The obtained break-open hepatocyte suspensionis submitted to centrifugation (in some cases silicon can beused) for the separation of mitochondria from the rest of thecytoplasm.– Pellet the cell suspension containing 1.5�107 hepatocytes
after low-speed centrifugation and wash the cells with PBS.
– Hepatocytes are suspended and incubated for 2 min at roomtemperature in 0.8 mL of permeabilization medium.
– In a polypropylene microtube, 500 mL of the homogenizedhepatocyte suspension are layered on the top of a silicon oillayer (800 mL).
– Centrifuge the permeabilized hepatocytes through the siliconoil layer for 30 s at 13,500�g into 250 mL of 250 mM sucrosesolution.
– Recover the upper part that contains the cytosolic fraction andfreeze it at –808C until analysis.
– Suspend the mitochondria pellet of the lower fraction with200 mL of lysis buffer and incubate for 10 min on ice.
– Centrifuge the mitochondria lysate for 2 min at 13,500�gat 48C.
– Recover 180 mL of the supernatant and store at –808C forfurther analysis.
– Dose the protein concentration and analyze with SDS-PAGE.
– Fifty micrograms of the total extracted proteins from eachcompartment were separated by SDS-PAGE and transferredto nitrocellulose membranes.
– Use a specific primary antibody for western blotting (seeNotes 18 and 19).
3.6.2. Caspase Activity Caspases are aspartate-specific cysteine proteases that use thesulfur atom in cysteine to cleave polypeptide chains. They initi-ally exist as pro-caspases and are activated as a consequence ofthe propagation of a death-inducing signal, leading to the clea-vage of several intracellular substrates ensuring cell death. Forinstance, nuclear shrinkage occurs due to the caspase cleavage ofnuclear lamins, cellular shape loss is due to the cleavage ofcytoskeletal proteins whereas loss of cell adherence is the resultof caspase attack on focal adhesion kinase (17). Regarding livercell transplantation, the involvement of caspase-3 activity, an
Hepatocyte Apoptosis 69

initiator of apoptotic early events, has already been demonstratedfor the induction of hepatocyte apoptosis both in vitro and invivo (18, 19).
Caspase involvement can be evaluated at the level of itsexpression or activity using immunological techniques, such aswestern blotting, flow cytometry, immunocytochemistry andimmunohistochemistry. The advantage of the latter is the pos-sible combined analysis of cell morphology and apoptotic mar-kers expression and/or activity. Biochemical assays are quitesimple and may quantitatively evidence the binding of labeledpeptide on the active site of the caspase or the formation oflabeled products after the cleavage of substrate. It is alsopossible to detect substrate cleavage using western blotting.
Measurement of caspase activity by evaluating the proteolyticcleavage of specific labeled substrates is very useful for the detec-tion and quantification of apoptosis. Fluorescence-, absorbance-or luminescence-based assay kits are available and ready to use forthe rapid analysis of caspase activity. This can be evaluated both onhepatocyte lysates and in situ, leading to select the appropriateassay for apoptosis detection sensitivity (see Note 20). The datacan be presented as percentage or fold increase vs control samples.The protein lysis step is crucial to avoid contamination by otherproteases. Appropriate positive and negative controls shouldaccordingly be used to evaluate both the efficacy and the specifi-city of the assay. These assays are only suitable for hepatocytesuspensions or primary culture. After liver cell transplantation,evaluation of caspase activity should be analyzed in situ to corro-borate the detection of engrafted donor cells and apoptosis withinthe recipient liver parenchyma.– Suspended hepatocytes are centrifuged at 666�g, 3 min at 48C.
– Remove the supernatant and re-suspend the pellets in cell lysisbuffer.
– Hepatocyte lysates are transferred to 96-well flat-bottomedplates, incubated for 30 min at 48C (it is recommended tomicroscopically confirm the cell lysis) and re-centrifuged at3838�g for 5 min (to eliminate nuclei).
– Fifty micrograms of the total extracted proteins were incubatedwith the labeled substrate for 1 h and the resulted fluorescenceor absorbance was measured.
3.7. Transmission
Electron Microscopy
In this paragraph, we will only focus on the analysis of isolatedhepatocyte suspension. Transmission electron microscopy(TEM) is a very slow procedure and, in contrast to light micro-scopy, needs more hepatocytes. It also needs very experiencedpeople for accurate analysis of the data. Therefore, the techniquecannot accordingly be used as a routine assay for apoptosis
70 Najimi et al.

evaluation on hepatocytes. Because of the small number of cellsanalyzed per section, TEM can neither be used for quantitativeevaluation of hepatocyte apoptosis. However, TEM remainsmore adapted for tissue analysis and can supply appropriate con-trols and complementary data to the other apoptotic evaluationtests cited above.– Samples of suspended hepatocytes are centrifuged at 1200
r.p.m. for 5 min at room temperature.
– After supernatant removal, hepatocyte pellets were fixed with2.5% EM grade glyceraldehyde buffered in 0.1 M sodiumcacodylate, for 48 h at 48C and post-fixed in 1% osmium tetr-oxide (see Notes 21 and 22).
– After embedding in Epoxy Embedding Medium, semi-thinsections were contrasted with uranyl acetate and lead citrate(see Note 23) before examination using TEM at a magnifica-tion of �4140.
4. Notes
1. The decision as to which technique to use for the evalua-tion of apoptosis in the context of hepatocyte transplanta-tion is based both on the specific addressed questionand on the time schedule, especially for hepatocyte suspen-sion (after isolation and thawing) dedicated to immediatetransplantation.
2. No permeabilization step is needed for Hoechst staining.The compound is dissolved in H2O (precipitation withPBS) at 1 mM concentration. Working solution should beprepared fresh prior to each assay by diluting the dye inwarmed buffer.
3. Incubation time is determined depending on the transportefficiency of the dye and staining kinetics should be adaptedto experimental conditions. pH and NaCl concentrations arealso determinant for the binding of Hoechst to the DNA.
4. DAPI staining of living cells is slow to appear whereas in fixedcells the dye can, in certain conditions, form complexes withother cellular compounds as RNA and tubulin.
5. For more details, see http://www.ihcworld.com/_protocols/special\_stains/h&e\_ellis.htm
6. Lysis time must be determined depending on the sample used(liver tissue or hepatocyte suspension).
7. Loading buffer is used to easily load the wells of the agarosegel and to follow the samples electrophoresis (bromophenolblue dye) whereas EB (carcinogenic agent!) will stain DNA
Hepatocyte Apoptosis 71

for visualization on a UV transilluminator (eye and skinprotection).
8. Hepatocytes, transcriptionally active cells, contain high levelsof RNA, which could be co-extracted with DNA. Hepatocytelysate should be treated with RNAse to digest the contam-inating RNA.
9. In some primary cell cultures, spontaneous cell DNA frag-mentation can occur, leading to an increased background.
10. The dissolution of extracted DNA, which depends on therecovered quantity and the size of the analyzed sample, iscrucial as non-fragmented DNA may need higher volumesof TE buffer.
11. This step is important to avoid the loss of low-molecularDNA fragments during the permeabilization step.
12. For non-fluorescent detection, inactivation of endogenousenzymes is recommended for a lower background. Suchinformation could also be obtained after incubation of thesections without TdT.
13. In some experimental conditions, apoptosis is not accompa-nied by DNA degradation and vice versa, leading to use ofthe TUNEL assay in parallel to other techniques such asmorphological analyses.
14. Slices are placed in successive solutions of xylene, methanoland tap water. From that step, never let slices dry out.
15. Labeled Annexin binding is sensitive to salts and calciumconcentration.
16. Rhodamine 123 (red powder) is poorly dissolved in H2O.Dilution can be performed in ethanol at 1 mg/mL (storedat –208C for several months in the dark), whereas H2O canbe thereafter used for intermediate dilutions. Shakingwill facilitate the incorporation of the probe, which higherconcentrations (>1 mM) may inhibit F 0–F 1 ATPase andmitochondrial respiration.
17. For labeling specificity, the analysis of �c in the presence ofmitochondrial depolarizing agents such as dinitrophenol ishighly recommended.
18. For cytochrome C detection using western blotting, appro-priate controls should be used (apoptotic and non-apoptoticcell extracts). To specifically evaluate the compartmentaliza-tion of cytochrome C, expression of extra-mitochondrialproteins such as actin should be analyzed and serves as thecontrol of the purity of the mitochondrial and extra-mito-chondrial protein fractions.
19. For immunocytochemistry, specific mitochondrial dyesshould be used to accurately evaluate the intracellular
72 Najimi et al.

expression pattern of cytochrome C. In non-apoptotic cells,mitochondrial staining of cytochrome C should reveal apunctuate signal that coincides with the dye staining. Inapoptotic cells, cytoplasmic release of cytochrome C coin-cides with its instability, leading them to lose staining insome cases.
20. Titration should be studied to evaluate the limit of detectionof the assays used especially for cell lysates. Intermediatedilutions of initial protein extracted from hepatocytes suspen-sion should be carefully performed and it depends on thetotal volume of the biochemical reaction.
21. Fixation step of the samples is crucial for ultrastructure pre-servation and must be performed in a fume hood.
22. Osmium tetroxide needs at least 24 h to completely dissolve.Hence, the stock solution (4%) must be prepared in advance.According to the thickness of the sections, the percentage ofosmium tetroxide used must be adapted. One percent isusually used for cell pellets.
23. Lead citrate commonly used for section counterstaining canbe prepared as follows: add 4.8 mL of double-distilled waterto 0.133 g of lead nitrate and shake gently to dissolve. Add0.176 g of trisodium citrate until a milky solution is formedbefore adding 200 mL of 4 M NaOH.
References
1. Zvibel, I., Smets, F., Soriano, H. (2002)Anoikis: roadblock to cell transplantation?Cell Transpl 11, 621–630.
2. Tanaka, K., Soto-Gutierrez, A., Navarro-Alvarez, N., et al. (2006) Functional hepato-cyte culture and its application to celltherapies. Cell Transpl 15, 855–864.
3. Gressner, A. M., Lahme, B., Mannherz, H.G., et al. (1997) TGF-beta-mediated hepa-tocellular apoptosis by rat and human hepa-toma cells and primary rat hepatocytes. JHepatol 26, 1079–1092.
4. Wyllie, A. H., Kerr, J. F., Currie, A. R.(1980) Cell death: the significance of apop-tosis. Int Rev Cytol 68, 251–306.
5. Gong, J., Traganos, F., Darzynkiewicz, Z.(1994) A selective procedure for DNA extrac-tion from apoptotic cells applicable for gelelectrophoresis and flow cytometry. Anal Bio-chem 218, 314–319.
6. Sambrook, J., Fritsch, E. F., Maniatis, T.(1989) Molecular Cloning: A laboratory
Manual, 2nd edn. Cold Spring HarborLaboratory Press, Cold Spring Harbor, NY.
7. Smets, F. N., Chen, Y., Wang, L. J., et al.(2002) Loss of cell anchorage triggers apop-tosis (anoikis) in primary mouse hepatocytes.Mol Genet Metab 75, 344–352.
8. Gavrieli, Y., Sherman, Y., Ben Sasson, S. A.(1992) Identification of programmed celldeath in situ via specific labeling of nuclearDNA fragmentation. J Cell Biol 119, 493–501.
9. Pulkkanen,K. J., Laukkanen, M.O., Naarala, J.,et al. (2000) False-positive apoptosis signal inmouse kidney and liver detected withTUNEL assay. Apoptosis 5, 329–333.
10. Stahelin, B. J., Marti, U., Solioz, M., et al.(1998) False positive staining in the TUNELassay to detect apoptosis in liver and intestineis caused by endogenous nucleases and inhib-ited by diethyl pyrocarbonate. Mol Pathol 51,204–208.
11. Fu, T., Blei, A. T., Takamura, N., et al.(2004) Hypothermia inhibits Fas-mediated
Hepatocyte Apoptosis 73

apoptosis of primary mouse hepatocytes inculture. Cell Transplant 13, 667–676.
12. Stephenne, X., Najimi, M., Khuu, N. D., et al.(2007) Cryopreservation of Human Hepato-cytes Alters the Mitochondrial RespiratoryChain Complex 1. Cell Transpl 16, 409–419.
13. Vayssiere, J. L., Petit, P. X., Risler, Y., et al.(1994) Commitment to apoptosis is asso-ciated with changes in mitochondrial bio-genesis and activity in cell lines conditionallyimmortalized with simian virus 40. Proc NatlAcad Sci USA 91, 11752–11756.
14. Kroemer, G., Reed, J. C. (2000) Mitochondrialcontrol of cell death. Nat Med 6, 513–519.
15. Mignotte, B., Vayssiere, J. L. (1998) Mito-chondria and apoptosis. Eur J Biochem 252,1–15.
16. Ly, J. D., Grubb, D. R., Lawen, A. (2003)The mitochondrial membrane potential (del-tapsi(m)) in apoptosis; an update. Apoptosis8, 115–28.
17. Rudel, T., Bokoch, G. M. (1997) Membraneand morphological changes in apoptotic cellsregulated by caspase-mediated activation ofPAK2. Science 276, 1571–1574.
18. Yagi, T., Hardin, J. A., Valenzuela, Y. M., et al.(2001) Caspase inhibition reduces apoptoticdeath of cryopreserved porcine hepatocytes.Hepatology 33, 1432–40.
19. Song, E., Chen, J., Antus, B., et al. (2001)Adenovirus-mediated Bcl-2 gene transferinhibits apoptosis and promotes survival ofallogeneic transplanted hepatocytes. Surgery130, 502–11.
74 Najimi et al.

Chapter 7
Small Animal Models of Hepatocyte Transplantation
Jurgen Seppen, Ebtisam El Filali, and Ronald Oude Elferink
Abstract
In this chapter, we describe techniques used to determine the efficiency of hepatocyte transplantation inanimal models of liver disease. We have included the Gunn rat as a model of an inherited liver diseasewithout hepatocyte damage and Abcb4 knockout mice as a model for an inherited liver disease withhepatocyte damage. Immunodeficient mice are included as an animal model for human hepatocytetransplantation.
We describe problems that can be encountered in the maintenance and breeding of Gunn rats andimmunodeficient Rag2/gamma common knockout mice. Protocols for the collection of bile in rats andmice are described, and we have also detailed the detection of green fluorescent protein (GFP)-labelledhuman hepatocytes in immunodeficient mice in this chapter.
Keywords: Gunn rat, bilirubin, bile collection, UGT1A1, Abcb4, PFIC3, Crigler–Najjar,glucuronyltransferase, liver.
1. Introduction
The first studies on liver transplantation in animal models showedthat this procedure was feasible but also revealed that considerablemorbidity and mortality occurred (1). The transplantation ofhepatocytes instead of whole livers was therefore already consid-ered in an early stage. The first experimental model used in thedevelopment of liver cell transplantation was the Gunn rat. Thisstrain of rats is the model of Crigler–Najjar disease and is char-acterised by the absence of the hepatic enzyme bilirubin UDPglucuronyltransferase. Because Gunn rats are not able to conjugatebilirubin with glucuronic acid, high concentrations of toxicbilirubin occur in the circulation.
Transplantation of normal hepatocytes into the portal vein ofGunn rats was shown to partially correct the hyperbilirubinaemia
Anil Dhawan, Robin D. Hughes (eds.), Hepatocyte Transplantation, vol. 481� Humana Press, a part of Springer ScienceþBusiness Media, LLC 2009DOI 10.1007/978-1-59745-201-4_7 Springerprotocols.com
75

for up to 12 weeks (2). The Gunn rat model has subsequentlybeen used in several studies designed to optimise hepatocytetransplantation procedures, culminating in the treatment ofCrigler–Najjar patients by this procedure (3). What has becomeclear from these studies is that the grafting efficiency of hepatocytetransplantation is low. Whereas this low grafting efficiency may besufficient in the treatment of inherited liver diseases that requireminimal expression of the defective gene, other disorders wouldrequire a much larger liver cell replacement.
The liver has a remarkable regenerative capacity; after removalof up to 70% of the liver, normal liver mass is restored within2 weeks. When the liver is damaged by a genetic deficiency or toxicsubstance, transplanted hepatocytes that are resistant to thisdamage will have a growth advantage and can preferentially repo-pulate the liver. This phenomenon has been first described in theurokinase plasminogen activator transgenic mouse. These miceexhibit severe liver damage; transplantation of these mice withnormal hepatocytes leads to virtually complete repopulation of theliver with the donor cells (4). Several disease models exist in whichhepatocytes are damaged by a genetic deficiency. Fumarylacetoa-cetate hydrolase (Fah) deficiency causes accumulation of fumar-ylacetoacetate and/or maleylacetoacetate, which results in severeliver damage. After transplantation of Fah-deficient mice withnormal liver cells, repopulation of the host liver with transplantedcells will take place (5).
Another model in which liver cell repopulation can occuris the deficiency of the canalicular phosphatidylcholine (PC)transporter Abcb4. The excretion of PC serves to inactivatethe detergent activity of high concentrations of bile saltspresent in bile. The absence of Abcb4 causes progressivefamilial cholestasis type 3. Mice with Abcb4 deficiency sufferfrom mild progressive liver disease; feeding these animals adiet containing the bile salt cholic acid strongly aggravatesliver damage. Because the deficiency of Abcb4 causes hepato-cyte toxicity, normal liver cells have a growth advantage inAbcb4 knockout mice. Transplantation of normal hepatocytesinto Abcb4 knockout mice leads to partial repopulation of theliver by these cells (6).
These animal models of liver cell repopulation are clinicallyrelevant since a recent paper shows that repopulation of the liverwith transplanted normal cells will also occur in humans sufferingfrom a genetic deficiency that damages the liver cells (7). It istherefore also important to have an animal model in which trans-plantation of human hepatocytes can be studied. One of the bestimmune-deficient models are mice with disrupted Rag2 andinterleukin receptor gamma common chain genes. The conse-quence is of this double knockout is a total absence of T, B andNK cells. These mice are better hosts for human tissues than
76 Seppen et al.

Scid or Rag1/2 knockout mice, which may have some NK cellactivity. Another advantage of this strain is that they do notspontaneously develop tumors, which makes long-term studiespossible.
2. Materials
2.1. Collection of Bile
from Gunn Rats
1. 1 ml syringe and 25 gauge needles 5/8 (0.5�16 mm).
2. Operation instruments: Scissors (Medicon 03.06.14,02.04.10), dissecting forceps, tissue forceps, vessel clip, self-retaining retractors, hooked sharp forceps (Aesculap, BD 501,BD 216, FE 13 K, BV74, BD329). Microscissors (Moria9600). Hook (Aesculap Brom BT75).
3. Canule (Venencatheter, 0.5�0.9 mm, B. Braun).
4. Suture material (Ethicon 5-0, EH781).
5. Eppendorf vessels, sterile gauze, cotton tips and blood absorp-tion swabs.
6. Anaestetic, Nembutal (sodiumpentobarbital, 60 mg/ml,Sanofi).
2.2. Collection of Bile
from Abcb4 Knockout
Mice
1. 1 ml syringe and 25 gauge needles 5/8 (0.5 � 16 mm).
2. Operation instruments: scissors, tissue forceps (Medicon02.10.10, 06.30.10), dissecting forceps, self-retaining retrac-tors, hooked-sharp forceps, hooked forceps (Aesculap, BD501, BV74, BD329, OC22); Microscissors (Moria 9600);Hook (Aesculap Brom BT75).
3. Canule (polyethylene, 0.4 � 0.8 mm, Portex Limited).
4. Suture material (Ethicon 5-0, EH781).
5. Eppendorf vessels, sterile gauze, cotton tips and blood absorp-tion swabs.
6. FFD mix for anaesthesia: 4.5 ml 0.9% NaCl + 0.3 ml Hypnorm(10 mg/ml fluanisone, 0.315 mg/ml fentanyl citrate) +0.3 ml diazepam (5 mg/ml) (Janssen Pharmaceutica, Beerse,Belgium).
2.3. Fixation of Intact
Animals for Direct
Fluorescence
Detection of
Transplanted GFP-
Positive Cells
1. Phosphate-buffered saline (PBS), 30% sucrose solution.
2. Paraformaldehyde (PFA) in PBS, 2 and 4%. The solutionsneeds to be heated to 708C in order to dissolve the PFA andmust then be cooled to room temperature before use. Thesolution may be stored at –208C.
3. Infusion set (Microflex: 0.5 mm, 25G, Vygon 246.05).
4. Scissors, dissecting forceps (Medicon 02.10.10, 06.30.10).
Small Animal Models of Hepatocyte Transplantation 77
5. Freezing vials.
6. FFD mix for anaesthesia: 4.5 ml 0.9% NaCl + 0.3 ml Hyp-norm (10 mg/ml fluanisone, 0.315 mg/ml fentanyl citrate)+ 0.3 ml diazepam (5 mg/ml) (Janssen PharmaceuticaBeerse, Belgium).
2.4. Preparation of
Cryosections of Fixed
Livers on Poly-
L-Lysine-Coated Glass
Slides
1. Poly-L-lysine stock solution 10 mg/ml poly-L-lysine (Sigma,P-1399) in bidistilled water). Store aliquots of the stockat –208C. Dilute the stock solution of poly-L-lysine prior touse to a final concentration of 0.1 mg/ml (1:100) using10 mM Tris-HCL (pH 8.0).
2. Microtome suitable for cryosectioning.
3. Embedding medium: tissue-tek OCT compound (Bayer4583).
4. Disposable microtome blades (model S35, Klinipath,02.075.00.000).
5. Mounting medium (Vectashield, Vectorlabs H-1200).
3. Methods
Because transplantation and histochemical techniques are alreadycovered in other chapters of this volume, we will describe techni-ques used to determine transplantation efficiency in Gunn rats (seeNote 1), Abcb4 knockout mice and immune-deficient mice (seeNote 2).
In animal models of inherited liver diseases in which biliaryexcretion of compounds is affected, it is important to collect bileto determine the therapeutic efficiency of hepatocyte transplanta-tion. We therefore describe techniques to collect bile from miceand rats.
Detection of human cells in murine liver can be difficult. Oneof the easiest ways is to mark the human cells with green fluor-escent protein (GFP). This can be done by transduction with GFPlentiviral vectors as described elsewhere in this volume. We there-fore include a protocol for the detection of GFP-labelled liver cellsby direct fluorescence microscopy.
3.1. Collection of Bile
from Gunn Rats
1. Weigh the rat and give the anaesthetic (0.1 ml nembutalper100 g bodyweight, intraperitoneally).
2. Shave the belly and open the skin and the peritoneal cavity.
3. Spread the wound, take the intestine out of the peritonealcavity and position it to the left side of the rat. Cover theexternal intestine with sterile gauze wetted with saline.
78 Seppen et al.

4. Cut the membrane between the liver and the diaphragm andposition the liver.
5. Put an atraumatic vessel clip on the duodenum, the bile ductwill be visible as a thin white line.
6. Carefully put a ligature (ethicon 5-0) around the bile duct atthe caudal side and tie it (do not cut away the loose ends).
7. Clean the bile duct carefully from unwanted tissues (pancrea-tic tissue, fatty tissue).
8. Put a ligature (ethicon 5-0) around the bile duct at the cranialside. Make one knot but do not tie it yet.
9. Make a cut, using the microscissors in the bile duct betweenthe two ligatures and keep it open with a hook.
10. Put the cannula in the bile duct, push it towards the liver butkeep it distal from the bifurcation.
11. First tie the cranial suture, then tie the caudal suture.
12. Position the cannula and put the end into a collection vessel.
13. Protect the cannula and collection vessel from light by cover-ing it with aluminum foil (see Note 3).
3.2. Collection of Bile
from Abcb4 Knockout
Mice Fed a Cholate
Diet
1. Administer the FFD anaesthetic to the mouse (100 ml FFDmix per 5 g bodyweight, intraperitoneally).
2. Shave the belly and open the skin and the peritoneal cavity.Spread the wound, take the intestine out of the peritonealcavity and position it to the left side of the mouse. Cover theexternal intestine with sterile gauze wetted with saline.
3. Cut the membrane between the liver and the diaphragm andposition the liver.
4. Ask someone to lift the xyphoid to enhance visibility of thegallbladder.
5. Put a ligature around the bile duct between the gallbladderand the duodenum and tie it.
6. Put a ligature around the gallbladder with one double knot butdo not tie it yet. To get a better view, use magnifying glasses.
7. Pick up the gallbladder at the tip and cut a small hole at thetop of the bladder using the microscissors.
8. Insert the cannula and tie the ligature with the double knot,then tie two single knots.
9. Position the cannula for optimal flow and put the intestineback in the abdomen.
10. Cut the cannula for optimal contact with the collection vesseland to create a better flow.
11. Add 100 ml of FFD mix on top of the intestine to maintain theright level of anaesthesia.
Small Animal Models of Hepatocyte Transplantation 79

3.3. Fixation of Intact
Animals for Direct
Fluorescence
Detection of
Transplanted GFP-
Positive cells
1. Administer the FFD anaesthetic to the mouse (100 ml FFDmix per 5 g bodyweight intraperitoneally).
2. Make an incision over the entire abdomen using the surgicalscissors.
3. Make sure all equipment is laid out next to you as the follow-ing steps will require to be performed as quickly and smoothlyas possible.
4. Carefully cut the thorax open along the sternum. Make surethe thorax is flapped to the sides so that the heart can be wellviewed.
5. Insert the needle of the infusion set in the apex of the heart.
6. Cut the vena cava inferior, proximally situated from the liverto ensure good perfusion.
7. Perform an intracardial perfusion with 20 ml PBS in approxi-mately 1 min. The liver should become pale soon after thestart of the perfusion.
8. Change the syringe to one containing 20 ml 2% PFA. Upon2% PFA, perfusion the body of the mouse will become rigid.
9. The perfused tissues of interest are dissected out and furtherfixed for 2–4 h in 4% PFA at room temperature.
10. Fixed organs are incubated overnight in 30% sucrose at 48C.
11. Cut the organs in smaller pieces prior to snap freezing themto facilitate the sectioning.
12. Place the tissues in cryotubes, snap-freeze them in liquidnitrogen and store at –808C.
3.4. Preparation of
Cryosections of Fixed
Livers on Poly-l-
Lysine-Coated Glass
Slides
1. Soak glass slides overnight in 1% NaOH.
2. Rinse them the next morning for 15 min in running warm tapwater followed by rinsing them briefly with distilled water.
3. Soak the slides for at least 1 h in 2% HCL and rinse again for15 min in running warm tap water and briefly with Elix water.
4. Place the glass slides in racks in a solution of 0.1 mg/ml poly-L-lysine. Incubate for 30 min at room temperature.
5. Dry the slides first in an air flow for 2–3 h followed by over-night placement in an incubator at 378C.
6. The slides can be stored at room temperature.
7. Take the vials containing the liver samples to the cryostat ondry ice or in liquid nitrogen.
8. Make sure the working temperature of the cryostat is –248C.
9. Apply sufficient amount of embedding medium on the speci-men disc, avoid air bubbles and let it cool without solidifying.Place the frozen tissue sample on the embedding medium andlet it equilibrate for at least 5 min.
80 Seppen et al.

10. Make sections with a thickness of 5 mm.
11. After sectioning, immediately attach the section on thepoly-L-lysine-coated glass slide, which must be at roomtemperature.
12. Dry the sections briefly and add a drop of vectashield mount-ing medium containing DAPI on the sections and cover themwith glass coverslips. The sections are now ready to be viewedunder the fluorescence microscope (see Note 4).
4. Notes
1. Breeding and maintenance of Gunn rats. In some centersGunn rats are bred as heterozygotes due to the severe pheno-type of homozygous animals. However, we are able to breedhomozygous mutant rats. A crucial factor in the breeding ofGunn rats is the chow used, we routinely fed the rats HopeFarms SRM-A chow. On this diet, bilirubin levels are generallybelow 150 mM. On some diets, serum bilirubin will be con-siderable higher; switching the rats to a purified diet (normalpurified diet, Hope Farms) or to the Harlan Teklad 2018 dietcaused a twofold increase in serum bilirubin. Breeding of ratsfed Harlan Teklad 2018 diet was difficult because the newbornrats were killed by the mothers or had to be terminated becausethey appeared to have neurological damage. In contrast, Gunnrats maintained on SDS CRM(E) diet did not have an increasedserum bilirubin as compared to Hope Farms SRM-A. How-ever, Gunn rats on SDS CRM(E) diet did not reproduce.These observations indicate that the choice of diet is veryimportant in the maintenance of Gunn rats and changes indiet should be tried if problems in maintenance or breedingof Gunn rats occur. Because Gunn rats are deficient in detox-ification, they can be more sensitive to drugs commonly usedin other rodents. For surgical procedures and drawing of bloodisoflurane gas, anaesthesia is therefore preferred. For end-pointprocedures intraperitoneal injection of sodium pentobarbitalcan be used.
2. Breeding and maintenance of RAG gamma common knockoutmice. Because these mice are immunodeficient, they are vulner-able to infections. Breeding of the mice is therefore preferablydone in isolator devices or in individually ventilated cages.However, for experiments with an end point within half ayear, the mice can be maintained in normal cages with filtertops.
3. Collection of bile. Bilirubin is very light sensitive, collection ofGunn rat bile to determine output of bilirubin should
Small Animal Models of Hepatocyte Transplantation 81

therefore be performed with the canula and collection vesselcovered with aluminium foil.
For canulations in mice and rats: try to make sure the sharpends of the cannula are removed by rolling it in your fingers.Otherwise the sharp end may rupture the bile duct.
4. Preparation of cryosections of fixed livers on Poly-L-lysine-coated glass slides. The fluorescence of GFP is rapidly lostwhen unfixed livers are cryosectioned. Embedding of fixedtissue according to standard histochemical techniques inmedia such as paraplast also leads to loss of GFP fluorescence.Because cryosectioning of formaldehyde fixed livers is verydifficult it is necessary to saturate the tissue samples with a30% sucrose solution to facilitate sectioning. Because sucrosesaturation makes liver sections prone to detachment from theglass slides it is subsequently necessary to use poly-L-lysine-coated slides to allow better attachment. Autofluorescence canbe a problem in detecting GFP fluorescence in liver. If possibleuse a microscope equipped with a broad band emission filterfor the detection of green fluorescence. GFP will fluorescebright green whereas the autofluorescence will show up asyellow.
References
1. Starzl, T. E., Marchioro, T. L., Faris, T. D.(1966) Liver transplantation. Ann Intern Med64(2),:73–477.
2. Matas, A. J., Sutherland, D. E., Steffes, M. W.,et al. (1976) Hepatocellular transplantationfor metabolic deficiencies: decrease of plasmsbilirubin in Gunn rats. Science 192(4242),892–894.
3. Fox, I. J., Chowdhury, J. R., Kaufman, S. S., etal. (1998) Treatment of the Crigler–Najjarsyndrome type I with hepatocyte transplanta-tion. N Engl J Med 338(20), 1422–1426.
4. Rhim, J. A., Sandgren, E. P., Degen, J. L.,et al. (1994) Replacement of diseased mouseliver by hepatic cell transplantation. Science263(5150), 1149–1152.
5. Overturf, K., Al Dhalimy, M., Tanguay, R., etal. (1996) Hepatocytes corrected by genetherapy are selected in vivo in a murinemodel of hereditary tyrosinaemia type I. NatGenet 12(3), 266–273.
6. De Vree, J. M., Ottenhoff, R., Bosma, P. J.,et al. (2000) Correction of liver diseaseby hepatocyte transplantation in a mousemodel of progressive familial intrahepaticcholestasis. Gastroenterology 119(6),1720–1730.
7. Stephenne, X., Najimi, M., Sibille, C., et al.(2006) Sustained engraftment and tissueenzyme activity after liver cell transplantationfor argininosuccinate lyase deficiency. Gastro-enterology 130(4), 1317–1323.
82 Seppen et al.

Chapter 8
Hepatocyte Transplantation Techniques:Large Animal Models
Anne Weber, Marie-Therese Groyer-Picard, and Ibrahim Dagher
Abstract
The poor hepatocyte engraftment efficiency and the low level of their expansion in the host liver are amajor limitation to cell therapy for the treatment of life-threatening liver diseases. Many rodent modelshave shown that liver repopulation via transplanted hepatocytes occurs only when liver growth capacity isimpaired for an extended period of time. However, these models are not transposable to the clinics and todate there is no safe method to achieve this result in a clinical setting.
Therefore, it is necessary to define on large animal models strategies that provide to transplantedhepatocytes sufficient proliferation stimuli to induce their division and that could permit a direct extra-polation to humans. Such procedures should be transposable to patients. We have defined a protocol ofliver partial portal branch embolisation and shown that it induces the proliferation of transplantedhepatocytes in non-human primates (Macaca mulatta). This animal model is also appropriate to evaluatethe lentiviral-mediated ex vivo gene therapy approach, since simian hepatocytes are efficiently transducedby HIV-1-derived lentivirus vectors.
Key words: hepatocytes, transplantation, portal embolisation, non-human primates, retroviraltransduction.
1. Introduction
The selective replacement of dysfunctional hepatocytes bytransplantation of normal hepatocytes has become an alterna-tive to orthotopic liver transplantation for the treatment oflife-threatening metabolic diseases and several trials of allo-geneic transplantation have already been performed. Theoverall results suggest that an insufficient number of func-tional hepatocytes engraft in the liver parenchyma (1). Theloss of transplanted hepatocytes prior to their engraftmentwithin the recipient liver parenchyma was also observed in
Anil Dhawan, Robin D. Hughes (eds.), Hepatocyte Transplantation, vol. 481� Humana Press, a part of Springer ScienceþBusiness Media, LLC 2009DOI 10.1007/978-1-59745-201-4_8 Springerprotocols.com
83

non-human primates (2). In parallel, studies in rodentswith acute or chronic liver injury showed that transplantedhepatocytes can repopulate recipient livers only when theydisplay a selective advantage over host cells and can proliferatein response to appropriate stimuli (3–5). However, these modelsare not transposable to the clinics. It is therefore necessary todevelop clinically relevant approaches in large animal models,rabbits, pigs, dogs or non-human primates, to increase cellengraftment and proliferation, a limiting step common to allo-and auto-transplantation. Ex vivo gene therapy with autologoushepatocytes would avoid problems related to immunosuppressionand the shortage of donor organs. This approach also requires acareful evaluation of transgene expression at long term in situ insuch animal models and of its biodistribution.
In humans, partial occlusion either by portal branch ligationor by portal embolisation is currently performed to induce liverregeneration in non-occluded lobes (6). In rats and rabbits, partialportal branch ligation, improves hepatocytes transplantation (7,8). This procedure developed in Macaca mulatta enhances trans-planted hepatocyte engraftment (9). Human immunodeficiencyvirus (HIV)-1-derived vectors transduce efficiently quiescent pri-mary cell types including primary hepatocytes (10, 11). Non-human primate is thus an appropriate model to assay for the long-term expression of therapeutic transgene in situ.
2. Materials
2.1. Animals Monkeys are Macaca mulatta, weighing 3–5.5 kg, seronegativefor simian herpes virus, simian retrovirus, simian immunodefi-ciency virus and simian T-cell lymphotropic virus. All experimentswere carried out in accordance with the guidelines of FrenchMinistry of Agriculture.
2.2. Simian
Hepatocyte Isolation
1. Pre-perfusion solution: 0.1 M Hepes (Free Acid, ULTROLGrade, Merck KGaA, Germany), 0.002 M KCl (Sigma),0.013 M fructose (Sigma), 0.12 M NaCl (Sigma), 2.8 mMNa2HPO4 12 H2O (Sigma).
2. Collagenase solution: Pre-perfusion solution supplementedwith 10 mM CaCl2 (Sigma) and collagenase: Worthingtontype 1 CLS-1 (129 U/ml).
3. Wash and plating medium: Dulbecco’s Modified Eagle’sMedium DMEM/HAMF12 (Eurobio, Les Ulis, France) sup-plemented with 10% heat-inactivated foetal calf serum (FCS;PAA Laboratories GmbH, Austria), 0.1% bovine serum
84 Weber et al.

albumin, 2 mM L-glutamine and 1% antibiotics (penicillin/streptomycin, 50,000 UI, Eurobio).
2.3. Hepatocyte
Culture in Hormonally
Defined Medium
DMEM/HAMF12 supplemented with: 1:250 linoleic acid/albu-min (Sigma), 5�10–8 M 3,30,5-triiodo-L-thyronine (Sigma), 0.2 IUinsulin (Actrapid, Novo Nordisk A/S), 10–6 M hydocortisone(Merck Sharp & Dohme), vitamin C (Aguettant, Lyon, France),0.0025% (w/v) human Apo-Transferrin (iron-poor) (Sigma), 1 mMNa Pyruvate (Eurobio), 2 mM L-glutamine and 1% antibiotics.
2.4. Percoll Solution To 27 ml PercollTM (Amersham Biosciences) add 3 ml 10�phosphate-buffered saline (PBS) (Eurobio) and 20 ml platingmedium into a 50-ml conical tube. Mix gently upside downseveral times.
2.5. B-galactosidase
Activity
1. Formaldehyde: prepare a 4% solution in PBS fresh for eachexperiment.
2. Stock solutions: K Ferricyanide: 200 mM in PBS; K Ferrocya-nide :200 mM in PBS; MgCl2: 2 M in PBS and substrate X-Gal(5-bromo-4-chloro-3-indolyl-b-D-galactopyranoside):40 mg/ml in DMSO (stored at –208C).
2.6. Immuno
histochemistry for
Green Fluorescent
Protein Expression
1. Phosphate-buffered saline (PBS): From 10� stock solution atpH 7.4, prepare working solution by dilution of one part withnine parts water.
2. Formaldehyde (Sigma): Prepare a 4% (v/v) solution fresh foreach experiment.
3. Inhibition of endogenous peroxidase solution: 3% H2O2 indistilled water.
4. Quench solution: 50 mM NH4Cl in PBS.
5. Permeabilisation solution: 0.1% (v/v) Triton X-100 in PBS.
6. Blocking solution: 3% (w/v) BSA in PBS.
7. Primary antibody: Anti-GFP antibody, BD Living Colors A.v(Clontech, BD Biosciences, CA, USA).
8. Antibody dilution: 0.1% Tween 20 + 3% BSA in PBS.
9. Secondary antibody: Biotinylated anti-mouse IgG (MOMVector immunodetection Kit; Vector Laboratories, UK)
10. Covalent conjugate between avidin and an enzyme: peroxi-dase-conjugated avidin (Vector Laboratories).
11. Peroxidase substrate solution: Diaminobenzidine (DAB)chromogene (Dako K3465)
2.7. BrdU-Labelled
Cell Analysis
1. Antigen unmasking solution: Citric acid-based stock solution(Vector, H-3300).
2. ADN denaturation solution: HCl 4 N in water.
Hepatocyte Transplantation Techniques 85

3. Washing solution: 0.5% (v/v) Tween in PBS.
4. Inhibition of endogenous peroxidase solution: 5% H2O2 indistilled water
5. Primary antibody: mouse monoclonal anti-BrdU antibody:clone Bu20a isotype IgG1k (MO 823) (Dako).
6. Secondary antibody: Biotinylated anti-mouse IgG (Dako,StreptABComplex/HRP Duet Mouse/Rabbit KO492).
7. Covalent peroxidase-conjugated avidin (Dako, StreptABCom-plex/HRP Duet Mouse/Rabbit KO492).
8. Peroxidase substrate solution: DAB Ultratech, Becton Coulter(IM2394).
3. Methods
Non-human primates are the most closely related to humans. Thisis true for liver anatomy and hepatic vascularisation, which aredifferent in both dogs and pigs.
Different procedures have been tested on monkeys to partiallyocclude portal veins. The most efficient one proved to be embolisa-tion with a biological glue, histoacryl, currently used for patients.
Recombinant vectors derived from the onco-retrovirus(Moloney murine leukaemia virus) can be used for gene markingto trace transplanted in situ (12). However, they efficiently trans-duce only dividing cells and hepatocytes have to be stimulated toproliferate in culture. Lentiviral-mediated transduction of hepa-tocyte does not require cell division and human immunodefi-ciency virus (HIV)-1-derived vectors transduce efficientlyhuman and simian hepatocytes. Moreover, hepatocytes can betransduced in suspension immediately after isolation or thawing,which avoids culture and harvest steps (13).
3.1. Removal of the
Macaca Left Lobe
1. Operative procedures are performed under general anaesthe-sia. Monkeys are sedated with an intramuscular injection ofketamine (10 mg/kg intramuscular) and general anaesthesia isinduced by the intravenous administration of propofol (2 mg/kg; Diprivan1, Astra-Zeneca, Sodertalje, Sweden) and sufen-tanil (0.15–0.3 mg/kg, Sufenta1, Janssen-Cilag, Issy-les-Moulineaux, France). Acetaminophen is generally used foranalgesia (10 mg/kg orally every 6 h for 3 days).
2. A supraumbilical midline incision is performed. The left laterallobe is separated from the rest of the liver and removed bycutting the portal pedicle and the corresponding hepatic vein.Haemostasis is achieved by ligature with a 4/0 monoligamentthread.
86 Weber et al.

3. Simian hepatocytes are isolated from the left lateral lobe becausethis lobe is separated from the rest of the liver by a deep fissureand is connected to it only by a narrow parenchymal bridgecontaining the portal pedicle and hepatic vein. It accounts forabout 20% of the liver mass of the cynomolgus monkey (14).
3.2. Portal
Embolisation
1. The inferior mesenteric vein is dissected and a 3-F introducer isinserted. An initial portogram is taken to map the portalbranches before embolisation. A 3-F angiographic microcath-eter (Terumo Progreat1 MC-PP27131, Guyancourt, France)is pushed through the portal vein distally into the left and thenthe right anterior branches.
2. The embolising material (a 1:1 mixture of cyanoacrylate andlipiodol) is injected until complete obstruction of thesebranches is achieved. Another portogram is then performedto ensure the complete embolisation and patency of theremaining portal branches.
3. The introducer is then replaced by the 4.5-F venous catheter,which is placed right at the junction of the inferior mesentericvein and the splenic vein. The proximal part of the catheter isconnected to a perfusion chamber (Set Celsite1 Epoxy Pur 4.5F, B. Braun Medical, Boulogne-Billancourt, France), placedsubcutaneously in the left anterior thoracic region to makerepeated access to the portal vein possible.
3.3. Hepatocyte
Isolation of Macaca
mulatta Liver
1. Short plastic catheters (0.7–1.0 mm Vygon, Ecouen, France) areintroduced into one (or two) hepatic veins of the resected lobeand secured by a 4/0 ligature and filled with pre-perfusion buffer.
2. A Masterflex Precision tubing (diameter 16 mm) is connectedto the catheter introduced in the hepatic vein via a polyethy-lene extension tube (Vygon) and a double male connector(Vygon).
3. The liver is perfused with 1 l of Hepes buffer pH 7.65 incubatedin a water bath at 398C. The flow rate used varies according tothe size of the liver lobe, generally 80 ml/min (see Note 1).
4. After washing out the blood completely from the liver, it isperfused with 500 ml of Hepes buffer containing 250 mg/500 ml collagenase Type 1 (250 U/mg) (Worthington) sup-plemented with 10 mM CaCl2 (Sigma) at a flow rate of half ofthat of the first perfusion. (see Note 2).
5. The digested liver is transferred into a sterile beaker and100 ml medium is added. The liver is cut in slices with ascalpel and shaken to release dissociated cells from the Glissoncapsula. (see Note 3).
6. The cell suspension is filtered through sterile gaze to removesmall pieces of non-digested liver and transferred into eight
Hepatocyte Transplantation Techniques 87

50 ml conical tubes (Falcon). Each tube is adjusted to 50 mlwith plating medium.
7. The cells are washed by four centrifugations at 50�g for3 min at room temperature. After each centrifugation, thesupernatant is discarded and the cell pellet gently dissociatedin fresh medium. Before the last centrifugation, the cells fromfour tubes are suspended in 50 ml, and the cell suspensionfrom the four remaining tubes is filtered through a 70-mmnylon filter net into a new sterile bottle, gently mixed anddistributed into two 50 ml tubes so that the cell concentra-tion is equal in both tubes. After the last centrifugation, thecells are suspended in 50 ml and counted.
8. The viable cells are counted by dilution of the cell suspension(1:10) into trypan blue solution (0.04% Sigma). Cells withtrypan blue-negative nuclei are the viable cells. A Malassez’scell is used to count the cells and calculate the cellular con-centration using the formula as follows: Number of viablecells per ml=n (number of cell counted)�f (dilution fac-tor=105 if dilution: 1:10)
9. Hepatocytes are seeded on Primaria culture dishes (BectonDickinson, USA) in the same plating medium at 2�106 cellsper 60 mm dish (confluency).
10. The medium is replaced with serum-free medium (HDM)after 5 h, and daily thereafter.
3.4. Percoll
Purification
When the recovery of viable cells is less than 85%, it is necessary toperform a Percoll gradient to remove dead cells and cell debris.
For 200 million cells:1. Twenty-five millilitre of 60% Percoll solution is pipetted into a
50-ml conical tube.
2. Twenty-five millilitre of cell suspension is poured onto thePercoll solution and gently mixed (upside down severaltimes).
3. Hepatocytes are centrifuged at 50�g for 15 min at roomtemperature.
4. The supernatant is discarded and 40 ml of plating medium areadded into each tube. The cell pellet is dissociated by gentlepipetting and centrifuged at 50�g for 5 min. The procedure isrepeated twice.
5. The number of viable cells is counted.
3.5. Hepatocyte
Labelling with Hoescht
Fluorescent Dye
After isolation and eventually Percoll purification, isolated hepa-tocytes are immediately labelled with the Hoescht fluorescentdye.1. Hepatocyte suspension is adjusted to 107 cells/ml in serum-
free medium.
88 Weber et al.

2. One millilitre of hepatocyte suspension is distributed intoeach 12 ml conical tube.
3. Five microlitres of Hoescht dye is added to the cell suspen-sion, which is incubated for 30 min at 378C with gentleagitation.
4. The reaction is stopped by the addition of 1 ml FCS and thenby the addition of 9 ml medium containing 10% FCS.
5. The cells are centrifuged at 50�g for 5 min, the supernatant isdiscarded and fresh medium containing 10% FCS is added.The cells are washed three times.
6. Hoescht-labelled hepatocytes are counted and are suspendedin plating medium and seeded on culture dishes. Alterna-tively, hepatocytes are suspended in serum-free medium with-out phenol red, washed once and suspended in the samemedium containing heparin (25 IU/ml) to be infusedthrough the Baby Port.
3.6. Hepatocyte
Culture and Retroviral
Transduction
Hepatocytes have to be stimulated to proliferate to be transducedby retroviral vectors. This is achieved by the sequential addition ofHGF (kindly provided by Genentech, San Francisco, USA) in theHDM medium.1. The amphotropic FLYTA7 cell line (a gift from F.L. Cosset
Inserm France) is used to produce the recombinant retrovirusexpressing the b-galactosidase gene under the control of thevirus long terminal repeat (15).
2. The cell line is grown in DMEM supplemented with 10–3 Msodium pyruvate, 2�10–3 M glutamine and antibiotics(Eurobio), and with 10% heat-inactivated FCS.
3. Virus-containing medium is prepared as follows: the nightbefore collection, the medium from confluent plates isremoved and replaced with a 1:1 mixture of producer cellmedium and hepatocyte medium. The supernatant is har-vested 24 h later, filtered through a 0.45-mm pore size filterand immediately frozen in liquid nitrogen and stored at–808C.
4. Hepatocytes are seeded at 50% confluency (3.5�106 cells)on 100 mm dishes. Hepatocyte growth factor (HGF) isadded to the hepatocyte culture 30 h after seeding. Forty-eight hours after seeding, the medium is removed and theplates incubated for 2 h with 500 ml of thawed virus super-natant plus Polybrene (3 mg/ml) (Sigma-Aldrich Co.) in3 ml medium. HGF is added 4 h before the infection(5 ng/ml).
5. The virus supernatant is then replaced by fresh hepatocyteHDM containing 10 ng/ml HGF.
Hepatocyte Transplantation Techniques 89
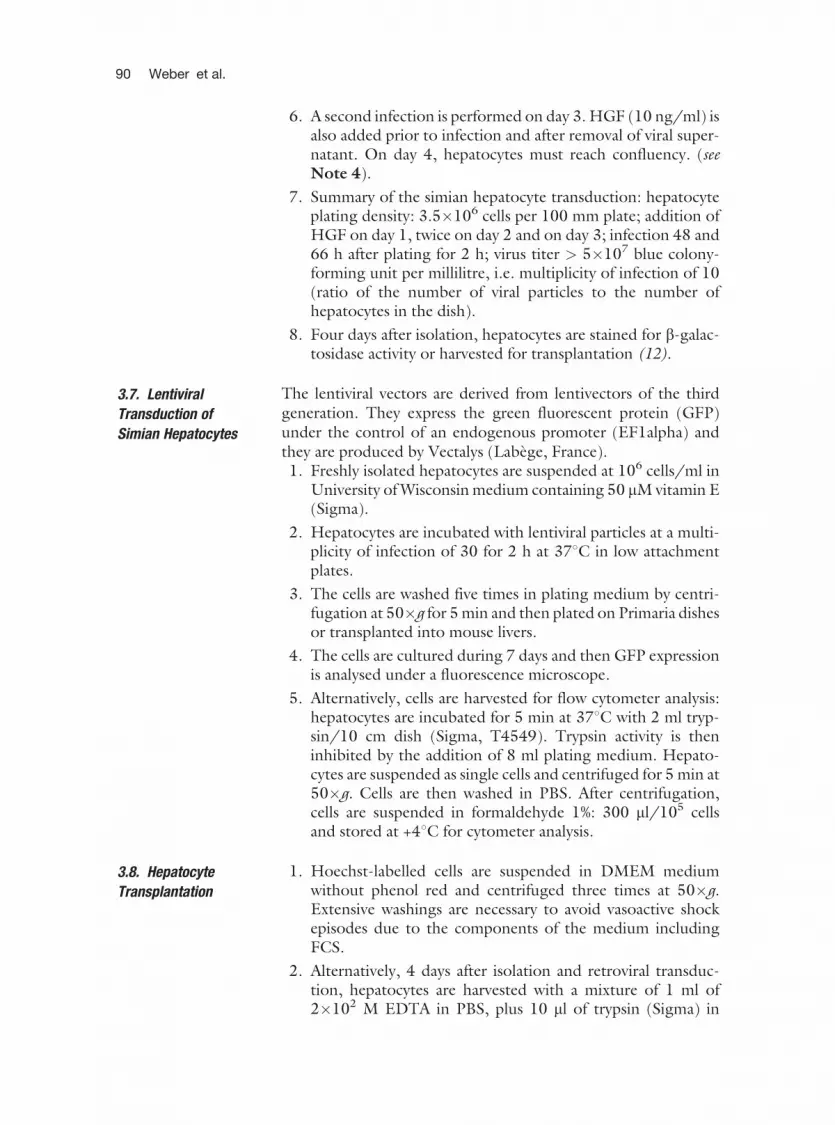
6. A second infection is performed on day 3. HGF (10 ng/ml) isalso added prior to infection and after removal of viral super-natant. On day 4, hepatocytes must reach confluency. (seeNote 4).
7. Summary of the simian hepatocyte transduction: hepatocyteplating density: 3.5�106 cells per 100 mm plate; addition ofHGF on day 1, twice on day 2 and on day 3; infection 48 and66 h after plating for 2 h; virus titer > 5�107 blue colony-forming unit per millilitre, i.e. multiplicity of infection of 10(ratio of the number of viral particles to the number ofhepatocytes in the dish).
8. Four days after isolation, hepatocytes are stained for b-galac-tosidase activity or harvested for transplantation (12).
3.7. Lentiviral
Transduction of
Simian Hepatocytes
The lentiviral vectors are derived from lentivectors of the thirdgeneration. They express the green fluorescent protein (GFP)under the control of an endogenous promoter (EF1alpha) andthey are produced by Vectalys (Labege, France).1. Freshly isolated hepatocytes are suspended at 106 cells/ml in
University of Wisconsin medium containing 50 mM vitamin E(Sigma).
2. Hepatocytes are incubated with lentiviral particles at a multi-plicity of infection of 30 for 2 h at 378C in low attachmentplates.
3. The cells are washed five times in plating medium by centri-fugation at 50�g for 5 min and then plated on Primaria dishesor transplanted into mouse livers.
4. The cells are cultured during 7 days and then GFP expressionis analysed under a fluorescence microscope.
5. Alternatively, cells are harvested for flow cytometer analysis:hepatocytes are incubated for 5 min at 378C with 2 ml tryp-sin/10 cm dish (Sigma, T4549). Trypsin activity is theninhibited by the addition of 8 ml plating medium. Hepato-cytes are suspended as single cells and centrifuged for 5 min at50�g. Cells are then washed in PBS. After centrifugation,cells are suspended in formaldehyde 1%: 300 ml/105 cellsand stored at +48C for cytometer analysis.
3.8. Hepatocyte
Transplantation
1. Hoechst-labelled cells are suspended in DMEM mediumwithout phenol red and centrifuged three times at 50�g.Extensive washings are necessary to avoid vasoactive shockepisodes due to the components of the medium includingFCS.
2. Alternatively, 4 days after isolation and retroviral transduc-tion, hepatocytes are harvested with a mixture of 1 ml of2�102 M EDTA in PBS, plus 10 ml of trypsin (Sigma) in
90 Weber et al.

Versene buffer (Gibco/BRL, Bethesda, MD, USA) per100 mm dish. The cells are suspended into medium contain-ing 2% FCS and washed twice by centrifugation at 50�g for5 min, then in serum-free medium without phenol red.
3. The cells are suspended in serum-free medium containingheparin (25 U/ml) (Choay) at a density of 10�106 cells/mland infused through the heparinised Baby Port at a flow rateof 2 ml/min (Fig. 8.1).
4. Portal pressure is monitored throughout hepatocyte infusion.
5. Surgical liver biopsies are performed under general anaesthe-sia at different times after hepatocyte transplantation with alarge sample of tissue removed on the edge of each remnantliver lobe through the same midline laparotomy.
Fig. 8.1. Transplantation of autologous hepatocytes into Macaca mulatta after retroviral-mediated gene marking.(A) Protocol for simian hepatocyte isolation, retroviral transduction and transplantation. Hepatocyte transduction withHIV-1-derived lentivirus vectors avoids the culture steps. They are transduced in suspension and transplanted.(B) Hepatocytes are transplanted via the infusion chamber. (C) Freshly isolated simian hepatocytes at confluency after3 days of culture. (D) Transduced hepatocytes in culture expressing the b-galactosidase. (E) Thawed hepatocytes after3 days of culture. (see Color Plate 3)
Hepatocyte Transplantation Techniques 91

6. The liver biopsies are embedded in OCT (Agar), frozen inliquid nitrogen vapours and stored at –808C. Cryostat sec-tions of 7 mm are performed with cryoultratome (Leica) andexamined under fluorescence microscopy (Leica DMR) (exci-tation at 450 nm) to detect Hoechst-labelled cells.
7. Twenty fields are counted on 10 sections/lobe at�20 magnifica-tion to evaluate the proportion of Hoechst-labelled hepatocytes,knowing that there are 178 hepatocytes in a microscope field.
3.9. Cryopreservation 1. Simian hepatocytes are suspended at a concentration of5�106 cells/ml in plating medium supplemented with60 mM ZVAD-fmk, Caspase inhibitor (R&D Systems, Min-neapolis, MN, USA) and 50 mM vitamin E (Sigma).
2. The cell suspension is incubated for 30 min at 378C.
3. DMSO (Sigma) is added dropwise and with gentle mixing togive a final concentration of 10%.
4. Hepatocyte suspension is distributed into cryotubes (1 ml/vial),kept for 5 min on ice, then for 2 h at –208C with upside-downmixing three times every 2 min, then placed overnight (18 h) at–808C.
5. The following day, the vials are stored in liquid nitrogen.
6. Frozen hepatocytes are thawed by placing the vials directly intoa water bath at 378C.
7. As soon as cells are thawed they are suspended in plating med-ium in 12 ml conical tubes and centrifuged for 5 min at 50 G.
8. Viable hepatocytes are counted and seeded on collagen 1-coated dishes (BD Bioscience).
3.10. Histochemistry
for Detection of
b-Galactosidase
Activity
1. The hepatocytes are rinsed three times with PBS.
2. Formaldehyde solution is added for 5 min at room tempera-ture to fix the cells, which are then rinsed three times for10 min each with PBS.
3. Cells are incubated from a few hours to overnight at 308C inthe revealing solution: for 1 ml: 20 ml K ferricyanide; 20 ml Kferrocyanide; 2 ml MgCl2 and 10 ml X-Gal in PBS. (see Note 5).
4. Cells are then rinsed in PBS and kept in PBS at 48C. Bluetransduced cells are counted under a microscope.
3.11. Immuno
histochemistry for
Localisation of
Transplanted
GFP-Expressing
Hepatocytes
Several chromogens are used to localise peroxidase in tissuesections. One of the most commonly used has been DABtetrahydrochloride.1. Formaldehyde solution is added for 10 min at room tempera-
ture to fix the samples.
2. The formaldehyde is discarded and the samples washed threetimes for 5 min each with PBS.
92 Weber et al.

3. Endogenous peroxidases are inhibited with 3% H2O2 in PBSfor 30 min at room temperature and washed twice with PBS.
4. Residual formaldehyde is quenched by incubation in NH4Cl for15 min at room temperature, followed by three washes in PBS.
5. The samples are permeabilised by incubation in PBS/0.1%Triton X-100 for 10 min at room temperature andthen rinsed three times with PBS.
6. The samples are blocked by incubation in blocking buffer for1 h at room temperature.
7. The blocking solution is removed and replaced with theanti-GFP monoclonal antibody (1:100) for 1 h at roomtemperature in a humid chamber.
8. The primary antibody is removed and the samples washedthree times for 5 min each with PBS.
9. The secondary biotinylated antibody is applied according tothe M.O.M kit staining procedure and then the sections arewashed twice in PBS.
10. The Vectastain ABC reagent is prepared and applied asdescribed in the M.O.M. kit. The sections are incubated for5 min and then washed twice for 5 min each.
11. DAB solution is applied on the sections: development times,controlled under a microscope, vary between 2 and 10 min inthe dark.
12. Sections are then washed in distilled water three times for2 min each.
13. The samples are then ready to be mounted in glycergel(Dako) or glycerol (90% in PBS) if counter-staining is neces-sary. (see Note 6).
3.12. Detection of
Dividing Hepatocyte
In Situ
Cell division is assessed by BrdU incorporation. BrdU (50 mg/kg) is infused via the Baby Port for 4 h before liver biopsies arecarried out.1. Liver sections are deparaffinised through xylene and graded
alcohol series three times for 10 min and rinsed in tap water.
2. The slides are rapidly rinsed in distilled water.
3. Citrate buffer (1:100) is then added and the slides are placedin a microwave oven at 650 W for 5 min and at 160 W for15 min to unmask the specific antigens and then rinsed twicein distilled water.
4. ADN is denatured with HCl 4 N for 20 min and the sectionsare rinsed three times with distilled water, then rinsed in 0.5%PBS/Tween twice for 5 min.
5. Endogenous peroxidase activity is inhibited with 5% H2O2 for10 min and then the samples are rinsed with distilled water.
Hepatocyte Transplantation Techniques 93

6. The non-specific sites are blocked by incubation in goatserum (1:20) for 10 min at room temperature, then the excessof serum is removed without rinsing.
7. The samples are incubated with anti-BrdU monoclonal anti-body (1:100) in antibody dilution buffer for 1 h at roomtemperature in a humid chamber, then washed three timesfor 5 min each with PBS.
8. The secondary biotinylated antibody is applied according toan indirect avidin–biotin peroxidase kit for 15 min and thenthe sections are washed twice in PBS/Tween.
9. The complex strepavidin–peroxidase is added for 15 min (kitDako) and then the sections are washed twice in PBS/Tween.
10. DAB solution is applied on the sections: development times,controlled under a microscope, 10 min in the dark.
11. Harris hematoxylin solution is applied for 5 min. then the sam-ples are rinsed three times in tap water and in distilled water.
12. The samples are dehydrated in graded alcohol series, thenplaced in xylene three times for 5 min and then mountedglycergel (Dako).
4. Notes
1. The pre-perfusion has to be flowed until the blood is comple-tely washed out from the liver lobe. Stop the flow before airbubbles move into the liver. The portal vessels allow to flow theperfusate out of the lobe and to avoid an increase in thepressure.
2. The batch of collagenase is critical for cell viability and trans-duction efficiency. Batches are first tested for their ability toproduce high yields, maximum viability and membrane recov-ery of rat hepatocytes. Currently, collagenase A from Boehrin-ger (Mannheim, Germany) or collagenase type 1 CLS-1(Worthington) is used. Collagenase must be dissolved whenthe amount of the pre-perfusion solution becomes small toavoid a decrease in collagenase activity. To preserve the max-imum of enzyme activity and to avoid too much cooling ofcollagenase solution in the tubing, the water bath temperatureis kept at 398C.
3. Liver digestion has to be carefully checked and, depending onlobe size, collagenase perfusion can be stopped before the endof the solution flows out.
4. A low number of hepatocytes per dish leads to their apoptosis.The number of hepatocytes should be carefully adjusted to50% confluency when retroviral transduction is performed.
94 Weber et al.

The plating efficiency is always inferior to the number of viablecells as assessed by trypan blue.
5. To detect b-galactosidase activity, culture dishes or sectionshave to be incubated at 308C rather than at 378C, because atthis temperature, endogeneous b-galactosidase is not revealed.Whenever possible, it is recommended to add a nuclear locali-sation signal (nls) that targets the protein to the outer mem-brane of the nucleus and distinguish it from the endogenouslysosomal enzyme.
6. Hepatocytes in liver sections are autofluorescent. Therefore,GFP-transduced and GFP-transplanted hepatocytes are gen-erally difficult to detect from the resident cells. It is thereforebest to use an anti-GFP antibody to detect the geneticallymodified engrafted cells.
Acknowledgments
The authors thank Pr Dominique Franco for his permanent sup-port as well as all the members of Inserm U 804 who participatedin these protocols. Experiments on animals were performed atINRA (Jouy-en-Josas), and we thank Dr Guy Germain and DrAlexandre Laurent for their help and advice.
This work was supported by AFM (Association Francaise contreles Myopathies), Inserm, University Paris XI, Delegation a laRecherche Clinique AP-HP.
References
1. Fisher, R. A., Strom, S. C. (2006) Humanhepatocyte transplantation: worldwideresults. Transplantation 82, 441–449.
2. Weber, A., Mahieu-Caputo, D., Hadchouel,M., et al. (2006) Hepatocyte transplantation:studies in preclinical models. J Inherit MetabDis 29, 436–441.
3. Allen, K., Soriano, E. (2001) Liver cell trans-plantation: the road to clinical application.J Lab Clin Med 138, 298–311.
4. Grompe, M. (2006) Principles of therapeuticliver repopulation. J Inherit Metab Dis 29,421–425.
5. Azuma, H., Paulk, N., Ranade, A., et al.(2007) Robust expansion of human hepato-cytes in Fah-/-/Rag2-/-/Il2rg-/- mice. NatBiotechnol 25, 903–910.
6. Makuuchi, M., Thai, B. L., Takayasu, K., et al.(1990) Preoperative portal embolization to
increase safety of major hepatectomy forhilar bile duct carcinoma: a preliminary report.Surgery 107, 521–527.
7. Ilan, Y., Roy-Chowdhury, N., Prakash, R.,et al. (1997) Massive repopulation of rat liverby transplantation of hepatocytes into specificlobes of the liver and ligation of portal veinbranches to other lobes. Transplantation 64,8–13.
8. Eguchi, S., Rozga, J., Lebow, L. T., et al.(1996) Treatment of hypercholesterolemiain the Watanabe rabbit using allogeneic hepa-tocellular transplantation under a regenera-tion stimulus. Transplantation 62, 588–593.
9. Dagher, I., Boudechiche, L., Branger, J.,et al. (2006) Efficient hepatocyte engraft-ment in a nonhuman primate model afterpartial portal vein embolization. Transplan-tation 82, 1067–1073.
Hepatocyte Transplantation Techniques 95

10. Nguyen, T. H., Birraux, J., Wildhaber, B.,et al. (2006) Ex vivo lentivirus transductionand immediate transplantation of uncul-tured hepatocytes for treating hyperbilirubi-nemic Gunn rat. Transplantation 82,794–803.
11. Nguyen, T. H., Oberholzer, J., Birraux, J.,et al. (2002) Highly efficient lentiviral vec-tor-mediated transduction of nondividing,fully reimplantable primary hepatocytes.Mol Ther 6, 199–209.
12. Andreoletti, M., Loux, N., Vons, C., et al.(2001) Engraftment of autologous retrovi-rally transduced hepatocytes after intraportaltransplantation into nonhuman primates:
implication for ex vivo gene therapy. HumGene Ther 12, 169–179.
13. Parouchev, A., Nguyen, T. H., Dagher, I., et al.(2006) Efficient ex vivo gene transfer into non-human primate hepatocytes using HIV-1derived lentiviral vectors. J Hepatol 45, 99–107.
14. Vons, C., Loux, N., Simon, L., et al. (2001)Transplantation of hepatocytes in nonhumanprimates: a preclinical model for the treat-ment of hepatic metabolic diseases. Trans-plantation 72, 811.
15. Cosset, F. L., Takeuchi, Y., Weiss, R., et al.(1995) High-titer packaging cells producingrecombinant retrovirus resistant to humanserum. J Virol 69, 7430–7436.
96 Weber et al.
Chapter 9
Cell Transplant Techniques: Engraftment Detection of Cells
Robert A. Fisher and Valeria R. Mas
Abstract
The use of isolated human hepatocyte infusions to treat human disease will require safe, acceptable,
reliable, and reproducible measures of engraftment and function of the donor liver cell. Cell transplant for
inborn errors of hepatic metabolism can be followed by measuring the specific protein missing from therecipient, expressed by the transplanted unmodified donor hepatocytes expressing the genes in question.
This chapter will focus on the clinical techniques successful in identifying the engraftment and function of
donor human hepatocytes when no specific identifiable genes are expressed by donor hepatocytes in acuteand chronic liver diseases treated by cell infusion. Radiolabeling and dye labeling techniques, DNA typing
of HLA class I alleles, soluble class I HLA ELISA, real-time quantitative PCR techniques including short
tandem repeats analysis will be detailed and critiqued.
Key words: Human hepatocyte, short tandem repeats (STR), SHLA-class I, Real-time PCR.
1. Introduction
The first illustrations published on using a cell labeling tech-nique in human hepatocyte transplantation used 99m Tc(technetium) scintigrams to detect hepatocyte autotransplants,injected into the spleen, detected at 1 and 10 months follow-up (1). The use of radiolabeling technology to follow humanallogeneic hepatocyte transplant in the spleen, in the later1990 s, was demonstrated using serial technetium – 99m-diisopropyl-iminodiacetic acid (DISIDA) serial perfusionscans from days 2 to 23 post cellular infusion. The Tc scanscombined with serum measured serial improved ammoniaclearance matched radiologic evidence of hepatocellular activ-ity in the spleen with hepatocellular function (2).
Anil Dhawan, Robin D.Hughes (eds.), Hepatocyte Transplantation, vol. 481� Humana Press, a part of Springer ScienceþBusiness Media, LLC 2009DOI 10.1007/978-1-59745-201-4_9 Springerprotocols.com
97
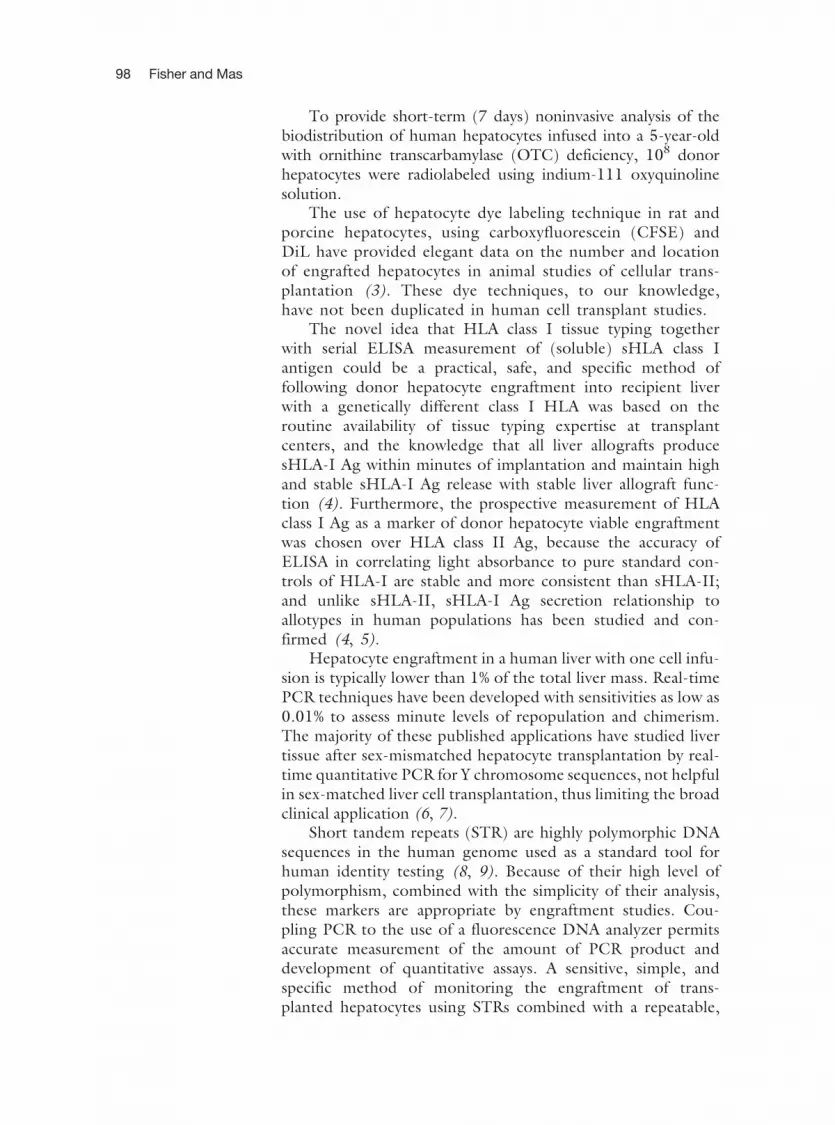
To provide short-term (7 days) noninvasive analysis of thebiodistribution of human hepatocytes infused into a 5-year-oldwith ornithine transcarbamylase (OTC) deficiency, 108 donorhepatocytes were radiolabeled using indium-111 oxyquinolinesolution.
The use of hepatocyte dye labeling technique in rat andporcine hepatocytes, using carboxyfluorescein (CFSE) andDiL have provided elegant data on the number and locationof engrafted hepatocytes in animal studies of cellular trans-plantation (3). These dye techniques, to our knowledge,have not been duplicated in human cell transplant studies.
The novel idea that HLA class I tissue typing togetherwith serial ELISA measurement of (soluble) sHLA class Iantigen could be a practical, safe, and specific method offollowing donor hepatocyte engraftment into recipient liverwith a genetically different class I HLA was based on theroutine availability of tissue typing expertise at transplantcenters, and the knowledge that all liver allografts producesHLA-I Ag within minutes of implantation and maintain highand stable sHLA-I Ag release with stable liver allograft func-tion (4). Furthermore, the prospective measurement of HLAclass I Ag as a marker of donor hepatocyte viable engraftmentwas chosen over HLA class II Ag, because the accuracy ofELISA in correlating light absorbance to pure standard con-trols of HLA-I are stable and more consistent than sHLA-II;and unlike sHLA-II, sHLA-I Ag secretion relationship toallotypes in human populations has been studied and con-firmed (4, 5).
Hepatocyte engraftment in a human liver with one cell infu-sion is typically lower than 1% of the total liver mass. Real-timePCR techniques have been developed with sensitivities as low as0.01% to assess minute levels of repopulation and chimerism.The majority of these published applications have studied livertissue after sex-mismatched hepatocyte transplantation by real-time quantitative PCR for Y chromosome sequences, not helpfulin sex-matched liver cell transplantation, thus limiting the broadclinical application (6, 7).
Short tandem repeats (STR) are highly polymorphic DNAsequences in the human genome used as a standard tool forhuman identity testing (8, 9). Because of their high level ofpolymorphism, combined with the simplicity of their analysis,these markers are appropriate by engraftment studies. Cou-pling PCR to the use of a fluorescence DNA analyzer permitsaccurate measurement of the amount of PCR product anddevelopment of quantitative assays. A sensitive, simple, andspecific method of monitoring the engraftment of trans-planted hepatocytes using STRs combined with a repeatable,
98 Fisher and Mas

reliable technique for using paraffin-embedded tissue speci-mens is described (10).
2. Materials
2.1. Cell Labeling with
Indium
1. Indium-111 oxyquinoline solution (1 mCi/ml activity;Amersham Corp., Arlington Heights, IL, USA).
2.2. HLA Class I
Tissue and Soluble
Typing
1. Mouse anti-human monoclonal antibodies (One Lambda Inc.Canoga Park, CA, USA) microtiter plates (CoStar, Cam-bridge, MA, USA).
2. Rabbit anti-human b-2 microglobulin (Dako, Carpinteria,CA, USA).
3. Tetramethylbenzidine (Dako), which is the substrate ofperoxidase.
2.3. Real-Time
Quantitative PCR and
STR Techniques
1. QIAamp Tissue Kit (Qiagen, Valencia, CA, USA).
2. PCR-SSP typing tray was from One Lambda Inc.
3. Perkins-Elmer Ampli Taq DNA polymerase (Norwalk, CT, USA).
4. PE 9700 Thermocycler (Perkin-Elmer).
5. Agarose gel with Micro SSP Gel System (One Lambda Inc.).
6. The AmpFLSTR1
Profiler PlusTM PCR Amplification Kit(Applied Biosystems, Foster City, CA, USA).
7. 310 Genetic Analyzer (Applied Biosystems).
3. Methods
3.1. Cell Labeling with
Indium
1. The procedure in brief is 108 human hepatocytes suspended inserum-free phosphate-buffered saline (PBS), centrifuged at70�g for 10 min.
2. The cells are then re-suspended with (1.3 mCi) In-111 oxy-quinoline drop by drop with gentle shaking. The suspension isgently agitated for 20 min of incubation at room temperature.
3. The In – 111 hepatocytes are re-suspended twice in 10 ml ice-cold PBS, and centrifuged twice at 70�g for 10 min, eachtime. The re-suspension and centrifugation is repeated forevery 30 min storage interval, until patient infusion, to ensurethe complete removal of unbound radioactivity (see Note 1).This procedure provides a labeling cell efficiency of 36%, whichis adequate for clinically useful scintigraphy (11).
Cell Transplant Techniques: Engraftment Detection of Cells 99

3.2. HLA Class I
Tissue and Soluble
Typing
3.2.1. Class I-Specific
ELISA
The methods used for class I-specific ELISA in brief are (4, 12, 13):Mouse anti-human monoclonal antibodies were used to measuredonor-specific sHLA. Donor-mismatched HLA alleles were chosento avoid known cross-reactivity with other recipient HLA alleles.1. Plasma samples are analyzed at a half dilution and all samples
are tested on the same day to minimize interassay variations.
2. Briefly, microtiter plates are coated with 100 ml of the chosenanti-sHLA overnight at 48C. The two or three chosen anti-bodies are diluted 1:200 in a carbonate buffer (35 mMNaHCO3/15 mM Na2CO3, pH 9.6).
3. Free binding sites are blocked by incubation of 200 ml PBScontaining 0.05% Tween 20 (PBST) and 1% bovine serumalbumin for 1 h at 378C.
4. The plasma samples are centrifuged at 14,000�g for 5 min toremove undissolved proteins. One hundred microliters of thepatient’s serum is added in half dilution with PBST and incu-bated for 2 h at 378C.
5. Subsequently, 100 ml of rabbit anti-human b-2 microglobulinis added in 1:1000 dilution with PBST and incubated for 1 hat 378C.
6. Finally, the plate is washed extensively three times with PBSTand incubated with 100 ml of conjugated goat anti-rabbit IgG-horseradish peroxidase in 1:5000 dilution at 378C for 1 h. Afterthe wash with PBST, bound antibody is detected by adding 100mlof tetramethylbenzidine, which is the substrate of peroxidase.
7. The reaction is stopped after 20 min with 100 ml of 2.5 NH2SO4 and the absorbance read at 450 nm. Backgroundcontrol uses PBST containing 1% bovine serum albumin,and the absorbance is subtracted by background reading.
3.2.2. Micro SSP DNA
Tissue Typing
1. For DNA extraction from the biopsy tissue, the QIAampTissue Kit is used. Briefly, the tissue is cut into small pieces.Proteinase K is used to mix with the tissue at 558C until thetissue is completely lysed.
2. RNase A (20 mg/ml) is added to digest RNA in the liver tissue.
3. After 100% ethanol precipitation, the samples were placed on aQIAamp spin column and centrifuged at 6000�g for 1 min.DNA samples are eluted with distilled water and the concen-tration of DNA measured (14).
4. The Micro SSP DNA Typing Tray is a polymerase chain reac-tion sequence-specific primer (PCR-SSP)-based assay for theDNA typing of HLA class I alleles (15). This technique
100 Fisher and Mas

determines whether donor-specific HLA is present (chimer-ism) in the pool of liver biopsy specimens from the patient.
5. All procedures were strictly followed according to the manufac-turer’s instructions. Each run of PCR includes a negative control.The presence of the negative control band and/or the positivetyping band in the negative control well voids all test results.
6. The master mix is prepared, and 28 U of Ampli Taq DNApolymerase is used for each tray. The tray containing completereactions is placed on a PE 9700 Thermocycler (16). The PCRprogram is run as follows: 1 cycle of 968C for 140 s, 658C for60 s; 5 cycles of 968C for 20 s, 658C for 60 s; 20 cycles of 968Cfor 20 s, 598C for 30 s, 728C for 45 s; and 8 cycles of 968C for20 s, 558C for 60 s, 728C for 90 s.
7. Each result is examined on a 2.5% agarose gel with a Micro SSPGel System (see Notes 2 and 3).
3.3. Real-Time
Quantitative PCR and
STR Techniques
1. The assay characteristics and analytical validation in brief are:The AmpFLSTR
1
Profiler PlusTM PCR Amplification Kitamplifies nine tetranucleotide STR loci and the amelogeninlocus in a single reaction tube. The STR loci amplified areD3S12358, D5S818, D7S820, D8S1179, D18S51, D21S11,FGA, and vWA. The amelogenin locus is used for gender iden-tification because products of different lengths are generatedfrom the X and Y chromosomes (Fig. 9.1).
2. Engraftment analysis requires one or more informative locithat distinguish the recipient from the donor. Each selectedpolymorphism is tested by means of an artificial reconstructionmixture of varying percentages of informative pre-transplantrecipient and donor DNAs to determine the validity and thesensitivity of the method.
3. Using 11 dilutions simulates a range of mixed chimerismsvarying from 100 to 0.01% (90, 70, 50, 25, 10, 5, 1, 0.75,0.5, 0.1, and 0.01%).
4. In addition, a negative control (100% donor DNA for recipientmarker amplification and the converse for donor marker ampli-fication) is included in the assay.
5. Each mix sample dilution is run in triplicate and the completeexperiments are run twice on 2 different days and are con-ducted by the same operator.
6. The mixing of DNAs is conducted on freshly collected humanperipheral blood with similar white blood cell counts. In addi-tion, sex-matched and mismatched cases are included for theanalytical validation.
7. DNA is isolated from individual blood mixtures.
8. Finally, PCR amplification is performed in triplicate accordingto the manufacturer’s instructions (using 25 cycles) and all
Cell Transplant Techniques: Engraftment Detection of Cells 101

the samples are analyzed on a 310 Genetic Analyzer in thesame run.
9. In addition, DNA mixes for the sensitivity analysis arecreated from DNA isolated from paraffin-embedded livertissues (PELT). The sensitivity of the test was establishedat 0.5% of DNA donor in the recipient using at least twoinformative alleles for the final engraftment percentagecalculation. Differences in the sensitivity between thecurves of DNA mixes from peripheral blood cells andPELT are not observed. Donor genotype is detected untilthe 0.5% recipient cell fraction with at least two informa-tive markers. Using a linear regression analysis, comparingmeasured donor genotype (%) versus effective donor DNA(%), the value for the coefficient of determination r2 was0.988. (see Notes 4 and 5).
Fig. 9.1. (A) DNA is to be isolated from donor and recipient before and after hepatocyte transplantation and then (B)amplified to produce sufficient DNA quantity so that (C) the AmpFLSTR Profiler Plus PCR Amplification Kit (AppliedBiosystems) can be used to quantify the donor-to-recipient DNA ratio to determine the donor cellular engraftment ofbiopsies of transplanted site or sites at variable times with accuracy, reproducibility, and sensitivity (0.5% donor DNA/recipient DNA).
102 Fisher and Mas

4. Notes
1. This re-suspension procedure, to minimize radiation injuryto labeled cells and provide the minimal cell labeling effi-ciency, reduces cell viability by as much as 10–20% evenwith the use of better cell-enhancing supernatants (17) andshorter storage time (<2 h) in the authors in vitro experi-ments to improve In-111 human hepatocyte labelingmethods. These factors have limited the routine applicationof this laborious labeling technique to clinical human celltransplant study.
2. Using the techniques detailed above, the first isolated humanliver cell transplant for fulminant liver failure as a bridge tonative liver regeneration was safely and reliably verified (18).The limitations of future applications of HLA class-I Ag mon-itoring for human hepatocyte transplant engraftment wereprimarily the senior authors inability to finance, test, and main-tain a broad enough library of readily available anti-HLA class Imonoclonal antibodies to be available for the diverse unpre-dictable donor cell to recipient HLA class I combinationsbased on donor hepatocyte availability and affected recipientpopulations.
3. Finally, the other major critique of this methodology for fol-lowing human hepatocyte engraftment and viability was that itlacked a simultaneous hepatocellular function-specific quanti-fication that has been solved with the next described appliedtechnology.
4. By combining use of the AmpFLSTR Profiler Plus PCRAmplification Kit and quantification of gene expression ofthe liver-specific transcripts, albumin, and P450 II B1, usingreal-time PCR, successful human hepatocyte transplantengraftment in a liver failure patient bridged to native liverregeneration (Fig. 9.2) was specifically, quantifiably, andreproducibly measured (19).
5. Finally, by combining STRs with liver function-specifictranscripts in a gene array chip platform, we will automateand standardize measurements of hepatocyte engraftmentand function. Although cell transplant for non-inbornerrors of hepatic metabolism have stimulated these mole-cular techniques, they will ironically aid in the timingstudies of additional cell transplants for the treatment ofinherited hepatocellular factor deficiencies that are notsolved by single cell infusion and simple-factor (i.e. FactorVII) (20) serum measurement.
Cell Transplant Techniques: Engraftment Detection of Cells 103

References
1. Kusano, M., Jiang, B., Murakami, M., et al.(1997) Clinical liver cell transplantation, in(Mito, M., Sawa, M., eds.), HepatocyteTransplantation: Now and Then, pp.297–311. Karger Landes Systems, Basel,Switzerland.
2. Fisher, R. A., Strom, S. C. (2000) Humanhepatocyte transplantation: biology and ther-apy. in (Berry, M. N., Edwards, A. M., eds.),In the Hepatocyte Review, pp. 475–501.Kluwer Academic Publishers, Dordrecht,The Netherlands.
3. Fujioka, H., Hunt, P. J, Rozga, J., et al.(1994) Carboxyfluorescein (CFSE) Labeling
of hepatocytes for short-term localizationfollowing intraportal transplantation. CellTransplantation 3, 397–408.
4. McDonald, J. C., Adamashivili, I. (1998)Soluble HLA: a review of the literature.Human Immunol 59, 387–403.
5. McDonald, J. C., Adamashivili, I., Zobaro,G. B., et. al. (1997) Serologic allogeneic chi-merism. Transplantation 64 (6), 865–871.
6. Byrne, P., Huang, W., Wallace, V. M., et al.(2002) Chimerism analysis in sex-mis-matched murine transplantation using guan-titative real-time PCR. Biotechniques 32,279–280, 282–284.
Fig. 9.2. Study of engraftment and gene expression after hepatocyte transplantation. (A) The AmpFLSTR Profiler Plus PCRAmplification Kit (Applied Biosystems) is used for the study of engraftment. Engraftment studies are performed in liverbiopsies at days 0, 7, 15, and 32 post hepatocyte transplantation. Although the pre-transplantation biopsy shows markerscorresponding to the recipient genotype, a mix of markers from donor and recipient is observed at day 7 with lowerengraftment percentages at days 15 and 32. (B) Quantitation of gene expression of the liver-specific transcripts albuminand P450IIB1 is performed using real-time PCR. MRNA levels of both transcripts are increased after transplantation whencompared with pre-transplantation values.
104 Fisher and Mas

7. Wang, L. J., Chen, Y. M., George, D., et al.(2002) Engraftment assessment in humanand mouse liver tissue after sex-mismatchedliver cell transplantation by real-time quanti-tative PCR for Y chromosome sequences.Liver Transpl 8, 822–828.
8. Antin, J. H., Childs, R., Filipovich, A. H., et al.(2001) Establishment of complete and mixeddonor chimerism after allogeneic lymphohe-matopoietic transplantation: Recommenda-tions from a workshop at the 2001 TandemMeetings of the International Bone MarrowTransplant Registry and the American Societyof Blood and Marrow Transplantation. BiolBlood Marrow-Transplant 7, 473–485.
9. Kleeberg, W., Rothamel, T., Glockner, S.,et al. (2002) High frequency of epithelialchimerism in liver transplants demonstratedby microdissection and STR-analysis. Hepa-tology 35(1), 110–116.
10. Mas, V. R., Maluf, D. G., Thompson, M.,et al. (2004) Engraftment measurement inhuman liver tissue after liver cell transplanta-tion by short tandem repeats analysis. CellTranspl 13, 231–236.
11. Bohnen, N. I., Charron, M., Reyes, J., et al.(2000) Use of Indium – III – labeled hepa-tocytes to determine the biodistribution oftransplanted hepatocytes through portal veininfusion. Clin Nucl Med 25, 447–450.
12. Koelman, C. A., Mulder, A., Jutte, N. H.,et al. (1998) The application of humanmonoclonal antibodies for monitoringdonor derived soluble HLA Class I mole-
cules in the serum of heart transplant recipi-ents. Human Immunol 59, 106–114.
13. Pouletty, C., Mercier, I., Glanville, L., et al.(1994) Typing of a panel of soluble HLAclass I antigen by enzyme-linked immuno-sorbent assay. Human Immunol 40, 218.
14. Ausubel, F. M., Brent, R., Kingston, R. E.,et al. (1992) Current Protocols in MolecularBiology. New York: John Wiley and Sons, 59.
15. Teraski, P. I. (1980) Histocompatibility test-ing. Report of the 8th International histo-compatibility workshop, in (Taraski, PI, ed.),UCLA Tissue Typing Laboratory, LosAngeles, CA.
16. Newton, C. R., Graham, A., Heptinstall, E.,et al. (1989) Analysis of any point mutation inDNA: the amplification refractory mutationsystem (ARMS). Nucleic Acids Res 17, 2503.
17. Fisher, R. A., Bu, D., Thompson, M., et al.(2004) Optimization of conditions for clin-ical human hepatocyte infusion. Cell Transpl13, 677–689.
18. Fisher, R. A., Bu, D., Thompson, M.,et al. (2000) Defining hepatocellular chi-merism in a liver failure patient bridgedwith hepatocyte infusion. Transplantation69, 303–307.
19. Fisher, R. A., Strom, S. C. (2006) Humanhepatocyte transplantation: Worldwideresults. Transplantation 82, 441–449.
20. Dhawan, A., Mitry, R. R., Hughes, R. D.,et al. (2004) Hepatocyte transplantation forinherited factor VII deficiency. Transplanta-tion 78, 1812–1813.
Cell Transplant Techniques: Engraftment Detection of Cells 105

Chapter 10
Hepatic Preconditioning for Transplanted Cell Engraftmentand Proliferation
Yao-Ming Wu and Sanjeev Gupta
Abstract
Hepatocyte transplantation has therapeutic potential for multiple hepatic and extrahepatic disorderswith genetic or acquired basis. To demonstrate whether cell populations of interest will be effective forclinical applications, it is first necessary to characterize their properties in animal systems. Demonstrat-ing the potential of cells to engraft and proliferate is a critical part of this characterization. Similarly, forstem/progenitor cells, demonstrating the capacity to differentiate along appropriate lineages andgenerate mature cells that can engraft and proliferate is essential. In various animal models, precondi-tioning of recipients prior to cell transplantation has been necessary to improve engraftment of cells, tostimulate proliferation of engrafted cells, and to induce extensive repopulation of the host liver bytransplanted cells. Although this is an area of active investigation, effective preconditioning protocolsshould alter the hepatic microenvironment, such that transplanted cells can obtain selective advantagesfor engrafting and proliferating in the liver. Use of such experimental systems in animals will helpgenerate further strategies for liver repopulation and thereby advance clinical applications of liver celltherapy.
Key words: Hepatocyte, engraftment, liver, preconditioning, proliferation, transplantation.
1. Introduction
In principle, liver-directed cell therapy could substitute fororthotopic liver transplantation (OLT) in some conditions,serve as a bridge to OLT in other situations, e.g., acute liverfailure, and offer the possibility of hepatic support in refractoryhepatic failure, when OLT may not be possible. To advanceapplications of hepatocyte transplantation, it is necessary todevelop effective mechanisms for engraftment and proliferationof transplanted cells, such that the liver can be repopulated tothe desired extent. Moreover, it is necessary to identify suitable
Anil Dhawan, Robin D.Hughes (eds.), Hepatocyte Transplantation, vol. 481� Humana Press, a part of Springer ScienceþBusiness Media, LLC 2009DOI 10.1007/978-1-59745-201-4_10 Springerprotocols.com
107

cell populations for transplantation, which will be capable ofengrafting, proliferating, and restoring deficient functionunder various circumstances. These goals require the availabil-ity of appropriate systems in vivo using both small and largeanimals.
Apart from issues concerning the route of cell delivery,infusion rate, prior manipulations of cells, fresh versus fro-zen cells, etc., the successful engraftment of cells constitu-tes the first step of effective cell transplantation. In general,transplantation in one session of the equivalent of 2–5% ofthe hepatocyte mass present in the whole liver is well tol-erated and is without serious adverse effects. However, only15–20% of transplanted hepatocytes engraft successfully inthe parenchyma of the recipient liver (1, 2). Therefore, notmore than 1% of the liver can be replaced by transplantedhepatocytes after one session of cell transplantation.Repeated cell transplantation can increase the fraction oftransplanted cells in the liver, although the extent of liverreplacement remains limited (5–7%). On the other hand,effective cell therapy demands greater liver replacement.Therefore, efforts have been ongoing to develop suitablestrategies for obtaining superior results following hepato-cyte transplantation.
Two complementary approaches have been effective inincreasing the number of transplanted hepatocytes in the liver.The first approach concerns the improvement of cell engraft-ment by various manipulations, including repeated cell trans-plantation, use of vasodilators to alter the distribution oftransplanted cells in the liver lobule, inhibition of macrophagefunction, manipulation of extracellular matrix component inter-actions in liver sinusoids, and prior disruption of the sinusoidalendothelial barrier with specific drugs or chemicals (3–8). Thesecond approach concerns the induction of proliferation intransplanted hepatocytes to promote repopulation of the recipi-ent liver. Creation of a suitable hepatic microenvironment maystimulate proliferation in transplanted cells, although whenregenerating native cells compete with transplanted cells, e.g.,in response to partial hepatectomy or ischemic liver injury,transplanted cells do not proliferate beyond 1–2 cell dou-blings. The most effective way to induce proliferation intransplanted cells is to either selectively enhance the prolifera-tion capacity of transplanted cells (9) or to impair survivaland/or proliferation in native cells (10–17). The formerapproach requires manipulation of cell cycle regulatory con-trols, which is intrinsically problematic due to the possibilityof oncogenic perturbations. Therefore, recent interest hasfocused more on the latter approach.
108 Wu and Gupta

The combination of manipulations to improve cell engraft-ment in the first instance followed by perturbation of nativehepatocytes to induce proliferation in transplanted cells hasbeen most effective. It should be noteworthy that manipula-tions capable of improving cell engraftment can increase thenumber of engrafting cells by several-fold, which can greatlyaccelerate the kinetics of liver repopulation. The time taken tonear-total liver repopulation under such circumstances can bemarkedly shortened. The findings are significant because trans-planted hepatocytes survive life-long in the absence of rejectionand this has obvious implications for therapies in specificdisorders.
Several preconditioning regimens were recently devel-oped to improve engraftment and proliferation of trans-planted cells in animals. Rodent models capable ofdemonstrating transplanted cell proliferation include trans-genic strain combinations, e.g., alb-uPA transgenic mice asrecipients, Bcl2–/– mice as donors with Jo-2 Fas-ligand-induced liver damage in recipients, mice lacking the fumar-ylacetoacetate hydroxylase enzyme (FAH–) as recipients(10–12), use of radiation plus hepatic ischemia and reperfu-sion (13), radiation plus hepatocyte growth factor (14),retrorsine plus partial hepatectomy or thyroid hormone orcarbon tetrachloride (15–18), and use of monocrotalineplus partial hepatectomy or CCl4 (19, 20). Among these,protocols using hepatic radiation could be useful forclinical applications and these are undergoing furtherinvestigations.
On the other hand, convenient protocols for animalstudies will be particularly helpful in preclinical studies, ana-lysis of lot-to-lot variability of cells during clinical trials, aswell as assessment of novel cell populations. Derivatives ofembryonic stem cells, organ-derived stem/progenitor cells,and circulating stem/progenitor cells gained interest for celltherapy, although understanding their properties in vivorequires further work. Also, suitable animal models willhelp in mechanisms concerning xenotransplantation of cells,e.g., use of porcine hepatocytes, which show therapeuticpotential in rodent systems, although further analysis isrequired on how these cells will engraft, proliferate, andfunction in the liver.
Here, we provide convenient protocols in rats to establishmechanisms in the engraftment and proliferation of trans-planted hepatocytes. The preconditioning regimens describedutilize the pyrrolizidine alkaloids, retrorsine and monocrota-line, which exert hepatic toxicity and are known to possessoncogenic potential. Therefore, these chemicals are not suita-ble for clinical use.
Hepatocyte Transplantation in Animals 109

2. Materials
2.1. Animals 1. Six to 10-week-old dipeptidyl peptidase-deficient (DPPIV–)rats in F344 background as cell recipients (F344/DchcHsd-DPPIV–; Harlan Sprague Dawley Inc., Indianapolis, IN, USA).
2. Inbred F344 rats as hepatocyte donors (F344/NHsd fromHarlan Sprague Dawley Inc.).
2.2. Hepatocyte
Isolation (see previous
detailed publication in
Ref. (21)
1. Perfusion solution:(a) Leffert’s buffer, (b) EGTA in Leffert’sbuffer, and (c) collagenase (21) (all chemicals from SigmaChemical Co., St. Louis, MO, USA).
2. Nylon mesh 85 mm pore size.
3. RPMI 1640 medium.
4. Trypan blue dye 0.4% (Sigma, 30-264-3).
2.3. Chemicals for
Liver Preconditioning
1. Retrorsine (Sigma, R0382).
2. Monocrotaline (Sigma, C2401).
2.4. Histochemical
Staining for DPPIV
1. Gly-Pro-4-methoxy-b-naphtylamide (GPMNA) (Sigma,G9137), store at –208C.
2. o-Dianisidine, tetrazotized (Fast Blue Salt BN) (Sigma,F3378), store at 48C.
3. N,N-Dimethylformamide (Sigma, D4551).
4. Chloroform and acetone.
5. 0.1 M phosphate-buffered saline (PBS), pH 7.4.
2.5. Preparation
of Monocrotaline
Solution for Injection
Weigh suitable amounts of monocrotaline depending on body weight(dose 200 mg/kg) and dissolve in 0.9% saline in a small tube with theaddition of 1 N HCl to lower pH around 2. After dissolution, adjust pHto 7 with 1 N NaOH. Pass the solution through a 22 mm filter.
2.6. Preparation
of Retrorsine Solution
for Injection
Dissolve retrorsine powder in PBS at 6 mg/ml, add up to twodrops of 1 N HCl until complete dissolution, then adjust pH with1 N NaOH to 7.4. Pass the solution through a 22 mm filter. Injectretrorsine in 500 ml per 100 g body weight.
2.7. Preparation
of DPPIV Staining
Solution
Dissolve 10 mg Fast Blue Salt BN in 10 ml 0.1� PBS in a smalltube. Keep on ice. Dissolve 4 mg GPMNA in 0.5 ml N,N-dimethylformamide. Keep on ice. Combine solutions in a and bimmediately before use. Freeze excess solutions in c at –70? forreuse over up to several months without repeated freeze-thawing.
2.8. Quantitative
Analysis of Cell
Proliferation
1. Spot RT digital camera (Diagnostic Instruments Inc., SterlingHeights, MI, USA) or equivalent.
2. ImageJ software (http://rsb.info.nih.gov/ij/).
110 Wu and Gupta

3. Methods
3.1. Isolation of Rat
Hepatocytes (21)
1. Set up a perfusion apparatus and maintain solutions at 378C ina water bath (see Note 1).
2. Insert a 20 French intravascular catheter into the main portalvein and go beyond the tie but not beyond the bifurcation ofthe portal vein (see Note 2).
3. Start perfusion at 10–20 ml/min with 1� EGTA for 5 min(see Note 3).
4. Cut the abdominal aorta to drain perfusion fluid and continueperfusion with 1� Leffert’s Buffer for 3 min and with collage-nase-containing buffer for 10–20 min.
5. Excise the liver after completing perfusion, incise the capsule,and gently disperse cells.
6. Collect dissociated cell suspension and filter through 85 mmnylon mesh, followed by centrifugation of the cell suspensionunder 50�g for 5 min at 48C at least twice to pellet viable cellsand eliminate other cell types.
7. Resuspend cell pellet in RPMI 1640 medium, count cell num-bers, and assess cell viability with trypan blue dye exclusion andmaintain cells on ice for transplantation (see Note 4).
3.2. Transplantation
of Isolated
Hepatocytes in Rats
1. Anesthetize rat with anesthetic ether or other suitable medica-tion, place in right decubitus position, and clean the abdominalwall with 70% ethanol and iodine.
2. Make 0.5–1 cm incision below the left subcostal abdominalwall with sharp scissors.
3. Identify the spleen and loosely tie a monofilament silk ligaturearound its lower pole.
4. Resuspend 10–20 million hepatocytes per milliliter of plainRPMI 1640 medium.
5. Inject 5–20 million cells through a 1 ml syringe with a 25French needle into the lower pole of spleen over 10–20 s(see Note 5).
6. Withdraw the needle after injecting cells and tighten the silkligature to prevent leakage of transplanted cells and bleeding.
7. Wipe blood with gauze and close the abdominal incision with4-0 nylon sutures.
8. Return the animal to its cage, keep warm under heating lampuntil recovery from anesthesia, and administer analgesia.
3.3. Preconditioning
to Improve Cell
Engraftment
1. Administer 200 mg/kg monocrotaline intraperitoneally orintravenously to DPPIV– rats 24 h before cell transplantation(see Note 6).
Hepatocyte Transplantation in Animals 111
2. Analyze engraftment of transplanted cells 1, 2, 4, or 7 days orafter longer intervals, e.g., 3 months, following cell transplan-tation (Fig. 10.1).
3.4. Preconditioning
for Assessing the
Proliferation of
Transplanted
Cells – Retrorsine Plus
Partial Hepatectomy
1. Commence administration of 30 mg/kg retrorsine to DPPIV–rats when 6 weeks old weighing 70–100 g. Retrorsine is admi-nistered intraperitoneally in a volume of 500 ml per 100 g bodyweight. A second dose of retrorsine is given 2 weeks later.
2. Two-thirds partial hepatectomy is according to the standardHiggins and Anderson method (22). Rats are anesthetizedunder ether, placed supine, and the abdominal wall is cleanedwith 70% ethanol and iodine. A 2–3 cm midline laparotomyincision is made starting from the bottom of the xiphoid process.The falciform, and left triangular and lienorenal ligaments aredivided. A nonabsorbable silk ligature is placed around the med-ian lobe and left lateral lobe of the liver to enclose the inflow andoutflow pedicles and tied securely underneath the liver. The liverparenchyma above the ligature is resected, blood is wiped, andthe abdomen is closed with 4-0 nylon sutures. After injecting0.5 ml warm saline intraperitoneally, the animal is returned to thecage and kept warm until recovery from anesthesia.
Fig. 10.1. Liver preconditioning using monocrotaline (MCT) for improving cellengraftment in DPPIV– rats. Transplanted F344 rat hepatocytes are shown in therecipient liver 4 and 7 days after cell transplantation. Panel a shows 1–3 transplantedhepatocytes with histochemically visualized DPPIV activity (red color, arrows) in peri-portal areas (Pa). By contrast, in MCT-treated rats (b) several-fold more transplantedcells are present. Original magnification, �200; hematoxylin counterstain. Modifiedfrom Joseph B, et al. (20). Reprinted with permission of Wiley-Liss, Inc., a subsidiary ofJohn Wiley & Sons, Inc. (see Color Plate 4)
112 Wu and Gupta

3. To assess liver repopulation, 5 million F344 hepatocytes aretransplanted intrasplenically immediately after or 4–7 daysafter partial hepatectomy followed by timed analysis of livers.
4. To demonstrate the kinetics of liver repopulation, hepatocyterecipients are analyzed 2, 3, and 4 weeks following cell trans-plantation (Fig. 10.2).
3.5. Identification of
Transplanted
Hepatocytes by DPPIV
Histochemical
Staining
1. Tissues are sampled from multiple lobes per animal and frozenin methylbutane cooled to –708C on dry ice. Cryosections of5–6 mm thickness are prepared.
2. The sections are air-dried for at least 30 min and fixed inchloroform-acetone (1:1, v/v) at 48C for 10 min.
3. The sections are covered with 50–100 ml staining solution andincubated for 30–45 min at room temperature in humidifiedchambers.
4. The staining solution is removed and sections are washed withclean water before counterstaining with aqueous 0.5% methyl-green or toluidine blue for 10–30 s.
5. Stained slides can be stored at 48C after air-drying withoutmounting medium.
6. For microscopic examination and microphotography, stainedsections are mounted in aqueous medium, e.g., glycerol.
Fig. 10.2. Analysis of the kinetics of liver repopulation in DPPIV– rats precondi-tioned with retrorsine and partial hepatectomy. Foci of transplanted cells with DPPIVactivity (red color) are seen 2 (a), 3 (b), and 4 weeks (c) after cell transplantation.Morphometric analysis of liver repopulation in panel d indicates linear increase in liverrepopulation during this period. Original magnification, (a–c), �40; hematoxylin coun-terstain. Modified from Wu Y-M et al. (18). Reprinted with permission of Wiley-Liss, Inc.,a subsidiary of John Wiley & Sons, Inc. (see Color Plate 5)
Hepatocyte Transplantation in Animals 113

3.6. Quantification
of Engrafted Cells
1. Analyze multiple cryosections per liver lobe after DPPIV staining.
2. Place one reinforcement ring (3.7 mm in diameter) on eitherthe coverslip or the back of the slide for the hole to not extendbeyond the tissue section.
3. Count transplanted cells identified by DPPIV staining under�400. Analyze 100 consecutive liver lobules. Assess the frac-tion of portal vein radicles containing transplanted cells.
4. The number of transplanted cells can be depicted as trans-planted cells per liver lobule, as well as transplanted cells perunit liver area (mm2) or volume (mm3).
3.7. Measuring
the Extent of Liver
Repopulation by
Transplanted Cells
1. Analyze multiple sections per liver lobe following DPPIVstaining and obtain microphotographs from consecutiveadjacent areas in sections under �40 magnification.
2. To estimate the fraction of liver repopulated by transplanted cells,use ImageJ, or equivalent software, according to instructions.
Fig. 10.3. Effect of immunosuppressive drugs, Rapamycin (Rapa) and Tacrolimus(Tacro), on liver repopulation in DPPIV– rats preconditioned with retrorsine andpartial hepatectomy. Animals were treated with drugs subsequent to the completion ofcell engraftment. Rapa- but not Tacro-suppressed transplanted cell proliferation asshown by DPPIV histochemistry and morphometric analysis of either the extent ofliver repopulation (e) or individual transplanted cell foci (f). Original magnification(a–d), �100; hematoxylin counterstain. Modified from Wu Y-M et al. (18) . Reprintedwith permission of Wiley-Liss, Inc., a subsidiary of John Wiley & Sons, Inc. (see ColorPlate 6)
114 Wu and Gupta

3. To estimate the size of transplanted cell foci in microphoto-graphs, use Neubaur chamber (1 mm2 per square) or equivalentfor calibration.Using this preconditioning protocol for repopulation of the
liver, the behavior of transplanted cells can be convenientlydemonstrated. As an illustration, studies to analyze the effect ofthe immunosuppressive drug, Rapamycin, on transplanted hepa-tocytes were informative (Fig. 10.3). These studies (18) demon-strated that Rapamycin suppressed proliferation in transplantedcells, resulting in the arrest of liver repopulation. This analysis washelpful in establishing which immunosuppressive drugs will bemost suitable for clinical liver cell therapy protocols.
4. Notes
1. Filter all solutions after adjusting pH to 7.4. Prepare collage-nase solution immediately before perfusion.
2. Advancement of the IV catheter beyond the bifurcation of theportal vein will produce variable liver perfusion.
3. After portal cannulation, perfusion should be started immedi-ately to avoid thrombotic occlusion of distal portal vein radi-cles, which impairs perfusion and tissue digestion. Low-doseheparin intravenously before portal cannulation may be helpfulfor the beginner.
4. The viability of isolated hepatocytes will affect cell engraftmentand proliferation. Hepatocytes with viability less than 80%should not be used for transplantation.
5. Use of large volumes (e.g., in excess of 2 ml) may producesplenic rupture or hemorrhage.
6. Proliferation of transplanted cells after preconditioningwith retrorsine and partial hepatectomy is affected by the gen-der. Male rats are more responsive to both retrorsine andmonocrotaline.
References
1. Ponder, K. P., Gupta, S., Leland, F., et al.(1991) Mouse hepatocytes migrate to liverparenchyma and function indefinitely afterintrasplenic transplantation. Proc Natl AcadSci USA 88, 1217.
2. Gupta, S., Aragona, E., Vemura, R. P., et al.(1991) Permanent engraftment and functionof hepatocytes delivered to the liver: implica-tions for gene therapy and liver repopulation.Hepatology 14, 144.
3. Harmeet, M., Pallavi, A., Sanjeev, S., et al.(2002) Cyclophosphamide disrupts hepaticsinusoidal endothelium and improved trans-planted cell engraftment in rat liver. Hepatol-ogy 36, 112–121.
4. Kim, K. S., Joseph, B., Inada, M., et al.(2005) Regulation of hepatocyte engraftmentand proliferation after cytotoxic drug-inducedperturbation of the rat liver. Transplantation80, 653–659.
Hepatocyte Transplantation in Animals 115

5. Sanjeev, S., Pankaj, R., Yoshiya, I., et al.(2002) Hepatic sinusoidal vasodilatorsimprove transplanted cell engraftment andameliorate microcirculatory perturbations inthe liver. Hepatology 35, 1320–1328.
6. Kumaran, V., Joseph, B., Benten, D., et al.(2005) Integrin and extracellular matrixinteractions regulate engraftment of trans-planted Hepatocytes in the rat liver. Gastro-enterology 129, 1643–1653.
7. Brigid, J., Harmeet, M., Kuldeep, K. B., et al.(2002) Kupffer cells participate in early clear-ance of syngeneic hepatocytes transplantedin the rat liver. Gastroenterology 123,1677–1685.
8. Rajvanshi, P., Kerr, A., Bhargava, K. K., et al.(1996) Efficacy and safety of repeated hepa-tocyte transplantation for significant liverrepopulation in rodents.Gastroenterology111, 1092–1102.
9. Yuan, R. H., Ogawa, A., Ogawa, E., et al.(2003) p27Kip1 inactivation provides a pro-liferative advantage to transplanted hepato-cytes in DPP?/Rag2 double knockout miceafter repeated host liver injury. Cell Transpl12, 907–919.
10. Rhim, J. A., Sandgren, E. P., Degen, J. L.,et al. (1994) Replacement of diseased mouseliver by hepatic cell transplantation. Science263, 1149–1152.
11. Alexandre, M., Jacques, E. G., Claudia, M.,et al. (1998) Selective repopulation of nor-mal mouse liver by Fas/CD95-resistanthepatocytes. Nat Med 4, 1185–1188.
12. Overturf, K., Al-Dhalimy, M., Ou, C. N.,et al. (1997) Serial transplantation revealsthe stem-cell-like regenerative potential ofadult mouse hepatocytes. Am J Pathol 151,1273–1280.
13. Harmeet, M., Giridhar, R. G., Adil, N. I.,et al. (2002) Cell transplantation after
oxidative hepatic preconditioning with radia-tion and ischemia-reperfusion leads to exten-sive liver repopulation. Proc Nat Acad SciUSA 99, 13114–13119.
14. Guha, C., Yamanouchi, K., Jiang, J., et al.(2005) Feasibility of hepatocytes transplanta-tion-based therapies for primary hyperoxalurias.Am J Nephrol 25, 161–170.
15. Ezio, L., Ran, O., Deb, K. M., et al.(1998) Long-term, near-total liver repla-cement by transplantation of isolated hepato-cytes in rats treated with retrorsine. Am J Pathol153, 319–329.
16. Oren, R., Dabeva, M. D., Karnezis, A. N., et al.(1999) Role of thyroid hormone in stimulatingliver repopulation in the rat by transplantedHepatocytes. Hepatology 30, 903–913.
17. Guo, D., Fu, T., Nelson, J. A., et al.(2007) Liver repopulation after cell trans-plantation in mice treated with retrorsineand carbon tetrachloride. Transplantation73, 1818–1824.
18. Wu, Y. M., Joseph, B., Gupta, S. (2006)Immunosuppression using the mTOR inhi-bition mechanism affects replacement of therat liver with transplanted cells. Hepatology44, 410–419.
19. Witek, R. P., Fisher, S. H., Petersen, B. E.(2005) Monocrotaline, an alternative to ret-rorsine-based hepatocytes transplantation inrodents. Cell Transpl 14, 41–47.
20. Joseph, B., Kumaran, V., Berishvili, E., et al.(2006) Monocrotaline promotes trans-planted cell engraftment and advances liverrepopulation in rats via liver conditioning.Hepatology 44, 1411–1420.
21. Neufeld, D. S. (1997) Isolation of rat liverhepatocytes. Methods Mol Biol 75, 145–151.
22. Higgins, G. M., Anderson, R. M. (1931)Experimental pathology of liver resection.Arch Pathol 12, 186–197.
116 Wu and Gupta

Chapter 11
Ex Vivo Gene Transfer into Hepatocytes
Xia Wang, Prashant Mani, Debi P. Sarkar, Namita Roy-Chowdhuryand Jayanta Roy-Chowdhury
Abstract
Ex vivo gene transfer into hepatocytes could serve several purposes in the context of gene therapy or celltransplantation: (1) isolated hepatocytes can be transduced in culture with therapeutic genes and then
transplanted into the recipient; (2) marker genes can be introduced for subsequent identification of
transplanted cells and their progeny; (3) gene transfer can be used for conditional immortalization ofhepatocytes for expansion in culture; (4) immunomodulatory genes can be transferred into hepatocytes to
prevent allograft rejection. Gene transfer into cultured hepatocytes can be achieved using DNA that is not
incorporated into recombinant viruses. In such systems, transgene integration into the host cell genomecan be enhanced using transposon systems, such as ‘‘sleeping beauty.’’ In addition to using the conven-
tional reagents, such as cationic liposomes, DNA transfer into hepatocytes can be achieved by Nucleofec-
tion1 or special hepatocyte-targeted carriers such as proteoliposomes containing galactose-terminated
glycoproteins (e.g. the F protein of the Sendai virus). Alternatively, genes can be transferred usingrecombinant viruses, such as adenoviral vectors that are episomal or retroviral vectors (including lenti-
viruses) that permit integration of the transgene into the host genome. Gene transfer using lentiviral
vectors has been achieved in both attached and suspended hepatocytes. Transduction efficiency oflentiviral vectors can be enhanced using magnetic nanoparticles (Magnetofection
1
).
Key words: Gene transfer, ex vivo, sleeping beauty, nucleofection, F-virosome, lentiviral vectors,magnetofection.
1. Introduction
Transferring genes into isolated hepatocytes could enhance thescope of hepatocyte transplantation. Some examples of the poten-tial uses of ex vivo gene transfer are discussed below to illustratethat the choice of methods to transfer the transgene depends onthe ultimate goal of the procedure.
Anil Dhawan, Robin D.Hughes (eds.), Hepatocyte Transplantation, vol. 481� Humana Press, a part of Springer ScienceþBusiness Media, LLC 2009DOI 10.1007/978-1-59745-201-4_11 Springerprotocols.com
117

1.1. Objectives of Ex
Vivo Gene Transfer
into Hepatocytes
1.1.1. Ex Vivo Gene
Therapy
This procedure consists of isolating hepatocytes from a patient ora mutant animal carrying a liver-based inherited disease, transdu-cing the cells in culture with a therapeutic gene and then trans-planting the phenotypically corrected cells back into the donor.Since the hepatocytes are autologous, this approach circumventsthe need for immunosuppression of the host. Long-term efficacyof this strategy requires integration of the transgene into the hostgenome.
Hepatocytes from a resected liver segment from low-densitylipoprotein (LDL) receptor-deficient rabbits (Watanabe heritablehyperlipidemic rabbit) have been transplanted after ex vivo trans-duction with the low-density lipoprotein receptor (LDLR) geneusing recombinant Moloney’s murine leukemia virus (MuLV)vectors (1). This study and the subsequent clinical trial inhuman subjects (2) with familial hypercholesterolemia had onlya minor metabolic effect, which was not sufficient for clinicalbenefit. Several technical issues limited the success of the proce-dure. (i) Because cultured primary hepatocytes do not proliferatesignificantly and have a limited life span in culture, it was notpossible to select the transduced cells prior to transplantation.Therefore, the success of the procedure was dependent primarilyon the efficiency of transduction. Oncoretroviruses, such asMuLV, require cell division for integration into the chromosome.Despite the use of growth factors in the media, there was only aminor degree of mitosis of hepatocytes in culture. Thus, theefficiency of transduction was limited. (ii) The number of hepa-tocytes that can be safely transplanted in a single procedure islimited. As no preparative maneuver had been employed to pro-mote preferential proliferation of the transplanted cells in the hostliver, the total number of engrafted phenotypically correctedhepatocytes was quite small. Nonetheless, these studies demon-strated that the procedure can be performed safely and delineatedthe problems involved in this approach, which has stimulatedfurther research, addressing each hurdle as described below.
Vectors, such as those based on immunoretroviruses (lenti-viruses) and plasmids that are transposition competent, exhibit ahigh efficiency of integration in non-dividing cells. Substitution ofthe oncoretroviral vectors with these vectors could provide a highlevel of gene transfer into primary hepatocytes, enabling successfulex vivo gene therapy, without the need for prior selection of thetransduced cells. New development in the area of hepatic repopu-lation with transplanted hepatocytes, such as those based on con-trolled irradiation of the host liver and the use of hepatocyte
118 Wang et al.

mitostimulatory factors, can enable preferential proliferation ofthe engrafted cells over host hepatocytes, leading to progressiverepopulation of the liver.
1.1.2. Marking
Hepatocytes for Imaging
Currently, the assessment of survival of the engrafted hepatocytesin the host liver requires needle biopsies or surgical biopsies of theliver, which is difficult and risky to repeat in clinical settings andcan be misleading because of the inhomogeneous distribution ofthe engrafted cells. A major obstacle to improving the techniquesfor hepatocyte transplantation is the lack of a non-invasive methodfor serial assessment of the survival and distribution of the trans-planted hepatocytes. In small animals, optical imaging employinghepatocytes expressing firefly luciferase or green fluorescent pro-tein can be used for localization of engrafted cells (3, 4). Butoptical methods do not offer the degree of penetration thatwould be needed in larger animals or humans, because of thethickness of the abdominal wall. Positron emission tomography(PET) and single photon emission computed tomography(SPECT) are sensitive enough for human studies (5). The abovemethods require the expression of non-mammalian gene pro-ducts, which may be immunogenic or may have other toxiceffects. Recently, it has been possible to determine the distribu-tion of the engrafted donor hepatocytes expressing creatininekinase (CK) and to quantify the extent of hepatic repopulationusing magnetic resonance spectrometric imaging (MRSI) (6). CKis not expressed constitutively in hepatocytes. CK-mediated phos-phorylation of creatinine (Cr) in the donor cells produces phos-phocreatine (PCr) that is absent in normal liver, therebygenerating a specific 31P NMR spectrum in vivo.
For the assessment of initial engraftment, it may be sufficientto employ vectors that do not lead to integration of the markergene. However, long-term assessment, especially after repeatedmitosis of the engrafted cells, transgene integration into donorcell chromosomes is necessary.
1.1.3. Conditional
Immortalization of
Hepatocytes
The shortage of donor organs has prompted investigators todesign strategies for conditional immortalization of hepatocytes.The strategies involve the use of immortalizing gene products thatmay be degraded rapidly at physiological temperatures (e.g. ther-molabile Simian Virus 40 T-antigen) or transgenes that can beremoved before or after engraftment (e.g. T-antigen flanked by P-lox sequences). Conditionally immortalized hepatocytes havebeen used successfully in rodents to provide metabolic supportduring acute (7) or chronic liver failure (8). Conditional immor-talization requires integration of the transgene into the hepato-cyte genome.
Ex Vivo Gene Transfer into Hepatocytes 119

1.1.4. Prevention
of Immune Rejection
of the Transplanted
Hepatocytes
Available methods for preventing allograft rejection involve thesuppression of the host immune system by the use of immuno-suppressive agents, which are associated with many untoward sideeffects. Expression within the donor cells of non-secreted geneproducts that could prevent allorejection without modulating thehost immune system could represent a major advance toward theclinical application of hepatocyte transplantation. Recently,expression of certain viral gene products within donor hepatocyteshas been shown to prevent their allograft rejection by protectingthe engrafted cells from the effector limb of the host alloimmuneresponse (9). This approach probably requires the integration ofthe transgene into the host genome.
1.2. Approaches to
Ex Vivo Gene Transfer
into Hepatocytes
1.2.1. Constructing
Plasmids Expressing the
Gene of Interest
An important consideration in designing plasmids for ex vivo genetransfer is promoter selection. Several viral promoters, includingthe cytomegalovirus immediate early promoter (CMV-IE), havebeen reported to be silenced over time, particularly when thetranscription unit is integrated into the hepatocyte genome.Therefore, selection of a ubiquitous vertebrate promoter (e.g.the phosphoglycerate kinase (PGK), chicken b-actin or the eukar-yotic initiation factor 1A promoter) or a hepatocyte-specific pro-moter (albumin, a-fetoprotein or a1-antitrypsin promoter) maybe preferred. Hepatocyte-specific promoters provide the advan-tage of restricting the gene expression to hepatocytes, which mayreduce the immune response against the expressed protein. How-ever, some hepatocyte-specific promoters, such as the albuminpromoter, are downregulated during an inflammatory response,which occurs in the liver immediately after hepatocyte transplan-tation. Generally, a ‘‘strong’’ promoter is chosen to maximize thetransgene expression, although there are exceptions to this. In thecase of transposition-enabled plasmids expressing the sleepingbeauty transposase (see below), expression of the transposesfrom a ‘‘weak’’ promoter is desirable, because excessive amountof the transposase inhibits transposition.
Although plasmid transfection into hepatocytes generallyresults in the transient expression of transgenes, in recent years,transposition-enabled plasmids have been designed to increasemarkedly the frequency of integration of transgenes into thehost genome (10, 11). In this system, the transcription unit ofinterest is flanked by inverted and direct repeats that are bindingsites for the sleeping beauty transposase. The transposase may beexpressed from a second transcription unit on the same plasmid(cis) or from a different plasmid that is cotransfected (trans-) with
120 Wang et al.

the plasmid containing the gene of interest. As discussed above, itis important to keep the expression of the transposase at a low levelto achieve high levels of integration of the gene of interest (12).
1.2.2. Gene Transfer
Using DNA That Is Not
Incorporated into
Recombinant Viruses
Plasmids or other forms of DNA, unincorporated in viral vectors,can be transfected into primary hepatocytes. Generally, suchtransfections result in transient expression of the gene and inte-gration into the cellular genome occurs infrequently. Whenselection of the stably transfected cells is possible, such as in thecase of transfection with immortalizing genes, simple transfec-tion can be effective. Hepatocytes are more susceptible to injuryby many standard transfection vehicles than are other cell types.Calcium phosphate coprecipitation, diethylaminoethyl-dextranand conventional electroporation methods of transfection resultin an unacceptable degree of cell death. However, new transfec-tion methods (such as Nucleofection1, Amaxa, Gaithersburg,MD, USA) that combine a chemical and an electroporationapproach have been successful. DNA can be transfected intohepatocytes using liposomes as carriers. In an effort to providehepatocyte specificity of transfection, so that other contaminat-ing cells in the preparation are not transfected inadvertently,hepatocyte-specific ligands have been used as the transfectionvehicle. Galactose-terminated asialoglycoproteins, such as asia-lofetuin or asialo-orosomucoid, have been conjugated with apolycation to serve as a vehicle to transfer the DNA by endocy-tosis via the hepatocyte-specific asialoglycoprotein receptor(ASGR). However, molecules transferred by this pathway arenaturally targeted to the lysosome, where they are degraded.This reduces the transfection efficiency. As an ingenious solutionto this problem, investigators have used the F-protein of theSendai virus as a hepatocyte-specific ligand. The F-protein has ahigh affinity for ASGR, but its fusogenic activity leads to deliveryof the cargo to the cytosol, rather than to the endosomes (13).Some protocols for transfection of DNA without incorporationinto recombinant viruses are described below. This is not acomprehensive list, but covers methods that we have found tobe useful in our laboratory.
1.2.3. Gene Transfer
Using Recombinant
Viruses
Recombinant viruses can greatly enhance gene transfer effi-ciency. Where transient gene transfer is needed, recombinantadenoviruses offer the most effective means of ex vivo genetransfer into hepatocytes. However, when integration into thehost chromosome is required for persistence of transgeneexpression into the progeny of the transduced cells, recombi-nant retroviruses, including lentiviral vectors, may beemployed.
Ex Vivo Gene Transfer into Hepatocytes 121

2. Materials
2.1. Hepatocyte
Culture
1. RPMI 1640 (Invitrogen, Carlsbad, CA) supplemented with 10%fetal bovine serum (FBS, Sigma, St. Louis, MO, USA), 100 mg/ml streptomycin, 100 U/ml penicillin (Invitrogen, Carlsbad,CA, USA), 2 mM L-glutamine (Fisher, Pittsburgh, PA, USA)
2. Dulbecco’s Modified Eagle’s Medium (DMEM) (Fisher) sup-plemented with 10% FBS, 100 mg/ml streptomycin, 100 U/ml penicillin.
3. Iscove’s DMEM (IMDM, Invitrogen) contains 10% FBS,100 mg/ml streptomycin and 100 U/ml penicillin.
4. OptiMEM (Invitrogen).
5. Dexamethasone is dissolved in 100% ethanol at 25 mmol/l andstored in –208C. Final Dexamethasone concentration shouldbe 25 nmol/L.
6. Bovine insulin (Sigma). Working concentration is 5 mg/ml.
7. Hexadimethrine bromide (Polybrene, Fisher) is dissolved at8 mg/ml in ddH2O and stored in –208C. Final working con-centration of polybrene is 8 mg/ml.
8. Collagen (Vitrogen 100, Cohesion Technologies, Palo Alto,CA, USA). Collagen is diluted with 0.012 N HCl (see Note 1).
2.2. Nucleofection
by Amaxa
1. Mouse hepatocyte Nucleofector1 solution (Amaxa, Gaithers-burg, MD, USA) (see Note 2).
2. Amaxa1-certified cuvette (Amaxa).
2.3. F-Virosome 1. Inactivated Hemaglutinating virus of Japan (Sendai virus-Zstrain, HVJ) (Charles River, North Franklin, CT, USA).
2. 0.02 M Tris-buffered saline (pH 8.3). Store at room temperature.
3. Dithiothreitol (DTT, Sigma) is dissolved in 0.02 M Tris-buf-fered saline (pH 8.3) at 30 mM, always make fresh (see Note3), the final concentration should be 3 mM.
4. Dialysis bag (cutoff MW 12,000–14,000, VWR, Batavia, IL,USA).
5. 10 mM Tris-buffered saline, pH 7.4.
6. 10% Triton X-100, keeping the final percentage of tritonbetween 2 and 5%.
7. SM-2 Biobeads (Bio-Rad, Hercules, CA, USA).
8. 26-Gauge needle (Fisher).
9. Histidine containing lipid and control lipid (Provided byDr. A. Chaudhuri, Indian Institute of Chemical Technology,Hyderabad) is dissolved in solvent (methanol/chloroform, 2:1).
122 Wang et al.

2.4. Lentiviral Vectors 1. 2� BBS (150 mM NaCl; 50 mM Bes; and 1.5 mM Na2HPO4
pH 6.95).
2. 0.22 mm filter (Fisher).
3. 2.5 M CaCl2 is filtered with a 0.22-mm filter, stored in –208C.
2.5. Tissue Staining
for b-Galactosidase
1. 100% Ethanol.
2. 5-Bromo-4-chloro-3-indolyl-b-D-galactopyranoside (X-Gal,Fisher) is dissolved at 40 mg/ml in dimethyl sulfoxide(DMSO, Sigma) and stored in –208C. Complete X-Galstaining solution contains 1 mg/ml X-Gal, 35 mM potas-sium ferricyanide, 35 mM potassium ferrocyanide, 2 mMMgCl2.
2.6. Immunostaining 1. Microscope coverslips (Fisher).
2. Fixation solution: acetone/methanol (1/4, v/v).
3. 70% Ethanol in phosphate-buffered saline (PBS).
4. Antibody dilution buffer: 1% bovine serum albumin (BSA) and0.5% Tween-20 in PBS.
5. Primary antibody WP1 is diluted at 1:10 antibody dilutionbuffer.
6. Secondary antibody: anti-mouse IgG conjugated to alkalinephosphatase (AKP) (Sigma) is diluted at 1:200 antibody dilu-tion buffer.
7. Alkaline Phosphatase substrate kit III (Vector Laboratories,Burlingame, CA, USA). One drop of A, B and C each areadded to 2.5 ml pH 8.2 Tris-HCl.
2.7. Magnetofection
Enhancement of Viral
Vector-Mediated
Gene Transfer
ViroMag1 and ViroMag R/L1
(Oz Biosciences, Marseille,France). (see Note 4).
2.8. Adenoviral
Vectors
1. 10 mM Tris at pH 8.0.
2. 1,1,2-Trichloro-1,2,2-trifluoroethane (Freon, Fisher). (seeNote 5).
3. CsCl gradient: 67 g CsCl is dissolved in 100 ml 10 mM Tris(pH 8.0) as 1.4p 1.2p CsCl can be prepared by adding thesame volume 10 mM Tris (pH 8.0) to 1.4p CsCl.
4. 1% sodium dodecyl sulfate (SDS).
5. Fixation solution: 100% ice-cold methanol.
6. Mouse anti-hexon antibody (BD, Franklin Lakes, NJ, USA).
7. Rat anti-mouse antibody conjugated to horseradish peroxidase(HRP) (BD).
8. Diaminobenzidine substrate (DAB, BD).
Ex Vivo Gene Transfer into Hepatocytes 123

3. Methods
3.1. Primary
Hepatocytes
Preparation
for Gene Transfer
Hepatocytes are isolated by in situ perfusion of the liver byminor modifications (14) of the method originally describedby Berry and Friend (15). The method for rat liver perfusion isdescribed here, but the method can be adapted for bothsmaller and larger animal livers. Modification of this methodfor perfusion of resected liver segments has been describedelsewhere (16). 1.5�106 primary hepatocytes are plated onto100 mm pre-coated plates. These cells are then cultured inDMEM with 10% fetal calf serum (FBS), 100 mg/ml strepto-mycin, 100 U/ml penicillin, 2 mM L-glutamine, 1 mMsodium pyruvate, 25 nM dexamethasone and 5 mg/ml bovineinsulin.
3.2. Protocol for Gene
Transfer into
Hepatocytes Using
Conventional
Liposomes
3.2.1. Preparation of
Cationic Liposome–DNA
Complex (17–20)
There are several effective liposome preparations that are availablecommercially. A typical example is given below.1. The optimized concentration of the gene of interest cDNA
(1–20 mg) is incubated at room temperature (228C) withthe liposome (1–50 mg) for 20 min by gentle mixing. Theliposome consists of a 3:1 formulation of 2,3-dioleyloxy-N-[2 (sperminecaboxamido)ethyl]-N-N-dimethyl-1-propa-naminiumtrifluoroacetate (DOPSA) and dioleoylphosphati-dyl ethanolamine (DOPE).
2. After incubation, a final concentration of 16 mg DNA and40 mg liposome is obtained by dilution with OptiMEM(Invitrogen).
3.2.2. Transfection
of Hepatocytes
1. Primary hepatocytes are rinsed in Dulbecco’s phosphate-buf-fered saline (DPBS) and incubated with the liposome–DNAcomplex for 2 h at 378C.
2. After this initial incubation period, complete DMEM is addedto the cells, which are incubated for an additional 24 h.
3. Twenty hours after transfection, the cells are washed withDPBS and released from the plate by incubation with 0.25%trypsin for 5 min and sedimented by centrifugation (50�g for5 min) at 48C. The cell pellet is reconstituted in 500 ml of PBSfor transplantation.
124 Wang et al.

3.3. Protocol for
Nucleofection (Amaxa,
Gaithersburg)
This method combines the principles of chemical transfection andelectroporation. Methods have been optimized by the manufac-turer for various types of cells (21), including hepatocytes(Fig. 11.1). The transfection buffers (Nucleofector solutions)are proprietary and their compositions are not published. Thefollowing protocol that has been developed by Amaxa has beenvalidated in our laboratory.
Protocol for transfecting primary hepatocytes from rats ormice:1. Warm the supplemented mouse hepatocyte Nucleofector
solution to room temperature.
2. Pre-equilibrate RPMI 1640 (Invitrogen) with 10% FBS,100 mg/ml streptomycin, 100 U/ml penicillin in a humidi-fied 378C incubator containing air with 5% CO2.
3. Isolated primary mouse or rat hepatocytes are sedimented at50�g for 5 min and then gently resuspended with mousehepatocyte Nucleofector solution at 7�105 cells/100 ml atroom temperature. The cell suspension is not kept in theNucleofector solution for more than 15 min before Nucleo-fection as this reduces cell viability.
4. Mix 100 ml of cell suspension with 2–6 mg plasmid DNAcontaining the gene of interest.
5. Transfer the mixture into an Amaxa-certified cuvette. Thesample should cover the bottom of the cuvette and thereshould be no air bubbles. The cuvette is capped.
6. Select the approriate Nucleofector program, T-28 or T-028(see Nucleofector I or Nucleofector II Manual for details).Insert the cuvette into the cuvette holder (for Nucleofector I:rotate carousel to final position) and press the ‘‘X’’ button tostart the program.
7. After completion of the program the sample in the cuv-ette is incubated for 15 min at room temperature and500 ml of the pre-equilibrated culture medium is added to
Fig. 11.1. Transfection by Amaxa Nucleofection: Expression of GFP in primary mouse hepatocytes (isolated fromC57BL/6 mice) nucleofected using an Amaxa mouse hepatocyte Nucleofector kit with a plasmid encoding maxGFP.Twenty-four hours after nucleofection, cells were analyzed by bright field (A) and fluorescence microscopy (B). Themerged image is shown in panel (C). (see Color Plate 7)
Ex Vivo Gene Transfer into Hepatocytes 125

the cuvette. The cells are then gently transferred to six-well plates.
8. Incubate cells in a humidified 378C /5% CO2 incubator.
9. After 4 h, replace the medium with fresh complete DMEM(hepatocytes should be attached to the plate at this point oftime).
10. Expression of the transgene is evaluated 24–48 h afterNucleofection. (see Note 6): Transgene expression can bedetected within 6 h after Nucleofection. The rapid expressionof the transgene is presumably due to the more efficienttransfer of the DNA to the nucleus than with other methodsof gene transfer.
3.4. Transfection
Using Liposomes
Containing
Components of the
Sendai Virus
The hemagglutinating virus of Japan (HVJ, also called Sendaivirus), an enveloped paramyxovirus, has a long history of beingutilized for its cell fusion properties. Liposomes derived by deter-gent solubilization of the virus contain two major glycoproteins,hemagglutinin neuraminidase (HN) and fusion factor (F). Lipo-somes generated from detergent-solubilized Sendai viruses lackthe viral genome but contain HN and F. Such liposomes can beused to entrap exogenous DNA for transfer into a wide varietyof cell types. Binding of HN proteins to the cell membranepromotes fusion of the complex liposome to the cell membrane,which is mediated by the F-protein. Liposomes containing bothHN and F proteins lack host cell specificity and exhibit some celltoxicity. To design DNA transfection vehicles that are targeted tohepatocytes, biochemical methods have been developed to elim-inate the HN protein from the complex. Briefly, treatment ofthe virus with a strong reducing agent (e.g. dithiothretol), fol-lowed by removal of the reducing agent leads to regeneration ofF-protein, but to irreversible denaturation and insolubilizationof the HN protein. Subsequent detergent solubilization of thevirus and addition of the DNA of interest, followed by removal ofthe detergent, leads to the formation of liposomes composed ofvirus-derived lipids, the F-protein and the entrapped DNA ofinterest. The galactose-terminated carbohydrate moieties withfucose side chains confer the F-protein with high affinity andspecificity for hepatocyte-specific ASGRs. Thus, the F-protein-containing liposomes (termed F-virosomes) are hepatocyte-specific. However, the absence of HN in F-virosomes reducesthe gene transfer efficiency. Although the mechanism by whichHN enhances the fusion activity of F-virosomes is not understoodcompletely, histidine residues of HN are known to be importantfor this function. Incorporation of histidinylated lipids in theF-virosome–DNA complex is thought to confer several benefits,including compaction of the DNA, enhancement of the packagingcapacity of individual F-virosomes, augmenting the fusogenic
126 Wang et al.

activity of the F-protein and lysis of endosomes that releases theDNA into the cytosol. The protocol for generating F-virosome–-DNA complexes, with or without the histidinylated lipid, is givenbelow.
3.4.1. Entrapment of
the DNA of Interest into
Reconstituted
F-Virosomes (22–24)
The protocol described here is from 100 mg of Sendai virus for thepreparation of hepatocyte-specific F-virosomes.1. Spin 100 mg of Sendai virus at 100,000�g for 1 h at 48C.
2. Suspend pellet in 0.02 M Tris-buffered saline (pH 8.3). Tothis, add 30 mM DTT (Sigma) solution so that the finalconcentration of DTT is 3 mM.
3. Mix the sample properly and incubate the sample in a 378Cwater bath for 4 h with occasional shaking.
4. For dialysis treatment boil the dialysis bag (cutoff12,000–14,000) in MilliQ water for 5 min.
5. Now thoroughly rinse the bag with cold dialysis buffer(10 mM Tris-buffered saline pH 7.4).
6. Fill the bag with the DTT-treated viral suspension and dialyzethe sample against 4 L cold dialysis buffer overnight, givingfive changes of 2 h each.
7. After dialysis, spin the sample at 100,000�g for 1 h at 48C.
8. Homogenize the pellet with 10 mM Tris-buffered saline pH7.4, to this add 10% Triton X-100, double the amount ofvirus, keeping the final percentage of triton between 2and 5%.
9. Mix and rotate the sample slowly on a rotator for 1 h at roomtemperature.
10. Spin the sample at 100,000�g for 1 h at 48C.
11. The histidine-containing lipid was dissolved in solvent(methanol: chloroform, 2:1) and dried in a glass vial undernitrogen to form a thin film (4 mg lipid per 100 mg Sendaivirus).
12. To this mixture, add the supernatant from detergent extractcontaining only the viral F protein and lipids and incubate at208C for 30 min with gentle shaking.
13. To this final solution add DNA sample containing 2 mMEDTA and mix.
14. For detergent removal add SM-2 Biobeads (BioRad, eighttimes the amount of detergent) to the above solution androtate the sample on a rotator for 2 h at 48C.
15. Again add the same amount of Biobeads to the above solu-tion and rotate the sample slowly on a rotator for 2 h at roomtemperature.
Ex Vivo Gene Transfer into Hepatocytes 127

16. Repeat the above step again by adding the same amount ofBiobeads at room temperature.
17. Take out the virosome suspension with a 26-gauge needleavoiding Biobeads and spin the suspension at 100,000�g for1 h at 48C.
18. Wash the pellet in Tris-buffered saline pH 7.4 at 100,000�gfor 1 h at 48C.
19. Finally suspend the pellet in 10 mM phosphate bufferedsaline pH 7.4 and store the virosome samples at 48C.
3.4.2. Transfection
of Primary Hepatocytes
with DNA-Loaded
F-Virosomes (Fig. 11.2)
1. Primary hepatocytes, isolated by collagenase perfusion, arecultured in DMEM containing 10% FBS, 100 mg/ml strep-tomycin, 100 U/ml penicillin, 2 mM L-glutamine, 1 mMsodium pyruvate, 25 nmol/L dexamethasone and 5 mg/mlbovine insulin and divided into 100 mm pre-coated platescontaining 1.5�106 cells at 378C, 5% CO2 for 4 h.
2. Primary hepatocytes are rinsed with DPBS and incubatedwith DNA-loaded modified F-virosomes (2–4 mg per 5�105
cells) with serum-free medium for 2 h at 378C, 5% CO2.
3. Following the initial incubation, DMEM with 20% FBS isadded to the cells, followed by incubation for an additional24 h.
4. After 24 h of infection, the cells are washed with DPBS. Thecells are now ready for analysis of transgene expression ortransplantation. For transplantation, the cells are releasedfrom the plates by gentle agitation with 0.25% trypsin, har-vested by centrifugation at 50�g for 5 min at 48C and resus-pended in 0.5 ml PBS .
Fig. 11.2. Transfection using liposomes containing F protein of the Sendai virus: Expression of LacZ in cellstransfected with DNA-loaded F-virosomes as described in the text. After incubation for 24 h, cells were fixed with ethanol,stained for b-galactosidase and photographed. (magnification, �20, Nikon, Japan). Hepa1 cells (A), HEK293 cells (B).Note, only asialoglycoprotein-expressed cells are transduced by this method. Structure of histidine lipid used to enhanceF-virosome-mediated gene transfer (C). (see Color Plate 8)
128 Wang et al.
3.5. Gene Transfer
Using Integrating
Recombinant Viral
Vectors
3.5.1. Ex Vivo Gene
Transfer Using
Recombinant
Oncoretroviruses
Oncoretroviruses, such as Moloney’s murine leukemia viruses, havesimple genomes that can be readily manipulated for transferringgenes into a variety of mammalian cells. Recombinant oncoretro-viruses are generated usually in cloned producer cells, whereby thetiter and other characteristics of the vector remain similar frombatch to batch. It is also possible to generate the vector by transienttransfection. However, integration of oncoretroviral vectorsrequires the host cell to be in the cell cycle, which makes thesevectors inefficient for hepatocytes and other quiescent cells. There-fore, increasing numbers of investigators are using lentiviral vectors,which can infect non-dividing cells efficiently (see later in thissection). For details of construction of plasmids containing therecombinant cDNA of the retroviral genome and the gene ofinterest, and for the generation of producer cells and the recombi-nant virus, see ref. (25–28). The protocol for gene transfer intocultured primary hepatocytes is described in brief below.1. Hepatocytes are isolated as described above and are cultured
on collagen- or gelatin-coated plates for 48–72 h beforeinfection. The culture medium can be DMEM containing10% FBS, 100 mg/ml streptomycin, 100 U/ml penicillin,2 mM L-glutamine, 1 mM sodium pyruvate, 25 nmol/l dex-amethasone and 5 mg/ml bovine insulin and divided into100 mm pre-coated plates containing 1.5�106 cells for 4 h.To stimulate mitosis of the cultured hepatocytes, some inves-tigators have used hormonally defined media, containingHGF and EGF (29, 30).
2. Hepatocytes are rinsed in DPBS and incubated with recom-binant retrovirus at MOI=10 for 2–6 h at 378C. The mediumcontains 8 mg/ml polybrene.
3. After incubation, the medium is replaced with completeDMEM and the cells are cultured overnight.
4. The cells are then washed with DPBS and detached from theplate using 0.25% trypsin for 5 min. The cells are collected bycentrifugation at 50�g for 5 min at 48C and the cell pellet isresuspended in 500 ml PBS for transplantation.
3.5.2. Ex Vivo Gene
Transfer Using
Recombinant
Lentiviruses
As mentioned above, recombinant lentiviruses are particularlyattractive for ex vivo gene transfer into hepatocytes becausethese vectors can infect non-dividing cells efficiently. Further-more, infection with these vectors occurs rapidly enough forgene transfer into hepatocytes in suspension. This is particularuseful for ex vivo gene therapy, because there can be significant
Ex Vivo Gene Transfer into Hepatocytes 129

loss of cells during detachment of the cells, once they are attachedto culture plates. Various generations of lentiviral vector produc-tion systems are available. In our laboratory, we have found the 4-plasmid system developed by Naldini and associates to be quiteefficient (31). As the vectors are pseudotyped with the vesicularstomatitis G (VSV-G) envelope, they infect a wide variety of celltypes. These self-inactivating vectors express the gene of interestfrom internal promoters. To obtain transcriptional specificityfor hepatocytes, a hepatocyte-specific promoter may be employed(e.g. the albumin promoter-enhancer). For ubiquitous transgeneexpression, other promoters (e.g. the phosphoglycerate kinase pro-moter) can be used. The example given below is based on the use ofthe albumin promoter-enhancer. The system is based on the trans-fection of four plasmids: (i) The transduction plasmid, containingthe internal promoter and the coding region of the gene of interestfollowed by a woodchuck post-transcriptional regulatory element(WPRE) (e.g. pAlb-UGT1A1); (ii) pMD2-VSV-G, the plasmidexpressing VAS-G envelope protein; (iii) the core-packaging plas-mid, pMDLg/pRRE; and (iv) pRSV-REV, a plasmid that expressthe REV protein from a Rous sarcoma virus (RSV) promoter.
3.5.2.1. Generation and
Concentration of
Lentivirus pAlb-UGT1A1
1. The day before transfection, 293T cells were plated at1.8�107 cells per 150 mm dish. Each culture dish contains22 ml DMEM (Invitrogen) containing 10% FBS, 100 mg/mlstreptomycin and 100 U/ml penicillin. Usually, 14 plates areseeded and incubated at 378C in air containing 5% CO2.
2. Two hours before transfection, the medium was changed toIMDM (Invitrogen) containing 10% FBS, 100 mg/ml strep-tomycin and 100 U/ml penicillin.
3. For each 150 mm dish, the following plasmid DNAs are mixed:pMD2-VSV-G 6 mg, pMDLg/pRRE 10 mg, pRSV-REV 5 mgand 32 mg of pAlb-UGT1A1 in a final volume of 900 ml of 0.1�TE/ddH2O. To this mixture is added 100 ml of 2.5 MCaCl2.The DNA mixture is kept at room temperature for 5 min.
4. After this, add 1 ml of 2� BBS (150 mM NaCl; 50 mM Bes;and 1.5 mM Na2HPO4, pH 6.95). The pH of 2� BBS ischecked carefully (see Note 7); the solution is sterilized byfiltration (0.22 mm) and stored in 25 ml aliquots at –208C.Before use, the solution is mixed in a Vortex and incubatedfor 30 min at room temperature.
5. To each cell culture dish is added dropwise 2 ml of theplasmid DNA solution, while swirling gently to distributethe solution evenly. The cells are incubated overnight at378C, in a 5% CO2 atmosphere.
6. Fourteen to 16 h after transfection, the medium is replaced byfresh medium.
130 Wang et al.

7. Medium is collected after 24 and 48 h, and filtered through a0.22-mm filter (Millipore, USA).
8. To sediment the recombinant Lentiviral vector, the filteredmedium is centrifuged at 19,500 r.p.m. for 2 h at 228C. Thesupernatant is discarded carefully and the pellet is resus-pended in 500 ml of phosphate buffered saline containing10 mM phosphate and 150 mM sodium chloride (1� PBS),pH 7.4 and stored at 48C .
9. If further concentration of the vector is required, the concen-trated virus harvested from step 8 is diluted 1:1 with 1� PBSand centrifuged at 19,500 r.p.m. for 2 h at 228C. The finalpellet is resuspended in 500 ml of the above buffer, aliquotedand stored at –808C till further use (see Note 8).
10. Determination of viral titer: In cases where the vectorexpresses a marker gene or a gene product that is easilyvisualized by cytochemical or immunocytochemical staining,the titer is determined from the maximum dilution resultingin positively staining cells after 72 h. For vectors that do notexpress a gene product that can be readily visualized, viraltiter can be determined by quantitative RT-PCR for WPRE.Examples of titer determination methods in three differentscenarios are given below.a) For transfer vector expressing a marker gene, e.g. lenti-
virus pAlb-LacZ, 72 h after infection with the variousdilutions of the vector, enzyme-cytochemical stainingwas performed to determine b-galactosidase expression.Briefly, the transduced cells were fixed for 5 min with100% ethanol, washed with PBS twice, incubated withthe complete X-gal staining solution (1 mg/ml X-Gal,35 mM potassium ferricyanide, 35 mM potassium ferro-cyanide, 2 mM MgCl2) at 378C for 1 h to overnight. Theviral titer was calculated as follows:
Transduction Units (TU)/ml=[Numbers of transduced cells(105)]�[% of positive stained cells]�Dilution factor/100
b) For pAlb-UGT1A1, which expresses the human UGT1A1,viral gene transfer titer was determined by immunocyto-chemical probing with an antibody that is specific for thetransgene product (e.g. WP1, a monoclonal antibodyagainst the human UGT1A family of proteins) (32). Inthis case, mouse hepatoma cells (Hepa-I) were used fortittering. The transduced Hepa-I cells were washed twicewith 10 mM PBS and fixed for 45 min with acetone/methanol (1:4) at room temperature. The fixed cells werewashed with 70% ethanol in PBS and three times withPhosphate buffer containing 0.5% Tween-20 and 1% BSA(buffer A). The cells were incubated with WP1 for 45 minat room temperature and then washed five times with
Ex Vivo Gene Transfer into Hepatocytes 131

buffer A. The goat anti-mouse IgG conjugated withAKP, used as secondary antibody, was detected by AlkalinePhosphatase substrate kit III (Vector laboratories, USA).The viral titer was calculated as follows:
Transduction Units (TU)/ml = [Numbers of transducedcells (105)] X [% of positive stained cells] X Dilutionfactor /100
c) For transfer vectors that do not express easily visualizedgene products, the copy number of WPRE, which ispart of 30 UTR of many lentiviral transgene mRNA tran-scripts, was used to determine the virus titer (33), usingqRT-PCR. The total RNA was isolated from the trans-duced Hepa-I cells, using RNeasy columns as per themanufacturer’s guidelines (Qiagen, Germany). The 1 mgpurified RNA was reverse transcribed to generate cDNA asusual. The sense primer (1277F), 50-CCGTTGTCAGG-CAACGTG-30, antisense primer (1361R), 50-AGCTGACAGGTGGTGGCAAT30, probe (1314P) and50-FAM-TGCTGACGCAACCCCCACTGGT-TAMRA-30 were used to detect the WPRE sequence. Expressionlevels of WPRE were determined by qRT-PCR, and b-actin mRNA was used as normalization. The primers andprobe of b-actin were as follows (34): forward primer, 50-TCACCCACACTGTGCCCATCTACGA-30 reverse primer:50-GGATGCCACAGGATTCCATACCCA-30; probe50-FAM-TATGCTCTCCCTCACGCCATCCTGCGT-TAMRA-30. The transfer vector was used to generatethe standard curve, viral titer was determined as follows:Transduction Units (TU)/ml=[numbers of WPRE mole-cules in transduced cells (105)]�Dilution factor/100.
3.5.2.2. Transduction
of Primary Hepatocytes
Subsequent to
Transplantation
(Fig. 11.3)
1. Isolate rat or mouse primary hepatocytes by liver perfusionusing collagenase as above. Hepatocytes from other species,such as rabbit or human, can also be processed by the follow-ing method.
2. Cells are washed twice by sedimenting at 50�g for 5 minand resuspending (107cells/ml) in DMEM containing 10%FBS, 100 mg/ml streptomycin, 100 U/ml penicillin, 2 mML-glutamine, 25 nmol/L dexamethasone and 5 mg/ml bovineinsulin. Cell viability is determined by trypan blue exclusion.
3. Hepatocytes are incubated for 4 h at 48C with the recombi-nant vector (e.g. pAlb-LacZ at MOI=10) in the presence of8 mg/ml polybrene.(35, 36) Some investigators prefer cen-trifuging the mixture at room temperature for 4 h at 50�g toenhance gene transfer (37). In our hands, this procedure didnot increase gene transfer over simply incubating the cellswith the vector.
132 Wang et al.

4. After 4 h of incubation at 48C, the cells are incubated at 378Cfor 15 min, washed twice, resuspended in PBS and then usedfor transplantation.
5. For retrospective testing of the transduction efficiency oflentiviral vector in vitro, transduced cells are plated at1�105/well of 24-well plates pre-coated with bovine dermalcollagen (Vitrogen, Cohesion Technologies). After 48 h, thecells are washed twice with PBS, fixed with 100% ethanol for5 min and then examined for expression of the marker gene.
3.5.2.3. Enhancement
of Gene Transfer by
Application of a
Magnetic Field
(Magnetofection1)
This method is based on magnetic nanoparticles, coated withcationic molecules that permit the particles to be associated withrecombinant viral vectors or naked plasmid DNA. Exertion ofmagnetic force on the particles results in concentration of thenanoparticle–vector complex on cell surfaces, resulting in increasedtransduction efficiency (Fig. 11.4). The variants of these magneticparticles that are designed to work with adenoviral and retroviral(including Lentiviral) vectors are named ViroMag1 and ViroMagR/L
1
by their manufacturers (Oz Biosciences). The protocol foruse with one lentiviral vector is given below as an example.1. Plate the primary hepatocytes 14–16 h before infection in
100 mm tissue culture dishes.
2. Add 150 ml of ViroMag R/L in a tube large enough tocontain the volume of virus preparation (�0.8 ml). Ifrequired, ViroMag R/L can be diluted with deionizedwater (not medium). Medium containing retroviral or lenti-viral vectors can be used directly, or diluted as needed withthe hepatocyte culture medium.
3. Add the Lentiviral preparation (e.g. pAlb-LacZ) to thetube(s) containing ViroMag R/L and mix immediately bypipetting up and down. Incubate for 15 min at roomtemperature.
Fig. 11.3. Transduction of primary rat hepatocytes using a Lentiviral vector: Isolated Gunn rat hepatocytes weretransduced with Lentivirus pAlb-UGT1A1 at an MOI of 10 and immunostained with WP1, monoclonal primary antibodyagainst UGT1A1, followed by anti mouse Alkaline Phosphatase substrate kit III as described in the text and controlhepatocytes (A) and experimental hepatocytes (B) were photographed. (see Color Plate 9)
Ex Vivo Gene Transfer into Hepatocytes 133
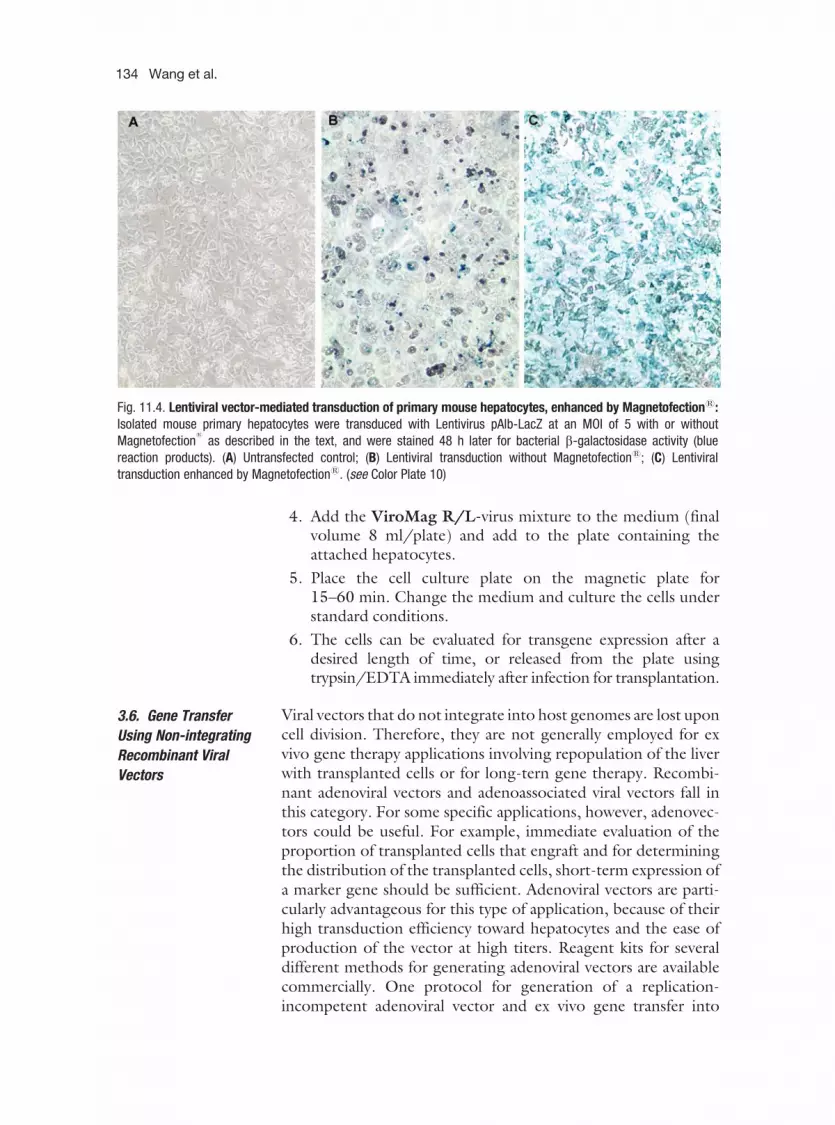
4. Add the ViroMag R/L-virus mixture to the medium (finalvolume 8 ml/plate) and add to the plate containing theattached hepatocytes.
5. Place the cell culture plate on the magnetic plate for15–60 min. Change the medium and culture the cells understandard conditions.
6. The cells can be evaluated for transgene expression after adesired length of time, or released from the plate usingtrypsin/EDTA immediately after infection for transplantation.
3.6. Gene Transfer
Using Non-integrating
Recombinant Viral
Vectors
Viral vectors that do not integrate into host genomes are lost uponcell division. Therefore, they are not generally employed for exvivo gene therapy applications involving repopulation of the liverwith transplanted cells or for long-tern gene therapy. Recombi-nant adenoviral vectors and adenoassociated viral vectors fall inthis category. For some specific applications, however, adenovec-tors could be useful. For example, immediate evaluation of theproportion of transplanted cells that engraft and for determiningthe distribution of the transplanted cells, short-term expression ofa marker gene should be sufficient. Adenoviral vectors are parti-cularly advantageous for this type of application, because of theirhigh transduction efficiency toward hepatocytes and the ease ofproduction of the vector at high titers. Reagent kits for severaldifferent methods for generating adenoviral vectors are availablecommercially. One protocol for generation of a replication-incompetent adenoviral vector and ex vivo gene transfer into
Fig. 11.4. Lentiviral vector-mediated transduction of primary mouse hepatocytes, enhanced by Magnetofection1:Isolated mouse primary hepatocytes were transduced with Lentivirus pAlb-LacZ at an MOI of 5 with or withoutMagnetofection
1
as described in the text, and were stained 48 h later for bacterial b-galactosidase activity (bluereaction products). (A) Untransfected control; (B) Lentiviral transduction without Magnetofection1; (C) Lentiviraltransduction enhanced by Magnetofection1. (see Color Plate 10)
134 Wang et al.

hepatocytes is described below. In this example, the gene ofinterest, LacZ (expressing E. coli b-galactosidase), is insertedinto the adenoviral plasmid, using the Adeno-X Expression system(BD Biosciences Clontech).
3.6.1. Generation,
Amplification and
Purification of
Recombinant
Adenoviral Vectors
1. HEK293 cells(Note) are plated at 1�106 cells in six-well platescontaining 20 ml DMEM, supplemented with 10% FBS (Sigma),100mg/ml streptomycinand100U/mlpenicillin, and incubatedat 378C under 5% CO2 for 24 h before transfection.
2. The adenoviral plasmid vector is digested with PacI andtransfected into HEK293 cells at 80% confluence, usingLipofectamine.
3. After 24 h, and periodically thereafter, the cells are examinedfor cytopathic effect (CPE).
4. Once CPE appears, the cells are harvested and rupturedby three freeze–thaw cycles to release the recombinantadenovirus.
5. To amplify the recombinant adenovirus, fresh HEK293in six-well plates are infected by adding cell lysate fromstep 4.
6. Repeat step 4. At this point, the cell lysate should be exam-ined for transgene expression by Western blot (or any othermethod that is available for the transgene of interest).
7. For further amplification, HEK293 cells are plated in three-tier flasks (total surface area 500 cm2), and grown to 50–80%confluency.
8. The medium is replaced with 90 ml of medium that contains2% FBS and cell lysate from step 6. The cells are incubatedfor 24–72 h at 378C under 5% CO2 until CPE appears.
9. The infected HEK293 cells are sedimented by centrifugationfor 10 min at 650�g (GSA, 2000 r.p.m.). The cells areresuspended in 10 mM Tris at pH 8.0.
10. The viral particles are purified by CsCl2 gradient centrifuga-tion as follows. One volume of Freon (Fisher) is added to theresuspended cells, shaken for 5 min, centrifuged for 5 min at2000 r.p.m., 48C. The upper layer is saved and the lower layeris re-extracted with the addition of 7 ml 10 mM Tris, The firstand second upper layers are combined and re-extracted onemore time with Freon. The gradient maker is loaded with10 ml 1.2p CsCl in the distal well and 10 ml 1.4p CsCl in theproximal well. Add the infected cell extract gently against theside of the tube over the gradient and ultracentrifuge at22,000 r.p.m., 48C, using SW28 rotor with buckets over-night. The band containing the virus is collected after ultra-centrifugation, diluted with one volume of 10 mM Tris,
Ex Vivo Gene Transfer into Hepatocytes 135

loaded to the same gradient as above and centrifuged for 4 hat 22,000 r.p.m., 48C, using SW28 rotor with buckets. Theband containing the virus is collected from the tube. Thevirus particle can be measured by absorbance at 260 nm.Ten microliters of the virus is diluted with 1 ml 1% SDS andOD260 nm is measured 15 min after adding virus to the SDS,using 1% SDS as a blank. The following formula is used tocalculate the viral particle: Total viral particles = OD260�(virusdilution factor)�(0.28 mg/OD)�(3.1�1012 particles/mg).
11. The virus preparation is mixed with an equal volume ofglycerol and stored at –208C.
12. The titer of recombinant adenovirus is determined by plaqueassay as follows:5�105 HEK 293 cells are seeded in 12-well plates withgrowth medium, 100 ml of 10-fold serial-diluted virus ismade from 10–2 to 10–6 ml, is added to each well and incu-bated at 378C in 5% CO2 for 48 h. The cells are fixed withice-cold 100% methanol at –208C for 10 min, washed with 1%BSA in PBS three times, incubated with 1:1000 mouse anti-hexon antibody (BD) for 1 h at 378C, washed with 1% BSA inPBS three times, incubated with 1:500 rat anti-mouse anti-body (HRP conjugate, BD) for 1 h at 378C, washed with 1%BSA in PBS three times and incubated with DAB substrate(BD) solution at room temperature for 10 min. The DAB isaspirated from plate and 1 x PBS is added to the cells. Theminimum of three fields of positive cells are counted using amicroscope with a 20 X objective, the infectious units for eachwell is calculated as follows:PFU = (infected cells/field)�(fields/well)/volume virus(ml)�(dilution factor).
3.6.2. Transduction
of Hepatocytes or
Hepatocyte
Progenitor Cells
Primary hepatocytes are prepared by collagenase perfusion asdescribed above. Adenoviral vectors can also be used for geneticmarking of hepatic progenitor/stem cells. The procedure fortransducing primary hepatocytes is described below.1. Primary hepatocytes are cultured in complete DMEM
(DMEM containing 10% FBS, 100 mg/ml streptomycin,100 U/ml penicillin, 2 mM L-glutamine, 1 mM sodiumpyruvate, 25 nM dexamethasone, and 5 mg/ml bovine insu-lin) and plated on 100 mm PrimariaTM plates, coated withcollagen (Vitrogen) (1.5�106 cells per plate). The cells wereallowed to attach to the plate for 4 h.
2. Primary hepatocytes are rinsed in PBS and incubated inDMEM with the recombinant adenovirus (e.g. Ad-LacZ) ata multiplicity of infection (MOI) of 10 in serum-free DMEMfor 3 h at 378C.
136 Wang et al.

3. After the initial incubation, the complete DMEM (as in step 1)is added and the cells are incubated for an additional 24 h.
4. The cells can be detached from the plates by 5-min incubationwith 0.05% trypsin in 0.53 mM EDTA for 5 min. The cells arecollected by centrifugation at 50�g for 5 min and resus-pended in 500 ml PBS. Cell viability is determined by trypanblue exclusion before transplantation.
5. To determine the transduction efficiency, the cells are cul-tured for an additional 24 h before staining for b-galactosi-dase expression as described above.
4. Notes
1. Collagen is prepared at 1:10 in 0.012 HCl, coated cell cultureplates at room temperature for overnight. The coated plates aretransferred to 48C and washed with 1� PBS twice beforeusing.
2. Nucleofector Solution are stable for 3 months at 48C after thesupplement is added to Nucleofector and pre-warmed to roomtemperature before using.
3. DTT is an unusually strong reducing agent and liable to airoxidation, so always keep DTT at 48C and make fresh DTTsolution.
4. Viromag R/L could not be frozen, always kept at 48C and onlydiluted with deionized water if needed.
5. Freon should be ice-cold before using because cold Freon gascan delipidate the infected cells and extract the virus from cells.
6. Transgene expression can be detected within 6 h afterNucleofection. The rapid expression of the transgene is pre-sumably due to the more efficient transfer of the DNA to thenucleus than with other methods of gene transfer.
7. pH of 2� BBS is very important for transfection efficiency, soshould carefully adjust pH of 2� BBS to 6.95.
8. The reason for making multiple aliquots of the virus stocks is toprevent virus titer to decrease by the freeze–thaw cycle.
Acknowledgments
This work was supported by the NIH grants: RO1 DK 46057 (toJRC), RO1 DK 067440 (to JRC); RO1 DK-068216-02 (to JRC)and RO1 DK 039137 (to NRC); by the Gene Therapy Core of the
Ex Vivo Gene Transfer into Hepatocytes 137

Human Genetics Program of the Albert Einstein College of Med-icine, and a research grant provided by the National ResearchDevelopment Corporation of India.
References
1. Roy-Chowdhury, J., Grossman, M., Gupta, S.,et al. (1991) Long-term improvement ofhypercholesterolemia after ex vivo gene ther-apy in LDLR-deficient rabbits. Science 254,1802–1805.
2. Grossman, M., Raper, S. E., Kozarsky, K.,et al. (1994) Successful ex vivo gene therapydirected to liver in a patient with familialhypercholesterolaemia. Nat Genet 6,335–341.
3. Shah, K., Jacobs, A., Breakefield, X. O., et al.(2004) Molecular imaging of gene therapyfor cancer. Gene Ther 11, 1175–1187.
4. Weissleder, R., Ntziachristos, V. (2003)Shedding light onto live molecular targets.Nat Med 9, 123–128.
5. Blasberg, R. (2002) PET imaging of geneexpression. Eur J Cancer 38, 2137–2146.
6. Landis, C. S., Yamanouchi, K., Zhou, H.,et al. (2006) Noninvasive evaluation of liverrepopulation by transplanted hepatocytesusing 31P MRS imaging in mice. Hepatology44, 1250–1258.
7. Nakamura, J., Okamoto, T., Schumacher, I.K., et al. (1997) Treatment of surgicallyinduced acute liver failure by transplantationof conditionally immortalized hepatocytes.Transplantation 63, 1541–1547.
8. Schumacher, I. K., Okamoto, T., Kim, B. H.,et al. (1962) Transplantation of conditionallyimmortalized hepatocytes to treat hepaticencephalopathy. Hepatology 24, 337–343.
9. Mashalova, E. V., Guha, C., Roy-Chowdhury,N., et al. (2007) Prevention of hepatocyte allo-graft rejection in rats by transferring adenoviralearly region 3 genes into donor cells. Hepatol-ogy 45, 755–766
10. Kren, B. T., Ghoss, S. S., Linchen, C. L., et al.(2003) Hepatocyte-targeted delivery ofSleeping Beauty mediates efficient gene trans-fer in vivo. Gene Ther Mol Biol 7, 229–238
11. Ivics, Z., Hackett, P. B., Plasterk, R. H., et al.(1997) Molecular reconstruction of SleepingBeauty, a Tc1-like transposon from fish, andits transposition in human cells. Cell 91,501–510.
12. Mikkelsen, J. G., Yant, S. R., Meuse, L., et al.(2003) Helper-Independent Sleeping Beautytransposon–transposase vectors for efficientnonviral gene delivery and persistent geneexpression in vivo. Mol Ther 8, 654–665.
13. Markwell, M. A., Portner, A., Schwartz, A.L. (1995) An alternative route of infectionfor viruses: entry by means of the asialogly-coprotein receptor of a Sendai virus mutantlacking its attachment protein. Proc NatlAcad Sci USA 82, 978–982.
14. Neufeld, D. S. (1997) Isolation of rat liverhepatocytes. Methods Mol Biol 75 145–151.
15. Berry, M. N., Friend, D. S. (1969) High-yield preparation of isolated rat liver parench-ymal cells: a biochemical and fine structuralstudy. J Cell Biol 43, 506–520.
16. Wilson, J. M., Roy-Chowdhury, N.,Grossman, M., et al. (1991) Transplantationof allogeneic hepatocytes into LDL-receptordeficient rabbits leads to transient improve-ment in hypercholesterolemia. Clin Biotech-nol 31, 21–26
17. Sen, L., Gambhir, S. S., Furukawa, H., et al.(2005) Noninvasive imaging of ex vivo intra-coronarily delivered nonviral therapeutic trans-gene expression in heart. Mol Ther 12, 49–57.
18. Sen, L., Hong, Y. S., Luo, H., et al. (2001)Efficiency, efficacy and adverse effects of ade-novirus versus liposome-mediated gene ther-apy in cardiac allografts. Am J Physiol 281,H1433–H1441.
19. Oshima, K., et al. (2002) Localized interleu-kin-10 gene transfer induces apoptosis of allor-eactive T cells via Fas/FasL pathway, improvesfunction and prolongs survival of cardiac allo-grafts. Transplantation 74, 1019–1026.
20. Daftary, G. S., Taylor, H. S. (2001) Efficientliposome-mediated gene transfection andexpression in the intact human uterus.Human Gene Therapy 12, 2121–2127.
21. Aslan, H., Zilberman, Y., Arbeli, V., et al.(2006) Nucleofection-based ex vivo nonviralgene delivery to human stem cells as a plat-form for tissue regeneration. Tissue Eng 12,877–889.
138 Wang et al.

22. Bagai, S., Puri, A., Blumenthal, R., et al. (1993)Hemagglutinin-neuraminidase enhances Fprotein-mediated membrane fusion of recon-stituted Sendai virus envelopes with cells. JVirol 7, 3312–3318.
23. Bagai, S., Sarkar, D. P. (1993) ReconstitutedSendai virus envelopes as biological carriers:dual role of F protein in binding and fusionwith liver cells. Biochim Biophys Acta 1152,15–25.
24. Santosh, K. V., Mani, P., Sharma, N. R., et al.(2005) Histidylated lipid-modified Sendaiviral envelopes mediate enhanced membranefusion and potentiate targeted gene delivery.J Biol Chem 280, 35399–35409.
25. Blesch, A. (2004) Lentiviral and MLV basedretroviral vectors for ex vivo and in vivo genetransfer. Methods 33, 164–172
26. Danos, O., Mulligan, R. C. (1988) Safe andefficient generation of recombinant retro-viruses with amphotropic and ecotropichost ranges. Proc Natl Acad Sci USA 85,6460–6464.
27. Pear, W. S., Nolan, G. P., Scott, M. L., et al.(1993) Production of high-titer helper-freeretroviruses by transient transfection. ProcNatl Acad Sci USA 90, 8392–8396.
28. Roy-Chowdhury, J., Grossman, M., Gupta,S., et al. (1991) Long term improvement ofhypercholesterolemia after ex vivo gene ther-apy in LDL-receptor deficient rabbits.Science 254, 1802–1805.
29. Minami, H., Tada, K., Roy Chowdhury, N.,et al. (2000) Enhancement of retrovirus-mediated gene transfer to rat liver in vivo byinfusion of hepatocyte growth factor andtriiodothyronine. J Hepatol 33, 183–188.
30. Bosch, A., McCray, P. B. Jr., Walters, K. S.,et al. (1998) Effects of keratinocyteand hepatocyte growth factor in vivo:
implications for retrovirus-mediated genetransfer to liver. Hum Gene Ther 9,1747–1754.
31. Follenzi, A., Naldini, L. (2002) Generationof HIV-1 derived lentiviral vectors. MethodsEnzymol 346, 454–465.
32. Seppen, J., Tada, K., Hellwig, S., et al.(1996) Bilirubin glucuronidation by intactGunn rat fibroblasts expressing bilirubinUDP-glucuronosyltransferase Biochem J314, 477–483.
33. Lizee G, Aerts JL, Gonzales MI, ChinnasamyN, Morgan RA, Topalian SL. (2003) Real-time quantitative reverse transcriptase-polymerase chain reaction as a method fordetermining lentiviral vector titers and mea-suring transgene expression. Hum Gene Ther14, 497–507
34. Pahl A, Kuhlbrandt U, Brune K,Rollinghoff M, Gessner, A. (1999) Quan-titative detection of Borrelia burgdorferi byReal-Time PCR. J Clin Microbiol 37,1958–1963.
35. Giannini C, Morosan S, Tralhao JG, Gui-dotti JE, Battaglia S, Mollier K, HannounL, Kremsdorf D, Gilgenkrantz H, CharneauP.A (2003) Highly efficient, stable, and rapidapproach for ex vivo human liver gene ther-apy via a FLAP lentiviral vector. Hepatology38, 114–122.
36. Nguyen TH, Oberholzer J, Birraux J,Majno P. Morel P, Trono D. (2002)Highly efficient lentiviral vector-mediatedtransduction of nondividing, fully reim-plantable primary hepatocytes. Mol Ther6, 199–209.
37. Cui Y, Chang LJ. (2003) Detection andselection of Lentiviral vector-transducedcells. Methods in Molecular Biology 229,69–85.
Ex Vivo Gene Transfer into Hepatocytes 139

Chapter 12
Sources of Adult Hepatic Stem Cells: Haematopoietic
Rosemary Jeffery, Richard Poulsom, and Malcolm R. Alison
Abstract
Bone marrow cells can engraft in the liver and differentiate into a variety of cell types including hepatocytes
and myofibroblasts. This chapter describes how, after transplantation of male bone marrow into female
recipients, cells of bone marrow origin (male) can be identified in the female liver by virtue of detection ofthe Y chromosome by the technique of in situ hybridisation (ISH). Furthermore, ISH for Y chromosome
detection can be combined both with immunohistochemistry (IHC) to identify phenotype and with ISH
for mRNA to demonstrate function. Additionally, we show that bone marrow-derived cells can beidentified in the liver without prior sex-mismatch bone marrow transplantation, identifying instead the
BCR:ABL fusion gene that is present in all such cells in almost all patients suffering from chronic
myelogenous leukaemia (CML).
Keywords: Bone marrow, X and Y chromosomes, in situ hybridization, immunohistochemistry,
myofibroblast, chronic myelogenous leukaemia, BCR:ABL gene.
1. Introduction
Our ability to track and identify cells from outside the liver that areable to act as progenitors for liver cells, in particular for hepato-cytes, relies on identifying the origin of these so-called ‘plasticcells’ and characterising their phenotype. This may be achieved ina variety of ways. In experimental models, one of the simplestapproaches is to lethally irradiate female mice, rescue them with amale bone marrow transplant and look for Y chromosome-expres-sing donor cells within the liver or other organs of interest. Otherapproaches rely on a similar replacement of recipient bone marrowwith cells that carry other markers such as green fluorescentprotein (GFP), Luciferase or the Escherichia coli b-galactosidasegene (Fig. 12.1)
Anil Dhawan, Robin D.Hughes (eds.), Hepatocyte Transplantation, vol. 481� Humana Press, a part of Springer ScienceþBusiness Media, LLC 2009DOI 10.1007/978-1-59745-201-4_12 Springerprotocols.com
141

Human studies rely on the examination of tissue frompatients that have either undergone a sex-mismatch liver trans-plant (usually female liver allografted to male recipient) or asex-mismatch bone marrow transplant and then investigatingbiopsies for X and Y chromosome-expressing cells. In bothhumans and animals, these donor-derived cells can be assessedfor phenotype using a variety of histochemical and immunohis-tochemical markers. A further modification is to use isotopicallylabelled RNA riboprobes to study the function of these donor-derived, phenotypically characterised cells. Taking advantage ofthe t9:22 that occurs in the majority of CML patients, resultingin the Philadelphia chromosome with the BCR:ABL fusiongene, we further show that bone marrow cell engraftment inthe liver can occur without irradiation and bone marrow trans-plantation. (Fig. 12.2C)
We also demonstrate the detection of engrafted human cellsof bone marrow origin in immunodeficient mice by distinguishingbetween human and murine cells using species-specific pan cen-tromeric probes. (Fig. 12.2B)
Fig. 12.1. Revealing that bone marrow cells (BMCs) have differentiated into non-haematopoietic cells can beachieved by transplanting lethally irradiated animals with new BMCs that can be tracked whatever their subsequentfate. This would include male BMCs to a female recipient, or GFP- or LacZ-positive BMCs to wild-type recipients.The male chromosome can be detected by in situ hybridisation, GFP by immunohistochemistry and b-galactosidaseby X-gal histochemistry. (see Color Plate 11)
142 Jeffery et al.

2. Materials
2.1. Basic Histological
Preparation of
Sections
1. Neutral buffered formalin (BDH) tissue fixative: prepared as a10% solution.
2. Coated slides (Fisher superfrost).
3. Graded alcohols 70, 96 and 100% prepared using Analar grade.ethanol and double-distilled water.
4. Xylene (BDH).
5. Wax (Lamb).
2.2. Pretreatments 1. Hydrogen peroxide (BDH) blocking solution for endogenousperoxidases. Add 2.4 ml 30% hydrogen peroxide to 100 mlabsolute alcohol.
2. PBS tablets (Sigma): dissolve in double-distilled water accord-ing to the manufacturer’s instruction.
3. Pepsin: dissolve 0.4 g pepsin (Sigma) in 0.1 M HCl(see Note 1)
Fig. 12.2. Fluorescent and confocal microscopy. (A) Male cells (arrows) in male bone marrow-transplanted female mouseliver (green FITC dot). These cells are CK18 immunoreactive (red cytoplasm), suggestive of hepatocyte differentiation. (B)Human cell (green FITC, spotty nucleus, arrowed) in mouse liver (pink CY3 spots) after injection of human CD133+ cellsinto a NOD-SCID mouse. (C) BCR/ABL probe on human liver in a case of CML showing normal ploidy, with two copies ofchromosome 9 (red signals) and two copies of chromosome 22 (green signals) in some cells (asterisks), but multiplecopies (polyploidy) in another cell (arrow). (D) BCR/ABL fusion signal (green and red overlap producing orange, arrowed)seen in cell tentatively identified as a hepatocyte in a case of CML. There is one native chromosome 9 (red), one nativechromosome 22 (green) and one small red signal (ASS gene). (E) Confocal images demonstrating liver polyploidy in afemale mouse transplanted with male bone marrow, with multiple X chromosomes (green signals) showing that a Ychromosome (red signal, black arrow) is outside the nuclear membrane (view E), while a smaller nucleus (white arrow)has both X and Y chromosomes contained within it. (see Color Plate 12)
Sources of Adult Hepatic Stem Cells: Haematopoietic 143

4. Sodium thiocyanate (Sigma-Aldrich): dissolve 16 g in 200 mlof double-distilled water at 808C.
5. Glycine stop: dissolve 0.4 g glycine (BDH) in double-strengthPBS.
6. Paraformaldehyde (PFA) (Sigma): prepare a 4% solution by dis-solving 4 g of powder in 100 ml PBS at 808C. Cool to roomtemperature before use (see Note 2). Use on day of preparation.
7. Glass coverslips of various sizes to cover tissue section.
8. Rubber cement: available from cycle repair suppliers.
9. Humid chamber: this can be made from any sealable containerlarge enough to take a slide rack horizontally – line with damptissue soaked in distilled water.
2.3. Probes 1. Mouse Y chromosome paint (Cambio), FITC labelled.
2. Human X and Y chromosome paint (Stretton Scientific).
3. Mouse and human pan centromeric probes (Cambio).
4. BCR/ABL probe (Vysis).
2.4. Post-washes 1. Standard sodium citrate (SSC): to make the 20� stock, dissolve175.3 g of sodium chloride and 88.2 g of sodium citrate in900 ml water. Adjust to pH 7 with NaOH or HCl if necessary,make up to 1 l and sterilise by autoclaving. Dilute as necessary.
2. Anti-fluorescein POD (Roche): diluted 1:200 with PBS.
3. 3,30-Diaminobenzidine (DAB): prepare a working solution bydissolving 6 mg in 10 ml of PBS, mix well and then add 20 ml30% hydrogen peroxide.
4. Vectaset (Vector Labs) Hardset with DAPI.
5. Haematoxylin (Lamb).
6. DPX mountant (BDH).
2.5. Immunohis-to
chemistry 1. Various primary antibodies raised against leukocyte commonantigen, (CD45), cytokeratin 8/18, a-smooth muscle actinavailable from many sources including Dako, Novocastra,R&D Systems and Santa Cruz.
2. Biotinylated rabbit anti-mouse (Dako): use 1:300.
3. Biotinylated swine anti-rabbit (Dako): use 1:300.
4. Streptavidin-peroxidase (Dako): use 1:500.
5. Streptavidin–alkaline phosphatase (Dako): use 1:50.
6. Vector Red (Vector labs): prepare a working solution accord-ing to the manufacturer’s instructions by adding two drops ofstock to 5 ml of 100 mM Tris buffer pH 8.4.
7. Acid alcohol block: 20% acetic acid in absolute alcohol.
144 Jeffery et al.

2.6. ISH for mRNA 1. Nuclease-free water (Q): add 0.1% vol of diethylpyrocarbo-nate (DEPC) to all solutions, then autoclave.
2. TE buffer: 10 mM Tris-HCl (pH 8.0), 1 mM EDTA.
3. RNA polymerases (Promega) T7, SP6 or T3 depending onthe desired template.
4. RNAse inhibitor (Promega): use at a 20 U/ml concentration.
5. Dithiothreitol (DTT) (Sigma).
6. AGC mix (Boehringer): prepare as 6.25 mM aliquots of eachindividual base, ATP, GTP, CTP and then mix in equalvolumes to give a final concentration of 1.0 mM.
7. 3H UTP (GE Healthcare) �800 Ci/mmol.
8. DNaseI. RNase-free grade (Boehringer).
9. Chromaspin-30 columns DEPC-equilibrated (Clontech).
10. Transfer RNA (Sigma).
11. Triethananolamine buffer (Sigma): dissolve 37.5 g of trietha-nolamine in DEPC-treated water, then make up to 2 l to givea 0.1 M solution.
12. Acetic anhydride (Sigma): immediately before use, add 1.25acetic anydride to 500 ml of 0.1 M triethanolamine (Acetyla-tion buffer).
13. Formamide wash solution (Fisher): to prepare wash bufferadd 250 ml of 10� salts (14.2 g Na2HPO4 in 300 ml Q pH6.8, add 176.2 g NaCl), then add 100 ml of Tris-HCl pH 7.6and 250 ml of 0.2 M EDTA, pH 7.5. Mix well and make up to1 l. For 1 l of wash buffer solution, add 250 ml of 10� salts to1.25 l of formamide, then make up to 2.5 l with Q.
14. Deionised Formamide (for use in hybridisation buffer): To400 ml formamide add 20 g of ion exchange resin (20–50mesh Bio Rad, Germany). Stir overnight then filter using No.1filter paper to remove resin. Store at –208C in small aliquots.
15. Dextran sulphate solution: dissolve 50 g of powder (Sigma)in 100 ml of autoclaved water at 808C until dissolved. Aliquotin 1 ml tubes and store at –208C.
16. Denhardt’s salt solution: add 5 ml of 10� salts to a vial contain-ing 5 ml Denhardt’s solution and stir until dissolved. Transfer toa 50 ml tube and make up to 25 ml. Store in small volumes at–208C.
17. Hybridisation buffer: for 1 ml, combine the following inorder: 100 ml Denhardt’s salt solution, 500 ml deionisedformamide, 30 ml tRNA, 200 ml dextran sulphate (pre-warmed), 10 ml 1 M DTTMix well. Store at –208C
18. TNE buffer (Tris-HCl/NaCl/EDTA) for RNase digestion:combine 146 g of NaCl, 50 ml of 1 M Tris-HCl pH 7.6,
Sources of Adult Hepatic Stem Cells: Haematopoietic 145

25 ml of 0.2 M EDTA, pH 7.5 and make up to 5 l with water.Adjust pH to 7.2–7.6.
19. RNaseA: dissolve 500 mg ribonucleaseA (Sigma) in 10 ml of10 mM sodium acetate pH 5.2. Heat to 1008C for 15 min,cool, adjust pH to 7.4 with 1 M Tris-HCl.
20. Phenol:choloroform:isoamyl alcohol (PCI): prepared bymixing 24 ml of phenol and 24 ml chloroform, then adding1 ml of isoamyl alcohol, before mixing well. The bottomphase is then used.
21. Chloroform:isoamyl alcohol (CI): prepared by adding 1 ml ofisoamyl alcohol to 25 ml chloroform and using the bottomphase.
3. Methods
It is possible to use a variety of methods, and therefore markers, toinvestigate the origin and phenotype of cells. The simplestapproach is to study the origin of cells using basic in situ hybridi-sation (ISH) and look for the Y chromosome either by directfluorescence (Fig. 12.2) or by indirectly using light microscopy.(Fig. 12.3) Combining ISH with immunohistochemistry (IHC)further allows the investigator to determine the phenotype of thecells under investigation. These methods may also be combinedwith riboprobe ISH to look for an appropriate mRNA indicativeof functionality, although this is technically very difficult andprone to failure. Figure 12.3 illustrates the problems associatedwith combining these techniques.
3.1. Basic Histology 1. Tissue is harvested from experimental animals and fixed imme-diately in NBF. After fixing for a set period of time (see Note 3),the tissue is transferred to 70% alcohol and processed to waxblocks using standard histological techniques. Paraffin sectionsthat are 4–6 mm thick are cut on a microtome, collected ontocoated slides and dried overnight at 378C.
3.2. ISH
Pretreatments
1. Slides are dewaxed in xylene, 3 � 5 min.
2. Transferred to absolute alcohol and blocked in hydrogenperoxide if required (see Note 4) for 10 min before re-hydrat-ing through graded alcohols to water and then PBS.
3. Wash in PBS for 15 min with three changes.
4. Treat slides in1 M sodium thiocyanate at 808C for 10 min.
5. Wash in PBS, two changes over 10 min.
6. Digest slides in 0.4% pepsin at 378C for required time(see Note 5).
146 Jeffery et al.

7. Stop the digestion by immersing in glycine stop for 5 min.
8. Wash in PBS for 5 min.
9. Post-fix in PFA for 2 min.
10. Wash well in PBS: three washes over 15 min.
11. Dehydrate through graded alcohols and air dry.
12. Remove probe from fridge or freezer and allow to warm toroom temperature before applying 10–15 ml to each slidedepending on the size of the tissue.
13. Cover with a glass coverslip and seal with rubber cement.
14. Denature the sealed slide at the required temperature for10 min (see Note 6).
15. Place the slides horizontally in a humid chamber and hybri-dise overnight at 378C.
Fig. 12.3. Liver fibrosis in a mouse as viewed by bright field microscopy. (A) Demonstration of Y chromosome-positive cells(brown nuclear dots) in a female mouse liver after a male bone marrow transplant. (B) Demonstration of mRNA for pro(a1)I (blackautoradiographic grains) in the same liver using a 3H-labelled antisense riboprobe. (C) Demonstration of Y chromosome detection(brown dot, arrow) and IHC for a-SMA expression (red staining) – a marker of myofibroblast differentiation. (D) Demonstration ofthe expression of mRNA for pro(a1)I, the Y chromosome and a-SMA in the same liver. One Y chromosome-positive cell isexpressing neither a-SMA nor mRNA for pro(a1)I, but another cell (asterisk) is expressing all three markers. Note the reducedgrain density when techniques are combined in comparison to when ISH for the mRNA is performed alone. (E and F) Examples ofISH for pro(a1)I mRNA expression and immunoreactivity for a-SMA in the same section. (see Color Plate 13)
Sources of Adult Hepatic Stem Cells: Haematopoietic 147

3.3. ISH Post-
hybridisation Washes
and Detection
1. Carefully remove the rubber cement by rubbing gentlybetween the thumb and the forefinger and then remove thecoverslip.
2. Rinse the slides quickly in 0.5% SSC at 378C, then wash for5 min at 378C, again in 0.5% SSC.
3. Wash with PBS, three changes over 15 min.
4. At this stage it is possible to mount the slides in Hardset andview using suitable software on a fluorescent microscope(see Note 7), see Fig. 12.2 for examples.
5. Alternatively, sections that have been probed with a fluores-cein-conjugated probe may be detected by applying 200 ml ofanti-fluorescein POD FAB fragments to each slide for 1 h.
6. Wash with three changes of PBS over 15 min and detect usingDAB for 2–3 min.
7. Wash with three changes of PBS over 15 min.
8. Counterstain with a light haematoxylin, dehydrate, clear inxylene and mount in DPX. In Fig. 12.3, panel A shows anexample of a mouse Y chromosome paint on a section of femaleliver from a female mouse that had received a male bonemarrow 6 weeks previously.
3.4. Immunohisto-
chemistry
It is possible to combine ISH with IHC for a variety of specific cellmarkers. The IHC needs to be performed before ISH as thetreatments involved in ISH destroy the IHC epitopes.1. Dewax and block sections as for ISH. If using both peroxidase
and alkaline phosphatase for detection, it will be necessary toalso block for endogenous alkaline phosphatase for 5 min inice-cold acid alcohol.
2. Take sections to PBS and wash for 5 min.
3. Perform any necessary antigen retrieval (see Notes 8–10).
4. Wash with three changes of PBS over 15 min.
5. Apply 1:25 blocking serum according to the species in whichthe secondary layer was raised for 15 min (see Note 8).
6. Apply primary antibody at a pre-determined dilution(see Notes 9 and 10) for 40 min in a humidity chamber,e.g. leukocyte common antigen (CD45) is diluted 1:200 ifusing a mouse monoclonal from Dako, but at 1:20 if using arat monoclonal from Pharmacia.
7. Wash with three changes of PBS over 15 min.
8. Apply a second layer (biotinylated) for 40 min.
9. Wash with three changes of PBS over 15 min.
10. Apply a tertiary layer for 40 min. If continuing with FITC-labelled probe then Vector Red is the detection method ofchoice as it allows both direct and indirect visualisation;
148 Jeffery et al.

therefore apply 1:200 streptavidin-AP. For DAB detection,apply 1:500 streptavidin-HRP.
11. Wash with three changes of PBS over 15 min.
12. Detect colour using either DAB or Vector Red (see Note 10)(see step 10 above).
13. Continue with ISH pre-treatments from step 4.
3.5. ISH Probe
Preparation
The main technical problem with combining mRNA ISH fora functional marker such as the mRNA for the a1 chain oftype I (pro)collagen [pro(a1) I] with dual DNA ISH andIHC is the preservation of the RNA during the necessarypre-treatments. Utmost care must be taken to avoid anysource of contamination with ribonucleases. Riboprobes arelabelled single-stranded RNA molecules synthesised by invitro transcription using a DNA-directed RNA polymerase.The labelled UTP is usually 35S but 3H gives an improvedspatial resolution due to its low-energy particles and is there-fore the isotope of choice when deciding which cell is respon-sible for individual autoradiographic silver grains. As withIHC, the reader is advised to seek more expert help if adapt-ing the basic methods in this way (1).1. After obtaining a plasmid containing the sequence of interest
(usually in the form of an agar slope with bacteria transfectedwith the coding region in a suitable vector) this needs to beextracted using a kit such as Qiagen maxiprep and followingthe given instructions.
2. The plasmid is then linearised (to give template) using asuitable restriction endonuclease (see Note 11). For mRNAof pro(a1) I (IMAGE clone 335137), 200 units of EcoR1 willlinearise 50 mg of purified plasmid, which can then be cleanedup using PCI.
3. Make a 3H-labelled single-stranded mRNA pro(a1)I anti-sense probe using the DNA-directed RNA polymerase T3.Add to a microfuge tube at room temperature in the followingorder: 2.5 ml 5� transcription buffer (as supplied with poly-merase), 1.0 ml RNase inhibitor, 0.7 ml DTT (100 mM), 2.0 mlAGC mix, 1.0 mg DNA template (made up to 2.4 ml with Q) 1ml 3H UTP, mix well then add 1.0 ml appropriate polymerase,in this case T3.
4. Incubate for 1 h at 378C, then destroy the template by adding1.0 ml DNase and incubate for a further 15 min. During thistime prepare a Chromaspin 30 column by centrifugationaccording to the manufacturer’s instructions.
5. Spin the tube to reduce the risk of radioactive aerosols, thenadd carrier RNA (10 mg/ml, 1.5 ml) with 10 mM DTT to afinal volume of 25 ml (see Note 12).
Sources of Adult Hepatic Stem Cells: Haematopoietic 149
6. Add bulk of reaction mix to top of the chromaspin columnand centrifuge at 700 g for 3 min, collect the elute into a newtube containing 4 ml 100 mm DTT and 2 ml RNase inhibitor.Store at –208C (see Note 12).
3.6. Radiolabelled ISH
Pre- and Post-
treatments
It is crucial to avoid RNase contamination. If combining with DNAISH and /or IHC, then apply stringent precautions throughout alltreatments. The steps must be undertaken wearing gloves, usingsterile glassware and adding DEPC to all solutions. (1, 2)1. Slides should be in PBS after any preceding treatments.
2. Permeabilise in proteinase K at 378C for 10 min(see Note 13).
3. Rinse in glycine/2� PBS for 5 min to stop the protease.
4. Wash in two changes of PBS over 5 min.
5. Post-fix in PFA for 10 min.
6. Wash in PBS, three changes over 15 min.
7. Immerse slides in 500 ml acetylation buffer for 20 min(see Note 14).
8. Dehydrate through sequential alcohols and air dry. The slidesare now ready to hybridise.
9. Calculate the volume of hybridisation mix required (seeNote 15). Mix enough probe mix, allowing an extra 10% asit is difficult to pipette, mix well, then boil in a screw top tubefor 2 min to denature before cooling on ice.
10. Apply 20 ml to each slide and cover with a glass coverslip.Place the slides horizontally in a suitable slide rack or slidemailing box, then place in a lunch box or similar containerhumidified with blotting paper soaked in 1� salts in 50%formamide (see Note 16) and place at 558C overnight.
11. Pre-warm all solutions required the following day. A volumeof 5 l of formamide wash buffer at 558C, 5 l of TNE washes at378C, 1 l of 2� SSC and 500 ml of 0.5� SSC, both at 658C.
12. The following day, remove the slides and gently ease off eachcoverslip by rubbing between the thumb and the forefinger.Place all slides in 500 ml formamide wash solution at 558C ona rocking table. Keeping everything at 558C, wash the slideswith the full 5 l of wash buffer over the next 3–4 h.
13. Remove all traces of formamide by washing with the 4.5 l ofTNE over 30 min. To the remaining 500 ml of TNE, add1 ml of stock RNase.
14. Place the slides in RNAse solution at 378C for 1 h.
15. Wash slides in 2� SSC at 658C for 30 min twice.
16. Wash slides in 0.5� SSC at 658C for 30 min.
17. Pass slides through graded alcohols and air dry.
150 Jeffery et al.

3.7. Autoradiography
(see Note 17)
1. In a darkroom fitted with a 902 filter and 15 W bulb, heat25 ml water to 428C in a cut-down measuring cylinder orsimilar in a suitable water bath. Check that the water bathdoes not have a light source indicating power or temperature.
2. Cool a metal plate.
3. Using plastic forceps or spoon to add strands of emulsion tothe 40-ml mark, stir gently and leave to melt for at least 10 min,stirring occasionally.
4. Check that there are no bubbles in the solution by dipping aplain control slide, wipe the back and lay on a cooled metalplate to set. The dipping solution is ready to use if no bubblescan be seen on the test slide when it is held up to the light.
5. Dip slides one at a time, allow excess to drip off for a second,wipe the back and lay on a cooled plate to dry and set. Thistakes 1–2 h.
6. When dry, place all slides in a wooden or plastic box, seal inlight-proof black bag and leave to expose at 48C as appropriate(see Note 18).
7. Develop a set of exposed slides by immersing in a D19 devel-oper for 4 min at 188C for 4 min, stop in 1% acetic acid, wash intap water and then fix in 30% sodium thiosulphate for 8 min.The main light may now be turned on.
8. Wash in running tap water for 1 h to remove any trace offixative before counterstaining (see Note 19).
3.8. Discussion The majority of the techniques described here are routinely usedin many laboratories, but are rarely combined in the waysdescribed. It is important to emphasise the absolute necessity toavoid contamination with any DNAses and or RNAses. Autoclav-ing of solutions and glassware, the wearing of gloves, the additionof DEPC to all solutions are all fundamental in preserving targetsof interest (1, 2).
The use of markers for the Y chromosome is widespread in thefield of liver stem cell research (3–8) and in other organ systems (9and for review see 10); Fig. 12.2A illustrates the presence of cellsof donor origin (male) after a sex-mismatch bone marrow trans-plant to a female mouse. Figure 12.2B illustrates the combina-tion of two separate probes on a single section. NOD-SCID micereceived an injection of CD133+ haematopoietic stem cells 7 daysprior to killing. The livers were examined using an FITC-labelledhuman pan centromeric probe combined with a CY3-labelledmouse pan centromeric probe. It is not possible here to determinewhether the human cells are merely residing in the liver or whetherthey have undergone differentiation. This would necessitate com-bining these two probes with another technique such as IHC forphenotype or a riboprobe to show function. A complication of
Sources of Adult Hepatic Stem Cells: Haematopoietic 151

combining techniques is that the use of unmasking agents to allowfor the detection of one signal is the very procedure that destroys asubsequent target. Figure 12.3C illustrates this point: signals forboth RNA and Y chromosome are both greatly reduced when theyare combined together.
The decision as to how to examine slides for the presence ofthe Y chromosome may depend on the availability of a suitablefluorescent microscope. The use of confocal microscopy furtherallows the examiner to determine the exact position of signalsand confirm that they are inside or outside the nucleus – this isof particular importance in ploidy and translocation studies(Fig. 12.2C–E). The use of direct visualisation will also allowthe investigator to determine true signals over background bylooking in several channels but for researchers used to examiningtissues by direct microscopy structural interpretation may be moredifficult.
When attempting to use a triple method, it may be necessaryto adapt the basic Y probe protocols to avoid high temperatures,which may destroy RNA. This may be done by denaturing the Yprobe by boiling for 2 min before applying it to the slides and notco-denaturing at 608C. As already mentioned, the combination oftwo techniques causes the loss of some signals, including a thirdmethod that is technically very challenging (Fig. 12.3C–F), but ispossible provided that signals are very strong when performedindividually (Fig. 12.3B).
4. Notes
1. Pepsin is known to autodigest. It is important to always allowit to dissolve at 378C without too much agitation for a settime before use to standardise it. The powder is very light andshould be handled with care.
2. PFA is hazardous. Wear gloves and avoid breathing vapour.
3. A standardised fixation time at this stage will avoid too greatervariation in subsequent digestion times.
4. It is necessary to treat slides in hydrogen peroxide to block forendogenous peroxidase if using peroxidase detection later.
5. The time required for pepsin digestion is very variable. Advi-sable to try between 2 and 45 min to determine a suitable timewhen signal strength is adequate without losing too muchmorphology.
6. The denaturing temperature varies according to the probeused. Most mouse probes work well at 608C, whereas humanprobes usually require 808C.
152 Jeffery et al.

7. We recommend Smartcapture software (Digital Scientific)although other similar software packages may be just asgood. Depending on the fluorescent label used, DAPI, FITCand CY3 filters will be required, although using other filterswill help to distinguish true signals from autofluorescence.
8. Basic immunohistochemistry is beyond the remit of this arti-cle. For those wishing to learn more about this subject, refer-ence books such as the Handbook of Immunochemical StainingMethods (11) as supplied by Dako are recommended.
9. Many antibodies require antigen retrieval before the epitopecan be revealed; techniques to achieve this include digestionin various proteases including trypsin, and heating by eitherboiling, microwaving or pressure cooking. It is necessary torefer to the data sheet supplied with individual antibodies todetermine the appropriate method.
10. The use of appropriate controls cannot be over-emphasised.It is also usual to lose some signals due to the harshness ofthe ISH treatments, so it is recommended that colour isallowed to develop strongly before proceeding to ISH pre-treatments.
11. Restriction endonucleases cleave DNA at known sites – theenzyme to use is determined by the orientation and positionof the sequence of interest within the plasmid vector.
12. It is possible at his stage to take samples of pre- and post-spincolumn aliquots and count in a scintillation counter to assessthe quantity of labelled probe made, and also to assess thequality by running on a 6% polyacrylamide denaturing gel (ifusing 35S but not if using 3H). Radiolabelled probes do notkeep well. It is advisable to use within 3 days of preparation.
13. This step may not be necessary if tissue has already beendigested previously.
14. This must be prepared immediately before use.
15. Add 20 ml per slide. Hybridisation buffer should make up 84%of the final volume. For 3H-labelled probes, aim to add200,000 counts to each slide, the difference in volume ismade up with Q.
16. Formamide is toxic. Avoid breathing in fumes.
17. All autoradiography must be carried out under safe light con-ditions. Cleanliness is important, avoid the use of any metalcoming into contact with the slides, i.e. use plastic racks.
18. This may be anything from 2 to 20 weeks depending on thestrength of the signal.
19. Giemsa is the usual counterstain of choice if just looking atthese slides; however, after DNA ISH and IHC, haematox-ylin may be preferred as it gives a better contrast with vector
Sources of Adult Hepatic Stem Cells: Haematopoietic 153

red and DAB. Silver grains indicating the presence of messageappear as very small black dots under conventional lightmicroscopy or as bright white dots when using dark field-reflected light illumination. It is usual to lose much of thesignal when combining with other techniques.
Acknowledgements
We thank Prof. R. Revoltella for the tissue for demonstratinghuman cells in mouse liver.
References
1 Poulsom, R., Longcroft, J. M., Jeffery, R. E.,et al. (1998) A robust method for isotopicriboprobe in situ hybridisation to localisemRNAs in routine pathology specimens.Eur J Histochem 42, 121–132.
2. Jeffery, R., Hunt, T., Poulsom, R. (2003) Insitu hybridisation combined with immunohis-tochemistry to localise gene expression. PartIV Chapter 23, in (Brooks, S. A., Harris, A., eds.),Breast Cancer Research Protocols, pp. 323–346.Humana Press Inc.
3. Alison, M. R., Poulsom, R., Jeffery, R., et al.(2000) Hepatocytes from non-hepatic adultstem cells. Nature 406, 257.
4. Theise, N. D., Badve, S., Saxena, R., et al.(2000) Derivation of hepatocytes frombone marrow cells in mice after radiationinduced myeloablation. Hepatology 31,235–240.
5. Theise, N. D., Nimmakalu, M., Gardner, R.,et al. (2000) Liver from bone marrow inhumans. Hepatology 32,11–16.
6. Lagasse, E., Connors, H., Al-Dhalimy, M.,(2000) Purified hematopoietic stem cells candifferentiate into hepatocytes in vivo. NatMed 6, 1229–1234.
7. Korbling, M., Katz, R. L., Khanna, A., et al.(2002) Hepatocytes and epithelial cells ofdonor origin in recipients of peripheral-bloodstem cells. N Engl J Med 346, 738–746.
8. Sato, Y., Araki, H., Kato, J., et al. (2005) Humanmesenchymal stem cells xenografted directly torat liver are differentiated into human hepato-cytes without fusion. Blood 106, 756–763.
9. Fang, T.-C., Alison, M. R., Cook, H. T.,et al. (2005) Proliferation of bone marrow-derived cells contributes to regeneration afterfolic acid-induced acute tubular injury. J AmSoc Nephrol 16, 1723–1732.
10. Poulsom, R., Alison, M. R., Forbes, S. J.,et al. (2002) Adult stem cell plasticity.J Pathol 197, 441–456.
11. Handbook of Histochemical Methods. 3rdEdition published by DAKO.
154 Jeffery et al.

Chapter 13
Production of Hepatocyte-Like Cells from Human Amnion
Toshio Miki, Fabio Marongiu, Ewa C.S. Ellis, Ken Dorko,Keitaro Mitamura, Aarati Ranade, Roberto Gramignoli, Julio Davilaand Stephen C. Strom
Abstract
Cells isolated from the placenta have been the subject of intense investigation because many of the cellsexpress characteristics of multipotent or even pluripotent stem cells. Cells from the placental tissues such asamnion and chorion have been reported to display multilineage differentiation and surface marker andgene expression patterns consistent with embryonic stem (ES) and mesenchymal stem cells, respectively.We have reported that epithelial cells isolated from term placenta contain cells that express surface markerssuch as the stage-specific embryonic antigens (SSEA) and a gene expression profile that is similar to EScells. When subjected to specific differentiation protocols, amniotic epithelial cells display markers ofdifferentiation to cardiomyocytes, neurons, pancreatic cells and hepatocytes. If specific and efficientmethods could be developed to induce differentiation of these cells to hepatocytes, the amnion maybecome a useful source of cells for hepatocyte transplants. Cells isolated from amnion also have someunique properties as compared to some other stem cell sources in that they are isolated from a tissue that isnormally discarded following birth, they are quite plentiful and easily isolated and they do not producetumors when transplanted. Cells isolated from the amnion may be a uniquely useful and noncontroversialstem cell source.
Key Words: Stem cell hepatocyte, hepatocyte transplant, cardiomyocyte, neuron, pancreatic betacell, cell transplantation.
1. Introduction
While the transplantation of hepatocytes to treat liver disease hasbecome a more common experimental technique worldwide, amajor problem still exists concerning the source of cells for trans-plant (1, 2). The most common source of cells has been fromdonor livers that have been rejected for transplantation because ofsteatosis, extended cold ischemic time, plaques in the vessels ormoderate to advanced underlying liver disease (3, 4). Thus, many
Anil Dhawan, Robin D. Hughes (eds.), Hepatocyte Transplantation, vol. 481� Humana Press, a part of Springer ScienceþBusiness Media, LLC 2009DOI 10.1007/978-1-59745-201-4_13 Springerprotocols.com
155

hepatocyte transplants rely on the isolation of cells for transplantfrom organs that were already judged not to be useful for trans-plant. Although it is clear that there are still useful cells in mostorgans that are not useful for whole-organ transplant, an alter-native source of hepatocytes would increase the number ofpatients who could receive cell transplants. The most commonlyproposed alternative sources of cells for hepatocyte transplantshave been xenotransplants of hepatocytes from a porcine source,immortalized human cells, human fetal or progenitor cells or stemcell sources (5). This chapter will discuss the possibility of gen-erating hepatocytes from stem cells isolated from the amnionmembrane of term placenta.
2. Amnion-Derived Stem Cells
Miki et al. (6) reported that epithelial cells from term humanamnion (AE) have stem cell characteristics. Cell surface markersare commonly found on ES cells such as SSEA 3 and 4 and thetumor rejection antigens 1-60 and 1-81. In addition to the surfacemarkers, AE cells also express molecular markers characteristic ofES cells including the expression of Oct-4 and Nanog, genesknown to be involved in the maintenance of pluripotency. Thehypothesis that AE cells might be pluripotent was supported bythe demonstration of the differentiation of the cells. Under certainculture conditions, AE cells differentiate to cell types derived fromall three germ layers including cardiomyocytes, neurons, pancrea-tic alpha and beta cells and hepatocytes (6–8). Work from otherlaboratories also supported the hypothesis that AE cells have stemcell characteristics (9). Sakuragawa and co-workers (10–13)reported that AE cells could be induced to differentiate to cellswith neural characteristics (14, 15). These authors reported theexpression of neural genes and proteins as well as the productionand release of neurotransmitters (16, 17). Wei et al. (18) exploredthe differentiation of AE cells to pancreatic cells and demonstratedthe production and release of insulin and a lowering of bloodglucose levels following the transplantation of AE cells into dia-betic mice. Cells from the amniotic fluid and other compartmentsof the placenta also show stem cell characteristics, although mostof the properties reported suggest that these cells are more similarto mesenchymal stem cells than AE cells (19–26).
Taken together, the data clearly indicate that cells with stemor progenitor properties are located in the amnion membrane. Ifspecific and efficient methods could be devised to induce differ-entiation of amnion-derived stem cells to hepatocytes, AE cells
156 Miki et al.

could be a useful source of stem cells for hepatocyte transplants.Amnion membrane is plentiful; with over 4 million live births peryear in the United States, amnion-derived stem cells could beimmediately available. Since relatively low-technology procuresare needed for isolation and banking, this stem cells sourcecould easily be available worldwide at a modest cost. Finally, thisstem cell source is noncontroversial. Amnion membrane, like allother placental tissues, is normally discarded following the birth ofa baby; thus tissue collection is not a problem. Since the life anddevelopment of the fetus is never interrupted, stem cells derivedfrom placental tissues would be expected to avoid all of the ethicalor religious concerns associated with some other stem cell sources.
3. Derivation ofthe Amnion andIsolation of AECells
Amnion develops during the second week of life (Fig. 13.1) at thetime when the fertilized egg has begun implantation into the mater-nal endometrium and has formed a blastocyst (7). While most of thefetal components of the placenta are derived from the hypoblast, theamnion differentiates from the epiblast, the same cell compartmentthat eventually gives rise to all organs and tissues of the developingfetus. The differentiation of amnion from the epiblast occurs beforegastrulation and the specification of the three germ layers. Therefore,amnion might maintain some of the pluripotent nature of the epi-blast. The differentiation of AE cells to cell types derived from allthree germ layers supports this hypothesis. For the isolation of the
Fig. 13.1. Diagram of embryogenesis from fertilization to gastrulation.
Production of Hepatocyte-Like Cells from Human Amnion 157

stem cells, the amnion membrane is removed from the surface ofthe placenta. A detailed protocol has been published describing theseparation of the amnion membrane from the placenta and theisolation of the epithelial cells (27). Briefly, the amnion membraneis stripped from the surface of the placenta immediately followingdelivery. Amnion membrane is washed to remove blood and trypsi-nized to release epithelial cells. Trypsin digestions (one or two diges-tions of up to 40 min each) specifically release epithelial cells.Mesenchymal stromal cells (formerly called mesenchymal stemcells) remain in the amnion membrane through the procedure and,if needed, can be specifically released by digestion of the amnionmembrane with collagenase following the removal of the epithelialcells. Following isolation, the epithelial cells can be immediatelycryopreserved or placed in culture. Standard culture media consistsof Dulbecco’s Modified Eagle’s Medium supplemented with 10%fetal bovine serum and 10 ng/ml epidermal growth factor (EGF),1 mM nonessential amino acids (neaa), 4 mM L-glutamine (glu)55 mM 2-mercaptoethanol (2ME). Specific growth factors can beadded to help direct differentiation. Cultured cells grow to conflu-ence quickly in the presence of serum and EGF. If EGF is removed,cell proliferation immediately slows, and then ceases even if serumsupplementation is maintained. The morphology of human AE cellsin culture at mid-confluence and complete confluence is presented inFig. 13.2
4. Differentiationof AE toHepatocyte-LikeCells
Differentiation of AE cells to different cell types is dependent onboth the culture substrate and the types and concentration ofgrowth factors added to culture media. Two simple protocols for
Fig. 13.2. AE cells in culture: low density (A) and high density (B).
158 Miki et al.

hepatic differentiation are shown in the schematic form inFig. 13.3. For hepatic differentiation, AE cells are plated on type1 collagen-coated culture dishes in standard culture media supple-mented with neaa, glu, 2ME and EGF as described above andsteroid hormones such as hydrocortisone (HydC) or dexametha-sone (Dex). Over the next days to weeks, the cells take on severalmarkers of hepatic differentiation. We examined the ability of steroidhormone exposure to enhance hepatic differentiation. Data shown inFig. 13.4 show the relative expression of the endodermal/hepaticmarker genes hepatocyte nuclear factor-4 (HNF4-a) and Alpha 1-antitrypsin (A1AT) at 7 and 14 days in culture in the presence of Dexor HydC. For these experiments, expression of the gene in the cells atthe time of plating was set as 1 and the height of individual barsrepresent the relative expression of each gene at the indicated timepoints. Both HydC and Dex enhance the expression of the endo-dermal/hepatic genes in cultured AE cells. Since Dex was as good asor better than HydC in inducing endodermal/hepatic differentia-tion, the remaining studies were conducted with Dex as the steroidhormone in the media. Data presented in Fig. 13.5 show the relativeexpression of albumin (Alb), A1AT and the liver-enriched
Fig. 13.3. Hepatocyte differentiation protocols.
Fig. 13.4. Relative mRNA expression of HNF-4 (A) and A1AT (B) in AE cells cultured in the presence or absence of 1 mMDex or HydC.
Production of Hepatocyte-Like Cells from Human Amnion 159

transcription factor, and CAAT enhancer binding protein-alpha (C/EBP-a). All three markers of hepatic differentiation increase overtime in culture in the presence of Dex. Under these simple cultureconditions Alb expression can increase over 400-fold and up to 35%of the cells will react positively to an antibody to human Alb.
Liver arises from the endoderm germ layer. The molecularevents involved in endoderm formation have begun to be workedout from recent studies on zebra fish mutants, knockout mice andXenopus (28–31). These investigators described an intermediatestage of development between the mesoderm and the endodermcalled the mesendoderm (Fig. 13.1) a bipotential tissue that givesrise to both mesoderm and endoderm. They also describedgrowth factors and methods that enhance the formation ofmesendoderm from undifferentiated cells. Mesendodermal differ-entiation of cells is accompanied by a decrease in the expression ofstem cell marker genes and an increase in the expression of mesen-dodermal genes such as FoxA2 and brachury (Fig. 13.6).
Fig. 13.5. Relative mRNA expression of albumin (A), A1AT (B) and C/EBP-a (C) in AE cells after 3, 9 and 15 days of culturein the presence of 0,1 mM Dex.
Fig. 13.6. Gene expression accompanying mesendodermal differentiation.
160 Miki et al.

Differentiation of AE cells to an endodermal lineage such asliver might benefit from efficient differentiation of AE cells tomesendoderm, first, followed by exposure to additional growthfactors that would enhance endodermal formation. One of thefactors known to induce mesendodermal differentiation in undiffer-entiated cells is activin A, a member of the TGF-b superfamily.Activin A affects its biological activity via binding to the Type II,TGF-b cell surface receptor. Recent reports indicate that a briefexposure activin A enhances the differentiation of ES cells to thehepatic and pancreatic lineage (32–35). However, other investiga-tors reported that Activin A also plays an important role in main-taining self-renewal of ES cells (36). Smith et al. (37) also showedthat an inhibition of Activin signaling foster neurectoderm differ-entiation of ES cells.
During embryonic development, two types of endoderm aregenerated. Visceral endoderm contributes to the extraembryonicplacental structures, while definitive endoderm gives rise to liverpancreas and other internal organs. Although many genes such asAlb and A1AT are expressed by both visceral and definitive endo-derm, one gene that has been reported to be specific for definitiveendoderm is CYP7A1 (38). This gene is located on the endoplasmicreticulum and encodes cholesterol 7-alpha hydroxylase, an enzymeinvolved in the conversion of cholesterol to bile acids in hepatocytes(39). The detection of expression of CYP7A1 in amnion-derivedhepatocyte-like cells indicates that the AE cells differentiate todefinitive endoderm. Other evidence of hepatic differentiationcomes from studies of the regulation of CYP7A1 in AE cells. Inthe liver, the synthesis of bile acids from cholesterol is controlled inpart by the regulation of the transcription of the CYP7A1 gene. Theexposure of human hepatocytes in culture to bile acids results in afeedback inhibition of CYP7A1 expression (40). We investigatedthe regulation of CYP7A1 expression in human AE-derived hepa-tocyte-like cells exposed to chenodeoxycholic acid (CDCA). Thequantitative real-time reverse transcription-polymerase chain reac-tion (RT-PCR) data indicate that CYP7A1 expression is specificallydownregulated by bile acid exposure (Fig. 13.7). It is interestingthat along with CYP7A1, bile salt export pump (BSEP) expression isalso reduced by exposure to bile acids.
Data presented in Table 13.1 show a partial list of the liver-specific or liver-enriched genes whose expression was detected incultured AE cells exposed to differentiation conditions describedin Fig. 13.3. Results shown in Table 13.1 were generated byquantitative real-time RT-PCR or gene array studies. In additionto the expression CYP7A1, the expression of genes characteristicof mature human liver such as CYPs 1A2, 2B6 and 3A4 wasdetected. The wide range of hepatic genes detected in culturedAE, cells including the transcription factors, HNF4, C/EBP-alpha and beta, pregnane�receptor and constitutive androstane
Production of Hepatocyte-Like Cells from Human Amnion 161

receptor, all of the other CYP genes and genes encoding hepatictransport proteins (Table 13.1) provide additional evidence thatAE cells follow a pathway to definitive endoderm and authentichepatic differentiation. From the initial studies with the differen-tiation protocols provided here, the level of expression of themature liver genes such as the CYP enzymes range from approxi-mately 0.5 to 16% of the values normally expressed in maturehuman liver. We noticed that the levels of expression of theindividual genes are similar to those observed in human fetalliver at mid-gestation (18–22 weeks). Some genes are expressedpreferentially during the fetal period and decline in expressionfollowing birth. A well-known example of this type of patterncan be found with alpha fetoprotein (AFP) and Alb. Fetal liverexpresses high levels of AFP, but expression of this gene declinesrapidly after birth. Alb expression increases throughout gestationand remains high during adult life. Genes in the CYP3A familyshow a similar pattern to AFP and alb. Fetal liver expresses pre-dominantly CYP3A7, while mature liver expresses predominantly
Fig. 13.7. Absolute mRNA expression of CYP7A1 (A) and BSEP (B) in AE cells cultured inthe presence or absence of CDCA.
Table 13.1In vitro differentiation of hAE cells to hepatocyte-like cells
� Cytokeratines: 8, 18, 19
� Albumin, Alpha 1-antitrypsin, C-met
� CYP7A1
� HNF-1, HNF-4a, C/EBPa, C/EBPb, OATP, PXR, CAR, RAR,RXR and PPAR. . .
� CYP450 gene expressions: 1A2, 2B6, 2C8, 2C9, 2C19, 2D6, 3A4,3A7 and 7A1
162 Miki et al.

CYP3A4 (41–43). This is presented in a schematic form in(Fig. 13.8). In cultured AE hepatocyte-like cells, CYP3A7 com-prises approximately 60% of the total CYP3A gene expression.The expression of both CYP3A7 and CYP3A4 suggests that AEdifferentiates along a pathway similar to authentic fetal humanliver. The relative ratio of 3A4 to 3A7 suggests that cells areprogressing toward mature hepatocytes.
Other laboratories have reported similar observations of hepa-tic differentiation of AE cells (44). Longer and perhaps morecomplex differentiation and/or selection protocols will be neededbefore cells with a full adult liver phenotype are produced in vitro.Optimization of differentiation protocols requires the investiga-tion of multiple growth factors in dose–response type experi-ments. The number of possible combinations becomes quitelarge. We have employed a high-throughput, microscope-enabledinstrument to aid in the optimization of hepatic differentiationprotocols. Some select growth factors were screened for theirpotential to induce the nuclear translocation of HNF4-a with anArrayScan. The ArrayScan VTI (Cellomics, Pittsburgh, PA, USA)is an automated fluorescence microscopic with integrated imageanalysis and data management systems that allows high-contentscreening analysis on cultured cells. Naive AE cells (20�103 cellsper well) were plated on a 96-well plate. In the experimentssummarized in Fig. 13.9, cells were cultured 1 week with thegrowth factors, EGF, FGF-8, FGF-19, hepatocyte growth factor(HGF), OSM, DEX at concentrations from 6.25 to 400 ng/ml.Control cultures were not exposed to growth factors. Immuno-fluorescence analysis was performed with a rabbit anti-humanHNF-4a antibody and the corresponding Cy3-conjugated sec-ondary antibody. The fluorescent intensity of the nucleus wasmeasured and an equivalent size area of cytoplasm was measuredand quantified. From these data, a nuclear/cytoplasmic ratio canbe calculated to identify growth factor treatments that enhancenuclear localization of HNF4-a. Cell images (1,300/well) wereacquired. Results presented in Fig. 13.9 show that EGF is apotent inducer of the nuclear localization of HNF4-a and that
Fig. 13.8. The ratio of the expression of CYP3A4 to 3A7 RNA in adult and fetal liver and incultured AE cells induced to hepatic differentiation.
Production of Hepatocyte-Like Cells from Human Amnion 163

HGF also has a similar but smaller effect. These multiwell imageanalysis techniques allow the rapid analysis of multiple growthfactors and multiple concentrations of each in small-volumeassays. Such studies should shorten the time required to optimizedifferentiation protocols. In addition to in vitro studies, the trans-plantation of undifferentiated or partially differentiated AE cellsinto the liver of suitable recipients may provide a microenviron-ment, which more completely supports and instructs the hepaticdifferentiation of AE cells. Such studies are under way.
5. Evidence ofBipotential HepaticDifferentiation ofAE
The coexpression of AFP and cytokeratin 19 in AE cells is remi-niscent of a stage in hepatic development during fetal life wherethe liver is inhabited by bipotential progenitor cells, which cangive rise to both hepatocytes and bile ducts. The coexpression ofthese two genes in AE cells might suggest that they are bipotentialas well, and that in addition to hepatocytes, the generation of bileducts might also be possible. Attempts were made to inducedifferentiation of AE to biliary cells. Published reports indicatethat endothelial cells will undergo tube formation when plated ona substrate of matrigel followed by exposures to growth factorssuch as vascular endothelial growth factor (VEGF). AE cells were
Fig. 13.9. ArrayScan analysis was performed to investigate the effect of multiple growthfactors and the various concentrations of each growth factor. The localization of HNF-4aprotein was indicated by the nuclear/cytoplasmic ratio of fluorescent intensity.
164 Miki et al.

plated at low seeding density on matrigel-coated plates understandard growth conditions, which included EGF but specificallydid not include VEGF. The results of these experiments are shownin Fig. 13.10 Within 4 days, AE cells arranged themselves inclusters of cells connected by long tubes of cells. In these experi-ments, web formation was dependent on the presence of thematrigel substrate as these three-dimensional structures did notform on plastic or collagen-coated culture plates. Subsequentanalysis indicated that the tubes contain a rudimentary lumenand the cells react strongly with antibodies to cytokeratin 19(data not shown). The expression of the epithelial marker,CK19, clearly indicates that the duct-like structures are notendothelial, vascular structures. The observations of ductular for-mations of epithelial cells that express CK19 are consistent withthe differentiation of AE cells to biliary or pancreatic ducts. Addi-tional research is under way to determine if more mature epithelialducts with a large and complete lumen can be produced from AE,and if in addition to a physical similarity, the epithelial ductsexpress genes, proteins and functions common to biliary or pan-creatic ducts. If so, these ductular structures might be useful forreconstruction of extrahepatic biliary duct defects or the regen-eration of other ductular structures.
6. Conclusions
Data presented here and in previous reports clearly indicate thathuman term amnion contains cells with characteristics commonlyfound in pluripotent stem cells such as ES cells including theexpression of surface markers and genes that maintain pluripo-tency. In addition, AE cells display the ability to differentiate intocell types from all three germ layers, in vitro. In this report, we
Fig. 13.10. AE cells form web-like ductular structures on MatrigelTM-coated culture plates: ****A = 40x; B = ****100x.
Production of Hepatocyte-Like Cells from Human Amnion 165

present some initial studies to identify useful protocols to inducemesendodermal and subsequent endodermal differentiation ofAE cells to cells with hepatic characteristics. If effective and effi-cient procedures can be developed to induce hepatic differentia-tion and purify hepatocyte-like cells from AE cultures, these cellsmay become a useful and noncontroversial cell type for hepatocytetransplantation and regenerative medicine. If hepatocyte trans-plant procedures are to be employed on large numbers of patients,plentiful sources of hepatocytes for transplantation will be needed.Stem cell sources such as AE hold the promise of providing thesemuch-needed cells.
Acknowledgements
This research was supported in part by a grant from Pfizer, Inc.
References
1. Strom, S., Bruzzone, P., Cai, H., et al.(2006) Hepatocyte transplantation: clinicalexperience and potential for future use. CellTranspl 15, S105–S10.
2. Fisher, R. A., Strom, S. C. (2006) Humanhepatocyte transplantation: worldwideresults. Transplantation 82, 441–9.
3. Nakazawa, F., Cai, H., Miki, T., et al. (2002)in Proceedings of Falk Symposium, HepatocyteTransplantation, Vol. 126, pp. 147–58,Kouwer Academic Publishers, Lancaster,UK.
4. Mitry, R. R., Hughes, R. D., Dhawan, A.(2002) Progress in human hepatocytes: iso-lation, culture & cryopreservation. SeminCell Dev Biol 13, 463–7.
5. Strom, S., Fisher, R. (2003) Hepatocytetransplantation: new possibilities for therapy.Gastroenterology 124, 568–71.
6. Miki, T., Lehmann, T., Cai, H., et al. (2005)Stem cell characteristics of amniotic epithelialcells. Stem Cells 23, 1549–59.
7. Miki, T., Strom, S. C. (2006) Amnion-derived pluripotent/multipotent stem cells.Stem cell reviews 2, 133–42.
8. Davila, J. C., Cezar, G. G., Thiede, M., et al.(2004) Use and application of stem cells intoxicology. Toxicol Sci 79, 214–23.
9. Elwan, M. A., Sakuragawa, N. (1997) Evi-dence for synthesis and release of
catecholamines by human amniotic epithelialcells. Neuroreport 8, 3435–8.
10. Elwan, M. A., Ishii, T., Ono, F., et al. (1999)Evidence for the presence of dopamine D1receptor mRNA and binding sites in monkeyamniotic epithelial cells. Neurosci Lett 262,9–12.
11. Elwan, M. A., Ishii, T., Sakuragawa, N.(2003) Characterization of the dopaminetransporter gene expression and bindingsites in cultured human amniotic epithelialcells. Neurosci Lett 342, 61–4.
12. Sakuragawa, N., Thangavel, R., Mizuguchi,M., et al. (1996) Expression of markers forboth neuronal and glial cells in humanamniotic epithelial cells. Neurosci Lett 209,9–12.
13. Sakuragawa, N., Misawa, H., Ohsugi, K.,et al. (1997) Evidence for active acetylcho-line metabolism in human amniotic epithelialcells: applicable to intracerebral allograftingfor neurologic disease. Neurosci Lett 232,53–6.
14. Tamagawa, T., Ishiwata, I., Saito, S. (2004)Establishment and characterization of a plur-ipotent stem cell line derived from humanamniotic membranes and initiation of germlayers in vitro. Hum Cell 17, 125–30.
15. Ilancheran, S., Michalska, A., Peh, G., et al.(2007) Stem cells derived from human fetal
166 Miki et al.

membranes display multi-lineage differentia-tion potential. Biol Reprod 77, 577–588.
16. Kakishita, K., Elwan, M. A., Nakao, N., et al.(2000) Human amniotic epithelial cells pro-duce dopamine and survive after implanta-tion into the striatum of a rat model ofParkinson’s disease: a potential source ofdonor for transplantation therapy. Exp Neu-rol 165, 27–34.
17. Kakishita, K., Nakao, N., Sakuragawa, N.,et al. (2003) Implantation of human amnioticepithelial cells prevents the degenerationof nigral dopamine neurons in rats with 6-hydroxydopamine lesions. Brain Res 980,48–56.
18. Wei, J. P., Zhang, T. S., Kawa, S., et al.(2003) Human amnion-isolated cells nor-malize blood glucose in streptozotocin-induced diabetic mice. Cell Transplant 12,545–52.
19. In ’t Anker, P. S., Scherjon, S. A., Kleijburg-van der Keur, C., et al. (2004) Isolation ofmesenchymal stem cells of fetal or maternalorigin from human placenta. Stem Cells 22,1338–45.
20. In ’t Anker, P. S., Scherjon, S. A., Kleijburg-van der Keur, C., et al. (2003) Amniotic fluidas a novel source of mesenchymal stem cellsfor therapeutic transplantation. Blood 102,1548–9.
21. Prusa, A. R., Marton, E., Rosner, M., et al.(2003) Oct-4-expressing cells in humanamniotic fluid: a new source for stem cellresearch? Hum Reprod 18, 1489–93.
22. Tsai, M. S., Lee, J. L., Chang, Y. J., et al.(2004) Isolation of human multipotentmesenchymal stem cells from second-trime-ster amniotic fluid using a novel two-stageculture protocol. Hum Reprod 19, 1450–6.
23. Tsai, M. S., Hwang, S. M., Tsai, Y. L., et al.(2006) Clonal amniotic fluid-derived stemcells express characteristics of both mesench-ymal and neural stem cells. Biol Reprod 74,545–51.
24. De Coppi, P., Bartsch, G., Jr., Siddiqui, M. M.,et al. (2007) Isolation of amniotic stem celllines with potential for therapy. Nat Biotechnol25, 100–6.
25. De Coppi, P., Callegari, A., Chiavegato, A.,et al. (2007) Amniotic fluid and bone mar-row derived mesenchymal stem cells can beconverted to smooth muscle cells in the cryo-injured rat bladder and prevent
compensatory hypertrophy of survivingsmooth muscle cells. J Urol 177, 369–76.
26. Parolini, O., Alviano, F., Bagnara, G. P.,et al. (2007) CONCISE REVIEW: Isolationand Characterization of Cells from HumanTerm Placenta: Outcome of the First Inter-national Workshop on Placenta DerivedStem Cells. Stem Cells.
27. Miki, T., Marongiu, F., Ellis, E., et al. (2007)Isolation of amniotic epithelial cells. CurrentProtocols in Stem Cell Biology 1E.3, 1E.3.1–1E.3.9.
28. Alexander, J., Stainier, D. Y. (1999) A mole-cular pathway leading to endoderm forma-tion in zebrafish. Curr Biol 9, 1147–57.
29. Zoltewicz, J. S., Gerhart, J. C. (1997) TheSpemann organizer of Xenopus is patternedalong its anteroposterior axis at the earliestgastrula stage. Dev Biol 192, 482–91.
30. Woo, K., Fraser, S. E. (1997) Specification ofthe zebrafish nervous system by nonaxial sig-nals. Science 277, 254–7.
31. Darras, S., Marikawa, Y., Elinson, R. P., et al.(1997) Animal and vegetal pole cells of earlyXenopus embryos respond differently tomaternal dorsal determinants: implicationsfor the patterning of the organiser. Develop-ment 124, 4275–86.
32. D’Amour, K. A., Agulnick, A. D., Eliazer, S.,et al. (2005) Efficient differentiation ofhuman embryonic stem cells to definitiveendoderm. Nat Biotechnol 23, 1534–41.
33. D’Amour, K. A., Bang, A. G., Eliazer, S.,et al. (2006) Production of pancreatic hor-mone-expressing endocrine cells fromhuman embryonic stem cells. Nat Biotechnol24, 1392–401.
34. McLean, A. B., D’Amour, K. A., Jones, K. L.,et al. (2007) Activin a efficiently specifiesdefinitive endoderm from human embryonicstem cells only when phosphatidylinositol 3-kinase signaling is suppressed. Stem Cells 25,29–38.
35. Soto-Gutierrez, A., Kobayashi, N., Rivas-Carrillo, J. D., et al. (2006) Reversal ofmouse hepatic failure using an implantedliver-assist device containing ES cell-derivedhepatocytes. Nat Biotechnol 24, 1412–9.
36. Xiao, L., Yuan, X., Sharkis, S. J. (2006) ActivinA maintains self-renewal and regulates fibro-blast growth factor, Wnt, and bone morpho-genic protein pathways in human embryonicstem cells. Stem Cells 24, 1476–86.
Production of Hepatocyte-Like Cells from Human Amnion 167

37. Smith, J. R., Vallier, L., Lupo, G., et al.(2008) Inhibition of Activin/Nodal signal-ing promotes specification of humanembryonic stem cells into neuroectoderm.Dev Biol 313, 107–117.
38. Asahina, K., Fujimori, H., Shimizu-Saito, K.,et al. (2004) Expression of the liver-specificgene Cyp7a1 reveals hepatic differentiationin embryoid bodies derived from mouseembryonic stem cells. Genes Cells 9,1297–308.
39. Ellis, E., Goodwin, B., Abrahamsson, A.,et al. (1998) Bile acid synthesis in primarycultures of rat and human hepatocytes.Hepatology 27, 615–20.
40. Ellis, E. C. S. (2003) in Department of Med-icine, Karolinska Institute, Stockholm.
41. Yang, H. Y., Lee, Q. P., Rettie, A. E., et al.(1994) Functional cytochrome P4503A
isoforms in human embryonic tissues:expression during organogenesis. Mol Phar-macol 46, 922–8.
42. Schuetz, J. D., Beach, D. L., Guzelian, P. S.(1994) Selective expression of cytochromeP450 CYP3A mRNAs in embryonic and adulthuman liver. Pharmacogenetics 4, 11–20.
43. Wrighton,S.A.,Molowa,D.T.,Guzelian,P.S.(1988) Identification of a cytochrome P-450 in human fetal liver related to gluco-corticoid-inducible cytochrome P-450HLpin the adult. Biochem Pharmacol 37,3053–5.
44. Takashima, S., Ise, H., Zhao, P., et al.(2004) Human amniotic epithelial cellspossess hepatocyte-like characteristicsand functions. Cell Struct Funct 29,73–84.
168 Miki et al.

Chapter 14
Generation of Hepatocytes from Human Embryonic Stem Cells
Niloufar Safinia and Stephen L Minger
Abstract
Use of human hepatocytes for therapeutic and drug discovery applications is hampered by limited tissuesource and the inability of hepatocytes to proliferate and maintain function long-term in vitro. Humanembryonic stem (hES) cells are immortal and pluripotent and may provide a cell source for functionalhuman hepatocytes (1) Here we have outlined some of the protocols currently in use for the generation ofhepatocytes from hES cells.
Key words: Human embryonic stem (hES) cells and hepatocytes.
1. Introduction
Although liver transplantation has become an accepted treatment foracute and end-stage liver disease, the scarcity of organ donors limitsits potential. Transplantation of hepatocytes has, therefore, beenproposed as an aid and an alternative to whole-organ transplantation(2). Hepatocytes, derived from unused livers, have been transplantedinto the liver or ectopic sites such as the spleen and have been shownto support liver function. Although clinically used, deriving hepato-cytes by this means is also limited, meaning other sources for hepa-tocytes need to be found to enable wider use of the treatment.
One possibility to derive hepatocytes for transplantation is the useof embryonic stem cells. In the last 20 years, mouse ES cells haveserved as a major biological tool for studying early embryonic devel-opment (3). These pluripotent cells, isolated from the blastocyst-stage embryos, have been shown to differentiate into derivatives ofthe three embryonic germ layers. During in vitro differentiation,mouse ES cells have also been shown to develop into specializedsomatic cells, including hepatocytes (4, 5). The isolation of human
Anil Dhawan, Robin D. Hughes (eds.), Hepatocyte Transplantation, vol. 481� Humana Press, a part of Springer ScienceþBusiness Media, LLC 2009DOI 10.1007/978-1-59745-201-4_14 Springerprotocols.com
169

ES cells several years ago, however, expanded the potential of ES cellsas a source of cells not only for developmental studies but also for celltherapy(6). The pluripotency of human embryonic stem (hES) cellshas been proven both in vivo and in vitro. In vivo studies have shownthat injection of hES cells into immune-deficient mice can lead to thegeneration of teratomas, harboring all three embryonic germ layers(7). In vitro studies in which hES cells are aggregated in suspensioncultures leading to the formation of embryoid bodies (EBs) have beenshown to express molecular markers specific to the three embryonicgerm layers (8). Here, we have summarized some of the protocolscurrently in use for the differentiation of hES along a hepatocytelineage. In general, the methods of differentiation are divided intospontaneous and directed differentiation with the latter being sub-divided into two categories: addition of growth factors and hormonesand constitutive expression of hepatic transcription factors (3).
1.1. Generation of hES
Cells and ‘Directed’
Differentiation
As mentioned in the previous section, hES cells are pluripotent cellsderived from the inner cell mass of in vitro-fertilized human pre-implantation blastocysts. A study by Schuldiner et al. (9) in 2000examined the potential of eight different growth factors includinghepatocyte growth factor (HGF) and nerve growth factor (NGF) todirect the differentiation of hES cells in vitro. They showed that hEScells that had initiated development as EBs express a receptor foreach of the factors. Differentiation of cells along a hepatocyte lineagewas assessed by expression of cell-specific molecular markers.
1.2. Directed
Differentiation of hES
Cells Using Genetic
Selection
Directed differentiation of hES cells into hepatic-like cells was firstdemonstrated by Lavon et al. in 2004 (7). Using DNA microarrayanalysis they identified several genes expressed at high levels ineither fetal or adult liver cells. Most of these genes were also shownto be expressed in hES cells undergoing differentiation as EBs,and in order to further explore the hepatic differentiation patternof hES cells, they genetically engineered hES cells by placing thegreen fluorescent protein (GFP) reporter gene under the controlof the albumin promoter (7). The cells were then sorted from theheterogeneous population of differentiating human ES cells usingfluorescent activated cell sorting (FACs), and the population ofhepatic-like cells was expanded through the addition of variousgrowth factors. The protocol is outlined below.
1.3. Directed
Differentiation of hES
Cell Using Sequential
Growth Factor
Stimulation
An alternative means of directing hepatic differentiation is tosequentially induce differentiation first to definitive endoderm fol-lowed by directed differentiation into hepatic cells. Cai et al. (10)first used Activin A for 3 days to specifically direct undifferentiatedhES cells toward an endodermal cell fate. At this time, more than80% of cells expressed immunoreactivity for antigens indicative ofdefinitive endoderm. Targeted differentiation of definitive endo-derm to a hepatic lineage was achieved by the combined addition of
170 Safinia and Minger

the growth factors, FGF4 and BMP2, for 5 days. These primitivehepatic cells were further differentiated to mature functionalhepatocytes by the sequential addition of HGF, oncostatin M anddexamethasone. These cells were shown to have properties of func-tional human hepatocytes including the ability to secrete albumin,to store glycogen and to take up indocyanine green. These cells werealso shown to be capable of engraftment in the spleen and migrationinto the liver of immune-compromised CCl4-treated mice.
2. Materials
2.1. Cell Culture 1. Human ES cells [H9 clone (11)] were grown on mouse embryofibroblasts in 80% knockout DMEM, an optimized Dulbecco’smodified Eagle’s medium for ES cells (Gibco/BRL), 20%knockout SR, a serum-free formulation (Gibco/BRL), 1 mMglutamine (Gibco/BRL), 0.1 mM b-mercaptoethanol (Sigma),1% nonessential amino acids stock (Gibco/BRL), 4 ng/ml basicfibroblast growth factor (bFGF) (Gibco/BRL) and 103 units/ml leukaemia inhibitory factor (LIF) (Gibco/BRL).
2. 0.1% gelatin (MERCK) was used to cover tissue culture plates.
3. To induce formation of EBs, 107 hES cells were transferred byusing 0.1%/1 mM trypsin/EDTA (Gibco/BRL) to 100 mm2
low-adherence plastic petri dishes to allow their aggregationand to prevent adherence to the plate.
4. Human EBs were grown in the same culture medium, exceptin the absence of LIF and bFGF.
5. EBs were cultured for 5 days after which time they were dis-sociated with trypsin and plated on 100 mm2 tissue culture platecoated with 50 mg/ml fibronectin (Boehringer Mannheim).
6. Cells were grown in the presence of various factors including20 ng/ml hepatocyte growth factor (HGF) (R&D Systems,Minneapolis, MN, USA) and 100 ng/ml b-nerve growthfactor (b-NGF) (R&D Systems). Of note, all examined growthfactors were absent from the commercially available knockoutserum replacement in which the embryonic stem cells werecultured (Fig. 14.1).
Fig. 14.1. A schematic representation of the differentiation protocol (taken from ref.(9) with permission).
Generation of Hepatocytes from Human Embryonic Stem Cells 171

2.2. Reverse
Transcription-
Polymerase Chain
Reaction Analysis
1. Total RNA was extracted by using an Atlas Pure Total RNAlabeling Kit (Clontech, Franklin Lakes, NJ, USA).
2. cDNA was synthesized from 1 mg total RNA, by using anAdvantage RT-for-PCR Kit (Clontech).
3. cDNA samples were subjected to PCR amplification withDNA primers selective for human gene sequences.
4. For each gene, the DNA primers were derived from differentexons to ensure that the PCR product represents the specificmRNA species and not genomic DNA.
5. PCR was performed by using the Clontech AdvanTaq plus RT-PCR kit and by using a two-step cycle at 688C.
6. Primers were synthesized for the following human genes(specific to hepatocytes): albumin, a1-anti-trypsin and a-fetoprotein.
2.3. Analysis 1. Initially the presence of growth factor receptors was deter-mined at the stage when growth factors were to be added tothe culture (Fig. 14.2).
2. RNA from human ES cells, 5-day-old EBs and 10-day-olddifferentiated hES cells (DE) was isolated and analyzed byreverse transcription-PCR (RT-PCR) by using primers specificto receptors for the various growth factors.
3. The differentiation of hES cells induced by growth factors wasfurther examined by determining the expression of cell-specificgenes by using RT-PCR (Fig. 14.3 and see Note 1).
Fig. 14.2. Expression of receptors for various growth factors in human embryonic cells. RNA samples from ES cells,5-day-old EBs and 10-day-old DE cells were analyzed by RT-PCR for expression of specific receptors (taken from ref.(9)with permission).
172 Safinia and Minger
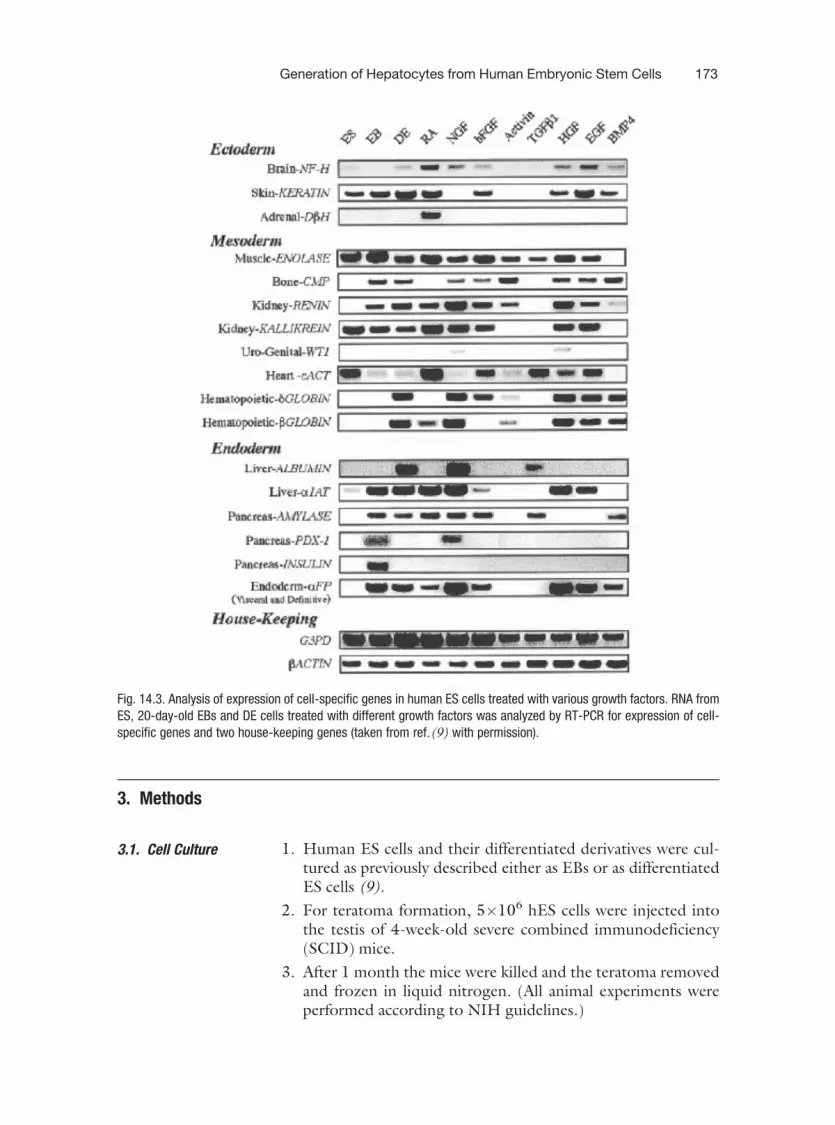
3. Methods
3.1. Cell Culture 1. Human ES cells and their differentiated derivatives were cul-tured as previously described either as EBs or as differentiatedES cells (9).
2. For teratoma formation, 5�106 hES cells were injected intothe testis of 4-week-old severe combined immunodeficiency(SCID) mice.
3. After 1 month the mice were killed and the teratoma removedand frozen in liquid nitrogen. (All animal experiments wereperformed according to NIH guidelines.)
Fig. 14.3. Analysis of expression of cell-specific genes in human ES cells treated with various growth factors. RNA fromES, 20-day-old EBs and DE cells treated with different growth factors was analyzed by RT-PCR for expression of cell-specific genes and two house-keeping genes (taken from ref.(9) with permission).
Generation of Hepatocytes from Human Embryonic Stem Cells 173

3.2. RT-PCR Analysis 1. Total RNA was extracted and 1 mg of RNA was reverse tran-scribed by random hexamer priming using an EZ-first StrandcDNA Synthesis Kit (Biological Industries, Kibbutz BeitHaemek, Israel).
2. cDNA samples were subjected to PCR amplification withDNA primers specific to the human genes using a pair ofoligomers, each from a different exon.
3. All RT-PCR experiments were performed under non-satura-tion conditions. (PCR conditions include a first step of 3 minat 948C, a second step of 20–30 cycles for 30 s at 948C, a 30-sannealing step at 60–62 and 45 s at 728C, and a final step of5 min at 728C
4. A description of primers and size of final products is describedin Table 14.1.
5. Final products were assessed by gel electrophoresis on 2%agarose ethidium bromide-stained gels and their identity wasverified through direct sequencing.
3.3. Plasmid
Construction
1. The ALB-eGFP expression vector was constructed by deletingthe CMV promoter sequence from peGFP-N1 (Clontech (12)and inserting the mouse albumin minimal promoter sequenceinto the Hin dIII restriction site.
Table 14.1Primers used for PCR and size of final products
Gene 5’ primer 3’ primer Size
APOA4 GTGGCAAGAAACTCCTCCAG CCTTCCCAATCTCCTCCTTC 353 bp
APOB ACCCGGAGAAAGATGAACCT GAAGAGGTGTTGCTCCTTGC 371 bp
APOH GCACTGAGGAAGGAAAATGG GGCCATCCAGAGAATATCCA 357 bp
APOF GGAAGCGATCAAACCTACCA ATCAGCCTGACAACCAGCTT 347 bp
FGA TCTCATCACCCTGGGATAGC AAAAGCCATCCTCCCAAACT 338 bp
FGB GGGAGAAAACAGGACCATGA ATTGGGGACTATTGATGTCC 312 bp
FGG GAATTTTGGCTGGGAAATGA TGTTCAGCACAGTTGCCTTC 314 bp
AFP AGAACCTGTCACAAGCTGTG GACAGCAAGCTGAGGATGTC 676 bp
ALB GTGAGACCAGAGGTTGATGTG CATTCATGAGGATCTGCAGCG 760 bp
ADHIC TGCAGGAATCTGTCGTTCAG GAAGGTGCTGACGCCGAC 312 bp
GAPDH AGCCACATCGCTCAGACACC GTACTCAGCGCCAGCATCG 302 bp
174 Safinia and Minger
2. The construct contained an SV40-driven neomycin selectablemarker, which confers resistance to G418 antibiotic.
3. Transfection and establishment of cell lines were performed aspreviously described (12).
3.4. Fluorescence-
Activated Cell Sorter
Analysis and Cell
Sorting
1. Analysis was performed on a FACSCalibur system (BectonDickinson, Franklin Lakes, NJ, USA) according to green fluor-escent emission for detection of enhanced GFP-positive cells.
2. Analysis was performed by CELLQUEST software (BectonDickinson).
3. Forward- and side-scatter plots were used to exclude dead cellsand debris from the histogram analysis plots.
4. The sorting of eGFP-positive cells was performed as describedpreviously (12).
3.5. Immunostaining 1. DE cells were washed several times and grown overnight withserum-free media in order to avoid cross-reaction with serumproteins.
2. The cells were then washed three times with saline and fixedonto the plate with 4% paraformaldehyde.
3. Either rabbit anti-human a-fetoprotein (Dako, Carpinteria, CA,USA) or monoclonal mouse anti-human albumin (Fitzgerald,Concord, MA, USA) was used as primary antibodies.
4. Secondary antibodies used included Cy-3-conjugated donkeyanti-rabbit IgG (H+L; Jackson ImmunoResearch, WestGrove, PA, USA) or CY-3-conjugated goat anti-mouse IgG(H+L; Jackson ImmunoResearch).
5. Teratomas were embedded in the OCT compound (SakuraFinetek USA Inc., Torrance, CA, USA) and 6 mm sections werestained using either anti-human albumin (Fitzgerald) or anti-a-cardiac actin (Maine Biotechnology Services Inc., Portland,ME, USA) antibodies.
3.6. Cytokine
Treatments
1. Twenty-four-day-old EBs were dissociated and plated as DEcells for an additional 10 days with or without growth factors.
2. Growth factors were added as follows: 100 ng/ml acidic fibro-blast growth factor (as previously described ref. (13); Boeh-ringer-Mannheim GmbH), 5 ng/ml bFGF (ref (13);Boehringer-Mannheim GmbH), 20 ng/ml HGF (ref. (14) ;R&D Systems) and 50 ng/ml bone morphogenic protein 4(ref. (15) ; R&D Systems). Additionally, conditioned mediumfrom cultured mouse hepatocytes was also used to influencehepatic differentiation (see Note 2).
3.7. Cell Culture 1. Human ES cells H1 and H9 were used in this study and werepropagated on irradiated mouse embryonic fibroblasts inDMEM/F12 medium containing 20% serum replacement,
Generation of Hepatocytes from Human Embryonic Stem Cells 175
1 mM glutamine, 0.1 mM b-mercaptoethanol, 1% nonessentialamino acids (all from Gibco/Invitrogen) and 4 ng/ml bFGF(Peprotech).
2. To induce endodermal differentiation, hES cells were propagatedin 1640 medium (Hyclone) supplemented with 0.5 mg/mlalbumin fraction V (Sigma) and 100 ng/ml Activin A for1 day. On day 2, 0.1% of insulin-transferrin-selenium (ITS,Sigma) was added to this medium and on the third day this wasincreased to 1% ITS.
3. To induce differentiation to a hepatic lineage, cells were thencultured in hepatocyte culture medium (Cambrex) supplemen-ted with 30 ng/ml FGF4 (Peprotech) and 20 ng/ml BMP2(Peprotech) for five days, with the media changed every day. Todemonstrate that both of these factors were required for hepaticdifferentation, 20 ng/ml Su5402 (FGF4-receptor antagonist,Chemicon) or 800 ng/ml Noggin (BMP inhibitor, R&D Sys-tems) was used in combination with FGF4 and BMP2.
4. To further differentiate hepatic cells to functional hepatocytes,cells were then propagated in 20 ng/ml HGF (Peprotech) for5 days and then in 10 ng/ml Oncostatin M (R&D Systems)and 0.1 mm dexamethasone (Sigma) from then onwards.
3.8. RT-PCR Analysis 1. Total RNA was extracted by using TRIzol reagent (Invitrogen).
2. cDNA was synthesized from total RNA, by using the reversetranscription kit (Promega).
3. cDNA samples were subjected to PCR amplification withDNA primers (Table 14.2).
4. RT-PCR was performed by using the EXTaq polymerase andthe following programe conditions: first step of 5 min at 948C,35 cycles for 30 s at 948C, a 30-s annealing step at 50–578C and30 s at 728C, and extension for 10 min at 728C.
3.9. Real-Time
RT-PCR
1. Real-time PCR was performed on an ABI Prism 7300 SequenceDetection System.
2. Reaction conditions consisted of 12.5 ml SYBR Green PCR Mas-ter Mix (ABI), 0.8 ml 10 mm forward and reverse primers, 10.4 mlwater and 0.5 ml template cDNA in 25 ml reaction volume.
3. Reaction conditions were programed for 2 min at 508C, 10 min at958C, followed by 40 cycles of 15s at 958C and 1 min at 608C.Relative expression levels were normalized against the b-actin gene.
3.10. Immuno-
fluorescence
1. Cells were fixed with 4% paraformaldehyde in phosphate-buf-fered saline (PBS) at room temperature for 20 min.
2. Non-specific antibody binding was inhibited by incubating thecells in 0.1% Triton X-100, 10% horse serum and 1% bovineserum albumin at room temperature for 1 h.
176 Safinia and Minger

Table 14.2Primers and Conditions Used for RT-PCR
Genename Primer sequence
Product length(bp)
Annealing temperature(�C)
AFP Sense:TTTTGGGACCCGAACTTTCC
Antisense:CTCCTGGTATCCTTTAGCAACTCT
451 56
Alb Sense:GGTGTTGATTGCCTTTGCTC
Antisense:CCCTTCATCCCGAAGTTCAT
502 56
CK8 Sense: GGAGGCATCACCGCAGTAC
Antisense:TCAGCCCTTCCAGGCGAGAC
472 56
CK18 Sense:GGTCTGGCAGGAATGGGAGG
Antisense:GGCAATCTGGGCTTGTAGGC
460 56
G6P Sense:
GCTGGAGTCCTGTCAGGCATTGCAntisense:TAGAGCTGAGGCGGAATGGGAG
350 56
AAT Sense:ACATTTACCCAAACTGTCCATT
Antisense:GCTTCAGTCCCTTTCTCGTC
183 56
HNF4a Sense: CCACGGGCAAACACTACGG
Antisense:GGCAGGCTGCTGTCCTCAT
290 56
PEPCK Sense: CTTCGGCAGCGGCTATGGT
Antisense:TGGCGTTGGGATTGGTGG
383 50
TDO2 Sense: TACAGAGCACTTCAGGGAG
Antisense:CTTCGGTATCCAGTGTCG
285 50
TAT Sense: CCCCTGTGGGTCAGTGTT
Antisense:GTGCGACATAGGATGCTTTT
345 56
Cyp7A1 Sense:GTGCCAATCCTCTTGAGTTCC
397 57
Generation of Hepatocytes from Human Embryonic Stem Cells 177

3. Cells were incubated in primary antibody overnight at 48C.
4. Cells were washed five times with PBS and FITC- or TRITC-conjugated secondary antibodies (1:150 dilution, Santa Cruz)were applied for 1 h at 378C.
5. 1 mg/ml DAPI (Roche) was used to counterstain the nuclei ofeach cell.
6. Primary antibodies included Sox 17 (R&D Systems), HFN3b(Upstate), CK-7, CK-18, CK-19, AAT (all from Invitrogen),a-fetoprotein and albumin (both from Dako).
3.11. Albumin
Secretion
The concentration of albumin secreted into the tissue culture med-ium was quantified by ELISA using a Human Albumin ELISAQuantitation Kit (Bethyl Labs) with the values normalized to totalcellular protein content (Micro BCA Protein Assay Kit, Pierce).
3.12. Transplantation
of hES-Derived
Hepatic Cells
1. Ten-week-old female SCID mice were used in this study. Allprocedures were approved by the Peking University Institu-tional Animal Care and Use Committee.
2. One day prior to transplantation, each animal was adminis-tered 10 ml of CCl4 diluted 1:10 in sterilized mineral oil.
3. Approximately 100 ml of DMEM containing one million hepaticcells differentiated for 18 days were injected into the spleen ofrecipient animals. Control animals received an equal volume ofDMEM alone. Animals were killed 8 weeks post-implantation,the livers were isolated and embedded in OCT compound and7-mm-thick microtome sections were obtained for processing.
Table 14.2(continued)
Genename Primer sequence
Product length(bp)
Annealing temperature(�C)
Antisense:ACTCGGTAGCAGAAAGAATACATC
Cyp3A4 Sense: ATGAAAGAAAGTCGCCTCG
Antisense:TGGTGCCTTATTGGGTAA
267 56
Cyp2B6 Sense:AGGGAGATTGAACAGGTGATT
Antisense:GATTGAAGGCGTCTGGTTT
253 56
GAPDH Sense: AATCCCATCACCATCTTCCAntisense:CATCACGCCACAGTTTCC
382 56
178 Safinia and Minger

4. Transplanted human cells were identified by positive immu-noreactivity for anti-human nuclear antigen (Chemicon) andanti-human AAT protein (Invitrogen).
4. Notes
1. It is apparent from Fig. 14.3 that genes representative of livercells are already expressed in EBs and differentiated hES cells inthe absence of growth factors. The addition of NGF wouldappear to stimulate this expression pattern, although no quan-titative or functional data were presented to verify this. How-ever, this study is informative in demonstrating that hES cellsspontaneously differentiate into cells that express markers ofliver cells.
2. This protocol establishes conditions for the selection of highlyenriched populations of hepatic cells using gene transfer ofliver-specific promoter sequences and cell sorting technology.Conditioned medium from mouse liver hepatocytes wasshown to significantly enhance hepatic differentiation of EBsderived from hES cells suggestive of paracrine factors thatrequire further investigation.
3. This protocol follows one of the first successful reports of thesignificant enrichment of functional hepatic cells from hEScells using developmental cues to direct differentiation.
References
1. Rambhatla, L., Chiu, C-P., Kundu, P., et al.(2003) Generation of hepatocyte-like cellsfrom human embryonic stem cells. CellTransplant 12, 1–11.
2. Horslen, S. P., Fox, I. J. (2004) Hepatocytetransplantation. Transplantation 77,1418–1486.
3. Lavon, N., Benvenisty, N. (2005) Study ofhepatocyte differentiation using embryonicstem cells. J. Cell. Biochem. 96, 1193–1202.
4. Jones, E. A., Tosh, D., Wilson, D. I., et al.(2002) Hepatic differentiation of murineembryonic stem cells. Exp Cell Res 272,15–22.
5. Kania, G., Blyszczuk, P., Jochheim, A., et al.(2004) Generation of glycogen and albuminproducing hepatocyte-like cells from embryo-nic stem cells. Biol Chem 385, 943–953.
6. Reubinoff, B. E., Pera, M. F., Fong, C. Y.,et al., (2000) Embryonic stem cell lines fromhuman blastocysts: somatic differentiation invitro. Nat Biotechnol 18, 399–404.
7. Lavon, N., Yanuka, O., Benvenisty, N.(2004) Differentiation and isolation of hepa-tic-like cells from human embryonic stemcells. Differentiation 72, 230–238.
8. Itskovitz-Eldor, J., Schuldiner,M., Karsenti,D.,et al. (2000) Differentiation of humanembryonic stem cells into embryoid bodiescomprising the three embryonic germ layers.Mol Med 6, 88–95.
9. Schuldiner, M., Yanuka, O., Itskovitz-Eldor, J.,et al. (2000) Effects of eight growth factorson the differentiation of cells derived fromhuman embryonic stem cells. PNAS 97 (21):11307–11312.
Generation of Hepatocytes from Human Embryonic Stem Cells 179

10. Cai, J., Zhao, Y., Liu, Y., et al. (2007) Direc-ted differentiation of human embryonic stemcells into functional hepatic cells. Hepatology45, 1229–1239.
11. Thomson, J. A., Itskovitz-Eldor, J., Shapiro,S. S., et al. (1998) Science 282, 1145–1147.
12. Eiges, R., Schuldiner, M., Drukker, M., et al.(2001) Establishment of human embryonicstem cell-transfected clones carrying a mar-ker for undifferentiated cells. Curr Biol 11,514–518
13. Jung, J., Zheng, M., Goldfarb, M., et al.(1999) Initiation of mammalian liver devel-
opment from endoderm by fibroblastgrowth factor. Science 284, 1998–2003.
14. Schmidt, C., Bladt, F., Goedecke, S., et al.(1995) Scatter factor/ hepatocyte growthfactor is essential for liver development.Nature 373, 699–702.
15. Rossi, J. M., Dunn, N. R., Hogan, B. L.et al. (2001) Distinct mesodermal sig-nals, including BMPs from the septumtransversum mesenchyme, are requiredin combination for hepatogenesis fromthe endoderm. Genes Dev 15,1998–2009.
180 Safinia and Minger

Chapter 15
Isolation, In Vitro Cultivation and Characterisationof Foetal Liver Cells
Yue Wu, Chetan C. Shatapathy, and Stephen L. Minger
Abstract
Hepatocyte transplantation has recently become an efficient clinical method in the treatment of patientswith metabolic liver diseases. The shortage of donor cells remains an obstacle to treat more patients. Foetalliver tissues may therefore be useful as an alternative source of generating functional hepatocytes after invitro culture and maturation.
Key words: Foetal liver tissue, in vitro culture, clonal selection.
1. Introduction
Liver failure is a serious health problem in the world. Currently,liver transplantation is the ultimate therapy for people sufferingfrom end-stage liver diseases and liver-based metabolic diseases,but the scarcity of donor organs and the risk of surgical complica-tions involved further complicate this approach. In recent years,hepatocyte transplantation has become an attractive therapeuticalternative to liver transplantation (1–4).
The liver has the remarkable ability to massively regeneratefollowing injury until it almost regains its normal mass, and hepa-tocytes are capable of rapid proliferation and functional regainfollowing surgical resection (5). However, hepatocytes are notor-iously difficult to maintain and expand in vitro. The problemsinclude difficulties in identifying, isolating and culturing purecell populations, the limited proliferation capacity of culturedcells and their inability to retain a hepatic phenotype beyonda few passages (6). Mature hepatocytes, in particular, showlittle potential to grow in primary culture (7, 8), and even under
Anil Dhawan, Robin D.Hughes (eds.), Hepatocyte Transplantation, vol. 481� Humana Press, a part of Springer ScienceþBusiness Media, LLC 2009DOI 10.1007/978-1-59745-201-4_15 Springerprotocols.com
181

the influence of primary mitogens they enter into a limitednumber of divisions before de-differentiating with a rapid lossof tissue-specific genes (9), or degeneration (10). Besides, thepaucity of molecular markers and their variability dependingon culture conditions and cell preparation make identificationand quantification of adult liver stem cells difficult. Complexculture techniques are involved in the isolation and culture ofadult mouse liver progenitor cells and results in low yields ofproliferating epithelial cells that can generate hepatocyte-likecells (11).
Given the problems involved in the isolation, culture andmaintenance of adult liver cells in vitro, culture of foetal livertissue presents a good alternative experimental model to analysemechanisms of hepatic development and regeneration. Comparedto adult progenitor cells, foetal progenitor cells are comparativelyuncommitted and are at an early developmental stage. Moreover,their pre-immune character, higher telomerase activity and resis-tance to cryopreservation make them attractive candidates forinvestigating potential clinical applications.
Various protocols have been described for the isolation of liverprogenitor cells from newborn rodents (12–18) and from adult ratliver (19). Recently, protocols to isolate multipotent progenitorcells from human foetal liver have also been demonstrated (20,21). Here we describe protocols for isolating hepatic progenitorcells from both embryonic day 14 rats and human foetal livertissues, preferentially expanding and extensively replicating themin vitro in defined culture media, and generating pure clonalpopulations of cells derived from a single cell. The progenitorcells can be characterised by immunofluorescence, differentiatedinto mature hepatocytes using various differentiation protocolsand function of the mature hepatocytes confirmed by albuminassay.
2. Materials
2.1. Isolation and
Culture of Foetal Liver
Cells
1. Fischer rat 344 embryos, embryonic day 14.
2. Human foetal livers were obtained after termination of preg-nancy performed at 11–20 weeks of gestation, and with theinformed consent of mothers.
3. Dissection kit.
4. Isolation medium: Dulbecco’s Modified Eagle’s Medium/NUT MIX F-12 supplemented with 4 mM L-glutamine(Gibco) and 1.3 ml D-(þ)-glucose solution (450 g/l, Sigma).
182 Wu et al.

5. Growth medium: DMEM (Gibco) supplemented with 20%foetal bovine serum (FBS), 1% nonessential amino acid (Gibco),2 mM L-glutamine, 0.1 mM b-mercaptoethanol (Gibco) and1,000 U/ml leukaemia inhibitory factor (Chemicon).
6. 1� Ca2þ/Mg2þ-free phosphate-buffered saline (PBS, Gibco).
7. Collagen type IV (Sigma) from Engelbreth-Holm-Swarmmouse sarcoma. To make a stock solution, dissolve thepowder in 0.25% acetic acid for several hours at 2–88Cto a concentration of 1 mg/ ml. Dilute to 10 mg/ml inPBS for coating.
8. 0.25% trypsin solution (Gibco).
9. 70 mm nylon cell strainer (BD Biosciences).
10. Cloning cylinders (glass, 8 mm�8 mm, 150 ml, Sigma).
11. Freezing medium: growth medium with 10% dimethylsulfoxide (DMSO).
2.2. Immunocyto-
chemistry
1. Microscope coverslips.
2. PBS.
3. TBS-T: TBS with 0.1% Triton X-100 (Sigma).
4. Fixative: 4% paraformaldehyde (PFA). 8 g of PFA was dis-solved in 200 ml of PBS. The pH was adjusted to 7.0 byadding 150 ml of 10 N NaOH. The solution was stored atroom temperature.
5. Blocking solution: 5% milk solution in TBS-T. Weigh out themilk powder and then add TBS-T. Mix thoroughly ensuringall of the milk has dissolved.
6. Dilution buffer for immunofluorescence staining: 10 mMHEPES pH 7.5, 0.15 M NaCl.
7. Fluorescein-labelled goat anti-rabbit IgG (HþL) (VectorLaboratories) diluted 1:200 in dilution buffer.
8. Texas red-labelled mouse anti-guinea pig IgG (HþL) (VectorLaboratories) diluted in 1:200 in dilution buffer.
9. Mounting medium with DAPI (Vector Laboratories).
2.3. Albumin Assay 1. Rat albumin ELISA quantitation kit (Bethyl LaboratoriesInc., E110-125).
2. Coating buffer: 0.05 M carbonate-bicarbonate, pH 9.6.
3. Wash solution: 50 mM Tris, 0.14 M NaCl, 0.05% Tween 20,pH8.0.
4. Blocking (postcoat) solution: 50 mM Tris, 1% BSA, 0.05%Tween 20, pH8.0.
5. Sample/conjugate diluent: 50 mM Tris, 0.14 M NaCl, 1%BSA, 0.05% Tween 20, pH 8.0.
Isolation, In Vitro Cultivation and Characterisation of Foetal Liver Cells 183

6. Enzymesubstrate:TMB(3,30,5,50-tetramethylbenzidine,Sigma).
7. Stopping solution: 2 M H2SO4.
3. Methods
3.1. Tissue Culture
3.1.1. Isolation of
Foetal Rat Liver Cells
1. Harvest the Fischer rat 344 embryos at embryonic day 14(E14) by removing from the protective sac (see Note 1) andtransfer them to a 100 mm Petri dish (see Note 2).
2. Add sterile PBS into a 60 mm Petri dish.
3. Under a dissection microscope, open the abdominal cavity,remove the liver tissue, which is dark pink colour under theseptum transversum, and place it in sterile PBS.
4. Transfer all the liver tissues into a sterile 15 ml centrifuge tubecontaining 3 ml of PBS (see Note 3). Add 1 ml 0.25% trypsinsolution.
5. Mix thoroughly by gently flicking the tube. Incubate at 378Cfor 30 min with a gentle mixture every 10 min.
6. After digestion, add 6 ml isolation medium to inactivatetrypsin and pellet the cells by centrifugation at 100�g for5 min.
7. Aspirate the supernatant and resuspend the pelleted cellsin 10 ml isolation medium. Mix the cells by gently pipettingup and down 5–6 times. Centrifuge at 100�g for another5 min.
8. Remove the supernatant and add 10 ml isolation medium toresuspend the cells.
9. Triturate the cell solution 6–8 times gently with a flame-polished Pasteur pipette to make single cell suspension.
10. After any remaining large clumps of tissue have settled down,perform cell counting using a haemocytometer.
11. Place the cells in collagen IV pre-coated culture vessels at thedensity of 3,000 per cm2 and culture the cells in growthmedium.
12. Incubate the cells at 378C in 5% CO2.
3.1.2. Isolation of
Human Hepatoblasts
1. Transfer the tissue on ice in medium (see Notes 4 and 5).
2. Put the tissue into a 60 mm Petri dish in the hood using asterile forceps. Mince the tissue with a sterile surgical scalpelto pieces no larger than 1 mm3.
184 Wu et al.

3. Transfer the tissue into a 15 ml centrifuge tube. Add 3 ml PBSand 1 ml 0.25% trypsin solution.
4. Gently flick the tube to mix thoroughly. Incubate at 378C for30 min with a gentle mixture every 10 min.
5. After incubation, add 6 ml isolation medium and pellet thecells by centrifugation at 50�g for 5 min.
6. Remove the supernatant and resuspend the pellet with 10 mlisolation medium. Mix the cells by gently pipetting up anddown 5–6 times. Centrifuge at 50�g for 5 min.
7. Aspirate the supernatant and add 10 ml isolation medium toresuspend the cells.
8. Triturate the cell solution 6–8 times gently with a flame-polished Pasteur pipette to make single cell suspension.
9. Filter the cell suspension using a 70 mm cell strainer.
10. Perform cell counting using a haemocytometer.
11. Place the cells in collagen IV pre-coated culture vessels at thedensity of 20,000 per cm2 and culture the cells in the growthmedium.
12. Incubate the cells at 378C in 5% CO2. Check the cells underan invert phase-contrast microscope every day (Fig. 15.1).
3.1.3. Cloning of Foetal
Liver Progenitor Cells
1. To clone the cells with cloning ring (see Note 5), cells arefirst dissociated using trypsin followed by centrifugation(see Section 3.1.4).
2. Resuspend the cells with growth medium. Use a flame-polished Pasteur pipette to generate a single cell suspension.
3. Perform cell counting.
4. Seed the dissociated cells on the collagen IV pre-coated 6-wellplates at 5,000, 2,000, 1,000, 500, 200 and 100 cells/well
Fig. 15.1. Appearance of human foetal hepatoblasts 1 day after isolation. Phase-contrast micrograph (magnification, �100).
Isolation, In Vitro Cultivation and Characterisation of Foetal Liver Cells 185

(see Note 6). Culture the cells in growth medium at 378C in5% CO2.
5. Inspect the cells under the inverted microscope 1–3 days afterplating and a 2-day interval thereafter.
6. Mark the position of colonies that appear to have arisen froma single cell and are well separated from other cells.
7. Place a cloning cylinder with silicone grease at the bottomaround a marked colony and press it down using sterileforceps (see Note 7and 8).
8. Remove the medium inside the cloning cylinder and wash thecolony once with 150 ml sterile PBS.
9. Remove PBS and add 100 ml of 0.25% trypsin solutionand leave on the cells for a few seconds. Remove most of thetrypsin solution and incubate the plate at 378C. Inspect thecells periodically to monitor the detachment process.
10. When the cells are detached from the substrate, add 150 ml ofgrowth medium to the cloning cylinder to neutralise thetrypsin. Resuspend the cells by pipetting up and down gently.
11. Transfer the cell suspension to a new well of a collagen IVpre-coated 6-well plate (see Note 9).
12. Subculture the cells into a 25-cm2 flask when the cells reach80% confluence, and subsequently into a 75-cm2 flask.
13. For long-term storage, the cloned cells can be frozen in liquidnitrogen (see Section 3.1.5).
3.1.4. Maintenance
and Subculture
1. Maintain the cells in growth medium. Change the mediumevery other day.
2. Check the cells under an invert phase-contrast microscopeevery day.
3. Passage the cells when they reach 90% confluence (see Note 10).
4. Remove the culture medium and wash the cells with 10 ml(for a T75 flask) Ca2+/Mg2+-free PBS.
5. Remove PBS and add 3 ml 0.25% trypsin solution. Put theflask back to the incubator for 5 min.
6. Monitor progress of dissociation under an invert phase-contrastmicroscope.
7. When the cells are released from the substrate, add 7 mlgrowth medium to inhibit trypsin.
8. Pellet the cells by centrifugation at 100�g for 5 min.
9. Resuspend the cells with growth medium by pipetting up anddown.
10. Aliquot the cell suspension into new culture vessels at a 1:3ratio.
186 Wu et al.

3.1.5. Storage of Foetal
Liver Cells
3.1.5.1. Freezing and
Storage
1. Detach the cells as for subculture with 0.25% trypsin solution.
2. Add growth medium and centrifuge at 100�g for 5 min.
3. Resuspend the cells with freezing medium at a concentrationof 2�106 viable cells/ml.
4. Transfer 1 ml of cell suspension into each cryovial.
5. Package the vials with tissue paper and place them into apolystyrene foam box for insulation. Transfer the vialsto –808C to allow to cool down slowly.
6. The following day, transfer the vials to liquid nitrogen.
3.1.5.2. Thawing 1. Retrieve the vials from liquid nitrogen.
2. Immerse immediately in 378C water with gentle agitation topromote rapid thawing of the cells.
3. Transfer the defrosted 1 ml cells into a 15 ml centrifuge tube.Add 9 ml growth medium drop by drop with gentle shaking.
4. Centrifuge at 100 g for 5 min. Resuspend the cells in 1 ml pre-warmed growth medium.
5. Transfer the cells to a collagen IV pre-coated 25-cm2 tissueculture flask containing 6 ml pre-warmed growth mediumand incubate at 378C in 5% CO2.
6. Subculture when the cells are in exponential growth phase.
3.2. Characterisation
3.2.1. Fluorescence
Immunocytochemistry
1. Culture the cells on collagen IV pre-coated glass coverslips(see Note 11).
2. Aspirate the culture medium and wash the cells with PBS. Fixthe cells in 4% PFA for 30 min at 48C.
3. Aspirate PFA, wash the cells with PBS once.
4. Aspirate off the PBS. Pipette 0.5 ml of TBS into each well(see Note 12).
5. Aspirate the TBS, and repeat once.
6. Pipette 0.5 ml TBS-T and leave at room temperature for30 min (see Note 13).
7. Aspirate off TBS-T. Add 0.5 ml of milk solution to each welland incubate for 30 min at room temperature.
8. Make up the necessary amount (0.5 ml/well) of primaryantibody in milk solution on ice (see Note 14).
9. Add 450 ml of the antibody solution to each well and incubateat 48C overnight.
Isolation, In Vitro Cultivation and Characterisation of Foetal Liver Cells 187

10. The next day, aspirate off the primary antibody.
11. Add 0.5 ml of TBS-T to each well. Aspirate off.
12. Add 0.5 ml of TBS-T to each well. Leave for 15 min.
13. Aspirate off. Wash as above (12) twice more.
14. Make up 0.5 ml/well of the appropriate secondary antibodysolution on ice. Add 450 ml to each well and incubate at roomtemperature for 1 h (see Note 15).
15. Aspirate off the secondary antibody.
16. Repeat stages 11 and 12, but use TBS instead of TBS-T.
17. Mount the coverslips with mounting medium with DAPI.
18. Examine slides for specific staining using the fluorescencemicroscope.
3.2.2. Albumin Assay 1. Trypsinise the cells and determine the cell number using ahaemocytometer.
2. Seed the cells on collagen IV pre-coated 24-well plates at afinal density of 1�105 cells/well in 0.5 ml growth medium.
3. Incubate the cells at 378C in 5% CO2 for 24 h.
4. Collect the medium from each well and measure the totalvolume from each well to compensate the evaporation duringthe culture.
5. The concentration of albumin in the collected medium can beanalysed using a rat albumin ELISA quantitation kit immedi-ately after collection or store the medium at –208C for later use.
6. Carry out the assay in a flat-bottom 96-well plate at roomtemperature.
7. Coat each well with 1 ml sheep anti-rat albumin affinity pur-ified antibody (supplied with the kit) diluted in 100 ml coatingbuffer for 1 h.
8. Wash the wells with wash solution for three times.
9. Add 200 ml of blocking (postcoat) solution into each well andincubate the plate for 30 min.
10. After three-time wash, transfer 100 ml of standard or 200 ml ofthe samples to the assigned wells and incubate for 1 h.
11. To detect the signals, dilute HRP-conjugated detection anti-body (1 mg/ml, supplied with the kit) in conjugate diluent in1:40,000 and add 100 ml of the detection antibody solutiononto each well. Incubate the plate for 1 h.
12. Use TMB as the enzyme substrate. Transfer 100 ml of TMBonto each well and incubate for 30 minutes.
13. To stop the reaction, add 100 ml of 2 M H2SO4 to each well.
14. Read the plate by a microtiter plate reader at 450 nm.
188 Wu et al.
4. Notes
1. Rats should be maintained and treated according to ethicalstandards and specific regulations for animal care. To removethe embryos, animals are killed by cervical dislocation andshould be cleaned with disinfectant. Use sterile tools forremoval of embryos.
2. Always keep the embryos on ice during transportation. Putthe embryos on ice block or the fridge if not performingdissection immediately.
3. Use a 5 or 10 ml pipette to transfer the liver tissue. To preventadhesion of liver tissues to the walls of the pipette duringtransfer, rinse the inner surface of the pipette once with PBSbefore transferring the liver tissues.
4. The use of human foetal tissue for experimental use should begoverned by a license from relevant regulatory authority andsubject to ethical approval.
5. Keep liver tissues on ice in Eagle’s minimal essential medium(EMEM) during transportation.
6. Alternatively, dilution cloning techniques can be used.Briefly, harvest the cells by trypsinisation followed by cen-trifugation at 100�g for 5 min. Resuspend the cells gentlyand dilute the cells to a concentration of 10 cells/ml. Plate100 ml of the cells into each well of a collagen pre-coated96-well plate. Culture the cells in growth medium.
7. Use at least three different cell densities to ensure that optimalsparse cultures can be obtained. Note that sparse culturesgrow less efficiently and more slowly.
8. Make sure that the colony is right in the centre of the ring.When the colony is already larger than the cloning ring, thering may be placed over some of the cells. For the largecolonies, make sure that they derive from single cells on thebasis of daily observation. In some cases, large colonies com-posed of cells from different close colonies thus are notmonoclonal.
9. Sometimes it is better to culture the cells in 24-well plates toenhance cell growth by low dilution time.
10. Do not allow the cells to form a confluent cell layer. In such acase, the cells are difficult to detach due to the stabilisinginfluence of the adjacent cells. And confluency usually leadsto morphology change of the cells, hence the phenotypicalteration, including the enhanced production of extracellu-lar matrix, increased doubling time, etc.
11. Do not allow the cells to exceed 80% confluence since over-crowding of cellsmakes it difficult to distinguish cell morphology.
Isolation, In Vitro Cultivation and Characterisation of Foetal Liver Cells 189
12. PBS buffer may be used instead of TBS buffer for all proteinsexcept for phosphorylated proteins.
13. TBS-T buffer contains Triton, which is used to permeabilise thecell membrane in order to examine intra-cellular markers. How-ever, to examine cell surface markers alone, TBS buffer (withoutTriton) may be used in place of TBS-T throughout the protocol.
14. Negative controls must be established for each secondaryantibody. This is achieved by staining one coverslip eachwith only the secondary antibody without addition of thecorresponding primary antibody.
15. Following the addition of fluorescent secondary antibody,avoid the exposure of coverslips to light to prevent degradationof fluorescence. Wrap the culture plates with aluminium foiland perform washes of the coverslips in the dark.
References
1. Fox, I. J., Chowdhury, J. R, (2004) Hepato-cyte transplantation. Am J Transpl 4, 7–13.
2. Hughes, R. D., Mitry, R. R., Dhawan, A.(2005) Hepatocyte transplantation for meta-bolic liver disease: UK experience. J Roy SocMed 98, 341–345.
3. Horslen, S .P., Fox, I. J. (2004) Hepato-cyte transplantation. Transplantation 77,1481–1486.
4. Mizuguchi, T., Mitaka, T., Katsuramaki, T.,et al. (2005) J Hepatobiliary Pancreat Surg12, 378–385.
5. Fausto, N. (2000) Liver regeneration. JHepatol 32, 19–31.
6. Bucher, N. L., Robinson, G. S., Farmer, S. R.(1990) Effects of extracellular matrix on hepa-tocyte growth and gene expression: implica-tions for hepatic regeneration and the repair ofliver injury. Semin Liver Dis 10, 11–19.
7. Block, G. D., Locker, J., Bowen, W. C., et al.(1996) Population expansion, clonal growth,and specific differentiation patterns in pri-mary cultures of hepatocytes induced byHGF/SF, EGF and TGF alpha in a chemi-cally defined (HGM) medium. J Cell Biol132, 1133–1149.
8. Runge, D., Michalopoulos, G. K., Strom, S.C., et al. (2000) Recent advances in humanhepatocyte culture systems. Biochem BiophysRes Commun 274, 1–3.
9. Reid, L. M., Jefferson, D. M. (1984) Cultur-ing hepatocytes and other differentiatedcells. Hepatology 4, 548–559.
10. Michalopoulos, G. K., DeFrances, M. C.(1997) Liver regeneration. Science 276, 60–66.
11. Azuma, H., Hirose, T., Fujii, H., et al. (2003)Enrichement of hepatic progenitor cells fromadult mouse liver. Hepatology 37, 1385–1394.
12. Williams, G. M., Weisburger, E. K.,Weisburger, J. H. (1971) Isolation andlong-term culture of epithelial-like cellsfrom rat liver. Exp Cell Res 69, 106–112.
13. Grisham, J. W. (1983) Cell types in rat liver:their identification and isolation. Mol CellBiochem 53, 23–33.
14. Neupert, G., Langbein, L., Karsten, U. (1987)Characterization of established epithelioid celllines derived from rat liver: expression of cyto-keratin filaments. Exp Pathol 31, 161–167.
15. Williams, G. M. (1976) Primary and long-term culture of adult rat liver epithelial cells.Method Cell Biol 14, 357–364.
16. Tsuchiya, A., Heike, T., Fujino, H., et al.(2005) Long-term extensive expansion ofmouse hepatic stem/progenitor cells in anovel serum-free culture system. Gastroen-terology 128, 2089–2104.
17. Tsuchiya, A., Heike, T., Baba, S., et al.(2007) Long-term culture of postnatalmouse hepatic stem/progenitor cells andtheir relative developmental hierarchy. StemCells 25, 895–902.
18. Yovchev, M. I., Grozdanov, P. N., Joseph, B.,et al. (2007) Novel hepatic progenitor cellsurface markers in the adult rat liver. Hepatol-ogy 45, 139–149.
190 Wu et al.

19. Furukawa, K., Shimada, T., England, P.,et al. (1987) Enrichment and characteriza-tion of clonogenic epithelial cells fromadult rat liver and initiation of epithelialcell strains. In Vitro Cell Dev Biol I 23,339–348.
20. Mahieu-Caputo, D., Allain, J. E., Branger, J.,et al. (2004) Repopulation of athymic mouse
liver by cryopreserved early human fetal hepa-toblasts. Hum Gene Ther 15, 1219–1228.
21. Dan, Y. Y., Riehle, K. J., Lazaro, C., et al.(2006) Isolation of multipotent progenitorcells from human fetal liver capable of differ-entiating into liver and mesenchymallineages. Proc Natl Acad Sci USA 103,9912–9917.
Isolation, In Vitro Cultivation and Characterisation of Foetal Liver Cells 191

Chapter 16
Human Intrahepatic Biliary Epithelial Cell Lineages:Studies In Vitro
Ruth Joplin and Stivelia Kachilele
Abstract
The human intrahepatic biliary epithelium is composed of a morphologically heterogeneous population ofepithelial cells. During liver cirrhosis, new biliary ductular structures develop at the portal margins thatexpress markers of immaturity such as CD56 and Bcl-2. These markers are also expressed transiently onimmature biliary duct precursors during embryological development; thus their reappearance duringcirrhosis suggests a recapitulation of ontogenesis during some liver conditions. Here we describe meth-ods, based on the differential expression of membrane markers, for separating immature biliary epithelialcells from those associated with mature ducts. We also describe two- and three-dimensional culturemodels for the maintenance of mature and immature populations in vitro. Both populations readilyestablish colonies in monolayer culture but only cells from mature ducts can be maintained in medium-term culture as serially proliferating, passageable cultures; immature cells deteriorate and detach within2–3 weeks of isolation. In three-dimensional collagen gel culture, both mature and immature populationsform duct-like structures with clearly definable lumena that persist for up to 6 weeks.
Keywords: Human intrahepatic biliary epithelial cell sub-populations, purification, culture.
1. Introduction
The intrahepatic biliary epithelium lines the system of conduitsthat extend from the Canals of Hering (the smallest ramificationsof the biliary tree) to the right and left hepatic ducts that unite toform the common hepatic duct at the porta hepatis (1). The biliaryepithelium is morphologically a heterogeneous tissue, showing agradation from small and somewhat flattened cells in the smallestcalibre ductules through cuboidal in interlobular ducts to tall andcolumnar in larger septal/segmental ducts (1,2). Morphologicalheterogeneity of biliary epithelial cells (BEC, or cholangiocytes) isreflected in phenotypic and functional heterogeneity, particularly
Anil Dhawan, Robin D. Hughes (eds.), Hepatocyte Transplantation, vol. 481� Humana Press, a part of Springer ScienceþBusiness Media, LLC 2009DOI 10.1007/978-1-59745-201-4_16 Springerprotocols.com
193
in some human liver diseases (2, 3, 4). Investigators with rodentmodels have successfully separated different cholangiocyte sub-populations based on morphological criteria (2). We have utilisedthe differential expression of membrane markers by different sub-sets of biliary epithelium to purify BEC sub-populations (4). Wehave also developed two- and three-dimensional culture modelsthat allow us to monitor lineage progression of mature and imma-ture BEC (iBEC) populations (5).
Here we describe methods for the immunomagnetic purifica-tion of separate mature and iBEC populations from the humanliver. Cells are purified by a sequence of enzymatic digestions,differential density centrifugation and immunological stages. Wealso describe methods for maintenance of the separated popula-tions in two- and three-dimensional culture models.
2. Materials
2.1. Separation of
Purified Mature and
Immature Human
Intrahepatic BEC
Populations
1. Autoclave sterilised equipment: 250 ml glass beakers, 0.5 mmmesh metal sieves (Sigma), glass (fine bore) Pasteur pipettes.
2. Tissue culture plastic ware; sterile large tissue culture dishes,10 ml and 15 ml conical base centrifuge tubes, 25 ml Universalcentrifuge tubes, plastic pipettes, plastic (wide bore) Pasteurpipettes, 10 ml syringes, 0.2 um syringe filters, scalpels.
3. Stock solutions: autoclave sterilised phosphate-buffered sal-ine (PBS – normal 1� and hypertonic 10� strengths preparedfrom commercially available PBS tablets).
4. Collagenase type 1A (Sigma) dissolved in normal PBS(10 mg/ml stock solution), stored as 5 ml aliquots at –208C.
5. Normal PBS, 1% w/v bovine serum albumin (PBS, 1% BSA –pH 7.4, filter sterilised).
6. Normal PBS, 0.1% w/v bovine serum albumin (PBS, 0.1%BSA – pH 7.4, filter sterilised).
7. 0.2 M Tris, 0.1% BSA (0.2 M Tris-HCl, 0.1% BSA – pH 8.5,filter sterilised).
8. Percoll density gradient media (Pharmacia Amersham Bio-tech) prepared as follows: Percoll stock solution; 99 mlsPercoll combined with 11 mls hypertonic (10�) PBS storedat 48C in glass bottles; 33% Percoll solution (1.04 mg/ml);33 mls percoll stock solution combined with 67 mls normal(1�) PBS; 77% Percoll solution (1.09 mg/ml); 77 mls ofPercoll stock solution combined with 23 mls normal PBS.
9. Magnetic beads: HEA125-conjugated microbeads (Miltenyi);CD56 Dynabeads prepared by conjugation of Dynal M-450
194 Joplin and Kachilele
tosylactivated Dynabeads with anti-CD56 antibody (pur-chased from Dako – see Section 3.3).
10. Magnetic particle concentrators: Magnetic particle concen-trator (Dynal, UK); MACS separator and large cell separationcolumns (Mitenyi).
2.2. Monolayer
Culture of Human
BECs
1. Tissue culture-treated plastic 25 cm3 flasks.
2. BEC plating medium composed of Dulbecco’s Modification ofEagle’s Medium (DMEM) 43.5% and Hams F12 medium43.5% (both from Gibco) supplemented with 10% foetal bovineserum heat inactivated for 45 min at 568C (HiFBS or humanserum can be used) and the following: 0.2 M glutamine, 5 mg/ml insulin, 400 ng/ml hydrocortisone, 10 ng/ml cholera toxin,10 ng/ml epidermal growth factor (all from Sigma) and anti-biotics (104 IU/ml each of penicillin and streptomycin).
3. BEC growth medium is of the same composition as platingmedium (point 2 above) but with only 5% HiFBS and supple-mented with 10 ng/ml recombinant human hepatocytegrowth factor (HGF).
4. Cell detachment solution for sub-culturing BEC; 0.25%trypsin/EDTA (Gibco), stored as 5 ml aliquots at –208C.
5. Cryopreservation solution; dimethylsulphoxide (DMSO; Sigmaand stored at room temperature). A fresh 20% DMSO solutionis made at each use by appropriate dilution of DMSO in DMEM.
2.3. Three-
Dimensional Culture of
Human BECs in
Collagen Gel
1. Type 1 collagen prepared from rats tails (see Section 3.5).
2. 0.1 % acetic acid.
3. 10� concentrated DMEM (Gibco).
4. 1 M NaOH; 0.1 M NaOH.
5. BEC plating medium (2.2 item 2 above).
6. Williams E Medium (Gibco).
3. Methods
Chronically diseased human liver (and experimentally damagedrodent liver) frequently contains numerous small biliary ductules(termed reactive ductules) that appear to arise as a generalresponse to cirrhosis. CD56 (neural cell adhesion molecule) is amembrane molecule transiently expressed on biliary epithelium ofthe ductal plate during embryological development and thusrepresents an indicator of immature phenotype (5,6). In cirrhoticdisorders, reactive ductules (but not mature ducts) express CD56but lack certain other maturation markers (5, 7); biliary ducts andductules in normal liver are negative for CD56 (CD56–ve). Thus
Human Intrahepatic Biliary Epithelial Cell Lineages: Studies In Vitro 195

reactive ductular cells in diseased human liver appear to undergo arecapitulation of ontogenesis, by expressing markers of immatur-ity. We have exploited this property of immature cells in diseasedhuman liver to devise methods for purifying mature and immaturepopulations of human BECs.
Human liver tissue is obtained through our liver transplanta-tion programme. Approximately 30 g liver tissue (see Note 1) isobtained with informed consent: (1) from patients undergoingorthotopic liver transplantation for end-stage liver disorders (seeNote 2); (2) from donor liver residual following graft size reduc-tion for transplantation to paediatric recipients (see Note 3).Donor organs for transplantation are perfused with University ofWisconsin preservation fluid and maintained on ice; diseased liverexplant samples are rapidly transferred to preservation fluid on ice.30 g (approximately) liver slices (both donor and explanted dis-eased organs) are obtained and immersed in DMEM tissue culturemedium and stored at 48C until use (see Note 4). All proceduresare undertaken in a sterile laminar flow cabinet unless otherwisestated. All centrifugations are at 800�g for 10 min with 3 minbreak unless otherwise stated (standard centrifugation).
3.1. Purification of
Human Intrahepatic
BECs
3.1.1. Preparation of
Liver Tissue Extract
1. A total of 30 g of liver tissue is finely diced (dice no less than1 mm3) using a pair of scalpels (see Note 5) and transferred to a250 ml sterile glass beaker containing 45 mls of normal (1�) PBS.
2. A 5 ml aliquot of collagenase type 1A is sterilised by passingthrough a 0.2 mm sterile syringe filter and added to the tissuedice. The dice is stirred to give a 2 mg/ml final collagenaseconcentration and incubated at 378C without stirring or shak-ing (see Note 5) for 1–2 h (see Note 6).
3. The beaker is removed from the incubator to a laminar flowcabinet and the digest sieved through a sterile 0.5 mm meshmetal sieve. The liquor containing detached cells is collectedinto a clean 250 ml beaker. Tissue pieces remaining in the sieveare gently manipulated using the plunger of a 10 ml syringe toencourage further release of cells.
4. Residual undigested dice are transferred to a clean tissue cul-ture dish and diced further with scalpels to encourage release ofcells from the cut surfaces (see Note 7). The dice and sievedliquor are recombined and returned to the incubator for afurther 30–60 min.
5. The contents of the beaker are strained through a clean sterile0.5 mm mesh metal sieve and the liquor containing detached
196 Joplin and Kachilele

cells collected into a 250 ml clean sterile beaker. The undi-gested tissue pieces are gently manipulated using the plungerof a 10 ml syringe while adding normal PBS to enhance thesieving process and wash further cells through the sieve andinto a total liquor volume of 200 mls.
6. A volume of 25 ml aliquots of liquor are decanted into eightuniversal centrifuge tubes and centrifuged at 800�g for10 min, break 3 min (standard centrifugation).
7. Supernatants are decanted and the pellets resuspended thor-oughly (see Note 8) combing two pellets into a single tube (togenerate four tubes) and standard centrifugation repeated.
8. Step 7 is repeated until all the pellets (liver extract pellet) arecombined in one universal tube in a volume of 24 mls.
3.1.2. Semi-
purification of BEC on
Percoll Density Gradient
Media
1. 3.5 ml of 33% Percoll is transferred into each of eight 10 mlcentrifuge tubes.
2. 3.5 ml of 77% Percoll is added by inserting the pipette tipbelow the 33% Percoll and pipetting the 77% Percoll beneathit very slowly and gently to minimise turbulence and mixing ofPercoll densities (see Note 9). This procedure results in aPercoll bi-layer with 33% Percoll floating on top of 77% Percoll(see Fig. 16.1).
3. Each of the eight Percoll gradients are gently overlayedwith 3–4 ml liver extract using a plastic Pasteur pipette (seeNote 10).
4. The tubes are centrifuged at 800�g for 30 min with nobreak, resulting in several discernible layers beneath the super-natant, in descending order these being: (1) a viscous floatingpellicle, partially characterised as containing hepatocytes,stellate cells, undetermined non-viable cells and sub-cellulardebris; (2) mononuclear cells including iBEC; (3) a range ofmononuclear cells partially characterised as containing endothe-lium, immune cells and BEC (approximately 10%); (4) 77%Percoll, cell content undetermined (no cells detected); and (5)erythrocye pellet (see Fig. 16.1).
5. From each Percoll gradient, the supernatant and layer 1 aregently removed using a plastic pipette and discarded to waste.
6. Layers 2 and 3 (approximately 3–4 ml) are collected from eachgradient and transferred to a conical base tube thus yielding eighttubes containing approximately 3–4 ml each (see Note 11).
7. The volume in each conical tube is adjusted to 10 ml by theaddition of normal PBS to dilute the Percoll and the cellsuspension is then standard centrifuged.
8. Supernatants are decanted and the pellets resuspended in0.5 ml normal PBS. The pellets are combined in a single tube
Human Intrahepatic Biliary Epithelial Cell Lineages: Studies In Vitro 197

and the original tubes washed thoroughly with normal PBSusing a fine bore glass Pasteur pipette to detach any residualcells from the tube wall (see Note 12).
9. The volume of cell suspension is adjusted to 10 ml and stan-dard centrifuged yielding a cell pellet containing BECs (pellet).
3.2. Immunomagnetic
Separation of Mature
and Immature Human
Intrahepatic BEC
Populations According
to Differential
Expression of CD56 by
Immature Cells
Separate iBEC and mature BEC (mBEC) populations are purifiedaccording to the differential expression of CD56 on BEC asdescribed by Fabris et al (4); here we describe recent minor mod-ifications to the magnetic separation stages of the process (seeNote 13). Briefly, semi-purified cells are obtained by differentialdensity centrifugation of liver homogenate on a Percoll gradient (asdescribed in Section 3.2 above). The total BEC fraction is purifiedusing a pan BEC membrane molecule, epithelial glycoprotein 34,which is recognised by the monoclonal antibody HEA125 (8).Using a HEA125-Miltenyi microbeads system, BEC from all sub-sets of bile ducts is obtained (see Note 13). Immature cells are thenpurified from the HEA125-positive (HEA125+ve) population bypositive selection of CD56+ve (conjugated to dynabeads) cells.Thus CD56/HEA125 double-positive (iBEC) and CD56–ve/HEA125+ve (mBEC) populations are obtained.
3.2.1. Preparation of
CD56-Conjugated
Dynabeads
1. At least 2 days in advance of cell isolations 4�108 tosylacti-vated Dynabeads are washed 3� in normal PBS, harvestingafter each wash by placing on a Dynal magnetic particle con-centrator for 2 min.
2. After the final wash the beads are combined with 500 mlanti-CD56 antibody and rotated slowly for 10 min at 378Cbefore addition of 50 ml of 1% PBS/BSA to give a final 0.1%BSA concentration.
3. Incubation is continued for a further 24 h at 378C with slowmagnetic stirring.
4. The labelled beads are harvested on a Dynal magnetic particleconcentrator for 2 min and washed 4�; washes 1 and 2 in
tnatanrepuS
noitcarfCEB-erp-elcillepgnitaolf-1reyaL
llocreP%33-2reyaLsllecraelcunonom-3reyaL
llocreP%77-4reyaL
tellepetycorhtyre-5reyaL
noitcarfCEB
noitcarfCEB-tsop
Fig. 16.1. The appearance of a Percoll gradient following centrifugation at 800�g for30 min is shown. Layers 2 and 3 contain biliary epithelial cells (approximately 10%) andare harvested for further purification of immature and mBEC populations by immuno-magnetic separation. The supernatant and fractions 1 and 4–6 are discarded. (see ColorPlate 14)
198 Joplin and Kachilele

PBS/0.1% BSA, 5 min each at 48C; wash thrice in Tris/0.1%BSA for 24 h at room temperature; wash four times in 0.1%PBS/BSA for 5 min at 48C.
5. After the final wash CD56-conjugated beads are stored inPBS/0.1% BSA at 48C (see Note 14).
6. Before use in cell separations an aliquot of the CD56-conju-gated Dynabeads (107 beads per cell preparation) is washed innormal PBS and resuspended in 0.5 ml normal PBS.
3.2.2. Separation of
Mature and Immature
Human Intrahepatic BEC
Populations
1. Purification of HEA125+ve cells. 40 ml HEA 125-labelledMiltenyi microbeads are added to the BEC pellet obtainedfrom layers 2 and 3 following semi-purification by differentialdensity centrifugation on Percoll (Section 3.2, step 9,above).
2. After thorough but gentle mixing, cells and beads are incu-bated at 48C (or on ice) for 30 min (see Note 15).
3. During the incubation (point 2 above), two large cell separationcolumns are placed in the magnetic field of a MACS separator(Miltenyi) and conditioned by running 2�1 ml of normal PBS(the suspension buffer of the cells) through the column.
4. After incubation with HEA125 microbeads the volume of thecell per bead suspension is adjusted to 15 ml with normal PBS.
5. A volume of 7.5 ml of cell per bead suspension is added to eachof the two columns and cell separation is performed (MiltenyiMACS). HEA125–ve cells elute into collection tubes below thecolumns while HEA125+ve cells are retained by the magnet.
6. Columns on the magnetic cell separator are washed 3� withnormal PBS, then removed and HEA125+ve cell per beadcomplexes eluted into collection tubes ensuring that all cellsare eluted by using the column plunger to propel the cellsdown the column (see Note 16).
7. The cell per bead complexes are resuspended in 30 ml normalPBS and distributed in 2�15 ml conical base centrifuge tubesand standard centrifuged for a final wash.
8. Purification of CD56+ve cells from the HEA125+ve fraction.Supernatants are decanted and the pellet containing cell perbead complexes resuspended in 0.5 ml normal PBS contain-ing 107 CD56-conjugated Dynabeads (see Section 3.3.1above) and incubated at 48C for 30 min with occasionalagitation of the tube (see Note 15).
9. The cells and beads are washed in 5 ml of cold normal PBSand placed on a Dynal magnetic particle concentrator for2 min after which the supernatant is gently decanted andretained. All residual supernatant is removed with a glassPasteur pipette and retained with the decanted supernatant(see Note 16).
Human Intrahepatic Biliary Epithelial Cell Lineages: Studies In Vitro 199

10. Normal PBS is added to the CD56+ve cells per dynabead andwashing (Step 9) is repeated to a total of three repeats afterwhich the CD56+ve per HEA125+ve cells (iBEC) are readyfor plating.
11. The decanted supernatants are standard centrifuged to yield aHEA125+ve per CD56–ve pellet (mBEC).
12. The cell per bead preparations is suspended in culture med-ium appropriate for subsequent culture and plated (please seebelow).
3.3. Monolayer
Culture of Human
BECs
Purified mature and iBEC are cultured separately as monolayersaccording to our standard protocol (5).1. The entire iBEC per mBEC preparations are seeded separately
into 25 cm2 tissue culture flasks in 5 ml of plating medium andallowed to adhere for 48 h at 378C, 5% CO2 in air (CO2
incubator) (see Note 17).
2. Plating medium is replaced by 5 ml of growth medium andculture continued with full medium replacement every 2–3days until the cells become confluent (see Note 18).
3. Once confluent mBEC are harvested for subculture (see Note 19and Fig. 16.2) by incubating with trypsin per EDTA, the cellsare washed thoroughly with normal PBS to remove all serum,and 1 ml of trypsin per EDTA is added. The cells are incubated at378C for 2–3 min with occasional agitation of the flask. Celldetachment is confirmed by phase contrast microscopy and 1 mlof HiFBS added to inactivate the trypsin and prevent further(damaging) digestive activity by trypsin and the detached cellsare washed by standard centrifugation in 25 ml DMEM.
4. For subculture the pellet is resuspended in 10 ml platingmedium for passage into 2�25 cm2 flasks (see Note 19).Cells are left to adhere overnight and plating medium isreplaced by growth medium the following day and culturecontinued as described above (point 2 above).
5. mBEC can be successfully frozen in and retrieved from liquidnitrogen following the second subculture (see Note 20). Afterdetachment with trypisn and standard centrifugation (step 3above), the cell pellet is resuspended at 2�106 cells per ml incold HiFBS and an equal volume of 20% DMSO is added drop-wise. The cells are rapidly distributed to freezing vials at 106 cellsper vial (1 ml aliquots) and frozen in the vapour phase of a liquidnitrogen tank overnight before transfer to the liquid phase.
6. For retrieval of mBEC from liquid nitrogen, aliquots arerapidly thawed by placing the vials in a beaker of water at398C and quickly transferring the thawed vials ascepticallyto a laminar flow cabinet. The thawed cells are transferredto 25 ml DMEM to dilute the DMSO and standard
200 Joplin and Kachilele

centrifuged. The culture is then re-established accordingto Step 4 above.
3.4. Preparation of
Collagen
1. Six rats’ tails are immersed in sterile normal PBS for 30 minthen stripped of connective tissue using pliers.
2. Excess PBS is drained and the connective tissue weighed.
3. 100 ml of 0.1% acetic acid are added per gram of wet weight ofconnective tissue and stirred in a sterile beaker for 2 days at 48Cafter which the solution is centrifuged at 800�g for 30 min.
4. The pellet is discarded and the supernatant sieved through asterile fine nylon mesh and stored at 48C until use (up to a year).
5. Aliquots of sieved supernatant are tested for sterility before usein cell culture by placing at 378C for 1 week and analysing formicrobial growth.
3.5. Culture of BEC in
Three-Dimensional
Collagen Gel
1. On ice 900 ml of collagen is combined with 100 ml 10�DMEM in a universal tube and mixed thoroughly; this givesan acidic solution with a yellow indicator colour.
2. 1 M NaOH is added dropwise with thorough mixing betweendrops until a neutral indicator colour is approached (see Note21). 0.1 M NaOH is then added dropwise with thorough mix-ing between drops until a neutral indicator colour is achieved.
3. A volume of 250ml collagen solution is added to the central wells ofa 24-well plate and allowed to gel at room temperature for 15 min.A volume of 1 ml of normal PBS is added to the outer wells of theplate to prevent dehydration of collagen in the inner wells.
CEBm
CEBi
erutlucreyalonoM erutlucD-3 erutlucreyalonoM
syad01syad5 syad02
a b dc
L
L
Fig. 16.2. The morphological appearance of separated immature BEC (iBEC) and mBECfractions maintained in vitro is shown. Freshly isolated mBEC cell clusters are generallylarger than iBEC clusters (around 20–100 cells vs 2–20 cells, respectively). Initially inmonolayer culture iBEC and mBEC cell clusters are indistinguishable (panel a), butwhereas mBEC develop proliferating colonies (panel b) that eventually become confluent(panel d) iBEC fail to establish and deteriorate and detach. In three-dimensional collagengel culture, hollow spherical and ductular structures develop from both iBEC and mBEC;these structures have a clear lumen (L) surrounded by polarised epithelium (panel c).
Human Intrahepatic Biliary Epithelial Cell Lineages: Studies In Vitro 201

4. Once gelling has occurred iBEC per mBEC preparations areseeded onto the top of the gels at approximately 104 per well(see Note 22) in 300 ml of plating medium.
5. The plates are incubated at 378C in 5% CO2 in air for 48 h afterwhich the gels are carefully but thoroughly washed with nor-mal PBS (see Note 23).
6. After washing the cells are overlaid with 250 ml of collagen byrepeating steps 1–3 above.
7. After gelling of the second collagen layer 300 ml serum-freeWilliams E culture medium are added and culture is continuedwith medium changing every 2–3 days (see Note 24).
4. Notes
1. Although we routinely use 30 g approximately of liver tissue,it is possible to obtain adequate cell yield for further studieswith as little as 5 g of tissue. Early attempts to adapt theprocedure for use with liver biopsy samples were unsuccessfulalthough we did succeed in culturing cells from biopsy frag-ments through an alternative approach (please see Ref. (9)for details).
2. We have successfully prepared m and iBEC from livers ofpatients with liver disorders including primary biliary cirrhosis(PBC), primary sclerosing cholangitis (PSC), alcoholic liverdisease (ALD), polycystic liver disease, biliary atresia andalpha 1 anti-trypsin deficiency.
3. As alternative sources of normal liver we have successfullyprepared mBEC from donor liver rejected for transplantationbecause of steatosis and uninvolved liver residual fromtumour resections. We have been unable to harvest iBECfrom normal liver, confirming our previous failure to identifyCD56 per HEA125 double-positive cells in normal liver (5).
4. Viable cells can be obtained following storage of tissue for upto 48 h. However, yield and viability of purified cells arecompromised after 24 h storage and the cell purificationprocess should commence as soon after organ harvest as ispractically possible.
5. We have experimented extensively with less time-consum-ing, labour-saving devices such as mincers, homogenisers,stirrers in an effort to automate the dicing process. We findthat such procedures release unacceptable amounts of fibro-tic material and other debris that subsequently interfere withthe purification process and compromise the purity of theisolated cells.
202 Joplin and Kachilele

6. The duration of enzymatic digestion depends of the degree offibrosis in the starting tissue. For tissue harvested from organdonors and which is relatively free of fibrosis we incubate for1 h initially while samples of fibrotic tissue such as from PBCor PSC are usually incubated for a maximum of 2 h at thisstage. A further incubation of 30–60 min in digestive enzymeis beneficial in releasing more cells depending on the degreeof fibrotic tissue remaining after the first incubation. Incuba-tion with collagenase beyond 3 h is damaging to cells andcounterproductive in terms of achievable yield.
7. We understand that the cells harvested are those that havebeen digested from the surface of the dice by the combinedactions of chemical and mechanical disaggregation (collage-nase and dicing). Therefore increasing the surface areaexposed to collagenase through effective dicing generally iseffective in maximising yield of BEC, without detrimentallyadding significantly to cell debris and fibrotic material in thefinal product.
8. A large, thick and sometimes viscous pellet is formed at thebottom of the tubes with a cloudy supernatant. Such pelletscan be difficult to disaggregate and cells may adhere to thebottom of the tube and require vigorous pipetting for ade-quate resuspension.
9. Good Percoll gradients can be achieved if 33% Percoll isunderlayed by 77% so that the 33% Percoll layer floats ontop of the 77% layer; attempts to overlay 77% Percoll on top of33% generally lead to excessive mixing of the two concentrations.
10. Liver extract should float on top of and not mix with the 33%Percoll layer. The gentler action of a wide bore plastic pipetteminimises mixing of liver extract with 33% Percoll.
11. It is important that only layers 2 and 3 are harvested;although collection of some 77% Percoll (layer 4) may beunavoidable this must be minimised. Contribution of exces-sive volumes of 77% to the cell suspension at this stage willresult in cells failing to pellet adequately at the subsequentcentrifugation, leading to poor yield of cells.
12. The pellets are quite sticky and may adhere to the tube wall.Initially we experimented with coated tubes but found thatwith thorough washing of the standard tube wall cell losscould be minimised and coated tubes offered no advantage.
13. In the study by Fabris et al, (4) we used different subclasses ofantibody as the basis of separation but recently amended theprocess in favour of utilising two different sizes of magneticbead: HEA125-conjugated microbeads require a high-per-formance Miltenyi MACS particle separator at the firstseparation. HEA+ve cells and microbeads are not able to
Human Intrahepatic Biliary Epithelial Cell Lineages: Studies In Vitro 203

bind to the Dynal magnetic particle concentrator used for har-vesting the larger beads used in the second separation. Thus twocell populations are harvested based on the size of the magneticparticle to which they are bound: (1) HEA125+ve/CD56–vecells using HEA125 microbeads; and (2) HEA125/CD56double-positive cells using Dynabeads. At the first incubation,with HEA125-conjugated microbeads, BEC from all subsets ofthe biliary tree are harvested; this total population can be usedfor studies in which separated sub-populations are not required.
14. CD56-conjugated Dynabeads can be stored in PBS/0.1%BSA for several months at 48C (we do not recommend freez-ing). After storage for more than 2 weeks we recommend two5 min washes in PBS/0.1% BSA before final suspension innormal PBS and use in cell purification.
15. Incubation with magnetic beads must be performed at 0–48Cto prevent phagocytic activity, which can lead to the contam-ination of purified cells by phagocytes that ingest beads atphysiological temperatures.
16. Thorough washing of the cell per bead complexes is requiredfor with complete removal of all cells unbound to beads, thusminimising contamination of purified HEA125+ve cells withHEA125–ve cells. Such HEA125–ve cells can become trappedin bead per cell complexes and efficient washing is essential torelease them and prevent reduced purity of the HEA125+veisolate.
17. We have found that 10% HiFBS in plating medium facilitatesadhesion of the cells. Some cell clusters may attach veryquickly but others take longer and we routinely allow 48 hto enable all those cells able to, to adhere; no advantage hasbeen found in allowing more than 48 h for adhesion to occur.
18. Cell clusters spread out during the first few days of culture andincrease in number. After around 7–14 days of culture somecells terminally differentiate and detach. There may be a briefperiod of apparent cell loss. It is important to persist with culturethroughout this phase as it is followed by the establishment ofcolonies in mBEC preparations (see Fig. 16.2), which respondto HGF in growth medium and proliferate to confluence usuallywithin 2–3 weeks (10); iBEC usually fail to establish confluentmonolayers and deteriorate after 2–3 weeks (see Fig. 16.2).
19. Cells at the first subculture are still vulnerable to terminaldecline if replated too sparsely. Cells should be split two waysat the first subculture followed by 1:4–1:8 at subsequentsubcultures depending on growth.
20. Cells frozen in liquid nitrogen after the first passage cannot besuccessfully retrieved, possibly because of the large number ofmagnetic beads still attached to the cells at this stage.
204 Joplin and Kachilele

21. It is usually possible to add 300–500 ml of 1 M NaOH beforesignificant increase in pH is achieved but all additions shouldbe cautious with thorough mixing in between as the solutioncan very quickly become too alkaline (purple indicator col-our) and need to be discarded. It is advisable to use a weakerNaOH solution as neutral pH is approached as a single dropof 1 M NaOH at this stage may result in excessive alkalinity.
22. The number of cells plated is very difficult to estimate as thecells are isolated in clusters and counting on a conventionalhaemocytometer is untenable. It is possible to disaggregatean aliquot of freshly isolated clusters completely by extensivedigestion with trypsin and to determine cell yield (found torange from 103–106 cells). Such trypsin digestions render thecells non-viable, and thus reduce the yield of cells available forsubsequent studies significantly.
23. Unattached cells and beads wash easily from the surface of mono-layer cultures during routine medium changes. However, afteraddition of the second layer of collagen, detached cells and beadsare trapped within the ‘‘sandwich’’. Therefore, thorough washingis essential before addition of the second collagen layer, to ensureremoval of as many beads and unattached cells as possible.
24. In the absence of added growth promoters both mBEC andiBEC form duct-like structures in three-dimensional collagenmatrix that show circular cross-sectional profile, polarisedepithelium and well-defined lumena (see Fig. 16.2). We rou-tinely culture iBEC and mBEC in collagen gels for periods ofbetween 2 and 6 weeks after which the cells are analysed byimmunocytochemistry or PCR. We have had no success withreleasing cells from the gels in a viable state for sub-culture.
Acknowledgements
The authors thank the Children’s Liver Disease Foundation forsupport, award no. NL 1739.
References
1. Desmet, V. J. (1985) Intrahepatic bile ductsunder the lens. J Hepatol 1, 545–59.
2. Alpini. G., Roberts, S., Kuntz. S. M. et al.(1996) Morphological, molecular and func-tional heterogeneity of cholangiocytes fromnormal rat liver. Gastroenterol 110, 1636–43.
3. Alpini, G., Glaser, S. S., Ueno, Y., et al.(1998) Heterogeneity of proliferative
capacity of rat chiolangiocytes after bile ductligation. Am J Physiol 247, 767–75.
4. Fabris, L., Strazzabosco, M., Crosby, H.,et al. (1995) Characterisation and isolationof immature atypical ductular cells co-expressing NCAM and Bcl-2 from primarycholangiopathies and ductal plate malfor-mations. Am J Pathol 156, 1599–1612.
Human Intrahepatic Biliary Epithelial Cell Lineages: Studies In Vitro 205

5. Ishida, Y., Smith, S., Wallace, L., et al. (2001)Ductular morphogenesis and functional polar-ization of normal human biliary epithelial cellsin three-dimensional culture. J Hepatol 35, 2–9.
6. Roskams, T., van den Oord, J. J., De Vos, R.,et al. (1990) Neuroendocrine features ofreactive ductules in cholestatic liver disease.Am J Pathol 137, 1019–25.
7. Crawford, J. M. (2004) Normal and abnormaldevelopment of the biliary tree, in (Alpini, G.,Alvaro, D., Marzioni, M., LeSage, G., LaRusso,N., eds.) The Pathobiology of Biliary Epithelia,pp. 1–27. Landes Bioscience, Georgetown, TX,
8. Momberg, F., Moldenhaur, G., Hammer-ling, G. H. (1987) Immunohistochemical
study of the surface expression of an Mr34000 human epithelium specific glycopro-tein in normal and malignant tissues. CancerRes. 47,2883–91.
9. Strain, A. J., Wallace, L, L., Joplin, R.,et al. (1995) Characterization of biliaryepithelial cells isolated from needle biop-sies of human liver in the presence ofhepatocyte growth factor. Am J Pathol146, 537–45.
10. Joplin, R., Hishida, T., Tsubouchi, H., et al.(1992) Human intrahepatic biliary epithelialcells proliferate in vitro in response to humanhepatocyte growth factor. J Clin Invest 90,1284–89.
206 Joplin and Kachilele

Chapter 17
Liver Cell Labelling with MRI Contrast Agents
Michel Modo, Thomas J. Meade, and Ragai R. Mitry
Abstract
Cell transplantation is a promising approach to improve the life of patients with liver disease. At present,however, techniques to track and visualise transplanted cells in patients are fairly limited and furtherdevelopment of non-invasive imaging technology is needed to advance the monitoring of liver cell grafts.Magnetic resonance imaging (MRI) is a non-invasive imaging technology that already allows the visualisa-tion of particular cell fractions in the liver by using MR contrast agents. The use of contrast agents to pre-label liver cells prior to transplantation will potentially provide a method to identify, track and study theintegration of engrafted cells non-invasively by MRI. Before this technique can find its clinical application,in vitro and pre-clinical in vivo studies need to be conducted to determine the safety and specificity of thisapproach.
Key words: Cell Transplant, liver, MRI, contrast agent, cellular MRI, gadolinium, iron oxide.
1. Introduction
The treatment of liver disease by cell transplantation promises tosave the lives of many patients. However, one of the obstacles sofar has been to identify, track and visualise the integration ofgrafted cells non-invasively in patients over many months. Livercell survival and its contribution to functional improvements ofthe liver are therefore difficult to assess.
Non-invasive imaging is needed to probe the liver repeatedly.Imaging techniques, such as magnetic resonance imaging (MRI),have developed sophisticated probes that allow the distinct visua-lisation of different cell fractions in the liver (1,2). Contrastagents, such as mangafodipir trisodium (Mn-DPDP, Teslascan),will integrate into all hepatocytes, whereas Gd-based agents (e.g.Gadoxetate) will only visualise mature hepatocytes. As in the caseof hepatomas, this difference between probes can therefore be
Anil Dhawan, Robin D. Hughes (eds.), Hepatocyte Transplantation, vol. 481� Humana Press, a part of Springer ScienceþBusiness Media, LLC 2009DOI 10.1007/978-1-59745-201-4_17 Springerprotocols.com
207

exploited to determine if immature highly proliferative hepato-cytes are present. In contrast, ferumoxides, such as Endorem, aretaken up and processed by Kupffer cells and can consequently beused to visualise the liver’s resident macrophages. The differencein cell uptake of MR contrast agents can hence also be used, forinstance, to study acute liver rejection (3).
Although these agents allow the specific imaging of different celltypes within the liver and help to determine if a particular cell typehas been replaced by grafting, these probes do not allow the distinc-tion between grafted and non-grafted cells. For this, MRI contrastagents need to be incorporated in vitro into the cells prior to theirtransplantation. Several types of contrast agents based on gadoli-nium, manganese or iron oxide have been described for cellulartracking (2). Currently, the most commonly used contrast mediaare ferumoxides. This is largely due to their superparamagneticrelaxation properties (i.e. the relaxivity effect is about 50 times largerthan the contrast particle) that allow the detection of even smallnumbers of cells (4). The use of micron-sized particles of iron oxide(MPIOs) even allows the visualisation of single cells by MRI (5).
The development of bimodal agents, i.e. probes that can bedetected by more than one imaging modality, provides a furtherdevelopment that is an efficient system to study the effectsof contrast agents in vitro, and also allows the corroboration of invivo imaging (6–8). Although these agents provide additionalbenefits over currently available clinical probes, at present theseagents are mainly used for experimental studies and will be requiredto undergo a stringent assessment prior to clinical approval. Clini-cally approved agents for liver imaging, such as Endorem or Teslas-can, might be more readily implemented into clinical protocolsas they are approved agents for liver imaging and in most caseswill provide sufficient flexibility to identify grafted cells. The clinicaltranslation of cellular MRI has recently been described with aclinical trial assessing Endorem-labelled dendritic cell placementin patients with lymphomas (9), therefore providing a precedentthat these agents can be safe for cellular imaging of implanted cells.
We here present the methodological framework in which theeffects of MRI contrast agent incorporation in liver cells can beassessed prior to progressing to in vivo experiments.
2. Materials
1. Williams’ medium E (cat no. W1878, Sigma, UK).
2. Foetal calf serum (cat no. F4135; 10%, v/v, Sigma, UK).
3. Penicillin/streptomycin (cat no. P0781; 10,000U/10 mgper ml, Sigma, UK).
208 Modo et al.

4. L-Glutamine (cat no. G7513; 5 ml of 200 mM, Sigma, UK).
5. Insulin (cat no. I1884; final concentration of 0.1 mM, Sigma,UK).
6. Dexamethasone (cat no. D8893; final concentration of 0.1mM, Sigma, UK).
7. Lipofectamine2000 (cat no. 11668, Invitrogen, UK).
8. Anti-dextran antibody (cat no. 10730, Stem Cell Technol-ogy, USA).
9. Trypan blue (cat no. 15250061, Invitrogen, UK)
10. Fluorescein diacetate (FDA) (cat no. D2650, Sigma, UK).
11. Ki67 (cat no. NCL-Ki67p, Novocastra, UK).
12. CyQuant (cat no. C7026, Invitrogen, UK).
13. 3-(4,5-Dimethylthiazol-2yl)-2,5-diphenyltetrazolium bro-mide, referred to as MTT (cat no. M2003, Sigma, UK).
14. [14C]-Leucine (cat no. CFB183, 1 ml of 1.85 MBq;Amersham International, Buckinghamshire, UK).
15. Packard FilterMate (Packard Instruments, Berkshire, UK).
16. Packard Matrix 9600 ß-counter (Packard Instruments,Berkshire, UK).
17. (5-and 6)-Chloromethyl-20,70-dichlorodihydrofluorescin dia-cetate, acetyl ester (CM-H2DCFDA) solution (cat no. c6827,Invitrogen, UK).
18. Endorem/Feridex (Guerbet, France/Berlex, USA).
19. Gadophrin-2 (Schering, Germany).
20. Multihance (Bracco, Italy).
21. Primovist (Schering, Germany).
22. Resovist (Schering, Germany).
23. Teslascan (Amersham, USA).
3. Methods
3.1. Cell Culturing and
Labelling
3.1.1. Cell Culturing Human hepatocytes are seeded onto collagen type I-coatedculture vessels, such as 96-well plates used for the functionalassays, and glass coverslips for confocal microscopy. After seed-ing, the cultures should be incubated overnight in a humidifiedincubator (378C, 5% CO2) prior to commencing the labellingprocedure.
Liver Cell Labelling with MRI Contrast Agents 209

1. Human hepatocytes are seeded at 50,000 cells in 200 mlWilliams’ medium E +supplements per well of collagen-coated 96-well plates.
2. The plates should be incubated overnight in a humidifiedincubator (378C, 5% CO2).
3. Cells are then labelled with the MRI contrast agent (seeSection 3.1.2).
3.1.2. Labelling The choice of contrast agent will depend on how many cells andwhich type of cell one intends to visualise after transplantation.Incorporation of clinically approved contrast agents that can beused for tracking grafted cells are Fe-based agents, Mn-basedagents or Gd-based agents (10).
Ideally, cellular MRI does not interfere with the generalassessment of liver pathology. The use of alternative nuclei forMR imaging, such as 19F, might therefore be exploited (11).However, these approaches often suffer from low signal-to-noiseratios. If only a small number of cells are transplanted, alternativenuclei might not produce sufficient signal to allow a reliabledetection.
Pinocytosis. Liver cells easily take up particular types of contrastagents. Labelling a particular cell population can therefore befacilitated by choosing the appropriate agent designed to betaken up by this type of cell. Some contrast agents with a smallmolecular weight, such as Gd-based agents, might also get takenup in vitro into the cells through fluid phase pinocytosis. For this:1. Culture cells according to standard protocol.
2. Following overnight incubation of cultures, the contrast agentis added at appropriate concentrations to fresh media andgently shake the culture to ensure good mixing of the contrastagent with the media. The concentration of contrast agent willdepend on the contrast agent and type of cell. Clinicallyapproved agents generally come in a prepared solution and itis recommended to start with three sets of concentrations 1:1,1:10 and 1:100. A further refinement of this dilution assay isneeded to determine the best molar concentration for celllabelling. Knowing the molar concentration will be importantto assess the relaxivity characteristics of the contrast agent.Typically, iron oxide-based agents will be in the range of mM,whereas Gd-based agents will be in the range of mM.
3. Duration of incubation. Certain cells, such as Kupffer cells,rapidly incorporate contrast agents and incubation times of<2 h can be sufficient for cell labelling. However, duration ofincubation also depends on the concentration of contrastagent in the media. The advantage of bimodal agents is thatduring this process, it is possible to assess cell uptake of thecontrast agent under an inverted fluorescent microscope.
210 Modo et al.

4. After sufficient contrast agent has been incorporated into thecells, wash the cells 3� with phosphate-buffered saline (PBS)before adding media for further experimentation.Transfection Agents. Although liver cells will easily take up
various contrast agents, in some cases it might be desirable,for instance, to label hepatocytes with iron oxide particles thattypically are not incorporated into these types of cells. Theuse of transfection agents can enable this process and ensuresufficient cellular uptake of particles to allow a reliable detec-tion. For this:1. Prepare transfection solution with 5 ml of Lipofecta-
mine2000 in 25 ml culture media for each well on a24-well plate.
2. Mix the contrast agent with transfection solution for 10 minon a shaker at room temperature. The contrast agent concen-tration will determine how much agent needs to be mixedwith the transfection agent. A typical guidance is about100 mg of ferumoxides to 5 ml of transfection agent.
3. Incubate for 2–3 h in a 1:1 mixture of serum-free media andtransfection agent-coated contrast agents. However, specificincubation times will depend on the contrast agent, the trans-fection agent and the type of cells.
4. Remove supernatant and wash cells three times with PBSbefore adding culture media for further experimentation.
3.2. Visualisation of
Contrast Agent Inside
Cells by Microscopy
3.2.1. Detecting Iron
Particles
Iron particles can be detected histologically by Perl’s stain (12).For this:1. Prepare Perl’s solution with 1.0 g of potassium hexacyanofer-
rate (ferrocyanide), 25 ml of distilled water, and 25 ml of 13%hydrochloric acid. This solution should be freshly prepared.
2. Wash cells or tissue with distilled water and add Perl’s solu-tion for 20–30 min
4. Wash cells or tissue with distilled water and add neutral red tothe tissue sections for 1–2 min. For cells, this step can beomitted as neutral red counterstains tissues in shades of red.
5. Rinse with tap water and dehydrate with graded alcohols (70,80 and 100%), clear and mount.
6. Ferric iron will appear blue.However, Perl’s stain detects all iron and therefore will also
pick up other cells that contain iron, such as macrophages orblood cells. Ideally, this method is therefore only used in vitro orin tissues that do not have cells that naturally contain large
Liver Cell Labelling with MRI Contrast Agents 211

quantities of iron. As liver tissue is generally used as a positivecontrol for Perl’s stain due to its naturally high content of iron, it isnot recommended to use this method to detect iron-based con-trast agents inside liver tissue.
3.2.2. Detecting
Contrast Agents Based
on Dextran
Many MRI contrast agents use dextran as a chelating agent and animmunocytochemical approach can therefore be used to specifi-cally detect dextran-based contrast agent:1. Label cells with a contrast agent.
2. Permeabilise cells or tissue with a 0.1% Triton X solution for5 min.
3. Rinse cells per tissue with PBS.
4. Add FITC-conjugated anti-dextran antibody at 1:1000 dilu-tion in PBS to the cells or tissue.
5. Rinse with PBS.
6. Counterstain all cell nuclei with DAPI or Hoechst.
7. The contrast agent will appear in green, whereas cell nucleiin blue.The green fluorescent signal should be clearly localised to
particles within the cells. If there is a diffuse staining or an absenceof staining, this could indicate that the dextran chelate is beingdowngraded within the cells or that there are no particles presentwithin this cells, respectively.
3.2.3. The Use of
Bimodal Agents
The use of bimodal contrast agents facilitates the visualisation ofcellular uptake. Due to the fluorescent moieties in these agents, itis possible to directly visualise the contrast agent as it is taken upinto the cells under an inverted fluorescent microscope. More-over, it is also possible to easily determine the cellular compart-ments within which the agent is trapped within the cells (13). Abimodal agent currently undergoing clinical development consistsof Gadophrin-2, which can be used to label liver cells for cellularimaging after transplantation (8). Bimodality might also refer toother combinations of imaging modalities and care should there-fore be taken that the appropriate imaging modalities can be usedto visualise the agent of interest. Examples of bimodal contrastagents labelling liver cells are presented in Fig. 17.1.
3.3. Assaying the
Effects of Contrast
Agents on Cell
Function
3.3.1. Cell Viability –
FDA
It is essential to measure the viability of the cells after cell labelling.Contrast agents contain metal particles that are rendered non-toxic through the use of chelating agents, such as dextran or
212 Modo et al.

albumin. Upon degradation of the protective coating, these metalparticles can affect cell viability. Moreover, overloading of the cellswith the contrast agent can also lead to deterioration in cellviability. However, it is not sufficient to just measure cell viabilitystraight after labelling, but ideally more protracted time pointsrelevant to transplantation paradigms should also be investigated.A variety of cell viability assays are commercially available, such astrypan blue marking all dead cells under brightfield or FDA tolabel all viable cells under fluorescence microscopy.
This test requires the use of the FDA stock solution (5 mg/mlin DMSO) (14) and cells must adhere to glass coverslips.1. Following labelling with an MRI contrast agent, remove the
culture medium and gently rinse twice with PBS.
2. Replace PBS with 200–300 ml medium containing FDA (2mg/ml; final concentration) and incubate the cultures for6 min at room temperature.
3. Remove medium and gently rinse twice with PBS.
4. Counterstain cell nuclei with DAPI or Hoechst.
5. Use a fluorescence microscopy to check for green fluores-cence in the cytoplasm of the viable cells only.
6. A quick semi-quantitative estimate of viable cells (green)could be carried out in e.g. five random fields. DAPI-stainednuclei could be counted as this will help in estimating theapproximate number of total cells in the counted field.
3.3.2. Cell Proliferation/
Mitochondrial Activity
Incorporation of contrast agents into cells will lead to their com-partmentalisation within the cells. As cells divide, the amount ofcontrast agent between cells will also decrease with time. How-ever, contrast agents can also affect the cells’ ability to proliferateby interfering with basic cell functions involved in mitosis. Either
Fig. 17.1. Visualisation of the MRI contrast agent. (A) Adult human hepatocytes beinglabelled with the bimodal Iron Oxide Green Oregon (IOGO) contrast agent (in green). Notethat some cells (cell nuclei in blue) are not labelled. It is noteworthy that the contrast agentseems strongly associated with the cell nuclei and does not fill the cytoplasm. It is likelythat mainly phagocytic Kupffer cells incorporated this agent, whereas unlabelled cellsrepresent a small fraction of undifferentiated hepatocytes. (B) In contrast, the GadoliniumRhodamine Dextran (GRID) bimodal agent (in red ) clearly labels the cytoplasm of cells thathave the appearance of immature hepatocytes and is incorporated into all types of cells.(see Color Plate 15)
Liver Cell Labelling with MRI Contrast Agents 213

the counting of proliferating cells based on the number of cells in aculture dish or the use of antibodies, such as Ki67, labelling alldividing cells can be used for this. Moreover, various commerciallyavailable assays, such as CyQuant, are available that assess variousaspects of proliferation and often are taken as a measure of pro-liferation. For instance, the MTT assay assesses mitochondrialactivity that is related to mitosis.
A commonly used assay to determine the overall cell meta-bolic activity based on mitochondrial dehydrogenases activityconsists of the MTT assay (15):1. Label cells with an MRI contrast agent.
2. Prepare the MTT assay solution with 5 mg/ml in PBS (pHadjusted to 7.2 and filtered through a 0.2 m filter). This solutioncan be stored in the dark at 48C for up to 2 weeks. (See Note 1.)
3. Dilute MTT solution in culture medium (1:10) and incubatewith cells for 4 h.
4. Remove media with MTT and place 20 ml of 0.25% trypsin perwell in a 96-well plate and place on a shaker for 5 min at highspeed.
5. Add 100 ml of isopropanol with 0.04 N HCl and place on ashaker for 15 min. This will dissolve the formazan.
6. Measure absorbance at 595–655 nm to quantify mitochon-drial activity.It is important to include appropriate control conditions
(such as no MTT and no contrast agent) and express fluorescenceabsorbance in relation to these controls. Results based on thisassay can be found in Fig. 17.2.
Fig. 17.2. Effects of labelling adult human hepatocytes with the Iron Oxide Green Orgeon(IOGO) MRI contrast agent on the overall cell metabolic activity compared to the control.Although the MTT is often used to measure proliferation based on mitochondrial activityinvolved in protein synthesis, under certain circumstances an increased activity will be areflection of increased activity in the cells rather than proliferation. IOGO, in this case,did not increase cell proliferation, but the cells processing of the agent resulted in anincreased activity.
214 Modo et al.

3.3.3. Protein Synthesis
– [14C]-Leucine
Incorporation Assay
This assay is used as an indirect functional assay that reflects theoverall synthetic activity of the cells (14). [14C]-leucine is a radio-active amino acid that gets incorporated in proteins. Followingincubation of the cell cultures, the cells are harvested onto a glassmembrane and the membrane is dried followed by the radioactiv-ity being counted using a Packard Matrix 9600 ß-counter (Pack-ard Instruments). The counts are presented as counts per minute(c.p.m.). If the MRI contrast agent used has cytotoxic effects, it isexpected to result in lower counts.
This assay requires the use of a 96-well cell culture plate. Atthe time of replacing the culture medium with medium containingthe contrast agent:1. Add [14C]-leucine solution to the medium to give a final
dilution of 0.2 mCi/well.
2. Label the plate with appropriate radioactivity warning signs.
3. Incubate the plate for the required period of labelling.
4. Post incubation, the cells are harvested and their membranesare analysed (see step 5) or the plate could be sealed with para-film to be stored at –208C for later analysis.
5. At the time of harvesting cells, the plate temperature shouldapproximate room temperature, i.e. frozen plates must becompletely defrosted.
6. Cells are harvested onto a glass membrane using the cellharvester.
7. The membrane must be dried in an oven (50–608C) for2–3 h. Ensure that the membrane is completely dry, other-wise contamination of the counter will occur.
8. Count the radioactivity of the membrane using the ß-counterfor 6 min and calculate c.p.m.High counts means a high level of protein synthesis and this will
indirectly reflect the level of cellular synthetic activity (See Note 2).
3.3.4. Reactive Oxygen
Species
Reactive oxygen species (ROS) should be measured in response tocell labelling to determine if the procedure produces any stressorsto the cells. ROS should be measured straight after labelling and atleast 24 h post-labelling to determine if these cells are undergoinga continued stress or if it is only a transient phenomenon asso-ciated with the labelling procedure rather than the presence of thecontrast agent. It is possible that some of the contrast agents aredegraded inside the cells, which can lead to the production ofROS and result in cell death.
Labelling of cells with an MRI contrast agent can lead to thecell undergoing reactive stress. To determine to what degree thisleads to the production of ROS that can damage the cells and leadto cell death, an ROS assay can evaluate if the cell labelling mightexert deleterious effects on the cells. For this:
Liver Cell Labelling with MRI Contrast Agents 215

1. Label cells with an MRI contrast agent.
2. Prepare the CM-H2DCFDA solution by diluting 50 mg in8.6 ml of PBS.
3. Add 1 ml of this solution to each well of a 24-well plate andleave on cultures for 60 min.
4. Wash 3� with PBS prior to fixing cells with 4% para-formaldehyde.
5. Quantify green fluorescence in an FITC channel. If ROS arepresent, these will emit a green fluorescent light.If no ROS are present, no green fluorescence will be emitted.
It is important to include a control condition to gain an estimateof the natural background. Values can then be expressed in rela-tion to this control condition to reflect an increase in ROS. (SeeNote 3).
3.4. MR Relaxometry Magnetic resonance images (MRI) are very dependent on thesequences used to acquire the images. Sequences can be designedto highlight fluids (such as on T2-weighted images) or to befairly insensitive to fluids (such as on T1-weighted images). Theeffect of contrast agents on the signal in images will depend bothon the type of sequences that are being used to scan a sample andon the strength of the magnet. As field strength increases, thesignal-to-noise ratio and spatial resolution increase. However,contrast agents do not necessarily follow the same principle.It is therefore important to bear these factors in mind if clinicaltranslation is envisaged. Most pre-clinical and cell labellingexperiments are conducted on high-field-strength magnets(>4.7 T), whereas most clinical studies are conducted at either1.5T and 3T, possibly resulting in too little signal to detecttransplanted cells.
To determine if sufficient contrast agent has been incorporatedinto the cell to effect a signal change on MRI, relaxometry needs to beconducted to quantify the relaxation signal on an MR image. For this:1. Label cells with a contrast agent.
2. Cell are placed in a vial (e.g. Eppendorf tube) with media or PBS.
3. Comparisons should include cells with no contrast agent,media/PBS and distilled water to determine the specificchange that the contrast agent induces inside the cells.
4. Insert Eppendorf into the coil of the scanner using eithercustom-made holders for the Eppendorfs or embed Eppen-dorfs into agarose gel for scanning. It is also possible to addcells directly into agarose gels and to insert these into the coilsfor scanning. In some cases, agarose gels are preferred as thesignal of these often resembles that of tissue. Ideally, severalcomparisons can be run in one scanning session (a standardcontrol should be included for all scans).
216 Modo et al.

5. Scanning parameters will depend on the scanner hardware.T1 and T2 relaxivities should be measured for all conditions.It is recommended that scanning sequences for relaxometryshould be set up by an experienced MR physicist.
6. On these images measure the signal in the area of the cells andthe media for each echo time (for T2 relaxation) or relaxationtime (for T1 relaxation). This will allow to determine thecontribution of the contrast agent to the relaxivity of labelledcells and if there is leakage of the contrast agent into themedia.
7. The results on the change in the signal can be plotted andanalysed using a multiple regression. It is advisable to logtransform the data to conduct this analysis. For measuringthe relaxivity of a particular contrast agent, a 1 M solution canbe used to express the molar relaxivity of the compound.However, this can also be calculated based on the molarconcentration of the solution.Calculating the relaxivity of contrast agents within cells will be
essential to calculate how many cells can be detected and willprovide the basis for deciding which contrast agent is more effec-tive for identifying transplanted cells in vivo by MRI. Resultsbased on this method are presented in Fig. 17.3.
3.5. Quantifying
Cellular Uptake of MRI
Contrast Agents
Inductively coupledplasma–mass spectrometry (ICP-MS)canbeusedto quantify the uptake of various contrast agents into cells. For this:1. Label cells with a contrast agent of interest.
2. Use sufficient quantities to yield >60,000 cells in 250 ml ofmedia. However, it is essential to count the number of cells
Fig. 17.3. MR relaxometry. (A) shows a T2-weighted MR image of Eppendorfs withmedia, Endorem-labelled or GRID-labelled cells (downward arrows). Air bubbles(upward arrow) on T2-weighted scans can easily be confounded with contrast agent-induced signal loss and care must be taken in the interpretation of these hypointensities.(B) Based on these images, it is possible to measure the signal change if the echo time isvaried. It is these values that are used to calculate the relaxivity of the contrast agent. Itis noteworthy here that cells clearly produce less signal than media or water. Incorpora-tion of the bimodal agent IOGO in these cells further reduced their signal indicating theefficiency of this agent compared to only cells.
Liver Cell Labelling with MRI Contrast Agents 217

per condition using a hematocytometer. An exact number ofcells is needed to calculate how much contrast agent wastaken up per cell.
3. Ideally, include control conditions with only cells, media pluscontrast agent and only media to define the background ornoise in the measurements.
4. Digest the sample overnight with an equal volume of nitric acid.
5. From this digested sample, add 0.25 ml to a mixture of0.05 ml indium (serving as internal control), 0.3 ml of nitricacid and 9.4 ml of distilled water.
6. A sample of this mixture is then sprayed into the ICP-MS (thisneeds to be done by an experienced researcher).
7. From these results, calculate the amount of contrast agent percell by dividing the total amount of particles (expressed inmoles or mg) in the total sample by the number of cells toyield a concentration of mol/cell or mg/cell.Knowing the amount of mole per cell will provide the basis
to calculate after how many cell divisions it will no longer bepossible to detect cells by MRI, but it will also help to determineif the amount of contrast agent per cell needs to be increased toensure a more reliable detection. This measure will also beessential to determine how effective a particular agent is tochange relaxivity. If a large quantity of intracellular contrastagent is needed to effect relaxivity, it is preferable to choose acontrast agent that is more effective and would require lesscellular uptake.
4. Notes
1. If precipitation occurs in the MTT solution a few days afterpreparation, this could be removed by filtration through a 0.2mm filter.
2. DNA synthesis assay, which uses [3H]-thymidine incorpora-tion, would be a useful assay to determine the effects of MRcontrast agent labelling on cell proliferation. This cannot beused in the case of adult human hepatocytes as they do notdivide in vitro.
3. The above assays could be carried out with any type of mam-malian cells or cell-lines. Cell type-specific assays could becarried out if needed, e.g. for hepatocytes, albumin (liver-specific protein) level in the cell culture supernatant or ureasynthesis (liver-specific detoxification product of NH4
+
metabolism).
218 Modo et al.

Acknowledgements
The authors thank Profs Steve Williams and Jack Price for theircontinued support in the development of cellular MRI. MM iscurrently supported by a RCUK fellowship and the WolfsonFoundation.
References
1. Balci, N. C., Erturk, S. M. (2007) CellularMR imaging of the liver usingcontrast agents, in (Modo, M., Bulte, J. W.,ed.), Molecular and Cellular MR Imaging,pp. 247–258. CRC Press, Boca Raton, FL.
2. Modo, M., Hoehn, M., Bulte, J. W. (2005)Cellular MR imaging. Mol Imaging4,143–164.
3. Muhler, A., Freise, C. E., Kuwatsuru, R.,et al. (1993) Acute liver rejection: evaluationwith cell-directed MR contrast agents in a rattransplantation model. Radiology 186,139–146.
4. Bulte, J. W., Kraitchman, D. L. (2004) Mon-itoring cell therapy using iron oxide MR con-trast agents. Curr Pharm Biotechnol 5,567–584.
5. Shapiro, E. M, Sharer, K., Skrtic, S., et al.(2006) In vivo detection of single cells byMRI. Magn Reson Med 55, 242–249.
6. Modo, M., Cash, D., Mellodew, K., et al.(2002) Tracking transplanted stem cellmigration using bifunctional, contrastagent-enhanced, magnetic resonance ima-ging. Neuroimage 17, 803–811.
7. Mulder, W. J., Koole, R., Brandwijk, R. J.,et al. (2006) Quantum dots with a paramag-netic coating as a bimodal molecular imagingprobe. Nano Lett 6, 1–6.
8. Daldrup-Link, H. E., Rudelius, M., Metz, S.,et al. (2004) Cell tracking with gadophrin-2:a bifunctional contrast agent for MR ima-ging, optical imaging, and fluorescence
microscopy. Eur J Nucl Med Mol Imaging31, 1312–1321.
9. de Vries, I. J., Lesterhuis, W. J., Barentsz, J. O., et al. (2005) Magnetic resonance tracking ofdendritic cells in melanoma patients for mon-itoring of cellular therapy. Nat Biotechnol 23,1407–1413.
10. Karabulut, N., Elmas, N. (2006) Contrastagents used in MR imaging of the liver.Diagn Interv Radiol 12, 22–30.
11. Ahrens, E. T., Flores, R., Xu, H. et al. (2005)In vivo imaging platform for tracking immu-notherapeutic cells. Nat Biotechnol 23,983–987.
12. Perls, M. (1867) Nachweis von Eisenoxyd ingewissen Pigmenten. Virchows Archive derPathologie, Anatomie und Physiologie 39,42–48.
13. Brekke, C., Morgan, S. C., Lowe, A. S., et al.(2007) The in vitro effects of a bimodal con-trast agent on cellular functions and relaxo-metry. NMR Biomed 20(2), 77–89.
14. Friend, J. R., Wu, F. J., Hansen, L. K., et al.(1999) Formation and characterisation of hepa-tocyte spheroids, in (Morgan, J. R., Yarmush,M. L., ed.), Methods in Molecular Medicine:Tissue Engineering Methods and Protocols, pp.248–249. Totowa, NJ, Humana Press Inc.
15. Mitry, R. R., Hughes, R. D., Bansal, S., et al.(2005) Effects of serum from patients withacute liver failure due to paracetamol over-dose on human hepatocytes in vitro. Trans-plant Proc 37, 2391–2394.
Liver Cell Labelling with MRI Contrast Agents 219

Chapter 18
Microbiological Monitoring of Hepatocyte Isolationin the GMP Laboratory
Sharon C. Lehec
Abstract
For clinical hepatocyte transplantation, cells need to be prepared in a sterile GMP environment. Strictregulations are in place that set the standard for this environment that cells are prepared in. Theseregulations control all aspects of the environment. In the United Kingdom, the laboratory must have alicence from the Human Tissue Authority to prepare cell for clinical administration. The physical para-meters such as air quality, pressure, temperature and microbiology counts have to be monitored regularlyusually through direct measurement. Described here are the methods for microbial monitoring of thelaboratory environment and the isolated cell preparations.
Key words: microbial contamination, blood culture, environment, sterility
1. Introduction
Microbial monitoring of the laboratory should be carried outweekly. This is to ensure that any potential microbial contamina-tion is kept within prescribed limits and that the appropriateaction is taken if these limits are approached or exceeded. Theroom air systems must be in operation and laminar flow cabinetsshould be on while monitoring is taking place. Microbiologicalmonitoring of cell preparation must be performed during everycell isolation procedure (1).
When setting up environmental monitoring of a labora-tory, the number of sampling points needs to be decided toensure adequate coverage. This will depend on the size of theroom. A record sheet should be made to record results. It isalso useful to make a diagram of the facility marking theposition of the sampling points.
Anil Dhawan, Robin D. Hughes (eds.), Hepatocyte Transplantation, vol. 481� Humana Press, a part of Springer ScienceþBusiness Media, LLC 2009DOI 10.1007/978-1-59745-201-4_18 Springerprotocols.com
221
2. Materials
1. Tryptone Soya Agar (TSA) contact plates (Cherwell, Bicester,UK).
2. TSA settle plates (Cherwell).
3. Air sampler (F.W. Parrett Limited, London, UK).
4. BacT/ALERT bottle (BioMerieux UK Limited, Basingstoke,UK).
3. Methods
3.1. Microbial
Monitoring of
Laboratory
Microbiological monitoring is carried out using irradiated TSAsettle plates to detect microorganisms in the air and TSA contactplates for surface contamination.
Before beginning monitoring, check the plates, do not use (a)cracked plates, (b) plates that accidentally fall open, (c) plateswhere the agar has been touched by fingers or the plate lid, (d)plates showing signs of microbial growth and (e) plates in whichthe agar has dried.
3.1.1. Settle Plate
Count for Airborne
Microorganisms
1. Settle plates are petri dishes containing a medium, which isusually agar-based and which will encourage and supportthe growth of bacteria and fungi, which land on them.
2. The purpose of the settle plate count is to monitor the clean-liness of an environment.
3. Settle plates must be inverted when being stored and incubated.
4. Collect pack of settle plates.
5. Label the bottom of the plate with the following information:
a. The location code.
b. The date.6. Place the settle plates in the appropriate position, as indicated on
the record sheet and diagram.
7. Expose the agar surface placing the lid face down next to theplate.
8. Plates should be exposed for a minimum of 1 h up to amaximum of 4 h.
9. Replace the lids and collect the settle plates.
10. Seal the lids with at least two pieces of fresh adhesive tape.
11. Plates should be placed in a bag and sealed.
12. Leave at room temperature for 3 days (to encourage anyfungal colonies to grow).
222 Lehec

13. Incubate at 328C for 4 days.
14. After incubation, results should be read with number ofcolonies counted and recorded on the microbiology mon-itoring form. (See Notes 1–3 for interpretation of results.)
15. Once plates have been read, they should be disposed of byautoclaving.
3.1.2. Contact Plate
Count for Surface
Microorganisms
1. Contact plates are agar plates that can be used to take surfacesamples. A contact plate is a plastic dish filled with agar to give aconvex surface with an area of 25 cm2 and can therefore bepressed against a test surface. The count of colonies after incuba-tion can be directly related to the contamination as cfu per unitarea.
2. The purpose of contact plates are:(i) To monitor the cleanliness of surfaces, e.g., benches,
floors, hatches, etc.
(ii) To show the effectiveness of cleaning schedules.3. It will give a total aerobic count. The surface under test may
be sampled before cleaning.
4. Collect pack of contact plates.
5. Label the bottom of the plate with the following information:
(a) the location code
(b) the date.6. Samples should be taken in the appropriate position, as indi-
cated on the record sheet and diagram.Sampling is carried out as follows:(i) Remove the lid taking care not to touch the agar surface.
(ii) Press the agar into contact with the test surface
(iii) Apply a firm and even pressure on the test surface for afew seconds taking care not to smear the agar over thetest area.
(iv) Replace the lid and seal with at least two pieces of freshtape.
7. Clean the area that has been sampled with an alcohol wipe andsterile 70% IMS.
8. Collect the contact plates.
9. Plates should be placed in a bag and sealed.
10. Leave plates at room temperature for 3 days.
11. Incubate at 328C for 4 days.
3.1.3. Air Sampling Once a month, the air quality of the unit is tested at various locationsin the Cell Isolation Unit, to ensure that aseptic processing can beperformed. This is done by taking 1 m3 sample of air using an airsampler that draws a measured sample of air onto an agar plate.
Microbiological Monitoring of Hepatocyte Isolation in the GMP Laboratory 223

1. Ensure that the air sampler is clean before use with alcoholwipes and sterile 70% IMS, paying particular attention to thehead where the sample is taken. Allow alcohol to evaporatebefore use.
2. Remove a TSA plate from the protective cover and carefullyplace in the head of the air sampler.
3. Set up the air sampler to run for 1 m3.
4. Once sampling is complete, place lid back on agar plate. Labelwith location and date.
5. Repeat for the other sample areas in the unit.
6. Leave plates at room temperature for 3 days, then incubate at328C for 4 days.
7. After incubation, results should be read and recorded onmicrobiology record sheet.
8. Once plates have been read they should be disposed of byautoclaving.
3.1.4. Microbiological
Monitoring of Re-
circulating Cold Water
Supply
Within the Cell Isolation Unit there is a water coolingsystem that allows refrigeration of cold blocks in the asepticroom. This avoids the need for ice, which is a potential sourceof contamination.
Once a month, a sample is taken from the circulating water inthe water cooler to monitor the standard of the water as it is apotential source of contamination.1. With a 1 ml sterile syringe, take a 0.5 ml sample of water from
the cooler unit.
2. Transfer this sample to a TSA settle plate and allow spreadingover the plate.
3. Label with sample type and date. Seal with tape.The procedure for incubation of the plates is as follows:
(i) Leave plates at room temperature for 3 days and thenincubate at 328C for 4 days.
(ii) Count the total number of any bacterial and fungalcolonies present. Record this figure on the recordsheet.
3.2. Microbiological
Monitoring During the
Isolation of Human
Hepatocytes
Microbiological monitoring is carried out during isolation ofhepatocytes to ensure an aseptic technique and that a clean pro-duct is produced. Hepatocyte isolation is explained in Chapter 2of this book.
3.2.1. Microbial
Monitoring of Aseptic
Technique During
Processing
Settle plates are used to show the standard of the aseptic techni-que of an operator whilst at work in the laminar flow cabinets.Finger dabs are used to monitor potential contamination offinger tips.
224 Lehec

1. Expose one plate on the work surface during every session inthe laminar flow cabinet.
2. Place the settle plate in close proximity to the working area,but where accidental contamination of the agar surface is notlikely to occur.
3. At the beginning of the session, expose the agar surfaceplacing the lid next to the plate.
4. At the end of the session and when gloves are changed,perform finger dabs.
5. Using one settle plate, draw a line down the centre of theback of the plate. Use one-half for the right hand and theother for the left. Label right or left finger dabs.
6. Finger dabs are taken by gently touching the surface of theagar with finger tips and then the thumb.
7. Seal the plates using at least two pieces of fresh tape.
8. Label the base of the plates with the date, the batch numbersof the products produced during the session, the names ofthe operator(s) and the cabinet used.
9. Plates should be incubated. Leave at room temperature for3 days. Incubate at 328C for 4 days.
10. After incubation, results should be read and recorded on themicrobiology record sheet.
11. Onceplateshavebeenreadthey shouldbedisposedofbyautoclaving.
3.2.2. Blood Culture
Monitoring During the
Isolation of Human
Hepatocytes
Samples are taken at four points during processing (2,3) and areinoculated into a BacT/ALERT bottle, and aerobic and anaerobicbottles:1. A sample of University of Wisconsin solution in which the liver
is preserved and transported.
2. Effluent at the end of the liver perfusion step, collected at or aboutthe time of perfusion with final buffer that contains collagenase.
3. Supernatant from cell purification centrifugation step, final wash.
4. Sampleof the finalproduct.Dependingonthevolumeofcells isolated.
A 50 ml of the final product is submitted for cytospin Gram stain.5. Sample is taken by withdrawing 10 ml of solution with a 10 ml
sterile syringe. Up to 5 ml per bottle minimum 100 ml per bottle.
6. Attach a needle to the syringe, leave the sheath on.
7. Wipe the bung on the BacT/ALERT bottle with an alcoholwipe and allow the alcohol to evaporate off.
8. The bottles must be labelled with a unique code to allowidentification of the procedure and the stage of procedure.BacT/ALERT cultures should be accompanied by appropri-
ate paperwork for the institution and delivered to the clinicalmicrobiology department.
Microbiological Monitoring of Hepatocyte Isolation in the GMP Laboratory 225

If positive, the type of microorganism is identified to try andspot potential sources of contamination, e.g., skin flora or envir-onmental or if they have more harmful pathogens.
Results are given on the microbiology department reports andkept with the hepatocyte isolation records. Preparations that havecultures that are positive at the final stages of the isolation arediscarded or used for research.
4. Notes
1. Areas in the unit have a specified limit according to the grade ofthe room. As set out in Rules and Guidance for PharmaceuticalManufacturers and Distributors: The Orange Guide (4).
2. Two limits are set: a warning limit and an alarm limit. Thewarning limit monitors for trends and give the first indicationthat there might be a problem.
3. The alarm limit is the actual limit for the area. Counts the abovealarm limits are recorded and the plate is sent to the hospitalMicrobiology Department for identification of the organism.Areas should be thoroughly cleaned with sporicidal agents.Where appropriate, other action may be taken, e.g., retrain staff.
Recommended limits for microbial contamination
Grade
Airsamplecfu/m3
Settle plates(diameter90 mm), cfu/4 h(b)
Contact plates(diameter55 mm), cfu/plate
Glove print.5 fingers.cfu/glove
A < 1 < 1 < 1 < 1
B 10 5 5 5
C 100 50 25 –
D 200 100 50 –
References
1. Lehec, S., Wade, J., Mitry, R., et al. (Novem-ber 2004) Evidence of microbiological screen-ing of human hepatocytes and islets for clinicaltransplantation. Abstracts of 7th InternationalCongress of the Cell Transplant Society,p. 124, Boston, USA.
2. Mitry, R. R., Hughes, R. D., Aw, M. M., et al.(2003) Human hepatocyte isolation and rela-tionship of cell viability to early graft function.Cell Transplant 12, 69–74.
3. Mitry, R. R. (2008) Isolation of HumanHepatocyte. In Dhawan A. and Hughes R. D.,eds. Methods in Molecular Biology: Hepato-cyte Transplantation, Humana Press Inc.:New Jersey [In Press].
4. Rules and Guidance for PharmaceuticalManufacturers and Distributors, MedicinesControl Agency, 2007. Pharmaceutical Press.London.
226 Lehec

Further Reading
Human Tissue Act 2004, Office of Public SectorInformation.
A Code of Practice for Tissue Banks. Departmentof Health. 2001.
Guidance on the Microbiological Safety of HumanOrgans, Tissues and Cells used in Transplanta-tion. Department of Health. 2000.
Alison M Beaney. (2001) Quality Assurance ofAseptic Preparation Services 3rd edition.Pharmaceutical Press.
BS 5295, Environmental Cleanliness inEnclosed Places, British Standards Institute,1989.
Microbiological Monitoring of Hepatocyte Isolation in the GMP Laboratory 227

INDEX
A
Abcb4 knock-out mouse...................................................76
Activin A.........................................................................161
Acute liver failure................................................................5
outcome.....................................................................6, 7
Adenoviral vector....................................................123, 135
AFP.................................................................................164
Agarose gel electrophoresis.........................................61, 65
Airborne microorganisms ...............................................222
Albumin assay .........................................................178, 188
Amnion-derived stem cells .............................................156
AmpFLSTR Profiler Plus PCR.....................................101
Animal models of liver disease ...................................4, 109
�1-antitrypsin deficiency ..........................................11, 159
ArrayScan analysis ..................................................163, 164
Autoradiography .............................................................151
B
BFC O-debenzylase assay ...........................................50, 53
Bile collection
in mice...................................................................77, 79
in rats ....................................................................77, 78
Bile salt export protein....................................................161
Biliary epithelial cells ......................................................193
Bimodal cell labelling agents ..........................................212
Bone marrow cells...........................................................142
BrdU-labelled cells......................................................85, 93
C
Caspase activity...........................................................62, 69
CD56 conjugated Dynabeads.........................................198
CD56 expression.............................................................198
Cell viability – FDA assay ..............................................212
CK19...............................................................................164
Cloning of foetal liver cells .............................................185
Collagen..........................................................................201
-coated plates ........................................................26, 41
Collagenase ...........................................................18, 84, 94
Controlled rate freezer................................................26, 28
Crigler–Najjar syndrome ..............................................9, 76
Cryopreservation
of biliary epithelial cells ............................................200
of foetal liver cells .....................................................187
of hepatocytes ...................................................3, 25, 92
Cryopreserved hepatocyte storage ....................................31
Cryosections of fixed liver ..........................................78, 80
Culture
of biliary epithelial cells -3D ............................195, 201
of biliary epithelial cells ....................................195, 200
of foetal liver cells .....................................................186
CYP isoforms............................................................48, 161
CYP7A1 .........................................................................161
Cytochrome C release.......................................................68
Cytochrome P450
activity ...................................................................37, 47
induction .....................................................................47
Cytoplasmic cell compartment ...................................61, 68
D
DAPI dye..........................................................................63
Detection
of dextran particles....................................................212
of b-GAL ...........................................................92, 123
of GFP positive cells.......................................77, 80, 85
Dexamethasone...............................................................159
Dipeptidyl peptidase deficient rats .................................110
DMSO..................................................................26, 27, 29
DNA fragmentation .........................................................65
DNaseI..............................................................................23
E
7-ethoxycoumarin O-deethylase assay..............................42
Embryogenesis ................................................................157
Embryonic stem cell
culture .......................................................171, 173, 176
cytokine treatment ....................................................175
Endorem .........................................................................208
7-ethoxyresorufin O-deethylase assay.........................49, 52
Ex vivo gene therapy...............................................118, 119
F
Factor VII deficiency ........................................................10
Fah-deficient mice ............................................................76
FDA staining ..................................................................213
Flow cytometry ...........................................................61, 67
Foetal calf serum...............................................................29
Fructose pre-incubation....................................................27
F-virosome..............................................................122, 127
229

G
Gadolinium rhodamine dextran .....................................213
Glucose pre-incubation ....................................................27
Glycogen storage disease ..................................................10
GMP Laboratory ..................................................3, 23, 221
Green fluorescent protein ...........................................80, 85
Growth factor receptors..................................................172
Gunn rat .....................................................................75, 81
H
HEA125 cell selection....................................................198
Hepatectomy – monkey....................................................86
Hepatocyte(s)
apoptosis......................................................................59
co-culture ....................................................................39
culture .........................................................................39
media...............................................................38, 40
differentiation ...........................................................158
DPPIV staining ........................................................113
engraftment.........................................................13, 108
immortalization.........................................................119
lentiviral transduction .................................................90
pre-incubation.............................................................27
protein assay..........................................................50, 55
purification..................................................................21
retroviral transduction.................................................89
spheroid culture ..........................................................40
transplantation – monkey ...........................................90
HLA
and engraftment..........................................................98
tissue typing ..............................................................100
HNF-4� protein.............................................................164
Hoechst 33258 dye .....................................................63, 88
Human embryonic stem cell ...........................................169
Human hepatocyte
blood culture testing .................................................225
contamination ...........................................................221
Hypercholesterolaemia ...............................................5, 118
I
ICP-MS..........................................................................217
Immunocytochemistry ....................................................187
Immunodeficient mouse .....................................76, 81, 178
Immunohistochemistry...........................................148, 175
Immunosuppression..................................................12, 114
In situ hybridisation..............................................145, 146,
149, 150
Indium cell labelling .........................................................99
Intraportal injection..........................................................11
Iron Oxide Green Oregon..............................................213
Iron particle detection.....................................................211
Isolation
of biliary epithelial cells ....................................194, 196
of foetal liver cells .............................................182, 184
of human amnion cells..............................................157
of human hepatoblasts ..............................................184
of human hepatocytes .............................................3, 18
of monkey hepatocytes..........................................84, 87
of rat hepatocytes ......................................................111
L
�-lipoic acid pre-incubation .............................................27
Liposomes gene transfer .................................................124
Liver
cell culture.....................................................19, 29, 41,
122, 210
graft .............................................................................36
hepatectomy................................................................36
perfusion solutions ......................................................19
preconditioning.................................................109, 112
repopulation – rat......................................................114
specific genes.............................................................162
steatosis .......................................................................38
stem cells .....................................................................13
tissue donor screening...................................................4
-based metabolic disease ...............................................8
M
MACS cell separator ......................................................199
Magnetofection of viral vectors ....................................123,
125, 133
Matrigel ............................................................................39
Mesendodermal differentiation ......................................160
Micro SSP DNA tissue typing.......................................100
Microbiological air sampling ..........................................223
Microbiological monitoring............................................222
Mitochondrial membrane potential............................61, 68
Monkey – Macaca mulatta ................................................84
Monocrotaline, 112
MR relaxometry, 216
MRI contrast agent.........................................................207
MTT assay ......................................................................214
N
Non-heart-beating donor ...................................................3
Nuclear staining ..........................................................60, 62
Nucleofector....................................................................122
O
OTC deficiency ............................................................9, 10
230HEPATOCYTE TRANSPLANTATION
Index
N
PCR primers – liver related ....................................174, 177
Percoll solution ...................................................85, 88, 197
PFIC2 ...............................................................................10
Pinocytosis ......................................................................210
Port-a-Cath1 ..................................................................12
Portal embolisation...........................................................87
Propidium iodide ..............................................................64
Protein synthesis 14C-leucine assay ................................215
Purification of biliary epithelial cells ..............................197
R
Rapamycin ......................................................................115
Rat hepatocytes .................................................................50
Reactive oxygen species assay .........................................215
Real time PCR........................................................101, 176
Recombinant viral vector ........................................129, 134
Refsum’s disease................................................................11
Retrorsine........................................................................113
Route of hepatocyte administration .................................11
RT PCR..................................................................172, 174
S
Sex-mismatched transplantation ............................142, 143
Splenic injection................................................................12
STR analysis .............................................................98, 101
Surgical liver biopsy ..........................................................36
T
Testosterone 6b-hydroxylase assay .............................50, 54
Thawing of hepatocytes......................................28, 31, 187
Transduction of hepatic progenitor cells ........................136
Transfection
by lentivirus...............................................................129
by Sendai virus ..........................................................126
for cell labelling.........................................................211
Transmission electron microscopy..............................62, 70
Transplantation of rat hepatocytes .................................111
Trypan blue exclusion .................................................21, 41
TUNEL assay .............................................................61, 66
U
UGT1A1 ........................................................................130
Urea
assay.......................................................................21, 43
cycle disorders ...............................................................9
X
Xenotransplantation..........................................................13
Y
Y-chromosome detection................................................147
231HEPATOCYTE TRANSPLANTATION
Index


