Embed Size (px)
Citation preview

Examining the Implementation and Effectiveness of aDistrict-Wide Instructional Improvement Effort
Laura D’Amico Michael Harwell,University of Pittsburgh University of Minnesota
Mary Kay Stein and Jill van den HeuvelUniversity of Pittsburgh
Paper presented at theAnnual Meeting of the American Educational Research Association
Seattle, WA
April 14, 2001
Acknowledgements: This paper was prepared under the sponsorship of the High PerformanceLearning Communities Project at the Learning Research and Development Center, University ofPittsburgh, under research contract #RC-96-137002 with the Office of Educational Research andImprovement (OERI), U.S. Department of Education. The authors wish to thank the teachers,principals and district leaders from New York City’s Community School District #2 who participated inthe research, as well as the HPLC staff involved in data collection and management.

D’Amico, Harwell, Stein and van den Heuvel page 2 Implementation and Effectiveness of a District-Wide Instructional Improvement EffortAERA, Seattle, WA, April 14, 2001
Examining the Implementation and Effectiveness of aDistrict-Wide Instructional Improvement Effort
Laura D’Amico, Michael Harwell, Mary Kay Stein and Jill van den Heuvel
The improvement of urban education has been a key battleground in the past decade of school
reform. While most improvement efforts have been aimed at high-poverty urban schools,
strategies for reforming entire districts have recently attracted the attention of prominent panels
(Education Week, 2000) and researchers (e.g., Bryk, Sebring, Kerbow, Rollow, & Easton, 1998;
Elmore & Burney, 1999; Knapp & McLaughlin, 1999; Talbert & Wechsler, 1999; Stein &
D’Amico, 2000a). One of the biggest challenges associated with district-wide models of reform is
the need to systemically grapple with issues of scale (reaching every school and every classroom)
while at the same time honoring the variability that inevitably exists among the schools,
classrooms, teachers, and students in any given district. One-size-fits-all, district-imposed
models rarely work; models built entirely from the ground up by individual schools can also be
problematic, however, as individual schools rarely possess the resources or expertise to mount
comprehensive reform efforts.
The purpose of the present study is to examine the implementation and effectiveness of one
particular urban district’s improvement efforts. It is part of a five-year study of New York
City’s Community School District #2 and its multi-faceted strategy for continuous instructional
improvement. District #2 is one of 32 community school districts in New York City with
boundaries that encompass major cultural institutions, wealthy residential and commercial areas,
historic neighborhoods, and some of the most densely populated poor communities in
Manhattan. The district includes affluent and middle class neighborhoods on the upper east side,
diverse mid-town neighborhoods, Chinatown, Greenwich Village, Little Italy, Tribeca, and Hell’s
Kitchen, all of which include both middle class enclaves and neighborhoods with substantial
concentrations of lower income families and recent immigrants (Elmore & Burney, 1997).
Like all of New York City’s community school districts, District #2 primarily serves students in
kindergarten through eighth grade. Enrollment in the district has grown steadily in recent years
due to immigration and the return of middle class students to public schools, from 21,304 in the
1996-97 school year to 22,588 in 1999-00. As of the 1999-00 school year, approximately 66% of
the students were enrolled in kindergarten through fifth grade, while 30% were enrolled in grades

D’Amico, Harwell, Stein and van den Heuvel page 3 Implementation and Effectiveness of a District-Wide Instructional Improvement EffortAERA, Seattle, WA, April 14, 2001
six through eight.1 The district’s 44 schools are configured in a variety of ways, the most
common of which are PK/K–5 (21 schools), 6-8 (10 schools), PK/K-8 (5 schools) and 6-12 (5
schools). The size of these schools varies widely, from less than 100 students in some of the
specialty alternative schools, to more than 1000 in comprehensive middle schools. This wide
variation in both school composition and student needs is one of the major challenges facing
District #2’s reform efforts.
The diagram shown in Figure 1 is our representation of District #2’s strategy for accomplishing
district-wide improvement. Their improvement strategy includes both common goals and a
system of support and accountability that is tailored to individual schools, teachers, and
students. This strategy drives their major subject-matter initiatives in literacy and mathematics,
which in turn shape professional development, classroom instruction, and (hopefully) leads to
improvements in student achievement.
• Instructional leadership• Professional community
• Quality• Congruence with district programs in mathematics and literacy
• Literacy• Mathematics
Common goals, individualized accountability and support....1. For children—reified in curriculum and program adoption2. For adults—reified in professional development for teachers and school leaders3. For schools—reified in differential treatment based on past performance and current capacity
• Quality of instruction• Congruence with district programs in mathematics and literacy
• Student achievement in literacy• Student achievement in mathematics
Conceptual Frame for Current Study
Figure 1: Conceptual Frame for Current Study
Three underlying principles drive District #2’s improvement strategy. First, the ultimate focus
at all levels of the system should be on instructional improvement (Elmore & Burney, 1999).
Unlike many districts in which upper levels of the organization are far removed from the details
1 The remaining 4% of the students were in grades 9-12. Grades 9-12 are organized as small alternative schoolsserving specialized groups of students.

D’Amico, Harwell, Stein and van den Heuvel page 4 Implementation and Effectiveness of a District-Wide Instructional Improvement EffortAERA, Seattle, WA, April 14, 2001
of instructional practice, in District #2 the kinds of learning opportunities provided to students in
classrooms is viewed as everyone’s concern—from the teacher to the principal to the deputy
superintendent to the superintendent him or herself. A corollary to this principle is that effective
instructional practice depends on capable principals who serve as instructional leaders,
supporting teachers in the development of quality practice, arranging for professional
development, and encouraging a sense of professional community in the school building (Stein,
D’Amico & Israel, 1999; Stein & D’Amico, 2000b).
Second, instructional improvement is viewed as being greatly enhanced by the adoption of
district-wide instructional frameworks. Rather than each teacher discovering, developing, or
adapting his or her own pedagogical approach to the teaching of reading and mathematics,
District #2’s philosophy is that students and teachers benefit when the entire district adopts a
common framework in these major subject areas. In the late 1980s and early 1990s, the district
invested considerable time and resources into the development of Balanced Literacy as a
framework for the teaching of reading and writing in the elementary grades (Stein, D’Amico &
Johnstone, 1999; Stein, D’Amico & Israel, 1999). Starting in the mid-nineties, they adopted a
common mathematics curricula, TERC’s Investigations, for these grades (Stein & D’Amico,
2000b; Hudson, 2000). It is important to note that the district’s promotion of common
instructional frameworks goes beyond simple mandates. They’ve committed significant
resources (materials, professional development for teachers and principals), developed models of
best practice (e.g., a Professional Development Laboratory), and created an accountability
system that expects teachers to implement what they’ve learned. Together, these actions are
meant to harness significant staff energy toward the effective implementations of these programs
district-wide.
Finally, the district recognizes the tension that exists between common frameworks and the need
for local school autonomy. Indeed, conventional wisdom in educational circles is that district
imposition of common instructional approaches is antithetical to teacher professionalism, shared
ownership, and motivation for reform. Within District #2, this concern is exacerbated by an
exceedingly wide range of school contexts making up its system of elementary and middle
schools.
District #2’s twenty-eight elementary schools vary substantially in their student and teacher
composition as well as their overall progress with respect to the Literacy and Mathematics
Initiatives. The number of students in kindergarten through grade five who were eligible for free
or reduced price lunch in 1999-2000 ranged from as little as 10% in some schools to as much as
99% in others. Likewise, the number of students with limited proficiency in English in each

D’Amico, Harwell, Stein and van den Heuvel page 5 Implementation and Effectiveness of a District-Wide Instructional Improvement EffortAERA, Seattle, WA, April 14, 2001
school ranged from less than 1% to as much as 32%. Ethnic composition of the schools also
ranges broadly, with some schools consisting largely of Asian students (e.g. 93%), others of
White (e.g. 79%) or Hispanic students (66%), and still others with highly mixed populations.
As a result, the schools and classrooms within District #2 vary quite dramatically in terms of the
needs and proficiencies of their students, teachers and principals with respect to literacy and
mathematics. District #2’s reaction to this variation has been to create support and supervision
structures that attempt to individualize assistance as much as possible (Elmore & Burney, 1997).
Ideally, students receive instruction tailored to their needs, teachers receive professional
development within their classrooms and tied to their particular conditions, and principals work
directly with district leaders on strategies to improve teaching and learning in their particular
schools.
PURPOSE OF THE CURRENT STUDY
With data collected on the key components of District #2’s improvement strategy as represented
in Figure 1, we examine two major research questions:
Implementation of District #2’s Improvement Strategy: What is the relationship amongselected components of District #2’s improvement strategy, particularly instructionalleadership, school professional community, professional development and classroominstruction?
Effectiveness of District #2’s Improvement Strategy: What effects do the components ofDistrict #2’s improvement strategy have on student achievement?
Previous investigations focused largely on the effects of the professional development
component of District #2’s overall strategy on student achievement. Using schools as the unit of
analysis, Resnick and Harwell (1998) suggested that the quality of professional development in
schools (as judged by the Deputy Superintendent and the Director of Professional Development)
was positively and indirectly related to the achievement of students in those schools through its
affect on the quality of teaching. Another study by Stein, Harwell and D’Amico (1999) found
that schools in the Focused Literacy Network, a network of schools with historically low scores
in reading that received extra attention and resources to improve their performance, had greater
gains on reading tests between 1997 and 1998 than did other elementary schools in the district. A
key part of the extra support these schools received was more extensive and targeted professional
development experiences for their teachers. Like the Resnick and Harwell study, Stein, Harwell
and D’Amico relied on school aggregate data. In contrast, a study by Harwell, D’Amico, Stein,

D’Amico, Harwell, Stein and van den Heuvel page 6 Implementation and Effectiveness of a District-Wide Instructional Improvement EffortAERA, Seattle, WA, April 14, 2001
and Gatti (2000) used multilevel models and found little relationship between teachers’ self-
reported engagement in professional development and student achievement.
The study reported here takes into account a greater portion of District #2’s reform strategy than
professional development alone. Multilevel analyses are conducted to trace the relationships
between key components of District #2’s improvement strategy and student achievement in both
literacy and mathematics. These components include:
Instructional Leadership The quality of instructional leadership in literacy and mathematicsprovided to teachers by their principals;
Professional Community The strength of the professional community in each school;
Professional Development The quality of professional development provided to teachers andits connection to the district’s core instructional programs inliteracy and mathematics;
Classroom Instruction The quality of classroom instruction in both literacy andmathematics and its alignment with the district’s core instructionalprograms in these subjects.
The larger proportion of District #2’s strategy measured should lead to a more comprehensive
picture of their improvement plans and their effectiveness than was possible in previous studies.
METHODS
Data sources
The bulk of the data reported herein was collected during the 1999-2000 school year. Key
sources include student achievement and demographic data maintained by the New York City
Board of Education and questionnaires administered to teachers and principals throughout
District #2. The questionnaires were used to collect information on the school and classroom
variables described earlier—classroom instruction; professional development; instructional
leadership; and professional community. Table 1 summarizes the relationship between data
sources and variables. Details of the data collected follow.

D’Amico, Harwell, Stein and van den Heuvel page 7 Implementation and Effectiveness of a District-Wide Instructional Improvement EffortAERA, Seattle, WA, April 14, 2001
Table 1: School- and classroom-level data sources and variables for the 1999-2000 HPLCachievement study
Data SourcesVariables Teachers Principals
Quality of Instructional Leadership X
Strength of School Professional Community X
Professional Development• Alignment with Balanced Literacy/TERC’s Investigations• Quality
XX
Classroom Instruction• Quality• Alignment w/District #2 programs• Role of Balanced Literacy/TERC’s Investigations in
teachers’ workX
XX
Student demographics and achievement
Achievement and demographic data for individual students in District #2 was made available
through the Division of Assessment and Accountability of the Office of the Deputy Chancellor
of Instruction of the New York City Board of Education. The information obtained included the
ethnicity and gender for every student, eligibility for a free or reduced priced lunch, English
proficiency status, attendance rates, and achievement scores in reading and mathematics.
Achievement data of some kind is available for District #2 students in grades three through eight.
Unfortunately, achievement data in literacy and mathematics for students in grades six through
eight cannot be linked directly with their mathematics and English language arts teachers. As a
result, our analyses are limited to the 7092 students enrolled in grades three through five during
the 1999-00 school year. Third- and fifth-grade students’ reading achievement is measured by
the Comprehensive Test of Basic Skills (CTB); their mathematics achievement is measured by
the Terra Nova exam, also published by CTB. Fourth-grade student achievement is measured by
the New York State performance assessments in English Language Arts and mathematics.2
2 In 1998-99 New York State introduced a new set of performance assessments in English language arts and
mathematics that must be taken in fourth grade. As a result, the city no longer requires 4th
grade students to take theCTB tests.

D’Amico, Harwell, Stein and van den Heuvel page 8 Implementation and Effectiveness of a District-Wide Instructional Improvement EffortAERA, Seattle, WA, April 14, 2001
Teacher questionnaires
Information on teachers’ backgrounds and professional development experience was obtained via
a questionnaire. In early May of the 1999-2000 school year, questionnaires were sent to teachers
in all of District #2’s schools. By the end of the school year, questionnaires had been received
from 286 teachers, a response rate of approximately 26%. 82 of these teachers are regular
classroom teachers in grades 3 through 5 and thus their responses can be linked with student
achievement data. In Appendix A, we summarize the subset of the questions used in the
analyses reported here. The entire questionnaire is available as an appendix to D’Amico, van den
Heuvel, and Harwell (2000).
The questionnaire is divided into several sections. Teacher responses to six sections of the
questionnaire form the core of the analyses and findings discussed in this paper: Education and
Background; Teaching Experience; Your Principal; Professional Community in Your School;
Professional Development in Literacy; and Professional Development in Mathematics. Their
responses to the items in the first two sections provided basic demographic information, such as
the number of years they have been teaching or their ethnicity. In the section entitled, Your
Principal, teachers rated the instructional leadership of their principal in literacy and mathematics
and his/her ability to communicate with teachers. In the section entitled, Professional Community
in Your School, teachers responded to six Likert-type items which asked them to rate the quality
and strength of different aspects of their school community.
In the section on Professional Development in Literacy, teachers were asked to comment on the
quality of the professional development they had received in literacy and the role that the
Balanced Literacy program in District #2 played in their professional development and teaching
experiences. Teachers were asked to rate the quality of their professional development with
respect to its effectiveness in addressing important features of teachers’ professional knowledge
and skills, such as, the learning-to-read process, classroom assessment, and effective instructional
practices for supporting the learning-to-read process. They were also asked to comment on the
pervasiveness of the Balanced Literacy framework in their day-to-day professional lives (e.g.,
how directly tied their professional development was to Balanced Literacy, how important it was
to their principal that they incorporate Balanced Literacy into their instruction). In the section on
Professional Development in Mathematics, the teachers were asked a parallel set of questions in
mathematics to those on professional development in literacy.
All ratings provided by the teachers were on a five-point Likert scale in which a “5” indicated a
very positive opinion on the part of the teacher and a “1” indicated a negative one. Single

D’Amico, Harwell, Stein and van den Heuvel page 9 Implementation and Effectiveness of a District-Wide Instructional Improvement EffortAERA, Seattle, WA, April 14, 2001
constructs (corresponding to five of the variables listed in the first column of Table 1) were
created from the ratings of related items—first conceptually, then confirmed via factor analysis.
(See Appendix B for more details.) For example, all six items of the school professional
community section were found to cluster together and hence formed the construct “Strength of
School Professional Community.”. These constructs—Strength of School Professional
Community; Quality of Professional Development in Literacy; Quality of Professional
Development in Mathematics; Role of Balanced Literacy; Role of TERC’s Investigations—were
then used in the analyses presented here. The rest of the variables listed in the first column of
Table 1 were represented by single items on the questionnaire. (See Appendix A for a list of
which items formed constructs and which ones were used alone.)
Principal questionnaires
Twenty-five principals in the district also completed questionnaires in the spring of 2000,
twenty from elementary schools and five from middle and/or high schools. The principal
questionnaire consisted of a subset of the questions on the teacher questionnaire and a few
additional questions.3 The additional questions asked to the principals rate each teacher in the
school with respect to the quality of their literacy and mathematics instruction and the alignment
of that instruction with the Balanced Literacy program and the Investigations curriculum. These
ratings are the only portion of the questionnaire used in the analyses reported here. Five of the
principals who returned surveys did not complete the teacher ratings. Twenty of the principals
completed the teacher ratings section, leading to ratings for 297 elementary school teachers, 118
of which can be linked to student achievement data.
Data sample
Our analyses are based on a subset of the data resulting from the intersection of key data
sources—in particular, those teachers and students for whom both student achievement data and
a completed teacher questionnaire were available.4 As shown in Table 2, there were 4666
students enrolled in grades three and five in District #2 and 2426 in fourth grade. Slightly more
than 90% of these students sat for the achievement tests. Of these, just over 1300 students in 57
classrooms both took the CTB exams in reading and mathematics and had teachers who turned in
3 The full survey is available as an appendix to (D’Amico, van den Heuvel and Harwell, 2000).4 Several of the teachers who filled out a questionnaire performed specialized teaching, such as teaching music orspecial education classes. We omitted these teachers from our final sample. Moreover, while some student datawere available for more than 1000 teachers in PK-12 in District #2 in the 1999-00 school year, student achievementdata could only be linked to the 328 elementary teachers in grades three through five.

D’Amico, Harwell, Stein and van den Heuvel page 10 Implementation and Effectiveness of a District-Wide Instructional Improvement EffortAERA, Seattle, WA, April 14, 2001
a survey. Just over 600 students in 26 classrooms both took the state test in English language arts
or mathematics and had teachers who turned in a survey.
Table 2: Number of students in the sample used for data analysis
Studentsenrolled
Students withtest scores
Students linked to teacherswho turned in surveysStudents Classrooms
Literacy: CTB (grades 3 & 5) 4666 4226 1315 57Literacy: State (grade 4) 2426 2189 616 26Mathematics: CTB (grades 3 & 5) 4666 4221 1313 57Mathematics: State (grade 4) 2426 2199 620 26
Table 3: Comparisons of students throughout District #2 in grades 3-5 to those in thesamples
Grades 3 and 5 Grade 4
Not in sample(n = 3347)
Sample(n = 1319)
Not inSample
(n =1803)
Sample(n = 623)
Eligible for free/reduced price lunch 62.6% 51.5% 62.7% 49%English Language Learners 13.2% 2% 12.5% 3.2%Ethnicity
Asian 36.8% 29.4% 38.5% 28.9%White 30% 37.1% 28.1% 41.3%Hispanic 20.4% 19.3% 21.2% 15.4%Black 12.9% 14.2% 12.2% 14.3%
GenderFemale
Average Attendance RateAverage Time in District
49.4%94.4%3.42
49.7%94.4%3.52
49.2%94.7%3.48
51.8%94.8%3.59
CTB ReadingCTB MathState English Language ArtsState Math
655 (2911)652 (2908)
655.2647
663 (1573)660 (1579)
669661
Note: The CTB exams are only administered to 3rd
and 5th
grade students, and the State tests only to 4th
gradestudents. The values in parentheses in the table are the number of students who sat for the tests and who were notin the sample.

D’Amico, Harwell, Stein and van den Heuvel page 11 Implementation and Effectiveness of a District-Wide Instructional Improvement EffortAERA, Seattle, WA, April 14, 2001
Comparisons of student data from sampled and non-sampled classrooms suggests that the
achievement of students in these two groups is similar, as is the percentage of Black and Hispanic
students and the average number of years students have spent in the district. (See table 3)
However, the percentage of students eligible for free and reduced lunch is smaller and the percent
of White students is somewhat higher in the sampled group than in other District #2 classrooms.
Another difference is in the average percent of students with limited proficiency in English, with
classrooms in our sample having fewer such students on average.
We have relatively little information on teachers who did not turn in surveys, making it difficult
to describe precisely how these two groups of teachers may differ. However, of the 82 teachers
who returned questionnaires and taught in grades 3-5, most are relatively new and young
teachers. About half are under the age of 32 and 50% have been teaching for four years or less. In
contrast, just about 19% have been teaching for 15 years or more. Moreover, many are fairly new
to District #2, with 52% having taught in the district for three years or less and only about 18%
having taught in the district for 10 years or more. Most of the responding teachers are White
(72.2%), but a number were Asian (17.7%) and a few are Hispanic (2.5%) or Black (5.1%). Most
are female (91.5%) and have master’s degrees (92.6%).
Data analysis
In order to answer the first research question—How is District #2’s improvement strategy being
implemented?—we computed correlations to examine the extent to which key components of the
district’s improvement plan are related to one another. Research question two—What effect do
the various components of the district’s improvement plan have on student achievement?—is
addressed in two parts. First we provide descriptive statistics in order to give an overview of
achievement in District #2. Then hierarchical linear models (HLM) (Bryk & Raudenbush, 1992)
are used to explore the extent to which measures of instructional leadership, professional
community, professional development and classroom instruction captured at various levels of the
school system influence student achievement in literacy and mathematics. Student-level data in
these models includes information on student achievement and demographic characteristics such
as ethnicity, English language proficiency and eligibility for free and reduced lunch. Classroom-
level data includes teachers’ questionnaire responses on their own experiences and ratings of
classroom instruction provided by principals.

D’Amico, Harwell, Stein and van den Heuvel page 12 Implementation and Effectiveness of a District-Wide Instructional Improvement EffortAERA, Seattle, WA, April 14, 2001
Data issues
Before continuing, we acknowledge difficulties with four key data issues. Each of them speak to
the importance of careful interpretation of our findings.
The first involves the use of self-report measures like the teacher and principal questionnaires.
These instruments often have important limitations that can compromise the validity of the
information provided by respondents (Babbie, 1992; Stein & Henningsen, 1992). Self-report
measures may promote socially desirable responses. For example, principals may not feel
comfortable assigning poor ratings to their teachers. Another possible limitation is that
respondents must accurately recall and/or judge their perceptions of events stretching over a
period of time. For example, teachers were asked to characterize the quality and focus of their
professional development experiences during the 1999-2000 school year, which may have varied
greatly throughout that 8-month period. Creating a single characterization of those experiences
may have been difficult for some teachers.
A second area of concern are self-selection effects. Data from the teacher and principal surveys
may also contain skews because of self-selection effects. We have some capacity for ascertaining
the representativeness of the principals data received through other data sources, such as school
ratings and descriptions provided by District #2 leaders (D’Amico, van den Heuvel & Harwell
2000). However, we have no such means for the teacher data. The teacher survey sample,
although fairly representative with respect to students (i.e., the students taught by the teachers in
the sample were reasonably similar to students district-wide), may not have been representative
with respect to teachers. With only 26% of the possible teachers represented, we cannot be sure
that the sample was not perhaps somehow skewed with respect to potentially important
variables such as number of years of teaching experience within the district or their general
attitude toward their principals, the district and its programs. Such skews would have an effect
on our measures of District #2’s improvement strategy implementation and therefore limit our
ability to interpret its effects on student achievement.
A third data issue is the effect of missing data on our inferences. In some cases, the amount of
missing data was modest, but for other analyses the effect of missing data was substantial and it
emanated from several sources. Some students are missing information about who their teacher is,
or information on various characteristics (such as ethnicity or eligibility for free and reduced
priced lunch), which drop them from consideration in the analyses. Of greater concern was that
some teachers neglected to complete particular items on the questionnaire. The concern is that
missing cases/scores for the reasons described may substantially bias the results in ways that

D’Amico, Harwell, Stein and van den Heuvel page 13 Implementation and Effectiveness of a District-Wide Instructional Improvement EffortAERA, Seattle, WA, April 14, 2001
significantly impact our inferences. As described later, we imputed missing values for teacher’s
responses on the questionnaire, resulting in complete data for a subset of the questionnaire
responses. (See Appendix B.) This does not eliminate the possibility of biased inferences, but,
under some general assumptions about why teacher data were missing, decreases the likelihood of
biased inferences. Missing student data was not imputed.
Finally, in some classrooms and schools, there was no variation for some student demographic
variables such as ethnicity or eligibility for free and reduced price lunch, which drops those
schools or classrooms from some of the HLM models. This raises the possibility that some of
the HLM findings are biased by the absence of these classrooms. This issue is discussed in more
detail in Appendix B.
IMPLEMENTATION OF DISTRICT #2’S IMPROVEMENT STRATEGY
Given the basic assumptions underlying District #2’s improvement strategy — that strong
school communities headed by competent instructional leadership will lead to quality
professional development experiences for teachers that in turn will lead to strong instruction —
we would expect to see significant correlations among these key components. Moreover, given
the district’s allegiance to common instructional frameworks, we might expect to see high
alignment in both professional development and classroom instruction significantly correlated
with classrooms that are judged to be of high quality.
Using classroom data, we explore these possibilities by reviewing the relationships between and
among all of the components of the District #2 model for educational improvement as explicated
in Figure 1. Figures 2 and 3 show that a number of these correlations were statistically significant.
In literacy, the quality of professional development appears to be a pivotal component around
which many of the other components of the district’s improvement strategy congeal. As shown
in Figure 2, the quality of professional development was significantly related to five components
of the District #2 model. At the school level, high-quality professional development was
associated with teachers who judged their principals to be highly capable instructional leaders and
who judged their buildings to be characterized by strong professional communities. At the
classroom level, high-quality professional development was associated with classrooms in which
instructional practices were judged to be of high quality and highly aligned with the district’s
Balanced Literacy framework. As such, professional development is an important component
that ties the classroom components to the rest of the model.

D’Amico, Harwell, Stein and van den Heuvel page 14 Implementation and Effectiveness of a District-Wide Instructional Improvement EffortAERA, Seattle, WA, April 14, 2001
Alignment of ProfessionalDevelopement
Quality of ProfessionalDevelopement
InstructionalLeadership
Quality of Instruction
Alignment ofInstruction
ProfessionalCommunity
Role of BL in Instruction
0.629
0.562 0.700
0.366
0.402
0.518
0.389
0.425
0.900
Figure 2: Significant correlations between components ofDistrict #2’s improvement strategy in literacy
(All correlations are significant at the 0.01 level, two-tailed.)
Instructional leadership—a key component of the district’s strategy—appears to be more
strongly tied to the strength of the school professional community and the quality of
professional development than to other components of the model. (See Figure 2.) Teachers who
gave their principals high ratings for their instructional leadership in literacy were more likely to
judge the professional community in their school as strong (r = 0.562) and the quality of
professional development in literacy during the last year as high (r = 0.629).
Finally, alignment to the district’s literacy framework was found to relate to other
components of the improvement strategy in both predictable and unpredictable ways. In terms
of principals’ judgments of individual teachers’ instructional practice, it appears that high
alignment is nearly synonymous with high quality. The principals’ ratings for the quality and
alignment of instruction in their teachers’ classrooms were highly correlated (r = 0.900).
Another way to investigate the relationship between alignment and other components of
District #2’s improvement strategy is to examine the correlations between teachers’ feelings
about the pervasiveness of the Balanced Literacy program in their day-to-day professional lives
(see Role of Balanced Literacy in Figure 2) and other components of the model. Interestingly,
after Quality of Professional Development, this variable was the next most-connected variable in
the model. Specifically, teachers who felt that the Balanced Literacy program played a strong
role in their practice were more likely to judge their school professional community as strong (r =

D’Amico, Harwell, Stein and van den Heuvel page 15 Implementation and Effectiveness of a District-Wide Instructional Improvement EffortAERA, Seattle, WA, April 14, 2001
0.366), and the quality of their professional development as high (r=.402) than were teachers
who did not feel that the Balanced Literacy program played a strong role in their professional
lives. Teachers were also more likely to judge the ties of professional development to Balanced
Literacy as strong when they indicated that the Balanced Literacy program played a strong role in
their instructional activities (r = 0.518).
Strangely, however, neither teachers’ ratings of the role that Balanced Literacy plays in their
work nor the alignment of professional development with the program were correlated with their
principals’ judgments on the alignment of their instruction with Balanced Literacy.
Alignment of ProfessionalDevelopement
Quality of ProfessionalDevelopement
InstructionalLeadership
Quality of Instruction
Alignment ofInstruction
ProfessionalCommunity
Role of TERC in Instruction
0.593
0.412 0.590 0.584
0.436
0.429
0.730
Figure 3: Significant correlations between components ofDistrict #2’s improvement strategy in mathematics
(All correlations are significant at the 0.01 level, two-tailed.)
In mathematics, professional development was again the most-connected construct. It was
found to be significantly correlated with three other components. Teachers who indicated that the
quality of their professional development in mathematics was high were also more likely to state
that their principals provided strong instructional leadership in mathematics (r = 0.593) and that
the professional community in their school was a strong one (r = 0.412). Moreover, teachers
were more likely to judge the quality of their mathematics professional development to be high if
they also indicated that TERC’s Investigations curriculum played a strong role in their work
(r = 0.584). However, unlike in literacy, teachers’ judgments of the quality of their professional
development in mathematics was not found to correlate significantly to the quality and alignment

D’Amico, Harwell, Stein and van den Heuvel page 16 Implementation and Effectiveness of a District-Wide Instructional Improvement EffortAERA, Seattle, WA, April 14, 2001
of classroom instruction and hence did not play the same role of tying the classroom components
to the school level components as the quality of professional development did in literacy.
Similar to the findings in literacy, instructional leadership in mathematics appears to be more
strongly tied to the strength of the school professional community and the quality of
professional development than to other components of the model (see Figure 3). Teachers who
gave their principals high ratings for their instructional leadership in literacy were more likely to
judge the professional community in their school as strong (r = 0.412) and the quality of
professional development in mathematics during the last year as high (r = 0.593).
Finally, also similar to the findings in literacy, alignment to the district’s mathematics
framework (the TERC curriculum) was found to relate to other components of the
improvement strategy in both predictable and unpredictable ways. Once again, principals’
judgments of individual teachers’ instructional practice consisted of significantly correlated
ratings for quality and alignment (r = 0.730). Although not as high a correlation as for literacy,
the significance of the relationship suggests, once again, that principals tend to judge high quality
instruction and high alignment as closely related.
Similar to what was found about the Role of Balanced Literacy, teachers’ feelings about the
pervasiveness of the TERC curriculum in their day-to-day professional lives (see Role of TERC
in Figure 3) was the next most-connected variable in the model. It was found to be significantly
related to teachers’ judgments about their school professional community (r = 0.366), and about
the quality of their professional development (r = 0.402). In the case of mathematics, however,
teachers’ ratings of the role that TERC plays in their work was correlated with their principals’
judgments of the alignment of their instruction with the TERC curriculum. On the other hand,
prevalence of TERC did not correlate with judgments of how connected their professional
development was to TERC.
In summary, the data described in this section provide some evidence of the implementation of
District #2’s overall improvement strategy during the 1999-00 school year. The strongest
support is for the relationship between high-quality professional development, good instructional
leadership and strong professional community. For literacy, high quality professional
development also appeared to be associated with high quality instruction, as well as instruction
that was closely aligned with the Balance Literacy program. Professional development did not
appear to be associated with either high quality instruction or instruction closely aligned with the
Investigations curriculum. However, this may be due to the relative newness of the mathematics
initiative.

D’Amico, Harwell, Stein and van den Heuvel page 17 Implementation and Effectiveness of a District-Wide Instructional Improvement EffortAERA, Seattle, WA, April 14, 2001
Overall, instructional leadership was not as robust a variable as one might have expected. For
both mathematics and literacy it appears to be most closely related to judgments of professional
community and quality of professional development. Interestingly, teachers’ judgments of the
quality of instructional leadership do not appear to be related, in either literacy or mathematics,
to how aligned they perceived their professional development to be to the district’s frameworks.
Notably, instructional leadership was not correlated with high quality instruction in either
literacy or mathematics.
Given the importance of district-wide instructional frameworks to District #2’s overall strategy
for educational improvement, it is interesting that alignment played out in a rather equivocal
manner. One curious finding was the lack of a significant relationship between principals’ ratings
of degree of alignment of teachers’ practice with the Balanced Literacy framework and teachers’
own reporting of how pervasive Balanced Literacy program was in their professional lives. In
mathematics, on the other hand, these two measures were significantly correlated. Together,
these two findings may suggest that principals are better able to judge teachers’ practice in
literacy than in mathematics, not an unexpected finding given the newness of the mathematics
initiative. Also curious was the lack of significant correlation between alignment of professional
development in mathematics and anything else, particularly in contrast to literacy, in which
alignment of professional development was associated with teachers’ own judgment of how
important Balanced Literacy was to their professional lives.
Many of the differences between the mathematics and literacy findings may point to the newness
of the mathematics initiative as compared to the literacy initiative. In mathematics, the various
components and their interrelationships do not appear to be as congealed as they are in literacy.
EFFECTS OF DISTRICT #2’S IMPROVEMENT STRATEGYON STUDENT ACHIEVEMENT
Demonstrating the effectiveness of District #2’s improvement strategy on student achievement is
difficult. Given the district’s high variability in ethnic diversity, poverty levels, and English
proficiency, it is reasonable to expect that these factors will be strong predictors of academic
achievement, leaving less variance to be explained by the programs of District #2. In order to
detect increases in student performance it is reasonable to assume that program effects must be
strong.
In this section, the effects of District #2’s improvement strategy on student achievement are
examined through the use of descriptive statistics and HLM analyses. We report on the

D’Amico, Harwell, Stein and van den Heuvel page 18 Implementation and Effectiveness of a District-Wide Instructional Improvement EffortAERA, Seattle, WA, April 14, 2001
relationship between student achievement in both literacy and mathematics and student
characteristics, including ethnicity, socio-economic status, English proficiency, gender,
attendance, and number of years the student has been attending school in District #2. We also
examine the relationship of student achievement to various aspects of District #2’s improvement
strategy.
Student achievement throughout District #2
The 4666 third and fifth grade students in District #2 are subject to the same kinds of
achievement patterns seen in other school districts. Impoverished students (i.e. those eligible for
free or reduced price lunch) tend to score lower than their more affluent classmates, by 28 points
on the CTB reading test (standardized effect size (ES) = 0.84 standard deviations) and 24 points
on the CTB mathematics test (ES = 0.47). Minority students, particularly Black and Hispanic
students, also tend to have lower scores in both reading (mean = 643 for Black students; mean =
638 for Hispanic students) and mathematics (mean = 625 for Hispanic students; mean = 624 for
Black students) than their White counter parts (reading mean = 672; mathematics mean = 664; ES
= 1 between White and Hispanic students in reading; ES = 0.81 between White and Black
students in mathematics). Finally, students who are proficient in English tend to perform better
than those who are not proficient for both reading (ES = 1.24) and mathematics (ES = 0.74) by
approximately 44 points and 38 points, respectively.5
Similar patterns emerged for the approximately 2200 fourth grade students who sat for the state-
mandated tests in English Language Arts (ELA) and mathematics. Once again, impoverished
students tend to score lower than their more affluent classmates, by 32 points on the state test in
English language arts (standardized effect size (ES) = 0.83 standard deviations) and 21 points on
the state mathematics test (ES = 0.56). Minority students tended to have lower scores in both
English language arts (mean = 645 for Black students; mean = 646 for Hispanic students) and
mathematics (mean = 636 for Hispanic students; mean = 635 for Black students) than their White
counterparts (reading mean = 685; mathematics mean = 674; ES = 1.07 between White and
Hispanic students in reading; ES = 1.12 between White and Black students in mathematics).
Finally, students who are proficient in English tended to perform better than those who were not
5 There was a large disparity in sample size between those who were proficient (N = 4110) and those who were notproficient (N = 116). In part, the small number of students tested who were not proficient in English (at least inreading) is attributable to the fact that a number of them are officially considered “exempt” from testing in Englishdue to their limited proficiency.

D’Amico, Harwell, Stein and van den Heuvel page 19 Implementation and Effectiveness of a District-Wide Instructional Improvement EffortAERA, Seattle, WA, April 14, 2001
proficient for both English language arts (ES = 1.45) and mathematics (ES = 1.06) by
approximately 55 points and 54 points, respectively.6
In summary, the pattern of strong relationships between student achievement and background
characteristics (ethnicity, socio-economic status, and English language proficiency) that is so
prevalent in other studies of urban student achievement is also evident in District #2.
Modeling the relationship between student characteristics, componentsof District #2’s improvement strategy and student achievement
The HLM analyses take into account the relationships between socio-economic status, gender,
ethnicity, English proficiency, attendance and District #2 enrollment both within and between
individual classrooms. They also explore the effect of District #2’s improvement strategy on
achievement and the relationship between achievement and student characteristics.
Student achievement and its relationship to student characteristics
We explore the relationship between student characteristics and academic achievement in three
ways. First, we describe the extent to which classroom aggregates of student characteristics (e.g.
the percent of students within a given classroom eligible for free or reduced price lunch) can
predict mean academic achievement of students within that classroom. Second, we look at the
the ability of individual student characteristics (i.e. is a particular student eligible for free or
reduced price lunch) to predict individual academic achievement within each classroom. Finally,
we look at the extent to which the relationship between individual student characteristics and
achievement vary by classroom.
As Table 4 demonstrates, the classroom composition with respect to socio-economic status,
English proficiency and attendance were all weak predict predictors of student achievement in
literacy as measured by both the CTB in reading and the state exam in English language arts. In
other words, those classrooms with fewer students eligible for free and reduced price lunch,
higher average attendance rates, and higher percentages of students who were proficient in
English, tended to have higher mean achievement in literacy. Fewer classroom aggregates of
student characteristics were predictive of mean achievement in mathematics. While average
attendance was a moderate predictor of mean achievement as measured by both the CTB and the
state exams in mathematics, socio-economic status was only a weak predictor and just for the
CTB scores. Both both subjects, as measured by both exams, a considerable amount of variation 6 Once again, there was a large disparity in sample size between those who were proficient in English (N = 2112)and those who were not proficient (N = 77).

D’Amico, Harwell, Stein and van den Heuvel page 20 Implementation and Effectiveness of a District-Wide Instructional Improvement EffortAERA, Seattle, WA, April 14, 2001
in the mean student achievement among classrooms was still unexplained when just these
aggregates of student characteristics were included in the model.
Table 4: Predictive power of classroom aggregates of student characteristics on classroommean achievement
CTB State Exam
Reading Mathematics Reading Mathematics
Socio-economic status Weak Weak Weak Not Sig
English proficiency Weak Not Sig Weak Not Sig
Ethnicity Not Sig Not Sig Not Sig Not Sig
Attendance Weak Moderate Weak Weak-moderate
Gender Not Sig Not Sig Not Sig Not Sig
Time in District Not modeled Not modeled Not Modeled Not ModeledRough estimate of effects provided for statistically significant (p < 0.05) results only.
When the relationship between individual student characteristics and individual student
achievement was examined within classrooms, socio-economic status, attendance and ethnicity
were found to be statistically significant predictors of student achievement as measured by the
CTB in both literacy and mathematics. In mathematics, gender was also a predictor of student
achievement. Achievement as measured by the state test (in both English Language Arts and
mathematics) was predicted by ethnicity, attendance and the number of years the student had
been enrolled in District #2. Moreover, socio-economic status and gender were both predictors of
reading achievement as measured by the state test in English Language Arts. These findings
appear in the first two columns of Tables 5 and 6.
These within-classroom relationships between student characteristics and student achievement
were consistent across classrooms in most cases. However, the relationship between socio-
economic status and achievement in both reading and mathematics as measured by the CTB
varied significantly between classrooms. In other words, in some classrooms the tie between
socio-economic status and achievement was stronger than in others. Similarly, the relationship
between ethnicity and student achievement in both reading and mathematics as measured by the
CTB varied significantly between classrooms. These findings can be seen in the final two
columns of Tables 5 and 6.

D’Amico, Harwell, Stein and van den Heuvel page 21 Implementation and Effectiveness of a District-Wide Instructional Improvement EffortAERA, Seattle, WA, April 14, 2001
Table 5: Summary of HLM results relating student achievement to student characteristicsfor CTB
Predictive power of studentcharacteristics on individual
student achievement
Variation in the relationshipbetween student characteristics
and student achievement byclassroom
Reading Mathematics Reading Mathematics
Socio-economic status Strong Strong Sig Sig
Ethnicity Moderate Moderate Sig Sig*
Attendance Weak Weak Not Sig Not Sig
Gender Not Sig Weak-Moderate
Not Sig Not Sig
Time in District Not Sig Not Sig Not Sig Not SigRough estimate of effects provided for statistically significant (p < 0.05) results only.*This variable was so close to being significant (p = 0.056) that it was treated it as significant.
Table 6: Summary of HLM results relating student achievement to student characteristicsfor state-mandated tests
Predictive power of studentcharacteristics on individual
student achievement
Variation in the relationshipbetween student characteristics
and student achievement byclassroom
Reading Mathematics Reading Mathematics
Socio-economic status Strong Not Sig Not Sig Not Sig
English proficiency Not modeled Not modeled Not modeled Not modeled
Ethnicity Strong Strong Not Sig Not Sig
Attendance Weak Weak Not Sig Not Sig
Gender
Time in District
Strong
Weak
Not Sig
Weak-Moderate
Not Sig Not Sig
Not Sig
Rough estimate of effects provided for statistically significant (p < 0.05) results only.

D’Amico, Harwell, Stein and van den Heuvel page 22 Implementation and Effectiveness of a District-Wide Instructional Improvement EffortAERA, Seattle, WA, April 14, 2001
Next we explore to what extent the variation between classrooms in these relationships between
socio-economic status and achievement and ethnicity and achievement can be explained by
classroom differences in the implementation of District #2’s improvement strategy.
Effect of various components of the District #2 model on student achievement
We next explore the extent to which two types of variation—(a) overall variation in mean student
achievement between classrooms; and (b) the variation between classrooms in the relationship
between student characteristics and student achievement—can be attributed to various
components of District #2’s improvement strategy. The intersection between teacher survey
data, principals’ ratings of teachers’ instruction and fourth grade students who took the state
exams created too small a sample of classrooms to effectively run HLM models. As a result, our
analyses of the effects of components of District #2’s improvement strategy on student
achievement use only CTB data. There were 34 classrooms for whom we have CTB data in
reading and mathematics, as well as teacher questionnaire data and principal ratings of instruction.
There was considerable variation among mean classroom achievement in both literacy (40% for
the CTB) and mathematics (55% for the CTB) which was attributable to between classroom
variation. It is possible that classroom composition and/or effects of District #2’s improvement
strategy might account for at least part of the variation among classrooms. Findings indicate that
two of the components of District #2’s improvement strategy predict achievement in either
subject. As shown in Table 7, teachers’ judgments of the quality of their mathematics
professional development was a moderate predictor of mean classroom performance on the CTB
in mathematics. Alignment of instruction with Balanced Literacy was a strong predictor of mean
classroom performance on the CTB in reading.
Close inspection of Table 7 also shows that, for literacy, socioeconomic status, English
proficiency, and attendance7 remain significant predictors of mean student achievement per
classroom even when additional predictors (the district’s improvement components) are
available. In mathematics, none of the aggregates of student characteristics (weak predictors
initially as shown in Table 4) remain significant once the District #2 improvement strategies are
included in the HLM analyses.
7 Socio-econoomic status, attendence and ethnicity were found to be significant at the individual level for the CTB(see Table 4)

D’Amico, Harwell, Stein and van den Heuvel page 23 Implementation and Effectiveness of a District-Wide Instructional Improvement EffortAERA, Seattle, WA, April 14, 2001
Table 6: Summary of HLM results of the predictive power of components ofDistrict #2 model on classroom mean achievement as measured by the CTB
Reading Mathematics
School professional community Not Sig Not Sig
Quality of instructional leadership Not Sig Not Sig
Quality of professionaldevelopment
Not Sig Moderate
Alignment of professionaldevelopment with BL/TERC
Not Sig Not Sig
Quality of instruction Not Sig Not Sig
Alignment of instruction withBL/TERC
Strong Not Sig
Role of BL/TERC in teachers’work
Not Sig Not Sig
Classroom aggregates of studentcharacteristics
Socio-economic statusEnglish proficiencyEthnicityGenderAttendance
WeakWeakNot SigNot SigWeak-moderate
Not SigNot SigNot SigNot SigNot Sig
Rough estimate of effects provided for statistically significant (p < 0.05) results only.
These findings suggest that teachers who align their practices with the Balanced Literacy program
(as reported by their principal) reap the benefit of significantly higher student achievement than
do teachers whose practices were not judged to be aligned with the Balanced Literacy program.
Nevertheless, socio-economic status continues to play a significant role in reducing students’
achievement in literacy, although its effect at the classroom level was weaker and may be the
result of the district’s improvement strategies (the predictive power of socio-economic status on
student achievement went from strong [Table 4] to weak [Table 6]). In mathematics, it is the
quality of professional development that is the strongest predictor of student achievement at the
classroom level.
Next, we examine the extent to which components of District #2’s improvement strategy account
for variation in the classroom relationships between achievement and two demographic
characteristics—socio-economic status and ethnicity. As shown in Table 8, the findings indicate

D’Amico, Harwell, Stein and van den Heuvel page 24 Implementation and Effectiveness of a District-Wide Instructional Improvement EffortAERA, Seattle, WA, April 14, 2001
that teachers who report that Balanced Literacy plays a strong role in their work were less likely
to be in classrooms where the link between socio-economic status and achievement is a strong
one. Likewise, teachers who indicted that the Investigations curriculum played a strong role in
their work were less likely to be in classrooms where the link between socio-economic status and
mathematics achievement is strong. These were both moderate effects and suggest that the
support provided to teachers through the use of Balanced Literacy and the Investigations
curriculum may help reduce the link often seen between socio-economic status and student
achievement.
Table 8: Summary of HLM results of the predictive power of components of District #2model on classroom differences in the relationship between student characteristicsand student achievement (as measured by the CTB)
SES Ethnicity
Reading Mathematics Reading Mathematics
School professional community ↑Moderate ↑Weak-Moderate
Not Sig Not Sig
Quality of instructional leadership Not Sig Not Sig Not Sig Not Sig
Quality of professionaldevelopment
Not Sig Not Sig Not Sig Not Sig
Alignment of professionaldevelopment with BL/TERC
Not Sig Not Sig Not Sig ↑ Moderate
Quality of instruction Not Sig ↑ Moderate Not Sig Not Sig
Alignment of instruction withBL/TERC
Not Sig Not Sig Not Sig Not Sig
Role of BL/TERC in teachers’work
↓Moderate
↓ Weak-Moderate
Not Sig Not Sig
Rough estimate of effects provided for statistically significant (p < 0.05) results only.↓ means that the within-classroom relationship is weakened by higher values of the classroom predictor;↑ means that the within-classroom relationship is strengthened by higher values of the classroom predictor.
However, not all the effects of District #2’s improvement strategy appear to be such beneficial
ones. For example, teachers who judged the professional communities in their schools to be
strong ones were more likely to be in classrooms where the relationship between socio-economic
status and achievement was strong. This moderate effect held for both literacy and mathematics
achievement and suggests that highly cohesive, professional school communities are associated
with stronger links between students’ socio-economic status and their achievement.

D’Amico, Harwell, Stein and van den Heuvel page 25 Implementation and Effectiveness of a District-Wide Instructional Improvement EffortAERA, Seattle, WA, April 14, 2001
The other effects that are different than what would have been predicted all fall within
mathematics: (a) The relationship between mathematics achievement and socio-economic status
was moderately stronger in classrooms where principals gave teachers high ratings for the quality
of their instruction; (b) The relationship between mathematics achievement and ethnicity was
moderately stronger in classrooms in which teachers indicated that much of their professional
development in mathematics was tied to the Investigations curriculum. These findings may
indicate that the curriculum District #2 has adopted in mathematics is better suited to white
middle class children than it is to impoverished and ethnically diverse children. More likely, it
indicates that the teachers themselves have not been working with the curriculum long enough to
develop skill at adapting it for the wide range of students in their classrooms. On the other hand,
the findings may be a simple artifact of the teachers and principals themselves as judges of the
curriculum. Because of the newness of the Mathematics Initiative, principals may not be as keen
judges of the quality of the mathematics instruction as they are of the quality of literacy
instruction. Similarly, teachers may not be as good a judge of the alignment of their professional
development with Investigations as they are regarding the alignment of their professional
development with Balanced Literacy.
Overall, then, the findings of the HLM analyses (Tables 4-8) suggest different story lines for
District #2’s Literacy and. Mathematics Initiatives. In literacy, the findings are more
understandable and congruent. Basically, the findings suggest that the alignment of instructional
practice to the Balanced Literacy program is associated with improved student outcomes. This is
evidenced by the strong predictive power of principals’ judgements of alignment of instruction
on mean classroom student achievement and by the finding that the link between students’ socio-
economic status and their achievement is significantly weakened in those cases in which teachers
report that Balanced Literacy plays an important role in their day-to-day professional lives.
In mathematics, the findings are more difficult to interpret. In particular, no clear story line
emerges for either professional development or instructional practice. While quality of
professional development proves to be a predictor of student achievement, high alignment of
professional development with TERC’s Investigations curriculum is actually associated with
stronger links between students’ ethnicity and their achievement. And while teachers’ report of
high importance of TERC to their day-to-day professional lives was found to result in weakened
links between students’ socio-economic status and their achievement, high quality of instruction
(as judged by their principals) was actually found to strengthen the links between socio-economic
status and achievement.

D’Amico, Harwell, Stein and van den Heuvel page 26 Implementation and Effectiveness of a District-Wide Instructional Improvement EffortAERA, Seattle, WA, April 14, 2001
DISCUSSION
New York City’s Community School District #2 has in recent years enjoyed a national
reputation for the strength of their strategy for instructional improvement, particularly the
quality of their professional development system and the strength of their instructional
leadership. Rough measures of achievement indicated that this strategy was a successful one. For
example, between 1988 and 1998, the percent of students achieving at or above grade level rose
from 56% to 73% in reading and 66% to 82% in mathematics (HPLC Technical Report, 2000).
Moreover, previous research has also provided indications that the strategy was effective (e.g.,
Resnick & Harwell, 1998; Stein, Harwell & D’Amico, 1999), and the results of the current study
bolster that argument.
The correlation analyses indicate that quality instructional leadership, strong professional
communities and quality of professional development are correlated with one another in both
literacy and mathematics. Moreover, both the quality of literacy instruction and its alignment
with District #2’s Balanced Literacy program are correlated with the quality of the professional
development teachers experience. These findings provide some evidence supporting the district
leadership’s belief that improvements in instruction can be produced through strong instructional
leadership on the part of principals who work closely with staff developers to create both a
strong professional community in their school and high quality professional development
experiences for their teachers. It is possible that as the younger Mathematics Initiative matures
in District #2, a similar link between professional development and instruction will develop.
However, there is little evidence that strong instruction (as judged by District #2 principals) leads
to better student achievement in either literacy or mathematics. Instead, other aspects of
District #2’s improvement strategy emerge as strong predictors of student achievement. In
particular, working closely with the Balanced Literacy program and TERC’s Investigations
curriculum appears to reduce the likelihood that there will be a strong connection between
achievement and socio-economic status in literacy and mathematics within a given classroom. In
other words, teachers who use these programs appear to level the playing field between the
impoverished and more affluent students in their classrooms. In addition, the mean reading
achievement of students in classrooms where the instruction is closely aligned with Balanced
Literacy is higher than that of students in classrooms where it is less aligned. And finally, the
mean mathematics achievement of students in classrooms where teachers report having received
strong professional development in mathematics is higher than that of students in classrooms
where the teacher received professional development of lesser quality. These findings indicate
that both the Balanced Literacy program and the Investigations curriculum in conjunction with

D’Amico, Harwell, Stein and van den Heuvel page 27 Implementation and Effectiveness of a District-Wide Instructional Improvement EffortAERA, Seattle, WA, April 14, 2001
high quality professional development provide the support that teachers need to not only
improve student learning overall, but to break down the barriers that impoverished students often
face. They thus support District #2’s conviction that professional development which is
anchored by a core instructional program or curriculum can increase student learning.
The findings, however, are not perfectly in the alignment that one would predict if the District #2
model was performing flawlessly. Some pieces of District #2’s improvement strategy failed to
show a direct link to student achievement at all (e.g., quality of instructional leadership).
Moreover, a few had puzzling negative effects (e.g. schools with strong professional communities
appeared to more likely have classrooms in which the achievement gap between impoverished
and affluent children was a large one).
There are issues with both the data and analysis that suggest caution be taken with these findings,
both the encouraging and less than encouraging ones. We mentioned earlier that problems
associated with missing data, lack of variation in some data, self-report and self-selection effects
all indicate the need for careful interpretation of our findings. We discuss here in slightly more
detail, some of our specific self-report concerns, as well as some limitations of the kinds of
analyses used.
Interpretation of “quality” and “alignment”
The measures of each component of District #2’s improvement effort are all based on judgments
made by teachers and principals. The interpretation of findings based on these data depend on
the extent to which we believe that the responding teachers and principals were capable of
making the requested judgments and what effect the history of work in each subject matter
initiative may have had on their understanding of the questions being asked. Certainly some
teachers and principals are probably better judges of the quality of professional development,
instruction and leadership than others and such differences may affect our results. However, of
more concern are systematic effects on the respondents interpretation of the questions being
asked.
In particular, we believe that the differences in the histories of the Literacy and Mathematics
Initiatives may have implications for how both “quality” and “alignment” of professional
development and instruction are interpreted by teachers and principals in District #2 (D’Amico,
van den Heuvel & Harwell, 2000). The district’s Literacy Initiative has been in place for over a
decade. While based on models out of New Zealand and Australia, the Balanced Literacy
program at its core has a “home grown” feel to many of District #2 educators. There is a wide

D’Amico, Harwell, Stein and van den Heuvel page 28 Implementation and Effectiveness of a District-Wide Instructional Improvement EffortAERA, Seattle, WA, April 14, 2001
spread understanding of its basic structure and principles which permeate the entire district.
Often teachers, principals and district leaders will speak of instruction as being aligned with
Balanced Literacy if it meets the underlying principles of the program even if they do not meet
the structural features of it (Stein & D’Amico, 2000a; Stein, D’Amico & Israel, 1999).
In contrast, the Mathematics Initiative is just five years old and only in its second year of
district-wide expansion. Moreover, in the early years of this newer initiative, schools were not
encouraged to focus on mathematics until the district leadership felt their literacy instruction was
fairly strong. Thus, the curriculum at its core is not as well known throughout the entire district
as is the Balanced Literacy program. Moreover, while already some of the teachers and
principals at the vanguard of the initiative are working on changes and adaptations they feel need
to be made to the curriculum, for most it is being adopted whole cloth, as is (Stein & D’Amico,
2000b; Hudson, 2000).
As a result of these differences, we believe District #2 educators may be more likely to focus on
alignment of pedagogical principles with respect to Balanced Literacy and alignment with surface
features of the curriculum with respect to Investigations. Moreover, we think it likely that both
teachers and principals will tend to be better judges of quality professional development and
instruction in literacy than in mathematics.
Optimistic principals
We are particularly concerned about the principals’ responses to our questionnaire. Overall, their
responses were overwhelmingly positive for all items measured (D’Amico, van den Heuvel &
Harwell, 2000). Their strong positive ratings may be due to several factors. They may honestly
believe that the professional development and instruction in their schools is as high in quality as
their ratings show. If this is the case the district leadership may need to be concerned about their
ability to spot struggling teachers when necessary. It is more likely, however, that the social
complications of the situation may have made it difficult for the principals to answer honestly.
Principals are likely to identify strongly with their schools and are proud of their work there. As
a result, they may have felt uncomfortable providing low ratings that might then reflect back
poorly on them. They may also care deeply about their teachers—even the struggling ones—and
thus feel uncomfortable with providing hard criticisms of their work to strangers. In fact, of the
five principals who did not provide us with ratings of the quality and alignment of their teachers’
instruction, two either called or sent notes to explain they felt it was inappropriate for them to
supply such information for anything other than official evaluations used by the school system.

D’Amico, Harwell, Stein and van den Heuvel page 29 Implementation and Effectiveness of a District-Wide Instructional Improvement EffortAERA, Seattle, WA, April 14, 2001
While understandable, the overall positive pattern of their responses make it difficult for us to
determine whether they were sufficiently critical when evaluating both the quality of instruction
in teachers’ classrooms and its alignment with District #2’s programs. This uncertainty leads us
to suggest caution when interpreting findings based on their judgments. We are currently in the
process of coding write-ups of classroom observations conducted during the 1999-2000 school
year in 49 third grade classrooms across 16 District #2 elementary schools. The teachers in 32 of
these classrooms also completed questionnaires. Replacing the principals’ ratings of instructional
quality and alignment with District #2 programs with that of the researchers in our HLM
analyses may help to resolve this issue.
Limitations of our analysis
The analysis tools used in this study do not enable us to look at the mediated effects of various
components of District #2’s improvement strategy on one another and on student achievement.
Given the district’s improvement strategy (see Figure 1), we expect that mediated effects may be
an important contribution to the story. In other words, the district leaders do not expect the
quality of instructional leadership to have a direct impact on student achievement. Instead, they
expect instructional leadership to influence the quality of professional development provided to
teachers and therefore the quality of teaching, which in turn will improve student achievement.
Formal study of the role of mediated effects call for the use of path analysis models like those
reported in Resnick and Harwell (1998). Attempts to fit similar models to the current data have
so far been unsuccessful. However, we believe that the models we have used to date may be too
simple and analysis of this kind deserves further exploration.
Finally, perhaps one of the biggest and most difficult problems to solve with the current analysis
is our reliance on data collected completely within District #2 and for only one school year. In
essence, we are not studying the overall effect of District #2’s improvement strategy, but
variations in its effectiveness within the district during one school year. We attempted to
measure the strength of the implementation of various aspects of District #2’s strategy to
determine whether school and classroom level differences in their implementation effected
student achievement during one school year. Such a design both ignores the possibility that some
effects may only be seen longitudinally and does not take into consideration the possibility that
the district as a whole may be in a different space than other urban districts. In other words, our
analyses can only reveal shades of gray in the effectiveness of District #2’s program in different
schools and classrooms. It cannot tell us whether or not, overall, achievement in District #2 has
been positively affected by their efforts. We have access to student test scores over a multi-year
period, but no consistent data on the implementation of improvement strategy components

D’Amico, Harwell, Stein and van den Heuvel page 30 Implementation and Effectiveness of a District-Wide Instructional Improvement EffortAERA, Seattle, WA, April 14, 2001
during that time. Moreover, we have no means of comparing District #2’s strategy and student
achievement to that of other urban districts. As a result, this particularly troubling concern is not
one which will be easily resolved.
Conclusion
Despite these concerns and limitations, the findings described herein provide support for the
viability of District #2’s improvement strategy in literacy as shown in Figure 1 and as described
in the introduction. In particular, high quality professional development appears to be associated
with both high quality and highly aligned instructional practice—and when instructional practice
is highly aligned to the principles of the Balanced Literacy framework it appears to significantly
weaken the links between student achievement and their socio-economic status (a nontrivial
accomplishment). While the findings are more equivocal in mathematics, with time, we might
expect that District #2’s two guiding principals—focus on instruction and the adoption of
district-wide instructional frameworks—will prove to be similarly beneficial to student
achievement in mathematics as well.
D’Amico, Harwell, Stein and van den Heuvel page 31 Implementation and Effectiveness of a District-Wide Instructional Improvement EffortAERA, Seattle, WA, April 14, 2001
REFERENCES
Babbie, E. (1992). The practice of social research (6th ed). Belmont, CA: Wadsworth.
Bryk, A.S., & Raudenbush, S.W. (1992). Hierarchical linear models: Applications and dataanalysis methods. Newbury Park: Sage Publications.
Bryk, A.S., Sebring, P.B., Kerbow, D., Rollow, S., & Easton, J.Q. (1998). Charting Chicagoschool reform: Democratic localism as a lever for change. Boulder, CO; WestviewPress.
Burney, D. & Elmore, R. F. (2000). Adult learning and mentoring in Community School DistrictTwo: A key to closing the achievement gap (OERI contract deliverable). Pittsburgh, PA:High Performance Learning Communities Project, Learning Research and DevelopmentCenter, University of Pittsburgh.
D’Amico, L., van den Heuvel, J. R., & Harwell, M. (2000). Multiple Subjects II. (OERI contractdeliverable). Pittsburgh, PA: High Performance Learning Communities Project, LearningResearch and Development Center, University of Pittsburgh.
Education Week. (March 1, 2000). Annenberg task force will take a fresh look at districts.
Elmore, R. F., & Burney, D. (1997). School variation and systemic instructional improvement inCommunity School District 32, New York City (OERI contract deliverable). Pittsburgh,PA: High Performance Learning Communities Project, Learning Research andDevelopment Center, University of Pittsburgh.
Elmore, R. F. & Burney, D. (1999). Investing in teacher learning: Staff development andinstructional improvement. In L. Darling-Hammond & G. Sykes (Eds.), Teaching as thelearning profession: Handbook of policy and practice (pp. 263-291). San Francisco:Jossey-Bass.
Elmore, R. F., & Burney, D. (2000). Leadership and learning: Principal recruitment, inductionand instructional leadership in Community School District #2, New York City (OERIcontract deliverable). Pittsburgh, PA: High Performance Learning Communities Project,Learning Research and Development Center, University of Pittsburgh.
Fink, E., & Resnick, L. B. (1999). Developing principals as instructional leaders (OERI contractdeliverable). Pittsburgh, PA: High Performance Learning Communities Project, LearningResearch and Development Center, University of Pittsburgh.
Harwell, M., D'Amico, L., Stein, M.K. and Gatti, G. (2000). Professional development and theachievement gap in Community School District #2. (OERI contract deliverable).Pittsburgh, PA: High Performance Learning Communities Project, Learning Research andDevelopment Center, University of Pittsburgh.
Hiebert, J., Carpenter, T.P., Fennema, E., Fuson, K.C., Wearne, D., Muray, H., Olivier, A,Human, P. (1997). Making sense: Teaching and learning mathematics with understanding.Portsmouth, NH: Heinemann.
High Performance Learning Communities Project (2000). Technical Report I. Pittsburgh, PA:Learning Research and Development Center, University of Pittsburgh.

D’Amico, Harwell, Stein and van den Heuvel page 32 Implementation and Effectiveness of a District-Wide Instructional Improvement EffortAERA, Seattle, WA, April 14, 2001
Hudson, C. (2000). Building a Learning Community: The Mathematics Initiative in New YorkCity’s Community District #2. (Text for 2000 video). Pittsburgh, PA: University ofPittsburgh, High Performance Learning Communities Project, Learning Research andDevelopment Center.
Kennedy, M. (1997). The connection between research and practice, Educational Researcher, 7, 4-11.
Knapp, M.S. et al (1995). Teaching for meaning in high-poverty classrooms. New York, NY:Teachers College Press.
Knapp, M.S., & McLaughlin, M. (1999). The district role in the improvement of teaching:Framing the conversation and research. Paper presented at the annual meeting of theAmerican Educational Research Association, Montreal, Canada.
McLachlan, G.J., & Krishnan, T. (1997). The EM algorithm and extensions. New York: Wiley.
National Center on Education and the Economy and the University of Pittsburgh. (1997). EnglishLanguage Arts. New Standards Performance Standards, Volume I –Elementary School.Harcourt Brace Educational Measurement.
National Council on Teachers of Mathematics (2000). Principles and standards for schoolmathematics. Reston, VA: Author.
Newman, F.M. et al (1996). Authentic achievement: Restructuring schools for intellectual quality.San Francisco, CA: Jossey-Bass.
Raudenbush, S., Bryk, T., & Congdon, R. (1999). Hierarchical linear and nonlinear modelingwith the HLM 5 program. Chicago, IL: Scientific Software International, Inc.
Resnick, L., & Harwell, M. (1998). High performance learning communities: District 2achievement (OERI research contract #RC-96-137002 deliverable). Pittsburgh, PA:University of Pittsburgh, Learning Research and Development Center.
Schafer, J.L. (1997). Analysis of incomplete multivariate data. London: Chapman & Hall.
Stein, M. K., D’Amico, L., & Israel, N. (1999). Observations, conversations, and negotiations:Administrator support of literacy practices in New York City’s Community SchoolDistrict #2. Paper presented at the The Annual Meeting of the American EducationalResearch Association, Montréal, Québec, Canada.
Stein, M.K., & D’Amico, L. (2000a). Inquiry at the crossroads of policy and learning: A study ofa district-wide literacy initiative. Submitted for publication to Teachers College Record.
Stein, M. K., & D’Amico, L. (2000b). How subjects matter in school leadership. Paper presentedat the Annual Meeting of the American Educational Research Association, New Orleans,LA.
Stein, M.K., D’Amico, L., & Johnstone, B. (April, 1999). District as professional educator:Learning from and in New York City’s Community School District #2. Paper presented atthe annual meeting of the American Educational Research Association, Montreal, Canada.

D’Amico, Harwell, Stein and van den Heuvel page 33 Implementation and Effectiveness of a District-Wide Instructional Improvement EffortAERA, Seattle, WA, April 14, 2001
Stein, M.K., Harwell, M. and D'Amico, L. (1999). Toward closing the gap in literacyachievement: District 2 Achievement in Year Two. (OERI contract deliverable). Pittsburgh,PA: High Performance Learning Communities Project, Learning Research andDevelopment Center, University of Pittsburgh.
Stein, M.K., & Henningsen, M. (1992). Using triangulation in classroom research. Paperpresented at the annual meeting of the American Educational Research Association, SanFrancisco.
Stigler, J. W., Gonzales, P., Kawanaka, T., Knoll, S.; Serrano, A. (1999). The TIMSSVideotape Classroom Study: Methods and Findings from an Exploratory Research Projecton Eighth-Grade Mathematics Instruction in Germany, Japan, and the United States.Washington, DC: National Center for Education Statistics.
Talbert, J., & Wechsler, M. (1999). The district policy environment and the improvement ofteaching: Learning from the Bay Area school reform collaborative. Paper presented at theannual meeting of the American Educational Research Association, Montreal.

D’Amico, Harwell, Stein and van den Heuvel page 34 Implementation and Effectiveness of a District-Wide Instructional Improvement EffortAERA, Seattle, WA, April 14, 2001
APPENDIX A: SELECTED ITEMS FROM TEACHER QUESTIONNAIRE
3. Education and Background Variables/Constructs
3a. What is the highest degree you have completed thus far?3b. When did you complete this degree?3c. When did you graduate high school?3d. What is your ethnic background?3e. What is your gender?
4. Teaching Experience4a. How many years have you been teaching in a school that serves K-
12 students?4b. How many years have you been teaching in your current school
district?4c. How many years have you been teaching at your current school?
5. Your principal5a. Ability to provide guidance and feedback on your literacy
instructionQuality of InstructionalLeadership-Literacy
5b. Ability to provide guidance and feedback on your mathematicsinstruction
Quality of InstructionalLeadership-Mathematics
5c. Ability to communicate with teachers in your school
6. The professional community at your school6a. There is a common goal or vision about how to best help students
learn.6b. Teachers have a common language with which to discuss their
work toward common goals.6c. Teachers feel comfortable visiting one another’s rooms and talking
about instruction.6d. Teachers often work together to plan instruction as well as design
or review books, materials, curricula, etc.6e. There is a commitment among the teachers to improve their
teaching.6f. I feel comfortable asking for help from other teachers.
Strength of SchoolProfessional Community
7. Professional development in literacy
B. Quality of professional development in literacy
7Ba. How students learn to read and/or write7Bb. How to teach students to read and/or write7Bc. How to asses students’ proficiency in reading and/or writing
Quality of ProfessionalDevelopment in Literacy

D’Amico, Harwell, Stein and van den Heuvel page 35 Implementation and Effectiveness of a District-Wide Instructional Improvement EffortAERA, Seattle, WA, April 14, 2001
7Bd. How to plan instruction based on students’ assessed proficiencyin reading and/or writing
7Be. How to write and/or to interact with literature as an adult learner
C. Role of the Balanced Literacy program
7Ca. How much of the Professional Development in literacy that youreceived in the last year was directly tied to the Balanced Literacyprogram?
Alignment of ProfessionalDevelopment withBalanced Literacy
7Cb. How familiar are you with the Balanced Literacy program?7Cc. To what extent does the Balanced Literacy program provide
support for you as you plan and carry out your lessons?7Cd. How important is it to your principal that you incorporate
Balanced Literacy into your instruction?
Role of Balanced Literacyin Teachers’ Work
8. Professional Development in Mathematics
B. Quality of professional development in mathematics
8Ba. How students learn to understand and do mathematics8Bb. How to teach students to understand and do mathematics8Bc. How to assess students’ proficiency in mathematics8Bd. How to plan instruction based on students’ assessed proficiency
in mathematics8Be. How to engage in mathematics as an adult learner
Quality of ProfessionalDevelopment in
Mathematics
C. Role of TERC Investigations curriculum
8Ca. How much of the Professional Development in math you’vereceived in the last year was directly tied to TERC’s Investigationscurriculum?
Alignment of ProfessionalDevelopment with TERC’s
Investigations
8Cb. How familiar are you with TERC’s Investigations curriculum?8Cc. To what extent does TERC’s Investigations curriculum provide
support for you as you plan and carry out your lessons?
Role of TERC’sInvestigations in Teachers’
Work8Cd. How important is it to your principal that you incorporate
TERC’s Investigations curriculum into your instruction?

D’Amico, Harwell, Stein and van den Heuvel page 36 Implementation and Effectiveness of a District-Wide Instructional Improvement EffortAERA, Seattle, WA, April 14, 2001
APPENDIX B: DETAILED STATISTICAL ANALYSES
Reliability and Factor Analyses of Teacher Questionnaire Data
We investigated the reliability and validity of the various teacher subscales using Cronbach’s
alpha reliability coefficient and factor analysis (principals responses were not analyzed in this
fashion because the sample was too small). The sample of teachers data that was analyzed was
restricted to those teaching in grades 3-5, and unless otherwise noted, the reliability and factor
analyses were based on a sample of 75-82 teachers, depending on the presence of missing data.
The results of the reliability and factor analyses are summarized in Table 9.
The reliability of the literacy subscales was moderately high, with a median reliability across
subscales of .77. The Perception of Principal subscale showed the lowest estimated reliability
(.71). Factor analysis was used to examine the extent to which items for a literacy subscale
appeared to “hang together,” providing evidence of construct validity. The maximum likelihood
factoring routine in SPSS was used to extract factors. The Role of Balanced Literacy subscale
consisted of items 7cb-7cd in the teacher questionnaire; item 7ca (How much of the Professional
Development in Literacy That You Received in the Last Year was Directly tied to the Balanced
Literacy program?) was treated as a separate variable.
In every case, the proposed subscale structure was generally supported by the data in that a
single factor (only one eignevalue exceeded a value of one) appeared for each subscale and factor
loadings that tended to be quite similar in value. These results provide general evidence of
construct validity because the hypothesized literacy subscale structures were supported by the
data.

D’Amico, Harwell, Stein and van den Heuvel page 37 Implementation and Effectiveness of a District-Wide Instructional Improvement EffortAERA, Seattle, WA, April 14, 2001
Table 9: Reliability and Factor Analysis Results for the Teachers Questionnaire Data
Subscale
Prof. Comm. AtYour School (6a-6f)
Qual. Of Prof. Dev. InLiteracy (7ba-7be)
Role of BalancedLiteracy Program (7cb-7cd)
New StandardsPerformance Standards inEnglish Language Arts(7daNSPS-7dcNSPS)
New Standards EarlyLiteracy Standards(7daNSELS-7dfNSELS)
Qual. Of Prof. Dev. inMath (8ba-8be)
Role of TERC (8cb-8cd)*
New StandardsPerformance Standards inMath (8daNSPS-8dcNSPS)
NCTM Standards
(8daNCTM-8dcNCTM)
Reliability
.91
.92
.71
.83
.85 (63)
.93
.61
.91
.90 (64)
Range ofFactor Loadings
.70 -- .89
.77 -- .94
.69--.72
.64--.88
.73--.90
.74--.96
.33--.98
.77--.97
.80--.98

D’Amico, Harwell, Stein and van den Heuvel page 38 Implementation and Effectiveness of a District-Wide Instructional Improvement EffortAERA, Seattle, WA, April 14, 2001
The mathematics subscales showed a similar pattern with the exception of the TERC subscale.
The median reliability across mathematics subscales of the teacher questionnaire was .76. Factor-
analytic results led to the decision to delete item 8cd of the TERC subscale (How Important is
the Incorporation of TERC to Your Principal) because the associated loading was small/negative.
Deletion of this item reduced the TERC subscale to three items but led to better reliability and
higher and more consistent loadings. Subsequent data analyses involving TERC are based on
three items (8ca-8cc).
After examining the factor-analytic results we computed factor scores for each subscale for each
teacher. Correlations among factor scores for each subscale appear in tables 9 and 10 (factor
scores have a mean of 0 and a standard deviation of 1). On the whole, the literacy and
mathematics teacher subscales appear to be reliable and to show evidence of construct validity.

D’Amico, Harwell, Stein and van den Heuvel page 39 Implementation and Effectiveness of a District-Wide Instructional Improvement EffortAERA, Seattle, WA, April 14, 2001
Descriptive analyses of student data
Relationships between Demographic Variables for all 3rd-5th Grade Students
SES x Ethnicity. Closer examination of the student demographic data reveals several interesting
patterns, including SES and Ethnicity. As seen in Figure 4, sharp differences appear in the
percentages of students in various ethnic groups in the high and low SES groups. There was a
statistically significant relationship between these two variables (p < .05), with a moderate
Cramer’s statistic (V2 = .36), meaning that approximately 34% of the variation in SES is a
function of a student’s ethnicity.
In examining the gaps between high and low SES groups, the percentage of Black students in the
low SES group is slightly higher (14%) than that in the high SES group (11%). However, for
Hispanic students this gap is much larger (26% and 12%, respectively). The widest gap exists for
Whites, with these students making up 9% of the low SES group and 63% of the high SES group.
Overall, the group with the largest low SES representation was Asian students (50%).
Figure 4
Ethnicity
whiteblackhispanicasian
Per
cent
70
60
50
40
30
20
10
0
SES
high ses
low ses
Figure 4: Ethnicity and socio-economic status of district #2 students

D’Amico, Harwell, Stein and van den Heuvel page 40 Implementation and Effectiveness of a District-Wide Instructional Improvement EffortAERA, Seattle, WA, April 14, 2001
LEP x Ethnicity. The pattern for LEP and Ethnicity was similar to that involving SES but weaker.
Although there was a statistically significant relationship between these two variables (p < .05),
the V2 statistic of .06 means that relatively little of the variation in LEP status depends on
Ethnicity. This is borne out by Figure 5. White and Black students show the highest levels of
proficiency, followed by Hispanic and Asian students. The latter group shows the highest levels
of students classified as LEP—almost 66% of students classified as not proficient in English are
Asian.
Figure 5
Ethnicity
whiteblackhispanicasian
Per
cent
70
60
50
40
30
20
10
0
LEP
proficient
not proficient
Figure 5: Ethnicity and English proficiency of District #2 students
SES x LEP. Although there is a statistically significant relationship between SES and LEP (p <
.05), it is weak-positive (r = .20), meaning that students who were classified as LEP were
somewhat likely to be in the low SES group. This is confirmed in Figure 6, which shows that
most LEP students (90%) were in the low SES group.
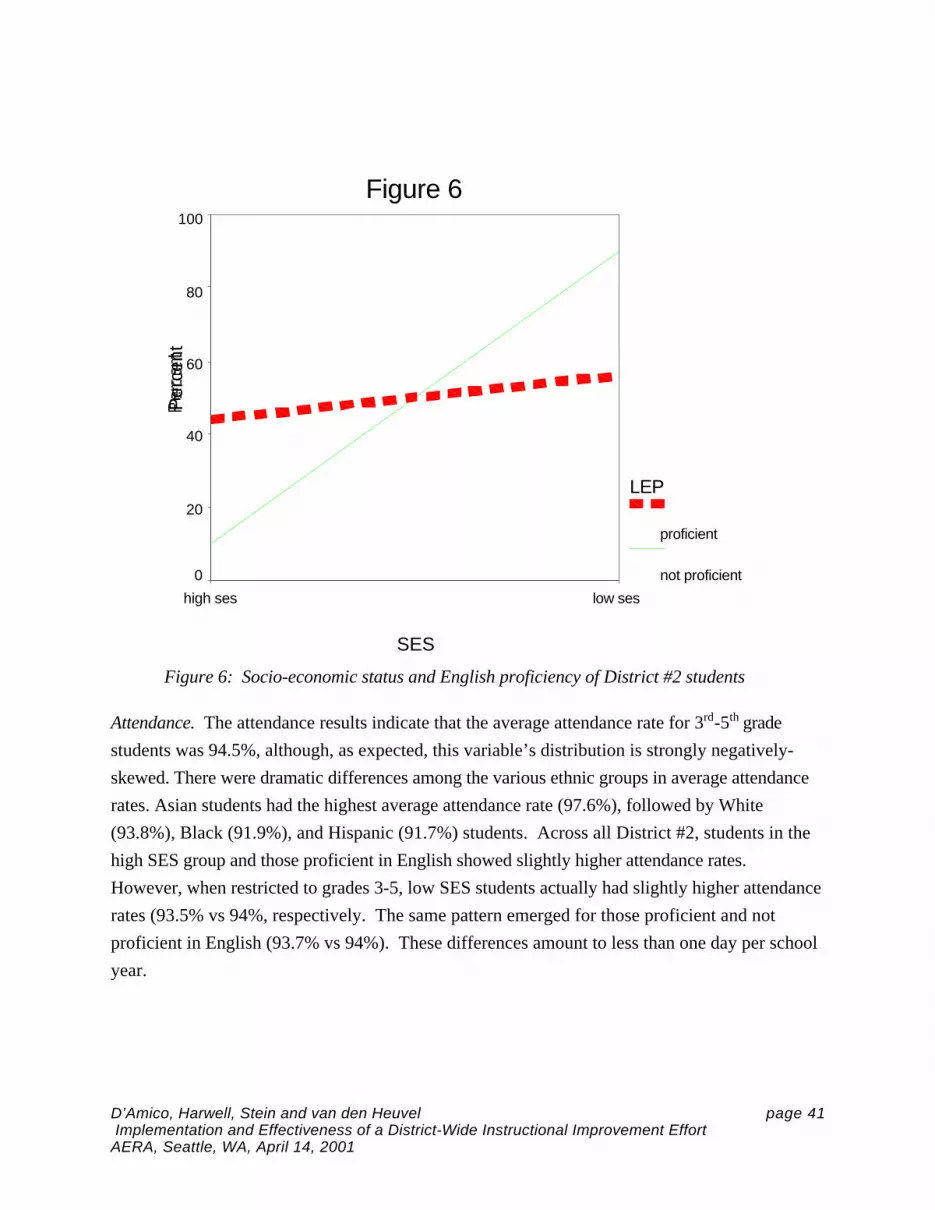
D’Amico, Harwell, Stein and van den Heuvel page 41 Implementation and Effectiveness of a District-Wide Instructional Improvement EffortAERA, Seattle, WA, April 14, 2001
Figure 6
SES
low seshigh ses
Per
cent
100
80
60
40
20
0
LEP
proficient
not proficient
Figure 6: Socio-economic status and English proficiency of District #2 students
Attendance. The attendance results indicate that the average attendance rate for 3rd-5th grade
students was 94.5%, although, as expected, this variable’s distribution is strongly negatively-
skewed. There were dramatic differences among the various ethnic groups in average attendance
rates. Asian students had the highest average attendance rate (97.6%), followed by White
(93.8%), Black (91.9%), and Hispanic (91.7%) students. Across all District #2, students in the
high SES group and those proficient in English showed slightly higher attendance rates.
However, when restricted to grades 3-5, low SES students actually had slightly higher attendance
rates (93.5% vs 94%, respectively. The same pattern emerged for those proficient and not
proficient in English (93.7% vs 94%). These differences amount to less than one day per school
year.
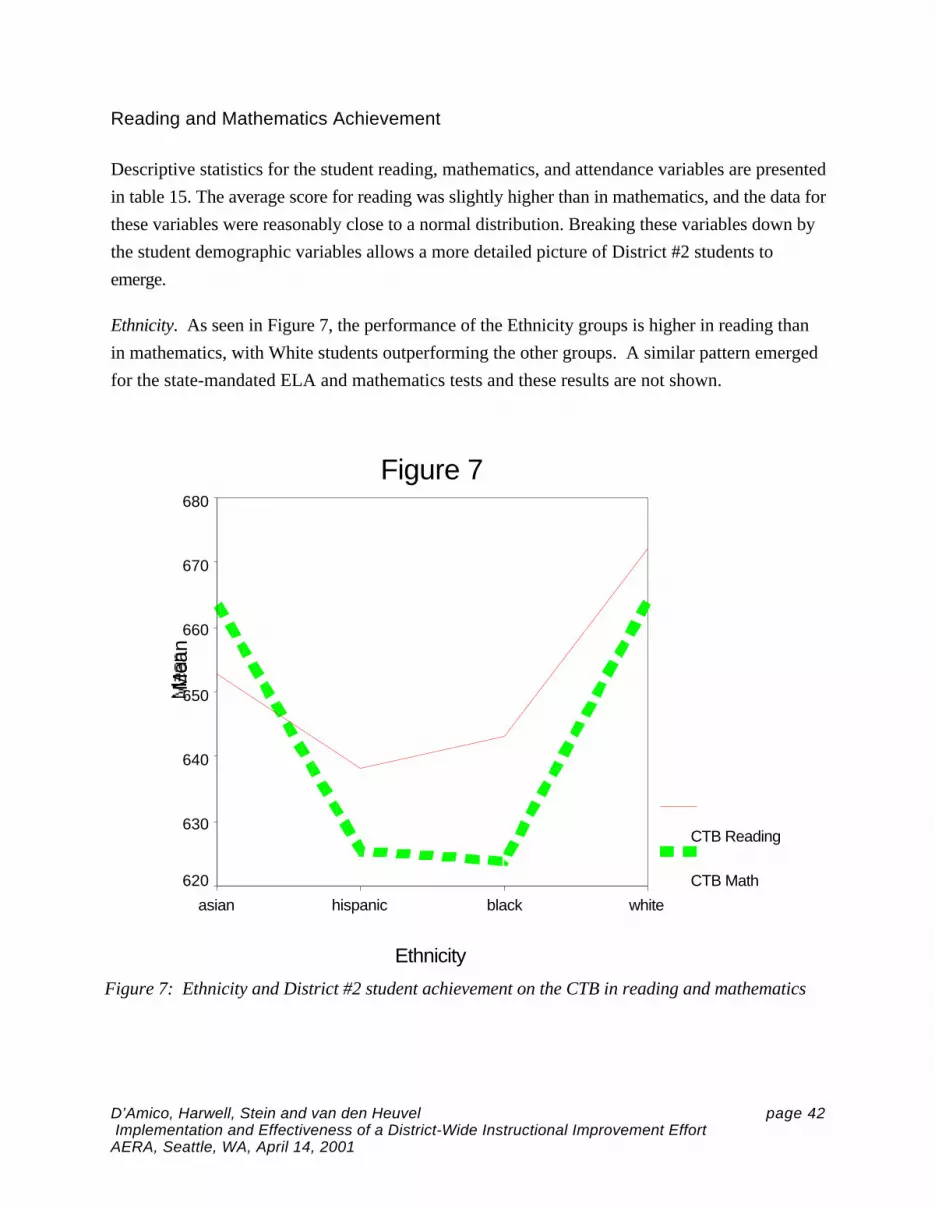
D’Amico, Harwell, Stein and van den Heuvel page 42 Implementation and Effectiveness of a District-Wide Instructional Improvement EffortAERA, Seattle, WA, April 14, 2001
Reading and Mathematics Achievement
Descriptive statistics for the student reading, mathematics, and attendance variables are presented
in table 15. The average score for reading was slightly higher than in mathematics, and the data for
these variables were reasonably close to a normal distribution. Breaking these variables down by
the student demographic variables allows a more detailed picture of District #2 students to
emerge.
Ethnicity. As seen in Figure 7, the performance of the Ethnicity groups is higher in reading than
in mathematics, with White students outperforming the other groups. A similar pattern emerged
for the state-mandated ELA and mathematics tests and these results are not shown.
Figure 7
Ethnicity
whiteblackhispanicasian
Mea
n
680
670
660
650
640
630
620
CTB Reading
CTB Math
Figure 7: Ethnicity and District #2 student achievement on the CTB in reading and mathematics

D’Amico, Harwell, Stein and van den Heuvel page 43 Implementation and Effectiveness of a District-Wide Instructional Improvement EffortAERA, Seattle, WA, April 14, 2001
SES. As seen in Figure 8, the pattern of reading and mathematics performances are reasonably
similar across both levels of SES, with both groups scoring higher in reading than in mathematics.
For reading, there was a 28-point difference between the low and high SES groups (effect size
(ES) = .84 standard deviations); for mathematics there was a 24 point difference (ES = .47).
Once again, the state-mandated results were similar to those for the CTB and are not shown.
Figure 8
SES
low seshigh ses
Mea
n
680
670
660
650
640
630
CTB Reading
CTB Math
Figure 8:Socio-economic status and District #2 student achievement on the CTB in reading and mathematics

D’Amico, Harwell, Stein and van den Heuvel page 44 Implementation and Effectiveness of a District-Wide Instructional Improvement EffortAERA, Seattle, WA, April 14, 2001
LEP. As seen in Figure 9, students within each LEP group performed quite similarly in CTB
reading and mathematics. For reading, as expected the proficient students scored substantially
higher (more than 40 points) than those classified as not proficient (ES = 1.24), while for
mathematics the gap was 37 points (ES = .73). The state-mandated results were even sharper
than those for the CTB. For the ELA test, students proficient in English tended to score 55
points higher than those not proficient (ES = 1.36), while for mathematics the gap was 44 points
(ES = 1.16).
Figure 9
LEP
not proficientproficient
Mea
n
660
650
640
630
620
610
600
CTB Reading
CTB Math
Figure 9:English proficiency and District #2 student achievement on the CTB in reading and mathematics

D’Amico, Harwell, Stein and van den Heuvel page 45 Implementation and Effectiveness of a District-Wide Instructional Improvement EffortAERA, Seattle, WA, April 14, 2001
Gender. As seen in Figure 10, there is a modest gender difference (6 points, ES = .16) in reading
favoring females. For mathematics, males showed a slight advantage with a 2-point gap (ES =
.04). The state-mandated tests showed greater differences in reading, with females outperforming
males in reading by an average of 10 points (ES = .24). In mathematics, the results mimicked
those of the CTB test, with males outperforming females by approximately 2 points (ES = .07).
Figure 10
Gender
femalemale
Mea
n
660
658
656
654
652
650
648
CTB Reading
CTB Math
Figure 10: Gender and District #2 student achievement on the CTB in reading and mathematics

D’Amico, Harwell, Stein and van den Heuvel page 46 Implementation and Effectiveness of a District-Wide Instructional Improvement EffortAERA, Seattle, WA, April 14, 2001
Ethnicity x SES. As seen in Figure 11, high SES students scored higher (on average) in reading
regardless of their ethnicity. That is, the general rank-ordering of ethnic groups was Whites,
Asians, Blacks, and Hispanics and emerged regardless of SES.
Figure 11
Ethnicity
whiteblackhispanicasian
Mea
n C
TB
Rea
ding
680
670
660
650
640
630
SES
high ses
low ses
Figure 11:Ethnicity, socio-economic status and District #2 student achievement on the CTB in reading
A slightly different rank-ordering emerged for mathematics, as seen in Figure 11. Here, Asian
students scored the highest, followed by White, Hispanic, and Black students. The average gap
favoring reading over mathematics was similar for Asians, Whites, and Hispanics (10, 8, and 13
points, respectively), and larger for Black students (19 points). For the state-mandated exams
(not presented), the same general rank-ordering (White, Asian, Hispanic, Black) appeared for
both reading and mathematics tests, with the average performance of Hispanic and Black students
virtually identical. The average gap favoring reading over mathematics for the state tests for
Whites, Blacks, and Hispanics was 11, 10, and 10, respectively. On the other hand, Asian
students scored an average of 7 points higher in mathematics than reading on these exams.

D’Amico, Harwell, Stein and van den Heuvel page 47 Implementation and Effectiveness of a District-Wide Instructional Improvement EffortAERA, Seattle, WA, April 14, 2001
Figure 12
Ethnicity
whiteblackhispanicasian
Mea
n C
TB
Mat
h 690
680
670
660
650
640
630
620
610
SES
high ses
low ses
Figure 12 Ethnicity, socio-economic status and District #2 student achievement on the CTB in mathematics
Ethnicity x LEP. The results for Ethnicity x LEP for CTB reading in Figure 13 are quite similar to
those for Ethnicity x SES. Even among LEP students, their performance in reading is uniformly
better than in mathematics, with the rank-ordering Asian, White, Black, and then Hispanic
students. As with SES, the rank-ordering changes slightly for mathematics, with Asian students
scoring highest, followed by White, Hispanic, and Black students (Figure 14). When examining
Figures 14 involving LEP it is important to remember that the number of students who were not
proficient in English who sat for the reading and mathematics exams was quite small.

D’Amico, Harwell, Stein and van den Heuvel page 48 Implementation and Effectiveness of a District-Wide Instructional Improvement EffortAERA, Seattle, WA, April 14, 2001
Figure 13
Ethnicity
whiteblackhispanicasian
Mea
n C
TB
Rea
ding
680
660
640
620
600
580
LEP
proficient
not proficient
Figure 14
Ethnicity
whiteblackhispanicasian
Mea
n C
TB
Mat
h
680
660
640
620
600
580
LEP
proficient
not proficient
Figures 13 &14:Ethnicity, English proficiency and District #2 student achievement on the CTB

D’Amico, Harwell, Stein and van den Heuvel page 49 Implementation and Effectiveness of a District-Wide Instructional Improvement EffortAERA, Seattle, WA, April 14, 2001
Patterns for the state-mandated exams are different from those presented in Figures 13 and 14.
The main difference for reading, presented in Figure 15, is that White students who were or were
not proficient performed similarly (average of 685 vs 681). For mathematics (Figure 16), it was
Black students who performed similarly regardless of their English status (635 vs 632).
Figure 15
Ethnicity
whiteblackhispanicasian
Mea
n E
LA
700
680
660
640
620
600
580
560
540
520
LEP
proficient
not proficient
Figure 15: Ethnicity, English proficiency andDistrict #2 student achievement on the state English language arts exam.

D’Amico, Harwell, Stein and van den Heuvel page 50 Implementation and Effectiveness of a District-Wide Instructional Improvement EffortAERA, Seattle, WA, April 14, 2001
Figure 16
Ethnicity
whiteblackhispanicasian
Mea
n S
tate
Mat
h T
est
680
660
640
620
600
LEP
proficient
not proficient
Figure 16: Ethnicity, English proficiency andDistrict #2 student achievement on the state mathematics exam

D’Amico, Harwell, Stein and van den Heuvel page 51 Implementation and Effectiveness of a District-Wide Instructional Improvement EffortAERA, Seattle, WA, April 14, 2001
SES x LEP. The results in Figure 17 indicate that even within the not proficient group, low SES
students performed substantially lower in reading than those in the high SES group (mean = 638
vs 605). The results in Figure 18 for mathematics were similar to those for reading, with the
average mathematics score of the not proficient group much lower than that of the proficient
group (mean = 630 vs 609).
Figure 17
SES
low seshigh ses
Mea
n C
TB
Rea
ding
680
660
640
620
600
LEP
proficient
not proficient
Figure 17:Socio-economic status, English proficiency and student achievement on the CTB in reading

D’Amico, Harwell, Stein and van den Heuvel page 52 Implementation and Effectiveness of a District-Wide Instructional Improvement EffortAERA, Seattle, WA, April 14, 2001
Figure 18
SES
low seshigh ses
Mea
n C
TB
Mat
h 670
660
650
640
630
620
610
600
LEP
proficient
not proficient
Figure 18:Socio-economic status, English proficiency and student achievement on the CTB in mathematics
Technical Notes on HLM Analyses
The hierarchical structure of educational data (e.g., students nested within teachers/classrooms)
requires the use of specialized data analysis models that take this structure into account. We
used hierarchical linear modeling (HLM) to study patterns in the data using the HLM5 computerprogram (Raudenbush, Bryk, Cheong, & Congdon, 2000). We assume that the i = 1,2,.., nj
students (level 1) are nested within j=1,2,…,J classrooms (level 2), which are themselves nested
within k = 1,2,…K schools, and that District #2 students, classrooms, and schools are
representative of an identifiable population. We used a significance level of .05 for all statistical
tests.
Four key data analysis issues surround our use of HLM. First, it is important that the sample
sizes at various levels be large enough to ensure that parameters can be estimated with reasonable

D’Amico, Harwell, Stein and van den Heuvel page 53 Implementation and Effectiveness of a District-Wide Instructional Improvement EffortAERA, Seattle, WA, April 14, 2001
accuracy. For example, the median within-classroom sample size in our HLM analyses was 24
and ranged from 8 to 34. In most cases this should ensure that within-classroom parameters are
estimated with reasonable accuracy. Similarly, most of the level 2 analyses involved sample sizes
that should be large enough to ensure that those parameters are estimated accurately (34-57
classrooms for analyses involving CTB reading and mathematics).
A second data analysis issue is that the statistical assumptions underlying these models need to
be at least approximately satisfied to ensure credible inferences. To this end we examined
residuals for the fitted models and found no serious evidence of nonnormality or
heteroscedasticity. We took advantage of the capability of HLM5 to produce robust standard
errors which are less sensitive to assumption violations, and we report these robust values in the
tables below. We also examined possible model misspecification by plotting residuals against
products of various predictor variables. These plots suggested that interaction-type predictors
were not needed.
A third data analysis issue is the effect of missing data on our inferences. Both the student and
teacher data contained missing values, but for HLM analyses missing data at the teacher level was
more troublesome. Coupled with the fact that HLM analyses only permit missing data at the
student level, these missing values raise several concerns, including the likelihood of inadequate
sample sizes at level 2. For example, we obtained questionnaires from 57 elementary school
teachers in grades 3 and 5 who could be linked to student achievement data, but several teachers
failed to respond to at least one item. The median number of missing responses across 57
teachers for the subscales used in the HLM analyses were professional community (0),
professional development in literacy (5), role of balanced literacy (0), professional development
in mathematics (3), and TERC (1). The missing response patterns were sufficient to render the
data of many teachers unusable for the HLM analyses. Fitting a particular two-level HLM
model in which factor scores representing teacher responses to questionnaire items served as
predictors at level 2 would, because of missing questionnaire data, reduce the number of teachers
to a number that would raise questions about the credibility of the analyses (e.g., 15).
Because the amount of missing data for the teacher’s responses was relatively modest we opted
to impute teacher’s missing values for the subscale items on the questionnaire using the EM-
approach in the SPSS Missing Values Analysis (missing student data were not imputed). This
approach imputes missing values using the information in available data. Essentially, this
procedure fits regression models using predictors believed to account for the reasons data were
missing (missingness) to data in which the variable with missing values is the dependent variable.
The fitted values are then imputed for the missing values (McLachlan, & Krishnan, 1997). The

D’Amico, Harwell, Stein and van den Heuvel page 54 Implementation and Effectiveness of a District-Wide Instructional Improvement EffortAERA, Seattle, WA, April 14, 2001
key assumption underlying this procedure is that missingness can be accounted for by
explanatory variables in such a way that the missing values are missing at random (MAR), and
these explanatory variables are in the data imputation model (Schafer, 1997). If MAR is satisfied
(along with multivariate-normality), then the resulting estimators are unbiased and efficient.
Fortunately, there is evidence that failure to precisely satisfy these assumptions still produces
estimators with desirable statistical properties (Schafer, 1997, pp.26-27).
Once the teacher’s responses for selected subscales were imputed factor scores were created for
the now complete data and used in the HLM analyses—The descriptions of factor analysis and
factor scores in table 14 were based on the incomplete data. The professional community and
balanced literacy subscales had no missing data and so no imputation was done. Where possible,
we performed analyses to assess the sensitivity of our findings to the use of imputed values. For
example, correlations based on incomplete and imputed subscales for literacy using factors scores
tend to be similar:
Incomplete Teachers Data Imputed Teachers DataQuality Prof Dev, %LOWSES -.24 -.12Quality Prof Dev, Principal’s Leadership .63 .63Quality Prof Dev, Balanced Literacy .40 .35Quality ProfDev, Prof Community .70 .62Balanced Literacy, CTB Reading -.19 -.10
These correlations were generally similar to those reported in tables 9 and 10, although there were
a few exceptions. For classroom-level regressions we fitted HLM models (see below) using the
imputed data but we also used the AMOS (Arbuckle, 1999) program to estimate slopes for the
incomplete data. AMOS employs Full Information Maximum Likelihood (FIML) estimation
using available (incomplete) data under the MAR assumption and multivariate-normality. We
found little evidence of strong differences in the estimated slopes and their standard errors using
the FIML approach versus a data imputation approach.
Although many of the correlations/slopes are similar regardless of whether they are based on the
incomplete or imputed teachers responses, it is important to emphasize that the credibility of the
EM approach for imputing missing values depends on the validity of the MAR assumption, not
the similarity of statistics like those presented above. Still, it is comforting when incomplete and
imputed data produce similar findings.
A fourth data problem was that some of the student level predictors showed no variation within
certain classrooms, meaning that those students and their classroom were removed from the

D’Amico, Harwell, Stein and van den Heuvel page 55 Implementation and Effectiveness of a District-Wide Instructional Improvement EffortAERA, Seattle, WA, April 14, 2001
HLM analysis. For example, if all of the students in a classroom were in the low SES group then
a regression model with this predictor could not be fitted to these data. In addition to SES, these
problems emerged for the Ethnicity and LEP predictors. The loss of data because of a lack of
variation can bias our findings.


