Embed Size (px)
Citation preview

lable at ScienceDirect
Energy 93 (2015) 730e739
Contents lists avai
Energy
journal homepage: www.elsevier .com/locate/energy
Exergy analysis of biohydrogen production from various carbonsources via anaerobic photosynthetic bacteria (Rhodospirillum rubrum)
Seyed Sina Hosseini a, Mortaza Aghbashlo a, *, Meisam Tabatabaei b, c, **,Habibollah Younesi d, Ghasem Najafpour e
a Department of Mechanical Engineering of Agricultural Machinery, Faculty of Agricultural Engineering and Technology, College of Agriculture and NaturalResources, University of Tehran, Karaj, Iranb Microbial Biotechnology and Biosafety Department, Agricultural Biotechnology Research Institute of Iran (ABRII), P.O. Box: 31535-1897, Karaj, Iranc Biofuel Research Team (BRTeam), Karaj, Irand Department of Environmental Science, Faculty of Natural Resources, Tarbiat Modares University, Nour, Mazandaran, Irane Faculty of Chemical Engineering, Noshirvani University of Technology, Babol, Iran
a r t i c l e i n f o
Article history:Received 19 May 2015Received in revised form24 August 2015Accepted 13 September 2015Available online xxx
Keywords:BiohydrogenExergyEco-exergyCarbon sourcesRenewability
* Corresponding author. Tel.: þ98 263 2801011; fax** Corresponding author. Biofuel Research Team (BRTel.: þ98 263 2703536; fax: þ98 263 2701067.
E-mail addresses: [email protected] (M. Aghcom (M. Tabatabaei).
http://dx.doi.org/10.1016/j.energy.2015.09.0600360-5442/© 2015 Elsevier Ltd. All rights reserved.
a b s t r a c t
In this study, exergy analysis of batch biohydrogen production through WGS (wateregas shift) reactionusing an anaerobic photosynthetic bacteria Rhodospirillum rubrum was carried out for the first time.Various carbon sources including formate, acetate, malate, glucose, fructose, and sucrose were applied tosupport microbial growth in the presence of CO-rich syngas. The microorganisms utilized carbonmonoxide and produced molecular hydrogen concurrently. The process was analyzed based on bothconventional exergy and eco-exergy concepts for determining the exergetic parameters i.e., exergydestruction and exergy efficiency. Unlike the exergy efficiency, the exergy destruction based on the eco-exergy concept was remarkably lower than what obtained via the conventional exergy theory. Minimumnormalized exergy destruction values of 189.67 and 181.40 kJ/kJ H2 were achieved for acetate as substrateusing the exergy and eco-exergy approaches, respectively. In better words, acetate was identified as themost appropriate carbon source for biohydrogen production from the exergy point of view. Finally, thefindings of this study confirmed that exergy analysis could be employed as an adaptable framework todetermine and compare the renewability of biological hydrogen production using different routes inorder to decide on the most suitable approach and conditions.
© 2015 Elsevier Ltd. All rights reserved.
1. Introduction
Today, more than 80% of the global energy demands are met byfossil-based fuels. The widespread application of such fuelsthrough combustion processes has led to the emissions of COx,SOx, NOx, CxHy, soot, ash, and organic compounds and hasconsequently brought about environmental concerns such asglobal warming [1e4]. In addition to that, the existing fossil fuelresources are depleting and that highlights the importance andurgency to act in haste and further move towards the productionand utilization of renewable energies [5e7]. Amongst various
: þ98 263 2808138.Team), Karaj, Iran.
bashlo), meisam_tab@yahoo.
renewable energy carriers, hydrogen has been proven promisingand is anticipated to play a prominent role in the future of theenergy market [8].
In recent years, different routes have been developed forhydrogen production from various renewable and non-renewablefeedstocks with their own pros and cons [9,10]. Currently,hydrogen is almost entirely produced via natural gas reforming andcoal gasification as well as water electrolysis, and thermochemicaldecomposition [11]. However, to achieve a sustainable and eco-friendly hydrogen production process, hydrogen must be pro-duced from renewable resources instead of employing thedepleting non-renewable origins [12]. In addition to biomassgasification [13] and photosynthetic cells [14], renewable hydrogencan also be produced via natural biocatalysts using CO-rich syn-thetic gas through fermentation [15] and waste sludge [8]. In thepresence of suitable substrates and process conditions, these mi-croorganisms are capable of simultaneously using carbon

S.S. Hosseini et al. / Energy 93 (2015) 730e739 731
monoxide and producing hydrogen in a non-thermal way. Overall,biological hydrogen production is regarded as a promisingapproach for sustainable production of renewable hydrogen energydue to its lower environmental impact as well as smaller capitaland operational costs required [15]. Nevertheless, advanced engi-neering tools should still be employed to assess the sustainability ofthe biological approaches over the conventional routes. Moreover,these advanced tools could be instrumental in justifying the pro-duction of a type of biofuel such as biohydrogen as well as inselecting the most eco-friendly pathway.
Thermodynamic analyses are effective means to obtain moreprecise and valuable information on the sustainability of renewableenergy plans worldwide aimed at dealing with the intensifyingclimate and energy supply crises. Determining the renewability ofan energy resource via the traditional energy assessment ap-proaches, which are based on the first law of thermodynamics, hasbeen criticized owing to their debility in identifying the quality ofenergy flows [16e18]. Therefore, a relatively new version of ther-modynamic indicators namely exergy has been increasinglyemployed to overcome the shortcomings of the conventional en-ergy analysis in terms of assessing the sustainability of renewableenergy projects. In fact, exergy is the maximum theoretical avail-able work obtainable from a system as it reaches a complete ther-modynamic equilibrium with the reference environment [19e22].Exergy analysis based on the first and second law of thermody-namics is regarded as a robust tool for determining the energyquantity and quality of a process more precisely than the traditionalenergy analysis [23].
In the last two decades, exergy analysis has been extensivelyapplied to investigate various available and emerging technologiessuggested for hydrogen production. Rosen [24] first studied thethermodynamic performance of a water-electrolysis process forhydrogen production. More than a decade later, the performance ofhydrogen production via steam-methane reforming was assessedusing exergy analysis [25]. In another survey, Toonssen et al. [26]applied exergy analysis to compare five different commercial orpilot scale gasification systems for producing hydrogen. Exergeticperformance assessment of gasification process followed by steam-methane reforming and shift reactions for hydrogen productionfrom oil palm shell was also carried out by Cohce et al. [27]. In anumber of investigations, Modarresi et al. [12,28] applied exergyanalysis for hydrogen production from starch and sugar as well aslignocellulosic biomass fermentation via thermophilic and photo-heterotrophic bacteria. Even though a number of investigationshave been published on the photobiological hydrogen production,the purpose of those studies was generally on its feasibility andmodeling [29e32]. However, no survey could be found in thepublished literature on exergy analysis of biological hydrogenproduction through fermentation of CO-enriched waste syngasusing anaerobic photosynthetic bacteria. This approach seems likea very promisingmethodology to convert environmentally-harmfulCO contained in waste gas to a useful energy carrier i.e.biohydrogen.
Therefore, this study was aimed to present exergy analysis ofbiohydrogen production by means of WGS (wateregas shift) reac-tion using an anaerobic photosynthetic bacterium (Rhodospirillumrubrum) in a batch fermenter for the first time. In this regard,fermentative hydrogen production was analyzed on the basis ofboth conventional exergy and eco-exergy concepts for evaluatingthe exergetic and renewability parameters. These analyses werecarried out to select the best suitable carbon sources for pilot- andcommercial-scale bioreactors. The outcomes of employing suchanalyses could be of great interest to engineers, designers, andresearchers in order to select the most appropriate substrate andprocess conditions for achieving more economical and eco-friendly
biological hydrogen production. In general, exergy analysis can beapplied as a decision-making tool for developing new renewabletechnologies and retrofitting the existing systems from therenewability and sustainability points of view.
2. Materials and methods
2.1. Biohydrogen production as well as liquid and syngas analyses
The WGS reaction involves the reaction of CO with water toproduce hydrogen. The other product of this process is CO2. Theprocess can be represented by the following equation:
H2Oþ CO/H2 þ CO2 (1)
Fig. 1 schematically manifests the biological WGS reaction forhydrogen production using photosynthetic bacteria. These mi-croorganisms conserve metabolic energy through the formationof H2 while CO serves as the carbon source, electron donor, andenergy source. More specifically, CO is oxidized by a monofunc-tional CO dehydrogenase and the electrons released through theoxidation are transferred to an ECH (energy converting hydrog-enase) that reduces protons to molecular hydrogen [33]. Inaddition, ECH couples the formation of H2 to the membranetranslocation of protons or sodium ions [33]. During thehydrogen production process through the WGS reaction, CO2 as agreenhouse gas contributor is also produced. Therefore, toimprove the environmental aspects of the process, extra mea-sures should be taken in order to mitigate the generated CO2.These measures could include different methods offered toconvert CO2 into value-added products such as CO2-to-fuelthrough thermochemical, photochemical, and electrochemicalconversion processes [34].
The detailed information on the biological hydrogen productionin a batch fermenter can be found elsewhere [15]. Briefly, R. rubrumATCC 25903 acquired from the American Type Culture Collectionswas applied in the current survey. This bacteriumwas incubated at30 �C in a sealed stoppered serum bottle with a volume of 163 mlafter hydrating and growing on malic acid. Serum bottles werefilled with 50ml culture medium under nitrogen gas and were thensterilized at 121 �C for 15 min. Then, 5% (v/v) seed culture wasadded to each bottle. The pH of the mediumwas adjusted to 7.5 byadding 0.2 M HCl and base 0.2 M NaOH solutions. The liquid culturemedia during hydrogen production was similar to the culture me-dia except various carbon sources e.g., malate, acetate, formate,fructose, glucose, and sucrose were employed. Table 1 lists thecompositions of the liquid culture media in 1000 ml. Moreover,synthetic gas with 55% CO, 20% H2, 15% Ar, and 10% CO2 was used topurge the serum bottles. A 60 W tungsten lamp was used to supplya uniform light intensity of 1000 lux on the surface of the serumbottles. The initial pressure of bioreactor was set to 1 atm. Anorbital shaker (B Braun, Germany) was applied to shake the serumbottles at a constant speed of 200 rpm during biohydrogenproduction.
Experiments were replicated twice and the average values wereused in the exergetic calculations. Exergy analysis of the bioreactorwas performed by using the data obtained from the experimentsconducted by applying various carbon sources as substrate.Generally, the exergy analysis of bioreactors could providecomprehensive and in-depth insights into the process, includingthe destructed exergy in the fermentation process, optimumoperational conditions, appropriate substrate, and etc. The mostimportant feature of the exergy analysis is its capability in therecognition of sustainable methods of using energy sources.

Fig. 1. Schematic illustration of biological hydrogen production via water-gas shift reaction using specific microorganisms Adopted from Henstra et al. [33]. Copyright (2015), withpermission from Elsevier.
S.S. Hosseini et al. / Energy 93 (2015) 730e739732
2.2. Sampling and analytical methods
Gas sampling (200 ml) was performed every 12 h from the gasphase of each serum bottle using a Hamilton gastight syringe(Nevada). The samples were analyzed using a Perkin Elmer Auto-system XL gas chromatograph (USA), equipped with TCD (thermalconductivity detector), a Carboxen 1000, 100/120 mesh column(Supelco, USA), and the Total Chrom software. Helium was used asthe carrier gas with a flow rate of 30 ml/min. Temperature pro-gramming was carried out as previously described by Najafpouret al. [15]. Briefly, the column temperature was maintained at 40 �Cfor 3.5 min followed by increasing the temperature to 180 �C at arate of 20 �C/min. The detector and injector temperatures were 200and 150 �C, respectively.
Table 1Compositions of liquid culture media in 1000 ml.
Component Values
Formate 2 g/LMalate 2.5 g/LAcetate 1.5 g/LGlucose 2 g/LFructose 2 g/LSucrose 2 g/LYeast extract 1 g/LAmmonium sulfate 1.25 g/LMagnesium sulfate heptahydrate 0.2 g/LCalcium chloride dihydrate 0.07 g/LFerric citrate 0.01 g/LEthylenediaminetetraacetic acid (EDTA) 0.02 g/LPotassium dihydrogen phosphate 0.6 g/LDipotassium hydrogen phosphate 0.9 g/L
Trace metal solution 1 mL/L
Zinc sulfate heptahydrate 0.01 g/LMagnesium sulfate heptahydrate 0.02 g/LBoric acid 0.01 g/LFerric citrate 3 g/LCopper sulfate pentahydrate 0.01 g/LEDTA 0.5 g/LAmmonium molybdate heptahydrate 0.02 g/LCalcium chloride dihydrate 0.2 g/L
B-vitamin solution 7.5 mL/L
Nicotinamide 0.2 g/LThiamine HCl 0.4 g/LNicotinic acid 0.2 g/LBiotin 0.008 g/LWater Up to 1000 mL
The optical density of the liquid samples was analyzed using aCecil 1000 spectrophotometer (Cambridge, UK) to determineR. rubrum cell concentration using the previously developed stan-dard calibration curve. Sugar and total carbohydrate contents weremeasured using DNS reagent and orcinol in sulfuric acid solutionbased on the spectrophotometric method previously described[35]. Malate was determined by using the pyrogallol/sulfuric acidmethod as elaborated by Carel [36] while formatewas measured bya colorimetric method in which HCOOH is determined; also knownas Nash assay [37]. The acetate concentration in the media wasinvestigated by a Hewlett Packard gas chromatography (USA)equipped with a FID (flame ionization detector) and a Carbopack B-DA/4% Carbowax 20M column (2.0 m length, 0.2 cm ID, and 80/120mesh) (Supelco, USA). Nitrogen was used as the carrier gas with aflow rate of 25 ml/min. The oven temperature was set at 175 �C,while the temperature of both detector and injector were adjustedat 225 �C. A defined concentration of 1-propanol was used as in-ternal standard.
2.3. Theoretical consideration
A schematic view of biological hydrogen production usingphotosynthetic bacterium in a batch fermenter with input andoutput terms is depicted in Fig. 2.
According to Fig. 2, the exergy balance equation for serumbottles containing synthetic gas, culture media, and micro
Fig. 2. Schematic illustration of biological hydrogen production using photosyntheticbacterium.

S.S. Hosseini et al. / Energy 93 (2015) 730e739 733
organisms (all considered as control mass) can be written asfollows:
ExCM;t þ ExSG;t þ ExMO;t þ ExOS þ ExDL
¼ ExCM;tþDt þ ExSG;tþDt þ ExMO;tþDt þ Exdes (2)
where ExCM , ExSG, and ExMO are the exergetic values of culturemedia, synthetic gas, and microorganisms, respectively, at times tand t þ Dt, ExDL and ExOS are the exergetic values delivered to theculture media from the tungsten light and orbital shaker, respec-tively, and Exdes is the exergy destruction (kJ).
The exergetic value of the culture media was determined usingthe following equation [38]:
ExCM ¼ n
Xi
xiεi þℛT0Xi
xilnðxiÞ!
(3)
where n is the mole number of culture media, xi is the molarfraction of each component, εi (in terms of kJ/mol) is the standardchemical exergy of i th component, ℛ is the gas constant(0.008314 kJ/mol. K), and T0 is the dead state temperature (30 �C).The specific chemical exergy of organic materials applied for theculture media preparation were computed using the formula pro-posed by Song et al. [39].
exOM;i ¼ 363:439C þ 1075:633H � 86:308Oþ 4:14N
þ 190:798S� 21:1A (4)
εOM;i ¼ MOM;iexOM;i (5)
where exOM and MOM are the specific chemical exergy (kJ/kg) andmolecular mass of an organic material (kg/mol), respectively, whileC, H, O, N, S and A are the percentages of carbon, hydrogen, oxygen,nitrogen, sulfur, and ash of an organic material, respectively.
Moreover, the standard chemical exergy of the inorganic ma-terials used in the present study were compiled from the literature[40] (Table 2).
The chemical exergy of the synthetic gas was obtained asfollows:
ExSG ¼ n
Xi
xiεi þℛT0Xi
xi lnðxiÞ þℛT0ln�PP0
�!(6)
where P and P0 are the pressure of syngas and dead state (kPa),respectively. The dead state pressure was assumed to be 100 kPa.The standard chemical exergy of the synthetic gas components isgiven in Table 3.
The chemical exergetic value of the microorganism was ob-tained as follows:
ExMO ¼ 18:7mMO (7)
where mMO is the mass of microorganisms and 18.7 kJ/g is thechemical exergy content of average detritus [42,43].
To compute the light exergy delivered to the culture media,firstly, the exergy balance equation for the tungsten lamp waspresented according to the theory proposed by Asada and Shukuya[44]. The energy balance equation for the tungsten lamp wasexpressed as follows:
WEL ¼ LR þ qTL (8)
whereWEL is the supplied electrical power to cap, LR is the radiationenergy emitted from bulb surface, and qTL is the heat transferred
from lamp bulb surface. Moreover, the entropy balance was ob-tained using the following equation:
Sel þ Sgen ¼ Srad þqTLTTL
(9)
where Sel is the entropy flux accompanied by electricity supply, Sgenis the total entropy generated at the lamp subsystems, Srad is theentropy flux accompanied by radiation energy emitted from lampsurface, and TTL is the surface temperature of tungsten lamp. Thevalue of Sel was considered to be zero since thework is entropy free.Finally, the exergy balance was written as follows:
Exel ¼ Exrad þ�1� T0
TTL
�qTL þ Exdes;TL (10)
where Exel is the exergy flux of electrical power, Exrad is the exergyflux accompanied by visible radiation emitted by the tungstenlamp, and Exdes;TL is the total exergy destruction in tungsten lampsubsystems. The overall exergy destruction of tungsten lamp andthe exergy flux of visible radiation emitted by the tungsten lampwere determined using the following equations:
Exdes;TL ¼ T0Sgen (11)
Exrad ¼ LR � T0Srad (12)
According to the above mentioned theory, Shukuya [45] foundthat about 34% of the incident light from incandescent lamp(tungsten lamp) was useful work or exergy. On this basis, the lightexergy delivered to the culture media was calculated using thefollowing equation:
ExDL ¼ ð1� CrÞaAITLDt (13)
where Cr is the reflection coefficient of serum bottle, a is the energyto exergy ratio (0.34), A is the surface area of serum bottle receivingthe light (m2), ITL is the light intensity (W/m2), and Dt is the timestep between two successive measurement.
In this study, the serum bottle was considered a transparentmaterial which reflects a known fraction of the received light. Theincidence angle of the light intercepting the serum bottle couldaffect the amount of reflection occurring. This was considered inthe range of 0e90� in the present study. The reflection coefficient ofthe incident light can be obtained using the Fresnel equations [46]:
Cr ¼ 12
����n1 cos qi � n2 cos qtn1 cos qi þ n2 cos qt
����2 þ 12
����n1 cos qt � n2 cos qin1 cos qt þ n2 cos qi
����2 (14)
where Cr is the reflection coefficient of the incident light, n1 is therefractive index of the air at standard condition for temperature andpressure (1.00027), n2 is the refractive index of the serum bottle(1.47, Borosilicate glass), qi is the angle between the incident lightand the normal of the interface, and qt is the angle between thetransmitted light and the normal of the interface which can beobtained using the Snell's law [47]:
sin qi=sin qt ¼ n2=n1 (15)
On the issue of the impact of roughness and thickness of serumbottles on the refraction of the light rays, it is worth quoting thatthe roughness of glassy materials (also known as smoothmaterials)is low, hence, the effect of roughness on serum bottles (as a smoothmaterial) can be neglected [46,47]. The refraction of light ray isdefined as the change in light direction due to a change in itstransmission medium (change in refraction index). According to
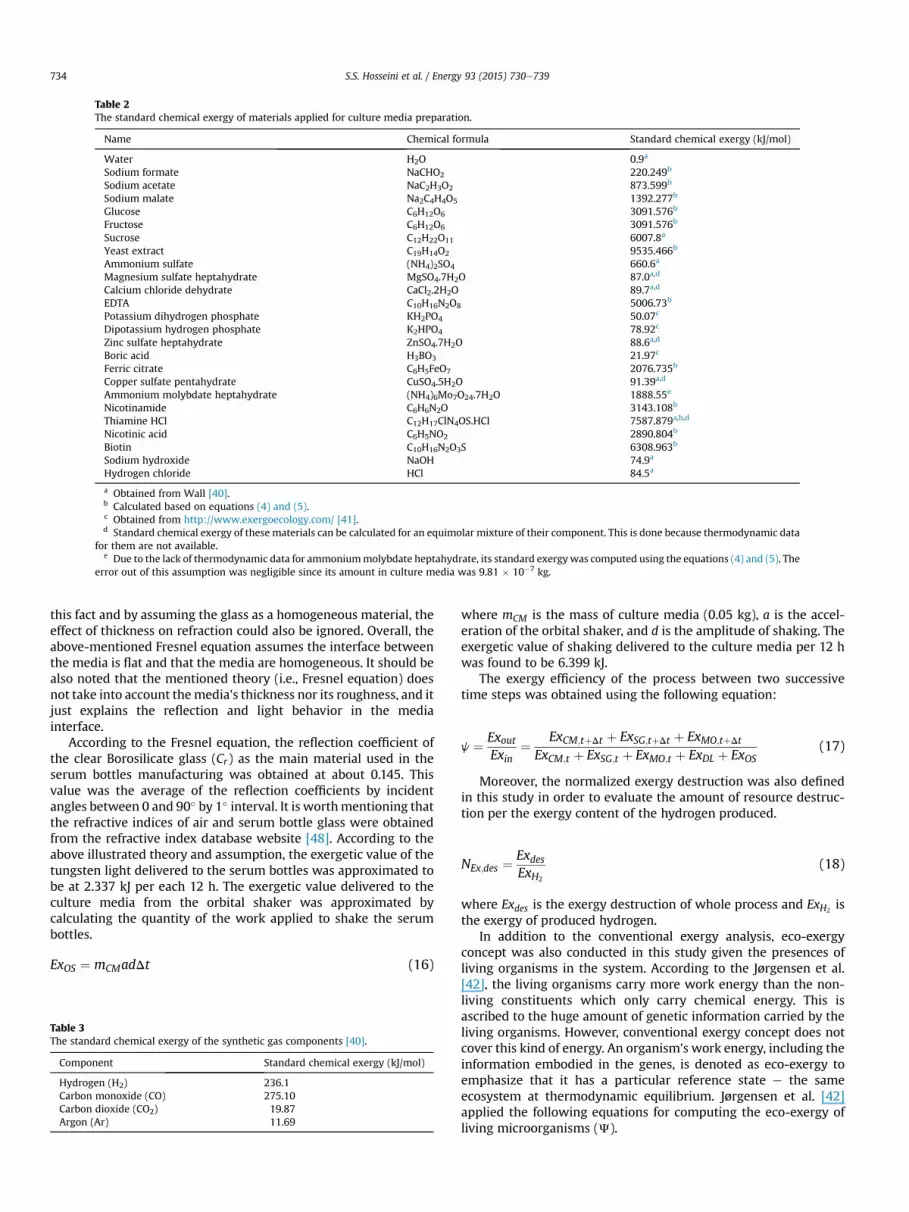
Table 2The standard chemical exergy of materials applied for culture media preparation.
Name Chemical formula Standard chemical exergy (kJ/mol)
Water H2O 0.9a
Sodium formate NaCHO2 220.249b
Sodium acetate NaC2H3O2 873.599b
Sodium malate Na2C4H4O5 1392.277b
Glucose C6H12O6 3091.576b
Fructose C6H12O6 3091.576b
Sucrose C12H22O11 6007.8a
Yeast extract C19H14O2 9535.466b
Ammonium sulfate (NH4)2SO4 660.6a
Magnesium sulfate heptahydrate MgSO4.7H2O 87.0a,d
Calcium chloride dehydrate CaCl2.2H2O 89.7a,d
EDTA C10H16N2O8 5006.73b
Potassium dihydrogen phosphate KH2PO4 50.07c
Dipotassium hydrogen phosphate K2HPO4 78.92c
Zinc sulfate heptahydrate ZnSO4.7H2O 88.6a,d
Boric acid H3BO3 21.97c
Ferric citrate C6H5FeO7 2076.735b
Copper sulfate pentahydrate CuSO4.5H2O 91.39a,d
Ammonium molybdate heptahydrate (NH4)6Mo7O24.7H2O 1888.55e
Nicotinamide C6H6N2O 3143.108b
Thiamine HCl C12H17ClN4OS.HCl 7587.879a,b,d
Nicotinic acid C6H5NO2 2890.804b
Biotin C10H16N2O3S 6308.963b
Sodium hydroxide NaOH 74.9a
Hydrogen chloride HCl 84.5a
a Obtained from Wall [40].b Calculated based on equations (4) and (5).c Obtained from http://www.exergoecology.com/ [41].d Standard chemical exergy of these materials can be calculated for an equimolar mixture of their component. This is done because thermodynamic data
for them are not available.e Due to the lack of thermodynamic data for ammoniummolybdate heptahydrate, its standard exergywas computed using the equations (4) and (5). The
error out of this assumption was negligible since its amount in culture media was 9.81 � 10�7 kg.
S.S. Hosseini et al. / Energy 93 (2015) 730e739734
this fact and by assuming the glass as a homogeneous material, theeffect of thickness on refraction could also be ignored. Overall, theabove-mentioned Fresnel equation assumes the interface betweenthe media is flat and that the media are homogeneous. It should bealso noted that the mentioned theory (i.e., Fresnel equation) doesnot take into account themedia's thickness nor its roughness, and itjust explains the reflection and light behavior in the mediainterface.
According to the Fresnel equation, the reflection coefficient ofthe clear Borosilicate glass (Cr) as the main material used in theserum bottles manufacturing was obtained at about 0.145. Thisvalue was the average of the reflection coefficients by incidentangles between 0 and 90� by 1� interval. It is worthmentioning thatthe refractive indices of air and serum bottle glass were obtainedfrom the refractive index database website [48]. According to theabove illustrated theory and assumption, the exergetic value of thetungsten light delivered to the serum bottles was approximated tobe at 2.337 kJ per each 12 h. The exergetic value delivered to theculture media from the orbital shaker was approximated bycalculating the quantity of the work applied to shake the serumbottles.
ExOS ¼ mCMadDt (16)
Table 3The standard chemical exergy of the synthetic gas components [40].
Component Standard chemical exergy (kJ/mol)
Hydrogen (H2) 236.1Carbon monoxide (CO) 275.10Carbon dioxide (CO2) 19.87Argon (Ar) 11.69
where mCM is the mass of culture media (0.05 kg), a is the accel-eration of the orbital shaker, and d is the amplitude of shaking. Theexergetic value of shaking delivered to the culture media per 12 hwas found to be 6.399 kJ.
The exergy efficiency of the process between two successivetime steps was obtained using the following equation:
j ¼ ExoutExin
¼ ExCM;tþDt þ ExSG;tþDt þ ExMO;tþDt
ExCM;t þ ExSG;t þ ExMO;t þ ExDL þ ExOS(17)
Moreover, the normalized exergy destruction was also definedin this study in order to evaluate the amount of resource destruc-tion per the exergy content of the hydrogen produced.
NEx;des ¼ExdesExH2
(18)
where Exdes is the exergy destruction of whole process and ExH2is
the exergy of produced hydrogen.In addition to the conventional exergy analysis, eco-exergy
concept was also conducted in this study given the presences ofliving organisms in the system. According to the Jørgensen et al.[42], the living organisms carry more work energy than the non-living constituents which only carry chemical energy. This isascribed to the huge amount of genetic information carried by theliving organisms. However, conventional exergy concept does notcover this kind of energy. An organism's work energy, including theinformation embodied in the genes, is denoted as eco-exergy toemphasize that it has a particular reference state e the sameecosystem at thermodynamic equilibrium. Jørgensen et al. [42]applied the following equations for computing the eco-exergy ofliving microorganisms (J).

Fig. 3. Effects of various carbon sources on CO consumption rate (A), H2 productionrate (B), and CO2 production rate (C).
S.S. Hosseini et al. / Energy 93 (2015) 730e739 735
J
RT0¼ 7:34� 105ExMO
þ ExMO ln20number of nucletodites ð1�number of repeating genesÞ=3
(19)
b¼1
þ ln20 number of nucleotides 1�number of repeating genesð Þð Þ3�7:34�105
(20)
Since ln20z3, therefore, the above equation could be simplifiedas follows:
b ¼ 1þ number of nucleotides 1� number of repeating genesð Þ7:34� 105
(21)
where b is the ratio of the eco-exergy to the chemical exergyaccounting for how information is embodied in a given microor-ganisms and has been found to be 8.5 for bacteria [42].
Consequently, the eco-exergetic value of microorganisms (J)was obtained as follows:
J ¼ 18:7� 8:5mMO (22)
Finally, the exergy destruction based on the eco-exergy conceptwas computed by substituting the chemical exergy content of themicroorganisms with its eco-exergy value as follows:
ExCM;t þ ExSG;t þJMO;t þ ExOS þ ExDL
¼ ExCM;tþDt þ ExSG;tþDt þJMO;tþDt þ Exdes (23)
3. Results and discussions
The effect of substrates on CO consumption rate, as well as H2and CO2 production rates were comprehensively reported anddiscussed in our previous publication [15]. However, these resultshave been brought herein as well for clarification and ease ofcomprehension of the exergetic outcomes achieved in the presentwork (Fig. 3A, B, and C). As could be easily seen, sucrose led to thehighest CO consumption and CO2 production rates. However, thehighest H2 production rate belonged to acetate.
Fig. 4 presents the variations in the synthetic gas exergy overfermentation time (120 h) for various carbon sources. It is clearfrom Fig. 4 that the exergy of the synthetic gas for all carbonsources decreased as the fermentation process progressed. Thiscould be related to the consumption of the carbon monoxide withhigher content of chemical exergy and subsequent production ofhydrogen and carbon dioxide with lower amount of chemicalexergy through the WGS reaction (See Table 3). However, thisreduction for the culture media containing sucrose as substratewas very extensive than for the other substrates. This might beascribed to the lower hydrogen production using this substratecompared to the carbon monoxide consumption. Moreover, theexergy value of the synthetic gas through the serum bottles con-taining fructose, glucose, and acetate as carbon sources showedalmost similar trends.
Fig. 5 reveals the exergy changes of the culture media using thevarious carbon sources against the fermentation time. The exergyvalue of the culture media for all the investigated substratesdiminished by time. The most likely explanation for this resultcould be the fact that during the fermentation process, substrateand water available in the liquid culture media were consumed for
microorganism growth and hydrogen production, respectively.However, this decrement in case of the culture media containingformatewas trivial due to the lower amount of substrate utilized formicroorganisms growth and smaller magnitude of water partici-pated in the WGS reaction. Additionally, the maximum exergyreduction of the culture media was observed in the fructose-containing media, noteworthy due to the intensive consumptionof this substrate by the microorganisms.
Fig. 6A and B represents the effects of various carbon sources onexergy of microorganisms using both conventional exergy and eco-exergy concepts as a function of fermentation time, respectively.

Fig. 4. Effect of various carbon sources on exergy of synthetic gas.
Fig. 6. Effect of various carbon sources on exergy of microorganisms using A) con-ventional exergy and, B) eco-exergy concepts.
S.S. Hosseini et al. / Energy 93 (2015) 730e739736
Obviously, the exergy and eco-exergy values of microorganismsincreased nonlinearly with time and remained almost constantafter 48e60 h. The initial rapid increase of exergy and eco-exergyvalues was related to the fast growth of microorganism withinthe low population density culture media. However, the microbialgrowth decreased or even ceased after 48e60 h and accordinglylowered the exergy and eco-exergy increments. The minimum andmaximum exergy and eco-exergy values of the microorganismwere found when sucrose and fructose were used as carbon sour-ces, respectively. Moreover, the chemical exergy and eco-exergy forglucose and acetate were in the middle range. These findings werein good agreement with the cell dry weight reported by Najafpouret al. [15], since the exergy and eco-exergy contents of the micro-organisms are directly proportional to the cell weight according tothe equations (7) and (22). A comparison between Figs. 6A and 6Breveal that the eco-exergy value of a given culture medium wasdrastically higher than its corresponding chemical exergy value.This could be ascribed to the fact that the eco-exergy conceptconsiders thework of information carried bymicroorganisms in theexergetic calculation as well. However, both exergy and eco-exergyquantities of the microorganisms in a given culture medium hadsimilar trends since the eco-exergy of the microorganisms wascomputed by multiplying the weighting factor (b) and chemicalexergy content of the microorganisms (equation (22)). It should be
Fig. 5. Effect of various carbon sources on exergy of liquid culture media.
mentioned that the classical exergy analysis might lead tomisleading results in systems containing living organisms becauseof ignoring the work energy associated with the informationembodied in their genomes.
Fig. 7 exhibits the variations in exergy destruction of the COfermentation process in various culture media using both conven-tional exergy (Fig. 7A) and eco-exergy (Fig. 7B) concepts. A com-parison between the two graphs discloses that the exergydestruction based on the eco-exergy concept was lower than theconventional exergy approach. This is because of considering workenergy in form of the information embodied in the amino acidsequence by eco-exergy concept. As mentioned previously, theconventional exergy disregards the exergy carried by the livingorganisms. Neglecting the work of information carried by micro-organisms represents another expression for the work loss, leadingto the higher exergy destruction via the conventional exergyanalysis.
In general, the exergy destruction using the conventional exergyapproach increased with fermentation time and reached itsmaximum value after 48 h. This could probably be related to thecessation of the cell growth after 48 h of the fermentation process.However, the exergy destruction based on the eco-exergy conceptcontinuously increased from the very initial state of the process andremained almost constant after 48 h. This meant that the work ofinformation carried by living organisms was the most important

Fig. 7. Effect of various carbon sources on exergy destruction of the process using A)conventional exergy and, B) eco-exergy concepts.
Fig. 8. Effect of various carbon sources on exergy efficiency using, A) conventionalexergy and, B) eco-exergy concepts.
S.S. Hosseini et al. / Energy 93 (2015) 730e739 737
factor affecting the exergy destruction based on the eco-exergytheory. In another word, the exergy destruction based on the eco-exergy concept was lower at the beginning of the process due tothe rapid microbial growth. At the end of the process, the eco-exergy-based exergy destruction increased because of the negli-gible growth of microorganisms.
The exergy efficiencies of the biohydrogen production processbased on the conventional exergy and eco-exergy approaches usingvarious carbon sources are presented in Fig. 8A and B, respectively.Obviously, the exergy efficiency of the process decreased slightly onthe basis of the conventional exergy analysis with progressing thefermentation process. This could be attributed to the greater exergydestruction towards the end of the process due to the reduction ofcell growth. In another word, the major part of the supplied lightand mechanical exergies to the bioreactor was destructed withoutuseful application for cell growth and hydrogen production after48 h. This means that the exergy efficiency of the process could beincreased by eliminating the light after the growth stage. In fact, themicroorganisms consumed carbon monoxide after 48 h to obtainenergy via WGS reaction. The exergy efficiency of the process forformatewas lower than for the other carbon sources because of theslow growth rate of organisms using this carbon substrate. More-over, the exergy efficiency of the fermentation process for fructosedrastically decreased between 36 and 60 h due to its rapid con-sumption at this time interval (see also Fig. 5). Generally, it could beroughly concluded that the exergy of the culture media and exergy
efficiency of the process possessed similar trends with fermenta-tion time.
Unlike the conventional exergy efficiency, the eco-exergy effi-ciency of the process did not decrease with fermentation time.Given the fact that the eco-exergy approach distinguishes betweenthe living and non-living organisms, the value of eco-exergy effi-ciency was remarkably higher than the exergy efficiency. The mainreason for such high eco-exergy efficiency was the low eco-exergydestruction during the fermentation process due to the inclusion ofthe structures and information of the living organisms as usefulwork. The maximum and minimum eco-exergy efficiency valuescalculated belonged to fructose and formate, respectively. Thismight be related to the microorganism growth and correspondingeco-exergy value as shown in Fig. 6.
The effect of various carbon sources on the normalized exergydestruction using the conventional exergy and eco-exergy conceptsis depicted in Fig. 9, respectively. The minimum normalized exergydestruction using acetate as carbon sourcewas found to be at 189.67and 181.40 kJ/kJ H2 using the conventional exergy and eco-exergyconcepts, respectively. A comparison between the normalizedexergy destruction obtained for various carbon sources indicatedthat acetate was the best substrate for biohydrogen productionusing R. rubrum as an anaerobic photosynthetic bacteria. Moreover,the normalized exergy destruction based on the eco-exergy conceptwas slightly lower than what obtained using the conventionalexergy approach. This could be attributed to the fact that the overall
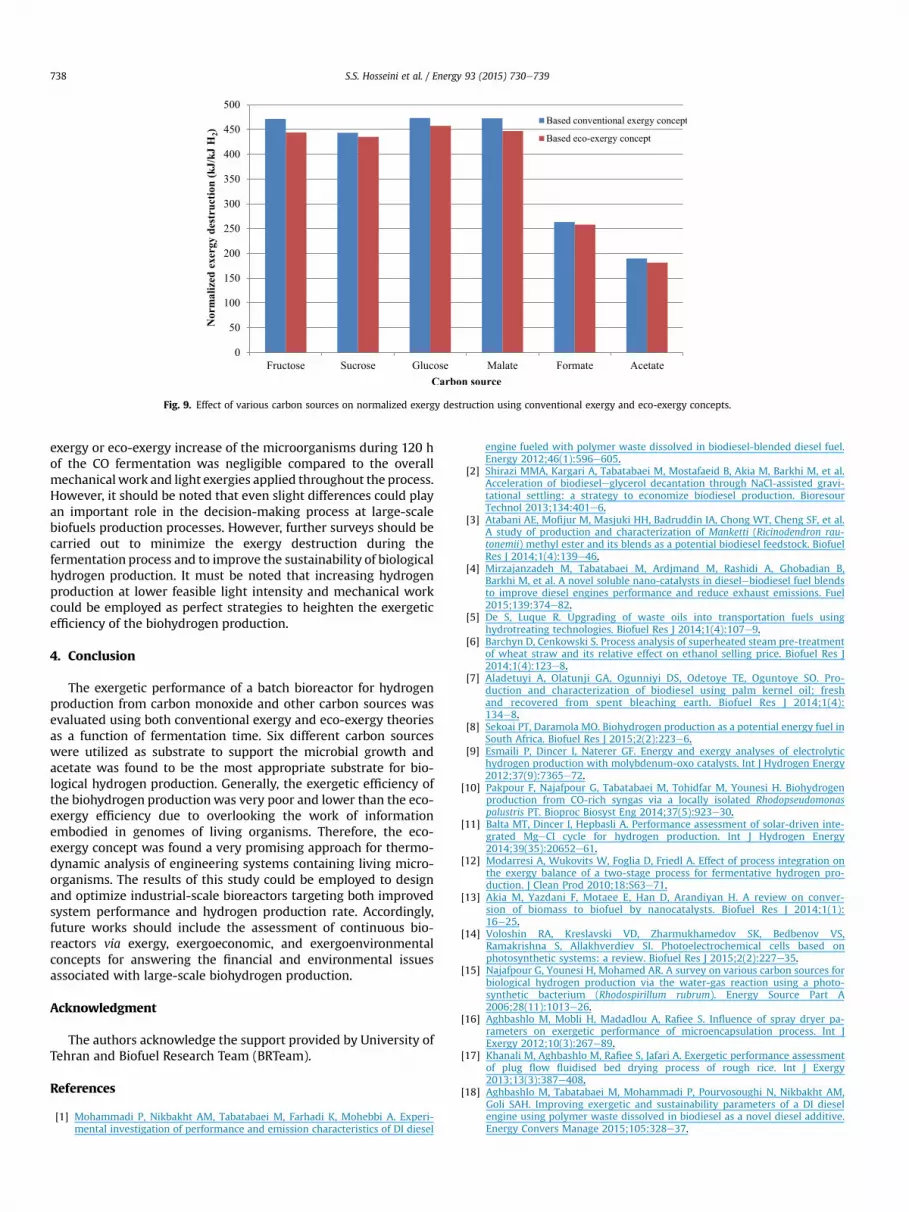
Fig. 9. Effect of various carbon sources on normalized exergy destruction using conventional exergy and eco-exergy concepts.
S.S. Hosseini et al. / Energy 93 (2015) 730e739738
exergy or eco-exergy increase of the microorganisms during 120 hof the CO fermentation was negligible compared to the overallmechanical work and light exergies applied throughout the process.However, it should be noted that even slight differences could playan important role in the decision-making process at large-scalebiofuels production processes. However, further surveys should becarried out to minimize the exergy destruction during thefermentation process and to improve the sustainability of biologicalhydrogen production. It must be noted that increasing hydrogenproduction at lower feasible light intensity and mechanical workcould be employed as perfect strategies to heighten the exergeticefficiency of the biohydrogen production.
4. Conclusion
The exergetic performance of a batch bioreactor for hydrogenproduction from carbon monoxide and other carbon sources wasevaluated using both conventional exergy and eco-exergy theoriesas a function of fermentation time. Six different carbon sourceswere utilized as substrate to support the microbial growth andacetate was found to be the most appropriate substrate for bio-logical hydrogen production. Generally, the exergetic efficiency ofthe biohydrogen productionwas very poor and lower than the eco-exergy efficiency due to overlooking the work of informationembodied in genomes of living organisms. Therefore, the eco-exergy concept was found a very promising approach for thermo-dynamic analysis of engineering systems containing living micro-organisms. The results of this study could be employed to designand optimize industrial-scale bioreactors targeting both improvedsystem performance and hydrogen production rate. Accordingly,future works should include the assessment of continuous bio-reactors via exergy, exergoeconomic, and exergoenvironmentalconcepts for answering the financial and environmental issuesassociated with large-scale biohydrogen production.
Acknowledgment
The authors acknowledge the support provided by University ofTehran and Biofuel Research Team (BRTeam).
References
[1] Mohammadi P, Nikbakht AM, Tabatabaei M, Farhadi K, Mohebbi A. Experi-mental investigation of performance and emission characteristics of DI diesel
engine fueled with polymer waste dissolved in biodiesel-blended diesel fuel.Energy 2012;46(1):596e605.
[2] Shirazi MMA, Kargari A, Tabatabaei M, Mostafaeid B, Akia M, Barkhi M, et al.Acceleration of biodieseleglycerol decantation through NaCl-assisted gravi-tational settling: a strategy to economize biodiesel production. BioresourTechnol 2013;134:401e6.
[3] Atabani AE, Mofijur M, Masjuki HH, Badruddin IA, Chong WT, Cheng SF, et al.A study of production and characterization of Manketti (Ricinodendron rau-tonemii) methyl ester and its blends as a potential biodiesel feedstock. BiofuelRes J 2014;1(4):139e46.
[4] Mirzajanzadeh M, Tabatabaei M, Ardjmand M, Rashidi A, Ghobadian B,Barkhi M, et al. A novel soluble nano-catalysts in dieselebiodiesel fuel blendsto improve diesel engines performance and reduce exhaust emissions. Fuel2015;139:374e82.
[5] De S, Luque R. Upgrading of waste oils into transportation fuels usinghydrotreating technologies. Biofuel Res J 2014;1(4):107e9.
[6] Barchyn D, Cenkowski S. Process analysis of superheated steam pre-treatmentof wheat straw and its relative effect on ethanol selling price. Biofuel Res J2014;1(4):123e8.
[7] Aladetuyi A, Olatunji GA, Ogunniyi DS, Odetoye TE, Oguntoye SO. Pro-duction and characterization of biodiesel using palm kernel oil; freshand recovered from spent bleaching earth. Biofuel Res J 2014;1(4):134e8.
[8] Sekoai PT, Daramola MO. Biohydrogen production as a potential energy fuel inSouth Africa. Biofuel Res J 2015;2(2):223e6.
[9] Esmaili P, Dincer I, Naterer GF. Energy and exergy analyses of electrolytichydrogen production with molybdenum-oxo catalysts. Int J Hydrogen Energy2012;37(9):7365e72.
[10] Pakpour F, Najafpour G, Tabatabaei M, Tohidfar M, Younesi H. Biohydrogenproduction from CO-rich syngas via a locally isolated Rhodopseudomonaspalustris PT. Bioproc Biosyst Eng 2014;37(5):923e30.
[11] Balta MT, Dincer I, Hepbasli A. Performance assessment of solar-driven inte-grated MgeCl cycle for hydrogen production. Int J Hydrogen Energy2014;39(35):20652e61.
[12] Modarresi A, Wukovits W, Foglia D, Friedl A. Effect of process integration onthe exergy balance of a two-stage process for fermentative hydrogen pro-duction. J Clean Prod 2010;18:S63e71.
[13] Akia M, Yazdani F, Motaee E, Han D, Arandiyan H. A review on conver-sion of biomass to biofuel by nanocatalysts. Biofuel Res J 2014;1(1):16e25.
[14] Voloshin RA, Kreslavski VD, Zharmukhamedov SK, Bedbenov VS,Ramakrishna S, Allakhverdiev SI. Photoelectrochemical cells based onphotosynthetic systems: a review. Biofuel Res J 2015;2(2):227e35.
[15] Najafpour G, Younesi H, Mohamed AR. A survey on various carbon sources forbiological hydrogen production via the water-gas reaction using a photo-synthetic bacterium (Rhodospirillum rubrum). Energy Source Part A2006;28(11):1013e26.
[16] Aghbashlo M, Mobli H, Madadlou A, Rafiee S. Influence of spray dryer pa-rameters on exergetic performance of microencapsulation process. Int JExergy 2012;10(3):267e89.
[17] Khanali M, Aghbashlo M, Rafiee S, Jafari A. Exergetic performance assessmentof plug flow fluidised bed drying process of rough rice. Int J Exergy2013;13(3):387e408.
[18] Aghbashlo M, Tabatabaei M, Mohammadi P, Pourvosoughi N, Nikbakht AM,Goli SAH. Improving exergetic and sustainability parameters of a DI dieselengine using polymer waste dissolved in biodiesel as a novel diesel additive.Energy Convers Manage 2015;105:328e37.

S.S. Hosseini et al. / Energy 93 (2015) 730e739 739
[19] Aghbashlo M, Mobli H, Madadlou A, Rafiee S. Integrated optimization of fishoil microencapsulation process by spray drying. J Microencapsul 2012;29(8):790e804.
[20] Aghbashlo M, Mobli H, Rafiee S, Madadlou A. Optimization of emulsificationprocedure for mutual maximizing the encapsulation and exergy efficiencies offish oil microencapsulation. Powder Technol 2012;225:107e17.
[21] Aghbashlo M, Mobli H, Rafiee S, Madadlou A. The use of artificial neuralnetwork to predict exergetic performance of spray drying process: a pre-liminary study. Comput Electron Agr 2012;88:32e43.
[22] Aghbashlo M. Exergetic simulation of a combined infrared-convective dryingprocess. Heat Mass Transf 2015. http://dx.doi.org/10.1007/s00231-015-1594-3.
[23] Aghbashlo M, Mobli H, Rafiee S, Madadlou A. Energy and exergy analyses ofthe spray drying process of fish oil microencapsulation. Biosyst Eng2012;111(2):229e41.
[24] Rosen MA. Energy and exergy analyses of electrolytic hydrogen production.Int J Hydrogen Energy 1995;20(7):547e53.
[25] Simpson AP, Lutz AE. Exergy analysis of hydrogen production via steammethane reforming. Int J Hydrogen Energy 2007;32(18):4811e20.
[26] Toonssen R, Woudstra N, Verkooijen AH. Exergy analysis of hydrogen pro-duction plants based on biomass gasification. Int J Hydrogen Energy2008;33(15):4074e82.
[27] Cohce MK, Rosen MA, Dincer I. Efficiency evaluation of a biomass gasification-based hydrogen production. Int J Hydrogen Energy 2011;36(17):11388e98.
[28] Modarresi A, Wukovits W, Friedl A. Application of exergy balances for eval-uation of process configurations for biological hydrogen production. ApplTherm Eng 2010;30(1):70e6.
[29] Yang H, Shao P, Lu T, Shen J, Wang D, Xu Z, et al. Continuous bio-hydrogenproduction from citric acid wastewater via facultative anaerobic bacteria.Int J Hydrogen Energy 2006;31(10):1306e13.
[30] Kapdan IK, Kargi F. Bio-hydrogen production from waste materials. EnzymeMicrob Tech 2006;38(5):569e82.
[31] Burgess G, Fern�andez-Velasco JG. Materials, operational energy inputs, andnet energy ratio for photobiological hydrogen production. Int J HydrogenEnergy 2007;32(9):1225e34.
[32] Dickson DJ, Page CJ, Ely RL. Photobiological hydrogen production from Syn-echocystis sp. PCC 6803 encapsulated in silica solegel. Int J Hydrogen Energy2009;34(1):204e15.
[33] Henstra AM, Sipma J, Rinzema A, Stams AJ. Microbiology of synthesisgas fermentation for biofuel production. Curr Opin Biotech 2007;18(3):200e6.
[34] Lu X, Leung DY, Wang H, Leung MK, Xuan J. Electrochemical reduction ofcarbon dioxide to formic acid. ChemElectroChem 2014;1(5):836e49.
[35] Monsigny MC, Petit C, Roche AC. Colorimetric determination of naturalsugars by a resorcinol sulfuric acid micromethod. Anal Biochem 1988;175:525e30.
[36] Carel AB. A spectrophotometric determination of malic acid in the pres-ence of glycolic, glyoxylic and diglycolic acids. Anal Chim Aceta 1971;57:317e22.
[37] Nash T. The colorimetric estimation of formaldehyde by means of theHantzsch reaction. Biochem J 1953;55:416e21.
[38] Ignatenko O, Van Schaik A, Reuter MA. Exergy as a tool for evaluation of theresource efficiency of recycling systems. Miner Eng 2007;20(9):862e74.
[39] Song G, Xiao J, Zhao H, Shen L. A unified correlation for estimating specificchemical exergy of solid and liquid fuels. Energy 2012;40(1):164e73.
[40] Wall G. Exergetics. Bucaramang. Exergy, ecology, democracy. 2009. http://exergy.Se/ftp/exergetics.pdf.
[41] The Exergoecology Portal. (n.d.). Retrieved March 5, 2015, from: http://www.exergoecology.com/.
[42] Jørgensen SE, Ladegaard N, Debeljak M, Marques JC. Calculations of exergy fororganisms. Ecol Model 2005;185(2):165e75.
[43] Draganovic V, Jørgensen SE, Boom R, Jonkers J, Riesen G, van der Goot AJ.Sustainability assessment of salmonid feed using energy, classical exergy andeco-exergy analysis. Ecol Indic 2013;34:277e89.
[44] Asada H, Shukuya M. Comparison of exergy consumption for daylighting,electric lighting and space heating/cooling system. Laboratory of Built Envi-ronment, Musashi Institute of Technology; 1998.
[45] Shukuya M. Exergy: theory and applications in the built 497 environment.Springer Science & Business Media; 2012.
[46] Orfanidis SJ. Electromagnetic waves and antennas. New Brunswick, NJ:Rutgers University; 2002. p. 227e50.
[47] Hecht E. Optics. Addison Wesley; 2002. p. 562e628.[48] Polyanskiy M. Refractive Index. Info. MediaWiki. http://refractiveindex. Info,
accessed 10, 2014.


