Embed Size (px)
Citation preview

Dynamic Article LinksC<Energy &Environmental Science
Cite this: Energy Environ. Sci., 2012, 5, 6640
www.rsc.org/ees REVIEW
A review on exergy comparison of hydrogen production methods fromrenewable energy sources
Koroneos Christopher* and Rovas Dimitrios
Received 26th January 2011, Accepted 17th January 2012
DOI: 10.1039/c2ee01098d
Hydrogen is an important energy carrier which could play a very significant role in the reduction of
emissions of greenhouse gases. The route by which hydrogen is produced is the determining factor for
its environmental performance. Hydrogen can be produced through methane reforming or through the
electrolysis of water with the use of electricity or it can be produced directly by gasification from
biomass. Renewable energy sources (RES) could be the feedstock for the two methods previously
mentioned. The objective of this work is the comparison of hydrogen (H2) production processes using
various renewable energy sources. This comparison is based on the exergy efficiency of each process.
The renewable energy sources that have been used are: wind power, solar energy, hydroelectric power,
and biomass. The solar energy systems that are used are photovoltaic and thermal. The biomass
systems are divided into two categories: (a) electricity production through biomass combustion, (b)
biomass gasification for the direct production of hydrogen. When in any of the processes electricity is
produced, this electricity is used for the electrolysis process of water to produce hydrogen (and oxygen).
Because hydrogen is transported in a liquid form, the liquefaction process is also taken into
consideration in this work. The liquefaction process is very energy intensive and as a consequence it
requires a lot of exergy. It has been found that the hydrogen production process with the highest exergy
efficiency is the electrolysis using electricity from hydro power. This efficiency is 5.6%. The process with
the lowest exergy efficiency is the one with electrolysis driven by electricity from solar energy
photovoltaics. The efficiency of this process is 1.0%.
Laboratory of Heat Transfer and Environmental Engineering, AristotleUniversity of Thessaloniki, P.O. Box 483, GR 54124 Thessaloniki,Greece. E-mail: [email protected]; [email protected];Fax: +30-2310-996012; Tel: +30-2310-995968
Broader context
The performance of exergy analysis of all the hydrogen production r
process. The processes considered included the following: solar elect
electricity production or thermal systems for indirect production
hydrogen by gasification or through combustion for electricity pro
used directly for the production of electricity. The processes involvi
the production of hydrogen. The comparison of the exergy efficienci
hydrogen production process using electricity from the hydropo
photovoltaic process using photovoltaic electricity has the lowest e
extremes. With regards to the issue of environmental impact the em
Since renewable energy is free the cost of the production of hydroge
processes.
6640 | Energy Environ. Sci., 2012, 5, 6640–6651
1. Introduction
The energy used today to satisfy all human needs is mostly based
on fossil fuels. It is estimated that the global distribution of
energy use is 80% fossil fuels, 14% renewable energy and 6%
nuclear power.1 The input of renewable energy sources to the
global energy grid, such as solar, wind and hydropower, is only
3%. The combustion of fossil fuels leads to the emission of great
outes from renewable energy sources has led to the most efficient
ricity production through either photovoltaic systems for direct
of electricity; biomass systems for the direct production of
duction in a power plant; wind and hydroelectric energies were
ng electricity systems were followed by electrolysis of water for
es of all these hydrogen production processes has shown that the
wer input has the highest exergy efficiency at 5.6% and the
fficiency at 1.0%. The rest of the processes fall within these two
issions are very low for even the low exergy efficiency processes.
n is solely based on the construction of the units for the various
This journal is ª The Royal Society of Chemistry 2012

amounts of greenhouse gases. Some studies predict that the
global energy consumption will triple in the next thirty years.2
The environmental impact will be significant if fossil fuels
continue to be used at high rates. The use of clean energy
becomes an urgent matter as the energy required keeps on
increasing with the continuous increase of the developing coun-
tries’ gross domestic product. Hydrogen could become a clean
energy carrier if it is produced with the use of RES. This will lead
to the production of hydrogen with a very low carbon footprint.
The hydrogen energy content per weight is 2.5 times higher than
that of any other conventional fuel. Hydrogen has been consid-
ered as the energy carrier of the future.
Most of the hydrogen produced today comes from methane
reforming. The disadvantage of this method is that the co-
product of the reaction is carbon dioxide, which is a greenhouse
gas.
Although there are many methods for the production of
hydrogen from renewable energy sources, the only one currently
practical is the one using electrolysis. The energy efficiency of
electrolysis reaches levels higher than 70%, but it remains
doubtful due to the high cost of the required electricity. It is
estimated that the production cost is about 20.0 $ per GJ of
hydrogen.3 The electricity used can be provided by a single
renewable energy source or by an integrated system of solar
energy, wind power, and hydropower.4,5 These techniques can be
applied to islands or isolated areas where the connection to the
central power grid is difficult or economically impractical. In
such cases, H2 could be utilised as an energy storage medium.6–8
Solar energy can be utilized to produce electricity through
photovoltaic or photothermal methods. Hydrogen can also be
produced by the thermal dissociation of natural gas (methane
thermal splitting) in a high temperature chemical reactor (1400–
1600 K). It features a nozzle-type graphite receiver which absorbs
the solar power and transfers the heat to the flow of methane at
a temperature that allows dissociation.2,9 The products of the
Koroneos Christopher
Christopher Koroneos is
a chemical engineer. He did all
his studies at the Department of
Chemical Engineering of
Columbia University in New
York, USA, where he later was
a professor. Now he is at the
Unit of Environmental Science
and Technology of the Depart-
ment of Chemical Engineering
at the National Technical
University of Athens and the
Laboratory of Heat Transfer
and Environmental Engineering,
Aristotle University of Thessa-
loniki. He is teaching at the
Interdisciplinary Programme of Post Graduate Studies ‘‘Envi-
ronment &Development’’ of the National Technical University of
Athens and at the Hellenic Open University. His research interests
are in Renewable Energy, Exergy Analysis, Life Cycle Assessment
and Sustainable Development.
This journal is ª The Royal Society of Chemistry 2012
reaction are hydrogen and carbon black. The method can be
economically viable due to the fact that carbon black is a high
value nano-material that can easily be absorbed by the existing
market. Thus, there is no CO2 production. This solar route
provides the process energy that otherwise had to be provided by
combustion of fossil fuel. The overall avoided fossil fuel
consumption is equivalent to 277 MJ per kg hydrogen produced
and the avoided CO2 equivalent emissions are 13.9 kg per kg of
produced hydrogen.
Anotherway toharvest solar power is the photoelectrochemical
(PEC) system. In these systems a semiconductor with proper
characteristics is immersed in an aqueous electrolyte and irradi-
ated with sunlight. Depending on the material of the semi-
conductor, the produced electrical current density varies between
10 and 30 mA cm�2 of the semiconductor. At these current
densities, the voltage required for electrolysis is much lower, and
therefore its efficiency reaches high levels.10,11 The effective
voltage to start the water splitting reaction for a photo-
electrochemical system is between 1.35 and 1.4 eV. For practical
applications the band gap is about 1.7 eV. The electrolysis effi-
ciency with this method reaches the levels of 91%, with the overall
hydrogen production reaching levels between 10% and 12.9%.10,11
Additionally, there is a solar reactor technology at laboratory
scale achieving temperatures between 1500 and 2500 K.12 At
these temperatures, hydrogen (and oxygen) can be produced by
thermolysis of water or by the use of specific cycles such as metal
oxide cycles and the S–I cycle. In the case of the thermolysis of
water, the water dissociation efficiency was estimated to be
around 25%. The problems of this technology are related to the
lack of materials that can withstand these temperature levels, to
avoid the backwards reaction, and the need to separate the
mixture of hydrogen and oxygen produced.12 At milder
temperature conditions chemical oxidation/reduction cycles to
dissociate water such as metal oxide cycles and the so-called
Sulfur–Iodine (S–I) cycle can be used.
Rovas Dimitrios
Dimitrios Rovas received his
diploma in Mechanical Engi-
neering in 2003 from the Aris-
totle University of Thessaloniki
and since 2005 he is working as
a research associate at the
Laboratory of Heat Transfer
and Environmental Engineering.
He works in the areas of renew-
able energy sources, environ-
mental management, life cycle
assessment and exergy analysis.
He is co-author of several scien-
tific papers in the field of
Renewable Energy Sources and
Sustainable Development.
Energy Environ. Sci., 2012, 5, 6640–6651 | 6641

Fig. 1 Hydrogen production routes from renewable energy sources.
MxOy / MxOy�1 + 1/2O2
MxOy�1 + H2O / H2 + MxOy
Metal oxide pairs used are Mn3O4/MnO, Co3O4/CoO, ZnO/
Zn and Fe3O4/FeO. The only feasible cycles are ZnO/Zn and
Fe3O4/FeO. Recent studies have shown that the ZnO/Zn cycle
operates at temperatures lower than 1200 K while its exergy
efficiency is between 29% and 44% (ref. 12) with a heat recovery.
The Fe based cycles have theoretical efficiencies of 61% at 1900 K
and 42% at 2500 K.12 The efficiency for the S–I cycle ranges
between 47% and 52%.12,13
The photolytic method uses a photo-catalyst to absorb visible
light and then transmit the energy of appropriate wavelength and
intensity to the water molecule, to liberate H2 and O2. The
reaction of the process is:
H2O + X + light / H2 + 1/2O2 + X
where X is the catalyst. The material used for the photo-catalyst
could be salt compounds, semiconductors, photosynthetic dyes,
green or red algae, etc.1,14
Biomass could be utilized using two different routes: combus-
tion of biomass for the production of electricity and then water
electrolysis, or direct production of hydrogen by gasification or
fermentation/bacteria/moulds. In this way, bio-solids, animal
waste, agricultural residues,municipal solidwastes and sludge can
beused toproduce either synthesis gas or different kinds of biogas.
Both of these gases are high in hydrogen content (30%).15
The disadvantage of the classic gasification process is that it
causes high drying costs of the biomass. The wet biomass
moisture content can reach the levels of up to 95%. Biomass
gasification in supercritical water (SCW) is a promising tech-
nology producing hydrogen from high moisture biomass.
Hydrogen bonds in SCW are lower in number and much weaker.
The biomass stock that could be used is wood sawdust, rice
straw, rice shell, wheat stalk, peanut shell and generally residues
of the agricultural industry. Gasification of biomass in SCW has
high gasification efficiency and high molar fraction of hydrogen
(35–45%) and there is no need of a drying process.16
Studies have shown that hydrogen may be produced in the
near term at a cost that is competitive with natural gas reforming
by integrating hydrogen production with existing industrial
utilization of agricultural residues. To be more specific, hydrogen
can be produced by catalytic steam reforming of peanut shell
pyrolysis vapours. In the same framework, residues from the
food industry can be utilized to produce hydrogen via anaerobic
digestion with no emissions of greenhouse gases.15 A case study
reveals that isolated microflora from cow dung exhibited their
capability to generate hydrogen while treating solid waste con-
sisting of jackfruit peel. The biogas generation was found to be
0.72 L g�1 VS (jackfruit peel) converted, with the content of
hydrogen being 55 � 2% and with no methane content.17
Biological treatment of waste organic material with dark and
photo-fermentation can produce hydrogen. Starch and cellulose
as residues of the agricultural and food industry, non-toxic
industrial effluents from the dairy industry, olive mills, bakers
yeast and brewery wastewaters and waste sludge can biodegrade
to produce hydrogen. The highest hydrogen yield obtained from
6642 | Energy Environ. Sci., 2012, 5, 6640–6651
glucose’s dark fermentation is estimated to be 2.0–2.4 mol of H2
per mol of glucose, while the treatment of starch can theoretically
produce 553 mL of hydrogen per gram of utilized starch.18 Some
photo-heterotrophic bacteria are capable of converting organic
acids (acetic, lactic, and butyric) to hydrogen and carbon
dioxide, while there can be hybrid systems using photosynthetic
and fermentative bacteria. The phototropic treatment of acetate
and butyrate, which are the main products of dark fermentation,
generates 2.5 mol of H2 per mol of acetate and 3.7 mol H2 per
mol butyrate. Another biological process that can be used is bio-
photolysis of water by algae. Algae split water molecules to
NADH and oxygen via photosynthesis while the hydrogen ions
are converted to hydrogen gas by a hydrogenase enzyme.19
Hydrogen could also be produced from post-consumer wastes
such as plastic and grease trap using a two-stage process: fast
pyrolysis to convert polymers to a gas/vapor stream of mono-
mers and other low-molecular weight compounds followed by
catalytic steam reforming of this gas to yield hydrogen and
carbon oxides. ‘‘Trap grease’’, a waste material recovered from
traps on sewer lines, does not require a depolymerization step
and can be directly steam reformed to produce hydrogen. It is
shown that annually, the hydrogen production can reach 6.5 Mt
(6 Mt from plastic and 0.5 Mt from grease trap).20
Hydrogen can also be produced by the treatment of biogas
with hot slag that can act both as a thermal medium and
a catalyst.21 It can be produced efficiently from the electrolysis of
ammonia and black liquor (paper industry effluent) in which
particular 85–90% of the electricity spent in electrolysis is stored
as hydrogen.22,23
The basic idea of the hydrogen production route from
renewable energy sources is illustrated in Fig. 1.
2. Exergy analysis
Exergy is defined as the amount of work available from an energy
source. The maximum amount of work is obtainable when
matter and/or energy such as thermal energy is brought to a state
of thermodynamic equilibrium with the common components of
the environment in which this process takes place with the dead
state by means of a reversible process, involving interaction only
with the above mentioned components of nature.24 Exergy is
a measurement of how far a certain system deviates from a state
of equilibrium with its environment. The quality of energy can be
expressed as the quantity of exergy per unit of energy. The
This journal is ª The Royal Society of Chemistry 2012

quality increases with the temperature (provided that the
temperature is higher than that of the environment). It is clear
that the exergy concept incorporates both the quantitative and
qualitative properties of energy.
Every irreversible phenomenon causes exergy losses leading to
exergy destruction of the process or to an increased consumption
of energy from whatever source the energy was derived.
The objective of exergy analysis is to determine the exergy losses
(thermodynamic imperfections) and to evaluate quantitatively the
causes of the thermodynamic imperfection of the process under
consideration. Exergy analysis can lead to all kinds of thermo-
dynamic improvement of the process under consideration.24
The hydrogen production systems studied are all assumed to
operate in a steady state. For a steady state system the mass
balance equation can be expressed by eqn (1)
P_min ¼ P
_mout (1)
where, _m is the mass flow rate, and the subscript in stands for
inlet and out for outlet. The general energy balance can be
expressed by eqn (2)
P_Ein ¼ P
_Eout (2)
E::
kin;inþE:
pot;inþðeventual other forms of energyÞþ: QþX
minhin ¼ E:
kin;inþE:
pot;inþðeventual other forms of energyÞ
þW þX
mouthout: (3)
where _Ein is the rate of net energy transfer in, _Eout is the rate of
net energy transfer out by heat, work and mass; _Q ¼ _Qnet, is the
rate of net heat input, _W ¼ _Wnet is the rate of net work output,
and h is the specific enthalpy.25
In systems studied most often the changes in kinetic and
potential energy are negligible, eqn (3) can then be written as
follows:
_Q +P
_minhin ¼ _W +P
_mouthout (4)
This equation expresses that the total amount of energy input
of the system is equal to the total amount of energy output. The
energy efficiency of the system can be expressed as
hı ¼P
_EoutP_E in
(5)
The exergy of the system can be expressed by the following
equations:
P_Exin �
P_Exout ¼
P_Exdest (6)
or
X��1� T0
Tk
�_Qk �W
::�þX
_minðex tm;in þ exch;inÞ
�X
_mout
�ex tm;out
:
þ ex ch;out
�
¼X
E:xdest (7)
with
This journal is ª The Royal Society of Chemistry 2012
extm ¼ (h � h0) � T0(s � s0) (8)
where _Qk is the heat transfer rate through the boundary at
temperature Tk at location k, _W is the work rate, extm is the
thermo-mechanical flow of exergy, s is the specific entropy and
the subscript zero indicates properties at the temperature and
pressure of the environment of the system considered (standard
state).26
Eqn (8) can be expanded to the form of eqn (9)
extm ¼ (h � h0) � (T0s � T0s0) (9)
The term T0s � T0s0 represents the exergy that has been
destroyed and it is presented as Exdest.
The standard chemical exergy of gaseous reference species can
therefore be expressed as,27
_Ech;i ¼ _miRT0lnP0
Pk
(10)
where, R is the specific gas constant.
Different ways of formulating exergetic efficiency proposed in
the literature have been given in detail elsewhere.28 The exergetic
efficiency expresses all exergy input as used exergy, and all exergy
output as useful exergy. Therefore, the exergetic efficiency
becomes:
hii ¼ hex ¼E:xout
E:xin
(11)
The efficiency will be improved to the maximum when the
exergy loss or irreversibility _Exin � _Exout is minimized.29
When heat at a temperature Tt > T0 is available and the
temperature of a thermodynamic system is Tt and the tempera-
ture of the environment is T0 its exergy quality can be expressed
by the quality factor.
Quality factor ¼ 1� T0
Tt
(12a)
When the temperature Tt, at which the heat is available,
increases, the quality factor increases too.
Exergy analysis is employed to detect and to evaluate quan-
titatively the causes of thermodynamic imperfection of the
process under consideration. Exergy analysis indicates the
possibilities of thermodynamic improvement of the process
under consideration.30–35
The exergy analysis of the hydrogen production system under
consideration can be split into two stages. At the first stage the
exergy analysis of the electrolysis is performed so that the exergy
efficiency for this process can be determined, this value is utilized
for renewable energy sources based processes to produce elec-
tricity. At the second stage, exergy analysis is performed for each
renewable energy system. In the third stage the hydrogen
produced in each of the processes is liquefied. Also, the exergy
efficiency for the liquefaction process is common for all processes
investigated.
2.1 Exergy analysis of the electrolysis process
The exergy analysis of the water electrolysis is based on the
electrolysis process shown in Fig. 2.36 The electricity production
Energy Environ. Sci., 2012, 5, 6640–6651 | 6643

shown in the figure comes from renewable energy sources. In the
case under study, the O2, H2 purification and the H2 compres-
sion processes will be excluded. Thus, the only steps that will be
taken into account are the electricity transformation and recti-
fication and the water splitting. The numbers inside parentheses
in Fig. 2 represent the inlet and outlet exergy of an individual
process.
The efficiency of the electrolysis process can be calculated by
analyzing each individual unit of the problem. Taking into
consideration the data of the electrolysis units of Fig. 2, its exergy
efficiency is calculated by eqn (12b)
hex ¼Exout
Exin¼ 25
37¼ 67:5% (12b)
The ‘‘electrolysis unit’’ investigated in this analysis will be the
same for all renewable energy sources based electricity produc-
tion processes investigated.36
2.2 Exergy analysis of the hydrogen liquefaction process
The hydrogen liquefaction process used in this application is
shown in Fig. 3, where a closed nitrogen loop is used for
additional cooling. Hydrogen gas enters the compressor at 300
K and pressure 1 bar and exits at 300 K and pressure 100 bar.
The compressed hydrogen passes through a heat exchanger
network and the outlet temperature is at 35 K.34 The network
consists of two heat exchangers. The working fluids in the first
exchanger are the hydrogen that needs to be liquefied, liquid
nitrogen and the non-liquefied hydrogen of the process, which
will return to the compressor. The working media of the second
exchanger are the hydrogen at the liquid and vapor phases. The
data of all the streams of this figure are shown in Table 1.34
Assume reversible isothermal compression: the total ideal work
requirement for compression of both hydrogen and nitrogen is
given by eqn (13).
(Wtot)rev ¼ mH(w12)rev + mN(wab)rev (13)
Fig. 2 The electrolysis process.
6644 | Energy Environ. Sci., 2012, 5, 6640–6651
where, (w12)rev is the work of the hydrogen compressor expressed
by eqn (14)
(w12)rev ¼ h2 � h1 � (q12)rev ¼ h2 � h1 � T1(s2 � s1)¼ ex2 � ex1 ¼exH (14)
(wab)rev is the work of the nitrogen compressor expressed by eqn
(15)
(wab)rev¼ hb� ha� (qab)rev¼ hb� ha� T1(sb� sa)¼ exb� exa¼exN (15)
Using the data from Table 1 (wtot)rev and taking r ¼ mN/mH ¼1, it is then calculated:
(Wtot)rev ¼ mH(w12)rev + mN(wab)rev ¼ mH[(w12)rev + (wab)rev] ¼6167.69mH (kJ)
Assuming that both compressors have an efficiency of 0.85, the
work needed for both compressors is
Wtot ¼ (Wtot)rev/ncomp ¼ 7256.1mH (kJ) (16)
The work can be expressed as a function of the liquefaction
ratio of hydrogen (eqn (17))
W0tot ¼
Wtot
y(17)
where y is the liquefaction ratio of hydrogen (eqn (18)).
y ¼ ðh1 � h2Þðh1 � h8Þ þ r
ðha � hbÞðh1 � h8Þ (18)
As mentioned before, the fraction of nitrogen to hydrogen
mass (r) can be taken to be equal to 1.
The minimum work of hydrogen liquefaction is equal to the
liquefied hydrogen’s exergy:
(W0)min ¼ mH[h8 � h1 � T0(s8 � s1)] (19)
The exergy efficiency of the liquefaction process is expressed
by eqn (20)
z ¼ ðW 0Þmin
ðW 0totÞ
¼ mH½h8 � h1 � T0ðs8 � s1Þ�mH � ðW 0
tot=yÞ
¼ ½h8 � h1 � T0ðs8 � s1Þ�W
0tot=y
(20)
Using the data of Table 1 the exergy losses of the process are
calculated to be equal to 86.7%. This leads to liquefaction
exergy efficiency of 13.3% (Fig. 4). Depending on how the
liquid hydrogen is used, part of its exergy value can be
recovered.
2.3 Exergy analysis of the renewable energy system
2.3.1 Exergy analysis of the photovoltaic panel. The exergy
efficiency of a photovoltaic panel can be expressed as the ratio
of the exergy output, the electricity produced, to the exergy
input, in this case the exergy of the solar radiation
This journal is ª The Royal Society of Chemistry 2012
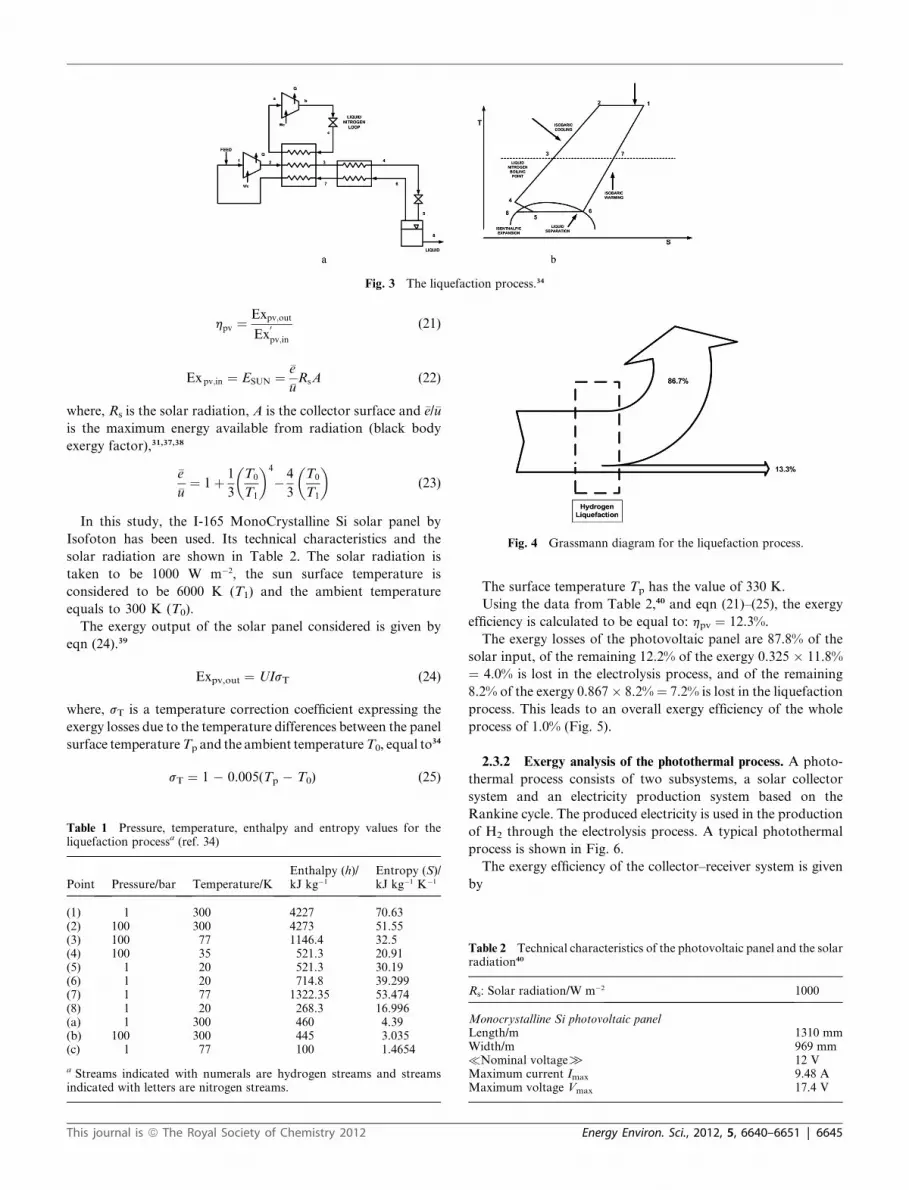
Fig. 3 The liquefaction process.34
Fig. 4 Grassmann diagram for the liquefaction process.
hpv ¼Expv;out
Ex0pv;in
(21)
Expv;in ¼ ESUN ¼ e�
u�RsA (22)
where, Rs is the solar radiation, A is the collector surface and �e/�u
is the maximum energy available from radiation (black body
exergy factor),31,37,38
e�
u�¼ 1þ 1
3
�T0
T1
�4
� 4
3
�T0
T1
�(23)
In this study, the I-165 MonoCrystalline Si solar panel by
Isofoton has been used. Its technical characteristics and the
solar radiation are shown in Table 2. The solar radiation is
taken to be 1000 W m�2, the sun surface temperature is
considered to be 6000 K (T1) and the ambient temperature
equals to 300 K (T0).
The exergy output of the solar panel considered is given by
eqn (24).39
Expv,out ¼ UIsT (24)
where, sT is a temperature correction coefficient expressing the
exergy losses due to the temperature differences between the panel
surface temperatureTp and the ambient temperatureT0, equal to34
sT ¼ 1 � 0.005(Tp � T0) (25)
Table 1 Pressure, temperature, enthalpy and entropy values for theliquefaction processa (ref. 34)
Point Pressure/bar Temperature/KEnthalpy (h)/kJ kg�1
Entropy (S)/kJ kg�1 K�1
(1) 1 300 4227 70.63(2) 100 300 4273 51.55(3) 100 77 1146.4 32.5(4) 100 35 521.3 20.91(5) 1 20 521.3 30.19(6) 1 20 714.8 39.299(7) 1 77 1322.35 53.474(8) 1 20 268.3 16.996(a) 1 300 460 4.39(b) 100 300 445 3.035(c) 1 77 100 1.4654
a Streams indicated with numerals are hydrogen streams and streamsindicated with letters are nitrogen streams.
This journal is ª The Royal Society of Chemistry 2012
The surface temperature Tp has the value of 330 K.
Using the data from Table 2,40 and eqn (21)–(25), the exergy
efficiency is calculated to be equal to: hpv ¼ 12.3%.
The exergy losses of the photovoltaic panel are 87.8% of the
solar input, of the remaining 12.2% of the exergy 0.325 � 11.8%
¼ 4.0% is lost in the electrolysis process, and of the remaining
8.2% of the exergy 0.867� 8.2%¼ 7.2% is lost in the liquefaction
process. This leads to an overall exergy efficiency of the whole
process of 1.0% (Fig. 5).
2.3.2 Exergy analysis of the photothermal process. A photo-
thermal process consists of two subsystems, a solar collector
system and an electricity production system based on the
Rankine cycle. The produced electricity is used in the production
of H2 through the electrolysis process. A typical photothermal
process is shown in Fig. 6.
The exergy efficiency of the collector–receiver system is given
by
Table 2 Technical characteristics of the photovoltaic panel and the solarradiation40
Rs: Solar radiation/W m�2 1000
Monocrystalline Si photovoltaic panelLength/m 1310 mmWidth/m 969 mm�Nominal voltage[ 12 VMaximum current Imax 9.48 AMaximum voltage Vmax 17.4 V
Energy Environ. Sci., 2012, 5, 6640–6651 | 6645

Fig. 5 Grassmann diagram for the hydrogen production process using
a photovoltaic panel.
hC/R ¼ ExC/R/Exs,in (26)
where, Exs,in is the exergy input of the solar radiation and ExC/Ris the exergy increase of the medium in the collector
ExC/R ¼ N[mf(hf0 � hfi) � T0(sf0 � sfi)] (27)
N is the number of collectors, mf is the mass flow rate of the
working fluid in each of the collectors, hf0 is the specific enthalpy
of the working fluid exiting the heat exchanger, and sf0 is the
specific entropy of that stream at the same point, hfi and sfi are the
specific enthalpy and entropy respectively of the stream entering
the heat exchanger, T0 is the ambient temperature.25 The exergy
of the incoming solar energy (received by the collector) is
Exs;in ¼ Qs
�1� T0
Ts
�(28)
where Qs is the total amount of solar energy input for N collec-
tors and Ts is the surface temperature of the sun. In this analysis
an ammonia Organic Rankine Cycle (ORC) will be used (Fig. 6).
The electricity production efficiency is given by
hel ¼Wnet
Ex1f(29)
where Wnet is the net output of electricity and Ex1f the increase in
exergy due to the heat transfer from the collectors, of the working
fluid (ammonia), of the ORC cycle.
Fig. 6 The photothermal process.39
6646 | Energy Environ. Sci., 2012, 5, 6640–6651
Ex1f ¼ Qf
�1� T0
TR0
�(30)
where Qf is the increase in energy in the evaporator of the ORC
and TR0 is the boiling temperature of the medium in the
evaporator.
The exergy efficiency of the system is calculated by multi-
plying the individual efficiencies. The efficiencies of the parts of
the photothermal process are shown in Table 3. Using the given
data for the efficiency of the different parts of the photothermal
process, from Table 3, and carrying out the calculation with
eqn (26)–(30), the exergy losses are calculated to be equal to
87.3%. Of the remaining 12.7% of the exergy 0.325 � 12.7% ¼4.1% is lost in the electrolysis process and of the remaining
8.6% of the exergy 0.867 � 8.6% ¼ 7.4% is lost in the lique-
faction process. This leads to an overall exergy efficiency of
1.2% (Fig. 7).
2.3.3 Exergy analysis of the wind turbine. The wind turbine
exergy41 is expressed by eqn (31)
exWE ¼ 1
2V 2
1 (31)
the following data are used:
� air pressure is at 1 atm
� air temperature is at 300 K
� air density is 1.225 kg m�3.
The received power of the engine is given by
Ein ¼ mexWE (32)
where m is the air mass flow through the wind turbine.
m ¼ rAV1 ¼ rpD2
4V1 (33)
The exergy efficiency of the wind turbine is
hex,WE ¼ Exout/Exin (34)
The nominal power outputs of the wind turbines for several
wind speeds are presented in Table 4.42 Taking into consideration
the nominal power of the Neg-Micon wind engines,42 and the
exergy input calculated from eqn (31)–(34), the exergy efficiencies
for various wind turbines at different wind speeds are calculated.
The results are shown in Table 5. The exergy efficiency of this
engine (Table 5) is equal to 45.6%. The exergy lost in the elec-
trolysis process is 0.325 � 45.6% ¼ 14.8% while of the remaining
30.8% of the exergy 0.867 � 30.8% ¼ 26.7% is lost in the lique-
faction process, leading to an overall exergy efficiency of 4.1%
(Fig. 8).
2.3.4 Exergy analysis of the hydroelectric process. The
hydroelectric process produces power from the water flow
through a turbine. In order to perform the exergy analysis of
a hydroelectric power plant, the data of the Meshohora hydro-
electric dam in Greece are used.43
� The water flow is _V ¼ 45 m3 s�1
� The length of the pipe flow is: 7.469 km
� The height of the fall is: 230 m, and
� the tube diameter is: 3.0 m.
This journal is ª The Royal Society of Chemistry 2012

Table 3 The efficiencies of individual parts of the photothermal process30
System Received exergy (1) Delivered exergy (2) Exergy losses/kW (3)Exergy losses(%) (4)
Exergy efficiencies(%) (5)
Collector Exi ¼ 270.82 Exc ¼ 78.82 I1 ¼ 192.19 70.96 29.03Receiver Exc ¼ 78.82 Exu ¼ 53.768 I2 ¼ 24.862 31.618 68.38Collector–receiver Exi ¼ 270.82 Exu ¼ 53.768 I1,2 ¼ 217.05 80.146 19.858Boiler heat exchanger Exu ¼ 53.77 Exu ¼ 51.845 Ihx ¼ 1.92 3.577 96.424Heat engine Exu
1 ¼ 51.845 W ¼ 34.511 I3 ¼ 17.334 33.434 66.566Total system Exi ¼ 270.82 W ¼ 34.511 I ¼ 236.30 87.254 12.743
Fig. 7 Grassmann diagram for the hydrogen production process from
a photothermal process.
The exergetic efficiency of the turbine is taken as 92.5%, and
the exergetic efficiency of the electric motors as 95%.
Due to friction along the pipe, pressure loss occurs which can
be expressed through the head loss (hf) according to eqn (35)
DPloss ¼ rghf, (35)
hf ¼ fLu2mean
2Dg(36)
where f is a friction coefficient related to the Reynolds number
and the pipe’s roughness, L the pipe length, umean the mean
velocity, D the hydraulic diameter of the pipe and g the gravity
acceleration.
umean is calculated by
umean ¼_V
A¼
_V
pðD2=4Þ ¼45
7:065¼ 6:4 m s�1 (37)
while the Reynolds number is given by eqn (38)
Re ¼ rumean
D
m(38)
Table 4 Technical characteristics of the three wind engines42
Wind velocity/m s�1
Wind turbine type
600 kW/48 m
750 kW/48 m
1 MW/60 m
6 93 95 1507 153 168 2488 235 259 3859 329 362 535
This journal is ª The Royal Society of Chemistry 2012
where r is the density of water and m is its dynamic viscosity
(1.002 � 10�3 N m�2, water at 25 �C). Using the Moody diagram
(3 ¼ 0.025) the friction coefficient is calculated to be 0.005.
Using eqn (36) hf is calculated at 25.8 m. Assuming that the
velocity of the flow is constant at 6.4 m s�1 the energy losses due
to friction and the pressure loss are
Eloss,fri ¼ m � DPloss ¼ A � r � L � g � hf ¼ 7.065 � 7.469 �9.81 � 25.8 ¼ 13 � 109 Joules ¼ 3.6 � 106 W h (39)
The potential energy of the water is calculated from eqn (40)
Epot ¼ mgH ¼ A � r � L � g � H ¼ 7.065 � 1000 � 7469 �9.81 � 230 ¼ 11.9 � 1010 Joules ¼ 33 � 106 W h (40)
where m is the mass of water in kg (52.8 � 106 kg), g the gravity
acceleration in m s�2, and H is the height of the fall in m.
The kinetic energy of the water is calculated by eqn (41)
Ekin ¼ 1
2mu2mean ¼ ð0:5Þ�52:8� 106
�ð6:4Þ2¼ 1:08� 109Joules
¼ 0:3� 106W h
(41)
where, umean is the water speed in m s�1.
The energy of the water just before the turbines is equal to the
sum of the kinetic and potential energy:
Etot ¼ Epot + Ekin � Eloss,fri ¼ 33 + 0.3 � 3.6 ¼ 29.7 GW h(42)
The exergy losses in the two serial placed turbines are:
Exloss,turb ¼ (2)(1 � 0.925) ¼ (2)(0.075) ¼ 0.15 or 15% (43)
Thus, the exergy output in the turbines is:
Eturb ¼ 29.7 � (0.15)(29.7) ¼ 25.3 GW h (44)
Table 5 Exergy efficiency of three wind engines30
Wind velocity/m s�1 Exergy efficiency
Wind turbine type
600 kW/48 m
750 kW/48 m
1 MW/60 m
6 hex,WE 38.8% 39.7% 40%7 40.24% 44.19% 41.75%8 41.41% 45.64% 43.42%9 40.71% 44.8% 42.37%
Energy Environ. Sci., 2012, 5, 6640–6651 | 6647

Table 6 Contents (mass% in dry sample) of C, H, N, S, Cl, O, and ash;and HHV in kJ kg�1 ref. 44
Biomass HHV/kJ kg�1 C H N S Cl O Ash
Wood waste 18 467 49.7 6.0 1.7 0.0 0.1 41.0 1.5
Fig. 8 Grassmann diagram for the hydrogen production process using
wind power.
Taking into consideration the exergy efficiency of the electric
motor, the exergy losses are:
Exloss,motor ¼ (2)(1 � 0.9) ¼ (2)(0.1) ¼ 0.2 or 20% (45)
Therefore, the exergy output is:
Eout ¼ 25.3 � (0.2)(25.3) ¼ 20.3 GW h (46)
The overall exergy efficiency of the electricity production in the
Meshohora hydroelectric power plant is:
hex ¼Exout
Exin¼ Exout
Etot þ Eloss;fri
¼ 20:3
33¼ 0:615 or 61:5%
The Grassmann diagram of the process is presented in Fig. 9.
The exergy loss of the power plant is 61.5%. Taking into
consideration the exergy efficiency of the electrolysis process, the
efficiency after this process is at 0.325 � 61.5% ¼ 41.6%. The
exergy lost in the liquefaction process is 0.867 � 41.6% ¼ 36%
leading to a remaining exergy efficiency of 5.6%, that is, the
overall efficiency of the process.
2.3.5 Exergy analysis of the biomass combustion process. The
biomass combustion produces the essential heat to operate
a power plant. The inlet exergy of the biomass is
Exbio,in ¼ _mDH (47)
where m, the biomass flow rate, is assumed to be 3000 kg h�1 and
DH, the average caloric potential of the inlet, is taken to be
Fig. 9 Grassmann diagram for the hydrogen production process using
hydro power.
6648 | Energy Environ. Sci., 2012, 5, 6640–6651
18 467 kJ kg�1 (ref. 44). The biomass used is wood waste and its
weight composition is given in Table 6.
The exergy efficiency using the Carnot cycle is given by
hex ¼DH
Exbio;inhboiler
�1� T0
Tm
�(48)
where Tm ¼ ((h2 � h1)/(s2 � s1)) is the average thermodynamic
temperature of the heat received by water, hboiler ¼ the boiler’s
efficiency, DH ¼ the caloric potential of biomass,
Exbio,in ¼ biomass exergy.
The assumptions made for the analysis are:
� the combustion temperature is 793 K and the ambient
temperature is 300 K
� the boiler efficiency is 90%
� the generator’s exergy losses represent the 3% of the exergy
output of the steam cycle.
� Tm is taken to be 546 K.
Taking into consideration these factors, the exergy effi-
ciency of biomass combustion is calculated to be 41.4% and
the exergy losses of the electric power production are equal to
1.2%. The electricity production efficiency is 0.987 � 41.4%
¼ 40.9%, of which 0.325 � 40.9% ¼ 13.3% is lost in the
electrolysis process. Of the remaining 40.9% � 13.3% ¼ 27.6%
exergy 0.867 � 27.5% ¼ 24.2% is lost in the water electrolysis.
This results in a hydrogen production process overall effi-
ciency of 3.9%. The results are illustrated in Fig. 10, where the
exergy losses throughout the process are shown.
2.4 Exergy analysis of the biomass gasification process
A typical biomass gasification process is shown in Fig. 11. The
reaction that describes the gasification of the biomass is:
C6H10O5 + 4.5H2O / 0.5CO + 7.5H2 + 4.5CO2 + CH4
Fig. 10 Grassmann diagram for the hydrogen production process from
biomass combustion.
This journal is ª The Royal Society of Chemistry 2012

Fig. 11 The biomass gasification process.42
Table 7 Heat and energy flows in the SCWG processa (ref. 43)
Heat flows (106 kJ kmol�1
biomass) Energy flows (106 kJ kmol�1 biomass)
DHF DHP DHR Biomassb Biomassc Biomassd Hydrogen
Input 2.597 3.078 1.044 0.256Output 2.111 0.250 1.777hE 40.6%
a DHF: heat for heating feedstock; DHP: heat released from productstream; DHR: heat of reaction; hE: the exergy efficiency. b Cellulose asfeedstock. c Providing process heat by wood combustion with anefficiency of 75%. d Generating electricity by wood conversion with anefficiency of 40%.
Fig. 13 The exergy efficiencies of the hydrogen production methods.
The weight fraction of the feedstock is 20% of cellulose
and 80% of water. The reactor operates at 600 �C and 350
bar producing SynGas that is made up of 55.6% hydrogen,
33.3% carbon dioxide, 7.4% methane and 3.7% carbon
monoxide.45
Using the data of Table 7, the gasification exergy efficiency is
assumed to be equal to 40.6%.46 The liquefaction process effi-
ciency is calculated to be 13.3%, and the overall efficiency of the
hydrogen production process is 5.4%. The Grassmann diagram
of the process is presented in Fig. 12.
Fig. 12 Grassmann diagram for the hydrogen production process from
biomass gasification.
This journal is ª The Royal Society of Chemistry 2012
3. Comparison and conclusions
An exergy analysis of all the hydrogen production routes from
renewable energy sources was performed. The renewable energy
sources that were used included wind power, solar energy,
hydroelectric power, and biomass. Because these sources could
be used in different ways, the most reasonable ones are all
considered. The solar energy systems were either photovoltaic
for direct electricity production or thermal for indirect
production of electricity. Biomass fed systems either produced
hydrogen directly by gasification or combusted to produce
electricity in a power plant. Wind and hydroelectric energies
were used directly for the production of electricity. Since
hydrogen had to be produced, all processes in which electricity
was produced were followed by electrolysis of water. Its exer-
getic efficiency was calculated to be 67.5%. A great impact on
the final exergy efficiency of all processes was that of hydrogen
liquefaction. Because hydrogen is transported in a liquid form,
the liquefaction process is also taken into consideration in this
work. The liquefaction process is very energy intensive and as
a consequence it requires a lot of exergy. Hydrogen liquefaction
has a very low exergetic efficiency value of 13.3%. The exergy
efficiency for electrolysis is taken to be the same for all processes
using renewable energy sources.
The comparison of the exergy efficiencies of all the hydrogen
production processes using renewable energy sources is given in
Fig. 13. This figure shows that the process with the hydropower
Fig. 14 The exergy efficiencies of the hydrogen production methods
before and after liquefaction.
Energy Environ. Sci., 2012, 5, 6640–6651 | 6649

input has the highest exergy efficiency at 5.6% and the photo-
voltaic process has the lowest at 1.0%. The biomass gasification
energy system has the second highest exergetic efficiency
reaching the level of 5.4%. Biomass gasification is a direct route
to hydrogen production, so there is no need for water elec-
trolysis. In the event that no liquefaction takes place (Fig. 14),
the hydro process efficiency reaches the level of 41.6% and that
of the photothermal process is equal to 8.6%. The exergy effi-
ciencies before and after the liquefaction process have great
fluctuations. That part of the process needs to be redesigned. If
there was development of an efficient hydrogen gas collection
system, the use of renewable energy sources could be highly
efficient, especially in the case of the use of hydropower, wind
power and biomass gasification. Even though there is a low
exergy efficiency, the emissions of the processes are very low
and there are no greenhouse gas emissions.47 It must also be
noted that renewable energy sources are free so the exergy
efficiency has an impact on the cost of the construction of the
processes.
Nomenclature
Symbols
A
6650 | Energy Env
surface (m2)
D
the turbine diameter (m)E
energy (kW) _E rate of net energy (kW s�1)Ex
exergy (kW)ex
specific exergy�e/�u
the black body exergy factorf
friction factorg
gravity acceleration (m s�2)H
height of the fall (m).h
specific enthalpy (kJ kg�1)hf
head loss (m)I
current (Amp)_m
mass flow (kg s�1)m
mass (kg)N
number of collectorsRs
solar radiation (W m�2)R
specific gas constant (J kg�1 K�1)P
pressure (Atm)q
specific heat (kJ kg�1)Q
heat (kW) _Q heat rate (kW s�1)r
(kg of N2)/(kg of H2)s
entropy (kJ kg�1 K�1)T
temperature (K)Tm
thermodynamic temperature of water (K)T0
temperature of the environment, 300 KV
velocity (m s�1). _V volume rate (m3 s�1)U
voltage (Volts)umean
mean velocity (m s�1)w
specific work (kJ kg�1)W
work (kJ) _W work rate (kJ s�1)iron. Sci., 2012, 5, 6640–6651
ExWE
This
the wind turbine exergy (kW)
y
liquefaction ratio of hydrogenGreeks
z
exergy efficiency of the liquefaction processDH
heating value of biomass (kJ kmol�1 biomass)h
efficiency (%)DS
difference in entropy values (kJ kg�1 K�1)m
dynamic viscosity of water (kg m�1 s�1)r
density (kg m�3)sT
temperature correction coefficientSubscripts
0
environment, initial state1,2,.
process steam indicatorab
nitrogen compressionbio
biomassC/R
Collector/Receivercomp
compressorch
chemicaldest
destroyedex
exergyf
working mediumin
inletk
location kkin
kineticloss
lossesmin
minimumout
outletp
panelpot
potentialpv
photovoltaicR
Rankinerev
reversibles
solart
the systemtm
thermomechanicaltot
totalturb
turbineu
collectorw
waterWE
wind energyReferences
1 M. A. K. Lodhi, Helio-hydro and helio-thermal production ofhydrogen, Int. J. Hydrogen Energy, 2004, 29(11), 1099–1113.
2 J. Dahl, et al., Rapid Solar-Thermal Dissociation of Natural Gas inan Aerosol Flow Reactor, Proceedings of the 2002 U.S. DOEHydrogen Program Review NREL/CP-610–32405.
3 F. Barbir, PEM electrolysis for production of hydrogen fromrenewable energy sources, Sol. Energy, 2005, 78(5), 661–669.
journal is ª The Royal Society of Chemistry 2012

4 E. P. Da Silva, et al., Analysis of hydrogen production from combinedphotovoltaics, wind energy and secondary hydroelectricity supply inBrazil, Sol. Energy, 2005, 78, 670–677.
5 C. Koroneos and D. Rovas, A solar thermal power system in the cityof Thessalonica with the use of the pinch method for entropyminimisation, Int. J. Exergy, 2007, 4(2), 134–150.
6 H.Miland, et al., Load of a wind-hydrogen stand alone power system,Int. J. Hydrogen Energy, 2006, 31, 1215–1235.
7 R. Gazey, S. K. Salman and D. D. Aklil-D’Halluin, A fieldapplication experience of integrating hydrogen technology withwind power in a remote island location, J. Power Sources, 2006,157(2), 841–847.
8 H. de Batista, R. J. Mantz and F. Garelli, Power conditioning ofa wind-hydrogen energy system, J. Power Sources, 2006, 155, 478–486.
9 S. Abanades and G. Flamant, Solar hydrogen production from thethermal splitting of methane in a high temperature solar chemicalreactor, Sol. Energy, 2006, 80(10), 1321–1332.
10 R. C. Valderrama, et al., Photoelectrochemical characterization ofGIGS thin films for hydrogen production, Sol. Energy Mater. Sol.Cells, 2005, 88, 145–155.
11 K. Varner, S. Warren and J. A. Turner, Photoelectrochemical systemsfor hydrogen production, Proceedings of the 2002 U.S. DOEHydrogen Program Review NREL/CP-610–32405.
12 C. Perkins and A. W. Weimer, Likely near-term solar-thermalsplitting technologies, Int. J. Hydrogen Energy, 2004, 29, 1587–1599.
13 C. Huang and A. T. Raissi, Analysis of sulfur-iodine thermochemicalcycle for solar hydrogen production. Part I: decomposition of sulfuricacid, Sol. Energy, 2005, 78(5), 632–646.
14 H. Jeong, et al., Hydrogen production by the photocatalytic overallwater splitting on NiO/Sr3Ti2O7: effect of preparation method, Int.J. Hydrogen Energy, 2006, 31(9), 1142–1146.
15 R. J. Evans et al., Engineering Scale up of Renewable HydrogenProduction by Catalytic Steam Reforming of Peanut ShellsPyrolysis Products, Proceedings of the 2002 U.S. DOE HydrogenProgram Review NREL/CP-610–32405.
16 Y. J. Lu, et al., Hydrogen production by biomass gasification insupercritical water: a parametric study, Int. J. Hydrogen Energy,2006, 31(6), 822–831.
17 K. Vijayaraghavan, et al., Biohydrogen generation from jackfruit peelusing anaerobic contact filter, Int. J. Hydrogen Energy, 2006, 31(18),569–579.
18 H. H. P. Fang, H. Liu and T. Zhang, Phototrophic hydrogenproduction from acetate and butyrate in wastewater, Int. J.Hydrogen Energy, 2005, 30(7), 785–793.
19 I. K. Kapdan and F. Kargi, Bio-hydrogen production from wastematerials, Enzyme Microb. Technol., 2006, 28(5), 569–582.
20 S. Czernik, et al., Production of Hydrogen from Post-ConsumerWastes, Proceedings of the 2002 U.S. DOE Hydrogen ProgramReview NREL/CP-610–32405.
21 H. Purwanto and T. Akiyama, Hydrogen production from biogasusing hot slag, Int. J. Hydrogen Energy, 2006, 31(4), 491–495.
22 H. R. Ghatak, Electrolysis of black liquor for hydrogen production:some initial findings, Int. J. Hydrogen Energy, 2006, 31(7), 934–938.
23 F. Vitse, M. Cooper and G. G. Botte, On the use of ammoniaelectrolysis for hydrogen production, J. Power Sources, 2005,142(1–2), 18–26.
24 J. Szargut, D. R. Morris and F. R. Steward, Exergy Analysis ofThermal, Chemical, and Metallurgical Processes, HemispherePublishing Corporation, 1988, ISBN 0-89116-574-6.
This journal is ª The Royal Society of Chemistry 2012
25 F. Balkan, N. Colak and A. Hepbasli, Performance evaluation ofa triple-effect evaporator with forward feed using exergy analysis,Int. J. Energy Res., 2005, 29, 455–470.
26 R. L. Cornelissen, Thermodynamics and Sustainable Development:The Use of Exergy Analysis and the Reduction of Irreversibility,PhD thesis, University of Twente, The Netherlands, 1997.
27 J. Szargut, D. R. Morris and F. R. Steward, Exergy Analysis ofThermal and Metallurgical Processes, Hemisphere PublishingCorporation, 1988.
28 W. Van Gool, Energy Policy: Fairly Tales and Factualities, in O.D.D.Soares et al. Innovation and Technology—Strategies and Policies,Kluwer, Dordrecht, 1997, pp. 93–105.
29 G. P. Hammond and A. J. Stapleton, Exergy Analysis of the UnitedKingdom Energy System, in The Paper Presented at the Institute ofMechanical Engineers, 2001, vol. 215, no. 2, pp. 141–162.
30 C. Koroneos, T. Spachos and N. Mousiopoulos, Exergy analysis ofrenewable energy sources, Renewable Energy, 2003, 28(2), 295–310.
31 G. Wall, Exergetics, Exergy Ecology Democracy, Molndal, 1998.32 Hans Dieter Baehr, assiduity K N Pattas, Thermodynamics:
Introduction in Fundamental and in Technical Applications,Giahoudis-Giapoulis, Thessaloniki, 1978.
33 F. Goran and O. Per, Exergies of natural resources in life-cycleassessment and other applications, Energy, 1997, 22(9), 923–931.
34 W. A. Amos, Costs of Storing and Transporting Hydrogen, NationalLaboratory Renewable Energy, 1998, NREL/TP-570-25106.
35 G. Beccali, M. Cellura and M. Mistretta, New exergy criterion in themulti\criteria context: a life cycle assessment of two plaster products,Energy Convers. Manage., 2003, 44, 2821–2838.
36 M. A. Rosen, Energy and exergy analysis of electrolytic hydrogenproduction, Int. J. Hydrogen Energy, 1995, 20(7), 547–553.
37 C. Zamfirescu and I. Dincer, How much exergy one can obtain fromincident solar radiation?, J. Appl. Phys., 2009, 105, 044911.
38 R. Petela, Exergy of undiluted thermal radiation, Sol. Energy, 2003,74(6), 469–488.
39 B. Sorensen, Renewable Energy, Academic Press, NY, 1979, ISBN:0-12-656150.
40 Characteristics of I-165 Photovoltaic Module. Isofoton. Available atwww.isofoton.com.
41 Y. A. Cengel and M. A. Boles, Thermodynamics, An EngineeringApproach, 3rd Edition,Copyright 1998 by MaGraw Hill, ISBN 960-7219074-0.
42 NEG-Micon Technical Data: http://www.windpower.dk/tour/wres/pow/index.htm.
43 Technical Data, Public Power Corporation of Greece, PPC, In Greek,http://www.dei.gr/.
44 A. Friedl, E. Padovas, H. Rotter and K. Varmuza, Prediction ofHeating Values of Biomass Fuel from Elemental Composition,Proceedings of the 9th International Conference on Chemometrics onAnalytical Chemistry, 15 July 2005.
45 W. Fenf, H. J. van der Kooi and J. de Swaan Arons, Biomassconversion in subcritical and supercritical water: driving force,phase equilibria, and thermodynamic analysis, Chem. Eng. Process.,2004, 43(12), 1459–1467.
46 Iaea,Hydrogen as an Energy Carrier and its Production by NuclearPower IAEA-TECDOC-1085,International Atomic Energy Agency,Vienna, Austria, 1999.
47 C. Koroneos, et al., Life cycle assessment of hydrogen fuel productionprocesses, Int. J. Hydrogen Energy, 2004, 29, 1443–1450.
Energy Environ. Sci., 2012, 5, 6640–6651 | 6651