Embed Size (px)
Citation preview
ARTICLE IN PRESS
International Journal of Adhesion & Adhesives 29 (2009) 525–534
Contents lists available at ScienceDirect
International Journal of Adhesion & Adhesives
0143-74
doi:10.1
� Corr
E-m
journal homepage: www.elsevier.com/locate/ijadhadh
Experimental and numerical analysis of a waterproofing adhesive layer usedon concrete-bridge decks
Qinwu Xu a,�, Qinghua Zhou b, Cesar Medina a, George K. Chang a, Dan K. Rozycki a
a The Transtec Group Inc., Austin, TX 78731, USAb The Key Laboratory for Special Area Highway Engineering of China’s Ministry of Education, Chang’an University, Xi’an 710064, China
a r t i c l e i n f o
Article history:
Accepted 20 December 2008This paper studies the adhesive behavior of a waterproof layer used between a concrete-bridge deck and
an asphalt–concrete overlay. The laboratory direct-shear and pull-off tests were designed to measure
Available online 29 January 2009Keywords:
B. Concrete
C. Finite-element stress
D. Mechanical properties of adhesives
96/$ - see front matter & 2009 Elsevier Ltd. A
016/j.ijadhadh.2008.12.001
esponding author. Tel.: +1512 709 4155; fax:
ail addresses: [email protected] (Q. Xu),
a b s t r a c t
the interface adhesive strengths. A three-dimensional, finite-element model was developed to analyze
the interfacial shear stress and tensile stress in response to vehicle loading. Results indicate that an
interface friction coefficient of 0.5 could achieve high interfacial shear strength with relatively low shear
stress. The safety factor (strength/stress) decreases significantly with increasing environmental
temperatures. The effects of compaction temperature, modulus, and thickness of overlay on the
adhesive strengths and stresses were also examined.
& 2009 Elsevier Ltd. All rights reserved.
1. Introduction
Adhesive materials are used in new constructions or rehabi-litation of bridge decks. These adhesive agents include epoxymaterials used to bond steel plates with concrete substrates [1,2],and asphalt binders used to bond asphalt–concrete (AC) overlayswith Portland cement concrete (PCC) decks [3]. Asphalt is a highlyviscous liquid or semi-solid with acceptable bonding properties,and has been primarily used as a binder between aggregateparticles to form AC mixture—a composite material used in roadpavements and bridge overlays. Asphalt is also used as animpervious material for manufacturing roofing shingles.
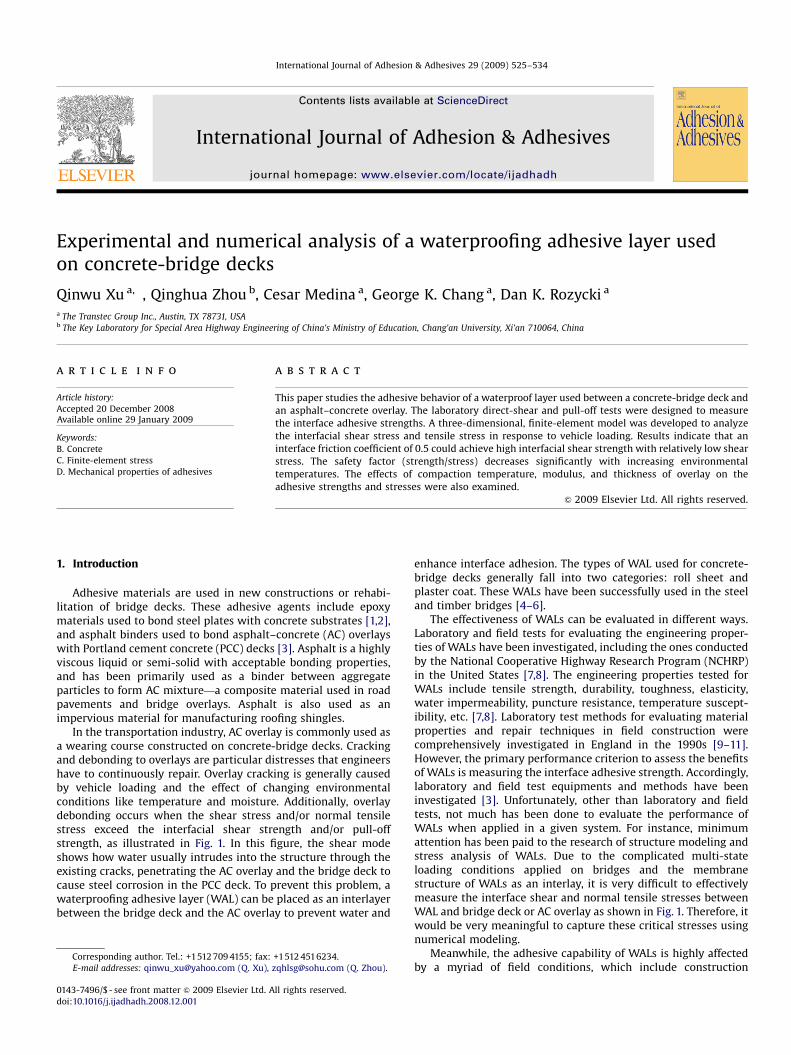
In the transportation industry, AC overlay is commonly used asa wearing course constructed on concrete-bridge decks. Crackingand debonding to overlays are particular distresses that engineershave to continuously repair. Overlay cracking is generally causedby vehicle loading and the effect of changing environmentalconditions like temperature and moisture. Additionally, overlaydebonding occurs when the shear stress and/or normal tensilestress exceed the interfacial shear strength and/or pull-offstrength, as illustrated in Fig. 1. In this figure, the shear modeshows how water usually intrudes into the structure through theexisting cracks, penetrating the AC overlay and the bridge deck tocause steel corrosion in the PCC deck. To prevent this problem, awaterproofing adhesive layer (WAL) can be placed as an interlayerbetween the bridge deck and the AC overlay to prevent water and
ll rights reserved.
+1512 4516234.
[email protected] (Q. Zhou).
enhance interface adhesion. The types of WAL used for concrete-bridge decks generally fall into two categories: roll sheet andplaster coat. These WALs have been successfully used in the steeland timber bridges [4–6].
The effectiveness of WALs can be evaluated in different ways.Laboratory and field tests for evaluating the engineering proper-ties of WALs have been investigated, including the ones conductedby the National Cooperative Highway Research Program (NCHRP)in the United States [7,8]. The engineering properties tested forWALs include tensile strength, durability, toughness, elasticity,water impermeability, puncture resistance, temperature suscept-ibility, etc. [7,8]. Laboratory test methods for evaluating materialproperties and repair techniques in field construction werecomprehensively investigated in England in the 1990s [9–11].However, the primary performance criterion to assess the benefitsof WALs is measuring the interface adhesive strength. Accordingly,laboratory and field test equipments and methods have beeninvestigated [3]. Unfortunately, other than laboratory and fieldtests, not much has been done to evaluate the performance ofWALs when applied in a given system. For instance, minimumattention has been paid to the research of structure modeling andstress analysis of WALs. Due to the complicated multi-stateloading conditions applied on bridges and the membranestructure of WALs as an interlay, it is very difficult to effectivelymeasure the interface shear and normal tensile stresses betweenWAL and bridge deck or AC overlay as shown in Fig. 1. Therefore, itwould be very meaningful to capture these critical stresses usingnumerical modeling.
Meanwhile, the adhesive capability of WALs is highly affectedby a myriad of field conditions, which include construction
ARTICLE IN PRESS
Tensile stress
Box-girder Bridge
Vehicle tire
Bridge beam
Shear stress
Water
Concrete bridge deck
Asphalt concrete overlay
Vehicle tire
Bridge bearing
Fig. 1. Interface debonding mechanisms: (a) shear mode—side view and (b) tensile
mode—front view.
AC overlay
PCC deck
APP modified asphalt
Polyester felt
SBS modified asphalt
WAL
Bridge beam
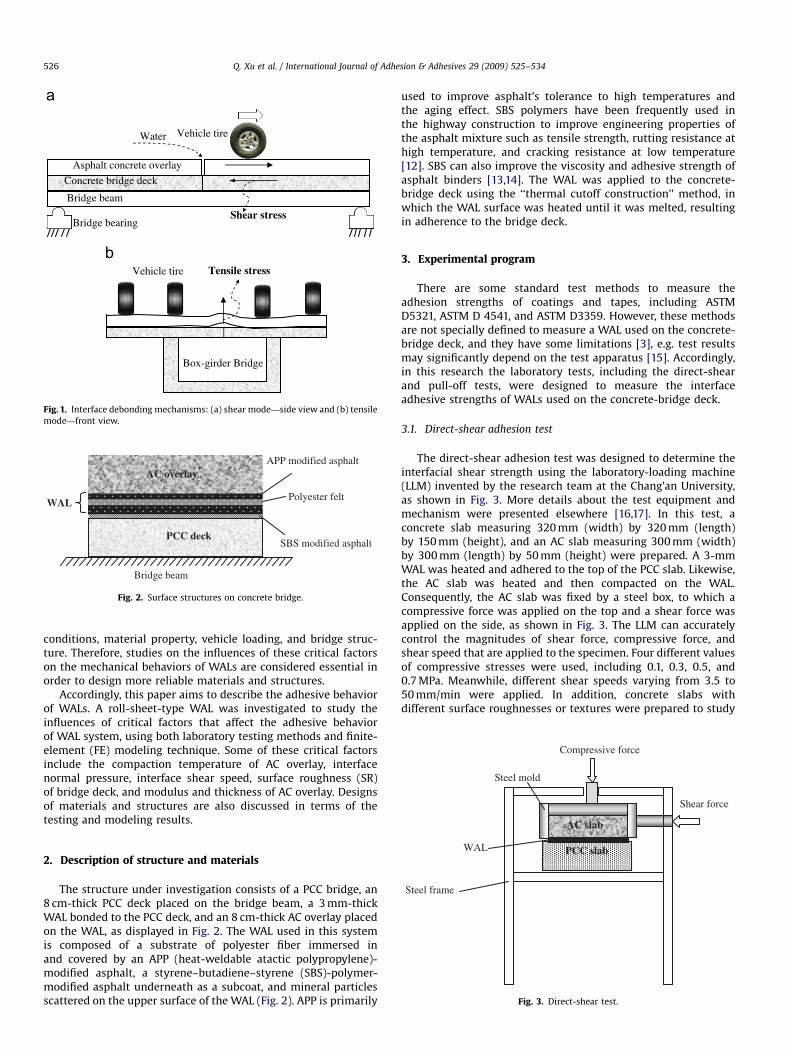
Fig. 2. Surface structures on concrete bridge.
AC slab
Shear force
Compressive force
Steel mold
Q. Xu et al. / International Journal of Adhesion & Adhesives 29 (2009) 525–534526
conditions, material property, vehicle loading, and bridge struc-ture. Therefore, studies on the influences of these critical factorson the mechanical behaviors of WALs are considered essential inorder to design more reliable materials and structures.
Accordingly, this paper aims to describe the adhesive behaviorof WALs. A roll-sheet-type WAL was investigated to study theinfluences of critical factors that affect the adhesive behaviorof WAL system, using both laboratory testing methods and finite-element (FE) modeling technique. Some of these critical factorsinclude the compaction temperature of AC overlay, interfacenormal pressure, interface shear speed, surface roughness (SR)of bridge deck, and modulus and thickness of AC overlay. Designsof materials and structures are also discussed in terms of thetesting and modeling results.
WAL PCC slab
Steel frame
Fig. 3. Direct-shear test.
2. Description of structure and materials
The structure under investigation consists of a PCC bridge, an8 cm-thick PCC deck placed on the bridge beam, a 3 mm-thickWAL bonded to the PCC deck, and an 8 cm-thick AC overlay placedon the WAL, as displayed in Fig. 2. The WAL used in this systemis composed of a substrate of polyester fiber immersed inand covered by an APP (heat-weldable atactic polypropylene)-modified asphalt, a styrene–butadiene–styrene (SBS)-polymer-modified asphalt underneath as a subcoat, and mineral particlesscattered on the upper surface of the WAL (Fig. 2). APP is primarily
used to improve asphalt’s tolerance to high temperatures andthe aging effect. SBS polymers have been frequently used inthe highway construction to improve engineering properties ofthe asphalt mixture such as tensile strength, rutting resistance athigh temperature, and cracking resistance at low temperature[12]. SBS can also improve the viscosity and adhesive strength ofasphalt binders [13,14]. The WAL was applied to the concrete-bridge deck using the ‘‘thermal cutoff construction’’ method, inwhich the WAL surface was heated until it was melted, resultingin adherence to the bridge deck.
3. Experimental program
There are some standard test methods to measure theadhesion strengths of coatings and tapes, including ASTMD5321, ASTM D 4541, and ASTM D3359. However, these methodsare not specially defined to measure a WAL used on the concrete-bridge deck, and they have some limitations [3], e.g. test resultsmay significantly depend on the test apparatus [15]. Accordingly,in this research the laboratory tests, including the direct-shearand pull-off tests, were designed to measure the interfaceadhesive strengths of WALs used on the concrete-bridge deck.
3.1. Direct-shear adhesion test
The direct-shear adhesion test was designed to determine theinterfacial shear strength using the laboratory-loading machine(LLM) invented by the research team at the Chang’an University,as shown in Fig. 3. More details about the test equipment andmechanism were presented elsewhere [16,17]. In this test, aconcrete slab measuring 320 mm (width) by 320 mm (length)by 150 mm (height), and an AC slab measuring 300 mm (width)by 300 mm (length) by 50 mm (height) were prepared. A 3-mmWAL was heated and adhered to the top of the PCC slab. Likewise,the AC slab was heated and then compacted on the WAL.Consequently, the AC slab was fixed by a steel box, to which acompressive force was applied on the top and a shear force wasapplied on the side, as shown in Fig. 3. The LLM can accuratelycontrol the magnitudes of shear force, compressive force, andshear speed that are applied to the specimen. Four different valuesof compressive stresses were used, including 0.1, 0.3, 0.5, and0.7 MPa. Meanwhile, different shear speeds varying from 3.5 to50 mm/min were applied. In addition, concrete slabs withdifferent surface roughnesses or textures were prepared to study
ARTICLE IN PRESS
Q. Xu et al. / International Journal of Adhesion & Adhesives 29 (2009) 525–534 527
its effects on adhesion strengths. In this research SR was expressedby the friction coefficient u of the PCC slab on the surface, and wasmeasured using the pendulum friction tester. The value ofinterfacial shear strength, tmax (MPa), was calculated as follows:
tmax ¼ F=A (1)
where F is the maximum shear loading (N) and A the interfacialcontact area (mm2)
3.2. Pull-off adhesion test
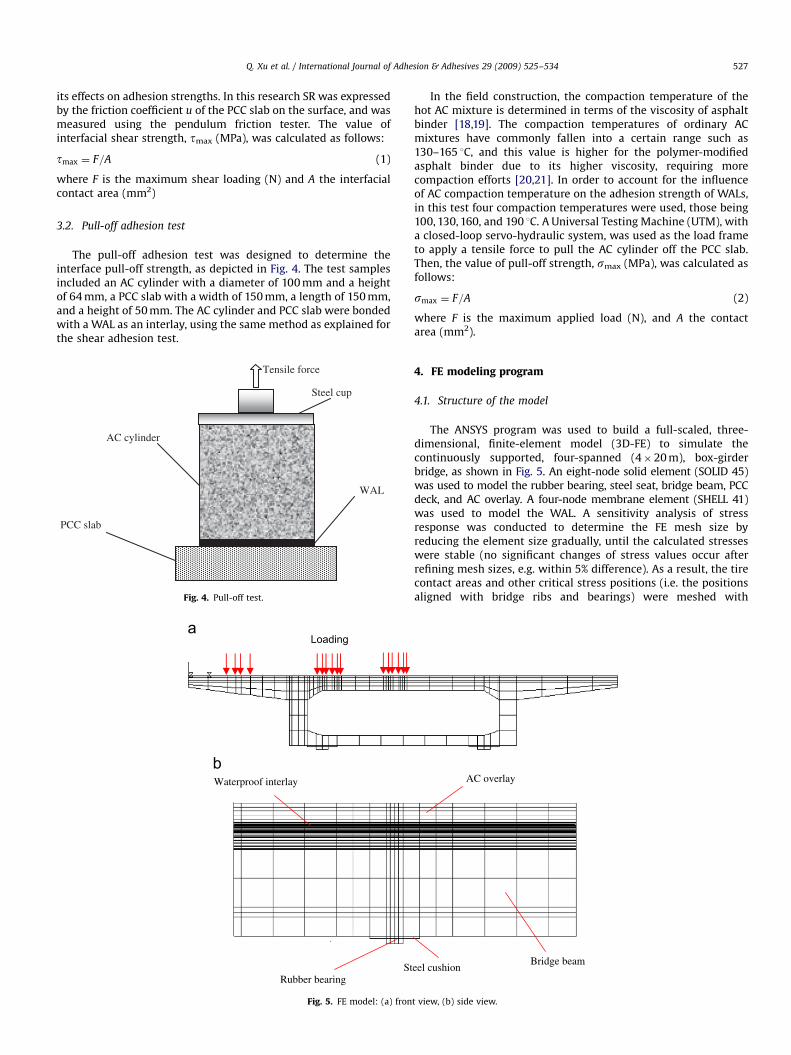
The pull-off adhesion test was designed to determine theinterface pull-off strength, as depicted in Fig. 4. The test samplesincluded an AC cylinder with a diameter of 100 mm and a heightof 64 mm, a PCC slab with a width of 150 mm, a length of 150 mm,and a height of 50 mm. The AC cylinder and PCC slab were bondedwith a WAL as an interlay, using the same method as explained forthe shear adhesion test.
Loading
St
Waterproof interlay
Rubber bearing
Fig. 5. FE model: (a) fron
AC cylinder
PCC slab
Steel cup
WAL
Tensile force
Fig. 4. Pull-off test.
In the field construction, the compaction temperature of thehot AC mixture is determined in terms of the viscosity of asphaltbinder [18,19]. The compaction temperatures of ordinary ACmixtures have commonly fallen into a certain range such as130–165 1C, and this value is higher for the polymer-modifiedasphalt binder due to its higher viscosity, requiring morecompaction efforts [20,21]. In order to account for the influenceof AC compaction temperature on the adhesion strength of WALs,in this test four compaction temperatures were used, those being100, 130, 160, and 190 1C. A Universal Testing Machine (UTM), witha closed-loop servo-hydraulic system, was used as the load frameto apply a tensile force to pull the AC cylinder off the PCC slab.Then, the value of pull-off strength, smax (MPa), was calculated asfollows:
smax ¼ F=A (2)
where F is the maximum applied load (N), and A the contactarea (mm2).
4. FE modeling program
4.1. Structure of the model
The ANSYS program was used to build a full-scaled, three-dimensional, finite-element model (3D-FE) to simulate thecontinuously supported, four-spanned (4�20 m), box-girderbridge, as shown in Fig. 5. An eight-node solid element (SOLID 45)was used to model the rubber bearing, steel seat, bridge beam, PCCdeck, and AC overlay. A four-node membrane element (SHELL 41)was used to model the WAL. A sensitivity analysis of stressresponse was conducted to determine the FE mesh size byreducing the element size gradually, until the calculated stresseswere stable (no significant changes of stress values occur afterrefining mesh sizes, e.g. within 5% difference). As a result, the tirecontact areas and other critical stress positions (i.e. the positionsaligned with bridge ribs and bearings) were meshed with
eel cushion Bridge beam
AC overlay
t view, (b) side view.
ARTICLE IN PRESS
Q. Xu et al. / International Journal of Adhesion & Adhesives 29 (2009) 525–534528
dimensions of 2�2�2 cm3 for each element, but other positionswere meshed with coarse mesh sizes. In total, 80,444 elementsand 101,420 nodes were used for the FE model.
4.2. Material model
Concrete is a brittle material and performs in an elastic wayat a small stress level that does not reach its ultimate strength.The elastic modulus E (MPa) of concrete was estimated from themeasured compressive strength using the American ConcreteInstitute (ACI) method [22], as follows:
E ¼ g1:5c � 0:043�
ffiffiffiffiffif 0c
q(3)
where gc is the material density (kg/m3) and f 0c the compressivestrength (MPa). Both the density and strength were determined bylaboratory tests. The Poisson’s ratio of the concrete was set as 0.18according to the bridge design specification [23].
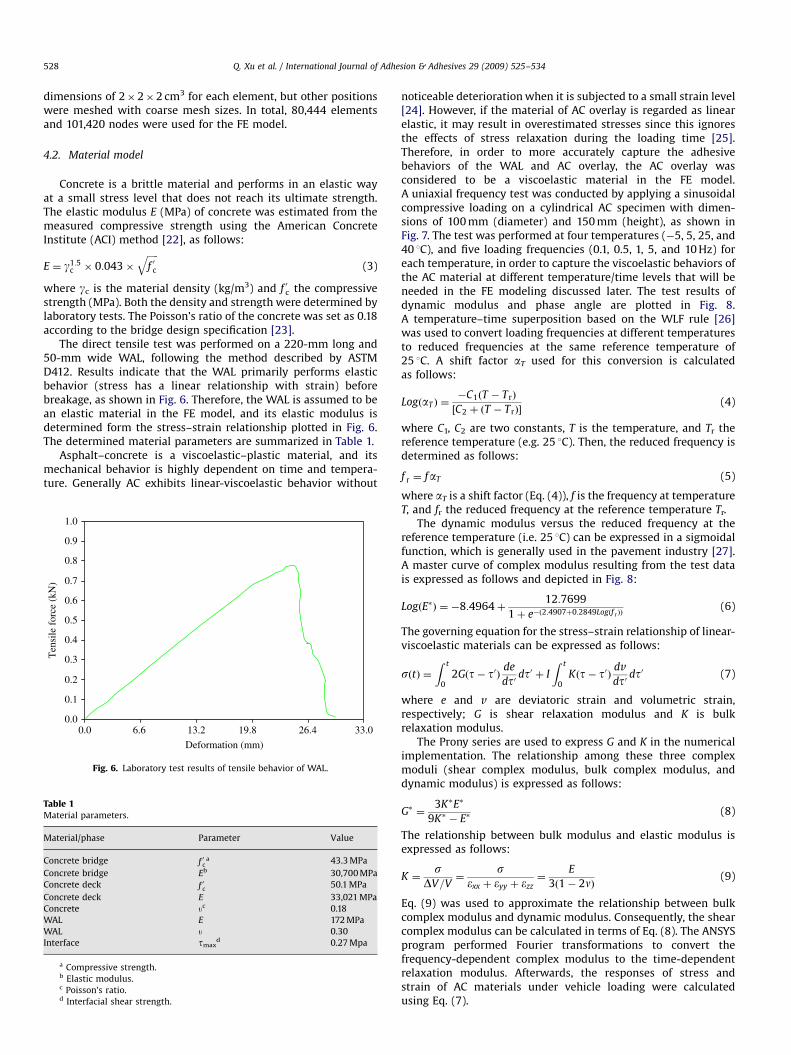
The direct tensile test was performed on a 220-mm long and50-mm wide WAL, following the method described by ASTMD412. Results indicate that the WAL primarily performs elasticbehavior (stress has a linear relationship with strain) beforebreakage, as shown in Fig. 6. Therefore, the WAL is assumed to bean elastic material in the FE model, and its elastic modulus isdetermined form the stress–strain relationship plotted in Fig. 6.The determined material parameters are summarized in Table 1.
Asphalt–concrete is a viscoelastic–plastic material, and itsmechanical behavior is highly dependent on time and tempera-ture. Generally AC exhibits linear-viscoelastic behavior without
0.0
0.1
0.2
0.3
0.4
0.5
0.6
0.7
0.8
0.9
1.0
0.0
Deformation (mm)
Ten
sile
for
ce (
kN)
6.6 13.2 19.8 26.4 33.0
Fig. 6. Laboratory test results of tensile behavior of WAL.
Table 1Material parameters.
Material/phase Parameter Value
Concrete bridge f 0ca 43.3 MPa
Concrete bridge Eb 30,700 MPa
Concrete deck f 0c 50.1 MPa
Concrete deck E 33,021 MPa
Concrete uc 0.18
WAL E 172 MPa
WAL u 0.30
Interface tmaxd 0.27 Mpa
a Compressive strength.b Elastic modulus.c Poisson’s ratio.d Interfacial shear strength.
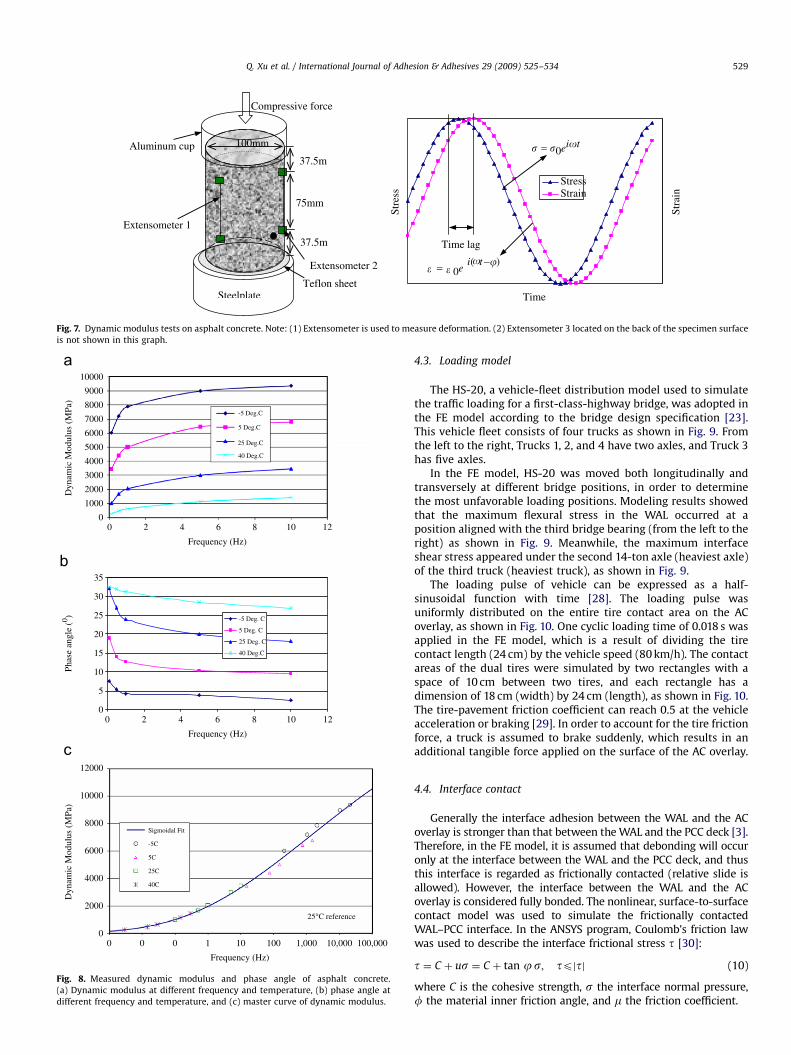
noticeable deterioration when it is subjected to a small strain level[24]. However, if the material of AC overlay is regarded as linearelastic, it may result in overestimated stresses since this ignoresthe effects of stress relaxation during the loading time [25].Therefore, in order to more accurately capture the adhesivebehaviors of the WAL and AC overlay, the AC overlay wasconsidered to be a viscoelastic material in the FE model.A uniaxial frequency test was conducted by applying a sinusoidalcompressive loading on a cylindrical AC specimen with dimen-sions of 100 mm (diameter) and 150 mm (height), as shown inFig. 7. The test was performed at four temperatures (�5, 5, 25, and40 1C), and five loading frequencies (0.1, 0.5, 1, 5, and 10 Hz) foreach temperature, in order to capture the viscoelastic behaviors ofthe AC material at different temperature/time levels that will beneeded in the FE modeling discussed later. The test results ofdynamic modulus and phase angle are plotted in Fig. 8.A temperature–time superposition based on the WLF rule [26]was used to convert loading frequencies at different temperaturesto reduced frequencies at the same reference temperature of25 1C. A shift factor aT used for this conversion is calculatedas follows:
LogðaT Þ ¼�C1ðT � TrÞ
C2 þ ðT � TrÞ½ �(4)
where C1, C2 are two constants, T is the temperature, and Tr thereference temperature (e.g. 25 1C). Then, the reduced frequency isdetermined as follows:
f r ¼ faT (5)
where aT is a shift factor (Eq. (4)), f is the frequency at temperatureT, and fr the reduced frequency at the reference temperature Tr.
The dynamic modulus versus the reduced frequency at thereference temperature (i.e. 25 1C) can be expressed in a sigmoidalfunction, which is generally used in the pavement industry [27].A master curve of complex modulus resulting from the test datais expressed as follows and depicted in Fig. 8:
LogðE�Þ ¼ �8:4964þ12:7699
1þ e�ð2:4907þ0:2849Logðf rÞÞ(6)
The governing equation for the stress–strain relationship of linear-viscoelastic materials can be expressed as follows:
sðtÞ ¼Z t
02Gðt� t0Þ de
dt0 dt0 þ I
Z t
0Kðt� t0Þ dv
dt0 dt0 (7)
where e and v are deviatoric strain and volumetric strain,respectively; G is shear relaxation modulus and K is bulkrelaxation modulus.
The Prony series are used to express G and K in the numericalimplementation. The relationship among these three complexmoduli (shear complex modulus, bulk complex modulus, anddynamic modulus) is expressed as follows:
G� ¼3K�E�
9K� � E�(8)
The relationship between bulk modulus and elastic modulus isexpressed as follows:
K ¼s
DV=V¼
s�xx þ �yy þ �zz
¼E
3ð1� 2nÞ(9)
Eq. (9) was used to approximate the relationship between bulkcomplex modulus and dynamic modulus. Consequently, the shearcomplex modulus can be calculated in terms of Eq. (8). The ANSYSprogram performed Fourier transformations to convert thefrequency-dependent complex modulus to the time-dependentrelaxation modulus. Afterwards, the responses of stress andstrain of AC materials under vehicle loading were calculatedusing Eq. (7).
ARTICLE IN PRESS
Stre
ss
Time
StressStrain
Stra
in
� = �0ei�t
)(0
−= tie
37.5m
37.5m
75mm
Extensometer 1
100mm
Steelplate
Extensometer 2
Teflon sheet
Compressive force
Aluminum cup
Time lag
� ���
Fig. 7. Dynamic modulus tests on asphalt concrete. Note: (1) Extensometer is used to measure deformation. (2) Extensometer 3 located on the back of the specimen surface
is not shown in this graph.
0
5
10
15
20
25
30
35
0
Phas
e an
gle
(0 ) -5 Deg. C
5 Deg. C
25 Deg. C
40 Deg.C
10000
9000
8000
7000
6000
5000
4000
3000
2000
1000
00 2 4 6 8 10 12
Frequency (Hz)
Frequency (Hz)
Frequency (Hz)
2
Dyn
amic
Mod
ulus
(M
Pa)
4 6 8 10 12
10000
12000
8000
6000
4000
2000
00
Dyn
amic
Mod
ulus
(M
Pa)
0 0 1 10 100 1,000 10,000 100,000
25°C reference
Sigmoidal Fit
-5C
5C
25C
40C
-5 Deg.C
5 Deg.C
25 Deg.C
40 Deg.C
Fig. 8. Measured dynamic modulus and phase angle of asphalt concrete.
(a) Dynamic modulus at different frequency and temperature, (b) phase angle at
different frequency and temperature, and (c) master curve of dynamic modulus.
Q. Xu et al. / International Journal of Adhesion & Adhesives 29 (2009) 525–534 529
4.3. Loading model
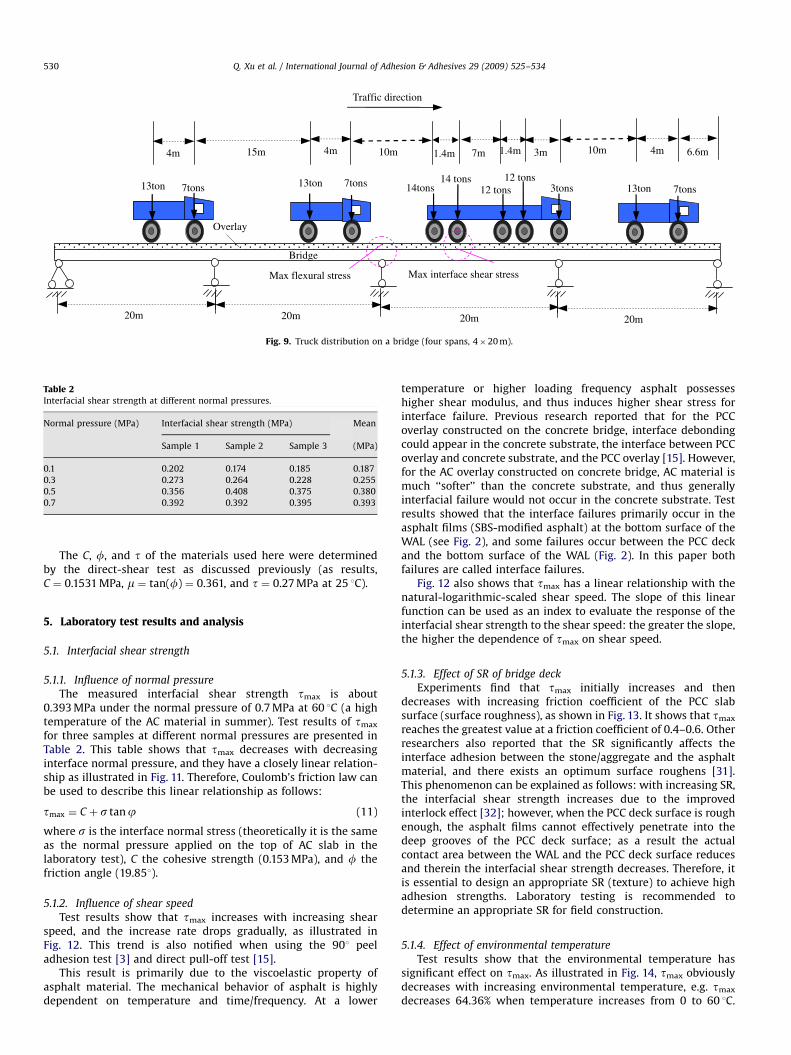
The HS-20, a vehicle-fleet distribution model used to simulatethe traffic loading for a first-class-highway bridge, was adopted inthe FE model according to the bridge design specification [23].This vehicle fleet consists of four trucks as shown in Fig. 9. Fromthe left to the right, Trucks 1, 2, and 4 have two axles, and Truck 3has five axles.
In the FE model, HS-20 was moved both longitudinally andtransversely at different bridge positions, in order to determinethe most unfavorable loading positions. Modeling results showedthat the maximum flexural stress in the WAL occurred at aposition aligned with the third bridge bearing (from the left to theright) as shown in Fig. 9. Meanwhile, the maximum interfaceshear stress appeared under the second 14-ton axle (heaviest axle)of the third truck (heaviest truck), as shown in Fig. 9.
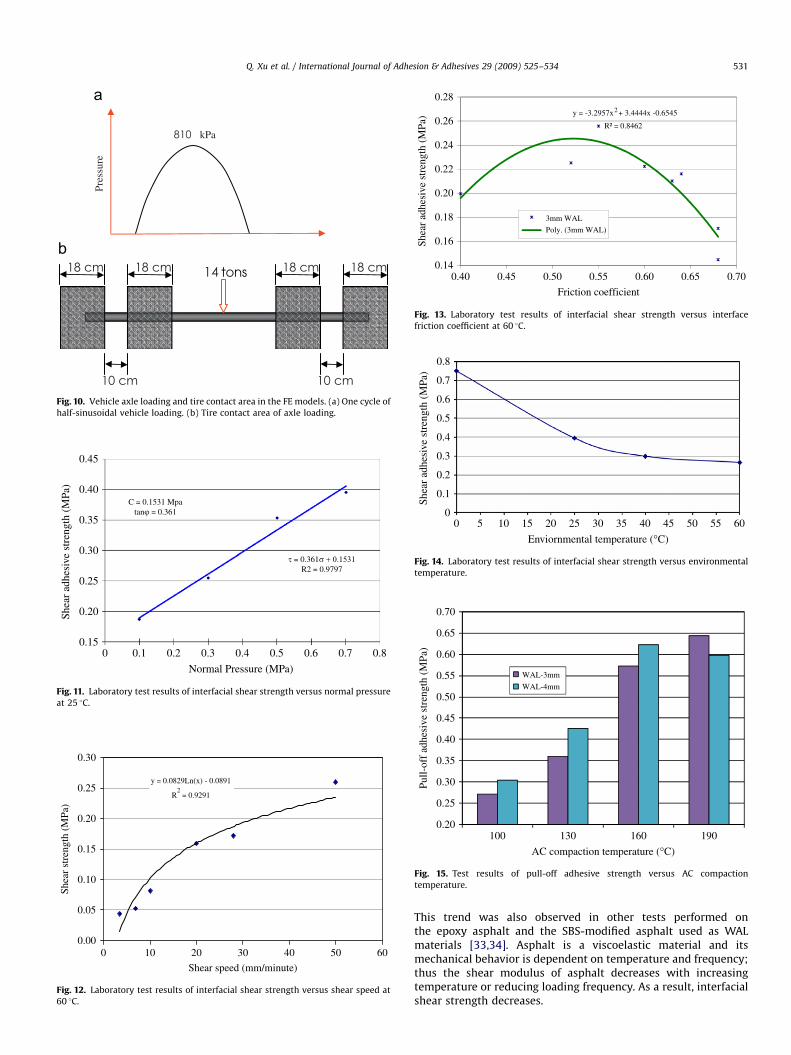
The loading pulse of vehicle can be expressed as a half-sinusoidal function with time [28]. The loading pulse wasuniformly distributed on the entire tire contact area on the ACoverlay, as shown in Fig. 10. One cyclic loading time of 0.018 s wasapplied in the FE model, which is a result of dividing the tirecontact length (24 cm) by the vehicle speed (80 km/h). The contactareas of the dual tires were simulated by two rectangles with aspace of 10 cm between two tires, and each rectangle has adimension of 18 cm (width) by 24 cm (length), as shown in Fig. 10.The tire-pavement friction coefficient can reach 0.5 at the vehicleacceleration or braking [29]. In order to account for the tire frictionforce, a truck is assumed to brake suddenly, which results in anadditional tangible force applied on the surface of the AC overlay.
4.4. Interface contact
Generally the interface adhesion between the WAL and the ACoverlay is stronger than that between the WAL and the PCC deck [3].Therefore, in the FE model, it is assumed that debonding will occuronly at the interface between the WAL and the PCC deck, and thusthis interface is regarded as frictionally contacted (relative slide isallowed). However, the interface between the WAL and the ACoverlay is considered fully bonded. The nonlinear, surface-to-surfacecontact model was used to simulate the frictionally contactedWAL–PCC interface. In the ANSYS program, Coulomb’s friction lawwas used to describe the interface frictional stress t [30]:
t ¼ C þ us ¼ C þ tan js; tpjtj (10)
where C is the cohesive strength, s the interface normal pressure,f the material inner friction angle, and m the friction coefficient.
ARTICLE IN PRESS
7tons13ton
4m
14 tons 12 tons 3tons
15m 3m1.4m 1.4m
14tons
Traffic direction
4m
13ton 7tons
6.6m
13ton
4m
7tons
Max flexural stress
Overlay
Bridge
12 tons
10m 10m
20m 20m 20m 20m
7m
Max interface shear stress
Fig. 9. Truck distribution on a bridge (four spans, 4�20 m).
Table 2Interfacial shear strength at different normal pressures.
Normal pressure (MPa) Interfacial shear strength (MPa) Mean
Sample 1 Sample 2 Sample 3 (MPa)
0.1 0.202 0.174 0.185 0.187
0.3 0.273 0.264 0.228 0.255
0.5 0.356 0.408 0.375 0.380
0.7 0.392 0.392 0.395 0.393
Q. Xu et al. / International Journal of Adhesion & Adhesives 29 (2009) 525–534530
The C, f, and t of the materials used here were determinedby the direct-shear test as discussed previously (as results,C ¼ 0.1531 MPa, m ¼ tan(f) ¼ 0.361, and t ¼ 0.27 MPa at 25 1C).
5. Laboratory test results and analysis
5.1. Interfacial shear strength
5.1.1. Influence of normal pressure
The measured interfacial shear strength tmax is about0.393 MPa under the normal pressure of 0.7 MPa at 60 1C (a hightemperature of the AC material in summer). Test results of tmax
for three samples at different normal pressures are presented inTable 2. This table shows that tmax decreases with decreasinginterface normal pressure, and they have a closely linear relation-ship as illustrated in Fig. 11. Therefore, Coulomb’s friction law canbe used to describe this linear relationship as follows:
tmax ¼ C þ s tanj (11)
where s is the interface normal stress (theoretically it is the sameas the normal pressure applied on the top of AC slab in thelaboratory test), C the cohesive strength (0.153 MPa), and f thefriction angle (19.851).
5.1.2. Influence of shear speed
Test results show that tmax increases with increasing shearspeed, and the increase rate drops gradually, as illustrated inFig. 12. This trend is also notified when using the 901 peeladhesion test [3] and direct pull-off test [15].
This result is primarily due to the viscoelastic property ofasphalt material. The mechanical behavior of asphalt is highlydependent on temperature and time/frequency. At a lower
temperature or higher loading frequency asphalt possesseshigher shear modulus, and thus induces higher shear stress forinterface failure. Previous research reported that for the PCCoverlay constructed on the concrete bridge, interface debondingcould appear in the concrete substrate, the interface between PCCoverlay and concrete substrate, and the PCC overlay [15]. However,for the AC overlay constructed on concrete bridge, AC material ismuch ‘‘softer’’ than the concrete substrate, and thus generallyinterfacial failure would not occur in the concrete substrate. Testresults showed that the interface failures primarily occur in theasphalt films (SBS-modified asphalt) at the bottom surface of theWAL (see Fig. 2), and some failures occur between the PCC deckand the bottom surface of the WAL (Fig. 2). In this paper bothfailures are called interface failures.
Fig. 12 also shows that tmax has a linear relationship with thenatural-logarithmic-scaled shear speed. The slope of this linearfunction can be used as an index to evaluate the response of theinterfacial shear strength to the shear speed: the greater the slope,the higher the dependence of tmax on shear speed.
5.1.3. Effect of SR of bridge deck
Experiments find that tmax initially increases and thendecreases with increasing friction coefficient of the PCC slabsurface (surface roughness), as shown in Fig. 13. It shows that tmax
reaches the greatest value at a friction coefficient of 0.4–0.6. Otherresearchers also reported that the SR significantly affects theinterface adhesion between the stone/aggregate and the asphaltmaterial, and there exists an optimum surface roughens [31].This phenomenon can be explained as follows: with increasing SR,the interfacial shear strength increases due to the improvedinterlock effect [32]; however, when the PCC deck surface is roughenough, the asphalt films cannot effectively penetrate into thedeep grooves of the PCC deck surface; as a result the actualcontact area between the WAL and the PCC deck surface reducesand therein the interfacial shear strength decreases. Therefore, itis essential to design an appropriate SR (texture) to achieve highadhesion strengths. Laboratory testing is recommended todetermine an appropriate SR for field construction.
5.1.4. Effect of environmental temperature
Test results show that the environmental temperature hassignificant effect on tmax. As illustrated in Fig. 14, tmax obviouslydecreases with increasing environmental temperature, e.g. tmax
decreases 64.36% when temperature increases from 0 to 60 1C.
ARTICLE IN PRESS
kPa
Pres
sure
Fig. 10. Vehicle axle loading and tire contact area in the FE models. (a) One cycle of
half-sinusoidal vehicle loading. (b) Tire contact area of axle loading.
0
0.45
0.40
0.35
0.30
0.25
0.20
0.150.1 0.2 0.3 0.4 0.5 0.6 0.7
Normal Pressure (MPa)
0.8
Shea
r ad
hesi
ve s
tren
gth
(MPa
)
C = 0.1531 Mpatanϕ = 0.361
τ = 0.361σ + 0.1531R2 = 0.9797
Fig. 11. Laboratory test results of interfacial shear strength versus normal pressure
at 25 1C.
y = 0.0829Ln(x) - 0.0891
R2 = 0.9291
0.00
0.05
0.10
0.15
0.20
0.25
0.30
0
Shear speed (mm/minute)
Shea
r st
reng
th (
MPa
)
10 20 30 40 50 60
Fig. 12. Laboratory test results of interfacial shear strength versus shear speed at
60 1C.
y = -3.2957x2 + 3.4444x -0.6545
R² = 0.8462
0.14
0.16
0.18
0.20
0.22
0.24
0.26
0.28
0.40
Shea
r ad
hesi
ve s
tren
gth
(MPa
)
Friction coefficient
3mm WAL
Poly. (3mm WAL)
0.45 0.50 0.55 0.60 0.65 0.70
Fig. 13. Laboratory test results of interfacial shear strength versus interface
friction coefficient at 60 1C.
0.8
0.7
0.6
0.5
0.4
0.3
0.2
0.1
00
5 10 15 20 25 30 35 40 45 50 55 60
Enviornmental temperature (°C)
Shea
r ad
hesi
ve s
tren
gth
(MPa
)
Fig. 14. Laboratory test results of interfacial shear strength versus environmental
temperature.
0.20
0.25
0.30
0.35
0.40
0.45
0.50
0.55
0.60
0.65
0.70
100
Pull-
off
adhe
sive
str
engt
h (M
Pa)
AC compaction temperature (°C)
WAL-3mm
WAL-4mm
130 160 190
Fig. 15. Test results of pull-off adhesive strength versus AC compaction
temperature.
Q. Xu et al. / International Journal of Adhesion & Adhesives 29 (2009) 525–534 531
This trend was also observed in other tests performed onthe epoxy asphalt and the SBS-modified asphalt used as WALmaterials [33,34]. Asphalt is a viscoelastic material and itsmechanical behavior is dependent on temperature and frequency;thus the shear modulus of asphalt decreases with increasingtemperature or reducing loading frequency. As a result, interfacialshear strength decreases.
ARTICLE IN PRESS
Q. Xu et al. / International Journal of Adhesion & Adhesives 29 (2009) 525–534532
5.2. Interface pull-off strength
5.2.1. Effect of compaction temperature
The compaction temperature of AC mixture in constructionmay affect the interfacial adhesion strength. Test results showthat pull-off strength smax increases with increasing AC compac-tion temperature, and the increase rate drops gradually, asillustrated in Fig. 15 (at 25 1C).
It is also noted that interface debonding occurs at the AC–WALinterface when the compaction temperature is relatively low (e.g.100 and 130 1C). This is because the asphalts of AC mixture are notmelted completely at these relatively low temperatures to formsufficient bonding effects at the AC–WAL interface. It is known forasphalt that the fluidity increases, while the viscosity decreaseswith increasing temperature. It is believed that microvoids at thesurface can be filled by adhesives only after sufficient wetting,followed by solidification to form interface adhesion according tothe mechanical interlock theory [35]. Other researches alsoreported that the asphalt binder with lower viscosity canpenetrate deeper and fill more voids in the AC mixture [35].
However, interface debonding occurs at the PCC–WAL interfacewhen the AC compaction temperature is equal to or higher than160 1C, which is because a strong adhesion forms at the AC–WALinterface at a relatively high temperature. Meanwhile, this showsthat the asphalt material of the WAL could be damaged and evenburned if the compaction temperature is too high (e.g. higher than190 1C), which is due to the aging effect of asphalts at hightemperatures. As a result, the adhesion strength eventually dropswith increasing compaction temperature, as shown in Fig. 15.Therefore, an optimum compaction temperature of the AC overlayis essential to achieve large interface adhesions. Based on the testresults obtained in this study, a temperature larger than 165 andless than 190 1C would be recommended.
5.2.2. Effect of environmental temperature
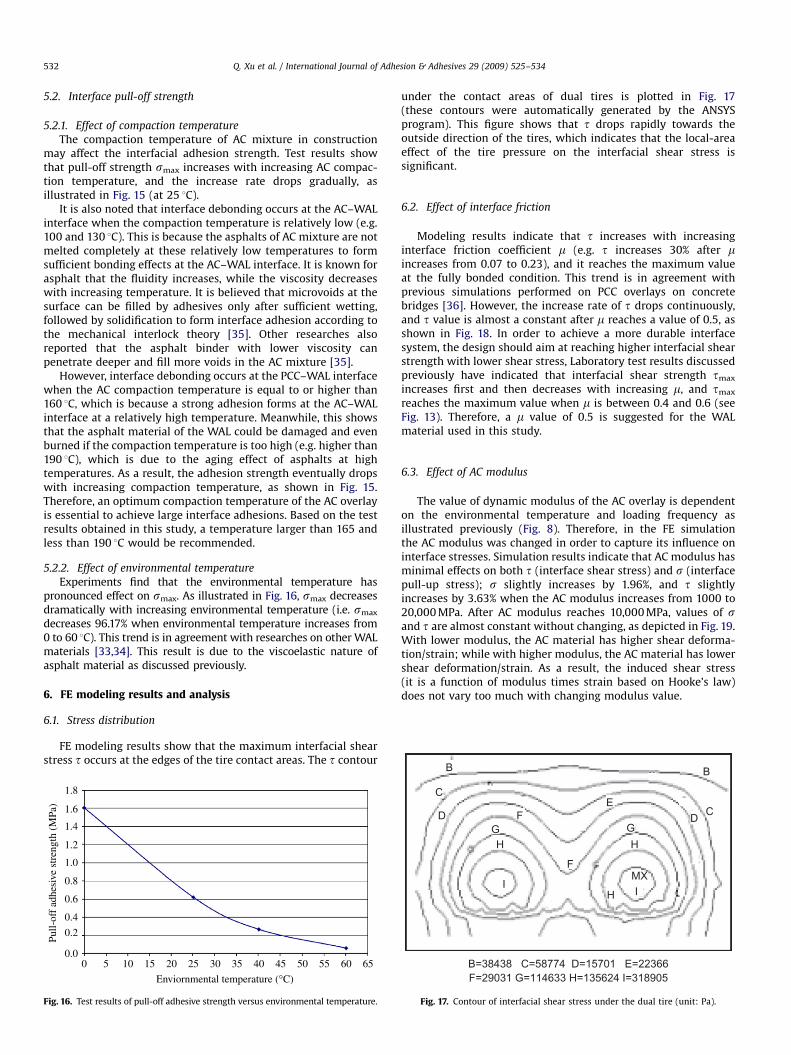
Experiments find that the environmental temperature haspronounced effect on smax. As illustrated in Fig. 16, smax decreasesdramatically with increasing environmental temperature (i.e. smax
decreases 96.17% when environmental temperature increases from0 to 60 1C). This trend is in agreement with researches on other WALmaterials [33,34]. This result is due to the viscoelastic nature ofasphalt material as discussed previously.
6. FE modeling results and analysis
6.1. Stress distribution
FE modeling results show that the maximum interfacial shearstress t occurs at the edges of the tire contact areas. The t contour
0.8
1.6
1.8
0.6
1.4
0.4
1.2
0.2
1.0
00.0
5 10 15 20 25 30 35 40 45 50 55 60 65
Enviornmental temperature (°C)
Pull-
off
adhe
sive
str
engt
h (M
Pa)
Fig. 16. Test results of pull-off adhesive strength versus environmental temperature.
under the contact areas of dual tires is plotted in Fig. 17(these contours were automatically generated by the ANSYSprogram). This figure shows that t drops rapidly towards theoutside direction of the tires, which indicates that the local-areaeffect of the tire pressure on the interfacial shear stress issignificant.
6.2. Effect of interface friction
Modeling results indicate that t increases with increasinginterface friction coefficient m (e.g. t increases 30% after mincreases from 0.07 to 0.23), and it reaches the maximum valueat the fully bonded condition. This trend is in agreement withprevious simulations performed on PCC overlays on concretebridges [36]. However, the increase rate of t drops continuously,and t value is almost a constant after m reaches a value of 0.5, asshown in Fig. 18. In order to achieve a more durable interfacesystem, the design should aim at reaching higher interfacial shearstrength with lower shear stress, Laboratory test results discussedpreviously have indicated that interfacial shear strength tmax
increases first and then decreases with increasing m, and tmax
reaches the maximum value when m is between 0.4 and 0.6 (seeFig. 13). Therefore, a m value of 0.5 is suggested for the WALmaterial used in this study.
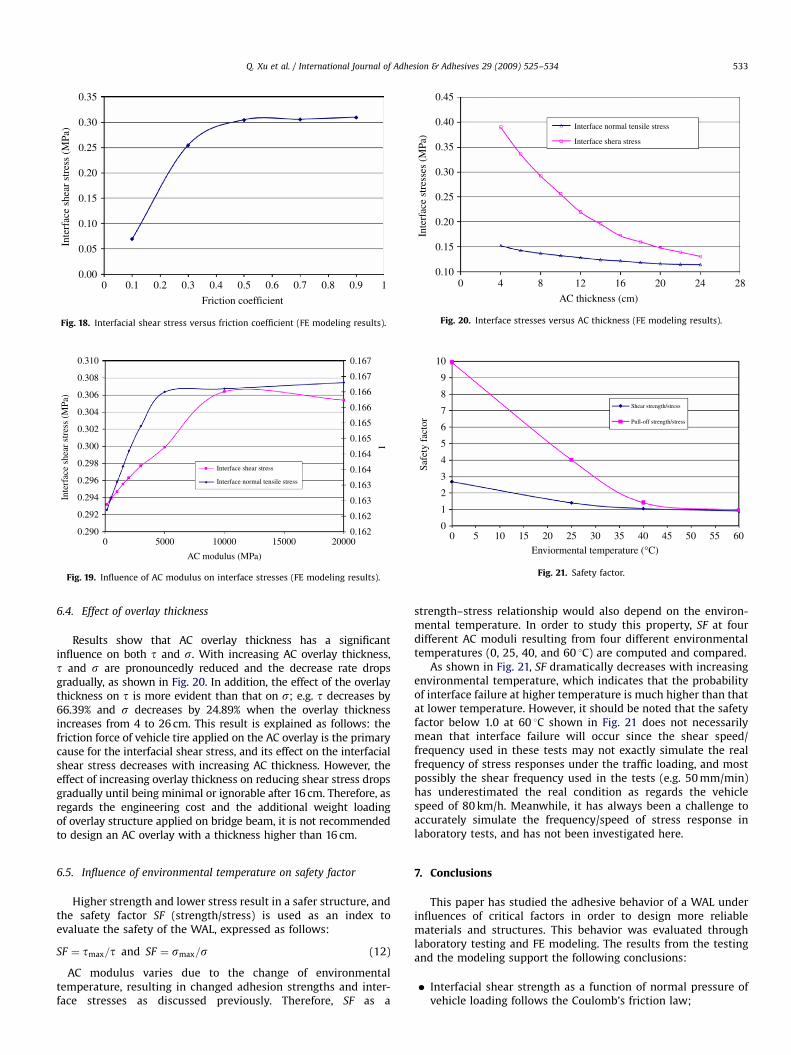
6.3. Effect of AC modulus
The value of dynamic modulus of the AC overlay is dependenton the environmental temperature and loading frequency asillustrated previously (Fig. 8). Therefore, in the FE simulationthe AC modulus was changed in order to capture its influence oninterface stresses. Simulation results indicate that AC modulus hasminimal effects on both t (interface shear stress) and s (interfacepull-up stress); s slightly increases by 1.96%, and t slightlyincreases by 3.63% when the AC modulus increases from 1000 to20,000 MPa. After AC modulus reaches 10,000 MPa, values of sand t are almost constant without changing, as depicted in Fig. 19.With lower modulus, the AC material has higher shear deforma-tion/strain; while with higher modulus, the AC material has lowershear deformation/strain. As a result, the induced shear stress(it is a function of modulus times strain based on Hooke’s law)does not vary too much with changing modulus value.
B=38438 C=58774 D=15701 E=22366F=29031 G=114633 H=135624 I=318905
B B
C
CE
F
F
HH
H I
D DGG
IMX
Fig. 17. Contour of interfacial shear stress under the dual tire (unit: Pa).
ARTICLE IN PRESS
0.30
0.35
0.25
0.20
0.15
0.10
0.05
0.000 0.1 0.2 0.3 0.4 0.5 0.6 0.7 0.8 0.9 1
Friction coefficient
Inte
rfac
e sh
ear
stre
ss (
MPa
)
Fig. 18. Interfacial shear stress versus friction coefficient (FE modeling results).
0.308
0.310
0.306
0.304
0.302
0.300
0.298
0.296
0.294
0.292
0.290
AC modulus (MPa)
0 5000 10000 15000 20000
Inte
rfac
e sh
ear
stre
ss (
MPa
)
0.162
0.162
0.163
0.163
0.164
0.164
0.165
0.165
0.166
0.166
0.167
0.167
I
Interface shear stress
Interface normal tensile stress
Fig. 19. Influence of AC modulus on interface stresses (FE modeling results).
0.45
0.40
0.35
0.30
0.25
0.20
0.15
0.100 4 8 12 16 20 24 28
AC thickness (cm)
Interface normal tensile stress
Inte
rfac
e st
ress
es (
MPa
)
Interface shera stress
Fig. 20. Interface stresses versus AC thickness (FE modeling results).
10
9
8
7
6
5
4
3
1
00 5 10 15 20 25 30 35 40 45 50 55
2
60
Enviormental temperature (°C)
Safe
ty f
acto
r
Shear strength/stress
Pull-off strength/stress
Fig. 21. Safety factor.
Q. Xu et al. / International Journal of Adhesion & Adhesives 29 (2009) 525–534 533
6.4. Effect of overlay thickness
Results show that AC overlay thickness has a significantinfluence on both t and s. With increasing AC overlay thickness,t and s are pronouncedly reduced and the decrease rate dropsgradually, as shown in Fig. 20. In addition, the effect of the overlaythickness on t is more evident than that on s; e.g. t decreases by66.39% and s decreases by 24.89% when the overlay thicknessincreases from 4 to 26 cm. This result is explained as follows: thefriction force of vehicle tire applied on the AC overlay is the primarycause for the interfacial shear stress, and its effect on the interfacialshear stress decreases with increasing AC thickness. However, theeffect of increasing overlay thickness on reducing shear stress dropsgradually until being minimal or ignorable after 16 cm. Therefore, asregards the engineering cost and the additional weight loadingof overlay structure applied on bridge beam, it is not recommendedto design an AC overlay with a thickness higher than 16 cm.
6.5. Influence of environmental temperature on safety factor
Higher strength and lower stress result in a safer structure, andthe safety factor SF (strength/stress) is used as an index toevaluate the safety of the WAL, expressed as follows:
SF ¼ tmax=t and SF ¼ smax=s (12)
AC modulus varies due to the change of environmentaltemperature, resulting in changed adhesion strengths and inter-face stresses as discussed previously. Therefore, SF as a
strength–stress relationship would also depend on the environ-mental temperature. In order to study this property, SF at fourdifferent AC moduli resulting from four different environmentaltemperatures (0, 25, 40, and 60 1C) are computed and compared.
As shown in Fig. 21, SF dramatically decreases with increasingenvironmental temperature, which indicates that the probabilityof interface failure at higher temperature is much higher than thatat lower temperature. However, it should be noted that the safetyfactor below 1.0 at 60 1C shown in Fig. 21 does not necessarilymean that interface failure will occur since the shear speed/frequency used in these tests may not exactly simulate the realfrequency of stress responses under the traffic loading, and mostpossibly the shear frequency used in the tests (e.g. 50 mm/min)has underestimated the real condition as regards the vehiclespeed of 80 km/h. Meanwhile, it has always been a challenge toaccurately simulate the frequency/speed of stress response inlaboratory tests, and has not been investigated here.
7. Conclusions
This paper has studied the adhesive behavior of a WAL underinfluences of critical factors in order to design more reliablematerials and structures. This behavior was evaluated throughlaboratory testing and FE modeling. The results from the testingand the modeling support the following conclusions:
�
Interfacial shear strength as a function of normal pressure ofvehicle loading follows the Coulomb’s friction law;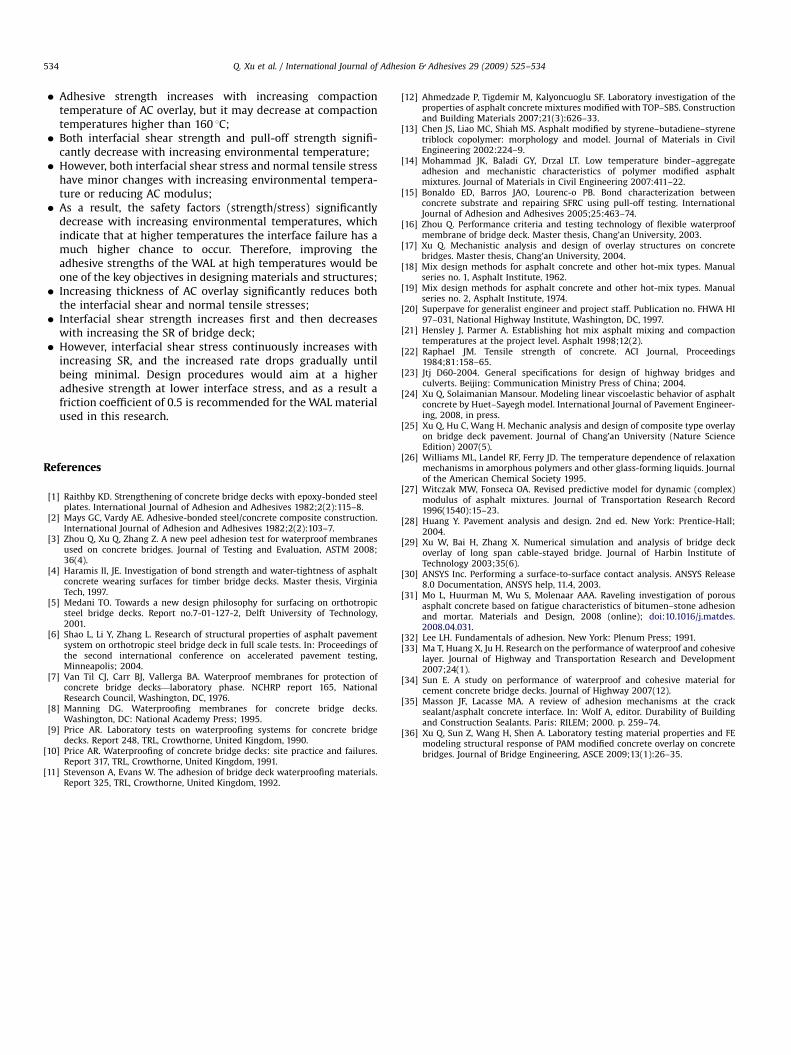
ARTICLE IN PRESS
Q. Xu et al. / International Journal of Adhesion & Adhesives 29 (2009) 525–534534
�
Adhesive strength increases with increasing compactiontemperature of AC overlay, but it may decrease at compactiontemperatures higher than 160 1C; � Both interfacial shear strength and pull-off strength signifi-cantly decrease with increasing environmental temperature;
� However, both interfacial shear stress and normal tensile stresshave minor changes with increasing environmental tempera-ture or reducing AC modulus;
� As a result, the safety factors (strength/stress) significantlydecrease with increasing environmental temperatures, whichindicate that at higher temperatures the interface failure has amuch higher chance to occur. Therefore, improving theadhesive strengths of the WAL at high temperatures would beone of the key objectives in designing materials and structures;
� Increasing thickness of AC overlay significantly reduces boththe interfacial shear and normal tensile stresses;
� Interfacial shear strength increases first and then decreaseswith increasing the SR of bridge deck;
� However, interfacial shear stress continuously increases withincreasing SR, and the increased rate drops gradually untilbeing minimal. Design procedures would aim at a higheradhesive strength at lower interface stress, and as a result afriction coefficient of 0.5 is recommended for the WAL materialused in this research.
References
[1] Raithby KD. Strengthening of concrete bridge decks with epoxy-bonded steelplates. International Journal of Adhesion and Adhesives 1982;2(2):115–8.
[2] Mays GC, Vardy AE. Adhesive-bonded steel/concrete composite construction.International Journal of Adhesion and Adhesives 1982;2(2):103–7.
[3] Zhou Q, Xu Q, Zhang Z. A new peel adhesion test for waterproof membranesused on concrete bridges. Journal of Testing and Evaluation, ASTM 2008;36(4).
[4] Haramis II, JE. Investigation of bond strength and water-tightness of asphaltconcrete wearing surfaces for timber bridge decks. Master thesis, VirginiaTech, 1997.
[5] Medani TO. Towards a new design philosophy for surfacing on orthotropicsteel bridge decks. Report no.7-01-127-2, Delft University of Technology,2001.
[6] Shao L, Li Y, Zhang L. Research of structural properties of asphalt pavementsystem on orthotropic steel bridge deck in full scale tests. In: Proceedings ofthe second international conference on accelerated pavement testing,Minneapolis; 2004.
[7] Van Til CJ, Carr BJ, Vallerga BA. Waterproof membranes for protection ofconcrete bridge decks—laboratory phase. NCHRP report 165, NationalResearch Council, Washington, DC, 1976.
[8] Manning DG. Waterproofing membranes for concrete bridge decks.Washington, DC: National Academy Press; 1995.
[9] Price AR. Laboratory tests on waterproofing systems for concrete bridgedecks. Report 248, TRL, Crowthorne, United Kingdom, 1990.
[10] Price AR. Waterproofing of concrete bridge decks: site practice and failures.Report 317, TRL, Crowthorne, United Kingdom, 1991.
[11] Stevenson A, Evans W. The adhesion of bridge deck waterproofing materials.Report 325, TRL, Crowthorne, United Kingdom, 1992.
[12] Ahmedzade P, Tigdemir M, Kalyoncuoglu SF. Laboratory investigation of theproperties of asphalt concrete mixtures modified with TOP–SBS. Constructionand Building Materials 2007;21(3):626–33.
[13] Chen JS, Liao MC, Shiah MS. Asphalt modified by styrene–butadiene–styrenetriblock copolymer: morphology and model. Journal of Materials in CivilEngineering 2002:224–9.
[14] Mohammad JK, Baladi GY, Drzal LT. Low temperature binder–aggregateadhesion and mechanistic characteristics of polymer modified asphaltmixtures. Journal of Materials in Civil Engineering 2007:411–22.
[15] Bonaldo ED, Barros JAO, Lourenc-o PB. Bond characterization betweenconcrete substrate and repairing SFRC using pull-off testing. InternationalJournal of Adhesion and Adhesives 2005;25:463–74.
[16] Zhou Q. Performance criteria and testing technology of flexible waterproofmembrane of bridge deck. Master thesis, Chang’an University, 2003.
[17] Xu Q. Mechanistic analysis and design of overlay structures on concretebridges. Master thesis, Chang’an University, 2004.
[18] Mix design methods for asphalt concrete and other hot-mix types. Manualseries no. 1, Asphalt Institute, 1962.
[19] Mix design methods for asphalt concrete and other hot-mix types. Manualseries no. 2, Asphalt Institute, 1974.
[20] Superpave for generalist engineer and project staff. Publication no. FHWA HI97–031, National Highway Institute, Washington, DC, 1997.
[21] Hensley J, Parmer A. Establishing hot mix asphalt mixing and compactiontemperatures at the project level. Asphalt 1998;12(2).
[22] Raphael JM. Tensile strength of concrete. ACI Journal, Proceedings1984;81:158–65.
[23] Jtj D60-2004. General specifications for design of highway bridges andculverts. Beijing: Communication Ministry Press of China; 2004.
[24] Xu Q, Solaimanian Mansour. Modeling linear viscoelastic behavior of asphaltconcrete by Huet–Sayegh model. International Journal of Pavement Engineer-ing, 2008, in press.
[25] Xu Q, Hu C, Wang H. Mechanic analysis and design of composite type overlayon bridge deck pavement. Journal of Chang’an University (Nature ScienceEdition) 2007(5).
[26] Williams ML, Landel RF, Ferry JD. The temperature dependence of relaxationmechanisms in amorphous polymers and other glass-forming liquids. Journalof the American Chemical Society 1995.
[27] Witczak MW, Fonseca OA. Revised predictive model for dynamic (complex)modulus of asphalt mixtures. Journal of Transportation Research Record1996(1540):15–23.
[28] Huang Y. Pavement analysis and design. 2nd ed. New York: Prentice-Hall;2004.
[29] Xu W, Bai H, Zhang X. Numerical simulation and analysis of bridge deckoverlay of long span cable-stayed bridge. Journal of Harbin Institute ofTechnology 2003;35(6).
[30] ANSYS Inc. Performing a surface-to-surface contact analysis. ANSYS Release8.0 Documentation, ANSYS help, 11.4, 2003.
[31] Mo L, Huurman M, Wu S, Molenaar AAA. Raveling investigation of porousasphalt concrete based on fatigue characteristics of bitumen–stone adhesionand mortar. Materials and Design, 2008 (online); doi:10.1016/j.matdes.2008.04.031.
[32] Lee LH. Fundamentals of adhesion. New York: Plenum Press; 1991.[33] Ma T, Huang X, Ju H. Research on the performance of waterproof and cohesive
layer. Journal of Highway and Transportation Research and Development2007;24(1).
[34] Sun E. A study on performance of waterproof and cohesive material forcement concrete bridge decks. Journal of Highway 2007(12).
[35] Masson JF, Lacasse MA. A review of adhesion mechanisms at the cracksealant/asphalt concrete interface. In: Wolf A, editor. Durability of Buildingand Construction Sealants. Paris: RILEM; 2000. p. 259–74.
[36] Xu Q, Sun Z, Wang H, Shen A. Laboratory testing material properties and FEmodeling structural response of PAM modified concrete overlay on concretebridges. Journal of Bridge Engineering, ASCE 2009;13(1):26–35.


