Embed Size (px)
Citation preview

Aspects of Spatial Cognition in Parks
Sylvie Fontaine1,2, Geoffrey Edwards1,2, Michel Denis2,3, and Barbara Tversky2,4
1Centre de recherche en géomatique, Département des sciences géomatiques2The GEOIDE Network
3Université Paris-Sud4Stanford University
Abstract : Studies of the conceptual structures that support spatial cognition, suggest
a common basis for spatial and linguistic memory. Furthermore, studies of route
descriptions provide evidence that selecting crucial information units in these
directions is based on metacognitive knowledge that is largely independent of a
specific environment. In this paper, we investigated spatial memory as revealed
through drawn maps, with a view to exploring this common basis and testing for the
presence of metacognitive knowledge in the production of maps. Three experiments
were performed. In the first, both individuals with geomatics expertise and those
without were asked to draw maps from their memories of the Plains of Abraham Park
in Quebec City. These productions were then compared and analyzed. This
experiment led to a rich set of results, including the observation that individuals with
and without geomatics expertise proceed somewhat differently when drawing maps.
In a second experiment, an independent group was asked to judge the resulting maps
to determine “better” and “poorer” maps. Evidence was presented that supports the
notion of metacognitive knowledge about what constitutes a good map. Finally, in a
third experiment, a third group was asked to remove non-essential features from a
consolidated map that incorporated all features drawn by all participants in the first
experiment. This experiment likewise provided evidence of metacognitive knowledge
about maps independent of the environment studied. We conclude with some remarks
concerning the likely nature of the common basis that supports both linguistic and
cartographic representations of environmental space.
Key words : spatial cognition, parks, maps, navigation, metacognitive knowledge,
effects of gender, effects of expertise.
1) Introduction
1

To communicate environmental knowledge, people may use either language or
some form of drawing (or gestures if the goal is proximal). These different modes of
externalization have been studied to understand how people represent mentally their
environment. In this study, we focused on drawn maps. Maps are commonly drawn is
to communicate spatial information. Children produce maps spontaneously and maps
are among the earliest human artefacts.
Tversky and her colleagues have investigated the link between language and
depiction to communicate spatial information in a variety of studies. It is now largely
recognized that people reorganize spatial information hierarchically or via
categorisation (Hirtle and Jonides, 1985 ; Holding, 1994 ; Maki, 1981 ; McNamara,
1986 ; McNamara, Hardy and Hirtle, 1989). Because hierarchical organization is
characteristic of memory for linguistic material, Tversky (1992) suggested a common
basis for spatial and linguistic memory. In their study comparing route directions and
route maps, Tversky and Lee (1998) found similarity of structure in these two
externalizations. In Tversky and Lee (2000?), the authors constructed two toolkits of
primitive elements intended to construct either a route map or a route direction. The
map toolkit contained different simple graphic forms (such as rectangles to represent
landmarks) to indicate roads, intersections, signs and landmarks. The direction toolkit
components were verb phrases. Their results indicated that the toolkits were sufficient
for people to describe routes, either pictorially or verbally. Hence the authors
suggested a common conceptual structure underlying depiction and description of
routes.
Route directions have been studied in numerous studies (Galea and Kimura,
1993 ; Golding, Graesser and Hauselt, 1996 ; Lloyd, 1991 ; Wright, Lickorish, Hull
and Ummelen, 1995). Denis, Pazzaglia, Cornoldi and Bertolo (1999) were interested
more particularly in the content and structure of route directions. Four experiments
were conducted. First they collected verbal descriptions of three routes in the city of
Venice. The aim of the second experiment was to construct a “skeletal” description
following a procedure developed by Denis (1997). The skeletal description was the
result of the selection of information judged as the most important by participants.
Participants familiar with Venice as well as non-familiar participants selected similar
information. Hence the authors suggested that selecting crucial information units in
2

route directions is based on metacognitive knowledge that is largely independent of a
specific environment. The third experiment also showed agreement between familiar
and non-familiar participants when they were asked to rate the communicative value
of the original descriptions. Finally, the fourth experiment assessed the value of the
individual descriptions in comparison with the skeletal description for assisting
navigation by testing the navigational performance elicited by these descriptions.
Navigation performance with descriptions rated as good and with the skeletal
description was similar. The assumption that descriptions are variants of core
structure (formalized by construction of a skeletal description) was hence confirmed.
The existence of metacognitive knowledge of essential units and their organization
has been demonstrated. The same procedure has been reproduced in another
environment. The routes began on a platform of a subway station and ended in the
city of Paris (Fontaine, 2000). The same patterns of results were obtained. The
theoretical validity of the concept of “skeletal” description and the confirmation of
metacognitive knowledge have therefore been confirmed.
Given the suggested parallel between language and maps and the findings
described above, we decided to study drawn maps using a similar procedure. We were
interested in the content and the structure of the maps but also in the following
questions : Is there a core structure to maps? Is there metacognitive knowledge of
what is important in a map? And what constitutes a good map?
The environment used in the study was an urban park in Quebec City. The
maps did not concern a specific route but the park as a whole. Experiment #1
consisted in collecting maps of the park drawn by participants familiar with the park.
In Experiment #2, other familiar and non-familiar participants evaluated these drawn
maps. In Experiment #3, we constructed a “skeletal” map based on the selection of
information judged as the most important. Because maps are also commercial devices
produced by professionals, we also compared the performance of both mapping
experts and non-experts. The experts were students in geomatics and all had been
trained in cartography. The expertise can be used to determine whether some general,
shared principles are used and whether specific features due to training are evident.
3

It has been largely demonstrated that the characteristics of the environment
affect mental representation in terms of content (of course), structure (Taylor and
Tversky, 1992, Zannaras, 1973), spatial system of reference (Werner and Schmidt,
1999), and perspective (Tversky, Lee and Mainwaring, 1999 ; Taylor and Tversky,
1996). The environment studied here is the Plains of Abraham Park. It is a huge park
(covering 150 hectares), rather longer than wide. The park is delimited on the north
side by the city and on south by a steep hill overlooking the river. In addition to its
size, the park presents a wide variety of relief. Several planar areas border areas
characterized by strong slopes. There are only a few roads in the park. So we can say
that compared to a city or a campus, this environment is only weakly structured. Thus
one of the points examined was how these characteristics would affect the
representation that people form of the park.
2) Experiment #1: Sketching Maps
The use of sketched maps as dependent variables in psychology experiments is
fraught with difficulties. Indeed, drawn maps are generally incomplete, distorted, and
they mix metrics. They are schematized, often including blank spaces and
unconnected networks. It is also difficult to score them. Moreover, sketched maps are
often criticized for being affected by individual drawing ability. Conversely, Blades
(1990) found them reliable over time and Newcombe (1985) commented that they are
not less accurate than other cognitive techniques. As suggested by Davies and
Pederson (2001), drawn maps can cause difficulties when the aim of a study is
concerned with judging the “quality” or the “accuracy” of the maps (compared to
Euclidean space). On the other hand, maps can be a real source of information when
the focus of the study is to explore the knowledge elicited and the strategy followed
when drawing the map.
The construction of sketched maps has been shown to be related to the
organization of information in the mental spatial representation. Taylor and Tversky
(1992) analyzed the order in which map elements of different environments were
drawn. They found that the global organization of maps depended on both functional
and spatial aspects of the environment. The authors suggested that subgroups of the
hierarchical organization were based mainly on spatial proximity, spatial scale and
4

functional features. Directional conventions seemed to link the subgroups. Physical
features of the environment but also semantic factors affected the construction of the
maps (Holding, 1994). Walsh, Krauss and Regnier (1981) used sketched maps as a
dependent measure to examine whether the elderly would rely more on streets or
structures to describe their neighborhood. The authors observed that most participants
began their maps with some sort of street grid and then filled in the pattern with
landmarks and a few more streets.
Along the same line of reasoning, maps collected in Experiment #1 were
analyzed first based on their content and on their structure. We focused on the amount
of information present, including landmarks and roads. Errors of localization were
also considered. Because all participants knew the park (a questionnaire confirmed
this), we did not expected differences in the number of items drawn. Nevertheless
experts were assumed to make less errors of localization than non-experts, due to their
ability to manipulate spatial information.
Gender was also considered but as an additional between-subjects factor. Only
the non-expert group was concerned because of the great majority of men in
geomatics. When women have to produce route directions or maps, they used more
landmarks than men (McGuiness and Sparks, 1983 ; Miller and Santoni, 1986 ; Galea
and Kimura, 1993) but this difference has not always been found (Ward, Newcombe
and Overton, 1993 ; Harrell, Bowly and Hall-Hoffart, 2000). However, Lawton (1994,
1996) suggested that women mainly use a strategy based on landmarks while men use
a strategy based on geometrical properties. So we could expect that women would
draw more landmarks than men and men more routes than women. Maps drawn by
men might also be assumed to be more accurate, with fewer errors. Men might also
consider the exercise of drawing a map easier than women.
Moreover, because the park was in the city, it was interesting to examine
whether or not people linked the park to the city in explicit ways (keeping in mind
that they were asked to draw a map of the park). During the analysis, we considered
how the park and the city were linked and what kinds of links were used : landmarks
or routes. Following Walsh, Krauss and Regnier (1981), we considered roads to be
elements that structure an environment. If people drew all the roads in the park (there
5

are only six), one can assume that they relied on the existing structure (even if it is
weak). On the contrary, if roads were not mentioned, people would need to structure
the environment based on another kind of element.
The second concern was on the construction of the maps. Each drawn
information item was assigned a serial number. So we could reconstruct the
chronology of the maps. As was shown in previous studies, we expected to find a
hierarchical organization of the drawn maps. The spatial proximity, size and
functional aspects should be found to influence the structure. Research comparing
experts and non-experts in different domains (chess by Groot, 1966 or basketball by
Spilich, Vesonder, Chiesi and Voss, 1979) had generally attributed the memory
superiority of experts to a better organization of information in their base knowledge.
So the structuring of information in the experts’ maps should differ from the maps
drawn by the non-experts. Moreover, we also could expect differences in organization
between men and women. Because of their use of strategy based on geometric
properties, men should construct their maps following criteria like spatial proximity.
Women should construct maps according to criteria more related to landmarks like
functional or physical aspects.
2.1 Procedure
A) Participants
Two groups of individuals participated in the experiment: 9 experts (8 men and
one woman considered as such because they were graduate students in geomatics) and
27 persons (13 men and 14 women) non-expert in manipulating maps. These
individuals were recruited by a firm specialized in polling. Participants were paid for
their participation. The criterion for selection was the estimated knowledge of the
park for each individual: the minimal level of requested knowledge was about three
on a five point scale. The age of expert participants varied between 25 and 47 years
old and between 21 and 50 for the non-experts.
B) Material
White sheets of paper, legal size were given to participants to draw the maps.
Non-expert participants were filmed during their drawing.
6

C) Method
Participants were asked to draw a map of the principal park in Quebec City: the
Plains of Abraham. The map was intended so that a person who did not know the park
could find the necessary information to move about in the park and find points of
interest. For technical reasons, non-expert participants were the only ones to be
filmed. Only their hands and the paper were recorded. Once the map was drawn,
participants were asked to complete a questionnaire focusing on a posteriori
judgements of their maps, and on the activities and uses of the park.
2.2 Results
The analysis of results is divided in three parts. The first part concerns the analysis
of information provided on the maps. The second part concerns descriptive analysis of
data from the questionnaire and finally the last part presents analysis of the
construction of the maps.
Two between-subjects factors were considered: expertise (experts/non-experts)
and gender for the non-expert group.
A) Analysis of the information drawn on the maps
On each map, we counted the number of landmarks, the number of road
segments, and the number of road intersections. The sum of these gave us the total
number of information items present on the maps. We also considered two types of
errors: local errors corresponding to errors in localization of features in a specific area
and global errors corresponded to errors of localization when comparing features from
one area to another. Hence the dependent measures for the analyses were: the number
of landmarks, the number of road segments, the number of intersections, the total
number of information items, the number of local errors and the number of global
errors.
Data from the analysis of the maps from the two groups are presented in the
Tables 1 and 2.
7

Mean SD Minimum MaximumNb of
landmarks 20,44 9,77 12 39Nb of segments 17,67 8,76 13 40
Nb of intersections 13,89 7,37 6 32
Nb total 52 23,86 29 111Local errors 2,11 1,36 0 4Global errors 0,11 0,33 0 1
Table 1. Data from the expert group
Mean SD Minimum MaximumNb of
landmarks 13,22 7,16 1 32Nb of segments 7,41 5,53 0 20
Nb of intersections 4,78 4,2 0 16
Nb total 25,41 14,96 5 59Local errors 1,96 1,43 0 6Global errors 0,81 0,96 0 3
Table 2. Data from the non-expert group
For both groups, a great variability in the richness of the maps can be noticed.
For the expert group, the number of information items varied between 29 and 111 and
between 5 and 59 for the non-expert group. For both groups, local errors were more
numerous than global ones.
We conducted an ANOVA test on the different dependent measures with the
expertise as the between-subjects factor.
Regardless of the type of information concerned, the experts drew more
information than the non-experts. The expertise had a significant effect on :
- the number of landmarks (F(1,34)=5.7 ; p=0.02)
- the number of road segments (F(1,34)=17.12 ; p=0.0002)
- the number of intersections (F(1,34)=21.32 ; p=5.35.10-5)
- the total number of information items (F(1,34)=15.64 ; p=0.0003)
8

While no difference was observed between the two groups for the local errors, the non
experts made more global errors than the experts (F(1,34)=4.55 ; p=0.04).
An analysis of variance was also conducted on the non-expert group to
evaluate the effect of gender on the different dependent variables. No difference
between men and women was observed.
In the questionnaire, participants were asked to indicate whether or not they
had already seen a map of the park. Because having seen a map of the park could have
affected their drawing, we considered this as a between-subjects factor. As all the
experts except one had seen a map of the park, only data from the non-expert group
were examined. Analysis showed that having seen a map of the park had only an
effect on the number of landmarks (F(1,23)=4.74 ; p=0.03). The thirteen participants
who had seen a map drew on average 16 landmarks (SD=7.88) while the others drew
on average only 10.5 landmarks (SD=5.45).
The experts draw more information, including both landmarks and roads, than
did non-experts. When experts were compared to non-experts on memory tasks, the
former always showed a better performance. Some authors have attributed this
difference to a better organization of information in their knowledge base. Our two
groups had similar levels of knowledge of the park and of frequency in visiting the
park. We can therefore suggest that the ability of the experts to use spatial
information, their ability to read and use maps, helped them to better organize the
information. A good organization allowed them to construct the map more efficiently.
The greater use of roads by the experts could also be used to highlight the idea that
their knowledge was better structured than that of the non-experts.
The park is within Quebec City. Participants added to their maps some
information related to the city around the park. We examined how this information
was distributed on both environments, which proportion of information items could be
related to the city. Two categories of information were considered: information
concerning the park and information concerning the city. These were further
subdivided into two additional categories: information concerning landmarks and
information concerning routes. Hence four categories were considered: landmarks in
9

the park, landmarks in the city, routes in the park and routes in the city. We wanted to
examine how information was distributed among these categories and also to examine
whether the distribution of this information would be different or not when comparing
experts and non-experts.
We collated the occurrences of information items in each category for all the
participants. The following distributions were obtained:
Park Landmarks
City Landmarks
Park Roads City Roads
Experts 41,03 9,68 28,49 20,80Non Experts 59,13 7,22 20,34 13,31Total 51,88 8,21 23,60 16,31
Table 3. Repartition of the information (%)
In Table 3, it can be noticed that the proportion of roads was more important
in the information given by the experts than the non-experts but a Chi-Square analysis
did not show significant difference between the two distributions. However, by
combining landmarks in the park with landmarks in the city on the one hand and the
roads in the park with those in the city on the other, we observed that the landmarks
constitute 50.71% of the information items for the experts and 66.35% for the non
experts while the routes represent 49.29% of the information given by the experts and
33.65% for the non experts. The distribution of drawn information is hence
significantly different in both groups (Chi-Square significant at 0.05). Several
explanations can be suggested for this. Experts could give more importance to roads
than non-experts or experts could better remember roads than non-experts. It could
also illustrate that the experts’ knowledge was mainly structured on routes while the
knowledge of non-experts is based primarily on landmarks.
B) Analysis of the data from the questionnaire
In the questionnaire, participants’ responses consisted of a rating on a scale
(from 1 to 5). We used these scores as dependent measures to conduct the analyses
presented below. Questions concerned:
- confidence in the content of the maps (scale 1-5)
- confidence in the location of elements on the map (scale 1-5)
10

- ease of drawing the map (scale 1-5)
- evaluation of knowledge of the park (scale 1-5)
- evaluation of sense of direction (scale 1-9)
- duration of frequentation of the park (in years)
- frequencies of using the park during summer and winter
For this last question, five solutions were proposed: more than once in a week,
once in a week, twice a month, once a month and less than once a month. Each of
these responses was respectively associated to a numerical value from 5 to 1. These
numerical values were used for the analysis. Tables 4 and 5 presented data
respectively concerning the expert group and the non-expert group.
Mean SD Minimum MaximumContent 4,11 1 3 5Position 3,67 0,87 2 5Ease 3,78 0,97 2 5Knowledge 3,56 0,73 3 5Orientation 7,78 1,51 6 9Duration 17,28 15,7 2 43Freq. Winter 1/ month / -1/month +1/weekFreq. Summer 2/month / -1/month +1/week
Table 4. Average values for expert responses
Mean SD Minimum MaximumContent 3,48 0,89 2 5Position 3,63 0,84 2 5Ease 3,11 0,89 2 5Knowledge 3,26 0,71 2 5Orientation 7,19 1,88 1 9Duration 15,7 9,95 1 40Freq. Winter 1/ month / -1/month +1/weekFreq. Summer 1/week / -1/month +1/week
Table 5. Average values for non-expert responses
We conducted analysis of variance on scores as dependent measures with the
expertise as a between-subjects factor. Analyses did not show any difference in the
responses of the two groups. Only the confidence in the content of the map is
11

significantly more important for the experts than the non experts (F(1,34)=3.85 ;
p=0.05). Drawing a map seemed to be easier for the experts than the non-experts. The
knowledge of the park for both groups was evaluated as equivalent. The additional
amount of information given by the experts did not seem to be linked to a better
knowledge. The evaluation of the sense of direction gave similar average rates but the
distribution of the rates was smaller for the expert group. The frequentation of the
park was equivalent for both groups. A large distribution of the use of the park was
related to the large distribution in participants’ ages.
We also examined the eventual effect of gender on the responses of non-expert
participants. The analysis of variance with gender as a between-subjects factor on the
different scores revealed no significant difference between men and women. Contrary
to the result reported by Harrell et al. (2000), men did not express more confidence
about their maps than women.
The analysis of data from the questionnaire showed that the two groups could
be considered as equivalent for the self-evaluated knowledge, the duration of use, and
the frequency of visiting the park. Given the evaluations on confidence and on ease
provided, we can assume that drawing a map of the park appeared to be less difficult
than expected for the non-experts.
C) Analysis of the global progression in the construction of the maps
To analyze the construction of the maps, we examined the global progression
of the construction, that is the direction in which the drawings developed and the
chronology of the drawn information. For these analyses, each information item
drawn was identified and marked chronologically by the experimenter in order to
reconstruct the elaboration of the map (whether drawings were filmed or not).
Experts like non-experts used one to five sheets of paper to draw the map. 34
of the 36 participants oriented their sheets horizontally. We examined the orientation
of the map in relation to real cardinal directions (whether they were correctly
indicated or not). We focused on the orientation observed and the resulting direction
of north (and not on how people indicated north on the map). Table 6 presents the two
orientations observed from the experts and the non-experts. The maps were drawn so
12

that either north corresponded to the top of the sheet or that north corresponded to the
bottom of the sheet.
North at the top North at the bottomExperts 8 1Non experts 5 22
Table 6. Orientation of the maps
The orientation of the map was significantly different for both groups (Chi-
square significant at 0.01). Several points must be taken into account. The experts
oriented spontaneously their maps to place north at the top, hence respecting a
classical rule in cartography. The orientation of the maps drawn by the non-experts
was such that north was at the bottom. We observed that non-experts began their
maps at the bottom. However, the main accesses to enter in the park are on the north
side of the park, that is, one enters the park by moving from north to south. We can
suppose that for most of the non-experts, the drawings were constructed in the sense
of the displacements as one enters the park. This would suggest that non-experts
adopted a route perspective for drawing the map of the park, at least in the beginning,
reproducing the environment as they apprehended it when entering the park.
Moreover, 8 of the 9 experts and 18 of the 27 non-experts constructed their
maps from the left to the right (regardless of the orientation of the map: north at the
top or the bottom). This direction corresponds to the that determined by reading and
writing.
We suggest therefore that the one functional feature of the park, namely the
location of the entrance, guided the construction of the maps by the non experts,
determining the overall orientation of the map. Taylor and Tversky (1992a) observed
that when there was a main entrance in the environment to be drawn, the entrance was
chosen to begin the map.
13

D) Analysis of the chronology in the construction of the maps
This section is divided in two parts: one concerning general observations and
one concerning the chronology of landmarks.
General observations
Because of the great variability in the amount of information provided, we
considered only the twenty first drawn information items and among these, only those
given by at least 50% of the participants. A rank number, corresponding to the order
of drawing, was given to each information item. From these rank numbers, a median
rank was calculated.
Some differences between the two groups appeared. In the expert group, we
noticed that information items with median rank inferior to 10 were all located in the
area at the west extremity of the park. Nevertheless, no trend really emerged from the
data of the non-expert group. From the median rank calculated, no information item
seemed to be drawn repeatedly among the first five elements.
Moreover, we observed that the drawing of road segments, at least some of the
time, came early in the construction of the expert maps. In particular, the street
Grande Allée (the street which runs alongside the park, which is a kind of limit
between the city and the park) has a median rank of 1. All expert participants except
one began their map with this street. For the non-expert group, the moment for
drawing this street varied a lot among the participants. Eight streets appeared among
the first drawn information items given by the experts while only one appeared among
those drawn by the non-experts. Moreover, for the expert group, the median ranks of
the roads were generally lower than those of landmarks. The median rank of the
streets was 6.5 (between 1 and 9) and the median rank of the landmarks was 11.5
(between 3 and 18). On the expert maps, roads seem to be drawn before landmarks.
Experts appear to proceed in this way to structure the space.
These observations correspond to results shown previously. The routes seemed
to have a specific status in the experts’ maps. We suggest that routes are used as
structuring elements of the environment. Experts rely more on these elements. They
14

appear to have a more structured representation of the park. They seemed to locate, at
least at the beginning, landmarks in relation to previously drawn routes.
We noticed that drawing a landmark or a road at a specific place induces the
drawing of neighboring elements (a kind of cued recall). At the end of the drawing,
participants “browsed” their map from one extremity to the other in order to complete
it with other information. They simulate actual displacements within the park. The last
items on the map are often drawn in a random way. Some people however, recall
information via associations. The observed associations concerned different kinds of
objects like restrooms, water dispensers, viewpoints and parking lots. For example,
for a parking lot drawn, the other parking lots in the park were then checked and the
map was completed if one or more were missed.
Analysis of the chronology of landmarks
Again because of the great variability in the amount of information furnished,
we focused on landmarks given by at least half of the participants. But contrary to
what was done previously, we did not restrict our interest to the first twenty
information items, as only ten landmarks were present in all reproductions.
We wanted to examine if a hierarchical organization of landmarks could be
found and what kind of factors might determine this hierarchy. We proceeded like
Taylor and Tversky (1992) by conducting cluster analyses on the 10 remaining
landmarks drawn on the maps.
For each map, we calculated the recall interval for every pairwise combination
of landmarks, that is the number of landmarks recalled between the two items in the
pair. The interval was not spatial but temporal. For each recall order, the median
recall interval for each pair of landmarks was calculated and represented in a half
matrix. We used this matrix to compute cluster analysis for the experts and for the
non-experts. Figures 1 and 2 show clustering of landmarks for both groups.
15

Figure 1. Clustering of landmarks for the experts
In the cluster analysis for the experts, two groups emerged. The first group
includes the museum, the Grey Terrace, the jogging path and the garden. The second
group includes the Citadel, the tower, the Loews Hotel and the bandstand. Landmarks
from the first group were mostly in the west and landmarks from the second group
were located more in the east of the park. Finally, the last two landmarks were at the
eastern limit of the park. So this analysis confirmed the progression from west to east
and showed that the elaboration of expert maps was based mainly on spatial
proximity.
16

Figure 2. Clustering of landmarks for the non-experts
As shown in Figure 2, we observed a different clustering of landmarks for the non-
experts. Two groups also emerged. The first group included the Citadel, the Grey
Terrace, the Loews Hotel and the jogging path. The jogging path is at the western end
of the park. The Loews Hotel is in the city, on a border of the park, approximately
equidistant from the western and eastern extremities. The Grey Terrace is in the west
of the park, south of the jogging path and the Citadel is at the eastern extremity. These
items are all located on the borders of the park. Their positions provide a frame-like
rectangle but open on the south. Once these elements were drawn, the rectangle was
filled in. The second group concerned items inside the park. So the elaboration of
maps of the non-experts was not structured in the same way as that of the experts.
Items at the borders seemed to be drawn first and then a filling in proceeded to occur.
Spatial proximity was not used as a recurrent rule.
Figure 3. Clustering of landmarks for non-expert men
17

The same analysis was conducted to differentiate the structure of maps drawn by men
and those drawn by women. Figures 3 and 4 showed the clustering for each of these
groups.
Contrary to what we expected, we did not find a clear structuring principle for the
men. The different subgroups observed did not seem to be based on spatial proximity
or another factor like functional or physical aspect.
Figure 4. Clustering of landmarks for non-expert women
However the structure observed for the non-expert group as a whole was
reproduced here for the women. They draw first information on the borders of the
park and then proceeded to fill in the map. The four elements on the right of Figure 4,
the jogging path, the Citadel, the Governors’ Promenade, and the Governors’ Kiosk
are all on the borders of the park. The first of these is at the western extremity of the
park and the three others are at the eastern extremity. The women seemed to fix the
eastern and western limits of the park at the beginning and then fill in between these.
Surprisingly, the localization of landmarks by women seemed to be more structured
than what we observed for men.
These results showed that at least for the ten landmarks considered, the
chronology of their drawings differed between experts and non-experts and between
men and women.
18

While experts seem to rely more on spatial proximity to draw the landmarks,
non-experts seem to rely on a functional but also on a spatial property of landmarks.
Because landmarks were located on the borders, they became functionally significant
to enclose the space of the park. This functional aspect was also observed for the
women. We expected that men would show a more structured representation,
especially concerning the spatial properties. The clustering of only ten landmarks
could have inhibited the observation of regularity in the constructions carried out by
men, however.
2.3 General Discussion of Experiment #1
Two points will be discussed: the content of the drawn maps and their
structure.
The first observation concerns the great variability in the amount of
information given by the participants, in spite of an equivalent visitation frequency for
the park. Aside from the intrinsic inter-individual variability, we suggest that the
environment itself and its specific use contribute to the variability of the content of the
maps. Indeed, most participants enter the park just to take a walk (as reported in the
questionnaire). They mainly adopt a “free exploration” mode of displacement within
the park. Their walks are not directed to specific goals or landmarks. Even if people
know the different buildings, monuments and routes in the park, they need not pay
much attention to them and to their location because their displacement behavior is
not goal-directed. While actually in the park, they will of course recognize these
features but they may not be recalled so easily when drawing the park. The
differences found between experts and non-experts could also be related to these
suggestions. Experts might pay more attention to the spatial information in their
environment than do the non-experts. As has been suggested for memory tasks
comparing experts and non-experts, their knowledge might be better organized. So
they can retrieve more information than the non-experts. The expertise provides tools
to structure the knowledge needed to elaborate a complete representation.
Our results provide additional support for the hierarchical organization of
spatial information. First, we found that the representation of the park in the expert
19

maps was structured according to the roads (in both the city and the park). The roads
provided a sort of grid with respect to which landmarks could then be located. The
localization of landmarks was mainly based on spatial proximity from west to east.
The pattern was different for the non-experts. They relied less on roads. The
construction of their maps suggested that people placed the limits of the park first and
then filled in the spaces between these limits. Their representations seemed less
structured than those of the experts, even if this strategy could, in principle, be as
efficient.
The landmarks on the borders of the park had a specific functionality
conferred by their specific location. We suggest that the characteristics of the
environment could also have affected the structuring of this information. Considering
the maps of the non-experts, it seems that their representations of the park were
mainly based on landmarks. Moreover, even if people had known the relationships
between landmarks, these are difficult to draw at best. Giving the nature of the
environment, the relations between landmarks can be expressed by using roads, paths
or shortcuts across the lawn. Moreover almost all participants said that they moved in
the park using both roads and shortcuts (data from the questionnaire). People should
move in the park by recognizing places. Because there was no constraint on the
displacements, we can assume that knowing the localization of the roads was not
necessary to the efficiency of the displacements. Another aspect is that there is no
chance to get lost in the park. From any point in the park, either the city or the river is
visible. So it is always possible to get out of the park.
Moreover the expertise had also an effect on the orientation of the expert
maps. They followed the cartographic rule that consists in placing north at the top.
They also seemed to demonstrate more ease in adopting a survey perspective to
externalize their knowledge. On the other hand, the orientation of the maps of the
non-experts suggested that the non-experts did not adopt a strict survey perspective
but mixed survey and route perspectives. Taylor and Tversky (1992a, 1996) already
observed that people often mix perspectives when they have to produce descriptions
of environments. In the drawings, some landmarks were drawn in a bird’s eye view
and others were drawn using a perspective representation (as if the drawer was
standing in front of them). Representing landmarks in perspective could also express
20

an attempt to give a more realistic and hence a more helpful representation. The use of
a route perspective was also evidenced by the orientation of the maps. The direction
of the drawings of the non-experts corresponded to the way one enters the park. As
observed by Taylor and Tversky (1996), the perspective adopted was influenced by
the structure of the environment.
In addition to revealing a route perspective, the direction of the drawings
might also reveal an environmental reference system. Werner and Schmidt (1999)
showed that accessibility of spatial knowledge was orientation-specific and strongly
dependent on characteristics of the environment. When imagining themselves aligned
with the streets at an intersection, participants answered faster and were more accurate
retrieving names of locations in different directions than when they imagined
themselves misaligned with the streets. The authors interpreted this finding as a
consequence of the spatial reference directions employed to mentally represent the
navigable environment. Certain directions, in their case the directions aligned with the
streets at an intersection, serve as reference directions in spatial memory.
In theories of the acquisition of spatial knowledge, it is expected that landmark
knowledge serves to elaborate route knowledge that could evolve into survey
knowledge (Siegel and White, 1975). The representations of the non-experts seemed
to be based mainly on landmarks. So our data did not illustrate this progression.
Previous research has shown that this progression could depend on the needs and
goals of the people (Moeser, Gauvain). We suggested that because of the nature if the
environment and consequently the needs and goals of the non-experts using the park,
they did not develop either a complete route knowledge or a survey knowledge of the
park. Our data illustrate, indeed, how context-specific, problem-specific and personal
are spatial mental representations of an environment.
3) Experiment #2: Evaluation of the drawn maps
The aims of this experiment were to collect evaluations of the drawn maps and
to investigate if metacognitive knowledge of what constitutes a good map exists. The
procedure was similar to that used Denis et al. (1999), although the latter worked with
verbal route descriptions rather than drawn maps. Participants were asked to give a
21

global score to maps and to answer a questionnaire (described below). Because this
task was very demanding, we selected a subset of 25 maps from the 36 collected in
Experiment #1. In the present experiment, we also studied the effect of expertise in
geomatics. We know that cartographers have some rules or criteria to produce maps
and once the rules are followed, the quality of the map produced is assured. We
wanted to examine differences in evaluation judgements according to expertise.
From the literature in graphic semiology (Bertin,) and cartography, we
selected criteria that seemed to be the most important to experts. Two classes of
criteria were considered: criteria concerning the physical qualities of the map and
criteria concerning the functional qualities. The criteria relating to the physical
qualities themselves divide up into physical qualities of the drawn objects and into
physical qualities of the map. For the drawn objects, we considered the following
elements : the quantity of information, respect for the proportions between objects, the
relative positions of objects, and the ability to identify objects quickly and simply. For
the map, we considered : the homogeneity of the scale and the aesthetic qualities of
the resulting map. The functional qualities are subdivided into factors concerning the
processing of the map and factors concerning the use of the map. On the one hand the
ease of reading, the localization of objects and the fact that the map supplies
recognizable elements were considered. On the other hand, we asked for a rating on
the extent to which the map allows one to locate oneself, to choose a goal and to
choose a route. The description of these criteria is given in Table 7.
Physical Qualities Functional Qualities
Objects Map Processing UseProportions
between objectsQuantity of information
Ease of reading To locate oneself
Relative position Homogeneity of scale
Localization of an object
Choose a goal
Identification Aesthetic qualities Recognition Choose a route
Table 7. Description of the evaluation criteria
Two experimental procedures were used. The first concerned the judges and
their differences. In the second one, we focused on the relations between the criteria.
22

If metacognitive knowledge of what constitutes a good map exits, we could
expect that evaluation by the judges would not differ as a function of their training,
their familiarity with the environment or their gender. A global score for one map
should be equivalent regardless of the kind of judge. If, on the other hand, such
knowledge does not exist, we can propose different hypotheses according to the
differences between the judges. Because experts use cartographic rules related to the
chosen criteria, we can assume that they should give more importance to these criteria
than the non-expert judges and might be harsher in their evaluation. We expected that
global scores given by the experts would be lower than those given by the non-
experts. We also expected that the weight of the different criteria would vary
according to the expertise.
Concerning the potential differences between men and women, data from the
literature suggest that women rely mainly on landmarks when they have to process a
space (in a real environment or on a map). So it would seem likely that women would
be more demanding for criteria related to the physical properties of objects, especially
their identification.
Moreover, not knowing the park could make the judges more demanding for
the respect of different criteria, so they might be expected to give lower evaluations
than judges familiar with the park. Nevertheless, on criteria concerning the accuracy
of localizations and object recognition, the non-familiar judges could be more
indulgent than familiar judges because they do not have any knowledge of the
environment.
In the second part of the experiment, we focused on the relations between
criteria. We examined the following questions: are some criteria more important than
the others, that is do they have more weight in the evaluation of the maps? Which
criteria can best explain the given scores? Do these criteria share dimensions in
common?
3.1 Procedure
23

A) Participants
Twelve persons participated in this experiment. Three factors were considered:
their gender, their expertise in geomatics and their familiarity with the studied
environment: the Plains of Abraham Park. Participants were considered as familiar
when they visited the park at least once a week and non-familiar when they have
never visited it or have done so just once. Participants were distributed through these
different categories as is showed in Table 8:
Men WomenFamiliar Non Familiar Familiar Non Familiar
Experts 1 1 1 1Non Experts 2 2 2 2
Table 8. Distribution of the participants
B) Material
A subset of 25 of the maps collected during Experiment #1 were used. These
maps were drawn by experts in geomatics (9) and by non experts (16). The maps were
presented on Legal sized sheets. They were all numbered. Their origin was not given.
C) Procedure
The task of the twelve participants consisted in evaluating drawn maps by
giving them first a global score on a scale of 7 points. The score 1 was given for a
map considered as poor, giving insufficient information or a map giving too much
information to be efficient. A score of 7 was given to an appropriate map allowing the
receiver to construct easily a good representation of the park, to navigate efficiently
and to find easily the places the receiver wants to visit. The judges were not informed
about the drawers’ level of expertise. After the global evaluation, participants were
asked to respond to 12 questions related to the qualities of the evaluated map (cf.
Appendix 1). The answers were to be given on a 7-point scale. Hence participants had
to give a global score and 12 scores (as responses to the questions) for each of the 25
maps.
3.2 Results
24

The factors considered in the analyses concerning the judges were their
expertise, their gender and their familiarity. The dependent variables were the global
score and the scores given to each criterion. These dependent variables were all
provided on a 7-point scale.
The analysis of results is organized in four parts. The first section concerns the
analyses of variance conducted to evaluate the effect of the different factors on all the
dependent variables, including the global scores, and the scores for individual criteria.
In the second section, we present analyses concerning the criteria, the relations
between the different criteria and their relative weights in the evaluation. The third
section focuses on the effect of the differences in expertise of the people who did the
drawings, on the evaluation by the judges. Finally, we describe in the last section, the
“profile” of the maps evaluated as the best and the maps evaluated as the poorest.
To facilitate the reading of the results, here is the list of the criteria:
- criterion 1, c1 : the quantity of information
- criterion 2, c2 : the respect of proportions between objects
- criterion 3, c3 : the relative position of objects
- criterion 4, c4 : the simple and fast identification of objects
- criterion 5, c5 : the homogeneity of the scale
- criterion 6, c6 : the aesthetic qualities
- criterion 7, c7 : the reading of the map
- criterion 8, c8 : the localization of objects
- criterion 9, c9 : if the map allows self positioning
- criterion 10, c10 : if the map allows to choose a goal
- criterion 11, c11 : if the map allows to choose a route
- criterion 12, c12 : if the map provides recognition elements
A) Analyses of the global score
The scores (global and for individual criteria) on the maps were processed as
repeated measures.
A 2 (expertise) x 2 (gender) x 2 (familiarity) ANOVA was conducted on the
global scores given on maps considered as repeated measures. The analysis of
25

variance showed only one effect of the maps (F(24,96)= 10.18 ; p=3.3.10 -17). As
expected, the global score depended on the map considered. No effect was found
concerning gender, familiarity or expertise. Nevertheless, men tended to give global
scores higher than women (3.89 vs. 2.98), and experts tended to give global scores
higher than non-experts (3.59 vs. 3.27). There was no difference between familiar and
non-familiar judges.
These results suggested that the evaluation of the maps was not affected by
gender, expertise or familiarity. The lack of difference could also be due to the limited
number of participants. Nevertheless, the numerous intra-individual measures should
have reduced this effect. Given this precaution, we suggest that the evaluation of the
maps seemed to use a common base whatever the expertise or the familiarity with the
environment.
B) Analysis of the agreement between judges
To evaluate agreement between the twelve judges, we calculated a matrix of
correlations describing the relations between the global scores given by the judges.
This matrix is presented in Table 9.
judges 1 2 3 4 5 6 7 8 9 10 11 12
1 1
2 0.73 1
3 0.69 0.58 1
4 0.69 0.76 0.66 1
5 0.65 0.52 0.46 0.49 1
6 0.71 0.60 0.53 0.56 0.79 1
7 0.59 0.53 0.42 0.45 0.35 0.32 1
8 0.51 0.66 0.36 0.44 0.33 0.48 0.32 1
9 0.47 0.52 0.54 0.53 0.66 0.39 0.29 0.24 1
10 0.71 0.81 0.66 0.65 0.51 0.59 0.51 0.40 0.47 1
11 0.55 0.54 0.51 0.52 0.45 0.67 0.38 0.47 0.18 0.43 1
12 0.60 0.55 0,41 0.52 0.60 0.42 0.47 0.47 0.65 0.53 0.38 1
Table 9. Correlation matrix between scores given by the twelve judges
(Coefficients in bold are significant at 0.05)
26

The matrix shows good agreement between judges in the global scores given.
To evaluate more accurately this agreement, we calculated intra-class coefficients
(ICC(3,1)) for the different kinds of judges (cf. Table 10).
ICC
Twelve judges 51.3 %
Experts 52.6 %
Non-Experts 48.9 %
Familiar 45.2 %
Non-Familiar 53.7 %
Men 54.8 %
Women 50.5 %
Table 10. Intra-classes coefficients for the different groups of judges
The correlation matrix and the intra-class coefficients suggest agreement between
judges independent of gender, familiarity or expertise. These results can be
interpreted as revealing common knowledge of what constitutes a good map and
suggest an implicit but shared grid of evaluation with common criteria.
C) Analysis of individual criteria
Analyses of scores given to criteria
A 2 (expertise) x 2 (gender) x 2 (familiarity) ANOVA was conducted
successively on scores given to the 12 criteria considered as repeated measures. For
each of the 12 criteria, the analysis of variance showed only an effect of the maps.
The score of each criterion depended on the map considered.
In addition to a map effect, the analysis showed a significant interaction
between gender and map on scores given for criterion #12 (elements of recognition)
(F(24,96)=9.92 ; p=0.01). Men gave a higher score to this criterion than women on all
maps (4.22 vs. 3.30).
27
As was observed for the global scores, scores given to describe the
contribution of the different criteria did not seem to depend on expertise, gender or
the familiarity of the judges. The limited number of judges could also have prevented
such differences from showing but these results were consistent with what were
observed with the global scores.
Analysis of relations between the 12 criteria
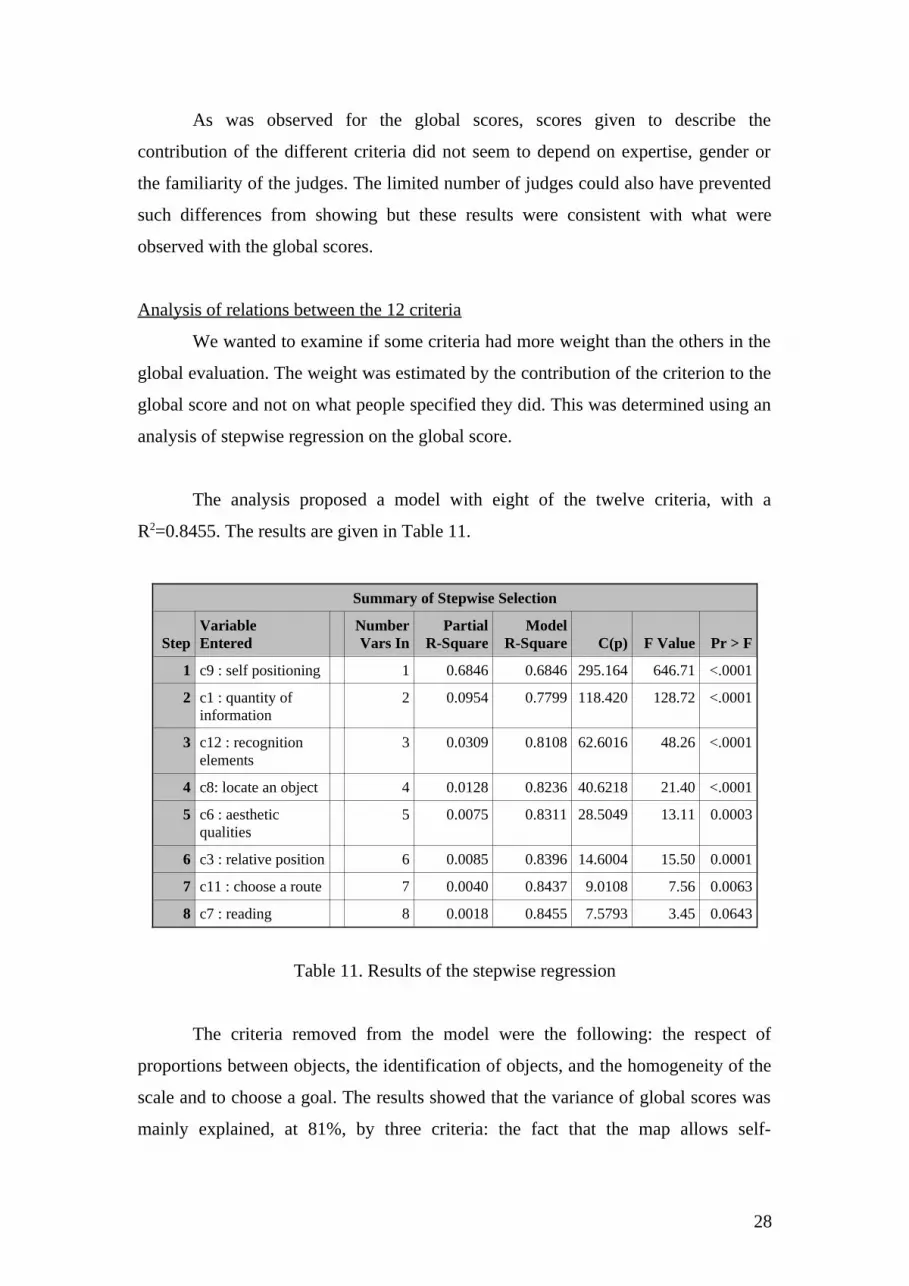
We wanted to examine if some criteria had more weight than the others in the
global evaluation. The weight was estimated by the contribution of the criterion to the
global score and not on what people specified they did. This was determined using an
analysis of stepwise regression on the global score.
The analysis proposed a model with eight of the twelve criteria, with a
R2=0.8455. The results are given in Table 11.
Summary of Stepwise Selection
StepVariableEntered
NumberVars In
PartialR-Square
ModelR-Square C(p) F Value Pr > F
1 c9 : self positioning 1 0.6846 0.6846 295.164 646.71 <.0001
2 c1 : quantity of information
2 0.0954 0.7799 118.420 128.72 <.0001
3 c12 : recognition elements
3 0.0309 0.8108 62.6016 48.26 <.0001
4 c8: locate an object 4 0.0128 0.8236 40.6218 21.40 <.0001
5 c6 : aesthetic qualities
5 0.0075 0.8311 28.5049 13.11 0.0003
6 c3 : relative position 6 0.0085 0.8396 14.6004 15.50 0.0001
7 c11 : choose a route 7 0.0040 0.8437 9.0108 7.56 0.0063
8 c7 : reading 8 0.0018 0.8455 7.5793 3.45 0.0643
Table 11. Results of the stepwise regression
The criteria removed from the model were the following: the respect of
proportions between objects, the identification of objects, and the homogeneity of the
scale and to choose a goal. The results showed that the variance of global scores was
mainly explained, at 81%, by three criteria: the fact that the map allows self-
28

positioning, the quantity of information and the fact that the map provides elements of
recognition.
In order to examine if the same model could be found in the different groups
of judges, we conducted stepwise regressions for the expert and non expert judges, for
men and women and for familiar and non familiar judges. The results are presented in
the following tables.
Summary of Stepwise Selection
StepVariableEntered
VariableRemoved
NumberVars In
PartialR-Square
ModelR-Square C(p) F Value Pr > F
1 c1 : quantity of information
1 0.7319 0.7319 139.567 267.49 <.0001
2 c9 : self positioning 2 0.0954 0.8273 57.7382 53.59 <.0001
3 c6 : aesthetic qualities
3 0.0358 0.8630 28.3277 25.06 <.0001
4 c12 : recognition elements
4 0.0170 0.8801 15.3517 13.50 0.0004
5 c8: locate an object 5 0.0101 0.8902 8.4658 8.66 0.0041
6 c2: respect of proportions
6 0.0055 0.8957 5.6199 4.92 0.0290
Table 12. Results of stepwise regression for experts
Summary of Stepwise Selection
StepVariableEntered
VariableRemoved
NumberVars In
PartialR-Square
ModelR-Square C(p) F Value Pr > F
1 c9 : self positioning 1 0.6949 0.6949 153.769 450.89 <.0001
2 c1 : quantity of information
2 0.0795 0.7744 64.5890 69.46 <.0001
3 c12 : recognition elements
3 0.0302 0.8046 31.9964 30.27 <.0001
4 c8: locate an object 4 0.0125 0.8171 19.6133 13.38 0.0003
5 c11 : choose a route 5 0.0065 0.8236 14.1956 7.12 0.0083
6 c3 : relative position 6 0.0047 0.8283 10.7687 5.32 0.0221
7 c6 : aesthetic qualities
7 0.0041 0.8325 8.0423 4.73 0.0309
8 c5 : homogeneity of scale
8 0.0036 0.8361 5.8995 4.21 0.0415
Table 13. Results of stepwise regression for non-experts
29

Summary of Stepwise Selection
StepVariableEntered
VariableRemoved
NumberVars In
PartialR-Square
ModelR-Square C(p) F Value Pr > F
1 c9 : self positioning 1 0.7184 0.7184 113.386 377.50 <.0001
2 c1 : quantity of information
2 0.0687 0.7871 52.0937 47.45 <.0001
3 c12 : recognition elements
3 0.0316 0.8187 24.9830 25.45 <.0001
4 c11 : choose a route 4 0.0107 0.8294 17.1600 9.06 0.0031
5 c3 : relative position 5 0.0065 0.8359 13.1793 5.70 0.0183
6 c7 : reading 6 0.0062 0.8420 9.4928 5.59 0.0194
7 c4 : identification 7 0.0034 0.8454 8.3988 3.09 0.0812
Table 14. Results of stepwise regression for men
Summary of Stepwise Selection
StepVariableEntered
VariableRemoved
NumberVars In
PartialR-Square
ModelR-Square C(p) F Value Pr > F
1 c8: locate an object 1 0.6598 0.6598 181.995 287.05 <.0001
2 c1 : quantity of information
2 0.1098 0.7696 78.1246 70.06 <.0001
3 c3 : relative position 3 0.0377 0.8073 43.7664 28.58 <.0001
4 c6 : aesthetic qualities 4 0.0303 0.8376 16.5316 27.08 <.0001
5 c11 : choose a route 5 0.0092 0.8469 9.6141 8.70 0.0037
6 c4 : identification 6 0.0034 0.8503 8.3507 3.23 0.0743
7 c9 : self positioning 7 0.0025 0.8528 7.9058 2.45 0.1200
Table 15. Results of stepwise regression for women
Summary of Stepwise Selection
StepVariableEntered
VariableRemoved
NumberVars In
PartialR-Square
ModelR-Square C(p) F Value Pr > F
1 c1 : quantity of information
1 0.6643 0.6643 134.995 292.92 <.0001
2 c9 : self positioning 2 0.1152 0.7796 40.5278 76.85 <.0001
3 c12 : recognition elements
3 0.0315 0.8110 16.1788 24.32 <.0001
4 c3 : relative position 4 0.0070 0.8180 12.3585 5.54 0.0199
5 c6 : aesthetic qualities 5 0.0076 0.8256 7.9591 6.31 0.0131
6 c8: locate an object 6 0.0048 0.8304 5.9518 4.04 0.0464
Table 16. Results of stepwise regression for familiar judges
30

Summary of Stepwise Selection
StepVariableEntered
VariableRemoved
NumberVars In
PartialR-Square
ModelR-Square C(p) F Value Pr > F
1 c9 : self positioning 1 0.7386 0.7386 138.715 418.15 <.0001
2 c12 : recognition elements
2 0.0710 0.8096 63.3384 54.86 <.0001
3 c8: locate an object 3 0.0304 0.8400 32.2513 27.72 <.0001
4 c11 : choose a route 4 0.0120 0.8520 21.1725 11.77 0.0008
5 c1 : quantity of information
5 0.0094 0.8615 12.8944 9.81 0.0021
6 c7 : reading 6 0.0064 0.8679 7.9043 6.95 0.0093
7 c3 : relative position 7 0.0039 0.8718 5.6034 4.37 0.0383
Table 17. Results of stepwise regression for non-familiar judges
The three prevalent criteria were also found in the models calculated for the
different groups of judges except for women. Scores given by women seemed to be
explained mainly by the capacity to locate an object, the quantity of information and
the relative position of objects, so criteria essentially based on the properties of
objects.
The model obtained for the experts proposed only six criteria: the quantity of
information, the possibility of self-positioning, the aesthetic qualities, the presence of
recognition elements, the possibility to locate an object and the proportions between
objects. Contrary to what we expected, the question of scale was not directly involved
in their evaluation but was in the model of non-experts. But the proportions between
objects are linked to the scale.
Whatever the group considered, criteria on physical qualities and functional
qualities were equally represented in the models. Nevertheless, among the three
prevalent criteria, the most important one is the fact that the map allows self-
positioning.
31

We can suggest that for the experts, a map should be complete, allow self-
positioning and have aesthetic qualities. For the non-experts, a map should allow self-
positioning, be complete and provide elements of recognition.
Analysis by principal components
Even though we knew that the criteria are linked to each other, we also wanted
to examine if the different criteria could be represented by some common dimensions.
To determine this, an analysis by principal components was conducted. We also
considered the dispersion of the global scores according to the scores given to the
criteria.
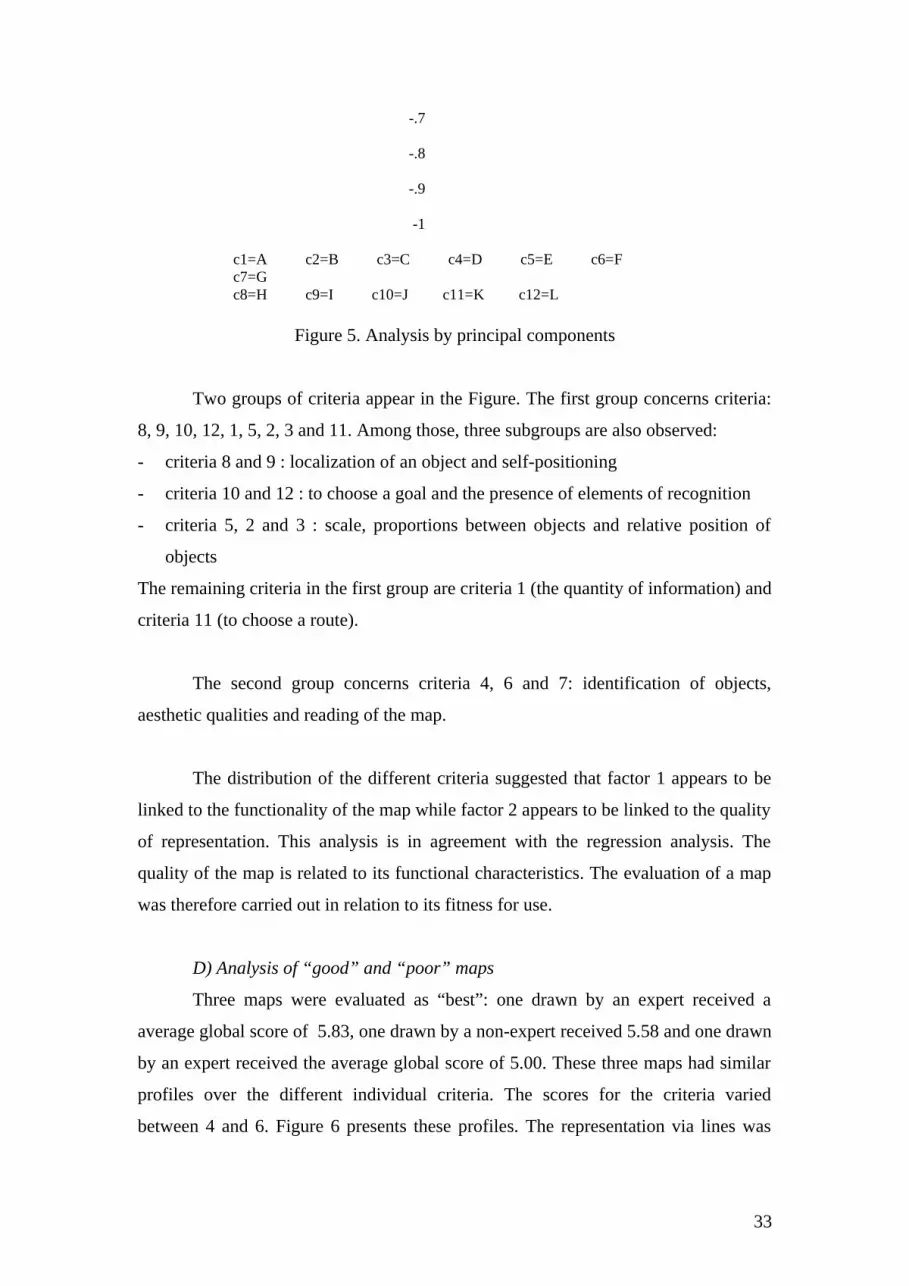
The analysis revealed two common factors, the variance expressed by the first was
6.86 and the variance explained by the second was 1.45. Figure 5 describes this analysis.
Plot of Factor Pattern for Factor1 and Factor2 Factor1 1 I H .9 JL A .8 EB C K .7 D .6 F G .5 .4 .3 .2 F .1 a c -1 -.9-.8-.7-.6-.5-.4-.3-.2-.1 0 .1 .2 .3 .4 .5 .6 .7 .8 .9 1.0t o -.1 r 2 -.2 -.3 -.4 -.5 -.6
32
-.7 -.8 -.9 -1 c1=A c2=B c3=C c4=D c5=E c6=F c7=G c8=H c9=I c10=J c11=K c12=L
Figure 5. Analysis by principal components
Two groups of criteria appear in the Figure. The first group concerns criteria:
8, 9, 10, 12, 1, 5, 2, 3 and 11. Among those, three subgroups are also observed:
- criteria 8 and 9 : localization of an object and self-positioning
- criteria 10 and 12 : to choose a goal and the presence of elements of recognition
- criteria 5, 2 and 3 : scale, proportions between objects and relative position of
objects
The remaining criteria in the first group are criteria 1 (the quantity of information) and
criteria 11 (to choose a route).
The second group concerns criteria 4, 6 and 7: identification of objects,
aesthetic qualities and reading of the map.
The distribution of the different criteria suggested that factor 1 appears to be
linked to the functionality of the map while factor 2 appears to be linked to the quality
of representation. This analysis is in agreement with the regression analysis. The
quality of the map is related to its functional characteristics. The evaluation of a map
was therefore carried out in relation to its fitness for use.
D) Analysis of “good” and “poor” maps
Three maps were evaluated as “best”: one drawn by an expert received a
average global score of 5.83, one drawn by a non-expert received 5.58 and one drawn
by an expert received the average global score of 5.00. These three maps had similar
profiles over the different individual criteria. The scores for the criteria varied
between 4 and 6. Figure 6 presents these profiles. The representation via lines was
33

chosen to give a more visual outline to the profiles. The lines do not represent
continuous variables, however.
0
1
2
3
4
5
6
7
c1 c2 c3 c4 c5 c6 c7 c8 c9 c10c11c12criteria
mean score
carte 4carte 9carte 13
Figure 6. Profiles of the three best maps for the different criteria
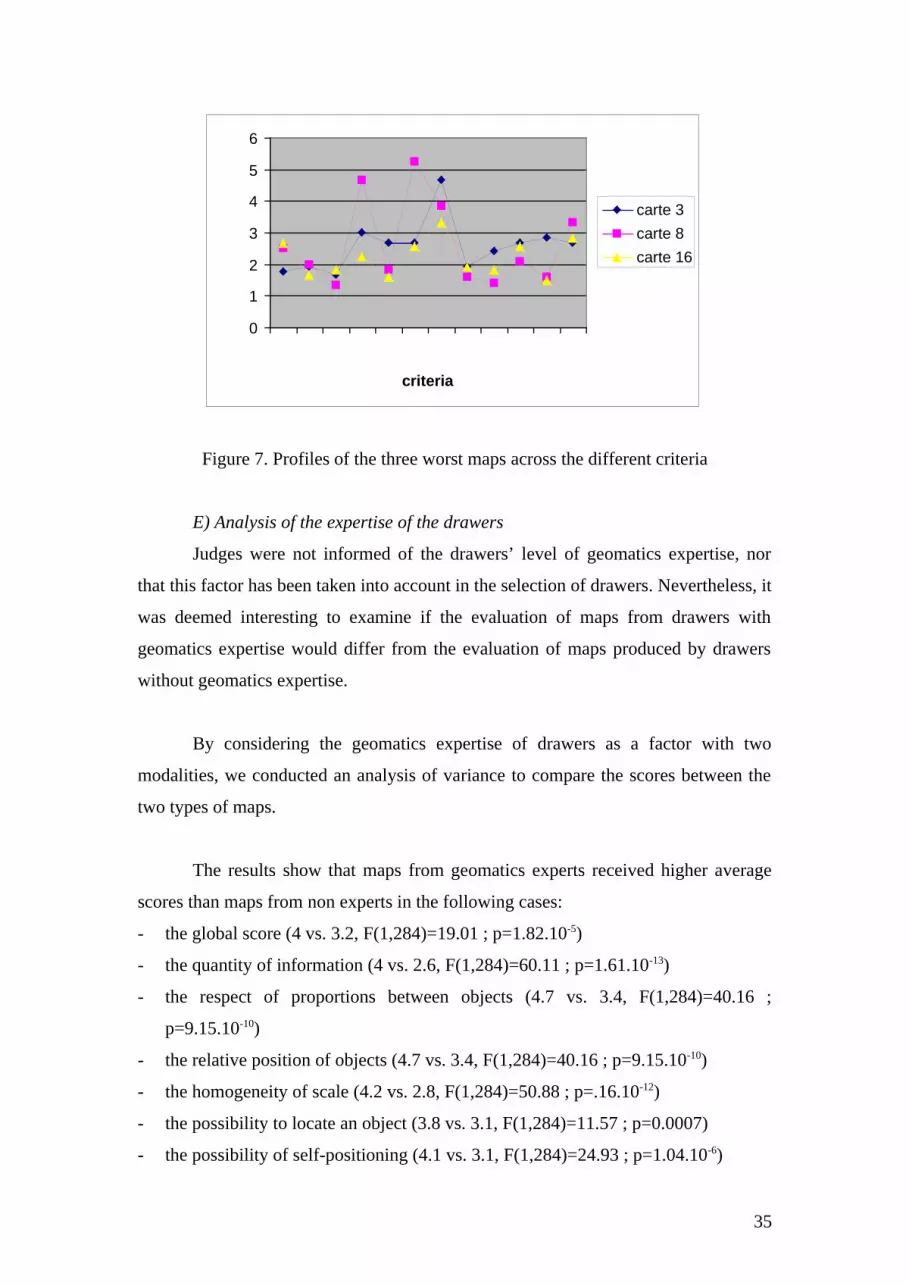
The three maps evaluated as the poorest were all drawn by non-experts. They
received the following average global scores: 1.5, 1.75 and 1.83. When examining
their scores across the different criteria, we observed that there was less homogeneity
in their profiles (cf. Figure 7) than was found among the maps judged to be better,
especially true for the maps 3 and 8. For the majority of criteria, scores varied
between 1 and 3. But, the map 8 received high scores for criteria 4, 6 and 7, that is
identification of objects, scale and aesthetic qualities. It seems that these criteria were
not sufficient to confer a good score to the whole map. The map 3 also received an
average score about 5 for its aesthetic qualities.
34
0
1
2
3
4
5
6
c1 c2 c3 c4 c5 c6 c7 c8 c9 c10c11c12criteria
mean score
carte 3carte 8carte 16
Figure 7. Profiles of the three worst maps across the different criteria
E) Analysis of the expertise of the drawers
Judges were not informed of the drawers’ level of geomatics expertise, nor
that this factor has been taken into account in the selection of drawers. Nevertheless, it
was deemed interesting to examine if the evaluation of maps from drawers with
geomatics expertise would differ from the evaluation of maps produced by drawers
without geomatics expertise.
By considering the geomatics expertise of drawers as a factor with two
modalities, we conducted an analysis of variance to compare the scores between the
two types of maps.
The results show that maps from geomatics experts received higher average
scores than maps from non experts in the following cases:
- the global score (4 vs. 3.2, F(1,284)=19.01 ; p=1.82.10-5)
- the quantity of information (4 vs. 2.6, F(1,284)=60.11 ; p=1.61.10-13)
- the respect of proportions between objects (4.7 vs. 3.4, F(1,284)=40.16 ;
p=9.15.10-10)
- the relative position of objects (4.7 vs. 3.4, F(1,284)=40.16 ; p=9.15.10-10)
- the homogeneity of scale (4.2 vs. 2.8, F(1,284)=50.88 ; p=.16.10-12)
- the possibility to locate an object (3.8 vs. 3.1, F(1,284)=11.57 ; p=0.0007)
- the possibility of self-positioning (4.1 vs. 3.1, F(1,284)=24.93 ; p=1.04.10-6)
35

- the possibility to choose a route (3.5 vs. 2.6, F(1,284)=21.53 ; p=5.33.10-6)
However, there was no significant difference between the two types of maps for the
following criteria :
- the identification of the objects
- the aesthetic qualities
- the reading of the map
- the possibility to choose a goal
- the presence of elements of recognition
The criteria that received higher scores in expert maps seemed to be all related
to the spatial properties of the map. So it appears that what differentiates a map drawn
by an expert from a map drawn by a non-expert is the spatial adequacy of the map.
This is of course the first axiom to which a map should respond, but the real difficulty
encountered by the non-experts was probably to represent accurately the spatial
properties of the environment and the spatial relations between objects.
3.3 General Discussion of Experiment #2
The first aim of Experiment #2 was to investigate if knowledge of what
constitutes a good map exists. Analysis of the global scores showed no difference
between the evaluations by the different kind of judges. Moreover, these results and
the different measures of agreement suggest that judges evaluated the maps in a
similar way. So they probably shared knowledge of what constitutes a good map. As
was the case for route directions and because maps are also a common tool, it is
reasonable that people would have developed such knowledge. This knowledge
allows people to communicate more easily, and to understand more efficiently graphic
spatial information.
The second aim of the experiment concerned the individual evaluation criteria
that contribute to the global scores. We proposed to the judges twelve criteria chosen
to describe adequately the physical and functional qualities of maps. These two
dimensions were considered a priori to categorize the criteria. Among the twelve
criteria, we did not hypothesize which would have more weight than the others.
36

Concerning the relations between criteria, regression analyses showed that
three criteria among the twelve seemed to have more weight than the others during the
evaluation. These were the fact that a map allows self-positioning, the quantity of
information and the presence of appropriate recognition elements. The first of these
concerns what we called the processing of a map, the second a physical quality of the
map and the third the way the map is used. The prevalence of these three criteria was
observed in the different regression models calculated. The observed difference
between the regressions models of experts and non-experts suggests that the experts
used fewer criteria than non-experts, maybe the more crucial ones. Differences
between regression models for men and women suggest a greater attention to objects
for women than for men. In summary, a good map should allow self-positioning,
present elements of recognition and present a sufficient quantity of information.
The analysis by principal components was conducted to determinate how the
global scores were distributed according to the scores of the individual criteria. Two
factors were identified, one describing the functionality of the map and the other, the
quality of representation. The distribution of the criteria between these two factors did
not strictly correspond to our a priori categorization. Indeed, the functional properties
of a map are so related to the physical qualities that it is difficult to dissociate them.
However, the regression analysis and the analysis by principal components both
suggested that a map is evaluated as a tool, that is a map is evaluated according to its
functional requirements as a priority. The physical qualities of a map serve these
functional requirements.
4) Experiment #3 : Construction of the skeletal map
The aim of Experiment #3 was to construct a “skeletal” map as was done for
route directions in Denis et al. (1999) and Fontaine (2000). The first step was to
construct a “mega-map” containing all information given by all participants in
Experiment #1. This mega-map was given to participants in Experiment #3 who were
asked to select the information they judged the most important. In this experiment, we
did not consider the expertise in geomatics but only gender and familiarity with the
park. This experiment, like the second one, allowed us to investigate if a common
37
metacognitive knowledge of what is necessary for a map could be determined. If such
knowledge exits, we could expect no difference between familiar and non-familiar
participants. If such knowledge does not exist, however, the differences could appear
in several ways : in the total number of selected information items or in the type of
selected information. According to this view, men might be more selective than
women and women would keep more landmarks than men. Non-familiar participants
might be less selective than familiar because they could have some difficulty
evaluating the relative importance of one information item over another.
Also, the procedure had to be adapted to maps. Because of the lack of
accuracy of the drawn maps, we could only consider the information items as such
and locate them on the mega-map as they are to be found in reality. The mega-map
was not hand-drawn but produced on the computer from a geo-referenced database
and hence was presented without spatial errors. So once all information items were
listed, we had to locate them accurately on the mega-map. For some information
items, we used existing data while for many of them, we had to measure their exact
spatial coordinates with a GPS (Global Positioning System) receiver. The map was
then constructed using the specialized software MapInfo™. The mega-map thus
obtained, contained 114 information items, all geo-referenced.
The next step was the selection of most important information items. If a map
contains a lot of information but is still legible, why should people eliminate
information? So we decided to use a “scale of necessity” in order to encourage
participants to avoid keeping all the information. A 1-5 point scale was introduced.
The score 1 was given to information that had to be eliminated and 5 to information
that had to be kept. Because the map represents not just a road but also an
environment, we also had to provide information concerning the aim of the map.
Knowing that information given on the map depends on the goal, participants were
told that the map would be used by tourists, to allow people a safe visit in the park.
Another difference with respect to route directions was that participants
needed to see the effect of the suppression of each information item to really
understand its necessity. So the selection of information could only be done using a
38

computer, and a projection of the map on a screen. The software MapInfo™ allowed
each selected information item to be made visible or invisible on the map.
We considered as between-subjects factors the familiarity with the park and
the gender of the participants. If metacognitive knowledge exists, we should obtain
similar selection from familiar and non-familiar participants and from men and
women. The expertise in geomatics was not considered in this experiment.
4.1 Procedure
A) Participants
16 men and 16 women participated. Half of each group was familiar with the
park and the other half non-familiar.
B) Material
Participants received a table in which each numbered information item was
presented in rows and the five possible scores were presented as columns.
C) Procedure
Participants were tested collectively. The experiment took place in a
classroom. Participants faced two large screens. On one screen, the mega-map was
projected and stayed projected all during the experiment. On the second screen, four
successive enlargements of the mega-map were projected. Each enlargement
represented an area of the park. On each enlargement, one by one the information
items were successively highlighted, shown, suppressed and re-shown. Participants
were asked to rate each information item on the five-point scale. The score 1 was
given to information that should absolutely be eliminated, 2 to information that should
be eliminated, 3 to information that could be kept or discarded indifferently, 4 to
information that should be kept and 5 to information that should absolutely be kept.
We proceeded in this way for all 114 information items. We used two screens to allow
participants to refer to the whole mega-map as many times as they wanted.
4.2 Results
39

The principle of construction of the “skeletal” map was inspired by the
procedure used by Denis et al. (1999), although finding a suitable adaption for the
world of maps took a certain level of effort. The skeletal map should incorporate the
information necessary to support good use of the map. It should allow an individual
who does not know the park to move efficiently without getting lost and to find all
elements that he or she could be interested in. We chose to keep information items
that had received a mean score between 4 and 5 to construct the skeletal map (cf.
Figure 8).
The first step consisted in comparing the mega-map and the skeletal map from
a quantitative point of view.
From the 114 information items on the mega-map, only 55 were kept on the
skeletal map.
We examined to which extent gender and familiarity could have affected the
selections. An ANOVA 2 (gender) x 2 (familiarity) test was conducted on the scores
given to each information item by all participants as dependent measures. Neither
main effect nor interaction was observed. Men kept as many information items as
women (respectively 54 and 57). The amount of information kept by the familiar
participants was equivalent to that retained by those not familiar with the park.
We were also interested in the nature of information items kept and those
eliminated. The 114 information items were distributed across 10 classes, as follows :
Class 1: roads in the park
Class 2: roads in the city
Class 3: buildings in the park (objects with a large surface area on ground)
Class 4: buildings in the city
Class 5: objects and monuments in the park (small surface area, punctual)
Class 6: objects and monuments in the city
Class 7: properties of terrain
Class 8: specific indications (restrooms, points of view, services)
Class 9: orientation of the map (north)
40

Class 10: the river
We separated landmarks into two classes: buildings and objects. These two
classes were present in the environment but they did not have the same spatial value,
the same saliency in the environment. Moreover, the indication of north constituted a
class, even if it was the only component. Given the importance of the orientation for
using a map, we could not assimilate this information to the indications found in class
8. The river is also the only component of its class. This element is specific because it
does not belong to the park (i.e. it is not a property of the terrain) but it is such a
salient spatial cue to orient the map that we decided to consider the river as a class by
itself.
Once these classes were established, we wanted to examine how information
was distributed across classes in the mega-map and whether this distribution would be
different in the skeletal map. We focused on information items kept in the skeletal
description (with a mean score between 4 and 5) and on information that had to be
eliminated (with a mean score between 1 and 2).
Table 18 presents the different distributions. In the mega-map, we noticed that
the most represented classes were those concerning roads in the city (c2) and
buildings in the park (c3), followed by objects in the park (c5) and roads in the park
(c1). In the skeletal map, six among the 10 classes were present, in descending order :
buildings in the park (c3), roads in the city (c2), roads in the park (c1) and buildings
in the city (c4). The river and north were also selected. Information concerning
objects in the park and in the city, specific indications and properties of the terrain
were eliminated. It was interesting to notice that the roads in the city that were
considered as not absolutely necessary were all routes crossing the main border road
Grande Allée. These were not directly connected to the park. We compared these two
distributions (for the mega-map and the skeletal map) by conducting a Chi-square
analysis. The distribution of information in the mega-map was significantly different
from the distribution of information in the skeletal map (Chi-square significant,
p=.05).
41

Class1 Class2 Class3 Class4 Class5 Class6 Class7 Class8 Class9 Class10Mega-map
13 28 30 10 15 3 9 4 1 1
Skeletal map4<x<5 12 17 18 6 0 0 0 0 1 12<x<4 1 11 9 4 3 3 9 4 0 01<x<2 0 0 3 0 12 0 0 0 0 0Men4<x<5 11 11 18 7 2 1 2 0 1 12<x<4 2 16 9 2 3 1 7 3 0 01<x<2 0 1 3 1 10 1 0 1 0 0Women4<x<5 12 21 16 5 1 0 0 0 1 12<x<4 1 7 9 4 1 2 9 4 0 01<x<2 0 0 5 1 13 1 0 0 0 0Familiar4<x<5 12 14 17 5 1 1 0 0 1 12<x<4 1 14 8 4 3 1 9 4 0 01<x<2 0 0 5 1 11 1 0 0 0 0Non-familiar4<x<5 12 17 16 6 1 0 1 0 1 12<x<4 1 11 11 2 3 2 8 4 0 01<x<2 0 0 3 2 11 1 0 0 0 0
Table 18. Distribution of information over the different classes in relation to their
scores for the different groups.
(x corresponds to the mean score)
Moreover we examined the potential effect of gender and familiarity on the
selection of information, especially for certain types of classes. Even if an equivalent
amount of information is obtained across the different groups, some specific kinds of
information might be more important for some individuals and less for others. We
compared the distribution of information kept in each of the different classes for men
to the distribution for women (cf. Table 11). No significant difference was observed
in the Chi-square analysis. The same analysis was conducted on the distribution of
eliminated information. No significant difference was observed. The information kept
by men were from the same classes as the information kept by women. The
information eliminated by men were from the same classes as the information
eliminated by women.
We also compared the distribution of kept information and the distribution of
eliminated information from familiar and non-familiar participants (cf. Table 11). The
42
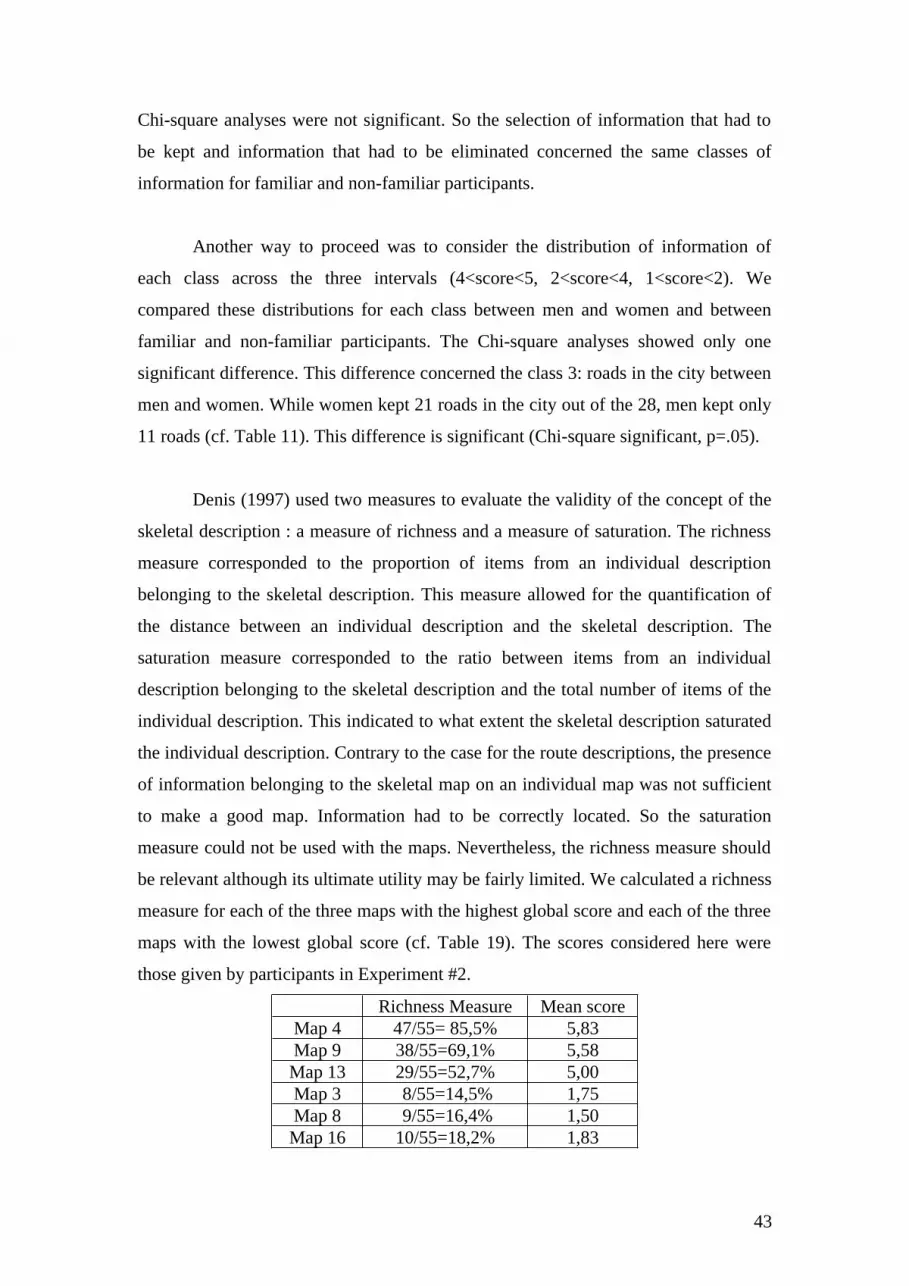
Chi-square analyses were not significant. So the selection of information that had to
be kept and information that had to be eliminated concerned the same classes of
information for familiar and non-familiar participants.
Another way to proceed was to consider the distribution of information of
each class across the three intervals (4<score<5, 2<score<4, 1<score<2). We
compared these distributions for each class between men and women and between
familiar and non-familiar participants. The Chi-square analyses showed only one
significant difference. This difference concerned the class 3: roads in the city between
men and women. While women kept 21 roads in the city out of the 28, men kept only
11 roads (cf. Table 11). This difference is significant (Chi-square significant, p=.05).
Denis (1997) used two measures to evaluate the validity of the concept of the
skeletal description : a measure of richness and a measure of saturation. The richness
measure corresponded to the proportion of items from an individual description
belonging to the skeletal description. This measure allowed for the quantification of
the distance between an individual description and the skeletal description. The
saturation measure corresponded to the ratio between items from an individual
description belonging to the skeletal description and the total number of items of the
individual description. This indicated to what extent the skeletal description saturated
the individual description. Contrary to the case for the route descriptions, the presence
of information belonging to the skeletal map on an individual map was not sufficient
to make a good map. Information had to be correctly located. So the saturation
measure could not be used with the maps. Nevertheless, the richness measure should
be relevant although its ultimate utility may be fairly limited. We calculated a richness
measure for each of the three maps with the highest global score and each of the three
maps with the lowest global score (cf. Table 19). The scores considered here were
those given by participants in Experiment #2.
Richness Measure Mean scoreMap 4 47/55= 85,5% 5,83Map 9 38/55=69,1% 5,58Map 13 29/55=52,7% 5,00Map 3 8/55=14,5% 1,75Map 8 9/55=16,4% 1,50Map 16 10/55=18,2% 1,83
43

Table 19. Richness measure and mean scores for good and poor maps.
The best maps were found to correspond to a richness measure higher than the
other maps. The correlation between the richness measure and the score of the maps
was 0.97. So the richer the map in information corresponding to the skeletal map, the
more the map is evaluated as good. However, a map could contain all information
belonging to the skeletal map without being a good map. If all information were
present but incorrectly located, the map could not be used. In order to fully validate
the skeletal map, it is necessary to develop a spatial measure, such as a metric or
topological measure to supplement the richness measure.
4.3 General Discussion of Experiment #3
Analysis of the total number of selected information items showed no effect of
gender or familiarity. This lack of difference supported the hypothesis of a common
knowledge base. Being familiar or not with an environment does not appear to be
crucial for determining the necessity of information on a map. Selecting essential
elements in a map is based on knowledge that is independent of the specific
environment.
The remaining information on the skeletal map consists of landmarks and
roads. We observed that the selected landmarks consisted of large and voluminous
objects. So some measure of assumed or known visual saliency appears to have
guided the selection of landmarks. The park was clearly linked to the city. The
properties of the terrain and some point-like indications were considered as
unnecessary.
The concept of skeletal map as adapted from Denis et al. (1999) was not
clearly validated here but not invalidated either. As this stage, we have not yet
developed a method to validate it as we did for the skeletal route description with the
navigation test. However, it seems plausible to assume that a skeletal map presents at
least the largest and the most salient landmarks, the main roads and orientations
44

(cardinal directions) and is anchored in a larger system of reference (here the park is
anchored in the city and located in relation to the river).
5) General Discussion of All Three Experiments and Conclusion
The three experiments presented here were conducted to investigate the
parallel suggested by Tversky and Lee (1999) between language and graphic modes to
communicate spatial information. We adapted a procedure used first by Denis et al.
(1999) on route directions to work with drawn maps. In this framework, several main
questions arose: Is there a core structure of maps? Is there metacognitive knowledge
of what is important in a map and of what may be considered to be a good map?
These questions were considered in Experiments #2 and #3 and will be discussed in
the final section.
The aim of Experiment #1 was to collect drawn maps of the Plains of
Abraham Park. Our study was focused on the content and the structure of these maps.
We examined the effects of geomatics expertise and gender on characteristics of the
maps. We also examined to what extent the characteristics of the environment
represented could affect the maps. First we observed a great variability both in the
quality and the quantity of information given on the maps. Data provided evidence
that spatial information is organized hierarchically but this hierarchy was affected by
expertise. In the structuring of information in the experts’ maps, roads seemed to
belong to higher level of the hierarchy than landmarks and hierarchical relations
between landmarks seemed to be based, among others, on spatial proximity. The
expertise provided people tools to organize information. We suggested that the better
the information was structured, the more information was retrieved.
Concerning the non-experts, their maps seemed to be based mainly on landmarks. The
hierarchical relations between landmarks tended to be related to functional properties
associated with a specific location. Landmarks on the borders of the park became the
frame that needed to be filled in. Another difference between experts and non-experts
appeared in the perspective adopted in the maps. The task required a survey
perspective. The experts did not show any difficulty in adopting a survey perspective.
On the other hand, the non-experts mixed survey and route perspectives. Their
45

representation of the environment seemed to be anchored in their displacements. This
suggested that the manipulation of the mental representation in this task appeared to
be easier for experts than for non-experts.
Another aspect examined in this experiment was the effect of the
characteristics of the environment on the content and the structure of the maps. The
nature of the environment and especially its use resulted in a lack of structure
(compared to previously studied environments like cities), no physical constraints on
the displacements, free exploration, no real need to know roads to explore or to go out
of the park and no chance to get lost. We suggested that these features have affected
the structuring of information among the non-experts. The weak representation of
roads, the fact that the representation was based on landmarks, and the anchoring of
the representation in a route perspective seem to be directly related to specific
properties of the environment. On the other hand, we thought that expertise prevented
individuals from being sensitive to these kinds of effects.
In Experiment #2, we wanted to examine on which kind of criteria evaluation
of maps could be based. Participants were asked to rate how well the maps fulfilled
different criteria. Functional and physical qualities of the maps were considered in the
criteria. Regression analysis and analysis by principal components on scores
associated with individual criteria yielded two observations. On the one hand, among
the different criteria proposed, some appeared to have more weight in the evaluation.
These criteria included self-positioning, appropriate elements of recognition and the
quantity of information. On the other hand, the criteria concerning the physical
qualities of the maps (like proportions between objects) were derivative with respect
to the functional criteria. To have a good map, the physical qualities of the map must
serve functions such as self-positioning, completeness, recognition in the
environment, and the location of objects. We suggest that the maps were evaluated as
tools. Judges appear to have taken into account the cognitive capacities of the users of
the maps and their needs, giving the highest scores to maps which best matched these
criteria. So judges seemed to really put the emphasis on the functionality of the maps.
As was exposed in the introduction, we wanted to pursue the exploration of
the parallel between maps and language by using the procedure developed by Denis et
46

al. (1999). The main challenge was to examine if metacognitive knowledge of what
constitutes a good map exists and the nature of this knowledge. In Experiment #2, we
compared the evaluation of the maps carried out by expert and non-expert judges, by
men and women and by judges familiar and not familiar with the environment
portrayed in the maps. Results showed substantial agreement between judges
(regardless of differences among the judges) as to the communicated value of the
maps. Being an expert or not, being familiar or not with the environment, did not
affect the global evaluation of the maps. So people appear to have a common
knowledge of what constitutes a good map and of a map needs to be constructed to
provide an efficient navigational aid.
In Experiment #3, participants were asked to select pertinent information on
the mega-map to provide the most efficient possible map. The assumption behind this
experiment was that any map would be based on a core structure. The concept of
skeletal map, derived from the one of skeletal description, was proposed to illustrate
the idea that some pieces of information in maps are more important than others. The
results showed that deciding what information should be included in a useful map is
not dependent on specific knowledge of the environment. The agreement between
judges who were familiar with the environment and those who were not, suggests that
they all had, and made use of metacognitive knowledge that was independent of their
level of familiarity with the environment. Moreover the agreement between experts
and non-expert judges suggests that this knowledge is not linked to specific training.
To what should this knowledge correspond? Couclelis (1996) suggested the
involvement of a conceptual level in the production of route directions. Couclelis
proposed that producing route directions requires a mental model based on two
different kinds of knowledge. The mental model should integrate a cognitive
representation of the environment of interest as well as a store of general schemas
regarding urban environments and the ways people normally interact with them.
These general schemas serve to organize and interpret the items of concrete
knowledge people have about specific places, and help draw inferences about places
not well remembered or not known. Couclelis suggested that these schemas could be
based on pre-conceptual structures like image schemas in the sense of Lakoff (1987),
action schemas and basic-level categories in the sense of Rosch (1973). Such schemas
47

common to all individuals would be the substrate from which production and
comprehension of route directions could be set.
In our situation, we suggested that some pre-conceptual structure could also be
involved in the production and the comprehension of maps. First, people could have
developed a schema of a prototypical map. Indeed, Lloyd (1994) showed that
individuals could extract prototypical spatial information from maps. This
prototypical map (containing the information of what a map should look like) could
contain the largest and more salient landmarks, the highest-level route hierarchy (the
main roads), the orientation of the map (locating the representation in an absolute
frame of reference) and information locating the represented environment in an
environmental system of reference (Werner and Schmidt, 1999). This schema is
generated through a developing individual’s interaction with the physical world.
When a person encounters a new map, he or she probably compares this map to his or
her prototype.
We also suggest that as and when people encounter and use maps, they
develop pragmatic knowledge than might consist of rules concerning the uses of a
map. In fact, to produce and use a map, it is necessary to understand the relations
between the map and the environment, on the one hand, and the environment and
oneself on the other. Liben (1991) insisted on two majors points that could correspond
to rules integrated within these schema. The first rule is to be aware of the
representational correspondences, that is the information represented and the way the
representation is achieved. The second rule is to be aware of the geometric
correspondences between the spatial relations in the environment itself and the spatial
relations in the representation (scale, analogy, point of view). These rules could
constitute a base of pragmatic knowledge concerning maps and consequently could
generate expectations on both form and content. Moreover, people also appear to
integrate through experience the information on maps that need to be selected from a
larger set. There is some classification of information, and the representation is a
simplification of the environment that uses a particular symbolization. These four
properties act like rules in map production as well as in map comprehension.
Individuals need to compare the new map to their schema and then to apply to this
new map the basic pragmatic rules as outlined above. We suggest that geomatics
48

expertise should operate on these pragmatic rules by enriching them and consequently
making experts more sensitive to certain types of map properties.
A complementary approach would consist in demanding a description of a
park and examining the content and the structure of the resulting text. Furthermore,
there is a need to deepen the concept of the skeletal map and to find an adequate
means to validate it.
6) Conclusion
In conclusion, we believed that exploring the parallel between language and
graphic externalizations in spatial cognition could be a good way to better understand
how people interact with their environment. The results of the three experiments
carried out are a rich set of interpretations that support existing findings in the
literature while providing additional clues as to the nature of the common conceptual
structure that appears to underlie both linguistic and cartographic depictions of
environmental space.
The work presented here also serves an addition purpose. The work was
carried out within a broader, multidisciplinary project focused on the development of
computational tools to assist in the design and use of outdoor spaces. The results of
this work will be used to support the development of computer software to assist park
users in understanding and navigating parks and other outdoor environmental spaces,
and to support the development of appropriate maps to aid different activity groups in
using the park.
7) Acknowledgements
The work reported on in this paper was financially supported through the DEC#30
project of the GEOIDE Network.
8) References
49


