Embed Size (px)
Citation preview
BioMed CentralBMC Genomics
ss
Open AcceResearch articleExploiting combinatorial cultivation conditions to infer transcriptional regulationTheo A Knijnenburg*1, Johannes H de Winde2, Jean-Marc Daran2, Pascale Daran-Lapujade2, Jack T Pronk2, Marcel JT Reinders1 and Lodewyk FA Wessels1,3Address: 1Information and Communication Theory Group, Faculty of Electrical Engineering, Mathematics and Computer Science, Delft University of Technology, Mekelweg 4, 2628 CD Delft, The Netherlands, 2Industrial Microbiology, Department of Biotechnology, Delft University of Technology, Julianalaan 67, 2628 BC Delft, The Netherlands and 3Department of Molecular Biology, The Netherlands Cancer Institute, Plesmanlaan 121, 1066 CX Amsterdam, The Netherlands
Email: Theo A Knijnenburg* - [email protected]; Johannes H de Winde - [email protected]; Jean-Marc Daran - [email protected]; Pascale Daran-Lapujade - [email protected]; Jack T Pronk - [email protected]; Marcel JT Reinders - [email protected]; Lodewyk FA Wessels - [email protected]
* Corresponding author
AbstractBackground: Regulatory networks often employ the model that attributes changes in geneexpression levels, as observed across different cellular conditions, to changes in the activity oftranscription factors (TFs). Although the actual conditions that trigger a change in TF activity shouldform an integral part of the generated regulatory network, they are usually lacking. This is due tothe fact that the large heterogeneity in the employed conditions and the continuous changes inenvironmental parameters in the often used shake-flask cultures, prevent the unambiguousmodeling of the cultivation conditions within the computational framework.
Results: We designed an experimental setup that allows us to explicitly model the cultivationconditions and use these to infer the activity of TFs. The yeast Saccharomyces cerevisiae wascultivated under four different nutrient limitations in both aerobic and anaerobic chemostatcultures. In the chemostats, environmental and growth parameters are accurately controlled.Consequently, the measured transcriptional response can be directly correlated with changes inthe limited nutrient or oxygen concentration. We devised a tailor-made computational approachthat exploits the systematic setup of the cultivation conditions in order to identify the individualand combined effects of nutrient limitations and oxygen availability on expression behavior and TFactivity.
Conclusion: Incorporating the actual growth conditions when inferring regulatory relationshipsprovides detailed insight in the functionality of the TFs that are triggered by changes in theemployed cultivation conditions. For example, our results confirm the established role of TF Hap4in both aerobic regulation and glucose derepression. Among the numerous inferred condition-specific regulatory associations between gene sets and TFs, also many novel putative regulatorymechanisms, such as the possible role of Tye7 in sulfur metabolism, were identified.
Published: 22 January 2007
BMC Genomics 2007, 8:25 doi:10.1186/1471-2164-8-25
Received: 30 June 2006Accepted: 22 January 2007
This article is available from: http://www.biomedcentral.com/1471-2164/8/25
© 2007 Knijnenburg et al; licensee BioMed Central Ltd. This is an Open Access article distributed under the terms of the Creative Commons Attribution License (http://creativecommons.org/licenses/by/2.0), which permits unrestricted use, distribution, and reproduction in any medium, provided the original work is properly cited.
Page 1 of 14(page number not for citation purposes)

BMC Genomics 2007, 8:25 http://www.biomedcentral.com/1471-2164/8/25
BackgroundThe simple and often used biological model to unraveltranscriptional regulation ascribes the change in geneexpression levels, as observed between different cellularconditions, to changes in the activity of transcription fac-tors (TFs). Change of the transcriptional activity of a TF isone of the means by which an organism adapts to changesin the extracellular environment. A substantial amount ofresearch has employed this model to infer regulatory net-works by integrating gene expression data, sequence data(to detect the cis-regulatory binding sites of TFs), e.g. [1-3],and/or TF binding data, e.g. [4-6]. For an overview see [7-9]. In most cases, the generated regulatory networks arederived from large microarray compendia. Notwithstand-ing the many advantages of such approaches, two maindrawbacks can be identified. Firstly, these compendiagather very heterogeneous gene expression data derivedfrom various culture conditions (media, pH, temperature,etc.) that, in a large majority of the cases, solely comparethe culture conditions to their direct condition-specificreferences. Different cultivation conditions within thecompendium can, therefore, hardly be compared. Sec-ondly, the interpretation of transcriptome data obtainedfrom the generally employed shake-flask cultivations islikely to be complicated by differences in specific growthrate, carbon catabolite repression, nitrogen cataboliterepression, and more generally continuous changes inenvironmental conditions. This prevents the establish-ment of a direct link between the activity of TFs and spe-cific growth conditions.
A frequently employed approach links a TF to a module,i.e. a set of co-expressed genes, based on TF binding dataor promoter analysis. Enrichment of functional categories(such as GO [10] and MIPS [11]) within the module pro-vides clues about the function of the TFs associated withthe module. Although this can provide a global view ofthe transcriptional role of a TF, we are convinced that theprecise conditions or perturbations that trigger a changein the activity of TFs should be an integral part of the gen-erated regulatory network.
To this end, we designed an experimental setup thatallowed us to explicitly model the cultivation conditionsand use these to infer the activity of TFs. To achieve this,we employed chemostat cultures that enable the cultiva-tion of micro-organisms under tightly defined environ-mental conditions. Chemostat cultures are superior to theshake-flask cultures in both accuracy and reproducibility[12]. In a chemostat, culture broth (including biomass) iscontinuously replaced by fresh medium at a fixed andaccurately determined dilution rate. When the dilutionrate is lower than µmax, the maximal specific growth rate ofthe micro-organism, a steady-state situation will be estab-lished in which the specific growth rate equals the dilu-
tion rate. In such a steady-state chemostat culture, µ, iscontrolled by the (low) residual concentration of a singlegrowth-limiting nutrient. In this research, microarrayswere employed to measure the genome-wide transcrip-tional response of the yeast Saccharomyces cerevisiae togrowth limitation by four different macronutrients (car-bon, nitrogen, phosphorus, and sulfur) in both aerobicand anaerobic chemostat cultures (Figure 1) [13]. Exceptfor the different nutrient limitations and oxygen availabil-ity, all other culture parameters (such as growth rate, pH,temperature, etc.) were kept constant throughout the dif-ferent experiments. Thus, changes in gene expression lev-els can solely be attributed to the different nutrientlimitations and the oxygen regime. We devised a compu-tational approach that exploits the interrelatednessbetween the conditions in order to identify the individualand combined effects of nutrient limitations and oxygenavailability on expression behavior and TF activity. Theinclusion of the growth conditions in the analysis allowsfor the identification of direct links between the cultiva-tion conditions, TFs triggered by specific cultivation con-ditions and the targets of these TFs.
ResultsOverview of the computation approachFrom the continuous expression levels measured acrossthe cultivation conditions we derive a discretized repre-sentation of the expression behavior for each gene. Thisrepresentation indicates up- or downregulation as a con-sequence of the individual or combined effects of thenutrient limitations and oxygen availability. Here, weexploit the combinatorial setup of the cultivation condi-tions to recognize and dissect the effect of the presence ofoxygen on the expression levels of a gene. More specifi-cally, we employ a regression strategy to detect, model andcorrect for the effect of oxygen presence. This procedure isoutlined in Figure 2 and explained in detail in the Meth-ods section. Modules are generated by clustering geneswith identical expression representations (Figure 3). Next,we integrate TF binding data [14] to assess whether a TF or
Schematic overview of the combinatorial cultivation condi-tionsFigure 1Schematic overview of the combinatorial cultivation conditions. Black squares indicate the employed nutrient limitation and oxygen supply.
Experiment
1. ClimAer
2. NlimAer
3. PlimAer
4. SlimAer
5. ClimAna
6. NlimAna
7. PlimAna
8. SlimAna
Nutrient Limitation
Carbon Nitrogen Phosphorus Sulfur
Oxygen supply
Aerobic Anaerobic
Page 2 of 14(page number not for citation purposes)

BMC Genomics 2007, 8:25 http://www.biomedcentral.com/1471-2164/8/25
a pair of TFs binds the promoter regions of a modulemuch more frequently than would be expected by chance.A significant relationship between a module and a TF sug-gests that the TF is (partly) responsible for the expressionbehavior of that particular module. Since the expressionbehavior of a module reveals under which combination ofcultivation conditions the genes are up- or downregu-lated, we are not only able to relate TFs to the groups ofgenes that they presumably regulate, but also to the pre-cise environmental conditions that trigger their activity toperform their regulatory role.
Overview of the uncovered regulatory relationshipsThe TF circle (Figure 4) depicts an overview of all the TFs,which are significantly related to one or more modules. Inaddition, pairs of TFs that can bind the promoter region ofthe genes in a module significantly often, are connectedby a solid line. In the TF circle, the modules and their asso-ciated TFs are categorized according to the cultivationparameters under which the genes in the module are dif-ferentially regulated, i.e. where the discretized representa-tion differs from zero. This arrangement is given by thecolor coding of the segments in the circle. From this it isclear which cultivation parameters affect the activity of aTF. Additional information concerning enrichment ofgene annotation categories and results of motif discoveryin promoter regions of the genes within the modules canbe found in Table 1 and more comprehensively in Addi-tional file 1.
In the remainder of this section, modules connected toanaerobiosis, aerobiosis and sulfur metabolism, are dis-cussed in more detail. However, first we consider Module13 (grey segment in Figure 4) that contains all genes thatdo not exhibit differential expression between the eightexperimental conditions. (The discretized expression pat-tern consists of all zeros.) Three regulators have beenassigned to this module, Fhl1, Sfp1 and Rap1. All threeTFs are known to play an essential role in the regulationof ribosomal protein genes [15-17]. Although the strainswere grown under different nutrient limitations and oxy-gen regime, the dilution rate (in other words the growthrate) of Saccharomyces cerevisiae was kept equal (0.1 h-1)during the chemostat steady state in all the fermentationconditions tested [12,13]). Given that expression regula-tion of ribosomal protein genes is one of the end targetsof the Tor (target of rapamycin) signaling pathway, ourresults suggest that the regulation through the Tor signal-ling cascade is independent of the applied nutrient limita-tion and oxygen availability, but would rather reflect howthe cell senses the limiting nutrient to maintain a deter-mined growth rate.
Controlling anaerobiosisModule 12 (yellow segment in Figure 4) comprises all(383) genes that show consistent upregulation underanaerobic conditions, irrespective of any nutrient condi-tion. Note that our strategy enables us to isolate the effectthat the presence of oxygen has on the expression level ofa gene. This offers the obvious advantage to independ-ently analyze this effect. The irrelevance of the nutrientlimitations is indicated by 'x's in the discretized represen-tation of Module 12 in Figure 4. Several TFs and TF pairswere found to be able to bind the genes of this anaerobi-osis module significantly often. Current knowledge ongene expression regulation under anaerobic conditionscannot explain all the regulatory relationships and relatedTFs. The anaerobic growth conditions within our system-atic experiments can therefore contribute to elucidate therole of several regulators in the absence of oxygen.
The identification of Rox1, already known to play a role inlow oxygen processes, objectively validates the truthful-ness of this analysis. According to [4], this heme-depend-ent transcriptional repressor of hypoxic genes [13,18]constitutes a multi-component transcription factor looptogether with Yap6 and Cin5, i.e. these three TFs form aregulatory circuit in which they regulate each other.Although our algorithm does not explore these kind ofnetwork structures, we identify the concerted regulationamongst these three TFs and based on our results canhypothesize that this loop is active under anaerobic con-ditions. Additionally, we find the pair Ste12 and Tec1which is known to activate genes associated with pseudo-hyphal growth, as well as Dig1, which conversely isinvolved in the negative regulation of genes involved inpseudohyphal growth [19]. (We observed a large overlapbetween the genes in the regulon of Tec1-Dig1 and thosein the "conjugation with cellular fusion" GO-category (P= 6.7·10-8 according to the hypergeometric test)). Finally,the TF pair Mcm1 and Swi4 is connected to anaerobiosis,although both are known to be involved in controllingcell cycle [20]. Moreover, Mcm1 (also named PRTF for"Pheromone Receptor Transcription Factor" [21]) is alsoinvolved in mating and response to pheromone, relatingit to the cluster of Ste12, Tec1 and Dig1. These results cor-relate with the observation that Saccharomyces cerevisiaegrown under anaerobic conditions exhibits elongatedcell-shape irrespective of the applied nutrient limitation(See Additional file 6). Further investigation is needed togain more insight into the role of these regulators in con-trol of anaerobiosis.
Missing from the TFs significantly related to the anaerobi-osis module is Upc2, which together with Rox1 isinvolved in regulating the expression of many genesinduced under anaerobic conditions [13,22]. The reasonfor not retrieving Upc2 is simply the absence of this TF in
Page 3 of 14(page number not for citation purposes)

BMC Genomics 2007, 8:25 http://www.biomedcentral.com/1471-2164/8/25
Page 4 of 14(page number not for citation purposes)
Procedure to derive the discretized representation of a geneFigure 2Procedure to derive the discretized representation of a gene. a) Examination of the expression levels under the eight cultivation conditions led to the observation that for many genes the expression pattern across the four nutrient limitations when grown aerobically is a scaled and offset version of its anaerobic counterpart. (Permutation tests were performed to con-firm this notion (Additional file 3)). b) This "global oxygen effect", i.e. the effect that presence of oxygen has on the expression levels across all or most of the nutrient limitations, is modeled as a linear relationship and estimated using a regression strat-egy. c) The estimated regression parameters (slope and offset) are employed to isolate the oxygen effect by transforming the aerobic expression values. Discretization of this pattern allows for identification of up- or downregulation as a consequence of specific nutrient limitations and possible nutrient-limitation-specific effects of oxygen presence. d) Pairwise T-tests are per-formed to compare the original aerobic and anaerobic expression values for each nutrient limitation. The results of these tests are combined to detect possible consistent and significant higher or lower expression as a consequence of oxygen presence. e) The derived discrete representation of the expression of a gene is visualized in a nine-bit ternary (-1,0,1) vector.
C N P S C N P S200
400
600
800
1000
1200
1400
1600
1800
2000
2200
1
0 00
1
0 0 0
Aerobic Anaerobic
Ex
pre
ssio
nle
vel
Discretization of the linearlymapped expression data
0
1
1000 1200 1400 1600 1800 2000
400
500
600
700
800
900
1000
1100
Aerobic
An
aero
bic
Linear mapping of aerobic toanaerobic expression pattern
C
N
P
S
C N P S C N P S200
400
600
800
1000
1200
1400
1600
1800
2000
2200
Aerobic Anaerobic
Ex
pre
ssio
nle
vel
Pairwise T-tests on theOriginal expression data
ClimAer NlimAer PlimAer SlimAer ClimAna NlimAna PlimAna SlimAna Oxygen
1 0 0 0 1 0 0 0 1
a
b
c d
e
C N P S200
400
600
800
1000
1200
1400
1600
1800
2000
2200
Ex
pre
ssio
nle
vel
Pairwise T-tests on theoriginal expression data
Aerobic
Anaerobic

BMC Genomics 2007, 8:25 http://www.biomedcentral.com/1471-2164/8/25
the genome-wide location analysis employed to build theTF database. Employing motif discovery, however, the aer-obic regulator 1 (AR1) binding motif of Upc2 (TCGTT[22]) was found 244 times in the upstream regions of the383 genes (P = 2.4·10-13) (See Table 1).
Controlling aerobiosisThe TFs Hap1 and Hap4 are associated with the regulationof aerobiosis (dark blue segment in Figure 4). Hap1 issolely connected to the presence of oxygen (Modules 3and 11), while Hap4 is also connected to carbon-limita-tion (Modules 1 and 7). This is in agreement with a rolefor Hap4 in both aerobic regulation and glucose derepres-sion [23]. Amongst the targets of Hap1, which are over-represented in Modules 3 and 11, we find well-knownoxygen specific Hap1 regulated genes such as CTT1, CYB2and CYC1, confirming that its regulatory role is linked tothe presence of oxygen irrespective of limited or high glu-cose availability. The presence of Hap4 as part of theHap2/Hap3/Hap4/Hap5 complex fits with the enrich-ment in energy categories in the aerobic genes (see Table1 and Additional file 1). This is in line with the involve-ment of the Hap complex in the regulation of mitochon-drial functions such as TCA cycle, electron transport chainand respiration. However, overrepresentation of only
Hap4 targets from the location analysis dataset mayappear as a surprise. Overrepresentation of Hap2 or Hap3may be expected, because these two subunits of Hap2/Hap3/Hap4/Hap5 actually bind the DNA, while Hap4, asa regulatory subunit, does not.
Furthermore, a clear-cut discrepancy exists between thelocation analysis data of the separate members of the Hapcomplex. The results of this study imply that the TF bind-ing data of Hap4 is the more relevant one. This wouldthen suggest that in order to monitor the DNA binding ofa transcriptional complex, e.g. Hap2/Hap3/Hap4/Hap5,it would be more suitable to tag the subunits that do notbind the DNA template, speculating that tagging DNAbinding subunits may alter the structure of the complexand, consequently, the affinity and the specificity of theinteraction with the DNA.
Sulfur metabolismThe systematic combinatorial setup of cultivation condi-tions used to generate the transcript data allows us toextract specific information on genes regulated inresponse to a certain nutrient limitation. Modules 9, 6 and4 and 82 form prime examples. Module 9 (red segment ofthe circle) contains all (93) sulfur-limitation-upregulated
Heatmaps of a moduleFigure 3Heatmaps of a module. a) Normalized expression pattern of all (57) genes that share the same discretized representation, namely 100010001, and consequently, form a module. This representation, which indicates upregulation under carbon limita-tion and higher expression when grown within the presence of oxygen, is identical to the one derived in Figure 2. The expres-sion patterns of the genes in this heatmap are comparable to the expression pattern in Figure 2a. b) Normalized expression pattern of the genes after the linear mapping is applied. Isolation of the oxygen effect clearly reveals upregulation under the carbon limitation. The linearly mapped expression patterns are comparable to the one in Figure 2c. c) The (identical) discre-tized expression pattern for the 57 genes. Note that our discretization procedure assigns a 0 to the cultivation conditions that form the most common expression level. For these 57 genes this common expression level is represented in b by the dark yel-low, which occurs in six of the eight conditions. The ninth entry of this representation, i.e. the oxygen effect, is also character-ized as upregulated, since the original expression levels in a are consistently higher under aerobic growth when compared to anaerobic growth.
a cb
Relativ
elylo
wex
pressio
nR
elatively
hig
hex
pressio
n
Aerobic Anaerobic
Original expression data
C N P S C N P S
5
10
15
20
25
30
35
40
45
50
55
Relativ
elylo
wex
pressio
nR
elatively
hig
hex
pressio
nAerobic Anaerobic
Linearly mapped expression data
C N P S C N P S
5
10
15
20
25
30
35
40
45
50
55
Do
wn
regulated
Upreg
ulated
Com
mon
expressio
n
Aerobic AnaerobicO
2
of the expression behaviorDiscretized representation
C N P S C N P S
5
10
15
20
25
30
35
40
45
50
55
Page 5 of 14(page number not for citation purposes)

BMC Genomics 2007, 8:25 http://www.biomedcentral.com/1471-2164/8/25
Page 6 of 14(page number not for citation purposes)
TF CircleFigure 4TF Circle. The TF circle depicts all the TFs and TF pairs, which are significantly related to at least one module. Related mod-ules are represented by strings in the vicinity of the relevant TF or, in the case of a TF pair, in the vicinity of the line connecting both TFs. The strings are made up out of three parts. The first number represents the number that was assigned to the mod-ule. The second number indicates the number of genes in the module. The third part is the discretized expression pattern of the genes in the module. Here, an 'x' indicates the irrelevance (don't care) of a particular cultivation parameter. The color cod-ing of the circle is based on the discretized expression representation of the modules. The placement of the TFs (near the center or the edge) is for reasons of visibility only.
Cbf1
Met32
Fhl1Cin5
Tec1
Pho4Tye7
Yap1
Yap7
Met4
Met31
Cad1
Dal82
Gln3
Rap1Sfp1
Aft2
Rox1
Yap6
Swi4
Mcm1
Dig1
Ste12
Hap1
Hap4
9-93 0 0 0 1 0 0 0 1 x
4-70 0 0 0 1 0 0 0 1 09-93 0 0 0 1 0 0 0 1 x
10-52 0 0 1 0 0 0 1 0 x
12-3
83
xx
xx
xx
xx-1
2- 70 0 1 0 0 0 1 0 0 08-100 0 1 0 0 0 1 0 0 x
12-383 x x x x x x x x-1
13-3883 0 0 0 0 0 0 0 0 0
2- 70 0 1 0 0 0 1 0 0 08-100 0 1 0 0 0 1 0 0 x
2- 700
10
00
10
00
8-1000
10
00
10
0x
3-211 0 0 0 0 0 0 0 0 111-638 x x x x x x x x 1
1- 57 1 0 0 0 1 0 0 0 17-169 1 0 0 0 1 0 0 0 x
11-638 x x x x x x x x 1
9-93 0 0 0 1 0 0 0 1 x
4-70 0 0 0 1 0 0 0 1 06-15 0 0 0 1 0 0 0 1 19-93 0 0 0 1 0 0 0 1 x
4-70
00
01
00
01
0
9-93
00
01
00
01
x
9-93 0 0 0 1 0 0 0 1 x
9-93 0 0 0 1 0 0 0 1 x
5-44 0 0 1 0 0 0 1 0 010-52 0 0 1 0 0 0 1 0 x
5-4
40
01
00
01
00
10-5
20
01
00
01
0x
13-3
883
00
00
00
00
0
12-383 x x x x x x x x-1
12-3
83x
xx
xx
xx
x-1
13-3
883
00
00
00
00
0
12-383 x x x x x x x x-1
12-383 x x x x x x x x-1
12-383 x x x x x x x x-1
12-383 x x x x x x x x-1
12-383 x x x x x x x x-1
12-383x
xx
xx
xx
x-1
9-9
30
00
10
00
1x
12-383x x x x x x x x-1
4-70 0 0 0 1 0 0 0 1 09-93 0 0 0 1 0 0 0 1 x
4-70
00
01
00
01
0
Nitrogen metabolism
Sulfur metabolism
Phosphorus metabolism
No differential expression
Anaerobiosis
Aerobiosis
Carbon metabolism

BMC Genomics 2007, 8:25 http://www.biomedcentral.com/1471-2164/8/25
Page 7 of 14(page number not for citation purposes)
Table 1: Overview of the uncovered modules
Module Disc.Expr.Pattern TF binding Motif Discovery Annotation
Aer Ana
no. # genes C N P S C N P S Ox TFs TFpairs Motif Ass.TFs GO MIPS KEGG
1 57 1 0 0 0 1 0 0 0 1 Hap4 CCAATCA Hap5, Hap2/3/4, Mcm1 GO: Oxidative phosphorylationATTGG Hap5, Hap2/3/4, Mcm1, ... MIPS: Respiration
KEGG: Oxidative phosphorylation
2 70 0 1 0 0 0 1 0 0 0 Dal82 Gln3-Dal82 AGATAAG Gzf3, Dal80, Gat1 GO: CatabolismGln3 CTTATC Gat1, Gzf3, Dal82, ... MIPS: Nitrogen and sulfur utilization
KEGG: Cyanoamino acid metabolism
3 211 0 0 0 0 0 0 0 0 1 Hap1
4 70 0 0 0 1 0 0 0 1 0 Cbf1 Met32-Cbf1 CACGTGA Cbf1, Tye7, Ino4, ... GO: Sulfur metabolismMet32 Yap7-Yap1 GCCACA Met4, Rpn4 MIPS: Amino acid metabolismYap7 KEGG: Sulfur metabolism
5 44 0 0 1 0 0 0 1 0 0 Pho4 Pho4-Cbf1 ACGTGC Pho4, Cbf1, Ino2, ... GO: Anion transportCACGTGG Pho4, Tye7, Cbf1, ...
6 15 0 0 0 1 0 0 0 1 1 Met32 GCCAC Rpn4, Met4, R. car1, ...CTGTGGC Met4, Rfx1
7 169 1 0 0 0 1 0 0 0 x Hap4 GGGGTA Mig1, Rap1 GO: Oxidative phosphorylationACCCC Mig1, Adr1, Msn4, ... MIPS: Respiration
KEGG: Oxidative phosphorylation
8 100 0 1 0 0 0 1 0 0 x Dal82 Gln3-Dal82 CTTATC Gat1, Gzf3, Dal82, ... GO: Amine transportGln3 AGATAAG Gzf3, Dal80, Gat1 MIPS: Nitrogen and sulfur utilization
9 93 0 0 0 1 0 0 0 1 x Cad1 Met32-Cbf1 GCCACA Met4, Rpn4 GO: Sulfur metabolismCbf1 Met32-Met31 CACGTGA Cbf1, Tye7, Ino4, ... MIPS: Metabolism of methionine
Met31 Tye7-Cbf1 CTGTGGC Met4, Rfx1 KEGG: Sulfur metabolismMet32Met4Yap7
10 52 0 0 1 0 0 0 1 0 x Cbf1 Pho4-Cbf1 ACGTGC Pho4, Cbf1, Ino2, ... GO: Anion transportPho4 CACGTGG Pho4, Tye7, Cbf1, ...
11 638 x x x x x x x x 1 Hap1 CCGATA Hap1 GO: Oxidative phosphorylationHap4 MIPS: Respiration
KEGG: Oxidative phosphorylation
12 383 x x x x x x x x -1 Dig1 Cin5-Aft2 ACAATAG Yox1, Rox1 GO: Lipid metabolismRox1 Rox1-Cin5 TGCTTT Upc2 MIPS: MetabolismSte12 Swi4-Mcm1Swi4 Tec1-Dig1Tec1 Tec1-Ste12
Yap6-Cin5
13 3883 0 0 0 0 0 0 0 0 0 Fhl1 Rap1-Fhl1 AAAAT Rlr1, Spt23Sfp1-Fhl1 GAAAA Rlr1, Ume1, Azf1, ...
AAAAA Azf1, Sig1, Met4TGAAA Ste12, Dig1, Ume1, ...AAATA Smp1, Rlm1, Azf1, ...AAATT Pho2, Spt23
Detailed information for all modules that are significantly related to at least one TF(-pair). Besides the discretized expression pattern and the significant TFs from binding data, the table reports overrepresented motifs through motif discovery as well as TFs associated to these motifs. Also, the most highly enriched GO, MIPS and KEGG category for each module is given (if significant).

BMC Genomics 2007, 8:25 http://www.biomedcentral.com/1471-2164/8/25
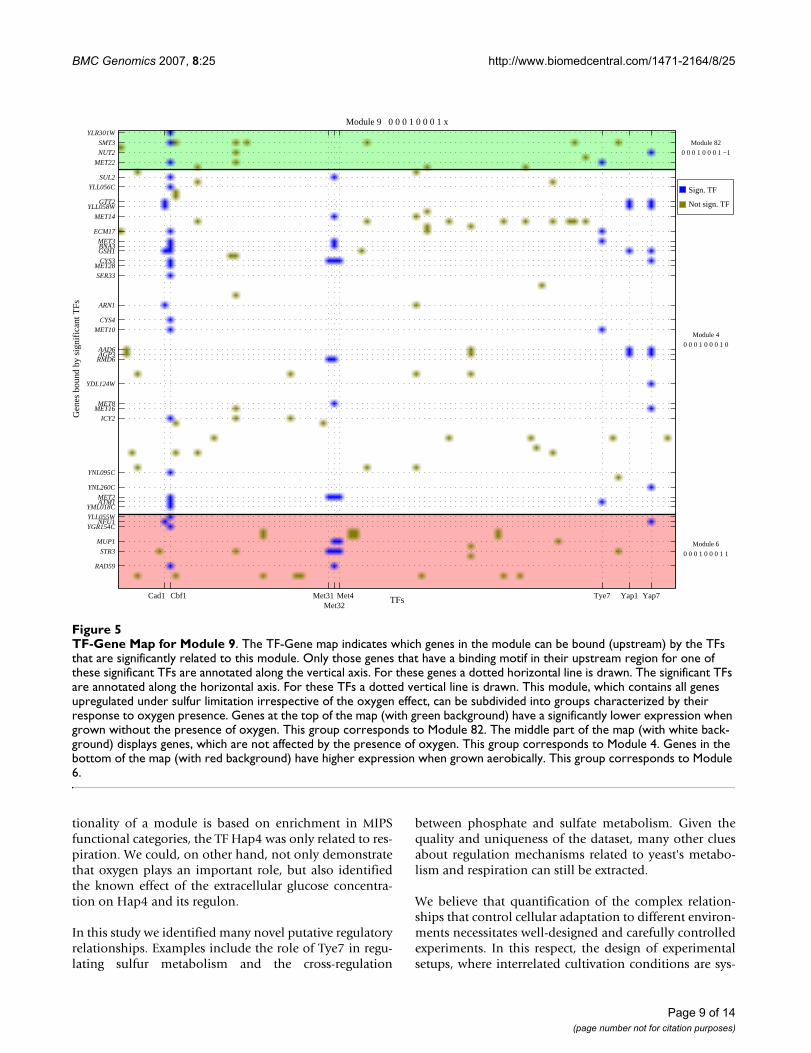
genes, regardless of the effect that the presence of oxygenmight have on the expression of the genes. Modules 6, 82and 4 consist of the sulfur-limitation-upregulated genesfor which oxygen presence leads to higher expression (15genes), lower expression (8 genes, not in Figure 4) and nosignificant change in expression (70 genes). Thus, Module9 is the union of Modules 6, 4 and 82. Figure 5 displaysgenes from Module 9 that are bound by the TFs, which aresignificantly related to the set of sulfur regulated genes. Inthis map, genes are subdivided into groups based on theirresponse to oxygen presence. Several genes that showeither a higher or lower expression level depending onoxygen presence, i.e. genes from Module 6 and 82 respec-tively, also have a binding site for the significant TFs. Forexample, MET22, involved in methionine biosynthesis,exhibits higher expression when grown anaerobically.This can be related to the fact that the promoter sequenceof MET22 contains a LORE (low oxygen response ele-ment) motif [24], which provides clues for future researchto elucidate the functionality of this gene. Amongst thegenes that have a higher expression when grown aerobi-cally and that are bound by significant TFs, is STR3,involved in homocysteine and cysteine interconversionthat is part of the sulfur amino acid biosynthesis and sul-fur degradation pathway. Currently no relationship isknown between sulfur- and oxygen-dependent regulationof this gene.
The regulatory network constructed from our analysisreveals a complex interplay between six individual tran-scription factors (Met4, Met31, Met32, Cbf1, Yap7 andCad1) and four pairs of regulators (Tye7-Cbf1, Cbf1-Met32, Met32-Met31 and Yap1-Yap7) connected to sulfurmetabolism. Met4, Met31, Met32 and Cbf1 constitute aninternal validation of the analysis, since these four factorsare indeed known as members of the Met regulatory com-plex [25] that also includes the regulatory subunit Met28.More interestingly, our data provide new insight into sul-fur metabolism regulation by implicating new regulatorsas Tye7 and the members of the fungal-specific family ofbasic leucine zipper (bZIP) proteins Yap1, Cad1 (Yap2)and Yap7. Literature reports available so far concerningTye7 limit its role to cell cycle [26]. Our results, however,would implicate that Tye7 in combination with Cbf1would participate in the regulation of the genes encodingthe upper part of the sulfur assimilation pathway includ-ing MET3, MET10, ECM17, MET22 and ATM1, who's geneproducts are involved in maturation of cytosolic Fe/S(iron-sulfur) proteins [27]. Even more interesting is thepossible cross-coupling with phosphate metabolism. Asindicated in Figure 4, Cbf1 was also found to bind theupstream regions of phosphorus regulated genes signifi-cantly often. Given that Cbf1, Pho4 and Tye7 recognizesimilar binding sites, our results could shed new light on
the possible cross-regulation of phosphate and sulfatemetabolism that centers around Pho4 and Cbf1 [28].
In the case of Cad1 and Yap1 the link to sulfur metabo-lism may correlate to their reported role in mediatingresistance to cadmium (Cd2+), which leads to changes inthe sulfate assimilation pathway and to sulfur sparing[29]. When Saccharomyces cerevisiae is exposed to Cd2+
most of the sulfur assimilated by the cells is converted intoglutathione, a thiol-metabolite essential for detoxifica-tion. Yeast adapts to this vital metabolite requirement byglobally modifying its proteome to reduce the productionof abundant sulfur-rich proteins.
Discussions and conclusionWe observed and successfully modeled that the presenceof oxygen leads to an offset (addition) and/or scaling(multiplication) of the expression levels of many genes,corroborating the existence of various types of regulationon various levels. The uncovered results find their originin the systematic combinatorial setup of the well-definedcultivation conditions within the experiment. Our tai-lored approach exploits the interrelatedness between theconditions and links the cultivation parameters to TFactivity and gene expression behavior.
We compared our strategy to an approach that follows theexact same steps, but which does not exploit the systematicsetup of the cultivation conditions. In short, when theinterrelatedness between the conditions is not used, theoriginal continuous expression levels are discretized with-out modeling the oxygen effect. Results of this compari-son indicate that more genes can be related to a particularcultivation parameter when incorporating the relationsbetween the cultivation conditions. See Table 2. Addition-ally, we can relate more TFs and TF pairs to the generatedmodules and achieve higher functional annotationenrichment. See Additional files 4 and 5 (as well as Addi-tional files 1 and 2 for a more in depth comparison).These results provide additional evidence for the validityof the adopted approach. Moreover, the inclusion of theconditions within the computational framework accom-modates the assessment of the direct effect of these condi-tions on gene expression, TF activity and other biologicalprocesses in the cell. This is in contrast to the currentlyused compendium approaches, where the relationbetween the cultivation conditions is ambiguous and cannot be modeled. There, large heterogeneity in terms of thestrain, growth rate, growth conditions, measuring tech-nique and other environmental or measurement parame-ters may have a profound, but undetermined impact onthe behavior of the cell and the resulting dataset. Conse-quently, these approaches often resort to annotation data-bases to determine the functionality of a module or TF.For example, in the GRAM method [5], where the func-
Page 8 of 14(page number not for citation purposes)
BMC Genomics 2007, 8:25 http://www.biomedcentral.com/1471-2164/8/25
tionality of a module is based on enrichment in MIPSfunctional categories, the TF Hap4 was only related to res-piration. We could, on other hand, not only demonstratethat oxygen plays an important role, but also identifiedthe known effect of the extracellular glucose concentra-tion on Hap4 and its regulon.
In this study we identified many novel putative regulatoryrelationships. Examples include the role of Tye7 in regu-lating sulfur metabolism and the cross-regulation
between phosphate and sulfate metabolism. Given thequality and uniqueness of the dataset, many other cluesabout regulation mechanisms related to yeast's metabo-lism and respiration can still be extracted.
We believe that quantification of the complex relation-ships that control cellular adaptation to different environ-ments necessitates well-designed and carefully controlledexperiments. In this respect, the design of experimentalsetups, where interrelated cultivation conditions are sys-
TF-Gene Map for Module 9Figure 5TF-Gene Map for Module 9. The TF-Gene map indicates which genes in the module can be bound (upstream) by the TFs that are significantly related to this module. Only those genes that have a binding motif in their upstream region for one of these significant TFs are annotated along the vertical axis. For these genes a dotted horizontal line is drawn. The significant TFs are annotated along the horizontal axis. For these TFs a dotted vertical line is drawn. This module, which contains all genes upregulated under sulfur limitation irrespective of the oxygen effect, can be subdivided into groups characterized by their response to oxygen presence. Genes at the top of the map (with green background) have a significantly lower expression when grown without the presence of oxygen. This group corresponds to Module 82. The middle part of the map (with white back-ground) displays genes, which are not affected by the presence of oxygen. This group corresponds to Module 4. Genes in the bottom of the map (with red background) have higher expression when grown aerobically. This group corresponds to Module 6.
Module 9 0 0 0 1 0 0 0 1 x
TFs
Gen
es b
ound
by
sign
ifica
nt T
Fs
Module 82
0 0 0 1 0 0 0 1 −1
Module 4
0 0 0 1 0 0 0 1 0
Module 6
0 0 0 1 0 0 0 1 1
Cad1 Cbf1 Met31Met32
Met4 Tye7 Yap1 Yap7
YLR301W
SMT3
NUT2
MET22
SUL2
YLL056C
GTT2YLL058W
MET14
ECM17
MET3BNA3GSH1
CYS3MET28
SER33
ARN1
CYS4
MET10
AAD6AGP3
RMD6
YDL124W
MET8MET16
ICY2
YNL095C
YNL260C
MET2ATM1
YML018C
YLL055WNFU1
YGR154C
MUP1
STR3
RAD59
Sign. TF
Not sign. TF
Page 9 of 14(page number not for citation purposes)

BM
C G
enom
ics
2007
, 8:2
5ht
tp://
ww
w.b
iom
edce
ntra
l.com
/147
1-21
64/8
/25
Page
10
of 1
4(p
age
num
ber n
ot fo
r cita
tion
purp
oses
)
Table 2: Effect of the linear mapping on module size and enrichment
Cultivation parameter Linear mapping applied No linear mapping
Disc.Expr.Pattern # genes # TF(pairs) # Ann.cat Disc. Expr. Pattern # genes # TF(pairs) # Ann.cat
Carbon 1 0 0 0 1 0 0 0 x 169 1 48 1 0 0 0 1 0 0 0 59 - 5
-1 0 0 0 -1 0 0 0 x 69 - - -1 0 0 0 -1 0 0 0 23 - -
Nitrogen 0 1 0 0 0 1 0 0 x 100 2(1) 8 0 1 0 0 0 1 0 0 42 2(1) 8
0 -1 0 0 0 -1 0 0 x 2 - - 0 -1 0 0 0 -1 0 0 0 - -
Sulfur 0 0 1 0 0 0 1 0 x 52 2(1) 1 0 0 1 0 0 0 1 0 39 2(1) 6
0 0 -1 0 0 0 -1 0 x 2 - - 0 0 -1 0 0 0 -1 0 1 - -
Phosphorus 0 0 0 1 0 0 0 1 x 93 6(3) 27 0 0 0 1 0 0 0 1 59 5(3) 27
0 0 0 -1 0 0 0 -1 x 4 - - 0 0 0 -1 0 0 0 -1 1 - -
Oxygen x x x x x x x x 1 638 2 75 1 1 1 1 0 0 0 0 115 2 19
x x x x x x x x -1 383 5(6) 13 0 0 0 0 1 1 1 1 76 - 5
For the modules that are most straightforwardly related to one of the the cultivation parameters (the four nutrient limitations and the oxygen availability) this table indicates the size of the respective module, the number of associated TFs, TF pairs and annotation categories; both with and without appliance of the linear mapping. (Note that when no linear mapping is applied the original continuous expression levels are discretized and no oxygen effect can be computed, resulting in a discretized expression pattern of length eight.)

BMC Genomics 2007, 8:25 http://www.biomedcentral.com/1471-2164/8/25
tematically combined, is especially important. The analy-sis of the individual and combined effects of thecultivation parameters in such experiments will help toreveal the multi-faceted nature of cellular regulatorymechanisms.
MethodsDataGene expression dataThe employed microarray gene expression data consists ofthe measured transcriptional response of the yeast Saccha-romyces cerevisiae to growth limitation by four differentmacronutrients (carbon, nitrogen, phosphorus and sul-fur) in both the presence of oxygen (aerobic growth) andthe absence of oxygen (anaerobic growth) [13]. The yeastis grown in chemostat cultures, which allow for the accu-rate control of the environmental parameters, i.e. concen-trations of nutrients can be kept constant, as well as thepH value, the temperature and the growth rate. Threeindependently cultured replicates were performed perexperimental condition. A complete description of theexperimental procedures can be found in [12,13,30]. Thesystematic setup of the eight experiments is displayed inFigure 1. Sampling of the chemostat cultures, probe prep-aration and hybridization to Affymetrix GeneChip micro-arrays was performed as described previously [12].Acquisition and quantification of array images and datafiltering were performed using Affymetrix MicroarraySuite Version 5.0. Before comparison, all arrays were glo-bally scaled to a target value of 150 using the robust aver-age signal from all gene features. The array data used inthis study can be retrieved at Genome Expression Omni-bus [31] with series numbers GSE4807 and GSE1723.
Transcription factor dataIn [14] a combination of genome-wide location analysis(based on ChIP-chip technology) [4], motif discoverytools and literature was employed to recognize motifs inpromoter regions that are bound by one of 102 knownTFs. The resulting regulatory map indicates the number ofmotifs in the promoter region of a gene for a TF for allgene-TF pairs. We binarized this map such that an elementindicates whether a gene can be bound by a TF or not. Weemployed only motifs that are bound with high confi-dence (P ≤ 10-3); not taking into account conservationamong other sensu stricto Saccharomyces species, since ourinterest in purely focused on Saccharomyces cerevisiae. Thedata was downloaded from [32].
Gene annotation dataGenes were associated with the processes in which theyparticipate as annotated in Gene Ontology biologicalprocesses [10,33], MIPS functional categories [11,34] andKEGG pathways [35,36].
MethodologySelection of differentially expressed genesGenes that show differential expression across the experi-mental conditions are selected. For this purpose, weemployed a multi-class SAM analysis [37]. Here, theclasses are the eight different experimental conditions.The 2500 most significantly changed genes are selected(median false discovery rate of 0.01%). This is an estimateof the number of genes involved in the metabolic proc-esses of yeast grown under the experimental conditions[13].
Isolation of the global oxygen effect
To investigate the linear relationship between the aerobicand anaerobic expression values of a gene, we perform thefollowing steps: First, we compute the mean and standard
deviation across the replicates, µij and σij, for the nutrient
limitations i = 1...4 and both aerobic (j = 1) and anaerobic(j = 2) growth. We model the joint aerobic-anaerobicexpression distribution for each nutrient limitation i as a
normal distribution N(µi, ∑i), with µi = [µi1, µi2] and
. This is graphically depicted in Figure
2b. Next, we estimate the parameters of a linear model(slope and offset) by fitting a straight line through thefour normal distributions. This heteroscedastic regressionproblem is solved as described in [38]. As a goodness-of-fit criterion for the regression, a P-value was computed byemploying the Student's T cumulative distribution func-tion with the ratio between the slope and the standarddeviation of the slope. The P-value cut-off was set at 10-4.When no significant linear relationship (P > 10-4) is foundemploying the four nutrient limitations, we successivelyleave one of the nutrient limitations out, thus employingonly three normal distributions to find a linear relation-
ship. If P ≤ 10-4 for the best of the resulting four fits, thisfit is used. This strategy handles genes with one nutrient-limitation-specific reaction to oxygen presence. See Addi-tional file 7. When again no good linear relationship isfound, the slope is fixed to one and only the offset (i.e. thedifference between the mean aerobic and anaerobicexpression level) is computed. See Additional file 8. Thethree different regression strategies (use of four nutrientlimitations, use of three nutrient limitations, only com-pute the offset) were applied to 1190, 518 and 792 genes,respectively. For each gene, we apply the estimated param-eters (slope a and offset b) to map the original aerobicexpression values x to their linearly mapped values x', viax' = a·x + b, thereby aligning the aerobic and anaerobic
=
∑
σ
σi
ii
12
22
0
0
Page 11 of 14(page number not for citation purposes)

BMC Genomics 2007, 8:25 http://www.biomedcentral.com/1471-2164/8/25
expression patterns, such that the differences in the result-ing expression pattern are not caused by the oxygen effect.See for example, Figure 2c.
Construction of the discretized representationA gene is represented by a ternary expression pattern oflength nine. The first eight entries represent the discretizedrepresentation of the linearly mapped continuous expres-sion data, which can be either 0, -1 or 1, indicating themost common expression level, downregulation or upreg-ulation, respectively. Since the linear mapping changesthe continuous expression pattern of a gene, SAM is runagain on the linearly mapped data. Genes that now dropout of the top 2500 most differentially expressed genes areassigned a value of zero in the first eight entries of theexpression pattern. Genes, that remain in the top 2500(2062 genes) are discretized by employing k-means clus-tering for each gene separately, i.e. in an one-dimensionalspace on the eight mean expression levels associated withthe eight experimental conditions. (Red crosses on theright vertical axis in Figure 2c). The Davies-Bouldin index[39] was used to choose between k = 2 (most commonlevel and down- or upregulation) and k = 3 (all threequantized levels). Genes for which no compact and well-separated clusters could be found, i.e. for which the Dav-ies-Bouldin index for both k = 2 and k = 3 exceeded 0.5,were removed. The most common level (0) was assignedto the experimental conditions that formed the largestcluster. The clusters with higher or lower gene expressionlevels with respect to the most common level cluster arelabeled as upregulated (1) or downregulated (-1) respec-tively. The ninth entry of the discretized expression pat-tern of a gene represents the global oxygen effect. This caneither be 0,-1 or 1. No significant difference betweenexpression under aerobic and anaerobic growth is indi-cated by a zero (0). A consistent significantly lower orhigher expression level when grown anaerobically is indi-cated by -1 and 1, respectively. The global oxygen effect isdetermined by performing pairwise T-tests for all nutrientlimitations, comparing the original expression levelswhen grown aerobically with those when grown anaero-bically. See Figure 2d. When at least three of the four nutri-ent limitations have a significantly (P ≤ 5·10-2) higherexpression when grown aerobically (or anaerobically) weassign a 1 (or -1 respectively). (In the case where onlythree nutrient limitations were used in regression onlytwo of these three should be significantly higher (orlower) to pass the test.)
Generation of the modulesModules are formed by grouping genes with identical dis-cretized expression patterns, i.e. by performing a hierar-chical clustering on the discretized data with Hammingdistance as dissimilarity measure and then forming clus-
ters by cutting the dendrogram at a distance of zero (link-age is irrelevant). Additionally, modules are formed withthe global oxygen effect being irrelevant, i.e. genes areclustered together when only the first eight entries of theexpression pattern are identical. Similarly, modules arecreated based solely on the oxygen effect. This strategy cre-ates overlapping clusters of genes, that represent differentcharacterizations based on the global oxygen effect.
Identification of significant TFs and enrichment of annotation categoriesModules are related to TFs by the hypergeometric test,which assesses the probability that the observed frequencythat the genes in a module are bound by a TF would occurby chance. The P-value cutoff to decide whether a relationis significant is P ≤ 1/(nm nx), where nm is the number ofmodules consisting of more than ten genes and nx is thenumber of TFs or TF pairs that bind to more than tengenes. This Bonferroni correction for multiple testingresults in a per-family error rate (PFER) of one [40]. Con-sidering the stringency of the Bonferroni correction andthe fact that the tests are not independent, the P-value cor-rection is quite conservative. The same procedure isemployed to assess the overrepresentation of GO, MIPSand KEGG annotation categories.
Motif discoveryRSAT motif discovery [41] was applied to modules, whichare significantly related to at least one TF or TF pair. Anoligonucleotide analysis was run with motif sizes rangingfrom five to eight. Significant (RSAT occurrence signifi-cance score larger than one) and dissimilar motifs for eachmodule were manually extracted. Published PWM/PSSMmatrices for known TFs [14,42,43] are captured in theweight matrix form as described in [44]. A simple similar-ity score between a motif and a weight matrix, i.e. the sumof the weights of the matrix for the letters of the alignedmotif, was employed to relate the uncovered motifs toknown TFs.
Authors' contributionsTAK devised the methodology and drafted the manu-script. JHW interpreted the results and assisted in structur-ing the manuscript. JMD carried out the microarray workand interpreted the results. PDL assisted in structuring themanuscript. JTP assisted in structuring the manuscript.MJTR participated in devising the methodology andhelped to draft the manuscript. LFAW participated indevising the methodology and helped to draft the manu-script. All authors read and approved the final manu-script.
Page 12 of 14(page number not for citation purposes)

BMC Genomics 2007, 8:25 http://www.biomedcentral.com/1471-2164/8/25
Additional material
AcknowledgementsThe research group of J.T.P. is part of the Kluyver Centre for Genomics of Industrial Fermentation, which is supported by the Netherlands Genomics Initiative (NGI). This work was part of the BioRange programme of the Netherlands Bioinformatics Centre (NBIC), which is supported by a BSIK grant through the Netherlands Genomics Initiative (NGI). The authors would like to thank D.M.J. Tax en D. de Ridder for fruitful discussions about the applied regression strategy and its alternatives. The authors would like to thank the anonymous reviewers for their helpful comments.
References1. Roth FP, Hughes JD, Estep PW, Church GM: Finding DNA regula-
tory motifs within unaligned noncoding sequences clusteredby whole-genome mRNA quantitation. Nat Biotechnol 1998,16(10):939-945.
2. Bussemaker HJ, Li H, Siggia ED: Regulatory element detectionusing correlation with expression. Nat Genet 2001,27(2):167-171.
3. Kellis M, Patterson N, Endrizzi M, Birren B, Lander ES: Sequencingand comparison of yeast species to identify genes and regu-latory elements. Nature 2003, 423(6937):241-254.
4. Lee TI, Rinaldi NJ, Robert F, Odom DT, Bar-Joseph Z, Gerber GK,Hannett NM, Harbison CT, Thompson CM, Simon I, Zeitlinger J, Jen-nings EG, Murray HL, Gordon DB, Ren B, Wyrick JJ, Tagne JB, VolkertTL, Fraenkel E, Gifford DK, Young RA: Transcriptional regulatory
Additional file 1Discretized Clustering With Linear Mapping. An Excel file containing all the modules derived with the proposed method. Also, significantly enriched annotation categories and transcription factors are given.Click here for file[http://www.biomedcentral.com/content/supplementary/1471-2164-8-25-S1.xls]
Additional file 6Microscopic pictures of Saccharomyces cerevisiae. Microscopic pictures of Saccharomyces cerevisiae grown in aerobic carbon limited (left) and anaerobic carbon limited (right) chemostats. The cells were sampled from the fermenters and directly observed under an optical microscope equipped with a camera. Also for the other nutrient limitations these observations were made. These results were not photographed.Click here for file[http://www.biomedcentral.com/content/supplementary/1471-2164-8-25-S6.jpeg]
Additional file 2Discretized Clustering Without Linear Mapping. An Excel file contain-ing all the modules derived with the proposed method, however without applying the linear mapping. Also, significantly enriched annotation cat-egories and transcription factors are given.Click here for file[http://www.biomedcentral.com/content/supplementary/1471-2164-8-25-S2.xls]
Additional file 4Enrichment of annotation categories with and without appliance of the linear mapping. After performing the hypergeometric tests on mod-ules created both with and without appliance of the linear mapping, we select for all different annotation categories from GO, KEGG and MIPS, the smallest P-value (highest enrichment in a particular module) for both approaches. These minimal P-values for all functional categories obtained by applying or omitting the linear mapping are plotted against each other. Note that in the case of the Gene Ontology (GO) we consider two types of data: One indicates whether a gene is assigned to a particular leaf (bio-logical process) in the GO annotation tree. This one is referred to as 'GO leaves'. The other associates a gene located in a certain leaf not only with that particular leaf but also with all nodes between the leaf node and the root of the GO tree. We refer to this GO data as 'GO comp'.Click here for file[http://www.biomedcentral.com/content/supplementary/1471-2164-8-25-S4.eps]
Additional file 5The TF circle for modules uncovered without applying the linear map-ping. Similar to Figure 4, except now the proposed method is applied with-out performing the linear mapping.Click here for file[http://www.biomedcentral.com/content/supplementary/1471-2164-8-25-S5.eps]
Additional file 7Procedure to derive the discretized representation of a gene using only three nutrient limitations in the regression. Similar to Figure 2. For this gene, no good linear relationship could be found using all four nutrients limitations. However, when the carbon limitation is left out, there exist a good linear relationship (see b).Click here for file[http://www.biomedcentral.com/content/supplementary/1471-2164-8-25-S7.eps]
Additional file 8Procedure to derive the discretized representation of a gene using the mean-offset correction. Similar to Figure 2. For this gene, no good linear relationship could be found using four or sets of three nutrient limitations. Therefore, the slope is fixed to one and only the offset is computed (see b).Click here for file[http://www.biomedcentral.com/content/supplementary/1471-2164-8-25-S8.eps]
Additional file 3Permutation tests. For the differentially expressed genes in the dataset, the estimated parameters (scaling factor (slope) and offset) from the het-eroscedastic regression are compared with those generated by employing the regression strategy on 1000 datasets, where the eight condition labels were randomly permuted. Also, the P-values that represent the variability of the slope and the offset were computed for all permutations. In the top-left plot the red line indicates the number of genes with a P-value that is lower than the Pcutoff, which is found on the x-axis. The blue line indicates the false discovery rate (FDR) as a function of the Pcutoff. Here, the FDR is defined as the median number of genes with P <Pcutoff from the per-muted datasets divided by number of genes with P <Pcutoff from the origi-nal dataset. The top-right plot displays the same features for the offset. In these top figures, if the scaling factor is smaller than zero, the P-values of scaling factor and offset are set to 1. A slope smaller than zero implies that the best linear relationship is found when inverting the expression pattern. This, of course, makes no sense from a biological perspective. The bottom-left plot displays the distribution of the computed scaling factors. This dis-tribution is estimated using Parzen density estimation. From the 1000 permuted datasets, 1000 different distributions were estimated. These were plotted using an errorbar plot, which indicates the standard deviation of the permuted distribution. Here, it is clearly visible that for the correct labels only few genes exhibit a slope smaller than zero. Additionally, for most genes the slope is between zero and one and the offset is smaller than zero, indicating that the majority of genes have a higher expression when grown within the presence of oxygen. The bottom-right plot displays the original and permuted distribution for the offset.Click here for file[http://www.biomedcentral.com/content/supplementary/1471-2164-8-25-S3.eps]
Page 13 of 14(page number not for citation purposes)

BMC Genomics 2007, 8:25 http://www.biomedcentral.com/1471-2164/8/25
Publish with BioMed Central and every scientist can read your work free of charge
"BioMed Central will be the most significant development for disseminating the results of biomedical research in our lifetime."
Sir Paul Nurse, Cancer Research UK
Your research papers will be:
available free of charge to the entire biomedical community
peer reviewed and published immediately upon acceptance
cited in PubMed and archived on PubMed Central
yours — you keep the copyright
Submit your manuscript here:http://www.biomedcentral.com/info/publishing_adv.asp
BioMedcentral
networks in Saccharomyces cerevisiae. Science 2002,298(5594):799-804.
5. Bar-Joseph Z, Gerber GK, Lee TI, Rinaldi NJ, Yoo JY, Robert F, Gor-don DB, Fraenkel E, Jaakkola TS, Young RA, Gifford DK: Computa-tional discovery of gene modules and regulatory networks.Nat Biotechnol 2003, 21(11):1337-1342.
6. Luscombe NM, Babu MM, Yu H, Snyder M, Teichmann SA, GersteinM: Genomic analysis of regulatory network dynamics revealslarge topological changes. Nature 2004, 431(7006):308-312.
7. Banerjee N, Zhang MQ: Functional genomics as applied to map-ping transcription regulatory networks. Curr Opin Microbiol2002, 5(3):313-317.
8. Siggia ED: Computational methods for transcriptional regula-tion. Curr Opin Genet Dev 2005, 15(2):214-221.
9. Blais A, Dynlacht BD: Constructing transcriptional regulatorynetworks. Genes Dev 2005, 19(13):1499-1511.
10. Ashburner M, Ball CA, Blake JA, Botstein D, Butler H, Cherry JM,Davis AP, Dolinski K, Dwight SS, Eppig JT, Harris MA, Hill DP, Issel-Tarver L, Kasarskis A, Lewis S, Matese JC, Richardson JE, Ringwald M,Rubin GM, Sherlock G: Gene ontology: tool for the unificationof biology. The Gene Ontology Consortium. Nat Genet 2000,25:25-29.
11. Mewes HW, Albermann K, Heumann K, Liebl S, Pfeiffer F: MIPS: adatabase for protein sequences, homology data and yeastgenome information. Nucleic Acids Res 1997, 25:28-30.
12. Piper MDW, Daran-Lapujade P, Bro C, Regenberg B, Knudsen S,Nielsen J, Pronk JT: Reproducibility of oligonucleotide microar-ray transcriptome analyses. An interlaboratory comparisonusing chemostat cultures of Saccharomyces cerevisiae. J BiolChem 2002, 277(40):37001-37008.
13. Tai SL, Boer VM, Daran-Lapujade P, Walsh MC, de Winde JH, DaranJM, Pronk JT: Two-dimensional transcriptome analysis in che-mostat cultures. Combinatorial effects of oxygen availabilityand macronutrient limitation in Saccharomyces cerevisiae. JBiol Chem 2005, 280:437-447.
14. Harbison CT, Gordon DB, Lee TI, Rinaldi NJ, Macisaac KD, DanfordTW, Hannett NM, Tagne JB, Reynolds DB, Yoo J, Jennings EG, Zei-tlinger J, Pokholok DK, Kellis M, Rolfe PA, Takusagawa KT, Lander ES,Gifford DK, Fraenkel E, Young RA: Transcriptional regulatorycode of a eukaryotic genome. Nature 2004, 431(7004):99-104.
15. Yeast Protein Database [http://www.proteome.com]16. Marion RM, Regev A, Segal E, Barash Y, Koller D, Friedman N, O'Shea
EK: Sfp1 is a stress- and nutrient-sensitive regulator of ribos-omal protein gene expression. Proc Natl Acad Sci USA 2004,101(40):14315-14322.
17. Moehle CM, Hinnebusch AG: Association of RAP1 binding siteswith stringent control of ribosomal protein gene transcrip-tion in Saccharomyces cerevisiae. Mol Cell Biol 1991,11(5):2723-2735.
18. Zitomer RS, Lowry CV: Regulation of gene expression by oxy-gen in Saccharomyces cerevisiae. Microbiol Rev 1992, 56:1-11.
19. Norman TC, Smith DL, Sorger PK, Drees BL, O'Rourke SM, HughesTR, Roberts CJ, Friend SH, Fields S, Murray AW: Genetic selectionof peptide inhibitors of biological pathways. Science 1999,285(5427):591-595.
20. Simon I, Barnett J, Hannett N, Harbison CT, Rinaldi NJ, Volkert TL,Wyrick JJ, Zeitlinger J, Gifford DK, Jaakkola TS, Young RA: Serialregulation of transcriptional regulators in the yeast cellcycle. Cell 2001, 106(6):697-708.
21. Hayes TE, Sengupta P, Cochran BH: The human c-fos serumresponse factor and the yeast factors GRM/PRTF haverelated DNA-binding specificities. Genes Dev 1988,2(12B):1713-1722.
22. Kwast KE, Lai LC, Menda N, James DT, Aref S, Burke PV: Genomicanalyses of anaerobically induced genes in Saccharomycescerevisiae: functional roles of Rox1 and other factors inmediating the anoxic response. J Bacteriol 2002, 184:250-265.
23. Forsburg SL, Guarente L: Identification and characterization ofHAP4: a third component of the CCAAT-bound HAP2/HAP3 heteromer. Genes Dev 1989, 3(8):1166-1178.
24. Vasconcelles MJ, Jiang Y, McDaid K, Gilooly L, Wretzel S, Porter DL,Martin CE, Goldberg MA: Identification and characterization ofa low oxygen response element involved in the hypoxicinduction of a family of Saccharomyces cerevisiae genes.Implications for the conservation of oxygen sensing ineukaryotes. J Biol Chem 2001, 276(17):14374-14384.
25. Rouillon A, Barbey R, Patton EE, Tyers M, Thomas D: Feedback-regulated degradation of the transcriptional activator Met4is triggered by the SCF(Met30)complex. EMBO J 2000,19(2):282-294.
26. Horak CE, Luscombe NM, Qian J, Bertone P, Piccirrillo S, Gerstein M,Snyder M: Complex transcriptional circuitry at the G1/S tran-sition in Saccharomyces cerevisiae. Genes Dev 2002,16(23):3017-3033.
27. Sipos K, Lange H, Fekete Z, Ullmann P, Lill R, Kispal G: Maturationof cytosolic iron-sulfur proteins requires glutathione. J BiolChem 2002, 277(30):26944-26949.
28. O'Connell KF, Baker RE: Possible cross-regulation of phosphateand sulfate metabolism in Saccharomyces cerevisiae. Genet-ics 1992, 132:63-73.
29. Fauchon M, Lagniel G, Aude JC, Lombardia L, Soularue P, Petat C,Marguerie G, Sentenac A, Werner M, Labarre J: Sulfur sparing inthe yeast proteome in response to sulfur demand. Mol Cell2002, 9(4):713-723.
30. Boer VM, de Winde JH, Pronk JT, Piper MDW: The genome-widetranscriptional responses of Saccharomyces cerevisiaegrown on glucose in aerobic chemostat cultures limited forcarbon, nitrogen, phosphorus, or sulfur. J Biol Chem 2003,278(5):3265-3274.
31. Genome Expression Omnibus [http://www.ncbi.nlm.nih.gov/geo/]
32. Fraenkel Lab – Regulatory Map formatted for spreadsheetimport [http://fraenkel.mit.edu/Harbison/release_v24/txtfiles/]
33. The Gene Ontology Version: 31 August 2005 [http://www.geneontology.org]
34. Munich information center for protein sequences Version:20 June 2005 [http://mips.gsf.de/]
35. Kanehisa M, Goto S: KEGG: kyoto encyclopedia of genes andgenomes. Nucleic Acids Res 2000, 28:27-30.
36. Kyoto Encyclopedia of Genes and Genomes Version: 8 June2005 [http://www.genome.jp/kegg/]
37. Tusher VG, Tibshirani R, Chu G: Significance analysis of micro-arrays applied to the ionizing radiation response. Proc NatlAcad Sci USA 2001, 98(9):5116-5121.
38. Leedan Y, Meer P: Heteroscedastic Regression in ComputerVision: Problems with Bilinear Constraint. Int J of ComputerVision 2000, 37(2):127-150.
39. Davies DL, Bouldin DW: A cluster separation measure. IEEETrans Patt Anal Machine Intell 1979, PAMI-1:224-227.
40. Ge Y, Dudoit S, Speed TP: Resampling-based multiple testingfor microarray data analysis. TEST 2003, 12:1-77.
41. van Helden J: Regulatory sequence analysis tools. Nucleic AcidsRes 2003, 31(13):3593-3596.
42. Gene Regulation [http://www.gene-regulation.com/]43. SCPD The Promoter Database of Saccharomyces cerevisiae
[http://rulai.cshl.edu/SCPD/]44. Hertz GZ, Stormo GD: Identifying DNA and protein patterns
with statistically significant alignments of multiplesequences. Bioinformatics 1999, 15(7–8):563-577.
Page 14 of 14(page number not for citation purposes)


