Embed Size (px)
Citation preview

Journal of Geochemical Exploration 154 (2015) 171–179
Contents lists available at ScienceDirect
Journal of Geochemical Exploration
j ourna l homepage: www.e lsev ie r .com/ locate / jgeoexp
Exploratory data analysis and singularity mapping in geochemicalanomaly identification in Karamay, Xinjiang, China
Zhou Shuguang a,b,c, Zhou Kefa a,⁎, Cui Yao a,d, Wang Jinlin a, Ding Jianli b
a Xinjiang Research Centre for Mineral Resources, Xinjiang Institute of Ecology and Geography, Chinese Academy of Sciences, Urumqi, Xinjiang 830011, Chinab Xinjiang University, Urumqi, Xinjiang 830046, Chinac University of Chinese Academy of Sciences, Beijing 100049, Chinad British Columbia Geological Survey, PO Box 9333 Stn Prov Govt, Victoria, BC, Canada V8W 9N3
⁎ Corresponding author.E-mail address: [email protected] (Z. Kefa).
http://dx.doi.org/10.1016/j.gexplo.2014.12.0070375-6742/© 2014 Elsevier B.V. All rights reserved.
a b s t r a c t
a r t i c l e i n f oArticle history:Received 14 November 2013Revised 26 November 2014Accepted 2 December 2014Available online 16 December 2014
Keywords:geochemical explorationexploratory data analysissingularity mapping techniquegold deposit
Hatu and Baogutu are two typical gold deposits in the study area. Hatu gold deposit is associated withmagmatism and controlled by regional-scale faults; mineralisation mainly occurs within hydrothermally alteredfelsic rocks and quartz veins. In thewest region of theHatumining area, Cu, Ag, As and Sb are present in high con-centrations in carbon tuffaceous shale. Baogutu gold deposit is associated with the evolution of felsic magmas,and the porphyry copper-gold mineralisation and copper-gold ore body dominated by sulphide were formedin the rock or near the contract zone in the faults, respectively. The ore-forming elements include Au, As andSb. In this study, exploratory data analysis (EDA) and singularitymapping (SM) techniqueswere applied to iden-tify geochemical anomalies caused by Au-relatedmineralisation according to stream sediment geochemical dataset in Karamaymineral district, northwestern China. Silver, As, Au and Sbwere chosen as indicator elements. Theresults show that EDA could not well identify weak anomalies within the strong variance of the background,while SM can recognise effectively weak anomalies, and quantify the properties of enrichment caused bymineralisation. The results obtained by SM demonstrated that the anomalies are closely associated with theknown Au deposits in the study area. The anomalous areas delineated by the SM have potential for follow-upmineral exploration. In addition, the results document that Ag, As, Au and Sb may be reliable indicator elementsfor Au-related mineralisation in the study area.
© 2014 Elsevier B.V. All rights reserved.
1. Introduction
Identifying anomalies during mineral exploration is one of the basictasks in geochemical data utilisation. Several techniques can be used toidentify anomalies in geochemical data sets, which can be broadlyclassified into two categories according to the number of thresholdsused in the study area: (i) ‘hard threshold techniques’ (employing aglobal threshold level for all data in the study area), and (ii) ‘soft thresh-old techniques’ (which employs local, dynamical thresholds over astudy area). For hard threshold techniques, the anomaly threshold isoften calculated, e.g. by using the mean of a variable or element plustwo or three times the variable/element’s standard deviation (MSTD)(Reimann and Garrett, 2005; Reimann et al., 2005; Xie et al., 2008a),or by the value of the median of a variable or element plus two timesthe median absolute deviation (MMAD) (Bounessah and Atkin, 2003;Chipres et al., 2009; Reimann and Filzmoser, 2000; Reimann et al.,2005) or by using the concentration–area (C-A) multifractal model(Cheng et al., 1994). In soft threshold techniques, some window-based
contrast filtering methods (Jin and Chen, 2011; Shi et al., 1999; Zhaoet al., 2012b), such as the spectrum and area model (S-A model)(Cheng, 2000) and the SM technique developed by Cheng (2007a), arewidely used (Chen et al., 2007; Cheng et al., 2009; Wang et al., 2013a,b; Zuo and Cheng, 2008; Zuo et al., 2013, 2015–in this issue).
In China, theMSTD is often used as the canonical anomaly thresholddefinition, in the statistical treatment of regional geochemical data formineral exploration, even at the present time when computers andnew and efficient techniques are available. MMAD, as a kind of explor-atory data analysis (EDA), is considered a robust method of treatingexploration data. By contrast, the C-Amodel has limited success in iden-tifying weak anomalies in covered areas (Zuo et al., 2013), and expertknowledge is needed to determine the anomaly threshold accordingto the log-log plot. The problem in using contrast filtering methods isthat the size of the window used needs to be determined according toa priori knowledge, which limits practical application. The S-A modelis complicated and suffers from edge effects in irregularly shapedstudy areas (Zuo et al., 2013). By contrast, the SM technique has beenreported widely and often produces meaningful results when used inthe statistical treatment of geochemical data (Bai et al., 2010; Cheng,2012; Sun et al., 2010; Xiao et al., 2012; Zuo et al., 2013).

172 Z. Shuguang et al. / Journal of Geochemical Exploration 154 (2015) 171–179
In this paper, the Hatu and Baogutu gold districts in Karamay,Xinjiang, China are selected as the study area used for comparison ofthe results of MMAD (hard threshold) and the SM technique (softthreshold) with respect to identifying geochemical anomalies associatedwith mineralisation.
2. Study area and data set
The study area (Fig. 1) is located in the western Junggar Basin,approximately 330 km northwest of Urumqi, Xinjiang, China. This dis-trict is mainly controlled byNNE faults. Major faults in this area include,from north to south, the Hatu, Anqi, Darabut and Yijiaren faults. TheDarabut ophioliticmélange belt, distributed as a band along theDarabutfault, is approximately 50 km2 in size, whichwas tectonically disrupted,and now forms the present imbricate structure that ismainly controlledby thrust faults. Materials from the oceanic crust often appear in terrig-enous detrital sediment at old continental margins, and exhibitgeochemical characteristics that are similar to the materials from themantle (Zhang and Huang, 1992). Major plutonic rocks are representedby Miaoergou, Hatu, Akebasitao, Red Mountain and north Karamaygranite batholiths in this area, with an age of 300 Ma from zirconLA-ICP-MS U-Pb (Su et al., 2006). The distributions of intrusive rocksand ore deposits in this area are highly correlated with the faults.
The Hatu gold deposit in the NW and the Baogutu gold deposit in theSE of the study area are two representative deposits of the regionalmineralisation geology. The Hatu gold deposit is controlled by two NEtrending faults, namely, Anqi (extension fault) and Hatu (compressionand scissor fault). SomeNW,NE and EWtrending secondary faults are as-sociated with ore formation and with the NE trending fault. The ore bod-ies occur in groups, en échelon, and end-to-end alignment (Zhu et al.,2013). The Hatu gold deposit mainly consists of superficial quartz vein-type and altered rock-type ore bodies, and these ore bodies are productsof a homologous hydrothermalflow (Zhang, 2003). Copper, Ag, As and Sbare present in high concentrations in carbon tuffaceous shale. Antimonyoccurs in the Lower Carboniferous stratum. Gold mineralisation is asso-ciated with silicification, sericitisation, pyritisation and arsenopyrite
Fig. 1. Simplifiedmap of regional tectonics, magmatic rocks and alteration districts in the northformation; C1b = Baogutu formation).
mineralisation. The main mineral assemblage is arsenopyrite-pyrite-native gold-native arsenic-native antimony-stibnite. Arsenopyrite is theore mineral of this gold deposit, and its element association is Au, Asand Sb (Zhu et al., 2013).
China’s National Geochemical Mapping Project (Regional Geochem-istry National Reconnaissance) was initiated in 1979 (Xie et al., 1997),and the project covered more than 6 million km2 (Xie et al., 2008b).This project mainly collected stream sediment samples. In this study,the density was one sample per km2. To reduce the laboratory load,four samples were composited into one sample for analysis representing4 km2 (Fig. 2). For the purposes of this study, four elementswere selectedfrom the 39 elements thatwere determined (Wang et al., 2011; Xie et al.,2008b), which are closely related to the mineralisation, namely, Ag, As,Au and Sb. Silver was determined using emission spectrometry (ES)with a detection limit of 0.1 mg/kg. Arsenic and Sb were determinedby hydride generation–atomic fluorescence spectrometry (HG-AFS),and their detection limits were 0.005 and 0.1 mg/kg respectively. Goldwas determined by graphite furnace–atomic absorption spectrometry(GF-AAS) with a detection limit of 0.1 mg/kg. Details on the quality con-trol procedures are reported by Xie et al. (1996), Cheng et al. (1997) andLiu et al. (2015–in this issue).
Many research projects on geochemical anomaly recognition wereconducted on the basis of China’s National Geochemical Mapping Pro-ject, and these projects used methods such as the C-A fractal model(Cheng et al., 1994), the concentration–distance fractal model (Liet al., 2003), the spectrum–area (S-A) model (Cheng, 2000), and theSM technique (Cheng, 2007a; Wang et al., 2013b; Xiao et al., 2012;Zuo et al., 2009, 2012, 2013), which involved both the frequency distri-butions and the spatial self-similar properties of geochemical variables.These models are effective tools for decomposing complex and mixedgeochemical populations, and for identifying weak geochemical anom-alies hidden within a strong geochemical background (Cheng, 2007a;Cheng and Agterberg, 2009; Cheng et al., 2010). In the present paper,the effectiveness of EDA and SM techniques to identify geochemicalanomalies related to gold deposits are compared using the streamsediment geochemical data from the Karamay area.
western Xinjiang Autonomous Region, China (C1x=Xibeikula formation; C1t= Tailegula

Fig. 2. Simplified map of stream sediment geochemical sample locations.
173Z. Shuguang et al. / Journal of Geochemical Exploration 154 (2015) 171–179
3. Methodology
3.1. EDA
The principles of the EDA (Tukey, 1977) are unlike those of conven-tional statistical techniques because EDA does not require a data set tofollow normal or log-normal distribution. A boxplot is plotted by firstordering data values from minimum to maximum, or vice versa (Kürzl,1988). The median value is determined by counting halfway throughthe data values, thereby dividing the univariate data set into two equalparts. Subsequently, by counting halfway from the minimum to themedian and from the maximum to the median, the lower hinge (LH)and the upper hinge (UH) values are estimated, respectively. With thelower hinge, median and upper hinge, a data set is thus divided intofour approximately equal parts known as quartiles. A box is thendrawn between the lower and upper hinges. The box is usually dividedby a line at themedian value. The absolute difference between the valuesat the lower and upper hinges represents the inter-quartile range (IQR)or hinge width:
hinge width ¼ IQR ¼ lower hinge–upper hingej j ð1Þ
A lower inner fence (LIF) and an upper inner fence (UIF) are definedat 1½ × IQR away from the lower hinge towards the minimum valueand the upper hinge toward the maximum, respectively. Algebraically,values (X) at the LIF and the UIF are estimated as:
XLI F ¼ XLH– 1:5� IQRð Þ ð2Þ
XUIF ¼ XUH þ 1:5 � IQRð Þ ð3Þ
The data values beyond the inner fences are considered as outliers.In this paper, the outliers corresponded with the geochemicalanomalies, and the values beyond the upper hinge (XUIF), rather thanthose of XLIF, were taken into consideration only.
3.2. Singularity mapping technique
Formation of an ore deposit can be a complex, nonlinear process.The mineralisation process may occur repeatedly at different periods,and a deposit may be transformed many times by geological activities.The key conceptual issue supported by many studies is that the intensi-ty, geometricalmorphology and frequency distribution of anomalies re-lated tomineralisation almost certainlywill be different fromanomaliesthat are related to a regional geological process (Cheng et al., 2007).Research on and application of nonlinear fractal theory and associatedmethods have proven that anomaly patterns, produced by differentgeological processes, have different scaling properties, anisotropy andgeneral self-similarity characteristics (Cheng, 2007b). Thus, bothanomaly and background information are present in geochemicalsample data sets. Sampling may also be affected by other factors, suchas sedimentation of aeolian sandy soil, landform, rainwash and vegeta-tion. Because of these complex mechanisms, conventional statisticalmethodsmay be not effective in the treatment of geochemical data sets.
The local singularity index model was proposed by Cheng (1999),based on nonlinear fractal theory and was considered to be an effectivemethod to characterise special phenomena accompanied by energy re-lease or material accumulation within narrow spatial–temporal inter-vals. This singularity property has been observed in geochemical datasets (Ali et al., 2007; Cheng and Agterberg, 2009; Sun et al., 2010; Xiaoet al., 2012; Zuo et al., 2009, 2013). This technique can advantageouslybe used to discriminate geochemical anomalies from regional or localbackgrounds. For a two-dimensional situation, the principle of thesingularity model can be quantitatively described by the followingpower–law relationships (Cheng, 2007a):
μ Aið Þ∝ Aα2i ð4Þ
ρ Aið Þ∝ Aα2−1i ð5Þ
where μ(Ai) and ρ(Ai) denote the amount and density of a certain phys-ical quantity in an area (Ai), respectively.∝ denotes proportionality andα is the estimated singularity index. When applied to a geochemicalmap, α N 2 or α b 2 represent enrichment and depletion of element
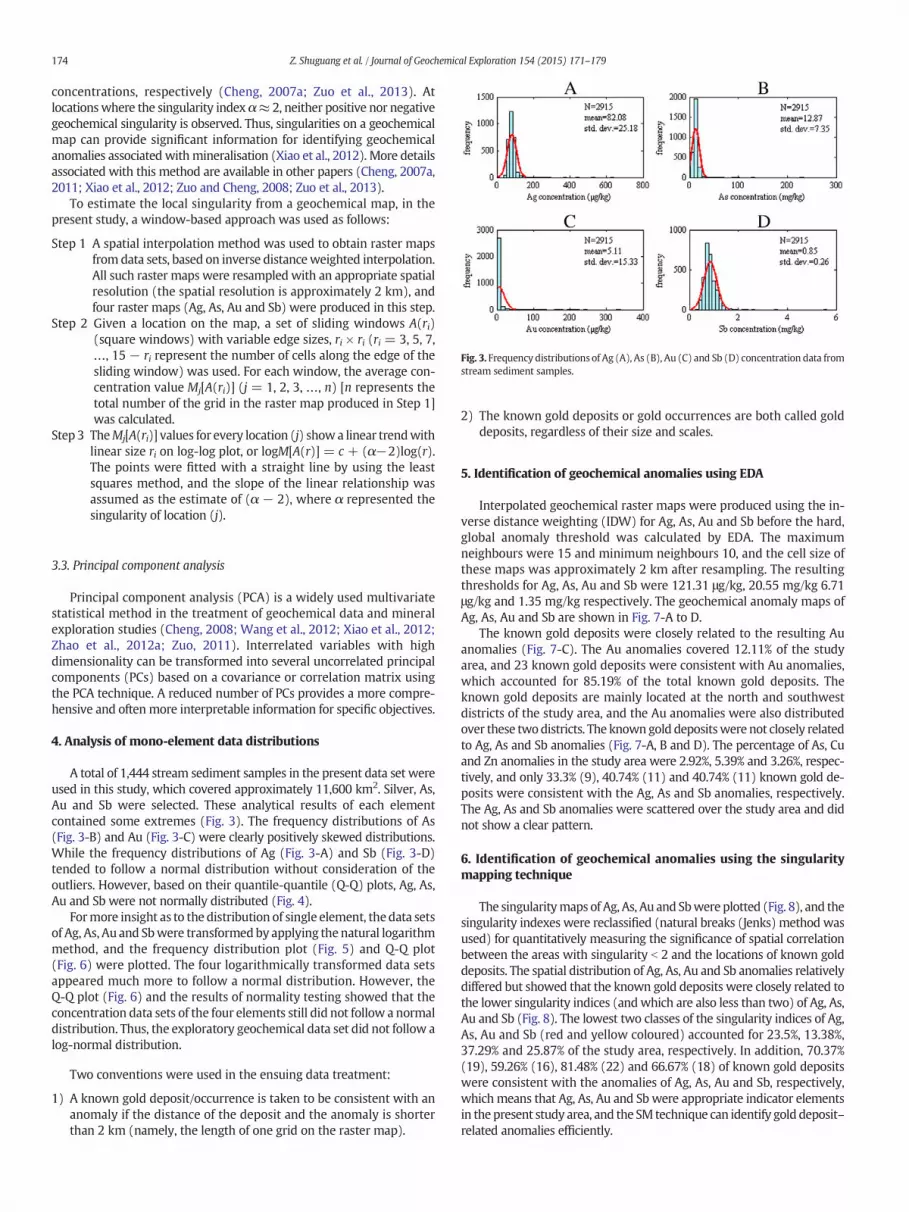
Fig. 3. Frequency distributions of Ag (A), As (B), Au (C) and Sb (D) concentration data fromstream sediment samples.
174 Z. Shuguang et al. / Journal of Geochemical Exploration 154 (2015) 171–179
concentrations, respectively (Cheng, 2007a; Zuo et al., 2013). Atlocationswhere the singularity index α≈ 2, neither positive nor negativegeochemical singularity is observed. Thus, singularities on a geochemicalmap can provide significant information for identifying geochemicalanomalies associated withmineralisation (Xiao et al., 2012). More detailsassociated with this method are available in other papers (Cheng, 2007a,2011; Xiao et al., 2012; Zuo and Cheng, 2008; Zuo et al., 2013).
To estimate the local singularity from a geochemical map, in thepresent study, a window-based approach was used as follows:
Step 1 A spatial interpolation method was used to obtain raster mapsfromdata sets, based on inverse distanceweighted interpolation.All such raster maps were resampled with an appropriate spatialresolution (the spatial resolution is approximately 2 km), andfour raster maps (Ag, As, Au and Sb) were produced in this step.
Step 2 Given a location on the map, a set of sliding windows A(ri)(square windows) with variable edge sizes, ri × ri (ri = 3, 5, 7,…, 15 − ri represent the number of cells along the edge of thesliding window) was used. For each window, the average con-centration value Mj[A(ri)] (j = 1, 2, 3, …, n) [n represents thetotal number of the grid in the raster map produced in Step 1]was calculated.
Step 3 TheMj[A(ri)] values for every location (j) showa linear trendwithlinear size ri on log-log plot, or logM[A(r)] = c + (α−2)log(r).The points were fitted with a straight line by using the leastsquares method, and the slope of the linear relationship wasassumed as the estimate of (α − 2), where α represented thesingularity of location (j).
3.3. Principal component analysis
Principal component analysis (PCA) is a widely used multivariatestatistical method in the treatment of geochemical data and mineralexploration studies (Cheng, 2008; Wang et al., 2012; Xiao et al., 2012;Zhao et al., 2012a; Zuo, 2011). Interrelated variables with highdimensionality can be transformed into several uncorrelated principalcomponents (PCs) based on a covariance or correlation matrix usingthe PCA technique. A reduced number of PCs provides a more compre-hensive and oftenmore interpretable information for specific objectives.
4. Analysis of mono-element data distributions
A total of 1,444 stream sediment samples in the present data set wereused in this study, which covered approximately 11,600 km2. Silver, As,Au and Sb were selected. These analytical results of each elementcontained some extremes (Fig. 3). The frequency distributions of As(Fig. 3-B) and Au (Fig. 3-C) were clearly positively skewed distributions.While the frequency distributions of Ag (Fig. 3-A) and Sb (Fig. 3-D)tended to follow a normal distribution without consideration of theoutliers. However, based on their quantile-quantile (Q-Q) plots, Ag, As,Au and Sb were not normally distributed (Fig. 4).
Formore insight as to the distribution of single element, thedata setsof Ag, As, Au and Sbwere transformedby applying the natural logarithmmethod, and the frequency distribution plot (Fig. 5) and Q-Q plot(Fig. 6) were plotted. The four logarithmically transformed data setsappeared much more to follow a normal distribution. However, theQ-Q plot (Fig. 6) and the results of normality testing showed that theconcentration data sets of the four elements still did not follow a normaldistribution. Thus, the exploratory geochemical data set did not follow alog-normal distribution.
Two conventions were used in the ensuing data treatment:
1) A known gold deposit/occurrence is taken to be consistent with ananomaly if the distance of the deposit and the anomaly is shorterthan 2 km (namely, the length of one grid on the raster map).
2) The known gold deposits or gold occurrences are both called golddeposits, regardless of their size and scales.
5. Identification of geochemical anomalies using EDA
Interpolated geochemical raster maps were produced using the in-verse distance weighting (IDW) for Ag, As, Au and Sb before the hard,global anomaly threshold was calculated by EDA. The maximumneighbours were 15 and minimum neighbours 10, and the cell size ofthese maps was approximately 2 km after resampling. The resultingthresholds for Ag, As, Au and Sb were 121.31 μg/kg, 20.55 mg/kg 6.71μg/kg and 1.35 mg/kg respectively. The geochemical anomaly maps ofAg, As, Au and Sb are shown in Fig. 7-A to D.
The known gold deposits were closely related to the resulting Auanomalies (Fig. 7-C). The Au anomalies covered 12.11% of the studyarea, and 23 known gold deposits were consistent with Au anomalies,which accounted for 85.19% of the total known gold deposits. Theknown gold deposits are mainly located at the north and southwestdistricts of the study area, and the Au anomalies were also distributedover these twodistricts. The knowngold depositswere not closely relatedto Ag, As and Sb anomalies (Fig. 7-A, B and D). The percentage of As, Cuand Zn anomalies in the study area were 2.92%, 5.39% and 3.26%, respec-tively, and only 33.3% (9), 40.74% (11) and 40.74% (11) known gold de-posits were consistent with the Ag, As and Sb anomalies, respectively.The Ag, As and Sb anomalies were scattered over the study area and didnot show a clear pattern.
6. Identification of geochemical anomalies using the singularitymapping technique
The singularitymaps of Ag, As, Au and Sbwere plotted (Fig. 8), and thesingularity indexes were reclassified (natural breaks (Jenks) method wasused) for quantitatively measuring the significance of spatial correlationbetween the areas with singularity b 2 and the locations of known golddeposits. The spatial distribution of Ag, As, Au and Sb anomalies relativelydiffered but showed that the known gold deposits were closely related tothe lower singularity indices (andwhich are also less than two) of Ag, As,Au and Sb (Fig. 8). The lowest two classes of the singularity indices of Ag,As, Au and Sb (red and yellow coloured) accounted for 23.5%, 13.38%,37.29% and 25.87% of the study area, respectively. In addition, 70.37%(19), 59.26% (16), 81.48% (22) and 66.67% (18) of known gold depositswere consistent with the anomalies of Ag, As, Au and Sb, respectively,whichmeans that Ag, As, Au and Sb were appropriate indicator elementsin the present study area, and the SM technique can identify gold deposit–related anomalies efficiently.

Fig. 4. Q-Q plots for the Ag (A), As (B), Au (C) and Sb (D) concentration data from streamsediment samples. Fig. 6.Q-Qplots for the lnAg (A), lnAs (B), ln Au (C) and ln Sb (D) concentration data from
stream sediment samples.
175Z. Shuguang et al. / Journal of Geochemical Exploration 154 (2015) 171–179
To reduce the uncertainty of a single element, and to obtain amore re-liable results, PCA was used to delineate the comprehensive anomalousareas with the combined elements Ag, As, Au and Sb. Ordinary PCA usesa linear correlation matrix. A scree plot (Fig. 9a) shows the distributionof eigenvalues representing the relative importance of each component.The first principal component (PC1) accounted for 40.7% of the total var-iancewhile PC2, PC3 and PC4modelled additional 23.1%, 21.0% and 15.2%of total variance, respectively. Positive loadings (Fig. 9b) indicated thatPC1 mainly reflected the singular association of Ag, As, Au and Sb. Com-pared with the singularity maps of individual ore-forming elements,areas with the lower PC1 scores had stronger coincidence with knownmineral occurrences (Fig. 10).
Furthermore, a noticeable spatial correlation exists between graniterocks, altered zones and fault traces with low PC1 scores, implying thatthese geological variables played an important role in the formation ofknown hydrothermal mineral deposits (Fig. 10; i.e., granite rocks maybe the sources of energy and hydrothermal fluids, regional faults confinemagmatic activities to certain scales and ranges, hydrothermal fluids per-meate rocks through local faults, metasomatism andmineralisation occurwithin fault zones).
7. Results and discussion
Conventional statistical techniques that assume a data set followsnormal or log-normal distribution may, therefore, not be suitable forgeochemical data analysis, as the geochemical data sets in this study
Fig. 5. Frequency distributions of ln Ag (A), ln As (B), ln Au (C) and ln Sb (D) concentrationdata from stream sediment samples.
follow neither a normal nor a log-normal distributions, as shown inSection 3.
Neither EDA nor the SM technique requires that the data set followsnormal or log-normal distributions, and these two techniques were com-pared in detail in this study. The anomaly threshold definition is not seri-ously affected by outliers when EDA is applied, provided a robustapproach is used, for example, MMDA. The EDA techniques have provento be quite effective (Bounessah and Atkin, 2003) in the statistical treat-ment of single element stream sediment analytical results in areaswhere the data variability may be expected to be affected by lithological,sampling, analytical, climatic and physiographical factors. Using medianand median absolute deviation instead of mean and the standarddeviation, respectively, may be preferable when working with complexgeochemical data (Templ et al., 2008). However, EDA is not suitablefor identifying geochemical anomalies in the present study for thefollowing reasons: (1) the present thresholds for Ag, As and Sb are allvery high and only few anomalies exist on the corresponding map(Fig. 7-A, B, D). Although the known gold deposits are consistent withAu anomalies, the results may be unreliable because only few Au anoma-lies exist outside the areas of known gold deposits. Thus, the Aumap pro-vides only limited information for further mineral exploration; and(2) only one global threshold is obtained for each variable using EDA,which is not suitable for mineral exploration target prediction becausethis global level tends to overlook significantly weak anomalies, whichmainly, or only, express themselves locally. These are effectively‘swamped’ by a singular, high threshold levels. Such cases are obvious instudy areas with complex geological backgrounds.
With the SM technique, singularity indices are used to identify anom-alies. These indiceswill differwithin the total spatial study area because ofthe sliding window approach. This has the effect that the SM techniquedoes not overlook such local-scale weak anomalies, making it suitablefor identifying geochemical anomalies. The results of this study showthat PCA can be used to analyse the SM results of Ag, As, Au and Sb, andto obtain a more comprehensive and hopefully more meaningful end re-sult. In this study, these results are exceedingly interpretable, when com-paredwith the geologicalmap of the study area. In some districts (Fig. 10;R1 and R2), the comprehensive geochemical anomalies are obvious, al-though no gold deposits have been found in those districts yet. R1 andR2 may thus be valuable potential districts for mineral exploration be-cause telltale granite rocks, alteration zones and faults are indeed present.
8. Conclusions
1) The regional stream sediment geochemical data sets in this studyneither follow a normal nor a log-normal distribution. EDA was not

Fig. 7. Anomaly maps of Ag (A), As (B), Au (C) and Sb (D) generated from the EDA data treatment.
176Z.Shuguang
etal./JournalofGeochem
icalExploration154
(2015)171
–179

Fig. 8. Anomaly maps of Ag (A), As (B), Au (C) and Sb (D) generated by the singularity mapping technique.
177Z.Shuguang
etal./JournalofGeochem
icalExploration154
(2015)171
–179

Fig. 9. PCA results on the geochemical data set. The geochemical data were processedusing the local singularity analysis. Details are given in the text. (a) Scree plot of eigen-values of principal components (PC1–PC4) of singularity indices of ore-forming elements;(b) loadings on the first component (PC1).
178 Z. Shuguang et al. / Journal of Geochemical Exploration 154 (2015) 171–179
found suitable for identifying feasible anomalies in this studybecause it did not produce a clear, geologically interpretablegeochemical anomaly pattern. By contrast, the SM technique wasfound exceptionally suitable for identifying geochemical anomalies,and when integrated with PCA, was shown to indeed be a powerfultool for identifying relevant anomalies in the Karamay geochemicaldata sets.
Fig. 10. Raster map showing the scores of samp
2) Silver, As, Au and Sb are appropriate indicator elements in thepresent study area, and in some parts (districts R1 and R2 inFig. 10) where geochemical anomalies, rather than gold depositsare present, are identified using SM technique. Theymay be valuablefor mineral exploration because of the merits of SM techniques, andgeologically speaking, the identified comprehensive geochemicalanomalies are explainable.
Acknowledgments
The author thanks Prof. Tom Kellie, Prof. Zuo Renguang, Dr. QiaoQingqing and Feng Qianwen and two anonymous reviewers of theJournal of Geochemical Exploration for constructive comments andsuggestions. This research benefited from the support of the Fundedprojects for the western Dr. (XBBS201107), National Natural ScienceFoundation of China (U1129302), The National Key Technology R&DProgramme (2011BAB06B08-01), Science-Technology Infrastructureconstruction projects of Xinjiang Science and Technology Agency(PT1217), Science-Technology Foundation for Young Scientist ofXinjiang Science and Technology Agency (2011211B48).
Appendix A. Supplementary data
Supplementary data associated with this article can be found in theonline version, at http://dx.doi.org/10.1016/j.gexplo.2014.12.007.These data include the Google map of the most important areasdescribed in this article.
References
Ali, K., Cheng, Q., Chen, Z., 2007. Multifractal power spectrum and singularity analysis formodelling stream sediment geochemical distribution patterns to identify anomaliesrelated to gold mineralization in Yunnan Province, South China. Geochem. Explor.Environ. Anal. 7, 293–301.
Bai, J., Porwal, A., Hart, C., Ford, A., Yu, L., 2010. Mapping geochemical singularity usingmultifractal analysis: application to anomaly definition on stream sediments datafrom Funin Sheet, Yunnan, China. J. Geochem. Explor. 104, 1–11.
Bounessah, M., Atkin, B.P., 2003. An application of exploratory data analysis (EDA) as arobust non-parametric technique for geochernical mapping in a semi-arid climate.Appl. Geochem. 18, 1185–1195.
Chen, Z., Cheng, Q., Chen, J., Xie, S., 2007. A novel iterative approach for mapping localsingularities from geochemical data. Nonlinear Process. Geophys. 14, 317–324.
les on the first principal component (PC1).

179Z. Shuguang et al. / Journal of Geochemical Exploration 154 (2015) 171–179
Cheng, Q., 1999. Multifractality and spatial statistics. Comput. Geosci. 25, 949–961.Cheng, Q., 2000. Integrated spatial and spectrum method for geochemical anomaly
separation. Nat. Resour. Res. 9, 43–51.Cheng, Q., 2007a. Mapping singularities with stream sediment geochemical data for
prediction of undiscovered mineral deposits in Gejiu, Yunnan Province, China. OreGeol. Rev. 32, 314–324.
Cheng, Q., 2007b. Singular mineralization processes and mineral resources quantitativeprediction: new theories and methods. Earth Sci. Front. 14, 042–053 (In Chinesewith English abstract).
Cheng, Q., 2008. Non-linear theory and power-law models for information integrationand mineral resources quantitative assessments. Math. Geosci. 40, 503–532.
Cheng, Q., 2011. Singularity modeling of Geo-anomaly and recognition of anomaliescaused by buried sources. Earth Sci. J. China Univ. Geosci. 36, 307–316 (In Chinesewith English abstract).
Cheng, Q., 2012. Singularity theory and methods for mapping geochemical anomaliescaused by buried sources and for predicting undiscovered mineral deposits incovered areas. J. Geochem. Explor. 122, 55–70.
Cheng, Q., Agterberg, F.P., 2009. Singularity analysis of ore-mineral and toxic traceelements in stream sediments. Comput. Geosci. 35, 234–244.
Cheng, Q., Agterberg, F.P., Ballantyne, S.B., 1994. The separation of geochemical anomaliesfrom background by fractal methods. J. Geochem. Explor. 51, 109–130.
Cheng, H., Shen, X., Yan, G., Gu, T., Lai, Z., Xie, X., 1997. Wide-spaced floodplain sedimentsampling covering the whole of China: pilot survey for international geochemicalmapping. In: Xie, X. (Ed.), Proceedings of the 30th International Geological Congress.Geochemistry 19, pp. 89–109.
Cheng, Q., Chen, Z., Ali, K., 2007. Application of fuzzy weights of evidence method in min-eral resource assessment for gold in Zhenyuan District, Yunnan Province, China. EarthSci. J. China Univ. Geosci. 32, 175–184 (In Chinese with English abstract).
Cheng, Q., Li, L., Wang, L., 2009. Characterization of peak flow events with local singularitymethod. Nonlinear Process. Geophys. 16, 503–513.
Cheng, Q., Xia, Q., Li, W., Zhang, S., Chen, Z., Zuo, R., Wang, W., 2010. Density/area power-law models for separating multi-scale anomalies of ore and toxic elements in streamsediments in Gejiu mineral district, Yunnan Province, China. Biogeosciences 7,3019–3025.
Chipres, J.A., Castro-Larragoitia, J., Monroy, M.G., 2009. Exploratory and spatial dataanalysis (EDA-SDA) for determining regional background levels and anomalies ofpotentially toxic elements in soils from Catorce-Matehuala, Mexico. Appl. Geochem.24, 1579–1589.
Jin, J., Chen, J., 2011. A self-adaptive method of contrast filtering for extracting geochem-ical anomaly. Geophys. Geochem. Explor. 35, 526–531 (In Chinese with Englishabstract).
Kürzl, H., 1988. Exploratory data analysis: recent advances for the interpretation ofgeochemical data. J. Geochem. Explor. 30 (3), 309–322.
Li, C., Ma, T., Shi, J., 2003. Application of a fractal method relating concentrations and dis-tances for separation of geochemical anomalies from background. J. Geochem. Explor.77, 167–175.
Liu, X., Wang, X., Caritat, de, P., Salminen, R., 2015. Comparison of data sets obtained byglobal-scale geochemical sampling in Australia, China and Europe. In: Demetriades,A., Birke, M., Albanese, S., Schoeters, I., De Vivo, B. (Eds.), Continental, regional andlocal scale geochemical mapping, special issue. Journal of Geochemical Exploration154, pp. 6–16 (in this issue).
Reimann, C., Filzmoser, P., 2000. Normal and lognormal data distribution in geochemistry:death of a myth. Consequences for the statistical treatment of geochemical and envi-ronmental data. Environ. Geol. 39, 1001–1014.
Reimann, C., Garrett, R.G., 2005. Geochemical background—concept and reality. Sci. TotalEnviron. 350, 12–27.
Reimann, C., Filzmoser, P., Garrett, R.G., 2005. Background and threshold: criticalcomparison of methods of determination. Sci. Total Environ. 346, 1–16.
Shi, C., Zhang, J., Huang, X., 1999. Subregion median contrast filtering method andrecognition of wake anomalies. Geophys. Geochem. Explor. 23, 250–257 (In Chinesewith English abstract).
Su, Y., Tang, H., Hou, G., Liu, C., 2006. Geochemistry of aluminous A-type granites alongDarabut teconic belt in west Junggar, Xinjiang. Geochimica 35, 55–67 (In Chinesewith English abstract).
Sun, X., Gong, Q., Wang, Q., Yang, L., Wang, C., Wang, Z., 2010. Application of local singu-larity model to delineate geochemical anomalies in Xiong'ershan gold and molybde-num ore district, Western Henan province, China. J. Geochem. Explor. 107, 21–29.
Templ, M., Filzmoser, P., Reimann, C., 2008. Cluster analysis applied to regional geochemicaldata: problems and possibilities. Appl. Geochem. 23, 2198–2213.
Tukey, J.W., 1977. Exploratory Data Analysis. Addison-Wesley, Reading (688 pp.).Wang, X., Xie, X., Zhang, B., Hou, Q., 2011. Geochemical probe into China's continental
crust. Acta Geosci. Sin. 32, 65–83 (In Chinese with English abstract).Wang, W., Zhao, J., Cheng, Q., Liu, J., 2012. Tectonic-geochemical exploration modeling for
characterizing geo-anomalies in southeastern Yunnan district, China. J. Geochem.Explor. 122, 71–80.
Wang, W., Zhao, J., Cheng, Q., 2013a. Application of singularity index mapping techniqueto gravity/magnetic data analysis in southeastern Yunnan mineral district, China.J. Appl. Geophys. 92, 39–49.
Wang, W., Zhao, J., Cheng, Q., 2013b. Fault trace-oriented singularity mapping techniqueto characterize anisotropic geochemical signatures in Gejiu mineral district, China.J. Geochem. Explor. 134, 27–37.
Xiao, F., Chen, J., Zhang, Z., Wang, C., Wu, G., Agterberg, F.P., 2012. Singularity mappingand spatially weighted principal component analysis to identify geochemical anom-alies associated with Ag and Pb-Zn polymetallic mineralization in NorthwestZhejiang, China. J. Geochem. Explor. 122, 90–100.
Xie, X., Shen, X., Cheng, H., Yan, G., Gu, T., Lai, Z., Du, P., Yan, M., Lu, Y., Ren, T., 1996.Environmental geochemistry monitoring network and dynamic geochemistry mapsin China. Institute of Geophysical and Geochemical Exploration. Research Report (inChinese, unpublished).
Xie, X., Mu, X., Ren, T., 1997. Geochemical mapping in China. J. Geochem. Explor. 60,99–113.
Xie, S., Cheng, Q., Ke, X., Bao, Z., Wang, C., Quan, H., 2008a. Identification of geochemicalanomaly by multifractal analysis. J. China Univ. Geosci. 334–342.
Xie, X., Wang, X., Zhang, Q., Zhou, G., Cheng, H., Liu, D., Cheng, Z., Xu, S., 2008b. Multi-scalegeochemical mapping in China. Geochem. Explor. Environ. Anal. 8, 333–341.
Zhang, F., 2003. The study of geological characteristics of the gold associatedminerals andgold vine of Hatu gold deposit. J. Xinjiang Nonferrous Met. 5-6 (In Chinese withEnglish abstract).
Zhang, C., Huang, X., 1992. The ages and tectonic settings of ophiolites in West Junggar.Xinjiang Geol. Rev. 38, 509–524 (In Chinese with English abstract).
Zhao, J., Wang,W., Dong, L., Yang,W., Cheng, Q., 2012a. Application of geochemical anom-aly identification methods in mapping of intermediate and felsic igneous rocks ineastern Tianshan, China. J. Geochem. Explor. 122, 81–89.
Zhao, N., Fu, J., Zhang, C., Liu, H., 2012b. Application of subinterval area median contrastfiltering method in the recognizing of geochemical anomalies. World Nucl. Geosci.29, 47–51 (In Chinese with English abstract).
Zhu, Y., An, F., Xu, C., Guo, H., Xia, F., Xiao, F., Zhang, F., Lin, C., Qiu, T.,Wei, S., 2013. Geologyand Au-Cu Deposits in the Hatu and its Adjacent Region (Xinjiang): Evolution andProspecting Model. Geological Publishing House, Beijing (In Chinese with Englishabstract).
Zuo, R., 2011. Identifying geochemical anomalies associated with Cu and Pb–Zn skarnmineralization using principal component analysis and spectrum–area fractalmodeling in the Gangdese Belt, Tibet (China). J. Geochem. Explor. 111, 13–22.
Zuo, R., Cheng, Q., 2008. Mapping singularities—a technique to identify potential Cumineral deposits using sediment geochemical data, an example for Tibet, westChina. Mineral. Mag. 72, 531–534.
Zuo, R., Cheng, Q., Agterberg, F.P., Xia, Q., 2009. Application of singularity mappingtechnique to identify local anomalies using stream sediment geochemical data, acase study from Gangdese, Tibet, western China. J. Geochem. Explor. 101, 225–235.
Zuo, R., Cheng, Q., Carranza, E.J.M., 2012. Fractal/multifractal modelling of geochemicalexploration data. J. Geochem. Explor. 122, 1–3.
Zuo, R., Xia, Q., Zhang, D., 2013. A comparison study of the C-A and S-A models with sin-gularity analysis to identify geochemical anomalies in covered areas. Appl. Geochem.33, 165–172.
Zuo, R., Wang, J., Chen, G., Yang, M., 2015. Identification of weak anomalies: amultifractalperspective. In: Demetriades, A., Birke, M., Albanese, S., Schoeters, I., De Vivo, B. (Eds.),Continental, regional and local scale geochemical mapping, special issue. Journal ofGeochemical Exploration 154, pp. 200–212 (in this issue).


![Kurzweil, Ray - Singularity Is Near, The (hardback ed) [v1.3].pdf](https://img.pdfslide.net/doc/110x75/6325e751e491bcb36c0a872b/kurzweil-ray-singularity-is-near-the-hardback-ed-v13pdf.jpg)


