Embed Size (px)
Citation preview
157
Exploring Urban Space Volumetric Site Analysis for ConceptualDesign in the Urban ContextMichele Leidi and Arno Schlüter
issue 2, volume 11international journal of architectural computing
158
Exploring Urban Space Volumetric Site Analysis for Conceptual Design in theUrban ContextMichele Leidi and Arno Schlüter
This paper proposes a set of new analytic andvisualization methods for conceptual design in theurban context.The methodology is based on thediscretization of the urban site into a volumetric grid ofpoints. For each of these points, different physicalproperties such as solar radiation, airflow, and visibilityare computed. Subsequently interactive visualizationtechniques allow the observation of the site at avolumetric, directional and dynamic level, making visibleinformation that is typically invisible. Several case-studies demonstrate how this allows to generatesuggestions, for example, for the definition of the formof a building or for the rationalization of its surfaces.This approach aims at developing a conceptual designprocess that allows the fusion of active technologies,passive methods, and expressive aspects, in cohesiveconcepts able to embrace and exploit the diversities ofan urban site.
159Exploring Urban Space Volumetric Site Analysis for Conceptual Design in the Urban Context
1. INTRODUCTION
Before reading this paper it is recommended to view the related videoavailable online [1].
1.1. State of the art
In recent years a broad range of simulation tools have been developed toassist architects in evaluating solar radiation and thermal performanceduring the design phase [2] [3] [4]. Despite their increasing sophistication,these tools only allow architects to estimate the performance of an existingbuilding design, which can then possibly be ameliorated through an iterativeprocess as shown in Figure 1. Current efforts in research aim at developingstrategies to identify optimal design parameters through the automation ofperformance-based generative design processes.These design studies treatfor example the integration of photovoltaic technologies [5] [6], the balancebetween the minimization of heat losses and the maximization of solar gains[7] [8] [9], passive solar strategies for large buildings [10], daylightingquestions [11], or the growth of architectural forms according to energyharvesting objectives [12].
Other recent works are based on studies of comparative analysis tryingto clarify the relationship between architectural form and solar energy in aglobal context [13] or the role of urban forms, in dense sites, related today-lighting and solar potentials[14] [16].
Analyzing these research works we can observe that, in reality,generative processes that are supposed to be able to generate new designsolutions are highly constrained by their own definitions (i.e. starting design-schemes) and act only within the boundaries in which they have beendefined.This situation often ends with a conceptual entrapment thatresembles the chicken and the egg problem: the design of a building isnecessary to run a simulation, and in turn, the aim is to use the simulationresults to generate the building design [11]. Similarly, the generalizationsextracted from the analytic studies are only able to judge existing cases andthus not capable to propose inventive solutions.Additionally, most of theavailable tools and approaches focus on analysis rather than synthesis, andare limited to the calculation of values or performance indices. It is, thus,often unclear how the results of the analysis can help to generate newsolutions and be really beneficial for innovation in sustainable architecturaldesign.
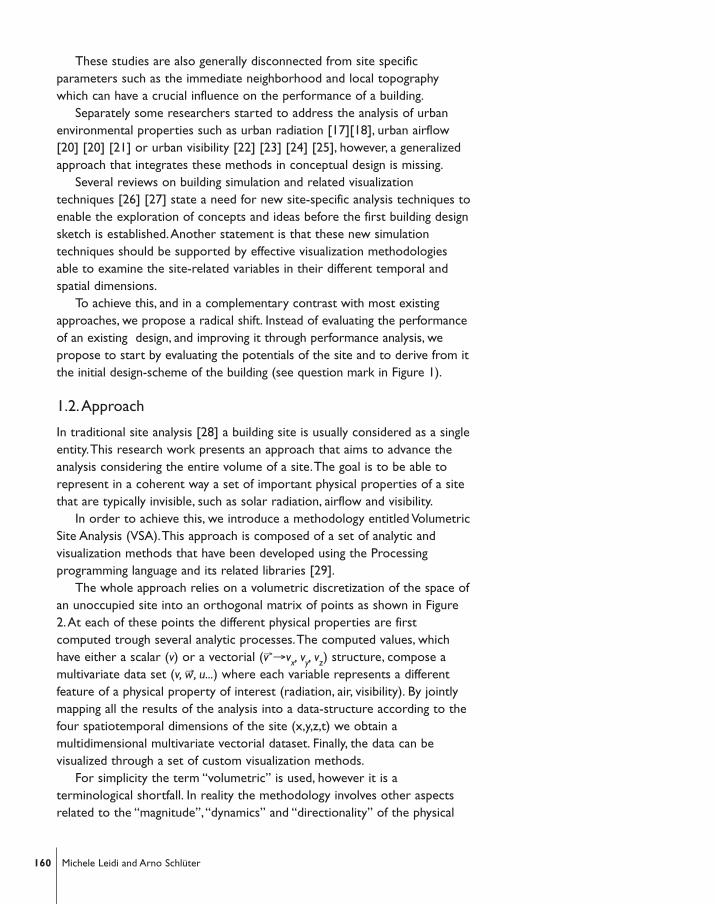
� Figure 1: Performance-based design
process
These studies are also generally disconnected from site specificparameters such as the immediate neighborhood and local topographywhich can have a crucial influence on the performance of a building.
Separately some researchers started to address the analysis of urbanenvironmental properties such as urban radiation [17][18], urban airflow[20] [20] [21] or urban visibility [22] [23] [24] [25], however, a generalizedapproach that integrates these methods in conceptual design is missing.
Several reviews on building simulation and related visualizationtechniques [26] [27] state a need for new site-specific analysis techniques toenable the exploration of concepts and ideas before the first building designsketch is established.Another statement is that these new simulationtechniques should be supported by effective visualization methodologiesable to examine the site-related variables in their different temporal andspatial dimensions.
To achieve this, and in a complementary contrast with most existingapproaches, we propose a radical shift. Instead of evaluating the performanceof an existing design, and improving it through performance analysis, wepropose to start by evaluating the potentials of the site and to derive from itthe initial design-scheme of the building (see question mark in Figure 1).
1.2.Approach
In traditional site analysis [28] a building site is usually considered as a singleentity.This research work presents an approach that aims to advance theanalysis considering the entire volume of a site.The goal is to be able torepresent in a coherent way a set of important physical properties of a sitethat are typically invisible, such as solar radiation, airflow and visibility.
In order to achieve this, we introduce a methodology entitled VolumetricSite Analysis (VSA).This approach is composed of a set of analytic andvisualization methods that have been developed using the Processingprogramming language and its related libraries [29].
The whole approach relies on a volumetric discretization of the space ofan unoccupied site into an orthogonal matrix of points as shown in Figure2.At each of these points the different physical properties are firstcomputed trough several analytic processes.The computed values, whichhave either a scalar (v) or a vectorial (v→→vx, vy, vz) structure, compose amultivariate data set (v, w→, u...) where each variable represents a differentfeature of a physical property of interest (radiation, air, visibility). By jointlymapping all the results of the analysis into a data-structure according to thefour spatiotemporal dimensions of the site (x,y,z,t) we obtain amultidimensional multivariate vectorial dataset. Finally, the data can bevisualized through a set of custom visualization methods.
For simplicity the term “volumetric” is used, however it is aterminological shortfall. In reality the methodology involves other aspectsrelated to the “magnitude”,“dynamics” and “directionality” of the physical
160 Michele Leidi and Arno Schlüter
properties, but the volumetric aspect remains its foundation and mainspecificity.
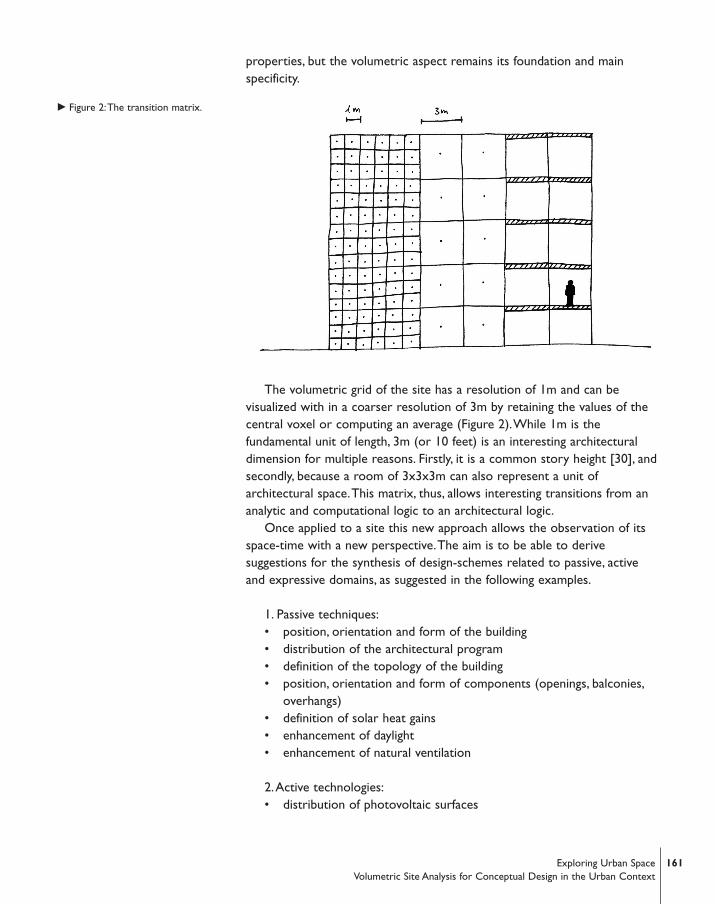
The volumetric grid of the site has a resolution of 1m and can bevisualized with in a coarser resolution of 3m by retaining the values of thecentral voxel or computing an average (Figure 2).While 1m is thefundamental unit of length, 3m (or 10 feet) is an interesting architecturaldimension for multiple reasons. Firstly, it is a common story height [30], andsecondly, because a room of 3x3x3m can also represent a unit ofarchitectural space.This matrix, thus, allows interesting transitions from ananalytic and computational logic to an architectural logic.
Once applied to a site this new approach allows the observation of itsspace-time with a new perspective.The aim is to be able to derivesuggestions for the synthesis of design-schemes related to passive, activeand expressive domains, as suggested in the following examples.
1. Passive techniques:• position, orientation and form of the building• distribution of the architectural program• definition of the topology of the building• position, orientation and form of components (openings, balconies,
overhangs)• definition of solar heat gains• enhancement of daylight• enhancement of natural ventilation
2.Active technologies:• distribution of photovoltaic surfaces
� Figure 2:The transition matrix.
161Exploring Urban Space Volumetric Site Analysis for Conceptual Design in the Urban Context
• distribution of thermal collection surfaces• distribution of small wind turbines• distribution of inlets and outlets of mechanical ventilation
3. Expressive aspects:• articulation of the site identity by reflecting the diversities that are
present in its volume• fusion of the functional implementations into an overall cohesive
concept• addition of a semantic layer that supports the meaning of the whole
concept
1.3. Demonstration site
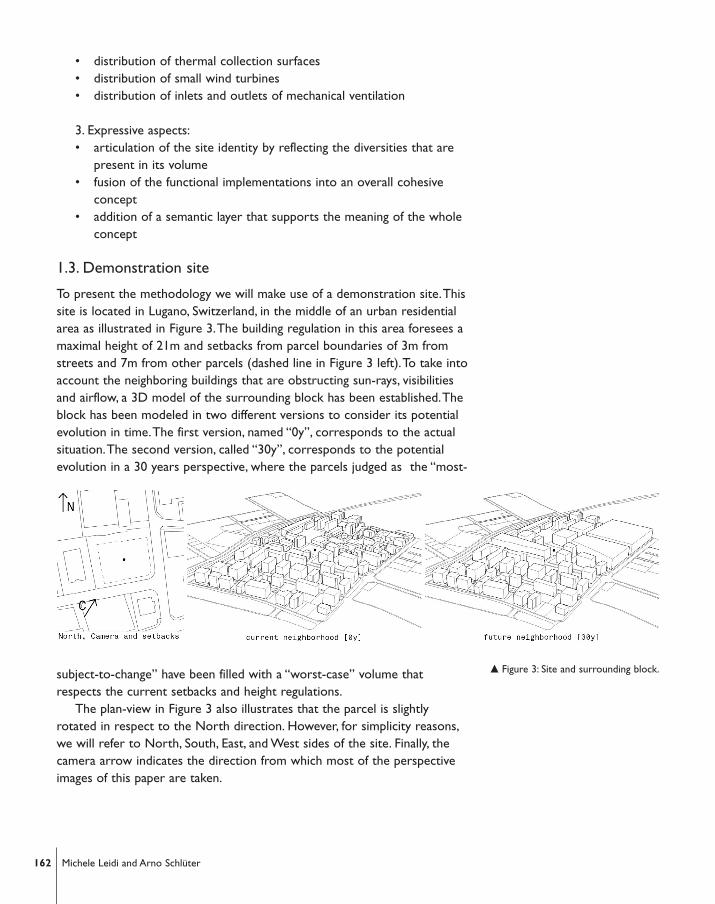
To present the methodology we will make use of a demonstration site.Thissite is located in Lugano, Switzerland, in the middle of an urban residentialarea as illustrated in Figure 3.The building regulation in this area foresees amaximal height of 21m and setbacks from parcel boundaries of 3m fromstreets and 7m from other parcels (dashed line in Figure 3 left).To take intoaccount the neighboring buildings that are obstructing sun-rays, visibilitiesand airflow, a 3D model of the surrounding block has been established.Theblock has been modeled in two different versions to consider its potentialevolution in time.The first version, named “0y”, corresponds to the actualsituation.The second version, called “30y”, corresponds to the potentialevolution in a 30 years perspective, where the parcels judged as the “most-
subject-to-change” have been filled with a “worst-case” volume thatrespects the current setbacks and height regulations.
The plan-view in Figure 3 also illustrates that the parcel is slightlyrotated in respect to the North direction. However, for simplicity reasons,we will refer to North, South, East, and West sides of the site. Finally, thecamera arrow indicates the direction from which most of the perspectiveimages of this paper are taken.
162 Michele Leidi and Arno Schlüter
� Figure 3: Site and surrounding block.
2.ANALYSIS METHODS
2.1.Volumetric Insolation Analysis (VIA)
A new methodology, entitled Volumetric Insolation Analysis (VIA), has beendeveloped to allow the quantification of the relative distribution of directsolar radiation in urban contexts. Insolation (solar radiation energy) istraditionally computed for surfaces.VIA expands this concept to theunoccupied volume of an urban site.
The principle of VIA consists of tracing, for each of the volume points, aset of rays in the direction of the sun, and verifying if the rays areobstructed by an obstacle. If the rays reach the point without obstructionthe insolation values are added to the point. Ray direction is also taken inconsideration so that, after the complete analysis process, the result alsocontains directional information.
As far as known by the authors this is the first methodology that allowsthe generation of volumetric, dynamic and directional information related todirect solar radiation in urban sites.The details on this methodology aredescribed in a dedicated conference paper [31].
2.2.Volumetric Visibility Analysis (VVA)
Several approaches to quantify measurable features of relative visibility in anurban site are currently under development by the research community[22] [23] [24] [25]. Each of these has different abilities and constraints. Inorder to obtain the desired information, and to integrate it seamlessly inthis research framework, a simplified custom methodology, entitledVolumetric Visibility Analysis (VVA), has been developed. Geometricallyspeaking visibility is simple to define. Given a set of obstacles in space, twopoints are said to be visible to each other if the line segment that joinsthem (line-of-sight) does not intersect any obstacles. Based on this principlea set of different analytic visibility measures have been developed andcompared.
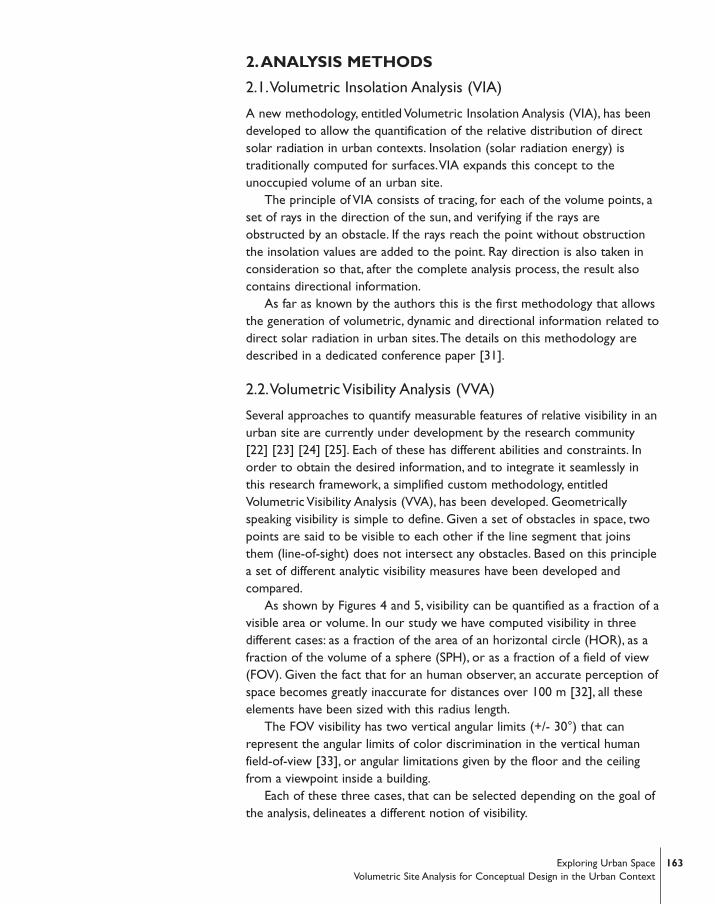
As shown by Figures 4 and 5, visibility can be quantified as a fraction of avisible area or volume. In our study we have computed visibility in threedifferent cases: as a fraction of the area of an horizontal circle (HOR), as afraction of the volume of a sphere (SPH), or as a fraction of a field of view(FOV). Given the fact that for an human observer, an accurate perception ofspace becomes greatly inaccurate for distances over 100 m [32], all theseelements have been sized with this radius length.
The FOV visibility has two vertical angular limits (+/- 30°) that canrepresent the angular limits of color discrimination in the vertical humanfield-of-view [33], or angular limitations given by the floor and the ceilingfrom a viewpoint inside a building.
Each of these three cases, that can be selected depending on the goal ofthe analysis, delineates a different notion of visibility.
163Exploring Urban Space Volumetric Site Analysis for Conceptual Design in the Urban Context
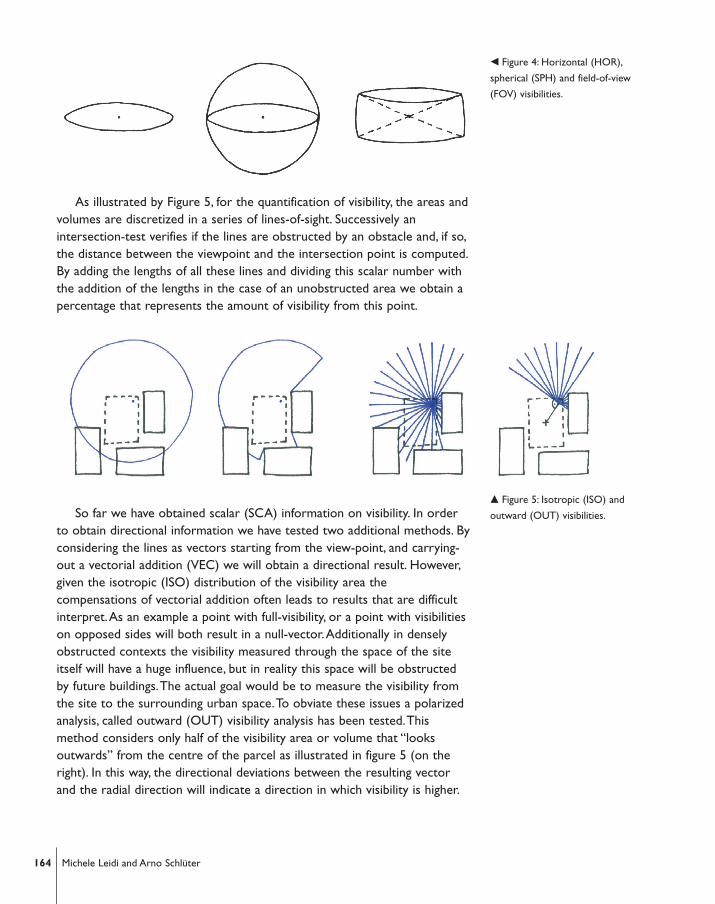
As illustrated by Figure 5, for the quantification of visibility, the areas andvolumes are discretized in a series of lines-of-sight. Successively anintersection-test verifies if the lines are obstructed by an obstacle and, if so,the distance between the viewpoint and the intersection point is computed.By adding the lengths of all these lines and dividing this scalar number withthe addition of the lengths in the case of an unobstructed area we obtain apercentage that represents the amount of visibility from this point.
So far we have obtained scalar (SCA) information on visibility. In orderto obtain directional information we have tested two additional methods. Byconsidering the lines as vectors starting from the view-point, and carrying-out a vectorial addition (VEC) we will obtain a directional result. However,given the isotropic (ISO) distribution of the visibility area thecompensations of vectorial addition often leads to results that are difficultinterpret.As an example a point with full-visibility, or a point with visibilitieson opposed sides will both result in a null-vector.Additionally in denselyobstructed contexts the visibility measured through the space of the siteitself will have a huge influence, but in reality this space will be obstructedby future buildings.The actual goal would be to measure the visibility fromthe site to the surrounding urban space.To obviate these issues a polarizedanalysis, called outward (OUT) visibility analysis has been tested.Thismethod considers only half of the visibility area or volume that “looksoutwards” from the centre of the parcel as illustrated in figure 5 (on theright). In this way, the directional deviations between the resulting vectorand the radial direction will indicate a direction in which visibility is higher.
164 Michele Leidi and Arno Schlüter
� Figure 4: Horizontal (HOR),
spherical (SPH) and field-of-view
(FOV) visibilities.
� Figure 5: Isotropic (ISO) and
outward (OUT) visibilities.
If the position of the future building is known and does not correspondto the centre of the parcel this new position can be taken to define theoutwards direction.The combination of the previous HOR/SPH/FOV,SCA/VEC, and ISO/OUT variants, results in 12 different analysis methodseach of which has its own specificity and meaning.The differences betweenthese methods are not covered in detail in this publication. For thepurposes of this paper the field-of-view, vectorial, outward method (FOV-VEC-OUT) presented a good compromise and has been used in all theexamples that will be illustrated in the following pages.
2.3. Computational Fluid Dynamics (CFD)
For the analysis of airflow and turbulence (mean velocities and fluctuations),an existing computational fluid dynamics (CFD) engine, called TransAT, hasbeen selected [33].This engine allows sophisticated CFD simulations andgrants the required import-export functionalities that were necessary tolink the results to our visualization framework.
The CFD simulation process starts by acquiring the average annual windspeed in m/s and the average annual wind direction from the meteorologicalstation closest to the site. If the wind direction is rather concentrated asingle average angle can be selected. If the wind rose instead presentsseveral directional peaks, for example depending on the seasons, severalsimulations will be carried out with the different directions.
Further, variations in wind speed in relation to the height (vertical windshear) must be considered.At ground level wind speed is lowered by theobstacles and the landscape roughness, while high above ground the wind isno longer influenced by these effects. Knowing the height of the sensor of themeteorological station and the roughness class of the landscape it is possibleto compute the vertical wind profile with a logarithmic equation [35-36].
Finally some additional parameters, such as the 3D volumes of theneighbourhood, the simulation domain size [37], and the position of themeasurement points in the site volume, have to be defined. Once this data isavailable the CFD simulation is carried-out using a 3D steady-state RANS(Reynolds-averaged Navier-Stokes) model.The outputs of this analysis areseveral scalar and vectorial fields which contain information on velocities(speed plus direction), pressures and turbulence intensities (ratio betweenthe mean velocity and its fluctuation).
3.VISUALIZATION METHODS
3.1.Visualization elements
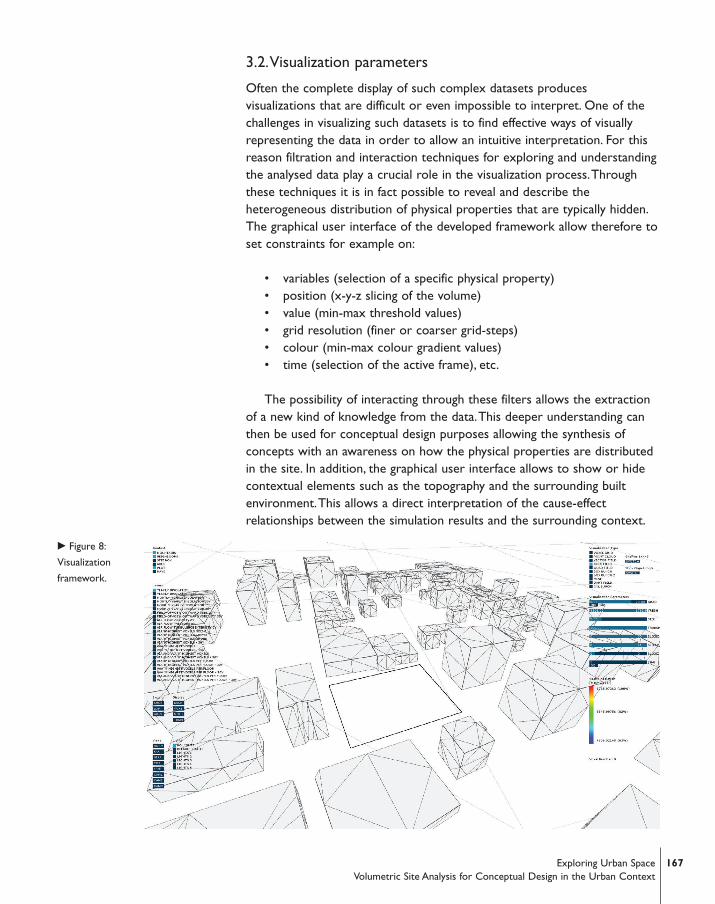
To visualize the results of the analysis a custom, flexible visualizationframework has been developed.The framework illustrated in Figure 8 relieson a set of different visualization elements, which allow volumetric, dynamic
165Exploring Urban Space Volumetric Site Analysis for Conceptual Design in the Urban Context
and directional representations, and on a graphic user interface that allowsthe filtration of the data.
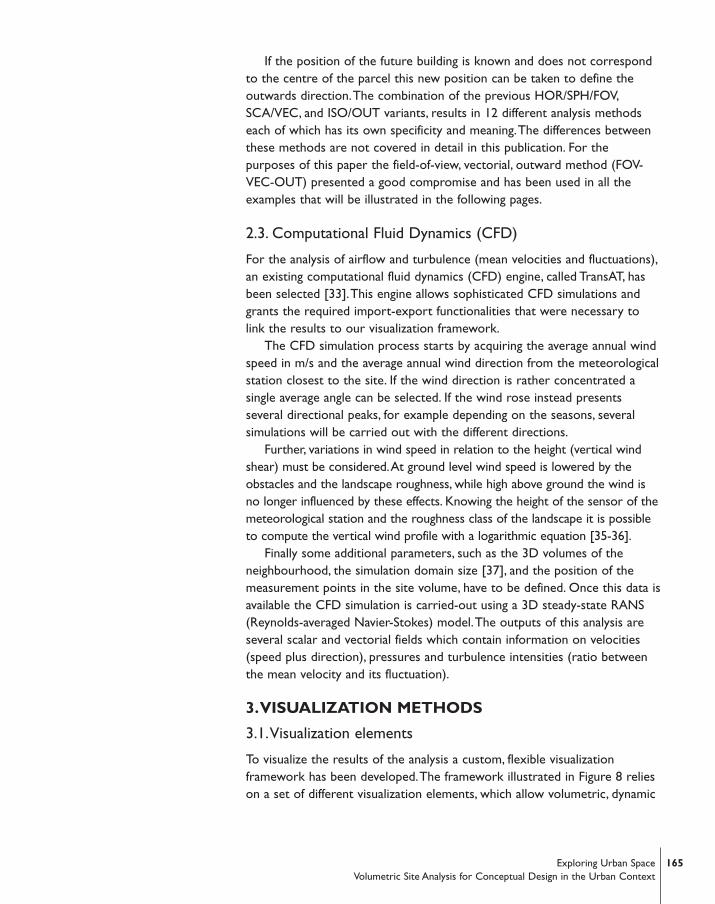
Beside common visualization elements (points, voxels, arrows, etc.) a setof custom visualization elements has been introduced to enhance thevisualization of certain features.The key innovation factor was theimprovement of the perception of directionality.
The implemented visualization elements are shown in Figure 6.All theseelements share the ability to visualize data dynamically and volumetrically.Red indicates that the colour reacts to the magnitude of the element,ranging over a defined colour-gradient scale. Other colours (grey, white,yellow, etc.) mean that in these elements the magnitude is disregarded andthat they are displayed with fixed colours in order to focus the visualizationon other aspects such as volumes or directionality (ex: mesh, cyl, box).Topoint the directionality one surface of these elements may hold a particularfixed coloration depending on the nature of the data (yellow for radiation,blue for visibility, and white for airflow).
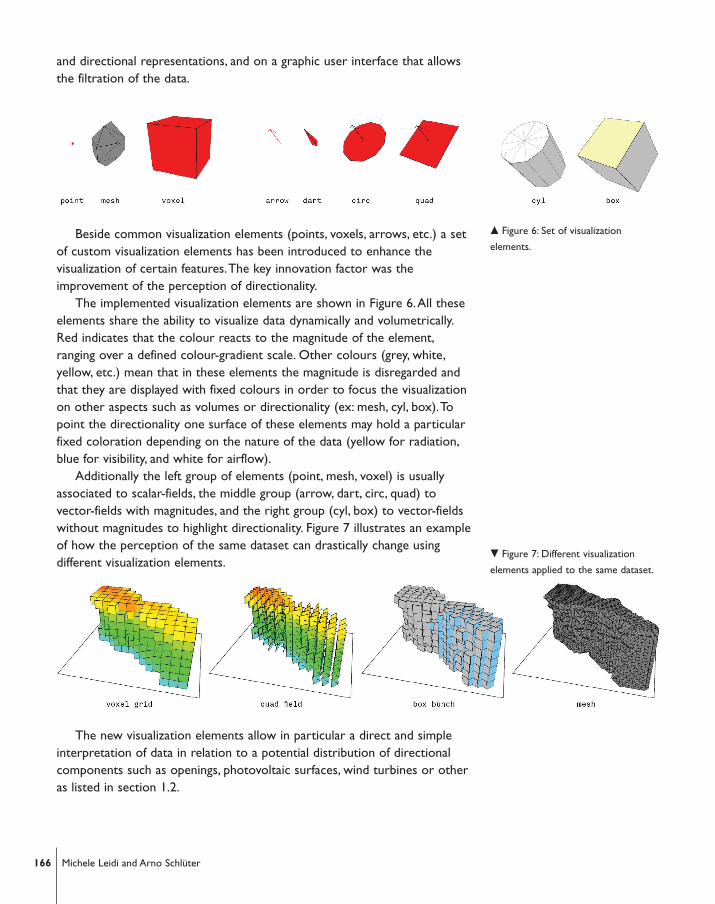
Additionally the left group of elements (point, mesh, voxel) is usuallyassociated to scalar-fields, the middle group (arrow, dart, circ, quad) tovector-fields with magnitudes, and the right group (cyl, box) to vector-fieldswithout magnitudes to highlight directionality. Figure 7 illustrates an exampleof how the perception of the same dataset can drastically change usingdifferent visualization elements.
The new visualization elements allow in particular a direct and simpleinterpretation of data in relation to a potential distribution of directionalcomponents such as openings, photovoltaic surfaces, wind turbines or otheras listed in section 1.2.
� Figure 6: Set of visualization
elements.
� Figure 7: Different visualization
elements applied to the same dataset.
166 Michele Leidi and Arno Schlüter
3.2.Visualization parameters
Often the complete display of such complex datasets producesvisualizations that are difficult or even impossible to interpret. One of thechallenges in visualizing such datasets is to find effective ways of visuallyrepresenting the data in order to allow an intuitive interpretation. For thisreason filtration and interaction techniques for exploring and understandingthe analysed data play a crucial role in the visualization process.Throughthese techniques it is in fact possible to reveal and describe theheterogeneous distribution of physical properties that are typically hidden.The graphical user interface of the developed framework allow therefore toset constraints for example on:
• variables (selection of a specific physical property)• position (x-y-z slicing of the volume)• value (min-max threshold values)• grid resolution (finer or coarser grid-steps)• colour (min-max colour gradient values)• time (selection of the active frame), etc.
The possibility of interacting through these filters allows the extractionof a new kind of knowledge from the data.This deeper understanding canthen be used for conceptual design purposes allowing the synthesis ofconcepts with an awareness on how the physical properties are distributedin the site. In addition, the graphical user interface allows to show or hidecontextual elements such as the topography and the surrounding builtenvironment.This allows a direct interpretation of the cause-effectrelationships between the simulation results and the surrounding context.
� Figure 8:
Visualization
framework.
167Exploring Urban Space Volumetric Site Analysis for Conceptual Design in the Urban Context
4. EXAMPLES OF IDENTIFICATION OFPOTENTIALS
4.1. Observation of the whole volume of the site
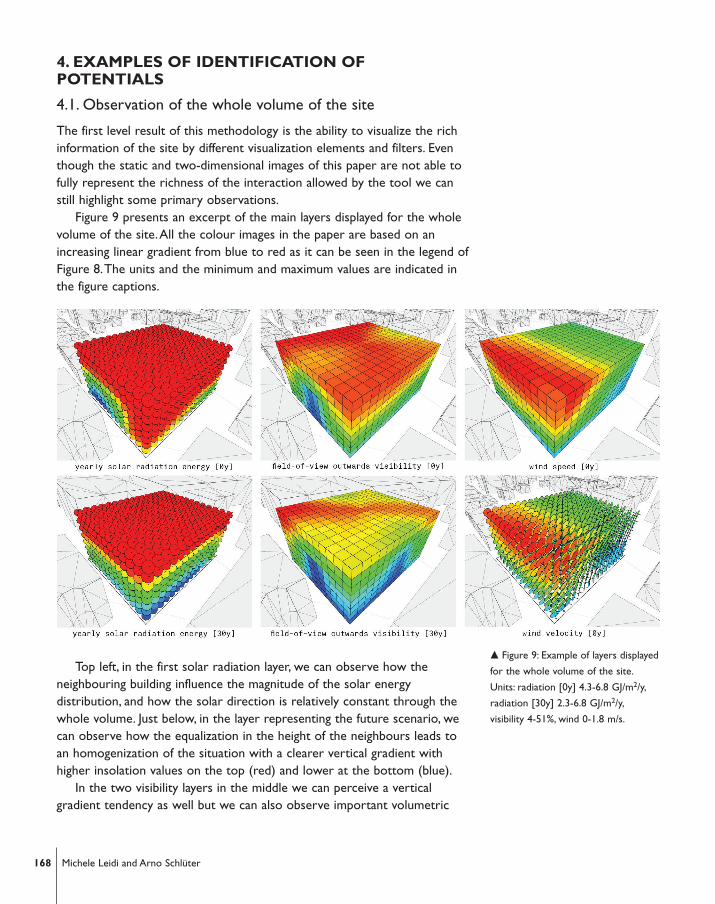
The first level result of this methodology is the ability to visualize the richinformation of the site by different visualization elements and filters. Eventhough the static and two-dimensional images of this paper are not able tofully represent the richness of the interaction allowed by the tool we canstill highlight some primary observations.
Figure 9 presents an excerpt of the main layers displayed for the wholevolume of the site.All the colour images in the paper are based on anincreasing linear gradient from blue to red as it can be seen in the legend ofFigure 8.The units and the minimum and maximum values are indicated inthe figure captions.
Top left, in the first solar radiation layer, we can observe how theneighbouring building influence the magnitude of the solar energydistribution, and how the solar direction is relatively constant through thewhole volume. Just below, in the layer representing the future scenario, wecan observe how the equalization in the height of the neighbours leads toan homogenization of the situation with a clearer vertical gradient withhigher insolation values on the top (red) and lower at the bottom (blue).
In the two visibility layers in the middle we can perceive a verticalgradient tendency as well but we can also observe important volumetric
� Figure 9: Example of layers displayed
for the whole volume of the site.
Units: radiation [0y] 4.3-6.8 GJ/m2/y,
radiation [30y] 2.3-6.8 GJ/m2/y,
visibility 4-51%, wind 0-1.8 m/s.
168 Michele Leidi and Arno Schlüter
diversities at an horizontal level.The top image (current scenario) presentsan H-shaped pattern, while the bottom image (future scenario) presents adiagonal shaped pattern.
In the two air flow layers on the right we can instead observe a clearprevalent flow direction from North to South. Regarding the magnitude wecan observe a clear diagonal gradient spanning from 0 m/s in the bottom-East corner to 1.8 m/s in the top-West corner.
Beside the main layers of Figure 9 several additional layers of informationare available through the tool. Examples are dynamic layers with hourly ormonthly solar radiation values, air pressures or turbulence intensities. Inaddition to the observation of the whole volume of the site a multitude ofadditional second-level visualizations can be extracted by simply applyingdifferent visualization elements or filters. In the next sections two examplesof such second-level investigations are presented.The first example willregard the attempt to identify particular volumes that could providesuggestions for the form of the future building.The second example will beinstead based on a fixed building form and the attempt will be to obtainsuggestions for the structuration of the building surfaces.
4.2. Identification of volumes
The goal of this study is to identify volumes that respond to specificinvestigation criteria in order to obtain suggestions for the position,orientation and form of the future building. In this example two data layersare involved: the yearly solar radiation (VIA) and the field-of-view outwardvisibility (VVA).The investigation criterion will be to identify volumes thatensure high solar radiation and visibility values.
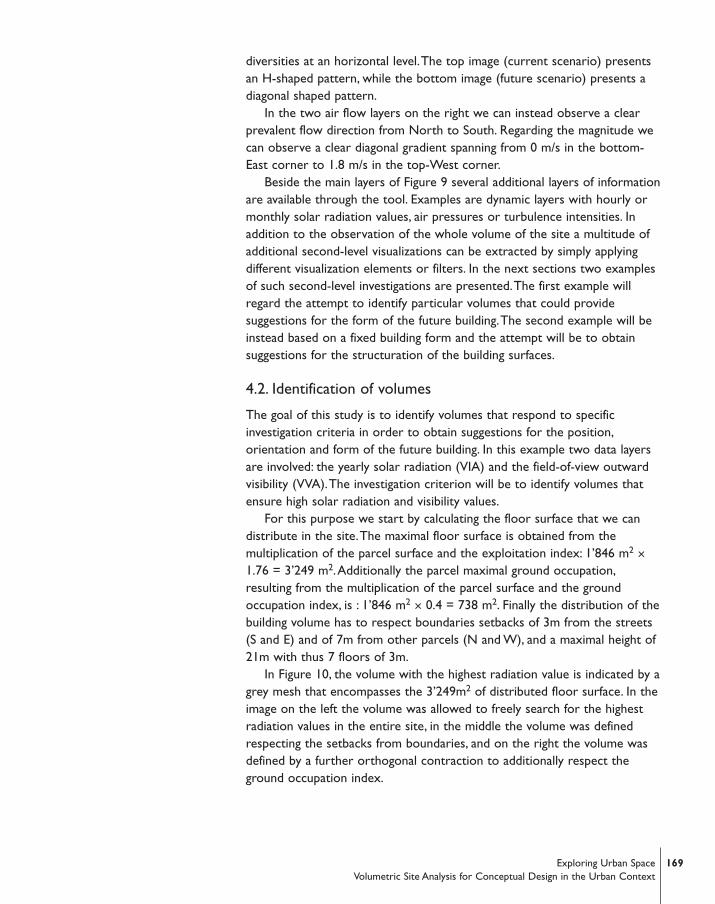
For this purpose we start by calculating the floor surface that we candistribute in the site.The maximal floor surface is obtained from themultiplication of the parcel surface and the exploitation index: 1’846 m2 ×1.76 = 3’249 m2.Additionally the parcel maximal ground occupation,resulting from the multiplication of the parcel surface and the groundoccupation index, is : 1’846 m2 × 0.4 = 738 m2. Finally the distribution of thebuilding volume has to respect boundaries setbacks of 3m from the streets(S and E) and of 7m from other parcels (N and W), and a maximal height of21m with thus 7 floors of 3m.
In Figure 10, the volume with the highest radiation value is indicated by agrey mesh that encompasses the 3’249m2 of distributed floor surface. In theimage on the left the volume was allowed to freely search for the highestradiation values in the entire site, in the middle the volume was definedrespecting the setbacks from boundaries, and on the right the volume wasdefined by a further orthogonal contraction to additionally respect theground occupation index.
169Exploring Urban Space Volumetric Site Analysis for Conceptual Design in the Urban Context
By these volumes we can note that in order to maximize the access tofeatures like solar radiation, the building volume should be placed on thetop of the site.Applying this scheme to multiple buildings would result in anurban configuration similar to a canopy, in which the neighbours would tryto maximize their solar access competing with each other in height. Inpractice, current regulations restrain the freedom of action directing ittowards classic morphologies as illustrated in Figure 10 on the right.
Another consideration suggested by these images, is that conceptualdesign could be radically turned upside-down.While a building is usuallyconceived based on a ground-up ideology, similarly to how it is constructed,if the design criteria are based on searching for optimal conditions of solarradiation, visibility or airflow, the design should rather be conceived with asky-down logic, at least partially.
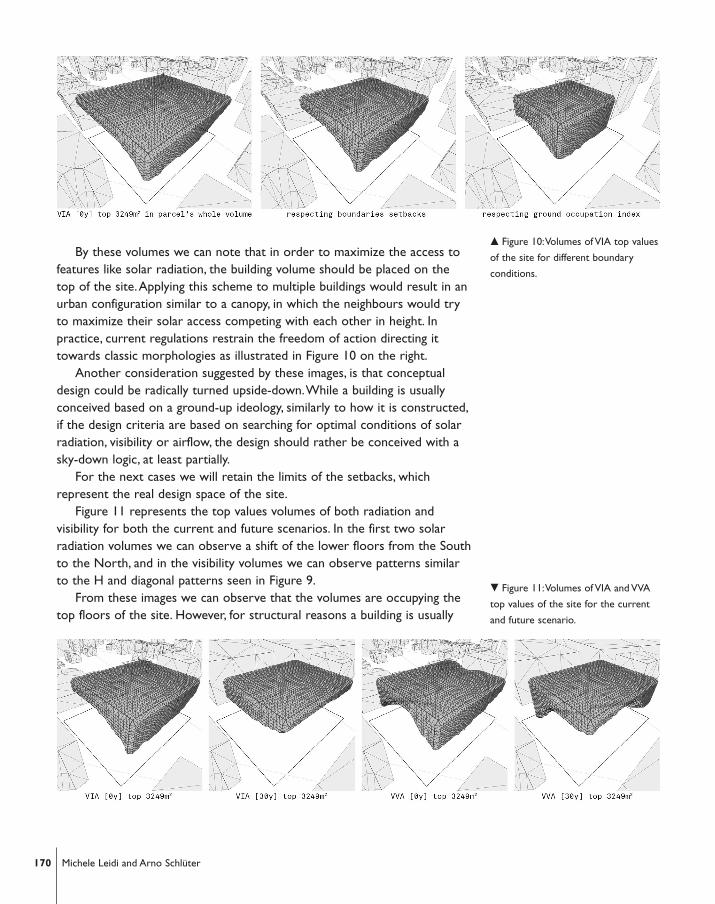
For the next cases we will retain the limits of the setbacks, whichrepresent the real design space of the site.
Figure 11 represents the top values volumes of both radiation andvisibility for both the current and future scenarios. In the first two solarradiation volumes we can observe a shift of the lower floors from the Southto the North, and in the visibility volumes we can observe patterns similarto the H and diagonal patterns seen in Figure 9.
From these images we can observe that the volumes are occupying thetop floors of the site. However, for structural reasons a building is usually
170 Michele Leidi and Arno Schlüter
� Figure 10:Volumes of VIA top values
of the site for different boundary
conditions.
� Figure 11:Volumes of VIA and VVA
top values of the site for the current
and future scenario.
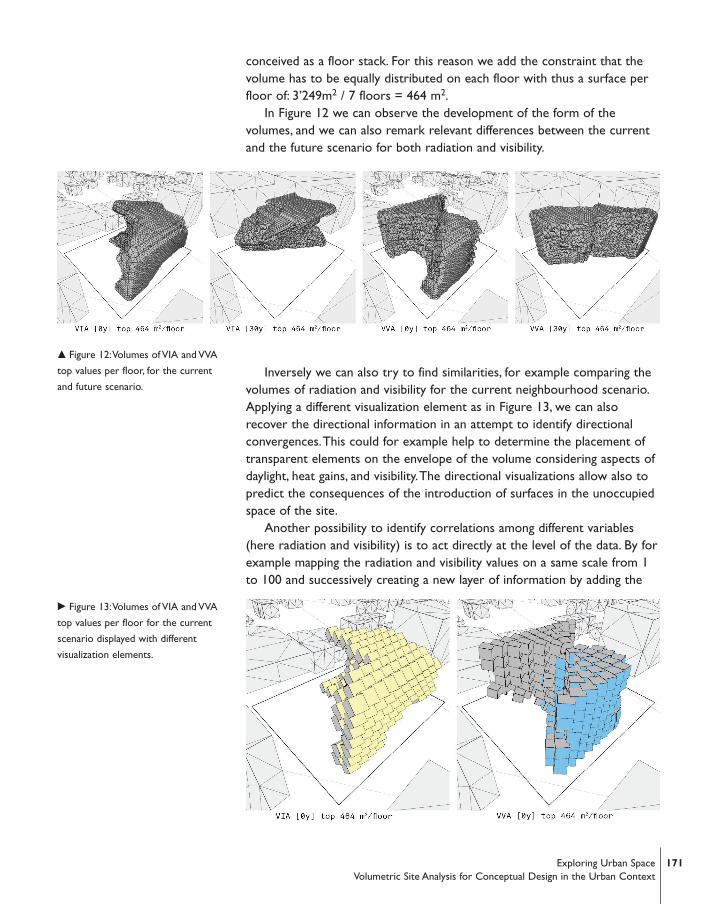
conceived as a floor stack. For this reason we add the constraint that thevolume has to be equally distributed on each floor with thus a surface perfloor of: 3’249m2 / 7 floors = 464 m2.
In Figure 12 we can observe the development of the form of thevolumes, and we can also remark relevant differences between the currentand the future scenario for both radiation and visibility.
Inversely we can also try to find similarities, for example comparing thevolumes of radiation and visibility for the current neighbourhood scenario.Applying a different visualization element as in Figure 13, we can alsorecover the directional information in an attempt to identify directionalconvergences.This could for example help to determine the placement oftransparent elements on the envelope of the volume considering aspects ofdaylight, heat gains, and visibility.The directional visualizations allow also topredict the consequences of the introduction of surfaces in the unoccupiedspace of the site.
Another possibility to identify correlations among different variables(here radiation and visibility) is to act directly at the level of the data. By forexample mapping the radiation and visibility values on a same scale from 1to 100 and successively creating a new layer of information by adding the
171Exploring Urban Space Volumetric Site Analysis for Conceptual Design in the Urban Context
� Figure 12:Volumes of VIA and VVA
top values per floor, for the current
and future scenario.
� Figure 13:Volumes of VIA and VVA
top values per floor for the current
scenario displayed with different
visualization elements.
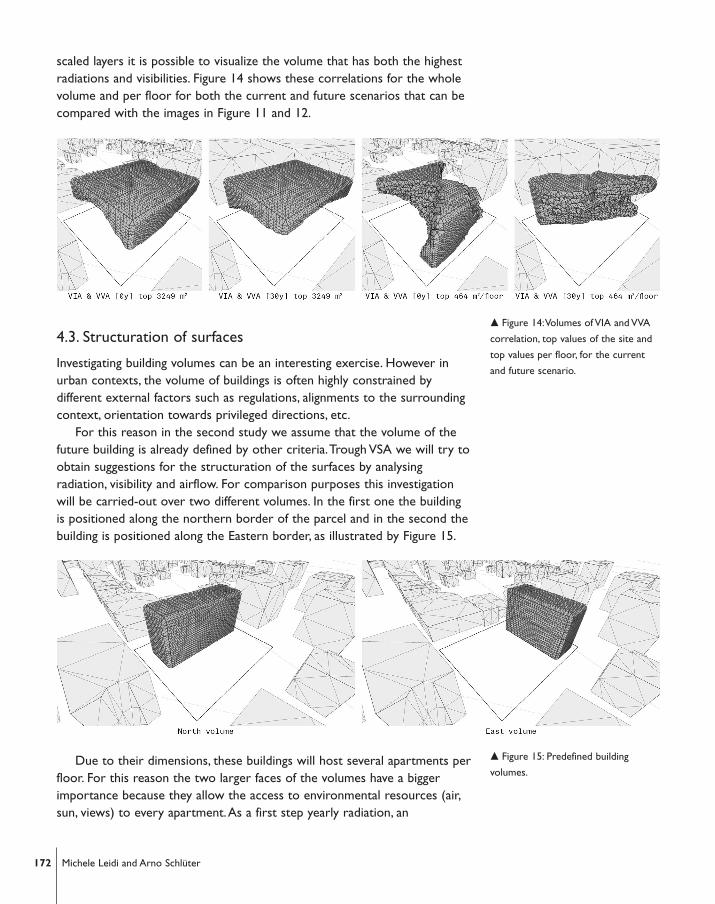
scaled layers it is possible to visualize the volume that has both the highestradiations and visibilities. Figure 14 shows these correlations for the wholevolume and per floor for both the current and future scenarios that can becompared with the images in Figure 11 and 12.
4.3. Structuration of surfaces
Investigating building volumes can be an interesting exercise. However inurban contexts, the volume of buildings is often highly constrained bydifferent external factors such as regulations, alignments to the surroundingcontext, orientation towards privileged directions, etc.
For this reason in the second study we assume that the volume of thefuture building is already defined by other criteria.Trough VSA we will try toobtain suggestions for the structuration of the surfaces by analysingradiation, visibility and airflow. For comparison purposes this investigationwill be carried-out over two different volumes. In the first one the buildingis positioned along the northern border of the parcel and in the second thebuilding is positioned along the Eastern border, as illustrated by Figure 15.
Due to their dimensions, these buildings will host several apartments perfloor. For this reason the two larger faces of the volumes have a biggerimportance because they allow the access to environmental resources (air,sun, views) to every apartment.As a first step yearly radiation, an
172 Michele Leidi and Arno Schlüter
� Figure 14:Volumes of VIA and VVA
correlation, top values of the site and
top values per floor, for the current
and future scenario.
� Figure 15: Predefined building
volumes.
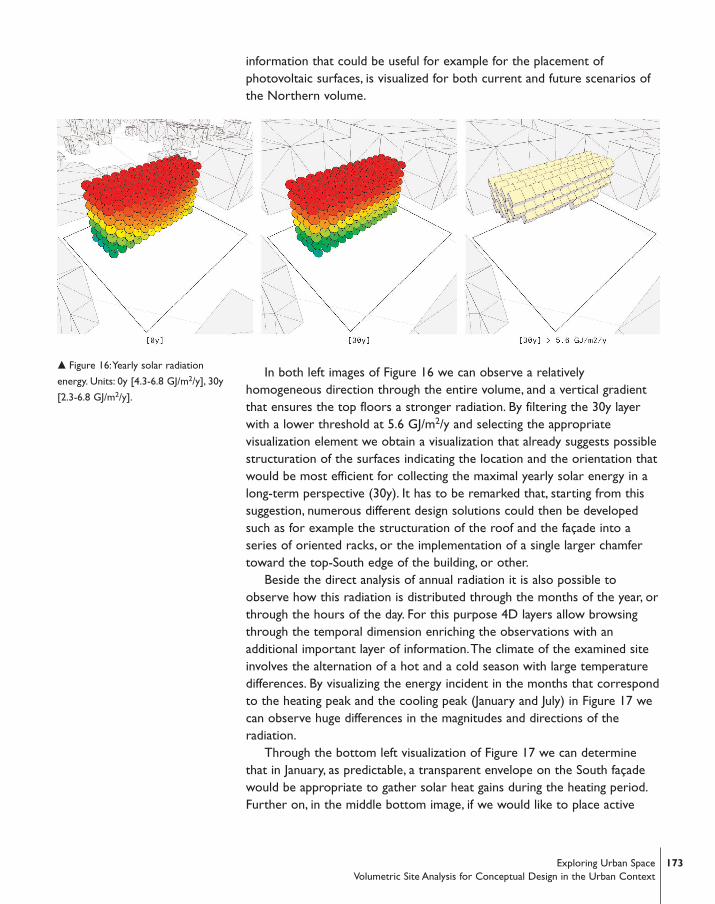
information that could be useful for example for the placement ofphotovoltaic surfaces, is visualized for both current and future scenarios ofthe Northern volume.
In both left images of Figure 16 we can observe a relativelyhomogeneous direction through the entire volume, and a vertical gradientthat ensures the top floors a stronger radiation. By filtering the 30y layerwith a lower threshold at 5.6 GJ/m2/y and selecting the appropriatevisualization element we obtain a visualization that already suggests possiblestructuration of the surfaces indicating the location and the orientation thatwould be most efficient for collecting the maximal yearly solar energy in along-term perspective (30y). It has to be remarked that, starting from thissuggestion, numerous different design solutions could then be developedsuch as for example the structuration of the roof and the façade into aseries of oriented racks, or the implementation of a single larger chamfertoward the top-South edge of the building, or other.
Beside the direct analysis of annual radiation it is also possible toobserve how this radiation is distributed through the months of the year, orthrough the hours of the day. For this purpose 4D layers allow browsingthrough the temporal dimension enriching the observations with anadditional important layer of information.The climate of the examined siteinvolves the alternation of a hot and a cold season with large temperaturedifferences. By visualizing the energy incident in the months that correspondto the heating peak and the cooling peak (January and July) in Figure 17 wecan observe huge differences in the magnitudes and directions of theradiation.
Through the bottom left visualization of Figure 17 we can determinethat in January, as predictable, a transparent envelope on the South façadewould be appropriate to gather solar heat gains during the heating period.Further on, in the middle bottom image, if we would like to place active
� Figure 16:Yearly solar radiation
energy. Units: 0y [4.3-6.8 GJ/m2/y], 30y
[2.3-6.8 GJ/m2/y].
173Exploring Urban Space Volumetric Site Analysis for Conceptual Design in the Urban Context
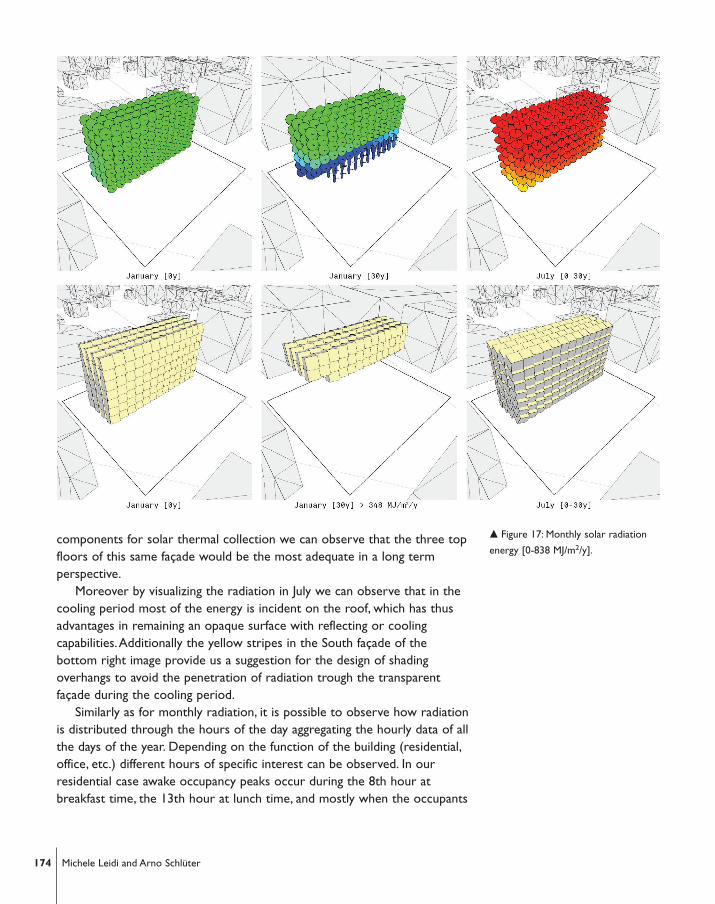
components for solar thermal collection we can observe that the three topfloors of this same façade would be the most adequate in a long termperspective.
Moreover by visualizing the radiation in July we can observe that in thecooling period most of the energy is incident on the roof, which has thusadvantages in remaining an opaque surface with reflecting or coolingcapabilities.Additionally the yellow stripes in the South façade of thebottom right image provide us a suggestion for the design of shadingoverhangs to avoid the penetration of radiation trough the transparentfaçade during the cooling period.
Similarly as for monthly radiation, it is possible to observe how radiationis distributed through the hours of the day aggregating the hourly data of allthe days of the year. Depending on the function of the building (residential,office, etc.) different hours of specific interest can be observed. In ourresidential case awake occupancy peaks occur during the 8th hour atbreakfast time, the 13th hour at lunch time, and mostly when the occupants
174 Michele Leidi and Arno Schlüter
� Figure 17: Monthly solar radiation
energy [0-838 MJ/m2/y].
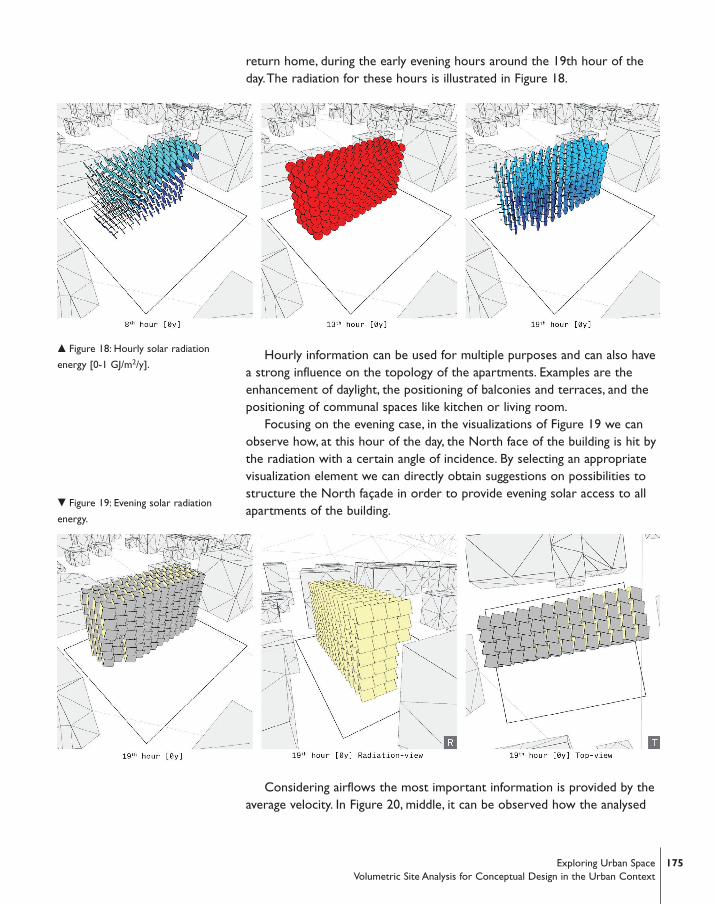
return home, during the early evening hours around the 19th hour of theday.The radiation for these hours is illustrated in Figure 18.
Hourly information can be used for multiple purposes and can also havea strong influence on the topology of the apartments. Examples are theenhancement of daylight, the positioning of balconies and terraces, and thepositioning of communal spaces like kitchen or living room.
Focusing on the evening case, in the visualizations of Figure 19 we canobserve how, at this hour of the day, the North face of the building is hit bythe radiation with a certain angle of incidence. By selecting an appropriatevisualization element we can directly obtain suggestions on possibilities tostructure the North façade in order to provide evening solar access to allapartments of the building.
Considering airflows the most important information is provided by theaverage velocity. In Figure 20, middle, it can be observed how the analysed
� Figure 18: Hourly solar radiation
energy [0-1 GJ/m2/y].
� Figure 19: Evening solar radiation
energy.
175Exploring Urban Space Volumetric Site Analysis for Conceptual Design in the Urban Context
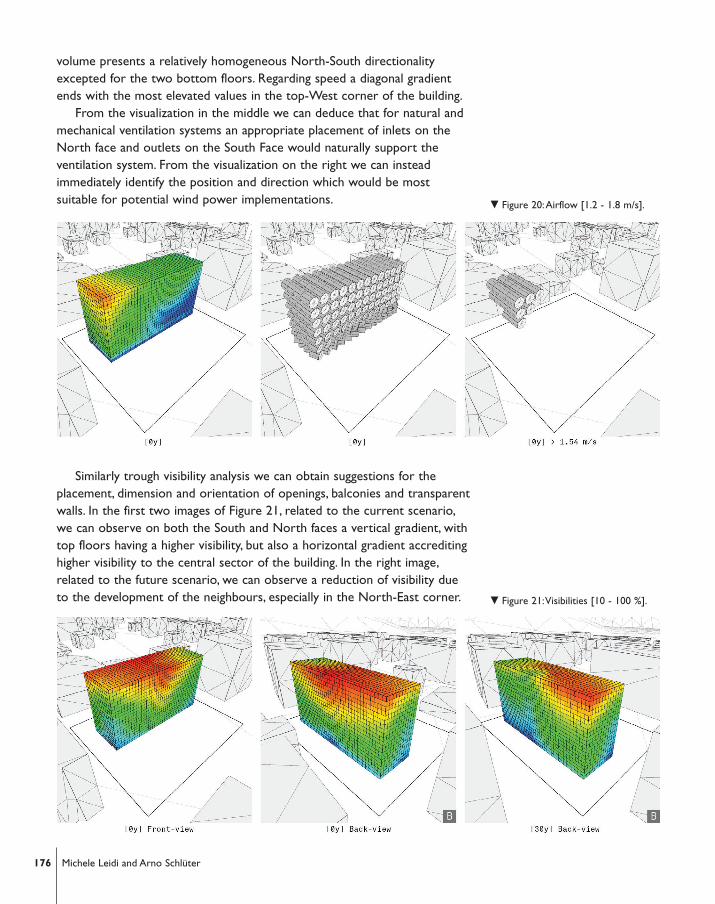
volume presents a relatively homogeneous North-South directionalityexcepted for the two bottom floors. Regarding speed a diagonal gradientends with the most elevated values in the top-West corner of the building.
From the visualization in the middle we can deduce that for natural andmechanical ventilation systems an appropriate placement of inlets on theNorth face and outlets on the South Face would naturally support theventilation system. From the visualization on the right we can insteadimmediately identify the position and direction which would be mostsuitable for potential wind power implementations.
Similarly trough visibility analysis we can obtain suggestions for theplacement, dimension and orientation of openings, balconies and transparentwalls. In the first two images of Figure 21, related to the current scenario,we can observe on both the South and North faces a vertical gradient, withtop floors having a higher visibility, but also a horizontal gradient accreditinghigher visibility to the central sector of the building. In the right image,related to the future scenario, we can observe a reduction of visibility dueto the development of the neighbours, especially in the North-East corner.
� Figure 20:Airflow [1.2 - 1.8 m/s].
� Figure 21:Visibilities [10 - 100 %].
176 Michele Leidi and Arno Schlüter
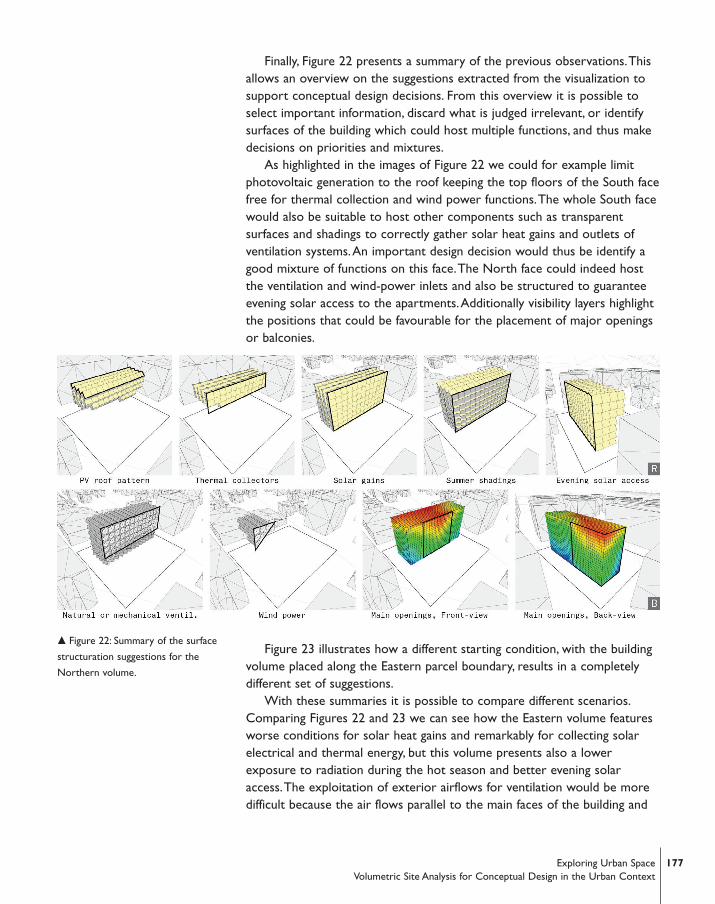
Finally, Figure 22 presents a summary of the previous observations.Thisallows an overview on the suggestions extracted from the visualization tosupport conceptual design decisions. From this overview it is possible toselect important information, discard what is judged irrelevant, or identifysurfaces of the building which could host multiple functions, and thus makedecisions on priorities and mixtures.
As highlighted in the images of Figure 22 we could for example limitphotovoltaic generation to the roof keeping the top floors of the South facefree for thermal collection and wind power functions.The whole South facewould also be suitable to host other components such as transparentsurfaces and shadings to correctly gather solar heat gains and outlets ofventilation systems.An important design decision would thus be identify agood mixture of functions on this face.The North face could indeed hostthe ventilation and wind-power inlets and also be structured to guaranteeevening solar access to the apartments.Additionally visibility layers highlightthe positions that could be favourable for the placement of major openingsor balconies.
Figure 23 illustrates how a different starting condition, with the buildingvolume placed along the Eastern parcel boundary, results in a completelydifferent set of suggestions.
With these summaries it is possible to compare different scenarios.Comparing Figures 22 and 23 we can see how the Eastern volume featuresworse conditions for solar heat gains and remarkably for collecting solarelectrical and thermal energy, but this volume presents also a lowerexposure to radiation during the hot season and better evening solaraccess.The exploitation of exterior airflows for ventilation would be moredifficult because the air flows parallel to the main faces of the building and
� Figure 22: Summary of the surface
structuration suggestions for the
Northern volume.
177Exploring Urban Space Volumetric Site Analysis for Conceptual Design in the Urban Context
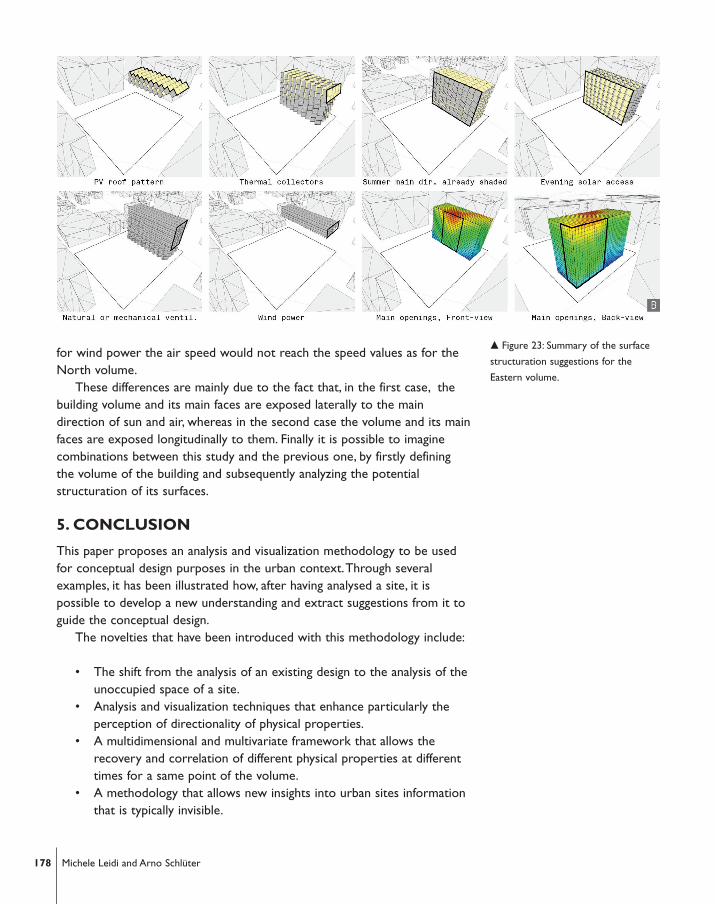
for wind power the air speed would not reach the speed values as for theNorth volume.
These differences are mainly due to the fact that, in the first case, thebuilding volume and its main faces are exposed laterally to the maindirection of sun and air, whereas in the second case the volume and its mainfaces are exposed longitudinally to them. Finally it is possible to imaginecombinations between this study and the previous one, by firstly definingthe volume of the building and subsequently analyzing the potentialstructuration of its surfaces.
5. CONCLUSION
This paper proposes an analysis and visualization methodology to be usedfor conceptual design purposes in the urban context.Through severalexamples, it has been illustrated how, after having analysed a site, it ispossible to develop a new understanding and extract suggestions from it toguide the conceptual design.
The novelties that have been introduced with this methodology include:
• The shift from the analysis of an existing design to the analysis of theunoccupied space of a site.
• Analysis and visualization techniques that enhance particularly theperception of directionality of physical properties.
• A multidimensional and multivariate framework that allows therecovery and correlation of different physical properties at differenttimes for a same point of the volume.
• A methodology that allows new insights into urban sites informationthat is typically invisible.
178 Michele Leidi and Arno Schlüter
� Figure 23: Summary of the surface
structuration suggestions for the
Eastern volume.
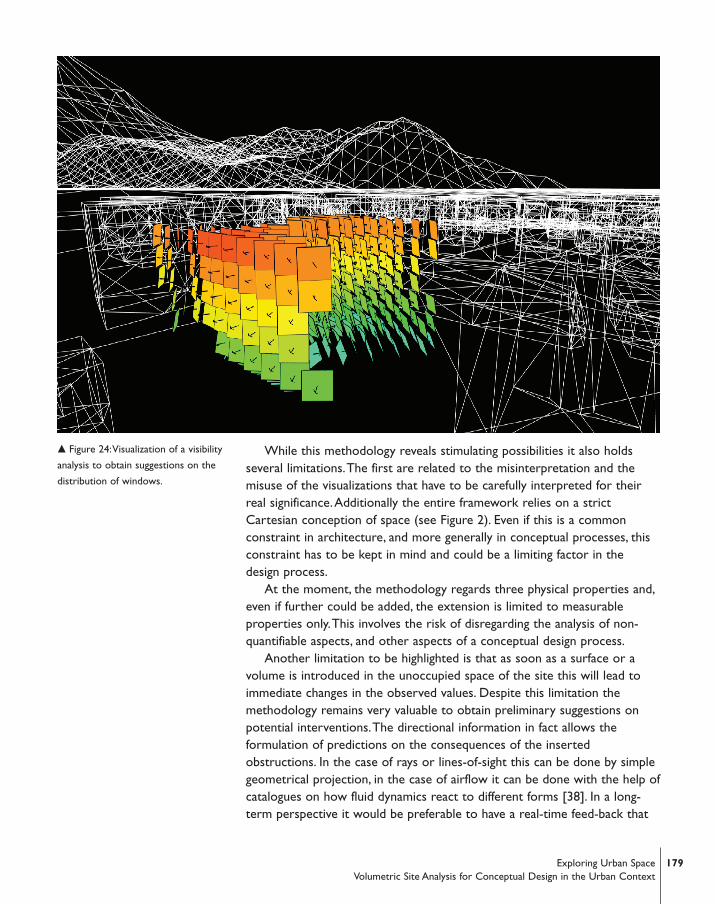
While this methodology reveals stimulating possibilities it also holdsseveral limitations.The first are related to the misinterpretation and themisuse of the visualizations that have to be carefully interpreted for theirreal significance.Additionally the entire framework relies on a strictCartesian conception of space (see Figure 2). Even if this is a commonconstraint in architecture, and more generally in conceptual processes, thisconstraint has to be kept in mind and could be a limiting factor in thedesign process.
At the moment, the methodology regards three physical properties and,even if further could be added, the extension is limited to measurableproperties only.This involves the risk of disregarding the analysis of non-quantifiable aspects, and other aspects of a conceptual design process.
Another limitation to be highlighted is that as soon as a surface or avolume is introduced in the unoccupied space of the site this will lead toimmediate changes in the observed values. Despite this limitation themethodology remains very valuable to obtain preliminary suggestions onpotential interventions.The directional information in fact allows theformulation of predictions on the consequences of the insertedobstructions. In the case of rays or lines-of-sight this can be done by simplegeometrical projection, in the case of airflow it can be done with the help ofcatalogues on how fluid dynamics react to different forms [38]. In a long-term perspective it would be preferable to have a real-time feed-back that
179Exploring Urban Space Volumetric Site Analysis for Conceptual Design in the Urban Context
� Figure 24:Visualization of a visibility
analysis to obtain suggestions on the
distribution of windows.
could immediately make visible the consequences of the introduction of anobject in the unoccupied space. Due to the computational demand of theanalysis this process is currently difficult to achieve but future developmentsin the performance of desk computers, real-time CFD, and real-time solarradiation analysis [39] could allow developments in this direction.
Although the presented results are the product of considerabledevelopments, these are in reality just a starting point. Further investigationscould address the amelioration of the drafted analysis and visualizationmethods or the development of an integrated software prototype.
The next phase of our research investigation will however focus onexploring the application of this methodology to synthesis processes ofconceptual design and on its validation.The ultimate goal is to potentially beable to fuse active technologies, passive methods, and expressive aspects,achieving design concepts that are able to embrace and valorize thevolumetric, dynamic and directional diversities of an urban site.
ACKNOWLEDGEMENT
This research work was supported by the Swiss National ScienceFoundation (SNSF).
REFERENCES1. http://suat.arch.ethz.ch/research/posip [1-5-2013].
2. Dubois, M.-C., Horvat, M., State-of-the-art of digital tools used by architects for solardesign, Report, IEA SHC Task 41.B, 2010.
3. http://usa.autodesk.com/ [3-1-2013].
4. http://openstudio.nrel.gov/ [3-1-2013].
5. Cheng, S., Curved Photovoltaic Surface Optimization for BIPV:An EvolutionaryApproach Based on Solar Radiation Simulation, Master Thesis, University CollegeLondon, 2009.
6. Lobaccaro, G., Frontini, F., Masera, G., Polia,T., SolarPW:A New Solar Design Toolto Exploit Solar Potential in Existing Urban Areas, in: Häberle,A., ed., 1stInternational Conference on Solar Heating and Cooling for Buildings and Industry,Elsevier Science Publisher, 2012, 1173-1183,.
7. Janssen, P.H.T.,An evolutionary system for design exploration, in:Tidafi,T. , DortaT., eds., Joining Languages, Cultures and Visions : CAADFutures, PUM, Montreal, 2009,259-272.
8. Caldas, L., Generation of energy-efficient architecture solutions applyingGENE_ARCH:An evolution-based generative design system, Advanced EngineeringInformatics, 2007, 22(1), 59-70.
9. Marin, Ph., Bignon, J.-C., Lequay, H.,A Genetic Algorithm for Use in CreativeDesign Processes, in: Kudless,A., Oxman, N., Swackhamer, M., eds., Silicon + Skin:Biological Processes and Computation,ACADIA, Minneapolis, 2008, 332-339.
10. Turrin, M., von Buelow, P., Stouffs, R., Kilian,A., Performance-oriented design oflarge passive solar roofs, a method for the integration of parametric modellingand genetic algorithms, in: Schmitt, G., Hovestadt, L.,Van Gool, L., Bosche, F.Burkhard, R., Coleman, S., Halatsch, J., Hansmeyer, M., Konsorski-Lang, S., Kunze,A., Sehmi-Luck, M., eds., Future Cities, eCAADe, Zürich, 2010, 321-330.
180 Michele Leidi and Arno Schlüter
11. Zarzycki A., Intuitive Structures:Applications of Dynamic Simulations in EarlyDesign Stages, in: McGraw, R.M., Imsand, E.S., Chinni, M.J., eds. Proceedings of the2010 Spring Simulation Multiconference, SpringSim, Orlando, 2010, 1-8.
12. LaBelle, G., Nembrini, J., Huang , J., Simulation-Driven Design System, in: Muylle,M., Architecture ‘in computero’, Integrating Methods and Techniques, eCAADe, 2008,Antwerpen.
13. Rullán-Lemke, C.,ArchitekturForm & SolarEnergie, Cuvillier Verlag Göttingen,PhD Thesis,TUHH, Hamburg, 2009.
14. Kämpf, J.H., Montavon, M., Bunyesc, J., Bolliger, R., Robinson, D., Optimization ofbuildings’ solar irradiation availability, Solar Energy, 2010, 84(4), 596-603.
15. Montavon M., Optimization of Urban Form by the Evaluation of the SolarPotential, PhD Thesis, EPFL, Lausanne, 2010.
16. Cárdenas-Jirón, L.A., Comparison of solar energy performance on two distinctiveurban fabrics at the neighborhood scale, in: Proceedings of the CISBAT internationalconference, 2009, Lausanne.
17. Teller J. & Azar S.,Townscope II - A computer system to support solar accessdecision-making, Solar Energy, 2001, 70(3), 187-200.
18. Marsh,A.,The Interaction of Radiance and Ecotect, Presentation, 5th AnnualRadiance Workshop, Leicester, 2006.
19. http://andrewmarsh.com/ [3-1-2013].
20. Yi,Y. K., Malkawia,A. M., Site-specific optimal energy form generation based onhierarchical geometry relation, Automation in Construction, 2012, 26, 77-91.
21. Jun Chung, D. H., Lai Choo, M. L., Computational Fluid Dynamics for UrbanDesign:The Prospects for Greater Integration, International Journal of ArchitecturalComputing, 2011, 9(1), 33-54.
22. Derix C., In-Between Architecture Computation, International Journal ofArchitectural Computing, 2009, 7(4), 565-586.
23. Van Bilsen,A., 3D Visibility analysis in virtual worlds: the case of supervisor, in:Wang, X., Gu, N., eds., Proceedings of the 9th International Conference onConstruction Applications of Virtual Reality,The University of Sydney Press, 2009,267-278.
24. Van Maren, G., Ma, J., 3D Analyst - Feature & Volumetric Analysis,Technical workshoppresentation at the Esri International User Conference, San Diego, 2012.
25. Suleiman,W., Joliveau,T., Favier E.,A New Algorithm for 3D Isovist, Proceedings ofthe Sageo conference, Liege, 2012.
26. Donn, M., Selkowitz, S., Bordass, B., Simulation in the service of design - askingthe right questions, in: Proceedings of the Eleventh International Building SimulationConference, IBPSA, Glasgow, 2009, 1314-1321.
27. Srivastav, S., Lannon, S.,Alexander, D.K., and Jones, P.,A review and comparison ofdata visualization techniques used in building design and in building simulation, in:Proceedings of the Eleventh International Building Simulation Conference, IBPSA,Glasgow, 2009, 1942-1949.
28. White E., Site Analysis: Diagramming Information for Architectural Design,Architectural Media Ltd.,Tallahassee, 2004.
29. http://processing.org/ [3-1-2013].
30. Themenblatt Nr. 10, Lichte Höhe Geschosshöhe, Ein Fachausdruck und seineunterschiedliche Verwendung Vorschlag zur einheitlichen Begriffsverwendung, Report,Institut für Raumentwicklung IRAP HSR, Rapperswil, 2006.
31. Leidi, M., Schlueter,A.,Volumetric Insolation Analysis, in: Proceedings of the CISBATinternational conference, 2011, Lausanne.
181Exploring Urban Space Volumetric Site Analysis for Conceptual Design in the Urban Context
32. Oliva,A., Park, S. J. , Konkle,T. , Representing, perceiving and remembering theshape of visual space. In Vision in 3D Environments, in: Harris L. R., Jenkin, M.,eds., Cambridge University Press, 2011.
33. Parameters of Human Vision and Viewshed Definition, Report, Annexure A of theStockyard Hill wind farm landscape & visual assessment, the EnvironmentalResources Management Australia, 2009.
34. http://www.ascomp.ch/ [3-1-2013].
35. Ray, M. L.,Analysis of wind shear models and trends in different terrains, in:Proceedings of the American Wind Energy Association Windpower Conference,AWEA,Anaheim, 2006, 22-25.
36. http://www.wind-data.ch/tools/profile.php [3-1-2013].
37. Franke, J., Hellsten,A., Schlünzen, H., Carissimo, B., Best practice guideline for theCFD simulation of flows in the urban environment, Report, COST Action 732,Quality assurance and improvement of microscale meteorological models, 2007.
38. Beranek,W.J.,Wind environment around single buildings of rectangular shape,and,Wind environment around building configurations, Institute for BuildingMaterials and Building Structures, Heron Magazine, 1984, 29(1), 30-70.
39. Chronis,A.,Tsigkari, M., Davis,A.,Aish, F., Design Systems, Ecology,And Time, in:Synthetic Digital Ecologies, in: Cabrinha, M., Johnson, J.K., Steinfeld, K., eds.,Proceedings of the 32nd Annual conference for computer aided design in architecture,ACADIA, San Francisco, 2012.
182 Michele Leidi and Arno Schlüter
Michele Leidi and Arno Schlüter
Architecture & Sustainable Building Technologies (SuAT) Institute of Technology in Architecture (ITA)ETH Zürich Schafmattstrasse 32, CH-8093 Zürich
M.Leidi, [email protected]


