Embed Size (px)
Citation preview

ORIGINAL ARTICLE
doi:10.1111/j.1558-5646.2012.01598.x
EXPLOSIVE RADIATION OF A BACTERIALSPECIES GROUPHelene Morlon,1,2 Brian D. Kemps,3 Joshua B. Plotkin,3 and Dustin Brisson3,4
1Center for Applied Mathematics, UMR 7641 CNRS, Ecole Polytechnique, 91128 Palaiseau, France2E-mail: [email protected]
3Department of Biology, University of Pennsylvania, Philadelphia, Pennsylvania 191044E-mail: [email protected]
Received October 11, 2011
Accepted January 23, 2012
The current diversity of life on earth is the product of macroevolutionary processes that have shaped the dynamics of diversification.
Although the tempo of diversification has been studied extensively in macroorganisms, much less is known about the rates of
diversification in the exceedingly diverse and species-rich microbiota. Decreases in diversification rates over time, a signature
of explosive radiations, are commonly observed in plant and animal lineages. However, the few existing analyses of microbial
lineages suggest that the tempo of diversification in prokaryotes may be fundamentally different. Here, we use multilocus and
genomic sequence data to test hypotheses about the rate of diversification in a well-studied pathogenic bacterial lineage, Borrelia
burgdorferi sensu lato (sl). Our analyses support the hypothesis that an explosive radiation of lineages occurred near the origin
of the clade, followed by a sharp decay in diversification rates. These results suggest that explosive radiations may be a general
feature of evolutionary history across the tree of life.
KEY WORDS: Diversification, microbial macroevolution, phylogeny, radiation.
Explosive evolutionary radiations are one of the most conspicuousand intriguing features of evolutionary biology (Simpson 1953;Schluter 2000; Rundell and Price 2009). Explosive radiations haveoccurred in a wide variety of animal and plant lineages, identifiedusing both fossil and molecular data, and may be a general pat-tern of the diversity of life (Sanderson and Donoghue 1994; Purviset al. 1995; Zink and Slowinski 1995; Alroy 1999; Harmon et al.2003; McPeek 2008; Phillimore and Price 2008; Rabosky andLovette 2008; Morlon et al. 2010). In comparison with the wealthof evidence supporting rapid radiations of macroorganisms, verylittle is known about the tempo of microbial diversification(Martin et al. 2004). Given the vast diversity of microbes andtheir crucial roles in human health and economics, as well asin natural ecosystem processes, it is essential to investigate thepattern of species diversification in the microbial world.
Analyses of molecular phylogenies of extant taxa underbirth–death models of cladogenesis are widely used to investigatediversification patterns. In particular, they are used to test the hy-
pothesis that diversification rates have decayed over time, whichis commonly interpreted as an ecological niche-filling process as-sociated with radiations (Nee et al. 1994; Pybus and Harvey 2000;Rabosky and Lovette 2008; Glor 2010; Morlon et al. 2010). Timedecays in diversification rates are often investigated by measuringthe relative position of nodes in a phylogeny using the gamma(!) statistic (Pybus and Harvey 2000; Harmon et al. 2003; Martinet al. 2004; Phillimore and Price 2008; Brock et al. 2011), or byanalyzing the likelihood of the waiting times between branchingevents in a phylogeny under various birth–death models ofcladogenesis (Nee et al. 1992, 1994; Rabosky 2006; Raboskyand Lovette 2008; Morlon et al. 2010; Morlon et al. 2011; Stadler2011). Such analyses have revealed time decays in diversificationrates in many plant and animal clades (Davis et al. 2005; Kozaket al. 2006; McPeek 2008; Phillimore and Price 2008; Schuettpelzand Pryer 2009; Morlon et al. 2010; Valente et al. 2010), and evenin the Kingdom Animalia itself (Rokas et al. 2005). By contrast,the sole analysis of the tempo of diversification in prokaryotic
2 5 7 7C! 2012 The Author(s). Evolution C! 2012 The Society for the Study of Evolution.Evolution 66-8: 2577–2586

HELENE MORLON ET AL.
phylogenies that we know of did not detect a time decay indiversification rates (Martin et al. 2004), a surprising resultgiven that prokaryote lineages rapidly and adaptively diversify inexperimental systems (reviewed in MacLean 2005; Kassen 2009).
There are three main complications associated withphylogeny-based macroevolutionary analyses of microbial lin-eages. First, the true diversity is rarely well sampled as the ma-jority of bacterial species have yet to be described; second, thereis no broadly accepted species concept for microbes; and lastly,the horizontal gene transfer that is common among prokaryotesrenders birth–death models of cladogenesis less suited to analyzediversification in microbial clades. The evolutionary clade con-taining the Lyme disease-causing spirochetes, Borrelia burgdor-feri sensu lato (sl), avoids many of these complications and thusprovides an excellent opportunity to study rates of diversificationin a prokaryotic group.
Borrelia burgdorferi is obligatorily vectored among verte-brate hosts by ticks in the Ixodes ricinus species complex (Barbourand Hayes 1986; Nuttall 1999; van Dam 2002; Piesman and Gern2004). This host specialization potentially limits species diversityby limiting habitat suitability, and makes scientific samplingeasier than for free-living groups. Further, the implications of B.burgdorferi sl for human health has lead to an exhaustive exam-ination of vertebrates and hematophagous arthropods around theworld for both human infectious and wildlife-specific Borreliaspecies through both cultivation-dependent and cultivation-independent methods. These exhaustive field studies to identifyB. burgdorferi sl have resulted in a very high coverage of thediversity of this clade, revealing 15 described and two recentlyproposed phylotypes that are readily distinguishable by DNAsequence divergence and phylogenetic clustering (Gern 2008;Margos et al. 2009; Rudenko et al. 2009, 2011). Genetic diversitywithin each phylotype is small compared to divergence amongphylotypes, suggesting that each lineage is an independentlyevolving, phylogenetically distinct group comparable to speciesin eukaryotes (Avise and Wollenberg 1997; Richter et al. 2006;Postic et al. 2007; Margos et al. 2011). Finally, horizontalgene transfer among phylotypes is rare for chromosomal genes(Dykhuizen and Baranton 2001; Qiu et al. 2004) allowingapplication of birth–death models of cladogenesis to studydiversification rates.
The present study provides a comprehensive assessment ofthe pattern of phylotype diversification in B. burgdorferi sl. Weconstruct phylogenetic hypotheses for B. burgdorferi sl using mul-tiple loci and chromosome sequences. We then analyze variationin the rate of diversification of B. burgdorferi phylotypes overthe evolutionary history of the species group using the !-statisticas well as a recently developed hypothesis-testing framework thataccounts for the possibility that some lineages have not been sam-pled (Morlon et al. 2010). Finally, we discuss our results in light
of classical results found for macroorganisms and of specific bi-ological characteristics of B. burgdorferi sl that may influencediversification rates in this group.
Materials and MethodsLOCUS SEQUENCE DATA
The NCBI nucleotide database was searched in November 2010for B. burgdorferi sl sequences that meet three criteria. First,only DNA sequence data from chromosomal loci were used asplasmid genes are more prone to horizontal gene transfer (Qiuet al. 2004; Margos et al. 2009). Second, we used only lo-cus datasets for which meaningful comparisons could be madeacross at least 11 B. burgdorferi sl taxa. Lastly, locus datasetswith homologs in at least two taxa in the relapsing fever Bor-relia group (B. hermsii, B. duttonii, B. recurrentis, or B. tur-racatae) were desired, to root the trees. Nucleotide sequencesfrom seven loci—fla (flagellin, 122 sequences), hbb (histone-likeprotein, 77 sequences), rpoB (RNA polymerase, 66 sequences),RRS (16S rDNA, 256 sequences), recA (recombinase A, 108 se-quences), 5S–23S internal transcribed rDNA sequence (ITS, 798sequences), and groEL (chaperone protein, 116 sequences)—fitthese criteria. Sequences for each locus in the NCBI nucleotidedatabase were downloaded and aligned using ClustalX (Higginsand Sharp 1988; Larkin et al. 2007) and Muscle (Edgar 2004).This resulted in a total of 1543 sequences. Data across all 15 rec-ognized B. burgdorferi sl phylotypes were available for only threeloci (fla, groEL, and RRS). We thus constructed two phylogenies:a phylogeny comprising all phylotypes based on these three loci,and a phylogeny using all seven loci comprising 11 phylotypes(hereafter referred to as “three-locus” and “seven-locus” trees,respectively).
CHROMOSOME SEQUENCE DATA
Primary shotgun sequences from 15 Borrelia genome projects,11 of which are from the B. burgdorferi sl group, were ac-quired from NCBI. These 11 genome projects covered six ofthe recognized phylotypes: three B. burgdorferi sensu stricto (ss)genome projects (B31, CA-11.2, ZS7), three B. garinii (Far04,PBi, PBr), two B. afzelii (ACA-1, PKo), one B. sp SV1 (SV1),one B. valaisiana (VS116), and one B. spielmanii (A14S). Thechromosome sequences were aligned to the annotated chromo-some of the B. burgdorferi sensu stricto (ss) type-strain (B31)using Blast (Altschul et al. 1990) and Muscle (Edgar 2004). Allambiguous nucleotides were excluded from analyses. The datarepresent orthologous genes shared across all sampled organisms.The final dataset comprised 551,152 nucleotides (58% of the ap-proimately 0.95 Mb B31 reference chromosome). Of the 551,152chromosomal nucleotides, 95,018 were polymorphic (14.7%) ofwhich 41,042 (7.4%) were parsimony informative. Sites with
2 5 7 8 EVOLUTION AUGUST 2012

EXPLOSIVE DIVERSIFICATION IN BACTERIA
evidence of multiple mutations—those with three or more di-vergent bases—made up only 7021 of the polymorphic sites sug-gesting that mutation saturation is unlikely. The tree was rootedusing 118,709 nucleotides from B. hermsii, B. duttonii, B. rec-curentis, and B. turicatae genomic sequences, hereafter referredto as the “chromosome” tree.
DELIMITING PHYLOTYPES
Although there is no universally accepted species definition forprokaryotes, there are well-recognized phylotypes in B. burgdor-feri sl (Richter et al. 2006; Margos et al. 2009; Rudenko et al.2009, 2011). To test that the genetic diversity of each of theseven loci clusters into independently evolving lineages that cor-respond to the recognized phylotypes, we first built single-locusultrametric trees using MrBayes and penalized likelihood (PL),as described below. We then used the Generalized Mixed YuleCoalescent model, implemented in the GMYC package in R(splits http://r-forge.r project.org/projects/splits/), which tests thehypothesis that the data represent several independently evolvingpopulations against the null hypothesis that it represents a singlepopulation (in practice, that the tree conforms to a neutral coa-lescent, Pons et al. 2006; Barraclough et al. 2009). The GMYCmodel estimates a threshold that defines clusters of sequencescorresponding to independently evolving populations. The clus-ters formed with this approach matched the phylotypes given byGenBank for each locus, which were used to infer the multilocustrees described below.
PHYLOGENETIC RECONSTRUCTION
The phylogenetic history of B. burgdorferi sl was inferred byBayesian inference in MrBayes 3.0 version 4 (Huelsenbeck andRonquist 2001). Two types of phylogenetic trees were con-structed, corresponding to the multilocus and partial-chromosomesequence data (the three- and seven-locus trees, and the chromo-some tree, respectively). The multiloci trees were obtained byconcatenating the individual gene sequences. In practice, for agiven phylotype, a concatenated sequence was obtained by ran-domly sampling one sequence per locus in the cluster of sequencescorresponding to that phylotype. We checked that the resultingtrees were robust to the set of sequences sampled, and used oneset for further analyses. This procedure resulted in an average ofapproximately five concatenated sequences per phylotype. To cir-cumvent any potential complications that could arise through theconcatenation of loci with different phylogenetic signals, we alsoanalyzed the diversification rates in each of the seven individuallocus trees.
For both the multilocus and chromosomal sequence data, weused the HKY85 model of molecular evolution with invariantsites and ! distributed rates, as selected by the Akaike Informa-
tion Criterion by MrModeltest version 2.2 (Nylander 2004). Thishighly parameterized model of molecular evolution is necessaryto avoid biasing branch length estimates that could result in biasesin diversification rate estimates (Revell et al. 2005). Bayesian re-constructions using a Markov Chain Monte Carlo (MCMC) algo-rithm with four chains were run for 15,000,000 generations eachand sampled every 250 generations. The first five million gener-ations were discarded as burn-in, and convergence of the modelwas detected by assessing stationarity of logL values, plottingthe posterior probabilities of nodes as a function of the numberof generations, and by examining standard deviations of split fre-quencies for independent runs (Huelsenbeck et al. 2001; Rambautand Drummond 2007). Three Bayesian runs using different seedswere implemented to verify convergence to the same posteriordistribution of trees. To overcome uncertainty in the branchingtimes and branching order, all further analyses were conductedon the 100 trees with the greatest posterior probability supportfrom the Bayesian phylogenetic reconstruction (Huelsenbeck andRonquist 2001). Ultrametric trees were obtained by applying PLto each phylogram using the software package r8s (Sanderson2003). In the resulting trees, the nodes corresponded to diver-gences among phylotypes as well as divergences within phylo-types. Because we were interested in the diversification patternsof independently evolving lineages comparable to macroeukary-ote species, that is, the diversification patterns of phylotypes, wehad to clump within-phylotype sequences into a single lineage.We thus ran the GMYC model on the ultrametric trees containingall sequences, and checked that they formed clusters consistentwith the accepted phylotypes. One branch from each phylotypewas then retained for subsequent analyses.
The sensitivity of our results to the method of phylogeneticreconstruction was assessed by constructing ultrametric trees withtwo additional methods. The Bayesian Estimation of SpeciesTrees (BEST) leverages multilocus data while accounting forthe fact that gene trees are embedded within a common phy-logeny (Edwards et al. 2007; Liu and Pearl 2007; Liu 2008).The BEST analyses using all sequences from the seven loci wereinitiated from random starting trees and sampled every 1000 gen-erations over a 100 million generation run. The posterior dis-tribution of species trees (post burn-in) was summarized as the50% majority-rule consensus tree to obtain posterior probabil-ity values for species relationships. We also constructed phy-logenetic trees using maximum-likelihood methods assuming amolecular clock (MLMC) in PAUP" version 4.0b10 (Swofford2003) for both the partial-chromosome and concatenated mul-tilocus datasets. MODELTEST version 3.06 (Posada andCrandall 1998) was used to choose the best evolutionary model(HKY85+I+!). Maximum-likelihood analyses were subjectedto 1000 bootstrap replicates.
EVOLUTION AUGUST 2012 2 5 7 9
HELENE MORLON ET AL.
DETECTING TIME VARIATION IN DIVERSIFICATION
RATES
Both the !-statistic (Pybus and Harvey 2000) and the co-alescent approach of Morlon et al. (2010, codes availableat http://www.cmap.polytechnique.fr/#morlon/resources.html)were employed to test for temporal variation in diversificationrates. Both methods are robust to absolute age estimates and re-quire only relative divergence times. These approaches also allowus to statistically account for phylotypes that are not included inthe dataset. Accounting for unsampled phylotypes is essential asmissing phylotypes can cause the spurious detection of declinesin diversification rates (Pybus and Harvey 2000). Completing theanalyses of ! with another method is also essential, as a negative! does not necessarily indicate an early burst of diversification(Fordyce 2010). Other methods that allow for periods of diver-sity decline (Morlon et al. 2011) and rate heterogeneity acrosslineages (Alfaro et al. 2009; Morlon et al. 2011) are also appli-cable, but not required to address our central question of whetherdiversification rates have varied over time.
To assess the robustness of our results to incomplete phylo-type sampling, we analyzed all datasets using both the ! and thecoalescent with the assumption that the true number of existingphylotypes (N) is 15 (the current number of recognized phylo-types), 17 (the current number of recognized phylotypes plus thetwo newly proposed phylotypes), 20, 30, 50, 100, 150, 200, and250. An upper limit of 250 phylotypes, more than 15-fold thetotal number of currently described B. burgdorferi sl phylotypes,seems a reasonable upper bound on the true number of phylotypesgiven the extensive effort that has been made to sample this clade.
We used the Monte Carlo Constant Rates (MCCR) ! ap-proach detailed in Pybus and Harvey (2000) to test for a declinein diversification rates while accounting for potentially missingtaxa. This approach assumes that missing taxa are randomly dis-tributed in the tree. Violations of this assumption could lead tospurious detection of rate declines (Cusimano and Renner 2010),extensions of the approach exist that can account for overdis-persed or underdispersed sampling (Brock et al. 2011). However,we chose not to employ these methods here as we had no a prioriexpectations of the form of the sampling. For each phylogeny, wecalculated the !-value of the 100 Bayesian phylogenies with bestposterior support. We then compared these values to the criticalMCCR corrected !-value indicating a significant decay in diver-sification rate (P < 0.05). The critical MCCR corrected !-valuewas estimated for each phylogeny and each assumed number oftotal phylotypes (N).
The coalescent approach employed yields an approximatelikelihood expression for internode distances in a phylogeny un-der a variety of diversification scenarios (Fig. 1 and Table 1 fromMorlon et al. 2010). The coalescent framework was introduced inpopulation genetics to study the genealogy of samples, and is thus
particularly well suited to the study of phylogenies that may not becompletely sampled. We compared the fit of four diversificationmodels to the empirical data: the Yule model (constant diversifi-cation rate, no extinction), the YuleVAR model (varying diversifi-cation rate, no extinction), the Birth–Death model (constant diver-sification and extinction rates), and the BirthVAR-Death model(varying diversification rate, constant extinction rate). When ratesvaried over time, we used an exponential form of rate variationwith time, t. Time is measured from the present to the past, suchthat t = 0 denotes the present.
To test the hypothesis that diversification rates have variedover time, we used likelihood ratio tests for the two pairs of mod-els with constant versus varying rate (i.e., Yule vs. YuleVAR,and Birth–Death vs. BirthVAR-Death). The possibility that phy-lotypes exist but are not represented in our datasets was accountedfor by computing the sampling fraction f (Morlon et al. 2010) foreach reconstructed phylogeny and each hypothesized number ofphylotypes (N) and fitting the various diversification models withthe corresponding sampling fraction. We tested the robustness ofthe results to topological and branch-length uncertainty by run-ning the likelihood ratio tests on the 100 Bayesian phylogenieswith best posterior support.
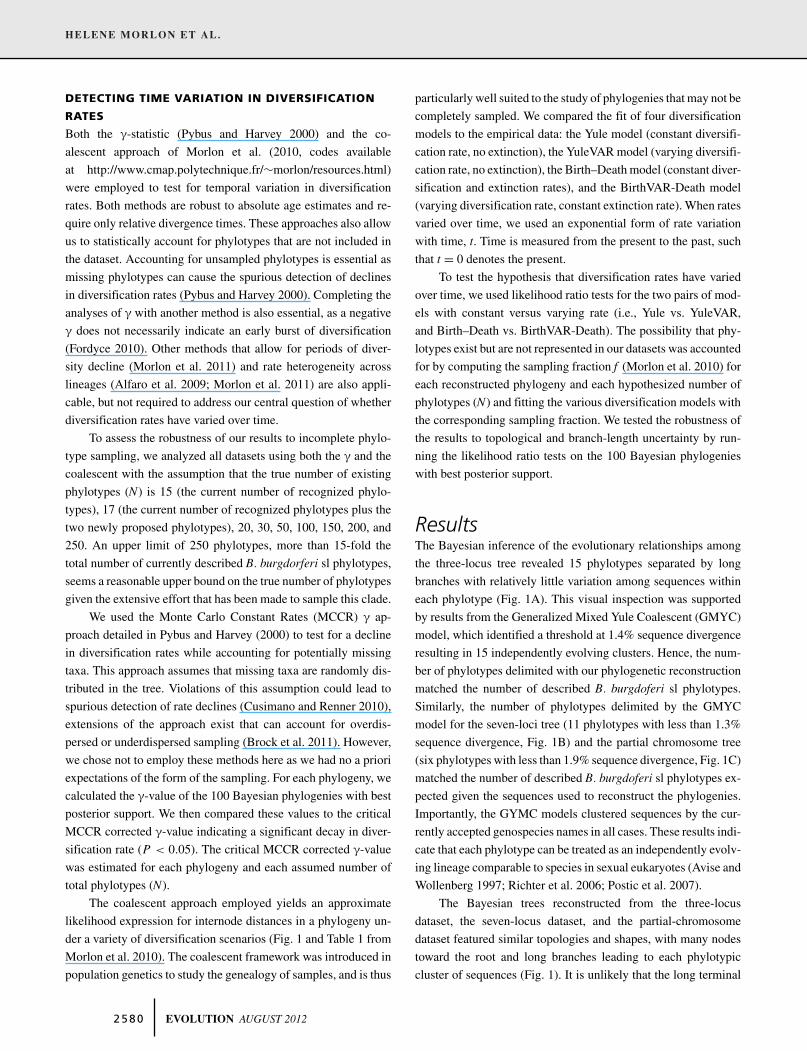
ResultsThe Bayesian inference of the evolutionary relationships amongthe three-locus tree revealed 15 phylotypes separated by longbranches with relatively little variation among sequences withineach phylotype (Fig. 1A). This visual inspection was supportedby results from the Generalized Mixed Yule Coalescent (GMYC)model, which identified a threshold at 1.4% sequence divergenceresulting in 15 independently evolving clusters. Hence, the num-ber of phylotypes delimited with our phylogenetic reconstructionmatched the number of described B. burgdoferi sl phylotypes.Similarly, the number of phylotypes delimited by the GMYCmodel for the seven-loci tree (11 phylotypes with less than 1.3%sequence divergence, Fig. 1B) and the partial chromosome tree(six phylotypes with less than 1.9% sequence divergence, Fig. 1C)matched the number of described B. burgdoferi sl phylotypes ex-pected given the sequences used to reconstruct the phylogenies.Importantly, the GYMC models clustered sequences by the cur-rently accepted genospecies names in all cases. These results indi-cate that each phylotype can be treated as an independently evolv-ing lineage comparable to species in sexual eukaryotes (Avise andWollenberg 1997; Richter et al. 2006; Postic et al. 2007).
The Bayesian trees reconstructed from the three-locusdataset, the seven-locus dataset, and the partial-chromosomedataset featured similar topologies and shapes, with many nodestoward the root and long branches leading to each phylotypiccluster of sequences (Fig. 1). It is unlikely that the long terminal
2 5 8 0 EVOLUTION AUGUST 2012

EXPLOSIVE DIVERSIFICATION IN BACTERIA
Figure 1. Bayesian phylogenetic reconstruction (left) and ultrametric phylogenies (right) of all available B. burgdorferi sensu lato (sl)phylotypes, based on a total of 1543 gene sequences. The triangles represent the maximum genetic distance among sequences withinphylotypes in the Bayesian phylogenies. The majority of among-phylotype diversification events occur near the root of the phylogeniessuggesting a rapid burst of diversification early in the evolutionary history of the group. Phylogenies were constructed using: (A) thethree loci for which data were available from 15 phylotypes, (B) seven loci for which data were available from 11 phylotypes, and (C) thepartial chromosome sequence data (chromosome). Nodes marked with asterisks are supported by posterior probabilities of more than0.8 (!), 0.9 (!!), or 0.95 (!!!).
EVOLUTION AUGUST 2012 2 5 8 1

HELENE MORLON ET AL.
branches observed in the ultrametric trees (Fig. 1, right column)resulted from high among-lineage variation in molecular evolu-tionary rates, because the nonclocklike trees (Fig. 1, left column)also featured long terminal branches and likelihood ratio tests didnot detect deviations from clocklike evolution (P > 0.1 for allcomparisons). Further, the phylogenetic trees inferred by maxi-mum likelihood with a forced molecular clock (Fig. S1) and theBEST tree (Fig. S2) displayed internal nodes near the root andlong branches leading to each phylotype. The evolutionary rela-tionships differed slightly among the phylogenies in some cases(ex B. valaisiana, Fig. 1) and statistical support for several in-ternal nodes was not significant. However, the consistent shapeacross trees indicates phylotype diversification occurred early andrapidly in the history of the clade, potentially explaining the un-certainty in phylogenetic resolution and incongruence betweentrees.
Macroevolutionary analyses of the phylogenies support thehypothesis that the present-day diversity of B. burgdorferi sl re-sults from rapid-early diversification (Figs. 2 and 3). The !-valuescalculated from the three- and seven-locus phylogenies were lessthan the smallest !-value of the phylogenies simulated underconstant rate (hence, the null hypothesis of constant diversifi-cation rates was rejected, P < 0.001), even when assuming atrue diversity of as many as 250 B. burgdorferi sl phylotypes(Fig. 2A,B). The MCCR analyses of the partial chromosome phy-logeny also significantly supported a time-decaying diversifica-tion rate (P < 0.05) unless the currently described phylotypesrepresent less than 10% of the true number of extant phylotypes(Fig. 2C). These results strongly suggest that diversification oc-curred rapidly in the early history of the clade and has sinceslowed.
The time-decaying diversification rate hypothesis was furthersupported by the coalescent-based analyses. B. burgdorferi sl phy-logenies were consistent with models that included time-varyingrates. Both the pure-birth and the birth-death models with varyingdiversification rates were significantly more likely than modelswith constant diversification rates (Fig. 3). Both models posit thatdiversification rates have decayed sharply since the diversificationevents that happened early in the history of the clade. The strongsupport we found for time-decaying rates is all the more strikinggiven that there are few B. burgdorferi sl phylotypes and thus a pri-ori little statistical power to select complex (time-varying) modelsover simpler (time-constant) models. Our conclusions were robustto potential biases introduced by missing phylotypes as the modelswith time-varying rates were consistently supported even when weassumed that as many as 250 B. burgdorferi sl phylotypes exist to-day (Fig. 3). The conclusions were also supported by our analysesof the individual-locus trees (Fig. S3), suggesting that our resultsare not an artifact of concatenating loci with different phylogeneticsignal.
50 100 150 200 250
!6!4
!2ga
mm
a
50 100 150 200 250
!6!4
!2ga
mm
a
50 100 150 200 250
!6!4
!2
assumed number of phylotypes
gam
ma
A
B
C
Figure 2. Monte Carlo Constant Rates (MCCR) tests reject the hy-pothesis that diversification rates have been constant over timeeven if considerable species diversity in the B. burgdorferi sl cladehas yet to be discovered. Black lines represent the !-values of the100 phylogenies with maximal Bayesian support. Black dots rep-resent the critical !-values of the constant-rates test correspond-ing to each assumed number of phylotypes. !-values below thedots indicate significant rate-decay (P < 0.05). The MCCR analysesof the three-locus (A) and seven-locus (B) phylogenies support atime-decaying diversification rate, even if the currently describedphylotypes represent less than 6% of the true number of extantphylotypes. Similarly, the hypothesis of constant diversificationrate can be rejected for the chromosome phylogeny even if theactual number of existing phylotypes exceeds 100 (C).
DiscussionAlthough explosive radiations followed by rapid decreases indiversification rates is a common pattern for plant and animallineages, little is known about the macroevolutionary patternsof prokaryotes, which constitute most of the diversity of life onearth. Contrary to a previous result suggesting that the tempoof diversification in microorganisms is fundamentally differentfrom that of macroorganisms (Martin et al. 2004), our studysuggests that the variation in the rates of cladogenesis overtime in bacteria can be comparable to those reported in classicexamples of radiations (Harmon et al. 2003; Phillimore and Price
2 5 8 2 EVOLUTION AUGUST 2012

EXPLOSIVE DIVERSIFICATION IN BACTERIA
50 150 250
510
1520
25Li
kelih
ood
ratio
50 150 250
510
1520
25
50 150 250
46
812
Like
lihoo
d ra
tio
50 150 250
46
812
50 150 250
510
1520
assumed number of phylotypes
Like
lihoo
d ra
tio
50 150 250
510
1520
assumed number of phylotypes
Pure birth Birth-DeathA
B
C
0.001
0.010.05
Figure 3. Likelihood ratio tests indicate that models with varyingdiversification rates are significantly more likely than models withconstant rates regardless of the assumed number of species in theB. burgdorferi sl clade. The likelihood ratios (2 log L H1
L H2) between
models with constant versus varying diversification rates are plot-ted as a function of the assumed number of extant phylotypes. Thedashed lines indicate the chi-square values corresponding to P <
0.001, 0.01, and 0.05 (from top to bottom). The pure-birth modelwith decaying diversification rate is more likely given the datathan a pure-birth model with constant rates (left column), and thebirth–death model with decaying diversification rate is more likelythan the constant-rate birth–death model (right column). Modelswith time-varying rates were consistently supported even whenwe assumed that as many as 250 B. burgdorferi sl phylotypes existat present.
2008; Rabosky and Lovette 2008; Morlon et al. 2010). The rapiddiversification of B. burgdorferi phylotypes early in the history ofthe clade followed by a decrease in diversification rates observedin this study closely resembles the patterns described in manyplant and animal lineages.
Our results conflict with previous findings that suggest thatthe diversification rates of microorganisms are constant over time(Martin et al. 2004). This discrepancy may stem from eithermethodological artifacts or differing biological characteristics ofthe clades analyzed. Martin et al. (2004) pointed out that the
broad phylogenetic clade they investigated was substantially un-dersampled and exhibited significant substitution rate variationamong lineages. Undersampling and substitution rate variationare thought to bias ! negatively rather than positively (Revellet al. 2005), which would lead to a false detection of rate declinesrather than the opposite. These two factors nevertheless createbiases in the distribution of node heights, which weakens the gen-eral confidence one can have in the inferred patterns of lineagediversification. By contrast, the focus on a narrow clade in thepresent study resulted in no departure from clocklike assump-tions, allowing a more accurate assessment of node heights andthus the relative timing of diversification. Further, it is likely thatthe B. burgdorferi sl clade has been thoroughly sampled due to itsrole in human Lyme disease and because of its obligatory associ-ation with arthropod vectors and vertebrate hosts that are easy tocapture and investigate for infection (Barbour and Hayes 1986;Nuttall 1999; van Dam 2002; Piesman and Gern 2004). Althoughnovel phylotypes will doubtless be described in the future, it isunlikely that the 15 phylotypes analyzed here represent a smallenough fraction of the total diversity to lose the statistical supportwe found for the decay in diversification rate over time (Figs. 2and 3).
One difference between our analyses and that of Martin et al.(2004) is that we grouped individual sequences into phylotypesbefore analyzing diversification patterns. Our resulting phyloge-nies therefore represent divergences among phylotypes. By con-trast, Martin et al. (2004) analyzed the lineage-through-time plotof a phylogeny without grouping sequences; their phylogeny rep-resents divergences both within and between phylotypes. Hence,a potential slowdown in the diversification rate of phylotypes inMartin’s study could have been masked by recent divergencesof individuals within phylotypes. Because our goal was to ana-lyze the diversification patterns of independently evolving bac-terial lineages—comparable to species in macroorganisms—wedefined the independently evolving lineages (the phylotypes) priorto analyzing their phylogenetic relationships and diversificationdynamics. The 15 phylotypes we defined, based on molecular datafrom multiple loci, conform to the 15 B. burgdorferi sl phylotypesrecognized in the literature.
The patterns of diversification observed in the B. burgdor-feri clade may indicate that time-decaying diversification ratesare a common pattern in the microbial world, as they are inmacroeukaryote clades. However, the rapid-early diversificationobserved here may result from specific biological features of B.burgdorferi that differ from free-living microbes like those pre-viously analyzed (Martin et al. 2004). B. burgdorferi are obli-gatorily associated with vertebrates and hematophagous arthro-pods and thus may be subject to similar ecological processesthat structure the macroevolutionary patterns of macroeukary-otes. For example, the geographical processes that influence
EVOLUTION AUGUST 2012 2 5 8 3

HELENE MORLON ET AL.
diversification in macroeukaryotes by creating ecological oppor-tunity and reducing gene flow among populations (Day 2000)may be less important for many free-living prokaryotes that aremore readily transported over large distances. The constant as-sociation of B. burgdorferi with either ticks or vertebrate hosts(Barbour and Hayes 1986; Nuttall 1999; van Dam 2002; Piesmanand Gern 2004) may limit gene flow between isolated popula-tions, rendering macroevolutionary patterns more similar to thoseof macroorganisms. Hence, time variation in diversification ratesmay be rare among free-living bacteria as previously suggested(Martin et al. 2004) but common in bacteria that are obligatorilyassociated with macroorganisms. This hypothesis could be testedusing a broader array of well-sampled free-living and nonfree-living bacterial phylogenies.
The fast-early diversification followed by a strong decay indiversification rates observed in the B. burgdorferi phylogeniesis consistent with the hypothesis that ecological opportunity pro-moted diversification (Schluter 2000; Yoder et al. 2010), that is,that diversification is constrained by ecological factors (Raboskyand Lovette 2008; Rabosky 2009; Morlon et al. 2010; Raboskyand Glor 2010). An intriguing hypothesis is that diversification ofB. burgdorferi phylotypes may have resulted from adaptive spe-cialization to ecological niches, such as specific vertebrate speciesor tick vectors (Kurtenbach et al. 2002, 2006; Xu et al. 2003). In-deed, each phylotype infects only a subset of vertebrate speciescollectively infected by all B. burgdorferi phylotypes (Kurtenbachet al. 2002, 2006); for example, human infectiousness is restrictedprimarily to three of the 15 phylotypes (Baranton et al. 1992). Al-though current data suggest that B. burgdorferi phylotypes parti-tion potential niches only into broad categories such as associationwith either birds, mammals, or both (Kurtenbach et al. 2002), ad-ditional studies on host species specificity or organ tropism mayreveal further niche partitioning. Recent evidence suggests thatlineages within two of the human infectious B. burgdorferi phylo-types specialize on specific host species and maybe organs withinhosts (Kurtenbach et al. 2002; Hanincova et al. 2003; Brissonand Dykhuizen 2004; Hanincova et al. 2006; Brisson et al. 2008;Brisson et al. 2011). Finer scale investigation into host species useby B. burgdorferi phylotypes that are not medically relevant mayalso reveal greater specialization than is currently acknowledged.
Evidence of rapid diversification in bacteria gathered fromexperimental microcosm studies (reviewed in MacLean 2005;Kassen 2009) is consistent with the analyses supporting time-decaying diversification rates in B. burgdorferi sl. A wide varietyof bacterial lineages readily and repeatedly diversify to adapt toa myriad of structured environmental and biotic niches, and tospecialize on alternative resources during experimental evolutionstudies (Hardin 1960; Friesen et al. 2004; Kassen and Rainey2004; Barrett et al. 2005; Barrett and Bell 2006; Brockhurst et al.2006; Habets et al. 2006; Jasmin and Kassen 2007). These exper-
iments suggest that diversification rates should be rapid initiallywhen ecological opportunities are abundant and decrease as op-portunities become less abundant (MacLean 2005; Kassen 2009).Additionally, nonadaptive radiations, potentially caused by vicari-ance processes, could also lead to a time decline in diversificationrates as space is occupied (Kozak et al. 2006). Therefore, the sig-nature of decaying diversification rates is likely to be commonand readily observable in many prokaryotic phylogenies.
There are many challenges associated with the study ofmacroevolutionary patterns in microorganisms. Although manymicrobial groups must be analyzed to establish that the rapid-earlydiversification hypothesis is a common macroevolutionary featureacross the entire tree of life, the analyses presented here suggestthat rapid-early diversification can occur in bacterial lineages.
ACKNOWLEDGMENTSWe thank P. Sniegowski and D. Dykhuizen for helpful advice and com-ments on the manuscript. We also thank P. Turner, M. Pennell, and twoanonymous reviewers for comments that improved the manuscript. Thiswork was supported by grants from the NIAID (AI076342) to DB. HMacknowledges support from the Centre National de la Recherche Sci-entifique and the Agence Nationale de la Recherche (ECOEVOBIO—CHEX2011). JBP acknowledges support from the James S.McDonnell Foundation, the Alfred P. Sloan Foundation, the David andLucille Packard Foundation, the Burroughs Wellcome Fund, and the De-fense Advanced Research Projects Agency (HR0011–05-1–0057).
LITERATURE CITEDAlfaro, M. E., F. Santini, C. Brock, H. Alamillo, A. Dornburg, D. L. Rabosky,
G. Carnevale, and L. J. Harmon. 2009. Nine exceptional radiations plushigh turnover explain species diversity in jawed vertebrates. Proc. Natl.Acad. Sci. USA 106:13410–13414.
Alroy, J. 1999. The fossil record of North American mammals: evidence fora Paleocene evolutionary radiation. Syst. Biol. 48:107–118.
Altschul, S. F., W. Gish, W. Miller, E. W. Myers, and D. J. Lipman. 1990.Basic local alignment search tool. J. Mol. Biol. 215:403–410.
Avise, J. C., and K. Wollenberg. 1997. Phylogenetics and the origin of species.Proc. Natl. Acad. Sci. USA 94:7748–7755.
Baranton, G., D. Postic, I. Saint Girons, P. Boerlin, J. C. Piffaretti, M. Assous,and P. A. Grimont. 1992. Delineation of Borrelia burgdorferi sensustricto, Borrelia garinii sp. nov., and group VS461 associated with Lymeborreliosis. Int. J. Syst. Bacteriol. 42:378–383.
Barbour, A. G., and S. F. Hayes. 1986. Biology of Borrelia species. Microbiol.Rev. 50:381–400.
Barraclough, T. G., M. Hughes, N. Ashford-Hodges, and T. Fujisawa.2009. Inferring evolutionarily significant units of bacterial diversityfrom broad environmental surveys of single-locus data. Biol. Lett. 5:425–428.
Barrett, R. D., and G. Bell. 2006. The dynamics of diversification in evolvingPseudomonas populations. Evolution 60:484–490.
Barrett, R. D., R. C. MacLean, and G. Bell. 2005. Experimental evolutionof Pseudomonas fluorescens in simple and complex environments. Am.Nat. 166:470–480.
Brisson, D., and D. E. Dykhuizen. 2004. ospC diversity in Borrelia burgdor-feri: different hosts are different niches. Genetics 168:713–722.
Brisson, D., D. E. Dykhuizen, and R. S. Ostfeld. 2008. Conspicuous impactsof inconspicuous hosts on the Lyme disease epidemic. Proc. R. Soc.Lond. B 275:227–235.
2 5 8 4 EVOLUTION AUGUST 2012

EXPLOSIVE DIVERSIFICATION IN BACTERIA
Brisson, D., N. Baxamusa, I. Schwartz, and G. P. Wormser. 2011. Biodiversityof Borrelia burgdorferi strains in tissues of Lyme disease patients. PLoSOne 6:e22926.
Brock, C. D., L. J. Harmon, and M. E. Alfaro. 2011. Testing for tempo-ral variation in diversification rates when sampling is incomplete andnonrandom. Syst. Biol. 60:410–419.
Brockhurst, M. A., M. E. Hochberg, T. Bell, and A. Buckling. 2006. Characterdisplacement promotes cooperation in bacterial biofilms. Curr. Biol.16:2030–2034.
Cusimano, N., and S. S. Renner. 2010. Slowdowns in diversification ratesfrom real phylogenies may not be real. Syst. Biol. 59:458–464.
Davis, C. C., C. O. Webb, K. J. Wurdack, C. A. Jaramillo, and M. J. Donoghue.2005. Explosive radiation of Malpighiales supports a mid-cretaceousorigin of modern tropical rain forests. Am. Nat. 165:E36–E65.
Day, T. 2000. Competition and the effect of spatial resource heterogeneity onevolutionary diversification. Am. Nat. 155:790–803.
Dykhuizen, D. E., and G. Baranton. 2001. The implications of a low rate ofhorizontal transfer in Borrelia. Trends Microbiol. 9:344–350.
Edgar, R. C. 2004. MUSCLE: multiple sequence alignment with high accuracyand high throughput. Nucleic Acids Res. 32:1792–1797.
Edwards, S. V., L. Liu, and D. K. Pearl. 2007. High-resolution species treeswithout concatenation. Proc. Natl. Acad. Sci. USA 104:5936–5941.
Fordyce, J. A. 2010. Interpreting the gamma statistic in phylogenetic diver-sification rate studies: a rate decrease does not necessarily indicate anearly burst. PloS One 5:e11781.
Friesen, M. L., G. Saxer, M. Travisano, and M. Doebeli. 2004. Experimen-tal evidence for sympatric ecological diversification due to frequency-dependent competition in Escherichia coli. Evolution 58:245–260.
Gern, L. 2008. Borrelia burgdorferi sensu lato, the agent of Lyme borreliosis:life in the wilds. Parasite 15:244–247.
Glor, R. E. 2010. Phylogenetic insights on adaptive radiation. Annu. Rev.Ecol. Evol. Syst. 41:251–270.
Habets, M. G., D. E. Rozen, R. F. Hoekstra, and J. A. de Visser. 2006. Theeffect of population structure on the adaptive radiation of microbialpopulations evolving in spatially structured environments. Ecol. Lett.9:1041–1048.
Hanincova, K., V. Taragelova, J. Koci, S. M. Schafer, R. Hails, A. J. Ullmann, J.Piesman, M. Labuda, and K. Kurtenbach. 2003. Association of Borreliagarinii and B. valaisiana with songbirds in Slovakia. Appl. Environ.Microbiol. 69:2825–2830.
Hanincova, K., K. Kurtenbach, M. Diuk-Wasser, B. Brei, and D. Fish. 2006.Epidemic spread of Lyme borreliosis, northeastern United States. Emerg.Infect. Dis. 12:604–611.
Hardin, G. 1960. The competitive exclusion principle. Science 131:1292–1297.
Harmon, L. J., J. A. Schulte, A. Larson, and J. B. Losos. 2003. Tempo andmode of evolutionary radiation in iguanian lizards. Science 301:961–964.
Higgins, D. G., and P. M. Sharp. 1988. CLUSTAL: a package for performingmultiple sequence alignment on a microcomputer. Gene 73:237–244.
Huelsenbeck, J. P., and F. Ronquist. 2001. MRBAYES: Bayesian inference ofphylogenetic trees. Bioinformatics 17:754–755.
Huelsenbeck, J. P., F. Ronquist, R. Nielsen, and J. P. Bollback. 2001. Bayesianinference of phylogeny and its impact on evolutionary biology. Science294:2310–2314.
Jasmin, J. N., and R. Kassen. 2007. On the experimental evolution of special-ization and diversity in heterogeneous environments. Ecol. Lett. 10:272–281.
Kassen, R. 2009. Toward a general theory of adaptive radiation: in-sights from microbial experimental evolution. Ann. N Y Acad. Sci.1168:3–22.
Kassen, R., and P. B. Rainey. 2004. The ecology and genetics of microbialdiversity. Annu. Rev. Microbiol. 58:207–231.
Kozak, K. H., D. W. Weisrock, and A. Larson. 2006. Rapid lineage accumula-tion in a non-adaptive radiation: phylogenetic analysis of diversificationrates in eastern North American woodland salamanders (Plethodontidae:Plethodon). Proc. R. Soc. Lond. B 273:539–546.
Kurtenbach, K., S. De Michelis, S. Etti, S. M. Schafer, H. S. Sewell, V. Brade,and P. Kraiczy. 2002. Host association of Borrelia burgdorferi sensulato–the key role of host complement. Trends Microbiol. 10:74–79.
Kurtenbach, K., K. Hanincova, J. I. Tsao, G. Margos, D. Fish, and N. H.Ogden. 2006. Fundamental processes in the evolutionary ecology ofLyme borreliosis. Nat. Rev. Microbiol. 4:660–669.
Larkin, M. A., G. Blackshields, N. P. Brown, R. Chenna, P. A. McGettigan,H. McWilliam, F. Valentin, I. M. Wallace, A. Wilm, R. Lopez, et al. 2007.Clustal W and Clustal X version 2.0. Bioinformatics 23:2947–2948.
Liu, L. 2008. BEST: Bayesian estimation of species trees under the coalescentmodel. Bioinformatics 24:2542–2543.
Liu, L., and D. K. Pearl. 2007. Species trees from gene trees: reconstructingBayesian posterior distributions of a species phylogeny using estimatedgene tree distributions. Syst. Biol. 56:504–514.
MacLean, R. C. 2005. Adaptive radiation in microbial microcosms. J. Evol.Biol. 18:1376–1386.
Margos, G., S. A. Vollmer, M. Cornet, M. Garnier, V. Fingerle, B. Wilske, A.Bormane, L. Vitorino, M. Collares-Pereira, M. Drancourt, et al. 2009.A new Borrelia species defined by multilocus sequence analysis ofhousekeeping genes. Appl. Environ. Microbiol. 75:5410–5416.
Margos, G., S. A. Vollmer, N. H. Ogden, and D. Fish. 2011. Populationgenetics, taxonomy, phylogeny and evolution of Borrelia burgdorferisensu lato. Infect. Genet. Evol. 11:1545–1563.
Martin, A. P., E. K. Costello, A. F. Meyer, D. R. Nemergut, and S. K.Schmidt. 2004. The rate and pattern of cladogenesis in microbes. Evo-lution 58:946–955.
McPeek, M. A. 2008. The ecological dynamics of clade diversification andcommunity assembly. Am. Nat. 172:E270–E284.
Morlon, H., M. D. Potts, and J. B. Plotkin. 2010. Inferring the dynamics ofdiversification: a coalescent approach. PLoS Biol. 8:e1000493.
Morlon, H., T. L. Parsons, and J. B. Plotkin. 2011. Reconciling molecular phy-logenies with the fossil record. Proc. Natl. Acad. Sci. USA 108:16327–16332.
Nee, S., A. O. Mooers, and P. H. Harvey. 1992. Tempo and mode of evolu-tion revealed from molecular phylogenies. Proc. Natl. Acad. Sci. USA89:8322–8326.
Nee, S., E. C. Holmes, R. M. May, and P. H. Harvey. 1994. Extinction ratescan be estimated from molecular phylogenies. Phil. Trans. R. Soc. Lond.B 344:77–82.
Nuttall, P. A. 1999. Pathogen-tick-host interactions: Borrelia burgdorferi andTBE virus. Zentralbl. Bakteriol. 289:492–505.
Nylander, J. A. A. 2004. MrModeltest v2. Program distributed by the author.Evolutionary Biology Centre, Uppsala University.
Phillimore, A. B., and T. D. Price. 2008. Density-dependent cladogenesis inbirds. PLoS Biol. 6:e71.
Piesman, J., and L. Gern. 2004. Lyme borreliosis in Europe and NorthAmerica. Parasitology 129(Suppl):S191–S220.
Pons, J., T. G. Barraclough, J. Gomez-Zurita, A. Cardoso, D. P. Duran,S. Hazell, S. Kamoun, W. D. Sumlin, and A. P. Vogler. 2006. Sequence-based species delimitation for the DNA taxonomy of undescribed in-sects. Syst. Biol. 55:595–609.
Posada, D., and K. A. Crandall. 1998. MODELTEST: testing the model ofDNA substitution. Bioinformatics 14:817–818.
Postic, D., M. Garnier, and G. Baranton. 2007. Multilocus sequence analy-sis of atypical Borrelia burgdorferi sensu lato isolates–description of
EVOLUTION AUGUST 2012 2 5 8 5

HELENE MORLON ET AL.
Borrelia californiensis sp. nov., and genomospecies 1 and 2. Int. J. Med.Microbiol. 297:263–271.
Purvis, A., S. Nee, and P. H. Harvey. 1995. Macroevolutionary inferencesfrom primate phylogeny. Proc. R. Soc. Lond. B 260:329–333.
Pybus, O. G., and P. H. Harvey. 2000. Testing macro-evolutionary models us-ing incomplete molecular phylogenies. Proc. R. Soc. Lond. B 267:2267–2272.
Qiu, W. G., S. E. Schutzer, J. F. Bruno, O. Attie, Y. Xu, J. J. Dunn, C.M. Fraser, S. R. Casjens, and B. J. Luft. 2004. Genetic exchange andplasmid transfers in Borrelia burgdorferi sensu stricto revealed by three-way genome comparisons and multilocus sequence typing. Proc. Natl.Acad. Sci. USA 101:14150–14155.
Rabosky, D. L. 2006. Likelihood methods for detecting temporal shifts indiversification rates. Evolution 60:1152–1164.
———. 2009. Ecological limits and diversification rate: alternative paradigmsto explain the variation in species richness among clades and regions.Ecol. Lett. 12:735–743.
Rabosky, D. L., and R. E. Glor. 2010. Equilibrium speciation dynamics in amodel adaptive radiation of island lizards. Proc. Natl. Acad. Sci. USA107:22178–22183.
Rabosky, D. L., and I. J. Lovette. 2008. Explosive evolutionary radiations:decreasing speciation or increasing extinction through time? Evolution62:1866–1875.
Rambaut, A., and A. J. Drummond. 2007. Tracer v1.4. Available at:beast.bio.ac.uk/Tracer. Accessed September 2009.
Revell, L. J., L. J. Harmon, and R. E. Glor. 2005. Underparameterized modelof sequence evolution leads to bias in the estimation of diversificationrates from molecular phylogenies. Syst. Biol. 54:973–983.
Richter, D., D. Postic, N. Sertour, I. Livey, F.-R. Matuschka, and G. Baranton.2006. Delineation of Borrelia burgdorferi sensu lato species by multi-locus sequence analysis and confirmation of the delineation of Borreliaspielmanii sp. nov. Int. J. Syst. Evol. Microbiol. 56:873–881.
Rokas, A., D. Kruger, and S. B. Carroll. 2005. Animal evolution and the molec-ular signature of radiations compressed in time. Science 310:1933–1938.
Rudenko, N., M. Golovchenko, L. Grubhoffer, and J. H. Oliver, Jr. 2009.Borrelia carolinensis sp. nov., a new (14th) member of the Borreliaburgdorferi sensu lato complex from the southeastern region of theUnited States. J. Clin. Microbiol. 47:134–141.
———. 2011. Borrelia carolinensis sp. nov., a new species of Borrelia
burgdorferi sensu lato isolated from rodents and tick from the south-eastern United States. Int. J. Syst. Evol. Microbiol. 61:381–383.
Rundell, R. J., and T. D. Price. 2009. Adaptive radiation, nonadaptive radiation,ecological speciation and nonecological speciation. Trends Ecol. Evol.24:394–399.
Sanderson, M. J. 2003. r8s: inferring absolute rates of molecular evolution anddivergence times in the absence of a molecular clock. Bioinformatics19:301–302.
Sanderson, M. J., and M. J. Donoghue. 1994. Shifts in diversification rate withthe origin of angiosperms. Science 264:1590–1593.
Schluter, D. 2000. The ecology of adaptive radiation. Oxford Univ. Press,New York.
Schuettpelz, E., and K. M. Pryer. 2009. Evidence for a Cenozoic radiation offerns in an angiosperm-dominated canopy. Proc. Natl. Acad. Sci. USA106:11200–11205.
Simpson, G. G. 1953. The major features of evolution. Columbia Univ. Press,New York.
Stadler, T. 2011. Mammalian phylogeny reveals recent diversification rateshifts. Proc. Natl. Acad. Sci. USA 108:6187–6192.
Swofford, D. L. 2003. PAUP". Phylogenetic analysis using parsimony ("andother methods). Sinauer Associates, Sunderland, MA.
Valente, L. M., V. Savolainen, and P. Vargas. 2010. Unparalleled rates ofspecies diversification in Europe. Proc. R. Soc. Sci. Lond. B 277:1489–1496.
van Dam, A. P. 2002. Diversity of Ixodes-borne Borrelia species–clinical,pathogenetic, and diagnostic implications and impact on vaccine devel-opment. Vector Borne Zoonotic Dis. 2:249–254.
Xu, G., Q. Q. Fang, J. E. Keirans, and L. A. Durden. 2003. Molecular phyloge-netic analyses indicate that the Ixodes ricinus complex is a paraphyleticgroup. J. Parasitol. 89:452–457.
Yoder, J. B., E. Clancey, S. Des Roches, J. M. Eastman, L. Gentry, W. Godsoe,T. J. Hagey, D. Jochimsen, B. P. Oswald, J. Robertson, et al. 2010.Ecological opportunity and the origin of adaptive radiations. J. Evol.Biol. 23:1581–1596.
Zink, R. M., and J. B. Slowinski. 1995. Evidence from molecular systematicsfor decreased avian diversification in the pleistocene Epoch. Proc. Natl.Acad. Sci. USA 92:5832–5835.
Associate Editor: P. Turner
Supporting InformationThe following supporting information is available for this article:
Figure S1. Phylogenetic trees inferred by maximum likelihood with a forced molecular clock for: (A) the three-locus tree(multilocus3), (B) the seven-locus tree (multilocus7), and (C) the chromosome tree (chromosome).Figure S2. Phylogenetic tree inferred by Bayesian Estimation of Species Trees (BEST).Figure S3. For most of the seven individual locus phylogenies trees, likelihood ratio tests indicate that the pure-birth model withdecaying diversification rate is significantly more likely than a pure-birth model with constant rate regardless of the assumednumber of species in the B. burgdorferi sl clade.
Supporting Information may be found in the online version of this article.
Please note: Wiley-Blackwell is not responsible for the content or functionality of any supporting information supplied by theauthors. Any queries (other than missing material) should be directed to the corresponding author for the article.
2 5 8 6 EVOLUTION AUGUST 2012


