Embed Size (px)
Citation preview

www.elsevier.com/locate/ymcne
Mol. Cell. Neurosci. 30 (2005) 291 – 303
Expression of reef coral fluorescent proteins in the central nervous
system of transgenic mice
Petra G. Hirrlinger,a,e,1 Anja Scheller,a,e,1 Christian Braun,a Markus Quintela-Schneider,b
Babette Fuss,c Johannes Hirrlinger,a,d and Frank Kirchhoff a,d,*
aDepartment of Neurogenetics, Max Planck Institute of Experimental Medicine, Gottingen, GermanybDepartment of Molecular Neurobiology, Max Planck Institute of Experimental Medicine, Gottingen, GermanycDepartment of Anatomy and Neurobiology, Virginia Commonwealth University, Richmond, VA 23284, USAdDFG Research Center for Molecular Physiology of the Brain (CMPB), Gottingen, GermanyeFreie Universitat Berlin, Section of Biology, Chemistry and Pharmacy, Berlin, Germany
Received 25 April 2005; revised 2 August 2005; accepted 22 August 2005
Reef coral fluorescent proteins (RCFPs) are bright fluorescent proteins
(FPs) covering a wide spectral range. We used various RCFP genes to
transgenically color different cell populations in the brain. The mouse
Thy1.2 promoter was used to target expression of HcRed1 in neurons,
the human glial fibrillary acidic protein (GFAP) promoter to label
astrocytes with AmCyan1, AsRed2 and mRFP1 as well as the mouse
proteolipid protein promoter to mark oligodendrocytes with DsRed1.
In brain sections of transgenic mice, RCFP expression was found to be
highly specific using immunohistochemistry and fluorescence micro-
scopy. In contrast to transgenic mice with expression of jellyfish FP
variants, RCFPs formed numerous fluorescent precipitates. These
aggregates were primarily found in cell somata and also in cell
processes. Older mice were more affected than younger ones. Despite
these fluorescent deposits, physiological properties of RCFP expressing
brain cells such as whole-cell membrane currents or glutamate-evoked
calcium signaling seemed to be unaffected.
While brightness and spectral variation of RCFPs are optimal for
expression in transgenic animals used in physiological experiments, the
formation of fluorescent precipitates in various cell types limits their
use for morphological cell analysis in situ.
D 2005 Elsevier Inc. All rights reserved.
Introduction
The jellyfish Aequorea victoria is the source for the most
commonly used reporter gene, the green fluorescent protein
(AvGFP). While the original AvGFP was rather dim and bleached
1044-7431/$ - see front matter D 2005 Elsevier Inc. All rights reserved.
doi:10.1016/j.mcn.2005.08.011
* Corresponding author. Department of Neurogenetics, Max Planck
Institute of Experimental Medicine, Hermann-Rein-Str. 3, 37075 Gottingen,
Germany. Fax: +49 551 3899 758.
E-mail address: [email protected] (F. Kirchhoff).1 Both authors contributed equally.
Available online on ScienceDirect (www.sciencedirect.com).
fast upon excitation, site-directed mutagenesis generated a series of
bright and spectrally distinct variants (Heim and Tsien, 1996; Heim
et al., 1994, 1995; Zhang et al., 1996).
In particular, transgenic mice with FP expression have been
used to study development and cell–cell interactions in the
nervous system. The TgN(hGFAP-S65T-GFP) was the first mouse
line which allowed the selective analysis of a defined population of
brain cells, the astrocytes, which are the major glial cell population
(Zhuo et al., 1997). In this line, the human glial fibrillary acidic
protein (hGFAP) promoter targets FP expression. S65T-GFP was
also used to label oligodendrocytes, the myelin-forming glial cells
(Fuss et al., 2000). Feng et al. (2000) took advantage of the Thy1.2
promoter to drive the expression of several FPs in neurons. Their
study also showed that different neuronal populations could be
studied simultaneously in double-transgenic mice (Feng et al.,
2000). The most common FP, enhanced GFP (EGFP), has also
been used to label astrocytes (Nolte et al., 2001), oligodendrocytes
(Mallon et al., 2002), and microglia (Jung et al., 2000). In the latter,
EGFP is targeted by homologous recombination to the CX3CR1
locus. The prevalent use of EGFP to generate various transgenic
mouse lines, combined with the strong spectral overlap of EGFP
with EYFP, impeded the analysis of structural interactions among
different cell types in transgenic mice.
In addition to these FPs from jellyfish, several new chromo-
proteins (RCFPs) were isolated from various reef coral Anthozoa
species (Fradkov et al., 2000; Gurskaya et al., 2001; Lukyanov et
al., 2000; Matz et al., 1999). RCFPs are characterized by their
bright fluorescence and spectral variation ranging from cyan to far
red. We used AmCyan1 (Anemonia majano, exc. 458 nm, em. 489
nm), DsRed1 (Discosoma sp., exc. 558, em. 583), AsRed2
(Anemonia sulcata, exc. 576 nm, em. 592 nm), and HcRed1
(Heteroactis crispa, exc. 588 nm, em. 618 nm) to generate
transgenic mouse lines with cell-type-specific, cytosolic expression
of RCFPs to study their practical use in a living organism. In
particular, we were interested in the question on how valuable

P.G. Hirrlinger et al. / Mol. Cell. Neurosci. 30 (2005) 291–303292
RCFPS are for physiological experiments or whether their long-
term expression might impair mouse development and brain
differentiation. In addition, we asked whether or not cell labeling
by RCFPs can be used to visualize and analyze structural
interactions. We used the well-characterized promoters of the
human GFAP, mouse PLP, and mouse Thy1.2 genes to target
expression in astrocytes, oligodendrocytes, and neurons, respec-
tively (Brenner et al., 1994; Caroni, 1997; Wight et al., 1993). In
addition, we used the modified variant of DsRed, monomeric RFP1
(exc. 584 nm and em. 607 nm; kindly provided by Roger Y. Tsien
(Campbell et al., 2002)) for expression in astrocytes to investigate
whether or not the oligomerization of RCFPs interferes with the
labeling of thin processes.
Results
Focusing on the central nervous system, we used the RCFPs
HcRed1, DsRed1, AmCyan1, AsRed2, and mRFP1 to selec-
tively label neurons, oligodendrocytes, and astrocytes. Trans-
Fig. 1. Cell-type-specific expression of fluorescent proteins in the brain of transgen
red (HcRed1, DsRed1, AsRed2, mRFP1) and cyan (AmCyan1) fluorescent protein
glial fibrillary acidic (hGFAP) promoter. (B) The Thy1.2-HcRed1 minigene i
fluorescence in pyramidal cell layers II and V of the cortex is shown. (C) Prot
oligodendrocytes. In the cerebellum, many red fluorescent oligodendrocytes outli
expression of AmCyan1, AsRed2, and mRFP1 in the major astroglial cell popu
expression. While AmCyan1 and mRFP1 were evenly distributed throughout ce
precipitates in the Bergmann glia somata. Panels (B–F) are confocal laser-scan
perfusion-fixed adult transgenic mice. ml, molecular layer; pc, Purkinje cell layer
genic mouse lines with functional fluorescent protein expression
could be obtained from all the constructs tested. In all lines,
RCFPs were expressed in a cell-type-specific manner (Fig. 1).
In addition to the characteristic cell morphology highlighted by
fluorescence microscopy, the analysis of the various transgenic
mouse lines by immunohistochemistry using the cell-type
markers glial fibrillary acidic protein (GFAP), myelin-associated
glycoprotein (MAG), and neuronal nuclei antigen (NeuN) for
astrocytes, oligodendrocytes, and neurons, respectively, substan-
tiated the cell-type-specific RCFP expression (Fig. 2). Similar to
transgenic mice with variants of GFP, RCFP transgenic mice
lived more than a year, were fertile, and showed no obvious
signs of developmental or behavioral abnormalities.
Transgenic mice with neuronal HcRed1 expression
(TgN(Thy1.2-HcRed1))
Four different transgenic mouse lines with functional HcRed1
expression were obtained with a distinct set of fluorescently
tagged neuronal populations (Fig. 3). First expression was
ic mice. (A) DNA constructs for oocyte injection were generated by placing
genes into either Thy1.2 and PLP minigenes or downstream from the human
nduced highly selective expression in projection neurons. Here, the red
eolipid protein (PLP)-DsRed1 minigene driven FP expression highlighted
ne the white matter tracts. (D–F) The hGFAP promoter induced high level
lation of the cerebellum, the Bergmann glia. Note the various degree of
ll bodies and processes (D, F), AsRed2 was expressed only as fluorescent
ning recordings obtained from frontal (B) and sagittal (C–F) sections of
; gl, granular layer; wm white matter.

Fig. 2. Immunohistochemical analysis confirmed cell-type-specific RCFP expression in transgenic mice. Cell-type-specific expression of RCFPs was further
substantiated by immunostaining against the cell markers GFAP, myelin-associated glycoprotein, and NeuN (neuronal nuclei antigen) for astrocytes,
oligodendrocytes, and neurons, respectively. (A–D) Expression of AmCyan1 (brain stem) and mRFP (hippocampus) in astrocytes, DsRed1 in
oligodendrocytes of the cerebellar white matter, and HcRed1 in hippocampal CA1 pyramidal neurons. (E–H) Immunostaining against GFAP (E–F),
myelin-associated glycoprotein (G), and NeuN (H). (I–L) Merges of RCFP expression and corresponding immunolabeling. Images were recorded by confocal
laser-scanning microscopy and represented as maximum intensity projections of stacks with a depth of 10 to 50 Am (A, C–E, GI, K and L). Panels (B, F and J)
are single confocal sections. Arrowheads indicate selected cells with co-expression of RCFPs and the respective immunolabel. The arrow in panels (A, E and I)
labels an astrocyte with a low level of AmCyan1 expression.
P.G. Hirrlinger et al. / Mol. Cell. Neurosci. 30 (2005) 291–303 293
detected as early as 6 days of postnatal development. Primarily,
major projection neurons such as pyramidal neurons of layer 2/3
and 6 (Fig. 3B) as well as CA1 neurons of the hippocampus
(Figs. 2D, H, L and 3E) expressed HcRed1. In some of these
lines, efferents of motor neurons of the spinal cord and afferents
of sensory neurons of the dorsal root ganglia were labeled (data
not shown). One line was particularly suited to study retinal
ganglion cells (data not shown). HcRed1 protein was detected
by its fluorescence in all parts of the neuron, such as soma,
axon, and dendrites. The expression of HcRed1 could still be
observed in old mice of more than 300 days of age.
Unexpectedly, numerous neuron populations of different brain
areas expressing HcRed1 showed red fluorescent protein
precipitates of about 1 to 2 Am in size (Figs. 2D and 3). These
aggregates were more pronounced in older mice (postnatal day
200 (P200), Figs. 3D, E, F) than in younger ones (P50, Figs.
3A, B, C). In addition, we saw a significant variability among
neuronal cell types. Aggregation was less common in cortical
pyramidal cells (Fig. 3B), but often seen in cerebellar Purkinje
cells (Figs. 3A, D).
Transgenic mice with oligodendroglial DsRed1 expression
(TgN(PLP-DsRed1))
The PLP-DsRed1 construct gave rise to four different lines with
oligodendroglial FP expression. Two of these showed strong and
highly selective labeling of oligodendrocytes in various brain
regions (Figs. 2C, G, K cerebellum; Figs. 4A cortex; B, C
hippocampus). These two lines were further investigated. Func-
tional transgene expression was detected as early as postnatal day 2
in oligodendrocytes of the brain stem. After 10 days, expression
could also be detected in telencephalic regions such as the corpus
callosum. In young (P21) oligodendrocytes, DsRed1 was also
found in the thin myelin-forming processes (Figs. 4A, B). However,
with cell maturation and myelin compaction, less FP was detected
in processes, and it remained restricted to cell somata and distal

Fig. 3. The fluorescent protein HcRed1 forms clusters in neurons. In various regions of the brain, with increasing age, HcRed1 formed fluorescent protein
deposits mainly in somata as well as in processes of projection neurons. (A and D) HcRed1 formed fluorescent clusters in Purkinje cell somata. Though already
visible at postnatal day 50 (A), HcRed1 deposits accumulated heavily until postnatal day 200 (D). (B and C) Neurons of the cortex or deep cerebellar nuclei of
P50 mice displayed no sign of protein aggregation, in contrast to neurones from older mice (P200; E, F). All images were recorded by laser-scanning
microscopy of brain sections obtained from perfusion-fixed transgenic mice.
P.G. Hirrlinger et al. / Mol. Cell. Neurosci. 30 (2005) 291–303294
processes. Similarly to the TgN(Thy1.2-HcRed1) mice, the DsRed1
protein also formed fluorescent aggregates which accumulated in
the cell somata (Fig. 4C), as well as the processes (Figs. 4A, B). In
addition, we observed regional variation and increased FP
aggregation in older mice (more than a few weeks old) compared
to early postnatal mice.
Fig. 4. DsRed1 was abundantly expressed in somata and processes of oligodendr
highlighted the three-dimensional structure of oligodendrocytes in cortex (A) a
transgenic brain sections. (C) After reducing the detector gain of the CLSM, DsRe
in panel [B]). These precipitates were already detectable in the first postnatal we
Transgenic mice with astroglial AsRed2 or AmCyan1 expression
As expected, the other RCFPs AsRed2 and AmCyan1 gave
rise to transgenic mice with cell-type-specific fluorescent labeling
as well. In these mice, the human GFAP promoter was used to
target RCFPs into another neural cell population, the astrocytes
ocytes, but also forms fluorescent deposits. (A and B) DsRed1 expression
nd hippocampus (B) recorded by confocal laser-scanning microscopy of
d1 clusters became evident within the oligodendroglial soma (same view as
eks (P21; A–C) and accumulate with age.
P.G. Hirrlinger et al. / Mol. Cell. Neurosci. 30 (2005) 291–303 295
(Figs. 1D, E, 2A and 5). In the case of the GFAP-AsRed2 construct,
however, we obtained one putative female founder, which had only
non-transgenic offspring. After sacrificing this TgN(GFAP-
AsRed2) mouse, we found that AsRed2 was expressed in the brain,
but only in solid fluorescent aggregates. The cell-type-specific
expression could be determined by their selective presence in
Bergmann glia somata, which can unequivocally be identified by
their location within the cerebellar Purkinje cells (Fig. 1E). In
contrast, the GFAP-AmCyan1 transgene generated a mouse line
with bright fluorescent astrocytes in several regions of the central
nervous system (Figs. 1D, 2A, 5) such as cortex, brain stem, and
striatum. However, AmCyan1 expression was highest within the
cerebellar Bergman glial cells. As it has been described previously,
reporter gene expression driven by the human GFAP promoter can
label at least two distinct astroglial cell populations which are
characterized by different expression levels of the transgene (Grass
et al., 2004; Matthias et al., 2003). Also, in our transgenic mice
expressing AmCyan1 under the control of the human GFAP
promoter, a second distinct astroglial cell population with a low
transgene level and lack of GFAP immunoreactivity could be
discerned (Fig. 2A).
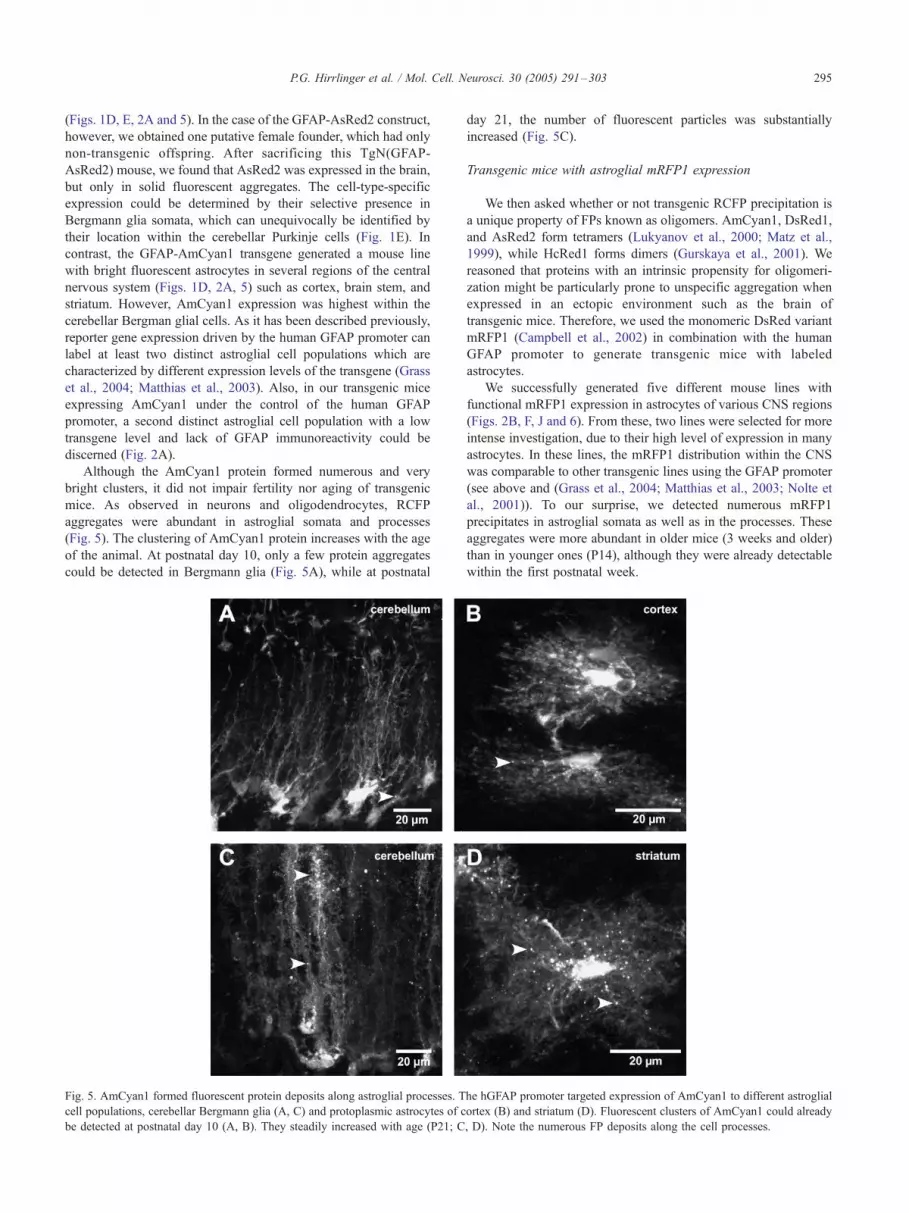
Although the AmCyan1 protein formed numerous and very
bright clusters, it did not impair fertility nor aging of transgenic
mice. As observed in neurons and oligodendrocytes, RCFP
aggregates were abundant in astroglial somata and processes
(Fig. 5). The clustering of AmCyan1 protein increases with the age
of the animal. At postnatal day 10, only a few protein aggregates
could be detected in Bergmann glia (Fig. 5A), while at postnatal
Fig. 5. AmCyan1 formed fluorescent protein deposits along astroglial processes. T
cell populations, cerebellar Bergmann glia (A, C) and protoplasmic astrocytes of c
be detected at postnatal day 10 (A, B). They steadily increased with age (P21; C
day 21, the number of fluorescent particles was substantially
increased (Fig. 5C).
Transgenic mice with astroglial mRFP1 expression
We then asked whether or not transgenic RCFP precipitation is
a unique property of FPs known as oligomers. AmCyan1, DsRed1,
and AsRed2 form tetramers (Lukyanov et al., 2000; Matz et al.,
1999), while HcRed1 forms dimers (Gurskaya et al., 2001). We
reasoned that proteins with an intrinsic propensity for oligomeri-
zation might be particularly prone to unspecific aggregation when
expressed in an ectopic environment such as the brain of
transgenic mice. Therefore, we used the monomeric DsRed variant
mRFP1 (Campbell et al., 2002) in combination with the human
GFAP promoter to generate transgenic mice with labeled
astrocytes.
We successfully generated five different mouse lines with
functional mRFP1 expression in astrocytes of various CNS regions
(Figs. 2B, F, J and 6). From these, two lines were selected for more
intense investigation, due to their high level of expression in many
astrocytes. In these lines, the mRFP1 distribution within the CNS
was comparable to other transgenic lines using the GFAP promoter
(see above and (Grass et al., 2004; Matthias et al., 2003; Nolte et
al., 2001)). To our surprise, we detected numerous mRFP1
precipitates in astroglial somata as well as in the processes. These
aggregates were more abundant in older mice (3 weeks and older)
than in younger ones (P14), although they were already detectable
within the first postnatal week.
he hGFAP promoter targeted expression of AmCyan1 to different astroglial
ortex (B) and striatum (D). Fluorescent clusters of AmCyan1 could already
, D). Note the numerous FP deposits along the cell processes.

Fig. 6. The monomeric red fluorescent protein mRFP1 formed fluorescent protein deposits in transgenic mice. Similar to the TgN(hGFAP-AmCyan1) mice, the
monomeric red fluorescent protein mRFP1 was selectively targeted to astroglial cells of the cerebellum (A), hippocampus (B), cortex (C), and brain stem (D).
Surprisingly, numerous fluorescent precipitates were also found in this transgenic mouse line, even during the early postnatal weeks (P14; A–D).
P.G. Hirrlinger et al. / Mol. Cell. Neurosci. 30 (2005) 291–303296
Fluorescent protein precipitates are aggregates of the respective
RCFPs
To further characterize the identity of the fluorescent ag-
gregates, we performed spectral analysis using multi-channel
laser-scanning microscopy (Figs. 7A, B). We selected areas of
cells with normal soluble RCFP expression as well as those with
fluorescent clusters. Both types of regions were scanned in the
wavelength (lambda) scanning mode using the multi-channel
detector of the laser-scanning microscope. In particular, we
investigated the precipitates of AmCyan1 and DsRed1 (Figs.
7A, B). No significant differences of the various emission spectra
could be detected between regions of obvious soluble or insoluble
RCFPs. Therefore, we conclude that the observed fluorescent
protein aggregates consist mainly of the respective, unmodified
RCFP.
Transient transfection of cell lines is not sufficient for RCFP
aggregation
To study the RCFP deposition in culture, we transfected
different cell lines such as human embryonic kidney (HEK293)
and Chinese hamster ovary (CHO) cells with vectors in which the
RCFPs AsRed2, AmCyan1, and mRFP1 (Figs. 7C–E) are driven
by the cytomegalovirus (CMV) promoter. Cells were investigated
24 and 48 h after transfection by confocal laser-scanning micro-
scopy. All the tested RCFPs displayed a similar, uniform cytosolic
expression within the cells (Figs. 7C–E). Fluorescent deposits
were not detected. From these data, we conclude that short-term
(48 h and less) expression is not sufficient to induce RCFP
deposition.
The jellyfish variants of GFP do not form aggregates
In general, the formation of fluorescent deposits is not a
phenomenon of ectopic overexpression of fluorescent proteins. We
also studied the distribution of FP variants derived from the
jellyfish GFP in transgenic mice. For this purpose, we investigated
several transgenic mouse lines expressing EGFP (2 lines, Fig. 7F)
or ECFP (1 line, Fig. 7H) under the control of the hGFAP promoter
in astrocytes and expressing EYFP driven by the Thy1.2 promoter
in neurons (7 lines, Fig. 7G) (unpublished and Nolte et al., 2001).
In contrast to mice expressing RCFPs, we did not detect clusters of
fluorescent proteins in mice expressing the jellyfish FP variants
(Figs. 7F, G, H), even at older ages.
RCFP deposits do not change the properties of resting membrane
currents and glutamate evoked Ca2+ signaling
To evaluate whether transgenic RCFP expression interferes
with the cellular physiology, we applied whole-cell patch-clamp
recordings and Ca2+ imaging to acutely isolated brain slices (Fig.
8). In current clamp mode, positive current injections into
identified cortical pyramidal cells (resting membrane potential
Vmem = �62 mV T 6 mV, n = 15, P4–P20) evoked a series of
action potentials which resemble wild-type recordings (Figs. 8A–
C) (Larkum et al., 2001). Simultaneous filling of the patch-
clamped neuron with Lucifer Yellow revealed its detailed structure

Fig. 7. Comparison of reef coral fluorescent proteins with GFP variants from jellyfish. (A, B) The emission spectra of fluorescent deposits (squares) and soluble
RCFPs (circles) (A, AmCyan1, exc. 458 nm; B, DsRed1, exc. 543 nm) did not reveal significant differences. Using the multi-channel detector of the laser-
scanning microscope, emission spectra were recorded in somatic cell regions with either fluorescent aggregates (small yellow circles) or uniform fluorescence
(large yellow circles) of transgenic brain sections. Emission spectra are displayed as mean values T SD of n = 21 (AmCyan1, aggregated), n = 21 (AmCyan1,
soluble), n = 36 (DsRed1, aggregated), and n = 14 (DsRed1, soluble) recordings. (C–E) Transient transfection of various cell lines with RCFP vectors under
the cytomegalovirus promoter was not sufficient to induce FP aggregation. (C) Human embryonic kidney (HEK) cells transfected with AsRed2; (D) HEK cells
transfected with AmCyan1; (E) Chinese hamster ovary (CHO) cells transfected with mRFP1. (F–H) Transgenic mice generated with similar constructs but
using the jellyfish FP variants EGFP, EYFP, and ECFP did never show fluorescent protein precipitates. CLSM recordings from TgN(hGFAP-EGFP),
TgN(Thy1.2-EYFP), and TgN(hGFAP-ECFP) revealed uniform fluorescence in hippocampal protoplasmic astrocytes (F) and pyramidal neurons (G) as well as
cortical astrocytes contacting brain capillaries (H), respectively.
P.G. Hirrlinger et al. / Mol. Cell. Neurosci. 30 (2005) 291–303 297
(Fig. 8B). Analysis of oligodendrocytes in the white matter of the
cerebellum and midbrain (Vmem = �64 mV T 10 mV, n = 20, P6–
P25; Figs. 8D–F) as well as astrocytes in the cortex (Vmem = �77
mV T 12 mV, n = 4, P6; Figs. 8G–I) in voltage-clamp mode
showed unequivocally the dominance of symmetrical almost non-
rectifying, Ohmic potassium currents (Berger et al., 1991; Fuss et
al., 2000; Grass et al., 2004; Matthias et al., 2003). Both cell types
showed a slightly higher expression of inward currents when

P.G. Hirrlinger et al. / Mol. Cell. Neurosci. 30 (2005) 291–303298

P.G. Hirrlinger et al. / Mol. Cell. Neurosci. 30 (2005) 291–303 299
hyperpolarizing voltage steps were applied (Figs. 8E and H). This
is often observed in mature glial cells. At large depolarizing steps,
oligodendrocytes showed some apparent inactivation of outward
currents and larger tail currents (Fig. 8H). This behavior is very
typical for oligodendrocytes and represents a shift in the K+
equilibrium potential due to the restricted extracellular space in
myelinated tissue (Berger et al., 1991).
Astrocytes display various responses to the excitatory trans-
mitter glutamate (Verkhratsky and Kettenmann, 1996). In the
hippocampus of early postnatal mice (P2 to P4), we investigated
glutamate-evoked Ca2+ transients by confocal laser-scanning
microscopy (Figs. 8J–L). Frontal cortical slices of TgN(hGFAP-
mRFP1) mice were loaded with the Ca2+ indicator dye Fluo4-AM.
Signals from astrocytes could unequivocally be identified by the
astroglial mRFP1 expression. Short bath application of glutamate
(1 mM in aCSF for 1 min) evoked reliable Ca2+ signals with various
kinetics. In some of the cells, spontaneous Ca2+ oscillations prior to
glutamate application could be observed (Figs. 8J–L, cell #3).
Discussion
A series of transgenic mice were generated, which functionally
express various reef coral fluorescent proteins (RCFPs) driven by
various promoters. The mouse Thy1.2, the mouse proteolipid
protein (PLP), and the human glial fibrillary acidic protein
(hGFAP) promoters are well-characterized DNA elements targeting
specific expression in the major neural cell types: neurons,
oligodendrocytes, and astrocytes, respectively. Indeed, RCFP
expression was highly cell-type specific in the nervous system of
our transgenic mice. As expected from the above promoters which
are rather sensitive to their site of chromosomal transgene
insertion, each of the RCFP transgenes showed a variable
percentage of labeled cells not only in different brain regions but
also among different mouse lines.
Transgenic expression of various reef coral fluorescent proteins is
possible in several cell types of the brain
In contrast to the abundant and versatile use of jellyfish GFP
variants as reporters in transgenic mice (for reviews, see
Hadjantonakis et al., 2003; Hadjantonakis and Nagy, 2001), there
are only a few reports describing transgenic expression of RCFP
variants. So far, RCFPs have mainly been used to generate
transgenic plants (Jach et al., 2001; Wenck et al., 2003),
invertebrates (Verkhusha et al., 2001), or lower vertebrates (Finley
Fig. 8. RCFP expression did not change physiological properties such as whole-c
clamp analysis of cortical pyramidal cell (P16) expressing HcRed1. (A) Confoc
Dialysis with Lucifer Yellow-containing pipette solution highlighted the investig
injections induced a series of action potentials. (D–F) Patch-clamp analysis of
Epifluorescence image recorded by a CCD camera. The arrowhead points to the p
symmetrical, almost non-rectifying in- and outward currents. (F) The I/V relat
equilibrium potential indicating that the resting membrane conductance was prima
expressing astrocyte in voltage-clamped mode. (G) Epifluorescence image recorde
of hyper- and depolarizing voltage steps induced symmetrical, almost not-rectifyin
showed current reversal close to the K+ equilibrium potential indicating that th
Glutamate-evoked Ca2+ signaling in acutely isolated brain slices of hGFAP-mRFP
from a 4-day-old TgN(hGFAP-mRFP1) mouse. Numerous astrocytes were detecta
widespread loading of the slice with the green fluorescent Ca2+ indicator dye F
changes (in arbitrary units) reflect the variety of Ca2+ signals in astrocytes. The ci
panel (L). Note Ca2+ oscillations in cell 3 prior to glutamate application.
et al., 2001; Zhu and Zon, 2004). However, there are also few
reports describing the successful generation of transgenic rats with
DsRed2 expression in liver (Sato et al., 2003), as well as transgenic
mice with DsRed1 expression in different tissues composed of
smooth muscle (Magness et al., 2004). Very recently, transgenic
mice with ubiquitous expression of mRFP1 have been described
(Long et al., 2005; Zhu et al., 2005). Unfortunately, the authors did
not show high-resolution images allowing a detailed evaluation at
the cellular and subcellular level. Transgenic expression of RCFPs
in the nervous system has so far only been described in two
studies: in different types of neurons, DsRed1 was targeted by the
Thy1.2 promoter (Feng et al., 2000), and in catecholamine neurons
of the retina and the substantia nigra, DsRed2 was driven by the
tyrosine hydroxylase promoter (Zhang et al., 2004). Others,
however, reported severe problems in establishing DsRed1 trans-
genic mouse lines via embryonic stem cell-mediated transgenesis
(Hadjantonakis et al., 2002). Using the cre/loxP system, problem-
atic expression during embryo development can be circumvented
(Vintersten et al., 2004). Since the human GFAP promoter is active
as early as day 11 of gestation in radial glia which represent a vital
neural progenitor cell population during embryonic development
(Malatesta et al., 2003), our data suggest that RCFP expression
does not impair brain differentiation or mouse development.
Our study shows that various RCFPs can be used in several cell
types as a conventional transgenic label. Since RCFPs display awide
spectral range, these mice are extremely helpful in cell-specific
analysis when combined with a wide variety of dyes for functional
imaging such as fluorescent calcium or voltage indicator dyes. Our
physiological analysis of various cell types with transgenic RCFP
expression suggests that important cellular properties are not
affected and well comparable with those of wild-type cells.
Transgenic expression of RCFPs is accompanied by fluorescent
protein deposition
We were successful in transgenic labeling of neurons, astro-
cytes, and oligodendrocytes with spectrally different RCFPs.
Different cell types of the brain could be highlighted and easily
identified; for example, for use in physiological studies such as
patch-clamp recordings or Ca2+ imaging. The property of RCFPs
to form fluorescent aggregates, however, deteriorates a morpho-
logical analysis. Fluorescent deposits of all RCFPs (AmCyan1,
DsRed1, AsRed2, HcRed1, and mRFP1) were found in the somata,
as well as processes of cells. Not all cell types of the same class
(like different neuronal populations or oligodendrocytes in differ-
ent brain regions) were similarly affected. In some cells, we
ell membrane currents or glutamate-evoked Ca2+ signals. (A–C) Current
al laser-scan recording showing several HcRed1-expressing neurons. (B
ated neuron (arrowhead). (C) Neuronal depolarization by positive curren
a DsRed1-expressing oligodendrocyte (P6) in voltage-clamped mode. (D
atch pipette. (E) A series of hyper- and depolarizing voltage steps induced
ionship of the evoked currents showed current reversal close to the K+
rily carried by K+ ions. (G– I) Patch-clamp analysis of a cortical, mRFP1
d by a CCD camera. The arrowhead points to the patch pipette. (H) A series
g in- and outward currents. (I) The I/V relationship of the evoked currents
e resting membrane conductance is primarily carried by K+ ions. (J–L
1 transgenic mice. (J) Single optical section through a brain slice obtained
ble due to their intense red fluorescence. (K) CLSM recording revealed the
luo4-AM. (L) Glutamate-evoked (1 mM for 1 min) fluorescence intensity
rcles in panels (J and K) outline the cells which responses are displayed in
-
)
t
)
-
)

P.G. Hirrlinger et al. / Mol. Cell. Neurosci. 30 (2005) 291–303300
detected fluorescent clusters, while they were missing in others. In
addition, we observed an increase in cluster formation during aging
of mice. We conclude that the continuous accumulation of proteins
in a given cell leads to concentration and time-dependent
precipitation of RCFPs. In transient short-term transfection experi-
ments, we did not observe any fluorescent deposits. It is most
likely due to the cell-type-specific catabolism of ectopic proteins,
which determines the aggregation threshold. In addition, this
threshold by itself is an intrinsic function of RCFPs, since the
spectral comparison of aggregated versus soluble RCFP did not
show significant differences. Therefore, we exclude gross mod-
ifications of RCFPs by oxidation or other mechanisms as a cause
for aggregation. In contrast, the aggregation of RCFPs seems to be
an intrinsic property of this protein family, since transgenic mice
with jellyfish FP variants are devoid of fluorescent aggregates (our
own study and Belachew et al., 2003; Feng et al., 2000; Mallon et
al., 2002; Nolte et al., 2001). The aggregation is independent of the
oligomerization of RCFPs, which exists normally as tetramers or
dimers (Matz et al., 1999), since exchange of amino acids which
are responsible for tetramerization of DsRed (Campbell et al.,
2002) does not prevent deposition of insoluble protein as seen with
the monomeric RFP1. RCFP aggregation is a time-dependent
process. While cells in culture expressing the proteins for a short
time (<48 h) show no RCFP aggregates, long-term expression in
transgenic mice is accompanied by a widespread RCFP deposition.
This is underlined by the observation that young animals show less
aggregates than older ones.
Protein aggregates have been considered a major pathogenic
principle in a number of neurodegenerative disorders such as
Alzheimer disease or Parkinson disease (Ross and Poirier, 2004;
Shastry, 2003; Taylor et al., 2002). RCFP aggregates, however, do
not obviously interfere with the normal life of the transgenic mice.
These mice have a normal life expectancy and their breeding
behavior is comparable to other mice, except of the TgN(GFAP-
AsRed2), which is probably due to an unfavorable genomic
integration. When investigated in the cage, obvious behavioral
abnormalities were not detected. Therefore, protein aggregates as
such seem not to be toxic. Disease-related protein aggregates are
specific properties of these proteins or their intermediates formed
during precipitation (Agorogiannis et al., 2004).
Conclusion
Reef coral fluorescent proteins represent a versatile class of
proteins which possess a broad spectral variation. As such, they are
perfectly suited to label various cell populations in transgenic mice
and can be used in combination with various fluorescent indicator
dyes in physiological studies. However, their tendency to form
fluorescent protein deposits in cell somata as well as processes
limits their use for morphological analysis as well as their
application as fusion proteins, at least in transgenic mice.
Experimental methods
Cloning of vectors used to generate transgenic mice
Vectors encoding AmCyan1, DsRed1, AsRed2, and HcRed1
were purchased from BD Biosciences/Clontech (Heidelberg). The
mRFP1 vector was kindly provided by Roger Y. Tsien (University
of California, San Diego). For cell-type-specific expression in
astrocytes, the human GFAP promoter was PCR amplified from a
pGFAP-EGFP vector (Nolte et al., 2001) using sense primer 5V-ACC TCC ATTAAT CCC ACC TCC CTC TCT GTG CTG-3V andanti-sense primer 5V-GCT CCT CGC CCT TGC TCA CCA-3V andthe AseI/AgeI fragment of the product was cloned into
pAmCyan1-C1 and pAsRed2-N1. The mRFP1 was amplified
from pRSETB-mRFP1 using sense primer 5V-ACC GGT CGC
CAC CAT GGC CTC CTC CG-3V and anti-sense primer 5V-TCAAGC TTC GAA TTC TTA GGC GCC-3V. The BamHI/EcoRI
fragment of the product was cloned into the corresponding sites of
pGFAP-AmCyan1-C1. To label oligodendrocytes, the cDNA
sequence coding for DsRed1 was isolated from pDsRed1-1
(Clontech) as a HindIII-NotI fragment and inserted into the PLP
promoter construct as described previously (Fuss et al., 2000). To
label neurons, a construct was generated by cloning the open
reading frame of HcRed1 into the XhoI site of the Thy1.2-
minigene as described (Caroni, 1997; Feng et al., 2000). The
Thy1.2 minigene consists of 6.5 kb of the murine Thy1.2 gene
from the promoter to the intron following exon 4, but lacking exon
3 and its flanking introns (see Fig. 1A).
Cell culture and transfection
To prove functional cytosolic expression of the various FPs,
human embryonic kidney cells (HEK293) and Chinese hamster
ovary (CHO) cells were transiently transfected. HEK293 cells were
cultured in Dulbecco’s modified Eagle Medium (Gibco) supple-
mented with 5% fetal bovine serum. CHO cells were cultured in
F12 HAM medium supplemented with 10% fetal bovine serum.
For transfection, cells were plated onto coverslips (12 mm in
diameter) in 24-well plates and transfected at approximately 75%
density. Expression of all RCFPs was driven by the cytomegalo-
virus (CMV) promoter. Transfection was performed with Lip-
ofectamini 2000 (Invitrogen) according to the manufacturer’s
protocol. Cells were washed once with phosphate-buffered saline
(PBS) 24 or 48 h after transfection and fixed with 4%
paraformaldehyde in 100 mM sodium phosphate buffer (PFA).
Generation of transgenic mice
Transgenic mice were generated by injection of their respective
linear transgene-containing construct into the pronucleus of
fertilized oocytes obtained from FVB/N or C57BL/6J mouse
strains. Mice were kept in the mouse facility of the institute
according to national and European guidelines for the welfare of
experimental animals. Putative transgenic founders were identified
by PCR genotyping of tail-tip DNA and subsequently crossbred to
wild-type mice. Positively genotyped F1 litters of transgenic
founders were screened for functional FP expression using
epifluorescence and laser-scanning microscopy. All transgene
constructs gave rise to functional expression in adult mice. Lines
with functional FP expression were bred further and investigated.
Cell-type-specific expression of FPs was readily identified, since
RCFP-mediated fluorescence highlights the characteristic mor-
phology of astrocytes, oligodendrocytes, and neurons.
Tissue fixation and immunohistochemistry
Transgenic mice were anesthetized with 2.5% 2,2,2-tribromoe-
thanol in H2O (100 Al/10 g body weight) and perfused trans-

P.G. Hirrlinger et al. / Mol. Cell. Neurosci. 30 (2005) 291–303 301
cardially with Hank’s Balanced Salt Solution (HBSS, Gibco)
followed by perfusion with PFA for 15 min. The brain was
removed and incubated in PFA over night at 4-C. For analysis oftransgenically expressed fluorescent proteins, 100 Am sagittal or
horizontal vibratome sections (Leica VT 1000S, Leica Instruments,
Nussloch, Germany) were investigated by epifluorescence or laser-
scanning microscopy. Immunohistochemical labeling was per-
formed on 50 Am free-floating vibratome slices at room temper-
ature. Cells were permeabilized with 0.4% Triton-X100 in PBS for
30 min and then blocked for 30 min in 4% fetal calf serum (FCS)
with 0.2% Triton-X100 in PBS. The slices were incubated over
night at 4-C in 1% FCS and 0.05% Triton-X100 in PBS with the
following first antibodies: monoclonal anti-GFAP (mouse, 1:200,
Novocastra), monoclonal anti-neuronal nuclei antigen (NeuN,
mouse, 1:100, Chemicon), or monoclonal anti-myelin associated
glycoprotein (MAG, 1:200, Chemicon). Slices were washed twice
in PBS for 5 min and incubated with Cy2- or Alexa 488-
conjugated secondary antibodies (1:1000, Dianova; 1:2000 Mobi-
tec) for 2 h in 1.5% FCS in PBS. After washing twice in PBS,
slices were mounted with Immu-Mount (Shandon).
Confocal laser-scanning microscopy
Fixed brain sections were investigated by confocal laser-
scanning microscopy (Zeiss LSM 510NLO, Axiovert 200M)
equipped with laser lines at 458/488/514, 543 and 633 nm. The
following laser lines and emission filters were used for excitation
and emission: 458 nm/BP 473–526 or BP 480–520 IR
(AmCyan1), 458 nm/BP 480–520 IR or BP 462–548 (ECFP),
488 nm/BP 500–530 IR (EGFP), 488 nm/BP500–550 IR (Cy2
and Alexa 488), 514 nm/BP 526–580 (EYFP), 543 nm/LP 560
(HcRed1/mRFP1), 543 nm/BP 565–615 IR (DsRed1), 543 nm/BP
558–623 (AsRed2). Three-dimensional image stacks were
recorded with frame sizes of 512 � 512 pixels or 1024 � 1024
pixels. Shown are maximum intensity projections from stacks with
a depth of 10 to 50 Am, except of the immunohistochemistry of
TgN(hGFAP-mRFP1) which is a single optical plane. All confocal
images were stored and processed with the Zeiss LSM Software,
ImageJ or Adobe Photoshop.
Emission spectra of AmCyan1 and DsRed1 were recorded at
10.7 nm resolution using the Zeiss LSM510 Meta system. FPs
were excited at 458 nm and 543 nm, respectively. For analysis of
emission spectra, regions of interest were examined in areas
consisting of obvious aggregates or where a diffuse fluorescence
indicated soluble protein. Spectra were normalized to the max-
imum (set as 100) and averaged.
Recording of calcium signals by laser-scanning microscopy
Astroglial calcium responses to glutamate (1 mM in artificial
cerebrospinal fluid, aCSF; in mM: 125 NaCl, 2.5 KCl, 2 CaCl2, 1
MgCl2, 1.25 NaH2PO4, 25 NaHCO3, and 25 d-glucose; 330
mosm/l, pH7.4) were observed in acutely isolated brain slices
obtained from TgN(hGFAP-mRFP1) transgenic mice. Frontal
slices (200 Am) were prepared from the brain of postnatal 4-day-
old mice. The slices were placed in carbogenated (95% oxygen/5%
carbon dioxide) aCSF at 35-C for 10 min, subsequently kept at
room temperature for 45 min, stained with 1 AM Fluo-4-AM
(Molecular Probes) for 45 min, and washed for at least 30 min in
aCSF. Slices were transferred to the recording chamber and
continuously perfused with aCSF (room temperature; 20–23-C).
Fluo-4 fluorescence was excited at 488 nm and recorded using a BP
500–530 emission filter. Before starting Ca2+ imaging, a mRFP1
image was acquired (Ex 543nm, Em LP 560) to unequivocally
identify astrocytes. 1 mM glutamate in aCSF was applied to the bath
for 1min, followed bywashingwith aCSF until the end of recording.
Fluo-4 fluorescence was recorded at about 1-Hz repetition rate with
a spatial resolution of 0.5 Am (512 � 512 pixels).
Electrophysiology
Acute 200 Am frontal sections were obtained from mice
(TgN(hGFAP-mRFP1), TgN(mPLP-DsRed1) and TgN(mThy1.2-
HcRed1)) of postnatal days 4–20. Mice were decapitated, the brain
was dissected and placed in ice-cooled, carbogen-saturated aCSF.
Slices were stored in aCSF at 35-C for 10 min and then placed at
room temperature (20–23-C) for at least 20 min before experi-
ments were started. Subsequently, slices were transferred to the
recording chamber and kept submerged by a platinum grid with
nylon threads (Edwards et al., 1989) for mechanical stabilization.
The chamber was mounted on an upright microscope (Axioscope 2
FSmot, Zeiss, Germany) and continuously perfused with aCSF
(room temperature; 20–23-C) at a flow rate of 2–5 ml/min. Cells
(neurons, oligodendrocytes, and astrocytes) were identified by their
red fluorescence in the epifluorescence illumination (excitation 560
nm; Polychrome II, TILL Photonics, Grafelfing Germany). Images
of astrocytes and oligodendrocytes were taken with a CCD camera
(Princeton Instruments, Trenton, USA) and the MetaMorph
imaging software (Visitron Systems, Puchheim, Germany).
Whole-cell voltage-clamp recordings were obtained with an
EPC9/2 double patch-clamp amplifier (HEKA, Lambrecht/Pfalz,
Germany). Patch electrodes were pulled from borosilicate glass
capillaries (Hilgenberg, Malsfeld, Germany) on a horizontal pipette
puller (P-2000, Sutter Instruments, Germany) and filled with (in
mM) 125 K-Gluconate, 1 CaCl2, 2 MgCl2, 4 Na2ATP, 10 EGTA,
10 HEPES (pH adjusted to 7.2 with KOH). The resistance of the
pipettes was between 2 and 6 MV.
Currents were low-pass filtered at 3 kHz, recorded at 20 kHz
using Patchmaster 1.0 software (HEKA, Lambrecht/Pfalz, Ger-
many), and stored for off-line analysis. The analysis was performed
with IGOR Pro Version 4.0 (Wavemetrics, Inc., USA). Glial cells
were voltage-clamped at �70 mV (Vhold). Whole-cell membrane
currents were evoked by a series of hyper- and depolarizing
voltage steps ranging from �130 to 50 mV with an increment of 10
mV. Under voltage-clamp neurons were clamped at �60 mV. After
switching into the current-clamp mode, various hyper- and
depolarizing currents were injected (�30 pA to +250 pA) into
the soma.
During electrophysiological experiments, selected neurons were
dialyzed with Lucifer Yellow (3 mM in pipette solution, Molecular
Probes) for 5–10 min. After filling, slices were fixed in PFA for 2
h and visualized by confocal microscopy as described above.
Acknowledgments
This work was supported by the Deutsche Forschungsgemein-
schaft through the DFG Research Center for Molecular Physiology
of the Brain (CMPB grant to F.K.) and a priority program grant
(SPP 1172 to F.K.). In addition, the authors wish to thank Adriane
Mosley for the valuable comments on the manuscript, Simone
Schmidt for the DNA injections, Daniel Flemming and Rainer

P.G. Hirrlinger et al. / Mol. Cell. Neurosci. 30 (2005) 291–303302
Libal for the animal husbandry and mouse database management.
The generous support of Klaus-Armin Nave to this project is
particularly acknowledged.
References
Agorogiannis, E.I., Agorogiannis, G.I., Papadimitriou, A., Hadjigeorgiou,
G.M., 2004. Protein misfolding in neurodegenerative diseases. Neuro-
pathol. Appl. Neurobiol. 30 (3), 215–224.
Belachew, S., Chittajallu, R., Aguirre, A.A., Yuan, X., Kirby, M., Anderson,
S., Gallo, V., 2003. Postnatal NG2 proteoglycan-expressing progenitor
cells are intrinsically multipotent and generate functional neurons. J. Cell
Biol. 161 (1), 169–186.
Berger, T., Schnitzer, J., Kettenmann, H., 1991. Developmental changes
in the membrane current pattern, K+ buffer capacity, and morphol-
ogy of glial cells in the corpus callosum slice. J. Neurosci. 11 (10),
3008–3024.
Brenner, M., Kisseberth, W.C., Su, Y., Besnard, F., Messing, A., 1994.
GFAP promoter directs astrocyte-specific expression in transgenic mice.
J. Neurosci. 14 (3 Pt. 1), 1030–1037.
Campbell, R.E., Tour, O., Palmer, A.E., Steinbach, P.A., Baird, G.S.,
Zacharias, D.A., Tsien, R.Y., 2002. A monomeric red fluorescent
protein. Proc. Natl. Acad. Sci. U. S. A. 99 (12), 7877–7882.
Caroni, P., 1997. Overexpression of growth-associated proteins in the
neurons of adult transgenic mice. J. Neurosci. Methods 71 (1), 3–9.
Edwards, F.A., Konnerth, A., Sakmann, B., Takahashi, T., 1989. A thin
slice preparation for patch clamp recordings from neurones of the
mammalian central nervous system. Pflugers. Arch. 414 (5), 600–612.
Feng, G., Mellor, R.H., Bernstein, M., Keller-Peck, C., Nguyen, Q.T.,
Wallace, M., Nerbonne, J.M., Lichtman, J.W., Sanes, J.R., 2000.
Imaging neuronal subsets in transgenic mice expressing multiple
spectral variants of GFP. J. Neurosci. 28 (1), 41–51.
Finley, K.R., Davidson, A.E., Ekker, S.C., 2001. Three-color imaging using
fluorescent proteins in living zebrafish embryos. Biotechniques 31 (1),
66–70.
Fradkov, A.F., Chen, Y., Ding, L., Barsova, E.V., Matz, M.V., Lukyanov,
S.A., 2000. Novel fluorescent protein from Discosoma coral and its
mutants possesses a unique far-red fluorescence. FEBS Lett. 479 (3),
127–130.
Fuss, B., Mallon, B., Phan, T., Ohlemeyer, C., Kirchhoff, F., Nishiyama, A.,
Macklin, W.B., 2000. Purification and analysis of in vivo-differentiated
oligodendrocytes expressing the green fluorescent protein. Dev. Biol.
218 (2), 259–274.
Grass, D., Pawlowski, P.G., Hirrlinger, J., Papadopoulos, N., Richter, D.W.,
Kirchhoff, F., Hulsmann, S., 2004. Diversity of functional astroglial
properties in the respiratory network. J. Neurosci. 24 (6), 1358–1365.
Gurskaya, N.G., Fradkov, A.F., Terskikh, A., Matz, M.V., Labas, Y.A.,
Martynov, V.I., Yanushevich, Y.G., Lukyanov, K.A., Lukyanov, S.A.,
2001. GFP-like chromoproteins as a source of far-red fluorescent
proteins. FEBS Lett. 507 (1), 16–20.
Hadjantonakis, A.K., Nagy, A., 2001. The color of mice: in the light of
GFP-variant reporters. Histochem. Cell Biol. 115 (1), 49–58.
Hadjantonakis, A.K., Macmaster, S., Nagy, A., 2002. Embryonic stem
cells and mice expressing different GFP variants for multiple non-
invasive reporter usage within a single animal. BMC Biotechnol. 2
(1), 11.
Hadjantonakis, A.K., Dickinson, M.E., Fraser, S.E., Papaioannou, V.E.,
2003. Technicolour transgenics: imaging tools for functional genomics
in the mouse. Nat. Rev., Genet. 4 (8), 613–625.
Heim, R., Tsien, R.Y., 1996. Engineering green fluorescent protein for
improved brightness, longer wavelengths and fluorescence resonance
energy transfer. Curr. Biol. 6 (2), 178–182.
Heim, R., Prasher, D.C., Tsien, R.Y., 1994. Wavelength mutations and
posttranslational autoxidation of green fluorescent protein. Proc. Natl.
Acad. Sci. U. S. A. 91 (26), 12501–12504.
Heim, R., Cubitt, A.B., Tsien, R.Y., 1995. Improved green fluorescence.
Nature 373 (6516), 663–664.
Jach, G., Binot, E., Frings, S., Luxa, K., Schell, J., 2001. Use of red
fluorescent protein from Discosoma sp. (dsRED) as a reporter for plant
gene expression. Plant J. 28 (4), 483–491.
Jung, S., Aliberti, J., Graemmel, P., Sunshine, M.J., Kreutzberg, G.W., Sher,
A., Littman, D.R., 2000. Analysis of fractalkine receptor CX(3)CR1
function by targeted deletion and green fluorescent protein reporter gene
insertion. Mol. Cell. Biol. 20 (11), 4106–4114.
Larkum, M.E., Zhu, J.J., Sakmann, B., 2001. Dendritic mechanisms
underlying the coupling of the dendritic with the axonal action potential
initiation zone of adult rat layer 5 pyramidal neurons. J. Physiol. 533
(Pt. 2), 447–466.
Long, J.Z., Lackan, C.S., Hadjantonakis, A.K., 2005. Genetic and spectrally
distinct in vivo imaging: embryonic stem cells and mice with
widespread expression of a monomeric red fluorescent protein. BMC
Biotechnol. 5 (1), 20.
Lukyanov, K.A., Fradkov, A.F., Gurskaya, N.G., Matz, M.V., Labas, Y.A.,
Savitsky, A.P., Markelov, M.L., Zaraisky, A.G., Zhao, X., Fang, Y., Tan,
W., Lukyanov, S.A., 2000. Natural animal coloration can Be determined
by a nonfluorescent green fluorescent protein homolog. J. Biol. Chem.
275 (34), 25879–25882.
Magness, S.T., Bataller, R., Yang, L., Brenner, D.A., 2004. A dual reporter
gene transgenic mouse demonstrates heterogeneity in hepatic fibrogenic
cell populations. Hepatology 40 (5), 1151–1159.
Malatesta, P., Hack, M.A., Hartfuss, E., Kettenmann, H., Klinkert, W.,
Kirchhoff, F., Gotz, M., 2003. Neuronal or glial progeny: regional
differences in radial glia fate. J. Neurosci. 37 (5), 751–764.
Mallon, B.S., Shick, H.E., Kidd, G.J., Macklin, W.B., 2002. Proteolipid
promoter activity distinguishes two populations of NG2-positive
cells throughout neonatal cortical development. J. Neurosci. 22 (3),
876–885.
Matthias, K., Kirchhoff, F., Seifert, G., Huttmann, K., Matyash, M.,
Kettenmann, H., Steinhauser, C., 2003. Segregated expression of
AMPA-type glutamate receptors and glutamate transporters defines
distinct astrocyte populations in the mouse hippocampus. J. Neurosci.
23 (5), 1750–1758.
Matz, M.V., Fradkov, A.F., Labas, Y.A., Savitsky, A.P., Zaraisky, A.G.,
Markelov, M.L., Lukyanov, S.A., 1999. Fluorescent proteins from
nonbioluminescent Anthozoa species. Nat. Biotechnol. 17 (10),
969–973.
Nolte, C., Matyash, M., Pivneva, T., Schipke, C.G., Ohlemeyer, C.,
Hanisch, U.K., Kirchhoff, F., Kettenmann, H., 2001. GFAP promoter-
controlled EGFP-expressing transgenic mice: a tool to visualize
astrocytes and astrogliosis in living brain tissue. Glia 33 (1), 72–86.
Ross, C.A., Poirier, M.A., 2004. Protein aggregation and neurodegenerative
disease. Nat. Med. 10, S10–S17 (Suppl.)
Sato, Y., Igarashi, Y., Hakamata, Y., Murakami, T., Kaneko, T., Takahashi,
M., Seo, N., Kobayashi, E., 2003. Establishment of Alb-DsRed2
transgenic rat for liver regeneration research. Biochem. Biophys. Res.
Commun. 311 (2), 478–481.
Shastry, B.S., 2003. Neurodegenerative disorders of protein aggregation.
Neurochem. Int. 43 (1), 1–7.
Taylor, J.P., Hardy, J., Fischbeck, K.H., 2002. Toxic proteins in neuro-
degenerative disease. Science 296 (5575), 1991–1995.
Verkhratsky, A., Kettenmann, H., 1996. Calcium signalling in glial cells.
Trends Neurosci. 19 (8), 346–352.
Verkhusha, V.V., Otsuna, H., Awasaki, T., Oda, H., Tsukita, S., Ito, K.,
2001. An enhanced mutant of red fluorescent protein DsRed for
double labeling and developmental timer of neural fiber bundle for-
mation. J. Biol. Chem. 276 (32), 29621–29624.
Vintersten, K., Monetti, C., Gertsenstein, M., Zhang, P., Laszlo, L.,
Biechele, S., Nagy, A., 2004. Mouse in red: red fluorescent protein
expression in mouse ES cells, embryos, and adult animals. Genesis 40
(4), 241–246.
Wenck, A., Pugieux, C., Turner, M., Dunn, M., Stacy, C., Tiozzo, A.,
Dunder, E., van Grinsven, E., Khan, R., Sigareva, M., Wang, W.C.,

P.G. Hirrlinger et al. / Mol. Cell. Neurosci. 30 (2005) 291–303 303
Reed, J., Drayton, P., Oliver, D., Trafford, H., Legris, G., Rushton, H.,
Tayab, S., Launis, K., Chang, Y.F., Chen, D.F., Melchers, L., 2003.
Reef-coral proteins as visual, non-destructive reporters for plant trans-
formation. Plant Cell Rep. 22 (4), 244–251.
Wight, P.A., Duchala, C.S., Readhead, C., Macklin, W.B., 1993. A myelin
proteolipid protein-LacZ fusion protein is developmentally regulated
and targeted to the myelin membrane in transgenic mice. J. Cell Biol.
123 (2), 443–454.
Zhang, G., Gurtu, V., Kain, S.R., 1996. An enhanced green fluorescent
protein allows sensitive detection of gene transfer in mammalian cells.
Biochem. Biophys. Res. Commun. 227 (3), 707–711.
Zhang, D.Q., Stone, J.F., Zhou, T., Ohta, H., 2004. Characterization of
genetically labeled catecholamine neurons in the mouse retina. Neuro-
Report 15 (11), 1761–1765.
Zhu, H., Zon, L.I., 2004. Use of the DsRed fluorescent reporter in zebrafish.
Methods Cell Biol. 76, 3–12.
Zhu, H., Wang, G., Li, G., Han, M., Xu, T., Zhuang, Y., Wu, X., 2005.
Ubiquitous expression of mRFP1 in transgenic mice. Genesis 42 (2),
86–90.
Zhuo, L., Sun, B., Zhang, C.L., Fine, A., Chiu, S.Y., Messing, A., 1997.
Live astrocytes visualized by green fluorescent protein in transgenic
mice. Dev. Biol. 187 (1), 36–42.


