Embed Size (px)
Citation preview
Extracting new patterns for cardiovasculardisease prognosis
Luis Mena,1 Jesus A. Gonzalez2 and Gladys Maestre3(1) Department of Computer Science, National Institute of Astrophysics, Optics andElectronics, Puebla, Mexico, and Faculty of Engineering, University of Zulia, Maracaibo,VenezuelaEmail: [email protected](2) Department of Computer Science, National Institute of Astrophysics, Optics andElectronics, Puebla, MexicoEmail: [email protected](3) Neurosciences Laboratory of the Institute for Biological Research and Institute forCardiovascular Diseases, University of Zulia, Maracaibo, Venezuela, and Gertrude H.Sergievsky Center, Columbia University, New York, USAEmail: [email protected]
Abstract: Cardiovascular diseases constitute one of the main causes of mortality in the world, and machinelearning has become a powerful tool for analysing medical data in the last few years. In this paper we present aninterdisciplinary work based on an ambulatory blood pressure study and the development of a new classificationalgorithm named REMED. We focused on the discovery of new patterns for abnormal blood pressurevariability as a possible cardiovascular risk factor. We compared our results with other classification algorithmsbased on Bayesian methods, decision trees, and rule induction techniques. In the comparison, REMED showedsimilar accuracy to these algorithms but it has the advantage of being superior in its capacity to classify sickpeople correctly. Therefore, our method could represent an innovative approach that might be useful in medicaldecision support for cardiovascular disease prognosis.
Keywords: cardiovascular diseases, machine learning, blood pressure variability, classification,medical decision support, prognosis
1. Introduction
Since the 1950s, cardiovascular diseases havetaken first place as a cause of mortality indeveloped countries. Projections carried out bythe Department of Public Health of Massachu-setts predict that for the year 2020, if thistendency continues, these diseases could be themain cause of death in the world. This would bethe first time that this has happened in thehistory of the modern world.
The main cardiovascular risk factors are re-lated to a high level of cholesterol in the bloodand hypertension; however, in the last fourdecades cardiology has been one of the branchesof medicine that has advanced a lot in thedevelopment of techniques to discover newcauses of risk. Ambulatory blood pressure mon-itoring (ABPM) (Mancia, 1990) has been one ofthe most effective techniques; it consists of mea-suring the blood pressure (BP) with portable andautomatic devices that allow the registration of
DOI: 10.1111/j.1468-0394.2009.00498.x
Article _____________________________
364 Expert Systems, November 2009, Vol. 26, No. 5 c! 2009 The Authors. Journal Compilation c! 2009 Blackwell Publishing Ltd

BP during a programmable period of time, gen-erally 24 hours. The fundamental contributionof this technique with regard to the traditionalmeasure is that BP readings are obtained outsidethe hospital environment. This helps to obtainmore representative samples and also avoids thealert reaction or phenomenon known as white-coat hypertension (Pickering et al., 1988).This phenomenon makes reference to thosesubjects that present a high BP during themedical appointment and normal BP outsidethis environment.In addition, continuous monitoring of BP has
allowed the BP variability (BPV) to be classifiedinto global and circadian BPV, and abnormalABPM registrations of both are consideredpotential cardiovascular risk factors. GlobalBPV is the variability present in the set ofmeasures registered by the ABPM. Generallythe ABPM readings are programmed periodi-cally considering a 15 minute interval betweenreadings; this is done with the objective ofgetting a representative sample of measurementsand to avoid dispersion of the results (Di Rienzoet al., 1983). Recent studies have suggested thatan increase in global BPV is associated with anincrease in subsequent cardiovascular events=complications (Frattola et al., 1993; Kikuya et al.,2000; Sander et al., 2000; Mena et al., 2005).The circadian BPV tries to measure the BP
changes between day (activity period) and night(rest period). Usually, a BP descent is detected atnight. The presence or absence of this night BPdescent allows the studied subjects to be classi-fied as dippers and non-dippers. In an informalway, subjects are considered non-dippers whentheir values of night BP do not decrease by 10%with regard to their values of day BP (Verdec-chia et al., 1990). Several studies seem to associ-ate the absence of BP decrement with the onsetof some cardiovascular diseases (Palatini et al.,1992; Rizzoni et al., 1992; Shimada et al., 1992).In recent years the need to automatically
extract knowledge from databases has in-creased. Thus, the use of machine learningtechniques (Witten & Frank, 2005) to discovervalid, novel, interesting and comprehensiblepatterns could be the key to success in either
the business or scientific environment. We find aclear example of this in the medical diagnosis=prognosis domain (Kukar & Groselj, 2000;Breault et al., 2002; Podgorelec et al., 2002),where identifying patterns that help to predictthe incidence of any kind of disease may repre-sent the opportunity to react on time to avoid,delay or diminish the consequences of exposureof predispositions.
Generally, prediction tasks are solved byapplying supervised classification techniques;however, we have to consider some additionalchallenges associated with the application ofmachine learning to the medical prognosis do-main. One of the most important problems is theselection of relevant attributes. These attributesare known in medical prognosis as risk factorsand are classified as changeable (e.g. bloodpressure, cholesterol etc.) and non-changeable(e.g. age, sex etc.). According to this, if weconsider a non-changeable attribute such as age(a good attribute for classification tasks) itmight not be useful as a target to modify diseaseevolution because no medical treatment exists tomodify the age of a patient. Therefore, weshould focus on changeable attributes, and thiscould make the classification task harder.
Another important aspect to consider is theneed to obtain classifiers with comprehensiblepatterns to provide the medical staff with anovel point of view about the given problem.Usually this is done using symbolic learningmethods (e.g. decision trees and rules), becauseit is possible to explain the decisions in an easyway for humans to understand. For this reason,connectionist methods such as neural networkscould be excluded, since these almost alwaysbehave as black boxes. However, the use of asymbolic learning method generally sacrificesaccuracy in prediction in order to obtain a moreunderstandable model.
A third problem that hinders obtaining highoverall performance is that in general medicaldata sets exhibit an imbalanced class distribu-tion (Chawla et al., 2004), where there exists amajority or negative class of healthy people(normal data) and a minority or positiveclass of sick people (the important class), which
c! 2009 The Authors. Journal Compilation c! 2009 Blackwell Publishing Ltd Expert Systems, November 2009, Vol. 26, No. 5 365
generally has the highest cost of erroneousclassification. Therefore, the performance ofstandard classifiers (e.g. C4.5, k-nearest neigh-bour and naive Bayes) tend to be overwhelmedby examples of the majority class and ignore theminority class examples; results have an accep-table performance in terms of accuracy andspecificity (healthy subjects diagnosed cor-rectly), but a low performance in terms ofsensitivity (sick subjects diagnosed correctly).Another problem refers to the fact that med-
ical data are often obtained from longitudinalstudies that consist of observing the incidence ofa disease in a group of subjects during a specificperiod of time. At the end of the study, a binaryclassification is done and every subject is classi-fied as sick (positive class) or healthy (negativeclass), depending on whether the studied diseasehad developed or not. However, the fact thatthese studies were designed to culminate at acertain time might make the classifiers’ taskharder, because a subject that presented clearrisk factors during the period of study but whosedeath was not caused by the studied disease (e.g.died in an accident) or who did not present thedisease by the end of the study (it could appearjust after the end of the study) is classified ashealthy (considered as class label noise), andboth situations tend to confuse the classifiers.Finally, we mention some features that a
machine learning algorithm should have tosatisfactorily solve medical diagnosis=prognosistasks. Besides creating a classifier that achieves agood overall performance and provides medicalstaff with comprehensible prognostic knowl-edge, it is necessary to have the ability tosupport decisions and to reduce the number oftests necessary to obtain a reliable prognosis(Kononenko, 2001; Bosnic & Kononenko,2008). What we mean by achieving a good over-all performance and the comprehensibility ofthe prognostic knowledge was described earlier.The ability to support decisions refers to the factthat it is preferable to accompany the predic-tions with a measure of reliability, e.g. theprobability of an example belonging to a class,which could provide medical staff with enoughtrust to use the new prognostic knowledge in
practice. In addition, it is desirable to have aclassifier that is able to predict reliably using asmall amount of data about the patients, be-cause the collection of the data is often expen-sive, time consuming and harmful for them(Kononenko, 2001).In this paper we propose a machine learning
method for medical decision support in theprognosis of cardiovascular diseases, which triesto solve the previously exposed disadvantages.This work is based on an ABPM study and thedevelopment of a new classification algorithmnamed REMED. We focused on the discoveryof new patterns for the abnormal BPV as possi-ble cardiovascular risk factors. We comparedour results with other classification algorithmssuch as Bayesian methods, decision trees andrule induction techniques. In the comparison,REMED showed similar accuracy to these algo-rithms but with the advantage that it is superiorin its capacity to predict sick people correctly.
2. Methods
2.1. Ambulatory blood pressure monitoring
All subjects underwent a 24 hour ABPM with afully automatic device (SpaceLabs 90207) thatmet the criteria of the Association for theAdvancement ofMedical Instrumentation (Imaiet al., 1990). Readings were obtained every 15minutes during the day period (06:00–22:59 h)and every 30 minutes for the night period(23:00–05:59 h). Systolic BP (SBP) values great-er than 260mmHg or lower than 70mmHg aswell as diastolic BP (DBP) readings greater than150mmHg or lower than 40mmHg were auto-matically discarded by the ABPM device (asnon-valid measures).
2.2. Representation of the cardiovascular riskfactors
The cardiovascular risk factors studied in thisresearch were obtained from analysis of thesubject’s ABPM registrations. We analysedabnormal BPV (global and circadian) andhypertension (a well-known cardiovascular risk
366 Expert Systems, November 2009, Vol. 26, No. 5 c! 2009 The Authors. Journal Compilation c! 2009 Blackwell Publishing Ltd
factor). To evaluate the presence of hyperten-sion we calculated the mean of the SBP and theDBP from the valid readings of the ABPM in aperiod of 24 hours. In addition, in order toanalyse the global and circadian BPV we pro-posed two new measures.
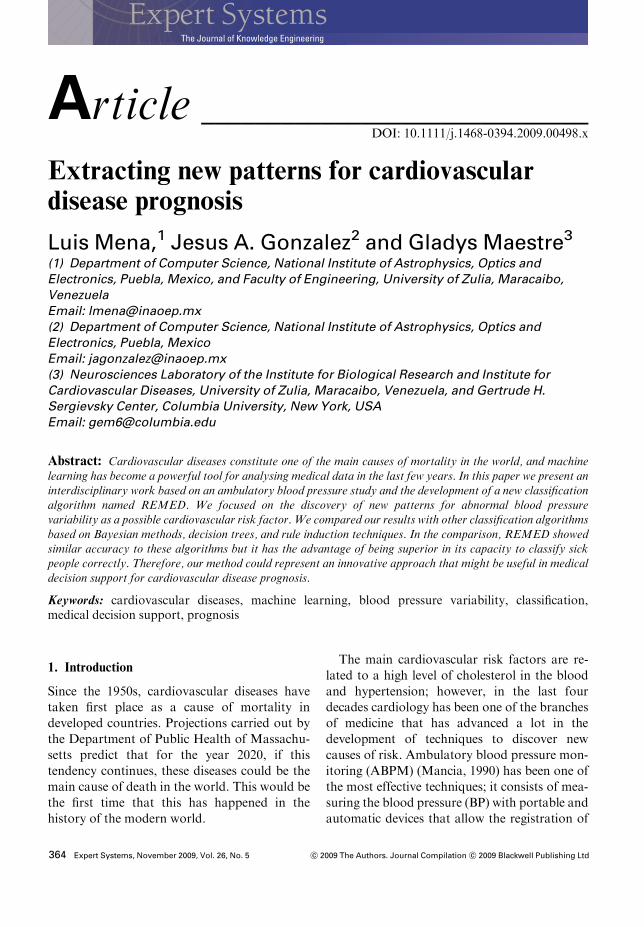
2.2.1. Global BPV Most of the previousworks that have studied the BPV as a cardiovas-cular risk factor have done it using the standarddeviation (SD) as a variability index (Frattolaet al., 1993; Kikuya et al., 2000; Sander et al.,2000). However, this is a statistical measure thatonly reflects the dispersion around the centralvalue (the mean); thus it does not account forthe order in which the measurements wereregistered, as can be seen in Figure 1. Therefore,we proposed the average real variability (ARV)(Mena et al., 2005) as the variability index. TheARV consists of calculating the arithmetic aver-age of the differences in absolute value of the BPcontinuous measures.
ARV" 1
n# 1
Xn#1
i" 1
xi$1 # xij j %1&
where n denotes the total number of valid readingsand xi denotes the BP reading obtained at time i.
2.2.2. Circadian BPV In order to identify thenon-dipper subjects from ABPM studies, we
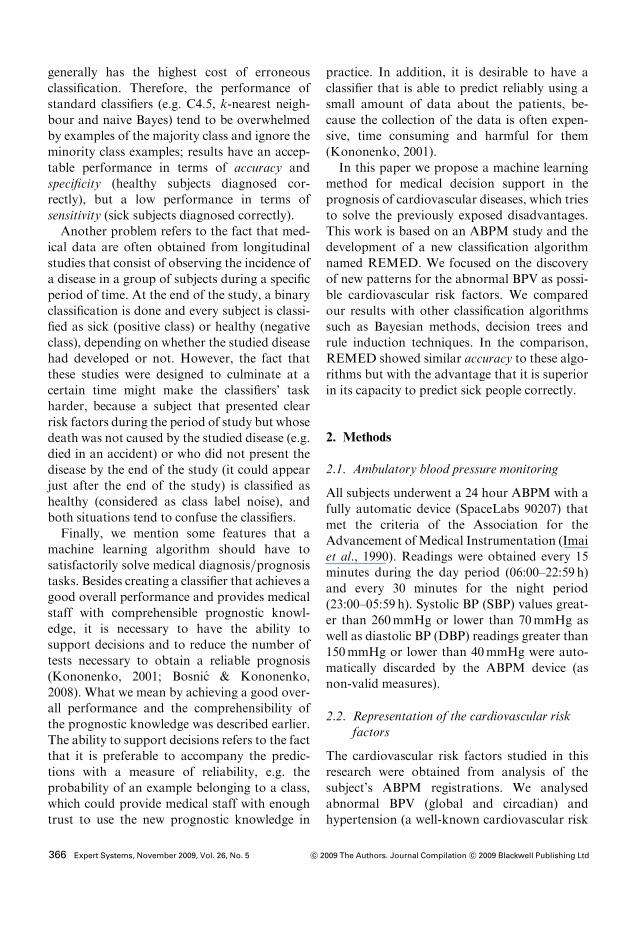
established the time periods of measurement(day=night) and then we contrasted the BPmeans for every period. Generally, the timeinterval used goes from 06:00 to 22:59 h duringthe day and from 23:00 to 05:59 h for night time.However, we consider that it is not practical toestablish a strict cut to generalize the activityand rest periods of the subjects and therefore wepropose to estimate for each subject the gradientof the straight line that best fits the valuesobtained with the ABPM during 24 hours(Figure 2). Our hypothesis is that those subjectswith a smaller decrement in this gradient couldbe non-dippers.
gradient"Pn
i" 1 %xi # !x&%yi # !y&Pn
i" 1 %xi # !x&2%2&
where n denotes the total number of valid read-ings from 06:00 to 05:59 h, xi denotes the BPreading obtained at time i, yi" i for i" 1, . . ., n,!x denotes the mean of xi and !y denotes the meanof yi.
2.3. Algorithm
The complete symbolic classification algorithmhas been called REMED (rules extraction formedical diagnosis) (Mena & Gonzalez, 2006).The REMED algorithm is composed of threebasic procedures: (1) a procedure supported bythe simple logistic regression model (LRM)(Hosmer & Lemeshow, 2000) for the selection
Figure 1: Variability for two distinct blood pres-sure signals, but with the same values. ARV,average real variability; SD, standard deviation.
Figure 2: Linear approach for blood pressurereadings of (a) a dipper and (b) a non-dippersubject.
c! 2009 The Authors. Journal Compilation c! 2009 Blackwell Publishing Ltd Expert Systems, November 2009, Vol. 26, No. 5 367
of the attributes, (2) a second procedure for theselection of initial partitions, and finally (3) theprocedure responsible for the construction ofclassification rules.
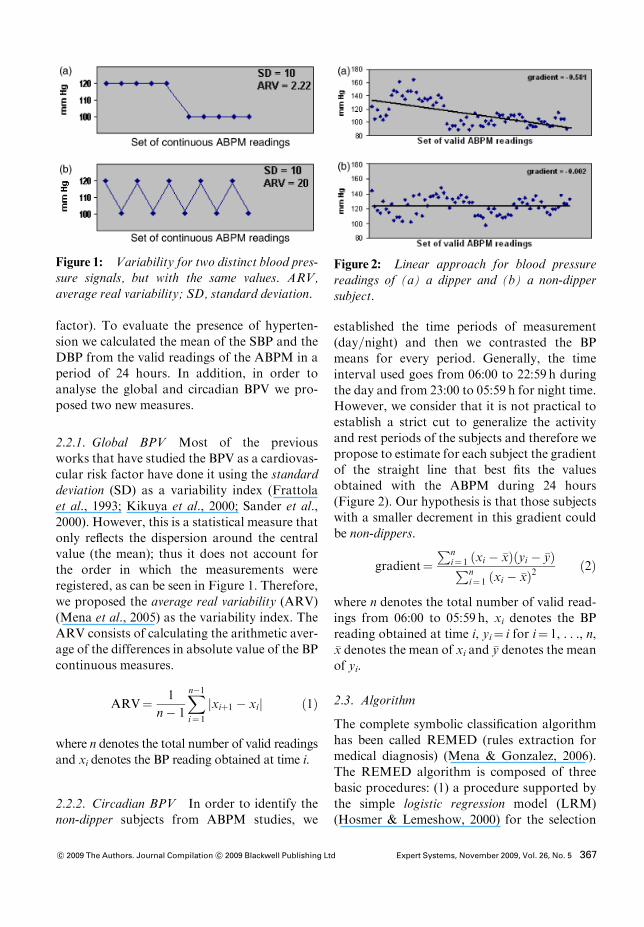
2.3.1. Attribute selection procedure The maintask of the first part of the algorithm (Figure 3)considers the selection of the best combinationof attributes to build precise prediction rules.For this reason we used the simple LRM. Thisallows us to quantify the risk of suffering thestudied disease with respect to the increase ordecrease in the value of a specific attribute. Wetake advantage of the simple LRM in ouralgorithm because it uses a probabilistic metriccalled the odds ratio (OR) (Zheng et al., 2004),which allows us to determine whether thereexists any type of association between the con-sidered attribute and the studied disease. Thus,an OR equal to 1 indicates a non-association, anOR greater than 1 indicates a positive associa-tion (if the value of the attribute increases thenthe risk of suffering the disease also increases)and an OR smaller than 1 indicates a negativeassociation (if the value of the attribute de-creases then the risk of suffering the diseaseincreases). Therefore, depending on the type ofassociation established (positive or negative)with the ORmetric, we can determine the syntaxwith which each attribute’s partition will appearin our rules system.
However, the establishment of a positive ornegative association between the risk of suffer-ing the disease and an attribute is not enough. Itis necessary to determine if this association isstatistically significant for a certain confidencelevel. To achieve this, we always use high con-fidence levels (> 99%) to select attributes thatare strongly associated with the risk of sufferingthe disease, and thus we can guarantee theconstruction of more precise rules. At this time,we only consider continuous attributes. This isbecause in the clinical environment discreteattributes are usually binary (e.g. smoker andnon-smoker) and their association with a certaindisease is almost always well known; therefore,continuous attributes have a higher degree ofuncertainty than discrete attributes.
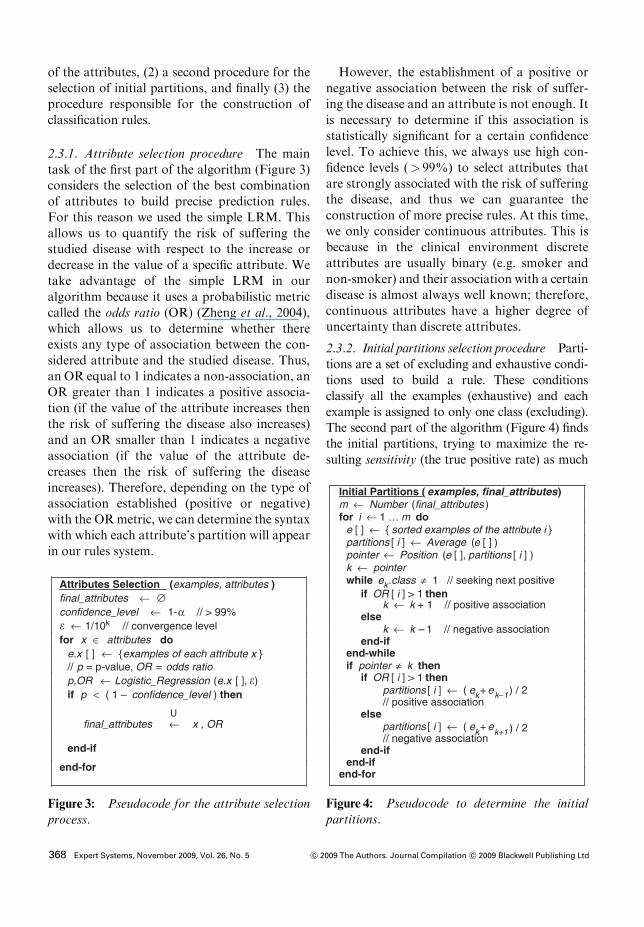
2.3.2. Initial partitions selection procedure Parti-tions are a set of excluding and exhaustive condi-tions used to build a rule. These conditionsclassify all the examples (exhaustive) and eachexample is assigned to only one class (excluding).The second part of the algorithm (Figure 4) findsthe initial partitions, trying to maximize the re-sulting sensitivity (the true positive rate) as much
Attributes Selection (examples, attributes ) final_attributes ! "confidence_level ! 1-# // > 99% ! ! 1/10k // convergence levelfor x $ attributes do
e.x [ ] ! { examples of each attribute x }// p = p-value, OR = odds ratiop,OR ! Logistic_Regression (e.x [ ], !)if p < ( 1 – confidence_level ) then
final_attributes ! x , OR
end-if
end-for
Figure 3: Pseudocode for the attribute selectionprocess.
Initial Partitions ( examples, final_attributes )m ! Number (final_attributes )for i ! 1 … m do
e [ ] ! { sorted examples of the attribute i }partitions [ i ] ! Average ( e [ ] )pointer ! Position (e [ ], partitions [ i ] )k ! pointer while ek.class % 1 // seeking next positive
if OR [ i ] > 1 thenk ! k + 1 // positive association
else k ! k – 1 // negative association
end-if end-while if pointer % k then
if OR [ i ] > 1 thenpartitions [ i ] ! ( ek+ ek&1 ) / 2// positive association
else partitions [ i ] ! ( ek+ ek+1 ) / 2// negative association
end-if end-if
end-for
Figure 4: Pseudocode to determine the initialpartitions.
368 Expert Systems, November 2009, Vol. 26, No. 5 c! 2009 The Authors. Journal Compilation c! 2009 Blackwell Publishing Ltd
as possible, without considerably decreasing spe-cificity (the true negative rate) and maintaining anacceptable accuracy.The procedure that REMED uses to select the
initial partitions comes from the fact that, if anattribute x has been associated in a statisticallysignificant form with the studied disease, then itsmean !x (mean of the n values of the attribute) is agood candidate for an initial partition of theattribute. This is because a large number of nindependent values of an attribute x will tend tobe normally distributed (by the central limittheorem); therefore, once a statistically significantassociation (positive or negative) is establishedbetween x and the studied disease, a single thresh-old above (positive association) or under (negativeassociation) !x will be a partition that indicates anincrease of the risk of suffering the disease.Then, we sort the examples by the attribute’s
value and we search for the next positive examplein the direction of the established associationaccording to the OR metric from the initial parti-tion of each attribute (!xi). Later, we calculate anew partition by computing the average betweenthe value of the selected example and the value ofits predecessor or successor. This displacement is
carried out only once for each attribute, becauseanother displacement to calculate a new partitionwould include at least a positive example at theopposite side of the threshold, and this coulddecrease the risk of suffering the disease in thenew partition (loss of sensitivity).
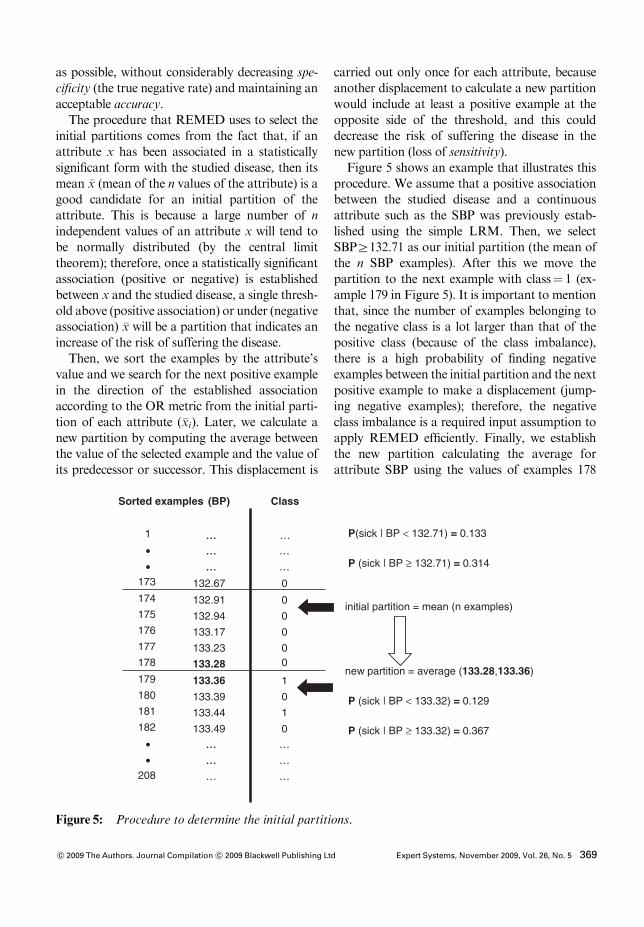
Figure 5 shows an example that illustrates thisprocedure. We assume that a positive associationbetween the studied disease and a continuousattribute such as the SBP was previously estab-lished using the simple LRM. Then, we selectSBPZ132.71 as our initial partition (the mean ofthe n SBP examples). After this we move thepartition to the next example with class" 1 (ex-ample 179 in Figure 5). It is important to mentionthat, since the number of examples belonging tothe negative class is a lot larger than that of thepositive class (because of the class imbalance),there is a high probability of finding negativeexamples between the initial partition and the nextpositive example to make a displacement (jump-ing negative examples); therefore, the negativeclass imbalance is a required input assumption toapply REMED efficiently. Finally, we establishthe new partition calculating the average forattribute SBP using the values of examples 178
Sorted examples (BP)
1 …… …• …… …• …… …
173
174 175 176 177 178 133.28 0
179 133.36 1180 181 182
132.67 0
132.91 0132.94 0133.17 0133.23 0
133.39 0133.44 1133.49 0
• …… …• …… …
208 … …
new partition = average (133.28,133.36)
P (sick | BP < 133.32) = 0.129
P (sick | BP ! 133.32) = 0.367
P(sick | BP < 132.71) = 0.133
P (sick | BP ! 132.71) = 0.314
initial partition = mean (n examples)
Class
Figure 5: Procedure to determine the initial partitions.
c! 2009 The Authors. Journal Compilation c! 2009 Blackwell Publishing Ltd Expert Systems, November 2009, Vol. 26, No. 5 369
and 179 (SBPZ133.32). The goal of this strategyconsists of increasing the risk of suffering thedisease above this partition. For this reason wedo not make a new displacement to search thenext positive example, because this possible newpartition calculated with the values of examples180 and 181 (SBP Z133.42) decreases the risk ofsuffering the disease above the threshold(p" 0.357) and increases again this risk under thisthreshold (p" 0.133).
2.3.3. Rules construction procedure Once weobtain the initial partitions for each of the mselected attributes, we build a simple system ofrules which contains m conditions (one for eachselected attribute j), in the following way:
if 1 hrelationi p1 and j hrelationi pj and . . . andm hrelationi pm then class" 1else class" 0
where hrelationi is either Z or r depending onwhether j is positively or negatively associatedwith the positive class through pj (partition forattribute j).We make a first classification with this rules
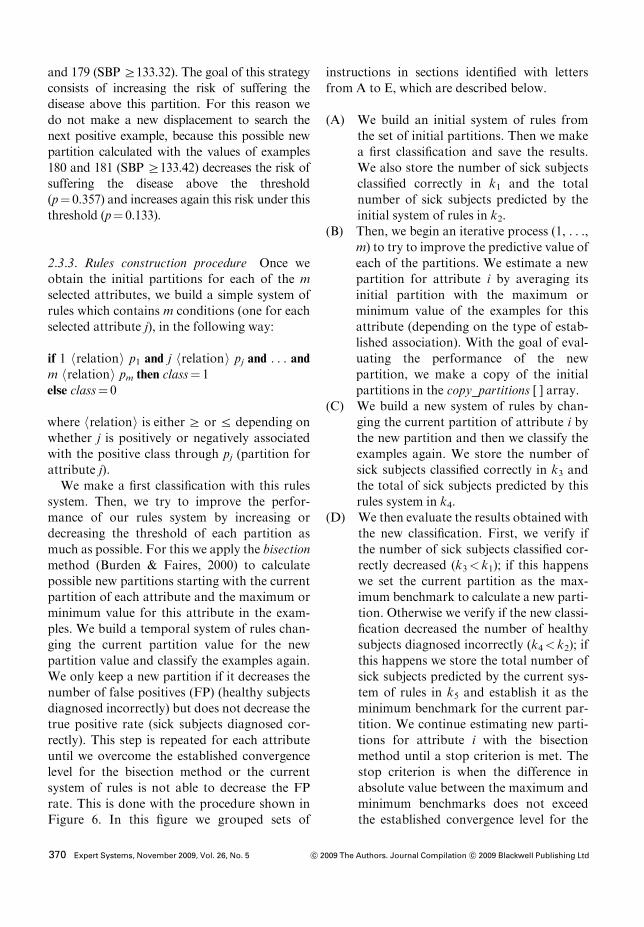
system. Then, we try to improve the perfor-mance of our rules system by increasing ordecreasing the threshold of each partition asmuch as possible. For this we apply the bisectionmethod (Burden & Faires, 2000) to calculatepossible new partitions starting with the currentpartition of each attribute and the maximum orminimum value for this attribute in the exam-ples. We build a temporal system of rules chan-ging the current partition value for the newpartition value and classify the examples again.We only keep a new partition if it decreases thenumber of false positives (FP) (healthy subjectsdiagnosed incorrectly) but does not decrease thetrue positive rate (sick subjects diagnosed cor-rectly). This step is repeated for each attributeuntil we overcome the established convergencelevel for the bisection method or the currentsystem of rules is not able to decrease the FPrate. This is done with the procedure shown inFigure 6. In this figure we grouped sets of
instructions in sections identified with lettersfrom A to E, which are described below.
(A) We build an initial system of rules fromthe set of initial partitions. Then we makea first classification and save the results.We also store the number of sick subjectsclassified correctly in k1 and the totalnumber of sick subjects predicted by theinitial system of rules in k2.
(B) Then, we begin an iterative process (1, . . .,m) to try to improve the predictive value ofeach of the partitions. We estimate a newpartition for attribute i by averaging itsinitial partition with the maximum orminimum value of the examples for thisattribute (depending on the type of estab-lished association). With the goal of eval-uating the performance of the newpartition, we make a copy of the initialpartitions in the copy_partitions [ ] array.
(C) We build a new system of rules by chan-ging the current partition of attribute i bythe new partition and then we classify theexamples again. We store the number ofsick subjects classified correctly in k3 andthe total of sick subjects predicted by thisrules system in k4.
(D) We then evaluate the results obtained withthe new classification. First, we verify ifthe number of sick subjects classified cor-rectly decreased (k3< k1); if this happenswe set the current partition as the max-imum benchmark to calculate a new parti-tion. Otherwise we verify if the new classi-fication decreased the number of healthysubjects diagnosed incorrectly (k4< k2); ifthis happens we store the total number ofsick subjects predicted by the current sys-tem of rules in k5 and establish it as theminimum benchmark for the current par-tition. We continue estimating new parti-tions for attribute i with the bisectionmethod until a stop criterion is met. Thestop criterion is when the difference inabsolute value between the maximum andminimum benchmarks does not exceedthe established convergence level for the
370 Expert Systems, November 2009, Vol. 26, No. 5 c! 2009 The Authors. Journal Compilation c! 2009 Blackwell Publishing Ltd
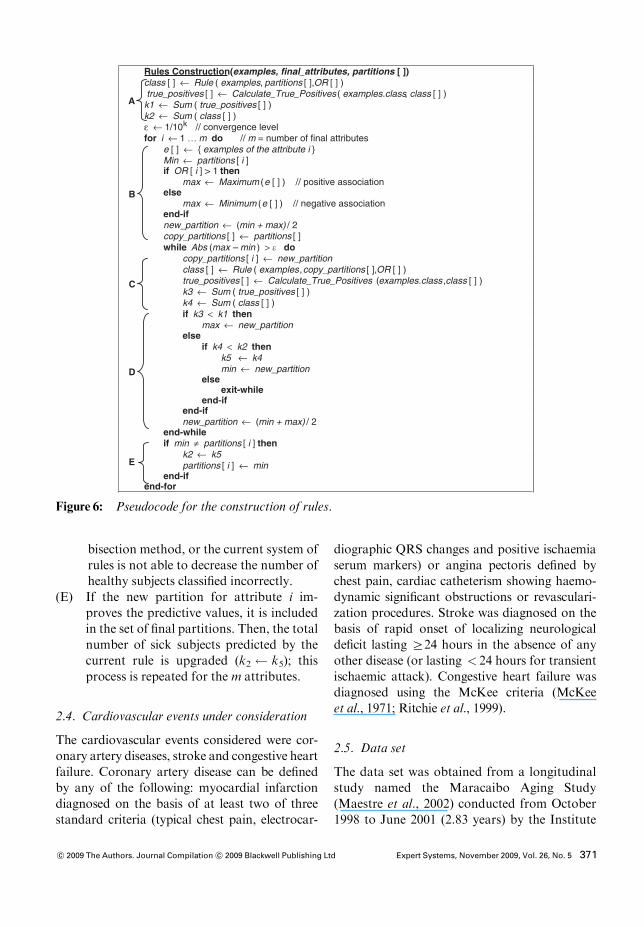
bisection method, or the current system ofrules is not able to decrease the number ofhealthy subjects classified incorrectly.
(E) If the new partition for attribute i im-proves the predictive values, it is includedin the set of final partitions. Then, the totalnumber of sick subjects predicted by thecurrent rule is upgraded (k2 k5); thisprocess is repeated for the m attributes.
2.4. Cardiovascular events under consideration
The cardiovascular events considered were cor-onary artery diseases, stroke and congestive heartfailure. Coronary artery disease can be definedby any of the following: myocardial infarctiondiagnosed on the basis of at least two of threestandard criteria (typical chest pain, electrocar-
diographic QRS changes and positive ischaemiaserum markers) or angina pectoris defined bychest pain, cardiac catheterism showing haemo-dynamic significant obstructions or revasculari-zation procedures. Stroke was diagnosed on thebasis of rapid onset of localizing neurologicaldeficit lasting Z24 hours in the absence of anyother disease (or lasting < 24 hours for transientischaemic attack). Congestive heart failure wasdiagnosed using the McKee criteria (McKeeet al., 1971; Ritchie et al., 1999).
2.5. Data set
The data set was obtained from a longitudinalstudy named the Maracaibo Aging Study(Maestre et al., 2002) conducted from October1998 to June 2001 (2.83 years) by the Institute
Rules Construction(examples, final_attributes, partitions [ ])class [ ] " Rule ( examples, partitions [ ],OR [ ] ) true_positives [ ] " Calculate_True_Positives ( examples.class, class [ ] )k1 " Sum ( true_positives [ ] )k2 " Sum ( class [ ] ) # " 1/10 // convergence levelfor i " 1 … m do // m = number of final attributes
e [ ] " { examples of the attribute i }Min " partitions [ i ]if OR [ i ] > 1 then
max " Maximum (e [ ] ) // positive associationelse
max " Minimum (e [ ] ) // negative association end-if new_partition " (min + max) / 2copy_partitions [ ] " partitions [ ]while Abs (max – min ) > ! do
copy_partitions [ i ] " new_partition class [ ] " Rule ( examples, copy_partitions [ ],OR [ ] )true_positives [ ] " Calculate_True_Positives ( examples.class ,class [ ] )k3 " Sum ( true_positives [ ] )k4 " Sum ( class [ ] )if k3 < k1 then
max " new_partitionelse
if k4 < k2 then k5 " k4 min " new_partition
else exit-while
end-if end-if new_partition " (min + max) / 2
end-while if min $ partitions [ i ] then
k2 " k5partitions [ i ] " min
end-if end-for
E
D
C
B
A
Figure 6: Pseudocode for the construction of rules.
c! 2009 The Authors. Journal Compilation c! 2009 Blackwell Publishing Ltd Expert Systems, November 2009, Vol. 26, No. 5 371
for Cardiovascular Diseases of the University ofZulia, in Maracaibo, Venezuela. The study in-cluded all subjects with 70% or higher validABPM measurements, and without importantconcomitant diseases. The final data set con-sisted of 312 subjects Z55 years, mean age 66.9years, 63% women. The changeable continuousattributes considered were SBP, DBP (bothcalculated with the mean of ABPM readings),systolic global variability (SGV), diastolic glo-bal variability (DGV) (both calculated with theARV index), and systolic circadian variability(SCV) (calculated with the gradient of thestraight line). All these attributes were obtainedfrom the valid readings of the ABPM in a periodof 24 hours. The follow-up period for eachindividual had a mean value of 1.86 years andended with a non-fatal cardiovascular event orwith the arrival of the termination date of thestudy. At the end of the ABPM study thesubjects registered 55 cardiovascular events(17.63%). Informed consent was obtained fromevery participant and the study protocol was ap-proved by the ethics committee of the Institute.
2.6. Performance comparison
In order to compare the predictive capacity ofthe REMED algorithm we made a performancecomparison with a set of 23 classification algo-rithms implemented in the WEKA framework(Witten & Frank, 2000). The algorithms consid-ered were four Bayesian techniques with differ-ent numeric estimator precision values, sevenrule learners and 10 decision trees with differentmethods to calculate information gain, anddifferent pruning techniques. The final selectionof methods to use in the comparison was doneaccording to the best accuracy shown for ourdata in terms of the area under the receiveroperating characteristics curve (AUC). Thesechosen algorithms were naive Bayes (Bayesiantechniques) (John & Langley, 1995), OneR (rulelearner) (Holte, 1993), ADtree (decision trees)(Freund &Mason, 1999) and REMED. In orderto improve the performance of all the classifierswe used the simple LRM to select only attributesassociated with the positive class with a con-
fidence level > 99% (p< 0.01). In all cases weused the 10-fold cross-validation technique toavoid overfitting (Witten & Frank, 2005). Final-ly, we evaluated the performance of each classi-fication algorithm in terms of accuracy,sensitivity, specificity, AUC calculated with thebinormal model (Hanley, 1996), and positiveand negative predictive values. We followed themethodology presented by Mitchell (1997) todetermine the level of significance by whichREMED outperformed the rest of the classifica-tion algorithms; we used the popular two-tailedpaired t test method with a confidence levelof 95%.
3. Results
3.1. Final selection of attributes
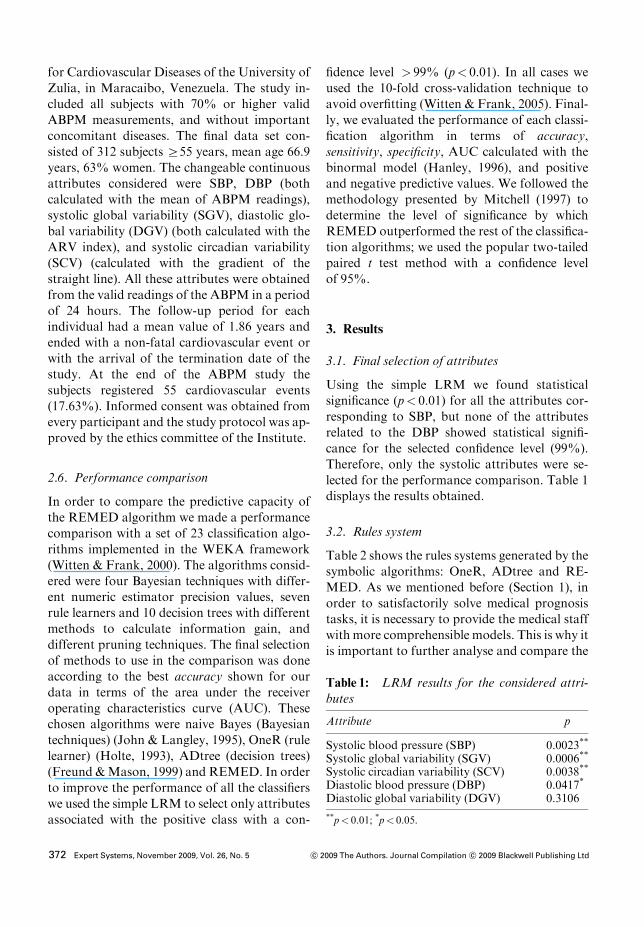
Using the simple LRM we found statisticalsignificance (p< 0.01) for all the attributes cor-responding to SBP, but none of the attributesrelated to the DBP showed statistical signifi-cance for the selected confidence level (99%).Therefore, only the systolic attributes were se-lected for the performance comparison. Table 1displays the results obtained.
3.2. Rules system
Table 2 shows the rules systems generated by thesymbolic algorithms: OneR, ADtree and RE-MED. As we mentioned before (Section 1), inorder to satisfactorily solve medical prognosistasks, it is necessary to provide the medical staffwith more comprehensible models. This is why itis important to further analyse and compare the
Table 1: LRM results for the considered attri-butes
Attribute p
Systolic blood pressure (SBP) 0.0023**
Systolic global variability (SGV) 0.0006**
Systolic circadian variability (SCV) 0.0038**
Diastolic blood pressure (DBP) 0.0417*
Diastolic global variability (DGV) 0.3106
**p< 0.01; *p< 0.05.
372 Expert Systems, November 2009, Vol. 26, No. 5 c! 2009 The Authors. Journal Compilation c! 2009 Blackwell Publishing Ltd
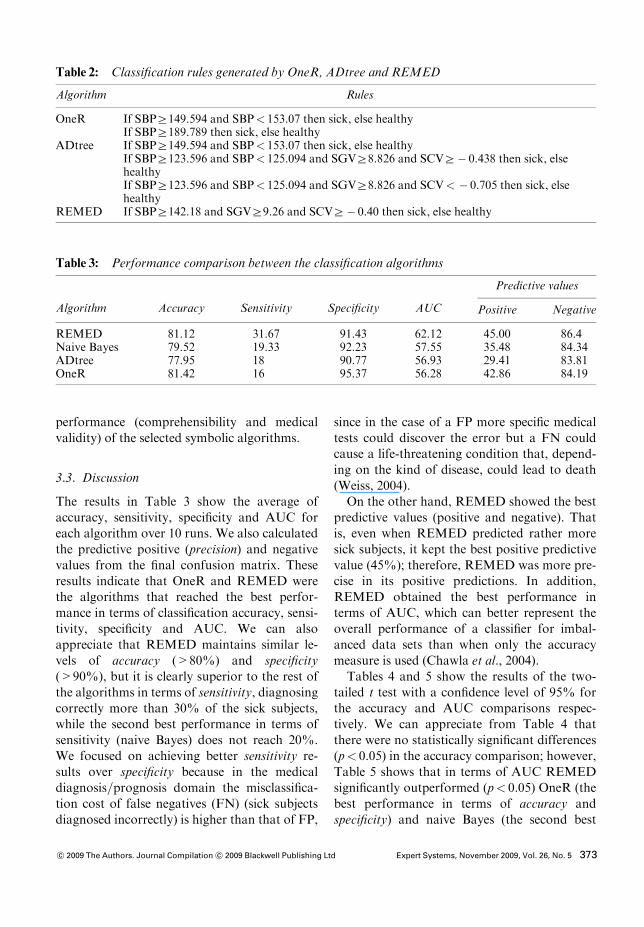
performance (comprehensibility and medicalvalidity) of the selected symbolic algorithms.
3.3. Discussion
The results in Table 3 show the average ofaccuracy, sensitivity, specificity and AUC foreach algorithm over 10 runs. We also calculatedthe predictive positive (precision) and negativevalues from the final confusion matrix. Theseresults indicate that OneR and REMED werethe algorithms that reached the best perfor-mance in terms of classification accuracy, sensi-tivity, specificity and AUC. We can alsoappreciate that REMED maintains similar le-vels of accuracy (>80%) and specificity(>90%), but it is clearly superior to the rest ofthe algorithms in terms of sensitivity, diagnosingcorrectly more than 30% of the sick subjects,while the second best performance in terms ofsensitivity (naive Bayes) does not reach 20%.We focused on achieving better sensitivity re-sults over specificity because in the medicaldiagnosis=prognosis domain the misclassifica-tion cost of false negatives (FN) (sick subjectsdiagnosed incorrectly) is higher than that of FP,
since in the case of a FP more specific medicaltests could discover the error but a FN couldcause a life-threatening condition that, depend-ing on the kind of disease, could lead to death(Weiss, 2004).
On the other hand, REMED showed the bestpredictive values (positive and negative). Thatis, even when REMED predicted rather moresick subjects, it kept the best positive predictivevalue (45%); therefore, REMED was more pre-cise in its positive predictions. In addition,REMED obtained the best performance interms of AUC, which can better represent theoverall performance of a classifier for imbal-anced data sets than when only the accuracymeasure is used (Chawla et al., 2004).
Tables 4 and 5 show the results of the two-tailed t test with a confidence level of 95% forthe accuracy and AUC comparisons respec-tively. We can appreciate from Table 4 thatthere were no statistically significant differences(p< 0.05) in the accuracy comparison; however,Table 5 shows that in terms of AUC REMEDsignificantly outperformed (p< 0.05) OneR (thebest performance in terms of accuracy andspecificity) and naive Bayes (the second best
Table 2: Classification rules generated by OneR, ADtree and REMED
Algorithm Rules
OneR If SBPZ149.594 and SBP< 153.07 then sick, else healthyIf SBPZ189.789 then sick, else healthy
ADtree If SBPZ149.594 and SBP< 153.07 then sick, else healthyIf SBPZ123.596 and SBP< 125.094 and SGVZ8.826 and SCVZ# 0.438 then sick, elsehealthyIf SBPZ123.596 and SBP< 125.094 and SGVZ8.826 and SCV< # 0.705 then sick, elsehealthy
REMED If SBPZ142.18 and SGVZ9.26 and SCVZ# 0.40 then sick, else healthy
Table 3: Performance comparison between the classification algorithms
Algorithm Accuracy Sensitivity Specificity AUC
Predictive values
Positive Negative
REMED 81.12 31.67 91.43 62.12 45.00 86.4Naive Bayes 79.52 19.33 92.23 57.55 35.48 84.34ADtree 77.95 18 90.77 56.93 29.41 83.81OneR 81.42 16 95.37 56.28 42.86 84.19
c! 2009 The Authors. Journal Compilation c! 2009 Blackwell Publishing Ltd Expert Systems, November 2009, Vol. 26, No. 5 373
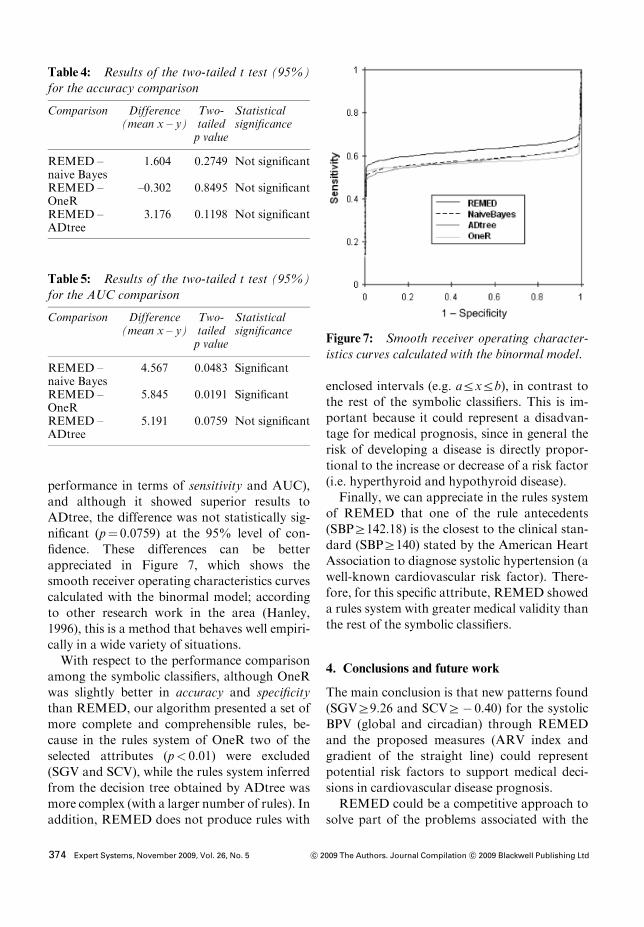
performance in terms of sensitivity and AUC),and although it showed superior results toADtree, the difference was not statistically sig-nificant (p" 0.0759) at the 95% level of con-fidence. These differences can be betterappreciated in Figure 7, which shows thesmooth receiver operating characteristics curvescalculated with the binormal model; accordingto other research work in the area (Hanley,1996), this is a method that behaves well empiri-cally in a wide variety of situations.With respect to the performance comparison
among the symbolic classifiers, although OneRwas slightly better in accuracy and specificitythan REMED, our algorithm presented a set ofmore complete and comprehensible rules, be-cause in the rules system of OneR two of theselected attributes (p< 0.01) were excluded(SGV and SCV), while the rules system inferredfrom the decision tree obtained by ADtree wasmore complex (with a larger number of rules). Inaddition, REMED does not produce rules with
enclosed intervals (e.g. arxrb), in contrast tothe rest of the symbolic classifiers. This is im-portant because it could represent a disadvan-tage for medical prognosis, since in general therisk of developing a disease is directly propor-tional to the increase or decrease of a risk factor(i.e. hyperthyroid and hypothyroid disease).Finally, we can appreciate in the rules system
of REMED that one of the rule antecedents(SBPZ142.18) is the closest to the clinical stan-dard (SBPZ140) stated by the American HeartAssociation to diagnose systolic hypertension (awell-known cardiovascular risk factor). There-fore, for this specific attribute, REMED showeda rules system with greater medical validity thanthe rest of the symbolic classifiers.
4. Conclusions and future work
The main conclusion is that new patterns found(SGVZ9.26 and SCVZ# 0.40) for the systolicBPV (global and circadian) through REMEDand the proposed measures (ARV index andgradient of the straight line) could representpotential risk factors to support medical deci-sions in cardiovascular disease prognosis.REMED could be a competitive approach to
solve part of the problems associated with the
Table 4: Results of the two-tailed t test (95%)for the accuracy comparison
Comparison Difference(mean x – y)
Two-tailedp value
Statisticalsignificance
REMED –naive Bayes
1.604 0.2749 Not significant
REMED –OneR
–0.302 0.8495 Not significant
REMED –ADtree
3.176 0.1198 Not significant
Table 5: Results of the two-tailed t test (95%)for the AUC comparison
Comparison Difference(mean x – y)
Two-tailedp value
Statisticalsignificance
REMED –naive Bayes
4.567 0.0483 Significant
REMED –OneR
5.845 0.0191 Significant
REMED –ADtree
5.191 0.0759 Not significant
Figure 7: Smooth receiver operating character-istics curves calculated with the binormal model.
374 Expert Systems, November 2009, Vol. 26, No. 5 c! 2009 The Authors. Journal Compilation c! 2009 Blackwell Publishing Ltd
application of machine learning to medicalprognostic domains, because it possesses thedesired features to solve medical prognosistasks: (1) good overall performance, becauseREMED reached a good overall performancein terms of accuracy, sensitivity, specificity,AUC, and predictive values (positives and nega-tives), (2) the comprehensibility of the prognos-tic knowledge, because REMED alwaysgenerated rules systems with a larger degree ofabstraction than the rest of the symbolic classi-fiers, (3) the ability to support decisions, becausethe fact that the rules systems of REMED arealways supported by an attribute selection withhigh confidence levels (> 99%) could providethe medical staff with enough trust to use thesepredictive rules in practice, and (4) the ability ofthe algorithm to reduce the number of medicaltests necessary to obtain a reliable prognosis,because REMED uses the simple LRM to onlyselect attributes strongly associated with thestudied disease.In future work, we will work on modifications
that improve REMED’s predictive capacity interms of sensitivity (Z50%) without signifi-cantly degrading its specificity. At the momentthe REMED algorithm can only work withcontinuous attributes; we will include modifica-tions that allow it to deal with discrete attri-butes. Finally, the rules obtained should beevaluated with data sets from other ABPMclinical studies.
Acknowledgements
The Maracaibo Aging Study is funded by theVenezuelan grant FONACIT G-97000876. MScSalvador Pintos collaborated in the applicationof the statistical methods. Dr Jose Aizpuruacollaborated in the application of the medicaldiagnostic tests and the clinical follow-up of thepatients. Mallira Rodriguez transcribed the re-sults of the ABPM study.
References
BOSNIC, Z. and I. KONONENKO (2008) Estimation ofindividual prediction reliability using the local sensi-tivity analysis, Applied Intelligence, 29, 187–203.
BREAULT, J.L., C.R. GOODALL and P.J. FOS (2002)Data mining a diabetic data warehouse, Journal ofArtificial Intelligence in Medicine, 1–2, 37–54.
BURDEN, R.L. and J.D. FAIRES (2000) NumericalAnalysis, Pacific Grove, CA: Brooks=Cole.
CHAWLA, N.V., N. JAPKOWICZ and A. KOLCZ (2004)Editorial: special issue on learning from imbalanceddata sets, SIGKDD Explorations, 6, 1–6.
DI RIENZO, M., G. GRASSI, A. PEDOTTI and G.MANCIA (1983) Continuous vs intermittent bloodpressure measurements in estimating 24 hour aver-age blood pressure, Hypertension, 5, 264–269.
FRATTOLA, A., G. PARATI, C. CUSPIDI, F. ALBINI andG. MANCIA (1993) Prognostic value of 24-hourblood pressure variability, Journal of Hypertension,11, 1133–1137.
FREUND, Y. and L. MASON (1999) The alternatingdecision tree learning algorithm, Proceedings of the16th International Conference on Machine Learning,San Francisco, CA: Morgan Kaufmann, 124–133.
HANLEY, J.A. (1996) The use of the binormal model forparametric ROC analysis of quantitative diagnostictests, Statistics in Medicine, 15, 1575–1585.
HOLTE, R.C. (1993) Very simple classification rulesperform well on most commonly used datasets,Machine Learning, 11, 63–91.
HOSMER, D.W. and S. LEMESHOW (2000) AppliedLogistic Regression, New York: Wiley.
IMAI, Y., K. ABE, S. SASAKI, N. MINAMI, M. MUNA-
KATA, H. SEKINO, M. NIHEI and K. YOSHINAGA
(1990) Determination of clinical accuracy and noc-turnal blood pressure pattern by new portable devicefor monitoring indirect ambulatory blood pressure,American Journal of Hypertension, 3, 293–301.
JOHN, G.H. and P. LANGLEY (1995) Estimating con-tinuous distributions in Bayesian classifiers, in Pro-ceedings of the 11th Conference on Uncertainty inArtificial Intelligence, San Mateo, CA: MorganKaufmann, 338–345.
KIKUYA, M., A. HOZAWA, T. OHOKUBO, I. TSUJI, M.MICHIMATA, M. MATSUBARA, M. OTA, K. NAGAI,T. ARAKI, H. SATOH, S. ITO, S. HISAMICHI andY. IMAI (2000) Prognostic significance of bloodpressure and heart rate variabilities, Hypertension,36, 901–906.
KONONENKO, I. (2001) Machine learning for medicaldiagnosis: history, state of the art and perspective,Artificial Intelligence in Medicine, 23, 89–109.
KUKAR, M. and C. GROSELJ (2000) Reliable diagnos-tics for coronary artery disease, in Proceedings of the15th IEEE Symposium on Computer Based MedicalSystems, New York: IEEE Press, 7–12.
MAESTRE, G., G. PINO, A. MOLERO, E. SILVA, R.ZAMBRANO, L. FALQUE, M. GAMERO and T. SUL-
BARAN (2002) The Maracaibo aging study: popula-tion and methodological issues, Neuroepidemiology,21, 194–201.
c! 2009 The Authors. Journal Compilation c! 2009 Blackwell Publishing Ltd Expert Systems, November 2009, Vol. 26, No. 5 375
MANCIA, G. (1990) Ambulatory blood pressure mon-itoring: research and clinical applications, Journal ofHypertension, 7, 1–13.
MCKEE, P., W. CASTELLI, T. MCNAMARA and W.KANNEL (1971) The natural history of congestiveheart failure, New England Journal of Medicine, 285,1444–1446.
MENA, L. and J.A. GONZALEZ (2006) Machine learn-ing for imbalanced datasets: application in medicaldiagnostics, in Proceedings of the 19th InternationalFlorida Artificial Intelligence Research Society Con-ference, Menlo Park, CA: AAAI Press, 574–579.
MENA, L., S. PINTOS, N. QUEIPO, J. AIZPURUA, G.MAESTRE and T. SULBARAN (2005) A reliable indexfor the prognostic significance of blood pressurevariability, Journal of Hypertension, 23, 505–512.
MITCHELL, T. (1997) Machine Learning, New York:McGraw-Hill.
PALATINI, P., M. PENZO, A. RACIOPPA, E. ZUGNO, G.GUZZARDI, M. ANACLERIO and A. PESSINA (1992)Clinical relevance of nighttime blood pressure and ofdaytime blood pressure variability, Archives of Inter-nal Medicine, 152, 1855–1860.
PICKERING, T., G. JAMES, C. BODDIE, G. HARSH-
FIELD, S. BLANKS and J. LARAGH (1988) Howcommon is white-coat hypertension?, Journal of theAmerican Medical Association, 259, 225–228.
PODGORELEC, V., P. KOKOL and M.M. STIGLIC (2002)Searching for new patterns in cardiovascular data, inProceedings of the 15th IEEE Symposium on Compu-ter Based Medical Systems, New York: IEEE Press,111–116.
RITCHIE, J., R. GIBBONS and M. CHEITLIN (1999)ACC=AHA=ACP-ASIM guidelines for the manage-ment of patients with chronic stable angina, A reportof the ACC=AHA Task Force on practice guidelines(Committee on management of patients with chronicstable angina), Journal of the American College ofCardiology, 33, 2092–2197.
RIZZONI, D., M.L. MUIESAN, G. MONTANI, R. ZULLI,S. CALEBICH and E. AGABITI-ROSEI (1992) Rela-tionship between initial cardiovascular structuralchanges and daytime and nighttime blood pressuremonitoring, American Journal of Hypertension, 5,180–186.
SANDER, D., C. KUKLA, J. KLINGELHOFER, W.KERSTIN and B. CONRAD (2000) Relationship bet-ween circadian blood pressure patterns and progres-sion of early carotid atherosclerosis, Circulation,102, 1536–1541.
SHIMADA, K., A. KAWAMOTO, K. MATSUYABASHI, M.NISHINAGA, S. KIMURA and T. OZAWA (1992)Diurnal blood pressure variations and silent cere-brovascular damage in elderly patients with hyper-tension, Journal of Hypertension, 10, 875–878.
VERDECCHIA, P., C. GOTTESCHI, G. BENEMIO, F.BOLDRINI, M. GUERRERI and C. PORCELLATI
(1990) Circadian blood pressure changes and leftventricular hypertrophy in essential hypertension,Circulation, 81, 528–536.
WEISS, G.M. (2004) Mining with rarity a unifyingframework, SIGKDD Explorations, 6 (1), 7–19.
WITTEN, I.H. and E. FRANK (2000) Data Mining:Practical Machine Learning Tools and Techniqueswith Java Implementations, San Francisco, CA:Mor-gan Kaufmann.
WITTEN, I.H. and E. FRANK (2005) Data Mining:Practical Machine Learning Tools and Techniques,San Francisco, CA: Morgan Kaufmann.
ZHENG, Z., X. WU and R. SRIHARI (2004) Featureselection for text categorization on imbalanced data,SIGKDD Explorations, 6, 80–89.
The authors
Luis Mena
Luis Mena received his first degree and an MScin applied computing from the University ofZulia, Venezuela. Currently he is concluding hisPhD in computer science at the National Insti-tute of Astrophysics, Optics and Electronics,Mexico. He is an associate professor in theDepartment of Computer Science at the Facultyof Engineering of the University of Zulia, Vene-zuela, and researcher at the National Observa-tory of Science, Technology and Innovation,Venezuela. His interest areas include datamining, pattern recognition and artificial intelli-gence. He has written four articles on artificialintelligence in medicine.
Jesus A. Gonzalez
Jesus A. Gonzalez obtained his bachelor degree incomputer science and engineering from the Uni-versity of the Americas, Mexico. He then ob-tained a Masters degree and PhD in computerscience and engineering from the University ofTexas at Arlington, USA. He is currently enrolledin the Computer Science Department at the Na-tional Institute of Astrophysics, Optics and Elec-tronics,Mexico, as a professor and researcher. Heis also the academic coordinator of the campusMexico of the Regional Center for Space Science
376 Expert Systems, November 2009, Vol. 26, No. 5 c! 2009 The Authors. Journal Compilation c! 2009 Blackwell Publishing Ltd

and Technology Education for Latin Americaand the Caribbean. His interest areas includemachine learning, data mining, remote sensingand geographic information systems.
Gladys Maestre
Gladys Maestre graduated from medical schoolat the University of Zulia, Venezuela, and,following a postdoctoral fellowship in the De-partment of Psychiatry at Massachusetts Gen-eral Hospital, USA, completed her PhD in the
Department of Pathology at Columbia Univer-sity. She currently holds the positions of profes-sor of neuroscience at the University of Zulia,Venezuela, and research associate scientist atColumbia University Sergievsky Center, USA.Her research projects focus on gene–environ-ment interactions affecting cognitive and cardi-ovascular health, particularly related to aging.She leads the Maracaibo Aging Study andcoordinates diverse activities related to capacitybuilding for research in Venezuela and theCaribbean region.
c! 2009 The Authors. Journal Compilation c! 2009 Blackwell Publishing Ltd Expert Systems, November 2009, Vol. 26, No. 5 377


