Embed Size (px)
Citation preview

www.rsc.org/advances
RSC Advances
This is an Accepted Manuscript, which has been through the Royal Society of Chemistry peer review process and has been accepted for publication.
Accepted Manuscripts are published online shortly after acceptance, before technical editing, formatting and proof reading. Using this free service, authors can make their results available to the community, in citable form, before we publish the edited article. This Accepted Manuscript will be replaced by the edited, formatted and paginated article as soon as this is available.
You can find more information about Accepted Manuscripts in the Information for Authors.
Please note that technical editing may introduce minor changes to the text and/or graphics, which may alter content. The journal’s standard Terms & Conditions and the Ethical guidelines still apply. In no event shall the Royal Society of Chemistry be held responsible for any errors or omissions in this Accepted Manuscript or any consequences arising from the use of any information it contains.
View Article OnlineView Journal
This article can be cited before page numbers have been issued, to do this please use: N. Jain, N.
Marwaha, R. Verma, B. K. GUPTA and A. K. Srivastava, RSC Adv., 2015, DOI: 10.1039/C5RA21150F.

RSC Advances
ARTICLE
This journal is © The Royal Society of Chemistry 20xx J. Nam e. , 2013, 00, 1-3 | 1
Please do not adjust margins
a. Academy of Scientific and Innovative Research, CSIR – National Physical Laboratory, New Delhi – 110012, India
*Email: [email protected], [email protected] *Fax: +91-11-45609310, Tel: +91-11-45609308 Electronic Supplementary Information (ESI) available: [Fig. S1 and Fig. S2]. See DOI: 10.1039/x0xx00000x
Received 00th January 20xx, Accepted 00th January 20xx
DOI: 10.1039/x0xx00000x
www.rsc.org/
Facile synthesis of defect induced highly-luminescent pristine MgO nanostructures for promising solid state lighting applications Navita Jaina, Neeraj Marwahaa, Rajni Vermaa, Bipin Kumar Guptaa and Avanish Kumar Srivastava*a
A novel strategy was introduced to produce large scaled pristine MgO nanostructures as a feasible candid for light harvesting applications. Herein, MgO nano-flakes/fibers like morphology was synthesized by co-precipitation route at different calcination temperatures ranging from 500 to 1100 °C and well characterized by several standard experimental techniques such as XRD, FTIR, SEM, EDX, TEM to confirm the formation of MgO nanostructures. Undoped MgO nanostructure obtained at 1100 °C, exhibited strong photoluminescence (PL) emission spectrum at 668 nm (hyper sensitive red) upon 466 nm excitation wavelength. Moreover, these nanostructures also show strong blue (477 nm) and red (668 nm) luminescence emissions simultaneously at excitation wavelength of 317 nm. A further investigations probed by PL mapping demonstrates the homogeneous distribution of PL intensity throughout the MgO surfaces and time-resolved photoluminescence spectroscopy results of these nanostructures indicate the decay time less than 10 ns. Hence facile synthesis of these luminescent undoped MgO nanostructures provides a potential platform to harvest white light generation (combination of blue and red emission) as well as in proposed LED application.
Introduction Past few decades, a huge amount of luminescent nanomaterials/nanophosphors are being searched globally and several discoveries emerging out to provide the alternate solutions for desired solid state lighting problems in our daily life. Although, there are well known materials that can easily emit light such as semiconductor nanomaterials (CdS, ZnS), quantum dots and rare earth based nanomaterials (Y2O3:Eu3+, YAG:Ce).1 These luminescent materials have numerous applications such as luminescent security ink, optoelectronic devices, solar cell, biological fluorescence labeling, light harvesting devices and optical imaging.2-5 The semiconductor materials like sulfides have disadvantage as toxicity, low efficiency, harmful solvents and additives.2,6 Similarly quantum dot suffers from photo-bleaching effect as well as low temperature required to control the size.7 Though, the rare earth materials have sharp transitions, anti-stokes emission and better stability, but they suffer from some obvious drawbacks such as inconsiderate synthesis conditions, high cost, and limited availability on the earth.8 There are several searched are going throughout the world wide to address this issues.9 In this series, alkaline earth metal oxides such as CaO, BeO, MgO, SrO gain much attention in material science as an
inorganic phosphor for optoelectronics devices, sensor, solid state lighting applications, due to their defect induced luminescence properties.10-11 Among these oxides nanostructures, MgO is one of the most important alkaline earth metal oxide which are attracting many researchers due to their high economical availability, less toxicity and eco-friendly nature. Now a day’s several researches on the study of MgO nanostructures like nanoparticles, nanorods and nanoflakes12-14 are carried out due to their excellent thermal, electrical, chemical, physical and optical properties15-18 and widely used for the vast applications such as adsorbents, sensors, catalysis, refractory material, paint, fluoride remover, optoelectronics and luminescence devices.19-24 There are few reports on synthesis of MgO nanostructures using various versatile methods like sol-gel, thermal evaporation, combustion aerosol, chemical vapor deposition, hydrothermal and co-precipitation25-30 etc. Among them, Co-precipitation method has been adopted mainly for its advantages such as simplicity, inexpensive instrumental setup, low-reaction time, high yield production and good control over the experimental conditions.31 The obtained MgO nanostructures has wide band gap of 7.8 eV32 and the photon excitation energy of rocksalt cubic structures of this material significantly well below the band gap of material in compare to direct band gap transition materials because of the presence of intrinsic/extrinsic defects induced absorption and emission.33 The tailoring of band gap of these nanostructures can be possible from ultraviolet to visible range. The photoluminescence (PL) properties of these nanostructures have been well studied both experimentally and theoretical in literatures. Due to the presence of defects at
Page 1 of 10 RSC Advances
RS
CA
dvan
ces
Acc
epte
dM
anus
crip
t
Publ
ishe
d on
15
Dec
embe
r 20
15. D
ownl
oade
d by
Gaz
i Uni
vers
itesi
on
05/0
1/20
16 1
1:38
:05.
View Article OnlineDOI: 10.1039/C5RA21150F

ARTICLE Nanoscale
2 | J. Name., 2012, 00, 1-3 This journal is © The Royal Society of Chemistry 20xx
Please do not adjust margins
the surface sites gaining significant interest among scientific community in this area.11,34 Earlier, literature reports exhibit that the bare MgO nanostructures with intrinsic defects such as Oxygen / magnesium ion vacancies (F-center defects and V center defects) mostly show PL emission in blue region at room temperature while MgO with external defects (doped impurities) such as Cr, Fe, Mn or other transition metal ions doping are responsible for red emissions.35-40 It is interesting to note that the present proposed work promises the strong red photoluminescence emission in undoped MgO nano-flakes/fibers at higher calcination temperature of 1100 °C which provides a new analog for MgO based luminescent materials in parallel to rare earth phosphors/nanophosphors. In present work, simple and economical co-precipitation method is used for the synthesis of nano-sized MgO which is calcined at different temperatures varying from 500 to 1100 °C. Further we analyzed the structural, morphological and optical properties of MgO samples by using different characterization techniques such as XRD, FTIR, SEM, TEM, UV-Vis. Nano-sized MgO calcined at 1100 °C exhibits strong photoluminescence emissions at blue and red region upon excitations at 317 nm, whereas strong red emission was observed at 466 nm with fast decay time less than 10 ns promise its proposed legitimate use in white light generation as well as solid state lighting applications.
Experimental details Chemicals used:
MgO nano-flakes/fibers were prepared by wet chemical co-precipitation method and calcined at different temperature ranges from 500 to 1100 °C. Magnesium nitrate hexahydrate [Mg(NO3)2.6H2O] (99%, Qualigens) as a precursor and ammonium hydroxide [NH4OH] (25% NH3, Rankem) as a precipitating agent were used. Double distilled water was used during all process of synthesis. Synthesis of MgO nanostructures
In brief detail, NH4OH solution (12%, 27ml) was drop wise injected into the solution of Mg(NO3)2.6H2O (20gm, 35ml) at 50 °C under constant stirring and a resultant white color precipitate appeared after digesting in the mother liquor for 5 h which is indicating the formation of as-synthesized Mg(OH)2. The reaction mixture was cooled down to room temperature, then precipitate was filtered out, washed with double distilled water for several times to remove the by-products and finally dried in oven at 100 °C for 10 h. Now after having prepared as-synthesized Mg(OH)2, MgO was obtained by calcination of Mg(OH)2 at higher temperature via thermal decomposition. In this experiment, the as-synthesized Mg(OH)2 was thermally heated in the muffle furnace at 500, 700, 900 and 1100 °C with a constant heating rate of 10 °C/min under 10 h dwell time to determine the effect of temperature on properties of MgO samples.
Details of instrumental analysis:
XRD experiment was carried out to obtain the crystalline structure, phase formation, purity and other information of synthesized material by using a Bruker X-ray diffractometer, Monochromatic Cu-Kα1 radiation (λ = 1.541Å) as a X-ray source with 10 to 80° scanning range. FTIR experiment was also performed by a single beam Perkin Elmer instrument (Spectrum BX-500) for structural information by determining the chemical group present in sample. The morphological study of nanostructure was measured by the scanning electron microscopy (Model: Zeiss EVO MA-10 SEM equipped). An energy dispersive X-ray spectrum of MgO was executed by EDS: Oxford Link ISIS 300. Transmission electron microscopy (TEM) was performed for high resolution morphology characterization and HRTEM used for calculation of lattice spacing (HR-TEM: FEI Tecnai G2 F30 STWIN at 300 kV). The UV-Vis absorption spectra of MgO samples were recorded by UV-Vis spectrometer (Shimadzu UV-3101). Photoluminescence characteristics were observed using a photoluminescence spectrometer (Edinburgh Instruments, model FLSP-900) with a xenon lamp as the excitation source. The time-resolved PL decay profile of spectra of MgO sample was recorded at room temperature by a time-correlated single-photon counting technique (Edinburgh Instruments, model FLSP-900) with Pico seconds diode laser as a source of 375 nm fixed excitation wavelength. The PL mapping for 2D view of fluorescence PL intensity was performed by WITec alpha 300R+ Confocal PL microscope system (WITec GnBH, Ulm, Germany), where 375 nm diode laser was used as a source of excitation. To estimate the absolute luminescence quantum efficiency of the undoped MgO nanostructure, an integrating sphere equipped with an Edinburgh spectrometer (Model F900) instrument has been used and by measuring the integrated fraction of luminous flux and radiant flux with the standard method.
Results and discussion Structural determination
Fig. 1A depicts the X-ray diffraction pattern of as-synthesized Mg(OH)2 and MgO samples calcined at 500, 700, 900 and 1100 °C.
Fig. 1A X-ray diffraction patterns of (a) as-synthesized Mg(OH)2 (lower segment) and MgO (upper segment) calcined at (b) 500, (c) 700, (d) 900 and (e) 1100 °C, respectively.
Page 2 of 10RSC Advances
RS
CA
dvan
ces
Acc
epte
dM
anus
crip
t
Publ
ishe
d on
15
Dec
embe
r 20
15. D
ownl
oade
d by
Gaz
i Uni
vers
itesi
on
05/0
1/20
16 1
1:38
:05.
View Article OnlineDOI: 10.1039/C5RA21150F

Nanoscale ARTICLE
This journal is © The Royal Society of Chemistry 20xx J. Nam e. , 2013, 00, 1-3 | 3
Please do not adjust margins
Where (a) displays the XRD pattern of as-synthesized Mg(OH)2 sample. All the diffraction peaks present in this sample were well indexed and closely matched with standard JCPDS card no. 84-2163 (a=b=3.148, c=4.779 Å) correspond to miller indices (001), (100), (101), (102), (110), (111), (013), (021) demonstrate hexagonal close packed structure with lattice parameters a=b=3.1384 Å and c=4.7803 Å with sharp peaks at 37.97 and 18.59°. No other peaks for any impurity signifying the formation of pure Mg(OH)2. The average crystallite size using FWHM value (0.40°) of peak centred at 37.97° (calculated by gauss fit) was found to be ~20 nm as calculated by Debye-Scherrer equation. Fig.1 (b)-(e) elucidate the XRD patterns of MgO samples produced by calcination of as- synthesized Mg(OH)2 at (b) 500, (c) 700, (d) 900 and (e) 1100 °C, where in all cases the peak position remain unchanged and peak intensity continued to grow as calcination temperature was increased. The peak positions correspond to (111), (200), (220), (311), (222) planes that can be indexed to the cubic structure of MgO with standard JCPDS card no. 87-0653 having lattice parameters and unit cell volume as illustrate in table 1. No other diffraction peak was present, it concluding no remnant. The average crystallite size was calculated to be ~8, ~15, ~22 and ~36 nm by using FWHM values of 0.94, 0.54, 0.37 and 0.23 with the peak locations at 42.83, 43.06, 43.01 and 43.00°, respectively for the products attained by calcination at 500, 700, 900 and 1100 °C. It is interesting to notice that cell volumes and cell parameters increases up to 1100 °C, beyond it a sharp decrease in cell volume as well as in cell parameters due to formation of secondary phases at the surface of MgO nanostructures which have good agreement with obtained photoluminescence results.
Fig. 1B crystal structures of MgO and Mg(OH)2, where yellow arrows represent (200) and (101) planes, respectively.
Calcination temperature (°C)
Lattice parameters (Å)
V (m3)
[Standard JCPDS no. 87-0653]
(a = b = c = 4.20) (a3)
500 4.2065 74.4325 � 10-30 700 4.2076 74.4909 � 10-30 900 4.2098 74.6078 � 10-30
1100 4.2659 77.6304 � 10-30
The crystal planes (200) and (101) correspond to the highest intensity peaks in cubic MgO and hexagonal Mg(OH)2, as shown in fig. 1B. The transformation from as-synthesized Mg(OH)2 to MgO was further confirmed by FTIR spectrum. The sharp and intense band at 3698 cm-1 is attributed to the -OH anti-symmetric stretching vibration41 and it vanishes with increasing calcination temperatures from 500 to 900 °C, as illustrated in fig. S1(Supporting information). The bands present around 668 to 865 cm-1 in spectra of all samples is assigned to the MgO stretching vibration mode34 for both uncalcined and calcined samples. The intensive bands at around 1550 cm-1 occurs due to the bending vibration of weakly bound molecular water.41 the emergence of absorption band at around 3463 cm-1 is attributed to the stretching modes of hydroxyl group. The bands associated at around 1500 and 3463 cm-1 is deformed into smaller peaks at higher temperature of 900 °C, indicating the removal of moisture and complete transformation of dense crystals of MgO from Mg(OH)2. Interestingly, the bathochromic shift was also noticed with increasing temperature as illustrated in fig.-S1, from 870 (MgO: 500 °C) to 865 (MgO: 700 °C), 858 (MgO: 900 °C) cm-1 owing to the dangling bonds present on the surface of the nanostructures.42 Plausible Mechanism for formation of MgO nanostructures The synthesis process for formation of solid precipitate of Mg(OH)2 is described by following chemical reaction between Mg(NO3)2.6H2O as precursor and NH4OH as precipitating agent.12 Mg�NO���. 6H�O+NH�OH→Mg�OH�� (1)
The whole intermediate chemical reactions for formation of Mg(OH)2 can be explained in proposed following steps. Mg�NO���. nH�O
�������������������� Mg�NO���+nH�O→�Mg�NO���H�O���� (2)
↔ Mg�� +NO�
� + 2H�O (3)
where n=2
�Mg�NO���H�O����
Mg�� + 2OH� → Mg�OH�� (4)
Mg�OH�� �������������������� MgO + H�O (5)
The plausible mechanism is briefly described in three steps, among them in the first step, the host material Mg�NO���. 6H�O was dissolved in deionized water and a clear solution of Mg�NO��� was formed. After dissolution, Mg�NO���form a complex intermediate cation �Mg�NO���H�O���� with water molecules,37 where the legend NO�
� has bidentate binding motif and it undergoes bond formation with Mg through its oxygen moiety. Here, n represents the number of water molecules varying from 1 to 4.
Page 3 of 10 RSC Advances
RS
CA
dvan
ces
Acc
epte
dM
anus
crip
t
Publ
ishe
d on
15
Dec
embe
r 20
15. D
ownl
oade
d by
Gaz
i Uni
vers
itesi
on
05/0
1/20
16 1
1:38
:05.
View Article OnlineDOI: 10.1039/C5RA21150F

ARTICLE Nanoscale
4 | J. Name., 2012, 00, 1-3 This journal is © The Royal Society of Chemistry 20xx
Please do not adjust margins
Intermediate cation at n=1-3 have unstable structures whereas at n=4, Mg��forms a stable octahedral structure. It was found that n=2,3 are more unstable than n=1 because additional water molecules bind with Mg�� ion which leads to reduction of average ion-water molecules interaction and become an unstable intermediate cation which leads to the formation of magnesium bivalent cation �Mg�� �according to eqn. (3).43 In third step, the formed Mg�� cation reacts with 2OH� anion from NH�OH and gives white precipitate ofMg�OH��. Atlast MgO rocksalt type six fold coordinated cubic structure was obtained from thermal calcination of as-synthesized Mg�OH�� at 500, 700, 900 and 1100 °C. Surface morphology and microstructure analysis
The surface morphologies and microstructures of Mg(OH)2 and MgO nanostructures were well characterized by SEM and TEM techniques. SEM micrographs of Mg(OH)2 at low magnification revealed the nanoflowers like structure due to the agglomeration of several nanoflakes as shown in Fig. 2(a1).
Fig. 2 SEM images of (a1, a2) represent as-synthesized Mg(OH)2, (b1, b2), (c1, c2), (d1, d2), (e1, e2) represent MgO nanostructures obtained by calcination temperature of 500, 700, 900, 1100 °C, respectively at lower and higher magnifications, (f1, f2) shows EDX spectrum of MgO calcined at 900 and 1100 °C, respectively.
The probable reason behind this agglomeration could be the hydrogen bonding formation among various hydroxyl species.42 The flakes are interconnected with adjacent one, such that no clear boundaries exist between them. The corresponding high magnification image [fig. 2(a2)] identified nanofibers emerging out from nanoflowers and show high pits and voids. Fig. 2(b1-e2) shows SEM micrographs at low and high magnification of the corresponding samples of MgO calcined at 500, 700, 900 and 1100 °C, respectively. SEM images of all the MgO samples were uniform and heating the samples at higher temperatures results in the recovery of surface. It is clear from the micrographs as shown in fig. 2(b2, c2, d2), that increasing the calcination temperature from 500 to 900 °C, the aspect ratio as well as density of nanoflakes converting to nanofibers increases indicating the bursting of nanoflowers like structure due to the removal of moisture.37 It can be interesting to notice from fig. 2(e2), the MgO nanostructures synthesized at 1100 °C exhibits that the width
of nanofibers became increase, whereas the length get shortened and structure of highly packed nanofibers dominated. Such structures are highly desirable to produce higher photoluminescence intensity due to its higher surface area. The EDS analysis [fig. 2(f1,f2)] of MgO samples calcined at 900 and 1100 °C, respectively reveal the presence of Mg and O concentrations of Mg:O is 54:46 and 49:51, respectively.
Fig. 3 TEM images of MgO samples; (a), (b) Low magnification images of MgO calcined at 700 and 900 °C, respectively. (c), (d) low and high magnification images of MgO calcined at 1100 °C. Right and left inset in (a), (b) show high magnification images and lattice resolved HRTEM images, respectively. Left inset of (c), (d) represent lattice resolved HRTEM image and SAED pattern, respectively.
For investigation of microstructures of nano-sized MgO obtained at various calcination temperatures, TEM was conducted. The bright field TEM image of 700, 900 and 1100 °C at low magnifications exhibited the irregular mix morphologies of nanofibers with flakes like structure as shown in fig. 3(a-c). High magnification micrographs of 700 and 900 °C [in right inset of fig. 3(a),(b)] attain the width near to 19 nm and 75 nm, respectively. Fig. 3(d) shows the high magnification image of the nanofiber calcined at 1100 °C which is approximately 95 nm in width and 400-500 nm in length which reveal the enhancement of width with increasing temperatures. HRTEM represents the well defined lattice fringes of d-spacing 0.24 nm that corresponds to [111] plane for 700 °C and 0.21 nm that corresponds to [200] plane for MgO samples calcined at 900 and 1100 °C, respectively that found to be in agreement with XRD results as represented in the left inset of Fig. 3(a-c), respectively. Bright and sharp dots obtained in SAED pattern of MgO sample at 1100 °C also confirm high crystallinity of MgO sample, left inset of Fig. 3(d). Electron microscopy results clearly reveal the formation of different types of nanostructure morphologies at various calcination temperatures. Nano-sized fiber like morphology was found to be enhanced than that of nano-flakes as the calcination temperature rises, as represented in Scheme 1(i). PL intensity was observed to be highest at 1100 °C, as elucidated in Scheme 1(ii), that is probably due to the highly crystalline, well defined and uniform morphology of obtained nano-fibers.35 High crystallinity of the sample can be explained
Page 4 of 10RSC Advances
RS
CA
dvan
ces
Acc
epte
dM
anus
crip
t
Publ
ishe
d on
15
Dec
embe
r 20
15. D
ownl
oade
d by
Gaz
i Uni
vers
itesi
on
05/0
1/20
16 1
1:38
:05.
View Article OnlineDOI: 10.1039/C5RA21150F

Nanoscale ARTICLE
This journal is © The Royal Society of Chemistry 20xx J. Nam e. , 2013, 00, 1-3 | 5
Please do not adjust margins
by FWHM value of PL, as calculated and shown in the table of Scheme 1.
Scheme 1 Pictorial representation shows the relationship among crystallinity, structural morphology and optical property. (i) Formation of as-synthesized nanoflowers of Mg(OH)2 from precursor and variation in structural morphology of obtained MgO nanostructures with increasing calcination temperatures, (ii) PL emission at excitation wavelength of 317 nm and table representing the increase in crystallite size with FWHM of MgO samples, (iii) Schematic illustrating the red and orange emission from MgO nanofiber obtained at 1100 °C (iv) diagrammatic view showing the use of MgO nanostructure in white LED.
The FWHM value of peak B was found to be least for the highest temperature pointing to the sharp narrower peak leading to the high crystallite size (calculated by Debye-Scherrer Equation) as obtained from XRD. Also, lattice spacing (d=0.20 nm) and SAED pattern are also found to be in agreement with FWHM values of PL intensity peaks. Thus, we can say that high crystallinity points highest PL peak. On blue excitation of nanofibre, obtained at 1100 °C, orange and red emission was observed as depicted in Scheme 1(iii) and on the combination of blue, orange and red, white light is produced which can be used for LED applications, as shown in Scheme 1 (iv).
Optical properties UV-Vis absorption spectroscopic analysis
The optical properties of MgO samples have been studied for many years due to their several defects formation and presence of low coordination ions. Optical absorption was studied for MgO samples to determine the existence of low coordination sites on the surface of oxides. MgO nanocrystals have three types of coordinated ions as 3-coordinated, 4-coordinated, 5-coordinated present at corner, edges and terrace sites.44 UV-Vis absorption spectra of MgO samples calcined at 500, 700, 900 and 1100 °C are presented in inset of fig. 4. The two UV-Vis absorption peaks were observed at about 220 and 250 nm for all MgO samples. The same absorption bands for all MgO samples concluded that they all have same absorption sites at different temperatures. Absorption spectra at 220 nm attributed to the optical
excitation of 4-coordinated surface anions (O���� �at the edges
of the MgO nanocrystallite and absorption spectra at 250 nm attributed to the optical excitation of 3-coordinates surface anions (O��
�� ) at the corners of the MgO nanocrystallite.23
Fig. 4 Tauc graph plotted for synthesized MgO samples at 500, 700, 900 and 1100 °C for optical band gap measurement, inset demonstrate the UV-Vis absorption spectra for the MgO samples at calcination temperatures of 500, 700, 900 and 1100 °C.
Surface anion of MgO nanocrystals reduces their coordination no. may be because of their low modulung potential and become less stable as a result MgO sample exhibit unusual reactivity under the influence of UV-Vis excitation.23 The tauc plot of (αhν)2 versus (hν) for energy band gap detection of MgO samples calcined at 500, 700, 900 and 1100 °C are demonstrate in fig. 4. The corresponding optical band gap of MgO calcined at 500 and 700 °C exhibit higher band gap value of 3.44 eV and optical band gap value of 3.30 eV and 3.10 eV was found for MgO samples calcined at 900 and 1100 °C, respectively. Fig. 4 is clarifies that energy band gap decreases as temperature increases. It might be due to the increase of size of nano-flakes/fibers with temperatures which lead to decrease energy bands gap.45-46 Photoluminescence spectroscopic analysis
In present study, room temperature photoluminescence spectra were carried out of all MgO samples calcined at different temperatures for surface defects induced photoluminescence study by using two excitation wavelengths (λex) at 317 nm and 466 nm upon 668 nm fixed emission wavelength(λem), as shown in fig. 5(a). The result of PL emission spectrum exhibits two broad PL emission bands at 477 nm (blue region) and 668 nm (red region) at excitation wavelength of 317 nm, as depict in fig. 5(b). The PL emission at 477 nm occurrences due to F°-center oxygen vacancies and didn’t show a symmetric change with calcination temperatures.47 Further, the emission peak at 668 nm could be established because of abundance of oxygen vacancies in terms of defects within lattice via heating at higher calcination temperature,48 therefore broad peak at 668 nm is significantly enhance with temperatures and show very high intensity at 1100 °C. The range of the PL spectra of doped MgO is almost similar as undoped MgO because these kind of emission basically aroused from defect induced emission centers but
Page 5 of 10 RSC Advances
RS
CA
dvan
ces
Acc
epte
dM
anus
crip
t
Publ
ishe
d on
15
Dec
embe
r 20
15. D
ownl
oade
d by
Gaz
i Uni
vers
itesi
on
05/0
1/20
16 1
1:38
:05.
View Article OnlineDOI: 10.1039/C5RA21150F

ARTICLE Nanoscale
6 | J. Name., 2012, 00, 1-3 This journal is © The Royal Society of Chemistry 20xx
Please do not adjust margins
the distinction in the all cases can be easily possible through the peak shift of the photoluminescence spectra of MgO doped nanostructures(as literature evidence emission peaks of doped MgO-685, 703, 718, 750 nm as compare to present case (undoped MgO ~668 nm)).36,38,39,40 The emphasis of the study on photoluminescence emission at excitation wavelength on 466 nm is due to its proposed application in integration with blue LED to convert into white LEDs. PL spectrum of all MgO samples was examined to use in LED applications because of commercial blue LEDs exhibits electro-luminescence emission around 470 nm. Fig. 5(c) shows strong emission from 580 to 750 nm associated with two peaks at 593 nm and 668 nm upon 466 nm excitation wavelength which is in the range of blue LED electroluminescence emission.
Fig. 5 (a) Photoluminescence excitation spectra at fixed emission wavelength 668 nm and (b) & (c) represent the emission spectra under the excitation wavelengths at 317nm and 466 nm of MgO samples calcined at 500, 700, 900 and 1100 °C, (d) CIE coordinates at white region of full emission wavelength of MgO: 1100 °C sample at excitation wavelength of 317 nm.
Fig. 5(d) represents the CIE color co-ordinates of MgO sample calcined at 1100 °C corresponding to photoluminescence emission at excitation wavelength of 317 nm. Here blue emission (477 nm) of PL demonstrate the CIE coordinates at x= 0.13, y=0.37 (blue region) and red emission (668 nm) shows CIE coordinates at x=0.64, y=0.36 (red region). The combination of these two blue and red emission or PL spectrum of full emission at 317 excitation range estimated CIE coordinates at white region (x=0.33, y=0.36) as shown in fig. 5(d). Time resolved photoluminescence spectroscopic analysis
Time resolved PL technique is performed to investigate the decay time of the luminescent MgO material. Here, TRPL was performed using a PL spectrometer at 375 nm excitation wavelength using picoseconds diode laser as a source by a time-correlated single-photon counting spectrometer. The resulted data demonstrate the decay time to be within less than 10 ns at 477 nm emission as represent in fig. 6(a). The decay time data was fitted to a double-exponential
function, as shown in given equation (6). The fitted curve shown in fig. 6(b) I�t�� A� exp�� t/τ��� A� exp��t/τ�� (6) Where I (t) is the PL intensity at time t and A1, A2 are weighting parameters. Exponential decay curve with decay time fewer than 5 ns reveal direct radiative recombination without trapping and a short lived emission of F-center.47,18 Average life time also determined by the following equation (7):2,4,5,11
τ�� � ����������
�
��������� (7)
The average life time for the MgO obtained at 1100 °C is calculated to be τav = 133 ps which is suitable for many potential applications such as solid state lighting, white light
Fig. 6(a) shows TRPL spectra in the nanosecond region (b) represents the fitting curve and parameter obtained from this fitting curve. Here, τ1 and τ2 is two decay components, called fast and slow decay components which represent the fast and slow recombination process, respectively.
generation, optical switching or optical sensor applications where decay time essential to be in the range of nanosecond to picoseconds.
Photo-luminescence stability analysis
To evaluate the light induced performance of MgO, we also performed photo bleaching experiment of MgO sample calcined at 1100 °C. Here obtained result represents a good photo stability of MgO material as shown in fig. (S2) (Supporting information). PL mapping: Spatial distribution of fluorescence intensity
Furthermore, the PL mapping was carried out by confocal PL instrument with a 375 nm diode laser as a source of excitation wavelength for obtained the optical image of spatial distribution of PL emission intensity at the surface of MgO nanostructure. Here PL mapping was carried out for MgO sample calcined at 1100 °C. The optical micrograph images and 2D view of fluorescence PL intensity mapping carried out at blue region (477 nm) and red region (668 nm) of MgO sample calcined at 1100 °C, represent in fig. 7.
Page 6 of 10RSC Advances
RS
CA
dvan
ces
Acc
epte
dM
anus
crip
t
Publ
ishe
d on
15
Dec
embe
r 20
15. D
ownl
oade
d by
Gaz
i Uni
vers
itesi
on
05/0
1/20
16 1
1:38
:05.
View Article OnlineDOI: 10.1039/C5RA21150F

Nanoscale ARTICLE
This journal is © The Royal Society of Chemistry 20xx J. Nam e. , 2013, 00, 1-3 | 7
Please do not adjust margins
Fig. 7(a) Optical micrograph images of MgO sample calcined at 1100 °C, (b) photoluminescence spectrum excited at 375 nm picoseconds diode laser, (c, d) 2D micrographs of PL intensity mapping at blue and red region of MgO sample
calcined at 1100 °C.
The obtained result reveals the uniform distribution of photoluminescence emission intensity on the MgO nanostructure surface.
Proposed futuristic application of MgO nanostructures in WLED
In order to propose futuristic application of luminescent MgO nanostructures for WLED application, it is important to understand the basic concept of white light generation in LEDs. In general concept for WLED, phosphor incorporated in the epoxy region of the blue LED (InGaN) to generate white light,
where some blue light emission from Blue LED converted into yellow light by the phosphor49-51 and the remaining blue light results in white light by mixing with yellow light.49,52-53 For example, YAG:Ce3+ is most commercially used phosphor in the field of solid state lighting applications, due to their attractive optical properties, long lifetime, non-toxicity, chemical and thermal stability.49 YAG:Ce3+ based LED suffers from some drawbacks such as very low quantum efficiency and poor color rendering index (CRI) due to the deficiency of generating red light.49 To improve the red emission of the YAG:Ce3+ phosphor, the effect of co-doping of red emitting species such as rare earth ions (Cr3+, Pr3+, Sm3+), quantum dots and nanophosphors has been widely examined.49,54-59 The recently another approach to improve the CRI and CCT is to incorporate plasmonic nanoparticles (such as Au) into the nanophosphors.49 But both the approaches suffer from the disadvantage of cost effectiveness. In present investigation, MgO is proposed as cost effective and environmental friendly, red emitting luminescent material for WLED application. The spectroscopic result of this material satisfied the required benchmark. Schematic illustration in scheme 2(a) is depicting that by integration of blue LED (λem= 470 nm) with luminescent MgO material or via using the combination of blue light (emission of BLED), plus red and orange light (emitted from MgO luminescent material) could be engineered to generate a white light for WLED application.
Scheme 2 Plausible mechanism for generation of white LED; (a) CIE coordinates for white color formation via the combination of red coordinates (from MgO: 1100 °C) and standard blue color coordinates; (b) PL emission of MgO: 1100 °C sample at excitation of 466 nm (right inset) and standard blue emission of BLED (left inset), their pictorial representation as white light emission.
The simulated CIE results is based on commercial blue LED electroluminescence emission with observed red emission of MgO excited at 466 nm as shown in Scheme 2(b). Briefly, in present case, we observed a broad spectrum which covers orange (593 nm) to deep red region (668 nm) at excitation of 466 nm as shown in scheme 2(b). The quantum efficiency of the present defect induced undoped MgO nanostructure is
~55% which qualifies the almost required criteria for LED application. The spectroscopy results of MgO clearly legitimate that it could be integrate with blue LEDs for futuristic white LED applications.
Page 7 of 10 RSC Advances
RS
CA
dvan
ces
Acc
epte
dM
anus
crip
t
Publ
ishe
d on
15
Dec
embe
r 20
15. D
ownl
oade
d by
Gaz
i Uni
vers
itesi
on
05/0
1/20
16 1
1:38
:05.
View Article OnlineDOI: 10.1039/C5RA21150F

ARTICLE Nanoscale
8 | J. Name., 2012, 00, 1-3 This journal is © The Royal Society of Chemistry 20xx
Please do not adjust margins
Please do not adjust margins
Conclusion We have successfully demonstrated a new strategy for high yield production of luminescent nano-flakes/fibers like MgO nanostructure using co-precipitation method. The structural/micro structural and surface morphology of these nanostructures was confirmed by various characterization techniques such as XRD, FTIR, EDX, SEM, TEM. The SEM and HRTEM images clearly demonstrate the nano-flakes/fibers like features throughout the sample. The photoluminescence spectroscopy results of MgO sample calcined at 1100 °C clearly reveal that these nanofibers exhibit strong blue and hyper sensitive red emission at 317 nm excitation wavelength. The combination of the CIE of blue and red emission clearly demonstrates white color generation. Additionally, the excitation at 466 nm emits broad spectrum in the range of 580 to 750 nm (yellowish to red region) which is highly suitable for proposed white LED application after integration of luminescent MgO with blue LED. Thus, luminescent MgO synthesized by simple wet chemical method provides a new analog form of rare earth free luminescent material for solid state lighting application.
Acknowledgements We thank the Director, NPL New Delhi, India for providing the necessary experimental facilities. Dr. N. Vijayen, Dr. S. N. Sharma, Mr. K. N. Sood, Mr. J. S. Tawale, Dr. Ritu Srivastava are gratefully acknowledged for providing the necessary instrumentation facilities for XRD, FTIR, SEM and UV-Vis. The Projects NanoSHE (BSC: 0112) and DST (GAP: 113932) are gratefully acknowledged.
References 1 J. Chen and J. X. Zhao, Sensors, 2012, 12, 2414. 2 B. K. Gupta, D. Haranath, S. Saini, V. N. Singh and V. Shanker,
Nanotechnology, 2010, 21, 055607. 3 P. Thanikaivelan, T. N. Narayanan, L. Song, W. Gao, T.
Hayashi, A. L. Mohana Reddy, A. Saha, V.Shanker, M. Endo, A. A. Martí and P. M. Ajayan, Nano Letters, 2011, 11, 5227.
4 P. Kumar and B. K. Gupta, RSC Adv., 2015, 5, 4729. 5 B. K. Gupta, V. Rathee, T. N. Narayanan, P. Thanikaivelan, A.
Saha, Govind, S.P. Singh, V. Shanker, A. A. Marti and P. M. Ajayan, Small, 2011, 7, 1767-1773,
6 M. Nirmal and L. Brus, Acc. Chem. Res., 1999, 32, 407. 7 B. A. Kairdolf, A. M. Smith , T. H. Stokes , M. D. Wang , A. N.
Young , S. Nie, Annu Rev Anal Chem., 2013, 6, 143-62. 8 J. Dwivedi, P. Kumar, A. Kumar, Sudama, V. N. Singh, Bhanu
P. Singh, S. K. Dhawan, V. Shanker and B. K. Gupta, RSC Adv., 2014, 4, 54936.
9 J. Dwivedi , P. Kumar, G. Kedawat, B. K. Gupta, New J. Chemistry, 2015, 39, 5161.
10 A. Sternig, S. Stankic, M. Müller, J. Bernardi, E. Knozinger, and O. Diwald, Adv. Mater., 2008, 20, 4840.
11 J. Gangwar, B. K. Gupta, S. K. Tripathi and A. K. Srivastava, Nanoscale, 2015, 7, 13313.
12 K. G. Rao, CH. Ashok, K. V. Rao, CH. S. Chakra, IJSR, 2013, 11, 43-46.
13 F. Taleshi and A. A. Hosseini, J. nanostructure chem., 2012, 3, 4.
14 K. Mageshwari, and R. Sathyamoorthy, Trans Indian Inst Met, 2012, 65, 49.
15 S. SURESH, J. ovon. Res., 2014, 10, 205. 16 F. Elizabeth, F. Patricio, and M. Fanor, Catal. Today, 2008,
133, DOI: 10.1016/j.cattod.2007.12.087. 17 A.-T. Vu, S. Jiang, Y.-H. Kim and C.-H. Lee, Ind. Eng. Chem.
Res., 2014, 53, 13228. 18 T. Uchino, D. Okutsu, R. Katayama, and S. Sawai, Phys. Rev.
B, 2009, 79, 165107. 19 S. W. Bian, J. Baltrusaitis, P. Galhotra, V. H. Grassian, J.
Mater. Chem., 2010, 20, 8705. 20 A. J. Haes, S. L. Zou, G. C. Schatz and R. P. Van Duyne, J. Phys.
Chem. B, 2004, 108, 109. 21 V. Gangaiah, A. Siddaramanna and G. T. Chandrappa, Mater.
Res. Express, 2014, 1, 045004. 22 T. Urade, T. Iemori, M. Osawa, N. Nakayama, and I. Morita,
IEEE Trans. Electron Devices, 1976, 23, 313. 23 M. Sterrer, T. Berger, O. Diwald and E. K. zinger, J. Am. Chem.
Soc., 2003, 125, 195. 24 X. Y. Yu, T. Luo, Y. Jia, Y. X. Zhang, J. H. Liu, X. J. Huang, J.
Phys. Chem. C , 2011, 115, 22242. 25 V. M. Boddu, S. Dabir, Y. Viswanath and S. W. Maloney, J.
Am. Cer. Soc., 2008, 91, 1718. 26 Q. Yang, J. Sha ,L. Wang, J. Wang ,and D. Yang, Mat. Sci. and
Engg., 2006, 26, 1097. 27 J. C. Yu, A. Xu, L. Zhang, R. Song and L. Wu, J. Physic. Chem. B,
2004, 108, 64. 28 J. R. Booth, W. D. Kingery and H. K. Bowen, J. Cryst. Growth.,
1975, 29, 257. 29 G. Wang, L. Zhang, H. Dai, J. Deng, C. Liu, H. He and C. T. Au,
Inorg. Chem., 2008, 47, 4015. 30 V. Marian, C. Bogdan, R. J. Hu, , C. C. Ciuculescu, F. Petru and
V. I. Parvulescu, Green Chem., 2008, 10, 373. 31 V. Banele, T. Phumlani, M. Poslet, G. Shumbula, N. Jane,
Lucky, S. Mashudu, and M. R. Motlhaletsi, J. Bio. Nano. Tech., 2013, 4, 365.
32 V. Skvortsova, L. Trinkler, Advances in sensors, signals and materials, ISBN: 978-960-474-248-6.
33 B. Choudhury and A. Choudhury, Mater. Res. Express, 2014, 1, 025026.
34 J. Gangwar, B. K.Gupta, P. Kumar, S. K. Tripathi and A. K. Srivastava, Dalton Trans., 2014, 43, 17034.
35 S. Stankic, J. Bernardi, O. Diwald, and E. K. Zinger, J. Phys. Chem. B, 2006, 110, 13866.
36 A. remon, J. A. gagacia and J. Piquras, J. Phys. Chem. Solids, 1986, 47, 577.
37 R. Verma, K. K. Naik, J. Gangwar, and A. K. Srivastava, Mats. Chem. and Physic., 2014, 148, 1064.
38 P. B. Devaraja, D. N. Avadhani, H. Nagabhushana, S. C. Prashantha, S. C. Sharma, B. M. Nagabhushana, H. P. Nagaswarupa, and B. D. Prasad, J. Radiat. Res. Appl. Sci., 2015, 8, 362.
39 P. V. Pikhitsa, C. Kim, S. Chae, S. Shin, S. Jung, M. Kitaura, S. Kimura, K. Fukui and M. Choi, Appl. Physic. Lett., 2015, 106, 183106.
40 C. M. McDonagh, B. Henderson, G. F. Imbuschj and P Dawson, J. Phys. C: Solid St. Phys., 1980, 13, 3309.
41 R. Verma, B. Mantri, Ramphal and A. K. Srivastava, Adv. Mater. Lett., 2015, 6(4), 324.
42 K. K. Dey, A. Kumar, R. Shanker, A. Dhawan, M. Wan, R. R. Yadav and A. K. Srivastava, RSC Adv., 2012, 2, 1387.
43 L. Jiang, T. Wende, R. Bergmann, G. Meijer, and K. R. Asmis, J. Am. Chem. Soc., 2010, 132, 7398.
44 T. Berger, M. Sterrer, O. Diwald, and E. K. Zinger, J. Phys. Chem. B, 2004, 108, 7280.
45 K. T. Selvi, K. A. mangai, M. Priya, M. Rathnakumari, P. S. Kumar, ICSEMR, International Conference 2014, IEEE, 32331.
Page 8 of 10RSC Advances
RS
CA
dvan
ces
Acc
epte
dM
anus
crip
t
Publ
ishe
d on
15
Dec
embe
r 20
15. D
ownl
oade
d by
Gaz
i Uni
vers
itesi
on
05/0
1/20
16 1
1:38
:05.
View Article OnlineDOI: 10.1039/C5RA21150F

Nanoscale ARTICLE
This journal is © The Royal Society of Chemistry 20xx J. Name. , 2013, 00, 1-3 | 9
Please do not adjust margins
Please do not adjust margins
46 K. K. Dey, D. Bhatnagar, A. K. Srivastava, M. Wan, S. Singh, R. R. Yadav, B. C. Yadav and M. Deepa, Nanoscale, 2015, 7, 6159.
47 Y. Uenaka, T. Uchino, phys. Rev. B, 2011, 83, 195108. 48 F. Stavale, L. Pascua, N. Nilius and H. J. Freund, J. Phys. Chem.
C, 2014, 118, 13693. 49 T. Hussain, L. Zhong, M. Danesh, H. Ye, Z. Liang, D. Xioa, C.-
W. Qiu, C. Lou, L. Chi and L. Jiang, Nanoscale, 2015, 7, 10350. 50 B. Chen, H. Zhong, M. Wang, R. Liu and B. Zou, Nanoscale,
2013, 5, 3514. 51 W.-S. Song, J.-H. Kim, J.-H. Lee, H.-S. Lee, Y. R. Do and H.
Yang, J. Mater. Chem., 2012, 22, 21901. 52 P. Schlotter, R. Schmidt and J. Schneider, Appl. Phys. A, 1997,
64, 417. 53 H. S. Jang, Y. H. Won and D. Y. Jeon, Appl. Phys. B, 2009, 95,
715. 54 Y.-C. Pu and Y.-J. Hsu, Nanoscale, 2014, 6, 3881. 55 L. Guo, Y. Wang, Y. Wang, J. Zhang, P. Dong and W. Zeng,
Nanoscale, 2013, 5, 2491. 56 H. S. Jang, W. B. Im, D. C. Lee, D. Y. Jeon and S. S. Kim, J.
Lumin.,2007, 126, 371. 57 X. Wang, X. Yan, W. Li and K. Sun, Adv. Mater., 2012, 24,
2742. 58 H. S. Jang, H. Yang, S. W. Kim, J. Y. Han, S.-G. Lee and D. Y.
Jeon, Adv. Mater., 2008, 20, 2696. 59 A. Aboulaich, M. Michalska, R. Schneider, A. Potdevin,
J.Deschamps, R. Deloncle, G. Chadeyron and R. Mahiou, ACS Appl. Mater. Interfaces, 2013, 6, 252.
Page 9 of 10 RSC Advances
RS
CA
dvan
ces
Acc
epte
dM
anus
crip
t
Publ
ishe
d on
15
Dec
embe
r 20
15. D
ownl
oade
d by
Gaz
i Uni
vers
itesi
on
05/0
1/20
16 1
1:38
:05.
View Article OnlineDOI: 10.1039/C5RA21150F
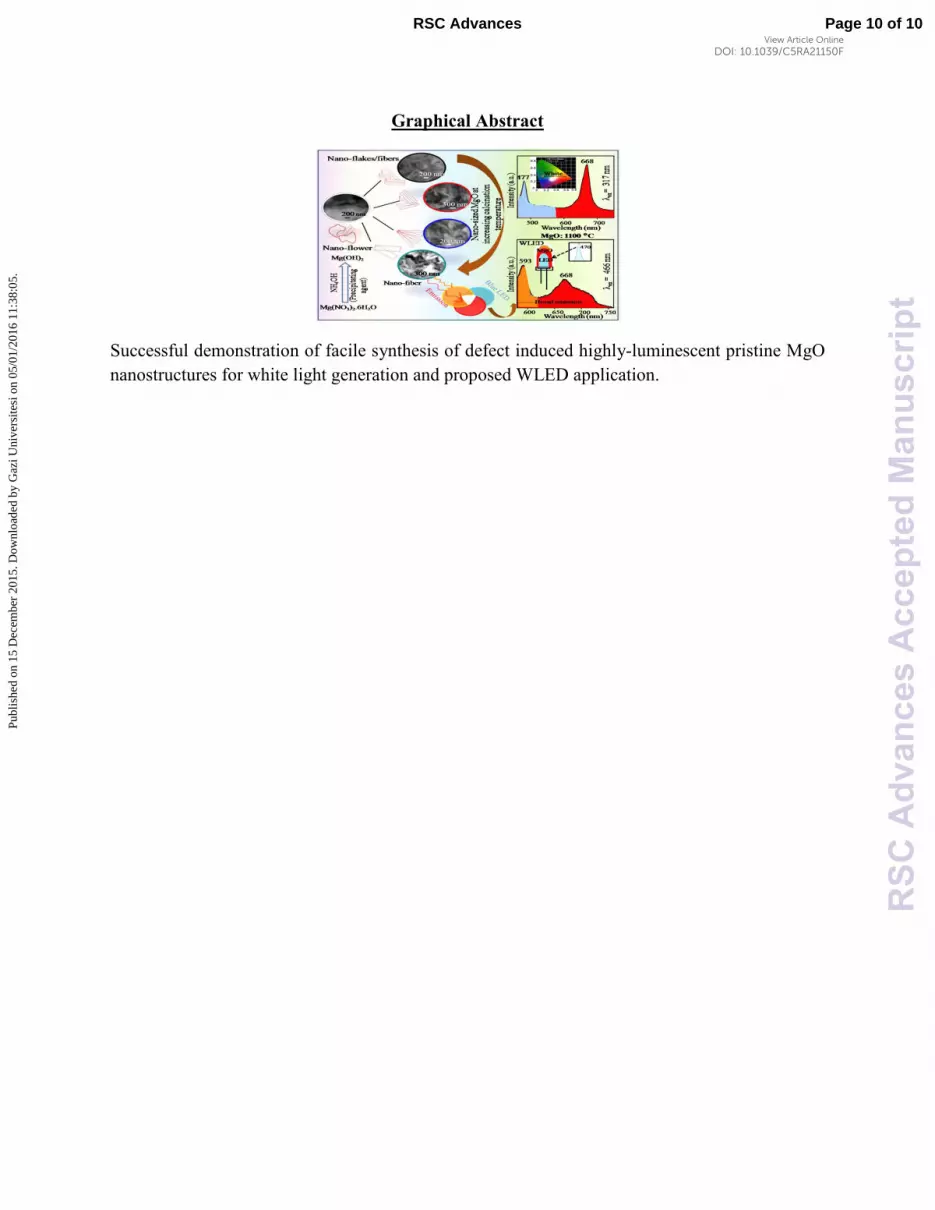
Graphical Abstract
Successful demonstration of facile synthesis of defect induced highly-luminescent pristine MgO
nanostructures for white light generation and proposed WLED application.
Page 10 of 10RSC Advances
RS
CA
dvan
ces
Acc
epte
dM
anus
crip
t
Publ
ishe
d on
15
Dec
embe
r 20
15. D
ownl
oade
d by
Gaz
i Uni
vers
itesi
on
05/0
1/20
16 1
1:38
:05.
View Article OnlineDOI: 10.1039/C5RA21150F
![A facile synthetic route to convert Tb( iii ) complexes of novel tetra-1,3-diketone calix[4]resorcinarene into hydrophilic luminescent colloids](https://img.pdfslide.net/doc/110x75/6355f0235108319c87030fa3/a-facile-synthetic-route-to-convert-tb-iii-complexes-of-novel-tetra-13-diketone.jpg)


