Embed Size (px)
Citation preview
Strathmore University
SU+ @ Strathmore University Library
Electronic Theses and Dissertations
2018
Factors influencing customer satisfaction with
services offered by Safaricom mobile cellular
network Ketry Kubasu Strathmore Business School (SBS) Strathmore University
Follow this and additional works at https://su-plus.strathmore.edu/handle/11071/5966
Recommended Citation
Kubasu, K. (2018). Factors influencing customer satisfaction with services offered by Safaricom
mobile cellular network (Thesis). Strathmore University. Retrieved from https://su-
plus.strathmore.edu/handle/11071/6127
This Thesis - Open Access is brought to you for free and open access by DSpace @Strathmore University. It has been accepted for
inclusion in Electronic Theses and Dissertations by an authorized administrator of DSpace @Strathmore University. For more
information, please contact [email protected]
Factors Influencing Customer Satisfaction with Services Offered by Safaricom Mobile
Cellular Network
KETRY KUBASU
MBA/76840
Submitted in partial fulfilment of the requirements for the award of a Master’s in Business
Administration (MBA) Degree
Strathmore Business School
MAY, 2018
This dissertation is available for Library use on the understanding that it is copyright material and that no
quotation from the thesis may be published without proper acknowledgement
i
DECLARATION
I declare that this work has not been previously submitted and approved for the award of a
degree by this or any other university. To the best of my knowledge and belief, the
dissertation contains no material previously published or written by another person except
where due reference is made in the thesis itself.
© No part of this thesis may be reproduced without permission of the author and Strathmore
University
Ketry Kubasu
May 2018
Approval
This dissertation of Ketry Kubasu was reviewed and approved by:
Dr. Tabitha Waithaka (Supervisor)
Strathmore University
Dr George Njenga
Dean, Strathmore Business School
Prof. Ruth Kiraka
Dean, School of Graduate Studies
Strathmore University
ii
DEDICATION
To my loving parents, Kennedy Kubasu and Dr. Stella Kubasu and my siblings, Abigael,
James, Emmy and Lissa, thank you all for believing in me, for your prayers and continuous
support during this journey.
iii
ACKNOWLEDGEMENT
I thank God for guiding me through this journey while undertaking my MBA program.
To Strathmore Business School, thank you for this platform you have created in Kenya that
we can be part of a program that is recognised widely.
My sincere gratitude to my supervisor Dr. Tabitha Waithaka. This thesis would not have been
achieved without your continual guidance, support and encouragement. You have guided me
with a lot of dedication.
Special thanks to my classmates and friends for their continued encouragement.
iv
ABSTRACT
Creating satisfied and loyal customers is a key concern of managers today and it will remain
in the future. It is well accepted that customer satisfaction is both a goal and a marketing tool
for customer-centred companies. Customers’ satisfaction which leads to purchase is a
significant factor that leads business to success. The main objective of this research was to
analyse the factors influencing customer satisfaction in the Kenyan mobile cellular industry.
The study was based on American Customer Satisfaction index and the Theory of Reasoned
Action. The study employed a descriptive survey research design in collecting data from
respondents. The target population was Safaricom customers who visit Safaricom customer
care centres/outlets in Nairobi County. There are about 14 Safaricom outlets in Nairobi. The
sample included 399 customers randomly selected out of which 331 participated in the study,
an 82% response rate. A semi structured questionnaire was used for data collection. The study
also used descriptive statistics and correlation analysis to show the relationship between the
dependent and the independent variables. The study established that promotional value,
functional value, innovative value and emotional value have a significant relationship with
customer satisfaction. Functional value and innovative value had the greatest influence on
customer satisfaction. Emotional value and promotional value also had a moderate influence
on customer satisfaction. The combination of all the factors and implementing them
successfully brings about a high level of customer satisfaction with mobile cellular firms
product and services. The limitation of the study was that it was focused on Safaricom
customers in Nairobi County. The study targeted customers who visit Safaricom customer care
centres or outlets in Nairobi County. Future studies could therefore focus on a wider coverage
in order to assess the level of customer satisfaction with Safaricom services and products. More
so, a study on customer satisfaction focusing on other factors could also be done. A further
study aiming at validating the conceptual model could be carried out in other services sectors
in the Kenyan economy such as banking and insurance, hotel and restaurant, and consulting
services.
v
TABLE OF CONTENTS
DECLARATION ........................................................................................................................ i
DEDICATION ........................................................................................................................... ii
ACKNOWLEDGEMENT ....................................................................................................... iii
ABSTRACT .............................................................................................................................. iv
LIST OF TABLES ................................................................................................................. viii
LIST OF FIGURES .................................................................................................................. ix
ACRONYMS AND ABBREVIATIONS .................................................................................. x
CHAPTER ONE: INTRODUCTION ........................................................................................ 1
1.1 Background of the Study .................................................................................................. 1
1.1.1 Factors Affecting Customer Satisfaction ................................................................... 3
1.1.2 Kenyan Mobile Cellular Network Industry ............................................................... 4
1.2 Problem Statement ........................................................................................................... 5
1.3 Research Objectives ......................................................................................................... 7
1.4 Research Questions .......................................................................................................... 7
1.5 Significance of the Study ................................................................................................. 7
1.6 Scope of the Study............................................................................................................ 8
CHAPTER TWO: LITERATURE REVIEW ............................................................................ 9
2.1 Introduction ...................................................................................................................... 9
2.2 Theoretical Foundation .................................................................................................... 9
2.2.1 American Customer Satisfaction Index (ACSI) ........................................................ 9
2.2.2 The Theory of Reasoned Action .............................................................................. 10
2.3 Empirical Review ........................................................................................................... 12
2.3.1 Customer Satisfaction .............................................................................................. 12
2.3.2 Factors Influencing Customer Satisfaction .............................................................. 13
2.4 Research Gap.................................................................................................................. 17
2.5 Conceptual Framework .................................................................................................. 19
vi
2.6 Operationalisation of Variables ...................................................................................... 21
CHAPTER THREE: RESEARCH METHODOLOGY .......................................................... 22
3.1 Introduction .................................................................................................................... 22
3.2 Research Design ............................................................................................................. 22
3.3 Population of the Study .................................................................................................. 22
3.4 Sampling Design ............................................................................................................ 23
3.5 Data Collection Method ................................................................................................. 24
3.6 Quality of the Research .................................................................................................. 24
3.6.1 Reliability ................................................................................................................ 24
3.6.3 Validity .................................................................................................................... 26
3.7 Data Analysis ................................................................................................................. 27
3.7.1 Analytical Model ..................................................................................................... 27
3.8 Ethical Considerations.................................................................................................... 28
CHAPTER FOUR: DATA ANALYSIS AND INTERPRETATION OF FINDINGS ........... 29
4.1 Introduction .................................................................................................................... 29
4.2 Response Rate ................................................................................................................ 29
4.3 Demographic Information .............................................................................................. 29
4.4 Factors Influencing Customer Satisfaction with Services.............................................. 30
4.4.1 To examine how functional value influencing customer satisfaction with Safaricom
Mobile Network ................................................................................................................ 30
4.4.2 To examine how promotional value influencing customer satisfaction with
Safaricom Mobile Network .............................................................................................. 31
4.4.3 To examine how innovative value influencing customer satisfaction with Safaricom
Mobile Network ................................................................................................................ 32
4.4.4 To examine how emotional value influencing customer satisfaction with Safaricom
Mobile Network ................................................................................................................ 33
4.4.5 To establish the extent of customer satisfaction with services offered by Safaricom
Mobile Network ................................................................................................................ 34
vii
4.4.6 Overall Customer Satisfaction ................................................................................. 35
4.5 Correlation Analysis ....................................................................................................... 36
4.6 Model Summary ............................................................................................................. 37
4.7 Distribution of Coefficients ............................................................................................ 38
CHAPTER FIVE: DISCUSSION, CONCLUSIONS AND RECOMMENDATIONS .......... 40
5.1 Introduction .................................................................................................................... 40
5.2 Discussion of Findings ................................................................................................... 40
5.2.1 Factors influencing customer satisfaction with Safaricom Mobile Network .......... 40
5.2.2 Extent of customer satisfaction with services offered by Safaricom Mobile
Network ............................................................................................................................ 42
5.3 Conclusion ...................................................................................................................... 43
5.4 Recommendations .......................................................................................................... 45
5.5 Limitations of Study ....................................................................................................... 45
5.6 Suggestion for Further Studies ....................................................................................... 46
REFERENCES ........................................................................................................................ 47
Appendices ............................................................................................................................... 50
Appendix I: Letter of Introduction ....................................................................................... 50
Appendix II: Questionnaire .................................................................................................. 51
viii
LIST OF TABLES
Table 1: Operational Variables ................................................................................................ 21
Table 2: Reliability Tests ......................................................................................................... 25
Table 3: Test for Multicollinearity ........................................................................................... 26
Table 4: Response Rate ............................................................................................................ 29
Table 5: Respondents Academic Qualifications ...................................................................... 29
Table 6: Length of Use of Safaricom Services Per Day .......................................................... 30
Table 7: Responses on influence of Functional Value on Customer Satisfaction ................... 31
Table 8: Responses on influence of Promotional Value on Customer Satisfaction ................ 32
Table 9: Responses on influence of Innovative Value on Customer Satisfaction ................... 33
Table 10: Responses on influence of Emotional Value on Customer Satisfaction .................. 34
Table 11: Extent of Customer Satisfaction with Services ....................................................... 35
Table 12: Overall Customer Satisfaction ................................................................................. 36
Table 13: Correlations.............................................................................................................. 37
Table 14: Model Summary ...................................................................................................... 37
Table 15: Regression Results ................................................................................................... 38
ix
LIST OF FIGURES
Figure 1: Factors Influencing Customer Satisfaction .............................................................. 19
x
ACRONYMS AND ABBREVIATIONS
2G- Second Generation
3G- Third Generation
4G- Fourth Generation
ACSI- American Customer Satisfaction Index
CAK- Communication Authority of Kenya
SERVQUAL- Service Quality
SPSS- Statistical Package for Social Sciences
TORA- Theory of Reasoned Action
1
CHAPTER ONE: INTRODUCTION
1.1 Background of the Study
Telecommunication sector in Kenya has experienced tremendous growth in total
subscriptions (CAK, 2016). Although the industry is dominated by two players in the
market: namely, Safaricom and Airtel with a market share of 67% and 20% respectively
as at 2015, competition has intensified during the industry maturity stage with entry of
other players. The competition in this sector has become very intense and the
companies’ need for survival in these conditions that dominate this sector, forces them
to search for ways to attract and retain customers (Vranakis, Chatzoglou & Mpaloukas,
2012). The increase in the number of subscribers on the various operators in Kenya has
brought with it the challenges of customer satisfaction. Though the industry is relatively
new yet the growth is much faster in comparison to other industries due to aggressive
market oriented business strategy. The mobile telecommunication industry of Kenya is
going towards high market penetration rate.
A key motivation for the growing emphasis on customer satisfaction is that it can lead
to a stronger competitive position, resulting in higher market share and profit
(Leelakulthanit & Hongcharu, 2011). It can lower price elasticity, business cost, failure
cost, and costs for attracting new customers. Overall, creating satisfied and loyal
customers is a key concern of marketers and marketing managers today and it will
remain in the future. It is well accepted that customer satisfaction is both a goal and a
marketing tool for customer-centred companies (Kotler & Keller 2012). Customers’
satisfaction which leads to purchase is a significant factor that leads business to success.
Customer satisfaction is defined as the number of customers, or percentage of total
customers, whose reported experience with a firm, its products or its services (ratings)
exceeds specified satisfaction goals (Farris, Bendle, Pfeifer & Reibstein, 2010. It's not
a straight forward science however, as customer satisfaction will vary from person to
person, depending on a whole host of variables which may be both psychological and
physical. The usual measures of customer satisfaction involve a survey with a set of
statements using a Likert technique or scale (Mishra & Kiranmai, 2009; Farris et al.,
2010).
2
Customer satisfaction is the extent to which customers are happy with the products and
service provided by a business. It is assumed to be a significant determinant of repeated
sales, positive word-of-mouth, and customer loyalty. Satisfied customers return and
buy more, and tell other people about their experiences (Fornell, Johnson, Anderson
and Bryant, 1996).
Firms that practice customer satisfaction enhancement strategies usually gain
sustainable competitive advantage. Satisfaction has been widely studied as a predictor
of customer loyalty (such as Kim, Park & Jeong, 2004; Olsen, 2002; Rahman &
Peterson, 2004). Customer satisfaction is an important factor for the long-term
relationship between a firm and a customer (Anderson & Srinivasan, 2003). In order to
shed light on the success of the companies in the telecommunications industry, this
study investigated factors affecting customer satisfaction with mobile cellular
networks.
Today, telecommunication is an inseparable part of everyday life. Mobile phones are
playing a great role to communicate from one place to another place. The phone is not
only used for making calls, among many other functions, it is used for communicating
through text-messages, multi-media messages, and ensuring internet connectivity. The
opportunities that lie in the telecom market seem endless and the growing demand for
mobile telephone systems is creating a world-wide market. Actors in this industry are
seeking the most profitable markets throughout the world (Suchy 2013). The
competition in this sector has become very intense and the companies’ need for
survival, in these very difficult conditions that dominate in this sector, forces them to
search for ways to attract and retain customers (Vranakis et al., 2012).
Globally, the telecommunication industry has been growing immensely in the past three
decades. Within this period the number of people who have been gaining access to
telecom services has also been on the rise. Many people have been able to access
cellular phones, broadband and fixed telephone lines. As a result, many nations are
investing in the industry as a way of spurring economic growth (Bodil, Lars &
Caroline, 2006).
Various studies have been done on the subject of factors influencing customer
satisfaction. Leelakulthanit & Hongcharu (2011) in their study “factors that impact
3
customer satisfaction: evidence from the Thailand mobile cellular network industry”
identified quality, promotional value, innovative value, social value, quality of shop
service, quality of call centre service, emotional value and corporate image as some of
the factors that impact customer satisfaction. Khan and Afsheen (2012) did a study on
determinants of customer satisfaction in Telecom industry in Pakistan. Using a
structured questionnaire to collect data for analysis, the results indicated that price
fairness, customer services and coverage are major factors which can highly affect the
customer satisfaction. The results proved that there is positive and significant
relationship between customer satisfaction and customer service, price fairness, sales
promotion, coverage, signal strength and promotion.
Omwenga (2016) carried out a study on analysis of factors affecting customer
satisfaction at Safaricom outlets in Nairobi Central Business District. The study
established that the firm’s product features, capacity to differentiate its products,
perception on the fairness of the firm’s product pricing and also customer service
practices affect the level of customer satisfaction. Skordoulis and Pekka-Economou
(2015) analysed customers’ satisfaction under the aspect of SERVQUAL. According
to service quality model (SERVQUAL), the level of customer satisfaction occurs in the
case of services meeting or exceeding the customer expectations (Berman & Evans,
2010). The current study focused on the following factors that influence customer
satisfaction: functional value, promotional value, innovative value, and emotional
value.
1.1.1 Factors Affecting Customer Satisfaction
The study focused on the following factors that influence customer satisfaction:
functional value, promotional value, innovative value, and emotional value.
Functional Value is the solution an offer provides to the customer. In the
telecommunication industry it relates to proper performance of the cellular network,
meaning that it should have a wide coverage, good voice quality, infrequently dropped
calls and instantaneous connection.
Promotional Value is an incentive for consumers to buy products or services. It provides
a saving for consumers and thereby creates economic value. It can be a special package
discount, coupons and a bonus gift among others.
4
Innovative Value is the extent of new product introduction in the industry. This includes
new technology, services and creative ideas that deliver better solutions to customer
problems. A company can differentiate itself from competitors with innovation.
Emotional Value is derived from feelings and sentimental state that a service provider
stimulates in customers and potential customers. It is a strong predictor of customers’
purchase intentions.
Several studies have been conducted on factors affecting customer satisfaction.
Leelakulthanit & Hongcharu (2011) carried out a study on factors that impact customer
satisfaction in Thailand’s mobile network focusing on social value, customer service,
functional value, innovative value, emotional value, corporate image and promotion
value. The current study chose to focus on four of these factors namely functional value,
promotional value, emotional value and innovative value and sought to determine if the
study will establish the same results given the geographical and cultural differences.
1.1.2 Kenyan Mobile Cellular Network Industry
The telecommunication industry in Kenya, just like the rest of the world, is going
through profound changes. In the past decade, technological advancement and
regulatory restructuring have transformed the industry. Markets that were formerly
distinct, discrete and vertical have coalesced across their old boundaries with a massive
investment of capital - much of it originating from private sector participants. The result
is new markets, new players, and new challenges. This has led to increased competition
requiring enhanced customer satisfaction.
Safaricom is the market leader in Kenya’s telecommunication sector followed by Airtel.
During the quarter three of 2016, the number of mobile subscriptions stood at 38.5
million down from 39.7 million subscriptions recorded in the previous period of 2015,
marking a decline of 3.0 per cent (CAK, 2016).
Market liberalisation efforts have also picked up ensuing the successful partial
privatisation of Telkom Kenya Ltd, trading as Orange (December 2007), divestment of
Government of Kenya’s 25% stake in Safaricom Ltd through a public listing (May
2008), Airtel entry into Kenya in 2000 and the launch of fourth mobile operator Econet
Wireless Kenya, trading as YU (November 2008). In this way, Vodafone, France
5
Telecom and Essar Communications through their investments in Safaricom Limited,
Telkom Kenya Limited and Econet Limited respectively, have become major players
in the Kenyan market (CAK, 2015).
After entry into Kenyan market, Airtel still remains a distant second to the market
leader, Safaricom, which has yet to achieve the market leadership objective. In view of
the above facts, this study sought to analyse the factors that affect customer satisfaction
with services offered by Safaricom Mobile Cellular Network.
1.2 Problem Statement
The mobile telecommunication services in Kenya show signs of an industry that is in a
transition. With the rapid development of information and communication technologies
(ICT) and high demand from enlightened customers, the service provision has shifted
from voice-centred communication to a combination of high-speed data
communication and multimedia (CCK, 2016; Omwenga, 2016). These changes in the
industry have intensified competition between companies. Consequently, the Kenyan
mobile service providers are coming to the full realization of the importance of a
customer-oriented business strategy as a condition for sustaining their competitive edge
and maintaining a stable profit level, and, indeed, for their very survival.
Safaricom, unlike the other mobile telephony firms in the country and regionally has
developed effective customer service strategies that can be exemplified by the number
of customer awards that it has received in the both nationally and international arena
for customer service. Despite receipt of the same, the level of customer satisfaction
cannot be termed as excellent based on the increased number of customer complaints
ranging from poor quality reception, unaccounted data bundles usage, congested
network and high tariff rates (Safaricom Annual Report, 2014).
Leelakulthanit and Hongcharu (2011) carried out a study on factors that impact
customer satisfaction in Thailand’s mobile network, the study concluded that factors
like promotional value, quality of customer service and corporate image were the most
important factors that affected customer satisfaction, this study focused on Thai
respondents, and thus is limited to that geographical setting with its culture. This study
sought to analyse the factors affecting customer satisfaction on mobile cellular network
6
brought in the Kenyan context. A study on analysis of factors affecting customer
satisfaction at Safaricom outlets was conducted by Omwenga (2016). This study
however restricted itself to the Nairobi Central Business District and the factors focused
on in this study included product features, product differentiation, perceptions of
fairness in pricing and customer service.
A study by Mohamad (2015) to analyse customer satisfaction using the 7Ps on retail
bank customers in Nigeria found that product, process and physical evidence were
significantly related to customer satisfaction while price, promotion, place and people
are not significantly related.
In addition, a study done by Rahman, Kalam, Rahman and Abdullah (2012) on the
influence of service quality and price on customer satisfaction in which they sought to
identify some key drivers of customer satisfaction on restaurant services, they found
that customers have negative impression about product and service quality, price
fairness, staff’s service and environment of the restaurant, image and loyalty. They
concluded that emphasis should be done on critical issues to attract new customers and
retain existing customers. There is an inconsistency between this study and others have
found positive correlation between factors affecting customer satisfaction and customer
satisfaction.
Whereas the cited studies focused on aspects of customer satisfaction, there was a
geographical limitation of the study carried out in Thailand and the different factors and
the scope of the study carried out in the Central Business District. More so the study by
Mohamad, (2015) showed that some factors were not significant to customer
satisfaction in that setting. The present study sought to determine how the following
factors; functional value, promotional value, innovative value, and emotional value
affect customer satisfaction.
7
1.3 Research Objectives
The main objective of the study was to establish the extent of customer satisfaction with
services offered by Safaricom Mobile Cellular Network.
The specific objectives were:
i. To examine the extent to which functional value influences customer
satisfaction with Safaricom Mobile Network.
ii. To determine the extent to which promotional value influences customer
satisfaction with Safaricom Mobile Network.
iii. To establish the extent to which innovative value influences customer
satisfaction with Safaricom Mobile Network.
iv. To examine the extent to which emotional value influences customer
satisfaction with Safaricom Mobile Network.
1.4 Research Questions
i. How does functional value influence customer satisfaction with Safaricom
Mobile Network?
ii. How does promotional value influence customer satisfaction with Safaricom
Mobile Network?
iii. How does innovative value influence customer satisfaction with Safaricom
Mobile Network?
iv. How does emotional value influence customer satisfaction with Safaricom
Mobile Network?
1.5 Significance of the Study
The findings of this study will be valuable to researchers and academicians in providing
knowledge on the factors that influence customer satisfaction. This research will also
be beneficial to telecommunication companies in Kenya as the information into the
factors affecting customer satisfaction in Safaricom will be useful as a reference point
to the stakeholders in the industry as it will inform their choice competitive strategies
to be adopted. By identifying the factors that influence the Safaricom customer’s level
of satisfaction, the strength of each factor will enable the organization to direct their
energies towards those the factor has more impact on customer satisfaction.
8
The findings will also be of great importance in decision making for industry players
and stakeholders in the telecommunications industry, for example the Communication
Authority of Kenya (CAK). By being able to identify the factors that satisfy the
customers, then at the policy level these regulators might consider developing
appropriate regulations geared towards improving the level of customer satisfaction
while protecting their interest by extending some tax rebates to the firms upon incurring
cost on such ventures. Lastly, the research will be essential for future researchers who
will employ the findings of this study as the foundation for carrying out more studies
in this area.
1.6 Scope of the Study
The scope of the study was focused on Safaricom customers in Nairobi County. The
study targeted customers who visit Safaricom customer care centres/outlets in Nairobi
County. There are about 14 Safaricom outlets in Nairobi namely Safaricom Shop I&M
building, Safaricom shop Moi Avenue, Safaricom shop Kimathi Street, Safaricom Shop
JKIA, Safaricom Shop Nakumatt Mega, Safaricom Shop Thika Road Mall (TRM),
Safaricom Shop-Sarit Center, Safaricom Shop Junction Mall, Safaricom Shop
Buruburu, Safaricom Shop Eastleigh, Safaricom Village Market, Safaricom Shop
Westgate, Safaricom Shop Safaricom House and Safaricom Shop Galleria Mall
(Safaricom, 2016).
9
CHAPTER TWO: LITERATURE REVIEW
2.1 Introduction
In this chapter, the researcher looked at the theoretical underpinnings of this study
followed by a section on customer satisfaction. The chapter also looks at the empirical
review, research gap and finally summary of literature. Thus, the chapter carries out
synthesis of past literature in relation to research objectives and discusses several key
empirical studies with other supporting researches on the subject under study.
2.2 Theoretical Foundation
This section explored the theoretical underpinning of the study focusing on two theories
namely American Customer Satisfaction Index (ACSI) and The Theory of Reasoned
Action.
2.2.1 American Customer Satisfaction Index (ACSI)
Several studies have identified the factors that influence customer satisfaction over the
years (Fornell et al., 1996; Yu et al 2005; Zeithaml et al., 2009). These factors are
mostly similar in what aspect of customer satisfaction they are measuring; some of them
include customer's expectation, perceived service quality, product quality, perceived
value, price, among others. This is applicable to mobile cellular network companies as
they endeavour to satisfy customers. Fornell et al. (1996) developed the American
Customer Satisfaction Index (ACSI) based on the Swedish Customer Barometer.
The ACSI is an economic indicator based on modelling of customer evaluations of the
quality of goods and services produced and purchased in the United States. Its main
purpose according to Te-King Chein et al. (2003) is to gain an insight into the
interaction between the customers and businesses, to enable better planning and
decision making. The ACSI is a cause-and-effect model showing drivers of satisfaction
on the left side (customer expectations, perceived quality, and perceived value),
satisfaction in the centre, and outcomes of satisfaction on the right side (customer
complaints and customer loyalty, including customer retention and price tolerance).
Perceived Quality is a customers' measure of the recent service interaction with the
company. They stated that quality could be measured in terms of how the product meets
10
customer's individual needs and error-free service delivery reliability. This is also said
to have a direct and positive impact on overall satisfaction. Perceived Value is a
measure of quality relative to price paid - value for money (Keller, Apéria and
Georgson, 2008; Anderson et al., 1994). They asserted that price has more impact on
satisfaction in a customer's first purchase experience but a lesser impact on satisfaction
for repeat purchases.
Customer Complaints are customers who have talked to the service provider about a
service that they were not happy within a specific time. They stated that satisfaction is
negatively correlated to customer complaints - the more satisfied the customers, the less
likely they are to complain. Customer Loyalty is customers' likelihood to purchase their
next service with the same organisation at a given price (price tolerance). Customer
loyalty is the critical component of the model because it equals profitability (Heskett et
al., 1997; Reichheld and Sasser, 1990).
This theory links factors influencing customer satisfaction functional value,
promotional value, innovative value and emotional value with services offered by
Safaricom because it shows a cause and effect model that measures customer
satisfaction facets of customer expectation, perceived quality and value with customer
complaints and customer loyalty.
2.2.2 The Theory of Reasoned Action
Consumer attitudes are formed as result of product attributes beliefs. The Theory of
Reasoned Action (TRA) has been consistently applied in understanding consumer
attitudes. This theory was postulated by (Fishbein and Ajzen, 1980) and the model
provides an expanded picture of how, when, and why attitudes predict behavior. The
Theory of Reasoned Action (TORA) model describes not only the general attitude of
consumers and how these attitudes are formed or changed but the theory also describes
how other potential customers and people they interact with influence their general
behaviour.
The theory places intention as the immediate antecedent of one’s behaviour, and this
means that the stronger a customer’s intention the more likely the occurrence of the
corresponding behaviour. The influence of intention is attitude and subjective norm that
an individual has (Cherry, 2006) while the attitude component is composed of beliefs,
11
the perceived likelihood of particular consequences of the behavior, weighted by an
evaluation of the consequences. The subjective norm component is conceptualized as
normative beliefs, the perceived pressure from salient referents, weighted by the
motivation to comply with the referents (Buchan, 2005).
This theory takes into consideration the principle of attitude specificity (that is the more
specific the attitude is to the behavior of interest, the more likely the attitude will be
related to the behavior) (Liu and Amitage, 2000). In general terms, marketers need to
be aware that a consumer’s action is an outcome of the consumer’s general attitude
towards a certain offering. If a consumer has heard of a good report about a service,
then they will seek to partake the same and establish for themselves the positive aspect
of the service or good. The features of the TRA model include the behavior, behavioural
intensions, attitude toward the act and the subjective norms like peer pressure.
The basic postulate of the model is that behaviour is a function of the person’s attitude
toward the act and the subjective norms that operate in the situation. The model further
specifies that act is determined by the consumer’s beliefs about the consequences of
engaging in the behavior and the consumers’ evaluation of these consequences.
Subjective norms are determined by the consumer’s normative beliefs (that is what the
consumer thinks someone wants him/her to do) and the consumer’s motivation to
comply.
This theory links factors influencing customer satisfaction functional value,
promotional value, innovative value and emotional value with services offered by
Safaricom. In relation to the study, since the theory provides an expanded picture of
how, when, and why attitudes predict behaviour, if customers of Safaricom mobile
cellular network form positive attitude towards its products or services, then uptake will
be high and vice versa. In this case attitude formed towards products predicts behaviour
i.e. uptake or no uptake. This in turn influences customer satisfaction of Safaricom
mobile cellular network’s products and services. Satisfied customers return and buy
more, and tell other people about their experiences. Customers form attitudes positive
or negative towards products or services offered by organizations.
12
2.3 Empirical Review
This section reviewed existing literature on customer satisfaction and factors
influencing customer satisfaction namely functional value, promotional value,
innovative value and emotional value.
2.3.1 Customer Satisfaction
Satisfaction is the consumer’s fulfilment response. It is a judgment that a product or
service feature, or the product or service itself, provided (or is providing) a pleasurable
level of consumption-related fulfilment, including levels of under- or over-fulfilment.
Here, pleasurable implies that fulfilment gives pleasure or reduces pain, as when a
problem in life is solved (Oliver (1997, p. 13). Customer satisfaction is seen as a result
which is obtained through customer’s comparison of pre-purchase expected
performance with that of the real post-purchase perception, and the cost paid (Beerli,
Martin and Quintana, 2004).
Jamal and Nasser define customer satisfaction as a feeling or attitude about the product
or service taken by the customer after use. They state that customer satisfaction is the
primary outcome of a marketer activity which acts as a linking pin between different
stages of consumer’s buying behavior. For example, if customers become satisfied by
some particular service, they most probably repeat their shop.
Furthermore, satisfied customers probably talk to others about their experiences and
consequently, they get engaged with word of mouth marketing (verbal-oral). On the
contrary, unsatisfied customers probably break their contact with the company and get
engaged with negative word of mouth marketing. Behaviours like repeat shopping and
word of mouth marketing have an influence on survival of a company, as well as
profitability (Jamal and Naser, 2002).
It is well accepted that customer satisfaction is both a goal and a marketing tool for
customer centred companies (Kotler and Keller 2012). In general satisfaction is a
person’s feelings of pleasure or disappointment that result from comparing a product’s
perceived performance or outcome to the expectation (Oliver, Richard 2006). If the
performance falls short of expectations, the customer is dissatisfied. If the performance
13
matches the expectations the customer is satisfied. If the performance exceeds
expectations, the customer is highly satisfied and delighted (Fournier, Mick 1999).
Researchers have shown that customer satisfaction is multidimensional (Leelakulthanit
and Hongcharu, 2011). Generally, delivering customer values is a key means for
marketers to satisfy customer needs. In relation to mobile cellular networks, customers
are concerned about the value that they derive from the service provider. This value is
what ensures their loyalty to the service provider.
2.3.2 Factors Influencing Customer Satisfaction
Previous researches have given significant importance to customer satisfaction.
Satisfaction can be defined as a features or characteristics that can full the either a need
or want of a consumer in better way than competitors. Although this satisfaction
explained by different researchers in different ways. If a company provides a product
according to the requirements of their consumers it will lead the satisfaction of those
consumers.
The higher or lower satisfaction of a consumer will depends upon the quality of brand
characteristics that offered by a company (Khan & Afsheen, 2012). The factors that
affect customer satisfaction that the current study focused on are functional,
promotional, innovative and emotional value.
2.3.2.1 Functional Value and Customer Satisfaction
Functional value relates to the proper performance of the cellular network, meaning
that it should have a wide coverage, good voice quality, infrequent dropped calls, and
instantaneous connection. It is equated to product's value proposition which is a
statement of the functional, emotional and self-expressive benefits delivered by the
brand that provides value to the target customer (Lim, Widdow, Richard & Park, 2006).
Logically, consumers expect any products or services they buy to perform correctly.
Unsurprisingly, network quality has garnered the attention of many researchers.
It is a vital factor for customer satisfaction of mobile networks (Lim et al., 2006;
Leelakulthanit and Hongcharu, 2011). The purpose of the functional value analysis is
twofold: to identify and develop a firm's value chain capabilities in order to open up
14
new market opportunities and to optimally calibrate a firm’s functional activities to
better fulfil the needs and objectives of its customers.
Signal quality and network coverage have always been essential criteria for selecting
communication service providers. During the previous years, where technology had not
advanced so much in this area, company networks were limited only to certain
locations. Today the signal quality has been improved and the company networks have
grown to a great extent. Surveys have shown that both signal quality and network
coverage affect positively consumer’s satisfaction and the image of the company (Khan
& Afsheen, 2012; Rahman, 2014).
2.3.2.2 Promotional Value and Customer Satisfaction
Promotional value is an incentive for consumers to buy products or services. It can be
a special package discount, coupons and a bonus gift among others. It provides savings
for consumers, and thereby creates economic value. In general, promotion value is a
comparison between the perceived economic benefits received by consumers and the
monetary cost of the service. One of the major elements of marketing mix is promotion.
Media plays major role to promote a product in various areas. Sometimes company
offer discount packages to increase the sale of any particular product. Promotion is
defined as to indicate the “right” product to the target market or other distribution
channels. It cannot be effective unless it catches the attention of people (Ayesha,
Hussain and Adnan, 2011).
Many researchers have found a significant role in consumers’ perceived monetary value
regarding satisfaction and future decisions (Chen, 2003; Leelakulthanit and Hongcharu,
2011). Lewis (2004) notices that promotional offers affect the observed service churn.
Some subscribers may leave after a promotional period ends, not because of increased
dissatisfaction with the service but simply because of the change in their price plan.
Price as a promotional value is used as an indicator of product quality, which results in
better expectations from the product and determines higher satisfaction.
The research shows that price perceptions directly influence satisfaction judgments as
well as indirectly through perceptions of price fairness (Herrmann et al. 2007). Price
reasonability and consumer satisfaction are significantly associated with each other.
15
The customers can switch to any other cellular service provider who offers fair prices
this reveals that the consumers can be held on to for a longer duration by offering them
the fair prices so the customer satisfaction is caused by the fairness of the price (Ali et
al. 2010).
Several factors affect customer satisfaction, price is one of them. Price is used as an
indicator of product quality, which results in better expectations from the product and
determines higher satisfaction. The research shows that price perceptions directly
influence satisfaction judgments as well as indirectly through perceptions of price
fairness (Herrmann et al. 2007). Price reasonability and consumer satisfaction are
significantly associated with each other. The customers can switch to any other cellular
service provider who offers fair prices this reveals that the consumers can be held on to
for a longer duration by offering them the fair prices so; the customer satisfaction is
caused by the fairness of the price (Ali et al., 2010).
Currently mobile service provider’s concern for providing value added service for
promoting customer satisfaction; includes SMS, MMS, voice call service, SMS alert,
and information service. This study was concerned with the assessment of customer
satisfaction on the basis of several quality factors like; service innovativeness, service
reliability, service competitiveness, service consistency, the operator’s network/signal
coverage, pricing, offering, fulfilment of customer demand, value added service, brand
value and operators contribution to society (Khan & Afsheen, 2012).
2.3.2.3 Innovative Value and Customer Satisfaction
Innovative value looks at the extent of new product introduction. The company often
introduces new products, and differentiates itself from competitors. Generally, new
technology, new services and creative ideas are supposed to surpass out dated services.
For instance, 3G and 4G enables people to send and receive pictures as well as provides
faster data transmission than 2G. Similarly, the new services and creative ideas are often
meant to deliver a better solution to consumer problems. In short, innovative value is
likely to create customer satisfaction (Leelakulthanit and Hongcharu, 2011).
The rapid changes in the technology are the challenge for the companies to satisfy the
customers and to get their loyalty through innovative products. The innovation used for
strategic orientation toward customer satisfaction, loyalty, and to gain market potential
that increases the market share of the company (Rahman, 2014). Innovativeness is
16
described as a process of converting the invention or idea into a product that customer
purchase and provides financial benefits to its providers.
This idea that has to convert into an innovation into a product or service must have the
quality to satisfy some specific needs of the customers and can be implemented at an
economic cost to be converted into an innovation. Service innovativeness, or the
propensity to introduce service innovations to satisfy customers and improve firm value
at acceptable risk, has become a critical organizational capability (Dotzel et al., 2013).
2.3.3.4 Emotional Value and Customer Satisfaction
Emotional value refers to utility derived from feelings or affective states that a service
provider engenders (Leelakulthanit & Hongcharu, 2011). This may include feeling
good, as well as enjoyment and happiness during the use of the mobile network.
Emotional value is expected to incorporate consumers’ affective responses to service
stimuli in a cognitive-oriented, means-end model.
In a retailing context, Sweeney and Souter (2001) found that emotional value is the
strongest predictor of consumers’ purchase intention. However, it was revealed that
customers place higher priority on utilitarian benefits than to hedonic benefits (Chitturi,
Raghunathan & Mahajan, 2007; Higgins, 2001). In general, research also supports the
positive influence of the perceived emotional value of satisfaction (Eroglu, Machleut
& Barr, 2005; Leelakulthanit & Hongcharu, 2011).
Service quality has been the subject of considerable interest by both practitioners and
researchers in recent years. According to the satisfaction model customer satisfaction
is influenced by service quality (Uddin, Akhter 2012; Henderson 2013). When
customers get expected service quality, it leads to higher satisfaction and quality is a
multi-dimensional phenomenon (Mosahab et al. 2010).
Thus, reaching the service quality without distinguishing the important aspects of
quality is impossible. In service quality discussions, there are three dimensions of
output technical quality, service performance quality, and an organization’s mental
picture (Khan & Afsheen, 2012). Parasuraman et al. (1988) identified 10 detailed
determinants of service quality through focus group studies: Tangibles, reliability,
17
responsiveness, communication, access, competence, courtesy, credibility, security,
understanding/knowledge of the customer (Khan & Afsheen, 2012).
2.4 Research Gap
There are considerable number of studies that have been done that focus on customer
satisfaction. Locally, Omwenga (2016) carried out a study on analysis of factors
affecting customer satisfaction at Safaricom outlets in Nairobi Central Business
District. The study concluded that the firm’s product features, capacity to differentiate
its products, perception on the fairness of the firm’s product pricing and also customer
service practices affect the level of customer satisfaction. However, this study restricted
itself to the Nairobi Central Business District and it did not consider the functional
value, promotional value, innovative value and emotional value, which are the factors
that this current study sought to analyse.
Globally, Leelakulthanit and Hongcharu (2011) carried out on factors that impact
customer satisfaction in Thailand’s mobile cellular network industry which showed a
significant relationship between factors affecting customer satisfaction and customer
satisfaction. There is however a cultural and demographic difference which could
influence customer perception on what determines their satisfaction with products and
services offered.
Another study was done by Rahman, Kalam Rahman and Abdullah (2012) on the
influence of service quality and price on customer satisfaction in which they sought to
identify some key drivers of customer satisfaction on restaurant services, they found
that customers have negative impression about product and service quality, price
fairness, staff’s service and environment of the restaurant, image and loyalty. They
concluded that emphasis should be done on critical issues to attract new customers and
retain existing customers. There is an inconsistency between this study and others that
have found positive correlation between factors affecting customer satisfaction and
customer satisfaction.
Further, a study by Mohamad (2015) sought to analyse customer satisfaction using the
7Ps on retail bank customers in Nigeria found that product, process and physical
evidence were significantly related to customer satisfaction while price, promotion,
place an people are not significantly related. There is an inconsistency between this
18
study and others that have found positive correlation between factors affecting customer
satisfaction and customer satisfaction.
There are therefore various geographical context, cultural differences and negative
correlation between factors that affect customer satisfaction and customer satisfaction
which provide an opportunity to make further study on the influence of various factors
on customer satisfaction. This study focused on telecommunication industry within the
Kenyan context to determine how functional value, promotional value, innovative value
and emotional value affect customer satisfaction with Safaricom Mobile Network.
19
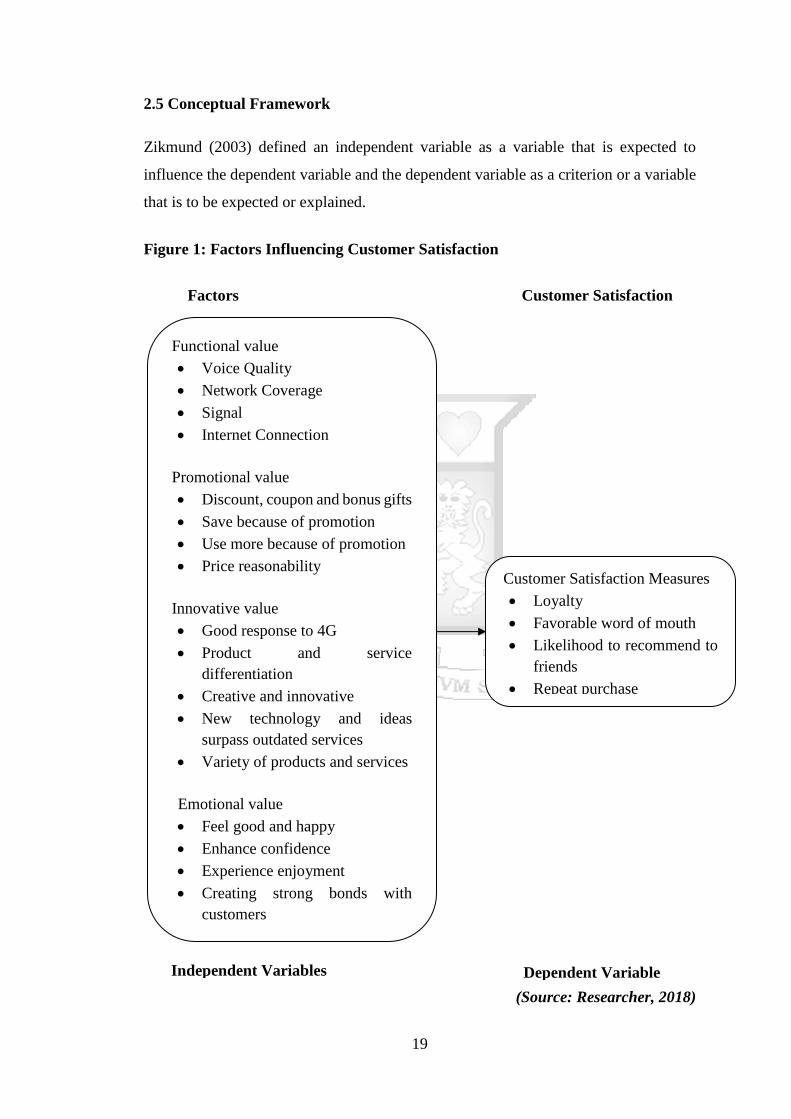
2.5 Conceptual Framework
Zikmund (2003) defined an independent variable as a variable that is expected to
influence the dependent variable and the dependent variable as a criterion or a variable
that is to be expected or explained.
(Source: Researcher, 2018)
Customer Satisfaction Measures
Loyalty
Favorable word of mouth
Likelihood to recommend to
friends
Repeat purchase
Dependent Variable
Functional value
Voice Quality
Network Coverage
Signal
Internet Connection
Promotional value
Discount, coupon and bonus gifts
Save because of promotion
Use more because of promotion
Price reasonability
Innovative value
Good response to 4G
Product and service
differentiation
Creative and innovative
New technology and ideas
surpass outdated services
Variety of products and services
Emotional value
Feel good and happy
Enhance confidence
Experience enjoyment
Creating strong bonds with
customers
Independent Variables
Factors Customer Satisfaction
Figure 1: Factors Influencing Customer Satisfaction
20
Figure 1 looks at the factors that influence customer satisfaction and the measures of
customer satisfaction. The conceptual framework carried out an analysis of factors
influencing customer satisfaction with services offered by Safaricom mobile cellular
network. The conceptual framework of this study consisted of one dependent variable
i.e. customer satisfaction measured by functional value, promotional value, innovative
value, and emotional value as the independent variables.
The conceptual model illustrates the role played by various factors in influencing
customer satisfaction as enumerated in the literature review. Based on this conceptual
framework, a number of measurable variables were derived that helped assess customer
satisfaction in Kenya’s cellular industry.
21
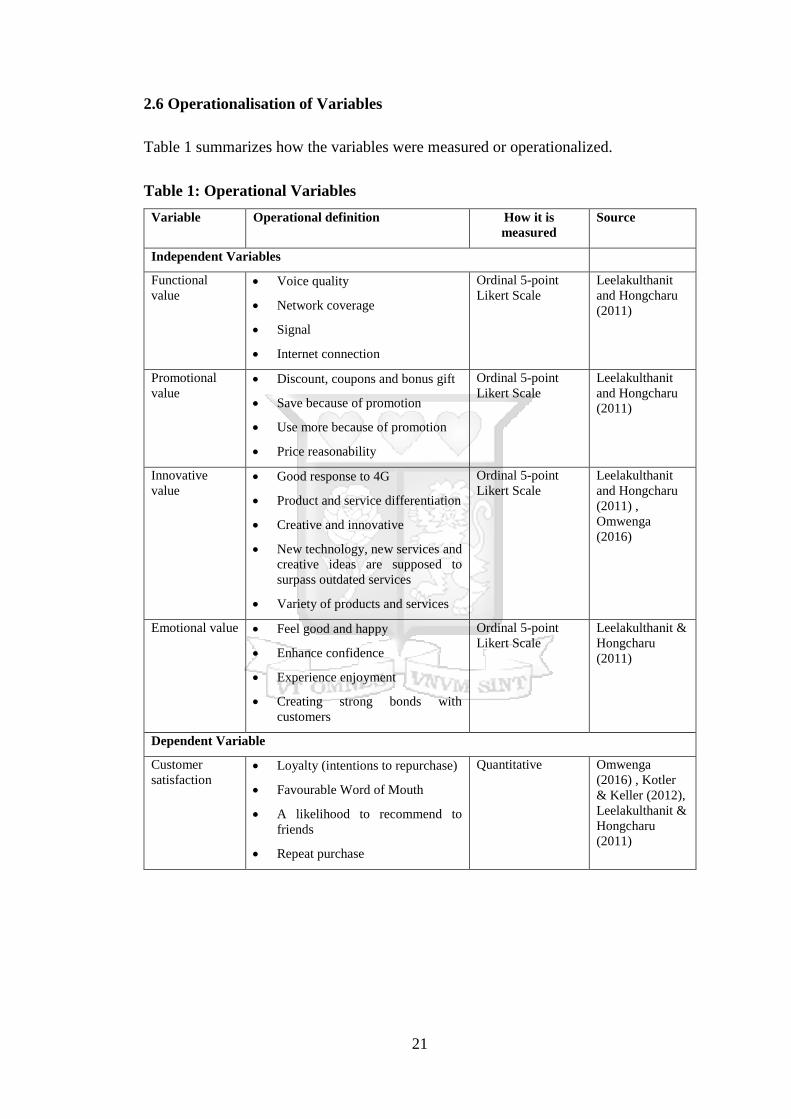
2.6 Operationalisation of Variables
Table 1 summarizes how the variables were measured or operationalized.
Table 1: Operational Variables
Variable Operational definition How it is
measured
Source
Independent Variables
Functional
value Voice quality
Network coverage
Signal
Internet connection
Ordinal 5-point
Likert Scale
Leelakulthanit
and Hongcharu
(2011)
Promotional
value Discount, coupons and bonus gift
Save because of promotion
Use more because of promotion
Price reasonability
Ordinal 5-point
Likert Scale
Leelakulthanit
and Hongcharu
(2011)
Innovative
value Good response to 4G
Product and service differentiation
Creative and innovative
New technology, new services and
creative ideas are supposed to
surpass outdated services
Variety of products and services
Ordinal 5-point
Likert Scale
Leelakulthanit
and Hongcharu
(2011) ,
Omwenga
(2016)
Emotional value Feel good and happy
Enhance confidence
Experience enjoyment
Creating strong bonds with
customers
Ordinal 5-point
Likert Scale
Leelakulthanit &
Hongcharu
(2011)
Dependent Variable
Customer
satisfaction Loyalty (intentions to repurchase)
Favourable Word of Mouth
A likelihood to recommend to
friends
Repeat purchase
Quantitative Omwenga
(2016) , Kotler
& Keller (2012),
Leelakulthanit &
Hongcharu
(2011)
22
CHAPTER THREE: RESEARCH METHODOLOGY
3.1 Introduction
This chapter described the methodology that was used in the research. It detailed the
research design used for the current research, the target population, sample size and
design, data collection methods, the validity and reliability of the data as well as how
the data was analysed and presented. Finally, the ethical considerations taken were
expounded.
3.2 Research Design
This study adopted a descriptive survey research design in collecting and analysing data
from the respondents. According to Cooper and Schindler (2007), descriptive survey
design discovers, and measures cause and effect relationships among variables. It
enables the researcher to collect in-depth information about the population being
studied. This design was preferred because it ensured a complete description of the
situation, making sure that there was minimum bias in the research process (Kothari,
2008). Descriptive research design determines and reports the way things are (Cooper
& Schindler, 2007).
In addition, this research design was deemed appropriate for this study because it
allowed the researcher to draw conclusions about the variables under the study without
the respondent being manipulated and thus allow the measurements to be fully
controlled.
3.3 Population of the Study
Target population in statistics is the specific population about which information is
desired. According to Ngechu (2008), a population is a well-defined or set of people,
services, elements, and events, group of things or households that are being
investigated. Mugenda and Mugenda, (2003), defined a population as the combination
of elements that have similar characteristics or behavior. This definition ensures that
population of interest is homogeneous.
Because of tremendous growth in the telecommunication sector, competition among
the players has intensified. Therefore, the companies’ need for survival, profitability
23
and growth forces them to search for ways to attract and retain customers. Customer
satisfaction is therefore core to business success. This study focused on Safaricom, the
dominant player in the market. Safaricom has developed effective customer services
strategies that can be exemplified by the numerous customer awards it has received
both locally and globally, however Safaricom still faces increasing customer complaint
(Safaricom Annual Report, 2014).
The population was Safaricom customers. According to the company’s official 2016
results and CAK (2016), Safaricom had 23,347,191 million subscribers with
approximately 30% of them (7,004,157) located in Nairobi and this group formed the
population of the study.
3.4 Sampling Design
A sampling frame consists of a list of items from which the sample is to be drawn
(Kothari, 2004). The sampling frame will be drawn from all the registered Safaricom
customers in Nairobi County. Using the formula by Cochran and Snedecor, then the
sample size n was determined as:
𝑛 =𝑁
1+𝑁(𝑒)2 = 7,004,157/1+7,004,157 (0.1) ^2 =7,004,157/3.7 = 399 customers
The study will therefore survey 399 customers from the population.
Where:
n = sample size, N = is the population size and, e = is the level of precision which is
10%; at 95% confidence level and p is assumed to be = .5
The researcher employed simple random sampling procedure to select a sample that
represented the entire population. This procedure was preferred since all the target
population had an equal chance of being selected. Mugenda and Mugenda (2003),
points out that simple random sampling method ensures inclusion of small groups
which otherwise could have entirely been omitted by other sampling methods.
24
3.5 Data Collection Method
The study utilised primary data collected using a questionnaire. The questions were
both closed and open ended (Appendix II). The questionnaires contained questions on
the factors that influence customers’ level of satisfaction. Primary data according to
Kothari (2004) is the data collected a fresh for the first time while secondary data is that
data that has already been collected and passed through statistical process.
The questions were measured on a 5-point Likert scale (1-5). According to Brace
(2008), Likert scales are useful when trying to capture or measure attitudes and
perceptions. In adddition, most questions were close ended to reduce variations and
make data analysis easy (Dillman et al., 2009).
The researcher used a letter of introduction explaining clearly why the research is being
done (Saunders et al., 2009). This request assured them of their confidentiality in order
to increase their participation and reference will not be made to any individual or
organizations. Moreover, the researcher made use of two research assistants who were
trained thoroughly on how to collect data using a questionnaire and a basic
understanding of the topic being studied. The questionnaires were administered using
the fill out and collect at the same time method. This option was preferred since the
respondents could be guided if they got stuck.
3.6 Quality of the Research
Research quality is measured using reliability and validity.
3.6.1 Reliability
Reliability is a way of assessing the quality of the data collection tool, the questionnaire.
The purpose of reliability is to minimise the errors and biases in the study. Internal
consistency was measured and the Cronbach's alpha test was used for this purpose since
it is the most popular methods of estimating reliability (Nunnaly and Bernstein, 1994).
The suggested alpha of 0.7 is the desired value (Cronbach, 1951).
The following reliability tests were done:
25
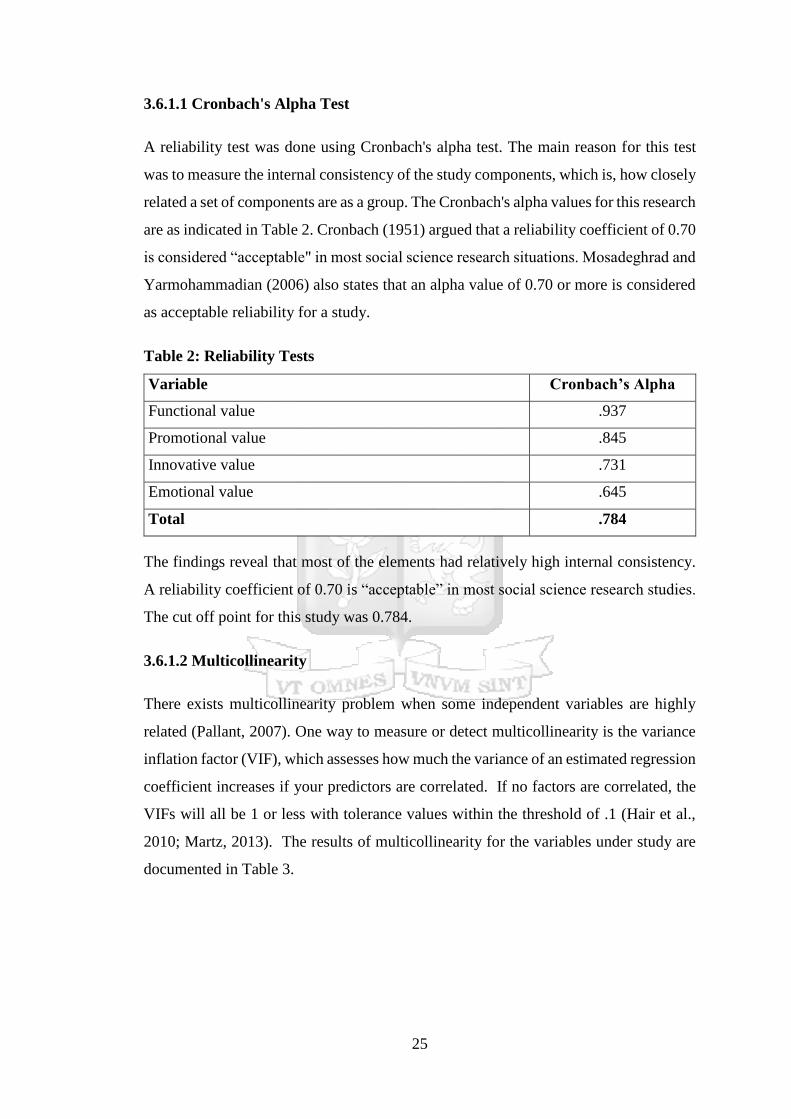
3.6.1.1 Cronbach's Alpha Test
A reliability test was done using Cronbach's alpha test. The main reason for this test
was to measure the internal consistency of the study components, which is, how closely
related a set of components are as a group. The Cronbach's alpha values for this research
are as indicated in Table 2. Cronbach (1951) argued that a reliability coefficient of 0.70
is considered “acceptable" in most social science research situations. Mosadeghrad and
Yarmohammadian (2006) also states that an alpha value of 0.70 or more is considered
as acceptable reliability for a study.
Table 2: Reliability Tests
Variable Cronbach’s Alpha
Functional value .937
Promotional value .845
Innovative value .731
Emotional value .645
Total .784
The findings reveal that most of the elements had relatively high internal consistency.
A reliability coefficient of 0.70 is “acceptable” in most social science research studies.
The cut off point for this study was 0.784.
3.6.1.2 Multicollinearity
There exists multicollinearity problem when some independent variables are highly
related (Pallant, 2007). One way to measure or detect multicollinearity is the variance
inflation factor (VIF), which assesses how much the variance of an estimated regression
coefficient increases if your predictors are correlated. If no factors are correlated, the
VIFs will all be 1 or less with tolerance values within the threshold of .1 (Hair et al.,
2010; Martz, 2013). The results of multicollinearity for the variables under study are
documented in Table 3.
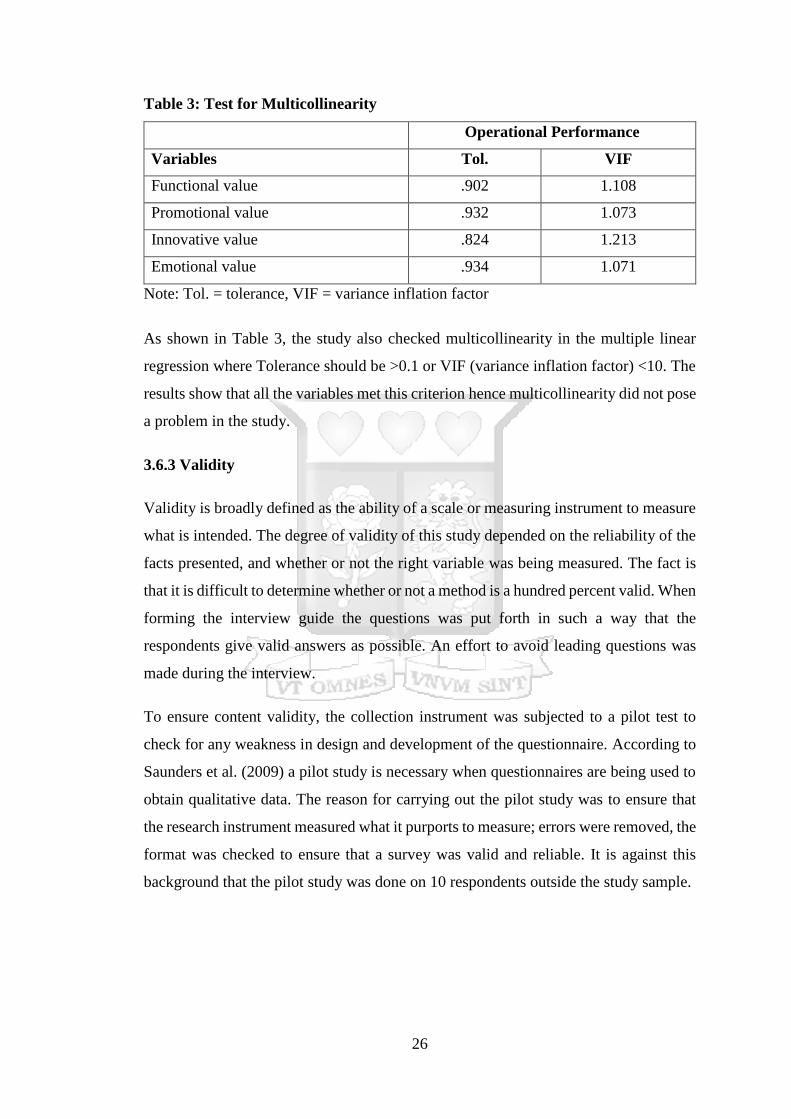
26
Table 3: Test for Multicollinearity
Operational Performance
Variables Tol. VIF
Functional value .902 1.108
Promotional value .932 1.073
Innovative value .824 1.213
Emotional value .934 1.071
Note: Tol. = tolerance, VIF = variance inflation factor
As shown in Table 3, the study also checked multicollinearity in the multiple linear
regression where Tolerance should be >0.1 or VIF (variance inflation factor) <10. The
results show that all the variables met this criterion hence multicollinearity did not pose
a problem in the study.
3.6.3 Validity
Validity is broadly defined as the ability of a scale or measuring instrument to measure
what is intended. The degree of validity of this study depended on the reliability of the
facts presented, and whether or not the right variable was being measured. The fact is
that it is difficult to determine whether or not a method is a hundred percent valid. When
forming the interview guide the questions was put forth in such a way that the
respondents give valid answers as possible. An effort to avoid leading questions was
made during the interview.
To ensure content validity, the collection instrument was subjected to a pilot test to
check for any weakness in design and development of the questionnaire. According to
Saunders et al. (2009) a pilot study is necessary when questionnaires are being used to
obtain qualitative data. The reason for carrying out the pilot study was to ensure that
the research instrument measured what it purports to measure; errors were removed, the
format was checked to ensure that a survey was valid and reliable. It is against this
background that the pilot study was done on 10 respondents outside the study sample.
27
3.7 Data Analysis
Data analysis started immediately after data collection and ended at the point of
interpretation and processing data (Kothari, 2004). Editing, coding, classifying and
tabulating were the steps used to process the collected data for a better and efficient
analysis. The statistical package for social sciences (SPSS) was used for further
analysis. Data was analysed using descriptive statistics whereby frequencies,
percentages, mean and standard deviations generated from the various data categories
will be computed and presented in graphs and tables.
The data collected was analysed in accordance with the study objectives. The data
collected was analysed using descriptive statistics (measures of central tendency and
measures of variations). In descriptive analysis, the study got the general description of
the population characteristics of the study. With inferential statistics, the study collected
data from a specified sample of the population and make an inference to it. However,
before final analysis was performed, data was checked up to eliminate discrepancies
and thereafter, classified on the basis of similarity and then tabulated. The responses
were coded into numerical form to facilitate statistical analysis.
Multiple regression analysis was used to determine the relationship between factors
influencing customer satisfaction with services offered by Safaricom mobile cellular
network. This was determined by analysing the two variables and getting a correlation
coefficient to measure the linear significance of two-attributes. The use of correlation
analysis was conducted to establish the strength of the relationship between the
dependent variable and independent variables.
3.7.1 Analytical Model
Analytic model is a set of equations that describes relationships that show a desired
outcome or performance. The general form of the multiple linear regression is presented
in equation (i)
Y= β0 + β1FV + β2PV+ β3IV+β4EV+ β5CS+ε..……………..……..….. (i)
Where; Y =Customer satisfaction;
FV= Functional value;
PV= Promotional value;
28
IV= Innovative value;
EV= Emotional value;
0β = Constant variable and
ε = error/term or variable which represents all the factors that affects the dependent
variable but will not be included in the model either because they are difficult to
measure or not known.
3.8 Ethical Considerations
The study was conducted ethically. The participation of the respondents was voluntary
and anonymous and the respondents were free to withdraw from participating in the
study at any point. The aim of research was made known to all the respondents so as to
ensure that any consent given were informed. The data collected from the current
survey will strictly be kept for education and research purpose only and the information
will be confidential to ensure that the participants face no personal risk upon
participating in the study.
29
CHAPTER FOUR: DATA ANALYSIS AND INTERPRETATION OF
FINDINGS
4.1 Introduction
This chapter presented the research finding from the data analysis in line with the
research objectives. The structure of this chapter begins with the response rate, and the
results from demographic data of the respondents. It further outlined the analysis as per
the research objectives and covered inferential statistics used by the study.
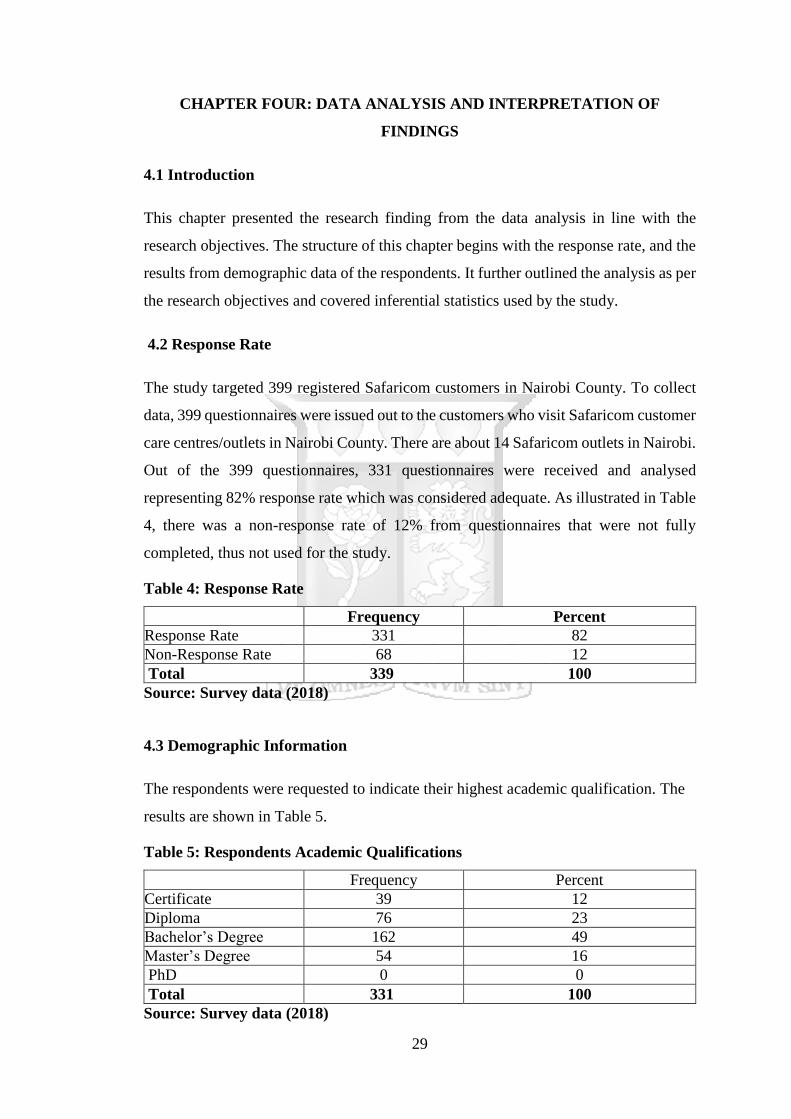
4.2 Response Rate
The study targeted 399 registered Safaricom customers in Nairobi County. To collect
data, 399 questionnaires were issued out to the customers who visit Safaricom customer
care centres/outlets in Nairobi County. There are about 14 Safaricom outlets in Nairobi.
Out of the 399 questionnaires, 331 questionnaires were received and analysed
representing 82% response rate which was considered adequate. As illustrated in Table
4, there was a non-response rate of 12% from questionnaires that were not fully
completed, thus not used for the study.
Table 4: Response Rate
Frequency Percent
Response Rate 331 82
Non-Response Rate 68 12
Total 339 100
Source: Survey data (2018)
4.3 Demographic Information
The respondents were requested to indicate their highest academic qualification. The
results are shown in Table 5.
Table 5: Respondents Academic Qualifications
Frequency Percent
Certificate 39 12
Diploma 76 23
Bachelor’s Degree 162 49
Master’s Degree 54 16
PhD 0 0
Total 331 100
Source: Survey data (2018)
30
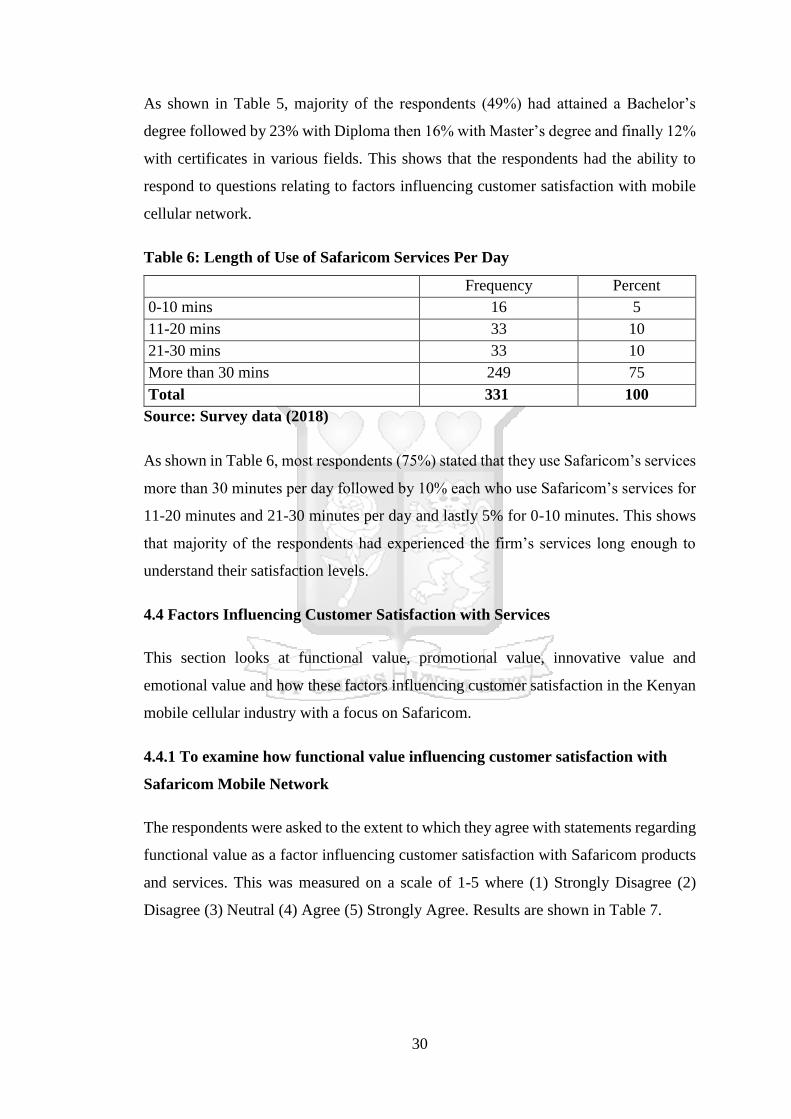
As shown in Table 5, majority of the respondents (49%) had attained a Bachelor’s
degree followed by 23% with Diploma then 16% with Master’s degree and finally 12%
with certificates in various fields. This shows that the respondents had the ability to
respond to questions relating to factors influencing customer satisfaction with mobile
cellular network.
Table 6: Length of Use of Safaricom Services Per Day
Frequency Percent
0-10 mins 16 5
11-20 mins 33 10
21-30 mins 33 10
More than 30 mins 249 75
Total 331 100
Source: Survey data (2018)
As shown in Table 6, most respondents (75%) stated that they use Safaricom’s services
more than 30 minutes per day followed by 10% each who use Safaricom’s services for
11-20 minutes and 21-30 minutes per day and lastly 5% for 0-10 minutes. This shows
that majority of the respondents had experienced the firm’s services long enough to
understand their satisfaction levels.
4.4 Factors Influencing Customer Satisfaction with Services
This section looks at functional value, promotional value, innovative value and
emotional value and how these factors influencing customer satisfaction in the Kenyan
mobile cellular industry with a focus on Safaricom.
4.4.1 To examine how functional value influencing customer satisfaction with
Safaricom Mobile Network
The respondents were asked to the extent to which they agree with statements regarding
functional value as a factor influencing customer satisfaction with Safaricom products
and services. This was measured on a scale of 1-5 where (1) Strongly Disagree (2)
Disagree (3) Neutral (4) Agree (5) Strongly Agree. Results are shown in Table 7.
31
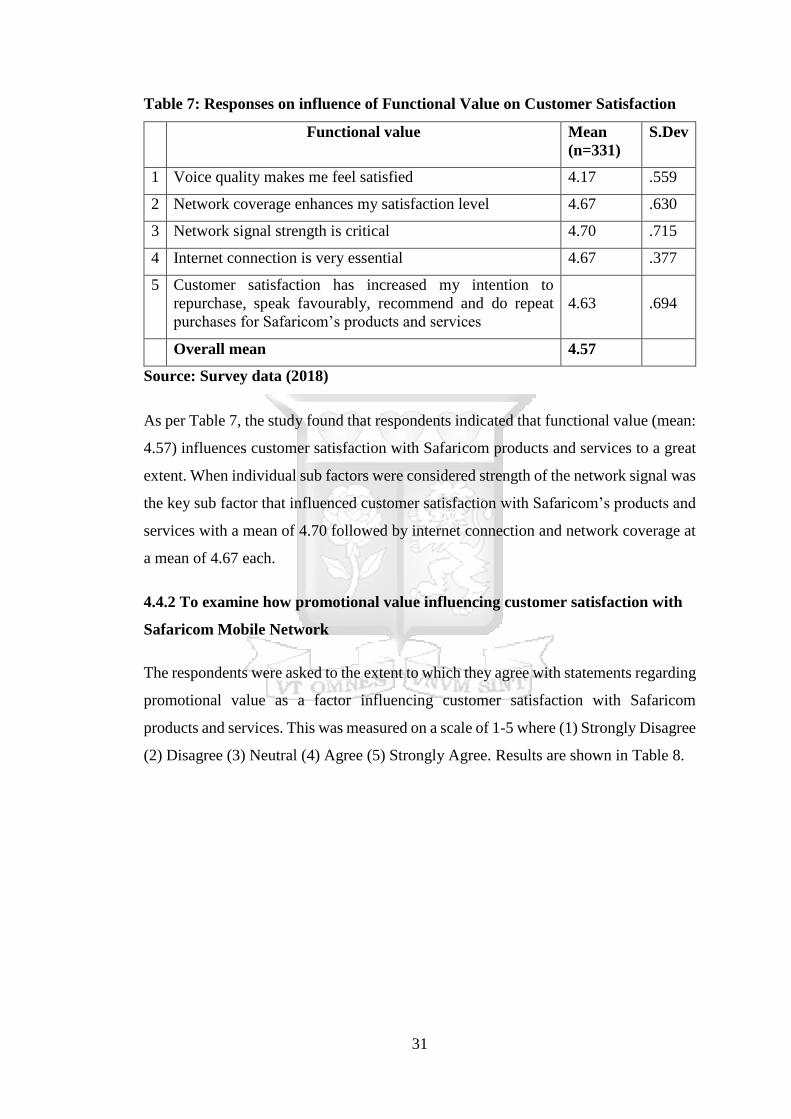
Table 7: Responses on influence of Functional Value on Customer Satisfaction
Functional value Mean
(n=331)
S.Dev
1 Voice quality makes me feel satisfied 4.17 .559
2 Network coverage enhances my satisfaction level 4.67 .630
3 Network signal strength is critical 4.70 .715
4 Internet connection is very essential 4.67 .377
5 Customer satisfaction has increased my intention to
repurchase, speak favourably, recommend and do repeat
purchases for Safaricom’s products and services
4.63 .694
Overall mean 4.57
Source: Survey data (2018)
As per Table 7, the study found that respondents indicated that functional value (mean:
4.57) influences customer satisfaction with Safaricom products and services to a great
extent. When individual sub factors were considered strength of the network signal was
the key sub factor that influenced customer satisfaction with Safaricom’s products and
services with a mean of 4.70 followed by internet connection and network coverage at
a mean of 4.67 each.
4.4.2 To examine how promotional value influencing customer satisfaction with
Safaricom Mobile Network
The respondents were asked to the extent to which they agree with statements regarding
promotional value as a factor influencing customer satisfaction with Safaricom
products and services. This was measured on a scale of 1-5 where (1) Strongly Disagree
(2) Disagree (3) Neutral (4) Agree (5) Strongly Agree. Results are shown in Table 8.
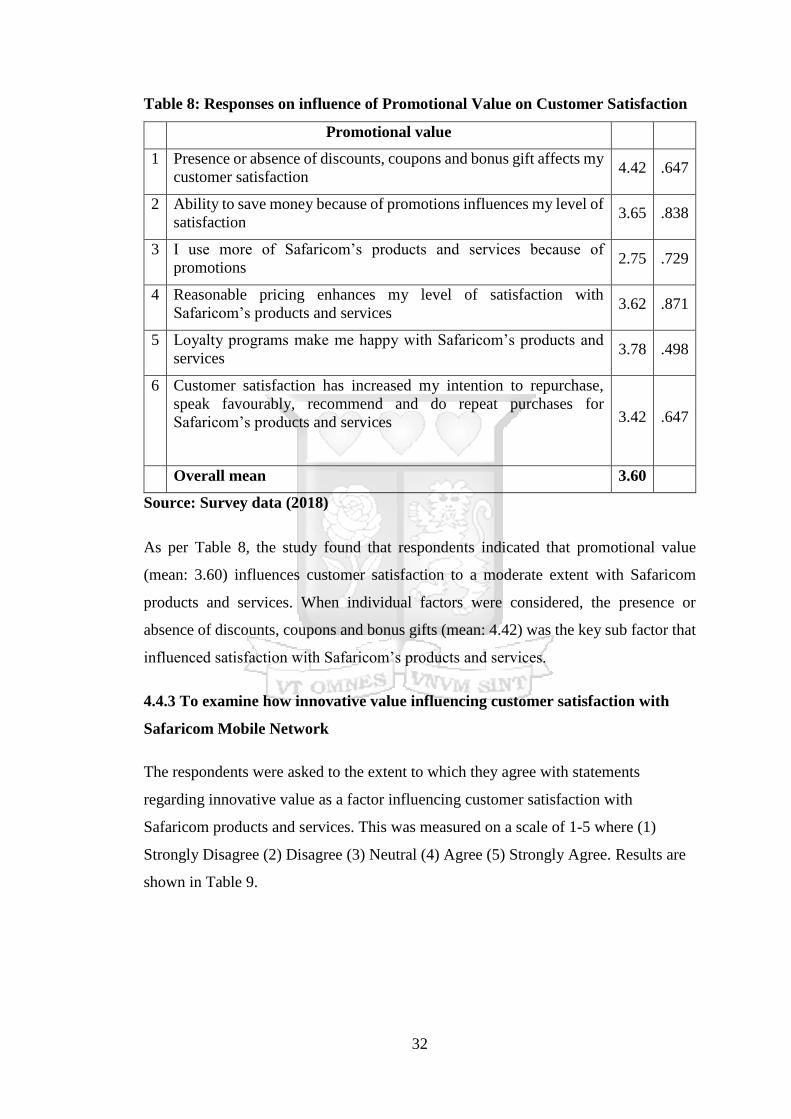
32
Table 8: Responses on influence of Promotional Value on Customer Satisfaction
Promotional value
1 Presence or absence of discounts, coupons and bonus gift affects my
customer satisfaction 4.42 .647
2 Ability to save money because of promotions influences my level of
satisfaction 3.65 .838
3 I use more of Safaricom’s products and services because of
promotions 2.75 .729
4 Reasonable pricing enhances my level of satisfaction with
Safaricom’s products and services 3.62 .871
5 Loyalty programs make me happy with Safaricom’s products and
services 3.78 .498
6 Customer satisfaction has increased my intention to repurchase,
speak favourably, recommend and do repeat purchases for
Safaricom’s products and services
3.42 .647
Overall mean 3.60
Source: Survey data (2018)
As per Table 8, the study found that respondents indicated that promotional value
(mean: 3.60) influences customer satisfaction to a moderate extent with Safaricom
products and services. When individual factors were considered, the presence or
absence of discounts, coupons and bonus gifts (mean: 4.42) was the key sub factor that
influenced satisfaction with Safaricom’s products and services.
4.4.3 To examine how innovative value influencing customer satisfaction with
Safaricom Mobile Network
The respondents were asked to the extent to which they agree with statements
regarding innovative value as a factor influencing customer satisfaction with
Safaricom products and services. This was measured on a scale of 1-5 where (1)
Strongly Disagree (2) Disagree (3) Neutral (4) Agree (5) Strongly Agree. Results are
shown in Table 9.
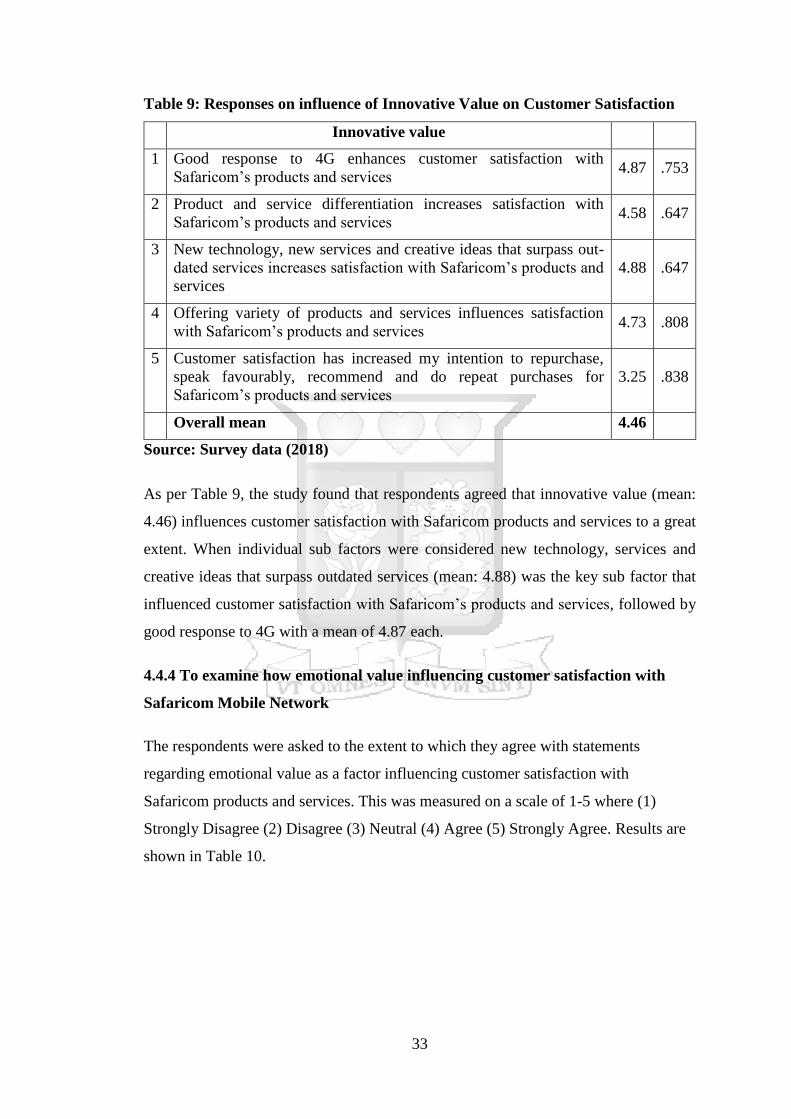
33
Table 9: Responses on influence of Innovative Value on Customer Satisfaction
Innovative value
1 Good response to 4G enhances customer satisfaction with
Safaricom’s products and services 4.87 .753
2 Product and service differentiation increases satisfaction with
Safaricom’s products and services 4.58 .647
3 New technology, new services and creative ideas that surpass out-
dated services increases satisfaction with Safaricom’s products and
services
4.88 .647
4 Offering variety of products and services influences satisfaction
with Safaricom’s products and services 4.73 .808
5 Customer satisfaction has increased my intention to repurchase,
speak favourably, recommend and do repeat purchases for
Safaricom’s products and services
3.25 .838
Overall mean 4.46
Source: Survey data (2018)
As per Table 9, the study found that respondents agreed that innovative value (mean:
4.46) influences customer satisfaction with Safaricom products and services to a great
extent. When individual sub factors were considered new technology, services and
creative ideas that surpass outdated services (mean: 4.88) was the key sub factor that
influenced customer satisfaction with Safaricom’s products and services, followed by
good response to 4G with a mean of 4.87 each.
4.4.4 To examine how emotional value influencing customer satisfaction with
Safaricom Mobile Network
The respondents were asked to the extent to which they agree with statements
regarding emotional value as a factor influencing customer satisfaction with
Safaricom products and services. This was measured on a scale of 1-5 where (1)
Strongly Disagree (2) Disagree (3) Neutral (4) Agree (5) Strongly Agree. Results are
shown in Table 10.
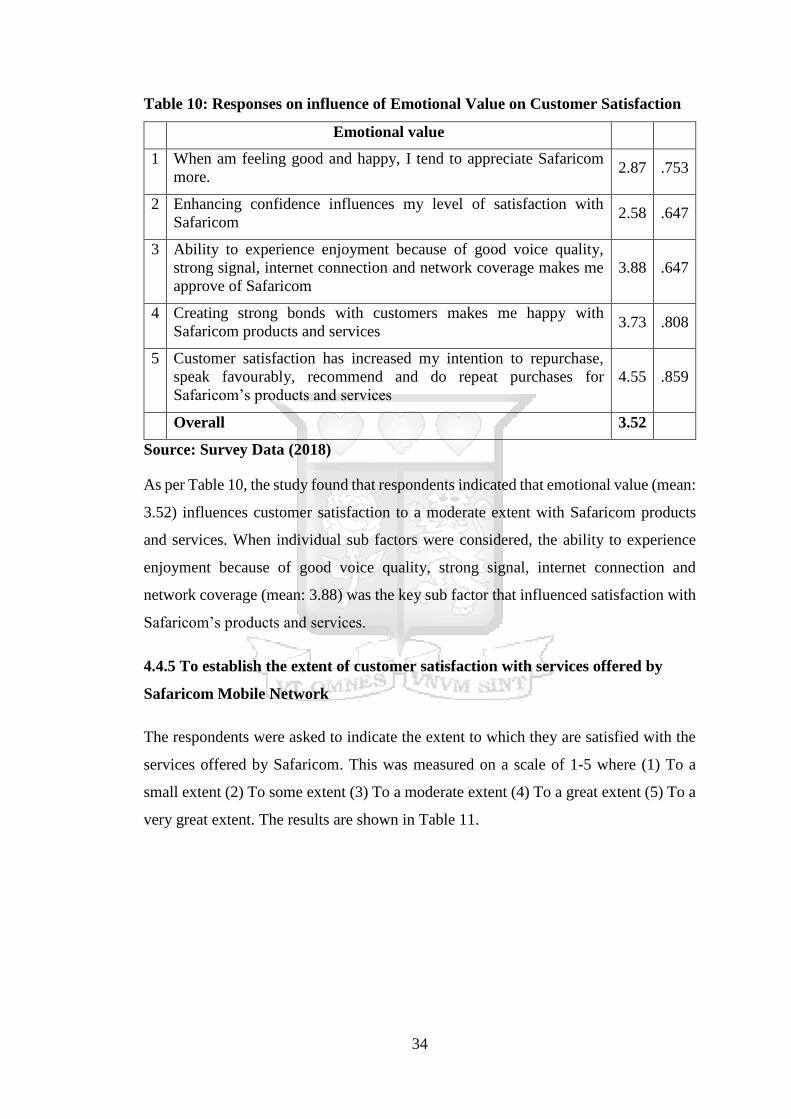
34
Table 10: Responses on influence of Emotional Value on Customer Satisfaction
Emotional value
1 When am feeling good and happy, I tend to appreciate Safaricom
more. 2.87 .753
2 Enhancing confidence influences my level of satisfaction with
Safaricom 2.58 .647
3 Ability to experience enjoyment because of good voice quality,
strong signal, internet connection and network coverage makes me
approve of Safaricom
3.88 .647
4 Creating strong bonds with customers makes me happy with
Safaricom products and services 3.73 .808
5 Customer satisfaction has increased my intention to repurchase,
speak favourably, recommend and do repeat purchases for
Safaricom’s products and services
4.55 .859
Overall 3.52
Source: Survey Data (2018)
As per Table 10, the study found that respondents indicated that emotional value (mean:
3.52) influences customer satisfaction to a moderate extent with Safaricom products
and services. When individual sub factors were considered, the ability to experience
enjoyment because of good voice quality, strong signal, internet connection and
network coverage (mean: 3.88) was the key sub factor that influenced satisfaction with
Safaricom’s products and services.
4.4.5 To establish the extent of customer satisfaction with services offered by
Safaricom Mobile Network
The respondents were asked to indicate the extent to which they are satisfied with the
services offered by Safaricom. This was measured on a scale of 1-5 where (1) To a
small extent (2) To some extent (3) To a moderate extent (4) To a great extent (5) To a
very great extent. The results are shown in Table 11.
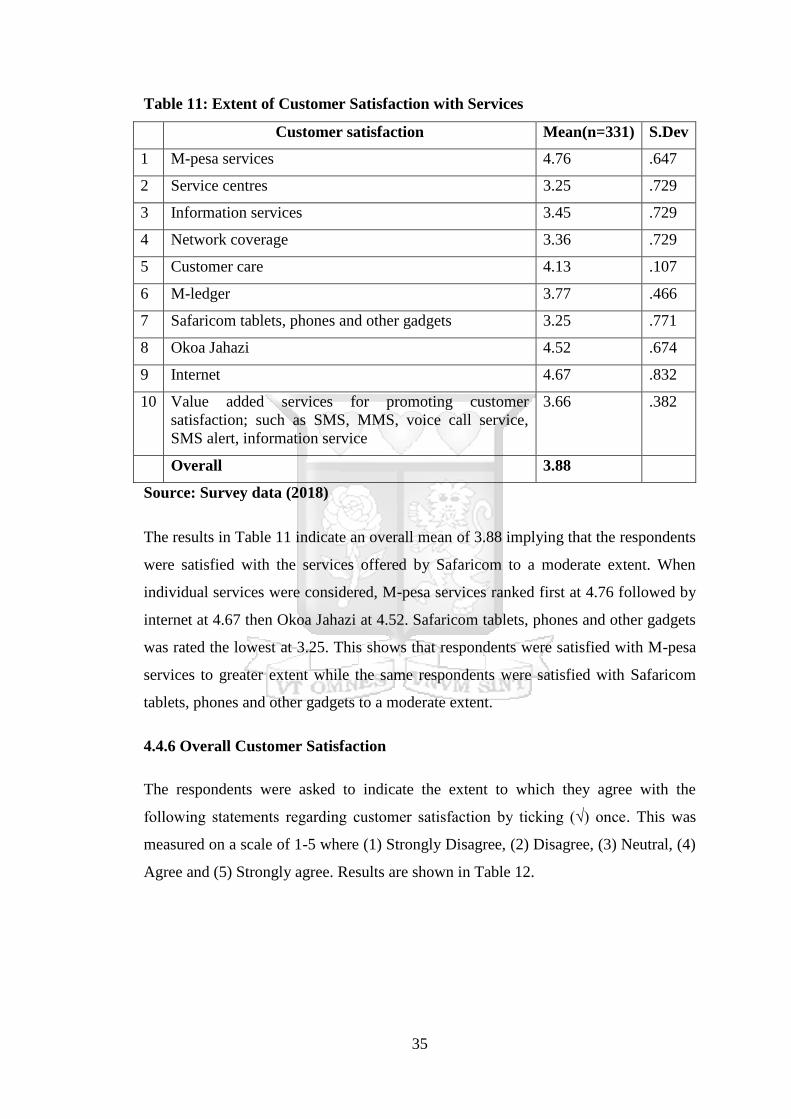
35
Table 11: Extent of Customer Satisfaction with Services
Customer satisfaction Mean(n=331) S.Dev
1 M-pesa services 4.76 .647
2 Service centres 3.25 .729
3 Information services 3.45 .729
4 Network coverage 3.36 .729
5 Customer care 4.13 .107
6 M-ledger 3.77 .466
7 Safaricom tablets, phones and other gadgets 3.25 .771
8 Okoa Jahazi 4.52 .674
9 Internet 4.67 .832
10 Value added services for promoting customer
satisfaction; such as SMS, MMS, voice call service,
SMS alert, information service
3.66 .382
Overall 3.88
Source: Survey data (2018)
The results in Table 11 indicate an overall mean of 3.88 implying that the respondents
were satisfied with the services offered by Safaricom to a moderate extent. When
individual services were considered, M-pesa services ranked first at 4.76 followed by
internet at 4.67 then Okoa Jahazi at 4.52. Safaricom tablets, phones and other gadgets
was rated the lowest at 3.25. This shows that respondents were satisfied with M-pesa
services to greater extent while the same respondents were satisfied with Safaricom
tablets, phones and other gadgets to a moderate extent.
4.4.6 Overall Customer Satisfaction
The respondents were asked to indicate the extent to which they agree with the
following statements regarding customer satisfaction by ticking (√) once. This was
measured on a scale of 1-5 where (1) Strongly Disagree, (2) Disagree, (3) Neutral, (4)
Agree and (5) Strongly agree. Results are shown in Table 12.
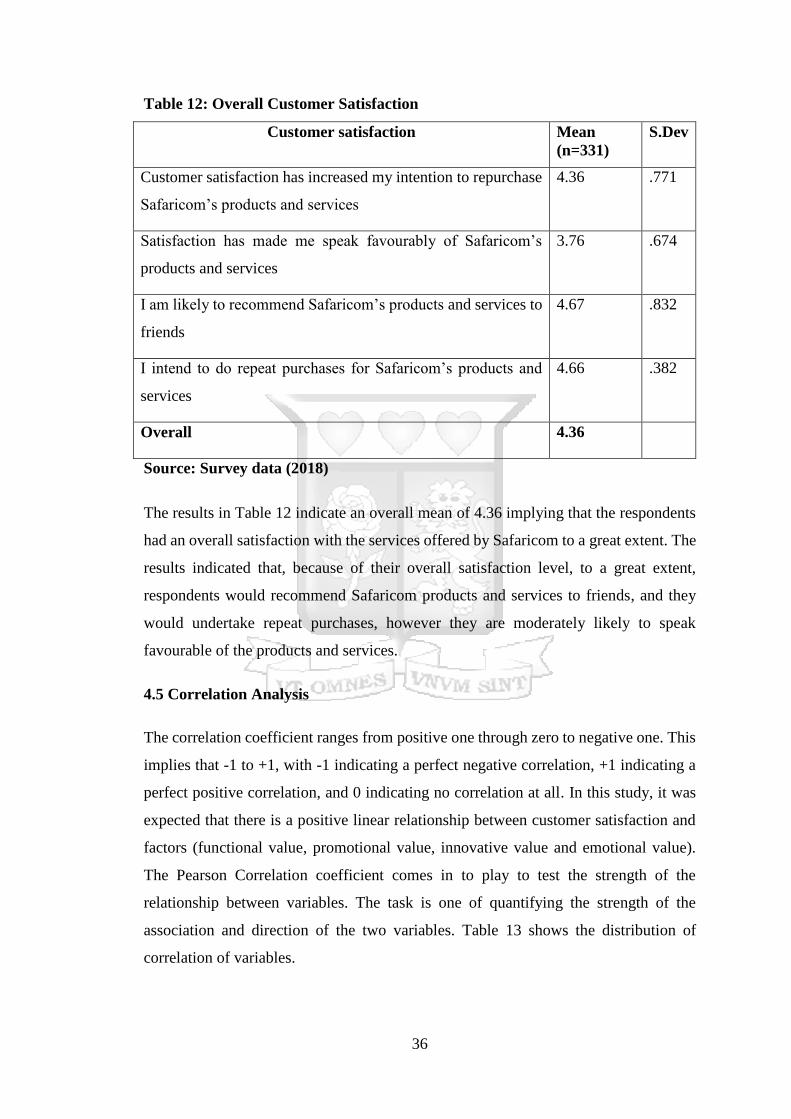
36
Table 12: Overall Customer Satisfaction
Customer satisfaction Mean
(n=331)
S.Dev
Customer satisfaction has increased my intention to repurchase
Safaricom’s products and services
4.36 .771
Satisfaction has made me speak favourably of Safaricom’s
products and services
3.76 .674
I am likely to recommend Safaricom’s products and services to
friends
4.67 .832
I intend to do repeat purchases for Safaricom’s products and
services
4.66 .382
Overall 4.36
Source: Survey data (2018)
The results in Table 12 indicate an overall mean of 4.36 implying that the respondents
had an overall satisfaction with the services offered by Safaricom to a great extent. The
results indicated that, because of their overall satisfaction level, to a great extent,
respondents would recommend Safaricom products and services to friends, and they
would undertake repeat purchases, however they are moderately likely to speak
favourable of the products and services.
4.5 Correlation Analysis
The correlation coefficient ranges from positive one through zero to negative one. This
implies that -1 to +1, with -1 indicating a perfect negative correlation, +1 indicating a
perfect positive correlation, and 0 indicating no correlation at all. In this study, it was
expected that there is a positive linear relationship between customer satisfaction and
factors (functional value, promotional value, innovative value and emotional value).
The Pearson Correlation coefficient comes in to play to test the strength of the
relationship between variables. The task is one of quantifying the strength of the
association and direction of the two variables. Table 13 shows the distribution of
correlation of variables.
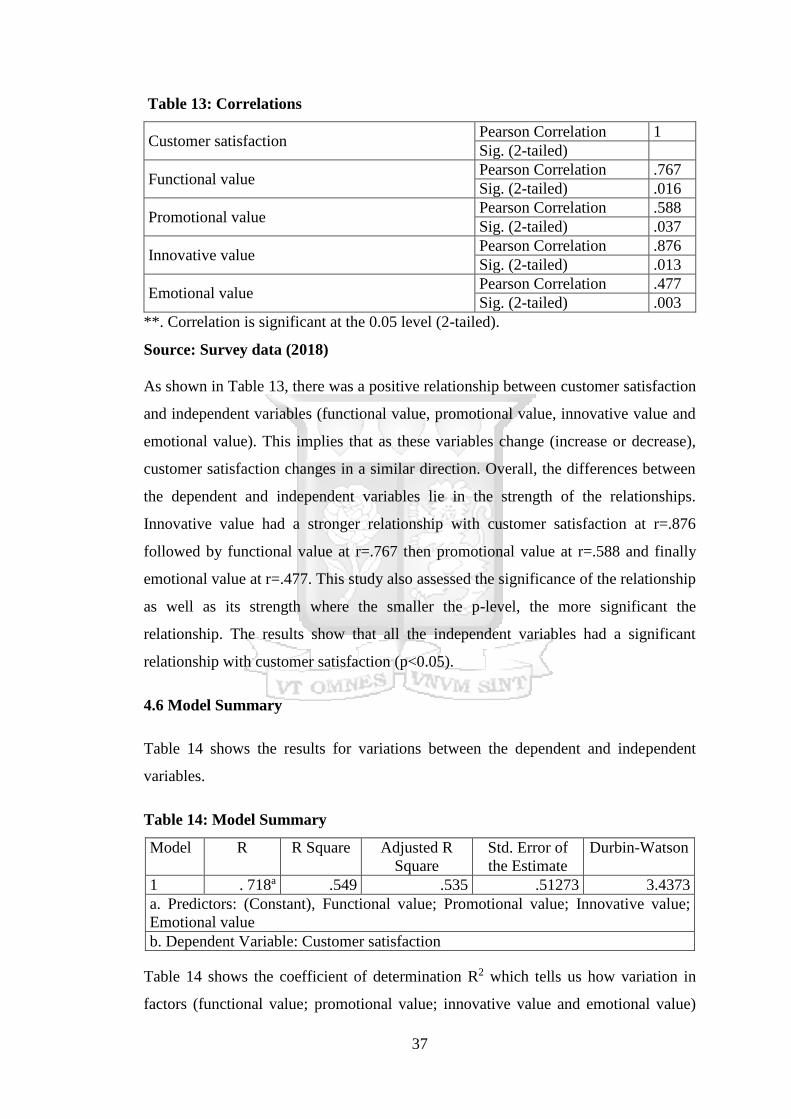
37
Table 13: Correlations
Customer satisfaction Pearson Correlation 1
Sig. (2-tailed)
Functional value Pearson Correlation .767
Sig. (2-tailed) .016
Promotional value Pearson Correlation .588
Sig. (2-tailed) .037
Innovative value Pearson Correlation .876
Sig. (2-tailed) .013
Emotional value Pearson Correlation .477
Sig. (2-tailed) .003
**. Correlation is significant at the 0.05 level (2-tailed).
Source: Survey data (2018)
As shown in Table 13, there was a positive relationship between customer satisfaction
and independent variables (functional value, promotional value, innovative value and
emotional value). This implies that as these variables change (increase or decrease),
customer satisfaction changes in a similar direction. Overall, the differences between
the dependent and independent variables lie in the strength of the relationships.
Innovative value had a stronger relationship with customer satisfaction at r=.876
followed by functional value at r=.767 then promotional value at r=.588 and finally
emotional value at r=.477. This study also assessed the significance of the relationship
as well as its strength where the smaller the p-level, the more significant the
relationship. The results show that all the independent variables had a significant
relationship with customer satisfaction (p<0.05).
4.6 Model Summary
Table 14 shows the results for variations between the dependent and independent
variables.
Table 14: Model Summary
Model R R Square Adjusted R
Square
Std. Error of
the Estimate
Durbin-Watson
1 . 718a .549 .535 .51273 3.4373
a. Predictors: (Constant), Functional value; Promotional value; Innovative value;
Emotional value
b. Dependent Variable: Customer satisfaction
Table 14 shows the coefficient of determination R2 which tells us how variation in
factors (functional value; promotional value; innovative value and emotional value)
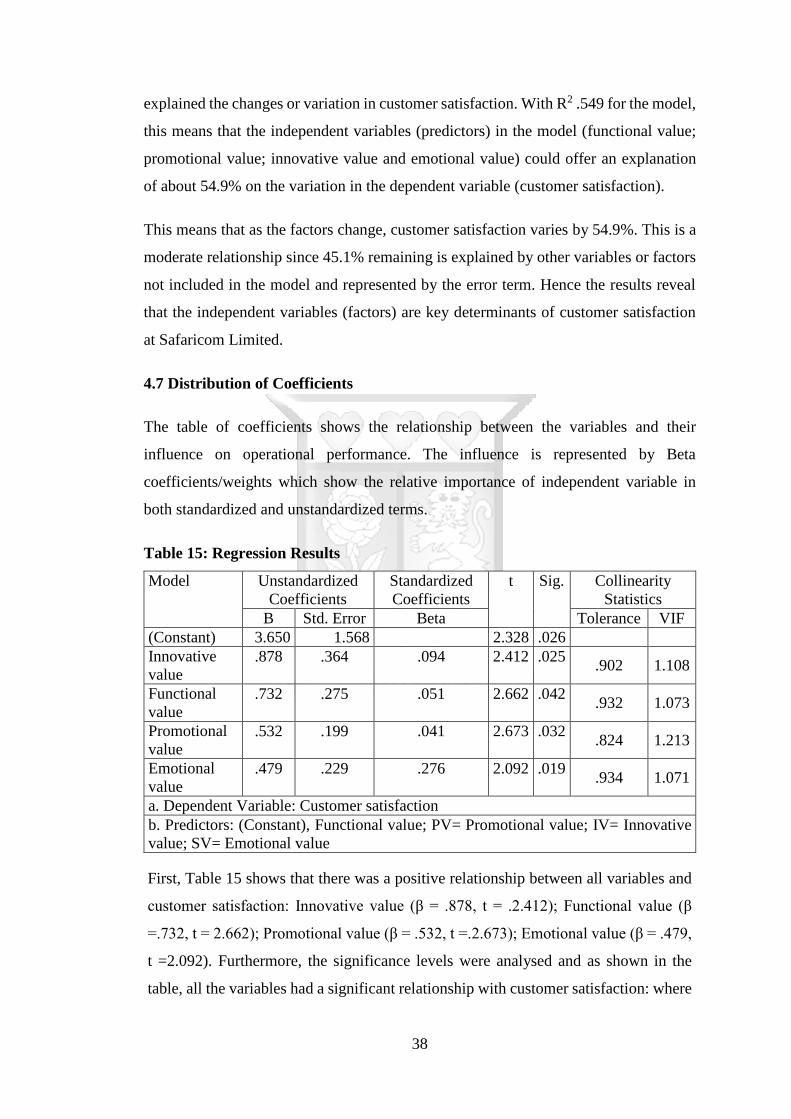
38
explained the changes or variation in customer satisfaction. With R2 .549 for the model,
this means that the independent variables (predictors) in the model (functional value;
promotional value; innovative value and emotional value) could offer an explanation
of about 54.9% on the variation in the dependent variable (customer satisfaction).
This means that as the factors change, customer satisfaction varies by 54.9%. This is a
moderate relationship since 45.1% remaining is explained by other variables or factors
not included in the model and represented by the error term. Hence the results reveal
that the independent variables (factors) are key determinants of customer satisfaction
at Safaricom Limited.
4.7 Distribution of Coefficients
The table of coefficients shows the relationship between the variables and their
influence on operational performance. The influence is represented by Beta
coefficients/weights which show the relative importance of independent variable in
both standardized and unstandardized terms.
Table 15: Regression Results
Model Unstandardized
Coefficients
Standardized
Coefficients
t Sig. Collinearity
Statistics
B Std. Error Beta Tolerance VIF
(Constant) 3.650 1.568 2.328 .026
Innovative
value
.878 .364 .094 2.412 .025 .902 1.108
Functional
value
.732 .275 .051 2.662 .042 .932 1.073
Promotional
value
.532 .199 .041 2.673 .032 .824 1.213
Emotional
value
.479 .229 .276 2.092 .019 .934 1.071
a. Dependent Variable: Customer satisfaction
b. Predictors: (Constant), Functional value; PV= Promotional value; IV= Innovative
value; SV= Emotional value
First, Table 15 shows that there was a positive relationship between all variables and
customer satisfaction: Innovative value (β = .878, t = .2.412); Functional value (β
=.732, t = 2.662); Promotional value (β = .532, t =.2.673); Emotional value (β = .479,
t =2.092). Furthermore, the significance levels were analysed and as shown in the
table, all the variables had a significant relationship with customer satisfaction: where
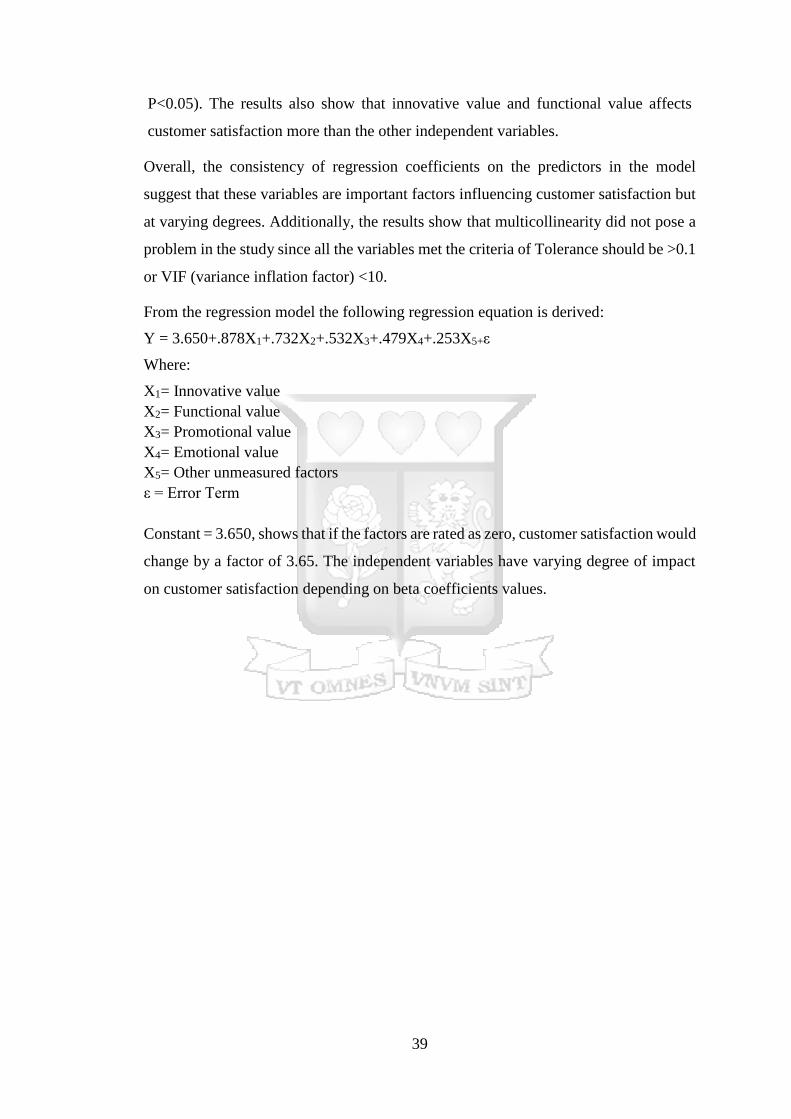
39
P<0.05). The results also show that innovative value and functional value affects
customer satisfaction more than the other independent variables.
Overall, the consistency of regression coefficients on the predictors in the model
suggest that these variables are important factors influencing customer satisfaction but
at varying degrees. Additionally, the results show that multicollinearity did not pose a
problem in the study since all the variables met the criteria of Tolerance should be >0.1
or VIF (variance inflation factor) <10.
From the regression model the following regression equation is derived:
Y = 3.650+.878X1+.732X2+.532X3+.479X4+.253X5+ε
Where:
X1= Innovative value
X2= Functional value
X3= Promotional value
X4= Emotional value
X5= Other unmeasured factors
ε = Error Term
Where Constant = 3.650, shows that if the factors are rated as zero, customer satisfaction would
change by a factor of 3.65. The independent variables have varying degree of impact
on customer satisfaction depending on beta coefficients values.
40
CHAPTER FIVE: DISCUSSION, CONCLUSIONS AND
RECOMMENDATIONS
5.1 Introduction
This chapter discusses the findings presented in chapter four of the study in line with
literature review. The study sought to analyse the factors influencing customer
satisfaction in the Kenyan mobile cellular industry. This chapter summarizes the
findings of the study through the analysed variables in this study. Thereafter,
conclusions are made based on factors (innovative, functional, emotional and
promotional value) and customer satisfaction. Finally policy recommendations and
areas of further research are suggested.
5.2 Discussion of Findings
This section presents the discussion of the findings based on the research objectives.
5.2.1 Factors influencing customer satisfaction with Safaricom Mobile Network
The study sought to examine the factors influencing customer satisfaction with
Safaricom Mobile Cellular Network. There were four factors considered in this study
namely functional value, promotional value, innovative value and emotional value.
5.2.1.1 Functional Value and Customer Satisfaction
The results revealed that functional value had great influence on customer satisfaction
thus indicating a positive correlation between the factor and customer satisfaction with
products and services offered by Safaricom. Customers expect any products or services
they buy to perform correctly this is the reason why functional value ranked highly
among the selected factors. This shows a positive correlation between functional value
and customer satisfaction.
From the findings, good voice quality, network coverage, strong signal and internet
connection are aspects of proper performance of a cellular network and this greatly
impacts customer satisfaction (Lim, Widdow, Richard & Park, 2006).
Several studies have identified a positive correlation between factors that influence
customer satisfaction and customer satisfaction (Fornell et al., 1996; Yu et al 2005;
41
Zeithaml et al., 2009). These factors are mostly similar in what aspect of customer
satisfaction they are measuring; some of them include customer's expectation,
perceived service quality, product quality, perceived value, price, among others. The
finding is also in line with observation by Leelakulthanit and Hongcharu (2011).
5.2.1.2 Promotional Value and Customer Satisfaction
The results revealed that promotional value influenced customer satisfaction
moderately. The monetary savings that are brought on by promotions, and use of loyalty
programs are sub factors that enhance the customer satisfaction with the products and
services offered by Safaricom. However, whether promotions are there or not,
customers will continue to use Safaricom products and services. This is an indication
that there are other aspects, products and services that will motivate a customer to
continue using Safaricom products and services.
When looking at customer satisfaction with the services offered, M-pesa services
ranked highest. This could be a core reason as to why customers would still use
Safaricom products and services whether or not there were promotions.
Several studies have identified a positive correlation between factors that influence
customer satisfaction and customer satisfaction (Fornell et al., 1996; Yu et al 2005;
Zeithaml et al., 2009). However a study by Mohamad (2015) that sought to analyse
customer satisfaction using the 7Ps on retail bank customers in Nigeria found that
product, process and physical evidence were significantly related to customer
satisfaction while price, promotion, place and people are not significantly related. There
is an inconsistency between this study and others that have found positive correlation
between factors affecting customer satisfaction and customer satisfaction. The current
study found that there is a positive correlation between promotional value and customer
satisfaction but not to a great extent implying.
5.2.1.3 Innovative Value and Customer Satisfaction
The results revealed that innovative value had the great influence on customer
satisfaction. This shows that this factor was important in influencing customer
satisfaction with Safaricom products and services. New technology, new services and
creative ideas ranked high as sub factors that influenced customer satisfaction with
42
Safaricom products and services, emphasising on the importance of innovative value
on customer satisfaction. This is in line with (Dotzel et all., 2013) who deduced that the
propensity to introduce service innovation to satisfy customers and improve firm value
has become a critical organisational capability.
A study done indicated that rapid changes in the technology is a challenge for
companies to satisfy the customers and to get their loyalty through innovative products.
The innovation used for strategic orientation toward customer satisfaction, loyalty, and
to gain market potential that increases the market share of the company (Rahman,
2014). This indicates that innovation is critical to business success.
5.2.1.4 Emotional Value and Customer Satisfaction
The results revealed that emotional value influenced customer satisfaction moderately.
The sub factor of creating bonds with customers and experiencing enjoyment due to
positive functional value to good quality voice, strong signal and internet connection
influenced customer satisfaction more than enhanced confidence with the products and
services offered by Safaricom and an individual’s general mood and happiness level.
Several studies support the positive influence of the perceived emotional value of
satisfaction (Eroglu, Machleut & Barr, 2005; Leelakulthanit & Hongcharu, 2011).
Sweeney and Souter (2001) found that emotional value is the strongest predictor of
consumers’ purchase intention. However, it was revealed that customers place higher
priority on utilitarian benefits than to hedonic benefits (Chitturi, Raghunathan &
Mahajan, 2007; Higgins, 2001). This is in line with the current study where higher
priority is on utilitarian benefit than hedonic benefit.
5.2.2 Extent of customer satisfaction with services offered by Safaricom Mobile
Network
The study sought to determine the extent of customer satisfaction with services offered
by Safaricom Mobile Cellular Network. The overall customer satisfaction with various
services showed that the respondents were satisfied with the services offered by
Safaricom to a moderate extent. When individual services were analysed, M-pesa
services ranked highest implying that respondents were satisfied with the service to a
great extent.
43
Overall it appears that respondents were satisfied with Safaricom services and this is
based on attitudes formed in the past. The Theory of Reasoned Action (TRA) supports
this because consumer attitudes are formed as result of product attributes beliefs
(Fishbein and Ajzen, 1980; Cherry, 2006). Attitudes formed towards Safaricom
products and services lead to perceived likelihood of particular consequences i.e. repeat
purchase and enhanced customer satisfaction. This theory provides an expanded picture
of how, when, and why attitudes predict behavior.
The empirical results indicate that on the basis of the Likert scale customer satisfaction
with Safaricom appears to be high especially when specific services are considered
which impacted the overall satisfaction level that showed respondents satisfaction to a
great extent. The findings also show that a customer who is satisfied will be loyal
because satisfaction has increased their intention to repurchase the products and
services. More so, the respondent is more likely to recommend the products and
services to others. This finding concurs with observation by Jamal and Naser (2002)
and Kotler and Keller (2012) that satisfied customers probably talk to others about their
experiences and consequently, they get engaged with word of mouth marketing.
On the contrary, unsatisfied customers probably break their contact with the company
and get engaged with negative word of mouth marketing. This shows that since the
respondents were satisfied with Safaricom services to a great extent, it has increased
the intention to repurchase Safaricom’s products and services. Also, they are likely to
recommend Safaricom’s products and services to friends.
5.3 Conclusion
Overall, with an aggregate mean of 4.04 the four factors identified in the study namely
functional value, promotional value, innovative value and emotional value affects
customer satisfaction to a great extent. Customer satisfaction is a parameter for
measuring profitability of business; higher satisfaction leads to higher sales of
merchandise and services generating higher revenues of the business. Customers
intension to maximize their service values through innovative services offered by
mobile service providers; the degree of newness has greater impact on valuing customer
satisfaction. Reliability of service perceived by one of the key factors in promoting
44
customer satisfaction; depended on the basis of trust of promoting expected needs at a
high level of confidence of customer on service providers.
The result of regression analysis revealed that there is a significant relationship between
the selected factors and customer satisfaction. Hence the variables had a significant
relationship with customer satisfaction: where P<0.05. The results also show that
innovative value and functional value affects customer satisfaction more than
promotional and emotional value.
Pearson correlation results also showed that all the independent variables had a
significant positive correlation with operational performance at p<0.05. Innovative
value had a stronger relationship with customer satisfaction at r=.876 followed by
functional value at r=.767. Promotional value at r=.588 had a moderate relationship
with customer satisfaction and finally emotional value at r=.477 had a weak but positive
relationship with customer satisfaction.
The coefficient of determination R2 tells us how variation in factors (functional value;
promotional value; innovative value and emotional value) explains the changes or
variation in customer satisfaction. With R2 .549 for the model, this means that the
independent variables (predictors) in the model (functional value; promotional value;
innovative value and emotional value) could offer about 54.9% explanation of variation
in customer satisfaction. Two factors (functional and innovative value) had a greater
impact on the services of cellular companies that leads to the customer satisfaction.
The study also reveals that, the operator’s network/signal coverage, pricing, offering,
fulfilment of customer demand and value added service such as M-pesa to society have
significant influence on customer satisfaction. Strong signal coverage is key
determinants of customer satisfaction; mobile telecommunication build upon a network
signal that convey voice call, voice SMS, internet service, information service among
others. Operators should be concerned with establishing a strong network signal for
promoting value added service which has great impact on client satisfaction.
It can be concluded that the respondents were satisfied with Safaricom services to a
great extent. Innovative value contributed the most level of satisfaction, followed by
functional value, promotional value and lastly emotional value. Therefore, if Safaricom
wants to increase the level of satisfaction, priority should be given to innovation,
45
followed by functional value then promotional and lastly emotional value. However
satisfaction can also be increased if emphasis are placed on improving promotional
value and emotional value.
5.4 Recommendations
From a managerial perspective, the results of the direct significant relationship between
the factors and customer satisfaction reinforce the need for Safaricom to prioritise the
delivery of quality, uninterrupted services to customers. At times, in the midst of much
competition for mobile subscribers, initiatives that achieve more immediate goals are
often prioritised. However, the result implies that a reliable, uninterrupted services
drives customer satisfaction, one of the ultimate goals of any service organisation.
Taken together, managers of Safaricom need to put measures in place to swiftly tackle
connectivity problems and to deliver quality, reliable services at reasonable prices
which are especially fair to consumers considering the level of services that are been
delivered. From this perspective, marketers in telecommunications network companies
should focus on observable benefits instead of the unnoticeable ones that lead to higher
customer satisfaction.
5.5 Limitations of Study
This study provided useful insight into factors that affect customer satisfaction of
Safaricom Cellular Mobile Network. However it is limited in scope in two ways: first
the study focused on the influence of four factors, namely, functional value,
promotional value, innovative value and emotional value on customer satisfaction.
Second it was done on Safaricom. The sample in this study decreases the
generalizability to the whole mobile cellular sector in Kenya.
Secondly, the use of the case study approach could limit the external validity of the
study, making the results unlikely to be generalizable to other firms within the same
industry.
46
5.6 Suggestion for Further Studies
Further researcher can be done using a survey to sample subscribers from across all
companies operating in the telecommunication industry.
Secondly, other studies should be done to determine other factors influencing customer
satisfaction other than innovative value, functional value, promotional value and
emotional value.
Lastly, related to the first suggestion, further attempts at validating the conceptual
model could be carried out in other services sectors of the Kenyan economy such as
banking and insurance, hotel and restaurant, and consulting services.
47
REFERENCES
Ali, J. F., Ali. I., Rehman, K., Yilmaz, A. K., Safwan, N., Afzal, H. 2010.
Determinants of consumer retention in cellular industry in Pakistan, African
Journal of Business Management 4(12): 2402–2408.
Ayesha Saeed, Nazia Hussain, Adnan Riaz (2011), “Factors Affecting Consumers’
Switching Intensions”, European Journal of social sciences, 19(1), 54-61.
Beerli, A., Martin, J. D. and Quintana, A.(2004). A model of customer loyalty in the
retail banking market, European Journal of Marketing, 38, 253-275.
Berman, B., and Evans, J.R. (2010). Retail Management, Prentice Hall, New Jersey,
NJ,
Bodil Arbin, Lars Holmberg and Caroline Jönsson (2006). Strategies in the Colombian
Telecommunication Market: Seen Through the Perspective of Porter. School of
Management, Blekinge Institute of Technology
Buchan, H. F. (2005), Ethical decision making in the public accounting profession: An
extension of Ajzen’s theory of planned behavior. Journal of Business Ethics,
61, 165–181.
CAK (2015) Quarterly sector statistics report third quarter of the financial Year
2014/15.
CAK (2015). Quarterly sector statistics report third quarter of the financial Year
2014/15.
CCK, (2016). First quarter sector statistics report for the financial year 2016/2017
(July September 2016). ww.ca.go.ke
Cherry, J. (2006), the impact of normative influence and locus of control on ethical
judgments and intentions: A cross-cultural comparison. Journal of Business
Ethics, 68, 113–132.
Chien, T, K. Chang, T. H., & Su, C. T. (2003). Did your efforts really win customers’
satisfaction?. Industrial Management and Data Systems, 103(4), 253-262.
Dotzel, T., Shankar, V., & Berry, L. L. 2013. Service innovativeness and firm value,
Journal of Marketing Research
Eshghi, A., Roy, S. K., and Ganguli, S. (2008). Service quality and customer
satisfaction: An empirical investigation in Indian mobile Telecommunications
services, Marketing Management Journal, 18 (2), 119-144.
Farris, P.W., Bendle, N.T., Pfeifer, P.E., & Reibstein, D.J. (2010). Marketing Metrics:
the definitive guide to measuring marketing performance.
Fishbein, M. and Ajzen, I., (1980). Understanding attitudes and predicting social
behaviour. Englewood Cliffs, NJ: Prentice-Hall.
Fornell, C. (1992). A national customer satisfaction barometer: the Swedish
experience, Journal of Marketing 56(1): 6–21.
48
Fornell, C., Johnson, M. D., Anderson, E .W., Cha, J. and Bryant, B. E. (1996). “The
American customer satisfaction index, nature, purpose and findings”, Journal
of Marketing, 60, 7-18
Fornell, C., Johnson, M. D., Anderson, E. W., Cha, J., and Everitt Bryant, B. (1996).
Growing the trust relationship [Electronic version]. Journal of Marketing,
60(4), 7-18.
Gim, G. (2014). Evaluating Factors Influencing Consumer Satisfaction towards
Online Shopping in Viet Nam. Journal of Emerging Trends in Computing and
Information Sciences, 5(1).
Jain S. K. and Gupta, G. (2015). Measuring Service Quality: SERVQUAL vs.
SERVPERF Scales, Analytical and case research Journal, 29(2), 25-37
Jamal, A. and Naser, K.(2002). Customer satisfaction and retail banking: an
assessment of some of the key antecedents of customer satisfaction in retail
banking. international journal of bank marketing, 20, 146-160.
Keller, K. L., Apéria, T., and Georgson, M. (2008). Strategic brand management: A
European perspective. Pearson Education.
Khan, S. and Afsheen, S. (2012). Determinants of Customer Satisfaction in Telecom
Industry A Study of Telecom industry Peshawar KPK Pakistan. Journal of
Basic and Applied Scientific Research, 2(12)12833-12840
Leelakulthanit, O. and Hongcharu, B. (2011). Factors that impact customer
satisfaction: evidence from the Thailand mobile cellular network industry.
International journal of management and marketing research, 4(2), 67-76
Liu, M., and Armitage, C. J. (200), Extending the theory of planned behavior: A review
and Avenues for further research. Journal of Applied Social Psychology, 28,
1429–1464
Mishra, R. K.; Kiranmai, J. (2009). E-banking: a case of India. ICFAI Journal of
Public Administration, 5(1), 55-65
Mohammed, H.I (2015). 7Ps marketing mix and retail bank customer satisfaction in
northeast Nigeria. British Journal of Marketing Studies, 3(3), 71-88.
Mwongoso., A.J., Kazungu, I., and Kiwia, R.H. (2015). Measuring service quality gap
in higher education using serviqual model at moshi University College of co-
operative and business studies (muccobs): implications for improvement.
International Journal of Economics, Commerce and Management, 3 (6).
Omwenga, P.M. (2016). An analysis of factors affecting customer satisfaction at
Safaricom outlets in Nairobi Central Business District.
Parasuraman, A., Zeithaml, V. A., and Berry, L. L. (1988). Servqual. Journal of
retailing, 64(1), 12-40.
Parasuraman, A., Zeithaml, V.A. and Berry, L.L. (1994).Moving forward in service
quality research: Measuring different customer-expectation levels, comparing
alternative scales, and examining the performance-behavioral intentions link.
Working Paper 94-114.
49
Popli, G. S. and Madan, Dr. Manish, Determinants of Customer Satisfaction in Telecom
Industry - A Study of Indian Telecom Industry (June 11, 2013).
Rahaman, M. M., Abdullah, M., and Rahman, A. (2011). Measuring service quality
using SERVQUAL model: A study on PCBs (Private Commercial Banks) in
Bangladesh. Business Management Dynamics, 1(1), 01-11.
Rahman M. A., Kalam A., Rahman M. M. and Abdullah M. (2012). The Influence of
Service Quality and Price on Customer Satisfaction: An Empirical Study on
Restaurant Services in Khulna Division, Industrial Engineering Letters. 2(2),
28-35.
Rahman, H. (2014). Factors affecting customer satisfaction in mobile
telecommunication industry in Bangladesh. Business, Management and
Education, 12(1): 74–93.
Safaricom, (2014), http://www.safaricom.co.ke/about-us/investors-reations/investor-
dashboard/investor-information/financial-results
Skordoulis, M., and Pekka-Economou, V. (2015). Analysis of the Factors Affecting
Customers' Satisfaction from the Greek Banks. International Scientific
Conference eRA – 10.
Vranakis, S., Chatzoglou, P. and Mpaloukas, A. (2012). Customer satisfaction of
Greek mobile phone services, International Journal of Managing Value and
Supply Chains 3(4): 43–54. http://dx.doi.org/10.5121/ijmvsc.2012.3404
Yu,C. J., Wu,L., Chiao,Y. and Tai, H. (2005). Perceived quality, customer
satisfaction, and customer loyalty: the case of Lexusin Taiwan. Total Quality
Management and Business Excellence,16 (6): 707 -719
Zeithaml, V. A., Bitner, M. J. & Gremler, D. D. (2009). Services marketing:
Integrating customer focus across the firm, 5th edition, New York: McGraw-
Hill
Zeithaml, V.A., Parasuraman, A. & Berry, L. (1990). Delivering Quality Service, The
Free Press, New York, N.Y
50
Appendices
Appendix I: Letter of Introduction
Dear Participant,
I invite you to participate in a research study entitled ‘Analysis of factors influencing
Customer Satisfaction with services offered by Safaricom mobile cellular network. I
am currently enrolled in the Master of Business Administration Degree at Strathmore
Business School and in the process of writing my Master’s Thesis.
The enclosed questionnaire has been designed to collect information on: Your level
of satisfaction with services offered by Safaricom mobile cellular network.
Your participation in this research project is completely voluntary. Your responses
will remain confidential and anonymous. The data collected from this survey will be
used for educational and research purpose only.
If you agree to participate in this project, please answer the questions on the
questionnaire as best you can. It should take approximately ten minutes (10) to
complete. If you have any questions about this project, feel free to inquire from me.
Thank you for your assistance in this important endeavour.
Sincerely yours,
Researcher
51
Appendix II: Questionnaire
This is a research aimed at understanding the factors influencing customer satisfaction
with mobile cellular network in Nairobi County. Please note that the information
provided shall be treated with utmost confidentiality and are for academic purposes
only. Your honest participation in this survey will be highly appreciated. Please answer
below by ticking (√) accordingly.
Section A. Respondent’s Details (Profile)
1. State your gender Male ( ) Female ( )
2. Number of years with the company
Below 5 years ( )
Between 5 to 10 years ( )
Between 10 to 15 years ( )
Between15 to 20 years ( )
Above 20 years ( )
3. State your highest level of education
Certificate /Diploma ( )
Bachelors ( )
Masters ( )
Doctoral ( )
Other (please specify) ……………………………………………….
4. What is your length of use of Safaricom services per day?
0-10 mins ( )
11-20 mins ( )
21-30 mins ( )
More than 30 mins ( )
Other (please specify) ……………………………………………….
Section B: Factors influencing customer satisfaction
5. Listed below are some statements regarding factors influencing customer
satisfaction with Safaricom products and services. Please indicate the extent to which
you agree with them by ticking (√) once.
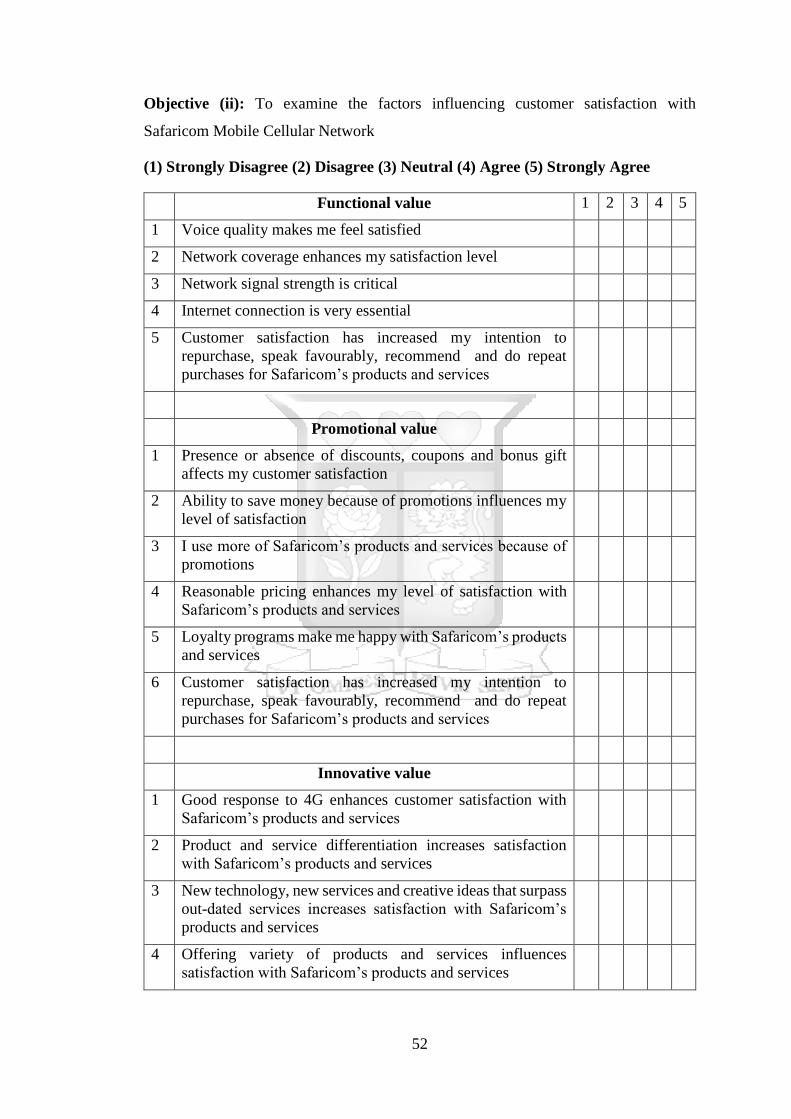
52
Objective (ii): To examine the factors influencing customer satisfaction with
Safaricom Mobile Cellular Network
(1) Strongly Disagree (2) Disagree (3) Neutral (4) Agree (5) Strongly Agree
Functional value 1 2 3 4 5
1 Voice quality makes me feel satisfied
2 Network coverage enhances my satisfaction level
3 Network signal strength is critical
4 Internet connection is very essential
5 Customer satisfaction has increased my intention to
repurchase, speak favourably, recommend and do repeat
purchases for Safaricom’s products and services
Promotional value
1 Presence or absence of discounts, coupons and bonus gift
affects my customer satisfaction
2 Ability to save money because of promotions influences my
level of satisfaction
3 I use more of Safaricom’s products and services because of
promotions
4 Reasonable pricing enhances my level of satisfaction with
Safaricom’s products and services
5 Loyalty programs make me happy with Safaricom’s products
and services
6 Customer satisfaction has increased my intention to
repurchase, speak favourably, recommend and do repeat
purchases for Safaricom’s products and services
Innovative value
1 Good response to 4G enhances customer satisfaction with
Safaricom’s products and services
2 Product and service differentiation increases satisfaction
with Safaricom’s products and services
3 New technology, new services and creative ideas that surpass
out-dated services increases satisfaction with Safaricom’s
products and services
4 Offering variety of products and services influences
satisfaction with Safaricom’s products and services
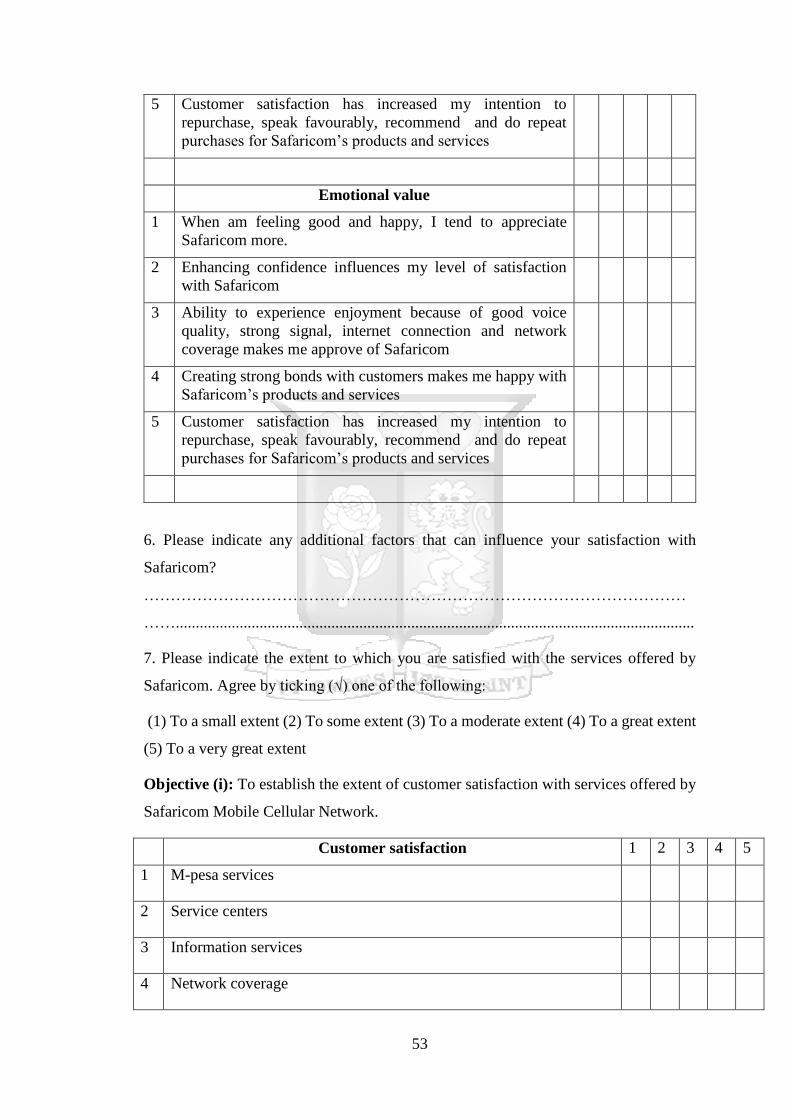
53
5 Customer satisfaction has increased my intention to
repurchase, speak favourably, recommend and do repeat
purchases for Safaricom’s products and services
Emotional value
1 When am feeling good and happy, I tend to appreciate
Safaricom more.
2 Enhancing confidence influences my level of satisfaction
with Safaricom
3 Ability to experience enjoyment because of good voice
quality, strong signal, internet connection and network
coverage makes me approve of Safaricom
4 Creating strong bonds with customers makes me happy with
Safaricom’s products and services
5 Customer satisfaction has increased my intention to
repurchase, speak favourably, recommend and do repeat
purchases for Safaricom’s products and services
6. Please indicate any additional factors that can influence your satisfaction with
Safaricom?
…………………………………………………………………………………………
……..................................................................................................................................
7. Please indicate the extent to which you are satisfied with the services offered by
Safaricom. Agree by ticking (√) one of the following:
(1) To a small extent (2) To some extent (3) To a moderate extent (4) To a great extent
(5) To a very great extent
Objective (i): To establish the extent of customer satisfaction with services offered by
Safaricom Mobile Cellular Network.
Customer satisfaction 1 2 3 4 5
1 M-pesa services
2 Service centers
3 Information services
4 Network coverage
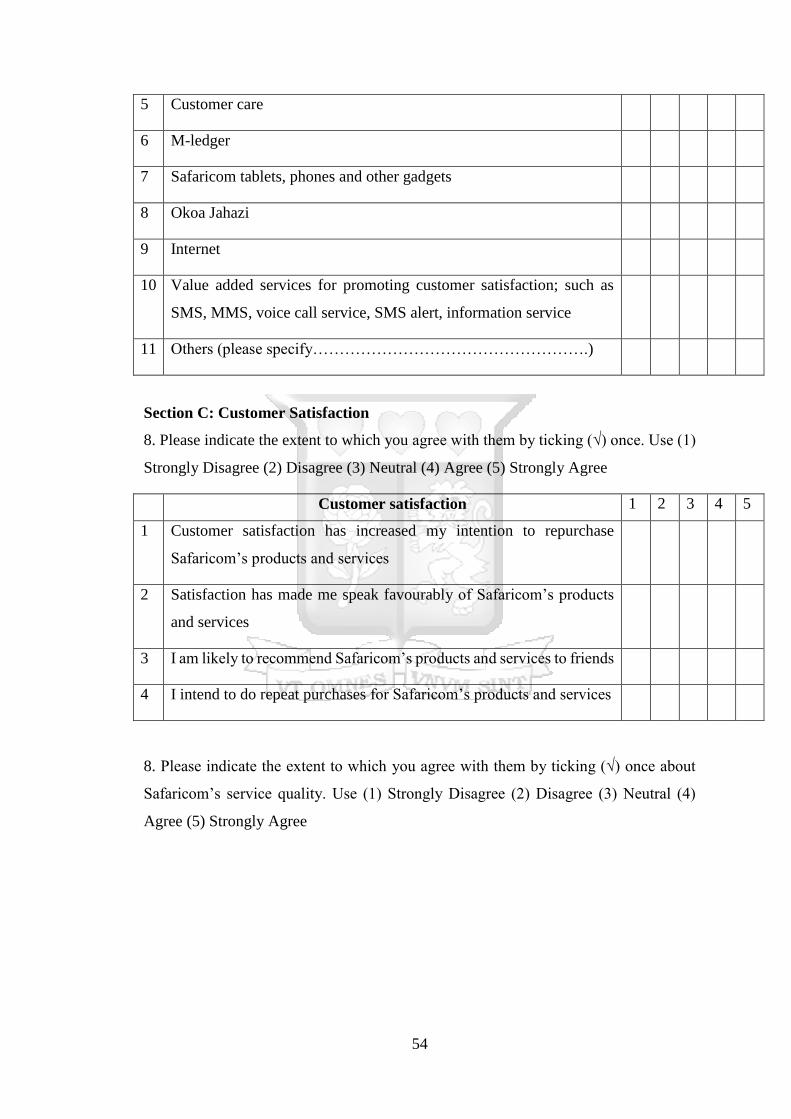
54
5 Customer care
6 M-ledger
7 Safaricom tablets, phones and other gadgets
8 Okoa Jahazi
9 Internet
10 Value added services for promoting customer satisfaction; such as
SMS, MMS, voice call service, SMS alert, information service
11 Others (please specify…………………………………………….)
Section C: Customer Satisfaction
8. Please indicate the extent to which you agree with them by ticking (√) once. Use (1)
Strongly Disagree (2) Disagree (3) Neutral (4) Agree (5) Strongly Agree
Customer satisfaction 1 2 3 4 5
1 Customer satisfaction has increased my intention to repurchase
Safaricom’s products and services
2 Satisfaction has made me speak favourably of Safaricom’s products
and services
3 I am likely to recommend Safaricom’s products and services to friends
4 I intend to do repeat purchases for Safaricom’s products and services
8. Please indicate the extent to which you agree with them by ticking (√) once about
Safaricom’s service quality. Use (1) Strongly Disagree (2) Disagree (3) Neutral (4)
Agree (5) Strongly Agree


