Embed Size (px)
Citation preview

Factors Influencing TV Home Shoppers’Intention to Repurchase
Bordin Phayaphrom
August 2016 ► No. 1
The GNU Working Paper Series is published electronically by the Research Office of GlobalNxt University. © Copyright is held by the author(s) of each working paper. Its content may not be republished, copied or hosted on any server without written permission from [email protected]

Phayaphrom: Factors Influencing TV Home Shoppers GNU Working Paper No. 1
1
Factors Influencing TV Home Shoppers’ Intention to Repurchase
Bordin Phayaphrom School of Business, GlobalNxt University, Malaysia
(ORCID: http://orcid.org/0000-0003-3829-924X)
ABSTRACT
As part of the digital economy, TV shopping business in Thailand recently became an eye-catching business for both local and international investor. This research aimed to investigate the factors influencing TV home shoppers’ intentions to repurchase. This online survey was based on a convenient sampling method from customers of Jewelry Channel, the TV home shopping in Thailand, to determine the influence of factors, such as perceived product quality, perceived social value, perceived trust and satisfactory prior experience for intentions to repurchase. 394 sets of completed questionnaires were collected and analyzed. Multiple regression analysis was used to test the research hypotheses. The results showed that perceived product quality, perceived trust and satisfactory of prior experience positively influence the consumers’ intention to repurchase, whereas the perceived social value did not predict the intention to repurchase. It was noted that the perceived product quality and satisfactory of prior experience are the better predictor than perceived trust. The researcher recommended TV shopping company to focus more on product quality and customer experience management to increase the level of intention to repurchase. The future research should include the potential customers yet to make a purchase through TV shopping.
Keywords: TV home shopping, intention to repurchase, consumer behavior
1. Introduction
Background of the Study Home shopping a decade ago involved mainly catalogue sales by sending printed materials to customers directly from the company. The customers then considered the merchandise, the price and promotional details in a printed format and placed an order with the company via telephone, fax or mail. The transaction and logistics between customer and company would then be processed. Recently, the advancement of telecommunications via television has become popular through the revolution of television transmission from analogue broadcasting to digital satellites and TV cable networks. In many countries, satellite TV has been licensed for enterprise to have a private television station. It is estimated that 70% of Thai households watch television programmes from a satellite television network (Saengwit, 2015).

Phayaphrom: Factors Influencing TV Home Shoppers GNU Working Paper No. 1
2
With the rapid change in broadcasting technology, more accessibility for viewers to television and the declining tradition of home shopping due to the cost of printed material and advertising, the term “home shopping” today usually refers only to shopping from television shopping ("Research and Markets; China TV Shopping Industry Report, Sales Up to RMB17.85 Billion in 2011," 2012). To support the TV home shopping business, most of the TV home shopping companies still retains other traditional distribution channels. For example, GS Home Shopping, one of the largest TV home shopping operators in Korea, declared itself as a non-store retailer with business involved in four reportable segments namely, TV home shopping, Internet shopping, catalogue business and others. However, GS Home Shopping reported that 69.3% of the revenue comes from its TV home shopping channel (GS Home Shopping Inc. - Company Capsule, 2014). TV Direct in Thailand is also operating several distribution channel strategies, such as TV marketing, direct marketing through an outbound call centre, catalogues, electronic commerce, direct selling and store retail outlets, but over 70% of sales still comes from the TV home shopping channel (TV Direct Annual Report 2014, 2014). As a main distribution channel, the TV home shopping company usually operates its business by investing directly into the television station operation; this will lower media costs when compared to buying media and show time as an advertisement from other TV stations. The more they can be reached through media coverage, the more likely they are able to expand their market coverage. This also helps minimise the risk of advertising expense rising ("Research and Markets; China TV Shopping Industry Report, Sales Up to RMB17.85 Billion in 2011," 2012). TV home shopping in Thailand has been recorded since 1999 when TV Direct Plc., the largest TV home shopping company, started its operation as the pioneer firm doing TV home shopping in Thailand (TVD annual report, 2013). The market has been dramatically grown to market size value of around 140 million USD per annum, in 2014. According to Dasree and Panyapirom (2015), the market value of TV home shopping is expected to end up with 222 million USD in 2015 to 266 million USD in 2016 and 2.16 billion USD by 2017. The jump step of the growing market value is forecast based on the increase of new entrants to the market from foreign countries, such as the O Shopping Channel (CJ O shopping-South Korea), True Select Channel (GS Shop-South Korea), High Shopping (Joint Venture with Thaicom Satellite and Hmall Shop from South Korea) and Shop Channel (Shop Global - the largest TV home shopping in Japan). Moreover, there are several local and large corporations aggressively entering the market. Most of the product categories sold on TV home shopping are intimate ware, health and exercise products, food supplements, household electronic devices, kitchenware, fashion, Jewelry and accessories. The research in this study investigated the influence of perceived product quality, perceived social value and perceived trust, as well as satisfactory prior experience of customers’ intention to repurchase, by using the respondents’ data from the Jewelry Channel, a TV home shopping company in Thailand. The Jewelry Channel is a satellite TV home shopping channel. Established in 2008, it has served over 250,000 customers and broadcast to around 10 million Thai households via Thaicom Satellite. The company is the only shopping television in Thailand that focuses on its position as a gem and Jewelry expert. Most of the executives and show hosts have graduated as gemologists. The company has its own Jewelry manufacturing facilities, a sophisticated call centre and ERP systems. The

Phayaphrom: Factors Influencing TV Home Shoppers GNU Working Paper No. 1
3
company has subsidiaries in Australia and France and is eager to move forward to the AEC market. Statement of the Problem In order to protect loyal customers from switching brands and driving the key strategies in focusing on customer retention, loyalty and lifetime customer values, it is necessary to understand the factors influencing their intention to repurchase for future strategy planning. Research Question Do perceived product quality, perceived social values, perceived trust and satisfactory prior experience positively influence TV home shoppers’ intentions to repurchase? Research Objectives The research aimed to examine whether the factors, perceived product quality, perceived social values, perceived trust and satisfactory prior experience influence TV home shoppers’ intentions to repurchase. Significance of the Research The information from the research was used to identify the priority of current issues to understand the customers’ intentions to repurchase on the Jewelry Channel Co., ltd. and other TV home shopping companies’ strategic planning. 2. Literature Review Intention to Repurchase Intention to repurchase has been defined for e-commerce business literature as the situation which manifests itself when a consumer is willing and intends to become involved in online purchase intention (Yu-Hui, Chao-Min, & Eric, 2011). The classical explanation of customer purchase decision-making is based on the continuum of routine problem-solving behaviour that a particular consumer has decided. The conclusion to explain consumers will come from extensive problem-solving behaviours (Schiffman, 1972). The original framework to analyse consumer purchase behaviour is based on a “buyer decision process” which is a five-step model, which explains that consumers are first coming from a state of felt deprivation or problem recognition to the search for information on problem solutions. The information gathered provided the basis for the evaluation of alternatives. The development and comparison of purchasing evaluation criteria creates an actual purchase decision. Finally, post-purchase behaviour is critical in the marketing perspective, as it eventually affects customers’ perceptions of satisfaction/dissatisfaction with the product/service (Schiffman, 1972). With the traditional measurement to explain consumer purchase behaviour, it is an essential measurement under most contexts to explain the consumer decision process. However, in terms of virtual marketing, the decision making to purchase may be different. There

Phayaphrom: Factors Influencing TV Home Shoppers GNU Working Paper No. 1
4
are a limited number of prior research studies regarding TV home shoppers’ behaviour. Customers who purchase products through TV shopping and Internet shopping do not get to touch the product before making any purchase. Therefore, it can be assumed that customer perceptions of TV shopping and Internet shopping are similar. Physical shopping and Internet shopping are different in some aspects. For physical shopping, consumers can physically look at, touch and have a direct feeling about the product. They can judge a product’s quality based on their visual experience or handling to product, including obtaining advice from the seller. The consumer may form an intention to purchase online based on factors such as money, price and benefit (Kotler & Armstrong, 2010). Researchers and marketers try to recognise the importance of consumers’ perceptions through value, intention to purchase online, actual purchasing and brand perceptions. Perceived Product Quality Product and service are the core values delivered to customers. The product quality can be defined by three dimensions (e.g. objective quality, subjective quality and external quality). Performance, features, reliability, durability, workmanship, responsiveness and overall quality can measure objective quality. Subjective quality can be measured by image, ergonomics, distinctiveness, ease of use, prestige, exclusiveness, stylish design and objective quality are indicated by price, brand and country of quality (Molina-Castillo, Calantone, Stanko, & Munuera-Aleman, 2013). Previous research studied the influence of product design experience to customer satisfaction. An Sheng (2010) conducted a survey in furniture product design to predict consumer satisfaction in Taiwan. The results showed that the features of furniture product designs positively influence consumer satisfaction. However, Warren (2011), conducted a survey to understand the impact of core product quality on customer satisfaction in NCAA Division I-FCS football games and men’s basketball games. The questionnaire was constructed around core product quality perceptions, team identification and service quality perceptions. The findings identified that core product quality does not have a strong impact on customer satisfaction but team identification on sport products was only the impact of customer satisfaction. Redefining the model has been suggested for future research. Perceived Social Value There are several research studies using different words to describe social benefit gains from brands or products. Some use social image, while others use social influence, social benefit or social value. Lassar, Mittal, and Sharma (1995) described social image as “the consumer’s perception of the esteem in which the consumer’s social group holds the brand. It includes the attributions a consumer makes and a consumer thinks that others make to the typical user of the brand”. In luxury brands, the luxury goods consumption is likely to have a strong social function. Therefore, the social dimension would mean the perceived utility individuals gain from products or services consumption which is recognised within their own social group(s), such as conspicuousness and privileged value, which may obviously affect the evaluation and the propensity to purchase or consume luxury brands (Bearden & Etzel, 1982; Brinberg & Plimpton, 1986); Vigneron and Johnson (2004).

Phayaphrom: Factors Influencing TV Home Shoppers GNU Working Paper No. 1
5
Perceived Trust TV home shopping shares a high market value proportion. However, the study concluded that TV shoppers’ behaviour seems to be neglected amongst marketing researchers (Chen & Tsai, 2008). TV home shoppers have many reasons to buy from TV home shopping. For example, with senior citizens, loneliness and convenience are the major factors influencing TV home shopping towards behaviour. In the study of Lim and Kim (2011), the lack of shopping mobility from health conditions, loneliness, parasocial interaction and convenience have a positive influence on TV home shopping satisfaction in the older generation. It also found that, the interaction with TV hosts fulfilled their feeling of loneliness and parasocial interaction, whereas in other research, the factor of parasocial interaction does not support this result among young consumers. It is recommend that to enhance the consumer experience the company may allow consumers participating with trust in TV Shopping and a show host as a strategy as well. Furthermore, a show host’s characteristics and presentation technique would bring a closer feeling and trust to the home audience (Lystig Fritchie & Johnson, 2003). In a TV home shopping programme, the product display, camera angle and the studio interior decoration will offer comfort for the audience’s feelings, encouraging them to be more relaxed and closer to the hosts. There are several techniques that a show host can use to promote the feeling of participation to share common environment and emotions, such as the mother’s role by talking about families. The show guests like product testimonials and celebrity endorsement in products also improves trust and consumer experience (Giles, 2002). This was confirmed by the survey research which later found that the TV shoppers’ purchase intention had a relationship with programme content trustfulness, celebrity endorsement and promotion (Jongjit, 2015). Major TV home shopping in the USA also utilise their celebrities in endorsement of the products via social media attached with a product image and activities of the company. This helps enhance TV home shopping brand’s image, trustfulness and sense of entertainment (Hargreaves, 2013). Satisfactory Prior Experience There are several other researches that indicated that customer experience in interaction with product, sales promotion, visualise display and showcase at point of sales design and decoration, as well as customer service and supply chain, play an important role in influencing customer satisfaction, which leads to customer behaviour like intention to purchase, loyalty and word of mouth. In other research, factors such as product quality, price, consistency of products and photos and speed of delivery were identified as customer satisfaction also has an impact on loyalty, which leads to word of mouth, repurchase intention and membership application in Taiwan (Lin, 2013). Prior experiences strongly affect future behaviour. In ecommerce’s customer studies, customers associate their online shopping experiences with perceptions of product information, payment methods, delivery efficiency, service offered, perceived risk, privacy, security, personalisation, visualisation, exploration and entertainment (Burke, 2002; Ling, Chai, & Piew, 2010)

Phayaphrom: Factors Influencing TV Home Shoppers GNU Working Paper No. 1
6
Conceptual Framework The conceptual framework was based on the previous research. According to the previous research, four constructs are expected to influence behavioural intention to repurchase which include perceived product quality, perceived social value, perceived trust and satisfactory prior experience. Figure 1 presents the conceptual framework.
Figure 1: The Conceptual Framework
Research Hypotheses H1: Perceived product quality has a positive influence on intention to repurchase. H2: Perceived social value has a positive influence on intention to repurchase. H3: Perceived trust has a positive influence on intention to repurchase. H4: Satisfactory prior experience has a positive influence on intention to repurchase. Concept and Operationalisation of Variables The questionnaire was divided into four constructs: perceived product quality, perceived social value, perceived trust and satisfactory prior experience. The variable constructs will be adopted from the relevant previous researches as shown in Table 1.
Perceived Product Quality
Perceived Social Value
Perceived Trust
Satisfactory Prior Experience
Intention to repurchase

Phayaphrom: Factors Influencing TV Home Shoppers GNU Working Paper No. 1
7
Table 1: Construct Concept and Variable Value
Items Description Source: Customised from
1 The Jewelry Channel offers very good quality products.
(Pappu, Quester, & Cooksey, 2006)
2 Jewelry from the Jewelry Channel is good value for money.
(Pappu et al., 2006)
3 Jewelry from the Jewelry Channel offers consistent craftsmanship quality.
(Pappu et al., 2006)
4 Jewelry from the Jewelry Channel would help me to feel accepted.
(Sweeney & Soutar, 2001)
5 Jewelry from the Jewelry Channel would help me make a good impression on others.
(Sweeney & Soutar, 2001)
6 Jewelry from the Jewelry Channel would give its owner social approval.
(Sweeney & Soutar, 2001)
7 The Jewelry Channel is an expert in the Jewelry field.
(Abbes & Goudey, 2015)
8 The show hosts are professional. (Abbes & Goudey, 2015)
9 I think that the show on the Jewelry Channel gives me enough useful information.
(Abbes & Goudey, 2015)
10 When I consider my experience with the Jewelry Channel, I am satisfied overall.
(Abbes & Goudey, 2015)
11 When I receive my Jewelry bought from the Jewelry Channel, I am often satisfied.
(Abbes & Goudey, 2015)
12 The experience of my friends and family at the Jewelry Channel has been satisfactory.
(Abbes & Goudey, 2015)
13 I will definitely buy Jewelry from the Jewelry Channel again in the near future.
(Jamaludin & Ahmad, 2013)
14 The next time I purchase Jewelry from TV home shopping, I will buy from the Jewelry Channel.
(Liu, 2012)
15 I would be very likely to increase my shopping activity with the Jewelry Channel.
(Liu, 2012)

Phayaphrom: Factors Influencing TV Home Shoppers GNU Working Paper No. 1
8
3. Research Methodology Research Design This survey research used convenient sampling methods among the Jewelry Channel’s customers to determine how the constructed factors influence TV home shoppers with the intention to repurchase. Causal research is a way of seeing how actions now will affect the future with a specific variable on another variable. Target Population The population of active customers in the Jewelry Channel Co., Ltd, which is internally defined as the customer who has previously purchased at least once in the past 3 months, were used for sampling. From company records, during the period of 1st September 2015 to 20th November 2015, there were 13,290 active customers. Sample Size There are several methods that have been used in determining the sample size, such as using a census for small population, a sample size of a similar study and a published table or using formulas to calculate a sample size (Israel, 1992). According to Krejcie and Morgan (1970) the sample size with a known population can be calculated using a following formula:
n = X2 * N * P* (1 – P)________ (ME2 * (N – 1)) + (X * P * (1 – P))
n = Sample Size N = Population Size X2 = Chi-square for the specified confidence level at 1 degree of freedom P = Population proportion ME2 = Desire Margin of Error (express as a proportion) Thus, the information given regards the populations and criteria. N = 3.841* 13,290 * 0.5 (1- 0.5)______ (0.0025 * (13,290 -1))+ (3.841 * 0.5 (1- 0.5)) n = 12,761.722 34.182 n = 373.346 Therefore, with a calculation from formula above, the suitable sample size will be not less than 374 from a known population of 13,290. The survey was conducted through an online survey and filtered for the completed 394 questionnaires.
Phayaphrom: Factors Influencing TV Home Shoppers GNU Working Paper No. 1
9
Research Instrument The five-point Likert’s Scale questionnaire was developed based on the relevant previous researches; the pilot test was conducted using a sample of 37 customers for validity and reliability before sending to all respondents. The research instrument was in English and so was translated back into Thai in order to support respondents not familiar with the English language. The questionnaire was divided into two parts, which included demographics of the respondents and questions according to the variable constructs. The first part was questions about the demographics of the respondents. This part consisted of questions related to gender, age range, income level and educational level. The second part included questions that were related to the variable constructs, such as perceived product quality, perceived social value, perceived trust and satisfactory prior experience. The questionnaire in this part used the five points as that of the Likert scale format. The five-point Likert scale is ranked accordingly:
1 = strongly disagree 2 = disagree 3 = neither agree nor disagree 4 = agree 5 = strongly agree
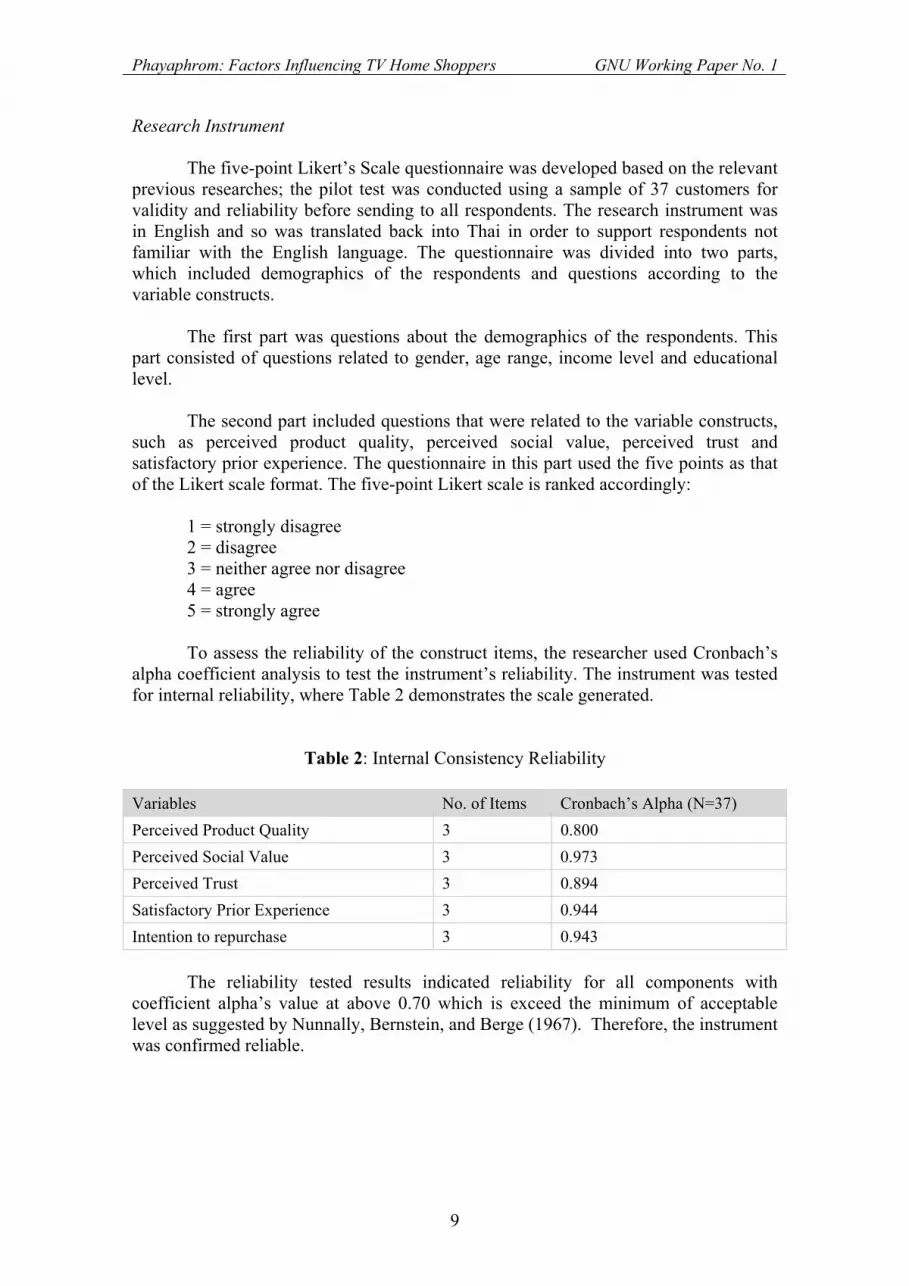
To assess the reliability of the construct items, the researcher used Cronbach’s
alpha coefficient analysis to test the instrument’s reliability. The instrument was tested for internal reliability, where Table 2 demonstrates the scale generated.
Table 2: Internal Consistency Reliability Variables No. of Items Cronbach’s Alpha (N=37)
Perceived Product Quality 3 0.800
Perceived Social Value 3 0.973
Perceived Trust 3 0.894
Satisfactory Prior Experience 3 0.944
Intention to repurchase 3 0.943
The reliability tested results indicated reliability for all components with coefficient alpha’s value at above 0.70 which is exceed the minimum of acceptable level as suggested by Nunnally, Bernstein, and Berge (1967). Therefore, the instrument was confirmed reliable.

Phayaphrom: Factors Influencing TV Home Shoppers GNU Working Paper No. 1
10
Data Collection The data collection was conducted through an online survey; each customer received the survey questionnaire URL link through the company’s official LINE application. In order to motivate respondents to participate this survey, the Jewelry Channel gave a discount voucher valued at 500 baht (~15 USD) upon completion of the online survey for the next purchase. Data Processing and Analysis The data processing and analysis was processed with SPSS version 21 for Macintosh for the required data model, testing and multiple regression analysis. 4. Data Analysis and Results The data processing and analysis were conducted through the multiple regression analysis method in the Statistical Package of Social Sciences (SPSS) version 21 for Mac. The survey conducted online and there were 471 respondents in total. However, the researcher filtered out only the completed surveys. As a result, only 394 completed questionnaires were taken into accountability. Descriptive Statistics Gender Among the 394 completed questionnaires, there were 350 female respondents and 44 male respondents.
Table 3: Descriptive Statistics for Gender Measures Items Frequency Percentage (%)
Gender Male 44 11.17
Female 350 88.83
Total 394 100
Age Table 4 indicates the distribution of the age of this study focused on a range from 40-49 years old, which makes up 35.28%, whereas the age range between 50-59 years old contributed 30.46%. By combining these two groups, it shows that over 66% of respondents are in the age range of around 40-59 years old.

Phayaphrom: Factors Influencing TV Home Shoppers GNU Working Paper No. 1
11
Table 4: Descriptive Statistics for Age Measures Items Frequency Percentage (%)
Age <18 1 0.25
18-20 3 0.76
21-29 15 3.81
30-39 69 17.51
40-49 139 35.28
50-59 120 30.46
60-69 44 11.17
>70 3 0.76
Total 394 100
Educational Background The result revealed that a large proportion of TV shoppers had an educational level equal to or higher than bachelor’s level, which accounted for approximately 65.23%. Only 4.06% of participants had a primary school education level or below. It was found that 30.71% of participants had graduated high school or higher diploma education.
Table 5: Descriptive Statistics for Educational Background Measures Items Frequency Percentage (%)
Educational Background
Uneducated from Normal School System
1 0.25
Primary School 15 3.81
High School 70 17.77
Higher Diploma or Equivalent
51 12.94
Bachelor’s Degree or Equivalent
214 54.31
Master’s Degree or Equivalent
39 9.90
Above Master’s Degree 4 1.02
Occupation The results shown in the Table 6 indicate a good coverage of various occupations and source of income, suggesting the major online buying forces and TV shoppers are government officers (26.14%) and business entrepreneurs account for over 62.18%, with 15.23% working as an employee in the private sector.

Phayaphrom: Factors Influencing TV Home Shoppers GNU Working Paper No. 1
12
Table 6: Descriptive Statistics for Occupation
Measures Items Frequency Percentage (%)
Occupation Government officer 103 26.14
Private Company Employee 60 15.23
Business Entrepreneur 142 36.04
Self Employed 44 11.17
Retired 42 10.66
Unemployed 3 0.76
Total 394 100 Monthly Income For income levels, the majority of respondents had an income above 20,001 baht per month, which is considered as a middle-income to higher income group and accounted for 67%, while 42.14% of respondents had an income higher than 40,001 baht. The higher income group who earned over 100,000 baht per month was only 3.81%. Table 7 shows the descriptive statistics for monthly income.
Table 7: Descriptive Statistics for Monthly Income
Measures Items Frequency Percentage (%)
Monthly Income < 10,000 Baht 23 5.84
10,000-15,000 55 13.96
15,001-20,000 52 13.20
20,001-30,000 75 19.04
30,001-40,000 63 15.99
40,001-50,000 62 15.74
50,001-80,000 41 10.41
80,001-100,000 8 2.03
100,000 -150,000 7 1.78
> 150,000 8 2.03
Quoted in Thai baht; ~36 THB: 1 USD. ("Foreign Exchange Rates as of 25 December 2015," 2015) Perceived Product Quality Descriptive statistical mean score of all items in perceived product quality were rated at the agreed level.

Phayaphrom: Factors Influencing TV Home Shoppers GNU Working Paper No. 1
13
Table 8: Descriptive Statistics of items in Perceived Product Quality (N=394) Minimum Maximum Mean Std.
Deviation Interpretation
The Jewelry Channel offers very good quality products.
2.00 5.00 4.5990 .55405 Agree
Jewelry from the Jewelry Channel is good value for the money.
2.00 5.00 4.5584 .63237 Agree
Jewelry from the Jewelry Channel offers consistent craftsmanship quality.
2.00 5.00 4.6244 .61036 Agree
Perceived Social Value Descriptive statistical mean score of all items in perceived social value were rated at the agreed level.
Table 9: Descriptive Statistics of items in Perceived Social Value (N=394) Minimum Maximum Mean Std.
Deviation Interpretation
Jewelry from the Jewelry Channel would help me to feel accepted.
2.00 5.00 4.4340 .69309 Agree
Jewelry from the Jewelry Channel would make a good impression on others.
2.00 5.00 4.5000 .66252 Agree
Jewelry from the Jewelry Channel would give its owner social approval.
2.00 5.00 4.4467 .69418 Agree
Perceived Trust Descriptive statistical mean score of all items in perceived trust were rated at the agreed level.

Phayaphrom: Factors Influencing TV Home Shoppers GNU Working Paper No. 1
14
Table 10: Descriptive Statistics of items in Perceived Trust (N=394) Minimum Maximum Mean Std.
Deviation Interpretation
The Jewelry Channel is an expert in the Jewelry market.
3.00 5.00 4.7817 .47112 Agree
The show’s hosts are professional.
2.00 5.00 4.6142 .61648 Agree
I think that the shows on the Jewelry Channel give me enough useful information.
2.00 5.00 4.7817 .46569 Agree
Satisfactory Prior Experience Descriptive statistical mean score of all items in satisfactory prior experience were rated at the agreed level.
Table 11: Descriptive Statistics of items in Satisfactory Prior Experience (N=394) Minimum Maximum Mean Std.
Deviation Interpretation
When I consider my experience with the Jewelry Channel, I am satisfied overall.
2.00 5.00 4.6168 .55517 Agree
When I receive the Jewelry bought from the Jewelry Channel, I am often satisfied.
2.00 5.00 4.5711 .59794 Agree
The experiences of my friends and family at the Jewelry Channel have been satisfactory.
2.00 5.00 4.3756 .69239 Agree
Multiple Regression Analysis and Hypotheses Testing Before the multiple regression analysis deployment, six conditions were checked, including: 1. normality; 2. linearity; 3. independence of error term; 4. free from multicollinearity; 5. free from heteroscedasicity; and 6. free from outlier and influential observations (Field, 2009). According to the normally distributed histogram received from SPSS analyses, the distributions of residuals are normal. The scatter plot diagram showed that both linearity and free from heteroscedasicity are accepted as the overall residuals appeared to be randomly scattered with no systematic pattern. The independence of error term also acceptable because the Durbin-Watson was at 2.091, which was close to 2, as explained by Field (2009), who suggested that the closer of

Phayaphrom: Factors Influencing TV Home Shoppers GNU Working Paper No. 1
15
value to 2, the better of the independence of error. From the multicollinearity statistics generated from SPSS, it appeared that the Variance Inflation Factor (VIF) fell between 1-10 and all of tolerance statistics were above 0.2. When considering the correlation between variables, Pearson’s Correlation value showed (Table 12) that there was no correlation value between any independent variables exceeding 0.7, which is considered as a strong relationship. Hence, the model is free from multicollinearity. The normal q-q plot analysis showed that the data model was free from outlier and influential observations as can been seen in a straight line and the spread of the residual were uniformed.
Table 12: Pearson’s Correlation between Independent Variables Perceived
Product Quality Perceived Social Value
Perceived Trust
Satisfactory Prior Experience
Perceived Product Quality
1.000 .642 .658 .700
Perceived Social Value
.642 1.000 .599 .681
Perceived Trust .658 .599 1.000 .677
Satisfactory Prior Experience
.700 .681 .677 1.000
From the coefficients in Table 13, for the perceived product quality, perceived
trust and satisfactory prior experience had significant values of 0.000, 0.011, and 0.000 respectively. The above significant value is below 0.05, which means that perceived product quality, perceived trust and satisfactory prior experience were significantly effective towards intention to repurchase, whereas, perceived social value’s significant value is above 0.05 at 0.307, which means that the perceived social value does not positively signify influence intention to repurchase.
Table 13: Coefficients Results Model Unstandardised
Coefficients Standardised Coefficients
t Sig. Collinearity Statistics
B Std. Error Beta Tolerance VIF
(Constant)
.367 .214 1.717
Perceived Product Quality
.270 .055 .251 4.935 .000 .420 2.384
Perceived Product Quality
.043 .042 .049 1.024 .307 .470 2.130
Perceived Trust .166 .065 .123 2.549 .011 .463 2.161
Satisfactory Prior Experience
.448 .056 .428 7.988 .000 .377 2.655

Phayaphrom: Factors Influencing TV Home Shoppers GNU Working Paper No. 1
16
5. Conclusions and Recommendations
The study of Factors influencing TV Home Shoppers intentions to repurchase used a survey questionnaire as an instrument. Convenient sampling of the responses from active customers of the Jewelry Channel was used and included those who had purchased at least once during the period of 1st September 2015 to 20th November 2015. Researchers used an online survey method that accounted for 394 completed surveys, which was then processed as data. Summary of Research Findings With 394 completed and valid sets of online questionnaires, the findings were presented as follows:
Summary of Frequency Analysis Frequency analysis for this research consisted of gender, age range, income level, occupation and level of education. Most of the respondents were females, aged between 40-59 years old. This analysis was not surprising, as most of the Jewelry designs sold on the Jewelry Channel were those of a ladies’ style. This could be a reason why more females qualified for the survey than males. Furthermore, as more female than male participants took part in this survey, this could indicate that the study reveals more of the behaviour and opinions of female TV shoppers than male TV shoppers. However, this study did not aim to focus on the gender differences in terms of intention to repurchase through TV shopping platforms, but instead focused on the overall buying behaviour of TV shoppers. It is to be remarked that this survey used a random sampling method to select the sample regardless of participants’ gender. Regarding the income of the respondents most earned higher than 40,000 baht/month and had an educational background of a bachelor’s degree or above. However, it should be noted that this survey method used an online survey. This may not be so convenient for older customers who are not familiar with online survey technology or are unable to gain access to the Internet. Summary of Mean and Standard Deviation This part summarises that the average mean score of main variables in this research study, which consist of perceived product quality, perceived social value, perceived trust and satisfactory prior experience.
Table 14: Summary of Mean and Standard Deviation for Independent Variable
Mean Std. Deviation N Interpretation
Perceived Product Quality 4.5939 .51914 394 Agree
Perceived Social Value 4.4602 .63737 394 Agree
Perceived Trust 4.7259 .41514 394 Agree
Satisfactory Prior Experience 4.5212 .53567 394 Agree

Phayaphrom: Factors Influencing TV Home Shoppers GNU Working Paper No. 1
17
The results of the mean scores in Table 14 show that perceived product quality, perceived social value, perceived trust and satisfactory prior experience are rated at the agreed level. Hypotheses Testing According to the summary of four hypotheses and outcomes in Table 15, it found that H1, H3 and H4 supported the research results which are: 1. Perceived Social Value has a positive influence on Intention to Repurchase; 2. Perceived Trust has a positive influence on Intention to Repurchase; and 3. Satisfactory Prior Experience has a positive influence on Intention to Repurchase. However, the research also found that Perceived Social Value does not have a positive influence on Intention to Repurchase.
Table 15: Summary of four hypotheses and outcomes Independent Variables Tested Hypotheses Outcomes
Perceived Product Quality H1: Perceived Product Quality has a positive influence on Intention to Repurchase.
Supported
Perceived Social Value H2: Perceived Social Value has a positive influence on Intention to Repurchase.
Not Supported
Perceived Trust H3: Perceived Trust has a positive influence on Intention to Repurchase.
Supported
Satisfactory Prior Experience H4: Satisfactory Prior Experience has a positive influence on Intention to Repurchase.
Supported
Answers to the Research Questions The research questions were answered based on the results of research findings as follows: Do perceived product quality, perceived social value, perceived trust, and satisfactory prior experience positively influence TV home shoppers’ intention to repurchase? Yes, perceived product quality, perceived trust and satisfactory prior experience influence TV home shoppers’ intention to repurchase. However, the perceived social value does not positively influence TV home shoppers’ intention to repurchase.

Phayaphrom: Factors Influencing TV Home Shoppers GNU Working Paper No. 1
18
Discussions and Recommendations Frequency Analysis The research identified perceived product quality, perceived social value, perceived trust and satisfactory prior experience as independent variables. The general demographic of the respondents was mostly women age 40-59 years old. Most of the respondents had an income above 20,000 baht and 42.14% of total respondents had an income higher than 40,000 baht and worked as a government officer or business entrepreneur. The majority of the respondents also had an education of a bachelor’s degree or above. This, in part, is due to the fact that the majority of customers of the Jewelry Channel were women and Jewelry is considered as a luxury product. Therefore, most customers could have earned more than 40,000 baht per month in order to afford it. Using Jewelry or luxury products generally helps the owners get social approval and become accepted. Considering women, who earn a high income and are aged 40-59 years old, working in government organisation or a business entrepreneur, perhaps they are upper class or higher rank in the organisation. The Jewelry Channel may use this information for future product designs to serve that group of customers. Perceived Product Quality The results of the multiple regression analysis found that the significant value of the perceived product quality (sig = 0.00) is less than the alpha value of 0.05. Hence, it can be concluded that the perceived product quality is positively influencing the intention to repurchase. This result was like this maybe because all of the respondents were active customers who had the impression that the Jewelry products of the Jewelry Channel were of quality due to previous purchase(s). In order to gain the customer loyalty, the Jewelry Channel should be more focused on product quality reputation, which includes the durability and design, as well as value chain and supply chain, which will lead to customer satisfaction on product quality. Perceived Social Value The significant value of perceived social value (sig = 0.307) is above the alpha value of 0.05. Therefore, it indicated that the perceived social value does not positively influence the intention to repurchase. This might be because of Jewelry products sold on the Jewelry Channel are generally considered luxury products where the product value is not attached to the brand, but value for money of the merchandise. In particular, Jewelry often differs from other luxury products like bags, watches, mobile phones, cars or clothes where the logo or design of product can obviously be seen to identify and enhance the brand name value. Therefore, using Jewelry from the Jewelry Channel brand might not be easily distinguished from wearing Jewelry from other Jewelry brands. In order to gain the perceive social value, the Jewelry Channel should be more focused on brand equity component, as well as showing the advertising with special collections to gain a better brand image and brand awareness. Perceived Trust It is postulated that perceived trust positively influences the intention to repurchase because the significant value is less than 0.05 (sig = 0.011). This result

Phayaphrom: Factors Influencing TV Home Shoppers GNU Working Paper No. 1
19
supports the previous research of Jongjit (2015), in that trustfulness has a relationship towards the intention to purchase. Additionally, several previous studies revealed that the presentation of the sales person (with TV shopping this can be implied as a show host) influences the intention to purchase. In order to improve the perceived trust among customers, the Jewelry Channel may enhance the image of the show host, by being more of an expert in the gem and Jewelry area. The training of the show hosts might be important in order to enhance the show host’s knowledge, as well as a knowledgeable call centre agent who will be on the front line when communicating with customers, would help in improving the trust among customers. Satisfactory Prior Experience The intention to repurchase also can be influenced by the customer’s satisfactory prior experience, as found in this research that the value of significant is 0.00, which is less than 0.05. This result supports the previous research of Burke (2002) that prior experiences strongly affect future behaviour. Similarly, this was found by Ling et al. (2010), who noted that, in e-commerce, the customers’ experiences with perceptions of product information, payment methods, delivery efficiency, service offered, perceived risk, privacy, security, personalisation, visualisation, exploration and entertainment are the factors which influence their buying intention. The Jewelry Channel may gain a better score of customer satisfaction and meet with customer satisfaction by improving supply chain ability as well as considering implementation of total quality management practice. Implications of the Research The research findings provided the managerial implications to the company’s management team. This insight and feedback gave the company’s management team important information to use in formulating a long-term strategic plan to increase customers’ intention to repurchase. The research findings can also be used in business strategic planning with other TV shopping businesses in Thailand, as well as other countries. Limitations of the Research Although the research findings reflect the feedback and new insight information, the findings should be noted with some limitations. The research focused on the active customers of the Jewelry Channel, who already had prior experience with teleshopping through the television-shopping retailer. Therefore, the study did not cover those potential customers who may not have prior experience in TV shopping. The products sold on the Jewelry Channel are exclusively only Jewelry products, hence it is possible that the information might not be valid for use with other TV shopping companies which may have more variety in its products. Another limitation is the period that the research had been studied. The research used a sample of respondents from an active customer database during November to December 2015, so the results may not necessarily apply to other time periods as the independent variable quality may change.

Phayaphrom: Factors Influencing TV Home Shoppers GNU Working Paper No. 1
20
Recommendations for Further Study According to the limitations of the research, it has been recommended that future research should concentrate on other TV shopping companies with a different profile of products and presentation techniques. Further study should also evaluate the influence of perceived product quality, perceived social value and the perceived trust relating to the intention to purchase among potential customers who have no prior TV shopping experience. Furthermore, it is recommended that the Jewelry Channel has a periodic survey in order to regularly gain up-to-date insight information, which may fluctuate due to the change of conditions and could affect the independent variables studied.
REFERENCES
Abbes, M., & Goudey, A. (2015). How salespersons induce trust between consumers and retailers: The case of French well-being stores. International Journal of Retail & Distribution Management, 43(12), 1104-1125. doi:10.1108/IJRDM-06-2014-0064
An Sheng, L. (2010). A Study on predicting consumers' satisfaction based on the
features of furniture product designs. International Journal of Organizational Innovation, 2(3), 138-160.
Bearden, W. O., & Etzel, M. J. (1982). Reference group influence on product and brand
purchase decisions. Journal of Consumer Research, 183-194. Brinberg, D., & Plimpton, L. (1986). Self-monitoring and product conspicuousness on
reference group influence. Advances in Consumer Research, 13(1), 297-300. Burke, R. R. (2002). Technology and the customer interface: what consumers want in
the physical and virtual store. Journal of the Academy of Marketing Science, 30(4), 411-432.
Chen, C.-F., & Tsai, M.-H. (2008). Perceived value, satisfaction, and loyalty of TV
travel product shopping: Involvement as a moderator. Tourism Management, 29(6), 1166-1171. doi:10.1016/j.tourman.2008.02.019
Dasree, C., & Panyapirom, P. (2015, September). Thai Retails: Paradise for TV Home
Shopping. Forbes Thailand, 3. Field, A. (2009). Discovering statistics using SPSS: Sage publications. Foreign Exchange Rates as of 25 December 2015. (2015). Retrieved from
https://www.bot.or.th/english/_layouts/application/exchangerate/ExchangeRate.aspx
Giles, D. C. (2002). Parasocial interaction: A review of the literature and a model for
future research. Media Psychology, 4(3), 279-305.

Phayaphrom: Factors Influencing TV Home Shoppers GNU Working Paper No. 1
21
GS Home Shopping Inc. - Company Capsule. (2014). Basingstoke: Progressive Digital Media. Retrieved from ProQuest ABI/INFORM Complete.
Hargreaves, J. L. (2013). The “Celebritization” of home shopping: An examination of
the phenomenon of celebrity endorsement and how a home shopping channel utilizes their celebrities and Twitter (Master's Thesis). Drexel University, Philadelphia, Pennsylvania. Retrieved from http://hdl.handle.net/1860/4264
Israel, G. D. (1992). Sampling the evidence of extension program impact. [June 2012].
Program Evaluation and Organizational Development (PEOD5). Jamaludin, A., & Ahmad, F. (2013). Investigating the relationship between trust and
intention to purchase online. Business and Management Horizons, 1(1), 1-9. doi: 10.5296/bmh.v1i1.3253
Jongjit, S. (2015). Marketimg Mix Factors Affecting a Decision Making on Purchasing
Kitchen Equipment Through TV Home Shopping Program of Consumers in Metropolitan Area. Paper presented at the National Academic Conference 2015, National Institute of Development Administration.
Kotler, P., & Armstrong, G. (2010). Principles of Marketing: Pearson Education. Krejcie, R. V., & Morgan, D. W. (1970). Determining sample size for research
activities. Educational and Psychological Measurement, 30, 607-610. Lassar, W., Mittal, B., & Sharma, A. (1995). Measuring customer‐based brand equity.
Journal of Consumer Marketing, 12(4), 11-19. doi:10.1108/07363769510095270
Lim, C. M., & Kim, Y.-K. (2011). Older consumers' TV home shopping: Loneliness,
parasocial interaction, and perceived convenience. Psychology and Marketing, 28(8), 763-780. doi:10.1002/mar.20411
Lin, P.-H. (2013). Shopping motivations on the Internet: An empirical study of trust,
satisfaction and loyalty. International Journal of Electronic Business Management, 11(4), 238-246.
Ling, K. C., Chai, L. T., & Piew, T. H. (2010). The effects of shopping orientations,
online trust and prior online purchase experience toward customers’ online purchase intention. International Business Research, 3(3), 63-76.
Liu, T.-H. (2012). Effect of E-service Quality on Customer Online Repurchase
Intentions (Doctoral dissertation). Retrieved from ProQuest Dissertations and Theses (Order number 3519935)
Lystig Fritchie, L., & Johnson, K. K. (2003). Personal selling approaches used in
television shopping. Journal of Fashion Marketing and Management: An International Journal, 7(3), 249-258.

Phayaphrom: Factors Influencing TV Home Shoppers GNU Working Paper No. 1
22
Molina-Castillo, F.-J., Calantone, R. J., Stanko, M. A., & Munuera-Aleman, J.-L. (2013). Product quality as a formative index: Evaluating an alternative measurement approach. Journal of Product Innovation Management, 30(2), 380-398. doi:10.1111/j.1540-5885.2012.01005.x
Nunnally, J. C., Bernstein, I. H., & Berge, J. M. t. (1967). Psychometric Theory (Vol.
226): McGraw-Hill New York. Pappu, R., Quester, P. G., & Cooksey, R. W. (2006). Consumer-based brand equity and
country-of-origin relationships: some empirical evidence. European Journal of Marketing, 40(5/6), 696-717.
Research and Markets; China TV Shopping Industry Report, Sales Up to RMB17.85
Billion in 2011. (2012). Marketing Weekly News, 352. Saengwit, K. (2015, June 5). Regulator acknowledges dominance of satellite TV.
McClatchy - Tribune Business News. Retrieved from ProQuest ABI/INFORM Complete.
Schiffman, L. G. (1972). Perceived risk in new product trial by elderly consumers.
Journal of Marketing Research, 106-108. Sweeney, J. C., & Soutar, G. N. (2001). Consumer perceived value: The development
of a multiple item scale. Journal of Retailing, 77(2), 203-220. doi:10.1016/S0022-4359(01)00041-0
TV Direct Annual Report 2014. (2014). Retrieved from
http://tvd.listedcompany.com/misc/ar/20150318-tvd-ar2014-th.pdf Vigneron, F., & Johnson, L. W. (2004). Measuring perceptions of brand luxury. The
Journal of Brand Management, 11(6), 484-506. Warren, C. J. (2011). Understanding the impact of core product quality on customer
satisfaction, team identification, and service quality (Doctoral dissertation). Retrieved from ProQuest Dissertations and Theses. (Order number 3474816)
Yu-Hui, F., Chao-Min, C., & Eric, T. G. W. (2011). Understanding customers'
satisfaction and repurchase intentions. Internet Research, 21(4), 479-503. doi:10.1108/10662241111158335


