Embed Size (px)
Citation preview
Factors that Determine the Development and Progression ofGastroesophageal Varices in Patients with Chronic Hepatitis C
Robert J. Fontana, M.D.1, Arun J. Sanyal, M.D.2, Marc G. Ghany, M.D.3, William M. Lee, M.D.4, Andrea E. Reid, M.D.5, Deepa Naishadham, M.A., M.S.6, Gregory T. Everson, M.D.7, Jeffrey
© 2009 The American Gastroenterological Association. Published by Elsevier Inc. All rights reserved.Address all correspondence to: Robert J. Fontana, MD Associate Professor of Medicine 3912 Taubman Center Ann Arbor, MI48109-0362 Tel: 734-936-4780 Fax: 734-936-7392 [email protected] to Manuscript 1, 2, 3, 4, 5 Study concept and design; acquisition of data; analysis and interpretation of data; drafting ofthe manuscript; critical revision of the manuscript for important intellectual content; statistical analysis; obtained funding; studysupervision; 6 Analysis and interpretation of data; drafting of the manuscript; critical revision of the manuscript for important intellectualcontent; statistical analysis; 7, 8, 9, 10, 11, 12 Acquisition of data; analysis and interpretation of data; critical revision of the manuscriptfor important intellectual contentAuthor Emails Robert J. Fontana [email protected] J. Sanyal [email protected] G. Ghany [email protected] M. Lee [email protected] E. Reid [email protected] Naishadham [email protected] T. Everson [email protected] A. Kahn [email protected] M. Di Bisceglie [email protected] Szabo [email protected] R. Morgan [email protected] E. Everhart [email protected] of InterestSection A. The following are disclosures that pertain to the industrial sponsors who have partnered with the NIDDK to support this study,which are also listed in the text of the manuscript.Financial relationships of the authors with Hoffmann-La Roche, Inc., are as follows:R.J. Fontana is on the speaker’s bureau; W.M. Lee receives research support; G. T. Everson is a consultant, on the speaker’s bureau, andreceives research support; A.M. Di Bisceglie is a consultant and receives research support; G. Szabo receives research support; and T.R.Morgan is consultant, on the speaker’s bureau, and receives research support.Section B. In addition, many of the HALT-C Trial investigators have other associations with industry relating to the area of hepatitis C,and, to achieve the highest level of disclosure, we list these for you as well.R.J. Fontana: Bristol-Meyers Squibb – Speaker’s bureau and consultant. Abbott Pharmaceuticals – Consultant. Bayer/Siemens –Consultant.A.J. Sanyal has served on ad hoc Advisory Boards of Bayer, Salix, Gilead, Astellas, Sanofi, Exhalenz in the last year. He has participatedin clinical trials by Bayer, Sanofi, Gilead, Exhalenz, Salix and Roche.W.M. Lee receives research support from Aegerion, Globeimmune, Orasure, Schering-Plough, Siemens Diagnostics and VertexPharmaceuticals.G. T. Everson receives research support from Schering-Plough, Pharmasset, GlobeImmune, Source, Novartis/Human Genome Sciences,and GlaxoSmithKline; and is a consultant and receives research support from Vertex Pharmaceuticals.A.M. Di Bisceglie is a consultant and receives research support from Vertex Pharmaceuticals, Idenix Pharmaceuticals, Gilead Sciences,Anadys, GlobeImmune and Pharmasset; has served as a consultant to Schering-Plough, Novartis, Bristol-Myers-Squibb and Abbott.G. Szabo receives research support from Idenix Pharmaceuticals, Vertex Pharmaceuticals, GlaxoSmithKline, Bristol-Myers-Squibb,IDERA, Novartis, and Schering Plough Corporation.T.R. Morgan is a consultant, serves on an advisory board, and receives research support from Vertex Pharmaceuticals; and receivesresearch support from Merck, Schering Plough Corporation, and WAKO Diagnostics.This is publication #48 from the HALT-C Trial Group.*The HALT-C Trial was registered with clinicaltrials.gov (#NCT00006164).Publisher's Disclaimer: This is a PDF file of an unedited manuscript that has been accepted for publication. As a service to our customerswe are providing this early version of the manuscript. The manuscript will undergo copyediting, typesetting, and review of the resultingproof before it is published in its final citable form. Please note that during the production process errors may be discovered which couldaffect the content, and all legal disclaimers that apply to the journal pertain.
NIH Public AccessAuthor ManuscriptGastroenterology. Author manuscript; available in PMC 2011 June 1.
Published in final edited form as:Gastroenterology. 2010 June ; 138(7): 2321–2331.e2. doi:10.1053/j.gastro.2010.02.058.
NIH
-PA Author Manuscript
NIH
-PA Author Manuscript
NIH
-PA Author Manuscript
A. Kahn, M.D.8, Adrian M. Di Bisceglie, M.D.9, Gyongyi Szabo, M.D.10, Timothy R. Morgan,M.D.11, James E. Everhart, M.D.12, and the HALT-C Trial Group1Division of Gastroenterology, Department of Internal Medicine, University of Michigan MedicalSchool, Ann Arbor, MI.2Department of Internal Medicine, Virginia Commonwealth University Medical Center, Richmond,VA.3Liver Diseases Branch, National Institutes of Diabetes and Digestive and Kidney Diseases,National Institutes of Health, Department of Health and Human Services, Bethesda, MD.4Division of Digestive and Liver Diseases, University of Texas Southwestern Medical Center, Dallas,TX.5Gastrointestinal Unit (Medical Services), Massachusetts General Hospital, Boston, MA.6New England Research Institutes, Watertown, MA.7Section of Hepatology, Division of Gastroenterology and Hepatology, University of ColoradoDenver, School of Medicine, Aurora, CO.8Division of Gastrointestinal and Liver Diseases, Keck School of Medicine, University of SouthernCalifornia, Los Angeles, CA.9Division of Gastroenterology and Hepatology, Saint Louis University School of Medicine, St. Louis,MO.10Hepatology and Liver Center, Division of Gastroenterology, Department of Medicine, Universityof Massachusetts Medical School, Worcester, MA.11Division of Gastroenterology, University of California - Irvine, Irvine, CA and GastroenterologyService, VA Long Beach Healthcare System, Long Beach, CA.12Division of Digestive Diseases and Nutrition, National Institutes of Diabetes and Digestive andKidney Diseases, National Institutes of Health, Department of Health and Human Services,Bethesda, MD.
AbstractBackground & Aims—We aimed to identify the incidence and predictors of de novogastroesophageal variceal formation and progression in a large cohort of patients with chronichepatitis C (CHC) and advanced fibrosis.
Methods—All participants in the HALT-C Trial were offered an endoscopy before treatment andagain after 4 years. Patients with varices at baseline also had a endoscopy at 2 years. Baselinelaboratory and clinical parameters were analyzed as predictors of de novo variceal formation andvariceal progression.
Results—De novo varices developed in 157 of the 598 (26.2%) patients. Most of the new variceswere small (76.4%) and only 1% of patients developed variceal hemorrhage. The likelihood ofdeveloping varices was associated with subject race (Hispanic > Caucasian > African American, p=0.0005), lower baseline levels of albumin (P=0.051), and higher levels of hyaluronic acid (P< 0.001)with an area under the receiver operating characteristic (AUROC) curve=0.70. Among 210 patientswith existing gastroesophageal varices, 74 (35.2%) had variceal progression or bleeding duringfollow-up. Patients with a higher baseline ratios of serum aspartate /alanine aminotransferase(P=0.028) and lower platelet counts (P=0.0002) were at greatest risk of variceal progression (AUROC= 0.72). Prolonged, low-dose peginterferon α2a therapy and β-blockers did not influence the risk ofdeveloping new or enlarging varices.
Fontana et al. Page 2
Gastroenterology. Author manuscript; available in PMC 2011 June 1.
NIH
-PA Author Manuscript
NIH
-PA Author Manuscript
NIH
-PA Author Manuscript
Conclusion—Development of varices in patients with CHC is associated with patient race/ethnicityand laboratory markers of disease severity. Prolonged low dose peginterferon α2a therapy and β-blockers do not reduce the risk of variceal development nor progression.
Keywordscirrhosis; portal hypertension; esophagogastroduodenoscopy; hyaluronic acid
IntroductionThe presence of varices in the esophagus or stomach (i.e. gastroesophageal varices) in patientswith chronic liver disease has important prognostic and therapeutic implications. For example,patients with moderate to large varices should receive prophylactic beta-blockers or undergoband ligation to reduce the risk of variceal hemorrhage (1). In addition, patients with varicesshould avoid aspirin, non-steroidal anti-inflammatory drugs, and other anticoagulants to reducethe risk of gastrointestinal bleeding. Although upper endoscopy is the “gold standard” fordiagnosing varices, the cost, risk, and inconvenience associated with this invasive procedurehave led many to seek alternative means to predict the presence and severity of varices (2,3).Development of reliable and simple non-invasive tests that accurately predict the presence ofvarices could greatly improve the clinical care of the increasing number of patients with chronicliver disease. In addition, accurate laboratory or clinical predictors of variceal progressioncould help guide surveillance and interventional strategies in patients with known varices.
The severity of cirrhosis as determined by the Child-Turcotte-Pugh (CTP) score hasconsistently been associated with the likelihood of having gastroesophageal varices. Forexample, subjects with decompensated cirrhosis are significantly more likely to have varicesor develop variceal bleeding during follow-up compared to subjects with compensated cirrhosis(4,5). However, many of these studies involved a limited number of patients with variablefollow-up and included a large proportion of patients with alcoholic liver disease (5). In theUnited States and most western countries, chronic hepatitis C (CHC) infection has emerged asa leading cause of liver failure, hepatocellular carcinoma (HCC) and liver transplantation (6).Improved understanding of the factors that influence disease progression including thedevelopment of gastroesophageal varices are urgently needed.
The Hepatitis C Antiviral Long-term Treatment against Cirrhosis (HALT-C) Trial is aprospective, multi-center study designed to determine if maintenance peginterferon can reducethe rate of disease progression in patients with CHC and advanced but compensated fibrosis(7). The overall rate of liver decompensation as well as histological fibrosis progression wassimilar in the peginterferon treated and untreated control patients (7). However, the largenumber of well-characterized patients provided a unique opportunity to prospectively studyvarious aspects of liver disease progression including the development of gastroesophagealvarices. In a prior report, esophageal varices were detected in 16% of the HALT-C Trial patientswith bridging fibrosis and 39% of those with compensated cirrhosis at study entry (8).Correlates of baseline varices included male gender, non-African American race, andlaboratory markers of disease severity. The aims of the current study are to identify theincidence of de novo gastroesophageal varix formation in HALT-C Trial patients withoutbaseline varices as well as the incidence of variceal progression in patients with establishedvarices during a median follow-up of 4 years. In addition, baseline laboratory and clinical datawere analyzed to develop models that accurately and reliably predict the presence andprogression of gastroesophageal varices.
Fontana et al. Page 3
Gastroenterology. Author manuscript; available in PMC 2011 June 1.
NIH
-PA Author Manuscript
NIH
-PA Author Manuscript
NIH
-PA Author Manuscript
MethodsThe design of the HALT-C Trial has been previously described (7). Briefly, patients with priornon-response to standard interferon and advanced hepatic fibrosis on biopsy (i.e. Ishak fibrosisscore > 3) with no history of hepatic decompensation or HCC were treated with pegylatedinterferon and ribavirin during the “lead-in” phase. Patients with persistently detectable HCVRNA at week 20, were randomized to maintenance peginterferon-α2a 90 ug/ week (Pegasys;Roche Laboratories, Nutley NJ) or no treatment for the next 3.5 years. Week 20 virologicalresponders in the lead-in continued combination therapy for 48 weeks. However, patients withdetectable HCV RNA during treatment (breakthrough) or after stopping treatment (relapse)were also eligible for randomization. In addition, “express” patients who had received at least24 weeks of peginterferon and ribavirin were eligible for enrollment in the randomized phase.This study was approved by the Institutional Review Board at each site and all subjects providedwritten informed consent for endoscopy.
Endoscopic evaluation and endpointsA written endoscopy protocol was developed that included standardized criteria for identifyingand grading esophageal varices, gastric varices and portal hypertensive gastropathy. All of thephysician investigators completed a tutorial prior to the study initiation. Furthermore,endoscopic findings were immediately recorded on a templated form on the date of theendoscopy and the data were queried and verified against source documents at annual audits.All subjects underwent a pretreatment baseline endoscopy prior to randomization and subjectswith baseline gastroesophageal varices had a repeat endoscopy at 18 months followingrandomization which is deemed study year 2. In addition, all randomized patients who had notdied or undergone liver transplantation underwent a follow-up endoscopy at year 3.5 followingrandomization which is deemed study year 4. The presence and grade of esophageal variceswere evaluated with the esophagus insufflated as follows (9):
F1= small varices with mild impingement on the lumen (< 25%)
F2 = medium varices, intermediate in size between F1 and F3
F3= large varices with considerable impingement on the lumen (> 50%).
Gastric varices were recorded according to the Sarin classification (10)
De Novo varices were defined as newly identified esophageal or gastric varices or thedevelopment of variceal hemorrhage during follow-up in the patients without varices atbaseline. Variceal progression was defined as an increase in esophageal varix size of at least1 grade at the year 2 or year 4 endoscopy, development of variceal bleeding any time in therandomized phase, or development of new gastric varices. Regression of varices was definedas a decrease in esophageal varix size by 1 grade or more at the year 4 endoscopy.
Laboratory and clinical assessmentLifetime alcohol consumption was estimated using a modification of the Skinner survey atenrollment (7). Routine baseline laboratory values (i.e. serum aminotransferases, albumin,bilirubin, platelet count) were obtained at the local laboratories. HOMA-IR was calculated asHOMA= [(insulin* glucose)/22.5]*0.5551. Serum HCV RNA testing was done at baseline andduring the randomized phase using the quantitative COBAS Amplicor HCV Monitor Test(Roche Molecular Diagnostics, Branchburg, NJ) with a lower limit of detection of 600 IU/mlat a central laboratory. Serum iron, total iron binding capacity, total bile acids and hyaluronicacid levels were determined at a reference laboratory (WAKO Diagnostics, Richmond VA).Liver biopsies were evaluated by a panel of expert liver pathologists and scored for the degreeof hepatic fibrosis and inflammation defined by the Ishak scoring system and the degree of
Fontana et al. Page 4
Gastroenterology. Author manuscript; available in PMC 2011 June 1.
NIH
-PA Author Manuscript
NIH
-PA Author Manuscript
NIH
-PA Author Manuscript
hepatic steatosis was estimated as grade 0 to 4 (11). Splenomegaly was defined by a spleenlength > 13 cm on sonography.
All patients were seen every 3 months during the randomized phase for laboratory and clinicalassessment. In addition, annual liver ultrasounds were obtained to screen for HCC and serumalpha fetoprotein levels were obtained every 6 months as well. Clinical endpoints for the studyincluded an increase in CTP score to > 7 on two separate occasions 3 months apart, varicealbleeding, ascites, spontaneous bacterial peritonitis, hepatic encephalopathy, HCC, or death.For the subgroup of patients with bridging fibrosis at baseline, a two point increase in the IshakFibrosis score was considered histological progression.
Statistical methodsStatistical analyses were performed at the data coordinating center with the use of SASsoftware, 9.2 (SAS Institute, Cary, NC). Log transformation of non-normally distributedvariables was undertaken when indicated. Multivariate logistic regression methods were usedto explore factors associated with new varices development, variceal progression, and varicealregression. For multivariate models, individual factors that were associated with the outcomeon bivariate analysis with a p < 0.20 were initially included. Then only variables that weresignificant with p < 0.05 were retained in the final multivariate model. The area under thereceiver operating curve (AUROC) was calculated from a plot of sensitivity versus 1-specificity and can range from 0.5 (no predictive ability) to 1 (perfect discrimination).
ResultsPatient population
A pretreatment screening endoscopy was available in 1,016 of the 1,050 (96.8%) patientsrandomized in the HALT-C Trial. Gastroesophageal varices were absent in 744 (73.2%)patients while 272 (26.8%) had either baseline esophageal varices (261) or gastric varices alone(11) (Figure 1). The 34 patients who did not undergo a pretreatment screening endoscopy didnot differ from the patients included in this analysis except for having significantly lower BMI,baseline serum AST/ ALT and being younger (p< 0.05 for each).
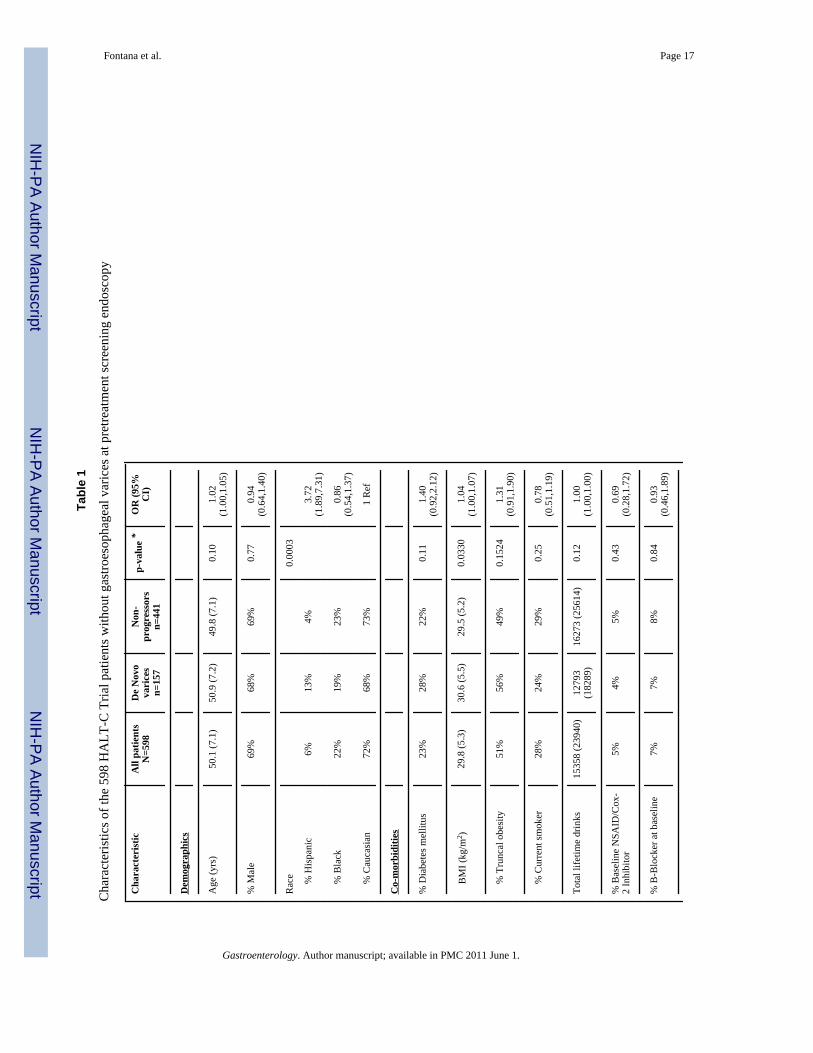
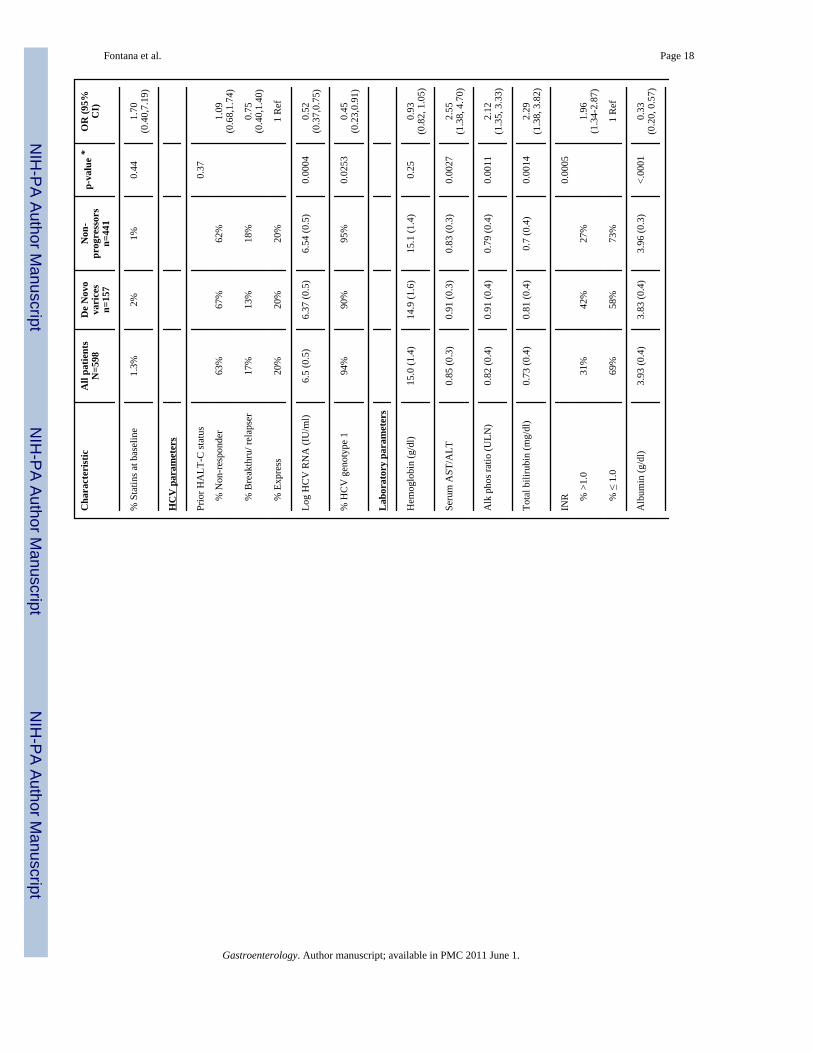
In the 744 subjects without baseline gastroesophageal varices, 146 patients did not undergo afollow-up endoscopy by year 4 due to liver disease progression (n=40), study withdrawal(n=66), or patient refusal (n= 40). The 146 excluded patients had similar baseline demographicfeatures to the 598 patients included in this analysis. However, the excluded patients also hada greater lifetime history of alcohol consumption (p=0.0002), were more likely to be smokers(p=0.0024), and had laboratory markers of more severe liver disease at entry (i.e. higher AST/ALT, p= 0.038, lower albumin p= 0.0093) (data not shown). In addition, the excluded patientswere more likely to develop a clinical outcome during follow-up in the HALT-C Trial (27%vs 8%, p < 0.0001). Clinical characteristics of the 598 patients without pretreatmentgastroesophageal varices include a mean age of 50.1 years, 72% were Caucasian, and 32% hadhistological cirrhosis (Table 1).
Sixty-two of the 272 subjects with pretreatment gastroesophageal varices failed to undergo afollow-up endoscopy due to liver disease progression (n= 32), study withdrawal (n=26), orpatient refusal (n= 4). The 62 excluded patients had similar demographic features to the 210patients included in this analysis but also had greater likelihood of smoking (p=0.015), higherserum alkaline phosphatase levels (p=0.025) and lower serum albumin levels (p=0.0013) (datanot shown). In addition, the excluded patients were more likely to develop a primary clinicaloutcome during follow-up (52% vs 27%, p=0.0003). The mean age of the 210 patients includedin this analysis was 50.8 years, 78% were male, 81% were Caucasian, 64% had cirrhosis, and
Fontana et al. Page 5
Gastroenterology. Author manuscript; available in PMC 2011 June 1.
NIH
-PA Author Manuscript
NIH
-PA Author Manuscript
NIH
-PA Author Manuscript
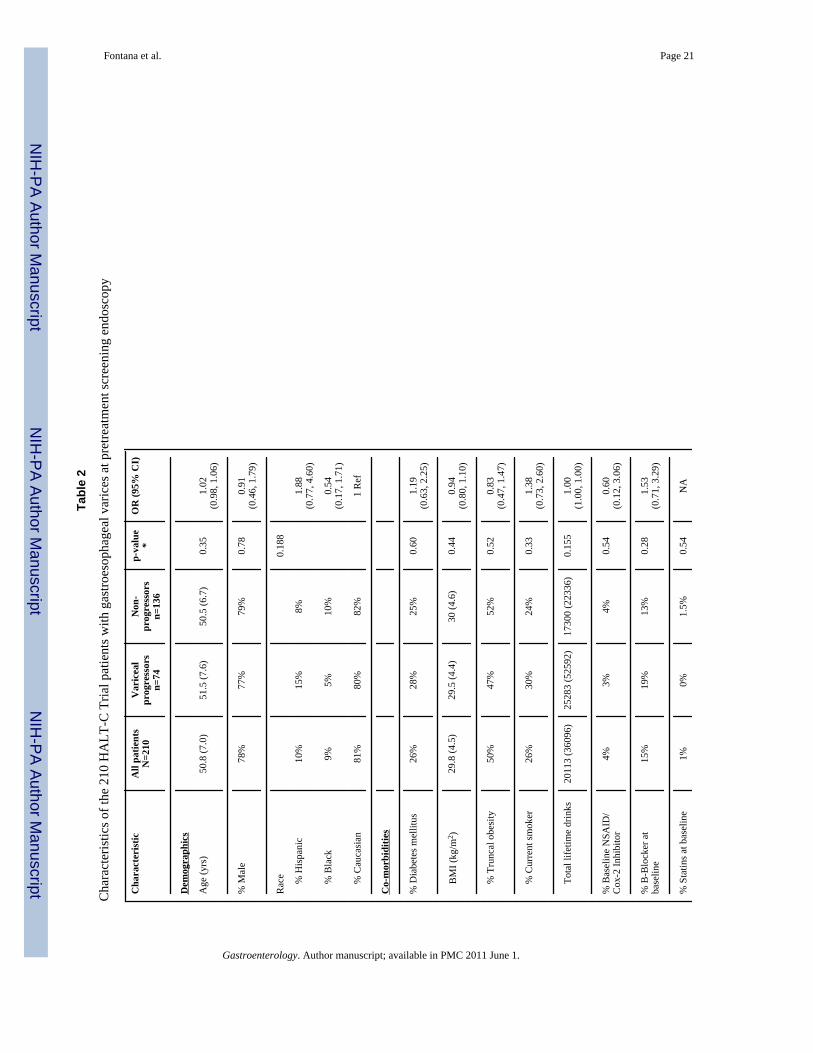
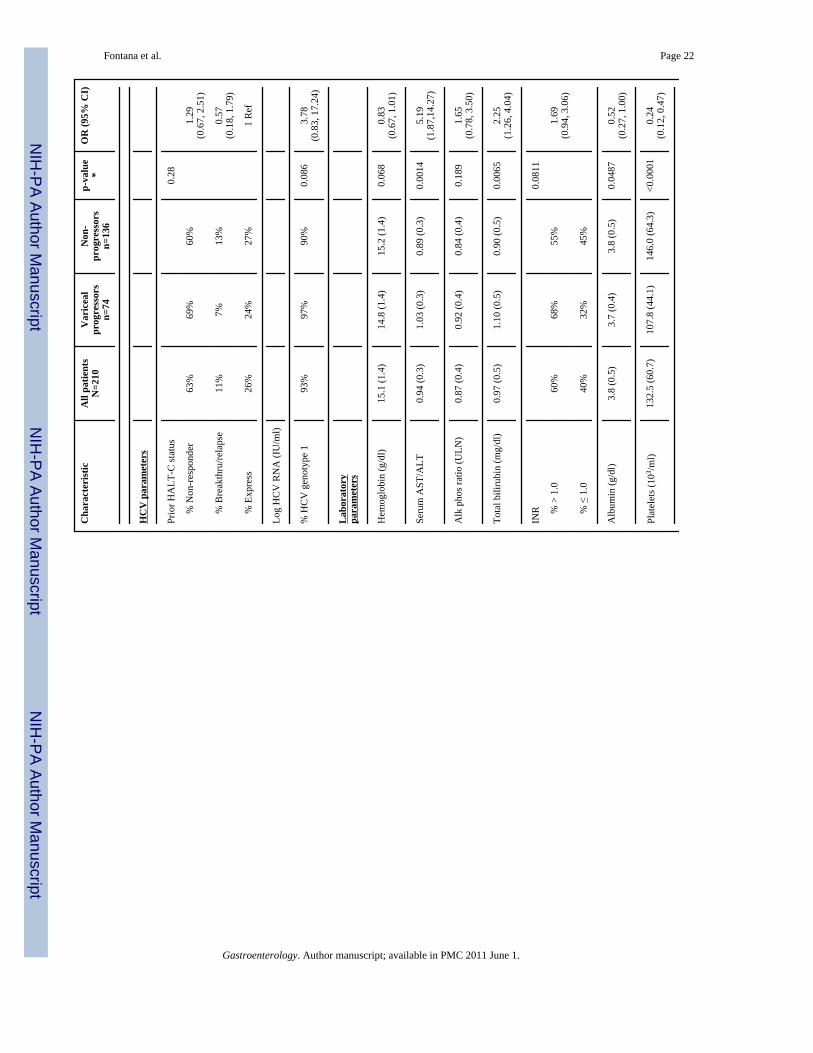
only 9.5 % (20) had gastroesophageal varices while the remainder (190) had esophageal varicesalone (Table 2). Adherence to the endoscopy schedule was excellent with 203 (97%) of thepatients undergoing a surveillance endoscopy at year 2 and 192 (91%) undergoing asurveillance endoscopy at study year 4.
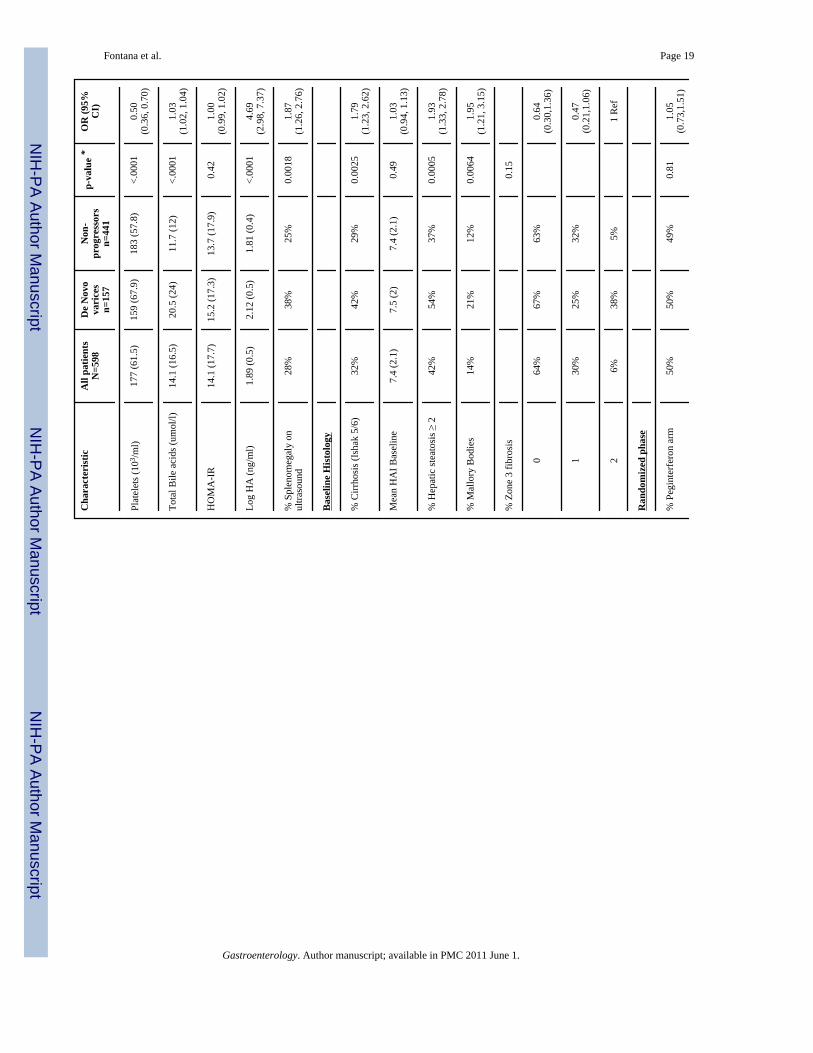
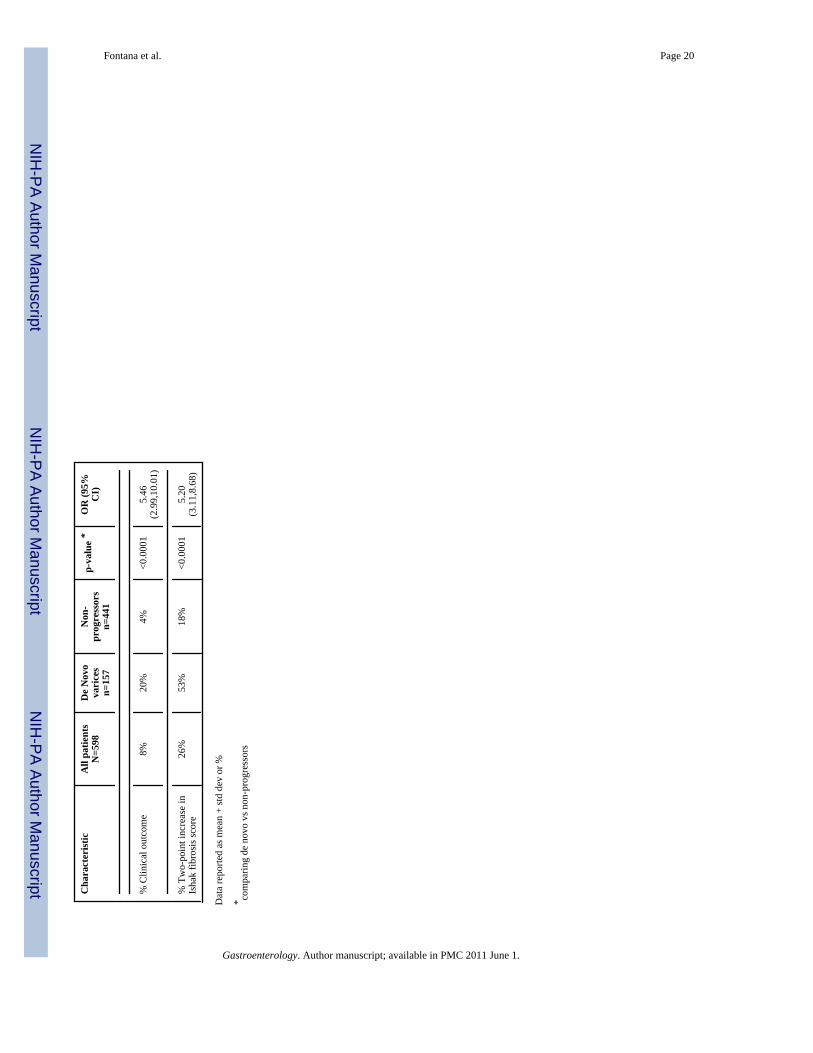
Development of de novo gastroesophageal varicesDuring a median follow-up of 48 months (range: 1.7 to 74 months), 157 of the 598 HALT-Cpatients (26.2%) without baseline varices developed gastroesophageal varices and only 8(5.1%) developed new gastric varices alone. New varices were detected at year 2 in 3 patientsand at year 4 in 150 patients while 4 additional patients presented with variceal hemorrhage.The size of the de novo esophageal varices at diagnosis was grade 1 in 120 patients (76.4%),grade 2 in 21 patients (13.4%), and grade 3 in 4 patients (2.5%). Subjects who developed newvarices were significantly more likely to be Hispanic, less likely to be African-American, havea higher BMI, and have a lower serum albumin level (Table 1). In addition, subjects with newvarices had significantly higher baseline serum AST/ ALT, total bilirubin, INR, alkalinephosphatase, hyaluronic acid (HA), and total bile acid levels compared to patients without newvarices (Table 1). The pretreatment liver biopsies of patients with new onset varices were alsomore likely to demonstrate cirrhosis, Mallory-Denk bodies, and more severe hepatic steatosis.During follow-up, patients with de novo varices were also significantly more likely to developa clinical outcome (Odds ratio 5.46: p< 0.0001). Conversely, the rate of de novo varices wassignificantly higher in the 50 (8%) patients with clinical progression compared to the 127 (92%)patients without a clinical outcome (62% vs 23%, p< 0.0001)
Multivariate modeling of baseline clinical and laboratory predictors identified subject race andpretreatment serum albumin and log HA levels as significantly associated with developingvarices. Specifically, the odds ratio for Hispanics versus Caucasians was 4.20 (95% CI: 1.92,9.20) and for African Americans versus Caucasians was 0.77 (95% CI: 0.47, 1.28). Similarly,for every one gm/dl unit decrease in albumin, the odds ratio was 0.55 (95% CI: 0.30,1.00) andfor every one unit increase in serum HA levels, the odds ratio was 3.84 (95% CI: 2.36, 6.26).The AUROC of the multivariate model for identifying patients at risk of developing variceswas 0.721 (95% CI: 0.65, 0.79). The addition of the pretreatment Ishak fibrosis, Mallory-Denkbodies, and steatosis scores to the model did not substantially change the model performancenor the inclusion of serial HA levels (Data not shown). Finally, the frequency of beta-blockeruse (44% vs 34%, p= 0.07) during the randomized phase was not significantly different in thosewith and without denovo varices.
The risk of developing varices in patients of varying ethnicity and baseline hyaluronic acidlevels was estimated from the logistic regression model (Figure 2). It was assumed that allpatients would have a baseline serum albumin level that was similar to the median value of theHALT-C Trial patients of 3.9 g/dl. In subjects with a baseline hyaluronic acid level of < 50ng/ml (i.e. log < 1.7), the risk of developing varices ranged from 13% in African Americansto 22% in Caucasians and 44% in Hispanics. Similarly, the risk of developing varices in patientswith a baseline hyaluronic acid level of > 126 ng/ml (i.e. log > 2.1) varied from 36% to 51%and 75% amongst the African American, Caucasian, and Hispanic subgroups, respectively.
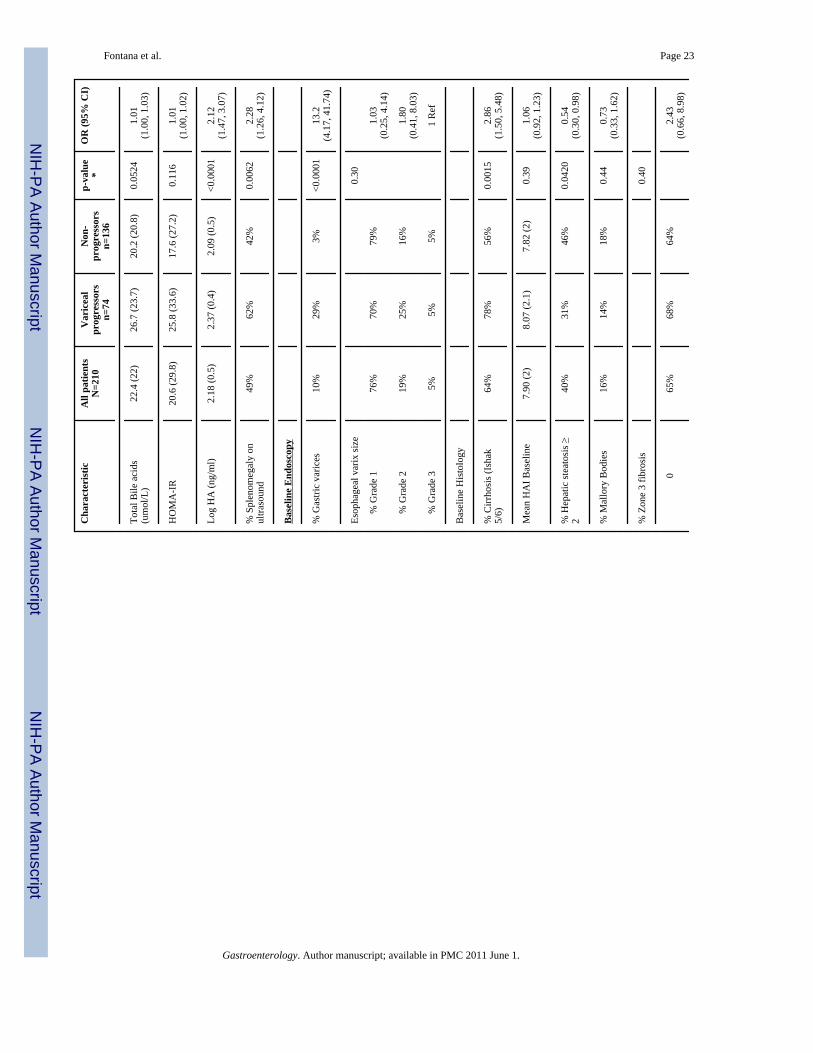
Progression of baseline varicesDuring a median follow-up of 48 months, 74 (35.2%) subjects experienced variceal progressionwhich included 46 detected at year 2, 23 detected at year 4, and 5 presenting with varicealbleeding. On univariate analysis, subjects with variceal progression had significantly higherbaseline serum AST/ ALT, total bilirubin, and hyaluronic acid levels and significantly lowerserum albumin and platelet levels compared to non-progressors (Table 2). In addition, thepatients with variceal progression were more likely to have splenomegaly on their pretreatment
Fontana et al. Page 6
Gastroenterology. Author manuscript; available in PMC 2011 June 1.
NIH
-PA Author Manuscript
NIH
-PA Author Manuscript
NIH
-PA Author Manuscript
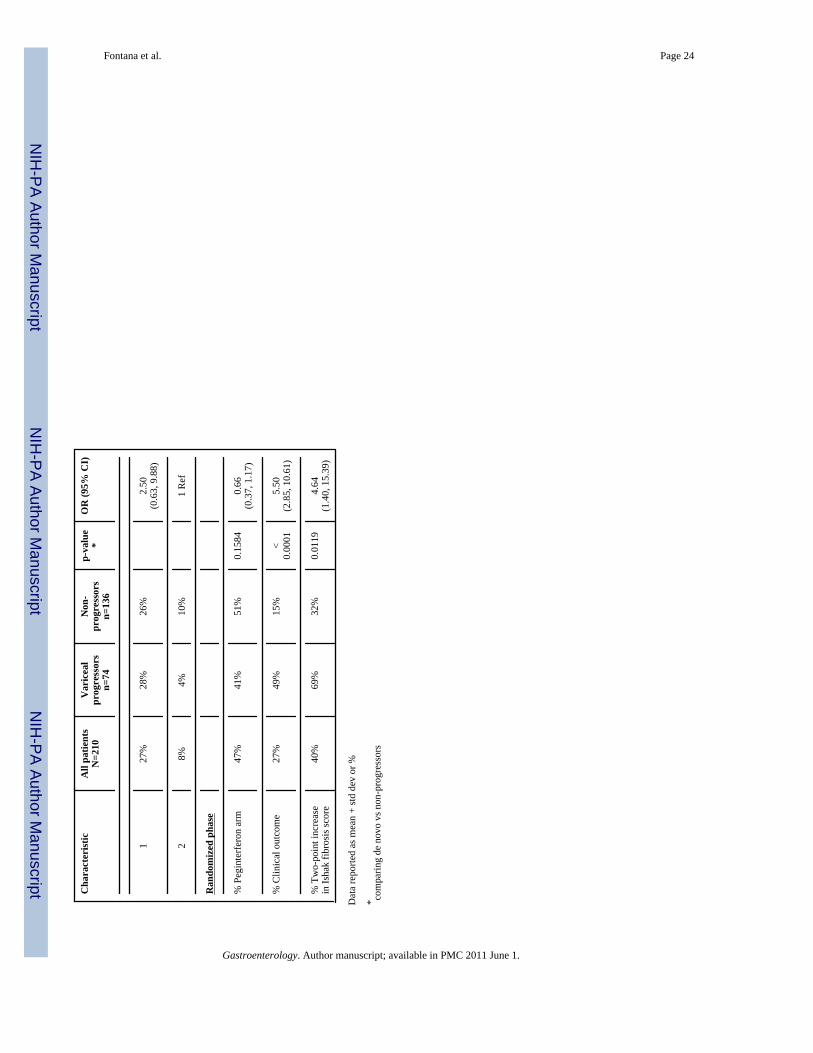
liver ultrasound. Administration of beta-blockers during the randomized phase was morecommon in those with compared to those without variceal progression (78% vs 50%, p=0.0003). Patients with variceal progression were also more likely to experience a clinicaloutcome compared to those without variceal progression (Table 2). Conversely, the rate ofvariceal progression was also significantly higher in the 56 (27%) patients with clinicalprogression compared to the 154 (73%) patients without a clinical outcome (64% vs 25%, p<0.0001). The overall risk of bleeding among those with baseline varices was ~ 7% over 4 yearsas compared to 0.7% in those without baseline varices (p < 0.001).
On multivariate analysis, baseline serum AST/ALT and platelet counts were the onlyparameters independently associated with variceal progression. Specifically, for every one unitincrease in the serum AST/ ALT ratio, the odds ratio was 3.39 (95% CI: 1.17, 9.84) and forevery decrease in baseline platelet counts of 50,000/ml the odds ratio for variceal progressionwas 0.53 (95% CI: 0.38, 0.75). The addition of baseline histological parameters includinghepatic steatosis did not improve model performance (data not shown). For every decrease inthe platelet count by 50,000/ ml, the likelihood of variceal progression during follow-upincreased by 88%. The impact of baseline platelet counts and varying serum AST/ ALT levelson the risk of variceal progression can be seen in supplemental figure 1. In subjects with abaseline serum AST/ ALT level < 0.8, the impact of baseline platelet count varies from 8%risk in subjects with platelets > 150,000/ml to 37% in subjects with platelet counts < 100,000/ml. In contrast, in subjects with a baseline serum AST/ ALT > 1.5, indicative of more severeliver disease, the baseline platelet count can vary the risk of variceal progression from 23% to66%.
Impact of pegylated Interferon on development and progression of varicesThe HALT-C Trial was designed to determine if maintenance peginterferon would reduce therate of clinical and histological disease progression. If effective, it was anticipated that varicealdevelopment and progression would also be less frequent in the peginterferon treated patients.However, peginterferon therapy was not a predictor of new varices formation compared to notherapy (27% vs 26%, p=0.81) (Figure 3A). Similarly, the frequency of variceal progressionwas similar in the treated and untreated patients during the randomized phase (30% vs 40%,p=0.157) and the overall likelihood of changes in variceal status were not different (p=0.353)(Figure 3B).
Finally, the role of medication adherence amongst the peginterferon treated patients wasexplored in relationship to variceal outcomes by defining adherent patients as those who wereable to take > 80% of the prescribed dose of peginterferon for at least 80% of the time. In thisanalysis, 62% of the peginterferon treated patients without varices were adherent butmedication adherence was not associated with the risk of developing de novo varices (25% vs30%, P=0.30). Similarly, 47% of the peginterferon treated patients with baseline varices wereadherent but again medication adherence was not associated with the risk of varicealprogression (26% vs 35%, p= 0.33).
DiscussionPrior studies had suggested that interferon therapy in patients with CHC that did not clear virusmay lead to histological improvement (12,13). As a result, several large randomized controlledtrials of peginterferon therapy were initiated with the hope that the anti-inflammatory and anti-fibrotic effect of treatment in persistently viremic patients would slow the rate of diseaseprogression. However, the HALT-C Trial and other studies have failed to demonstrate anysignificant benefit regarding clinical and histological disease progression with maintenanceinterferon therapy (7,14-16). Previous studies have also demonstrated that administration of
Fontana et al. Page 7
Gastroenterology. Author manuscript; available in PMC 2011 June 1.
NIH
-PA Author Manuscript
NIH
-PA Author Manuscript
NIH
-PA Author Manuscript
interferon to cirrhotic patients with CHC can lead to a reduction in portal pressure (17,18).Although reductions in portal pressure were consistently greatest in patients with an initial orsustained virological response, some non-responders with improved liver histology alsoexperienced improved portal pressures. Therefore, we hypothesized that antiviral therapywould be associated with a reduction in the rate of development of de novo varices as well asa reduced rate of variceal progression compared to no treatment.
Overall, 26.2% of the HALT-C Trial patients without baseline varices developed de novovarices during a median follow-up of 4 years. As expected, patients that developed variceswere also significantly more likely to experience a clinical outcome or histological progressioncompared to patients without de novo varices (Table 1). The majority of these new esophagealvarices were small (76%) and only 1% of patients developed variceal hemorrhage. Theannualized rate of new varices formation of 6.5% per year is slightly lower compared to thatreported in a randomized controlled trial of beta-blockers (8.9% per year) as well as in a naturalhistory study of variceal development (10% per year) (5,19). Of note, all of the patients in thelatter studies had cirrhosis and underwent annual endoscopy whereas only ~ 33% of the HALT-C patients at risk for varices had cirrhosis and an endoscopy was repeated at 4 years (Table 1).Also, the HALT-C Trial patients who did not undergo a follow-up endoscopy had clinicalprofiles that suggested they were at greater risk of developing varices. Thus, our observed ratesof variceal formation may be underestimates. Interestingly, African American patients in theHALT-C Trial were at a reduced risk of developing de novo varices compared to Caucasianswhile Hispanics were at the highest risk (Figure 2). These data are consistent with our prioranalysis demonstrating that African Americans are also less likely to have varices on screeningendoscopy after controlling for disease severity and liver histology (8). The reduced risk ofdeveloping varices amongst African Americans may be related to their tendency to have lesssevere necroinflammation or hepatic steatosis compared to Caucasians with HCV at initialpresentation and during follow-up (20,21). The increased risk of Hispanic patients to developvarices should be interpreted with caution due to the small number of Hispanics enrolled (i.e.only 6% of HALT-C patients but 13.3% of general US population). Nonetheless, the increasedprevalence of metabolic syndrome, hepatic steatosis, and advanced fibrosis reported in cross-sectional studies of Hispanic compared to Caucasian patients with CHC may, in part, explainour findings (22). In support of this, the frequency of significant hepatic steatosis (i.e ≥ 2) was32.5% in the African Americans, 42.5% in Caucasians, and 54.8% in Hispanic HALT-Cpatients (p = 0.002). When we controlled for subject BMI and liver histology, Hispanicethnicity remained an independent risk factor for developing varices. Additional longitudinalstudies of larger numbers of Hispanic and African-American HCV patients are eagerly awaitedto follow-up on these findings.
Baseline serum albumin and hyaluronic acid levels were also significantly associated with anincreased risk of developing varices which is consistent with prior studies demonstrating thatthese analytes correlate with the extent of hepatic fibrosis and disease severity in patients withCHC (23). Increases in serum hyaluronic acid levels are believed to be due to reducedendothelial clearance of HA from hepatic sinusoids as well as from increased hepatic stellatecell production with advancing fibrosis. A number of laboratory parameters associated withthe likelihood of developing varices in prior studies (e.g. platelet counts, total bilirubin levels,serum AST/ ALT) were also associated with the likelihood of developing varices in our patientpopulation (Table 1) (24). However, their lack of independent contribution to our model likelyreflects their collinearity with serum albumin and hyaluronic acid levels. Similarly, histologicalmarkers of disease severity were also associated with the risk of developing varices onunivariate analysis but were not on multivariate modeling presumably for the same reasons.
Administration of low dose peginterferonα2a did not reduce the risk of developing new varices(Figure 4A). Although only low doses of peginterferonα2a were used, the likelihood of
Fontana et al. Page 8
Gastroenterology. Author manuscript; available in PMC 2011 June 1.
NIH
-PA Author Manuscript
NIH
-PA Author Manuscript
NIH
-PA Author Manuscript
developing varices was also not influenced by medication adherence amongst the treatedpatients. Therefore, our results demonstrate that maintenance peginterferon does not reducethe risk of developing varices. These results are consistent with the overall HALT-C Trialresults wherein the rate of liver disease progression by clinical and histological assessment wasnot reduced in treated compared to untreated patients despite improvements in serumaminotransferase and HCV RNA levels (7). Our study results differ from preliminary reportsof other studies of low-dose peginterferonα2b compared to no treatment or colchicine whereina reduced risk of variceal development and bleeding have been noted (16,25). The differingresults may, in part, relate to the differing entry criteria of the studies. For example, 100% ofthe patients in the EPIC3 trial and 83% of the Colchicine versus PegIntron Long-Term (CoPilot)study patients had histological cirrhosis while only 40% of the HALT-C patients had cirrhosis.In addition, Co-Pilot allowed patients with a CTP score of < 8 while HALT-C limitedenrollment to patients with a CTP < 7. In addition, the lower reported rate of de novo varices/variceal progression with peginterferonα2b in CoPilot may relate to the absence of retreatmentwith full dose peginterferon and ribavirin prior to randomization. This could result in theCoPilot patients receiving peginterferonα2b having a greater chance of virological suppressionand reduced necrointlammation compared to those treated with peginterferonα2a in HALT-C.However, both of the trials involving peginterferonα2b also failed to demonstrate a reductionin the overall rate of disease progression and clinical outcomes compared to the control arm(15,16).
A second aim of our study was to determine the rate of variceal progression amongst patientswith CHC. Overall, 35.2% of the 210 patients with baseline gastroesophageal varicesexperienced variceal progression and these patients were also significantly more likely todevelop a clinical outcome or histological progression compared to the patients withoutvariceal progression (Table 2). The annualized rate of 8.8% per year is similar to that reportedin other studies of patients with small varices followed over time (19). On multivariate analysis,baseline serum AST/ ALT and platelet counts were independently associated with varicealprogression. Since the serum AST/ ALT ratio is associated with more advanced hepatic fibrosisin patients with CHC, it is not surprising that this parameter was also associated with varicealprogression. In fact, baseline serum AST/ ALT levels are a component of a model developedin the HALT-C cohort to distinguish patients with bridging fibrosis from those with cirrhosisas well as to identify patients at increased risk of clinical outcomes during follow-up (26,27)In addition, subjects with variceal progression were more likely to have cirrhosis (Table 2)although the addition of liver histology parameters did not substantially improve the model’sperformance.
Use of these simple and widely available laboratory parameters may be of value to practitioners.For example, the likelihood of developing variceal progression can be categorized as low,medium and high using various platelet levels for a patient with a given serum AST/ ALT level(Supplemental Figure 1). However, contrary to expectations, maintenance peginterferontherapy was not associated with a reduced likelihood of variceal progression (Figure 3B). Inaddition, adherence to peginterferon was not associated with a reduced risk of varicealprogression amongst the treated patients although the trend was in the expected direction (26%vs 35%, p= 0.33). The lack of an association between subject ethnicity and variceal progressionmay relate to the limited number of patients with baseline varices in this analysis.
The serial endoscopic data also demonstrated that 17% of patients with baseline varices had areduction in the size of their varices by at least 1 grade and remarkably 3% had a reduction invariceal size by more than 2 stages (See supplemental material). It is possible that the regressionin varices may relate to inter-observer variability in the grading of varix size which is knownto vary by 10 to 15% (28). Alternatively, the reproducibility of assessing esophageal varicesin a given patient due to technical factors of insufflating the esophagus may have also played
Fontana et al. Page 9
Gastroenterology. Author manuscript; available in PMC 2011 June 1.
NIH
-PA Author Manuscript
NIH
-PA Author Manuscript
NIH
-PA Author Manuscript
a role. However, on univariate analysis patients with lower INR levels and higher plateletcounts, indicative of less severe liver disease, were more likely to experience regression.Nonetheless, the use of maintenance peginterferon was not associated with variceal regression(Figure 3B). In addition, baseline use of beta-blockers and statins were also not associated withvariceal regression.
Strengths of our study include the large number of well-characterized patients with CHC thatwere prospectively assessed using a standardized endoscopy protocol while being carefullymonitored in a multi-center clinical trial. Furthermore, overall patient retention in the HALT-C Trial was excellent at 85% (7). In addition, the majority of patients with a pretreatmentscreening endoscopy did undergo a follow-up study as planned (80% of those without varicesand 90% of those with varices). However, the subjects without baseline varices who did notget a follow-up endoscopy had more severe liver disease at entry and were significantly morelikely to develop a clinical outcome during follow-up leading to a potential underestimationof the rate of varices formation. Similarly, amongst the 272 patients with baseline varices, theexcluded subjects that did not undergo a follow-up endoscopy tended to have more severe liverdisease at entry and were also more likely to develop a clinical outcome. Additional limitationsregarding our study design was the lack of central review of endoscopic findings which mayhave led to substantial inter-individual variability in grading varices as has been shown in priorstudies (28). To address these concerns, formal training on the grading of varices wasundertaken at the initiation of the study and a standardized scoring form was used in all patientsat all sites by a limited number of experienced investigators (8). Finally, direct portal pressuremeasurements were not obtained at baseline nor during follow-up. Although thesemeasurements are closely associated with the risk of developing new or worsening varices, theincremental risk, cost, and inconvenience of this invasive method precluded us fromincorporating it into this trial (1,5).
In summary, 26.2% of HALT-C Trial participants developed new gastroesophageal varicesand 35.2% of those with baseline varices experienced variceal progression during a medianfollow-up of 4 years. The risk of developing varices was significantly influenced by patientethnicity and laboratory markers of disease severity at entry but not influenced by the use ofmaintenance peginterferon. Assessment of baseline serum albumin and hyaluronic acid levelscan help stratify patients with CHC into low, medium, and high risk of developing varices(Figure 2). Use of these models may improve patient and physician adherence withrecommendations for endoscopic screening and assist in targeting the highest risk patients forthe most frequent follow-up. Similarly, determination of serum AST/ ALT and platelet countsin patients with CHC and known varices may help identify those that may benefit from beta-blocker prophylaxis or pre-emptive band ligation as well as more frequent endoscopicsurveillance.
Supplementary MaterialRefer to Web version on PubMed Central for supplementary material.
AcknowledgmentsThis study was supported by the National Institute of Diabetes & Digestive & Kidney Diseases (contract numbers arelisted below). Additional support was provided by the National Institute of Allergy and Infectious Diseases (NIAID),the National Cancer Institute, the National Center for Minority Health and Health Disparities and by General ClinicalResearch Center and Clinical and Translational Science Center grants from the National Center for ResearchResources, National Institutes of Health (grant numbers are listed below). The content is solely the responsibility ofthe authors and does not necessarily represent the official views of the National Center for Research Resources or theNational Institutes of Health. Additional funding to conduct this study was supplied by Hoffmann-La Roche, Inc.,through a Cooperative Research and Development Agreement (CRADA) with the National Institutes of Health.
Fontana et al. Page 10
Gastroenterology. Author manuscript; available in PMC 2011 June 1.
NIH
-PA Author Manuscript
NIH
-PA Author Manuscript
NIH
-PA Author Manuscript
In addition to the authors of this manuscript, the following individuals were instrumental in the planning, conduct and/or care of patients enrolled in this study at each of the participating institutions as follows:
University of Massachusetts Medical Center, Worcester, MA: (Contract N01-DK-9-2326) Gyongyi Szabo, MD,Barbara F. Banner, MD, Maureen Cormier, RN, Donna Giansiracusa, RN
University of Connecticut Health Center, Farmington, CT: (Grant M01RR-06192) Herbert L. Bonkovsky, MD,Gloria Borders, RN, Michelle Kelley, RN, ANP
Saint Louis University School of Medicine, St Louis, MO: (Contract N01-DK-9-2324) Adrian M. Di Bisceglie,MD, Bruce Bacon, MD, Brent Neuschwander-Tetri, MD, Elizabeth M. Brunt, MD, Debra King, RN
Massachusetts General Hospital, Boston, MA: (Contract N01-DK-9-2319, Grant M01RR-01066; Grant 1 UL1RR025758-01, Harvard Clinical and Translational Science Center) Jules L. Dienstag, MD, Raymond T. Chung,MD, Atul K. Bhan, MD, Wallis A. Molchen, Cara C. Gooch
University of Colorado School of Medicine, Denver, CO: (Contract N01-DK-9-2327, Grant M01RR-00051,Grant 1 UL1 RR 025780-01) Gregory T. Everson, MD, S. Russell Nash, MD, Jennifer DeSanto, RN, CarolMcKinley, RN
University of California - Irvine, Irvine, CA: (Contract N01-DK-9-2320, Grant M01RR-00827) Timothy R.Morgan, MD, John C. Hoefs, MD, John R. Craig, MD, M. Mazen Jamal, MD, MPH, Muhammad Sheikh, MD,Choon Park, RN
University of Texas Southwestern Medical Center, Dallas, TX: (Contract N01-DK-9-2321, GrantM01RR-00633, Grant 1 UL1 RR024982-01, North and Central Texas Clinical and Translational ScienceInitiative) Thomas E. Rogers, MD, Peter F. Malet, MD, Janel Shelton, Nicole Crowder, LVN, Rivka Elbein,RN, BSN, Nancy Liston, MPH
University of Southern California, Los Angeles, CA: (Contract N01-DK-9-2325, Grant M01RR-00043) KarenL. Lindsay, MD, MMM, Sugantha Govindarajan, MD, Carol B. Jones, RN, Susan L. Milstein, RN
University of Michigan Medical Center, Ann Arbor, MI: (Contract N01-DK-9-2323, Grant M01RR-00042,Grant 1 UL1 RR024986, Michigan Center for Clinical and Health Research) Anna S. Lok, MD, Joel K. Greenson,MD, Pamela A. Richtmyer, LPN, CCRC, R. Tess Bonham, BS
Virginia Commonwealth University Health System, Richmond, VA: (Contract N01-DK-9-2322, GrantM01RR-00065) Mitchell L. Shiffman, MD, Richard K. Sterling, MD, Melissa J. Contos, MD, A. Scott Mills,MD, Charlotte Hofmann, RN, Paula Smith, RN
Liver Diseases Branch, National Institute of Diabetes and Digestive and Kidney Diseases, National Institutes ofHealth, Bethesda, MD: T. Jake Liang, MD, David Kleiner, MD, PhD, Yoon Park, RN, Elenita Rivera, RN,Vanessa Haynes-Williams, RN
National Institute of Diabetes and Digestive and Kidney Diseases, Division of Digestive Diseases and Nutrition,Bethesda, MD: James E. Everhart, MD, Leonard B. Seeff, MD, Patricia R. Robuck, PhD, Jay H. Hoofnagle,MD, Elizabeth C. Wright, PhD
University of Washington, Seattle, WA: (Contract N01-DK-9-2318) Chihiro Morishima, MD, David R. Gretch,MD, PhD, Minjun Chung Apodaca, BS, ASCP
New England Research Institutes, Watertown, MA: (Contract N01-DK-9-2328) Kristin K. Snow, MSc, ScD,Anne M. Stoddard, ScD, Teresa M. Curto, MSW, MPH
Armed Forces Institute of Pathology, Washington, DC: Zachary D. Goodman, MD, PhD
Data and Safety Monitoring Board Members: (Chair) Gary L. Davis, MD, Guadalupe Garcia-Tsao, MD, MichaelKutner, PhD, Stanley M. Lemon, MD, Robert P. Perrillo, MD
Abbreviations
BMI Body mass index
CHC Chronic hepatitis C
CTP Child-Turcotte-Pugh
HA Hyaluronic acid
HALT-C Hepatitis C Antiviral Long-term Treatment against Cirrhosis Trial
HCC Hepatocellular cancer
Fontana et al. Page 11
Gastroenterology. Author manuscript; available in PMC 2011 June 1.
NIH
-PA Author Manuscript
NIH
-PA Author Manuscript
NIH
-PA Author Manuscript
HCV Hepatitis C virus
References1. Garcia-Tsao G, Sanyal AJ, Grace ND, et al. Prevention and management of Gastroesophageal varices
and variceal hemorrhage in cirrhosis. Hepatology 2007;46:922–938. [PubMed: 17879356]2. de Franchis R. Non-invasive (and minimally invasive) diagnosis of esophageal varices. J Hepatology
2008:520–527.3. Qamar A, Grace ND, Groszmann RJ, et al. Platelet count is not a predictor of the presence or
development of gastroesophageal varices. Hepatology 2008;47:153–159. [PubMed: 18161700]4. Burton JR, Liangpunsakul S, Lapidus J, et al. Validation of a multivariate model predicting presence
and size of varices. J Clin Gastroenterol 2007;41:69–615.5. Groszmann RJ, Garcia-Tsao G, Bosch J, et al. Beta-blockers to prevent gastroesophageal varices in
patients with cirrhosis. N Engl J Med 2005;353:2254–2261. [PubMed: 16306522]6. Wise M, Bialek S, Finelli L, et al. Changing trends in hepatitis C-related mortality in the United States,
1995-2004. Hepatology 2008;31:777–782.7. DiBisceglie AM, Shiffman ML, Everson GT, et al. Prolonged therapy of advanced chronic hepatitis
C with low dose peginterferon. N Engl J Med 2008;359:2429–2441. [PubMed: 19052125]8. Sanyal AJ, Fontana RJ, DiBisceglie AM, et al. The prevalence and risk factors associated with
esophageal varices in subjects with hepatitis C and advanced fibrosis. Gastrointest Endosc2006;64:855–864. [PubMed: 17140886]
9. Zoli M, Merkel C, Magalotti D, et al. Evaluation of a new endoscopic index to predict first bleedingfrom the upper gastrointestinal tract in patients with cirrhosis. Hepatology 1996:1047–1052. [PubMed:8903373]
10. Sarin SK, Lahoti D, Saxena SP, et al. Prevalence, classification, and natural history of Gastric varices:A long-term follow-up study in 568 portal hypertension Patients. Hepatology 1992;16:1343–1349.[PubMed: 1446890]
11. Lok ASF, Everhart JE, Chung RT, et al. Hepatic steatosis in hepatitis C: Comparison of diabetic andnon-diabetic patients in the Hepatitis C Antiviral Long-term Treatment against Cirrhosis Trial. ClinGastroenterol Hepatol 2007;5:245–254. [PubMed: 17296533]
12. Shiffman ML, Hofmann CM, Contos MJ, et al. A randomized controlled trial of maintenanceinterferon therapy for patients with chronic hepatitis C virus and persistent viremia. Gastroenterology1999;117:1164–1172. [PubMed: 10535880]
13. Alric L, Duffaut M, Selves J, et al. Maintenance therapy with a gradual reduction of the interferondose over one year improves histological response in patients with chronic hepatitis C withbiochemical response: results of a randomized trial. J Hepatology 2001;35:272–278.
14. Fartoux L, Degos F, Trepo C, et al. Effect of prolonged interferon therapy on the outcome of hepatitisC virus-related cirrhosis: A randomized trial. Clinic Gastro & Hepatology 2007;5:502–507.
15. Afdhal NH, Levine R, Brown R, et al. Colchicine versus peginterferon alfa-2b long term therapy:results of the 4 year CoPilot Trial (Abstract). J Hepatology 2008;48:S4.
16. Bruix J, Poynard T, Colombo M, Schiff ER, et al. Final results of the EPIC3 cirrhosis maintenanceTrial: Pegintron maintenance therapy in cirrhotic (METAVIR F4) HCV patients, who failed torespond to Interferon/ ribavirin therapy. Gastroenterology 2009;136(Suppl 1):#295. (Abstract).
17. Roberts S, Gordon A, McLean C, et al. Effect of sustained viral response on hepatic venous pressuregradient in Hepatitis-C related cirrhosis. Clin Gastro & Hep 2007;5:932–937.
18. Rincon D, Ripoll C, LoIacono O, et al. Antiviral therapy decreases hepatic venous pressure gradientin patients with chronic hepatitis C and advanced fibrosis. Am J Gastroenterol 2006;101:2269–2274.[PubMed: 17032192]
19. Merli M, NIcolini G, Angeloni S, et al. Incidence and natural history of small esophageal varices incirrhotic patients. J Hepatol 2003;38:266–272. [PubMed: 12586291]
20. Lepe R, Layden-Almer JE, Layden TJ, Cotler S. Ethnic differences in the presentation of chronichepatitis C. J V Hepatitis 2006;13:116–120.
Fontana et al. Page 12
Gastroenterology. Author manuscript; available in PMC 2011 June 1.
NIH
-PA Author Manuscript
NIH
-PA Author Manuscript
NIH
-PA Author Manuscript
21. Tencate V, Layden-Almer JE, Wolfert M, et al. Paired biopsies illustrate racial differences in fibrosisprogression in HCV patients (Abstract). Hepatology 2009;50(Suppl 1):#1629.
22. Rodriguez-Torres M, Jeffers LJ, Sheikh MY, et al. Peginterferon alfa-2a and ribavirin in Latino andNon-latino whites with hepatitis C. N Engl J Med 2009;360:257–267. [PubMed: 19144941]
23. Fontana RJ, Goodman ZD, Dienstag JL, et al. Relationship of serum fibrosis markers with liverfibrosis stage and collagen content in patients with advanced chronic hepatitis C. Hepatology2008;47:789–798. [PubMed: 18175357]
24. Giannini E, Zaman A, Kreil A, et al. Platelet count/spleen diameter ratio for the non-invasive diagnosisof esophageal varices: Results of a multicenter, prospective validation study. Am J Gastroenterol2006;101:2511–2519. [PubMed: 17029607]
25. Cardenas A, Pritchett S, Brown RS, Levin RA, Curry MP, Afdhal NH. The effects of long-term PEG-Interferon therapy on the Development of esophageal varices and variceal bleeding in patients withchronic hepatitis C and Advanced fibrosis: Final results from the CoPilot Trial. Gastroenterology(Abstract) 2009;136(Suppl 1):#259.
26. Lok ASF, Ghany MG, Goodman ZD, et al. Predicting cirrhosis in patients with chronic hepatitis Cbased on standard laboratory tests: Results of the HALT-C cohort. Hepatology 2005;38:518–526.[PubMed: 12883497]
27. Ghany MG, Lok ASF, Everhart JE, et al. Predicting Clinical outcome and Progression to cirrhosisusing standard laboratory Tests: Analysis of The HALT-C Cohort. Gastroenterology. 2009(accepted).
28. Bendsten F, Skovgard LT, Sorensen TIA, et al. Agreement among multiple observers on endoscopicdiagnosis of esophageal varices before bleeding. Hepatology 1990;11:341–347. [PubMed: 2312048]
Fontana et al. Page 13
Gastroenterology. Author manuscript; available in PMC 2011 June 1.
NIH
-PA Author Manuscript
NIH
-PA Author Manuscript
NIH
-PA Author Manuscript
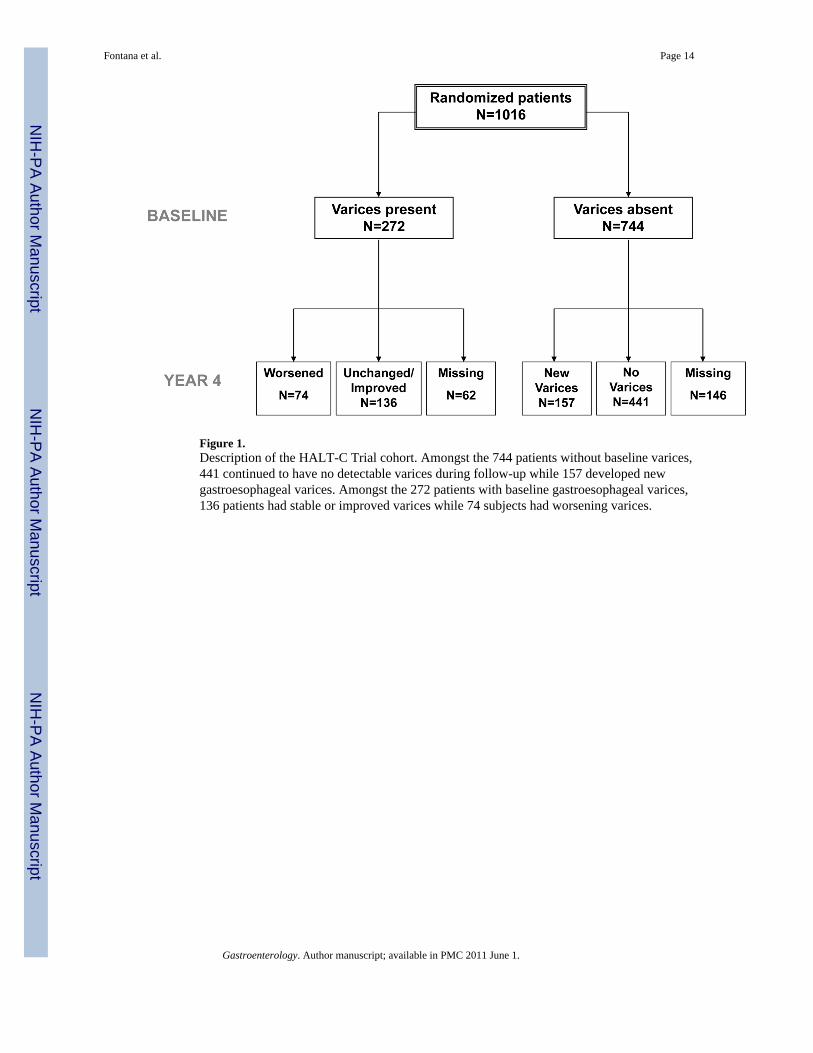
Figure 1.Description of the HALT-C Trial cohort. Amongst the 744 patients without baseline varices,441 continued to have no detectable varices during follow-up while 157 developed newgastroesophageal varices. Amongst the 272 patients with baseline gastroesophageal varices,136 patients had stable or improved varices while 74 subjects had worsening varices.
Fontana et al. Page 14
Gastroenterology. Author manuscript; available in PMC 2011 June 1.
NIH
-PA Author Manuscript
NIH
-PA Author Manuscript
NIH
-PA Author Manuscript
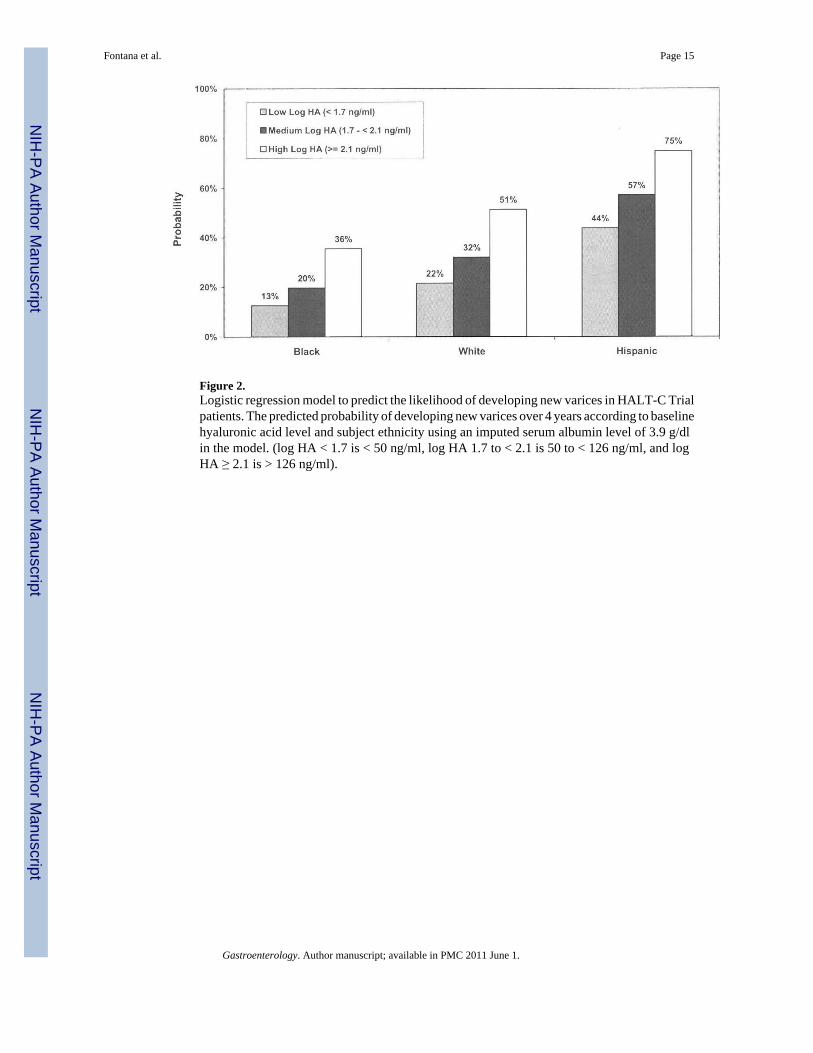
Figure 2.Logistic regression model to predict the likelihood of developing new varices in HALT-C Trialpatients. The predicted probability of developing new varices over 4 years according to baselinehyaluronic acid level and subject ethnicity using an imputed serum albumin level of 3.9 g/dlin the model. (log HA < 1.7 is < 50 ng/ml, log HA 1.7 to < 2.1 is 50 to < 126 ng/ml, and logHA ≥ 2.1 is > 126 ng/ml).
Fontana et al. Page 15
Gastroenterology. Author manuscript; available in PMC 2011 June 1.
NIH
-PA Author Manuscript
NIH
-PA Author Manuscript
NIH
-PA Author Manuscript
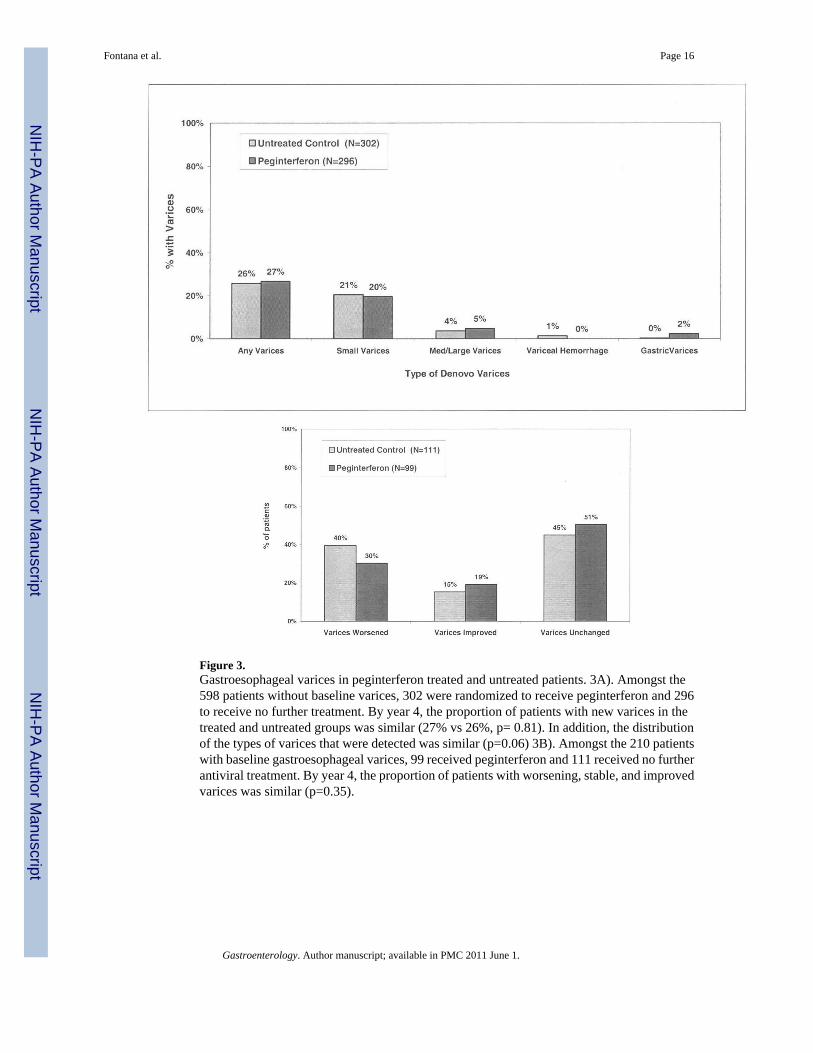
Figure 3.Gastroesophageal varices in peginterferon treated and untreated patients. 3A). Amongst the598 patients without baseline varices, 302 were randomized to receive peginterferon and 296to receive no further treatment. By year 4, the proportion of patients with new varices in thetreated and untreated groups was similar (27% vs 26%, p= 0.81). In addition, the distributionof the types of varices that were detected was similar (p=0.06) 3B). Amongst the 210 patientswith baseline gastroesophageal varices, 99 received peginterferon and 111 received no furtherantiviral treatment. By year 4, the proportion of patients with worsening, stable, and improvedvarices was similar (p=0.35).
Fontana et al. Page 16
Gastroenterology. Author manuscript; available in PMC 2011 June 1.
NIH
-PA Author Manuscript
NIH
-PA Author Manuscript
NIH
-PA Author Manuscript
NIH
-PA Author Manuscript
NIH
-PA Author Manuscript
NIH
-PA Author Manuscript
Fontana et al. Page 17
Tabl
e 1
Cha
ract
eris
tics o
f the
598
HA
LT-C
Tria
l pat
ient
s with
out g
astro
esop
hage
al v
aric
es a
t pre
treat
men
t scr
eeni
ng e
ndos
copy
Cha
ract
eris
ticA
ll pa
tient
sN
=598
De
Nov
ova
rice
sn=
157
Non
-pr
ogre
ssor
sn=
441
p-va
lue
*O
R (9
5%C
I)
Dem
ogra
phic
s
Age
(yrs
)50
.1 (7
.1)
50.9
(7.2
)49
.8 (7
.1)
0.10
1.02
(1.0
0,1.
05)
% M
ale
69%
68%
69%
0.77
0.94
(0.6
4,1.
40)
Rac
e0.
0003
%
His
pani
c6%
13%
4%3.
72(1
.89,
7.31
)
%
Bla
ck22
%19
%23
%0.
86(0
.54,
1.37
)
%
Cau
casi
an72
%68
%73
%1
Ref
Co-
mor
bidi
ties
% D
iabe
tes m
ellit
us23
%28
%22
%0.
111.
40(0
.92,
2.12
)
B
MI (
kg/m
2 )29
.8 (5
.3)
30.6
(5.5
)29
.5 (5
.2)
0.03
301.
04(1
.00,
1.07
)
%
Tru
ncal
obe
sity
51%
56%
49%
0.15
241.
31(0
.91,
1.90
)
%
Cur
rent
smok
er28
%24
%29
%0.
250.
78(0
.51,
1.19
)
Tota
l life
time
drin
ks15
358
(239
40)
1279
3(1
8289
)16
273
(256
14)
0.12
1.00
(1.0
0,1.
00)
% B
asel
ine
NSA
ID/C
ox-
2 In
hibi
tor
5%4%
5%0.
430.
69(0
.28,
1.72
)
% B
-Blo
cker
at b
asel
ine
7%7%
8%0.
840.
93(0
.46,
1.89
)
Gastroenterology. Author manuscript; available in PMC 2011 June 1.
NIH
-PA Author Manuscript
NIH
-PA Author Manuscript
NIH
-PA Author Manuscript
Fontana et al. Page 18
Cha
ract
eris
ticA
ll pa
tient
sN
=598
De
Nov
ova
rice
sn=
157
Non
-pr
ogre
ssor
sn=
441
p-va
lue
*O
R (9
5%C
I)
% S
tatin
s at b
asel
ine
1.3%
2%1%
0.44
1.70
(0.4
0,7.
19)
HC
V p
aram
eter
s
Prio
r HA
LT-C
stat
us0.
37
%
Non
-res
pond
er63
%67
%62
%1.
09(0
.68,
1.74
)
%
Bre
akth
ru/ r
elap
ser
17%
13%
18%
0.75
(0.4
0,1.
40)
%
Exp
ress
20%
20%
20%
1 R
ef
Log
HC
V R
NA
(IU
/ml)
6.5
(0.5
)6.
37 (0
.5)
6.54
(0.5
)0.
0004
0.52
(0.3
7,0.
75)
% H
CV
gen
otyp
e 1
94%
90%
95%
0.02
530.
45(0
.23,
0.91
)
Lab
orat
ory
para
met
ers
Hem
oglo
bin
(g/d
l)15
.0 (1
.4)
14.9
(1.6
)15
.1 (1
.4)
0.25
0.93
(0.8
2, 1
.05)
Seru
m A
ST/A
LT0.
85 (0
.3)
0.91
(0.3
)0.
83 (0
.3)
0.00
272.
55(1
.38,
4.7
0)
Alk
pho
s rat
io (U
LN)
0.82
(0.4
)0.
91 (0
.4)
0.79
(0.4
)0.
0011
2.12
(1.3
5, 3
.33)
Tota
l bili
rubi
n (m
g/dl
)0.
73 (0
.4)
0.81
(0.4
)0.
7 (0
.4)
0.00
142.
29(1
.38,
3.8
2)
INR
0.00
05
%
>1.
031
%42
%27
%1.
96(1
.34-
2.87
)
%
≤ 1
.069
%58
%73
%1
Ref
Alb
umin
(g/d
l)3.
93 (0
.4)
3.83
(0.4
)3.
96 (0
.3)
<.00
010.
33(0
.20,
0.5
7)
Gastroenterology. Author manuscript; available in PMC 2011 June 1.
NIH
-PA Author Manuscript
NIH
-PA Author Manuscript
NIH
-PA Author Manuscript
Fontana et al. Page 19
Cha
ract
eris
ticA
ll pa
tient
sN
=598
De
Nov
ova
rice
sn=
157
Non
-pr
ogre
ssor
sn=
441
p-va
lue
*O
R (9
5%C
I)
Plat
elet
s (10
3 /ml)
177
(61.
5)15
9 (6
7.9)
183
(57.
8)<.
0001
0.50
(0.3
6, 0
.70)
Tota
l Bile
aci
ds (u
mol
/l)14
.1 (1
6.5)
20.5
(24)
11.7
(12)
<.00
011.
03(1
.02,
1.0
4)
HO
MA
-IR
14.1
(17.
7)15
.2 (1
7.3)
13.7
(17.
9)0.
421.
00(0
.99,
1.0
2)
Log
HA
(ng/
ml)
1.89
(0.5
)2.
12 (0
.5)
1.81
(0.4
)<.
0001
4.69
(2.9
8, 7
.37)
% S
plen
omeg
aly
onul
traso
und
28%
38%
25%
0.00
181.
87(1
.26,
2.7
6)
Bas
elin
e H
isto
logy
% C
irrho
sis (
Isha
k 5/
6)32
%42
%29
%0.
0025
1.79
(1.2
3, 2
.62)
Mea
n H
AI B
asel
ine
7.4
(2.1
)7.
5 (2
)7.
4 (2
.1)
0.49
1.03
(0.9
4, 1
.13)
% H
epat
ic st
eato
sis ≥
242
%54
%37
%0.
0005
1.93
(1.3
3, 2
.78)
% M
allo
ry B
odie
s14
%21
%12
%0.
0064
1.95
(1.2
1, 3
.15)
% Z
one
3 fib
rosi
s0.
15
064
%67
%63
%0.
64(0
.30,
1.36
)
130
%25
%32
%0.
47(0
.21,
1.06
)
26%
38%
5%1
Ref
Ran
dom
ized
pha
se
% P
egin
terf
eron
arm
50%
50%
49%
0.81
1.05
(0.7
3,1.
51)
Gastroenterology. Author manuscript; available in PMC 2011 June 1.
NIH
-PA Author Manuscript
NIH
-PA Author Manuscript
NIH
-PA Author Manuscript
Fontana et al. Page 20
Cha
ract
eris
ticA
ll pa
tient
sN
=598
De
Nov
ova
rice
sn=
157
Non
-pr
ogre
ssor
sn=
441
p-va
lue
*O
R (9
5%C
I)
% C
linic
al o
utco
me
8%20
%4%
<0.0
001
5.46
(2.9
9,10
.01)
% T
wo-
poin
t inc
reas
e in
Isha
k fib
rosi
s sco
re26
%53
%18
%<0
.000
15.
20(3
.11,
8.68
)
Dat
a re
porte
d as
mea
n +
std
dev
or %
* com
parin
g de
nov
o vs
non
-pro
gres
sors
Gastroenterology. Author manuscript; available in PMC 2011 June 1.
NIH
-PA Author Manuscript
NIH
-PA Author Manuscript
NIH
-PA Author Manuscript
Fontana et al. Page 21
Tabl
e 2
Cha
ract
eris
tics o
f the
210
HA
LT-C
Tria
l pat
ient
s with
gas
troes
opha
geal
var
ices
at p
retre
atm
ent s
cree
ning
end
osco
py
Cha
ract
eris
ticA
ll pa
tient
sN
=210
Var
icea
lpr
ogre
ssor
sn=
74
Non
-pr
ogre
ssor
sn=
136
p-va
lue
*O
R (9
5% C
I)
Dem
ogra
phic
s
Age
(yrs
)50
.8 (7
.0)
51.5
(7.6
)50
.5 (6
.7)
0.35
1.02
(0.9
8, 1
.06)
% M
ale
78%
77%
79%
0.78
0.91
(0.4
6, 1
.79)
Rac
e0.
188
%
His
pani
c10
%15
%8%
1.88
(0.7
7, 4
.60)
%
Bla
ck9%
5%10
%0.
54(0
.17,
1.7
1)
%
Cau
casi
an81
%80
%82
%1
Ref
Co-
mor
bidi
ties
% D
iabe
tes m
ellit
us26
%28
%25
%0.
601.
19(0
.63,
2.2
5)
B
MI (
kg/m
2 )29
.8 (4
.5)
29.5
(4.4
)30
(4.6
)0.
440.
94(0
.80,
1.1
0)
%
Tru
ncal
obe
sity
50%
47%
52%
0.52
0.83
(0.4
7, 1
.47)
%
Cur
rent
smok
er26
%30
%24
%0.
331.
38(0
.73,
2.6
0)
To
tal l
ifetim
e dr
inks
2011
3 (3
6096
)25
283
(525
92)
1730
0 (2
2336
)0.
155
1.00
(1.0
0, 1
.00)
% B
asel
ine
NSA
ID/
Cox
-2 In
hibi
tor
4%3%
4%0.
540.
60(0
.12,
3.0
6)
% B
-Blo
cker
at
base
line
15%
19%
13%
0.28
1.53
(0.7
1, 3
.29)
% S
tatin
s at b
asel
ine
1%0%
1.5%
0.54
NA
Gastroenterology. Author manuscript; available in PMC 2011 June 1.
NIH
-PA Author Manuscript
NIH
-PA Author Manuscript
NIH
-PA Author Manuscript
Fontana et al. Page 22
Cha
ract
eris
ticA
ll pa
tient
sN
=210
Var
icea
lpr
ogre
ssor
sn=
74
Non
-pr
ogre
ssor
sn=
136
p-va
lue
*O
R (9
5% C
I)
HC
V p
aram
eter
s
Prio
r HA
LT-C
stat
us0.
28
%
Non
-res
pond
er63
%69
%60
%1.
29(0
.67,
2.5
1)
%
Bre
akth
ru/re
laps
e11
%7%
13%
0.57
(0.1
8, 1
.79)
%
Exp
ress
26%
24%
27%
1 R
ef
Log
HC
V R
NA
(IU
/ml)
% H
CV
gen
otyp
e 1
93%
97%
90%
0.08
63.
78(0
.83,
17.
24)
Lab
orat
ory
para
met
ers
Hem
oglo
bin
(g/d
l)15
.1 (1
.4)
14.8
(1.4
)15
.2 (1
.4)
0.06
80.
83(0
.67,
1.0
1)
Seru
m A
ST/A
LT0.
94 (0
.3)
1.03
(0.3
)0.
89 (0
.3)
0.00
145.
19(1
.87,
14.2
7)
Alk
pho
s rat
io (U
LN)
0.87
(0.4
)0.
92 (0
.4)
0.84
(0.4
)0.
189
1.65
(0.7
8, 3
.50)
Tota
l bili
rubi
n (m
g/dl
)0.
97 (0
.5)
1.10
(0.5
)0.
90 (0
.5)
0.00
652.
25(1
.26,
4.0
4)
INR
0.08
11
%
> 1
.060
%68
%55
%1.
69(0
.94,
3.0
6)
%
≤ 1
.040
%32
%45
%
Alb
umin
(g/d
l)3.
8 (0
.5)
3.7
(0.4
)3.
8 (0
.5)
0.04
870.
52(0
.27,
1.0
0)
Plat
elet
s (10
3 /ml)
132.
5 (6
0.7)
107.
8 (4
4.1)
146.
0 (6
4.3)
<0.0
001
0.24
(0.1
2, 0
.47)
Gastroenterology. Author manuscript; available in PMC 2011 June 1.
NIH
-PA Author Manuscript
NIH
-PA Author Manuscript
NIH
-PA Author Manuscript
Fontana et al. Page 23
Cha
ract
eris
ticA
ll pa
tient
sN
=210
Var
icea
lpr
ogre
ssor
sn=
74
Non
-pr
ogre
ssor
sn=
136
p-va
lue
*O
R (9
5% C
I)
Tota
l Bile
aci
ds(u
mol
/L)
22.4
(22)
26.7
(23.
7)20
.2 (2
0.8)
0.05
241.
01(1
.00,
1.0
3)
HO
MA
-IR
20.6
(29.
8)25
.8 (3
3.6)
17.6
(27.
2)0.
116
1.01
(1.0
0, 1
.02)
Log
HA
(ng/
ml)
2.18
(0.5
)2.
37 (0
.4)
2.09
(0.5
)<0
.000
12.
12(1
.47,
3.0
7)
% S
plen
omeg
aly
onul
traso
und
49%
62%
42%
0.00
622.
28(1
.26,
4.1
2)
Bas
elin
e E
ndos
copy
% G
astri
c va
rices
10%
29%
3%<0
.000
113
.2(4
.17,
41.
74)
Esop
hage
al v
arix
size
0.30
%
Gra
de 1
76%
70%
79%
1.03
(0.2
5, 4
.14)
%
Gra
de 2
19%
25%
16%
1.80
(0.4
1, 8
.03)
%
Gra
de 3
5%5%
5%1
Ref
Bas
elin
e H
isto
logy
% C
irrho
sis (
Isha
k5/
6)64
%78
%56
%0.
0015
2.86
(1.5
0, 5
.48)
Mea
n H
AI B
asel
ine
7.90
(2)
8.07
(2.1
)7.
82 (2
)0.
391.
06(0
.92,
1.2
3)
% H
epat
ic st
eato
sis ≥
240
%31
%46
%0.
0420
0.54
(0.3
0, 0
.98)
% M
allo
ry B
odie
s16
%14
%18
%0.
440.
73(0
.33,
1.6
2)
% Z
one
3 fib
rosi
s0.
40
065
%68
%64
%2.
43(0
.66,
8.9
8)
Gastroenterology. Author manuscript; available in PMC 2011 June 1.
NIH
-PA Author Manuscript
NIH
-PA Author Manuscript
NIH
-PA Author Manuscript
Fontana et al. Page 24
Cha
ract
eris
ticA
ll pa
tient
sN
=210
Var
icea
lpr
ogre
ssor
sn=
74
Non
-pr
ogre
ssor
sn=
136
p-va
lue
*O
R (9
5% C
I)
127
%28
%26
%2.
50(0
.63,
9.8
8)
28%
4%10
%1
Ref
Ran
dom
ized
pha
se
% P
egin
terf
eron
arm
47%
41%
51%
0.15
840.
66(0
.37,
1.1
7)
% C
linic
al o
utco
me
27%
49%
15%
<0.
0001
5.50
(2.8
5, 1
0.61
)
% T
wo-
poin
t inc
reas
ein
Isha
k fib
rosi
s sco
re40
%69
%32
%0.
0119
4.64
(1.4
0, 1
5.39
)
Dat
a re
porte
d as
mea
n +
std
dev
or %
* com
parin
g de
nov
o vs
non
-pro
gres
sors
Gastroenterology. Author manuscript; available in PMC 2011 June 1.


