Embed Size (px)
Citation preview

North Carolina Agricultural and Technical State University North Carolina Agricultural and Technical State University
Aggie Digital Collections and Scholarship Aggie Digital Collections and Scholarship
Dissertations Electronic Theses and Dissertations
2013
Fatigue Characterization Of Fire Resistant Syntactic Foam Core Fatigue Characterization Of Fire Resistant Syntactic Foam Core
Material Material
Mohammad Mynul Hossain North Carolina Agricultural and Technical State University
Follow this and additional works at: https://digital.library.ncat.edu/dissertations
Part of the Mechanical Engineering Commons
Recommended Citation Recommended Citation Hossain, Mohammad Mynul, "Fatigue Characterization Of Fire Resistant Syntactic Foam Core Material" (2013). Dissertations. 119. https://digital.library.ncat.edu/dissertations/119
This Dissertation is brought to you for free and open access by the Electronic Theses and Dissertations at Aggie Digital Collections and Scholarship. It has been accepted for inclusion in Dissertations by an authorized administrator of Aggie Digital Collections and Scholarship. For more information, please contact [email protected].

Fatigue Characterization of Fire Resistant Syntactic Foam Core Material
Mohammad Mynul Hossain
North Carolina A&T State University
A dissertation submitted to the graduate faculty
in partial fulfillment of the requirements for the degree of
DOCTOR OF PHILOSOPHY
Department: Mechanical Engineering
Major: Mechanical Engineering
Major Professor: Dr. Kunigal Shivakumar
Greensboro, North Carolina
2013

i
School of Graduate Studies
North Carolina Agricultural and Technical State University
This is to certify that the Doctoral Dissertation of
Mohammad Mynul Hossain
has met the dissertation requirements of
North Carolina Agricultural and Technical State University
Greensboro, North Carolina
2013
Approved by:
Dr. Kunigal Shivakumar
Major Professor
Dr. Mannur Sundaresan
Committee Member
Dr. Messiha Saad
Committee Member
Dr. Sanjiv Sarin
Dean, The Graduate School
Dr. Samuel P. Owusu-Ofori
Department Chair
Dr. Shamsuddin Ilias
Committee Member
Dr. Ivatury Raju
Committee Member
Dr. Claude Lamb
Committee Member

ii
© Copyright by
Mohammad Mynul Hossain
2013
iii
Biographical Sketch
Mohammad Mynul Hossain was born in Comilla, Bangladesh to Mr. Mohammad Abdul
Mannan and Rezia Begum.He earned his B.Sc in Mechanical Engineering from Bangladesh
University of Engineering & Technology, Dhaka, Bangladesh, in 2004. He received his M.Sc in
Mechanical Engineering from Kongju National University, South Korea, in 2008. From 2004 to
2006, he was employed at Akij Cement Company Ltd, Bangladesh as a Mechanical Engineer
(Shift Engineer) and later promoted to shift in-charge. At Akij Cement Company Ltd, His
responsibility was to supervise engineer and technician involved in production and maintenance
department.
He enrolled in the Department of mechanical Engineering Ph.D. program at the North
Carolina Agriculture and Technical State University in 2008. His research is in the area of
fatigue characterization of a fire resistant syntactic foam core for sandwich structure.

iv
Dedication
I dedicate this success to my father, late Mr. Mohammad Abdul Mannan and my mother, Rezia
Begum.

v
Acknowledgements
I wish to express my sincerest gratitude to the many individuals who supported and
encouraged me both professionally and personally for the completion of this work. Foremost, I
would like to thank my advisor Professor Dr. Kunigal Shivakumar. Admittedly, without his
continued support, encouragement, patience and valuable advice, this work would not be
possible. I greatly acknowledge to my committee members Dr. Mannur Sundaresan, Dr. Messiha
Saad, Dr. Shamsuddin Illias and Dr. Ivatury Raju for reviewing my work and offering many
useful recommendations.
I expressed my sincerest gratitude to the Center for Composite Materials Research
(CCMR) at the North Carolina A&T State University and the Department of Mechanical
Engineering for the opportunity to enroll me in this program. This research has been supported
and funded by various organizations including Office of Naval Research (Dr. Yapa Rajapakse),
U.S. Army Research Office (Dr. Larry Russell) and NASA university Research Center (URC)-
Center for Aviation Safety (CAS). I greatly acknowledge these organizations and personnel for
their financial and technical support to accomplish this research work. I would like to thank
CCMR staff, especially, Mr. Matthew Sharpe and Mr. John Skujins, Dr. Shivalingappa Lingaiah
for various assistance in completion of this work. It is my pleasure to acknowledge the
contribution of my lab mates and, senior alumni specially Dr. Raghu Pandurangha, Dr. Jogi
Gauwda, Dr. Paul Akangah, ABSM Rupan Talucdher, Anthony Cunningham, Hiba Ahmed, Rafid
Kully and Kazi Al Imran for their support.
Finally, I would like to express my deepest appreciation to my parents, my wife Hoshna
Ara Ovi and other family members for their lifelong sacrifices and belief in me. Their consistent
mental support, love and affection always played a significant role in my journey in life.

vi
Table of Contents
List of Figures………………………………………………………………………………...…...x
List of Tables……………………………………………………………………………….…...xiv
List of Symbols…………………………………………………………………………………..xv
Abstract ........................................................................................................................................... 2
CHAPTER 1 Introduction............................................................................................................... 4
1.1 Background of Syntactic Foams and Eco-Core .................................................................... 4
1.2 Fatigue Test Parameters ........................................................................................................ 8
1.2.1 Loading condition.............................................................................................................. 8
1.2.2 Test control mode. ............................................................................................................. 9
1.2.3 Stress ratio. ...................................................................................................................... 10
1.2.4 Loading frequency. .......................................................................................................... 11
1.2.5 Test temperature. ............................................................................................................. 11
1.2.6 Waveform. ....................................................................................................................... 11
1.3 Fatigue Life Models for Sandwich Structures .................................................................... 12
1.3.1 stress versus number of cycles (S-N) model. .................................................................. 12
1.3.2 Strength degradation model............................................................................................. 15
1.3.3 Stiffness reduction model. ............................................................................................... 16
1.3.4 Cumulative damage model for variable amplitude loading. ........................................... 20
1.4 Fatigue Test Methods for Foam Cores and Sandwich Beam .............................................. 23
1.4.1 Compression-compression or tension-tension fatigue test methods. .............................. 23

vii
1.4.2 Shear and flexural fatigue test methods. ......................................................................... 24
1.5 Literature Review ................................................................................................................ 24
1.5.1 Compression-compression fatigue. ................................................................................. 24
1.5.2 Shear fatigue. ................................................................................................................... 26
1.5.3 Flexural fatigue................................................................................................................ 27
1.6 Challenges and Gaps ........................................................................................................... 29
1.7 Test Concept and Methodology .......................................................................................... 30
1.8 Objectives of the Research .................................................................................................. 31
1.9 Scope of the Dissertation .................................................................................................... 31
CHAPTER 2 Compression-Compression Fatigue Characterization ............................................ 33
2.1 Introduction ......................................................................................................................... 33
2.2 Eco-Core Materials ............................................................................................................. 33
2.3 Compression Static Test and Test Results .......................................................................... 37
2.4 Fatigue Test ......................................................................................................................... 40
2.5 Fatigue Test Results and Discussion ................................................................................... 43
2.5.1 Failure criteria and associated failure lives. .................................................................... 43
2.5.2 Stress-N diagram. ............................................................................................................ 47
2.5.3 Stress ratio effect. ............................................................................................................ 50
2.5.3.1 Stress versus N. ...................................................................................................... 51
2.5.3.2 Stress range versus N. ............................................................................................ 52

viii
2.5.3.3 Mean stress versus N. ............................................................................................ 52
2.6 Summary ............................................................................................................................. 53
CHAPTER 3 Shear Fatigue Characterization ............................................................................... 55
3.1 Introduction ......................................................................................................................... 55
3.2 Material System................................................................................................................... 55
3.3 Design of Specimen ............................................................................................................ 56
3.4 Fabrication of Sandwich Panel and Specimen .................................................................... 59
3.5 Static Shear Test, Results and Discussion ........................................................................... 60
3.6 Shear Fatigue Test ............................................................................................................... 63
3.7 Fatigue Test Results and Discussions ................................................................................. 65
3.7.1 Failure modes and associated failure lives. ..................................................................... 65
3.7.2 Stress analysis near face sheet-core interface region. ..................................................... 68
3.7.3 S-N Diagram. Normalized shear stress (τmax/τc) versus number of load cycles (N) ....... 71
3.8 Summary ............................................................................................................................. 74
CHAPTER 4 Flexural Fatigue Characterization........................................................................... 75
4.1 Introduction ......................................................................................................................... 75
4.2 Material System................................................................................................................... 76
4.3 Design of Specimen ............................................................................................................ 76
4.4 Static Flexural Test and Results .......................................................................................... 78
4.5 Stress Analysis Near Face Sheet-Core Interface Region .................................................... 82

ix
4.6 Fatigue Test ......................................................................................................................... 83
4.7 Fatigue Test Results and Discussions ................................................................................. 85
4.7.1 Failure definition and associated failure lives ................................................................. 85
4.7.2. S-N diagram. .................................................................................................................. 89
4.8 Summary ............................................................................................................................. 92
CHAPTER 5 Concluding Remarks and Recommendation for Future Work ............................... 94
5.1 Conclusions ......................................................................................................................... 94
5.1.1 Compression-compression fatigue. ................................................................................. 94
5.1.2 Shear fatigue. ................................................................................................................... 95
5.1.3 Flexural fatigue................................................................................................................ 96
5.2 Recommendations for Future Works .................................................................................. 97
5.2.1 Development of new test method for high cyclic frequency loading. ............................. 97
5.2.2 Development of fatigue life prediction model for variable amplitude loading. .............. 97
5.2.3 Extend the study to tension-compression loading. .......................................................... 98
References ..................................................................................................................................... 99
Appendix A .................................................................................................................................. 108
Appendix B .................................................................................................................................. 116
Appendix C .................................................................................................................................. 135
Appendix D.................................................................................................................................. 140
x
List of Figures
Figure 1.1. SEM image of conventional syntactic foam [9]. .......................................................... 6
Figure 1.2. Structural difference between Conventional syntactic foam and Eco-Core. ................ 8
Figure 1.3. Three different fatigue loading conditions. .................................................................. 9
Figure 1.4. Nomenclature of different load ratio. ......................................................................... 10
Figure 1.5. Nomenclature for constant stress amplitude loading. ................................................. 13
Figure 1.6. Typical S-N diagram. ................................................................................................. 13
Figure 1.7. Normalized load Vs normalized number of cycles in sandwich composites under
displacement control fatigue with logarithmic fit [59]. ................................................................ 19
Figure 1.8. Schematic illustration of determination of residual life: two-step loading [36]. ........ 21
Figure 1.9. Eco-Core panel and test specimen configuration and loading. .................................. 30
Figure 2.1. Steps in fabricating Eco-Core panel…………………………………………… ……34
Figure 2.2. Compression test specimen. ....................................................................................... 34
Figure 2.3. Specimen layout. ........................................................................................................ 35
Figure 2.4. Specimen selection process from panel 1: (a) Specimens numbered according to
specimen number in specimen layout; (b) Specimen numbered according to ascending order of
specimen density. .......................................................................................................................... 36
Figure 2.5. SEM image of Eco-Core. ........................................................................................... 37
Figure 2.6. Machine setup for compression static and fatigue test. .............................................. 38
Figure 2.7. Static compression stress-strain responses of specimens (panel 1). ........................... 39
Figure 2.8. Onset, propagation and final failure images of static compression samples, panel 1. 40
Figure 2.9. Compression-compression fatigue loading. ............................................................... 42

xi
Figure 2.10. Typical compliance versus cycles response of a C-C fatigue test with definition of
three types of failure. .................................................................................................................... 44
Figure 2.11. Compliance versus number of cycles (N) and the fatigue lives based on the three
failure criteria. ............................................................................................................................... 46
Figure 2.12. Successive failure of the specimen (M-18) for σmin/σc =0.85 and R=10. .............. 47
Figure 2.13. Normalized stress (σmin/σc) versus number of load cycles (N) for R=10 along with
least square equation fit. Also shown is the equation with rounded off (solid line) constants. .... 48
Figure 2.14. Comparison of S-N equation with experimental data for R= 10, with constants
rounded off. ................................................................................................................................... 49
Figure 2.15. Comparison of equation with experiment for R=5, with constants in equation are
rounded off. ................................................................................................................................... 49
Figure 2.16. Normalized stress versus N for R= 10 and 5 for 2% compliance change. ............... 51
Figure 2.17. Normalized stress range versus N for 2% compliance change for R= 10 and 5. ..... 52
Figure 2.18. Normalized mean stress versus N for 2% compliance change for R= 10 and 5. ..... 53
Figure 3.1. (a) Schematic of test specimen, loading and nomenclature (b) Shear force diagram (c)
Bending moment diagram…………………………………………………………………..........57
Figure 3.2. Failure load versus span/depth (S/d) ratio for Eco-Core sandwich beam based on two
failure criteria. ............................................................................................................................... 58
Figure 3.3. Steps for fabricating face sheet. .................................................................................. 59
Figure 3.4. Steps for fabricating Eco-Core sandwich panel. ........................................................ 60
Figure 3.5. Short beam shear test setup. ....................................................................................... 61
Figure 3.6. Load-deflection responses of short beam test specimens. .......................................... 62

xii
Figure 3.7. Typical static failure modes in Eco-Core sandwich beam (Crack is highlighted by
white line). .................................................................................................................................... 63
Figure 3.8. Typical shear fatigue loading (R=0.1). ....................................................................... 65
Figure 3.9. Compliance versus number of cycles (N) and the fatigue lives based on the three
failure criteria. ............................................................................................................................... 66
Figure 3.10. Successive failure of the specimen (SSP-12) for τmax/τc = 0.80 (crack is highlighted
by white line). ............................................................................................................................... 67
Figure 3.11. Types of shear fatigue failure. .................................................................................. 68
Figure 3.12. Stress state near the support and load points for delamination failure. .................... 68
Figure 3.13. Shear stress distribution at section A, B, and C. ...................................................... 69
Figure 3.14. Normal stress distribution at section A, B, and C. ................................................... 70
Figure 3.15. Through the thickness shear stress distribution for X= 0, tf/3, 2tf/3, tf, 2tf and 4tf. .. 70
Figure 3.16. Maximum shear stress at the interface against X. .................................................... 71
Figure 3.17. Normalized stress (τmax/τc) versus number of load cycles test data and the power law
equation for three failure criteria. ................................................................................................. 72
Figure 3.18. Comparison of S-N equation with the experimental data for 2%, 5% and 7%
compliance failure criteria. ........................................................................................................... 73
Figure 4.1. (a) Schematic of test specimen, loading and nomenclature (b) Shear force diagram (c)
Bending moment diagram………………………………………………………………………..77
Figure 4.2. Failure load versus span/depth(S/d) ratio for Eco-Core sandwich beam based on shear
and flexural failure criteria. ........................................................................................................... 78
Figure 4.3. Flexural test setup. ...................................................................................................... 80
Figure 4.4. Stress versus deflection responses of flexural tests. ................................................... 81

xiii
Figure 4.5. Typical static failure modes in Eco-Core sandwich beam specimen FSP-20 (Crack is
highlighted by white line). ............................................................................................................ 81
Figure 4.6. Shear stress distribution at section A, B, and C. ........................................................ 83
Figure 4.7. Normal stress distribution at section A, B, and C. ..................................................... 83
Figure 4.8. Typical flexural fatigue loading (R=0.1). ................................................................... 84
Figure 4.9. Compliance versus number of fatigue cycles (N) and the fatigue lives based on the
three values (1%, 5% and 7% ) of compliance change failure criteria. ........................................ 88
Figure 4.10. Typical flexural fatigue failure sequence of a specimen (FSP-21) for σmax/σct =
0.80 (crack is highlighted by white line). ..................................................................................... 88
Figure 4.11. Comparison of normalized stress σmax/σct versus number of load cycles from
experiment and equation for 1%, 5% and 7% change in compliance failure criteria. .................. 91
Figure 4.12. Comparison of modified stress versus number of cycle equation with the experiment
for the three failure criteria. .......................................................................................................... 91

xiv
List of Tables
Table 2.1 Test Specimen and Properties ....................................................................................... 40
Table 2.2 Compression-Compression Fatigue Test Specimen and Loading for R=10, Panel 1(σc =
-18.9 MPa) .................................................................................................................................... 42
Table 2.3 Compression-Compression Fatigue Test Specimen and Loading for R=5, Panel 2(σc =
-20.3 MPa) .................................................................................................................................... 43
Table 2.4 Compression-Compression Fatigue Test Result for R= 10, panel 1 ............................ 45
Table 2.5 Compression-Compression Fatigue Test Result for R= 5, panel 2 .............................. 46
Table 2.6 Constants in the S-N Equation and Endurance Limit for R= 10 and 5 ......................... 50
Table 3.1 Material Properties of Eco-Core and Face-sheet [12]…...……………………………57
Table 3.2 Summary of Static Shear Strength Test ........................................................................ 62
Table 3.3 Shear Fatigue Test Plan (R = 0.1, τc = 4.23 MPa) ........................................................ 64
Table 3.4 Shear Fatigue Equation Constants ................................................................................ 67
Table 3.5 Flexural Static Test Results .......................................................................................... 73
Table 4.1 Flexural Static Test Results…………………………………………………………...79
Table 4.2 Flexural Fatigue Test Plan for R=0.1(σct = 9.97 MPa) ................................................. 85
Table 4.3 Flexural Fatigue Test Results for R=0.1(σct = 9.97 MPa) ............................................ 87
Table 4.4 Flexural Fatigue Equation Constants ............................................................................ 92

xv
List of Symbols
σc = Core compression strength
∆σ = Stress range
σmin = Minimum applied stress
σmax = Maximum applied stress
σmean = Mean applied stress
R = Load ratio or stress ratio
tc = Core thickness.
tf = Face sheet thickness.
d = Sandwich thickness.
S = Span of the beam.
b = Width of sandwich beam.
e = Edge distance from the support point.
Pf = Failure load.
D = Flexural rigidity of the sandwich beam.
Ec = Core elastic modulus (Tensile).
Ect = Core tensile elastic modulus.
Ef = Face sheet elastic modulus.
σct = Core tensile or flexural strength.
σult = Core ultimate flexural strength.
τc = Core shear strength.
τmax = Core maximum shear stress.
τmax = Core minimum shear stress.

xvi
Pmax = Maximum applied cyclic load in a single cycle.
Pmin = Minimum applied cyclic load in a single cycle.
dmax = Displacement for the maximum applied cyclic load Fmax.
dmin = Displacement for the minimum applied cyclic load Fmin.
N = Number of cycles.
N1% = Onset life based on 1% compliance change (for flexure load).
N2% = Onset life based on 2% compliance change (for compression and shear load).
N5% = Propagation life based on 5% compliance change.
N7% = Total life based on 7% compliance change.
Ao = The material property constant.
α = Slope of the stress versus number of cycles curve.
*All the symbols listed here are from chapter 2 to chapter 4.

2
Abstract
Eco-Core is a fire resistant material for sandwich structural application; it was developed at NC
A&T State University. The Eco-Core is made of very small volume of phenolic resin and large
volume of flyash by a syntactic process. The process development, static mechanical and
fracture, fire and toxicity safety and water absorption properties and the design of sandwich
structural panels with Eco-Core was established and published in the literature. One of the
important properties is needed for application in transportation vehicles is the fatigue
performance under different stress states. Fatigue data are not available even for general
syntactic foams. The objective of this research is to investigate the fatigue performance of Eco-
Core under three types of stress states, namely, cyclic compression, shear and flexure, then
document failure modes, and develop fatigue life equations for predicting life of Eco-Core
sandwich panels. Compression-Compression fatigue was performed directly on Eco-Core
cylindrical specimen, whereas shear and flexure fatigue tests were performed using sandwich
beam made of E glass-Vinyl Ester face sheet and Eco-Core. Compression-compression fatigue
test was conducted at two values of stress ratios (R=10 and 5) at the maximum compression
stress (σmin) range of 60% to 90% of compression strength (σc = 19.6 ± 0.25 MPa) for R=10 and
80% to 95% of compression strength for R=5. The failure modes were characterized by the
material compliance change: On-set (2% compliance change), propagation (5%) and ultimate
failure (7%). The number of load cycles correspond to each of these three damages were
characterized as on-set, propagation and total lives. A similar approach was used in shear and
flexure fatigue tests with stress ratio of R=0.1. The fatigue stress-number of load cycles data
followed the standard power law equation for all three stress states. The constant of the equation
were established for all three stress states and three failure modes. The fatigue life equation was

3
used to estimate endurance limit (106 cycles) of the material. Like metallic materials, the
compression fatigue life of Eco-Core was found to be dependent on the stress range instead of
maximum or mean cyclic stress. Furthermore shear and flexural ultimate failure of the core
material was found to be due to a combination of shear and tensile stresses.

4
CHAPTER 1
Introduction
A background of foam core sandwich composites including syntactic foams and Eco-
Core is presented. A review of fatigue test parameters, fatigue life models for characterization of
foam core sandwich composites and general fatigue test methods are discussed. A literature
survey on fatigue characterization of different metallic and polymeric foam core sandwich
composite is also presented. Finally, challenges and technology gaps in the syntactic foam core
sandwich beams, objective of the research, the scope of the dissertation are described.
1.1 Background of Syntactic Foams and Eco-Core
Sandwich structure core materials have received considerable amount of attention in
recent years. This is because of their low density and unique functional properties such as impact
energy absorption, sound absorption and high temperature tolerance. They are growing in use in
sandwich structures, crash protection devices and the weight sensitive structural parts in
transportation and aerospace applications. In sandwich structures, light weight core is covered on
either side by two thin but stiff face sheets which are adhesively bonded or co-cured. The core is
relatively thick, and carries the compression and shear loadings. The face sheet made of high
strength and stiffness materials is relatively thin (1/10~1/20 of core thickness) and it carries the
bending loads. The adhesive layer thickness is generally neglected as it is much smaller
compared to face sheet or core thickness. The properties of sandwich composite mainly depend
on the properties of the core and face sheets, their relative thicknesses and the integrity of bond
between the two.
A variety of core materials are used in the composites industry. In aerospace applications
honeycomb cores made from aluminum, phenolic-resin impregnated fiberglass, paper,

5
polypropylene and Aramid fiber are extensively utilized. Structures that are less weight critical
and where cost is an important factor, core materials of end-grain balsa, closed-cell foams made
from thermoplastics such as PVC or polyimide, carbon foams and syntactic foams are widely
used. End-grain balsa wood is not suitable for complex shape construction. Besides, balsa wood
suffers from non-uniform density, moisture swelling, rotting, and poor shear and transverse
tension strengths. Plastic foams releases noxious gases when exposed to fire [1].
Syntactic foam is a special type of particulate composite where hollow spherical particles
are bonded by matrix material. Here, matrix is considered to be the binder for the fillers. Matrix
material can be made of metal, ceramic and polymers [2]; whereas filler particle can be made of
hollow glass, carbon, steel, aluminum and polymer microbubbles of varying sizes (1 to 350 µm)
[3, 4]. Polymeric matrices are of two types: thermoset and thermoplastic resin. Thermoset resins
include epoxy resin, unsaturated polyesters, vinyl esters, phenolics, polyurethanes, and silicones.
Thermoplastic resins are polyethylene, polystyrene, polyvinyl chloride, etc. Syntactic foams
possess lower density compared to solid particulate or the matrix material, generally lower than 1
g/cc, which make the material to be buoyanent applications.
Syntactic foams are usually a two phase material, matrix and microballoons. However,
during fabrication some air or gases can be entrapped within the matrix. The micro structure of
syntactic foams under Scanning Electron Microscope (SEM) is shown in Figure 1.1. The
syntactic foams are macroscopically isotropic [5] and its properties can be tailored by varying its
density. This density variation is achieved in two different ways. One is by varying the radius
ratio of different microballoons [6] and other is by changing the volume fraction [7] of
microballoons in the structure. Processing and mechanical properties of syntactic foam have
been investigated by a number of researchers for example [6, 8-12]. Effect of fiber reinforcement

6
on mechanical properties of syntactic foam has also been studied in [13-16] and found that a
small amount of fibers reinforcement is required to increase fracture toughness. Nanoclay
reinforcement was investigated in [18].
Figure 1.1. SEM image of conventional syntactic foam [9].
A number of properties such as high specific compressive strength [18], low moisture
absorption and excellent damping properties [19, 20], higher thermal [21] and electrical
insulation [22] properties, self-healing [23] and radar transparent [24] properties make syntactic
foams suitable for many structural applications compared to open cell structural foams or balsa
[2]. Syntactic foams were initially developed as buoyancy aid materials for deep sea applications
[25]. They are now found to be useful in marine, aerospace, petroleum and mass transport
industries [26, 27]. Although Syntactic foams are multi-functional composites and can be
fabricated in a functionally graded configuration, but there are many limitations such as

7
brittleness, joining, repair, higher density and susceptibility to fire.
Although the general polymeric syntactic foams have found to have wide application in
marine, aerospace and other transportation industries, the main problems is its susceptibility to
fire. These foams contain about 50% weight of resin or 43 to 50% of gross weight of volatiles
(depending on the char yield of resin), which fuels the fire once a fire is started. As a solution to
this fire problem, Shivakumar et al. [11] developed a special class of syntactic foam called “Eco-
Core”. Eco-Core contains very low percent of volatiles (3-6% by weight) and the matrix material
is dispersed in a large volume of inert material that makes the material to be fire tolerant.
Another difference between Eco-Core and conventional syntactic foam is that the microbubbles
are coated with a thin layer of high char resin to make sphere to sphere contact while the general
syntactic foam is mixed and casted. Microbubbles used in Eco-Core are Cenospheres that it is
extracted from fly ash produced by coal burn electric thermal power plants. The Figure 1.2
shows the structural difference between conventional syntactic foam and Eco-Core. Major
highlights of Eco-Core are:
Inexpensive and manufactured from a waste product
Excellent fire resistant
Nontoxic in fire
Superior mechanical properties
Good thermal and sound insulator
Adaptable to existing manufacturing facility.
Moldable and shapeable.
Potential field of application for Eco-Core material is in sandwich structures as a fire
containment structures in marine ships, mass transportation structures (subway train), fire walls

8
in buildings, automobiles, and anywhere where fire is a major concern.
Figure 1.2. Structural difference between Conventional syntactic foam and Eco-Core.
The processing, static mechanical, fire and toxicity properties of Eco-Core material as
well as energy absorption and sea water resistance are presented in [1, 11, 15, 28]. Design of
sandwich panels with Eco-Core is presented in [12]. All transportation structures are subjected to
vibration or cyclic loads and fatigue performance of Eco-Core under various stress states needs
to be established before it can be used in structural applications.
1.2 Fatigue Test Parameters
There are several parameters that have greater or less influence on fatigue life and failure
modes of materials. These parameters include loading condition, test control mode, stress ratio,
loading frequency, waveform, test temperature, etc. In designing the fatigue test program,
decision should be made taking into account the influence of these parameters. Influences of
above parameters are discussed below.
1.2.1 Loading condition. Composite structures are rarely subjected to uniform constant
amplitude loading in service. The load could fluctuate randomly according to a vehicle operation
and environmental condition thus creating a load spectrum. This type of loading could be
presented as a series of block loading. Different fatigue loading conditions are schematically
shown in Figure 1.3.
(a) Conventional syntactic foam
Microballoon
Matrix Void
Resin coated
Microballoon
(b) Eco-Core

9
Figure 1.3. Three different fatigue loading conditions.
In literature, several articles are available on fatigue behavior of laminate composites
under block loading [29-31], variable amplitude loading [32] and multi-axial loading conditions
[33-35]. However, limited results are available on fatigue behavior of foam core and foam core
sandwich composite [36] and none on variable amplitude loading and multi-axial fatigue
loading. Clark et al. [36] investigated the fatigue behavior of Airex C70.130 foam core sandwich
beams under two-step and block loading conditions using four-point bending. They used a
combination of low-high and high-low loads to investigate the influence of load sequence on
fatigue life. Clark et al. concluded that load sequence affects the fatigue life and a high/low load
combination is more damaging than a low/high load combination. So, loading pattern plays a
significant role in fatigue failure behavior and life prediction of composite materials.
1.2.2 Test control mode. Fatigue test can be performed under load or displacement (or
strain) control. In load control mode, load is kept constant, deformation of the material increased
with increasing number of load cycles as damage accumulated in the material and finally
material fails. The load control mode is preferred for establishing S-N equation, to examine the
load sequence effect on fatigue life [29-31] and also for applying a spectrum loading on a
specimen or structural component [32]. On the other hand, displacement control is used in case
of smooth damage development. In this case the specimen cyclic displacement is kept constant
Cycles, N Cycles, N Cycles, N
Str
ess,
σ
Str
ess,
σ
Str
ess,
σ
(a) Constant amplitude loading (b) Variable amplitude loading (c) Block loading
Low-high sequence

10
and the load decreases continuously with number of cycles. Therefore the examined material
does not fail suddenly. Displacement control mode is preferred in testing fatigue crack
propagation studies [37].
1.2.3 Stress ratio. (R= σmin/σmax) is defined as the ratio of minimum cyclic stress to
maximum cyclic stress. It helps to determine whether the applied load is tensile or compressive
or a combination of both which are schematically shown in Figure 1.4.
Figure 1.4. Nomenclature of different load ratio.
R<0 corresponds to a fatigue test with either compression-tension or tension-compression
loading. 0<R<1 represent the fatigue test under tension-tension loading and R>1 corresponds to
a fatigue test under compression-compression loading. Composite materials behave differently
under tension fatigue and under compression fatigue because their mechanisms are different
under these loading conditions, which in turn reflect the stress ratio effect [38]. Therefore, the
σmax
σmin
σmax
σmin
σmax
σmin
0<R<1
R<0
R>1
Ten
sio
n (
+)
Time
Co
mp
ress
ion
(-)
R=σmax
σmin
Tension-Tension
Tension-Compression
Compression-Compression

11
successful design of a testing program requires correct selection of loading cases, in keeping
with the application for which the material is intended.
1.2.4 Loading frequency. In contrast to metallic materials, fatigue life of composite
materials is considerably affected by the loading frequency. Several researchers concluded that
the dependence of fatigue life on loading frequency is due to the heating of the material at higher
frequencies, or creep fatigue at lower frequencies, or the interaction of both [39-44]. Mechanical
energy dissipated during each stress-strain hysteresis loop is transformed into heat causing
greater rise of localized temperature in the material. When this energy cannot be dissipated into
the environment, it rises the temperatures of the specimen close to or even higher than the glass
transition temperature of the matrix that in turn reduces the fatigue life of the specimen. This is a
common phenomenon that researchers have observed at high loading frequency tests. Standards
concerning the development of S-N curves for laminate and sandwich composite materials [45],
provides no specific direction about loading frequency concern. The only prerequisite is that no
significant changes in temperature must be observed.
1.2.5 Test temperature. For most of the testing programs in the literature, experimental
results were obtained under ambient temperature conditions. This is because this type of test is
simpler, less expensive, and provides basic information about material fatigue behavior.
However, in practice, structures are subjected to combined thermo-mechanical loading [47] and
therefore information about fatigue behavior of the structures under similar conditions is
important to meet the design requirement. In general, fatigue strength of composite materials
decreases with increased temperature of the composite materials.
1.2.6 Waveform. The shape of the applied waveform can affect the fatigue results. The
sinusoidal waveform is the most commonly used since it can be easily generated and can be

12
assumed to be more realistic one compared to other types of loading that represent sudden
changes, like the triangular, step (square) and saw-tooth waveforms.
In the present basic fatigue characterization, constant amplitude, load control test at room
(ambient) temperature under three types of loading are conducted. The loadings are:
compression-compression, shear, and flexure with R ratio of 10, 5, 0.1 and 0.1, respectively.
1.3 Fatigue Life Models for Sandwich Structures
In literature, there are several fatigue life models for sandwich structures were reported.
These models are typically based on Stress versus number of cycles (S-N) diagram, strength
degradation, stiffness reduction, cumulative damage model, or combination of these approaches.
A brief description of these approaches is discussed:
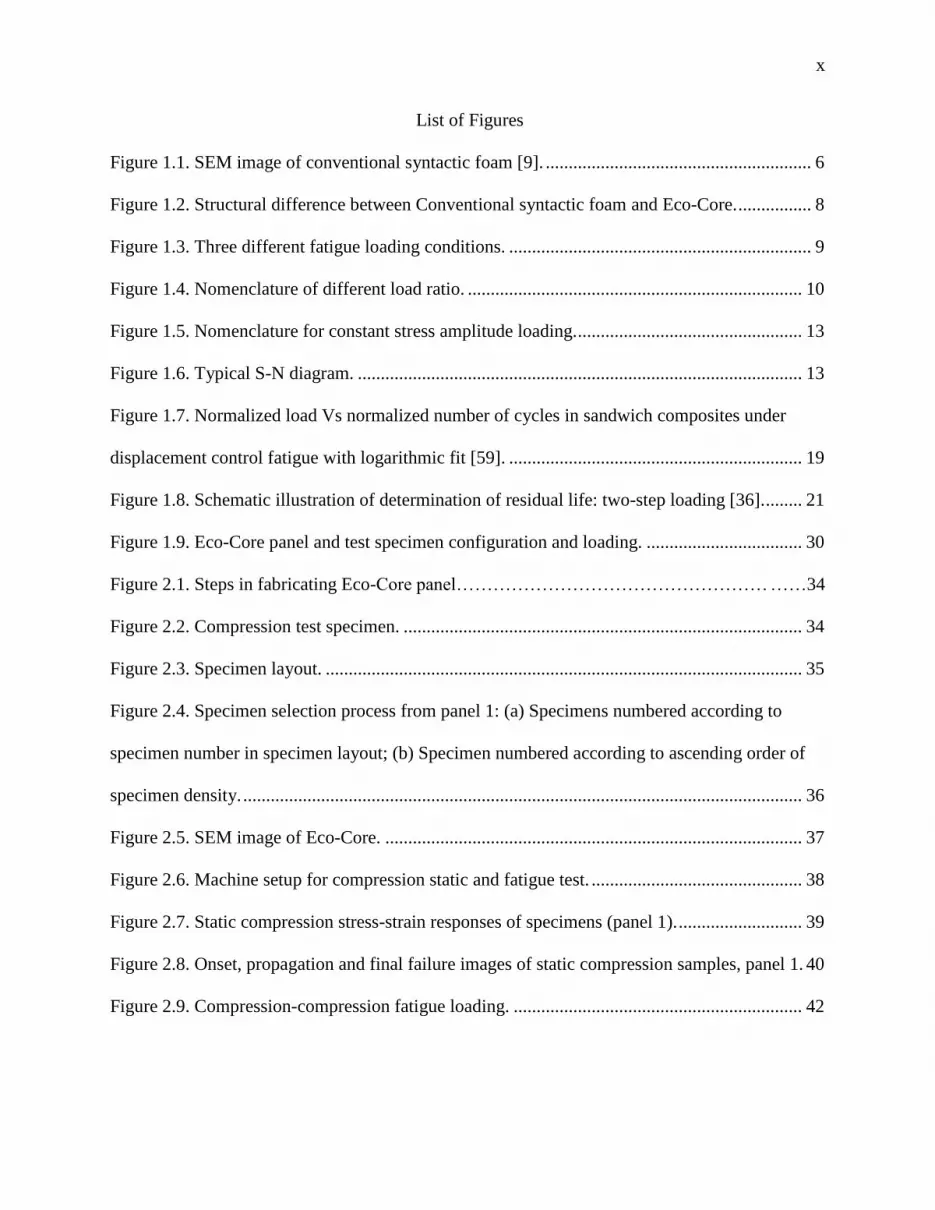
1.3.1 stress versus number of cycles (S-N) model. The S-N approach is based on a
simple curve fit to the experimental data of stress to number of cycles to cause failure. This is a
commonly used approach to establish the endurance limit. In S-N approach, the test specimens
are loaded in constant amplitude i.e. load between maximum (σmax) or minimum stress (σmin)
until the specimen fails by a defined failure. The mean stress (σmean), and stress amplitude (σamp)
are calculated by the equations (1.1) and (1.2), respectively. All this terms are illustrated in
Figure 1.5.
(1.1)
(1.2)
The typical S-N plot (linear scale) is shown in Figure 1.6. In S-N diagram, the total life of
the specimen is plotted, where total life defines the number of cycles required to fatigue crack
initiation plus the number of cycles required to propagate the fatigue crack up to final failure.
The stress, σ in equations (1.1) and (1.2) can be replaced by strain or even stress intensity factor
13
depending on type of the model needed.
Figure 1.5. Nomenclature for constant stress amplitude loading.
Figure 1.6. Typical S-N diagram.
In constant amplitude loading, many engineering materials show a plateau in S-N curve
after 106 or 10
7 cycles. At this load (stress) level, the specimen is assumed to take infinite number
of load cycles before failure. This load/stress is called threshold level or endurance limit (106 or
107
cycles). After this threshold level, the test is generally stopped and the corresponding results
are represented by an arrow in S-N plot (Figure 1.6) indicating that material is not failed.
Under constant amplitude loading, the fatigue life of a material may change radically
Time
σmin
σamp
σmean
σmax
σ
0
Cycles
Number of Cycles (N)
Str
ess
(S)

14
when the applied minimum load or load amplitude is changed while maintaining the same
maximum applied load. To overcome this problem, the load ratio, R is introduced which is
defined by equation (1.3). The fatigue characterization of a new material is generally involved
fatigue testing at different load ratios.
(1.3)
Kanny and Mahfuz [48] studied the flexural fatigue performance of PVC foam core
sandwich composite for different foam core densities and developed a simple fatigue life
expression for PVC foam core sandwich beam which is given by
(1.4)
here, N is the number of cycles to failure, C is a material constant, ∆σ is the stress range (σmax -
σmin), and m is the slope. By taking logarithms on both sides of equation (1.4) and rearranging,
the final equation for straight line on the S-N curve was defined as
(1.5)
where, 1/m is the slope of the straight line S-N curve in a log-log plot and C*= (logC)/m is the
material constant.
Burman and Zenkert [49, 50] studied the shear fatigue performance of Divinycell H100
and Rohacell WF51 foam core sandwich beam for transverse loading condition using damaged
and undamaged specimens. They proposed a simple fatigue life expression based on weibull
function of S-N data. The expression is based on two fitting parameter weibull function as
( ) ( ̂ ) (
)
(1.6)
here, τ is the shear stress in the beam for given number of load cycles to failure, τth is the fatigue
threshold (or endurance limit), ̂ is the static ultimate shear stress, N is the number of cycles to
failure, and a and b are the curve fitting parameters. In the experimental studies of fatigue, τth can

15
be determined by setting a limit on the number of load cycles and monitoring the damage. Their
study showed a reasonable agreement between experimental and analytical results.
Later, Burman and Zenkert [51, 52] studied the fatigue performance of Divinycell and
Rohacell foam of different densities under tension, compression and shear loadings. They
showed that fatigue stress-life data can be represented by Basquin’s law type relation which was
defined as
( ) (1.7)
where ∆σ is the stress range, N is the number of cycles to failure, B is the fitting constant and -
1/β is the slope of the relation.
1.3.2 Strength degradation model. The life prediction model based on strength
degradation approach describes the degradation of initial strength during fatigue life. This
method is also called as wear-out model. Sendeckyz [53] used this approach to predict the
fatigue life of fiber reinforced polymer matrix composite. This model requires only two
parameters to describe the strength degradation in fatigue loading. One parameter represents the
strength degradation and the other a relative fatigue life. Sendeckyz’s life prediction model is
summarized by the equations (1.8) to (1.13), respectively.
In this model, the probability distribution of static strength σs is described by a two-
parameter weibull distribution:
( ) [ (
)]
(1.8)
where β is a scale parameter and α is a shape parameter.
In constant amplitude fatigue at a maximum fatigue stress σa, the residual strength σr after
n cycles is related to the initial static strength σs, by a deterministic equation, a wear-out model:
[(
)
( ) ]
(1.9)

16
where, s and f are experimental parameters. The parameter s is the absolute value of the
asymptotic slope at long life on a log-log plot of S-N curve [53]. Therefore, s can describe the
strength degradation rate. Fatigue failure occurs when the residual strength decreases to the
maximum fatigue stress i.e. when σa = σr. Thus the relationship between the static strength (σs)
and fatigue stress (σa) is given by
[ ( ) ] (1.10)
The resulting fatigue life distribution is then
( ) { { [ ( ) ]
}
} (1.11)
The residual strength distribution after n cycles also follows from equation (1.9) and (1.10) as
(
) { [(
)
(
)
( )]
(
)
} (1.12)
Experimentally, the static strength distribution is determined from the ranked static strength data
using the median rank as
( )
(1.13)
where σsi is the ith strength and M is the total number of data.
Later, Dai and Hahn [54] extended Sendeckyz’s [53] wear-out model to develop model
for fatigue life and core fatigue failure of sandwich beams. They developed for PVC core
material and applied to Balsa core.
1.3.3 Stiffness reduction model. Many researchers investigated the robustness of
stiffness reduction approach in predicting the fatigue life for both laminate and sandwich
composites. This is because residual stiffness can be monitored nondestructively and can be
related to residual strength and fatigue life of the specimen. Wu et al. [55], Philippidis and
Vassilopoulos [56] and Whitworth [57] used the stiffness reduction approach to predict the

17
fatigue life of laminate composite and suggested that stiffness reduction approach is an accurate
way to predict the fatigue life of laminate composite. Judawisastra et al. [58] used the stiffness
reduction approach in predicting the fatigue life of polyurethane (PUR) foam core sandwich
composite. Clark et al. [36] proposed a model based on stiffness reduction approach for life
prediction of foam core sandwich composite made of Airex C70.130 foam core and hybrid
glass/kevlar/epoxy face sheet for both single step and multi-step fatigue loading conditions.
The term fatigue modulus or stiffness is defined as the ratio between the applied stress
and the resulting strain at a given number of cycles. This modulus is a function of loading cycles
n and applied stress level r = τa/τu where τa is the applied fatigue stress and τu is the ultimate
static stress. According to the model of Clark et al., the rate of decrease of fatigue modulus from
an initial static value can be expressed as:
( ) for
( ) ( ) for (1.14)
where, ( ) is the transient fatigue modulus, is the instantaneous static modulus, A and C
are the material constants, n is the number of fatigue cycles imposed and is the number of
cycles to initial damage. ( ) is the ratio of applied fatigue shear stress to the fatigue
component of the resultant shear strain ( ( )
( ) ). They derived a non-linear S-N equation
by rearranging the equation (1.14) and the non-linear S-N equation becomes
[ ( )]
(1.15)
where B = Go/A can be used to predict the number of cycles at failure for different applied stress
levels.
El Mahi et al. [59] studied the flexural fatigue behavior of PVC foam core and E-

18
glass/epoxy face sheet sandwich composite. In this study, they used the life prediction model of
Clark et al. [36] and compared the results with the experimental data. Fatigue tests were
conducted both in displacement control and load control and two different equations were
developed for load and displacement control modes. In the displacement control, dmean is the
static mean displacement (midspan deflection in the three-point bend test) and dam is the
amplitude of the applied sinusoidal waveform. During the tests the decrease in load (stiffness)
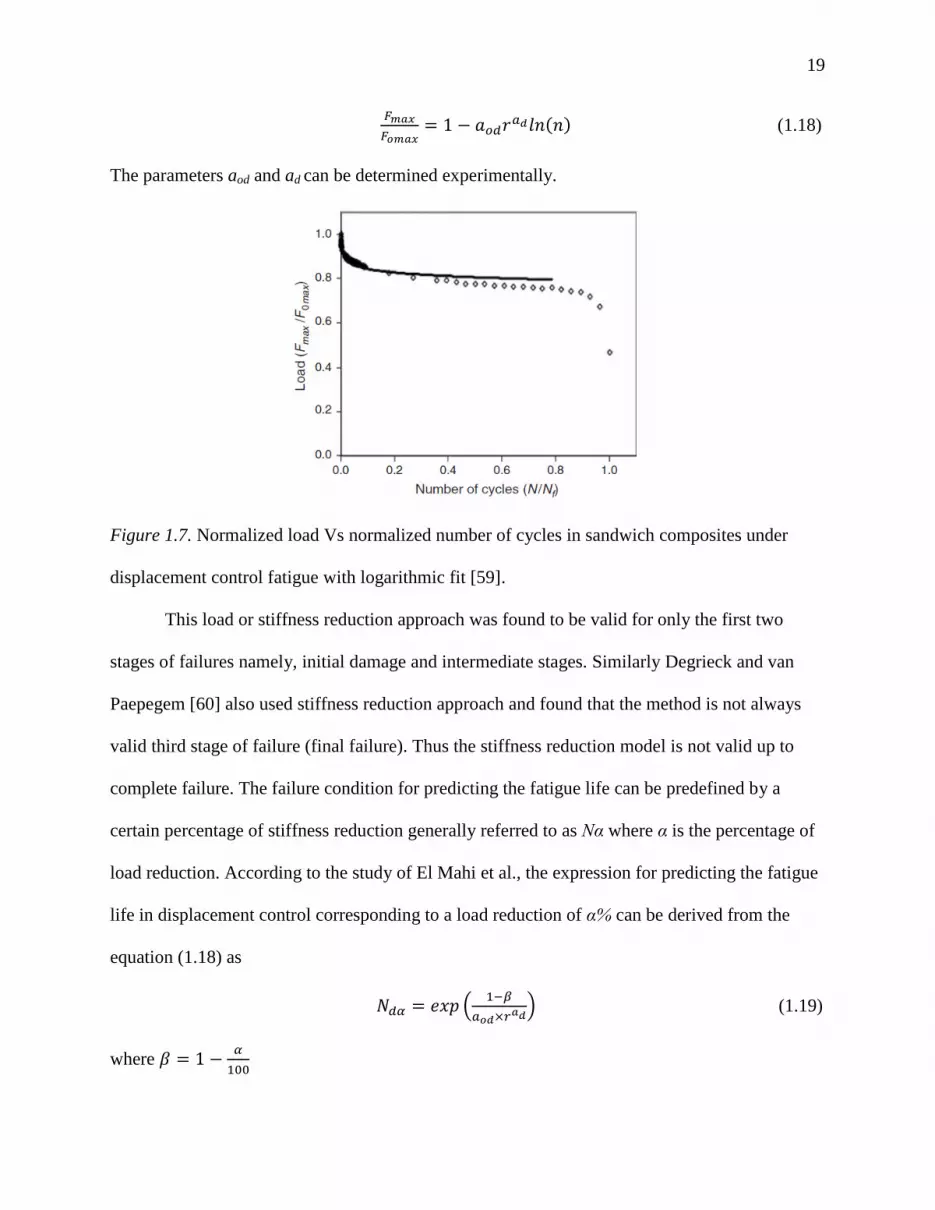
according to the number of cycles is recorded. Figure 1.8 represents the typical load reduction
(Fmax/Fomax) as function of number of cycles for a mean displacement dmean = 0.5du, where du is
the value of the failure displacement in the static tests for an amplitude dam = 1.75mm. Here, Fmax
is the maximum applied load and Fomax is the maximum load at the first cycle. The result shows
that the failure of the specimen proceeds in three stages: (i) an initial stage characterized by rapid
load reduction; (ii) an intermediate stage in which an additional load reduction occurred at a
much slower rate; and (iii) a final stage, in which rapid load reduction is observed as specimen
failure is approached. Load reduction is related to the decrease of the flexural fatigue modulus.
The load reduction can be expressed as a logarithmic function as
( ) (1.16)
where Fomax is the maximum applied load in the first cycle and Ad depends on the applied
displacement levels and the material properties. Ad can be described according to different load
levels r by a power function as
(1.17)
where aod and ad are the parameters that depends on the material properties and the loading
conditions. The load expression according to the number of cycles and the applied displacement
level thus becomes:
19
( ) (1.18)
The parameters aod and ad can be determined experimentally.
Figure 1.7. Normalized load Vs normalized number of cycles in sandwich composites under
displacement control fatigue with logarithmic fit [59].
This load or stiffness reduction approach was found to be valid for only the first two
stages of failures namely, initial damage and intermediate stages. Similarly Degrieck and van
Paepegem [60] also used stiffness reduction approach and found that the method is not always
valid third stage of failure (final failure). Thus the stiffness reduction model is not valid up to
complete failure. The failure condition for predicting the fatigue life can be predefined by a
certain percentage of stiffness reduction generally referred to as Nα where α is the percentage of
load reduction. According to the study of El Mahi et al., the expression for predicting the fatigue
life in displacement control corresponding to a load reduction of α% can be derived from the
equation (1.18) as
(
) (1.19)
where

20
Similarly, in the case of fatigue test with load control, the critical number of cycles NFα
corresponding to a displacement increase of α% is derived as
( ) (1.20)
A limitation of this concept is that it cannot be used for displacement level rd and load
level rF near the unity, where the failure occurs very rapidly and specimen fracture before
significant reduction in load or increase in displacement.
1.3.4 Cumulative damage model for variable amplitude loading. Several researchers
attempted to study the fatigue behavior of laminated composite based on cumulative damage
model for example [53, 61]. However, limited work was published in the literature on the use of
cumulative damage model for studying the fatigue behavior of sandwich composites. Clark et al.
[36] studied the use of cumulative damage model for sandwich composite based on stiffness
reduction approach for two-step loading. In this experimental investigation, the core material
used was Airex C70.130 and the face sheet was made of hybrid glass/Kevlar/epoxy. A general
damage model defining the fatigue damage parameter, D was defined assuming constant
frequency and environmental conditions. Fatigue damage, D accumulates from an initial damage
state zero at zero cycles to unity at final failure.
For constant amplitude loading
(1.21)
For a sequence of ‘m’ loadings:
∑ (1.22)
where Di is the damage experienced at load level i, n is the number of cycles, Nf is the number of

21
cycles to failure. The total damage is the summation of all the damage components at each load
Level. Thus for two-step loading, the residual life of a beam can be determined from the residual
damage, Dr which is schematically presented in Figure 1.9.If N1 and N2 are the expected lives
under the first and second loads, respectively, then the remaining damage can be expressed as
(1.23)
where D12 is the level of damage experienced under the first stress level and equated to an
amount of damage at the start of loading at the second stress level. The remaining life is
therefore the number of cycles to failure under second stress level N2, minus the number of cycles
under the second load that equates to the already damage level D12 under the first load.
Figure 1.8. Schematic illustration of determination of residual life: two-step loading [36].
Different forms of the cumulative damage parameter, D, can be chosen depending on the
degree of linearity of the degradation response. Three different models were proposed. The first
model is linear, based on ‘number of cycles’, the second model is based on changes of ‘modulus’
and the third model is based on changes of ‘strain’. Damage is assumed to initiate when fatigue
22
damage is first observed, i.e., at n=nif. At n=Nf, the damage is equal to unity. For the purpose of
all cumulative damage models investigated, it was assumed that:
( ) where
( ) where (1.24)
Model 1: According to this model, the amount of damage at a given cyclic stress level is equal to
the ratio of the number of cycles at a given stress level to the number of cycles required to cause
fatigue failure at that stress level. In this case, the damage model occurs after the initiation of
damage and can be expressed as:
( ) ( )
( ) where (1.25)
Model 2: The damage function was defined in terms of the fatigue modulus as:
( ) ( )
( ) (1.26)
where Gf(n) and Go are defined as the transient fatigue modulus and instantaneous static
modulus, respectively, and Gf(Nf) is the fatigue modulus at failure. The relation between Gf(n)
and Go is:
( ) where
( ) ( ) where (1.27)
where A and C are material constants to be determined from experimental data. Using equation
(1.27), equation (1.26) was modified as:
( ) ( )
( )
where (1.28)
Model 3: In this case the damage function was defined in terms of shear strain as:
( ) ( ) ( )
( ) ( ) (1.29)

23
Again following the equation (1.27) and stress-strain relationships, the damage function can be
modified as:
( ) [
] [
( )
( )
] where (1.30)
where B=Go/A.
In summary most of the core materials studied were polymeric foams (PVC, Airex,
Divinycell, Rohacell) and Balsa and their properties are different from syntactic foams. Syntactic
foams are brittle compare to the above cores. No failure model was reported for syntactic foam
sandwich panels.
1.4 Fatigue Test Methods for Foam Cores and Sandwich Beam
Fatigue tests are divided into three different types: smooth specimen tests to obtain total
fatigue life, pre-cracked specimen tests to obtain crack propagation data, and structural testing
where the fatigue life of a specific application is verified. In determining the fatigue life of foam
core materials in tension, compression, shear and flexural stress states using smooth specimens,
either solid foam core or foam core sandwich beam specimens is used, and corresponding test
methods are discussed below.
1.4.1 Compression-compression or tension-tension fatigue test methods. There are no
well-defined test standards for compression-compression or tension-tension fatigue testing of
foam core materials. The test standards used for the static properties may also be used for fatigue
testing. The standard test method for static compressive properties of rigid cellular plastics is
ASTM D621-10 [45] which is equivalent to ISO 844 [46], standard test method for flatwise
static compressive properties of sandwich cores is ASTM C365-05 [45] and standard test method
for static tensile and tensile adhesion properties of rigid cellular plastics is ASTM D1623-10 [46]
which is also similar to test standard ASTM D638-10 (Standard test method for tensile properties

24
of plastics) [45]. All these tests standards mentioned above may be used only for compression-
compression or tension-tension fatigue testing of foam core with some modification. None of
them can be used for compression-tension or tension-compression fatigue testing i.e. for R<0.
1.4.2 Shear and flexural fatigue test methods. Block shear test method ASTM C273-
07a [45] or four-point bending test method ASTM C393-06 [45] are the two methods commonly
used to determine the static shear properties of foam core materials in sandwich constructions.
The block shear test procedure may also be used for fatigue tests following ASTM C394-00 [45].
However, the major drawback of block shear test method is that the specimen geometry creates
stress concentrations at the corners of the core material which cause premature crack initiation
and failure in both static and fatigue loading conditions. The four-point bend test method, ASTM
C393-06 is an alternative effective test method in investigating the shear strength and failure
modes of sandwich beams. This test method is also successfully used to investigate the shear
fatigue life and fatigue failure modes of foam core sandwich beams [48-51, 74, 75]. Three-point
bending test following ASTM C393-06 is also used to investigate the flexural fatigue
performance of foam core sandwich beam [48, 71-73].
1.5 Literature Review
A literature on fatigue characterization of of polymeric and aluminum (Al) alloy foams
and foam core sandwich composite specimen is presented here. The type of loading included
compression-compression, shear and bending. Types of foams are PVC foams, open cell Duocel
and closed cell Alporas Al foams, and balsa. Very little fatigue study on syntactic foam has been
reported in open literature and is present last.
1.5.1 Compression-compression fatigue. Zenkert and Burman [51, 62] studied the
compression-compression fatigue of closed cell Divinycell H-grade (H60, H100 and H200) and
25
Rohacell F-grade (WF51, WF110 and WF200) foams. In their study, they reported that
compression fatigue failure was by crush band formation and propagation in the thickness
direction resulting in cell wall compaction. This crush band formation was reflected by a sudden
drop in displacement in load control fatigue test. The stress-life data can be represented by a
Basquin’s law and the slopes of the equation depends on the density of the material. Harte et al.
[63] studied the compression-compression fatigue performance of an open cell Duocel and
closed cell Alporas Al foam. Their study concluded that the typical failure mode is by
progressive shortening of the specimen by crush band formation. Zhou and Soboyejo [64]
studied the macro/micro scale fatigue mechanisms and the effect of heat treatment on Duocel
open cell Al foams. The foams were tested as fabricated (F), annealed (O) and T6-strengthened
conditions. From their study, it can be concluded that fatigue damage is associated with the
nucleation of surface crack and growth within the individual struts followed by formation of
macroscopic deformation bands which causes abrupt strain jumps. Heat treatment affected the
macro-scale fatigue behavior. The abrupt strain jump leads to the formation of heterogeneous
deformation band in the as-fabricated and T6-strengthened foams whereas for annealed foam, the
deformation band was relatively homogeneous. Besides, annealed foams exhibited better fatigue
strength compared to the T6-strengthened and the as-fabricated foams. Sugimura et al. [65]
studied the compression fatigue behavior of closed cell Alporas aluminum foam. In their study,
they reported that typical failure mode of the foam is by the formation of deformation bands.
Each band densifies with a thickness equal to cell the size. The bands originate from plastically
buckled membranes preferentially at the largest cells in the medium. This deformation band is
governed by an abrupt increase in strain. Hakamada et al. [66] studied the cyclic compression
fatigue behavior of porous Al fabricated by spacer method and compared them with those of

26
conventionally fabricated porous Al (Alporas). In this study, they didn’t observe any distinct
strain jump for porous Al produced by the spacer method. The strain jump, which was due to
localization deformation, was observed in Alporas Al. They suggested that the absence of the
distinct strain jump under cyclic compression for the porous Al produced by the spacer method
is due to the uniform cell structure. Kolluri et al. [67] studied the cyclic compression fatigue
behavior of closed-cell Al foam both with and without lateral constraint. Their study showed that
while the early stages of strain accumulation due to fatigue loading are independent of constraint,
the rapid strain accumulation stage behaviors are sensitive to the constraint. In both cases, no
fatigue effects (strain accumulation) were observed when the maximum stress of the fatigue
cycle was 60% of the quasi-static plastic strength of the foam. Stress-life diagrams, constructed
with two different critical strain accumulation failure criteria (4 and 10%), show a marginal
improvement of fatigue life under constraint when failure life is defined as 10%. All the
compression fatigue studies discussed above are related to polymer and metallic foams and no
compression fatigue studies were found in open literature for syntactic foams.
1.5.2 Shear fatigue. Zenkert and Burman [51, 52] studied the shear fatigue of Divinycell
H100 and Rohacell (WF51, WF110 and WF200) polymer foams of different densities using
composite face sheet sandwich beam specimens using four-point bending. Their study showed
that cores fail by shear by a formation of crack at angle ranging between 45o and 70
o with the
face sheet [51]. They also observed that the face sheet tensile failure at low stress levels [52].
Thomson et al. [69] studied the effect of core and face sheet debond on shear fatigue life of PVC
sandwich beams. They established a critical crack size below which the crack has no effect on
the fatigue life of the beam. Harte et al. [70] studied fatigue strength of a closed cell aluminum
alloy foam core sandwich beams of different span to depth ratios and established a design map to

27
display fatigue strength and failure modes as a function of specimen geometry. All the shear
fatigue studies discussed above are related to polymer and metallic foams and no shear fatigue
studies were found in open literature for syntactic foams.
1.5.3 Flexural fatigue. Dai and Hahn [71] studied the flexural fatigue properties of balsa
wood for short and long beam specimens. Their study concluded that short beam failed by core
shear as expected, forming large crack started at the center of the core and propagated into the
compression and tension side. For a long beam, the first damage initiated in the face sheet
tension laminate by ply cracking, fiber breaks, and debonding followed by crushing of the core
on the compression side of the beam. Kanny and Mahfuz [48] studied the influence of loading
frequency on flexural fatigue behavior of PVC foam core sandwich composite. Fatigue test was
performed on PVC foam core sandwich beams at frequencies of 3 and 15 Hz. They found that
fatigue life increased with increase in frequency. In both cases, fatigue failure was dominated by
45o core shear crack. The crack path and crack propagation rates varied with loading frequency.
Kulkarni et al. [72] studied the flexural fatigue characteristics of sandwich structures with
polymer (PVC) foam core using sandwich beam. Their study concluded that sandwich specimen
first failed by debonding between skin and core and finally core shear failure by forming a 45o
crack with the neutal axis. They developed a fatigue model based on fatigue damage of core
material and correlated it with the experimental data. Kanny et al. [73] studied the flexural
fatigue behavior of cross-linked PVC foam cores of three different densities (H130, R260 and
R300). Their study concluded that foam core failed by first forming an 80-85o angle of crack on
tension side of the beam and this crack quickly propagated towards the compression side of the
beam causing total collapse of the specimen. Kanny et al. [74] also studied the effect of elevated
temperature on fatigue behavior of PVC foam core sandwich composite. In this study, they

28
conducted test at three different temperatures (room temperature, 40oC and 80
oC) and found that,
fatigue life decreased with increased temperature and there was a slight change in mechanism of
core failure. Shenoi et al. [75] studied the flexural fatigue behavior of polymer composite
sandwich beams using ten-point loading configuration for three different polymer foams
( AIREX R63.80, AIREX R90.200 and AIREX C70.130) using frequency of 0.33, 0.50 and 0.91
Hz and load ratio of R=0. Their study concluded that AIREX R63.80 sandwich composite failed
by core shear near the supports whereas AIREX R90.200 and AIREX C70.130 sandwich
composite first failed by face-sheet tension failure on tension side of the specimen, followed by
catastrophic failure of the core. Based on literature review and their experimental results, they
reported that the effects of frequency do not have much significance in the range of 0-1.0 Hz but
may have some effect at about 5 Hz frequency, which may cause decrease in fatigue properties.
Based on available data in literature they also reported that stress ratio R has a great influence on
fatigue life of sandwich beams. The loading configuration (three-point bending or four-point
bending) and waveform shape (sinusoidal, slamming and square wave) type does not seem to
greatly influence the form of the S-N curve. Freeman et al. [76] studied the fatigue behavior of
polyurethane foam core sandwich composite with two different densities ( 0.164 g/cc and 0.106
g/cc) of core material using four-point bend specimen that was already impact tested. Their study
showed that fatigue failure mode depends on face sheet thickness. For low density foam with
thick (four layers) and thin (two layers) face sheets, failure mode was by core shear initiated
between core and face sheet interface under one of load points, followed by propagation of shear
cracks to the top and bottom face sheets and finally leading to specimen failure. Impact damage
had no influence on fatigue failure mode. However, for higher density foam with thin face sheet,
fatigue failure mode was changed from core shear to core bending failure. Bending failure

29
initiated at the damage created in the core by the impact and slowly propagated from the center
until it reached both ends of the sample. Zenkert and Burman [49, 50] studied fatigue properties
of Divinycell H100 and Rohacell WF51 using four-point bending. In their study, they used both
undamaged and damaged specimen and concluded that both undamaged and damaged specimen
failed by core shear forming a 45o crack with the neutral axis. In case of undamaged specimens,
failure initiation was from neutral axis. On the other hand for the damaged specimen, the damage
was initiated from corner of the butt joints and tip of the interfacial Teflon insert. The only paper
that is related to syntactic foam was by Ferreira et al. [77]. They studied the effect of volume
percent of microbubbles and reinforcing fibers (glass or carbon) on flexural fatigue behavior of
syntactic foams. They found that fatigue strength increased by 30% by the addition of a small
(<1%) percentage of fibers (glass or carbon) as a reinforcing material. However at higher filler
content, the fatigue strength decreased and fatigue degradation rate increased.
1.6 Challenges and Gaps
As explained in previous sections most of the fatigue characterization in literature was on
PVC, aluminum foam and balsa core sandwich panels subjected to bending loads. Only one
reference [77] related to syntactic foam was found in the literature that too was for bending load.
No results are reported for compression and shear fatigue loading. In addition, Eco-Core is a low
binder content with sphere to sphere contact foam and no data was found for such material in the
literature. Therefore, a comprehensive fatigue characterization of Eco-Core under three primary
types of fatigue loading: compression, shear and flexural are under taken. These stress states are
experienced by Eco-Core when used alone or as a core material in sandwich panels or structures.
Types of failures and associated lives are measured and documented. Based on the fatigue data,
simple stress-life equations are developed.

30
1.7 Test Concept and Methodology
Eco-Core material is envisioned to be used in compression, shear, and bending bearing
members. Although one can think of direct tension fatigue testing, because of its brittleness the
material is not suitable for such applications. Therefore, only compression, shear, and flexure
fatigue testing are considered. The compression fatigue was performed directly on the Eco-Core
material whereas the shear and flexure tests were performed on sandwich specimen to avoid
premature failure under load points by indentation and rubbing of loading rollers on the material.
The Eco-Core is fabricated as a rectangular panel of size 355.6x355.6 mm by 25.4 mm thick.
The cylindrical compression specimen was extracted by 27.9 mm diameter core cutter (See
Figure 1.9b). A separate sandwich panel (Figure 1.9a) with FGI 1854 glass fiber/vinyl ester
composite laminate face sheet (thickness of 1/18 of core thickness) was fabricated by adhesively
bonding composite face sheets to top and bottom surface of Eco-Core panel. A sketch of the
sandwich panel is shown in Figure 1.9a.
Figure 1.9. Eco-Core panel and test specimen configuration and loading.
σ
σ
P
S
FGI glass/vinyl ester
Face sheet
(a) Eco-Core Panel (b) Compression test
(c) Shear and Flexure tests
As fabricated Eco-Core
Panel (355.6x355.6x25.4 mm)
X

31
Four point loading (Figure 1.9c) was used for shear and flexure testing with different
span-thickness ratios. Quarter-point loading was used for shear and one-third load points was
used for flexure testing. Chapter 3 and 4 describe more details of the study.
1.8 Objectives of the Research
The overall objective of this research is to establish fatigue performance of “Eco-Core”
material under three different fatigue stress states, namely compression, shear and flexure. Then
identify failure modes for onset, propagation, and final failure and then the associated lives.
Finally, establish stress-life equation for the three stress states and associated failure modes.
Cylindrical Eco-Core samples are used for compression-compression fatigue and Eco-Core
sandwich beam is used for shear and flexure test. The sandwich face sheet is made of FGI
glass/vinyl ester composite laminate. Each of the three load conditions is presented in a separate
chapter.
1.9 Scope of the Dissertation
The dissertation consists of five chapters. In Chapter 1, an overview of syntactic foam,
Eco-Core, fatigue test parameters, fatigue life models for sandwich structures and a literature
review on fatigue characterization of foam core sandwich composites are presented. Chapter 2
presents the Eco-Core processing and its compression static and fatigue characterization.
Compression static characterization includes validating compressive strength, its failure modes
and failure mechanisms. Compression fatigue characterization includes two values of R,
endurance limit and identification of failure modes and mechanisms. Chapter 3 presents the
design of Eco-Core sandwich specimen for shear loading, fabrication of Eco-Core sandwich
panel and specimen, and static shear and fatigue shear tests. Characterization includes verifying
shear strength, establishing endurance strength and studying shear failure modes and

32
mechanisms for both static and cyclic loadings. Then an explanation of failure modes from the
stress states in sandwich core and face sheet interface is under taken. Chapter 4 presents the
design of Eco-Core sandwich specimen for flexure, fabrication of Eco-Core sandwich panel and
specimen, and static flexure and fatigue flexure tests. Characterization includes verifying flexural
strength, establishing endurance strength and studying flexural failure modes and mechanisms
for both static and cyclic loading. Then the explanation of failure modes from the stress states in
sandwich core and face sheet interface is under taken. Finally, the concluding remarks and
recommendations for future work are presented in chapter 5.

33
CHAPTER 2
Compression-Compression Fatigue Characterization
2.1 Introduction
In this chapter, Compression-Compression fatigue performance of Eco-Core is described.
The static test was conducted following ASTM C365 with some modification and the same test
setup was used for fatigue test. For both static and fatigue tests, cylindrical specimens was used.
The specimen diameter was 28 mm (1.1 in) and height was 25 mm (1 in). The specimen densities
were within the range of 0.53 g/cc to 0.54 g/cc, a less than 2% variation. Compression fatigue
test was conducted using sinusoidal loading frequency of 2 Hz and stress ratio R of 10 and 5.
Tests were conducted at different stress levels (σmin/σc) and a PC based data acquisition system
stored fatigue load, stroke displacement and time. This data was converted to compliance and
number of cycles and created compliance versus number of cycles curves. Fatigue life was
determined for 2%, 5% and 7% compliance change failure criteria. This data was used to
establish stress-number of cycles (S-N) relation. The macro-scale fatigue failure and associated
mechanism was investigated by analyzing the failure images taken from beginning to end of the
test. These images were taken by a digital camera. This work was published in open literature
[79].
2.2 Eco-Core Materials
A class of fly ash known as Cenosphere grade XL 150 supplied by Sphere Services Inc.
and phenol-formaldehyde resole binder resin, Durite SC 1008 supplied by Mektech Composities
Inc. were used to formulate Eco-Core [11]. The resin was diluted with alcohol at a weight ratio
of 10:1. Then fly ash was mixed with resin solution at a weight ratio of 5:1, where 5 and 1
represent the weight ratio of fly ash and solid resin, respectively. The mixture was mixed in a

34
low-shear planetary motion mixer so that fly ash was uniformly coated with resin. The fly ash
mixture was then charged into a compression mold of dimensions 356 x 356 x 25 mm in a steel
frame, compressed by a laboratory hot press that was preheated to a temperature of 82oC. The
preheated panel was then cured at 163oC for 30 minutes at 1.55 MPa (224 psi) pressure. The
panel was finally post cured in a convection oven at 163oC for 4-1/2 hours and all the steps in
fabricating Eco-Core panel are shown in Figure 2.1.
Figure 2.1. Steps in fabricating Eco-Core panel.
Figure 2.2. Compression test specimen.
Two panels (panel 1 and 2) were fabricated following the steps stated in the previous
section. These panels were used to extract cylindrical specimens 28 mm (1.1 in) diameter and 25
mm (1 in) height (Figure 2.2) using a core cutter of internal diameter 28.6 mm (1-1/8 in). The
specimen dimensions and bulk density were measured and recorded. Specimens from the panels
Material
Fabrication Steps:
Hot pressed+
Preheated at
82oC, 30min
Post cured at
163oC,4-1/2 hrs
Mix flyash +
Phenolic resin
Mixture charge into
compression mold
Cured at 163oC
at 1.55MPa,
30min
Fabrication of Eco-Core
• Cenosphere grade XL 150 supplied by Sphere Services Inc
• Phenol-formaldehyde resole resin, Durite SC 1008 supplied by Mektech
Composities Inc.
9d (28 mm)
h (25 mm)

35
1 and 2 were fatigue tested at two values of stress ratio R=10 and 5. Note that stress ratio values
are not conventional to what is commonly used, because of the negative sign was used for
compression stress. R= σmin/σmax is 10 and 5 in case of compression fatigue while it is 0.1 and 0.2
on an absolute value basis. The average bulk densities of the specimens for the panels 1 and 2
were 0.536 g/cc and 0.532 g/cc, respectively. Specimens within 0.5% of the average value of
the density were selected for testing. The specimen layout for panel 1 is shown in Figure 2.3. The
way of selecting specimens from panel-1 for static and fatigue test are shown and Figure 2.4 and
similar procedure was applied in case of selecting specimen from panel-2, which are attached in
Appendix B.1. In figure 2.4a, specimens are numbered according to specimen number in
specimen layout (Figure 2.3) whereas in figure 2.4b, specimens are numbered according to
ascending order of specimen density. More clearly, specimen number was 1 for the specimen of
lowest density and specimen number was 64 for the specimen of highest density. Between these
two ranges, specimen number was selected based on the position of the specimen density.
Selected specimens for static and fatigue test are listed in Tables 2.1, 2.2 and 2.3 for R=10 and 5,
respectively.
Figure 2.3. Specimen layout.
16
1
2
3
4
5
6
7
8
15
14
13
12
11
10
9 17
18
19
20
21
22
23
24 32
31
30
29
28
27
26
25 33
34
35
36
37
38
39
40 48
47
46
45
44
43
42
41 49
50
51
52
53
54
55
56 64
63
62
61
60
59
58
57
25 mm
25 mm
25
mm
25
mm
356 mm
16
1
2
3
4
5
6
7
8
15
14
13
12
11
10
9 17
18
19
20
21
22
23
24 32
31
30
29
28
27
26
25 33
34
35
36
37
38
39
40 48
47
46
45
44
43
42
41 49
50
51
52
53
54
55
56 64
63
62
61
60
59
58
57
35
6 m
m
25 mm
25 mm
25
mm
25
mm

36
(a)
(b)
Figure 2.4. Specimen selection process from panel 1: (a) Specimens numbered according to
specimen number in specimen layout; (b) Specimen numbered according to ascending order of
specimen density.
Scanning electron microscope (SEM) image of Eco-Core specimen is shown in Figure
Specimen number
Spec
imen
den
sity
, g/c
c
Average density (0.536 g/cc)
Mean (0.536)+/- 1% range (26 samples, 0.531 to 0.541)
Panel 1
Sp
ecim
en d
ensi
ty,
g/c
c
Specimen number
Selected specimens
Maximum density range ( 0.541 g/cc)
Average density (0.536 g/cc)
Minimum density range (0.530 g/cc)
(b) Specimen numbered according to ascending order of specimen density

37
2.5. Notice several features: size of microspheres about 20-75µm; a thin layer of resin coating on
microbubbles; sphere to sphere contact with open interstitial region. The broken microbubbles
are due to machining. The features represent the very low binder content of the material. Before
performing the test, the top and bottom surface of each specimen was coated with graphite fine
powder to reduce the friction between specimen and platen contact area.
Figure 2.5. SEM image of Eco-Core.
2.3 Compression Static Test and Test Results
Compression static test was performed to measure compression strength and modulus,
their variability and failure modes of Eco-Core. The static compression test was performed using
an MTS servo-hydraulic test machine and the machine setup is shown in Figure 2.6. The
specimen was compressed between two platens at a constant displacement rate of 1.27mm/min
(0.05in/min) while load and displacement were recorded at every one-half second. The specimen
deformation was continuously monitored by a high speed camera for post processing later. The
load deformation was recorded until the specimen is completely compressed. Compression stress
Fig.2.

38
and strain were calculated from load/cross sectional area and displacement/initial height,
respectively.
Figure 2.6. Machine setup for compression static and fatigue test.
Figure 2.7 shows compression stress-strain response for five Eco-Core samples for panel
1 and compression stress-strain response of the five Eco-Core samples is attached in Appendix
B.2. The stress-strain response is almost linear till the maximum stress is reached. After that,
stress suddenly drops, remains constant or both with increase in strain. Then stress gradually
decreases with increase in strain and finally material crushes. The crushing strain in this type of
unconfined compression could be as high as 30%, but only results upto about 10% strain is
shown in Figure 2.7. Each of failure steps, respectively, represent the failure initiation by
breakage of binder around the microbubble, which generally starts at the mid height or edge ( top
or bottom) of the specimen as a crush band, followed by failure progression in thickness
direction and finally leading to ultimate failure. All these features were imaged by a high speed
camera; only selected pictures are shown in Figure 2.8. Failure in the material first initiated at the
Specimen
Load cell
Control system

39
middle of the specimen due to bond breakage between the microbubbles causing a crush band,
the crush band propagated in thickness direction, finally leading to axial (longitudinal) cracking
of the specimen. A similar failure mode was also observed by Panduranga et al. [14, 78].
Maximum stress before failure onset was considered to be strength of the material. The average
compressive strength (σc) was -18.9MPa (-2,743psi) with a standard deviation (STD) of
0.28MPa (41psi). Compression elastic modulus was calculated from the linear slope of stress-
strain curve (Figure 2.7). The average modulus was 1.74GPa (253ksi) with a STD of 0.11 GPa
(16ksi) for panel 1. Whereas for panel 2, σc was -20.3MPa (-2,945 psi) with a STD of 0.45 MPa
(65psi) and average modulus of 1.55GPa (225ksi) with a STD of 0.01GPa (1.45ksi). The results
for the two panels are consistent. Compressive strengths and moduli of tested specimen from
panel 1 and 2 are listed in Table 2.1. By applying the statistical error mean, the average
compression strength and modulus of Eco-Core is 19.6 ± 0.25 MPa and 1.65 ± 0.05 MPa,
respectively.
Figure 2.7. Static compression stress-strain responses of specimens (panel 1). Fig.3.
Str
ess,
MP
a
Strain
M-26
M-27
M-28
M-29
M-30

40
Figure 2.8. Onset, propagation and final failure images of static compression samples, panel 1.
Table 2.1
Test Specimen and Properties
Panel no Specimen
ID
Specimen Geometry Specimen
Density,
g/cc
Compression
Diameter,
mm
height,
mm
Failure
Load, N
Strength,
MPa
Modulus,
GPa
1 M-26 29.770 25.630 0.536 13,050 18.76 1.44
M-27 29.850 25.630 0.539 13,295 19.02 1.87
M-28 29.740 25.640 0.537 13,033 18.75 1.79
M-29 29.810 25.620 0.535 12,993 18.62 1.76
M-30 29.770 25.630 0.540 13,513 19.42 1.84
Average 18.91 1.74
STD 0.28 0.11
SEM 0.13 0.05
2 M-13 29.172 26.416 0.529 13,135 19.65 1.55
M-26 29.228 26.213 0.532 13,317 19.92 1.54
M-38 29.158 26.060 0.537 13,936 20.87 1.55
M-43 29.158 26.162 0.531 13,397 20.06 1.54
M-47 29.102 26.060 0.533 13,664 20.54 1.56
Average 20.30 1.55
STD 0.45 0.11
SEM 0.20 0.00
2.4 Fatigue Test
Compression-compression fatigue tests were conducted under a sinusoidal cyclic load of
frequency 2Hz and two stress ratios of R = 10 and 5, respectively. Fatigue testing for R=10, used
specimens from panel 1 and corresponding average strength (σc) used was -18.9MPa (-2,743psi).
(a) Onset (b) Progression (c) Final failure

41
For R=5, specimens from panel 2 were used with a corresponding average strength of 20.3MPa
(2,945 psi). Typical compression cyclic load is shown in Figure 2.9. σmin is the maximum
compression or algebraically minimum stress. Similarly, σmax is algebraically maximum stress or
the minimum compression stress. Preliminary tests showed that for R=10, all the tested
specimens for σmin/σc= 0.6 exceeded 106 cycles and for R= 5, at σmin/σc= 0.8 all tested specimen
exceeded 106 cycles without failure. Therefore, the stress levels selected were above the limiting
stress. The endurance limit for this class of materials needs to be 107-10
9 cycles depending on the
application. However because of limitations of test time and equipment, the testing was limited
to 106 cycles and this is used as the endurance limit. Six different stress levels (σmin/σc) in the
range of 0.6 to 0.9 for R = 10 and four different stress levels in the range of 0.8 to 0.95 for R = 5
were chosen. Tables 2.2 and 2.3 lists stress levels and number of replication of tests. The same
static test setup was used for fatigue test (Figure 2.6). Three to four specimens were tested for
each stress ratio. All the cyclic compression tests on specimens were performed in the thickness
direction of the panel. Both load (P) and displacement (d) and numbers of load cycles (N) were
collected using a PC based acquisition system. The load-displacements recorded were used to
calculate compliance which is the ratio of change in displacements between the consecutive
maximum and minimum loads and the loads difference. The fatigue life is defined as the number
of cycles to failure. The failure is defined by the compliance change criteria, which is defined
later. To investigate the macro-scale fatigue failure mechanisms, a digital camera was set up to
record the deformation sequence. Since each fatigue test lasted for hours to days, images were
taken only for selective intervals between the beginning and end of the test (unstable failure).
The image sequences were then analyzed to understand the fatigue failure mechanism at the
macro-scale.

42
Figure 2.9. Compression-compression fatigue loading.
Table 2.2
Compression-Compression Fatigue Test Specimen and Loading for R=10, Panel 1(σc = -18.9
MPa)
Specimen ID Density, g/cc σmin/σc σmin, MPa Diameter,mm Pmin, N
M-14 0.538 0.90 -17.02 29.799 11,872
M-24 0.536 29.827 11,890
M-61 0.534 29.716 11,805
M-56 0.535 29.785 11,858
M-10 0.531 0.85 -16.08 29.785 11,205
M-15 0.538 29.799 11,213
M-18 0.537 29.840 11,245
M-52 0.541 0.80 -15.13 29.592 10,404
M-13 0.534 29.854 10,586
M-12 0.536 29.827 10,568
M-62 0.533 0.75 -14.18 29.716 9,835
M-16 0.531 29.785 9,883
M-48 0.540 29.564 9,719
M-50 0.539 0.70 -13.24 29.785 9,225
M-20 0.538 29.868 9,274
M-34 0.539 29.689 9,163
M-21 0.540 0.60 -11.35 29.840 7,935
M-25 0.534 29.564 7,788
σmin
σmax
Com
pres
sion
Str
ess
(-)
0Cycles, N
Ten
sion
Str
ess
(+)

43
Table 2.3
Compression-Compression Fatigue Test Specimen and Loading for R=5, Panel 2(σc = -20.3
MPa)
Specimen ID Density, g/cc σmin/σc σmin, MPa Diameter, mm Pmin, N
M-46 0.533 0.95 -19.292 29.130 12,857
M-30 0.535 29.158 12,882
M-55 0.536 29.102 12,832
M-39 0.527 0.90 -18.279 29.116 12,170
M-31 0.528 29.172 12,217
M-19 0.539 29.102 12,158
M-52 0.531 0.85 -17.258 29.158 11,524
M-44 0.534 29.158 11,524
M-51 0.527 29.130 11,502
M-27 0.535 0.80 -16.245 29.172 10,858
M-45 0.533 29.144 10,837
M-11 0.526 29.172 10,858
2.5 Fatigue Test Results and Discussion
2.5.1 Failure criteria and associated failure lives. Failure is a subjective term; to define
failure specimen compliance is used. Typical compliance versus number of cycles of a fatigue
test is shown in Figure 2.10. The response can be divided into three zones: Initial or onset where
the specimen shows onset of damage; slow propagation of damage where the material densifies
in thickness direction yet specimen has not lost its strength and fast damage progression or
ultimate failure (material crushed) that is leading to solidification of the sample. The onset can
also be treated as first breakage of bond between the microbubbles. The three different failures
are defined as onset, propagation and final failure. They are categorized as 2%, 5%, and 7%
respectively. The number of load cycles required for 2% compliance change is defined as onset
life, required for 5% compliance change is defined as propagation life and required for 7%
compliance change is defined as the total life. Selection of these compliance limits was based on
the profile of the compliance versus number of load cycles.

44
Figure 2.10. Typical compliance versus cycles response of a C-C fatigue test with definition of
three types of failure.
Compliance appears to be arbitrary but can be related to damage onset, and accumulation
[36] as in the stiffness reduction models [59]. Furthermore, a small variation of the compliance
values has minimal impact on the fatigue lives. The compliance change criteria were used in
estimating fatigue lives. The Figure 2.11 shows compliance versus number of cycles response for
Eco-Core sample M-18 for σmin/σc= 0.85 and response for all other samples are included in
Appendix B.3 through B.12 for R=10 and 5, respectively. The three failure zones and their lives
are clearly identifiable; the associated damage images are shown in Figure 2.12. The first image
(a) was taken before loading the specimen; image (b) was taken after the onset of damage (2%
compliance), notice the crush band; and images (c), (d), (e) were taken for successive
propagation of crush band indicating the damage propagation in Eco-Core. Image (f) was taken
around 7% compliance change. After 7% compliance change, the specimen failed within few
load cycles. The damage sequences were similar for all the tests for R= 10 and 5. Therefore, the
Fig.6.
Ultimate Failure (7%)
Cycles
Co
mp
lian
ce
2%
5%
Onset Propagation Accelerated failure
Solidification

45
formation of crush band, progression and final collapse of crush bands is the compression fatigue
failure mechanism of Eco-Core. The collapse of the material was not apparent in the region
outside of the crush band which happens mostly in the middle or edge (top or bottom) of the
specimens based on the weak region in the specimen. This behavior is similar to that of static
failure of Eco-Core. The fatigue lives for each of the three failure criteria for all tests are listed in
Tables 2.4 and 2.5 for R= 10 and 5, respectively. Those specimens that did not fail in 106 cycles
were static tested to measure the residual strength. Residual strengths are tabulated in Tables 2.4
and 2.5. To determine and understand the endurance limit of the material and the fatigue
degradation rate, the data is presented by normalized maximum compression stress (σmin/σc)
versus the number of load cycles (N) through S-N diagram in Figures 2.13 through Figure 2.15.
Table 2.4
Compression-Compression Fatigue Test Result for R= 10, panel 1
Specimen
ID
Cycles to
failure
Residual
Strength, MPa
Cycles for Compliance Change
N2% N5% N7%
M-14 914 - 295 740 820
M-24 1615 - 325 920 1480
M-61 602 - 65 390 520
M-56 4290 - 2,070 3820 4150
M-10 16,013 - 1,400 11650 13800
M-15 20,139 - 3,700 8,900 17,020
M-18 24,843 - 2,800 21,300 23,300
M-52 71,212 - 7,000 43,900 60,400
M-13 118,008 - 53,000 112,200 116,600
M-12 282,261 - 116,000 264,000 273,000
M-62 543,712 - 334,000 520,000 538,500
M-16 906,328 - 832,000 882,000 895,000
M-48 No* 18.155 725,000 - -
M-50 No* 18.727 - - -
M-20 No* 17.796 650,000 - -
M-34 No* 19.692 - - -
M-21 No* 18.541 - - -
M-25 No* 16.155 - - -
* indicates no failure

46
Table 2.5
Compression-Compression Fatigue Test Result for R= 5, panel 2
Specimen
ID
Cycles to
Failure
Residual
Strength, MPa
Cycles for Compliance Change
N2% N5% N7%
M-46 2,318 - 570 1,920 2,140
M-30 2,497 - 1,850 2,240 2,410
M-55 10,057 - 5,800 8,800 9,500
M-39 9,053 - 4,300 7,350 8,500
M-31 2,973 - 780 2,600 2,860
M-19 4,366 - 1,500 4,090 4,250
M-52 119,663 - 67,000 113,500 117,550
M-44 No* 21.464 - - -
M-51 33,587 - 21,300 31,350 32,400
M-27 No* 20.565 250,000 - -
M-45 No* 20.995 - - -
M-11 986,982 - 835,000 955,000 963,600
*No indicating no failure
Figure 2.11. Compliance versus number of cycles (N) and the fatigue lives based on the three
failure criteria.
Cycles, N
Co
mp
lian
ce,
mm
/N
R= 10
Panel-1
σmin/σc =0.85
2%
(Onset)
5%
(Propagation)
7% (Final
failure)
Specimen M-18
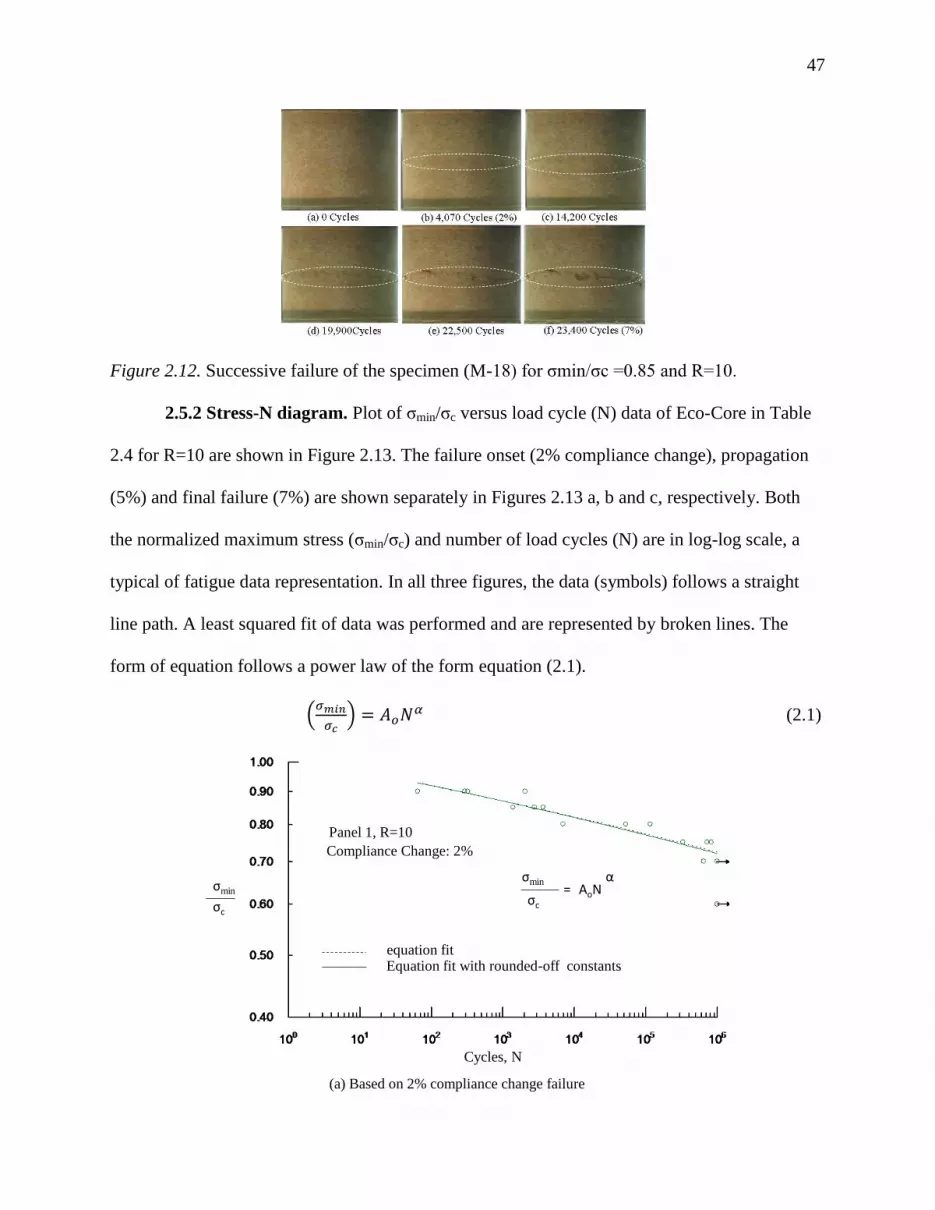
47
Fig.8.
Figure 2.12. Successive failure of the specimen (M-18) for σmin/σc =0.85 and R=10.
2.5.2 Stress-N diagram. Plot of σmin/σc versus load cycle (N) data of Eco-Core in Table
2.4 for R=10 are shown in Figure 2.13. The failure onset (2% compliance change), propagation
(5%) and final failure (7%) are shown separately in Figures 2.13 a, b and c, respectively. Both
the normalized maximum stress (σmin/σc) and number of load cycles (N) are in log-log scale, a
typical of fatigue data representation. In all three figures, the data (symbols) follows a straight
line path. A least squared fit of data was performed and are represented by broken lines. The
form of equation follows a power law of the form equation (2.1).
(
)
(2.1)
(a) Based on 2% compliance change failure
(Continued)
σmin
σc
Cycles, N
σmin
σc
= AoNα
Panel 1, R=10
Compliance Change: 2%
equation fitEquation fit with rounded-off constants

48
Figure 2.13. Normalized stress (σmin/σc) versus number of load cycles (N) for R=10 along with
least square equation fit. Also shown is the equation with rounded off (solid line) constants.
σmin
σc
Cycles, N
σmin
σc
= AoNα
Panel 1, R=10
Compliance Change: 5%
Equation fitEquation fit with rounded-off constants
(b) Based on 5% compliance change failure
(Continued)
(c) Based on 7% compliance change failure
σmin
σc
Cycles, N
σmin
σc
= AoNα
Panel 1, R=10
Compliance Change: 7%
Equation fitEquation fit with rounded-off constants

49
Figure 2.14. Comparison of S-N equation with experimental data for R= 10, with constants
rounded off.
Figure 2.15. Comparison of equation with experiment for R=5, with constants in equation are
rounded off.
σmin
σc
Cycles, N
Panel 1, R=10
σmin
σc
= AoNαα = -5x10⁻²
2%
5%
7%
2%
5% 7%
Cycles, N
σmin
σc
= AoNασc
σmin
Panel 2,R=5

50
The constant Ao is the material constant and α represents the degradation rate of the
material. The raw values of constant Ao and the exponent α for all three cases of failure are listed
in Table 2.6 for both R=10 and 5. For R=10, the values of α are nearly same whereas the
constant Ao varied for each of the failure criteria and shows an ascending trend from onset to
final failure. The broken lines in the Figure 2.13 represent the equation (2.1) using raw values of
Ao and α and are found to represent the data very well. The constants Ao and α were rounded-off
to two decimal places, these rounded values are listed also in Table 2.6. The solid lines in Figure
2.13 represent the equation 1 with rounded values of Ao and α. Results of rounded-off constants
in equation (2.1) are compared with the test data for R=10 and 5 in Figure 2.14 and 2.15,
respectively. The rounded values of Ao and α fit with the test data very well. Results in Figures
2.14 and 2.15 are used to estimate endurance limit (N≥106). Estimated endurance limit for R=10
and 5 are listed in Table 2.6.
Table 2.6
Constants in the S-N Equation and Endurance Limit for R= 10 and 5
Load ratio,
R
Failure criteria Constants Endurance
limit Compliance Change Fitted Rounded
Ao α Ao α
10 2%
5%
7%
1.0171
1.0451
1.0582
-0.04888
-0.04878
-0.05088
1.02
1.05
1.06
-0.05 0.72σc
0.75σc
0.76σc
5 2%
5%
7%
1.0504
1.0852
1.0893
-0.04051
-0.04586
-0.04654
1.05
1.09
1.09
-0.041
-0.046
-0.047
0.80σc
0.82σc
0.82σc
2.5.3 Stress ratio effect. The effect of R ratio on fatigue life is examined from the point
of view of cyclic stress range and mean stress. Most metallic material’s responses are dependent
on stress range. As Eco-Core also behaves like an isotropic material, the stress range effect is
investigated. Here both test data and equation are examined in three different ways: normalized

51
cyclic stress versus N; stress range versus N; and mean stress versus N. Here only the onset (2%
compliance change) results are shown, however same trend was found for other two failure
modes. Results for damage progression (5% compliance change) ultimate failure (7%
compliance change) are attached in Appendix B.
2.5.3.1 Stress versus N. Normalized stress (σmin/σc) versus N data in Tables 2.4 and 2.5
for R=10 and 5 for damage onset (2% compliance change) failure are shown in Figure 2.16.
σmin/σc versus N for damage progression (5% compliance change) and ultimate failure (7%
compliance change) are attached in Appendix B.13. From figure 2.16, it can be seen that for a
given stress (σmin/σc), the fatigue life of a specimen for R=5 is larger than for R=10. The slope
for R=10 is greater than for R=5. Alternately, strength degradation rate is larger for R=10 than
for R=5. Consequently, the estimated endurance limit (N= 106 cycles) for R=5 is larger than
R=10 by about 7%.
Figure 2.16. Normalized stress versus N for R= 10 and 5 for 2% compliance change. Fig.12.
σmin
σc
Cycles, N
R = 10
R = 5
Onset failure (2% compliance)

52
2.5.3.2 Stress range versus N. The σmin/σc versus N data in Figure 2.16 is transferred to
normalized stress range (∆σ/σc) versus N using the equation 2.2 and are presented in Figure 2.17
for damage onset (2% compliance change) for both R=10 and 5. ∆σ/σc versus N for damage
progression (5% compliance change) and ultimate failure (7% compliance change) are attached
in Appendix B.14.
Figure 2.17. Normalized stress range versus N for 2% compliance change for R= 10 and 5.
From Figure 2.17, it can be seen that the two data are closer and almost interspersed with
each other. This shows that that the fatigue life of Eco-Core depends on stress range and the R
ratio effect could be included when the loading is expressed as
( )
(2.2)
As expected and can be seen in Figure 2.17 that R= 10 has higher stress range than R=5. Because
of this reason, the degradation rate for R=10 is slightly higher than for R=5. These results are in
agreement with what is observed for metals.
2.5.3.3 Mean stress versus N. The σmin/σc versus N data in Figure 2.16 is transferred to
normalized mean stress (σmean/σc) versus N through the equation 2.3 and the results are plotted in
Cycles, N
σc
Δσ
Δσ
σc
=σmin (1-R)/Rσc
R=5R=10
Onset failure (2% compliance)

53
Figure 2.18 for damage onset (2% compliance change) for both R=10 and 5. σmean/σc versus N
for damage progression (5% compliance change) and ultimate failure (7% compliance change)
are attached in Appendix B.15.
In Figure 2.18, symbols represent the test data and lines represent the equation. The data
for R=10 and 5 are shifted apart as in Figure 2.16 for σmin/σc. Thus the mean stress versus N
representation of fatigue data does show dependency of R value.
(
) (2.3)
Figure 2.18. Normalized mean stress versus N for 2% compliance change for R= 10 and 5.
2.6 Summary
Static compression and compression-compression fatigue tests were conducted on a fire
resistant Eco-Core material for two values of stress ratios (R= 10 and 5). Fatigue stress (σmin/σc)
ranged 0.9 to 0.6 for R=10 and 0.95 to 0.8 for R=5. Here σmin is the maximum compression
stress (algebraically minimum) and σc is the compression strength of Eco-Core. The compression
strength of Eco-Core is 19.6± 0.25 MPa. The study showed that Eco-core has well defined
failure modes and associated fatigue lives.
R=5
R=1
σmean
σc
=σmin (1+1/R)2σc
σmean
σc
Cycles, N
Onset failure (2% compliance)

54
Eco-Core’s failure can be classified as three types: damage on-set, progression and final
failure. Damage on-set is characterized by formation of a single crush band at the middle or edge
of the specimen, which corresponds to 2% change in compliance; damage progression is
characterized by crush band propagation, which corresponds to 5% change in compliance; and
final failure characterized by 7% compliance change. The three failure modes were found to be
same for both static and fatigue loadings.
Based on 1 million cycles endurance limit was found to be 0.72σc, 0.75σc and 0.76σc,
respectively for on-set, propagation and final failure for R=10 while it is 0.81σc, 0.82σc and
0.82σc, respectively for R=5. The S-N (number of load cycles) data follows a well-defined power
law equation, σmin/σc= AoNα. Constants of the equation were established for all three modes of
failures and the two stress ratios. The Eco-Core fatigue life was found to be less sensitive to R
ratio when expressed in terms of stress range versus number of load cycles that is similar to what
was observed in most metallic materials.

55
CHAPTER 3
Shear Fatigue Characterization
3.1 Introduction
In this chapter, shear fatigue performance of Eco-Core sandwich beam is presented. The
static test was conducted following ASTM C393 and the same test setup was used for fatigue
test. For both static and fatigue tests, Eco-Core sandwich beams made of three ply (0/90/0)
woven roving FGI 1854 glass fiber/Vinyl ester face sheet were used. The thicknesses of
fabricated core (tc) and face sheet (tf) were 25.4 mm and 1.50 mm, respectively. The average
density of the Eco-Core panel was 0.50 g/cc. The length and width of the Short beam sandwich
specimens were 130 mm and 51 mm, respectively. The specimen span (S) was set to 80 mm with
an average sandwich thickness (d) of 26.9 mm that results in S/d of 3 and tf/d of 1/18. Shear
fatigue test was conducted using sinusoidal loading with a frequency of 2 Hz and stress ratio R
of 0.1. Tests were conducted at different stress levels (τmax/τc) and a PC based data acquisition
system was used to store fatigue load, stroke displacement and time. This data was converted to
compliance and number of cycles and created compliance-number of cycles curves. Fatigue life
was determined based on 2%, 5% and 7% compliance change failure criteria and corresponding
stress-number of cycles (S-N) diagram were established. The macro-scale fatigue failure
mechanism was investigated by analyzing the selective images of the specimen taken from
beginning to end of the test by a digital camera. This work is published in open literature [82].
3.2 Material System
A class of fly ash known as Cenosphere grade XL 150 supplied by Sphere Services Inc.
and phenol-formaldehyde resole binder resin, Durite SC 1008 supplied by Mektech Composities
Inc. were used to formulate Eco-Core [11]. Eco-Core panel fabrication process was already

56
discussed in chapter 2. Four core panels were fabricated with an average bulk density of 0.5 g/cc.
These panels were used as a core to fabricate sandwich panels.
Face sheets were fabricated by using woven roving three layers (0/90/0) of FGI-1854
glass fabric and vinyl ester composite laminate by a vacuum assisted resin transfer molding
process [80, 83]. FGI 1854 glass fabric was supplied by Fiber Glass Inc and vinyl ester was
supplied by Dow Chemicals. Sandwich panels were fabricated by bonding the face sheets to
Eco-Core on top and bottom surfaces using Loctite Hysol E-90FL adhesive as explained in [12].
3.3 Design of Specimen
Short beam shear test specimen was designed as per the guidelines and the material
properties are given in the reference [12], which are also listed in Table 3.1. Four point loaded
sandwich beam was selected to avoid direct contact of the load on the core material and reduce
the stress concentration and wear damage caused in fatigue test. Although the lap shear test
(ASTM C394) specimen was also be used in honey comb sandwich beams, here a four-point
bend loaded specimen used because of ease of loading. The specimen nomenclature is shown in
Figure 3.1. Here tc is the core thickness, tf is the face sheet thickness, d is the design depth of
sandwich beam (d = tc + tf), S is the span of the beam and e is the edge distance from the support
point. The symbols σc, τc, Ec, and Gc define core compression strength, shear strength,
compression modulus and shear modulus, respectively. Similarly, the core tensile modulus and
strength are defined by Ect and σct, respectively. Properties of Eco-Core given in Table 3.1 [12]
are for core material that was determined from direct tension, compression and shear tests. The
nominal thicknesses of the core and face sheet are 25.4 mm and 1.40 mm, respectively and the
width of the specimen is 51 mm. The test specimen was designed using the core shear and core
tension (flexure) failure criteria. The failure load (Pf) for core shear and core tension are derived

57
from beam theory from maximum shear and bending moment (see Figure 3.1b and 3.1c) and are
given by Equations (3.1) and (3.2), respectively.
Table 3.1
Material Properties of Eco-Core and Face-sheet [12]
Material Tensile Compressive Transverse Shear
Modulus,
GPa
Strength,
MPa
Modulus,
GPa
Strength,
MPa
Modulus,
GPa
Strenght,
MPa Face sheet[83] 29.20 512.50 31.90 363.40 4.00 77.10
Eco-Core[11] 2.54 6.46 1.14 21.85 0.97 4.61
Figure 3.1. (a) Schematic of test specimen, loading and nomenclature (b) Shear force diagram
(c) Bending moment diagram.
d = tc + tf
S
S/2tf
tf
tc
P
Width, b ≈ 2d
Face sheet, σf, Ef
Core, σc, Ec, τc,Gc
Edge distance, e = tc
e e
P/2 -P/2
-P/2 P/2
PS/8 PS/8
(a)
(b)
(c)

58
(3.1)
(3.2)
where, σct and Ect are the core tensile strength and modulus, respectively. The D is flexural
rigidity of the sandwich beam and is given by Equation (3.3).
(3.3)
Normalized failure loads of these two failure criteria are shown in Figure 3.2 as a function of
span to depth (S/d) ratio. The core shear failure is represented by a horizontal broken line and
core tension failure by a solid line. Intersection of the two lines represents the potential for both
failures. The two curves intersect at S/d = 4. Therefore, S/d of 3.0 was selected so that core
shear failure is the dominant failure mode. The failure load per unit width (Pf/b) of the beam is
247 N/mm.
Figure 3.2. Failure load versus span/depth (S/d) ratio for Eco-Core sandwich beam based on two
failure criteria.
Pf/
b, N
/mm
Core shear failure
Core tension failure
Experimental data
S/d
d
bP
c
f
2
EtSD
bP
ctc
ctf 16
181
dt f

59
3.4 Fabrication of Sandwich Panel and Specimen
Three-ply symmetric (0/90/0) woven roving FGI 1854 glass fabric/vinyl ester composite
face sheets of 1,270 mm X 810 mm in size were fabricated by Vacuum Assisted Resin Transfer
Molding (VARTM) as explained in references [80, 81]. Steps in fabricating glass/vinyl ester face
sheet are shown in Figure 3.3. The average thickness of the fabricated face sheet was 1.50 mm.
The large face sheet was cut into 356 mm X 356 mm pieces which is consistent with the core
panel size. The face sheets were bonded to core panel using Loctite Hysol E-90FL toughened
and medium viscosity epoxy adhesive. This adhesive has tensile strength of 13 MPa, lap shear
strength of 5.9 MPa and elongation of 64%. Adhesive bonded sandwich panels were cured in a
vacuum bag at a pressure of 0.051 MPa (15 in of Hg) at room temperature for 12 hours. The
adhesive layer thickness was about 250 µm (0.01 in) after cure. Steps in fabricating Eco-Core
sandwich panel is shown in Figure 3.4.
Figure 3.3. Steps for fabricating face sheet.
Fabrication of Face Sheet•VARTM Process
Curing Post curing & cut
Pouring vinyl
ester resin
Catalyzing vinyl
ester resin
Vacuum
bagging
Peel ply and flow
media stacking
Ply
stacking
Fabrication Steps:

60
Figure 3.4. Steps for fabricating Eco-Core sandwich panel.
Short beam sandwich specimens of 130 mm long and 51 mm wide were machined.
Specimen dimensions were precisely measured and are listed in Table 3.2 and 3.3. The specimen
span (S) was set to 80 mm with an average d of 26.9 mm that results in S/d of 3 and tf/d of 1/18.
3.5 Static Shear Test, Results and Discussion
Static shear tests were performed to validate the shear strength used in design of test
specimen, record core failure modes, and to precisely measure the shear strength of the core
material. The test was conducted using a MTS servo-hydraulic test machine following ASTM
C393 by applying quarter point loading (Figures 3.1). A deflection transducer (LVDT) was
placed under the specimen at the mid span for direct measurement of deflection (Figure 3.5). The
specimen was loaded at a constant cross-head speed of 0.5 mm/min (0.02in/min). Load and
deflection were recorded at every one-half second and the associated failure modes were
monitored by a high speed camera.
Fabrication: Sandwich PanelAdhesive bonding
Fabrication Steps:
Adhesive application
on face sheet surface
Distribution
of adhesiveGlass veil application
on adhesive
Fabrication of
sandwich panel
Vacuum bagging
and curing
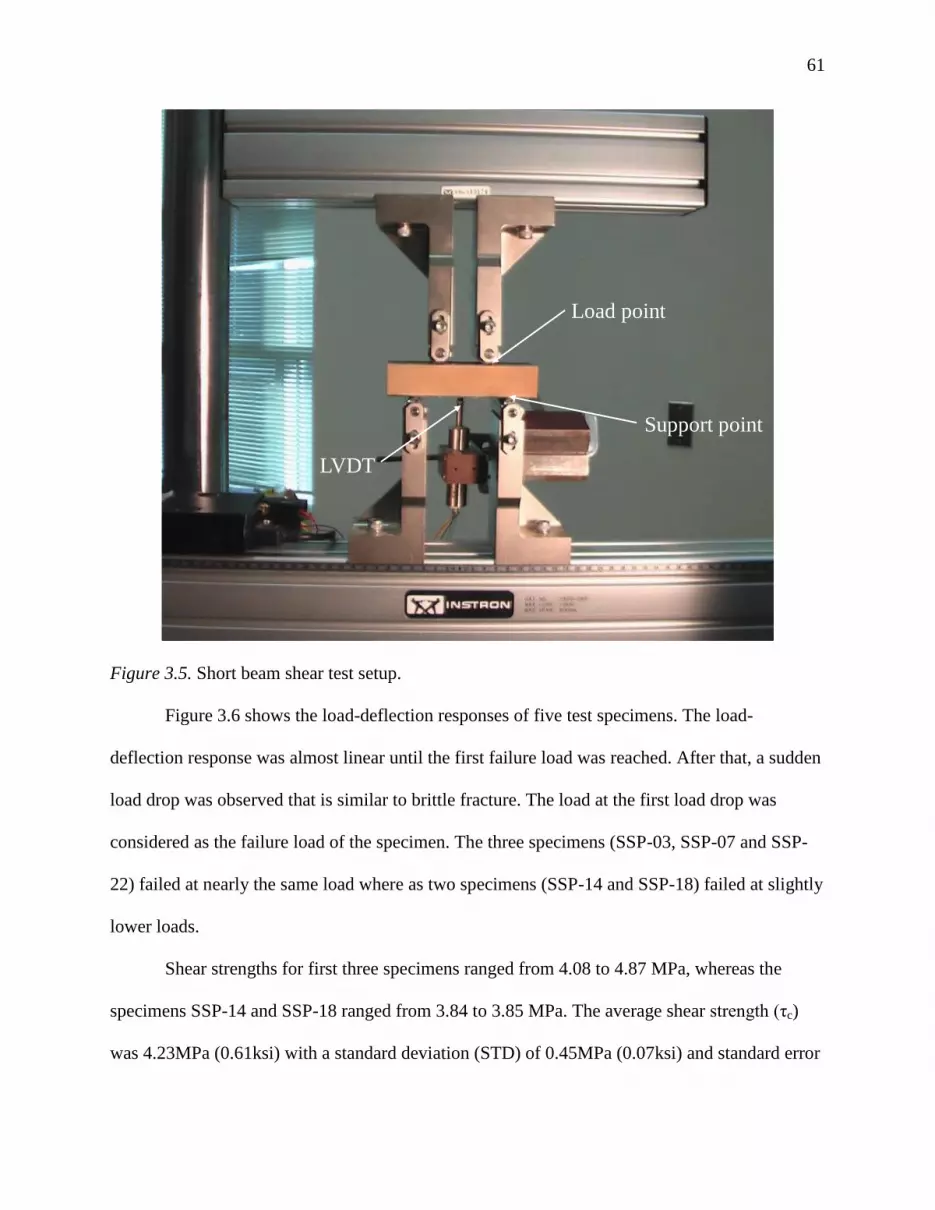
61
Figure 3.5. Short beam shear test setup.
Figure 3.6 shows the load-deflection responses of five test specimens. The load-
deflection response was almost linear until the first failure load was reached. After that, a sudden
load drop was observed that is similar to brittle fracture. The load at the first load drop was
considered as the failure load of the specimen. The three specimens (SSP-03, SSP-07 and SSP-
22) failed at nearly the same load where as two specimens (SSP-14 and SSP-18) failed at slightly
lower loads.
Shear strengths for first three specimens ranged from 4.08 to 4.87 MPa, whereas the
specimens SSP-14 and SSP-18 ranged from 3.84 to 3.85 MPa. The average shear strength (τc)
was 4.23MPa (0.61ksi) with a standard deviation (STD) of 0.45MPa (0.07ksi) and standard error
Load point
LVDT
Support point

62
mean (SEM) of 0.20MPa (0.03ksi). This average strength is about 8% lower than that of
reference [12], which is reasonable when comparing the direct strength and sandwich panel
strength. The test results are listed in Table 3.2. The normalized failure loads (Pf/b) of the test are
shown by solid circles in Figure 3.2.
Figure 3.6. Load-deflection responses of short beam test specimens.
Table 3.2
Summary of Static Shear Strength Test
specimen
ID
Specimen Parameters Shear
S, mm b, mm tc, mm tf, mm Pf, N τc, MPa
SSP-03 80 50.9 25.4 1.5 13,326 4.87
SSP-07 80 50.9 25.4 1.5 12,352 4.51
SSP-14 80 51.1 25.4 1.5 10,533 3.84
SSP-18 80 51.1 25.4 1.5 10,577 3.85
SSP-22 80 51.1 25.4 1.5 11,187 4.08
Average 11,595 4.23
STD 1,215 0.45
SEM 543 0.20
SSP-18
SSP-03
SSP-14SSP-07
SSP-22
Deflection, mm
Lo
ad,
N
181
dt f
S/d = 3 ;
Face sheet: Glass/Vinyl ester
Figure 4. Load-deflection responses of short beam shear test specimens.

63
Figure 3.7 illustrates the typical shear failure of the Eco-Core material. The typical shear
cracks occurred at an angle of 45o in the core near the mid thickness of the specimen and
between the bottom support and top load point. The load drops as soon as the crack forms. Two
types of crack formation were observed from the high speed images. One is a single crack (see
Figure 3.7a) and other one is the two symmetric cracks (Figure 3.7b) both possibilities are
expected. Both types of cracks extended up to the face sheets and stops. With continued loading,
the cracks turns into an interfacial delamination, which results in a final failure.
Figure 3.7. Typical static failure modes in Eco-Core sandwich beam (Crack is highlighted by
white line).
3.6 Shear Fatigue Test
Shear fatigue tests were conducted under a sinusoidal cyclic load of frequency 2Hz and
stress ratio of R = 0.1. Typical shear cyclic loading is shown in Figure 3.8. The endurance limit
requirement depends on the applications, which vary from 107-10
9 cycles. Because of limitations
of equipment and test time, the testing was limited to 106 cycles and the 10
6 cycles was used as
the endurance limit. Four different stress levels (τmax/τc) in the range of 0.9 to 0.7 were chosen
and are listed in Table 3.3. The shear fatigue test plan such as stress ratio, maximum shear stress,
and the associated load are shown in Table 3.3. Four specimens were tested for each stress ratio.
Load, stroke displacement and time were collected using a PC based data acquisition system.
Data acquisition procedure was different for each stress level (τmax/τc). For τmax/τc = 0.9, data was
collected for 5 seconds at every one minute interval, for τmax/τc = 0.8, the data was collected for 5
(a) Single shear crack (b) Symmetrically double shear crack
Figure 5. Typical static failure modes in Eco-Core sandwich beam (Crack is high lighted
by white line).
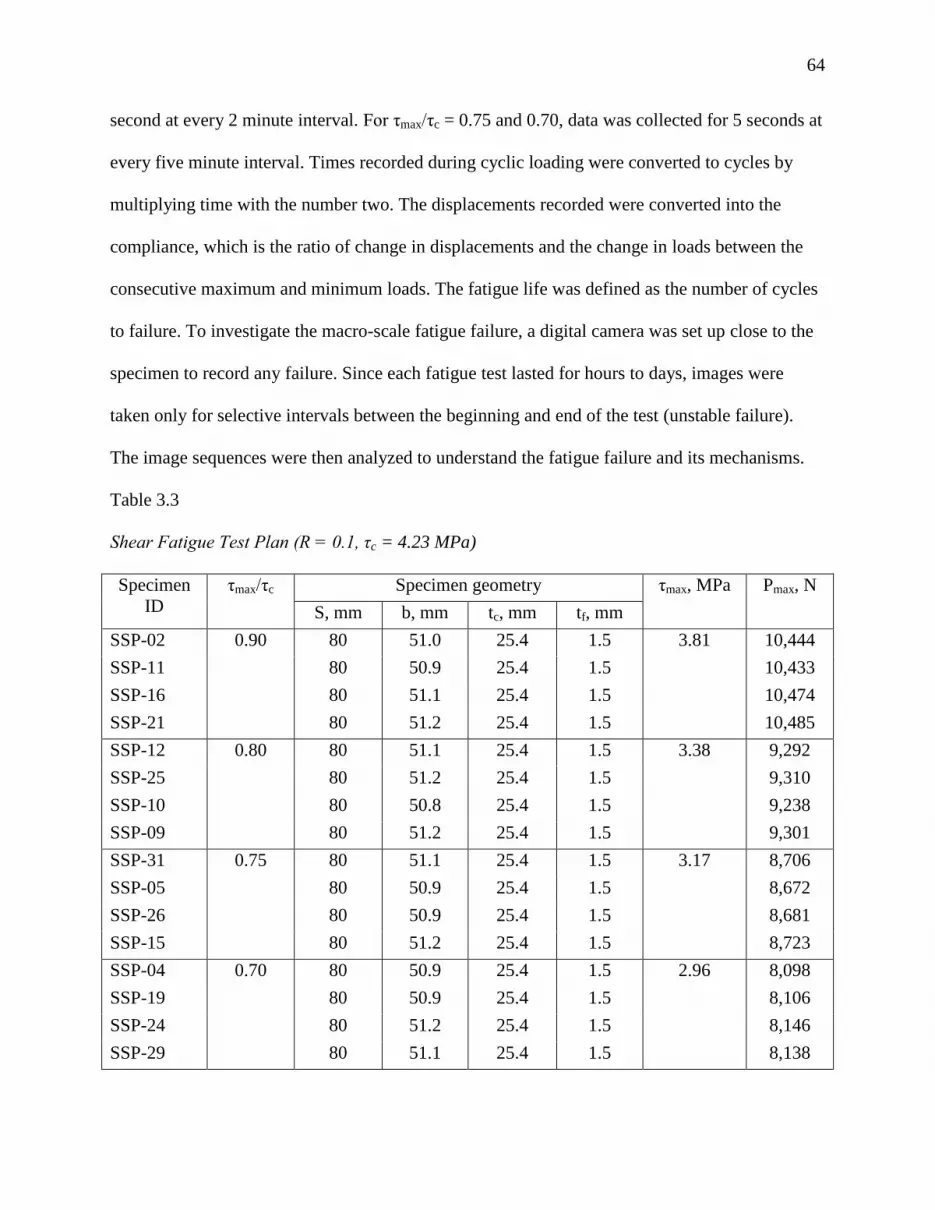
64
second at every 2 minute interval. For τmax/τc = 0.75 and 0.70, data was collected for 5 seconds at
every five minute interval. Times recorded during cyclic loading were converted to cycles by
multiplying time with the number two. The displacements recorded were converted into the
compliance, which is the ratio of change in displacements and the change in loads between the
consecutive maximum and minimum loads. The fatigue life was defined as the number of cycles
to failure. To investigate the macro-scale fatigue failure, a digital camera was set up close to the
specimen to record any failure. Since each fatigue test lasted for hours to days, images were
taken only for selective intervals between the beginning and end of the test (unstable failure).
The image sequences were then analyzed to understand the fatigue failure and its mechanisms.
Table 3.3
Shear Fatigue Test Plan (R = 0.1, τc = 4.23 MPa)
Specimen
ID
τmax/τc Specimen geometry τmax, MPa Pmax, N
S, mm b, mm tc, mm tf, mm
SSP-02 0.90 80 51.0 25.4 1.5 3.81 10,444
SSP-11 80 50.9 25.4 1.5 10,433
SSP-16 80 51.1 25.4 1.5 10,474
SSP-21 80 51.2 25.4 1.5 10,485
SSP-12 0.80 80 51.1 25.4 1.5 3.38 9,292
SSP-25 80 51.2 25.4 1.5 9,310
SSP-10 80 50.8 25.4 1.5 9,238
SSP-09 80 51.2 25.4 1.5 9,301
SSP-31 0.75 80 51.1 25.4 1.5 3.17 8,706
SSP-05 80 50.9 25.4 1.5 8,672
SSP-26 80 50.9 25.4 1.5 8,681
SSP-15 80 51.2 25.4 1.5 8,723
SSP-04 0.70 80 50.9 25.4 1.5 2.96 8,098
SSP-19 80 50.9 25.4 1.5 8,106
SSP-24 80 51.2 25.4 1.5 8,146
SSP-29 80 51.1 25.4 1.5 8,138

65
Figure 3.8. Typical shear fatigue loading (R=0.1).
3.7 Fatigue Test Results and Discussions
3.7.1 Failure modes and associated failure lives. The fatigue failure was characterized
by change in compliance. Figure 3.9 shows compliance versus number of fatigue load cycles of
the test specimen SSP-12 for a shear loading of τmax/τc= 0.80. The compliance plots for other
samples were similar and are presented in Appendix C.1 through C.3. The compliance response
was found to be divided into three types: failure onset, progression and ultimate failure. The
associate three failures were characterized by three different values of compliance change,
namely, 2%, 5% and 7%. This classification is same as that was used for compression fatigue
failure in chapter 2 [79]. Each of these compliance changes was represented by different stages
of shear cracks. The 2% compliance change was usually associated with formation of shear crack
near the mid thickness of the specimen. The 5% compliance change was represented by crack
propagation to the face sheets. Finally, the 7% compliance change was represented by the crack
arrest after meeting the face sheets or the interfacial delamination between face sheet and core.
Cycles, N0
τmax
Pmin
Pmax
P
R = τmax
τmin
τmin

66
The number of cracks associated with these failure stages could be a single crack, symmetrically
located two cracks or a multiple cracks as shown in Figure 3.11 which is similar to static shear
tests. All failure resulted from shear cracks at about 45o to beam axis. Fatigue lives of the
specimen for the three failure criteria are listed in Table 3.4 for different τmax/τc. Those
specimens that did not completely fail in 106 cycles were static tested to measure the residual
strength. Residual strengths are also tabulated in Tables 3.4.
Figure 3.9. Compliance versus number of cycles (N) and the fatigue lives based on the three
failure criteria.
The Figure 3.10 shows edge view of the specimen SSP-12 before starting test, 66,950,
72,600, and 82,300 cycles representing the different levels of failure. Based on edge view
analysis of specimens at different stress levels, three types of failure modes corresponding to
three values of compliance change were observed which are schematically shown in Figure 3.11.
At ultimate failure (Figure 3.10c), sometimes multiple shear cracks with interfacial delamination
near load/support points were observed. This type of crack occurred mostly when the number of
load cycles to failure was large. Delamination near the concentrated cyclic loads was considered
to be due to multi axial stress state, a combination of interfacial shear and tensile bending stress.
Cycles, N
Co
mp
lian
ce,
mm
/N
Specimen# SSP-12
2% (Onset)5% (Progression)
7% (Ultimate failure)
τmax/τc = 0.80181
;3 dt
dS f
Figure 7. Compliance versus number of cycles (N) and the fatigue lives based on the
three failure criteria.

67
Figure 3.12 shows the possible stress states at load and support locations. A detailed finite
element analysis was performed on the test specimen and a summary of the results is presented
below.
Table 3.4
Shear Fatigue Test Results (R= 0.1)
Specimen
ID
τmax/τc Cycles when
test stopped
Residual
strength,
MPa
Cycles for compliance change
N2% N5% N7%
SSP-02 0.90 133,950 3,250 6,160 8,500
SSP-11 346,509 2,975 7,145 7,300
SSP-16 10,128 1,190 3,280 3,460
SSP-21 124,827 360 915 980
SSP-12 0.80 166,926 22,800 52,600 67,500
SSP-25 339,689 3,500 10,200 15,600
SSP-10 1,000,000 140,300 220,090 250,400
SSP-09 698,719 110,600 264,200 325,500
SSP-31 0.75 504,861 148,500 235,200 274,500
SSP-05 903,899 180,300 350,500 470,500
SSP-26 123,104 4,360 11,540 17,820
SSP-15 208,300 41,570 80,150 85,013
SSP-04 0.70 1,000,000 5.78 570,500 1,000,000 1,000,000
SSP-19 1,000,000 4.68 330,500 430,800 515,500
SSP-24 1,000,000 171,500 460,200 554,200
SSP-29 1,000,000 284,600 390,600 590,300
Figure 3.10. Successive failure of the specimen (SSP-12) for τmax/τc = 0.80 (crack is highlighted
by white line).

68
Figure 3.11. Types of shear fatigue failure.
Figure 3.12. Stress state near the support and load points for delamination failure.
3.7.2 Stress analysis near face sheet-core interface region. A 2-D finite element
analysis (FEA) of the test sandwich beam was conducted to understand the stress field near the
support location. Details of the FEA are given in the Appendix A. Here only required figures are
shown to explain the possibility of core-face sheet interfacial debond in fatigue testing.
Figure 3.13 shows the shear stress distribution through the thickness of the core material
(no face sheet) at three locations between the support and load point (see in sketched picture).
The location B and C are about tf distance from the support and load points, respectively. As
expected, the shear stress distribution at B and C are reflection of each other about the mid-plane.
The maximum shear stress is about 2.6τav at the core-face sheet interface. The shear stress at A at
half-way between support and load points is symmetric about the mid-plane and nearly flat curve
as expected in sandwich beams (depending on the relative modulus of face sheet and core). The
maximum shear stress is about 1.1τav. These results conclude that if the shear failure occurs at
(a) Onset (b) Progression (c) Final failure
Figure 9. Types of shear fatigue failure.
P/2
S/2X
Z
Shear stress +
Compression stress
Shear stress +
tension stress
Sym
met
ric
Figure 10. Stress state near the support and load points for delamination failure.

69
mid-way between the support and load points, it is due to maximum shear at the mid-plane of the
beam. If the failure occurs near the support or load point, it may be because of shear
concentration at the interface. Because the interface is resin densified and the interfacial strength
could be much higher than the core shear strength.
Figure 3.13. Shear stress distribution at section A, B, and C.
To examine the state of normal stress near the interface, the bending stresses plotted
through the thickness at the same three sections (A, B and C) in Figure 3.14. As clearly shown
that the bending stress near the interface of the section B is tensile (before it becomes
compressive at the interface) while the bending stress at C near the support is compressive.
Therefore high interfacial shear stress and tensile stress near the support at section B may the
reason for initiation of delamination in fatigue loading. To establish the location of maximum
interfacial shear stress from the support, the through the thickness shear distribution are plotted
for X= 0, tf/3, 2tf/3, tf, 2tf and 4tf (see Figure 3.15). Maximum shear stress at the interface is
plotted against X in Figure 3.16. This plot clearly shows that the shear stress is maximum at
τ/τav
Z/(tf+tc+tf)
X
P
S
d= tc+tf
S/2
tc
tf
tf
Z
AB C
At section-A, X = S/8
At section-B, X ≈ tf
At section-C, X ≈ (S/4-tf )
181
dt f
S/d = 3 ;
(a)
tc
τav=P
2bd
Z/(
t f+
t c+
t f)

70
about one mm or about 2tf/3 distance from the support. Hence the hypothesis is that the
maximum interfacial shear stress and tension bending stress together may be causing interfacial
debond between the Eco-Core and the composite face sheet.
Figure 3.14. Normal stress distribution at section A, B, and C.
Figure 3.15. Through the thickness shear stress distribution for X= 0, tf/3, 2tf/3, tf, 2tf and 4tf.
P
S
d= tc+tf
S/2
tc
tf
tf
X
Z
AB C
At section-B, X ≈ tf
At section-C, X ≈ (S/4-tf )
At section-A, X = S/8
σ/σb
181
dt f
S/d = 3 ;
σb = PSEctc
16bD
(b)
tc
Z/(
t f+
t c+
t f)
181
dt f
S/d = 3 ;
τ/τav
X= tf2tf
4tf
X
P
S
d= tc+tf
S/2
tc
tf
tf
Z
0tf
3
2tf
3
(c)
Z/(
t f+
t c+
t f)

71
Figure 3.16. Maximum shear stress at the interface against X.
3.7.3 S-N Diagram. Normalized shear stress (τmax/τc) versus number of load cycles (N)
for 2%, 5%, and 7% compliance change criteria are shown in Figures 3.17a through 3.17c,
respectively. Both abscissa and the ordinates are in log-log scale. The log-log fatigue data fits a
power law Equation (3.4).
(3.4)
τImax/τav
X, mm
P
S
d= tc+tf
S/2
tc
tf
tf
Z
X
181
dt f
S/d = 3;
(a) Based on 2% compliance change failure
(Continued)
Equation fit
Constants rounded
τmax
τc
Cycles, N
τmax
τc
= AoNα
R = 0.1
2% compliance change

72
Figure 3.17. Normalized stress (τmax/τc) versus number of load cycles test data and the power law
equation for three failure criteria.
A least square equation fit was performed to determine the constants (Ao and α) of the
power law for the three types of failure and the values of the constant are listed in Table 3.5. The
equation, as fitted, is represented by broken lines. The constants when rounded to two
(b) Based on 5% compliance change failure
(Continued)
Equation fit
Constants rounded
R = 0.1
Cycles, N
τmax
τc
5% compliance change
τmax
τc
= AoNα
(c) Based on 7% compliance change failure
Equation fit
Constants rounded
Cycles, N
τmax
τc
= AoNα
τmax
τc
R = 0.1
7% compliance change
Fig.11.
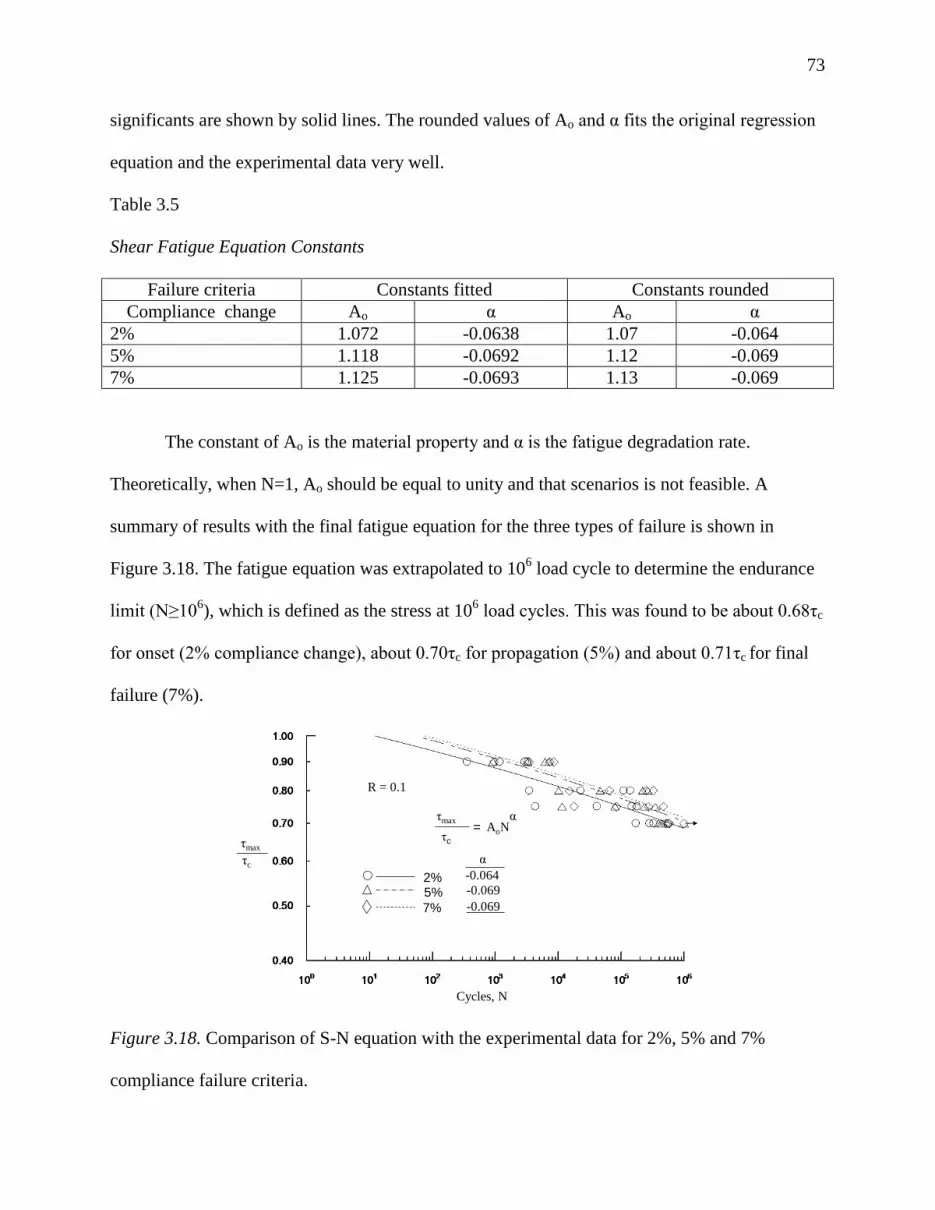
73
significants are shown by solid lines. The rounded values of Ao and α fits the original regression
equation and the experimental data very well.
Table 3.5
Shear Fatigue Equation Constants
Failure criteria Constants fitted Constants rounded
Compliance change Ao α Ao α
2% 1.072 -0.0638 1.07 -0.064
5% 1.118 -0.0692 1.12 -0.069
7% 1.125 -0.0693 1.13 -0.069
The constant of Ao is the material property and α is the fatigue degradation rate.
Theoretically, when N=1, Ao should be equal to unity and that scenarios is not feasible. A
summary of results with the final fatigue equation for the three types of failure is shown in
Figure 3.18. The fatigue equation was extrapolated to 106 load cycle to determine the endurance
limit (N≥106), which is defined as the stress at 10
6 load cycles. This was found to be about 0.68τc
for onset (2% compliance change), about 0.70τc for propagation (5%) and about 0.71τc for final
failure (7%).
Figure 3.18. Comparison of S-N equation with the experimental data for 2%, 5% and 7%
compliance failure criteria.
Cycles, N
2%5%
7%
τmax
τc
= AoN
τmax
τc
R = 0.1
-0.069
-0.069
-0.064
α
α
Figure 12. Comparison of S-N equation with the experimental data for 2%, 5% and 7%
compliance change failure criteria.

74
3.8 Summary
Eco-Core sandwich beams made of woven roving FGI 1854 glass/Vinyl ester face sheet
were used to study core shear fatigue performance. The loading frequency was 2Hz with a load
ratio R= 0.1. The core density was 0.5 g/cc. Specimen configuration was designed to produce
shear failure. Fatigue tests were conducted at τmax/τc values of 0.9 to 0.7, where τmax is the
maximum cyclic shear stress and τc is the shear strength of the Eco-Core, which is 4.23 ± 0.20
MPa.
Shear fatigue failure of Eco-Core sandwich specimen were classified into three types:
damage onset, damage progression and ultimate shear failure. These failures were characterized
by 2%, 5% and 7% changes in compliance and corresponding life represented the failure lives.
The 7% compliance change life is also classified as the total fatigue life of the core material.
These three failure are classified a onset of 45o single shear crack, multiple shear cracks, and
multiple shear cracks with an interfacial delamination. The Interfacial delamination is attributed
to combination of high interfacial shear stress and tensile bending stress.
The fatigue stress-load cycle (S-N) data followed a well-known power law equation,
τmax/τc= AoNα. The constants Ao and α were established for all three types of failure. Based on 1
million cycles, the endurance limit was found to be 0.68τc, 0.70τc and 0.71τc, respectively for
onset, propagation and ultimate failures.

75
CHAPTER 4
Flexural Fatigue Characterization
4.1 Introduction
In this chapter, flexural fatigue performance of Eco-Core sandwich beam is described. The
static test was conducted following ASTM C393 standard, the same test setup was used for
flexural fatigue test. For both static and fatigue flexure tests, Eco-Core sandwich beams made of
woven roving FGI 1854 glass/Vinyl ester face sheet were used. The thicknesses of fabricated
core (tc) and face sheet (tf) were 25.4 mm and 1.50 mm, respectively. The average density of the
Eco-Core panel was about 0.52 g/cc. The length and width of the long beam sandwich specimens
were 320 mm and 51 mm, respectively. The specimen span (S) was set to 269 mm with an
average sandwich thickness (d) of 26.9 mm that results in S/d of 10 and tf/d of 1/18. Flexural
fatigue test was conducted using sinusoidal loading with a frequency of 2 Hz and stress ratio R
of 0.1. Tests were conducted at different stress levels (σmax/σct), where σmax is the maximum
cyclic bending stress in the core and σct is the bending tensile strength of the core. A PC based
data acquisition system was used to store fatigue load, stroke displacement and time. This data
were converted to compliance and number of cycles, which was then used to create compliance-
number of cycles curves. As previously explained, the fatigue failure was characterized by
damage onset, progression and final failures. These failures were found to be equivalent to
compliance change of 1%, 5% and 7%, respectively and corresponding number of cycles
reflected the fatigue lives for damage onset, progression and final failure. This number of cycles
data was used to determine S-N relationship. The macro-scale fatigue failure mechanism was
investigated by analyzing the damage images of the test samples taken from beginning to end of
the test.

76
4.2 Material System
Eco-Core sandwich panels were fabricated first preparing Eco-Core panels from fly ash
and phenol-formaldehyde resole binder resin. Then fabricating FGI 1854 glass fiber/vinyl ester
composite laminate and bonding the face sheets on top and bottom face sheets of the Eco-Core
using a room temperature cure. Details of the fabrication of sandwich panels are given in chapter
3, section 4.
4.3 Design of Specimen
Flexural test specimen was designed as per the guidelines given in the reference [12] and
using the material properties given in Table 3.1 in chapter 3. The Eco-Core properties were taken
from reference [11] and the composite face sheet properties were taken from reference [83].
Transverse shear modulus of face sheet listed in Table 3.1 in chapter 3 and in reference [12] was
assumed. It should be noted that compressive strength and modulus of Eco-Core listed in Table
3.1 is slightly different from that is listed in [79]. In that study, the average value of compressive
strength and modulus was 19.61 MPa and 1.65 GPa, respectively. In designing the specimen,
Eco-Core was treated as isotropic and the face sheet as orthotropic. Four point loaded sandwich
beam was selected to avoid direct contact of the load on the core material and reduce the stress
concentration under the load point. The direct load contact with solid core may lead to premature
failure under load points by cyclic loading due to indentation and rubbing of loading rollers on
the material. The specimen geometric parameters are defined in Figure 4.1 and the parameters
are defined in chapter 3, section 3.
The nominal thicknesses of the core and face sheet are 25.4 mm and 1.40 mm,
respectively and the width of the specimen is 51 mm. The design equation for core shear and
core tension failure is similar to those derived in chapter 3 by equations 3.1 and 3.2, respectively.

77
Because the loading is one-third point loading, expression for the maximum bending moment is
PS/6 (Figure 4.1 c) instead of PS/8, which leads an expression for maximum bending stress in
the core is given by
(4.1)
Or the normalized failure load, Pf is given by
(4.2)
where, tc, σct and Ect are the core thickness, core tensile strength and modulus, respectively. D
and b are the flexural rigidity and width of the sandwich beam, respectively.
Figure 4.1. (a) Schematic of test specimen, loading and nomenclature (b) Shear force diagram
(c) Bending moment diagram.
Normalized failure loads for core shear and core tension failure criteria are shown in
Figure 4.2 as a function of span to depth (S/d) ratio. The core shear failure is represented by a
horizontal broken line and core tension failure (σct = 6.46 MPa based on tension test value) by a
solid line. Intersection of the two lines represents the potential for both failures. The two curves
P
Width, b = 2d
Edge distance, e ≈ tc
d= tc+tftc
tf
tf e eS = 10d
S/3
d
(a)
(b)
(c)
P/2 -P/2
-P/2 P/2
PS/6 PS/6

78
intersect at S/d = 3.5. Therefore, S/d of 10 was selected so that core tension failure is the
dominant failure mode and also the specimen length is short enough to conduct fatigue test using
the existing test fixtures.
Figure 4.2. Failure load versus span/depth(S/d) ratio for Eco-Core sandwich beam based on
shear and flexural failure criteria.
4.4 Static Flexural Test and Results
Static flexural tests were performed to validate the core tension strength used in design of
test specimen and identify the core failure modes. The test was conducted using an MTS servo-
hydraulic test machine following ASTM C393 by applying four-point loading (Figures 4.1). A
deflection transducer (LVDT) was placed under the specimen at the mid span for direct
measurement of deflection (Figure 4.3). The specimen was loaded at a constant cross-head speed
of 1.27 mm/min (0.05in/min). Load and deflection were recorded at every one-half second and
the associated failure modes were monitored by a high speed camera. Five specimens were
tested. The specimen number, geometric parameters, and failure loads of all tested specimens
EtSD
bP
ctc
ctf 12
d
bP
c
f
2
181
dt f
Core tension failure
For σct = 6.46 MPa
For σct = 9.97 MPa
Core Shear failure
Experimental data
S/d
Fig.2.
Pf/b
, N
/mm

79
were recorded and listed in Table 4.2. Figure 4.4 shows the load-deflection response of the tested
specimens. Figure 4.4a shows the response for all five tested specimens and Figure 4.4b shows
the detailed response for the specimen FSP-20. Each load drop in Figure 4.4b indicates a
formation of crack. The maximum load before the first load drop (#1) represent the first vertical
flexural crack appeared in the tension side of the core (between the load points) was considered
as the flexural failure load of the core. As load increased additional cracks formed between the
load-span, their sequence is represented by white lines in Figure 4.5 and also mapped in Figure
4.4b. All these cracks started at the bottom interface between the core and face sheet, and
propagated up to about mid-thickness of the core and stopped. The final failure was started by
forming a tension crack under one of the load points followed by a 45o shear crack near that load
point and then ultimate failure by interfacial delamination, see Figure 4.5d and also in Figure
4.4b. Similar failure modes were observed by Shivakumar and Chen [12].
Table 4.1
Flexural Static Test Results
Specimen
ID
Specimen geometry d= tc+tf,
mm
Failure
Load, N
Strength,MPa
S, mm b, mm tc,mm tf, mm
FSP-20 269 51.0 25.4 1.5 26.9 6761 10.03
FSP-11 269 51.2 25.4 1.5 26.9 6939 10.26
FSP-16 269 50.9 25.4 1.5 26.9 6872 10.22
FSP-28 269 51.1 25.4 1.5 26.9 6352 9.41
FSP-04 269 51.2 25.4 1.5 26.9 6716 9.94
Average 6728 9.97
STD 228 0.34
SEM 102 0.15
The specimens FSP-20, FSP-11, FSP-16 and FSP-04 failed at nearly the same load
whereas specimens FSP-28 had slightly lower failure load. The flexural core strength (σct) of all
tested specimens was calculated using the Equation (4.3) and is listed in Table 4.1. In measuring

80
the flexural strength, the core tensile modulus (Ec) of 2.54 GPa and flexural rigidity (D) of 19.01
MN.mm were used.
(4.3)
The average flexural strength (σct) was 9.97MPa (1.446ksi) with a standard error mean
(SEM) of 0.15MPa (0.02ksi). This strength value is 54% larger than that of Shivakumar et al.
[12] data, where core tensile strength measured by uniaxial tension test of Eco-Core sample of
core density 0.47 g/cc. The present result was from flexural test and the average core density was
0.52 g/cc. The density and the test method difference may be the reason for difference in
strengths. The flexural design curve Pf/b versus span for the new value of flexural strength (9.97
MPa) is shown by the broken line in the Figure 4.2. Symbols represent the test data. This
experimental data is used for designing specimen for fatigue test.
Figure 4.3. Flexural test setup.
Load Point
LVDT
Support Point

81
Figure 4.4. Stress versus deflection responses of flexural tests.
Figure 4.5. Typical static failure modes in Eco-Core sandwich beam specimen FSP-20 (Crack is
highlighted by white line).
(a) For all tested specimens
0
2
4
6
8
10
12
0 0.5 1 1.5 2 2.5 3 3.5
Deflection, mm
Str
ess,
MP
a
FSP-20
FSP-28
FSP-11
FSP-04FSP-16
Face sheet: Glass/Vinyl ester
181
dt f
S/d = 10 ;
Fig.4.
(b) Details for the specimen # FSP-20
Specimen#FSP-20
Deflection, mm
Str
ess,
MP
a
0
2
4
6
8
10
12
0 0.5 1 1.5 2 2.5 3 3.5
σult21
3
Onset, σct Shear crack
Fig.5.

82
4.5 Stress Analysis Near Face Sheet-Core Interface Region
A 2-D finite element analysis (FEA) of the test sandwich beam was conducted to
understand the stress field near the critical location. Details of the FEA are given in the
Appendix A. Here only required figures are shown to explain the possibility of final core shear
failure followed by core-face sheet interfacial debond in fatigue testing.
Figure 4.6 shows the shear stress distribution through the thickness of the core material
(no face sheet) at three locations between the support and load point and in the symmetric region
(see in insert picture). The location B and C are about tf distance from the support and load
points, respectively. As expected, the shear stress distribution at B and C are reflection of each
other about the mid-plane. The maximum shear stress is about 2.6τav at the core-face sheet
interface. The shear stress at A at half-way between support and load points is symmetric about
the mid-plane and nearly flat curve as expected in sandwich beams (depending on the relative
modulus of face sheet and core). The maximum shear stress is about 1.1τav. These results
conclude that if the shear failure occurs at mid-way between the support and load points, the
failure is due to maximum shear at the mid-plane of the beam. If the failure occurs near the
support or load point, the failure may be because of shear concentration at the interface. Because
the interface is resin densified, the interfacial strength could be much higher than the core shear
strength. Because of symmetry, the shear stresses at section D are zero. So, if there is any failure
between two loading points, it will be due to bending stresses.
To examine the state of normal stress near the interface, the bending stresses plotted
through the thickness at the same three sections (A, B, C and D) in Figure 4.7. As clearly shown
that the bending stress near the interface of the section B is tensile (before it becomes
compressive at the interface) while the bending stress at C is tensile at tension side and it is

83
nearly same as that at section D. Hence the hypothesis is that combination of shear stress and
high tensile stress near the load point at section C may the reason for initiation of tension crack
followed by shear crack under one of the load points in fatigue loading.
Figure 4.6. Shear stress distribution at section A, B, and C.
Figure 4.7. Normal stress distribution at section A, B, and C.
4.6 Fatigue Test
Flexural fatigue tests were conducted under a sinusoidal cyclic load of frequency 2Hz
and stress ratio R = 0.1. The test setup was similar as used for static test. Typical flexural cyclic
loading is shown in Figure 4.8.
P/2
S/2
tc
tf
tf
X
Z
AB C
Sym
met
ric
D
181
dt f
S/d = 10 ;
τ/τav
At section-C, X ≈ (S/3-tf )
At section-A, X = S/6
At section-B, X ≈ tf
At D, X =S/2
τav=P
2bd
tc
Z/(
t f+
t c+
t f)
At section-B, X ≈ tf
At section-C, X ≈ (S/3-tf ) At section-A, X = S/6
At section-D, X = S/2
σ/σb
181
dt fS/d = 10 ;
P/2
S/2
tc
tf
tf
X
Z
AB CS
ym
met
ric
D
σb = PSEctc
12bD
tc
Z/(
t f+
t c+
t f)

84
Figure 4.8. Typical flexural fatigue loading (R=0.1).
The endurance limit requirement depends on the application, which generally range 107-
109 cycles for marine applications. Because of limitations of equipment and test time, the testing
was limited to 106 cycles and the 10
6 cycles was used as the endurance limit for analysis of the
results. Four different stress levels (σmax/σct) in the range of 0.9 to 0.7 were chosen, where σmax is
the maximum cyclic flexural stress in the core material. For each stress level, four specimens
were tested. The specimen number and loading are listed in Table 4.2. Load, stroke displacement
and time were recorded using a PC based data acquisition system. Data acquisition procedure
was different for each stress level (σmax/σct). For σmax/σct = 0.9, data were collected for 5 seconds
at every one minute intervals, for σmax/σct = 0.8, the data were collected for 5 seconds at every 2
minute intervals. For σmax/σct = 0.75 and 0.70, data were collected for 5 seconds at every five
minute intervals. Times recorded in seconds during cyclic loading were converted to cycles by
multiplying time by two (2Hz loading frequency) to obtain number of cycles. The load and
displacements recorded were converted into the compliance, which is the ratio of change in
displacements and the change in loads between the consecutive maximum and minimum loads
for a single load cycle and is defined by
Rσmin
σmax==
Pmax
Pmin
Pmax
Pmin σmin
σmax
P
Cycles, N
Fig.6.

85
(4.4)
where, dmax is the displacement for the maximum applied load Pmax and dmin is the displacement
for minimum applied load Pmin for a single cycle.
To investigate the macro-scale fatigue failure, a digital camera was set up close to the
specimen to record the failure mode. Since each fatigue test lasted for hours to days, images were
taken only for selective intervals between the beginning and end of the test (unstable failure).
The image sequences were then analyzed to understand the fatigue failure and its mechanisms.
Table 4.2
Flexural Fatigue Test Plan for R=0.1(σct = 9.97 MPa)
Specimen
ID
σmax/σct σmax,
MPa
Thickness
tc, mm
Width
b, mm
Span
S, mm
Pmax, N
FSP-02 0.90 8.97 25.4 51.2 269 6062
FSP12 25.4 51.4 269 6093
FSP-24 25.4 51.2 269 6069
FSP-17 25.4 51.2 269 6062
FSP-03 0.80 7.98 25.4 51.1 269 5380
FSP-06 25.4 51.4 269 5420
FSP-10 25.4 51.3 269 5407
FSP-21 25.4 51.5 269 5423
FSP-09 0.75 7.48 25.4 51.3 269 5065
FSP-29 25.4 51.3 269 5065
FSP-23 25.4 51.2 269 5055
FSP-22 25.4 51.2 269 5060
FSP-05 0.70 6.98 25.4 51.4 269 4739
FSP-08 25.4 51.3 269 4725
FSP-18 25.4 51.1 269 4713
FSP-14 25.4 51.4 269 4739
4.7 Fatigue Test Results and Discussions
4.7.1 Failure definition and associated failure lives. The fatigue failure was
characterized by change in compliance which is similar to strength or stiffness reduction models.
Figure 4.9 shows compliance versus number of fatigue load cycles of the test specimen FSP-21

86
for a flexural loading of σmax/σct = 0.80. The compliance plots for other samples were similar and
are presented in appendix D.1 through D.3. The compliance response was found to be divided
into three types: failure onset, progression and ultimate failure. The three failures were
characterized by three different values of compliance change, namely, 1%, 5% and 7%, similar
the values were used in compression [79] and shear [82] fatigue tests. Except, here 1%
compliance change criteria was used for failure onset, because this failure was clear with a
formation of vertical flexural cracks. Each of these compliance changes was represented by
different stages of damage formation. The 1% compliance change can be usually associated with
the formation of a vertical crack in the core on tension region of the specimen, specifically
between the two load points. The 5% compliance change can be represented the accumulation of
damage by formation of multiple vertical cracks between two load points of four-point test.
Finally, the 7% compliance change can be represented by a formation of 45o shear crack in the
core under one of the load points in the beam. Selection of these compliance limits was based on
the profile of the compliance versus number of load cycles (See Figure 4.9). The number of load
cycles required to cause each of the compliance change is called fatigue life. According to the
three compliance changes (1%, 5% and 7%), there are three fatigue lives which are represented
by N1%, N5% and N7%, respectively (See Figure 4.9). A small variation of these values has
minimal impact on the fatigue lives.
The Figure 4.10 shows the fatigue failure mode of Eco-Core sandwich specimen FSP-21.
The white lines represent the crack pattern. The first image (a) was taken before loading the
specimen; image (b) was taken just after the formation of first vertical crack (about 1%
compliance change); images (c) and (d) were taken for successive formation of multiple vertical
cracks (within 5% compliance change). Each vertical crack matches with the compliance jump in
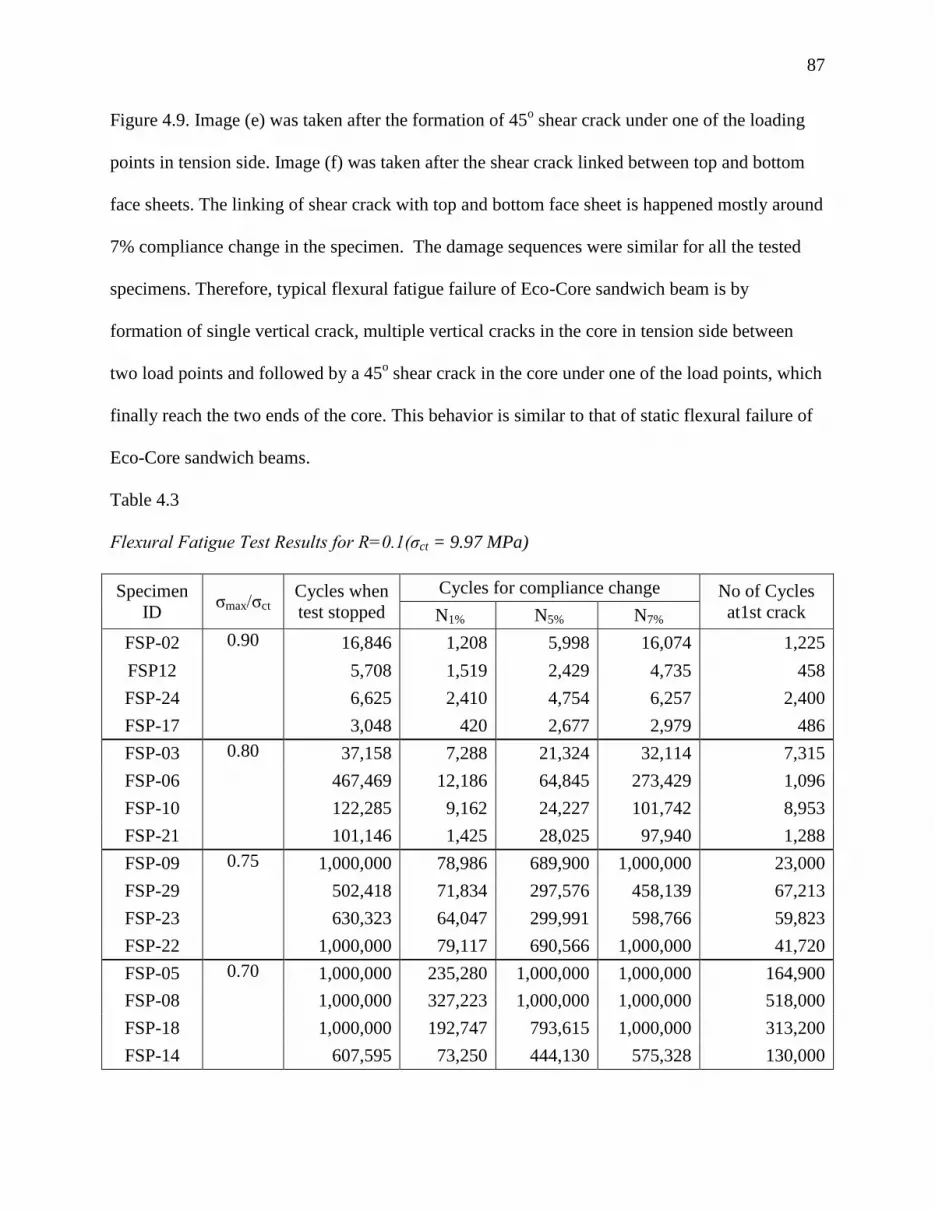
87
Figure 4.9. Image (e) was taken after the formation of 45o shear crack under one of the loading
points in tension side. Image (f) was taken after the shear crack linked between top and bottom
face sheets. The linking of shear crack with top and bottom face sheet is happened mostly around
7% compliance change in the specimen. The damage sequences were similar for all the tested
specimens. Therefore, typical flexural fatigue failure of Eco-Core sandwich beam is by
formation of single vertical crack, multiple vertical cracks in the core in tension side between
two load points and followed by a 45o shear crack in the core under one of the load points, which
finally reach the two ends of the core. This behavior is similar to that of static flexural failure of
Eco-Core sandwich beams.
Table 4.3
Flexural Fatigue Test Results for R=0.1(σct = 9.97 MPa)
Specimen
ID σmax/σct
Cycles when
test stopped
Cycles for compliance change No of Cycles
at1st crack N1% N5% N7%
FSP-02 0.90 16,846 1,208 5,998 16,074 1,225
FSP12 5,708 1,519 2,429 4,735 458
FSP-24 6,625 2,410 4,754 6,257 2,400
FSP-17 3,048 420 2,677 2,979 486
FSP-03 0.80 37,158 7,288 21,324 32,114 7,315
FSP-06 467,469 12,186 64,845 273,429 1,096
FSP-10 122,285 9,162 24,227 101,742 8,953
FSP-21 101,146 1,425 28,025 97,940 1,288
FSP-09 0.75 1,000,000 78,986 689,900 1,000,000 23,000
FSP-29 502,418 71,834 297,576 458,139 67,213
FSP-23 630,323 64,047 299,991 598,766 59,823
FSP-22 1,000,000 79,117 690,566 1,000,000 41,720
FSP-05 0.70 1,000,000 235,280 1,000,000 1,000,000 164,900
FSP-08 1,000,000 327,223 1,000,000 1,000,000 518,000
FSP-18 1,000,000 192,747 793,615 1,000,000 313,200
FSP-14 607,595 73,250 444,130 575,328 130,000
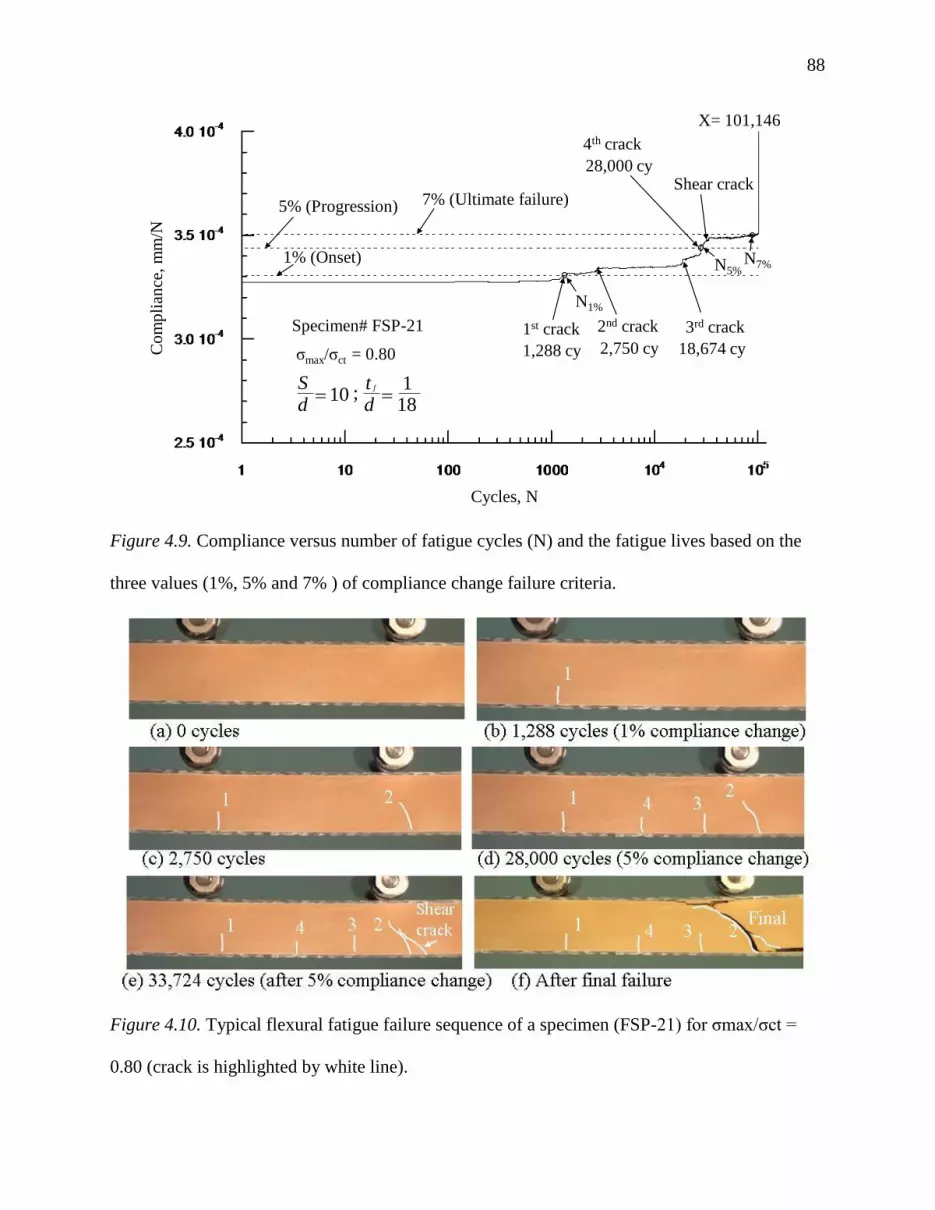
88
Figure 4.9. Compliance versus number of fatigue cycles (N) and the fatigue lives based on the
three values (1%, 5% and 7% ) of compliance change failure criteria.
Figure 4.10. Typical flexural fatigue failure sequence of a specimen (FSP-21) for σmax/σct =
0.80 (crack is highlighted by white line).
Fig.7.
1st crack 2nd crack 3rd crack
4th crack
Shear crack
1,288 cy 2,750 cy 18,674 cy
28,000 cy
X= 101,146
Cycles, N
1% (Onset)
5% (Progression) 7% (Ultimate failure)
Co
mp
lian
ce,
mm
/N
Specimen# FSP-21
σmax/σct = 0.80
181
;10 dt
dS f
N1%
N5%N7%

89
4.7.2. S-N diagram. The fatigue load cycles (N) for 1%, 5%, and 7% change in
compliance for different stress values of tested specimens are listed in Table 4.3. The same data
are plotted in Figure 4.11a through 4.11c for onset (1% compliance change), propagation (5%)
and ultimate failure (7%), respectively. The normalized maximum tensile stress (σmax/σct) and
number of load cycles (N) were plotted in log-log scale, a typical of fatigue data representation.
The test data was fit a power law equation (4.5) using a least square regression.
(4.5)
Here Ao is the material property constant and the exponent, α is the slope of the log-log
curve represents the fatigue degradation rate. Theoretically, when N=1, Ao should be equal to
unity and this scenario is not feasible. The computed values of Ao and the exponent α for all
three cases of failure are listed in Table 4.4. The values of α were nearly the same for damage
onset and progression but for final failure it is slightly higher. The constant Ao shows an
ascending trend from onset to final failure. The Table 4.4 also lists the final rounded values of
Ao and α. The rounded α values are -0.071, -0.074 and -0.079 for damage onset, progression and
ultimate failure, respectively. This indicates that flexural strength degradation rate of the core
increases with increasing damage. The broken and solid lines in Figure 4.11 represent the
equation (4.5) using raw values and rounded values of Ao and α, respectively. Both fits agree
with the experimental data. The final fatigue equation for the three types of failure along with
experimental data is shown in Figure 4.12. The fatigue equation was extrapolated to 106 load
cycle to calculate the endurance limit (N≥106). The endurance value was found to be about
0.65σct for onset (1% compliance change), about 0.70σct for propagation (5%) and about 0.71σct
for final failure (7%). The equation could be extrapolated to 107
and 108 cycles but there is no
data is available to validate the equation.

90
1% compliance change
σmax
σct
σmax
σct= AoN
α
Cycles, N
(a) Based on 1% compliance change failure criteria
Equation fit
Constants rounded
Experiment
(b) Based on 5% compliance change failure
Cycles, N
5% compliance changeσmax
σct
σmax
σct= AoN
α
Equation fit
Constants rounded
Experiment

91
Figure 4.11. Comparison of normalized stress σmax/σct versus number of load cycles from
experiment and equation for 1%, 5% and 7% change in compliance failure criteria.
Figure 4.12. Comparison of modified stress versus number of cycle equation with the
experiment for the three failure criteria.
7% compliance change
σmax
σct
σmax
σct= AoN
α
Cycles, N
(c) Based on 7% compliance change failure
Fig.9.
Equation fit
Constants rounded
Experiment
Fig.10.
σmax
σct
σmax
σct= AoN
α
1%
5%
7%
R = 0.1
α
-7.9x10⁻²
-7.1x10⁻²
-7.4x10⁻²
Cycles, N
Ao
1.08
1.15
1.19

92
Table 4.4
Flexural Fatigue Equation Constants
Failure criteria Constants fitted Constants rounded
Compliance change Ao α Ao α
1% 1.0825 -0.0708 1.08 -0.071
5% 1.1498 -0.0735 1.15 -0.074
7% 1.1914 -0.0785 1.19 -0.079
4.8 Summary
Eco-Core sandwich beams made of woven roving FGI 1854 glass/Vinyl ester face sheet
and a fire resistant Eco-Core were used to study core flexural fatigue performance. The loading
frequency was 2Hz with the load ratio R= 0.1.The Eco-Core density was ranging from 0.515 g/cc
to 0.522 g/cc with an average bulk density of 0.518 g/cc. Specimen configuration was designed
to produce core tension failure. Static flexural tests were conducted using ASTM C393 to verify
the core tension strength (σct) that was found to be 9.97 ± 0.15 MPa for the specimen produced in
this study. This is about 54% higher than the uniaxial tensile strength of the material that was
reported previously. The failure modes were tension cracks in the core followed by shear failure.
Fatigue tests were conducted at σmax/σct values of 0.9 to 0.7, where σmax is the maximum
cyclic flexural stress. The fatigue test setup was same as used for static test. The study showed
that flexural fatigue failure mode of Eco-Core material was by first formation of vertical cracks
in the core in tension side followed by a formation of 45o shear crack in the core under one of the
load points. These failure modes are similar to that of static flexural failures. Flexural fatigue
failure of Eco-Core sandwich beam occurred in three stages: damage onset, damage progression
and ultimate failure. These failures were characterized by 1%, 5% and 7% changes in
compliance and associated number of cycles as their failure lives. The 7% compliance change
was considered to be total fatigue life of the core.

93
The fatigue stress-load cycle (S-N) data followed the well-known power law equation,
σmax/σct = AoNα. The constants Ao and α were established for all three types of failures. The
damage degradation rate increased with damage state of the core material. Based on 1 million
cycles, the endurance limit was found to be 0.65σct, 0.70σct and 0.71σct, respectively for damage
onset, propagation and ultimate failure.

94
CHAPTER 5
Concluding Remarks and Recommendation for Future Work
5.1 Conclusions
Eco-Core is a special class of syntactic foam made by high volume of flyash and a small
volume of phenolic resin, where flyash is collected from coal burn thermal power plants.
Because of very low volatile content in the mixture, it has demonstrated to be a fire resistant
material for composite sandwich structures applications. Except for one flexure fatigue article on
general class of syntactic foam, there is no other article on fatigue characterization of syntactic
foams. Therefore, a comprehensive fatigue characterization of fire resistant Eco-Core materials
was undertaken. Three stress states were considered, namely, compression-compression, shear
and flexural stress states. Compression fatigue was performed directly on Eco-Core cylindrical
specimen, whereas the shear and flexure fatigue were performed using E glass-Vinyl ester face
sheet sandwich beam specimen to avoid direct load contact and avoid wear damage between the
support rollers. The Eco-Core specifics of the study and the conclusions are summarized in the
following sections. The endurance limit was determined based on one million load cycles
because of limitation of test equipment and duration of test that required more than 1 million
cycles. All tests were conducted in a load control mode with loading frequency of 2 Hz and core
specimen density of about 0.5 g/cc. The load, displacement and time were recorded continuously
using a PC based data acquisition system. From this data, compliance versus number of load
cycles was generated. Edge of the specimen was imaged in regular interval to document the
damage modes of onset, progression and final failure for both static and fatigue tests.
5.1.1 Compression-compression fatigue. Compression-Compression fatigue study on
Eco-Core was conducted for two values of stress ratios (R= 10 and 5). Tests were conducted at

95
maximum compression stress (σmin) varied from 60% to 90% of compression strength (σc) for
R=10 and 80% to 95% of compression strength for R=5. The compression strength of Eco-Core
depends on the material density and its value for panels 1 and 2 were 18.9 ± 0.13 MPa and 20.3
± 0.00 MPa, respectively with the average values of two panels was 19.6 ± 0.25 MPa. The study
showed that Eco-core has well defined failure modes and associated fatigue lives. The failure
modes were classified into: damage on-set; damage progression, and final failure.
Damage on-set was characterized by formation of a single crush band at the middle or at top
or bottom edge of the specimen; damage progression was characterized by crush band
propagation, and final failure was characterized by 7% increase in compliance. Damage onset
and progression were characterized by 2% and 7% increase in compliance. The number of
load cycles required for these three compliance changes are defined as onset life, progression
life and total life, respectively. The three failure modes were found to be same for both static
and fatigue loadings.
The stress versus number of load cycles (S-N) data followed a well-defined power law
equation, σmin/σc= AoNα. Constants of the equation were established for all three modes of
failures.
Based on 1 million cycles, the endurance limit was found to be 0.72σc, 0.75σc and 0.76σc,
respectively, for on-set, propagation and final failure for R=10 while it is 0.81σc, 0.82σc and
0.82σc, respectively, for R=5.
Finally, compression-compression fatigue life was found to be dependent on cyclic stress
range similar to a behavior that of metallic materials.
5.1.2 Shear fatigue. Shear fatigue performance of Eco-Core sandwich beam was studied
using a specimen of span to depth ratio of three and load ratio of R= 0.1. Normalized maximum

96
shear stress (τmax/τc) was ranging from 0.7 to 0.9. Shear fatigue failure of Eco-Core sandwich
specimen were also classified into three types: damage onset, damage progression and ultimate
shear failure. Each of these failures corresponds to 2%, 5% and 7% changes in compliance.
Shear failure initiated as a 45o angle of single shear crack and progressed to multiple shear cracks
that spanned between top and bottom face sheets. At low fatigue shear stress a core-face sheet
interfacial delamination were also found.
The fatigue stress-load cycle (S-N) data found to follow the well known power law equation,
τmax/τc= AoNα. The constants Ao and α were established for all three types of failure.
Based on 1 million cycles, the endurance shear strength was found to be 0.68τc, 0.70τc and
0.71τc, respectively for onset, propagation and ultimate failure.
5.1.3 Flexural fatigue. Flexural fatigue performance of Eco-Core sandwich beam was
studied using a specimen with a span-depth ratio of 10 and load ratio of 0.1. This specimen
configuration was found to produce core tension failure The Eco-Core bulk density was slightly
higher and it was about 0.52 g/cc. Fatigue tests were conducted at normalized maximum stress
σmax/σct ranged from 0.7 to 0.9, where σct is the flexural strength of Eco-Core and it was found to
be 9.97 ± 0.15 MPa.
The study showed that flexural fatigue failure mode was by first formation of vertical tension
cracks in the core between the load points of the four-point bend specimen, and then followed by
a formation of 45o shear crack in the core under one of the load points. Fatigue failure modes
were found to be similar to that of static flexural failure of the beam. Flexure failure modes were
classified into three types: damage onset, damage progression and ultimate failure. These failures
were found to be associated with 1%, 5% and 7% increase in compliance. Note that the on-set
compliance change reduced to 1% in contrast to 2% in compression and shear failure because the

97
flexure failure was clear.
The fatigue stress-load cycle (S-N) data followed the well-known power law equation,
σmax/σct = AoNα. The constants Ao and α were established for all three types of failures.
Based on 1 million cycles, the endurance limit was found to be 0.65σct, 0.70σct and 0.71σct,
respectively, for onset, propagation and ultimate failures.
A detailed finite element stress analysis of shear and flexure specimens was conducted to
understand the stress states at failure. Final failure of the shear specimen could also be
associated with both high interfacial shear stress and bending stress at the interface between
the core and face sheet. For flexure specimen, it was due to combination of high bending
stress and interfacial shear stress.
5.2 Recommendations for Future Works
5.2.1 Development of new test method for high cyclic frequency loading. Eco-Core
material is developed to use sandwich structural applications. This core has a potential to be used
in marine, aerospace and transport industries as a fire and toxicity safe structural core. Generally,
life of these structures range from 30-50 years yielding on 107-10
9 load cycles. Determining the
endurance limit of these numbers of cycles will take months to years for each specimen.
Conventional hydraulic system may not be suitable for such tests. Therefore, a suitable test
method apparatus needs to be developed so that an experiment is completed in a reasonable time
period.
5.2.2 Development of fatigue life prediction model for variable amplitude loading.
The constant amplitude fatigue life model was developed for Eco-Core in compression, shear
and flexure stress states was based on constant amplitude loading. But for practical applications,
these models have to be extended and validated for variable amplitude loading.

98
5.2.3 Extend the study to tension-compression loading. Most structures also
experience tension-compression stress during their life cycles. Unfortunately, the test fixture to
apply tension-compression loading is difficult to design, fabricate and operate. Such a test fixture
needs to be developed and validated. Then it can be extended to tension-compression fatigue
loading.

99
References
1. Argade, S., Shivakumar, K., Sadler, R., Sharpe, M., Swaminathan, G., and Sorathia, U.
(2004). Mechanical fire resistance properties of a core Material. SAMPE 2004, May 16-20,
Long Beach, CA.
2. Landrock, A. (1995). Handbook of plastic foams: types, properties, manufacture, and
applications: William Andrew Publishing.
3. Lee, S. (1993). Handbook of composite reinforcements: VCH Publishers, Inc
4. d'Almeida, J. (1999). An analysis of the effect of the diameters of glass microspheres on the
mechanical behavior of glass-microsphere/epoxy-matrix composites. Composites science and
technology, Vol.59, pp. 2087-2091.
5. Gupta, N., Priya, S., Islam, R., Ricci, W. (2006). Characterization of mechanical and
electrical properties of epoxy-glass microballoon syntactic composites. Ferroelectrics,
Vol.345,pp. 1-12.
6. Gupta, N., Woldesenbet, E. and Mensah, P. (2004). Compression properties of syntactic
foams: effect of cenosphere radius ratio and specimen aspect ratio. Composites Part A:
Applied Science and Manufacturing, Vol. 35(1), pp. 103-111.
7. Gupta, N. and Woldesenbet, E. (2004). Microballoon wall thickness effects on properties of
syntactic foams. Journal of cellular plastics, Vol. 40,pp. 461-480.
8. Devi, K., John, B., Nair, C.P., Ninan, K.N. (2007). Syntactic foam composites of epoxy‐allyl
phenol‐bismaleimide ternary blend—Processing and properties. Journal of applied polymer
science, Vol.105, pp. 3715-3722.
9. Rizzi, E., Papa, E., and Corigliano, A. (2000). Mechanical behavior of a syntactic
foam:experiments and modeling. International Journal of Solids and Structures, Vol.37,

100
pp. 5773-5794.
10. Kim, H.S. and Oh, H.H (2000). Manufacturing and impact behavior of syntactic foam.
Journal of applied polymer science, Vol.76, pp. 1324-1328.
11. Shivakumar, K., Argade, S.D, Sadler R.L., Sharpe. M.M., Dunn, L, Swaminathan, G,,
Sorathia, U. (2006). Processing and Properties of a lightweight Fire Resistant Core Material
for Sandwich Structures. Journal of Advanced Materials, Vol. 38, pp. 32-38.
12. Shivakumar, K. and Chen, H. (2010). Structural Performance of Eco-Core Sandwich Panels.
Major Accomplishments in Composite Materials and Sandwich Structures, pp. 381-406.
13. Gupta, N., Karthikeyan, C. and Sankaran, S. (1999). Correlation of processing methodology
to the physical and mechanical properties of syntactic foams with and without fibers.
Materials characterization, Vol.43,pp. 271-277.
14. Karthikeyan, C., Sankaran, S. and Kumar, J. (2001). Processing and compressive strengths of
syntactic foams with and without fibrous reinforcements. Journal of applied polymer science,
Vol.81,pp. 405-411.
15. Panduranga, R., Shivakumar, K. and Russell, Jr L. (2007). Energy Absorption Performance
of Eco-Core–A Syntactic Foam, 48th
AIAA/ASME/ASCE/AHS/ASC Structures, Structural
Dynamics, and Materials Conference, April 23-26, Honolulu, HI.
16. Panduranga, R., Russell, Jr L., and Shivakumar, K. (2007). Fracture toughness enhancement
of flyash based Eco-Core by glass fiber reinforcement, 22nd
annual technical conference of
the American Society for Composites, September 17-19, Seattle, WA.
17. John, B., Nair, C. and Ninan, K. (2010). Effect of nanoclay on the mechanical, dynamic
mechanical and thermal properties of cyanate ester syntactic foams. Materials Science and
Engineering: A, Vol.527,pp. 5435-5443.

101
18. Nji, J. and Li, G. (2008). A CaO enhanced rubberized syntactic foam. Composites Part A:
Applied Science and Manufacturing, Vol.39,pp. 1404-1411.
19. Kireitseu, M., Hui, D. and Tomlinson, G. (2008). Advanced shock-resistant and vibration
damping of nanoparticle-reinforced composite material. Composites Part B: Engineering,
Vol.39, pp. 128-138.
20. Gui, M.C., Wang, D.B., Wu, J.J., Yuan, G.J. and Li, C.G. (2000). Deformation and damping
behaviors of foamed Al–Si–SiC composite. Materials Science and Engineering: A,
Vol.286,pp. 282-288.
21. Sauvant-Moynot, V., Gimenez, N. and Sautereau, H. (2006). Hydrolytic ageing of syntactic
foams for thermal insulation in deep water: degradation mechanisms and water uptake
model. Journal of materials science, Vol.41,pp. 4047-4054.
22. Shutov, F. (1983). Foamed polymers. Cellular structure and properties. Industrial
Developments, pp. 155-218.
23. Li, G. and John, M. (2008). A self-healing smart syntactic foam under multiple impacts.
Composites science and technology, Vol.68, pp. 3337-3343.
24. Boyd, J., Sitt, H., Ryang, H. and Blermann, T. (1990). Structures exhibiting improved
transmission of ultrahigh frequency electromagnetic radiation and structural materials which
allow their construction, Google Patents.
25. Shutov, F., Klempner, D. and Frisch, K. (1991). Handbook of Polymeric Foams and Foam
Technology. New York: Hanser Publishers, 1991. 381.
26. Sorathia, U. and Perez, I. (2004). Improving the fire safety of composite materials for naval
applications. SAMPE 2004, May 16-20, Long Beach, CA.
27. Shutov, F. (1986). Syntactic polymer foams.Chromatography/Foams/Copolymers, pp.

102
63-123.
28. Sadler, R.L., Sharpe, M., Panduranga, R., and Shivakumar, K. (2009). Water immersion
effect on swelling and compression properties of Eco-Core, PVC foam and balsa wood.
Composite Structures, Vol. 90, pp. 330-336.
29. Paepegem, W., Degrieck, J.(2002). Effects of load sequence and block loading on the fatigue
response of fiber-reinforced composites. Mechanics of Advanced material Structure, Vol.9,
pp.19-35.
30. Harris, B., Gathercole, N., Reiter, H. and Adam, T. (1997). Fatigue of Carbon-fibre-
reinforced plastics under block-loading conditions. Composite Part A, Vol.28, pp. 327-337.
31. Gamstedt, E.K. and Sjogren, B.A. (2002). An experimental Investigation of the Sequence
Effect in Block Amplitude Loading of Cross-ply Composite Laminates, Int Journal of
Fatigue, Vol. 24, pp. 437-446.
32. Philippidis, T., Vassilopoulos, A. (2004). Life prediction methodology for GFRP laminates
under spectrum loading. Composite Part A- Applied Science, Vol. 35, pp. 657-666.
33. Philippidis, T., Vassilopoulos, A. (1999). Fatigue strength prediction under multiaxial stress,
Journal of Composite material, Vol. 33, pp. 1578-1599.
34. Philippidis, T., Vassilopoulos, A. (2002). Complex stress state effect on fatigue life of GRP
laminates. Part 11: Theoretical formulation, International Journal of Fatigue, Vol. 24, pp.
825-830.
35. Philippidis, T., Vassilopoulos, A. (2004). Fatigue of glass fibre reinforced plastics under
complex stress states, In the Handbook of Advanced Materials: Enabling New Designs, J
Wessel, ed., Wiley- Inter science.
36. Clark, S.D., Shenoi, R.A. and Allen, H.G. (1999). Modeling the fatigue behavior of

103
sandwich beams under monotonic, 2-step and block loading regimes, Composite Science and
Technology, Vol. 59, pp. 471-486.
37. Brunner, A.J., Murphy, N., Pinter, G. (2009). Development of a standardized procedure for
the characterization of interlaminar delamination propagation in advanced composites under
fatigue mode 1 loading conditions. Engineering Fracture Mechanics, Vol. 76, pp. 2678-2689.
38. Kadi, H., Ellyin, F. (1994). Effect of stress ratio on the fatigue failure of fiberglass reinforced
epoxy laminae. Composites, Vol. 25, pp. 917-924.
39. Saff, C. (1983). Effect of load frequency and lay-up on fatigue life of composites, in Long-
Term Behavior of Composites, ASTM STP 813, TK O’Brien, ed., pp.78-91.
40. Sun, C.T., Chan, W.S. (1979). Frequency effect on the fatigue life of laminated composite, in
Composite Materials: Testing and Design (fifth conference), ASTM STP 674, SW Tsai, ed.,
pp. 418-430.
41. Rotem, A.(1993). Load frequency effect on the fatigue strength of isotropic laminates.
Composite Science Technology, Vol. 46, pp. 129-138.
42. Burman, M. and Zenkert, D. (1997). Fatigue of Foam Core Sandwich Beams-1: Undamaged
Specimens, International Journal of Fatigue, Vol. 19(7), pp. 551-561.
43. Shenoi, R.A., Clark, S.D. and Allen, H.G. (1995). Fatigue behavior of polymer composite
sandwich beams, Journal of Composite Materials, Vol. 29, pp. 2423-2446.
44. Sharma, S.C., Murthy, H.N.N. and Krishna, M. (2004). Interfacial studies in fatigue behavior
of polyurethane sandwich structures, Journal of reinforced plastics and composites, Vol. 23,
pp. 893-903.
45. Annual Book of the ASTM Standards, American Society for Testing and Materials, ASTM
Intenational, West Conshohocken, PA.

104
46. ISO 844 (2004). Rigid cellular plastics-Determination of Compression Properties.
47. Sims G.D. Fatigue test methods, problems, and standards, In Fatigue in Composites, B Harris
, ed., Woodhead Publishing, pp. 36-62.
48. Kanny, K. and Mahfuz, H. (2005). Flexural fatigue characteristics of sandwich structures at
different loading frequencies. Composite Structures, Vol.67, pp. 403-410.
49. Burman, M. and Zenkert, D. (1997). Fatigue of foam core sandwich beams-1: Undamaged
specimens. International Journal of Fatigue, Vol.19, pp.551-561.
50. Burman, M. and Zenkert, D. (1997). Fatigue of foam core sandwich beams-2: Effect of initial
damage. International Journal of Fatigue, Vol. 19(7), pp. 563-578.
51. Zenkert, D. and Murman, M. (2009). Tension, compression and shear fatigue of a closed cell
polymer foam. Composite Science and Technology, Vol. 69, pp. 785-792.
52. Zenkert, D. and Burman, M. (2011). Failure mode shifts during constant amplitude fatigue
loading of GFRP/foam core sandwich beams. International Journal of Fatigue, Vol.33, pp.
217-222.
53. Sendeckyj, G. P. (19991). Life prediction for resin-matrix composite materials. Composite
Materials Series, Vol. 4, pp. 431-483.
54. Dai, J. and Hahn, H.T. (2004). Fatigue analysis of sandwich beams using a wear-out model.
Journal of Composite Materials, Vol.38, pp. 581-589.
55. Wu, W.F., Lee, L.J. and Choy, S.T. (1996). A study of fatigue damage and fatigue life of
composite laminates, Journal of Composite Materials, Vol. 30, pp. 123-137.
56. Philippidis, T. and Vassilopoulos, A. (1999). Fatigue of composite laminates under off-axis
loading, International Journal of Fatigue, Vol. 21, pp. 253-262.
57. Whitworth, H.A. (1998). A stiffness degradation for composite laminates under fatigue

105
loading, Composite Structures, Vol. 40, pp. 95-101.
58. Judawisastra, H., Ivens, J. Verpoest, I. Fatigue of 3D sandwich fabric composites under core
shear loading, ICCM 12.
59. Mahi, A., Farook, K., Sahraoui, S. and Bezazi, A. (1992). Modeling the flexural behavior of
sandwich composite materials under cyclic fatigue, Materials & design, Vol. 25, pp. 199-208.
60. Degrieck, J. and Paepegem, W. (2001). Fatigue damage modeling of fiber-reinforced
composite Material: review, Applied Mechanics Review, Vol. 54, pp. 279-299.
61. Epaarachchi, J. and Clausen, P. (2005). A new cumulative fatigue damage model for fiber
reinforced plastic composites under step/discrete loading, Composites: Part A, Vol. 36, pp.
1236-1245.
62. Zenkert, D. and Burman, M. (2010). Fatigue of a closed-cell foams in compression, Journal
of Sandwich Structures and Materials, Vol. 13, pp. 467-478.
63. Harte, A.M., Fleck, N.A. and Ashby, M.F. (1999). Fatigue Failure of An Open Cell and A
Closed Cell Aluminium alloy Foam. Acta mater Vol. 47, pp. 2511-2524.
64. Zhou, J., Soboyejo, W.O. (2004). Compression-Compression fatigue of open cell aluminum
foams: macro-/micro-mechanisms and the effects of heat treatment. Mater Sci and Eng A
Vol. 369, pp. 23-35.
65. Sugimura, Y., Rabiei, A., Evans, A.G., Harte, A.M. and Fleck, N.A. (1999). Compression
Fatigue of a Cellular Al Alloy. Mater Sci and Eng Vol. 269, pp.38-48.
66. Hakamada, M., Kuromura, T., Chino, Y., Yamada, Y.,Chen, Y., Kusuda, H., Mabuchi, M.
(2007). Monotonic and cyclic compressive properties of porous aluminum fabricated by
spacer method. Materials Science and Engineering A Vol. 459, pp. 286-293.
67. Kolluri, M., Mukherjee, M., Garcia-Moreno, F., Banhart, J., Ramamurty, U. (2008).

106
Fatigue of laterally constrained closed cell aluminum foam. Acta Materialia. Vol. 56, pp.
1114-1125.
68. Amsterdam, E., Hosson, J.T.M.D., Onck, P.R. (2006). Failure Mechanisms of closed-cell
aluminum foam under monotonic and cyclic loading. Acta Materialia. Vol. 54, pp. 4465-
4472.
69. Thomson, R., Khan, M., Mouritz, A. (1998). Shear properties of sandwich composite
containing defects, Composite Structures, Vol. 42, pp. 107-118.
70. Harte, A., Fleck, N., Ashby, M. (2001). The fatigue strength of sandwich beams with an
aluminum alloy foam core, International Journal of Fatigue, Vol. 23, pp. 499-507.
71. Dai, J., Hahn, H. (2003). Flexural behavior of sandwich beams fabricated by vacuum-assisted
resin transfer molding, Composite Structures Vol. 61, pp.247-253.
72. Kulkarni, N., Mahfuz, H., Jeelani, S., Carlsson, LA. (2003). Fatigue crack growth and life
prediction of foam core sandwich composites under flexural loading. Comp Struct Vol. 59,
pp. 499-505.
73. Kanny, K., Mahfuz, H.,Carlsson, L., Thomas, T. and Jeelani, S. (2002). Dynamic mechanical
analysis and flexural fatigue of PVC foams. Composite Structures Vol. 58, pp. 175-183.
74. Kanny, K., Mahfuz, H., Thomas, T. and Jeelani, S. (2004). Temperature effects on the
fatigue behavior of foam core sandwich structures, Polymers and Polymer Composites,
Vol.12, pp. 551-559.
75. Shenoi, R. A., Clark, S.D. and Allen, H.G. (1995). Fatigue behavior of polymer composite
sandwich beams, Journal of Composite Materials Vol. 29, pp. 2423-2445.
76. Freeman, B., Schwingler, E., Mahinfalah, M., Kellogg, K. (2005). The effect of low-velocity
impact on the fatigue life of sandwich composite, Composite Structures Vol.70, pp. 374-381.

107
77. Ferreira J.A.M., Salviano K., Costa J.D. and Capela, C. (2010). Fatigue behavior in hybrid
hollow microspheres/fibre reinforced composites. J Mater Sci Vol. 45, pp. 3547-3553.
78. Panduranga, R. (2010). High strain response of Eco-Core and its modification, PH.D.
Dissertation, Mechanical Engineering Department, North Carolina A&T State University,
Greensboro, NC.
79. Hossain, M.M., and Shivakumar, K. (2011). Compression Fatigue Performance of a Fire
Resistant Syntactic Foam, Comp. Struct. Vol. 94, pp. 290-298.
80. Smith, S., Shivakumar, K. (2000). Evaluation of Interfacial Fracture Toughness of VARTM
Sandwich Panels using the Mode-1 cracked Beam Specimen, AIAA-2000-1493.
81. Sadler, R., Shivakumar, K., Sharpe, M. (2002). Interlaminar fracture properties of split angle-
ply composites, Proceedings of the SAMPE Technical Conference and Exhibition, Long-
Beach, CA.
82. Hossain, M.M., and Shivakumar, K. (2012). Shear fatigue characterization of fire resistant
syntactic foam core composite sandwich panel, Proceeding of SAMPE TECH 2012, October
22-25, Charleston, SC.
83. Shivakumar, k.,Swaminathan, G. and Sharpe, M. (2006). Carbon/Vinyl Ester composites for
enhanced performance in marine applications, J Reinforced Plastics and Composites Vol.25,
pp.1101-1116.

108
Appendix A
Finite Element Analysis of Four-point Bend Shear and Flexure Test Specimen
During shear fatigue test, sometimes multiple shear cracks with interfacial delamination
near load/support points were observed as shown in Figure A.1. In flexural fatigue test, near the
final failure stage, a shear crack followed by delamination was observed under one of the load
points as shown in Figure A.2. To understand the stress states in the core and face sheet interface
regions of the sandwich beams, a detailed nonlinear 2-D finite element analysis (FEM) was
conducted. A summary of the results is presented below.
Figure A.1. Successive failure of the specimen (SSP-10) for τmax/τc = 0.80 at shear fatigue test.
Figure A.2. Final failure of the specimen (SSP-10) for σmax/σct = 0.80 at flexure fatigue test.
A.1 Finite Element Model
The shear and flexural test specimen shown in Figure A.3 was analyzed by ANSYS finite
element code. Figure A.4 shows the symmetric one-half of the FEA model for both shear (Figure
A.4a) and flexure (Figure 4.b) sandwich specimens with the origin at the left support. The figure

109
also shows the boundary condition and the loading applied at S/4 point on the face sheet for
shear test specimen and at S/3 for flexure test specimen. The loading and support were modeled
by steel elements to simulate realistic load transfer mechanism. Both specimens were idealized
by 4-noded Plane-42 elements. Line contact elements were used between the support cylindrical
roads and the specimen. The shear model had 6,636 elements and flexure model had 12,622
elements. Material properties of Eco-Core and face sheet were taken from the literature [11, 12,
83] and listed in Table A.1.
(a) Shear test specimen.
(b) Flexure test specmen.
Figure A.3. Schematic of test specimen, loading and nomenclature.
A.2 Finite Element Analysis
A Geometric nonlinear contact analysis was conducted using ANSYS finite element code
for an applied load P = failure on-set load in the static test. Although the contact region varied
with load, the deformation and stress distribution in the region of interest remained linear with
load. Transverse shear and bending stresses were examined at Section A, B and C for shear test
specimen (Figure A.3a) and at section A, B, C and D for flexure test (Figure A.3b). The section
d = tc + tf
S
S/2
tf
tf
tc
P
Thickness, b ≈ 2d
Face sheet, σf, Ef
Core, σc, Ec, τc, Gc
Edge distance, e ≈ tc
e e
Sec-B Sec-CSec-A
Fig.1.
P
Width, b = 2d
Edge distance, e ≈ tcd= tc+tf
tc
tf
tf e eS = 10d
S/3
dDAB C

110
B and C are about tf distance from the support and load points, section A at half-way between
support and load points and section D is in symmetric region. All stresses were normalized by
beam theory solutions for comparison.
Table A.1
Material Properties of Eco-Core and Face sheet [12].
(a) Eco-Core sandwich beam for shear test.
(b) Eco-Core sandwich beam for flexure test.
Figure A.4. Finite element models Eco-Core sandwich beam.
Tensile Shear Ex Ey Ez Gxy Gyz Gzx νxy νyz νzx
Eco-Core 0.50 6.46 4.61 2.54 - - 77.10 - - 0.17 - -
face sheet - 512.50 77.10 29.20 23.90 23* 4.50 4.30 4.0* 0.16 0.14 0.15*
* Assumed
Material properties
Young modulous, GPa Poisson's ratioStrength, MPaDensity,
g/ccMaterials
X
Z
P/2
Contact elements
Contact elements
Support
P/2Z
X
Contact element
Contact elementSupport

111
A.3 Results
A.3.1. Shear test specimen. Figure A.5 shows the shear stress distribution through the
thickness of the core material (no face sheet) at three locations between the support and load
point (see in sketched picture). The location B and C are about tf distance from the support and
load points, respectively. The shear stress distribution at B and C are reflection of each other
about the mid-plane. The maximum shear stress is about 2.6τav at the core-face sheet interface.
The shear stress at A at half-way between support and load points is symmetric about the mid-
plane and nearly flat curve as expected in sandwich beams (depending on the relative modulus of
face sheet and core). The maximum shear stress is about 1.1τav. These results conclude that if the
shear failure occurs at mid-way between the support and load points, it is due to maximum shear
at the mid-plane of the beam. If the failure occurs near the support or load point, it may be
because of shear concentration at the interface. Because the interface is resin densified and the
interfacial strength could be much higher than the core shear strength.
Figure A.5. Shear stress distribution at section A, B, and C.
τ/τav
Z/(tf+tc+tf)
X
P
S
d= tc+tf
S/2
tc
tf
tf
Z
AB C
At section-A, X = S/8
At section-B, X ≈ tf
At section-C, X ≈ (S/4-tf )
181
dt f
S/d = 3 ;
(a)
tc
τav=P
2bd
Z/(
t f+
t c+
t f)
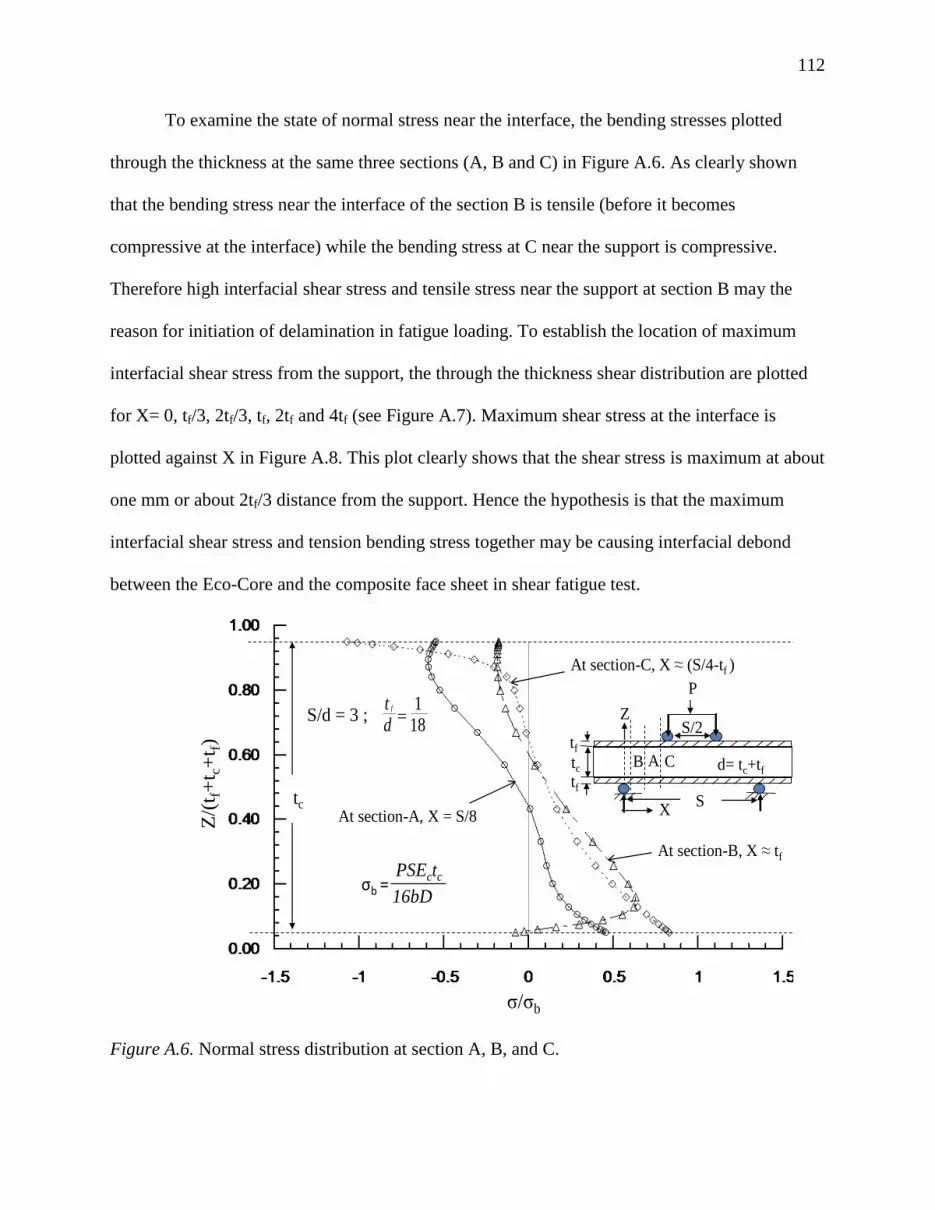
112
To examine the state of normal stress near the interface, the bending stresses plotted
through the thickness at the same three sections (A, B and C) in Figure A.6. As clearly shown
that the bending stress near the interface of the section B is tensile (before it becomes
compressive at the interface) while the bending stress at C near the support is compressive.
Therefore high interfacial shear stress and tensile stress near the support at section B may the
reason for initiation of delamination in fatigue loading. To establish the location of maximum
interfacial shear stress from the support, the through the thickness shear distribution are plotted
for X= 0, tf/3, 2tf/3, tf, 2tf and 4tf (see Figure A.7). Maximum shear stress at the interface is
plotted against X in Figure A.8. This plot clearly shows that the shear stress is maximum at about
one mm or about 2tf/3 distance from the support. Hence the hypothesis is that the maximum
interfacial shear stress and tension bending stress together may be causing interfacial debond
between the Eco-Core and the composite face sheet in shear fatigue test.
Figure A.6. Normal stress distribution at section A, B, and C.
P
S
d= tc+tf
S/2
tc
tf
tf
X
Z
AB C
At section-B, X ≈ tf
At section-C, X ≈ (S/4-tf )
At section-A, X = S/8
σ/σb
181
dt f
S/d = 3 ;
σb = PSEctc
16bD
(b)
tc
Z/(
t f+
t c+
t f)
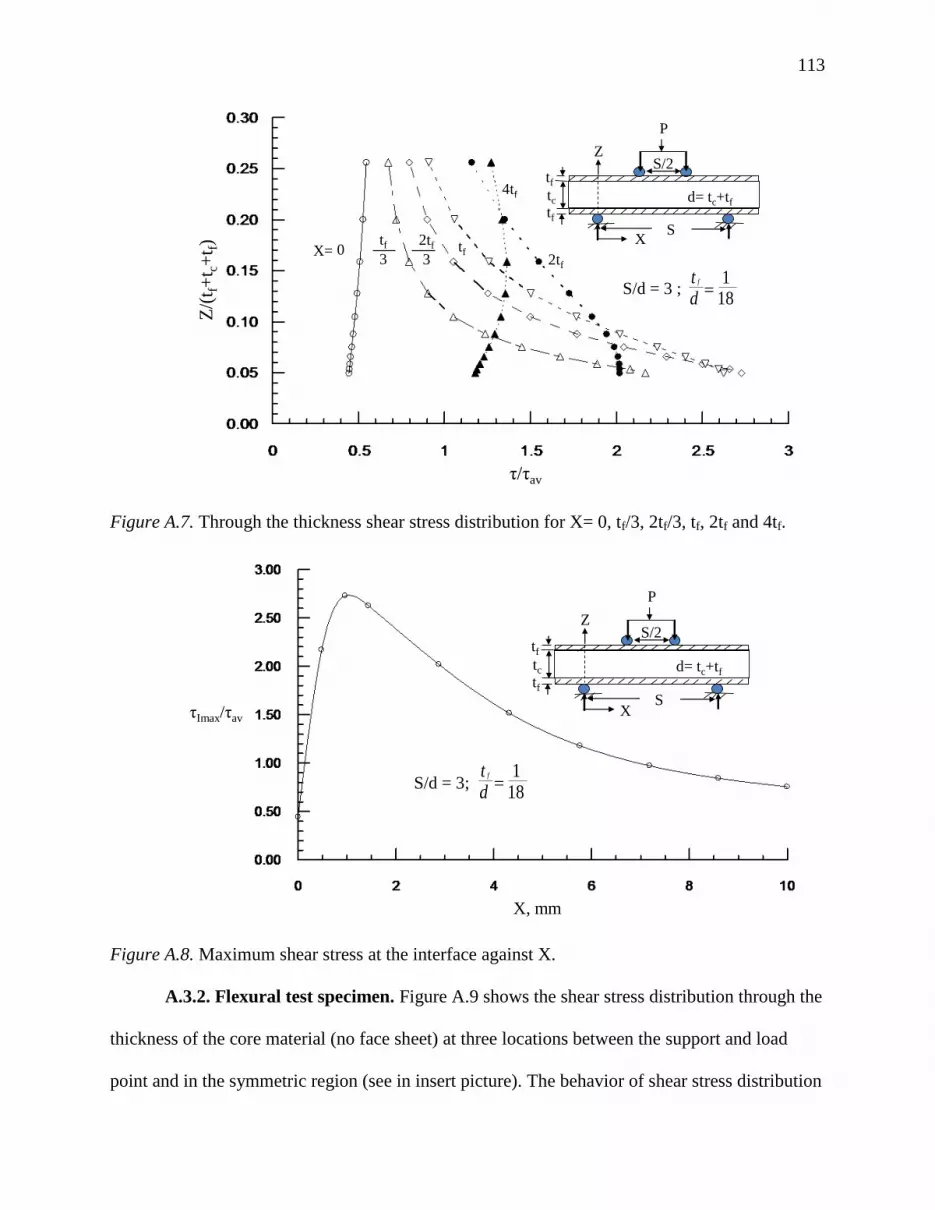
113
Figure A.7. Through the thickness shear stress distribution for X= 0, tf/3, 2tf/3, tf, 2tf and 4tf.
Figure A.8. Maximum shear stress at the interface against X.
A.3.2. Flexural test specimen. Figure A.9 shows the shear stress distribution through the
thickness of the core material (no face sheet) at three locations between the support and load
point and in the symmetric region (see in insert picture). The behavior of shear stress distribution
181
dt f
S/d = 3 ;
τ/τav
X= tf2tf
4tf
X
P
S
d= tc+tf
S/2
tc
tf
tf
Z
0tf
3
2tf
3
(c)
Z/(
t f+
t c+
t f)
τImax/τav
X, mm
P
S
d= tc+tf
S/2
tc
tf
tf
Z
X
181
dt f
S/d = 3;

114
at three locations between support and load points is similar to that for shear test specimen. Here,
the maximum shear stress is also about 2.6τav at the core-face sheet interface. If the failure occurs
near the support or load point, it may be because of shear concentration at the interface. Because
the interface is resin densified, the interfacial strength could be much higher than the core shear
strength. The shear stress at D, because symmetric region, is zero. So, if there is any failure
between two loading points, it will because of bending stress.
To examine the state of normal stress near the interface, the bending stresses plotted
through the thickness at the same four sections (A, B, C and D) in Figure A.10. As clearly shown
that the bending stress near the interface of the section B is tensile (before it becomes
compressive at the interface) while the bending stress at C is tensile at tension side and it is
almost same as at section D. Hence the hypothesis is that combination of shear stress and high
tensile stress near the load point at section c may the reason for initiation of tension crack
followed by shear crack under one of the load points in fatigue loading.
Figure A. 9.Shear stress distribution at section A, B, and C.
P/2
S/2
tc
tf
tf
X
Z
AB CS
ym
met
ric
D
181
dt f
S/d = 10 ;
τ/τav
At section-C, X ≈ (S/3-tf )
At section-A, X = S/6
At section-B, X ≈ tf
At D, X =S/2
τav=P
2bd
tc
Z/(
t f+
t c+
t f)

115
Figure A 10. Normal stress distribution at section A, B, and C.
At section-B, X ≈ tf
At section-C, X ≈ (S/3-tf ) At section-A, X = S/6
At section-D, X = S/2
σ/σb
181
dt fS/d = 10 ;
P/2
S/2
tc
tf
tf
X
Z
AB C
Sym
met
ric
D
σb = PSEctc
12bD
tc
Z/(
t f+
t c+
t f)

116
Appendix B
Additional Figures of Chapter 2
Selection process of specimens for static and fatigue test from panel 2, static compression
stress-strain response of the specimen (panel 2), compliance versus number of cycles(N) curves
of the fatigue tested specimens for σmax/σc = 0.90, 0.80, 0.75, 0.70 and 0.60 for R=10, and σmax/σc
= 0.95, 0.90, 0.85 and 0.80 for R=5 are given below.
B.1 Specimen Selection Process from Panel 2
(a) Specimens numbered according to specimen number in specimen layout
(b) Specimen numbered according to ascending order of specimen density.
Figure B 1. Specimen selection process from panel 2.
0.4
0.45
0.5
0.55
0.6
0 10 20 30 40 50 60 70
Mean Value 0.524, SD 0.014, %CV 2.692
Den
sity
, g/c
c
Specimen no
18
1624
33
41
48
5764
Panel-2a
According to specimen no in Panel 2
0.4
0.44
0.48
0.52
0.56
0.6
0 10 20 30 40 50 60 70
40 specimen within 0.519-0.54 density range ( ascending order)
Den
sity
, g/c
c
Specimen no
Panel 2a
According to ascending order of specimen density in panel-2

117
B.2 Static Compression Stress-Strain Response of the Specimen (Panel 2)
Figure B 2. Static Compression stress-strain response of the specimen (Panel 2).
B.3 Compliance Versus Number of Cycles Curves of the Specimens for σmax/σc = 0.90,
R=10.
Str
ess,
MP
a
Strain
M-47
M-13 M-26
M-38
M-43
Cycles, N
Co
mp
lian
ce,
mm
/N
R= 10
Specimen M-61
(a) Compliance Versus number of cycles curve for specimen M-61
σmin/σc =0.90

118
Cycles, N
Co
mp
lian
ce,
mm
/NR= 10
Specimen M-24
(b) Compliance Versus number of cycles curve for specimen M-24
σmin/σc =0.90
Cycles, N
Co
mp
liance,
mm
/N
R= 10
Specimen M-56
(c) Compliance Versus number of cycles curve for specimen M-61
σmin/σc =0.90

119
Figure B 3. Compliance versus number of cycles ( M-61, M-24, M-56 and M-14) for σmin/σc =
0.90, R=10.
B.4 Compliance Versus Number of Cycles Curves of the Specimens for σmax/σc = 0.85,
R=10.
Cycles, N
Co
mp
lian
ce,
mm
/NR= 10
Specimen M-14
(d) Compliance Versus number of cycles curve for specimen M-14
σmin/σc =0.90
Cycles, N
Co
mp
lian
ce,
mm
/N
R= 10
Specimen M-10
(a) Compliance Versus number of cycles curve for specimen M-10
σmin/σc =0.85

120
Figure B 4. Compliance versus number of cycles (M-10, M-15) for σmin/σc = 0.85, R=10.
B.5 Compliance Versus Number of Cycles Curves of the Specimens for σmax/σc = 0.80,
R=10.
Cycles, N
Co
mp
lian
ce,
mm
/N
R= 10
Specimen M-15
(b) Compliance Versus number of cycles curve for specimen M-15
σmin/σc =0.85
Cycles, N
Co
mp
lian
ce,
mm
/N
R= 10
Specimen M-12
(a) Compliance Versus number of cycles curve for specimen M-12
σmin/σc =0.80
3.40 10-6
3.50 10-6
3.60 10-6
3.70 10-6
3.80 10-6
3.90 10-6
4.00 10-6
0 5 104
1 105
1.5 105
2 105
2.5 105
3 105

121
Figure B 5. Compliance versus number of cycles (M-12, M-52, M-13) for σmin/σc = 0.80, R=10.
Cycles, N
Co
mp
lian
ce,
mm
/NR= 10
Specimen M-52
(b) Compliance Versus number of cycles curve for specimen M-52
σmin/σc =0.80
Cycles, N
Co
mp
lian
ce,
mm
/N
R= 10
Specimen M-13
(c) Compliance Versus number of cycles curve for specimen M-13
σmin/σc =0.80
3.40 10-6
3.50 10-6
3.60 10-6
3.70 10-6
3.80 10-6
3.90 10-6
4.00 10-6
0 2 104
4 104
6 104
8 104
1 105
1.2 105

122
B.6 Compliance Versus Number of Cycles Curves of the Specimens for σmax/σc = 0.75,
R=10.
Cycles, N
Co
mp
lian
ce,
mm
/N
R= 10
Specimen M-16
(a) Compliance Versus number of cycles curve for specimen M-16
σmin/σc =0.75
3.40 10-6
3.50 10-6
3.60 10-6
3.70 10-6
3.80 10-6
3.90 10-6
4.00 10-6
0 2 105
4 105
6 105
8 105
1 106
Cycles, N
Co
mp
lian
ce,
mm
/N
R= 10
Specimen M-62
(b) Compliance Versus number of cycles curve for specimen M-62
σmin/σc =0.75
3.4 10-6
3.45 10-6
3.5 10-6
3.55 10-6
3.6 10-6
3.65 10-6
3.7 10-6
3.75 10-6
3.8 10-6
0 1 105
2 105
3 105
4 105
5 105
6 105
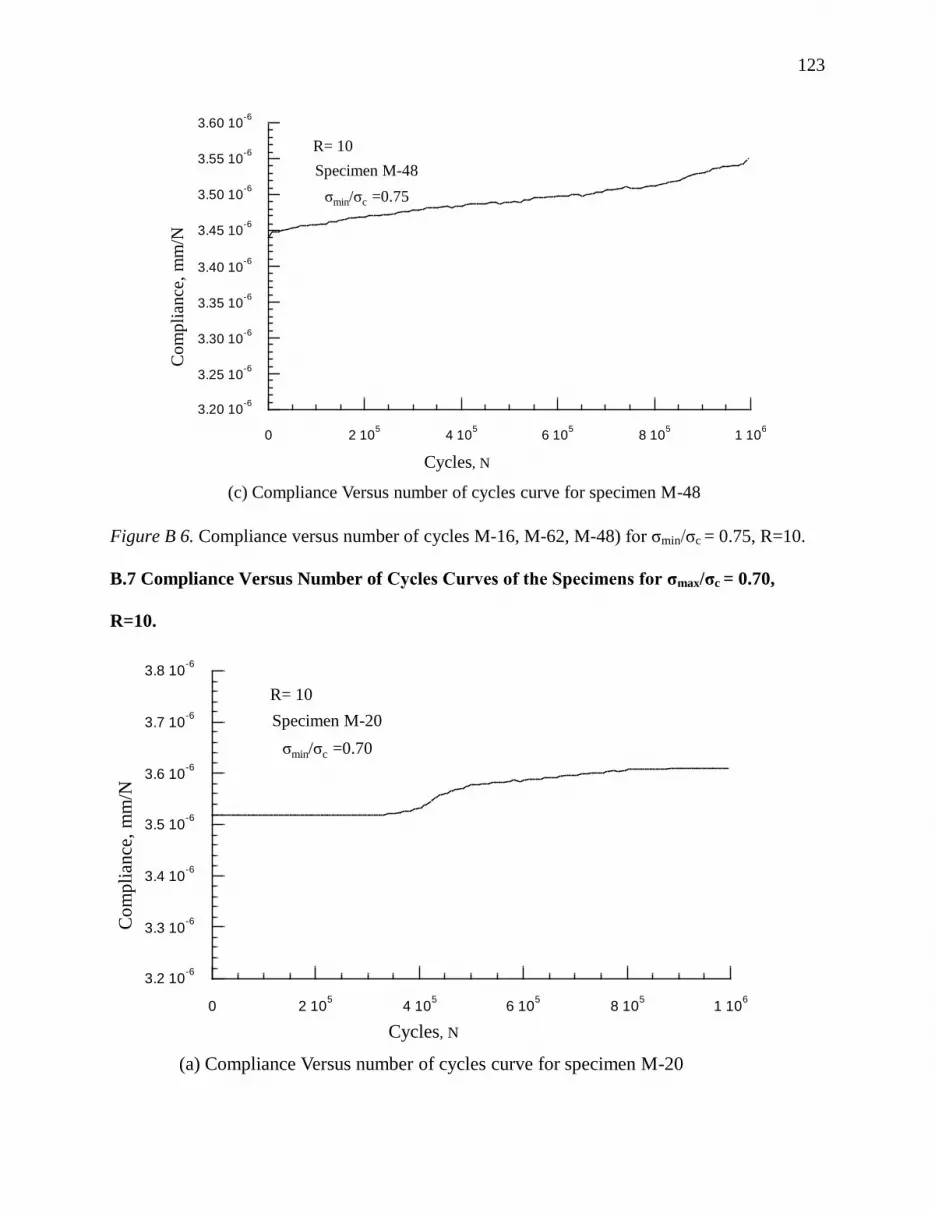
123
Figure B 6. Compliance versus number of cycles M-16, M-62, M-48) for σmin/σc = 0.75, R=10.
B.7 Compliance Versus Number of Cycles Curves of the Specimens for σmax/σc = 0.70,
R=10.
3.20 10-6
3.25 10-6
3.30 10-6
3.35 10-6
3.40 10-6
3.45 10-6
3.50 10-6
3.55 10-6
3.60 10-6
0 2 105
4 105
6 105
8 105
1 106
Cycles, N
Co
mp
lian
ce,
mm
/N
R= 10
Specimen M-48
(c) Compliance Versus number of cycles curve for specimen M-48
σmin/σc =0.75
Cycles, N
Co
mp
lian
ce,
mm
/N
R= 10
Specimen M-20
(a) Compliance Versus number of cycles curve for specimen M-20
σmin/σc =0.70
3.2 10-6
3.3 10-6
3.4 10-6
3.5 10-6
3.6 10-6
3.7 10-6
3.8 10-6
0 2 105
4 105
6 105
8 105
1 106

124
Figure B 7. Compliance versus number of cycles (M-20, M-50, M-34) for σmin/σc = 0.70, R=10.
Cycles, N
Co
mp
lian
ce,
mm
/NR= 10
Specimen M-50
(b) Compliance Versus number of cycles curve for specimen M-50
σmin/σc =0.70
3.2 10-6
3.3 10-6
3.4 10-6
3.5 10-6
3.6 10-6
3.7 10-6
3.8 10-6
0 2 105
4 105
6 105
8 105
1 106
Cycles, N
Co
mp
lian
ce,
mm
/N
R= 10
Specimen M-34
(c) Compliance Versus number of cycles curve for specimen M-34
σmin/σc =0.70
3.40 10-6
3.45 10-6
3.50 10-6
3.55 10-6
3.60 10-6
3.65 10-6
3.70 10-6
3.75 10-6
3.80 10-6
0 2 105
4 105
6 105
8 105
1 106

125
B.8 Compliance Versus Number of Cycles Curves of the Specimens for σmax/σc = 0.60,
R=10.
Figure B 8. Compliance versus number of cycles (M-25) for σmin/σc = 0.60, R=10.
B.9 Compliance Versus Number of Cycles Curves of the Specimens for σmax/σc = 0.95, R=5.
3.4 10-6
3.45 10-6
3.5 10-6
3.55 10-6
3.6 10-6
3.65 10-6
3.7 10-6
3.75 10-6
3.8 10-6
0 2 105
4 105
6 105
8 105
1 106
Com
pli
ance
, m
m/N
Cycles, N
R= 10
σmin/σc =0.60
Specimen M-25
Cycles, N
Co
mp
lian
ce,
mm
/N
R= 5
Specimen M-30
(a) Compliance Versus number of cycles curve for specimen M-30
σmin/σc =0.95
3.70 10-6
3.75 10-6
3.80 10-6
3.85 10-6
3.90 10-6
3.95 10-6
4.00 10-6
0 500 1000 1500 2000 2500

126
Figure B 9. Compliance versus number of cycles (M-30, M-46, M-55) for σmin/σc = 0.95, R=5.
Cycles, N
Co
mp
lian
ce,
mm
/N
R= 5
Specimen M-46
(b) Compliance Versus number of cycles curve for specimen M-46
σmin/σc =0.95
3.60 10-6
3.80 10-6
4.00 10-6
4.20 10-6
4.40 10-6
0 500 1000 1500 2000 2500
Cycles, N
Co
mp
lian
ce,
mm
/N
R= 5
Specimen M-55
(c) Compliance Versus number of cycles curve for specimen M-55
σmin/σc =0.95
3.50 10-6
3.75 10-6
4.00 10-6
4.25 10-6
4.50 10-6
0 2000 4000 6000 8000 1 104
1.2 104

127
B.10 Compliance Versus Number of Cycles Curves of the Specimens for σmax/σc = 0.90,
R=5.
Cycles, N
Co
mp
lian
ce,
mm
/N
R= 5
Specimen M-19
(a) Compliance Versus number of cycles curve for specimen M-19
σmin/σc =0.90
2.5 10-6
2.7 10-6
2.9 10-6
3.1 10-6
3.3 10-6
3.5 10-6
0 1000 2000 3000 4000 5000
Cycles, N
Co
mp
lian
ce,
mm
/N
R= 5
Specimen M-31
(b) Compliance Versus number of cycles curve for specimen M-31
σmin/σc =0.90
2.70 10-6
2.80 10-6
2.90 10-6
3.00 10-6
3.10 10-6
3.20 10-6
3.30 10-6
3.40 10-6
3.50 10-6
0 500 1000 1500 2000 2500 3000

128
Figure B 10. Compliance versus number of cycles (M-19, M-31, M-39) for σmin/σc = 0.90, R=5.
B.11 Compliance Versus Number of Cycles Curves of the Specimens for σmax/σc = 0.85,
R=5.
Cycles, N
Co
mp
lian
ce,
mm
/NR= 5
Specimen M-39
(c) Compliance Versus number of cycles curve for specimen M-39
σmin/σc =0.90
2.40 10-6
2.60 10-6
2.80 10-6
3.00 10-6
3.20 10-6
3.40 10-6
0 2000 4000 6000 8000 1 104
Cycles, N
Co
mp
lian
ce,
mm
/N
R= 5
Specimen M-44
(a) Compliance Versus number of cycles curve for specimen M-44
σmin/σc =0.85
3.50 10-6
3.60 10-6
3.70 10-6
3.80 10-6
3.90 10-6
4.00 10-6
0 2 105
4 105
6 105
8 105
1 106

129
Figure B 11. Compliance versus number of cycles (M-44, M-52, M-51) for σmin/σc = 0.85, R=5.
2.80 10-6
2.90 10-6
3.00 10-6
3.10 10-6
3.20 10-6
3.30 10-6
0 2 104
4 104
6 104
8 104
1 105
1.2 105
Cycles, N
Co
mp
lian
ce,
mm
/N
R= 5
Specimen M-52
(b) Compliance Versus number of cycles curve for specimen M-52
σmin/σc =0.85
Cycles, N
Co
mp
lian
ce,
mm
/N
R= 5
Specimen M-51
(c) Compliance Versus number of cycles curve for specimen M-51
σmin/σc =0.85
2.80 10-6
2.90 10-6
3.00 10-6
3.10 10-6
3.20 10-6
3.30 10-6
3.40 10-6
0 5000 1 104
1.5 104
2 104
2.5 104
3 104
3.5 104

130
B.12 Compliance Versus Number of Cycles Curves of the Specimens for σmax/σc = 0.80,
R=5.
Cycles, N
Co
mp
lian
ce,
mm
/N
R= 5
Specimen M-11
(a) Compliance Versus number of cycles curve for specimen M-11
σmin/σc =0.80
2.60 10-6
2.80 10-6
3.00 10-6
3.20 10-6
3.40 10-6
0 2 105
4 105
6 105
8 105
1 106
Cycles, N
Co
mp
lian
ce,
mm
/N
R= 5
Specimen M-27
(b) Compliance Versus number of cycles curve for specimen M-27
σmin/σc =0.80
2.40 10-6
2.60 10-6
2.80 10-6
3.00 10-6
3.20 10-6
3.40 10-6
0 2 105
4 105
6 105
8 105
1 106

131
Figure B 12. Compliance versus number of cycles (M-11, M-27, M-45) for σmin/σc = 0.80, R=5.
B.13 Normalized stress versus N for 5% and 7% compliance change for R=10 and 5
(a) For 5% compliance change failure
Cycles, N
Co
mp
lian
ce,
mm
/NR= 5
Specimen M-45
(c) Compliance Versus number of cycles curve for specimen M-45
σmin/σc =0.80
2.70 10-6
2.80 10-6
2.90 10-6
3.00 10-6
3.10 10-6
3.20 10-6
0 2 105
4 105
6 105
8 105
1 106
R = 10
R = 5
Progression failure (5% compliance)
σmin
σc
Cycles, N

132
(b) For 7% compliance change failure.
Figure B 13. Normalized stress versus N for 5% and 7% compliance change for R=10 and 5.
B.14 Normalized Stress Range Versus N for 5% and 7% Compliance Change for R=10 and
5.
(a) For 5% compliance change failure
σmin
σc
Cycles, N
Final failure (7% compliance)
R = 10
R = 5
Cycles, N
Compliance Change: 5%
R = 10
R = 5
σc
ΔσΔσ
σc
=σmin (1-R)/Rσc
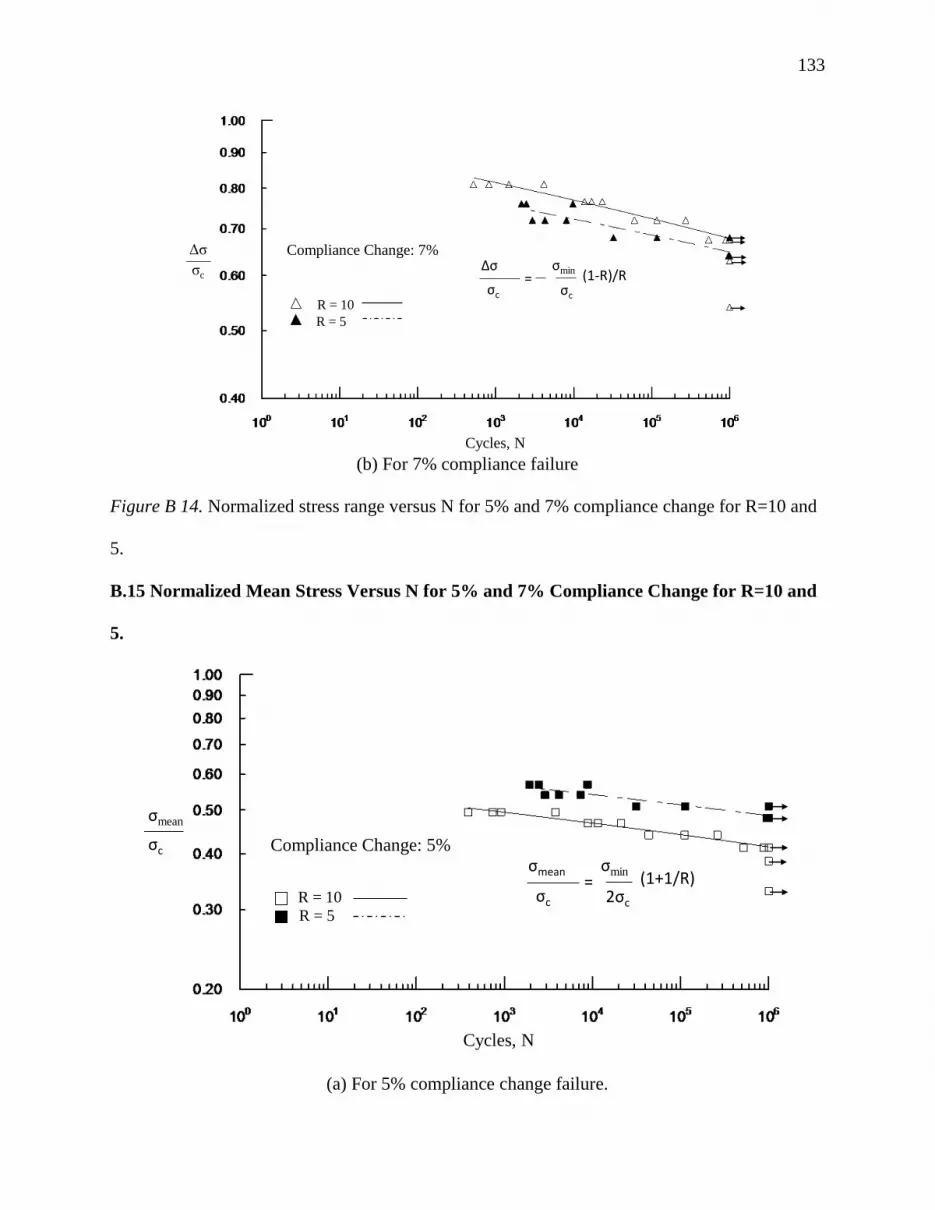
133
(b) For 7% compliance failure
Figure B 14. Normalized stress range versus N for 5% and 7% compliance change for R=10 and
5.
B.15 Normalized Mean Stress Versus N for 5% and 7% Compliance Change for R=10 and
5.
(a) For 5% compliance change failure.
σc
ΔσΔσ
σc
=σmin (1-R)/Rσc
Cycles, N
Compliance Change: 7%
R = 10
R = 5
R = 10
R = 5
Cycles, N
Compliance Change: 5%
σmean
σc
σmean
σc
=σmin (1+1/R)2σc

134
(b) For 7% compliance change failure.
Figure B 15. Normalized mean stress versus N for 5% and 7% compliance change for R=10 and
5.
Cycles, N
R = 10
R = 5
Compliance Change: 7%σmean
σc
=σmin (1+1/R)2σc
σmean
σc

135
Appendix C
Additional Figures of Chapter 3
Compliance versus number of cycles (N) curves of the fatigue tested specimens for
τmax/τc = 0.90, 0.80 and 0.75 are given below.
C.1 Compliance Versus N Curves of the Specimens for τmax/τc = 0.90, R=0.1.
4 10-5
5 10-5
6 10-5
7 10-5
8 10-5
9 10-5
1 10 100 1000 104
105
106
Specimen# SSP-02
τmax/τc = 0.90
Cycles, N
R=0.1
Co
mp
lian
ce,
mm
/N
(a) Compliance versus number of cycles curve for specimen SSP-02
Specimen# SSP-11
τmax/τc = 0.90
Cycles, N
R=0.1
Co
mp
lian
ce,
mm
/N
(b) Compliance versus number of cycles curve for specimen SSP-11
4 10-5
5 10-5
6 10-5
7 10-5
8 10-5
9 10-5
0.0001
1 10 100 1000 104
105
106
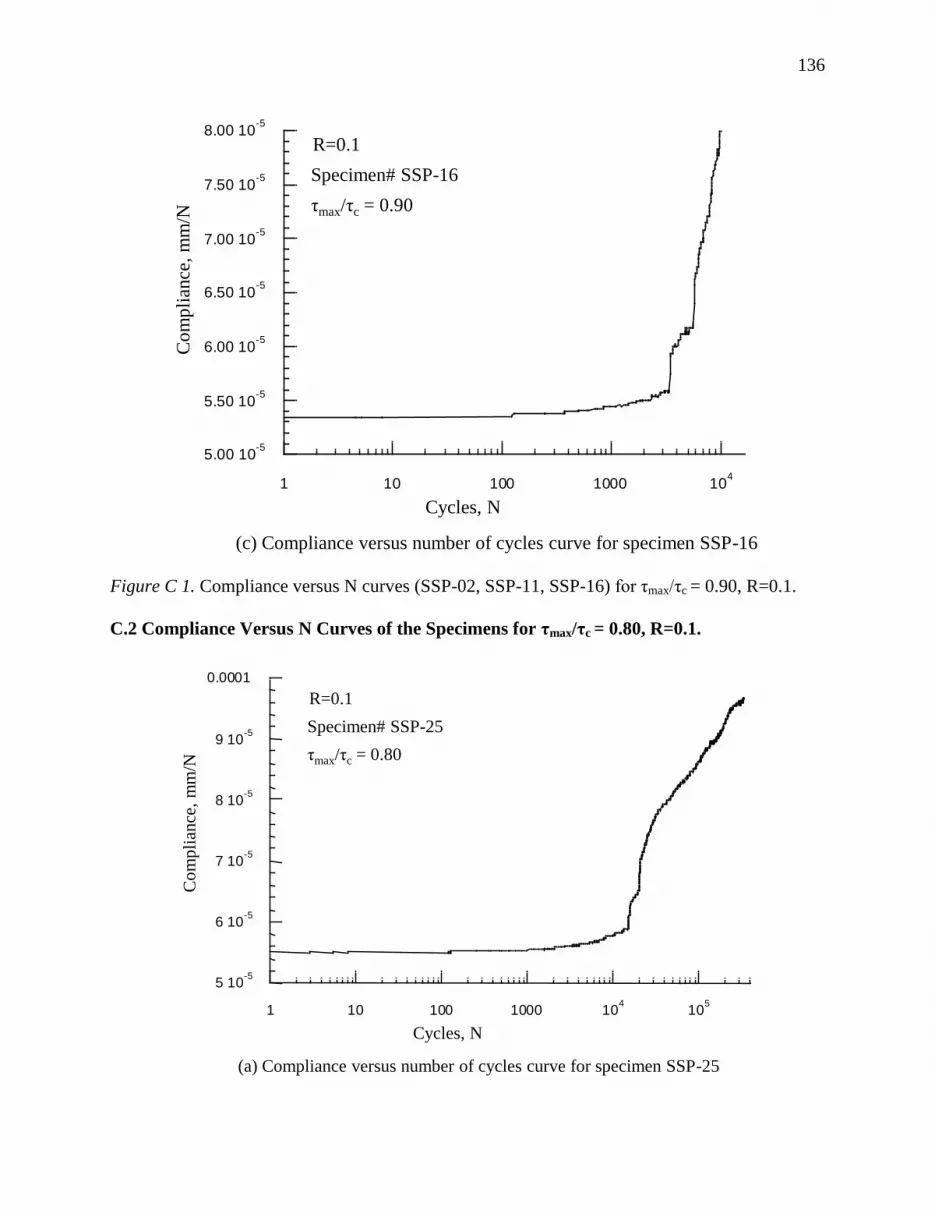
136
Figure C 1. Compliance versus N curves (SSP-02, SSP-11, SSP-16) for τmax/τc = 0.90, R=0.1.
C.2 Compliance Versus N Curves of the Specimens for τmax/τc = 0.80, R=0.1.
Specimen# SSP-16
τmax/τc = 0.90
Cycles, N
R=0.1
Co
mp
lian
ce,
mm
/N
(c) Compliance versus number of cycles curve for specimen SSP-16
5.00 10-5
5.50 10-5
6.00 10-5
6.50 10-5
7.00 10-5
7.50 10-5
8.00 10-5
1 10 100 1000 104
105
Specimen# SSP-25
τmax/τc = 0.80
Cycles, N
R=0.1
Co
mp
lian
ce,
mm
/N
(a) Compliance versus number of cycles curve for specimen SSP-25
5 10-5
6 10-5
7 10-5
8 10-5
9 10-5
0.0001
1 10 100 1000 104
105
106

137
Figure C 2. Compliance versus N (SSP-25, SSP-10, SSP-09) for τmax/τc = 0.80, R=0.1.
4.50 10-5
5.00 10-5
5.50 10-5
6.00 10-5
6.50 10-5
7.00 10-5
7.50 10-5
8.00 10-5
8.50 10-5
1 10 100 1000 104
105
106
Specimen# SSP-10
τmax/τc = 0.80
Cycles, N
R=0.1
Co
mp
lian
ce,
mm
/N
(b) Compliance versus number of cycles curve for specimen SSP-10
4.50 10-5
5.00 10-5
5.50 10-5
6.00 10-5
6.50 10-5
7.00 10-5
7.50 10-5
8.00 10-5
8.50 10-5
1 10 100 1000 104
105
106
Specimen# SSP-09
τmax/τc = 0.80
Cycles, N
R=0.1
Co
mp
lian
ce,
mm
/N
(c) Compliance versus number of cycles curve for specimen SSP-09

138
C.3 Compliance Versus N Curves of the Specimens for τmax/τc = 0.75, R=0.1.
Specimen# SSP-31
τmax/τc = 0.75
Cycles, N
R=0.1
Co
mp
lian
ce,
mm
/N
(a) Compliance versus number of cycles curve for specimen SSP-31
5.00 10-5
5.50 10-5
6.00 10-5
6.50 10-5
7.00 10-5
7.50 10-5
1 10 100 1000 104
105
106
Specimen# SSP-05
τmax/τc = 0.75
Cycles, N
R=0.1
Co
mp
lian
ce,
mm
/N
(b) Compliance versus number of cycles curve for specimen SSP-05
4.4 10-5
4.6 10-5
4.8 10-5
5 10-5
5.2 10-5
5.4 10-5
5.6 10-5
5.8 10-5
6 10-5
1 10 102
103
104
105
106

139
Figure C 3. Compliance versus number of cycles (SSP-31, SSP-05, SSP-16, SSP-15) for τmax/τc
= 0.75, R=0.1.
Specimen# SSP-16
τmax/τc = 0.75
Cycles, N
R=0.1
Co
mp
lian
ce,
mm
/N
(c) Compliance versus number of cycles curve for specimen SSP-16
5 10-5
6 10-5
7 10-5
8 10-5
9 10-5
0.0001
1 10 100 1000 104
105
106
5.00 10-5
5.50 10-5
6.00 10-5
6.50 10-5
7.00 10-5
7.50 10-5
1 10 100 1000 104
105
106
Specimen# SSP-15
τmax/τc = 0.75
Cycles, N
R=0.1
Co
mp
lian
ce,
mm
/N
(d) Compliance versus number of cycles curve for specimen SSP-15

140
Appendix D
Additional Figures of Chapter 4
Compliance versus number of cycles (N) curves of the fatigue tested specimens for
σmax/σct = 0.90, 0.80 and 0.75 are given below.
D.1 Compliance Versus N Curves of the Specimens for σmax/σct = 0.90, R=0.1.
5.0 10-5
5.5 10-5
6.0 10-5
6.5 10-5
7.0 10-5
0 5000 1 104
1.5 104
2 104
Co
mp
lian
ce,
mm
/N
Specimen# FSP-02
σmax/σct = 0.90
R=0.1
Cycles, N
(a) Compliance versus number of cycles cureve for specimen FSP-02
Co
mp
lian
ce,
mm
/N
Specimen# FSP-12
σmax/σct = 0.90
R=0.1
Cycles, N
(b) Compliance versus number of cycles cureve for specimen FSP-12
5.0 10-5
5.5 10-5
6.0 10-5
6.5 10-5
7.0 10-5
0 1000 2000 3000 4000 5000 6000

141
Figure D 1. Compliance versus N curves (FSP-02, FSP-12, FSP-24, FSP-17) for σmax/σct = 0.90,
R=0.1.
Co
mp
lian
ce,
mm
/N
Specimen# FSP-24
σmax/σct = 0.90
R=0.1
Cycles, N
(c) Compliance versus number of cycles cureve for specimen FSP-24
5.0 10-5
5.5 10-5
6.0 10-5
6.5 10-5
7.0 10-5
0 1000 2000 3000 4000 5000 6000 7000
Co
mp
lian
ce,
mm
/N
Specimen# FSP-17
σmax/σct = 0.90
R=0.1
Cycles, N
(d) Compliance versus number of cycles cureve for specimen FSP-17
5.0 10-5
5.5 10-5
6.0 10-5
6.5 10-5
7.0 10-5
0 500 1000 1500 2000 2500 3000

142
D.2 Compliance Versus N Curves of the Specimens for σmax/σct = 0.80, R=0.1.
Co
mp
lian
ce,
mm
/N
Specimen# FSP-03
σmax/σct = 0.80
R=0.1
Cycles, N
(a) Compliance versus number of cycles cureve for specimen FSP-03
5.0 10-5
5.5 10-5
6.0 10-5
6.5 10-5
7.0 10-5
0 1 104
2 104
3 104
4 104
Co
mp
lian
ce,
mm
/N
Specimen# FSP-10
σmax/σct = 0.80
R=0.1
Cycles, N
(b) Compliance versus number of cycles cureve for specimen FSP-10
5.0 10-5
5.5 10-5
6.0 10-5
6.5 10-5
7.0 10-5
0 2 104
4 104
6 104
8 104
1 105
1.2 105
1.4 105

143
Figure D 2. Compliance versus N curves (FSP-03, FSP-10, FSP-06) for σmax/σct = 0.80, R=0.1.
D.3 Compliance Versus N Curves of the Specimens for σmax/σct = 0.75, R=0.1.
Co
mp
lian
ce,
mm
/NSpecimen# FSP-06
σmax/σct = 0.80
R=0.1
Cycles, N
(c) Compliance versus number of cycles cureve for specimen FSP-06
5.0 10-5
5.5 10-5
6.0 10-5
6.5 10-5
7.0 10-5
0 1 105
2 105
3 105
4 105
5 105
Co
mp
lian
ce,
mm
/N
Specimen# FSP-09
σmax/σct = 0.75
R=0.1
Cycles, N
(a) Compliance versus number of cycles cureve for specimen FSP-09
5.0 10-5
5.5 10-5
6.0 10-5
6.5 10-5
7.0 10-5
0 2 105
4 105
6 105
8 105
1 106

144
Co
mp
lian
ce,
mm
/N
Specimen# FSP-29
σmax/σct = 0.75
R=0.1
Cycles, N
(b) Compliance versus number of cycles cureve for specimen FSP-29
5.0 10-5
5.5 10-5
6.0 10-5
6.5 10-5
7.0 10-5
0 1 105
2 105
3 105
4 105
5 105
6 105
5.0 10-5
5.5 10-5
6.0 10-5
6.5 10-5
7.0 10-5
0 1 105
2 105
3 105
4 105
5 105
6 105
7 105
Co
mp
lian
ce,
mm
/N
Specimen# FSP-23
σmax/σct = 0.75
R=0.1
Cycles, N
(c) Compliance versus number of cycles cureve for specimen FSP-23

145
Figure D 3. Compliance versus N curves (FSP-09, FSP-29, FSP-23, FSP-22) for σmax/σct = 0.75,
R=0.1.
Co
mp
lian
ce,
mm
/NSpecimen# FSP-22
σmax/σct = 0.75
R=0.1
Cycles, N
(d) Compliance versus number of cycles cureve for specimen FSP-22
5.0 10-5
5.5 10-5
6.0 10-5
6.5 10-5
7.0 10-5
0 2 105
4 105
6 105
8 105
1 106