Embed Size (px)
Citation preview

Seediscussions,stats,andauthorprofilesforthispublicationat:https://www.researchgate.net/publication/235455352
Fattyacidandstableisotopiccompositionasindicatorsofearly-lifefeedingecologyandpotentialmaternalresourcedependencyofthebullshark,Carcharhinusleucas
ARTICLEinMARINEECOLOGYPROGRESSSERIES·JANUARY2012
ImpactFactor:2.62
CITATIONS
3
READS
129
4AUTHORS,INCLUDING:
PhilipMatich
FloridaInternationalUniversity
13PUBLICATIONS373CITATIONS
SEEPROFILE
MichaelHeithaus
FloridaInternationalUniversity
161PUBLICATIONS4,916CITATIONS
SEEPROFILE
Availablefrom:PhilipMatich
Retrievedon:04February2016

MARINE ECOLOGY PROGRESS SERIESMar Ecol Prog Ser
Vol. 455: 245–256, 2012doi: 10.3354/meps09674
Published May 30
INTRODUCTION
The potential importance of sharks in marineecosystems coupled with declines in populations ofmany species around the world (see Ferretti et al.2010 for a review) has led to great interest in theirecological roles and factors that might impact popu-lation sizes. Uncertainties remain in our understand-ing of shark community dynamics, especially withrespect to the trophic dynamics of these apex preda-tors. In particular, few studies have addressed theearly-life feeding ecology of sharks and thetimescales over which newborn sharks are depen-
dent on maternal provisioning. Recently it was sug-gested that newborn sharks may rely on energyreserves from maternal allocation, in the form of anenlarged liver, during the first weeks to months of life(Hussey et al. 2010). This maternal head-start isadvantageous while newborn sharks develop forag-ing skills, and may be particularly crucial in densely-populated nursery areas, where prey availabilitymay also impact the condition of juvenile sharks(Duncan & Holland 2006, Hussey et al. 2010).
Attempts to clarify feeding ecology relationshipshave used methods ranging from more traditionalapproaches, such as stomach content analysis (New-
© Inter-Research 2012 · www.int-res.com*Email: [email protected]
Fatty acids and stable isotopes as indicators ofearly-life feeding and potential maternal resourcedependency in the bull shark Carcharhinus leucas
Laura L. Belicka1,3,*, Philip Matich2,3, Rudolf Jaffé1,3, Michael R. Heithaus2,3
1Southeast Environmental Research Center and Department of Chemistry and Biochemistry, and 2Department of Biological Sciences, Florida International University, Miami, Florida 33199, USA
3Marine Sciences Program, Florida International University, North Miami, Florida 33181, USA
ABSTRACT: The degree of reliance of newborn sharks on energy reserves from maternal resourceallocation and the timescales over which these animals develop foraging skills are critical factors to-wards understanding the ecological role of top predators in marine ecosystems. We used muscle tis-sue stable carbon isotopic composition and fatty acid analysis of bull sharks Carcharhinus leucas toinvestigate early-life feeding ecology in conjunction with maternal resource dependency. Values ofδ13C of some young-of-the-year sharks were highly enriched, reflecting inputs from the marine-based diet and foraging locations of their mothers. This group of sharks also contained high levels ofthe 20:3ω9 fatty acid, which accumulates during periods of essential fatty acid deficiency,suggesting inadequate or undeveloped foraging skills and possible reliance on maternal provision-ing. A loss of maternal signal in δ13C values occurred at a length of approximately 100 cm, withmuscle tissue δ13C values reflecting a transition from more freshwater/estuarine-based diets tomarine-based diets with increasing length. Similarly, fatty acids from sharks >100 cm indicated nosigns of essential fatty acid deficiency, implying adequate foraging. By combining stable carbon iso-topes and fatty acids, our results provided important constraints on the timing of the loss of maternalisotopic signal and the development of foraging skills in relation to shark size and imply that molec-ular markers such as fatty acids are useful for the determination of maternal resource dependency.
KEY WORDS: Essential fatty acid deficiency · Fatty acids · Food webs · Maternal investment · Stable isotopes · Sharks
Resale or republication not permitted without written consent of the publisher

Mar Ecol Prog Ser 455: 245–256, 2012
man et al. 2010, Torres-Rojas et al. 2010), to molecu-lar tools including stable isotope and lipid biomarkeranalysis (MacNeil et al. 2005, Pethybridge et al. 2010,Wai et al. 2011). Although stomach content analysiscan provide evidence for specific dietary items, bio-chemical approaches have the advantage of provid-ing information on assimilated organic substratesand can be especially helpful in complex ecosystemswith multiple organic carbon substrates (Dalsgaardet al. 2003, Iverson et al. 2004, Whiles et al. 2010).Bulk δ13C has been widely used for food web studies,providing information on the source of organic mat-ter in food webs (Fry et al. 1978, Fry & Sherr 1984,McCutchan et al. 2003). Furthermore, stable isotopiccomposition of neonatal animals has been demon-strated to reflect maternal diet and foraging locationinstead of neonatal diet, and this complication mustbe considered when interpreting isotope values inneonates and juveniles, especially for tissues withslow isotopic turnover times (e.g. muscle tissue inelasmobranchs; MacNeil et al. 2005, Olin et al. 2011).Fatty acid signatures are particularly useful fordietary studies because fatty acids from a prey itemare taken up into consumer adipose and muscle tis-sue with relatively minor or predictable modifica-tions (Iverson et al. 2004). Thus, a predator’s fattyacid signature closely matches the fatty acid signa-ture of its prey.
Fatty acid composition can also provide informa-tion on the nutritional status of an organism (Holman1960, Barbarich et al. 2006, Briend et al. 2011). Forexample, certain fatty acids, in particular 18:3ω3 (α-linolenic acid) and 18:2ω6 (linoleic acid), are essen-tial for growth, development, and cellular functionand furthermore cannot be synthesized by mammalsand most other animals, but instead must be obtainedthrough the diet (Le et al. 2009). If these fatty acidsare not obtained through the diet, ω9 unsaturatedfatty acids, such as 20:3ω9, are synthesized by theanimal instead to take the place of polyunsaturatedfatty acids derived from the essential fatty acids inbiochemical reactions. Thus, the presence of 20:3ω9in plasma and tissues has long been used as a nutri-tional status marker not only in humans (Holman1960, Siguel et al. 1987, Jeppesen et al. 1998, Le et al.2009) but also in animals such as carp Cyprinus car-pio (Farkas et al. 1977, Csengeri 1996), mice Musmusculus (Duffin et al. 2000), and the green seaurchin Strongylocentrotus droebachiensis (Gonza-lez-Duran et al. 2008).
Here, we investigated maternal resource depen-dency and early-life feeding ecology of bull sharksCarcharhinus leucas in the Florida Coastal Ever-glades, USA. Specifically, we used stable carbon iso-topes together with fatty acid composition in muscletissue to understand variation in the diets of individ-
246
Fig. 1. Sampling locations along a salinity gradient in the Shark River Estuary of the Florida Everglades, USA. OC/TBU: OtterCreek/Tarpon Bay (upper); SRS4/TBL: Shark River Slough Site 4/Tarpon Bay (lower); SRS5: Shark River Slough Site 5; PDL:
Ponce de Leon Bay. For geographical reference, the position of SRS5 is 25.377°N, 81.032°W

Belicka et al.: Early-life feeding in bull sharks
ual bull sharks and the possibility that young-of-the-year (YOY) sharks might rely on maternal provisions.Abundances of 20:3ω9 and the ratio of 20:3ω9 to20:4ω6 were used as indicators of essential fatty aciddeficiency, which infers non-feeding or poorly -developed foraging skills, with potential reliance onmaternal resources.
MATERIALS AND METHODS
In total, 28 bull sharks were captured in the SharkRiver Estuary of Everglades National Park, Florida,USA, with longlines as described by Heithaus et al.(2009) and Matich et al. (2011). Bull sharks in thissample collection ranged from 66 to 200 cm totallength (TL) and were evenly split between males andfemales. Sharks were captured along a salinity gradi-ent reaching from Otter Creek (OC) near the upperportion of Tarpon Bay (TBU) to Ponce de Leon Bay
(PDL) in the Gulf of Mexico (Fig. 1). Sampling at mid-and downstream sites (SRS4 and SRS5; Fig. 1) oc -curred near long-term environmental sampling plat-forms maintained by the Florida Coastal EvergladesLong-Term Ecological Research program (http://fce.lternet.edu). All sharks <100 cm TL analyzed forfatty acids were captured in TB, either in the upperportion near OC or in the lower portion of the baynear SRS4 (Table 1, Fig. 1). All sharks >150 cm TLwere captured from downstream portions of the estuary or coastal waters of PDL (Table 1, Fig. 1). An8 mm sterile biopsy punch (Acuderm) was used tocollect a 0.5 cm3 sample of muscle tissue, which wassubsequently placed on ice in the field and frozenupon return to the laboratory. Skin was removedfrom muscle samples, and a portion of the remainingtissue was dried and pulverized for stable isotopeanalysis.
Oven-dried, homogenized tissue was analyzed forstable carbon isotopic composition with a Carlo Erba
247
Tag no. Capture date Capture Sex Maturity TL δ13C (mm/dd/yy) location (cm) (‰)
J10043 06/24/09 OC/TBU M YOY 69 −13.255J10633 06/23/10 SRS4/TBL F YOY 78 −14.080J10058 07/25/09 SRS4/TBL F YOY 66 −15.016J10053 07/25/09 SRS4/TBL M YOY 69 −23.776J10091 09/17/09 SRS4/TBL F YOY 71 −16.820D1a 07/25/09 SRS4/TBL F YOY 72 −16.700D2a 07/30/09 SRS4/TBL F YOY 72 −17.420J10063 07/30/09 OC/TBU F YOY 73 −14.786D3a 08/13/10 SRS4/TBL M YOY 74 −14.950J10020 06/12/09 OC/TBU M YOY 75 −19.308J10006 08/04/09 SRS4/TBL F YOY 76 −19.510NT 09/17/09 SRS4/TBL F YOY 77 −14.478J10014 06/12/09 SRS4/TBL M YOY 79 −20.120NTa 07/30/09 OC/TBU F YOY 79 −15.395J10046 06/24/09 SRS4/TBL M YOY 81 −22.308J10673 10/28/10 SRS4/TBL M Immature 81 −23.310J10076 08/04/09 OC/TBU M Immature 106 −25.884J10054 08/01/09 SRS5 M Immature 108 −24.738J10031 05/30/09 OC/TBU M Immature 132 −20.868J10056 11/14/09 SRS5 M Immature 132 −21.989J10089 11/19/09 PDL M Immature 175 −19.672J10657 02/05/11 SRS5 F Immature 116 −15.880J10652 11/19/10 PDL M Immature 161 −16.950J10041 06/17/09 PDL F Immature 182 −17.764J10659 11/19/10 PDL F Immature 185 −17.740J10635 10/27/10 PDL M Immature 189 −17.510J10072 07/14/09 PDL F Immature 200 −17.707J10061 06/17/09 PDL F Immature 212 −15.558aDeceased
Table 1. Carcharhinus leucas. Characteristics and capture information for the bull sharks in this study. OC/TBU: OtterCreek/Tarpon Bay Upper; SRS4/TBL: Shark River Slough Site 4/Tarpon Bay Lower; PDL: Ponce de Leon Bay; SRS5: Shark
River Slough Site 5; YOY: young of the year; TL: total length; NT: not tagged

Mar Ecol Prog Ser 455: 245–256, 2012248
NA 1500 Elemental Analyzer coupled to a FinniganMAT Delta isotope ratio mass spectrometer at theStable Isotope Laboratory of Florida InternationalUniversity. All isotopic values are presented usingthe standard δ notation with Pee Dee Belemnite as astandard for δ13C. The average isotopic lab error forreplicate glycine internal standards treated identi-cally as the samples was 0.29‰ for δ13C. Lipid extrac-tion of the tissue was not performed prior to isotopicanalysis because C:N ratios were generally belowthose suggested as necessary for extraction or math-ematical correction (mean = 3.09 ± 0.06 SE, Post et al.2007).
Lipids were extracted from dried, homogenizedmuscle tissue following a modified method of Folchet al. (1957). Briefly, homogenized samples wereultrasonically extracted with a 2:1 mixture (v/v) ofmethylene chloride:methanol (CH2Cl2:MeOH). Asaline solution (0.9% NaCl) was added to achieve afinal ratio of 2:1:0.7 CH2Cl2:MeOH:H2O, the sampleswere strongly agitated, and the lower organic phasewas removed to an evaporation flask. Fresh organicsolvent was added to the remaining tissue and theextraction was repeated 2 more times. The 3 extractswere combined, and excess solvent was removed byrotary evaporation. Total lipid extracts were flushedwith nitrogen and stored in CH2Cl2 at −20°C.
Total lipid extracts were then saponified with 0.5 Nmethanolic KOH at 70°C for 30 to 60 min (Ju et al.2009). Neutral lipids were partitioned 3 times with amixture of hexane:diethyl ether (9:1) after addition ofwater and archived for subsequent analysis. Sampleswere then acidified to pH <2 with HCl, and free fattyacids were partitioned into 9:1 hexane:diethyl ether 3times and combined. Fatty acids were methylated tocorresponding methyl esters (FAMEs) with freshlydistilled diazomethane.
Fatty acids were identified and relative abun-dances were determined using gas-chromatography-mass spectrometry (GC-MS) with an Agilent 6890gas chromatograph coupled to an Agilent 5973 massspectrometer operating in electron ionization (EI)mode at 70 eV. Although many studies of quantita-tive analyses of fatty acids have been carried out byGC-flame ionization detection (FID), Dodds et al.(2005) have shown that the GC-MS technique usedhere compares satisfactorily to GC-FID. We used rel-ative abundances of fatty acids, instead of absoluteconcentrations of fatty acids, to compare sharks ofdifferent size and mass. GC column and oven para-meters were identical to those in Jaffé et al. (2001).Identification of fatty acids was performed by com-parison of chromatographic retention times and mass
spectral characteristics with authentic standards(Supelco PUFA No. 3 from Menhaden oil, SupelcoFAME Mix, C4−C24 Unsaturates, and Matreya MeadAcid Standard [Methyl 5,8,11-eicosatrienoic acid])and previously reported mass spectra. Selected sam-ples were analyzed with a Restek FAMEWAX col-umn (Crossbond® polyethylene glycol stationaryphase, 30 m length, 0.25 mm internal diameter,0.25 µm film thickness), with an oven program of6°C min−1 from 100 to 230°C, followed by a 10 minhold, to confirm structural assignment becausecoelutions of polyunsaturated fatty acids were mini-mal with the FAMEWAX column. Following quantifi-cation of the FAMEs, double bond positions in pre-dominant unsaturated fatty acids were furtherconfirmed through analysis of picolinyl esters follow-ing the method of Dubois et al. (2006).
Overall, 64 distinct fatty acids were quantified inthe shark sample set. For brevity, only a subset of the10 most abundant fatty acids in each sample, result-ing in a total of 21 fatty acids, are presented and dis-cussed here. Unsaturated fatty acids are named hereas A:BωC, where A is carbon chain length, B is num-ber of double bonds, and C is position of first doublebond counted from terminal methyl end. The fulldataset is available on the Florida Coastal Ever-glades Long-Term Ecological Research programwebsite (http://fce.lternet.edu). The subset of 21 fattyacids accounted for 91 to 97% of the total fatty acidsin all samples, and this subset was used in average-linkage hierarchical cluster analysis based on Bray-Curtis similarity coefficients on untransformed data(Howell et al. 2003) using the statistical package R asan exploratory data analysis technique to determinerelationships between individuals based on the fattyacid composition data. The Kruskal-Wallis non-para-metric analysis of variance (ANOVA) was used tocompare mean relative abundances of fatty acidsbetween groups of sharks determined by the clusteranalysis at the 95% significance level. Post hoc com-parisons following the Kruskal-Wallis test were per-formed using kruskalmc in the package pgirmess inR to evaluate statistical differences in mean fatty acidconcentration between shark groups.
RESULTS
Muscle tissue δ13C values were highly variable,ranging from −13.3 to −25.9‰ (Fig. 2). This broadrange in values closely follows the isotopic composi-tions of the 2 distinct basal resource pools located inthe system: a freshwater/estuarine component with a

Belicka et al.: Early-life feeding in bull sharks
mean ± SE δ13C of −29.7‰ ± 0.7 and a marine compo-nent, based largely on seagrass, with an average δ13Cof −14.5‰ ± 0.3 (Fry & Smith 2002, Chasar et al. 2005,Williams & Trexler 2006, Matich et al. 2011). Stablecarbon isotopic composition was independent oflocation of capture, with some sharks from both the
upper estuary (OC/TBU) and marineend-member (PDL) displaying highlyenriched δ13C (Fig. 2). Sharks withtotal lengths <100 cm displayedstrong variation in δ13C (Fig. 2).
We identified 64 fatty acids in theshark muscle tissue samples; how-ever, a subset of 21 structures ac -counted for >90% of the total fattyacids in all samples (Table 2). A hier-archical cluster analysis based onthese 21 fatty acids segregated theshark muscle tissue samples into 3main groups at the 20% dissimilar-ity level (Fig. 3). Importantly, the 3groups identified by this clusteranalysis based on fatty acid composi-tion, with the exception of a few out-liers, match the clusters of sharksfound when examining the relation-ships between δ13C and length(Fig. 2), as well as the relationshipsbetween specific fatty acid ratios
with total length and δ13C (see Figs. 5 & 6, with fur-ther explanation below). The first cluster of sharks(group i) included a subset of shark muscle tissuesamples that contained significantly higher totalmonounsaturated fatty acids compared to the sharksin groups ii or iii and significantly lower total satu-
249
Total length (cm)
40 60 80 100 120 140 160 180 200 220
δ13C
(‰)
–28
–26
–24
–22
–20
–18
–16
–14
–12
Maternal Influence Dietary Influence
Group i
Group iii
Group ii
J10006
J10657
J10031
J10061
Mar
ine
Fre
shw
ater
/es
tuar
ine
OC/TBUSRS4/TBL
SRS5PDL
YOYImmature
Fig. 2. Carcharhinus leucas. Stable carbon isotopic composition of shark mus-cle tissue as a function of total shark length. Groups of sharks defined by hier-archical cluster analysis as shown in Fig. 3. Note that shark J10006 clusteredwith group ii in Fig. 3, and an ungrouped sample, shark J10657, clustered withgroup iii in Fig. 3. The outliers in the cluster analysis, J10061 and J10031, are
also labeled. Site abbreviations as in Fig. 1; YOY: young of the year
Fig. 3. Carcharhinus leucas. Average-linkage hierarchical cluster analysis of composition of predominant fatty acid composi-tion of shark muscle tissue based on Bray-Curtis dissimilarity matrix. Muscle tissue clustered into 3 main groups (i, ii, and iii)at a 20% dissimilarity level, with the exception of outliers (J10061 and J10031). Site abbreviations as in Fig. 1; YOY: young of
the year

Mar Ecol Prog Ser 455: 245–256, 2012250
J10043 J10633 J10058 J10053 J10091 D1 D2 J10063 D3 J10020 J10006 NT J10014 NT (i) (i) (i) (iii) (i) (i) (i) (i) (i) (iii) (ii) 09/17/09 (i) (iii) 07/30/09 (i)
Saturated (SAT)14:0n 0.4 0.4 0.3 0.2 0.4 0.6 0.4 1.1 0.3 0.4 0.2 0.4 1.2 0.215:0n 0.1 0.2 0.1 0.1 0.1 0.2 0.2 0.8 0.1 0.2 0.2 0.1 0.6 0.116:0n 12.1 16.1 12.4 14.0 13.5 20.8 16.3 13.7 13.1 15.6 12.5 11.8 15.9 10.918:0n 13.7 9.7 13.0 14.2 11.3 9.6 11.3 20.5 9.4 14.1 15.1 10.8 20.3 12.1Total SAT 26.3 26.4 25.8 28.5 25.4 31.1 28.1 36.2 23.0 30.2 27.9 23.1 38.0 23.3
Monounsaturated (MUFA)
16:1ω9 0.3 2.5 2.4 − 2.2 0.6 0.6 − 2.5 0.2 0.2 1.9 − 2.416:1ω7 6.9 6.5 6.2 2.0 5.5 9.7 7.1 3.6 6.1 2.6 1.5 6.1 2.3 6.017:1ω8 0.4 − 0.3 0.2 0.4 1.0 0.8 0.2 0.6 0.4 0.6 0.4 − 0.318:1ω9 25.3 22.8 24.0 14.4 19.5 26.3 21.4 17.6 22.6 14.7 14.2 22.4 11.5 22.118:1ω7 9.2 9.5 8.5 8.6 8.2 5.2 5.1 6.5 8.5 7.5 6.8 7.6 7.0 8.6Total MUFA 42.2 41.3 41.5 25.1 35.8 42.9 35.1 27.9 40.2 25.4 23.3 38.4 20.8 39.4
Polyunsaturated (PUFA)
18:2 1.9 2.9 0.8 0.2 0.5 0.8 0.8 0.8 0.8 0.3 0.3 0.6 0.5 0.918:2 3.1 0.5 2.9 0.5 3.0 1.9 2.9 1.5 3.1 0.9 − 2.8 0.7 3.318:2ω6 − 0.1 0.1 1.5 0.3 0.3 0.4 0.3 0.3 0.8 1.1 0.3 0.8 0.220:2ω9 6.3 3.9 6.2 1.6 4.2 2.8 3.7 3.0 5.2 1.8 0.5 4.7 0.9 6.120:3ω9 10.4 7.8 11.8 4.8 12.1 7.0 10.2 14.5 10.0 8.4 3.0 11.8 5.9 13.320:4ω6 0.5 3.2 0.6 10.0 3.1 2.0 3.2 2.3 2.5 6.9 14.4 2.3 9.4 1.120:5ω3 0.2 0.8 0.2 0.7 0.8 0.5 1.1 0.5 0.7 1.1 1.2 0.5 1.1 −22:3 1.9 1.7 1.9 1.2 2.3 1.3 1.9 1.7 2.5 1.4 0.4 2.8 1.2 0.522:4ω6 0.3 0.8 0.3 5.4 1.0 0.4 0.7 0.5 0.5 3.8 4.5 0.9 2.4 0.422:5ω6 0.1 0.7 0.2 2.8 0.8 0.6 0.8 0.4 0.6 1.6 2.8 0.7 1.4 0.322:5ω3 0.4 0.7 0.7 2.7 0.9 0.7 1.3 0.7 0.9 3.0 3.4 0.6 1.7 3.222:6ω3 1.3 4.0 2.0 9.5 4.3 3.1 4.9 3.7 4.0 9.2 11.1 4.4 7.4 2.9
Total PUFA 26.4 27.1 27.6 40.9 33.3 21.6 31.9 29.9 31.1 39.4 42.8 32.5 33.6 32.1
J10046 J10673 J10076 J10054 J10031 J10056 J10089 J10657 J10652 J10041 J10659 J10635 J10072 J10061 (iii) (iii) (ii) (ii) (ii) (ii) (iii) (ii) (ii) (ii) (ii) (ii)
Saturated 14:0n 1.9 0.4 0.3 0.3 1.0 0.4 0.3 0.2 0.2 0.4 0.3 0.2 0.2 5.515:0n 1.0 0.4 0.2 0.2 1.6 0.2 0.3 0.2 0.2 0.2 0.2 0.1 0.2 5.816:0n 22.5 14.4 14.1 16.5 9.8 13.4 15.4 17.3 20.6 20.3 18.7 17.7 17.3 33.418:0n 20.8 11.2 16.9 16.0 33.2 15.1 13.6 11.0 14.0 17.6 15.8 13.5 14.4 27.2Total SAT 46.2 26.3 31.5 33.0 45.6 29.1 29.6 28.7 35.0 38.5 35.0 31.4 32.1 71.9
Monounsaturated 16:1ω9 − 1.0 tr − − − − 0.5 0.2 − 0.3 0.1 − −16:1ω7 1.8 2.1 1.3 1.2 1.4 1.3 1.4 4.1 1.7 1.2 3.6 0.5 1.7 0.717:1ω8 1.3 0.6 0.5 0.5 0.1 0.5 0.5 0.6 0.2 0.4 0.9 0.4 0.4 0.418:1ω9 13.4 15.2 16.1 13.6 11.4 15.3 13.8 17.9 11.0 16.3 16.6 10.9 14.6 8.018:1ω7 7.7 8.7 7.3 6.1 6.7 4.8 5.7 6.9 5.2 6.5 5.3 5.0 7.9 4.3Total MUFA 24.2 27.7 25.2 21.3 19.6 21.9 21.5 30.0 18.2 24.5 26.6 16.8 24.6 13.4
Polyunsaturated 18:2 0.4 0.3 0.2 0.1 0.2 0.2 0.1 0.4 0.1 0.1 0.1 tr 0.2 0.318:2 0.5 0.7 0.3 0.2 0.2 − − 0.5 0.1 0.1 − − − 0.318:2ω6 1.0 1.1 1.6 0.8 1.4 1.8 1.1 0.4 0.5 0.6 0.6 0.6 0.6 0.520:2ω9 1.2 1.9 0.4 0.9 − − 0.2 1.4 0.3 0.2 0.2 0.2 0.4 −20:3ω9 3.4 4.1 1.1 2.5 0.6 0.8 1.1 2.8 0.3 1.2 0.2 0.1 0.9 −20:4ω6 6.6 7.0 14.1 9.8 15.2 22.2 15.8 5.5 11.2 15.2 13.8 12.3 14.7 4.720:5ω3 − 1.0 0.5 0.4 0.5 0.5 0.7 2.6 1.2 0.6 1.1 1.3 0.5 −22:3 0.7 3.2 tr 0.7 − − 0.2 0.8 − − − 0.1 − −22:4ω6 2.0 2.9 6.3 9.0 2.7 7.3 9.3 1.8 9.5 6.2 6.7 11.6 8.3 0.522:5ω6 0.9 2.4 2.4 3.0 1.1 4.3 4.5 1.2 3.6 2.0 3.0 5.1 3.2 0.422:5ω3 1.3 3.3 2.8 3.1 1.5 1.6 2.3 5.0 3.9 1.5 1.9 3.2 2.0 −22:6ω3 4.6 9.6 8.5 10.4 7.4 6.3 8.5 13.9 12.7 6.5 7.8 13.7 8.1 1.0
Total PUFA 22.7 37.4 38.1 40.9 30.7 44.9 43.8 36.4 43.3 34.2 35.3 48.2 38.9 7.7
Table 2. Carcharhinus leucas. Relative abundance (% of total fatty acids) in shark muscle tissue samples. Shark group number(i, ii, or iii) shown in parentheses. Unsaturated fatty acids named as A:BωC, where A is carbon chain length, B is number ofdouble bonds, and C is position of first double bond counted from terminal methyl end (listed where confirmed through pico -linyl ester method or comparison with standard compound). NT: not tagged; Tr: trace amounts detected (<0.1%); −: not
detected. Sharks J10031 and J10061 were not assigned to groups based on the hierarchical cluster analysis (Fig. 3)

Belicka et al.: Early-life feeding in bull sharks
rated and polyunsaturated fatty acidscompared to group ii (Fig. 4). No sig-nificant differences (Kruskal-Wallis;α = 0.05) were found for mean rela-tive abundances of 14:0n, 15:0n,16:0n, 17:1ω8, and 20:5ω3 among the3 groups of sharks, although, onaverage, 16:0n, 17:1ω8, and 20:5ω3were lower in group i sharks than ingroups ii and iii. For all other fattyacids in the dataset, mean relativeabundance was significantly differ-ent between group i and groupii sharks. Average (± SD) relativeabundances of the 3 predominantmonounsaturated fatty acids, 16:1ω7,18:1ω9, and 18:1ω7, and the domi-nant representative polyunsaturatedfatty acid from the ω9, ω6, and ω3families, in each of the 3 groups ofsharks are presented in Fig. 4. Groupi sharks contained significantly high -er abundances of 16:1ω7, 18:1ω7, and
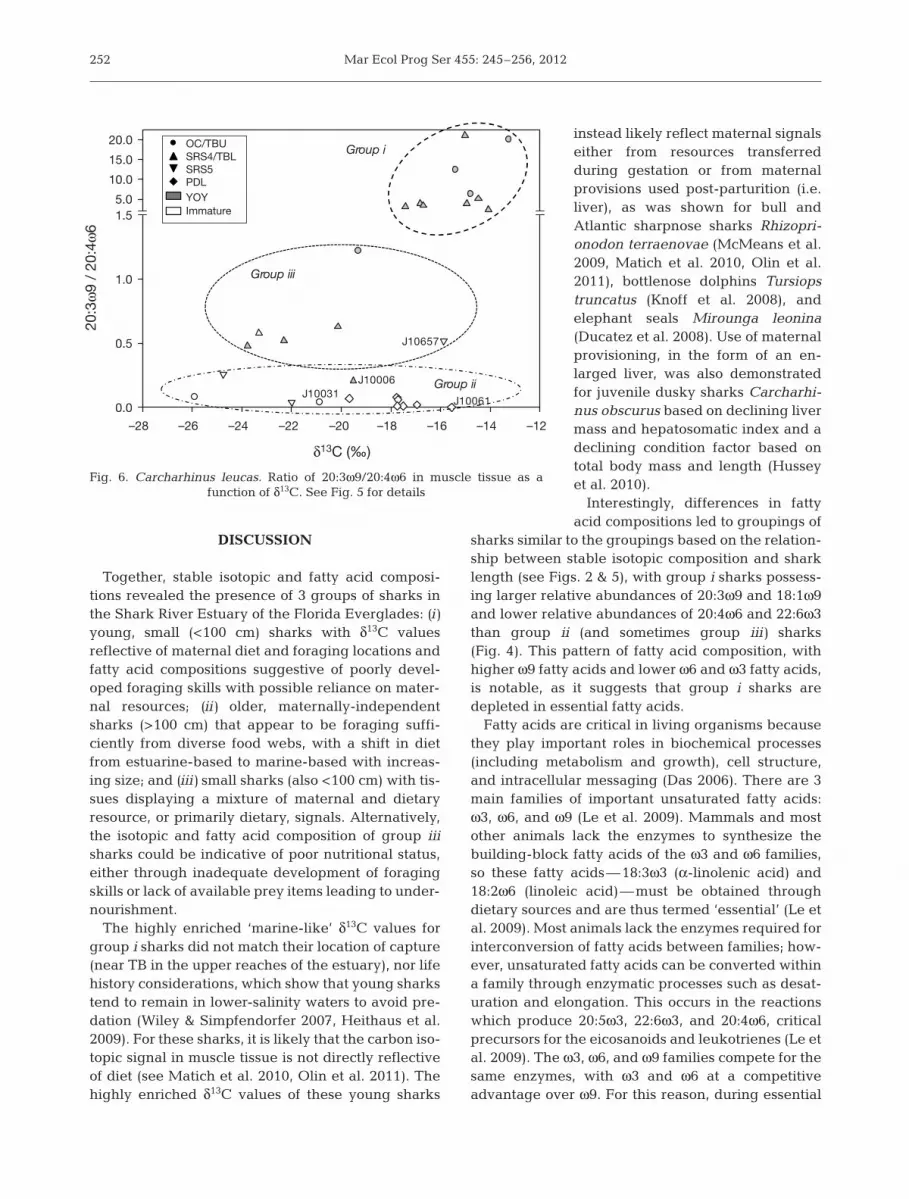
20:3ω9 compared to group ii, and significantly higher18:1ω9 compared to both groups ii and iii (Fig. 4). Incontrast, group i contained significantly lower 20:4ω6than group ii and significantly lower 22:6ω3 thanboth groups ii and iii (Fig. 4). No significant differ-ences in these fatty acids were found betweengroups ii and iii (Fig. 4). The ratio of 20:3ω9 to 20:4ω6ranged from 2.4 to 21 in group i sharks, which werealso relatively small (66 to 79 cm TL) and isotopicallyenriched (−13.3 to −17.4‰; Figs. 5 & 6). Group iiisharks, which were also small (69 to 116 cm TL), hadlower ratios of 20:3ω9/20:4ω6, ranging from 0.48 to1.22, and more deplete isotopic values (−15.9 to−23.8‰) compared to the group i sharks (Figs. 4 & 5).Group ii sharks were in general the largest, but hadthe smallest 20:3ω9/20:4ω6 ratios (0.0 to 0.26) andwide ranges of carbon isotopic composition (−15.6 to−25.9‰; Figs. 5 & 6).
For a subset of sharks in which body mass wasavailable (n = 17), the relationship between totallength (cm) and body mass (kg) was linear and highlysignificant (body mass = 0.212 × [total length] −12.432, R2 = 0.8816, p < 0.001). From this relationship,expected body masses were determined. The differ-ence between observed and expected body masseswere used as estimates of body condition. No signifi-cant relationship was found between this estimate ofbody condition and the 20:3ω9/20:4ω6 ratio (R2 =0.023, p = 0.558).
251
Saturated
i ii iii0
20
40
60
80
100Monounsaturated
i ii iii
Polyunsaturated
i ii iii
ab ab
a
bb
a
bab
16:1w7
i ii iii
Per
cent
age
of t
otal
fatt
y ac
ids
0
10
20
30
40
50
a
b ab
18:1w9
i ii iii
a
b b
18:1w7
i ii iii
a b ab
20:3w9
i ii iii0
10
20
30
40
50
a
b
ab
20:4w6
Shark groupi ii iii
a
b
ab
22:6w3
i ii iii
a
b b
Fig. 4. Carcharhinus leucas. Average (±SD) relative abun-dance of grouped (saturated, monounsaturated, and polyun-saturated fatty acids) and selected individual fatty acids ingroup i, ii, and iii sharks. Different letters represent signifi-
cant differences (p < 0.05)
Total length (cm)
20:3
ω9
/ 20
:4ω
6
0.0
0.5
1.0
1.5
5.0
10.0
15.0
20.0
Group i
Group iii
Group ii
J10031 J10061
J10657
J10006
OC/TBUSRS4/TBLSRS5PDL
YOYImmature
40 60 80 100 120 140 160 180 200 220
Fig. 5. Carcharhinus leucas. Ratio of 20:3ω9/20:4ω6 in muscle tissue as a func-tion of shark length. Groups of sharks defined by hierarchical cluster analysisas shown in Fig. 3. The outliers in the cluster analysis, J10061 and J10031, arelabeled. Note that sharks J10006 and J10657, atypical in Fig. 2, group asassigned by the cluster analysis. Site abbreviations as in Fig. 1; YOY:
young of the year
Mar Ecol Prog Ser 455: 245–256, 2012
DISCUSSION
Together, stable isotopic and fatty acid composi-tions revealed the presence of 3 groups of sharks inthe Shark River Estuary of the Florida Everglades: (i)young, small (<100 cm) sharks with δ13C valuesreflective of maternal diet and foraging locations andfatty acid compositions suggestive of poorly devel-oped foraging skills with possible reliance on mater-nal resources; (ii) older, maternally-independentsharks (>100 cm) that appear to be foraging suffi-ciently from diverse food webs, with a shift in dietfrom estuarine-based to marine-based with increas-ing size; and (iii) small sharks (also <100 cm) with tis-sues displaying a mixture of maternal and dietaryresource, or primarily dietary, signals. Alternatively,the isotopic and fatty acid composition of group iiisharks could be indicative of poor nutritional status,either through inadequate development of foragingskills or lack of available prey items leading to under-nourishment.
The highly enriched ‘marine-like’ δ13C values forgroup i sharks did not match their location of capture(near TB in the upper reaches of the estuary), nor lifehistory considerations, which show that young sharkstend to remain in lower-salinity waters to avoid pre-dation (Wiley & Simpfendorfer 2007, Heithaus et al.2009). For these sharks, it is likely that the carbon iso-topic signal in muscle tissue is not directly reflectiveof diet (see Matich et al. 2010, Olin et al. 2011). Thehighly enriched δ13C values of these young sharks
instead likely reflect maternal signalseither from re sources transferredduring gestation or from maternalprovisions used post-parturition (i.e.liver), as was shown for bull andAtlantic sharpnose sharks Rhizopri-onodon terraenovae (McMeans et al.2009, Matich et al. 2010, Olin et al.2011), bottlenose dolphins Tursiopstruncatus (Knoff et al. 2008), and elephant seals Mir ounga leonina(Ducatez et al. 2008). Use of maternalprovisioning, in the form of an en -larged liver, was also demonstratedfor juvenile dusky sharks Carcharhi-nus obscurus based on declining livermass and hepatosomatic index and adeclining condition factor based ontotal body mass and length (Husseyet al. 2010).
Interestingly, differences in fattyacid compositions led to groupings of
sharks similar to the groupings based on the relation-ship between stable isotopic composition and sharklength (see Figs. 2 & 5), with group i sharks possess-ing larger relative abundances of 20:3ω9 and 18:1ω9and lower relative abundances of 20:4ω6 and 22:6ω3than group ii (and sometimes group iii) sharks(Fig. 4). This pattern of fatty acid composition, withhigher ω9 fatty acids and lower ω6 and ω3 fatty acids,is notable, as it suggests that group i sharks aredepleted in essential fatty acids.
Fatty acids are critical in living organisms becausethey play important roles in biochemical processes(including metabolism and growth), cell structure,and intracellular messaging (Das 2006). There are 3main families of important unsaturated fatty acids:ω3, ω6, and ω9 (Le et al. 2009). Mammals and mostother animals lack the enzymes to synthesize thebuilding-block fatty acids of the ω3 and ω6 families,so these fatty acids—18:3ω3 (α-linolenic acid) and18:2ω6 (linoleic acid)—must be obtained throughdietary sources and are thus termed ‘essential’ (Le etal. 2009). Most animals lack the enzymes required forinterconversion of fatty acids between families; how-ever, unsaturated fatty acids can be converted withina family through enzymatic processes such as desat-uration and elongation. This occurs in the reactionswhich produce 20:5ω3, 22:6ω3, and 20:4ω6, criticalprecursors for the eicosanoids and leukotrienes (Le etal. 2009). The ω3, ω6, and ω9 families compete for thesame enzymes, with ω3 and ω6 at a competitiveadvantage over ω9. For this reason, during essential
252
δ13C (‰)
–28 –26 –24 –22 –20 –18 –16 –14 –12
20:3
ω9
/ 20
:4ω
6
0.0
0.5
1.0
1.55.0
10.0
15.0
20.0Group i
Group iii
Group iiJ10061
J10031
J10657
J10006
OC/TBUSRS4/TBLSRS5PDLYOYImmature
Fig. 6. Carcharhinus leucas. Ratio of 20:3ω9/20:4ω6 in muscle tissue as a function of δ13C. See Fig. 5 for details

Belicka et al.: Early-life feeding in bull sharks
fatty acid deficiency, ω9 unsaturated fatty acids suchas 20:3ω9 are synthesized from ubiquitous C18 satu-rated and monounsaturated fats present in cellsbecause of the almost complete lack of competitiveeffects of ω3 and ω6 fatty acids (Le et al. 2009).Although 20:3ω9 has been found in high abundancesin cartilage (Adkisson et al. 1991), the samples ana-lyzed here are purely muscle from the dorsal side ofthe animal near the first dorsal fin. Any cartilage orskin attached to the muscle tissue was removed, sowe expect negligible inputs of 20:3ω9 from cartilagi-nous tissue. Therefore, the pattern of higher abun-dances of C18 monounsaturated fatty acids and20:3ω9, combined with very low abundances of theω6 and ω3 polyunsaturated fatty acids, clearlydemonstrates that group i sharks are depleted inessential fatty acids.
The essential fatty acid deficiency present in groupi sharks suggests that these animals are either notfeeding, have inadequate foraging skills, or that preyabundance is limited. Limitation of prey is not likely,as other individuals captured in the same region asgroup i sharks showed little to no essential fatty aciddeficiency (Fig. 5). The former 2 possibilities, starva-tion or inadequate foraging skills, both lend supportfor the hypothesis that group i sharks have been rely-ing on maternal resources such as an enlarged liver,as was demonstrated for juvenile dusky sharks(Hussey et al. 2010), and may only recently havebegun to develop foraging skills.
For humans, a plasma ratio of 20:3ω9/20:4ω6(triene-tetraene ratio) >0.2 is considered diagnosticof essential fatty acid deficiency (Holman 1960, Hol-man et al. 1979, Siguel et al. 1987, Le et al. 2009).Although we cannot assume that the 0.2 cut-off valueof the triene-tetraene ratio defined in humans appliesexactly to bull sharks, the fact that all larger(>120 cm) bull sharks in this study possessed 20:3ω9/20:4ω6 ratios at or below this value (Fig. 4) does lendsupport to this assumption since they are replete inessential fatty acids. Additionally, the triene-tetraeneratio for group i sharks was 12 to 106 times thehuman cut-off value of 0.2, while the ratio for group iisharks was only 0.05 to 1.3 times the human cut-offvalue (Fig. 4).
No significant relationship was found (Pearson r =0.153; df = 16; p = 0.558) between this estimate ofbody condition and markers of essential fatty aciddeficiency, even for group i sharks only (Pearson r =0.429; df = 6; p = 0.336) in which muscle tissue sug-gested a high degree of essential fatty acid defi-ciency. This lack of relationship between body condi-tion and essential fatty acid deficiency could stem
from our small sample size (we only had body massmeasurements for 17 sharks), but is more likely areflection of the different timescales in which muscletissue fatty acids and body condition based on totalbody mass respond to dietary change. Additionalstudies of the fatty acid composition of other tissuescompared to morphometric measures, such as totalbody fat or liver mass, would be useful to clarify thesedietary response timescales. The fatty acid composi-tion of liver, the major lipid storage depot, can bechallenging to link directly to dietary inputs becauseextensive lipid synthesis and oxidation and modifica-tion of lipids for buoyancy regulation occurs in livers(see Ballantyne 1997); however, assessment of liverfatty acid composition in conjunction with muscle tis-sue might provide further information on the time -scales of transition from maternal resource depen-dency to foraging or information on the nutritionalquality of maternal resources.
A distinct change in the relationship betweenshark total length and muscle tissue δ13C occurred forsharks with lengths greater than approximately100 cm compared to the smaller sharks (Fig. 2). Sim-ilarly, sharks >100 cm had very low triene-tetraenefatty acid ratios (Fig. 4). The positive relationshipbetween shark length and δ13C for sharks >100 cmimplies firstly that sharks at this age/size are largelyindependent of maternal provisioning and their tis-sue composition is reflective of diet (see also Matichet al. 2010), and secondly, that some sharks transitionfrom freshwater/estuarine habitats to marine waters,with a greater reliance on marine, seagrass-basedfood webs as they age (Fig. 2). Because we do nothave many sharks in the range of 80 to 100 cm, andbecause individuals feed and mature at differentrates, it is difficult to determine an exact size, or sizerange, where the shark tissue would transition fromreflecting maternal influence to dietary influence.Olin et al. (2011) suggested that based on δ13C andδ15N, bull shark muscle and liver tissue indicate a lossof maternal signal by umbilical scar stage 5 (faintscar visible), although they caution that categorizingthis slow-growing species by umbilical scar stagesmay not be appropriate. Given that umbilical scarsare no longer visible in bull sharks in the Shark Riverestuary by the time sharks reach 75 to 85 cm totallength (M. Heithaus & P. Matich unpublished data),an estimate of 100 cm for the point at which maternalisotopic signal is lost is most likely conservative. Thissize estimate is presumably even more conservativewhen we consider that dietary changes become re -corded in tissue fatty acids on timescales of <12 wk injuvenile iridescent sharks Pangasius hypothalmus
253

Mar Ecol Prog Ser 455: 245–256, 2012
(Asdari et al. 2011), as opposed to stable isotopes,which turn over on the order of ~1 to 1.5 yr in elasmo-branch muscle tissue (see MacNeil et al. 2006, Logan& Lutcavage 2010, Matich et al. 2010, and referencestherein).
Fatty acids in shark muscle tissue were not suffi-cient to distinguish between freshwater/estuarineversus seagrass-based food sources, as demonstratedby the similarity in fatty acid composition amonggroup ii sharks, despite the substantial range of δ13C.Typical markers for terrestrial organic matter infreshwater/estuarine environments, such as long-chain saturated fatty acids characteristic of vascularplant debris (Eglinton & Hamilton 1967) or 18:3ω3indicative of cyanobacterial inputs to the abundantperiphyton in the freshwater prairies of the Ever-glades (Neto et al. 2006), were either absent or onlypresent in trace levels in shark muscle tissue.Whether this absence reflects a lack of feeding onfood sources that use vascular plant debris or peri-phyton as basal resources, or, alternatively, thatinputs from these sources are not accumulating upthe food chain to high trophic level consumersremains to be determined. Investigation into morespecific biomarkers or techniques such as com-pound-specific isotopic analysis may help answerthis question. Similarly, temporal and spatial vari-ability in shark diet may also be affecting our abilityto fully resolve the early-life feeding ecology of bullsharks. Our data encompassed individuals collectedin both wet and dry seasons over multiple years, butwas not large enough to adequately address changesin shark diet on spatial and temporal scales.
Because size at birth is quite variable in bull sharks(Neer et al. 2005) and growth rate among individualsis also variable, especially for smaller animals(Branstetter & Stiles 1987), it is possible that individ-uals that fall between 60 and 80 cm total length (inFig. 4) may represent sharks whose isotopic composi-tions are both completely dependent and increas-ingly or completely independent of maternal compo-sition (see Olin et al. 2011). This concept explainsthe presence of group iii, i.e. sharks with less en -riched isotopic compositions and intermediate triene-tetraene ratios. If these sharks are substantially olderthan sharks of the same size with highly enriched iso-topic signals, it is possible that their muscle tissuesare losing their maternal signal and are becomingmore indicative of diet. The lower triene-tetraeneratios support increasing dietary input of essentialfatty acids, implying greater nutritional conditioncompared to their group i counterparts. However, thetriene-tetraene ratio for group iii sharks was still ele-
vated compared to group ii sharks and may suggestpoor foraging skills leading to essential fatty aciddeficiency, particularly for those sharks with moredepleted isotopic compositions (approximately −20 to−24‰), if both fatty acid and isotopic compositionhave already fully lost any maternal influence(Fig. 5). Feeding studies with individuals of knownage would greatly improve our understanding ofthese transitional animals.
CONCLUSIONS
The stable isotopic composition of YOY bull sharksis complicated by inputs from maternal biochemicalmakeup. As sharks grow and initiate foraging, thematernal signal is gradually lost with sharks slowlyincorporating more dietary signals into their tissues.By a total shark length of approximately 100 cm,muscle tissues are wholly representative of diet, withan apparent transition from freshwater/estuarine toseagrass-based diets as shark length increases forsome individuals. Fatty acid composition of muscletissue of some YOY bull sharks shows severe essen-tial fatty acid deficiency, indicating non-feeding orinadequate feeding, with the possibility of maternalresource dependence during this time. Further inves-tigations should focus on the paired stable isotopeand fatty acid compositions of multiple tissues withdiffering turnover times to further constrain thetimescales of the loss of maternal signature from tis-sues and potential use of maternal reserves.
Acknowledgements. Funding for this project was providedby the National Science Foundation (DBI0620409,DEB9910514, DRL0959026) and Florida International Uni-versity’s Marine Sciences Program. We also thank the FCE-LTER for logistical and financial support of this study.Research was conducted under Everglades National Parkpermits EVER-2009-SCI-0024 and EVER-2007-SCI-0025and with Florida International University IACUC approval.This is contribution #552 of the Southeast EnvironmentalResearch Center at Florida International University.
LITERATURE CITED
Adkisson HD, Risener FS, Zarrinkar PP, Walla MD, ChristieWW, Wuthier RE (1991) Unique fatty acid composition ofnormal cartilage—discovery of high levels of n-9eicosatrienoic acid and low levels of n-6 polyunsaturatedfatty acids. FASEB J 5: 344−353
Asdari R, Aliyu-Paiko M, Hashim R, Ramachandran S (2011)Effects of different dietary lipid sources in the diet forPangasius hypothalmus (Sauvage, 1878) juvenile ongrowth performance, nutrient utilization, body indices,
254

Belicka et al.: Early-life feeding in bull sharks
and muscle and liver fatty acid composition. Aquac Nutr17: 44−53
Ballantyne JS (1997) Jaws: The inside story. The metabolismof elasmobranch fishes. Comp Biochem Physiol B Bio -chem Mol Biol 118: 703–742
Barbarich BN, Willows ND, Wang L, Clandinin MT (2006)Polyunsaturated fatty acids and anthropometric indicesof children in rural China. Eur J Clin Nutr 60: 1100−1107
Branstetter S, Stiles R (1987) Age and growth-estimates ofthe bull shark, Carcharhinus leucas, from the northernGulf of Mexico. Environ Biol Fishes 20: 169−181
Briend A, Dewey KG, Reinhart GA (2011) Fatty acid statusin early life in low-income countries - overview of the sit-uation, policy and research priorities. Matern Child Nutr7: 141−148
Chasar LC, Chanton JP, Koenig CC, Coleman FC (2005)Evaluating the effect of environmental disturbance onthe trophic structure of Florida Bay, USA: multiple stableisotope analyses of contemporary and historical speci-mens. Limnol Oceanogr 50: 1059−1072
Csengeri I (1996) Dietary effects on fatty acid metabolism ofcommon carp. Arch Tierernähr 49: 73−92
Dalsgaard J, St John M, Kattner G, Muller-Navarra D,Hagen W (2003) Fatty acid trophic markers in the pelagicmarine environment. Adv Mar Biol 46: 225−340
Das UN (2006) Essential fatty acids: biochemistry, physiol-ogy, and pathology. Biotechnol J 1: 420−439
Dodds ED, McCoy MR, Rea LD, Kennish JM (2005) Gaschromatographic quantification of fatty acid methylesters: flame ionization detection vs. electron impactmass spectrometry. Lipids 40: 419−428
Dubois N, Barthomeuf C, Berge JP (2006) Convenientpreparation of picolinyl derivatives from fatty acid esters.Eur J Lipid Sci Technol 108: 28−32
Ducatez S, Dalloyau S, Richard P, Guinet C, Cherel Y (2008)Stable isotopes document winter trophic ecology andmaternal investment of adult female southern elephantseals (Mirounga leonina) breeding at the KerguelenIslands. Mar Biol 155: 413−420
Duffin K, Obukowicz M, Raz A, Shieh JJ (2000) Electro-spray/tandem mass spectrometry for quantitative analy-sis of lipid remodeling in essential fatty acid deficientmice. Anal Biochem 279: 179−188
Duncan KM, Holland KN (2006) Habitat use, growth ratesand dispersal patterns of juvenile scalloped hammer-head sharks Sphyrna lewini in a nursery habitat. MarEcol Prog Ser 312: 211−221
Eglinton G, Hamilton RJ (1967) Leaf epicuticular waxes. Science 156: 1322−1335
Farkas T, Csengeri I, Majoros F, Olah J (1977) Metabolism offatty-acids in fish. 1. Development of essential fatty-aciddeficiency in carp, Cyprinus carpio Linnaeus 1758.Aquaculture 11: 147−157
Ferretti F, Worm B, Britten GL, Heithaus MR, Lotze HK(2010) Patterns and ecosystem consequences of sharkdeclines in the ocean. Ecol Lett 13: 1055−1071
Folch J, Lees M, Sloane-Stanley GH (1957) A simple methodfor the isolation and purification of total lipids from ani-mal tissues. J Biol Chem 226: 497−509
Fry B, Sherr EB (1984) Delta-C13 measurements as indicatorsof carbon flow in marine and fresh-water ecosystems.Contrib Mar Sci 27: 13−47
Fry B, Smith TJ (2002) Stable isotope studies of red man-groves and filter feeders from the Shark River Estuary,Florida. Bull Mar Sci 70: 871−890
Fry B, Jeng WL, Scalan RS, Parker PL, Baccus J (1978) δ13Cfood web analysis of a Texas sand dune community.Geochim Cosmochim Acta 42: 1299−1302
Gonzalez-Duran E, Castell JD, Robinson SMC, Blair TJ(2008) Effects of dietary lipids on the fatty acid composi-tion and lipid metabolism of the green sea urchinStrongylocentrotus droebachiensis. Aquaculture 276: 120−129
Heithaus MR, Delius BK, Wirsing AJ, Dunphy-Daly MM(2009) Physical factors influencing the distribution of atop predator in a subtropical oligotrophic estuary. LimnolOceanogr 54: 472−482
Holman RT (1960) The ratio of trienoic: tetraenoic acids intissue lipids as a measure of essential fatty acid require-ment. J Nutr 70: 405−410
Holman RT, Smythe L, Johnson S (1979) Effect of sex andage on fatty acid composition of human serum lipids. AmJ Clin Nutr 32: 2390−2399
Howell KL, Pond DW, Billett DSM, Tyler PA (2003) Feedingecology of deep-sea seastars (Echinodermata: Aster-oidea): a fatty-acid biomarker approach. Mar Ecol ProgSer 255: 193−206
Hussey NE, Wintner SP, Dudley SFJ, Cliff G, Cocks DT,MacNeil MA (2010) Maternal investment and size-spe-cific reproductive output in carcharhinid sharks. J AnimEcol 79: 184−193
Iverson SJ, Field C, Bowen WD, Blanchard W (2004) Quan-titative fatty acid signature analysis: a new method ofestimating predator diets. Ecol Monogr 74: 211−235
Jaffe R, Mead R, Hernandez ME, Peralba MC, DiGuida OA(2001) Origin and transport of sedimentary organic matter in two subtropical estuaries: a comparative, biomarker-based study. Org Geochem 32:507–526
Jeppesen PB, Hoy CE, Mortensen PB (1998) Essential fattyacid deficiency in patients receiving home parenteralnutrition. Am J Clin Nutr 68: 126−133
Ju SJ, Kang HK, Kim WS, Harvey HR (2009) Comparativelipid dynamics of euphausiids from the Antarctic andnortheast Pacific oceans. Mar Biol 156: 1459−1473
Knoff A, Hohn A, Macko S (2008) Ontogenetic diet changesin bottlenose dolphins (Tursiops truncatus) reflectedthrough stable isotopes. Mar Mamm Sci 24: 128−137
Le HD, Meisel JA, de Meijer VE, Gura KM, Puder M (2009)The essentiality of arachidonic acid and docosa-hexaenoic acid. Prostaglandins Leukot Essent FattyAcids 81: 165−170
Logan JM, Lutcavage ME (2010) Stable isotope dynamics inelasmobranch fishes. Hydrobiologia 644: 231−244
MacNeil MA, Skomal GB, Fisk AT (2005) Stable isotopesfrom multiple tissues reveal diet switching in sharks. MarEcol Prog Ser 302: 199−206
MacNeil MA, Drouillard KG, Fisk AT (2006) Variableuptake and elimination of stable nitrogen isotopesbetween tissues in fish. Can J Fish Aquat Sci 63: 345−353
Matich P, Heithaus MR, Layman CA (2010) Size-based vari-ation in intertissue comparisons of stable carbon andnitrogen isotopic signatures of bull sharks (Carcharhinusleucas) and tiger sharks (Galeocerdo cuvier). Can J FishAquat Sci 67: 877−885
Matich P, Heithaus MR, Layman CA (2011) Contrasting pat-terns of individual specialization and trophic coupling intwo marine apex predators. J Anim Ecol 80: 294−305
McCutchan J, Lewis W, Kendall C, McGrath C (2003) Varia-tion in trophic shift for stable isotope ratios of carbon,nitrogen, and sulfur. Oikos 102: 378−390
255

Mar Ecol Prog Ser 455: 245–256, 2012
McMeans BC, Olin JA, Benz GW (2009) Stable-isotope com-parisons between embryos and mothers of a placent -atrophic shark species. J Fish Biol 75: 2464−2474
Neer JA, Thompson BA, Carlson JK (2005) Age and growthof Carcharhinus leucas in the northern Gulf of Mexico: incorporating variability in size at birth. J Fish Biol 67: 370−383
Neto R, Mead R, Louda J, Jaffe R (2006) Organic biogeo-chemistry of detrital flocculent material (floc) in a sub-tropical, coastal wetland. Biogeochemistry 77: 283−304
Newman SP, Handy RD, Gruber SH (2010) Diet and preypreference of juvenile lemon sharks Negaprion brevi-rostris. Mar Ecol Prog Ser 398: 221−234
Olin JA, Hussey NE, Fritts M, Heupel MR, SimpfendorferCA, Poulakis GR, Fisk AT (2011) Maternal meddling inneonatal sharks: implications for interpreting stable iso-topes in young animals. Rapid Commun Mass Spectrom25: 1008−1016
Pethybridge H, Daley R, Virtue P, Nichols P (2010) Lipidcomposition and partitioning of deepwater chon-drichthyans: inferences of feeding ecology and distribu-tion. Mar Biol 157: 1367−1384
Post DM, Layman CA, Arrington DA, Takimoto G, MontanaCG, Quattrochi J (2007) Getting to the fat of the matter: models, methods and assumptions for dealing with lipidsin stable isotope analyses. Oecologia 152: 179−189
Siguel EN, Chee KM, Gong JX, Schaefer EJ (1987) Criteria
for essential fatty-acid deficiency in plasma as assessedby capillary column gas-liquid-chromatography. ClinChem 33: 1869−1873
Torres-Rojas YE, Hernandez-Herrera A, Galvan-Magana F,Alatorre-Ramirez VG (2010) Stomach content analysis ofjuvenile, scalloped hammerhead shark Sphyrna lewinicaptured off the coast of Mazatlan, Mexico. Aquat Ecol44: 301−308
Wai TC, Leung KMY, Sin SYT, Cornish A, Dudgeon D,Williams GA (2011) Spatial, seasonal, and ontogeneticvariations in the significance of detrital pathways andterrestrial carbon for a benthic shark, Chiloscyllium pla-giosum (Hemiscylliidae), in a tropical estuary. LimnolOceanogr 56: 1035−1053
Whiles MR, Gladyshev MI, Sushchik NN, Makhutova ON,Kalachova GS, Peterson SD, Regester KJ (2010) Fattyacid analyses reveal high degrees of omnivory anddietary plasticity in pond-dwelling tadpoles. Freshw Biol55: 1533−1547
Wiley TR, Simpfendorfer CA (2007) The ecology of elasmo-branches occurring in the Everglades National Park,Florida: implications for conservation and management.Bull Mar Sci 80: 171−189
Williams A, Trexler J (2006) A preliminary analysis of thecorrelation of food-web characteristics with hydrologyand nutrient gradients in the southern Everglades.Hydrobiologia 569: 493−504
256
Editorial responsibility: Yves Cherel,Villiers-en-Bois, France
Submitted: July 7, 2011; Accepted: February 13, 2012Proofs received from author(s): May 8, 2012


