Embed Size (px)
Citation preview
1
Fauna species endemicity in Dry Sclerophyll bushland within the
Helidon Hills Region
M.J. Forrest
University of Queensland, Associate Degree of Applied Science.
Abstract. Fauna population dynamics change drastically after introduced fire
regimes, natural disasters and predation. Furthermore, changes in these factors alter
flora structure, composition and abundance. Planned fires help encourage plant
growth via re-seeding and reduce accumulated fuel loads. Natural processes such as
predation from introduced and native fauna species play a role in further reducing
population abundances after fire regimes. This paper discusses methods in obtaining
relevant data and reveals the current population statistics regarding total trapping
nights and the numbers of animals caught. A ‘habitat complexity score’ model sheet
was implemented to monitor the particular types of vegetation in the Helidon Hills
region where the animals were recorded.
Introduction
Dry sclerophyllous bushlands are susceptible to burning, logging and grazing practices which
in turn creates a patchy temporal mosaic which is not evenly dispersed across the landscape.
In other words it is the alteration of the vegetation structure levels after these events which
influence the vegetation regrowth phase to aging periods (Tolsma, et al. 2007).
Uncontrolled fire patterns and frequent predation can further disrupt the symbiotic
relationships between native fauna and flora species causing a reduction in rare flora endemic
to the region and in some cases the alteration of soil ph levels. This can contribute to erosion
and salinity. Many of these factors combined have a major impact on native fauna
reproduction levels and population dispersal (Nussbaumer, et al. 2012).
Continual human interference apart from natural bushfires and introduced fire regimes
contribute to the escalation and spread of patchy mosaic forests. In certain regions this can
affect the growth of flora by offering competitive advantages towards invasive species.
Characteristics prevalent with competition involve smothering understorey vegetation,
leaching moisture and nutrients from the area and reducing the light entering the understorey
layers caused by overgrown crown canopies (Burton 2005).
2
Flora community distribution represents changing animal abundance patterns that are found
in different frequencies throughout the monitored landscape (Elmouttie 2009).
To understand the complexities of animal population abundance and distribution across the
landscape it was necessary to utilise a ‘habitat complexity score’. This represented the
differing ground, understorey, flora crown compositions, litter (rocks and debris) and soil
moisture content of the trapping area landscape where the captured animals were recorded
(Machunter et al. 2009).
The abundance of animals was measured by counting the number of trapping nights either
having trapped an animal or without having trapped an animal. The total number of trapping
nights represents a longer time period which was divided by the total mean number of
animals actually caught during trapping (Forsyth et al. 2005).
To discover the Grand Mean or relative population abundance percentage in the monitored
areas from this meant applying the ANOVA technique which is discussed further in Results.
The purpose of acquiring population abundance data is mandatory since it not only estimates
numbers in relation to the period of recording, but also helps predict possible shifts in the
physical landscape and the impacts this would have on other biota in the region in 10 to 20
years time (CSIRO, n.d.).
Methods
Study Area
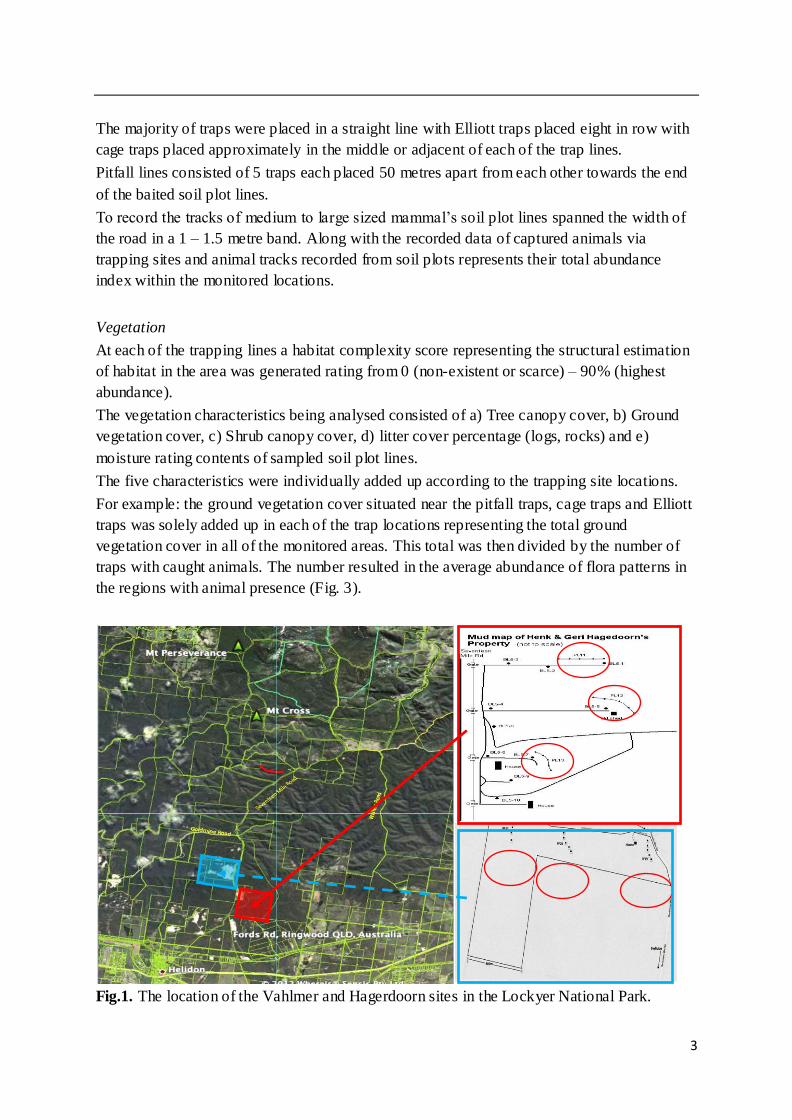
Helidon Hills is located to the South West of the Lockyer National Park covering 2,677 ha in
Queensland. The Vahlmer and Hagerdoorn properties within the Helidon Hills region were
utilised for trapping and recording data. Both properties are situated along Seventeen Mile
Road (Fig 1.). South East Queensland features a sub-humid to tropical climate and occasional
rain precipitation during the summer months. Lockyer National Park consists of dry
sclerophyllous forests consisting of different varieties of eucalypt and plant communities
dominating the landscape. Patches can be found near sandstone gorges, ridges and creek
systems (Department of National Parks, Recreation, Sport and Racing 2014).
Data Collection
Mammals
In August 2014, study sites consisted of six Pitfall lines PL1-PL3 and PL19-PL21, Elliott
lines EL1-EL8 and EL49-EL56, Cage lines CL1-CL8 and CL49-CL56, Passive soil plots
RL1 and RL7. These traps were used to record the fauna endemicity and dispersal patterns in
the Vahlmer and Hagedoorn regions.
3
The majority of traps were placed in a straight line with Elliott traps placed eight in row with
cage traps placed approximately in the middle or adjacent of each of the trap lines.
Pitfall lines consisted of 5 traps each placed 50 metres apart from each other towards the end
of the baited soil plot lines.
To record the tracks of medium to large sized mammal’s soil plot lines spanned the width of
the road in a 1 – 1.5 metre band. Along with the recorded data of captured animals via
trapping sites and animal tracks recorded from soil plots represents their total abundance
index within the monitored locations.
Vegetation
At each of the trapping lines a habitat complexity score representing the structural estimation
of habitat in the area was generated rating from 0 (non-existent or scarce) – 90% (highest
abundance).
The vegetation characteristics being analysed consisted of a) Tree canopy cover, b) Ground
vegetation cover, c) Shrub canopy cover, d) litter cover percentage (logs, rocks) and e)
moisture rating contents of sampled soil plot lines.
The five characteristics were individually added up according to the trapping site locations.
For example: the ground vegetation cover situated near the pitfall traps, cage traps and Elliott
traps was solely added up in each of the trap locations representing the total ground
vegetation cover in all of the monitored areas. This total was then divided by the number of
traps with caught animals. The number resulted in the average abundance of flora patterns in
the regions with animal presence (Fig. 3).
Fig.1. The location of the Vahlmer and Hagerdoorn sites in the Lockyer National Park.
4
Results
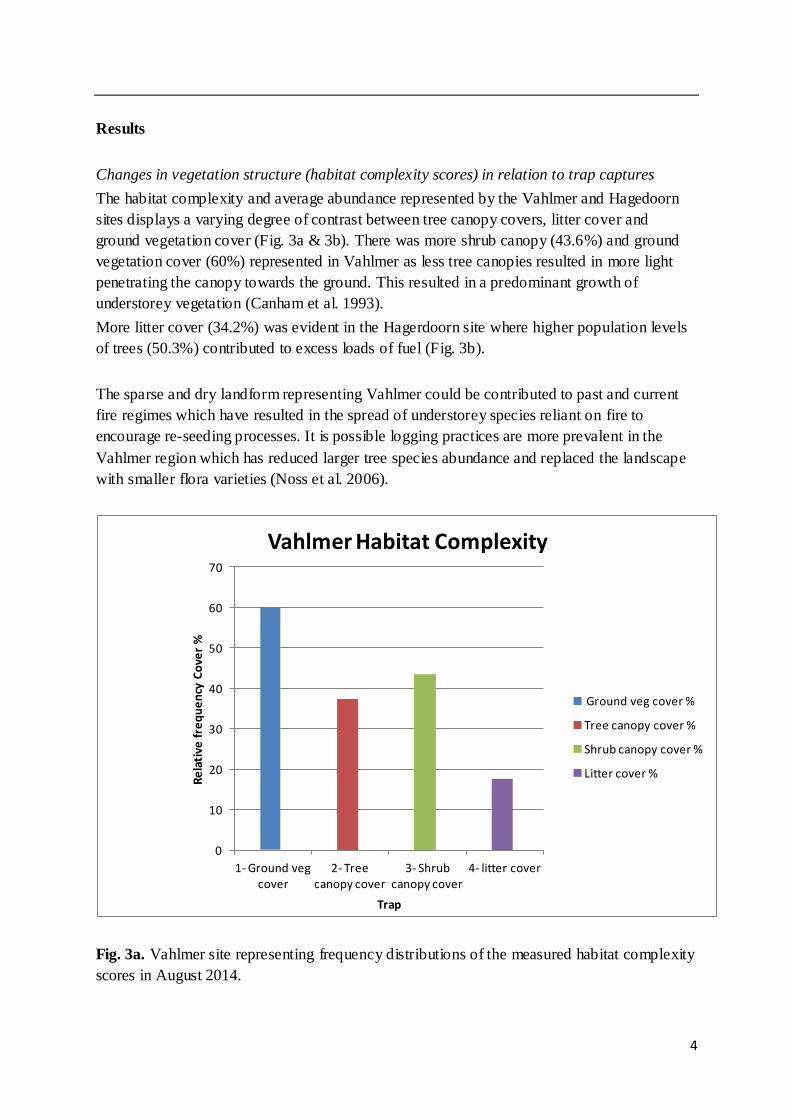
Changes in vegetation structure (habitat complexity scores) in relation to trap captures
The habitat complexity and average abundance represented by the Vahlmer and Hagedoorn
sites displays a varying degree of contrast between tree canopy covers, litter cover and
ground vegetation cover (Fig. 3a & 3b). There was more shrub canopy (43.6%) and ground
vegetation cover (60%) represented in Vahlmer as less tree canopies resulted in more light
penetrating the canopy towards the ground. This resulted in a predominant growth of
understorey vegetation (Canham et al. 1993).
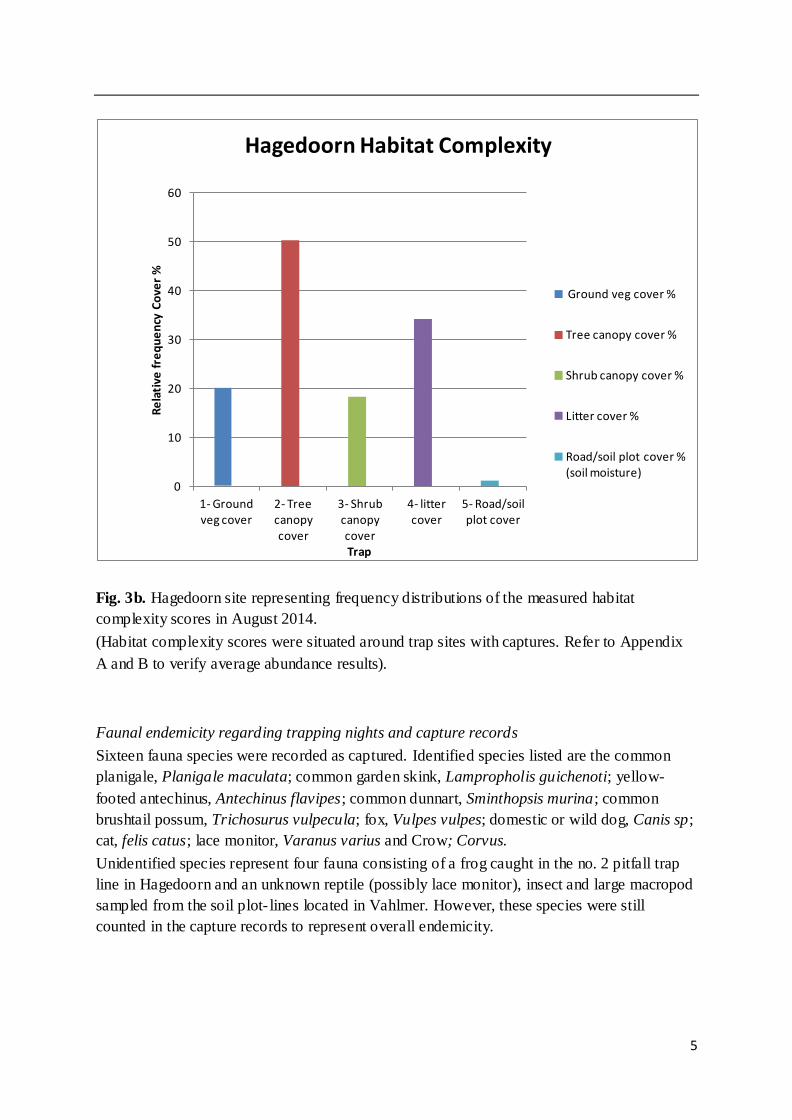
More litter cover (34.2%) was evident in the Hagerdoorn site where higher population levels
of trees (50.3%) contributed to excess loads of fuel (Fig. 3b).
The sparse and dry landform representing Vahlmer could be contributed to past and current
fire regimes which have resulted in the spread of understorey species reliant on fire to
encourage re-seeding processes. It is possible logging practices are more prevalent in the
Vahlmer region which has reduced larger tree species abundance and replaced the landscape
with smaller flora varieties (Noss et al. 2006).
Fig. 3a. Vahlmer site representing frequency distributions of the measured habitat complexity
scores in August 2014.
0
10
20
30
40
50
60
70
1- Ground veg cover
2- Tree canopy cover
3- Shrub canopy cover
4- litter cover
Re
lati
ve f
req
ue
ncy
Co
ver
%
Trap
Vahlmer Habitat Complexity
Ground veg cover %
Tree canopy cover %
Shrub canopy cover %
Litter cover %
5
Fig. 3b. Hagedoorn site representing frequency distributions of the measured habitat
complexity scores in August 2014.
(Habitat complexity scores were situated around trap sites with captures. Refer to Appendix
A and B to verify average abundance results).
Faunal endemicity regarding trapping nights and capture records
Sixteen fauna species were recorded as captured. Identified species listed are the common
planigale, Planigale maculata; common garden skink, Lampropholis guichenoti; yellow-
footed antechinus, Antechinus flavipes; common dunnart, Sminthopsis murina; common
brushtail possum, Trichosurus vulpecula; fox, Vulpes vulpes; domestic or wild dog, Canis sp;
cat, felis catus; lace monitor, Varanus varius and Crow; Corvus.
Unidentified species represent four fauna consisting of a frog caught in the no. 2 pitfall trap
line in Hagedoorn and an unknown reptile (possibly lace monitor), insect and large macropod
sampled from the soil plot- lines located in Vahlmer. However, these species were still
counted in the capture records to represent overall endemicity.
0
10
20
30
40
50
60
1- Ground veg cover
2- Tree canopy cover
3- Shrub canopy cover
4- litter cover
5- Road/soil plot cover
Re
lati
ve f
req
ue
ncy
Co
ver
%
Trap
Hagedoorn Habitat Complexity
Ground veg cover %
Tree canopy cover %
Shrub canopy cover %
Litter cover %
Road/soil plot cover % (soil moisture)
6
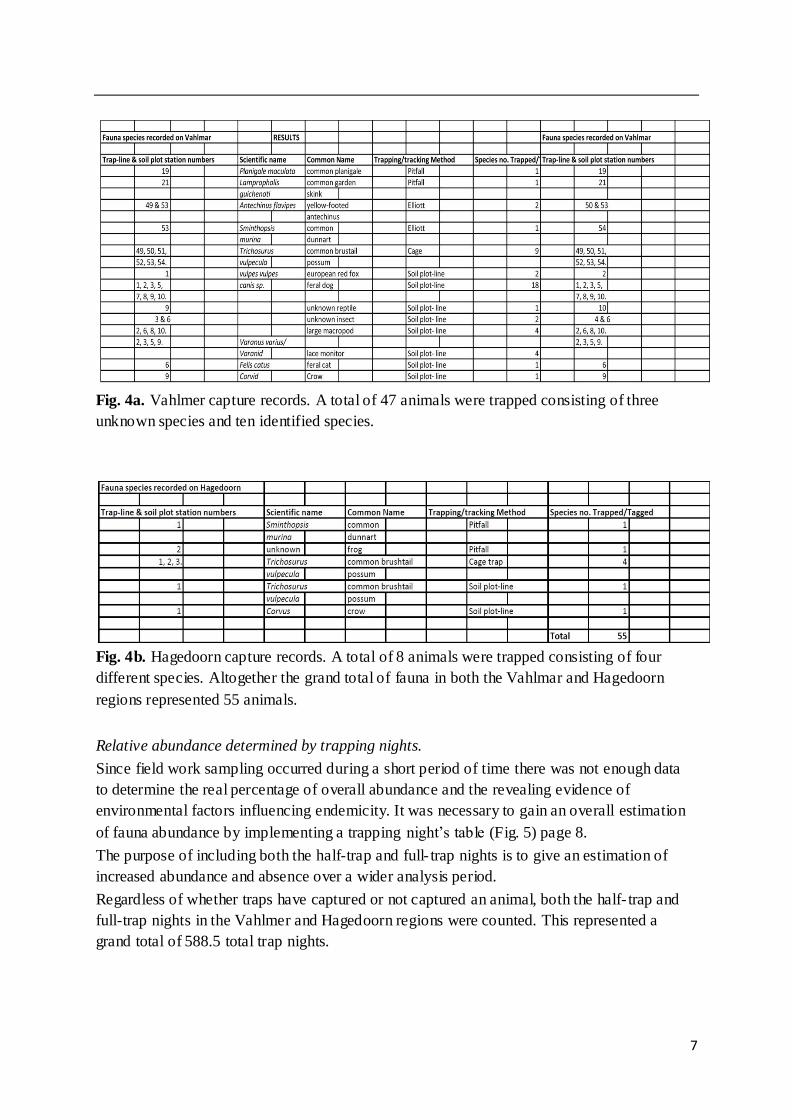
It was clear Vahlmer represented the most fauna abundance in trap-line sections throughout
the selected sites. Altogether a total of 47 trapped animals consisting of three unknown
species and 10 identified species were recorded (Fig. 4a) page 7.
During the same period of sampling in Vahlmer, 8 animals representing 4 different species
were trapped in Hagedoorn (Fig. 4b) page 7.
Comparing the Habitat Complexity results with fauna endemicity has revealed an interesting
correlation between distribution patterns and abundance.
Vahlmer with high levels of ground vegetation cover and medium shrub canopy coverage
without a large presence of tree canopies seems to be the main preference for a larger
population abundance of animals (Garden et al. 2007).
The possibilities for this represent many variables. Fire regimes may have been present some
time ago in the Hagedoorn region which might have reduced the necessary levels of foliage
cover needed for animals to live and any available food resources for them to survive
adequately. Therefore, a transition towards appropriate habitat levels in the Vahlmer region
with available food sources may be necessary for most animals to survive (Creighton et al.
1997).
Predation levels are inevitable during fire regimes since species such as the fox Vulpes
vulpes, cat Felis catus, dog Canis sp. including raptors and particular snake species prefer to
prey upon animals which have been displaced from their habitat. If there is less of an
abundance of animals in a particular habitat after a fire regime predators will target areas
which contain more fauna diversity (Reaveley et al. 2009).
These factors are represented in (Fig. 4a & Fig. 4b). Vahlmer during the sampling period
collected an estimated total of 25 predators consisting of 4 different species monitored on soil
plots. Most of the common species were the dog Canis sp. with 18 monitored, the lace
monitor Varanus varius with 4 monitored, fox Vulpes vulpes with 2 and the feral cat felis
catus with only 1 sampled. The amount of tracks monitored on soil plots could represent
avoidance techniques and opportunistic patterns.
Hagedoorn did not possess any known species of predator which have been recorded in
Vahlmer during the same period apart from 1 sampled crow Corvis.
There appeared to be nearly twice the number of common brushtail possums Trichosurus
vulpecula. Nine were found in Vahlmer compared to Hagedoorn which had five. It was
discovered the species may prefer to be in areas with sufficient ground and shrub canopy
cover with a substantial amount of tree canopy foliage. This could be in relation to the animal
relying on lower vegetation cover to evade predators while in the process of searching for
available food sources in close proximity to the ground (Bennett et al.1999).
7
Fig. 4a. Vahlmer capture records. A total of 47 animals were trapped consisting of three
unknown species and ten identified species.
Fig. 4b. Hagedoorn capture records. A total of 8 animals were trapped consisting of four
different species. Altogether the grand total of fauna in both the Vahlmar and Hagedoorn
regions represented 55 animals.
Relative abundance determined by trapping nights.
Since field work sampling occurred during a short period of time there was not enough data
to determine the real percentage of overall abundance and the revealing evidence of
environmental factors influencing endemicity. It was necessary to gain an overall estimation
of fauna abundance by implementing a trapping night’s table (Fig. 5) page 8.
The purpose of including both the half-trap and full- trap nights is to give an estimation of
increased abundance and absence over a wider analysis period.
Regardless of whether traps have captured or not captured an animal, both the half- trap and
full-trap nights in the Vahlmer and Hagedoorn regions were counted. This represented a
grand total of 588.5 total trap nights.

8
Fig. 5. Vahlmer and Hagedoorn trapping tables. Presented data represents half and full
trapping nights over a short allocated time frame.
Relative abundance using the Grand Mean (ANOVA) test.
The overall relative population abundance was estimated using the ANOVA technique to
discover x= the Grand Mean.
To achieve this ratio animals from both sites were separated into their species sub-groups and
totalled representing 55 animals altogether.
This figure was divided by the grand total of trapping nights consisting of 588.5 trap nights
presented as an equation on page 9.
9
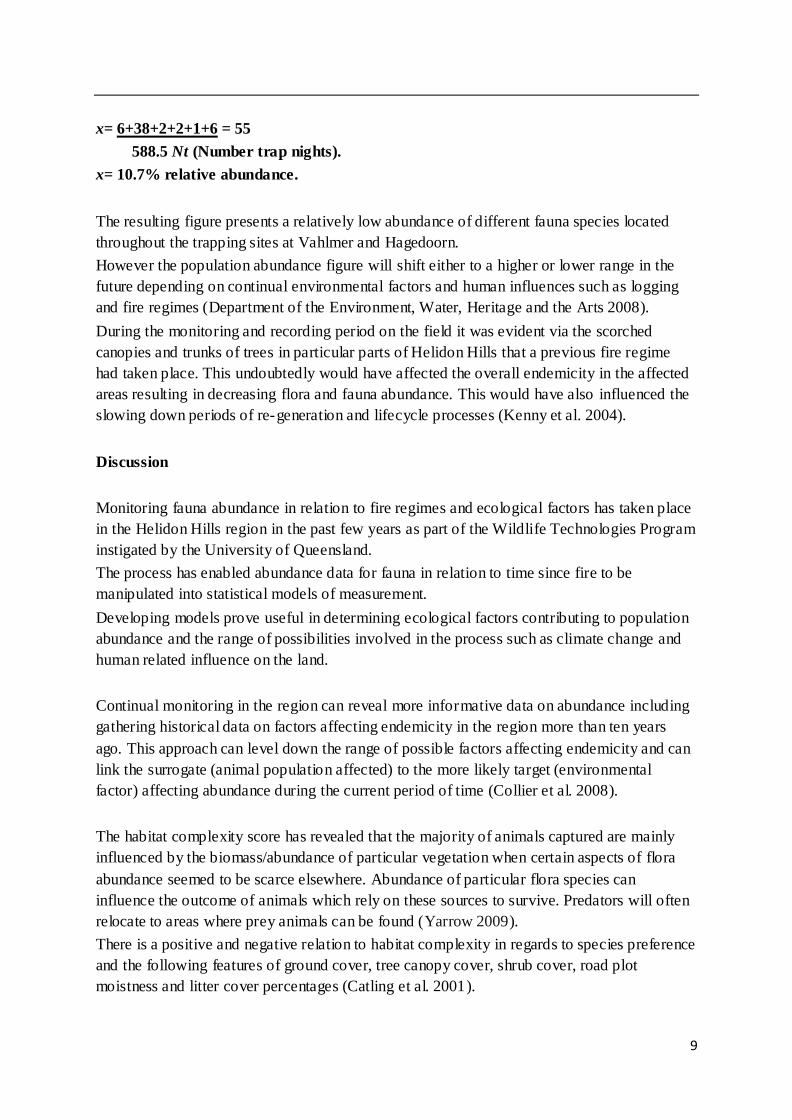
x= 6+38+2+2+1+6 = 55
588.5 Nt (Number trap nights).
x= 10.7% relative abundance.
The resulting figure presents a relatively low abundance of different fauna species located
throughout the trapping sites at Vahlmer and Hagedoorn.
However the population abundance figure will shift either to a higher or lower range in the
future depending on continual environmental factors and human influences such as logging
and fire regimes (Department of the Environment, Water, Heritage and the Arts 2008).
During the monitoring and recording period on the field it was evident via the scorched
canopies and trunks of trees in particular parts of Helidon Hills that a previous fire regime
had taken place. This undoubtedly would have affected the overall endemicity in the affected
areas resulting in decreasing flora and fauna abundance. This would have also influenced the
slowing down periods of re-generation and lifecycle processes (Kenny et al. 2004).
Discussion
Monitoring fauna abundance in relation to fire regimes and ecological factors has taken place
in the Helidon Hills region in the past few years as part of the Wildlife Technologies Program
instigated by the University of Queensland.
The process has enabled abundance data for fauna in relation to time since fire to be
manipulated into statistical models of measurement.
Developing models prove useful in determining ecological factors contributing to population
abundance and the range of possibilities involved in the process such as climate change and
human related influence on the land.
Continual monitoring in the region can reveal more informative data on abundance including
gathering historical data on factors affecting endemicity in the region more than ten years
ago. This approach can level down the range of possible factors affecting endemicity and can
link the surrogate (animal population affected) to the more likely target (environmental
factor) affecting abundance during the current period of time (Collier et al. 2008).
The habitat complexity score has revealed that the majority of animals captured are mainly
influenced by the biomass/abundance of particular vegetation when certain aspects of flora
abundance seemed to be scarce elsewhere. Abundance of particular flora species can
influence the outcome of animals which rely on these sources to survive. Predators will often
relocate to areas where prey animals can be found (Yarrow 2009).
There is a positive and negative relation to habitat complexity in regards to species preference
and the following features of ground cover, tree canopy cover, shrub cover, road plot
moistness and litter cover percentages (Catling et al. 2001).
10
In this paper the variable models developed were the habitat complexity score graph and the
ANOVA technique which displayed the overall relative abundance by dividing the total
rounded fauna population in both the Vahlmer and Hagedoorn sites to the total trapping
nights of both regions.
It is evident the gathered results in this paper only reflect the current trend affecting
population abundance in Helidon Hills. For this reason repeat observations and sampling will
have to be conducted in the future to analyse any decrease or increase in fauna and flora
population dynamics. Due to the rapidly changing diversity of the landscape it may prove
difficult to repeat the exact same quantifiable measurements that had taken place to gather
this data.
It is recommended other models of measuring diversity should be consorted if there proves to
be no relevant data to obtain over a period of time in the future.
Incorporating time series analysis measurements may prove useful in obtaining more
proficient, informative and relevant data (Catling et al. 2001).
The adopted models revealed the different responses displayed by the possum, feral dog and
lace monitor for a preference of undisturbed habitats featuring medium to dense shrub and
ground vegetation cover including low litter cover as represented in Vahlmer.
There was no prediction for the animals scarce in abundance such as the planigale, skink,
yellow-footed antechinus, common dunnart, fox, un-named insect and macropod, feral cat,
frog or crow since it would take a longer period of trapping nights to verify any distinct
change in their behaviour patterns.
The problem which was prevalent when sampling data at the research sites was the time and
team effort required to accumulate enough population abundance data to be used to form a
general hypothesis. In this case it may be necessary to incorporate other methods of analysis
by using satellite imagery of the property’s landscape to gain an accurate prediction of habitat
complexity scores to make measuring fauna abundance out on the field less time-consuming
and more focus driven (Parks and Wildlife Service 2014).
It is vital to present this research information to clients who need to utilise the data to better
understand the ecological processes affecting the stakeholders land. To ensure bio-diversity
in the adjoining Helidon Hills region is not affected by the client’s actions it is necessary to
set a number of recommendations for clients to implement accordingly into their work
schedule. Agricultural practices involving crop production, herbicide and pesticide use may
affect regional diversity in Helidon Hills from particles being spread by wind gusts (Strategic
Planning & Development Policy Committee 2012).
11
Livestock grazing, logging and inappropriate fire regimes may further displace native flora
and fauna if continued over a longer period of time (Environment Protection and Biodiversity
Conservation Act 1999).
Clients should collaborate with researchers and share information regarding periods of
agricultural practices taking place. This so an appropriate limitation on logging production
yield and livestock grazing in the Vahlmer and Hagedoorn areas during specific times can
take place. A reduction in the use of chemical applications during certain periods of time to
limit the likelihood of particles being transferred by wind to segments of the national park is
another step to be considered by stakeholders.
Acknowledgements
Thanks go to Luke Leung (Wildlife Technologies program course co-ordinator), Sonya
Fardell (Technical Support), Justin Hechinger and Melanie Mills (Research undergraduate
students) for their statistical knowledge and support during the data collection period and to
the Vahlmer and Hagedoorn residents for allowing research teams access to the sites on their
properties in the Lockyer National Park region. The Queensland Parks and Wildlife Service
have provided me with useful information on the effect of fire regimes on fauna and flora
biodiversity.
Additional information and advice was gathered prior to conducting the fauna and flora
abundance analysis regarding population statistics from Dr. Peter Elsworth (Experimentalist
for the Robert Wicks Pest Animal Research Centre, Biosecurity Queensland, Department of
Agriculture, Fisheries and Forestry).
12
References
Bennett A & Platt S 1999, ‘Farm planning and wildlife’, Land for Wildlife Notes,
Department of Natural Resources and Environment VIC, pp. 1-12,
http://www.swifft.net.au/resources/22_farm%20planning%20and%20wildlife.pdf
Burton R 2005, ‘Recovering Bushland on the Cumberland Plain’, - Best practice guidelines
for the management and restoration of bushland, Department of Environment and
Conservation NSW,
http://www.environment.nsw.gov.au/resources/nature/RecoveringCumberlandPlain.pdf
Canham C & Burbank D 1993, ‘Causes and consequences of resource heterogene ity in
forests’, - Interspecific variation in light transmission by canopy trees, vol. 24, pp. 337-49,
http://www.sortiend.org/lme/Likelihood%20Applications%20in%20Ecology/Canham_et_al_
1994_GMF_light.pdf
Catling PC, Coops NC & Burt RJ 2001, ‘The distribution and abundance of ground-dwelling
mammals in relation to time since wildfire and vegetation structure in south-eastern
Australia’, Wildlife Research, Vol. 28, CSIRO, pp. 555-64.
Collier N, Mackay DA & Benkendorff K 2008, 'Is relative abundance a good indicator of
population size? - Evidence from fragmented populations of a specialist butterfly
(Lepidoptera: Lycaenidae)', Population Ecology, vol. 50, no. 1, pp. 17-23.
http://epubs.scu.edu.au/cgi/viewcontent.cgi?article=1034&context=merc_pubs
Creighton JH & Baumgartner DM 1997, ‘Wildlife Ecology and Forest Habitat’, Washington
State University and the College of Agriculture and Home Economics,
http://cru.cahe.wsu.edu/CEPublications/eb1866/eb1866.pdf
CSIRO, n.d. ‘Vegetation Loss and Degradation’, - Chapter 9, Practical Conservation Biology,
pp. 229-54,
http://www.publish.csiro.au/onborrowedtime/docs/pcb_ch09.pdf
Department of National Parks, Recreation, Sport and Racing 2014, ‘About Lockyer’
Queensland Government, http://www.nprsr.qld.gov.au/parks/lockyer/about.html
13
Department of the Environment, Water, Heritage and the Arts 2008, Assessment of
Australia’s Terrestrial Biodiversity 2008, ‘Chapter 5 - Threats to Australian
Biodiversity’, pp. 149 – 212,
http://www.environment.gov.au/system/files/resources/e9f0d376-78eb-45cc-9359-
797c6b0f72ff/files/chapter5.pdf
Elmouttie D 2009, Utilisation of seed resources by small mammals, - ‘A two-way
interaction’, School of Natural Resource Sciences, Queensland University of Technology,
Brisbane, Australia,
http://eprints.qut.edu.au/30239/1/David_Elmouttie_Thesis.pdf
Environment Protection and Biodiversity Conservation Act 1999 (EPBC Act),
Draft Conservation Advice for Shale Sandstone Transition Forest in the Sydney Basin
Bioregion, pp. 1-48.
Forsyth, D. Robley, A & Reddiex B 2005, ‘Review of methods used to estimate the
abundance of feral cats’, Final Report for the Australian Government Department of the
Environment and Heritage, Arthur Rylah Institute for Environmental Research,
Department of Sustainability and Environment, Melbourne,
http://www.environment.gov.au/system/files/resources/20855c98-c575-4130-9a23-
c54200526a2a/files/feral-cats-review.pdf
Garden JG, McAlpine CA, Possingham HP & Jones DN 2007, ‘Habitat structure is more
important than vegetation composition for local- level management of native terrestrial reptile
and small mammal species living in urban remnants’, A case study from Brisbane, Australia,
Ecological Society of Australia, Austral Ecology, pp.669–85,
http://www.uq.edu.au/spatialecology/docs/Publications/2007_Garden_etal_StructureVsComp
osition.pdf
Kenny B, Sutherland E, Tasker E & Bradstock R 2004, ‘Guides for ecologically sustainable
fire management’, NSW Biodiversity Strategy, Bushfire Research Unit, Biodiversity
Research & Management Division, NSW National Parks and Wildlife Service,
http://www.environment.nsw.gov.au/resources/biodiversity/FireGuidelinesReport.pdf
Machunter J, Menkhorst P & Loyn R 2009, ‘Towards a process for integrating vertebrate
fauna into fire management planning’, Department of Sustainability and Environment, Arthur
Rylah Institute for Environmental Research, Technical Report Series No. 192, State
Government Victoria.
14
Noss RF, Franklin JF, Baker WL, Schoennage T & Moyle PB 2006, ‘Ecology and
Management of Fire-prone Forests of the Western United States’, Society for Conservation
Biology Scientific Panel on Fire in Western U.S. Forests, North American Section, Arlington,
http://www.conbio.org/images/content_policy/2006-
8_SCB_NA_Statement_Wildland_Fire.pdf
Nussbaumer Y, Castor C & Cole M 2012, ‘Establishing Native Vegetation’,-
Principles and Interim Guidelines for Soil Placement Areas and Restoration Lands,
Centre for Sustainable Ecosystem Restoration, the University of Newcastle, Australia,
http://www.newcastle.edu.au/Resources/Research%20Centres/CSER/Master%20Document%
20-%20Establishing%20Native%20Vegetation.pdf
Parks and Wildlife Service 2014, Evaluation Report: ‘Macquarie Island Pest Eradication Project’, August 2014, Department of Primary Industries, Parks, Water and Environment.
Hobart Tasmania, http://www.parks.tas.gov.au/file.aspx?id=31160
Reaveley A, Bettink K & Valentine L 2009, Biodiversity values and threatening processes of
the Gnangara groundwater system, ‘Chapter Eight - Impacts of Introduced Species on
Biodiversity’, Gnangara Sustainability Strategy – Biodiversity Report, Department of
Environment and Conservation WA,
http://www.water.wa.gov.au/sites/gss/Content/reports/Chapter%208%20Impacts%20of%20In
troduced%20Species%20on%20Biodiversity.pdf
Strategic Planning & Development Policy Committee 2012, Council Policy-‘Buffers’, SER-01, Planning & Development Services, Adelaide Hills Council, http://www.ahc.sa.gov.au/ahc-
council/Documents/Strategies%20Policies%20and%20Plans/Service%20Policies/Buffers%20120417.pdf
Tolsma A, Cheal D & Brown G 2007, ‘Ecological Burning in Box-Ironbark Forests’,
Phase 2 - Management Strategy, Arthur Rylah Institute for Environmental Research,
Department of Sustainability and Environment, Victoria,
http://www.nccma.vic.gov.au/library/scripts/objectifyMedia.aspx?file=KMSMedia/pdf/18/40
.pdf&fileName=
Yarrow G 2009, ‘Habitat Requirements of Wildlife: Food, Water, Cover and Space ’, Extension Forestry & Natural Resources, Wildlife Specialist, Fact Sheet 14, May 2009,
http://www.clemson.edu/extension/natural_resources/wildlife/publications/fs14_habitat_requi
rements.html
15
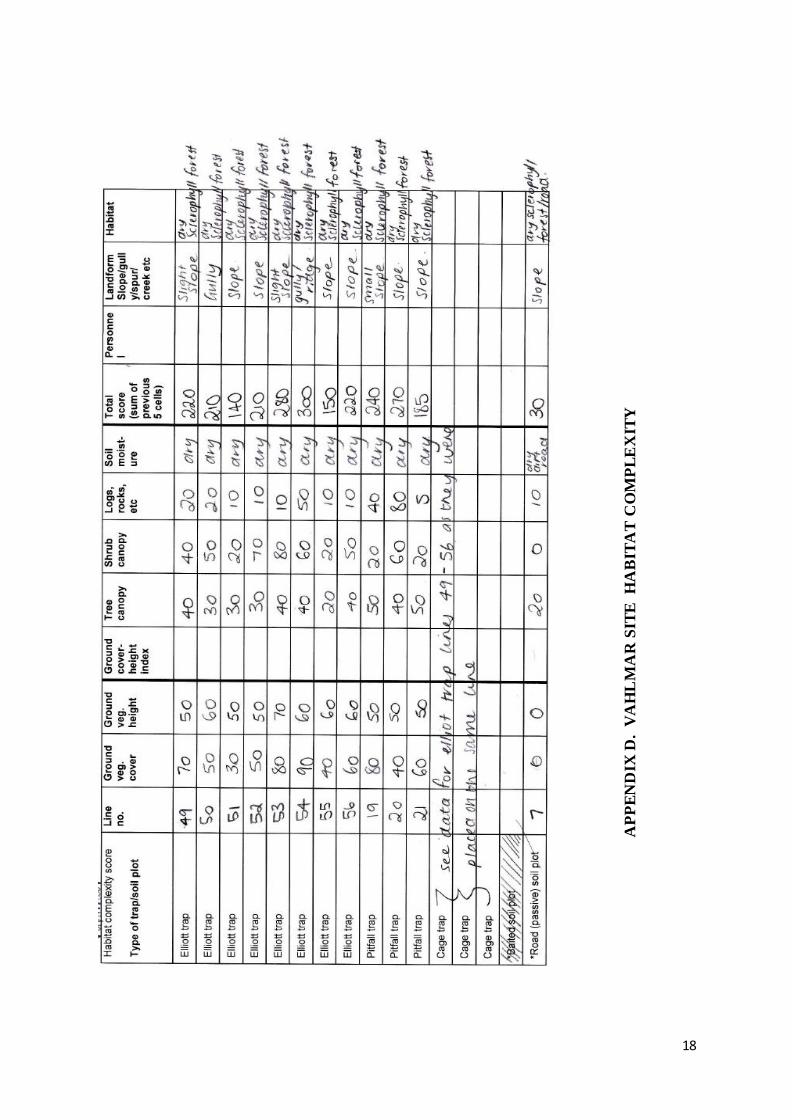
Appendices
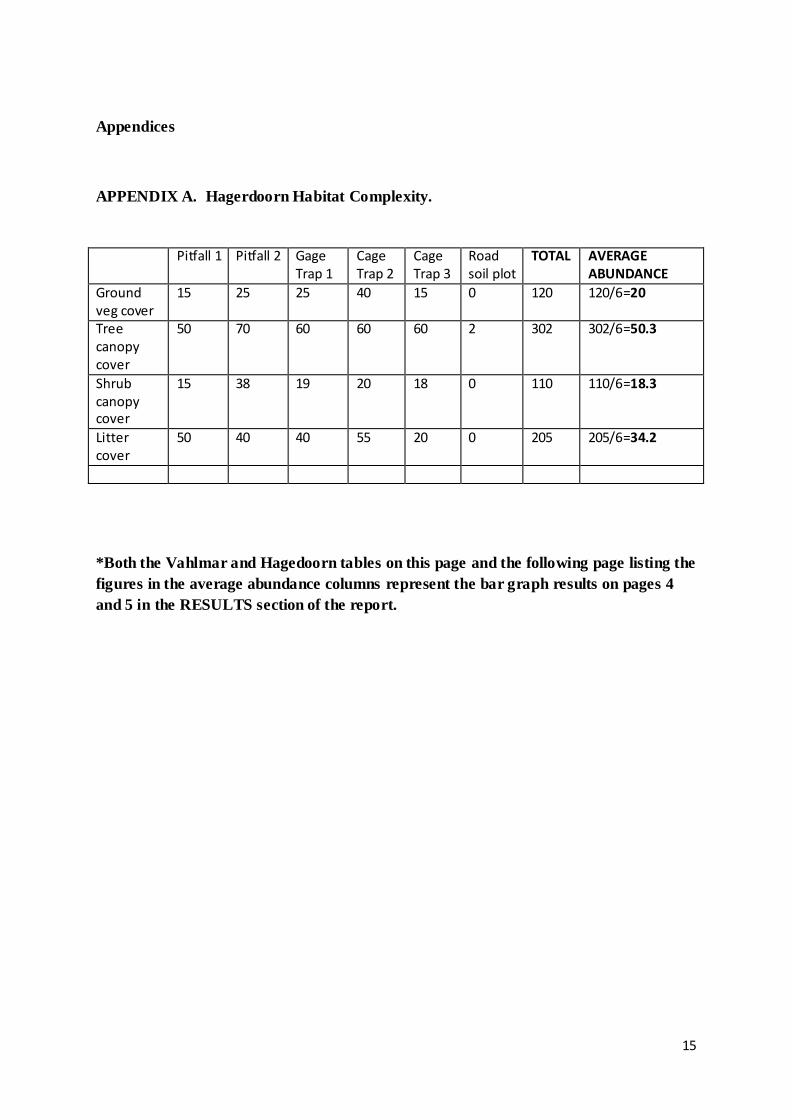
APPENDIX A. Hagerdoorn Habitat Complexity.
*Both the Vahlmar and Hagedoorn tables on this page and the following page listing the
figures in the average abundance columns represent the bar graph results on pages 4
and 5 in the RESULTS section of the report.
Pitfall 1 Pitfall 2 Gage Trap 1
Cage Trap 2
Cage Trap 3
Road soil plot
TOTAL AVERAGE ABUNDANCE
Ground veg cover
15 25 25 40 15 0 120 120/6=20
Tree canopy cover
50 70 60 60 60 2 302 302/6=50.3
Shrub canopy cover
15 38 19 20 18 0 110 110/6=18.3
Litter cover
50 40 40 55 20 0 205 205/6=34.2
16
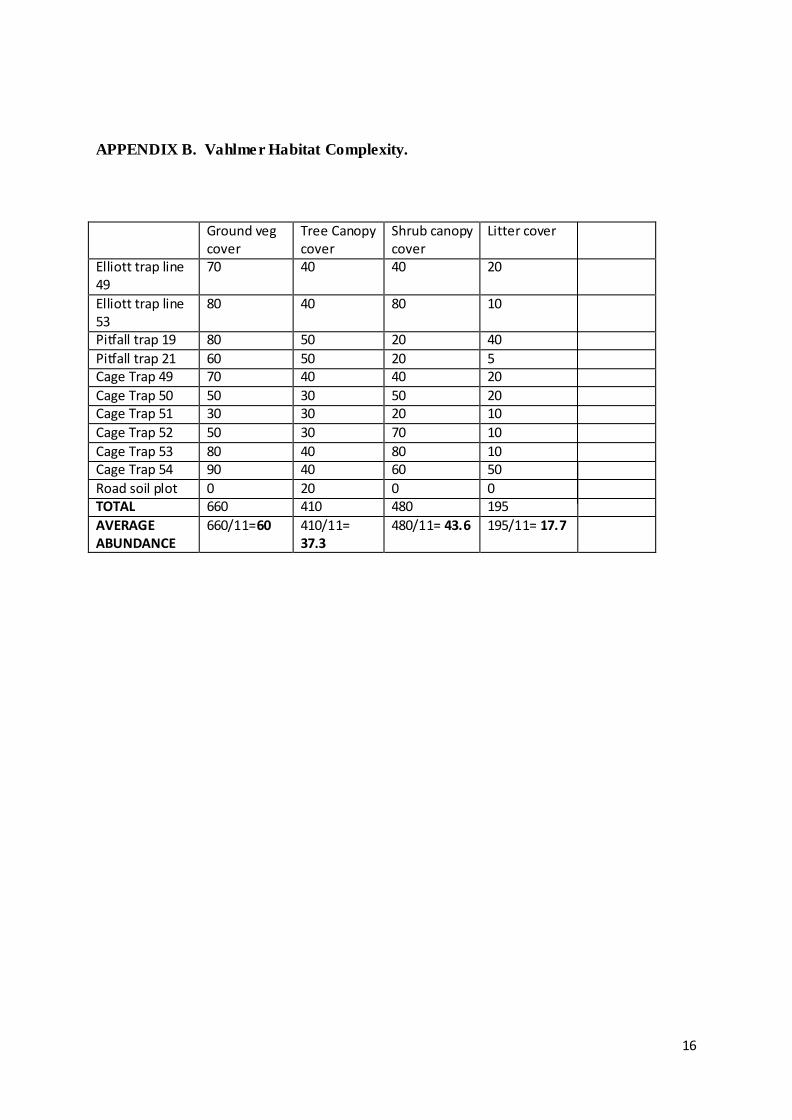
APPENDIX B. Vahlmer Habitat Complexity.
Ground veg cover
Tree Canopy cover
Shrub canopy cover
Litter cover
Elliott trap line 49
70 40 40 20
Elliott trap line 53
80 40 80 10
Pitfall trap 19 80 50 20 40
Pitfall trap 21 60 50 20 5 Cage Trap 49 70 40 40 20
Cage Trap 50 50 30 50 20 Cage Trap 51 30 30 20 10
Cage Trap 52 50 30 70 10
Cage Trap 53 80 40 80 10 Cage Trap 54 90 40 60 50
Road soil plot 0 20 0 0 TOTAL 660 410 480 195
AVERAGE ABUNDANCE
660/11=60 410/11= 37.3
480/11= 43.6 195/11= 17.7
17
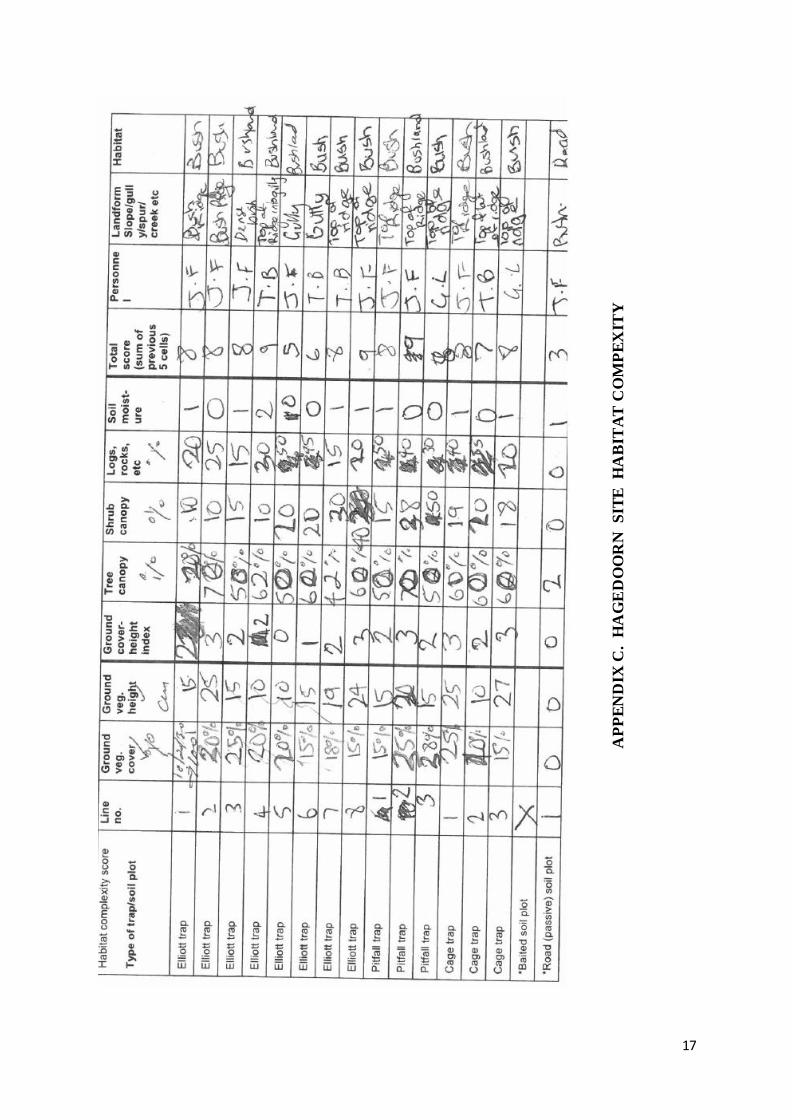
AP
PE
ND
IX C
. H
AG
ED
OO
RN
S
ITE
H
AB
ITA
T C
OM
PE
XIT
Y
18
AP
PE
ND
IX D
. V
AH
LM
AR
SIT
E H
AB
ITA
T C
OM
PL
EX
ITY


