Embed Size (px)
Citation preview


FEAST OR FAMINE: THE DIETARY ROLE OF RABDOTUS SPECIES SNAILS IN
PREHISTORIC CENTRAL TEXAS
APPROVED BY SUPERVISING COMMITTEE:
________________________________________ Robert J. Hard, Chair
________________________________________ Laura J. Levi
________________________________________ Steve A. Tomka
Accepted: ________________________________________ Dean of Graduate Studies
FEAST OR FAMINE: THE DIETARY ROLE OF RABDOTUS SPECIES SNAILS IN
PREHISTORIC CENTRAL TEXAS
by
ANDREW F. MALOF, B.A.
THESIS Presented to the Graduate Faculty of
The University of Texas at San Antonio in Partial Fulfillment of the Requirements
for the Degree of
MASTER OF ARTS IN ANTHROPOLOGY
THE UNIVERSITY OF TEXAS AT SAN ANTONIO
College of Liberal and Fine Arts Department of Anthropology
December 2001

ACKNOWLEDGMENTS
This project was conceived in 1995 while assisting University of Texas at Austin Graduate
Student John Voltin with test-level excavations at site 41BL116, when I was struck by the
quantity and diversity of the snails present. In 1998 John graciously granted permission for
my use of site data to pursue my research interests. It was at this time that J. L. “Michael”
Williams began expanding a single 1 x 1 m test pit into a more comprehensive block
excavation, creating momentum that was instrumental towards maintaining meaningful
levels of investigation at the site. With the enthusiastic cooperation and assistance of both
her and Christine Gauger a comprehensive data recovery program was initiated. Numerous
volunteers have assisted throughout the past three years, most notably Bonnie Shanks,
Allison Radke, Dannie Malof, Carol Macauley, George Thomas, and Steve Davis. Mr.
Tommy Blanton of the nearby Peaceable Kingdom has provided logistical support on many
occasions, and of extreme value, has placed a priority on monitoring the site for thieves and
trespassers. A special debt of gratitude is owed to Mr. Jim Bowmer, whose unqualified
support and unbounded interest regarding the information contained within his property has
provided us the opportunity to learn and grow both archaeologically and personally. Mr.
Daniel Prikryl provided aid in the form of lengthy discussions and personal support. Mr.
Kenneth Brown provided valuable assistance and advice as well, especially as I began to
grapple with the nuances of snail identification. I of course would like to thank my
committee members, Dr. Robert Hard, Dr. Laura Levi, and Dr. Steve Tomka. Their various
strengths and interests provided me with tools and insights that have made this thesis both a
challenge to prepare and a joy to finish. This list would not be complete without
iii

acknowledging the late Mr. Bruce Nightengale. He provided opportunities I never
expected, and taught me without letting me know he was doing so. Thanks Bruce. And
finally, my son Jacob, who still shakes his head in wonderment at the thought of counting
all those snails, and my parents, who, in many more ways than one, made this possible.
December, 2001
iv
FEAST OR FAMINE: THE DIETARY ROLE OF RABDOTUS SPECIES SNAILS IN
PREHISTORIC CENTRAL TEXAS
Andrew F. Malof, M.A. The University of Texas at San Antonio, 2001
Supervising Professor: Robert J. Hard
Snails are a common element in many Central Texas archaeological sites. Members of the
Rabdotus family are often assumed to be present due to a role in the subsistence strategies
of local inhabitants, however, little work has been specifically designed towards clarifying
and supporting this contention. Concepts of optimal foraging theory provide a means by
which the role of these snails can be explored through examining balances of energy
required for organisms to maintain reproductive potential. As human use and
understanding of energy is the focus of the theoretical approach, a history of its role in
anthropological thought is presented, thus placing the use of optimal foraging concepts in
perspective. The presence of snails, meanwhile, has certainly not gone unnoticed by
archaeologists, and they have been used for a variety of analytical purposes. Understanding
these uses allows a more thoughtful approach to future studies. Snails have limited
distributions, and Rabdotus are no exception. Recognizing their environmental parameters
provides an opportunity to more closely link their presence to various aspects of human
behavior, especially when placed within a larger, comparative context. Assumptions of
snail consumption are an insufficient supportive mechanism, and empirical, quantitative
means of discerning signatures of human use are necessary. A step-by-step process for
v

differentiating between naturally occurring and culturally modified assemblages has been
established, and can be used anywhere Rabdotus snails are present in statistically valid
numbers. If snails are found to have a different population structure within archaeological
sites, human consumption is not yet strongly supported. The nutritional content of one
species of Rabdotus is therefore presented, which when combined with experimental
gathering data, allows the snail to be ranked with other possible food sources. This in turn
creates potential for additional insight into of aspects of social organization, particularly
those that can be associated with subsistence level activities. By more clearly
understanding one particular type of behavior, a greater depth of general knowledge is
obtained.
vi

TABLE OF CONTENTS
Acknowledgments ..........................................................................................................iii Abstract ..........................................................................................................................v List of Figures.................................................................................................................viii List of Tables..................................................................................................................x Chapter 1. Introduction..................................................................................................1 Chapter 2. A Short History of Anthropological Studies of Energy...............................6 Chapter 3. Texas Snails .................................................................................................25 Chapter 4. Defining the Study Area ..............................................................................36 Chapter 5. An Exercise in Model Construction.............................................................52 Chapter 6. Quantifying Snail Populations .....................................................................62 Chapter 7. Return Rates of Snails..................................................................................82 Chapter 8. Conclusions..................................................................................................103 References Cited.............................................................................................................118 Vita
vii

LIST OF FIGURES Figure 1. Location of site 41BL116 in Central Texas ...................................................37 Figure 2. Comparing adult and juvenile Rabdotus. Numbers 1-5 are explained in text. Numbers 6 and 7 illustrate measurement points for width (diameter) and height, respectively. Scale in cm. ...........................................69 Figure 3. Comparing height and width between adults and juveniles from 315 shells sorted out of 1/4 inch screen from the BFL2 collection........................73 Figure 4. Control BFL2 sample approximating a 50% natural death assemblage. Note that the number of juveniles was adjusted from 173 to 142 in order to create a true 50% comparative ratio. The total BFL2 sample is compared below...............................................................................................74 Figure 5. Control BFL2 sample approximating a 50% natural death assemblage, with the combined mean of the adult and juvenile populations added............75 Figure 6. Control BFL2 sample approximating a 50% natural death assemblage with actual death assemblage from 1/4 inch screen sort added and compared to the combined mean of the adult and juvenile populations (TotalMean). ................................................................................75 Figure 7. The 50/50 Site Sample (Modeled Natural Population), comparing adult, juvenile, and total mean width-to-height ratios. ....................................76 Figure 8. The 50/50 Site Sample (MNP) as in Figure 7, with the 5% Site Sample representing the Actual Site Population (ASP) added........................77 Figure 9. Comparing an MNP (adult, juvenile, and 50% test) with the actual assemblage of live snails from the BFL1 collection. ............................78 Figure 10. Comparing an MNP (adult, juvenile, and 50% test) with the actual assemblage of shells from the Off-Site ST collection ..........................79 Figure 11. Comparing an MNP (adult, juvenile, and 50% test) with the actual assemblage of snail shells from the Off-Site2 collection......................81 Figure 12. Linear regression and best fit line comparing numbers of Rabdotus to numbers of mussels per level. .....................................................94 Figure 13. Linear regression and best fit line comparing time spent in each patch and the number of snails collected. ...........................................107
viii

Figure 14. Linear regression and best fit line comparing time spent in each patch and the number of snails collected. ...........................................108 Figure 15. Linear regression and best fit line comparing time spent in each patch and the number of snails collected per square meter (density). ..............................................................................109 Figure 16. Linear regression and best fit line comparing the time spent in each patch and the number of snails collected ............................................109
ix
LIST OF TABLES Table 1. Comparing collection times, rates, and returns for ten patches. ......................86 Table 2. Results of a nutritional analysis on 200 gm of Rabdotus mooreanus snail meat ......................................................................87 Table 3. Comparing the nutritional value of Rabdotus mooreanus snails with other mollusks and generalized food types. .............................................88 Table 4. RDA, time for acquisition, and percent per 100 gm meat for Rabdotus mooreanus........................................................................................89 Table 5. Comparisons of energy return rates of various foods. From Kelly (1995:Table 3-3) ...........................................................................90 Table 6. Comparing the nutritional and caloric returns for five potential food sources ......................................................................................99 Table 7. Gross rates of return for ten patches collected for Rabdotus species snails ....................................................................................106
x

CHAPTER 1.
INTRODUCTION
Snails are a common element in many archaeological sites, and in south Texas, at
least, might be termed ubiquitous (Brown 1999:213). The presence of these mollusks has
received varying levels of attention over the past 40 years, with some authors attempting to
incorporate them into interpretive schemes and others largely ignoring them.
Snails are useful for a variety of analytical purposes. They have been utilized in
order to achieve a better understanding of past environments through evaluating the
environmental niche preferences represented by recovered shells. They have also been
used to date sites and occupation zones both absolutely, through adjusted AMS techniques,
and relatively, through the use of amino acid racemization rates, a tool useful for
determining the extent of mixed deposits.
Another aspect of snail research has been geared towards the issue of prehistoric
consumption of snails by aboriginal peoples. To some it is self-evident that snails,
(exclusively the members of the Rabdotus family), were consumed. Ethnographic evidence
has shown this to be the case. For some others, it is felt that although in some instances
snails were eaten, in many, if not most cases, the archaeological presence of Rabdotus and
other snails are an artifact of processes not directly associated with human subsistence
patterns. Most prominent in this argument is the concept of the “commensal scavenger,”
which argues that Rabdotus made itself present at human campsites in order to feed off of
the detritus-enriched environment. It has also been demonstrated that natural flood events
can deposit high quantities of snails (shells) in near-alluvial settings in the form of drift
deposits. Many modern snail collections are actually gathered from such accumulations.
Site 41BL116, located in western Bell County on the Edwards Plateau, is a
prehistoric open camp containing Late Archaic through Late Prehistoric diagnostic artifacts.
Radiocarbon dates have placed major occupation zones from between 3100 and 1500 years
before present (BP). Perhaps not unusual, but still striking, are the high numbers of
molluscan animal remains—both freshwater mussels and land and water snails—at the site.
1
2
There can be little doubt that the mussels were gathered for consumption as no natural
processes could account for their presence and charred shell is commonly found in direct
association with cooking appliances.
Rabdotus shells are likewise common, and share similar associations; in fact, their
numerical presence can be seen to temporally mirror that of the mussels. This might be
cause to simply state that humans were gathering the snails for consumption and then move
on to other avenues of research. But presenting an assumption as fact does not make it so.
At present, there is no model in place that might allow testing of such a hypothesis.
There are, however, theoretical mechanisms that create the opportunity to construct such a
model. This thesis looks at the question of Rabdotus-based subsistence from an optimal
foraging perspective. One of the tools of optimal foraging models is the ranking of
potential food resources. This leads to greater understanding of food choices made by
humans. An abundant, high ranked resource is gathered in preference of less abundant,
lower ranked food items, and the breadth, or variety, of diet is low. As the more valuable
resources decline in abundance, it is more likely that lower ranked resources will find their
way into the dietary regime, and diet breadth widens.
Rabdotus might conceivably fit in either category, and either would be telling as a
means of understanding past human behavior. Should the snail be high in energetic value
and also easily obtainable, its presence might indicate stable human populations exploiting
an available resource. Should the snail provide a low energy return, yet high quantities
occur within a site or locale, indications would be that human populations were adapting to
a decrease in abundance of higher ranked resources, perhaps due to some form of seasonal
or long term environmental stress.
There are two main issues that must be addressed in order to determine if snails
found in archaeological deposits are the result of human foraging activities or are the result
of some other, natural process. The first involves determining if human snail gathering
might leave distinctive signatures in the archaeological record. Brown (1999:251) asked a
number of questions, the answers to which he suggests can help determine the place of
Rabdotus in archaeological contexts. The first question was “what percentage of juveniles
can be expected a natural death assemblage”; and the second was “what density of recently
3
dead…Rabdotus shells can be expected to occur in a natural setting?” This project
addresses these first two questions. The most relevant information is in regards to the
percentages of juveniles, which are shown to vary in proportion between “natural” and
archaeological site settings. This allows a quantitative method to be established based on
empirical returns, one that can be replicated in various settings, thus allowing this
conclusion to be potentially supported. The second issue, whether or not snails can be
shown to vary in density between on-site and off-site settings, is also addressed. For one
archaeological site at least, there is a real difference in the numbers of snails found within
the site and the number found directly adjacent to it.
The second issue lies in understanding the energetic and nutritional value of
Rabdotus. Although showing that population structures are distinctly different within
cultural deposits, snails must still be justified as a food source. To this end, the nutritional
value of at least one species of Rabdotus is presented. This allows the snail to be compared
meaningfully with other food items in regards to relative caloric and food value, and more
significantly, when combined with experimental gathering data, the amount of energy
expended in procuring that nutrition. From such actualistic studies the net energy return of
snails can be determined, allowing the principles of optimal foraging theory to be applied,
thereby testing the assumption that Rabdotus is a reasonable source of energy for
subsistence level foragers. This study establishes that although not a very efficient source
of energy, Rabdotus does provide a sufficient return to justify its acquisition within a broad-
based diet. Then, by looking at the macronutrient composition of the snails, refinements to
the diet-breadth model are proffered that allow for a multi-tiered approach to further
understanding the dietary role of snails and other mollusks in Late Archaic Central Texas.
What follows begins by an examination of energy studies in anthropological
thought. Chapter 2 reviews the theoretical trends that have led to optimal foraging theory,
in order to attain a better understanding of its uses, strengths, and weaknesses. Theory
operating in a vacuum loses it explanatory power, so it is necessary to understand the
underpinnings before attempting to invoke the paradigm.
Just as the theoretical position must be supported, so must the subject of study.
Snails can provide a wide range of useful information, and by becoming at least passingly
4
familiar with possible uses, a researcher can make better informed decisions as to how data
recovery might proceed. It is in this third chapter that the optimal foraging model as
applied to snails is more fully developed, setting up the procedural elements that will be
utilized in later sections.
Chapter 4 introduces site 41BL116 and places it within localized environmental
parameters. Central Texas is not only an ecological zone, but a cultural area as well.
Various approaches to describing and understanding the interactions between culture and
environment that have resulted in what is termed Central Texas are presented, thus placing
the study area within localized contexts.
Chapter 5 expands the ecological discussion and provides an opportunity to explore
environmental data at a scale that should help clarify some of the modeled choices that will
be based on optimization and evolutionary ecology, the overarching system in which
optimal foraging models reside. Although testing a full scale regional model is beyond the
scope of this paper, it is useful to apply some of the modeling concepts to the study area,
and so demonstrate the foraging aspect of these human lives from within a broader context.
Chapter 6 returns to empiricism and actualistic studies. These are often referred to
as middle range applications. The concept of middle range theory is explored, and
determined to be a relevant and justifiable perspective from which to approach the research
objectives. Rabdotus species snails were gathered experimentally over a period of several
months in the spring of 2001. This data provides the backbone for the thesis, from which
on-site and off-site population structures are compared. A specific and detailed
methodology is presented that shows that the Rabdotus assemblage from 41BL116 is
significantly and demonstrably differently structured than naturally occurring populations.
It also shows that live snails, gathered experimentally while mimicking expected aboriginal
behavior, resulted in an assemblage statistically indistinguishable from the site sample.
If Rabdotus has ever been quantified as to food value, the source is obscure or non-
published. Chapter 7 presents the results of a detailed food value analysis on
experimentally gathered Rabdotus species snails. This information, coupled with
experimental gathering data, allows net energy returns to be calculated. Rabdotus can then
be placed on both an absolute energy scale of return rates against which other potential food
5
sources may be measured, and on a relative scale, one that factors in the macronutrient
content of the snails as well as various environmental and perhaps cultural variables, and so
may affect when and to some extent why snails might enter the diet. A strong correlation
between snails and freshwater mussels is demonstrated, and it is suggested that the two
food items were complementary, allowing foraging decisions to be made that may not be
possible if only one of the items is exploited.
One of the primary complaints against optimal foraging models is that they do not
mirror reality, but rather present an idealized conceptual frame into which the larger picture
is often forced. The common answer to this issue, and the one that is used here, is that this
is not meant to represent absolute reality. Chapter 8 tests some of the assumptions optimal
foraging models place on the data. Diet breadth was addressed in Chapter 7, so it is here
that the patch choice model is examined. Next, the large scale model presented in Chapter
5 receives attention, and some tentative conclusions regarding population size, seasonality
and mobility, and social organization are presented. This is the point where the middle
range theory becomes actualized, linking the empirical data to broader issues of culture and
adaptation.
It is understood that humans act within a myriad of possibilities from which an
infinite number of choices are possible. The model that is presented represents one possible
set of such choices. As such, it is rests firmly within the hypothetico-deductive approach.
The hypothesis is presented (humans ate snails), the research design is established (the
model), and data is gathered. If the hypothesis cannot be supported it is abandoned. If,
however, it is supported, it can be redefined, with additional data gathered to test within a
refined model. Repeated tests may eventually allow the model to be accepted as fact.
The present project is somewhere along the midpoint of this trajectory. Close
associations of snails with other food remains in relatively assured contexts support human
consumption of snails. This thesis brings additional data to a specific perspective, and
ideally sets up a new stage of research. This may be within evolutionary ecology, or might
fall within a different theoretical construct. Regardless, it is hoped it presents data in an
informative and useful way, and that what follows will be of interest to future researchers.

CHAPTER 2.
A SHORT HISTORY OF ANTHROPOLOGICAL STUDIES OF ENERGY
Human use of energy plays an often integral part in interpretations of human
interactions, particularly within the natural world. The systemic nature of the energy cycle
lends itself well to positivist theories of human adaptation strategies, particularly within
foraging or hunter-gatherer contexts.
It is necessary first to define what is meant by energy, and to clarify its importance
in human affairs. The Concise Dictionary of Science defines energy as “the capacity to do
work,” which can be mechanical, electrical, and thermal, among others (Gaynor 1959:173-
174). On a biological level organisms expend energy to accomplish tasks, many of which
involve acquiring this energy to spend. The result is an energy balance, which for life to
sustain itself, must remain positive (Krebs 1994:603). The basis of almost all biological
energy is sunlight. Sunlight is transformed by autotrophs into a usable form (through
photosynthesis) and becomes what has been termed primary production (Kelly 1995:66,
Belovsky 1986). Rates of primary production can be quantified and then used as an index
for heterotrophs (omni- and carnivores), also referred to as secondary production (Kelly
1995:69). The environment becomes both an energy reservoir and an energy conduit. This
process provides a system in which construction of predictive models can be designed to
test foraging strategies.
One such model is based on optimization theory, again originating in the natural
sciences and widely applicable, at least to the community level (Krebs 1994:476).
Optimization has been summarized as the maximization of energy intake (Martin 1983:612)
within a holistic systems approach that is related to Darwinian fitness (Kaplan and Hill
1992:168) in which, once again, energy is the currency (Kelly 1995:101-108).
Energy can be approached from other perspectives. One method involves trying to
understand what may drive social change and has roots in the thermodynamics of Leslie
White (Trigger 1989:290), utilizing concepts of landscape ecology (e.g. Naveh and
Lieberman 1983) and chaos theory (McGlade 1995) within the framework of general
6
7
systems theory. Such approaches are potentially valuable, especially when attempting to
understand behavior in terms that transcend archaeological site boundaries (e.g. Ebert 1992,
Dunnel and Dancey 1983, Thomas 1983, Wandsnider 1992, Chang 1992, c.f. Binford
1982).
Early reviews of human interaction with the environment are seen in the works of
such classic writers and historians as Herodotus, Thucydides, Diodorus, Sicilus, and Strabo
(Pallotino 1991:60). Tacitus (AD 98) was another writer and observer of his world, and
from him it is possible to gain insights on the tribal people of Germany during that time.
Although he was writing from an emic perspective (Harris 1968:395), and some of his
information may be less than accurate (Whittaker 1993:283) the approach is one of viewing
behavior as the result of environmental influences.
Tacitus saw the Germans as people who were well adapted to cold, and therefore
could not function well in warm climates, and for the same reason were not suited for long-
term, laborious tasks. They were, however, adept at short-term bursts of high energy,
which to Tacitus explained a seeming predilection towards raiding rather than farming as a
means of subsistence. The cold also induced them to consume large amounts of alcohol
which led to violent councils that nonetheless were an effective means of self-government.
In short, Tacitus observed a group of people that behaved in ways he was not familiar with,
and in trying to understand this variation, utilized the most obvious difference between his
native country and theirs, namely, the climate and resulting environment.
It was during the Enlightenment that a florescence in anthropological thought was
initiated (Harris 1968:8) and numerous socio-evolutionary theories were developed
(Trigger 1989:84). Many of these called upon the classic texts as authorities and an effort
was made to use postivism as a means of understanding the natural world and the place of
humans within it (Harris 1968:1). Rousseau, for instance, in his discourse entitled The
Origin of Inequality (1775), postulated that a variable environment required different
adaptive strategies in dependent on geographic regions that resulted in differentiation in
tool use and led to the intensification of resources. Although his goal was to illuminate an
evolutionary sequence of necessary human development, he also recognized and discussed
how environmental conditions can potentially affect human adaptations.
8
Montesquieu, in his Spirit of Laws (1748), like Tacitus, looked at climate as a
primary causative factor in human behavior, although unlike Tacitus, felt cold climates
created a more temperate personality. Montesquieu believed cold weather physically
affected cells, and showed experimentally that the cells on the tongue of a sheep contracted
when chilled. Likewise, he postulated that persons in warmer climes required replacement
of body fluids with a like substance (water), while those in colder areas were better suited
for the effects of alcohol, which served to “give motion” to the blood. The German imbiber
then, was acting within reason, while one from Spain was acting immorally. He noted that
warmer climates seemed to be associated with increased reproductive success (fitness), but
this was also an indication of moral weakness. In general, persons from the North were
calmer of temperament and morally superior to those of the south. It is interesting to note
that these conclusions, largely opposite those of Tacitus, correspond with Montesquieu’s
area of origin, as do those of Tacitus’s.
Montesquieu argued that the effects of climate not only influence behavior but also
the institutions by which humans govern themselves. The Arab nations, for instance, have
strong laws regarding consumption of liquor, which Montesquieu saw as proof of his
theories. Climate influences the spread of disease, and laws are enacted to contain them. In
Britain, people are so entirely miserable that they developed an assembly with laws that
spread authority across a wide board, as they could not trust any single person as wholly
unhappy as themselves.
Montesquieu, then, was one of the first to develop a hypothesis based on a certain
level of empiricism that could be used as an explanatory device, as well as be tested
through observation of the immediate natural world. He was pulling energy ever closer to
the realm of heuristics.
It was not much later that Malthus expounded principles that influenced Charles
Darwin and Herbert Spencer, resulting in “the biologization of history” within a framework
of “universal progress” (Harris 1968:35, 107). The core of Mathusian theory lies in the
inequity between geometrically increasing populations subsisting on arithmetically
increasing environmental resources, thus determining population dynamics (Meffe and
Carroll 1994:442). Spencer, seemingly more than Darwin, concentrated on evolutionary
9
processes in humans, and helped develop what has been termed the “comparative method,”
a direct historical approach that assumed modern populations were very similar to
prehistoric ones at a similar level of development (Harris 1968:150) establishing precedents
that allowed explicit socio-evolutionary models to be devised and accepted.
Morgan, in Ancient Society (1877), elucidated Tylor’s (1871) evolutionary
trajectory from savagery through barbarism to the epitomization of civilization. This
tripartite division can be seen as well in the early eighteenth-century three-age system;
stone, bronze and iron (Trigger 1988:60, Harris 1968:146) and within Montesquieu, who at
an early date separated savages from barbarians (Harris 1968:29). Morgan saw evolution as
a necessary and concomitant aspect of human existence. An implication was that if certain
groups had failed to arrive at the level of civilization, they were somehow deficient. At the
same time, by examining their place on the ladder, a direct view into the past of civilization
was possible.
Subsistence, (and therefore environment) was a driving force of change, especially
among developing savages. Perhaps following Rousseau, Morgan argued that exploitation
of the environment for subsistence purposes led to improvements in technology which
allowed more time, (and mental sophistication), to develop new technologies to better
exploit the environment. It was by controlling the environment that humans became more
fully equipped to develop or discover new technologies that made them more suited to
exploiting the environment, a reciprocal process that lent itself naturally to social
development.
In what has been termed, (perhaps wrongly) a reaction to Morgan, evolutionism,
and the comparative method (Harris 1968:291), the Boasian school of anthropology, in the
first half of the last century, championed the inductive method, and as exemplified by
Alfred Kroeber, largely departed from positivist approaches (Harris 1968:336). Boas
himself did not seem to feel the comparative method and aspects of environmental
determinism were completely without merit, but he did suggest that necessary
methodologies were not in place that would allow productive research emanating from a
broad theoretical perspective (Boas 1940:270-280, 281-289, 290-294, 525-529). A
generation of Boas’s students focused on particular aspects of small-scale societies,
10
searching for explanatory devices typically grounded within the social group itself, rather
than outside, extra-societal forces (Moore 1997:65-67).
It was not until Leslie White and then Julian Steward that Morgan’s work was
reformulated and the scientific method again became explicit in anthropology (Moore
1997:169, Harris 1968:37), when Leslie White formulated a detailed conceptual analysis of
energy as a determinant factor in human affairs (White 1943, 1959), while Julian Steward
gave evolution a new outlook within the context of a multilinear methodology (Steward
1972). These works helped renew positivist approaches that would lead, among other
things, to the “New Archaeology” of the 1960s (Trigger 1989: 289-290).
Leslie White and Julian Steward were contemporaries, both in age (White was two
years older) and in practice. They were educated in the Boasian school; White under Sapir
(among others) and Steward largely under Kroeber. Both began publishing in the 1930s
and continued through the 1970s, and both espoused a departure from the dominant
relativistic paradigm within which they had been trained. Survey texts often seem to cover
White before Steward (e.g. Harris 1968, Trigger 1989, Moore 1997) and Steward seems to
be cited more frequently in the literature. In short, Steward seems to have had a greater
influence on recent anthropological thought than White.
Both Steward and White were interested in the effects of environment on culture,
with Steward looking at its systemic nature, and White reducing it to its core element,
energy. Because energy is essential for all other natural functions, it is therefore the
element against which all else can be measured. The result is an absolute quantification of
all aspects of the natural world, and this involves culture, as well as the evolution of culture.
White (1943, 1959) was able to produce mathematical formulas that explained how culture
develops, and so was attempting to show that culture is subject to laws that can be proven,
and is therefore universal in nature. This hearkens back to the evolutionary theory of Tylor
and Morgan, and indeed, White explicitly states his indebtedness to them, and denies that
he is practicing any form of neoevolutionism (White 1959:ix).
Steward, meanwhile, describes White’s approach as “universal evolution,” which he
feels is different from the unilinear model of Morgan and Tylor based on its rejection of
specific instances of universal stages in favor of viewing culture as an entity subject to
11
forces in a general sense, and distinct from his own multilinear approach (Steward
1972:16). Steward’s introduction of the universal evolution concept has been criticized as
arbitrary and irrelevant in that evolutionists can be placed within at least two of his
categories (Harris 1968:642). White, meanwhile, denies that Morgan and Tylor had
unilinear tendencies, stating that they were concerned with culture and not society, and that
“culture, or portions thereof, passed through stages of development” (White 1973:51, italics
in original). It was therefore invalid to state, as Steward did, that the early evolutionists
were trying to force data regarding placement of prehistoric or precivilized people into
categories while ignoring regional variation (Steward 1972:15).
Steward argued that his concept of multilinear evolution was a more realistic way of
understanding culture change and avoided the over-generalizing methods of White
(Steward 1972:28). Where White had completely divorced himself from his formative
influences, Steward was maintaining a middle ground, keeping what he felt were useful
aspects of the relativistic school of historical particularism and applying them to
positivistic, generalizing theories of evolution revolving around environment, an approach
he termed cultural ecology (Steward 1972).
Steward was not looking for universal stages, but rather causes of culture change.
Cultural ecology examines how change is induced by adaptations to the environment, with
humans introducing the reflexive super-organic factor. Although Steward is looking at the
environment as causative, it is not strictly deterministic, as it may be merely a shaping
force. Furthermore, cultural patterns are not genetically derived, and so biological
principles cannot be used to study culture. It is culture itself that explains human society,
and cooperation is as likely as competition. It is through, in part, culture histories that
explanations must be reached, not the biological sciences, and it is through recognizing
levels of integration of individuals and institutions that the evolution of human societies can
be understood.
The environment remains a very important part of this scheme, however, and it is
Steward’s concept of the “cultural core,” the “constellation of features…most closely
related to subsistence…and economic activities” that provides the motive force for cross-
cultural comparisons (Steward 1972:37). Local environments require varying adaptive
12
technologies that can used as indexes for understanding the differences seen in various
cultures. By understanding the relationship between environment and technology it is
possible to see behavioral patterns which are involved, through the cultural core, in
subsistence and basic economic pursuits and relate these to other aspects of culture. If these
minimally impact the aspect of interest than it is reasonable to look at historical processes,
such as diffusion, as explanatory. If, however, they appear to be of import, then the cultural
core has been approached and is relevant in understanding the question at issue. By using a
holistic, systemic approach, wherein the question of interest is framed appropriately against
various causative factors it is possible to determine whether a generally operative or locally
distinctive process is in play. Cultural evolution is represented, then, through increasingly
complex organizational forms that are nonsequential in nature.
Steward thought it was necessary to distinguish between the culture area concept
and the culture type. The culture area he felt was reductionist in that it was a classificatory
method based on differences that led naturally to a relativistic view of culture. When the
diachronic perspective is added trait relationships become disrupted as the links between
them become irrelevant. The cultural type, however, is represented by core features that are
functionally similar but are not the result of diffusion. When the form-function concept is
included the reflexive nature of the relationship between both is recognized which again
avoids the problem of relativism, an almost unavoidable consequence of looking only at
form.
It is Steward’s reliance on the understanding of particular patterns that White felt
was the downfall of the multilinear approach. Steward could not lay claim to an
evolutionary perspective because he was hopelessly entrapped in an effort of developing
theory that had no utility in explaining “particular features of particular cultures,” an
impossible task given that only broad generalizations are capable of enveloping and
explaining particular situations (White, in Harris 1968:649). What enabled these broad
generalizations for White was the explicit understanding of energy as the prime motive
force in all things natural (White, 1943, 1959, 1973). By following a very systematic
internal logic, White was able to elevate the study of culture to a true science, one he
dubbed “culturology.” Energy is universal, therefore, behavior is a manifestation of energy.

13
Culture exists to “serve man,” most especially through controlling the external world (e.g.
subsistence). Because this is primary (culture could not exist without food), other purposes
of culture (the “internal,” reaffirming aspects, such as symbolism) can be given secondary
importance. Thus, the human aspects of culture, along with habitats, which are averaged
across the world, can be ignored for the study. What is now relevant is the amount of
energy (E), the technology (T) used to harness it, and the product (P) which results. This
can be expressed E x T = P. Individual strengths and weaknesses can be averaged, and so
factored out, which allows technology to be expressed in terms of efficiency, with any one
technological application (tool) having a rate of efficiency that cannot be improved upon
(100% efficiency). Efficiency (F) can now be substituted for technology in the equation, E
x F = P. Culture, (which serves man), can thus be measured by total productivity (P), This
leads to the first of White’s laws, which states that P varies directly with E, when F is held
constant, and the second law, that P varies with F, if E is held constant, all the while
understanding that both E and F are dynamic and can vary in infinite ways with respect to
each other. The result, however, is that culture progresses when E and/or F increases.
As the purpose of culture is to serve humans, to make life more secure and more
comfortable, human evolution, the “struggle for survival” (White 1943:339), is seen
through culture. Primitive societies had a constant, albeit low supply of energy. For culture
to develop an increase in efficiency was required. Barbarism therefore began with the
advent of agriculture, and to some extent pastoralism, although agriculture, as a more direct
manipulation of the environment, was a more efficient technology. The final stage,
civilization, did not begin until the “fuel revolution,” which was attributed to James Watt
(White 1973:62). This was a huge leap forward in the harnessing of energy, and
precipitated culture rapidly forward.
White did not totally ignore the social aspects of culture. For example, he
acknowledged the argument of the individual as a catalyst for change; that without the great
minds that developed new technologies the development of culture would be decidedly
different. White countered, however, that within the greater scheme of culture, the motives
and intentions−the psychology−of the individual, were irrelevant. Likewise, the institutions
of culture, which were of such central significance to Steward, were realized as being

14
important in that they tempered the relationships of energy and production, but it was
technology that maintained dominance, with social evolution dependent upon technological
evolution, while recognizing a feedback mechanism existed between the two. A social
system might therefore hinder technological advance to the point where cultural advance
halts. Recalling the formula E x F = P, it would require an increase in energy to invigorate
the system once more.
It is interesting to speculate as to why White, “the dragonslayer of Boasianism”
(Binford 1972:6), seems to have been the loser in the struggle for theoretical supremacy.
The differences between White and Steward were irreconcilable, at least on a personal
level, try as did some to mediate (Harris 1968:651). It is ironic that White had multilinear
tendencies (Harris 1968:643), while Steward was able to describe generalizations that
White could accept as evolutionary (Harris 1968:653). Qualitative differences can be seen
in how they disseminated their ideas. As late as 1959 White was presenting his work as
self-evident fact, using examples from a wide range of disciplines in a manner which often
seemed didactic and tautological. His blatant attacks on the dominant Boasian paradigm of
the time apparently caused him to lose much in the way of general popularity and may well
have negatively affected his professional life (Moore 1997:170), even as he himself realized
that he was not the most popular man in the field (Binford 1972:6). But it is probably his
extreme reductionism that expressed all of human culture in terms of energy management
that was most damning.
The aspect of Steward that White found so annoying, his straddling of the fence
between the two fields of relativism and positivism, is probably his greatest strength.
Steward’s debt to Kroeber and historical particularism is readily apparent. As noted earlier,
he explicitly states he is interested in explaining regularities in patterns that are seen cross-
culturally. He is thus taking the descriptive, inductive methods of Kroeber to the next level,
applying deductive principles in order to determine causative factors for observed variation.
By focusing on likenesses rather than differences the unique cultures of Kroeber are seen to
have similarities that have nothing to do with diffusion or direct historical processes. The
culture types of Steward are based on selected features; particular aspects that are felt to be
of relevance to the problem at hand. The underlying methodology here is clear, and it
15
parallels that of historical particularism. Although the relativist school would not explicitly
search for general principles, it might well appreciate the formulation of particular laws that
seek to explain specific situations within certain constraints, without attempting to develop
universalities. Steward had also reintroduced the concept of the superorganic, reframing it
against an environment that is not passive, simply allowing or prohibiting events, but active
and at times determinant, actually creating change based on how the organism−the
superorganic structure of culture−adapts to particular environments in particular places.
Steward then, was able to craft an approach to describing and explaining the intricacies of
humans and the environment without broadly alienating the established view nor making
assertions that were so broad as to be always true, and therefore non-explanatory (Steward
1972: 28).
Both Steward and especially White were influential in that they reopened
anthropology as a valid field in which to apply deductive, positivistic approaches to
understanding society and culture change (Moore 1997:179). Theory building was again
possible (Binford 1972:8), especially in archaeology (Trigger 1989:293), and White’s
formulations of energy, technology, and product acting reflexively with other aspects of
culture were recast in material form as Binford’s “technomic,” “sociotechnic,” and
“ideotechnic” artifact classes (Binford 1972a:21-22). The concepts of cultural ecology,
meanwhile, are still broadly accepted (Moore 1997:188) and utilized (e.g. Netting 1986).
Applications such as catchment analysis (Jarman et al. 1972) follow closely on
understanding the relationship of humans and the natural environment. Whether or not
recent schools such as evolutionary archaeology represent a new paradigm (O’Brien and
Holland 1995) or can be seen as emergent methodological advances remains debatable.
What seems clear, though, is that behavioral ecology and optimal foraging theory,
developing out of biology, could not have been applied anthropologicaly without the
contributions of the so-called neo-evolutionists.
So, Steward and White to a large degree set in motion methodologies that would
allow the next generation of anthropologists to proceed with increasingly refined and
detailed theoretical approaches and research designs. The evolutionary perspective
demands such empiricism. But the contribution of the functionalist school cannot be
16
ignored, especially as expressed through the perspective of Malinowski (Trigger 198:245)
who looked at culture as a way of meeting human needs (Moore 1997:133), in part a
response to biological necessities where social responses have “beneficial consequences”
(Smith and Winterhalder 1992:43). Detailed ethnographic studies were taken to new levels
in works such as Rappaport’s Pigs for the Ancestors (1968) where detailed environmental
data was collected as a means of explaining the function of ritual within certain societies in
New Guinea. Such “particular” bits of information become increasingly vital to later work.
By 1959 it was realized that an increasing interest in environmental studies and
concomitant patterns of settlement was resulting in a renewed emphasis on the processes of
culture, especially as seen within systemic contexts (Trigger 1989:294) leading to the
cultural materialism of Harris, which he deemed to be an overarching perspective that
included cultural ecology as one of its subsets (Harris 1968:658). Such approaches took
shape not only in the realm of the physical world but in the mental as well, with Claude
Lévi-Strauss suggesting that an understanding of how such mental constructs as myths and
kinship terminologies are structured can lead to a universal understanding of basic human
social systems (Leach 1970).
Lewis Binford, meanwhile, was also looking at systems, but with an emphasis on
the functional aspects of environment on human adaptations formulating approaches that
became particularly influential in American archaeology (Trigger 1989:295). Binford
reemphasized the role of technology in human development, and became increasingly
perplexed about the failure of archaeologists to incorporate theoretical designs into their
research and the lack of interest in the potential of archaeology by many anthropologists
(Binford 1972:9-10). His paper “Archaeology as Anthropology,” first published in 1962,
introduced the terms technomic, sociotechnic, and idiotechnic, suggesting that technology
functioned across functional, social, and ideological levels of culture, and systems could be
understood by the construction of testable models based on ethnographic analogy and
comparative ethnography, thus forcefully arguing for a deductive approach towards
understanding the processual, systemic nature of culture (Binford 1972: 17-18). These
explicitly stated aims allowed Binford to use not only his own ethnographic work among
the Nunamiut but the work of others in varying parts of the world, and by drawing on
17
environmental similarities as expressed in effective temperature, explore such things as
mobility (Binford 1980) and housing, subsistence, and storage (Binford 1990).
Central to such approaches is the concept of “middle range theory” which
approaches the static, material, and non-symbolic aspects of culture to reconstruct history
(Binford 1981b: 23) and can also be viewed as theory of “limited sets of phenomena”
which may be derived from “general sets” (Bettinger 1987:124, 131). By developing
inferences based on physical remains, hypotheses about the people or cultures that
produced them can be tested using theory as a guide to interpretation (Simms 1987:4). The
past cannot be known directly from the artifacts (Kuznar 1996:160), but must be surmised
from and supported by evidence from a multitude of disciplines (Watson 1991:278).
Although it might be argued that middle range theory is limiting, especially in regard to
more generalized theory (Bettinger 1987:131), it has also been stated that such approaches
are the only way to interpret the archaeological record (Ellis 1997:46).
The continuing emphasis on “primitive” people is once more undoubtedly due to a
deterministic evolutionary perspective where human inventiveness was downplayed in
favor of responses to environmental factors (Trigger 1989:296). They also presented a very
appealing lifestyle during times of high anxiety as nuclear weapons proliferated during the
1960s and doubts as to the future of humanity became more focused; hunting (and
gathering) was seen as “the most successful and persistent adaptation man has ever
achieved” (Lee and DeVore 1968:3). Such foragers became idealized as working short
hours with ample time for leisure, thus becoming termed the “original affluent society”
(Lee and DeVore 1968:6, Sahlins 1968:85). An explicitly defined “generalized foraging
model” (Isaac, in Kelly 1995:14) was thus initiated, and became entrenched for a time as
research into hunter-gatherers proliferated, resulting in new data that indicated a range of
diversity that could not be explained in terms of any single approach (Speth 1991:x). For
example, when “work” was redefined to encompass all aspects of subsistence, rather than
just the actual acquisition of resources, an average 15 hour work week suddenly became
well over 40 hours (Kelly 1995:20).
One reaction to the contradictions seen in the material ethnographic record, as well
as a tendency by positivists to ignore issues as such as psychological and ideological
18
aspects of culture (Trigger 1989:302) was the post-processual school initiated by Hodder
and exemplified by Tilley and Shanks (Kuznar 1996:162) among others. Post-
processualism holds that extreme positivism has limited potential, and that by applying a
more humanistic approach additional insights can be gained (VanPool and VanPool
1999:33-34). Studies have become focused on the effects of colonialism on indigenous
societies (e.g Headland and Headland 1997), with some making the claim that the past is
unknowable, especially since it is reinterpreted within the inherently biased mind of the
researcher (Van Pool and VanPool 1999:36, Kuznar 1996:163). Although attempts at
bridging the gap between the humanist and the positivist schools are attempted (VanPool
and VanPool 1996, 2001), at present it seems that the researcher must choose one approach
over another, with perhaps a “shared conceptual core” (Moore 1997: 273) as elusive as
universal human laws.
Returning to the progression of functionalist and processual approaches, another
way of explaining diversity is through understanding human adaptations to environmental
constraints. From the detailed data gathering of Rappaport combined with the systemic
nature of Binfordian model building, Stewards’s cultural ecology and White’s explicit
evolutionary perspective has emerged a related array of current approaches that include
behavioral or evolutionary ecology, behavioral archeology, and perhaps selectionist
(evolutionary) archaeology. Evolutionary ecology is “the study of evolution and adaptive
design in ecological context” (Winterhalder and Smith 1992:3), while behavioral
archaeology examines material remains and how they relate to human behavior (Schiffer
1999:166), and selectionist archaeology more explicitly uses overt Darwinism to explain
cultural phenomena, as opposed to culture itself (O’Brien 1996:1), and has an emphasis as
well on artifacts, wherein they are extensions of the human phenotype and so subject to
evolutionary, or selective pressures (Broughton and O’Connell 1999:157). What at first
glance seems to be a splitting of theoretical hairs may be less an issue of researchers
positioning themselves on an intellectual landscape and might actually be (as some argue)
emergent paradigms (O’Brien and Holland 1995).
Behavioral archaeology thus seems to be an independent version of Binfordian
approaches to explaining the material record. Indeed, Binford recognizes the similarities
19
between Schiffer’s approach and his own views on middle range research (Binford
1981:25), although he disagrees with his methods, and feels that Schiffer cannot extract
behavior from the archaeological record (Binford (1981:28), even while Schiffer explicitly
states that his focus is atemporal, in the respect that he is looking at the interaction of
people and material culture irrespective of time and place (Schiffer 1999:166). The
behavioral archaeologist hopes that by focusing on such relationships more general theories
can be developed that may help explain certain portions of human behavior, and that in
doing so archaeology can become a science of its own, contributing to and accepting
contributions from other disciplines (Schiffer 1999:167,168).
Selectionist archaeology focuses on artifacts as well, but in an adaptive context.
Because the human populations themselves cannot be studied, the artifacts become not just
a proxy, but an actual extension of the human phenotype, through which evolution, defined
as changes in cultural traits, is expressed (Lyman and O’Brien 1998:616). As with the
behavioral archaeologists, the selectionists argue that only through applying their brand of
theory to archaeological problems will archaeology become a science in its own right
(Lyman and O’Brien 1998:630).
Behavioral ecology, the subset of evolutionary ecology that looks at behavioral
variability (Broughton and O’Connell 1999:153), especially within less complex societies,
relies heavily on optimal foraging models as an explanatory device for many levels of
diversity and social integration (Kelly 1995, Smith and Winterhalder 1981:11), presumably
working from the assumption of subsistence as central to survival of humans as a species
(Winterhalder and Smith 1981:x). The main proponent of behavioral archaeology has
explicitly removed himself from any connection with optimality, stating that general
theories of artifact design are more inclusive of behavioral and social variation (Schiffer
1999:167). A primary text on evolutionary archaeology has no indexed mention of
optimization or optimality (O’Brien 1996), based on the argument that evolution requires
only variation and inheritance (as seen in the phenotype as expressed through the artifacts);
optimization, as seen through fitness, is necessary only for evolution through natural
selection (Lyman and O’Brien 1998:616).
20
The conflict between these approaches is not easily resolved. Evolutionary
ecologists disagree with the scope of study of evolutionary and selectionist archaeologists,
arguing that phenotypic adaptation to various factors more clearly explains human variation
than the “direct action of natural selection and other Darwinian processes on heritable
variation in artifacts and behavior” (Boone and Smith 1998:S141). Evolutionary
archaeologists laud the contributions of evolutionary ecology and behavioral archaeology to
their domain (Lyman and O’Brien 1998:615), while the behavioral archaeologists offer new
insights (albeit perhaps somewhat belatedly) to a whole range of social issues (Schiffer
1999:167-168).
All these approaches are of interest to the archaeologist with an evolutionary bent.
Some argue that the differences are less than might be supposed when reading the primary
authors, and based, perhaps to some degree, more on the scale of observation than real
differences in approach (Lanata 1998:636). If archaeology of the evolutionary persuasion
is actually a sort of paleobiology, both micro and macro evolutionary processes should
work in tandem, each supporting the other (Lanata 1998:637, Denet 1998:S158).
Unfortunately, perhaps, those advocating the various approaches refuse to budge, and
indulge in polemical debates that serve mostly to further widen the gap (e.g. Smith 1998,
Lyman and O’Brien 1998:642).
The researcher, therefore, in order to establish some level of consistency, must
choose between various paradigms, regardless of whether they represent a mature science
or one in crisis (Kuhn 1996), as perhaps archaeology continues to be. Behavioral
archaeology is therefore removed from further consideration except for the usefulness of its
functional explanations, while evolutionary archaeology can be seen as an extension of
evolutionary ecology, especially in respect to evolutionary mechanisms such as fitness
(Simms 1987:9-13) although cautiously if using optimality models (Broughton and
O’Connell 1999:158-160). So although it is tempting to use the two in tandem, for present
purposes it is better to focus on one or the other, in this case behavioral (evolutionary)
ecology and its heuristic device, optimal foraging theory.
Behavioral ecology focuses on variation in such things as subsistence patterns,
family structures, fertility and morbidity as expressed in individuals within a broader
21
context of evolutionary theory, providing measures of reproductive fitness (Bailey 1991:3-
4). The emphasis on individuals is based on the fundamental aspects of natural selection;
there is inherited variance in phenotype among individuals that affects the ability to survive
and reproduce (Smith and Winterhalder 1992:26). A portion of the human phenotype is
cultural behavior, which from a “weak sociobiological” position is the tendency to select
from behaviors which in the long run increase reproductive success, and need not be
specifically programmed genetically, as there are innate human physical and mental
characteristics that serve the same purposes (Kelly 1995:51). The concept of fitness is
refined from simple reproductive success to one of reproductive potential, or the propensity
of an organism to reproduce within its given environment (Smith and Winterhalder
1992:27, reiterated in Kelly 1995:52). The two means by which this occurs in humans is
through methodological individualism, wherein humans store knowledge that they
understand to be useful towards linking actions to goals while maximizing opportunities to
reach those goals (Kelly 1995:53), and through optimization.
Optimization can be glossed as an assumption that actors choose from a set of
choices within certain constraints in which there is a currency that can be measured in terms
of relative success (Smith and Winterhalder 1992:50). When the actors are hunter-
gatherers, the choices can be described as subsistence strategies within local environments,
with the currency set as food value, or more basically, energy. Energy, then, serves as a
proxy for reproductive fitness, as fitness tends to vary directly with foraging success
(Winterhalder 1981:20). It is from these parameters that optimal foraging theory develops,
aspects of which include diet breadth and patch choice (Winterhalder 1981). Diet breadth
looks at the range of potential food items, and patch choice examines how resources are
distributed across the terrain. There are three predictions that can be applied to human
foragers: that foragers prefer profitable resources; they will be more selective if such
resources are readily available; and they will choose not to exploit readily available
resources if they are outside the optimal diet (Krebs and Davies 1978, in Simms 1987:14-
15).
Critiques of optimal foraging include its apparent lack of recognition of different
value systems among various groups, especially in regards to prestige activities and those
22
linked to taboos and other culturally mandated mores (Kelly 1995:52, 109). Optimal
foraging theory would also have individuals eating their returns themselves, rather than
sharing the catch among non-family (Dwyer 1985:243-244). And what about simple taste
preferences? These complaints are answered by asserting that optimal foraging theory
produces models that are not realistic descriptions but analytical tools, and that they create a
framework within which to understand diversity; when items not fitting the model are
found other explanations can be attempted (Smith and Winterhalder 1992:60, Kelly
1995:109). For instance, when the larger construct of behavioral ecology is applied, the
arguments surrounding sharing can be easily dealt with by looking at fitness within a larger
context. More damaging are attacks on the underlying assumptions and methodologies.
One concern is that of the borrowing of methodologies from other disciplines, due
in large part to differences in approach and in the questions being asked, as well as the
underlying structure of the borrowed approach (Keene 1983:141-142, 147-148). If the
concept of borrowing is allowed, it might be asked whether the borrowed concepts
themselves are valid. Martin (1983) takes the underlying assumptions of optimal foraging
to task, arguing that maximization, diet breadth, and patch choice models are either
illogical, use incorrect measures, or just cannot be justified due to a departure from realism
(Martin 1983:627). This last is perhaps the most damaging, because at least from Martin’s
viewpoint, it can no longer be used as a basis for an idealized model (Martin 1983:621), as
indeed that is how it is frequently applied (Winterhalder 1981:19,20, Smith and
Winterhalder 1981:12, Smith and Winterhalder 1992:60, Kelly 1995:109, Foley 1985:222,
Simms 1987:20).
An approach that might help clarify this disjunction lies in understanding the
confusion between theory and method. As stated above the theory of optimization rests in
evolutionary (behavioral) ecology, and optimization is merely the middle range set of tools
used to predict behavior, from which additional questions can be formulated based on the
relative fit of the data (Simms 1987:19). By looking at the “context” of the behavior in
question such models will become more useful (Jochim 1983:158) and better able to
address such issues as cultural preferences (Simms 1987:20). By turning the focus away
from the divisive issues of appropriate methodologies and instead accepting that broader
23
conceptual frameworks are necessary to meaningfully address human behavioral variation
(Bettinger 1987:138) which becomes more clearly defined when the evidence does not fit
the model (Cronk 1991:31), appropriate data sets receiving appropriate levels of analysis
will continue to contribute to the advancement of the science.
The flow of energy through anthropological thought does not end with evolutionary
ecology or optimal foraging methods. Systems theory, cybernetics and the embedded
concepts of feedback have long been recognized as either maintaining stasis or initiating
change (Trigger 1989:303-304). Feedback can help maintain or promote fitness (Smith and
Winterhalder 1992:42-43). Just as energy flows through a social system, so does
information (Moore 1981:194) with society becoming a nexus of information processing
(Moore 1983:173), and information containing “material correlates” (Root 1983:194).
Information could thus become a proxy for energy, or, perhaps more realistically, energy a
proxy for information. Meanwhile, a non-linear concept of evolution, based, in part, on the
feedback of social processes, emphasizes a coevolutionary perspective, wherein humans
“are active participants in a…process with the natural world” where the “social informs the
natural and the natural informs the social” (McGlade 1995:116, 114).
Against this backdrop lies another biological paradigm, that of landscape ecology
(Neveh and Leberman 1984). This approach challenges many of the established views of
ecological studies, in particular concepts of climax and equilibrium (Naveh and Leberman
1984:10). Because energy and matter, according to the first law of thermodynamics, are
essentially equivalent, energy can become the focus for material systems, in which humans
are an inextricable part. The entire human system, which includes both the physical and the
mental, becomes subject to feedback, and, as part of the natural world, influences and is
influenced by the “natural” world (McGlade 1995:114).
Such an approach helps remove an emphasis from “sites,” especially in an
archaeological sense, and the artifact becomes the “minimal operational unit” (Thomas
1975:62), allowing a fuller integration of human behavior into the broader landscape (Ebert
1992:12-13). The lessened emphasis on specific loci of activities allows a greater focus on
larger scale questions of human integration into the environment, and also aid in questions
of site “significance” (Butler 1987).

24
Energy studies are an attractive method for studying human behavior. In its purest
form, energy is the ultimate determinant of culture; culture, and all it entails, cannot exist
without it. At the same time humans are imbued with the capacity to alter not only how
they acquire and utilize energy, but how they conceptualize such use. This has resulted in
various approaches of understanding energy consumption, as well as denials of its
relevance in human studies. To date, optimal foraging models couched within the
framework of evolutionary ecology hold great promise for elucidating behavioral questions.
Meanwhile, new concepts that revolve around aspects of feedback and information
exchange may well be harbingers of a new paradigmatic approach.
The present study examines the energetic returns of Rabdotus species snails from
the perspective of optimal foraging theory. The subject lends itself well to testing the diet
breadth model, wherein food items with low energy value enter the diet when higher ranked
resources drop in abundance. As diet breath widens, changes in patch choice or utilization
would be expected. The simplest means of measuring energy is through calories. Different
food sources can be easily compared using that currency. Calories, however, are not the
sole benefit of food consumption. The health of any higher organism requires the correct
amounts and ratios of appropriate compounds, vitamins, and minerals. By expanding the
currency to include these other basic needs expanded or alternative models explaining
foraging choices can be presented (Kelly 1995:101-108). The general approach is the
same, but the scale of analysis changes, allowing differing levels of interpretation. Of great
importance, of course, is understanding the focus of study, in this case, the central Texas
Rabdotus species snail.
CHAPTER 3
TEXAS SNAILS
Sources
There is no single source that summarizes all snail species within Texas, or within a
single region within Texas. In the 1940s Henry Pilsbry compiled four volumes of data on
North American land snails (Pilsbry 1940, 1946, 1948), but the volumes are difficult to
access and contain much outdated taxonomy, and are therefore most useful for the
illustrations (Ken Brown 2000: personal communication). Between 1971 and 1973 E. P.
Cheatum and R. W. Fullington produced a series of bulletins for the Dallas Museum of
Natural History describing the aquatic and land mollusca of Texas (Cheatum and Fullington
1971a, 1971b, 1973). Cheatum died before the project was completed (Fullington and Pratt
1974:ii) and Fullington , assisted by W. L. Pratt, produced one more volume in 1974
(Fullington and Pratt 1974). The series was never finished, and although very useful at
times, it contains omissions that can prove frustrating. Further, it describes no aquatic
species, other than in the supplemental key (Cheatum and Fullington 1971b). Perhaps a
precursor to the Dallas Museum bulletins, D. C. Allen and E. P Cheatum published a short
but very informative summary of land and aquatic snails in the 1960 Bulletin of the Texas
Archeological Society (Allen and Cheatum 1960). Of interest was an emphasis on snails
found within archaeological sites.
The major references require supplementation from scattered reports from various
sources, and even these often lack information that might be of interest or relevance, both
from a natural history and an archaeological perspective. Very little is known about the
most basic aspects of snail ecology; reproduction, life spans, environmental preferences,
etc. In fact, it is not known what the most commonly recognized snail species in
archaeological assemblages, Rabdotus, eats (Brown 1999:251, although see Randolph
1973, for strong evidence of plant consumption).
25
26
Species, Morphology, and Distributions
By combining information from the Dallas bulletins and Allen and Cheatum’s 1960
BTAS publication it is possible to begin to inventory Texas snail species. Aquatic snails
are represented by at least 10 families containing 18 species (Cheatum and Fullington
1971b). Six of these families and 11 associated species are commonly found in
archaeological contexts (Allen and Cheatum 1960). Land snails exhibit a much richer
diversity. Twenty-one familes with 35 genera containing over 140 species are documented
(Cheatum and Fullington 1971a, 1973, Fullington and Pratt 1974). Of these, 14 families
containing 32 species are reported to be common in archaeological sites (Allen and
Cheatum 1960). Another source (Hubricht 1985) indicates 127 land snail species are found
in Texas. This discrepancy in numbers is probably largely due to exclusion of non-native
species and those found west of the Pecos River.
The range in species is reflected in range of phenotype. Fourteen major shell forms
are described as globose, depressed, discoidal, domed, bulimoid, pupilliform, conical, and
turbinate, among others. Other diagnostic features of shells include number and direction
of body whorls, presence or absence of a lip at the shell aperture, or opening, presence or
absence of lamella, also called teeth, also at the shell opening, and an open or closed
termination of the whorls on the underside of the shell, described as either perforate or
imperforate. Shell size ranges from around 30-35 mm to less than 1-2 mm. The animal
which inhabits the shell, the gastropod, presents a whole new range of morphologies (see
Purchon 1977, for details of anatomy).
Snails are found across the state. Distributional maps in Hubricht (1985), and
Cheatum and Fullington (1971, 1973) and Fullington and Pratt (1974) show that some
species are widespread, indicating a broad range of environmental tolerance, while others
are seen to cluster in various regions of the state, denoting narrower environmental
preferences. Still others are represented in only a very few counties.
The environmental preferences suggested by regional distributions are also seen on
a more local scale. These descriptions, however, are widely variable, depending, no doubt,
on available literature and observations of the various authors. The species Holospira
27
goldfussi, for instance, is distributed largely across Central Texas, but its more specific
habitat is described merely as “associated with limestone rock and humus” Cheatum and
Fullington (1973:37-38). Descriptions for other species’ habitat preferences are more
useful, illustrating such variables as moisture preferences and zonation in grass or
woodlands.
Other information is also inconsistent. Some comments help clarify distributions
and morphology, while others indicate that very little is known about a particular species.
More species specific data requires searching through literature sources from the natural
sciences or specialized journals (e.g. Hubricht 1982, Randolph 1973). In general, the
quality and quantity of available knowledge is highly variable.
Archaeological Snail Studies
Sites. Archaeological investigators have been including snails within their reports
for many years, but there has been little constancy in level of detail or analysis. Some
reports mention snails largely in passing, under sections such as “Non-Vertebrate Faunal
Remains,” although others attempt, with various degrees of success, to incorporate snails in
some aspect of site interpretation. A sample of some of the more involved studies are
summarized briefly below.
Raymond Neck’s (1994) analysis of non-vertebrate remains at Mustang Branch in
Hays County was a succinct summary of species collected and implications of species
diversity, with an emphasis on Rabdotus. Change in species ratios at this site were
inconclusive in reconstructing paleoenvironments. The discussion of holes found in
Rabdotus shells, (from roots and screen damage), and habits of the snail were especially
useful.
Henry (1995) compares seven sites in the Hog Creek basin of North Central Texas
and compared their frequencies with those of pollen and vertebrate fauna to argue for an
increasing woodland replacing grasslands. Species of Oligyra and Rabdotus varied
inversely, with the woodland adapted Oligyra replacing Rabdotus over time.

28
An exception to the general disregard of snails by some authors is LeRoy Johnson,
who makes an effort to explain, or at least describe, the presence of snails in sites he has
reported on. In 1962 he stated that snails and shellfish were likely gathered by women as a
regular part of the subsistence regime (Johnson et al. 1962:47). In a series of reports
produced for the Texas Department of Transportation (e.g. 1991, 1995, 1997) snails and
molluscan remains received generous attention as a means of environmental reconstruction
(1991), patterns of site use (1995), and general descriptive data (Neck 1997). More
recently, he argued that quantities of Rabdotus snail found at the Bessie Kruze Site in
Wiliamson County were the result of overbank flooding bringing in drift deposits (Johnson
2000).
Ken Brown (1999) has recently produced what is probably the definitive work on
snails in regard to methods of environmental reconstruction and subsistence questions.
Based on data from the Smith Creek Bridge Site in DeWitt County, he presents an analysis
that summarizes the current state of knowledge of snail use in paleoenvironmental studies
and subsistence models. This report will be a valuable asset to anyone interested in these
aspects of snail studies.
Ellis et al. (1996) and Lintz and Abbot (1997), meanwhile, have been active in using
snails to obtain dates for archaeological deposits using amino acid racemization and carbon
dating techniques. These methods are proving useful for absolute dating of archaeological
remains, and for helping to determine integrity of buried deposits.
Many other examples could be cited. What becomes clear though, in this very brief
literature review, is that the use of snails to understand archaeological sites in Texas has
been building for a number of years. Early studies recognized the potential for snail
analysis, and later works have been developing a framework from which future studies can
proceed. The following section examines three areas of snail studies: use of snails for
dating of archaeological deposits, for reconstructing past environments, and for
understanding prehistoric subsistence patterns.
Method: Dating. The dating of snails has been refined to the point where there is a
real possibility of gathering valuable information from snail shells in archaeological
contexts. It was recognized quite early that snail shells might be useful for providing dates

29
for archaeological assemblages (Allen and Cheatum 1960). Snails precipitate carbonates
that are ingested from local limestone or soils, and the shell therefore dates much older than
the snail itself (Goodfriend 1992:665). It is necessary to test a modern, preferably pre-
atomic bomb sample to enable use of a corrective factor to adjust for an up to 3000 year
discrepancy in carbon dates (Ellis et al. 1996:192). This age anomaly can be corrected for
on a regional basis (Lintz and Abbot 1997:15), and by extension, a database could
conceivably be initiated that would allow for local correlations.
Amino acid racemization and epimerization is perhaps more directly applicable to
snail studies. The difference between the two methods is not immediately clear, and may
be minor, as both are based on the fact that an L-form of a particular amino acid converts
(racemizes [Ellis et al. 1996:192] or epimerizes [Ellis and Goodfriend 1994:184-185]) to a
D-form upon death of an organism. Johnson states that the difference is that in
racemization a true mirror image is produced, unlike the results of epimerization (Johnson
2000:61). Regardless, once the rate is determined it can be calibrated with other absolute
dating methods resulting in a quick, cost-efficient dating method (Ellis and Goodfriend
1994:185).
These methods may be utilized for directly dating archaeological deposits. They
can also be used for determining site integrity. Snails and other carbon-bearing materials
can be extracted from excavation levels and used to determine potential for mixed deposits.
If the dates are not comparable, the site is likely mixed; if the sample indicates clustering of
ages, the deposits are likely intact. At 41ZP39 and 41ZP176 snail and charcoal samples
were dated by AMS methods, and by statistical comparison it was determined that the site
maintained enough vertical integrity to warrant further testing (Lintz and Abbot 1997).
Racemization rates of snails were used by Ellis et al. (1996) indicating that a number of
sites at Fort Hood contained mixed deposits.
Method: Paleoenvironments. Reconstruction of paleoenvironments is another
direction snail research has followed. Snails are capable of informing about past
environments in much the same way as other fauna, and it is the smaller, “microscopic”
snails that are more subject to selective pressure, and so are more reliable indicators of
surrounding environmental variables (Brown 1999:213). There are two methods of gaining
30
information on past environments from snails. One is through survey level data using local
and regional collections, and the other is through experimental studies (Goodfriend
1992:666). Survey data has been used for determining such variables as biome abundance
or frequency, elevation, rainfall amounts and frequency, temperature, and moisture
(Goodfriend 1992: Tables 1 and 3). An assumption that environmental requirements do not
change is necessary to support a good fit with known ecological parameters of modern
populations (Allen and Cheatum 1960:292). This assumption of evolutionary stasis is
expressed through relative scarcity or abundance of snail species based on fluctuations in
favorable climates, ignoring the implications of selection embedded in this comparative
process (Goodfriend 1992:669).
An equally complex issue is determining relationships between different aspects of
the environment. Variables that interact to produce today’s climatic regimes may not have
been in place in the early Holocene, when the factors controlling the Earth’s orbit were
different enough to produce increased seasonality in the northern hemisphere relative to
present conditions (Goodfriend 1992:669). Careful measurement of snails from datable
contexts may help resolve some of these issues, as shell size is dependent partially on
available moisture and temperature, as well as population density (Brown 1999:217).
Comparative studies utilizing other lines of evidence may allow environmental factors to be
teased apart from micro-evolutionary changes.
Another means of reconstructing past climates is through experimental research on
present populations (Goodfriend 1992:666). Controlling primary factors of light,
temperature and moisture can provide information on mortality rates, reproduction, feeding
habits, and mobility (Goodfriend 1992:667). Randolph (1972) conducted experiments on
two species native to central Texas, Mesodon roemeri and Bulimulus dealbatus (Rabdotus).
She was able to show that a fluctuating environment results in generalized species behavior,
and conversely, less species diversity (Randolph 1972:934). Using a standard biological
diversity index (Shannon-Weaver), it became apparent that a less variable environment
(woods), contained a richer diversity of snail species than did the more diverse grasslands,
where snail variability dropped (Randolph 1972:936-937). The seeming discrepancy of
grasslands described as environmentally more diverse than woods is due to a greater range
31
in temperature and relative humidity in the grasslands (Randolph 1972:936) and may also
be the result of a number of micro-habitats (downed wood, small bushes, etc.) within the
broader grass zone (Ken Brown 2000: personal communication).
Method: Subsistence. A long-standing issue revolves around the question of
whether snails formed a portion of the subsistence base or whether their presence in
archaeological sites is the result of enriched human midden deposits attracting existing
populations. Although it is generally accepted that Rabdotus species were a food source for
prehistoric populations (e.g. Simmons 1956, Allen and Cheatum 1960, Jelks 1960, Johnson
1964), some others maintain that even the extremely dense populations seen at some
archaeological sites are the result of “commensal scavengers” (Brown 1999:243). A
method that may help resolve this issue, the use of off-site control samples, is little utilized
(Brown 1999:244). If on-site snail deposits are denser than those found off-site, there will
be strong evidence for a correlation between human and snail populations, although what
kind of relationship will still require clarification.
Brown (1999) argues that an active campsite is a very poor environment for active
Rabdotus populations; foot traffic and soil compaction resulting in lessened soil moisture
would not support viable populations. Not until the site has been abandoned for a long
enough period to revegetate will it be favorable for recolonization. Therefore, in a well
stratified site, snails should be found in zones free of cultural material, if they are indeed
recolonizing previous human occupation zones. It remains possible that enriched soils
would support rich plant growth that potentially might reach a level supporting snails more
rapidly than surrounding areas. This factor, combined with mixing of deposits could
account for the dense concentrations of snails seen in many sites (Brown 1999:243-248). A
possible objection to this line of thought (if subsistence is being argued for), that other snail
species should follow similar patterns, can be countered if there is a lack of snail
concentrations by species other than Rabdotus (Brown 1999:249).
Ethnographic accounts indicate that snails were used as a food resource. Apparently
Cabeza de Vaca witnessed consumption of snails by Native Americans (Clark 1969:43,
1976, Hester and Hill 1975). North African groups, both recently and prehistorically,
conduct activities that result in large piles of burned rock, called rammadyat, that are quite
32
similar to the burned rock middens of central Texas (Honea 1962:317), and one of the
primary purposes seems to be the preparation of snails and other food resources (Honea
1962:318). The modern Hadza of Tanzania are reported to harvest a particular species of
land snail during the wet season (Woodburn 1970:45). The modern Maya collect snails for
subsistence purposes and evidence strongly suggests prehistoric populations did as well
(Healy et al. 1990).
Archaeologically, snail clusters accompanied by cultural material is good evidence
for snail consumption, and Brown lists a number such cases, some where snails numbered
in the thousands (Brown 1999:248-249). Looking at ratios of adults to juveniles may also
be of use. If adults are present in numbers exceeding those found in general populations it
is reasonable to suggest that they were being selectively gathered (Neck 1994:496). Clark
calls for an analysis of coprolites (Clark 1973) and although snail shell fragments have been
found in some samples, diagnostic body portions such as radulae, part of the feeding
mechanism (Clark 1969) have not been recovered (Clark 1973, Brown 1999:250), which
indicates that the recovered shell may have been introduced accidentally into the diet.
Although it appears that snails (Rabdotus sp.) could have been, and probably were
consumed on a fairly regular basis, another line of thought is to ask if they should have
been eaten; i.e., following on optimal foraging theory can it be shown that snail
consumption would be a rational and energetically realistic subsistence choice within a
prehistoric diet.
Potential Of Optimal Foraging Theory To Understand Snail Consumption. As
introduced above, optimal foraging theory includes the concepts of diet breadth and patch
choice (Kelly 1995:97). Diet breadth predicts whether a resource will be taken during a
foraging excursion and is based on total acquisition costs (search and handling) compared
to return rates (Kelly 1995:79). The result is ranked resources from which choices of
acquisition can be made. Higher ranked resources will be utilized as primary food sources
and diet-breadth will be low. As the availability of higher ranked resources decreases
acquisition costs rise, and to maintain efficiency in return rates lower ranked resources
become incorporated, and diet-breadth increases (Kelly 1995:84).
33
Incorporating resource “patches” into the model more accurately depicts
distributions of resources across any particular section of terrain. Searching a resource
patch becomes part of acquisition costs, and a patch remains productive as long as it can
provide a return rate higher the mean of the total environment, once the costs of moving to
that patch are factored in (Kelly 1995:91).
Combining these two models allows prediction of which area will be chosen and
what will be the focus of the acquisition activity (Kelly 1995:97). Optimal foraging theory
thus becomes a method from which predictive or explanatory models from a wide range of
situations can be tested (Smith and Winterhalder 1992:51). Optimization can also be placed
within the broader perspective of evolutionary ecology, which examines how potential
reproductive fitness determines human choice-making, and, ideally, why some choices are
made over others (Smith and Winterhalder 1992:60)
Differing return rates are dependent on several factors. For instance, in the Ache
diet, the paca has a higher number of kilocalories per unit than does deer, but also has a
much longer handling time (encounter plus acquisition), and so has a substantially lower
return rate, and correspondingly is ranked lower than deer (Kelly 1995: Table 3-5, 85). If
only acquisition and processing costs are calculated food sources can be ranked in a more
general sense (Kelly 1995:79-80, Table 3-3). It follows that if processing costs are
unavailable, then indices of nutrition, such as calories, protein, fats or carbohydrates must
be used as a baseline to which experimental or ethnographic data can be added.
A standard application of optimal foraging models involves the use of net calories
for any particular food item (Simms 1987, Kaplan and Hill 1992:169, Bettinger 1987:133,
Hawkes and O’Connell 1985). Experimental gathering exercises coupled with empirically
obtained caloric values result in tabular arrays of resources in rank order. The energy-as-
currency debate has led to the questioning of the relevance of optimal foraging approaches
(Martin 1983, Bettinger 1987:134) and perhaps more usefully, to a reevaluation of the
currency. Although energy may be the simplest approach (Kelly 1995:102), there seem to
be an increasing use of more involved models which recognize the importance of various
aspects of diet. Keene for example, looks at the Netsilik Eskimo and determines that if only
caribou utilized to meet their base energy requirements there would be resultant, major
34
deficiencies in calcium and ascorbic acid (1979:390). Ache men seem to concentrate their
expenditures acquiring meat which has a lower return than other gathering acquisition
activities they could chose (Hill 1988). One possible explanation is that by continuing to
hunt, the mean foraging return rate is lowered, thus ensuring, according to optimal foraging
theory, wider diet breadth with a greater range of nutrients. The problem, of course, is that
the initial premise runs counter to optimal foraging predictions; if the men can raise their
caloric return, they should do so, even should it mean that they forgo hunting activities in
lieu of gathering. This assumption in turn denies the potential for increased reproductive
fitness the prestigious act of hunting confers on successful men (Hawkes et al. 1991:89).
An increase in variables requires an increase in model complexity. This has been
attempted through linear programming (Belovsky 1988, Keene 1979, Reidhead 1980), and
indifference curves (Hill 1988, Kaplan and Hill 1992). These models are complex and
difficult to approach, and in part, perhaps, for these reasons others have used somewhat less
rigorous inductive techniques based on a general but increasingly refined knowledge of
basic nutritional requirements (Speth 1991, Sobolik 1991, O’Dea 1991) with relative
resource abundance (Sih and Morgan 1985), mechanisms of food sharing (Hawkes et al.
1991) and time management (Smith 1979:70) all being recognized as confounding factors
in “early” (Hill 1988) or “simple” (Sih and Morgan 1985) optimal foraging models.
The nutritional value of Rabdotus species has not previously been known, but it has
been thought to be high in protein and low in carbohydrates and fats (Brown 1999:250).
Brown presents figures of generic cultured snails as containing approximately 80 kcal, 16
grams of protein, 2 grams of carbohydrates, and 1 gram of fat per 100 grams of snails. This
compares well with snails known ethnographically to be consumed by lowland Maya
populations (Healy et al. 1990), although the carbohydrate values of the aquatic snail they
consume is considerably higher, at 12 grams per 100 grams of meat. Kilocalories are
comparable to rabbit (73 kcal/100gm) but considerably less than deer (126 kcal/100gm),
and both mammals contain higher amounts of protein and fats, but no carbohydrates (Healy
et al. 1990:Table 2, 178). The post encounter return rate for deer in the Great Basin
averages to 24,700 kcal/hour, while that of jackrabbit averages to 14,400 kcal/hour (Kelly
1995:Table 3-3). Based simply on return rates deer would be ranked higher than rabbit.
35
Because return rates for snails are not known it is possible to use a simple comparison
based on total kilocalories. Such an approach would run counter to optimal foraging theory
through the abandonment of energy balance (return rate) principles, and furthermore, as
will be shown below, would result in drastically erroneous conclusions. Snails would be
ranked higher than rabbit, but lower than deer.
Diet breadth has now been addressed, but the question of patch choice remains to be
clarified. Rabdotus is colonial in its habits, maintaining localized populations that become
active during periods of high humidity (Fullington and Pratt 1974:14). The species escapes
high temperatures by climbing above super-heated ground and estivating on upright
vegetation (Randolph 1972:934) or seeking shelter underground (Hubricht 1960:69) or
under rocks and logs (Fullington and Pratt 1974:14). Colonies may be as large as a city
block (Hubricht 1960:69). Densities of 1.8 to 18 individuals per square m could therefore
be found in prickly pear (tuna) patches along with rabbits and woodrats (Brown 1999:250),
and presumably in other locations as well.
Rabdotus, then, is a prime candidate for testing with an optimal foraging model. Its
colonial, or “patchy” nature combined with periods of high availability, and thus low
acquisition costs, might tend to boost its ranking relative to otherwise more valuable but
potentially less predictable resources having higher associated costs. Under the right
conditions, a dense patch of snails could conceivably become highly ranked within a diet
breadth widened by even a relatively minor fluctuation in larger game animals. Once
Rabdotus species are quantified as to nutritional value, and experimental gathering and
processing activities are conducted, a clearer picture of when Rabdotus might enter a
particular subsistence strategy should emerge.
CHAPTER 4
DEFINING THE STUDY AREA
Site 41BL116 in the Central Texas Lampasas Cut Plain provides the archaeological
data used to support the contentions presented herein. The site is representative of
occupation sequences consistent with the Late Archaic and Late Prehistoric periods in
Central Texas. This chapter begins by briefly introducing the site and then placing it more
fully within the known cultural chronology for the region. Central Texas is not only a
cultural area, but an environmental zone as well. Various implications of environment are
therefore discussed as they relate to the physical and cultural aspects of the study area.
The Site
Site 41BL116 is a stratified open camp located on an alluvial terrace some 40 feet
(12 m) above the junction of the Lampasas River and a tributary creek in southern Bell
County, Texas (Figure 1). Test excavations coupled with examination of looter-pit profiles
indicate main occupation during Late Archaic times and a distinct but seemingly more
ephemeral occupation during the Late Prehistoric period. Temporal diagnostics are
Pedernales dart points at one extreme, and a Perdiz arrow point and broken ceramics at the
other. In between are Williams, Marcos, Montell, Ensor, Fairland, Darl, and Scallorn
points. Burned rock is dense in Archaic levels and bone, mussel, and snail is well
preserved. Total depth of deposits is approximately 1.5-2 m.
Besides the diagnostic projectile points, a large number of bifaces in various stages
of completion have been recovered, as well as waste lithic material associated with such
activities. The lithic assemblage has not yet received intensive analysis, but preliminary
assessments indicate most flakes are small (1-3 cm) and generally lack significant amounts
of cortex. Cores and large chunks are virtually nonexistent. When flakes larger than 3 cm
in any one dimension are examined, a large proportion of them show evidence of use.
Numerous informal tools are present, most often represented by flakes which show
36

37
evidence of use or intentional retouch. Formal scrapers, however, are rare, as are gouges
and adzes.
To date, 259 tools have been recognized, of which 100, or 39%, are considered
informally or expediently used flakes. Out the remaining 159 formal tools, 66, or 41.5%
are recognizable projectile points, while 85, or 54.5% are unfinished bifaces. As single
gouge and seven formalized unifaces (scrapers) round out the formal tools.
Groundstone is also present, most notably in the presence of a large, bifacial, basin
shaped metate. Handstones, or manos, have been recognized, but most often were located
out of context. The overwhelming majority of raw lithic material, other than chert, is
limestone, which makes recognition of grinding implements problematic.
Site Area
Figure 1. Location of site 41BL116 in Central Texas.
A number of burned rock features have been documented. These typically are
shallow basin hearths, usually around 60 cm in diameter, and containing one to three
courses of stone. Other, smaller clusters of burned rock are also present, and may be rake-

38
out piles or small hearths. In other instances burned rock is densely packed within levels,
but with no recognizable patterning, and perhaps may best be described as sheet or proto
middens. In one instance, what appeared to be a rock-filled pit was recognized in the south
wall of the block area. It was approximately 40 cm in depth and narrowed from
approximately 60 cm in diameter at the top to perhaps 20 cm in diameter at its base.
Unauthorized excavators unfortunately destroyed much of this feature within the wall, but
not before it was mapped and photographed. This feature is immediately adjacent to what
may be the largest hearth-like feature recognized to date, a basin that may be 1.5 m in
diameter and up to 30 cm thick.
The most common item found within these deposits are snails, in particular
Rabdotus and Olygira species. Mussel shell is also extremely common, and often found
burned and in direct association with burned rock features. Features consisting of
concentrations of snail, mussel, lithics and bone are not uncommon. A number of these
have been collected in their entirety. One such feature contained two unmatched mussel
shells placed lip to lip, with the resulting cavity containing a Rabdotus snail shell and a
fragment of bone.
A single 1 x 1 m unit has been the focus of detailed data recovery, with an emphasis
on snails. Both 1/4 and 1/8 in screen have been used for all matrix, and substantial flotation
samples have also been collected. The result is an added level of control in snail recovery,
and it is the data from this unit, referred to here as the test column, that is the basis for the
analyses presented in this project.
Bone at the site seems to be well preserved, although generally fragmentary, usually
appearing splintered and broken. No large, complete pieces have been recovered, but a
cursory examination indicates most can be classified as small to medium mammal, and
some deer has been positively identified (Barbara Meissner 2000: Personal
Communication). Complete bone have typically been phalanxes, most probably from deer,
and occasional rodent and perhaps bird bones recovered from 1/8 in screens. A few fish
vertebra have also been recovered, although no otoliths have been recognized.
Soil samples have been retained from the test column, as well as from feature matrix
and levels in which there is a perceived quantity of charcoal. General matrix samples have
39
been floated, and have produced quantities of “microscopic” snails accompanied by various
amounts of organic material (primarily charred wood). Three feature flotation samples
were submitted for macro floral analysis, but the amount of charred material in the matrix
was insufficient for detailed analysis (Phil Dering 2001: Personal Communication). Soil
samples were also submitted for analysis of pollen and diatoms. The pollen analysis
provided data indicating that plant species presently in the area were present prehistorically
as well, and there was evidence of differential preservation, limiting somewhat the utility of
the analysis (John Jones 2001: Personal Communication). A diatom analysis was
somewhat more fruitful, and indicated that water conditions prehistorically were, at least at
times, substantially different (generally more marshy or lacustrine) then at present (Barbara
Winsborough 2000: personal communication).
Four carbon samples were submitted for dating, three by liquid scintillation
methods, and one by AMS methodology. The dates have been consistent with expectations,
(except for one that was dated to 285 ±40 years BP), falling at 3140 ± 45, 2385 ± 105, and
2065 ± 45 years BP, with older dates representing deeper stratigraphic levels.
These excavations are designed as test level investigations. They have indicated
that preservation is fair to good, disturbance is relatively minimal, and potential for data
recovery is high. Additional investigation, both at the site and in the laboratory, promise to
clarify many aspects of site function. Present levels of investigations have been sufficient
to initiate the present project, and to allow the interpretations presented below to be derived.
Site data is presented as needed below in more detail to illustrate or support the
applications or interpretations. A detailed site description and analysis awaits completion
of field investigations.
The Study Area
Through examining various local ecological parameters a model based on broad
global patterns can be developed. This model can be used to test site data and to explore
regional patterns of settlement. The process begins by gathering empirical information on
various environmental aspects of the area of interest. These are compared to previously
40
assembled databases containing similar information correlated with ethnographically
known societies. A link between environment and culture is thus established, allowing the
qualitative aspect of culture to be placed within a quantitative frame of the natural world.
This is, of course, only an exercise, and not designed to be an end in itself, but rather a
means of establishing questions that can be asked of the archaeological record.
Central Texas Defined. The study area falls within the region normatively defined
as “Central Texas.” The term has various meanings. Central Texas is actually a construct
based somewhat on an aesthetic rendering of Texas into pieces, in part on observed overlap
in cultural markers, and in part on environmental commonalities. There can be seen
indicators that certain groups of people used the region for similar purposes at similar
times. As Ellis et al. (1995) point out however, the associated markers of these potential
groups, be they socially or technologically distinct, extend well outside of what is generally
referred to as Central Texas.
Ellis et al. (1995:Figure 1) summarize three of the more distinctive constructs of
Suhm, Brown et al., and Prewitt. Their regions overlap to various degrees, and regional
edges vary widely. The broadest area was defined by Suhm (1960) and encompasses large
portions of the Blackland Prairies and the Southern High Plains, as well as encroaching
upon the Pecos area and East Texas Piney Woods. Brown et al.’s (1982) region limits
northern and eastern boundaries, but extends the western portion deep into the Pecos
region. Prewitt (1981), strikes a middle ground, with boundaries more confined in a
visually central core.
Common to all these schemes is a multiplicity of Blair’s (1950) biotic regimes. All
encompass at least four of his biotic provinces, with Brown et al.’s very nearly approaching
a fifth. Central Texas, therefore, regardless of how it is defined, has available the resources
and characteristics of various ecological regimes, with a resulting ecotonal condition. As
Johnson (1995) states, far from being a distinct “province,” Central Texas is a transition
zone between more identifiable ecological areas. Ellis et al. (1995) extend upon this notion
and show some ten or eleven distinct biotic subregions, which are in turns islands,
surrounds, or intricate interfingerings of ecological zones. The result is a complex interplay
41
of factors that if taken to an extreme, could render the Central Texas concept irrelevant,
especially if the concept of culture following ecology is accepted.
Central Texas is therefore arbitrarily defined. Prewitt’s 1981 version of Central
Texas, which encompasses all of the Edwards Plateau, and adjacent portions of the
Blackland Prairies, Lampasas Cut Plains, South Texas Brush Country, and the Lower Pecos
(Prewitt 1981, 1985) can perhaps best be seen as a compromise solution, and one that has
established itself in much of the literature. When Central Texas is referred to in this study,
it will be a general reference to Prewitt’s boundaries. Of interest, though, is Ellis et al.’s
(1995) mapping of the overlap of some of the more common diagnostic artifacts generally
associated with Central Texas. This results in a much more restricted zone, and although
they do not make a specific argument for it, might be a reasonable alternative, one that also
includes the present study area.
The culture area is defined by similarities in observed and perceived cultural traits,
and further tied together by environment. If culture is shaped by environment, it might be
logical to first discuss the ecological parameters of a study area. Central Texas, however,
has a well-established cultural chronology which developed independent of complex
environmental considerations, relying more on recognition of cultural traits and seriation of
artifacts for establishing conceptual culture change. What follows, then, begins with a
discussion of the established culture history and concludes with the regional environment.
Culture History. The Central Texas Archaic is a period of Texas prehistory that is
linked by similarities in subsistence, technologies, social patterning, and most obviously,
projectile point styles. Before examining the Archaic specifically it is useful and perhaps
necessary to examine the underpinnings of first the period concept and then the
environmental bases that to a large degree helped shape the patterns visible in the
archaeological record.
The concept of “period” grew out of attempts by archaeologists to place the material
record into meaningful contexts. Drawing on McKern’s Midwestern Taxonomic System
(McKern 1939), early Texas practitioners, such as J. E. Pearce (1932), J. Charles Kelley
(e.g. 1947) and Suhm et al. (1954), began organizing the largely lithic artifact assemblage
based on stylistic attributes. As some of these were from obvious contexts, associations
42
were made between known time frames and stylistic commonalities, with a resulting
division of the prehistoric period into Paleoindian, Archaic, and Late Prehistoric or Neo-
American periods. The Archaic and Late Prehistoric periods were drawn in large part from
better studied and more well known Eastern Woodland assemblages, with the Archaic
representing pre-agriculturists pursuing a hunting and gathering economy, and the Late
Prehistoric representing introduction of horticulture and agriculture, ceramics, advanced
weaponry (the bow and arrow) and concomitant social complexity. Paleoindian peoples
were of course seen as nomadic hunters of extinct megafauna.
Although archaeologists of the 1930s and 40s initiated sequences of projectile
points in a chronological framework it was not until work by a new vanguard of
investigators in the early 1960s that the long-lasting cultural chronology only now being
substantially altered was introduced and partially substantiated. Of importance for the
Archaic period was work at Canyon Reservoir; the Wunderlich, Footbridge, and Oblate
sites (Johnson et al. 1962), work at Devil’s Mouth in the Lower Pecos (Johnson 1964), and
work at the Bell County Youngsport (Shafer 1963) and Stillhouse Hollow sites (Sorrow et
al. 1967). These stratified sites from three distinct portions of Central Texas built upon and
reinforced one another, and to a large extent defined the culture history of the Archaic for
the region.
Prewitt (1981, 1985), and before him Weir (1976) made attempts at further dividing
prehistory, particularly the long-lived Archaic, into phases. This was an attempt to refine
the culture history and make it more manageable and diagnostic, perhaps in hopes of
allowing more thoughtful inquiry into underlying causes of change. Unfortunately, it
resulted to some degree in a cookbook approach wherein a single diagnostic artifact might
result in assigning a whole suite of characteristics to any particular aspect of an
investigation. Although Prewitt himself cautioned that these were provisional and subject
to refinement, it was not until sometime after Johnson’s (1986) review of the problem that
these phases began to fall out of common use.
What was left then, was a return to Early, Middle and Late Archaic periods, which
were defined, and are being redefined, on a broader suite of cultural and environmental
factors. There is now an enhanced culture history in place (Johnson and Goode 1994, ,

43
Johnson 1995, Collins 1995), which provides the general framework of what happened and
when, against which questions of how change occurred can be placed. Underlying
questions of why this change happened can now be addressed more fully and meaningfully.
First evidence of human occupations in Central Texas date to what is known as the
Paleoindian period. This period is defined as prior to 8500 years BP. The Paleoindian
period has been divided into two distinct periods (Collins 1995: 376, Table 2), with the
earlier Clovis, Folsom, and Plainview cultures present at 11,500 B.P. These early people
are typically thought to have subsisted on varieties of big game, the Clovis on mammoth
and extinct forms of bison, the Folsom and Plainview on bison. New evidence is
suggesting that this view is in error, and that these people utilized the big game when
necessary or advantageous, but subsisted on a substantial percentage of smaller game as
well (Collins 1995:381). This early Paleoindian period was followed by a Late Paleoindian
period, which has subsumed portions of Prewitt’s Early Archaic. For example, the
Golondrina style point, placed in the Early Archaic by Prewitt, has been placed in the late
Paleoindian period by Collins (1995:376) based on distinctive features such as edge
grinding and size. Lifeways, however, seem to indicate a more archaic lifestyle (Collins
1995:382). This has been termed a transitional period, with Paleoindian strategies slowly
giving way to broader-based pursuits of the relatively more sedentary hunter-gatherers of
the Archaic (Johnson 1989:52).
The entire Central Texas Archaic spans some 7500 years, from ca. 8500 BP to
around 1250 BP. It can be characterized generally as a time of increasing human
populations adapting within a fluctuating but generally warming climate. Following
Collins (1995) the Early Archaic begins around 8500 BP, and lasts until 6000 BP. The
Middle Archaic follows and lasts until around 4000 BP, followed by the Late Archaic I to
2500 BP, and the Late Archaic II, to about 1200 BP. The Late Prehistoric, or as Johnson
now refers to it, the Post Archaic, follows, and here the phases mentioned earlier seem to
hold fairly well, with Austin phase peoples around until about 800 BP when a seemingly
true cultural horizon (Johnson 1994), the Toyah phase, began.
Foraging cultures are immediately dependent upon natural resources for subsistence.
It follows that much information about lifeways can be gathered if ecological conditions
44
can be ascertained. Collins et al.(1993) and Johnson (1995) have both examined lines of
evidence to suggest warming and cooling trends, and these are both through the proxy of
moisture, as temperature is very difficult to arrive at. Collins et al. depend heavily on
pollen analysis, which provides information on plant regimes from which climatic data can
be extrapolated. Johnson utilizes various lines of data, including pollen and microfauna
from buried contexts at Halls Cave, and also dated evidence of aggradation or lack thereof
of stream side terraces, with the assumption being that surfaces aggrade (or deflate) during
wetter times, but remain stable during drier times. Their interpretations agree very closely
for the Middle and Late Archaic, but are in direct opposition during much of the Early
Archaic. Collins is also somewhat more conservative, avoiding some of the fine-grained
peaks and valleys seen in Johnson’s reconstruction (Collins 1995:Table 2, Johnson
1995:Figure 35).
The Early Archaic was a time when persons were having to adapt to the widespread
extinction of the large animals that had existed during the preceding Paleoindian period.
Although the big game hunting nomadic lifeway has been shown to be largely a stereotype,
mobility was probably high and populations relatively low (Collins 1995:381, Johnson
1989). This basic way of life extended into the first part of the Early Archaic. Dart points
are described as Early Split Stem, and include the Gower type first defined at the
Youngsport Site (Shafer 1963). Johnson has determined the period was relatively moist
(Johnson 1995:Figure 35), while Collins shows it as fairly dry (Collins 1995:Table 2). Both
indicate that the beginning and end of the period were opposite what they showed for the
majority, i.e., a peak of either dryness or wetness at about the middle of the period.
Evidence suggest there were no bison (Collins 1995:383).
The question of bison presence or absence is very significant for understanding
human behavior. Bison, and to a lesser degree antelope, prefer open grasslands and
prairies, and are also social animals, traveling in large herds. The habits of these large
bodied mammals can be contrasted with the largely solitary habits of woodland preferring
deer. In most cases bison would be considered to have high return rates, tempered to some
extent by high processing costs. The results would be evident in scheduling, mobility, and
technology of prehistoric people. In general, bison could be expected in tall grass prairies
45
as opposed to, for instance, oak savannas. Increases in available moisture favors tall grass
over short grass, but also can result in replacement of grasslands by woods. Johnson
suggests that bison favored dry conditions in Central Texas (Johnson 1995:86). Collins
indicates bison were present in both wet and dry conditions, and it is difficult to derive any
patterns from his projected data (Collins 1995:Table 2). The strongest correlation is
between moisture loving microfauna at Halls Cave and a long period of bison presence
through the Late Archaic. At other times bison are seen when all other indicators are of dry
conditions. Perhaps the best explanation comes from Ellis et al.’s (1995) discussion of
environmental diversity. Differential change on a micro or meso scale favored bison
presence or absence on a scale too fine grained to be reasonably compared with broader
climatic shifts.
The Middle Archaic shows climatic conditions of Collins and Johnson coming into
fairly close alignment. Both agree that there was an initial period of fairly mesic conditions
followed by a period of drying. Johnson sees a fairly mild and slow paced change, while
Collins sees an almost catastrophic drought. Regardless, it is at this time that rock features,
designed in the Early Archaic for efficient control of fire-produced heat, expand in function
and complexity, coinciding with a spread of xerophytes from the west due to drying
conditions, and resulting in the burned rock middens that begin to be seen (or at least are
more common) during the end of the Middle Archaic (Collins 1995:384, Prewitt 1991:26).
Projectiles in the first part of this period are thin, broad-bladed Bell/Andice/Calf
Creek types, deeply notched points that are believed to have been used both for hunting
based on impact breaks, and as knives, as seen in microwear analysis. This is consistent
with a specialized hunting economy, and the apparent bison presence at that time would be
an obvious target of a multipurpose projectile/knife (Collins 1995:384). The disappearance
of bison coincides with the replacement of these types with narrow, thick, heavy Travis and
Nolan points. Johnson sees precursors of the bison tool assemblage coming in from the
Plains, and precursors of these latter points perhaps from the Lower Pecos, in the form of
Pandale points (Johnson 1995:88). This is suggestive, as the Plains would of course have
had bison, while they were largely absent in the Lower Pecos. Perhaps the new style was
more efficient for the newly high-ranked deer, which would surely have replaced bison as
46
the preferred meat source. Toolkits in general became more diverse, as diet breadth
widened and generalization became necessary in order to effectively intensify the use and
processing of lower ranked food sources (Prewitt 1981:73).
The Late Archaic, as noted earlier, is divided into subperiods I and II. The first
portion saw a continuation of the dry period initiated earlier, and burned rock midden
accumulations peaked at this time. The Bulverde point, although in some respects similar
in form to Travis/Nolan points, is seen, at least by Johnson, to be a distinct technological
break, and again to have apparent influences from the northeast and Plains regions (Johnson
1995:89-90). It is this break combined with a continuity seen in succeeding Pedernales
types, as well as the extent of burned rock midden accumulations that has resulted in this
major reordering of this portion of the Archaic.
Also appearing about this time was the Marcos-style point, another broad bladed
point with deep corner or side notching, similar in some respects to the Pedernales, at least
in width of blade. It is at this time that Late Archaic I shifts to Late Archaic II, and the
climate seems to become much moister. Apparently bison are present throughout most of
the Late Archaic, even as narrow bladed Ensor/Fairland points begin replacing the broader
Marcos/Williams/Marshalls.
One interesting way of explaining this seeming discrepancy would be by having
these latter points hafted on arrows (Tomka 1998), with an underlying (but wholly
subjective) assumption that darts did not have enough penetrating power for bison and so
the emphasis was on a wide blade causing extensive hemorrhaging. The penetration of
darts was perhaps sufficient for deer if a narrower blade was used. A narrow blade
propelled by a bow, however, might have enough penetration to effectively kill a bison.
Regardless, increased moisture saw a retreat of the xerophytes, and a corresponding
decrease in the construction of burned rock middens, especially in the eastern portion of
Central Texas.
There is also evidence of increasing populations, and processing of plants other than
xerophytes is evident based on an increase in numbers of groundstone from these
components (Collins 1995:385). It is not clear what was being so extensively processed
with these implements. Acorns and grass seeds are two possibilities. Cemeteries became

47
more widespread, as does evidence of internecine warfare (Hall 1981:iii). Combined, these
would suggest an attachment to land and protection of resources, and also a certain increase
in environmental stress or resource depletion. As well, Johnson sees general technologies
arriving from the plains, while social variables seem to be influenced from Woodland
cultures to the east and northeast (Johnson 1995:96, 97). In short, it seems to be a time of
rapid changes in social complexity with resource intensification and a broadening of the
diet base, most likely as a response to the demands of increasingly large human
populations.
The Late Prehistoric period seems to be a continuation of Late Archaic lifeways up
until Toyah times when bison reappeared, as did a more nomadic life as well as
technologies (blades and specialized scrapers) not seen since Paleoindian times. The Late
Prehistoric period has been subdivided into two distinct intervals by Collins (1995: 385),
which correspond to Prewitt’s Neo-Archaic Austin and Toyah Phases. The early Late
Prehistoric, or Austin Phase, shows a distinct trend towards arrow points, but the Archaic
lifeways seem to persist. The late Late Prehistoric corresponds to the Toyah Phase, and
cultural remains indicate a shift back towards a hunting subsistence base. Bison apparently
became common once more in Central Texas (Collins 1995:377 Table 2, Prewitt, 1981:84),
and prehistoric peoples evidently took full advantage of that resource. This period of
course came to its conclusion shortly after the arrival of Europeans to Texas in the early
16th Century, marking the beginning of the Historic Period.
Site Setting. The study area is located in an area of Lower Cretaceous limestones
and marls (Pearl 1997). The Fort Hood area to the north has an underlying geology that
ranges from Glen Rose though Paluxy Sand, Walnut Clay, Comanche Peak Limestone and
Edwards Limestone/Kimachi Clay undifferentiated (Nordt 1992:4), all Lower Cretaceous in
age. Site 41BL116 is within the Glen Rose formation, which consists of non chert-bearing
limestone, dolomite and marl to a thickness of 380 feet (Barnes 1974). The Glen Rose
Formation has been exposed, primarily by stream downcutting, within the later
Fredricksburg Group (Pearl 1997:21), which contains Edwards Limestone, Comanche Peak
Limestone, Keys Valley Marl, Cedar Park Limestone, and Bee Cave Marl, as well as small
48
areas of the Georgetown Formation, with the Edwards Formation limestone apparently
containing the majority of chert (Barnes 1974).
The soils that have developed in the general area are primarily of the Speck-Tarrant-
Purves association, with a large area of the Denton-Purves association to the north, and the
location of 41BL116 very near the eastern edge of the Trinity-Frio-Bosque association,
which forms a narrow band on either side of the Lampasas River, ending very nearly at
Youngsport, where the surrounding Speck-Tarrant Purves association replaces it along the
river (Huckabee et al. 1977). Each of these associations can contain a number of differing
soil types, but are linked by similarities in occurrence, even though the individual types
may differ considerably (Huckabee et al. 1977:2). Complete descriptions of all relevant
soil types can be found in the SCA Soil Survey (Huckabee et al. 1977), so only the more
general associations and specifically relevant soil types will be discussed here.
The Speck-Denton-Purves association are shallow upland soils that are gravelly,
loamy and clayey and occur over limestone. The Denton-Purves association are shallow to
deep clayey soils over limestone, commonly associated with upland settings. The Trinity-
Bosque-Frio association are deep soils formed in alluvium and are loamy to clayey in
nature. Soils specific to 41BL116 are Frio silty clays, in which the site itself is found, and
Denton silty clays immediately adjacent, with a nearby pocket of Purves silty clay. The
Frio soil series are up to 78 inches in thickness, grade from a dark grayish-brown to brown,
and are calcareous, clayey, and somewhat alkaline. A buried A horizon is common at
about 40 inches (100 cm) in depth. There is no B horizon and the C horizon is a brown silt
calcareous clay with calcium carbonate threads and films. The soils tend to be well drained
with slow permeability, high water capacity, and slow runoff. (Huckabee et al. 1977:16).
Denton soils are dark grayish-brown to dark brown calcareous, alkaline soils to a depth of
35 inches over a 20 inch thick B horizon consisting of a dark brown silty clay, terminating
abruptly in a fractured limestone R horizon. These soils have rapid runoff and are well
drained with slow permeability and high available water capacity (Huckabee et al. 1977:13-
14). Purves soils developed out of a limestone R horizon below 14 inches and consist of
dark-brown calcareous and alkaline silty clays. These are likewise well drained soils with
49
slow permeability, but water capacity is low and runoff can be slow (Huckabee et al.
1977:26).
Frio soils are described as well suited for grains, grasses, legumes and herbaceous
upland plants, as well as hardwood trees, shrubs and vines. They are good for open-land
wildlife such as quail, dove, rabbit and fox, but only moderately suited for rangeland
wildlife such as deer, bobcat, raccoon and turkey. Denton soils have fair sustainability for
grains, grasses and herbaceous plants but are well suited for hardwoods, shrubs and vines.
They have fair suitability for both open-land and rangeland animal species. Purves soils do
not support grains and grasses, but have fair suitability for herbaceous plants and
hardwoods. Open-land animal suitability is poor, although rangeland animals are fairly
sustainable. Wetland environments are not supported by any of these soils (Huckabee et al.
1977:49-50).
Understanding the soil types aids in determining and understanding potential
catchment areas (Jarman et. al 1972). Bosque soils are seen near the river and Tarrant-
Purves association and Speck series soils in more upland settings. Tarrant soils are almost
identical in suitability ratings to Purves soils, while Bosque soils are similar to Frio soils.
The large areas of upland Tarrant-Purves soils are therefore most likely to harbor rangeland
animal species, herbaceous plants, hardwood trees, shrubs and vines, but not in great
frequency or abundance. The large areas of lowland/floodplain Bosque soils are well suited
to grasses, herbaceous plants, and both open and rangeland animals. There are numerous
other soil types mapped, but these are fragmented in distribution, and introduce a level of
detail too varied for the present.
The Lampasas River is the dominant drainage for the immediate vicinity, with a
basin measured at approximately 3224 square kilometers (Pearl 1997:24). The Lampasas
joins the Little River which then merges with the San Gabriel before entering the
overarching Brazos River system. Quaternary fluviatile terrace deposits and recent
alluvium are common along the Lampasas and its tributaries (Barnes 1974). Three terraces
have been identified above the modern floodplain at heights of 8 m, 10 m and 16 m above
the modern channel (Pearl 1997:26-29). The modern floodplain, at 5 m above the modern
channel is subject to flooding every second year, while the first two terraces may flood
50
every five to six years and every 10 to 20 years respectively, while the third terrace (T3) is
not expected to become flooded.
The geology provides the raw material from which soils develop, and helps
determine the nature of the drainage systems. Soils can be more or less favorable to certain
types of plants and animals. Climate, especially expressed as rainfall and temperature,
influences not only soil development (Huckabee et al. 1977:69), but also the types of
vegetation that can exist in a region, with the vegetation influencing the animal
communities (Krebs 1994:458, Blair 1950:93).
The climate is referred to variously as humid subtropical (Huckabee et al 1977:72)
and dry subhumid (Thornwaite, in Blair 1950:113). Annual precipitation in Texas
decreases from east to west, from a high of over 50 inches a year to a low of eight or less
(Carr 1967:4). The project area lies very near the 32 inch isocline, so rainfall averages 30-
34 inches per year. Bell County average yearly totals are 33.87 inches (Huckabee et al.
1977:72) and the 34 and 32 inch isoclines mark the eastern and western edges of the
Lampasas Cut Plains (Carr 1967:20).
Temperature, meanwhile, increases from northwest to south, with a mean annual
temperature of 54 degrees Farenheit in the extreme Panhandle to 74 degrees in the lower
Rio Grande Valley, with the project area averaging between 66 and 68 degrees (Orton
1969:887). The average warm (growing) season, based on first and last freezes, closely
follows temperature gradients, and ranges from 185 days in the northwestern portion of the
state to 320 days in the south. The 245 day cline runs directly through the project area,
indicating a warm season of between 230 and 260 days (Orton 1969:891). In Temple, the
date of the first freeze is typically November 24, while that of the last is March 10,
producing a warm season of 259 days (Orton 1969:902).
The study area falls within Blair’s (1950) Balconian province, the biotic
components of which are varied. The floral assemblage includes oak, hickory, mesquite,
elm, hackberry, pecan, cypress, and the seemingly ubiquitous juniper. Bear grass, agave
species, and even pinyon pine extend from the west into portions of the area (Blair
1950:113). There are 57 mammal species documented, 16 lizard species, and numerous
snakes, frogs, toads and amphibians (Blair 1950:114-115). Historical accounts include
51
mentions of bison, mustangs, and antelope in Travis and adjoining counties (Brown ca.
1900:1.35).
The vegetation regime is a mosaic of Oak-Mesquite-Juniper Parks/Woods with a
secondary component of Live Oak-Mesquite-Ashe Juniper Parks within the broader Cross
Timbers and Prairie ecological area and very near the junction of the Blackland Prairies
(McMahon et al. 1984:3, and map). Parks are defined as woody plants at least nine feet tall
growing individually or in clusters creating an 11 to 70% canopy over non-interrupted
grasses and forbs. Woods are taller, from 9 to 30 feet in height with a dense canopy of 71
to 100% and little to no midstory (McMahon et al. 1984:2). The Oak-Mesquite-Juniper
Parks/Woods are found as associations or mixtures of the larger woody species in upland
settings of the Cross Timbers and Prairies and contain blackjack, post, Texas, shin and live
oaks along with Ashe juniper, cedar elm, agarito, soapberry, sumac, hackberry, pricklypear,
persimmon, mesquite, and various grasses, especially the grama varieties such as hairy and
sideoats (McMahon et al. 1984:15). The Live Oak-Mesquite-Ashe Juniper Parks are very
similar, but somewhat more diverse, and are associated with uplands and ridge tops of the
Edwards Plateau.
Climate, soils, vegetation and topography all combine to create a region commonly
referred to as the Lampasas Cut Plain, described as “dissected limestone plateau country
with rolling hills and easterly flowing drainages” (Collins 2001:3), which has been lumped
into a larger North-Central Texas Region (Carr 1967:3). This region falls within Blair’s
Balconian and Kansan provinces, and further, represents a transition between the Edwards
Plateau, the Oak Woods (Cross Timbers), and the Prairies, is somewhat wetter than the
majority of the Edwards Plateau and has taller trees, but also contains fewer drainages and
more open grasslands (Ellis et al. 1995:405-406).
In summary, the study area is an area of varied resources, both plant and animal, has
moderate to mild temperatures, and an aridity tempered by abundant groundwater sources.
This would be an undoubtedly attractive location for prehistoric settlement and land-use
systems. The next chapter views these specific environmental aspects from a global
perspective, and a comparative approach is applied to create a model useful for
understanding cultural and social adaptations.
CHAPTER 5
AN EXERCISE IN MODEL CONSTRUCTION
Ecological Parameters
Environmental data can be used as a means of comparing regions on a global scale.
The assumption is that people react and adjust to similar environments in similar ways.
Based in large part upon Murdock (1967), and other studies with relevant data, comparative
analyses can be attempted across a wide variety of areas and cultures. By observing
patterns on a global scale a model for regional patterns can be constructed and tested.
These methods have the potential for allowing greater understanding of the archaeological
record.
Of underlying importance in model construction is the concept of productivity.
Primary productivity refers to the amount of raw biomass an environment can produce in
any given area over any period of time. Most measurements of production do not include
below-ground biomass, as this variable is very difficult to measure accurately, and so the
measure is net above-ground annual productivity (Rosenzweig 1968), also referred to as
primary production (Kelly 1995:69), or PP, specifically defined as the annual amount of
new biomass produced in one square m. (Keeley 1988:379). These raw figures, usually
measured in grams or kilograms per unit area, give a gross indication of the amount of
energy potentially available for organisms on successive trophic levels.
A problem is encountered though, in that not all of the PP is available for immediate
consumption by other organisms. This is addressed in a variety of fashions. One involves
the use of primary biomass, which is a measure of the standing amount of vegetation at any
instant in time. Interestingly, as primary biomass (PB) increases, there is a decrease in
available material for energy resource, due to more plant energy being invested in low
value growth than in reproduction, which forms the tissues most likely to provide
sustenance for organisms (Kelly 1995:121). Such PB rates are a more accurate indicator of
available resources.
52
53
Central to all these figures are the abiotic portions of the ecological system. Of
primary importance are temperature and rainfall, which combine to produce
evapotranspiration rates. Effective temperature (ET) is a measure of overall solar radiation
within a year across a particular area (Kelly 1995:66). This measure can produce a gross
scale of relative resource abundance, correlated roughly latitudinally. Rainfall, of course,
determines how much water is available to encourage plant production. Actual
evapotranspiration rates (AE), on the other hand, are a measure of how much moisture is
returned to the atmosphere through evaporation and respiration. This measure can be used
to determine PP values, as it measures both solar energy and water availability, which are
the limiting variables for successful photosynthesis (Rosenzweig 1968:73).
Evapotranspiration rates are difficult to obtain and dependent on various factors, including
the maturity, or nearness to climax, of the specific environment (Rosenzweig 1968:70).
Rosenzweig, however, states that for arid environments actual evapotranspiration is almost
identical to precipitation (Rosenzweig 1968:68).
The study area encompasses parts of three counties; Williamson, Burnet, and Bell.
Owen and Schmidly (1986) provide climatological data for the entire state, which was
divided into quadrats. The relevant areas were measured from stations in Austin, Burnet,
Gatesville, and Temple. This baseline data provided figures from which other relevant
figures were derived, and were chosen due to their relative closeness to the study area, both
in distance and in geographic location. The study area is centrally located between all four
stations, and all four stations are located either on or very near the edge of the Balcones
Escarpment.
Effective Temperature: The equation for determining effective temperature found
in Kelly (1995:66) was utilized. The high mean temperature and the low mean temperature
from the four relevant quadrats (Owen and Schmidly 1986:107, 108) were averaged (29.11
and 9.33 °C respectively), with a corresponding ET of 15.50.
Primary Productivity: Primary productivity rates are given in Owen and Schmidly
(1986:107,108). These are somewhat more variable then temperature, and generally
decreased from north and east to south and west. The mean PP figure was 1523 gm/ m2/yr.
The low figure was for the Burnet area, while the higher number was for Temple. This
54
appears to be more a factor of rainfall than temperature, as rainfall was more variable than
the high tempreature means (although there was an obvious difference in low mean
temperatures).
Primary Biomass: Primary biomass was calculated using the formula given in Kelly
(1995:121) for arid environments. Arid and humid environments are differentiated
primarily by ET values, and Kelly (1995:121) places the study area’s ET figures within arid
constraints. The value was 10.75 kg/ m2.
Results. The environment, based on ET values, fell between temperate desert and
tropical/subtropical desert (Kelly 1995:117) or between warm temperate and semitropical
(Binford 1980: Table 2). Blair also describes the region as arid to dry and recognizes
widespread oak, mesquite, juniper and hickory (Blair 1950:113), also referred to as woods
and parks (McMahan et al. 1984). With a warm season of around 250 days, and average
rainfall rates of around 30 inches (Orton 1969:888, 891), ET values may not be the best
means of arriving at an environmental descriptor. The study area, based on these various
data, will be described as semi-arid woodland .
When the regional ecology was placed into various models in Kelly, almost
invariably the one cultural group associated with a similar environment was the Hadza of
sub-equatorial Africa (1995:122, 128). No other foraging groups were found within the
ecological parameters being considered. This lack of broad associative data may be the
result of many hunter-gatherer groups being removed long ago from favorable temperate
environments (e.g. see Headland and Headland’s [1997] discussion of the principle of
competitive exclusion). Regardless, even such limited comparisons are valuable when
comparing global models to local realities.
The Model
Defining the ecological factors that are broadly predominant in the study area allows
construction of a global comparative model. Such variables as effective temperature,
evapotranspiration rates, primary productivity, and primary biomass allow definite
boundaries to be placed around theoretical expressions. Once global comparisons are made
55
groups most closely associated ecologically can be analyzed, with resulting data referenced
to produce a local model of environmental adaptations. This hypothesized settlement
pattern can then be field tested, with results, positive or negative, duly accounted for.
Perhaps of greatest value is the possibility that construction of the regional model based on
a global perspective may encourage more intensive investigations in areas or theoretical
dimensions previously under-explored by regional investigators.
Subsistence. Various lines of reasoning suggest this type of environment is more
conducive to gathering of plant materials than to primary use of hunted protein. The Hadza
rely on non-hunted resources for 65% of their subsistence base and consume no fish (Kelly
1995:131, Woodburn 1968). Based on an ET value of 15, Binford, using ethnographic data
from Murdock (1967), determined that 64% of described groups based subsistence on
greater than 60% plant foods (1990:132, Table 9). Fishing or dependence on other aquatic
resources was absent in 47% of the sample (Binford 1990:135, Table 10). Ten and 20%
dependence on aquatic resources was found in 11% and 12% of the sample, respectively,
while higher dependence rates were negligible (one group each at 30 and 40 percent;
N=14).
When division of labor is scaled against ET values, men are seen to provide
between 30 and 48% of food resources (Kelly 1995:264). ET values between 15.1 and 15.9
produced very similar results from the Great Basin and Australia (Kelly 1995:Table 7-1). If
the common assumption of men as hunters is allowed, then the result is that women are
gathering approximately 60% of the overall food resources, which further indicates
substantial dependence on gathered plant foods. A ratio of vegetable to meat subsistence of
around 70:30 indicates an energy maximizing, as opposed to time minimizing, subsistence
strategy (Belovsky 1988:332). This subsistence data has implications for social structure
and group interactions. The acquisition of calories takes precedence over producing free
time, which indicates less time is spent in family and leisure activities (at least by women).
Storage is tightly connected to subsistence and mobility strategies. Storage may be
a form of resource intensification, allowing greater sedentism (especially over winter), or it
may be incidentally based on windfalls of resource abundance. As storage increases there
are changes in group mobility patterns. Reliance on storage increases the likelihood that

56
groups will utilize logistical procurement strategies, and in turn, trend towards collectors as
opposed to foragers (Binford 1980:351). Rafferty (1985) recognizes pottery as a means of
storage and part of the process of intensification eventually leading to, or at least enabling,
sedentism (1985:119-120). Six groups in environments with ET figures of between 14.9
and 15.9 have minimal storage, most often using baskets to store dried nuts and seeds
(Binford 1990:142, Table 14). Based on latitude and population densities Keeley
determined storage values would be low, with value codes of 0-2 on a scale of 5
(1988:385).
Mobility. Based on an ET value of 15, (there were only three groups presented for
ET values of 16), Binford classifies foraging groups living in similar environments as
primarily semi-nomadic (1990:131, Table 8), represented by over 78% of the 14 groups
within that ET range. No groups were found to be fully sedentary, while 14.3% were fully
nomadic, and the remainder semi-sedentary.
Kelly plotted primary biomass figures against residential mobility patterns, and
when the Hadza, this region’s closest analog, are evaluated, they were shown to move about
27 times per year (1983:281). This is an outlying figure, however, falling well outside the
curve formed by multiple cross-cultural comparisons, which indicates a residential shift of
perhaps five times per year, based on this study area’s PB figure of 10.75 kg/ m2 (Kelly
1995:122). This drastic difference is undoubtedly due to confounding variables in the
environments, possibly such as water and secondary biomass availability, and also resource
intensification procedures such as storage or even horticulture.
What remains, then, is to produce a value based on the study region’s ecological
parameters. As the study area has been described as temperate, but arid woodland, rather
than the tropical desert of the Hadza, and the PB figures are relatively low, indicating
moderately high levels of available plant food resources, and seasonal variability indicates
concomitant variable resource availability, local groups would best be described as semi-
nomadic, with the high rate of moves by the Hadza of 27 times per year tempered by the
low figure of five moves per year. This high spread of potential mobility rates is justified
by the aforementioned lack of direct ethnographic analogies in similar environments (i.e.

57
there is little direct comparative data), and may be one of the more testable portions of the
overall model.
Territory and Territoriality. Territory is here defined as how much land a group will
encounter in any given year. One method of determining territory would be to simply
multiply number of moves by distance moved to develop a linear figure. This of course
would not be an accurate measure of actual territory as defined by land forms and resources
the mobility was designed to encompass. The Hadza, for instance, cover a total area of
2520 square km (Kelly 1995:114), a figure not readily discernible from previously supplied
data. The figure for the Hadza, then, can be assumed to be the high end of the territory
range for the study area, primarily due to lower levels of mobility as noted above.
Subsistence strategies also provide clues to territory size. Increased dependence on
hunted resources increases range (Kelly 1995:130). As already established, the study area
is expected to receive 30-40 % of food resources from hunting. Out of 10 groups within
this range, eight had territories smaller than the Hadza, with the majority maintaining
procurement areas of 100-1000 square kilometers. The Hadza once again provide an outlier
figure which will provide an outer limit, while other variables are considered and used to
temper the extremes.
Territoriality is the cultural awareness of who the land belongs to. This sense of
belongingness is often expressed in defensiveness, which is a willingness to risk the costs
of defending an area in order to reap assumed benefits (Kelly 1995:189). Empirical figures
were not used by Kelly (1995:190), but an intuitive overview of the study area suggests that
low resource density coupled with low resource predictability would result in relatively
greater dispersion and mobility (than to other groups in dissimilar environments), and of
interest here, lessened territoriality (Kelly 1995:190, Figure 5-4). This may be partially
supported by rainfall data. Precipitation rates peak in May and September, with
approximately 4 and 3 inches each of these months, respectively. Much of the rest of the
year receives less than two inches in any given month (Carr 1967:7). Such variability may
well affect distributions and predictability of resources. So, on a cost/benefit analysis, the
potential cost of defending a territory is not worth the fairly low yield within any given

58
area. As long as populations are free to move to new locales in such environments,
defensive strategies should remain low and resource intensification should be unnecessary.
Group size. The Hadza are documented as maintaining group size between 20 and
60 persons (Kelly 1995:211, Keeley 1988:382). They furthermore have a population
density of 15 persons per 100 square kilometers (Kelly 1995:226). A group of 20 persons
would therefore be expected to utilize 130 square km, while the larger extreme, 60 persons,
would inhabit close to 400 square km. In one of the few direct mentions to groups close to
the study area, the Karankawa, found further to the south, had a population density of 19 to
42 persons per 100 square kilometers (Kelly 1995:Table 6-4, Keeley 19888:383), a figure
which falls well within the Hadza model. It should be noted that Kelly’s data places the
Karankawa in temperate forests (ignoring the coastal plain environment they may be more
closely associated with [e.g. Patterson 1995, Gatschet 1891]) while the Hadza’s
environment is described as tropical/subtropical desert (Kelly 1995:225, 226).
Social organization. Social organization is a concept which can only be approached
with extreme caution, especially with the data currently being utilized. The ephemeral
nature of hunter-gatherer sites in the archaeological record makes such applications very
difficult to test. It is perhaps for this reason that relatively little comparative data is offered.
The strongest line of evidence would be in the observed fact that men provide between 30
and 48 % of food in similar regions with identical ET values (the Great Basin and Western
Australia), while with the Hadza, with a slightly higher ET value, men produce only 20% of
the subsistence base (Kelly 1995:264). These figures reinforce concepts of a male-
dominated society. If the assumption of low resource predictability is continued, bilocal
post marital residence is the most likely scenario for the study area, as there is no advantage
for a man to remain in his native territory, but there may be an advantage to moving for a
period of time to his wife’s locale, thus increasing his overall knowledge of regional
resources (Kelly 1995:272-273).
It is probably safe to assume the prehistoric people of the study area were simple, as
opposed to complex, foragers. Such variables as unpredictable environment, terrestrial,
largely game-based diet, relatively high residential mobility, low population densities, little
food storage, and limited territoriality all are indicators of such groups. Extrapolating from
59
the known variables assumptions can be made about other aspects of foraging life in the
study area. Such groups likely would have been egalitarian with little to no corporate
structure, specialization would have been limited to the elderly, competitiveness in resource
acquisition would have been unheard of, while resources would have been diffused widely.
Accumulated wealth would have been extremely rare, as would have been warfare and
slavery (Kelly 1995:294).
Shelter. Binford (1980, 1990) has provided data suitable for model construction,
some testable, some not. Assuming the group in question leads a semi-nomadic existence,
several assumptions can be made about housing. Such people would have been most likely
to have resided in semi-circular houses (69% of 93 groups) (Binford 1990:123). Of interest
is that no semi-nomadic groups were found to be living in circular houses, which were
reserved exclusively for fully nomadic peoples, and less than 13% of those. Both fully and
semi-nomadic people would have probably placed their houses directly on the ground
surface, as opposed to semi-subterranean or raised earth structures (Binford 1990:124). It is
also likely, especially among the semi-nomadic groups, that some sort of alternative
(seasonal) housing would have been utilized. Such housing would have had a roof and side
made of the same material, most likely grass, as would have the primary (winter?) housing
(Binford 1990:125-128). Hides would be the more likely roofing ( and therefore siding )
material for the primary houses of fully nomadic groups (Binford 1990:126). Housing
portability would have been fairly low. The presence of alternative housing, a relative lack
of dependence on hunted foods, and readily available natural resources would not have led
to transporting houses between locations (Binford 1990:129). The expected house
structures would most likely have been used on a seasonal, repetitive basis.
The Local Model
The global information provided above can now be synthesized into a local model
based on global patterns. This model can then be tested against the known archaeological
record.
60
Local prehistoric people were semi-nomadic groups of up to 60 persons covering up
to 400 square km of semiarid woodland. They would have moved residences up to 27
times a year, with an average distance of eight km between locations. Total territory
covered was up to 2500 square km, with between 19 and 42 persons per 100 square km in
density. They would have subsisted on plant resources for 65% of their caloric intake, and
would have used almost no aquatic resources. Warfare would have been limited or
nonexistent. Men would have provided most of the hunted meat, while women would have
provided most of the food. The social structure would have been egalitarian, with little
competition for resources and very little specialization. Post-marital residence was
probably bilocal, although inheritance rules may well have been patrilineal. They would
most likely have lived in semi-circular houses covered entirely with grass, with some
structural discontinuities between summer and winter houses. They did not take their
houses with them when they moved. Storage was probably limited to incidental
accumulations of seasonally abundant nuts and grains which were dried and kept in baskets,
pots, or subsurface pits.
If the model is taken to its extreme, what follows is a picture of prehistoric people
gathering along river and creek banks in early fall and establishing or repairing fairly
substantial structures. They would stay at these sites for one to four months, and typically
have good success at exploiting abundant faunal and floral resources. As spring
approached they would begin to make logistical forays, most likely testing various patches
for abundance. Then, as various resources either reached fruition or declined in abundance,
residential moves were made to accommodate the changing environment. Summer months
may have necessitated more frequent moves, as any stores would be exhausted as available
resources dwindled. Chances are good these people followed well established paths which
took them in a circular route over a changing landscape, never, however, far from water.
Fall was a welcome respite as they returned to winter haunts, waiting to enjoy the crops of
nuts, grains, and seeds, as well as the camaraderie of friends and family last seen some
months previously.
This idealized interpretation suggests that there may be various archaeological
signatures that could be used to support or negate its alternative aspects. Because it is

61
largely subsistence based, evidence from prehistoric subsistence activities might be the
most direct evidence. Site 41BL116 contains high numbers of the land snail Rabdotus. If
its presence can be shown to be the result of intentional foraging behavior, it may provide
some of the data that might be used to test portions of the model. The following two
chapters follow various lines of reasoning to suggest that snails were consumed at the site.
It will then be possible to pursue these larger questions.
CHAPTER 6
QUANTIFYING SNAIL POPULATIONS
It should be remembered here that there are two distinct, but not entirely unrelated,
research questions. The first, which is discussed in the present chapter, involves
determining if Rabdotus snails from an archaeological site (in this case 41BL116) can be
distinguished from naturally occurring snail populations. If on-site snails exhibit a
population structure that can be shown to be distinct from off-site populations, then a link
between human occupations and snail presence will be supported. Such a link would
suggest, but certainly not prove, that snails were a dietary item.
One method of supporting the hypothesis would be to determine if on-site snails
contained a lower percentage of juveniles than off-site, or natural populations. The
assumption here is that human foragers would be more likely to gather the larger and
presumably more visible adults, with a resulting gathered population therefore containing a
greater number of larger specimens. If a number of juveniles comparable to natural
populations, that is, smaller snails, are found within site deposits, it would run counter to
optimization expectations, and a direct cultural explanation for snail presence could be
largely discounted.
Another approach is by comparing densities of snails from on-site and near-site
deposits. Should densities be similar, a cultural explanation would again be discounted. If
there are considerably more snails in cultural deposits than in nearby non-cultural deposits
in identical environmental settings, then the snails could be considered the result of direct
(gathering) or indirect (the commensal scavenger theory) cultural processes. If on-site
snails are found to be significantly larger than natural populations and also found in greater
quantities, human gathering is strongly supported.
Once human gathering is supported and becomes a working assumption, the
concepts of optimal foraging theory can be applied. This requires knowledge of caloric and
nutritional values for the food items in question, and thus requires live snails for analysis.
62

63
The gathering of live snails leads naturally into additional analyses from which net return
rates can be determined, which is the second research question, addressed in Chapter 7.
The methodology involved in this project may be subject to various complaints.
These might include those mentioned previously, complaints that may be lodged against
optimal foraging theory and models. Another potentially troubling aspect of the research to
some might be the assumptions forced by the use of modern snail samples to extrapolate to
prehistoric populations. Without detailed knowledge of environmental factors it becomes
difficult to state emphatically that a modern sample is representative of non-extant
populations.
This is a recognized issue in archaeology, and one that has been addressed, perhaps
most usefully, through the concept of middle range theory. Bettinger describes middle
range theory as a method of “developing better links between theory and data through
theories of limited sets” (1987:124), where “limited sets” refer to limited sets of behavior
that can be contrasted with general behavioral sets that lead to “highly abstract” and often
“difficult” higher order theory (Bettinger 1987:121).
Binford, who Bettinger acknowledges as one of the leaders in middle range
applications (Bettinger 1987:125), became interested in faunal assemblages at human-
hominid sites with an applied focus on early sites in Europe, Asia, and Africa (Binford
1981). He was concerned that assumptions of human activity had been too broadly applied,
resulting in false interpretation of early human activities. He felt the way to clarify these
issues was through more clearly defining human activity through recognizing its products in
the faunal record (Binford 1981:7). Because an archaeological site rests within geological
deposits, the association between human and naturally introduced materials cannot be
casually assumed (Binford 1981:18). The archaeologist works in real time, and is therefore
attempting to interpret the past through an empirical frame grounded in the present (Binford
1981:22). This requires a “reasoning process”—the middle range—an assumption of
uniformitarian processes (Binford 1981:22).
By accepting the assumption, it then becomes possible to use “actualistic studies” in
order to apply the knowledge gained from living systems to those that can no longer be
studied in fact, meanwhile realizing that the assumptions may be proved false (Binford
64
1981:27). However, present day living systems that also existed in the past “warrant” such
uniformitarian assumptions, and by continued middle range testing in various realms such
assumptions may be increasingly supported (Binford 1981:28, 29).
This can be easily seen as applicable to the controlled collections of snails, both
living and dead, in order to determine various aspects of snail ecology and how human
interactions with snail populations might result in differential community structure,
especially within death assemblages. Binford argues that testing must be accomplished in
this manner, and that the middle range theory must be divorced from more general theory,
primarily because of the preconceived, paradigmatic ideas such theory imposes. Once the
middle range is fully established, it can then be applied to the archaeological record in
pursuit of higher order theory (Binford 1981:29). In the present case, snail research can be
carried out within an optimal foraging perspective, which Bettinger indicates falls within
his “limited sets” (Bettinger 1987), but not necessarily, from Binford’s perspective,
structured explicitly within a framework of evolutionary ecology. Once the hypothesized
optimality aspects of snail procurement are established and supported, however, it is then
possible to take that body of data and apply it to the bigger model, to find that particular
aspect of behavior and place it in the larger cultural system.
This is a reasonable and compelling argument, but one that Bettinger calls the “myth
of middle range theory” (Bettinger 1987:127). Although Bettinger is a strong supporter of
the concept, he feels that it cannot be separated from more general “sets” of knowledge and
theory. Although observations of dynamic systems are often the focus of middle range
research, it is not the extant system itself that is of interest, but the “processes and
principles” that can be applied in a more general sense that are of concern. Removing the
limited sets of data from more general contexts relegates the data to the observational level,
when it is the underlying logic that is of importance (Bettinger 1987:129-130). Such logic
may be proven true or false, but either outcome “can have true implications” (Bettinger
1987:131). It is through open ended research that recognizes an intrinsic link between
limited and general sets that progress in both arenas can be made.
The differences are actually minimal, and seem to relate more to issues of timing
than overall approach. Binford is essentially attempting to remove bias, while Bettinger
65
wants to keep the research grounded and focused. Both are interested in furthering the
development of the greater science, and both feel that pursuing the open-ended, actualistic
studies that middle range theory affords will help accomplish that goal.
The present study probably leans more towards Bettinger’s interpretation. The
snails have been approached through a fairly explicit framework of optimization strategies
couched in the larger concerns of energy studies, ultimately shaped by concepts of
evolutionary ecology. At the same time, the empirically based aspect of the study has been
just that; an inductive exercise designed to determine the quantifiable differences between
natural and potential artificial snail assemblages, as well as determining the nutritional
value of snails. These data feed back into the interpretive system, and are not necessarily
limited to one or another general theory. Those who may choose to utilize the information
may apply it towards goals completely separate from those of evolutionary ecology. Others
may determine that snails were not uniformly structured throughout the prehistoric past,
and conclude that the results presented here are inaccurate. That is also acceptable, because
the present study will have been used, its approaches tested, and the information presented
built upon, just as this study has built upon previous work, both limited and general in
scope. In the meantime, this particular aspect of human subsistence can be pieced into what
is known about other patterns of adaptation, and to some extent add both depth and breadth
to our overall knowledge.
Experimental gathering exercises are an integral portion of this study. The site
assemblage required comparison with a naturally occurring death assemblage in order to
determine population dynamics. The collection of live snails was performed in order not
only to attain a nutritional analysis, but also to mimic foraging behavior and thus establish
energy expenditure rates against which the caloric and food value of the gathered snails
could be gauged.
A number of collecting episodes were required to gather the data that are presented
below. These various collections were performed at different times for different purposes,
some of which were adjusted as the project progressed. These collection episodes are
summarized below in order to create a frame of reference for later discussions. They are
described in more detail later when relevant or necessary.
66
Welder Wildlife Foundation: On May 11-13, 2001 efforts were made to identify
and collect living colonies of Rabdotus species snails at the Welder Wildlife Foundation
(WWF) in San Patricio County near Sinton, Texas. Although living snails were scarce, a
number of transects were established that allowed subfossil shell (defined here as shells
representing potentially extant, as opposed to extinct populations) to be collected. A total
of 2100 square m were surveyed with 541 shells collected in a total of 101.5 minutes. This
will be referred to as the WWF collection.
Brackenridge Field Laboratory 1: On June 22, 2001, a visit was made to the
Brackenridge Field laboratory (BFL) in Austin, Texas. There had been substantial rain
throughout the night, but it had decreased and largely ended by morning. As snails were
expected a time trial process was established and in place. This involved determining both
search and pursuit times, with search determined as time between patches, and pursuit the
time within the patch. Search times were later determined to be problematic, and are not
used in the project. Once the patch was felt to be exhausted, its area was determined by
paced measurement, and a new search was initiated. A total of five patches were exploited,
with a total of 247 snails gathered from 4200 square m with a total pursuit time of 61
minutes. This will be referred to as the BFL1 collection.
Brackenridge Field Laboratory 2: On July 18, 2001 a return visit was made to the
BFL in order to make controlled collections of subfossil Rabdotus snail shells. The purpose
was to collect a sample representing a natural death assemblage. This was accomplished by
concentrating on 100% collection of all Rabdotus shells encountered. Approximately 29
patches, chosen on the basis of observed presence of more than one Rabdotus shell, were
searched within a 200 m sq area. The patch sizes were intentionally left very small
(between 20 and 50 cm in diameter) in order to assure maximum recovery, and only the
very smallest snails would have escaped observation. Once a collection was begun, it
progressed in stages, with first the visible surface shells being collected, followed by
careful hand sifting of the leaf litter and decayed vegetation, slowly clearing it away until
the bare soil was exposed. In most cases the soil was then carefully probed with a hand tool
to a depth of 1-3 cm. All observed Rabdotus were collected. A total of 343 snails were
collected within an estimated 11.5 m sq. This will be referred to as the BFL2 collection.
67
Off-Site Shovel Tests: On July 14, 2001, a series of shovel tests were excavated in
the vicinity of 41BL116 in order to compare the number and population structure with those
collected from the site itself. The shovel tests were 30 cm in diameter (700 square cm)
holes excavated in arbitrary 20 cm levels. Shovel tests that encountered dense cultural
material were terminated. Those that encountered relatively sparse cultural material were
continued under the assumption that there would be a certain amount of “noise” due either
to natural or cultural formation processes. Five shovel tests excavated to 80 cm in depth
recovered a total of 59 shells. This will be referred to as the Off-Site ST collection.
Off-Site Background Collection: On August 11, 2001, a surface collection in the
vicinity of 41BL116 was made to compare with the natural death assemblage as obtained
previously with the BFL2 collection. It resulted in the collection of 97 shells. Collection
here was problematic (discussed below) and times and areas were not recorded. This will
be referred to as the Off-Site2 Collection.
The Site Sample: Snails from the archaeological test column were collected between
February 27, 2000 and December 30, 2000. One hundred percent collection from 1/4 and
1/8 inch screens was attempted. Snails from the site were quantified in various ways as the
research progressed. The first priority was counting them. Due to various constraints,
counting each individual shell was not attempted. Instead, a standardized measure was
obtained through use of a container that was known to hold a relatively constant number of
shells. This number was obtained through a series of tests, in which the container was
filled, and then the contents counted. This was repeated several times until it was felt a
satisfactory average had been achieved. This procedure was used for shells recovered from
both 1/4 inch and 1/8 inch screens. For the 1/4 inch field sort, the shells were first
rescreened through nested 1/2 inch and 1/4 inch screens. The 1/2 inch material was counted
by way of a container holding 50 shells, and the 1/4 inch material in one holding 25 shells.
Each container fill was counted and then multiplied by 50 or 25, as appropriate. Any shells
left over from either sort were counted individually and added to the total. Shell from the
1/8 inch screen was counted using the same method, but with a smaller container that held
35 shells. The majority of specimens from the 1/8 inch sort were incomplete spire portions.
68
Shell collection was based on collection of either whole individuals or the spire
portion of broken shells. It was in this manner that a Minimum Number of Individuals
(MNI) was attained. As counting progressed, it was noticed that many of the larger shells
lacked the spire portion. This most likely resulted in an artificially inflated count. Options
included counting only apertural (the shell opening) sections, but these are fragile, and it
was felt to be an unreasonable alternative. Similarly, strict adherence to a complete or spire
only policy would result in the unnecessary removal of otherwise diagnostic shells from the
analytical assemblage. A rather informal review of the collection indicated that the number
of larger individuals lacking spires was relatively minor, leading to the conclusion that
although the Rabdotus counts were probably somewhat higher than in actuality, the
difference was not substantial, and more importantly, was consistent across levels. The
same logic is applied to potential complaints regarding the actual counting method. What
may be lacking in precision is relatively minor, and once more, is consistent across levels.
Site Collection 1: The first analysis involved obtaining a randomly derived 5%
sample from each of 21 levels in the test column. The snails were initially selected in order
to determine representative counts and measurements on adults and juveniles from the test
column, but once it was determined that the sample size for juveniles was too small to be
statistically valid, it was used instead as a baseline index of width-to-height ratio
representing the general site population. This sample consists of 321 shells and is referred
to as the 5% sample.
Site Collection 2: The second analysis on the archaeological column sample was a
more rigorous effort at determining adult to juvenile ratios effected by randomly selecting
six levels and pulling 240 shells from each. These were analyzed for juveniles, which were
pulled and measured. A closely matching number of adults were then randomly pulled and
measured as well. This resulted in 365 shells receiving measurements. The purpose for the
50/50 ratio of adults and juveniles receiving measurement is based on the BFL2 collection
from which a natural death assemblage of approximately 50% was derived (described
below). This sample is referred to as the 50/50 Site sample.

69
Number of Juveniles
As mentioned, the numbers of juveniles will be used to create class breaks based on
relative size. As will be shown below, it is not possible to directly compare different
populations of snails based on absolute size because of overlaps in characteristics between
populations in different environments and between different species within the Rabdotus
genus. However, by looking at the relationships between adults and juveniles, expressed as
a width-to-height ratio, a relative relationship can be established between populations
representing different species and environmental zones. But first it is necessary to be able
to distinguish between adults and juveniles.
What does a juvenile look like? When attempting to divide Rabdotus into age
categories it is tempting to rely on size as a determining factor. As will be shown, and is
documented elsewhere (Brown 1999), there is considerable overlap in the width (diameter)
and height in adult and juvenile populations. Brown (1999:233-234) has compiled a
number of indicators useful for determining juvenile status. Figure 2 presents three shells
representing three stages of development.
Figure 2 Comparing adult and juvenile Rabdotus. Numbers 1-5 are explained in text.
Numbers 6 and 7 illustrate measurement points for width (diameter) and height,
respectively. Scale in cm.
70
Specimen a is a fully developed adult. Specimen b is an adolescent, retaining some
juvenile characteristics, while Specimen c is more clearly a juvenile. The most telling
aspect of a juvenile is its carina (1), a ridge formed on the basal whorl below which new
shell develops. This carina is still visible in Specimen b (2), but absent in Specimen a. The
apertural lip of the adult (3) is slightly reflected, and at the point of reflection another ridge
has developed, the apertural ridge, which are also called varices. This is seen under
development in Specimen b (4), but is lacking in Specimen c, where the shell at the opening
is sharp-edged and unreflected. The signature of a fully developed adult is known as a
callus, a thicker portion of shell which often displays a distinctive sheen (Specimen a: 5).
Other characteristics include thicker shells and a lower width to height ratio for the body,
but a higher aperture height to total shell height ratio. Coloration is also more pronounced
in younger individuals. Based on Goodfriend (1986:214, in Brown 1999:234) the presence
or absence of a carina is the most telling aspect of the juvenile (or adolescent). It was this
criterion that was most useful when sorting the samples in the present study, (and referring
again to Figure a), both Specimens b and c would have been classed as juveniles.
This approach was not without difficulty. Some individuals were so small in a
relative sense that it was felt certain they were actually juveniles. In such cases the lip was
examined, presence or absence of a callus was determined, and an often fairly subjective
decision was made as to which category to place the shell in. At times relatively large
shells were seen to have carinas, and the same criteria were applied. In some instances
obviously mature shells exhibited irregular bulges on the basal whorls that to some extent
resemble carinas. These were determined to be either a function of age or perhaps the
result of distortion due to burial. These individuals all had calluses and were easily
identified as adults.
More troubling was the incomplete mature adults. These were shells that were
lacking basal whorls, often creating the impression of a thin-lipped carina-endowed
individual. The interior whorls of the shell build upon each other in step-like fashion, albeit
as a spiral. Destruction of later whorls reveal a ridge which closely resembles a carina.
This aspect of snail analysis is perhaps one that might prove most confusing to the analyst.
It was only through experience that implications of remnant shell left on the apparent basal

71
whorl and sudden and unusual changes in coloration from above and below the apparent
carina that relative confidence as to recognition of these specimens as adults was achieved.
Regardless, a level of subjectivity was often present, and must be accepted.
What Does A Natural Population Look Like?
The natural population is later compared with the site population, based on the ratio
of adults to juveniles found within the death assemblage. The first step is to determine the
ratio of adults to juveniles in a natural death assemblage.
Determining the Ratio of Juveniles in a Natural Population. The BFL2 sample was
divided into adult and juvenile groups, and the height and width of each was recorded. The
snails were further sorted through a standard 1/4 inch screen. A total of 315 snails
remained behind. Of these, 171, or 54%, were juveniles. The 28 snails that fell through the
1/4 inch screen were all juveniles. When these are factored in, the percentage of juveniles
rises to 58%. Following Drennan, the error range of the percentage at the 95% confidence
level was determined for the 315 snails from the 1/4 inch screen (Drennan 1996:140) The
sample indicates that a natural death assemblage collected at the Brackenridge Field
Laboratory and sorted through 1/4 inch screen consists of 54% juveniles ± 5.6% (at the
95% confidence level, d.f. = 120), allowing an assumption to be made about Rabdotus
populations in general, that is a natural death assemblage (gathered from 1/4 inch screen)
consists of between 48 and 60 % juveniles (54%±5.6%). In order to simplify the procedure
and make the results more widely applicable, only the shells from the 1/4 inch screen
(n=315) were used in later calculations.
Comparing On-Site And Off-Site Samples: Quantities. Once the natural death
assemblage was established it was possible to compare it with the site collection. First,
however, it was necessary to determine if the quantities of shell within the site were
representative of those outside the site’s boundaries. If the density of snails were similar in
both cultural and non cultural contexts, natural, rather than human agents would be
indicated. This comparison was accomplished through a series of shovel tests designed to
recover snails in contexts lacking cultural material (Off-Site STs collection).
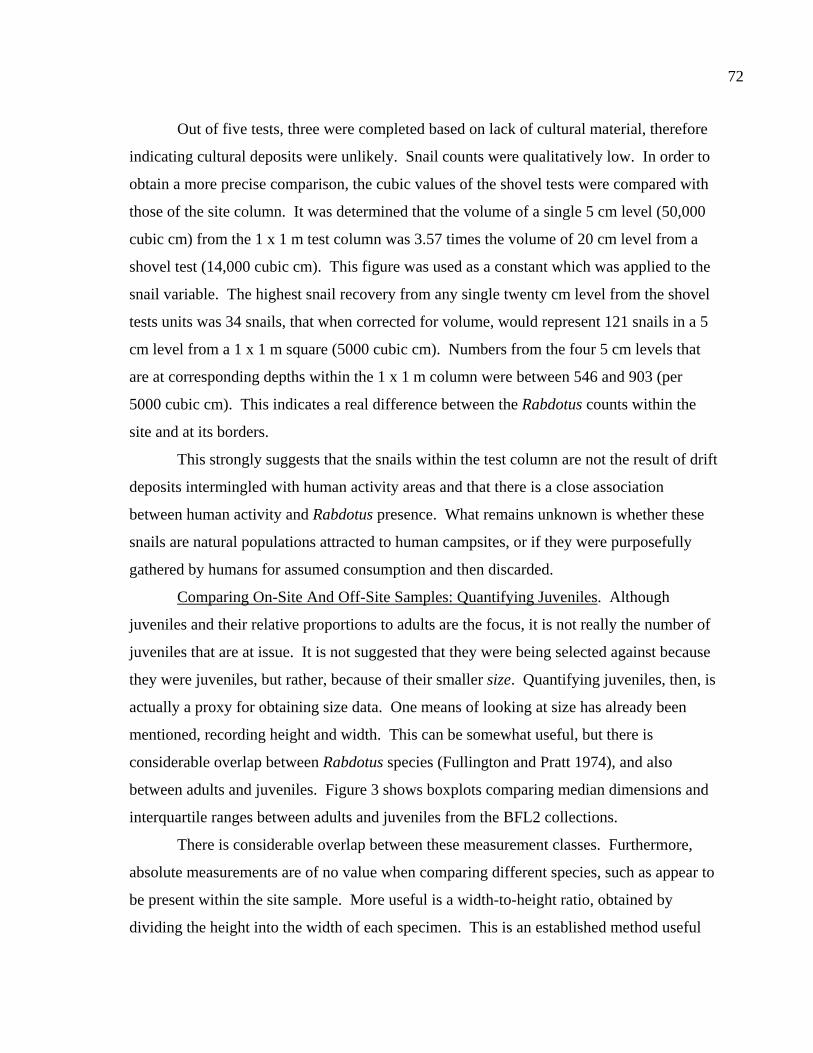
72
Out of five tests, three were completed based on lack of cultural material, therefore
indicating cultural deposits were unlikely. Snail counts were qualitatively low. In order to
obtain a more precise comparison, the cubic values of the shovel tests were compared with
those of the site column. It was determined that the volume of a single 5 cm level (50,000
cubic cm) from the 1 x 1 m test column was 3.57 times the volume of 20 cm level from a
shovel test (14,000 cubic cm). This figure was used as a constant which was applied to the
snail variable. The highest snail recovery from any single twenty cm level from the shovel
tests units was 34 snails, that when corrected for volume, would represent 121 snails in a 5
cm level from a 1 x 1 m square (5000 cubic cm). Numbers from the four 5 cm levels that
are at corresponding depths within the 1 x 1 m column were between 546 and 903 (per
5000 cubic cm). This indicates a real difference between the Rabdotus counts within the
site and at its borders.
This strongly suggests that the snails within the test column are not the result of drift
deposits intermingled with human activity areas and that there is a close association
between human activity and Rabdotus presence. What remains unknown is whether these
snails are natural populations attracted to human campsites, or if they were purposefully
gathered by humans for assumed consumption and then discarded.
Comparing On-Site And Off-Site Samples: Quantifying Juveniles. Although
juveniles and their relative proportions to adults are the focus, it is not really the number of
juveniles that are at issue. It is not suggested that they were being selected against because
they were juveniles, but rather, because of their smaller size. Quantifying juveniles, then, is
actually a proxy for obtaining size data. One means of looking at size has already been
mentioned, recording height and width. This can be somewhat useful, but there is
considerable overlap between Rabdotus species (Fullington and Pratt 1974), and also
between adults and juveniles. Figure 3 shows boxplots comparing median dimensions and
interquartile ranges between adults and juveniles from the BFL2 collections.
There is considerable overlap between these measurement classes. Furthermore,
absolute measurements are of no value when comparing different species, such as appear to
be present within the site sample. More useful is a width-to-height ratio, obtained by
dividing the height into the width of each specimen. This is an established method useful

73
for differentiating the different species (Fullington and Pratt 1974). It was also tested as a
means of looking at the differences between adults and juveniles, and therefore, size
classes.
173142173142N =HeightJuvHeightAdultWidthJuvWidthAdult
30
20
10
0
52
42
73
11012920
Figure 3. Comparing height and width between adults and juveniles from 315 shells sorted
out of 1/4 inch screen from the BFL2 collection.
The 50/50 Site Sample becomes a modeled natural population (MNP), drawn from
the actual site population (ASP). Each member of the 50/50 Site Sample was sorted
according to juvenile or adult status, and width and height of each was recorded. This
provided a width-to-height index approximating a natural death assemblage (from BFL2)
derived from the site sample, and was also a control against which the actual site population
could be tested. (The actual percentage of juveniles from each of the six levels comprising
the 50/50 Site Sample was between 8.75 and 18%, depending on level, with a resulting
mean percentage of juveniles of 12.5%.)
A comparative sample from each of 21 levels was also measured for width and
height, although not separated by age categories (the 5% Sample). These measurements
represent the ASP, and are compared with the MNP. To reiterate, the 5% sample (ASP)
represents the site assemblage, and the 50/50 sample (MNP) represents a natural death
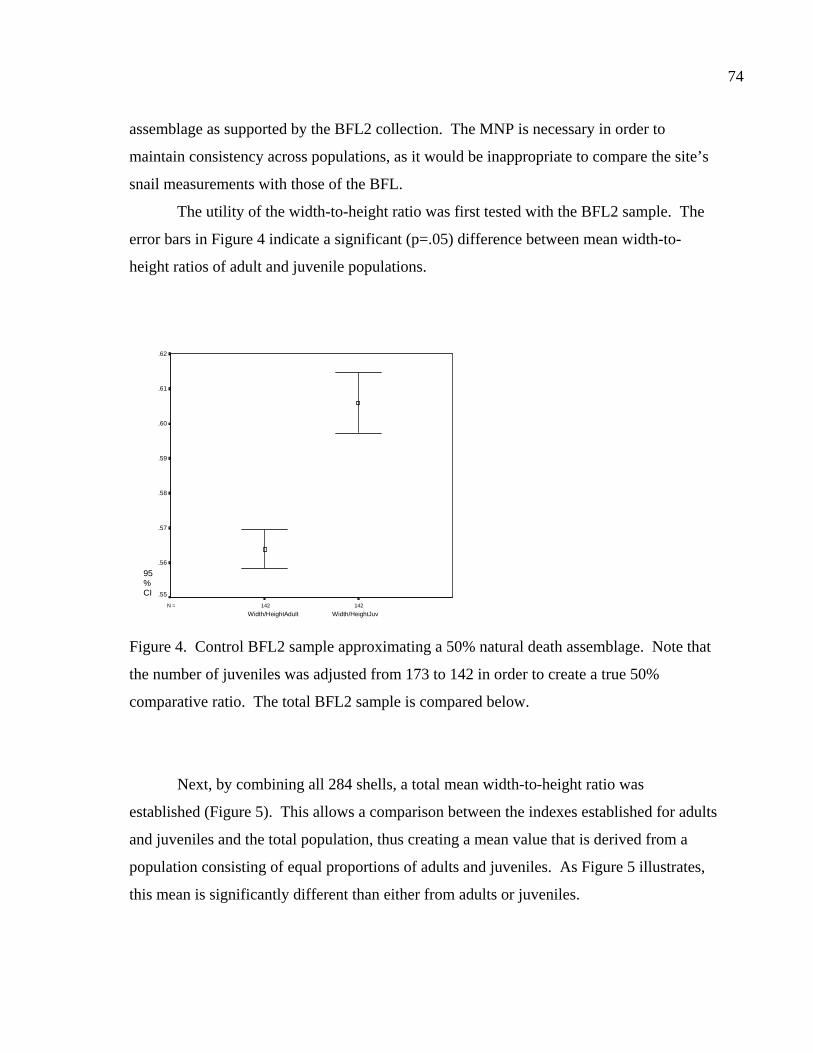
74
assemblage as supported by the BFL2 collection. The MNP is necessary in order to
maintain consistency across populations, as it would be inappropriate to compare the site’s
snail measurements with those of the BFL.
The utility of the width-to-height ratio was first tested with the BFL2 sample. The
error bars in Figure 4 indicate a significant (p=.05) difference between mean width-to-
height ratios of adult and juvenile populations.
142142N =
Width/HeightJuvWidth/HeightAdult
95%CI
.62
.61
.60
.59
.58
.57
.56
.55
Figure 4. Control BFL2 sample approximating a 50% natural death assemblage. Note that
the number of juveniles was adjusted from 173 to 142 in order to create a true 50%
comparative ratio. The total BFL2 sample is compared below.
Next, by combining all 284 shells, a total mean width-to-height ratio was
established (Figure 5). This allows a comparison between the indexes established for adults
and juveniles and the total population, thus creating a mean value that is derived from a
population consisting of equal proportions of adults and juveniles. As Figure 5 illustrates,
this mean is significantly different than either from adults or juveniles.

75
284142142N =50%TestWidth/HeightJuvWidth/HeightAdult
95%CI
.62
.61
.60
.59
.58
.57
.56
.55
Figure 5. Control BFL2 sample approximating a 50% natural death assemblage, with the
combined mean of the adult and juvenile populations added.
The 50% portion of the BFL2 sample was next compared with the total mean of all
315 shells gathered from the 1/4 inch screen for the same collection. Figure 6 allows a
comparison between a 50% natural death assemblage and that actually encountered.
315284142142N =
TotalMean50%TestWidth/HeightJuvWidth/HeightAdult
95%CI
.62
.61
.60
.59
.58
.57
.56
.55
Figure 6. Control BFL2 sample approximating a 50% natural death assemblage with actual
death assemblage from 1/4 inch screen sort added and compared to the combined mean of
the adult and juvenile populations (TotalMean).
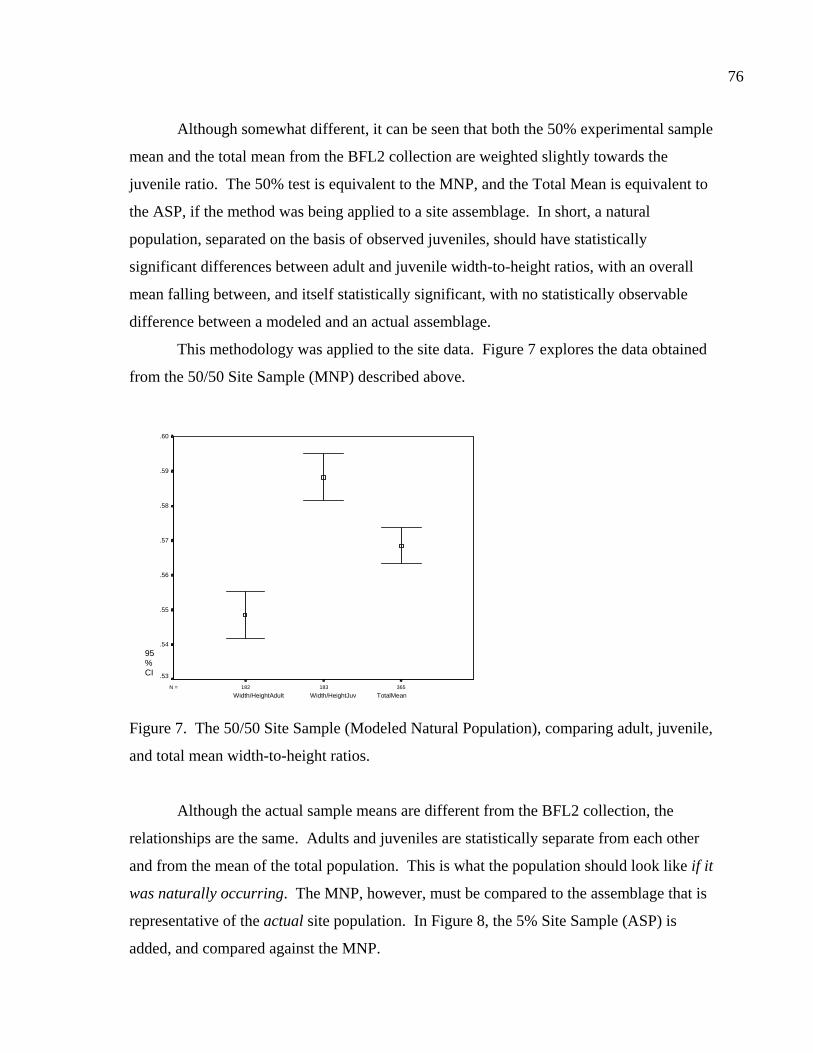
76
Although somewhat different, it can be seen that both the 50% experimental sample
mean and the total mean from the BFL2 collection are weighted slightly towards the
juvenile ratio. The 50% test is equivalent to the MNP, and the Total Mean is equivalent to
the ASP, if the method was being applied to a site assemblage. In short, a natural
population, separated on the basis of observed juveniles, should have statistically
significant differences between adult and juvenile width-to-height ratios, with an overall
mean falling between, and itself statistically significant, with no statistically observable
difference between a modeled and an actual assemblage.
This methodology was applied to the site data. Figure 7 explores the data obtained
from the 50/50 Site Sample (MNP) described above.
365183182N =TotalMeanWidth/HeightJuvWidth/HeightAdult
95%CI
.60
.59
.58
.57
.56
.55
.54
.53
Figure 7. The 50/50 Site Sample (Modeled Natural Population), comparing adult, juvenile,
and total mean width-to-height ratios.
Although the actual sample means are different from the BFL2 collection, the
relationships are the same. Adults and juveniles are statistically separate from each other
and from the mean of the total population. This is what the population should look like if it
was naturally occurring. The MNP, however, must be compared to the assemblage that is
representative of the actual site population. In Figure 8, the 5% Site Sample (ASP) is
added, and compared against the MNP.
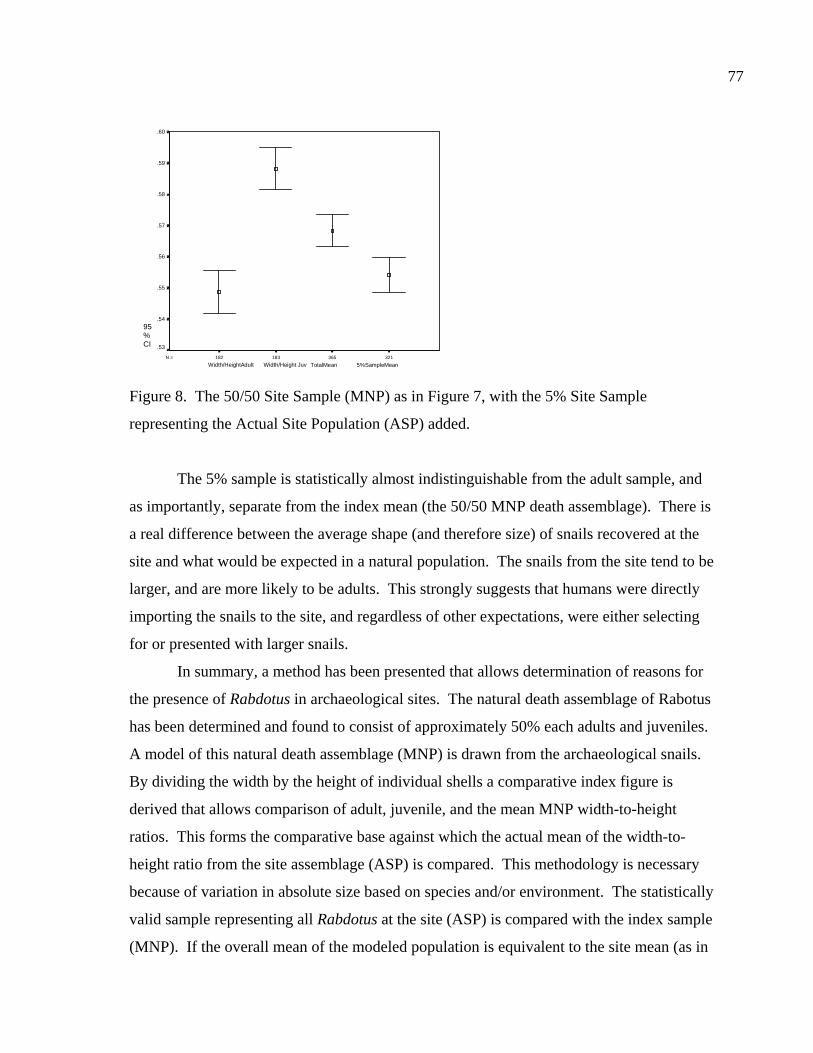
77
321365183182N =5%SampleMeanTotalMeanWidth/Height JuvWidth/HeightAdult
95%CI
.60
.59
.58
.57
.56
.55
.54
.53
Figure 8. The 50/50 Site Sample (MNP) as in Figure 7, with the 5% Site Sample
representing the Actual Site Population (ASP) added.
The 5% sample is statistically almost indistinguishable from the adult sample, and
as importantly, separate from the index mean (the 50/50 MNP death assemblage). There is
a real difference between the average shape (and therefore size) of snails recovered at the
site and what would be expected in a natural population. The snails from the site tend to be
larger, and are more likely to be adults. This strongly suggests that humans were directly
importing the snails to the site, and regardless of other expectations, were either selecting
for or presented with larger snails.
In summary, a method has been presented that allows determination of reasons for
the presence of Rabdotus in archaeological sites. The natural death assemblage of Rabotus
has been determined and found to consist of approximately 50% each adults and juveniles.
A model of this natural death assemblage (MNP) is drawn from the archaeological snails.
By dividing the width by the height of individual shells a comparative index figure is
derived that allows comparison of adult, juvenile, and the mean MNP width-to-height
ratios. This forms the comparative base against which the actual mean of the width-to-
height ratio from the site assemblage (ASP) is compared. This methodology is necessary
because of variation in absolute size based on species and/or environment. The statistically
valid sample representing all Rabdotus at the site (ASP) is compared with the index sample
(MNP). If the overall mean of the modeled population is equivalent to the site mean (as in
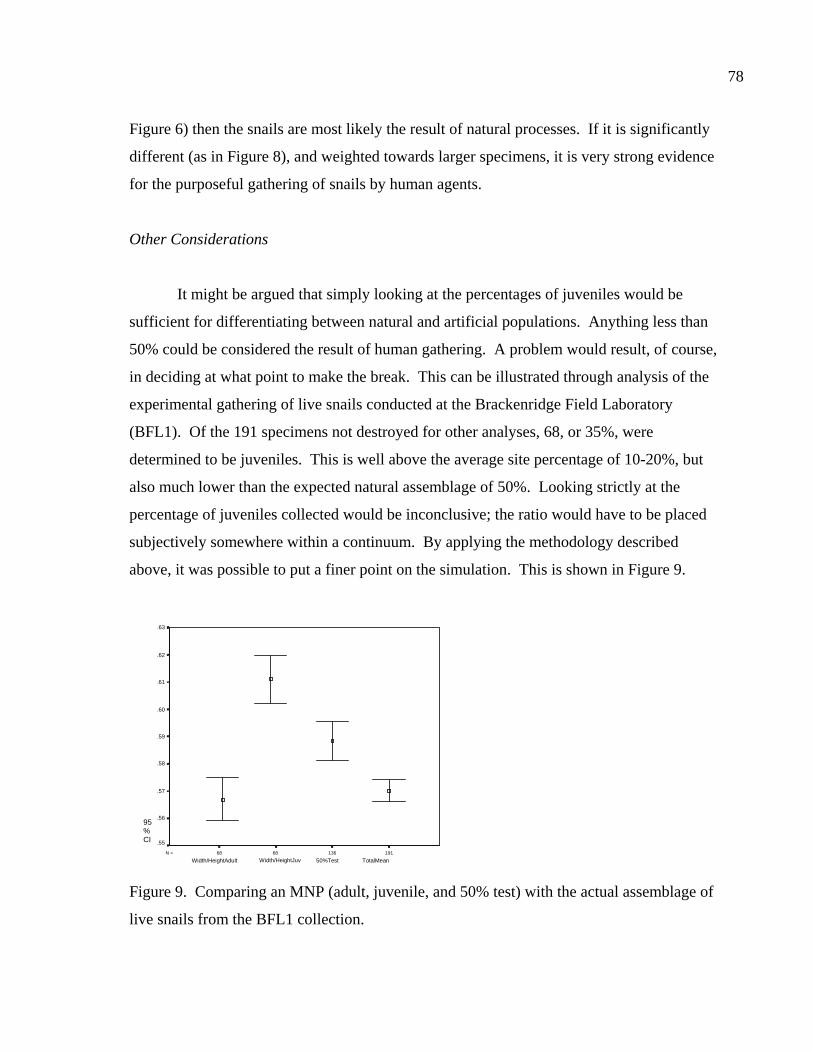
78
Figure 6) then the snails are most likely the result of natural processes. If it is significantly
different (as in Figure 8), and weighted towards larger specimens, it is very strong evidence
for the purposeful gathering of snails by human agents.
Other Considerations
It might be argued that simply looking at the percentages of juveniles would be
sufficient for differentiating between natural and artificial populations. Anything less than
50% could be considered the result of human gathering. A problem would result, of course,
in deciding at what point to make the break. This can be illustrated through analysis of the
experimental gathering of live snails conducted at the Brackenridge Field Laboratory
(BFL1). Of the 191 specimens not destroyed for other analyses, 68, or 35%, were
determined to be juveniles. This is well above the average site percentage of 10-20%, but
also much lower than the expected natural assemblage of 50%. Looking strictly at the
percentage of juveniles collected would be inconclusive; the ratio would have to be placed
subjectively somewhere within a continuum. By applying the methodology described
above, it was possible to put a finer point on the simulation. This is shown in Figure 9.
1911366868N =
TotalMean50%TestWidth/HeightJuvWidth/HeightAdult
95%CI
.63
.62
.61
.60
.59
.58
.57
.56
.55
Figure 9. Comparing an MNP (adult, juvenile, and 50% test) with the actual assemblage of
live snails from the BFL1 collection.
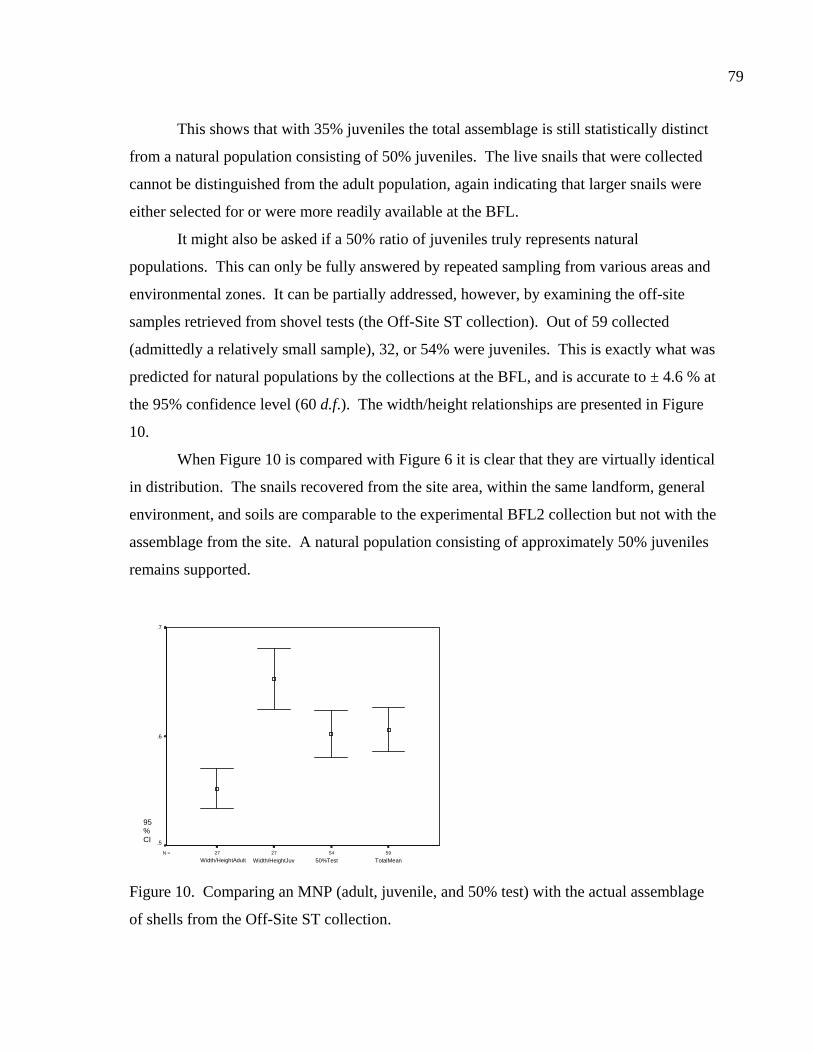
79
This shows that with 35% juveniles the total assemblage is still statistically distinct
from a natural population consisting of 50% juveniles. The live snails that were collected
cannot be distinguished from the adult population, again indicating that larger snails were
either selected for or were more readily available at the BFL.
It might also be asked if a 50% ratio of juveniles truly represents natural
populations. This can only be fully answered by repeated sampling from various areas and
environmental zones. It can be partially addressed, however, by examining the off-site
samples retrieved from shovel tests (the Off-Site ST collection). Out of 59 collected
(admittedly a relatively small sample), 32, or 54% were juveniles. This is exactly what was
predicted for natural populations by the collections at the BFL, and is accurate to ± 4.6 % at
the 95% confidence level (60 d.f.). The width/height relationships are presented in Figure
10.
When Figure 10 is compared with Figure 6 it is clear that they are virtually identical
in distribution. The snails recovered from the site area, within the same landform, general
environment, and soils are comparable to the experimental BFL2 collection but not with the
assemblage from the site. A natural population consisting of approximately 50% juveniles
remains supported.
59542727N =
TotalMean50%TestWidth/HeightJuvWidth/HeightAdult
95%CI
.7
.6
.5
Figure 10. Comparing an MNP (adult, juvenile, and 50% test) with the actual assemblage
of shells from the Off-Site ST collection.
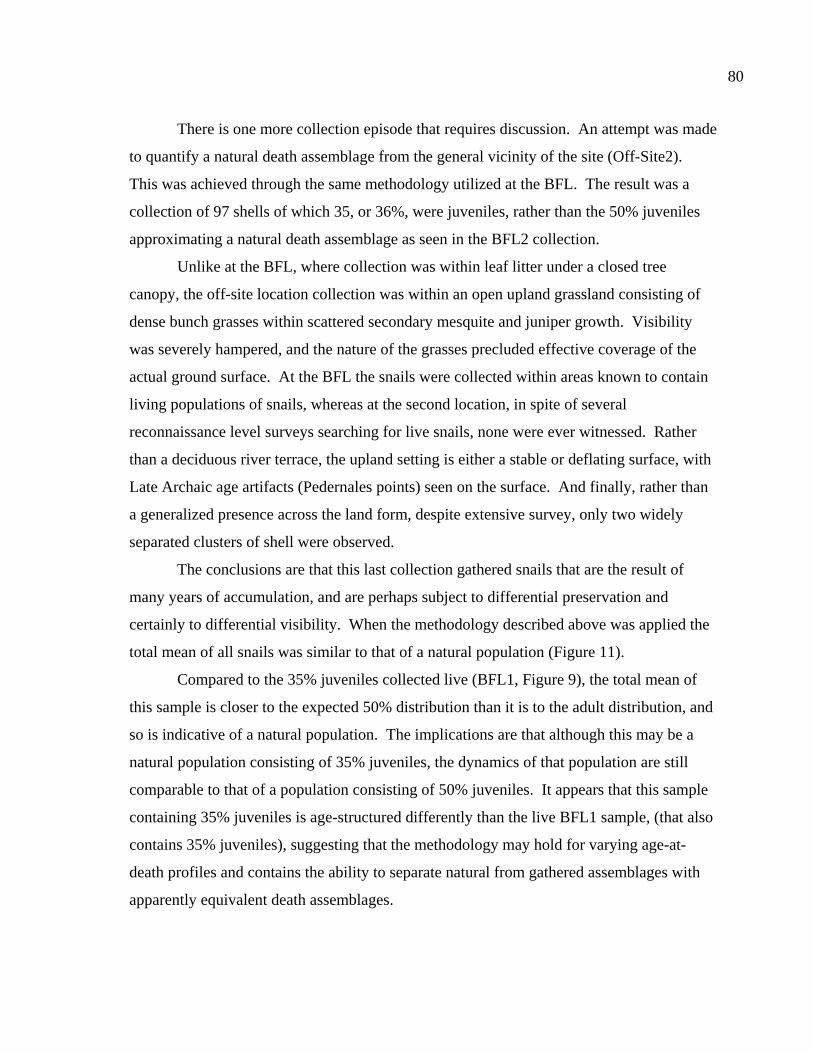
80
There is one more collection episode that requires discussion. An attempt was made
to quantify a natural death assemblage from the general vicinity of the site (Off-Site2).
This was achieved through the same methodology utilized at the BFL. The result was a
collection of 97 shells of which 35, or 36%, were juveniles, rather than the 50% juveniles
approximating a natural death assemblage as seen in the BFL2 collection.
Unlike at the BFL, where collection was within leaf litter under a closed tree
canopy, the off-site location collection was within an open upland grassland consisting of
dense bunch grasses within scattered secondary mesquite and juniper growth. Visibility
was severely hampered, and the nature of the grasses precluded effective coverage of the
actual ground surface. At the BFL the snails were collected within areas known to contain
living populations of snails, whereas at the second location, in spite of several
reconnaissance level surveys searching for live snails, none were ever witnessed. Rather
than a deciduous river terrace, the upland setting is either a stable or deflating surface, with
Late Archaic age artifacts (Pedernales points) seen on the surface. And finally, rather than
a generalized presence across the land form, despite extensive survey, only two widely
separated clusters of shell were observed.
The conclusions are that this last collection gathered snails that are the result of
many years of accumulation, and are perhaps subject to differential preservation and
certainly to differential visibility. When the methodology described above was applied the
total mean of all snails was similar to that of a natural population (Figure 11).
Compared to the 35% juveniles collected live (BFL1, Figure 9), the total mean of
this sample is closer to the expected 50% distribution than it is to the adult distribution, and
so is indicative of a natural population. The implications are that although this may be a
natural population consisting of 35% juveniles, the dynamics of that population are still
comparable to that of a population consisting of 50% juveniles. It appears that this sample
containing 35% juveniles is age-structured differently than the live BFL1 sample, (that also
contains 35% juveniles), suggesting that the methodology may hold for varying age-at-
death profiles and contains the ability to separate natural from gathered assemblages with
apparently equivalent death assemblages.
81
Looking closely at Figures 9 and 11, the differences are seen to be in the overall
width-to-height ratios. The live BFL1 collection resulted in an overall mean roughly
equivalent to the adult population. The Off-Site2 collection is statistically equivalent to its
MNP and is therefore a natural as opposed to gathered population. This is supportive of
relative size, rather than actual adult/juvenile ratios which are the determining factor in
differentiating between cultural and natural death assemblages.
97723636N =TotalMean50%testWidth/HeightJuvWidth/HeightAdult
95%CI
.64
.62
.60
.58
.56
.54
Figure 11. Comparing an MNP (adult, juvenile, and 50% test) with the actual assemblage
of snail shells from the Off-Site2 collection.
More study can clearly be done, but for the present purposes, the 50% assumption
will be maintained and used as a base index from which the natural population is modeled.
This will allow a standardized methodology that can be applied to different sites with
varying snail assemblages in order to test for culturally introduced Rabdotus assemblages.
CHAPTER 7
RETURN RATES OF SNAILS
Once it has been shown that the snails from the archaeological site are the result of
human gathering activities, the middle range concepts of optimal foraging models can be
applied. Knowledge of the energetic value of the snails will enable placement in a rank
order list of potential food sources. Should snails have a high caloric return, they would be
expected to be a preferred food source, and gathered to the exclusion of other food items
with lower caloric values. If snails are low in calories, then it would appear that other
highly ranked food items have become scarce, and that foragers have broadened their diet
base to include lower ranked, and therefore lower return food items.
This assumes that calories are the currency. As was discussed earlier, there is
additional potential in understanding the role other nutrients may play in maintaining
human health. If, for example, bison was determined to be highly ranked as well as readily
available, it would be the expected food source, and all other food items would be passed
over until the return on bison dropped below that of the next ranked food. The result, of
course, would be some form of malnutrition based on a limited diet. Other food sources
would be required to maintain a minimal level of population health.
Reproductive fitness, the aspect of evolutionary ecology the currency is supposed to
measure, may not be limited to physical well-being. Social factors such as activities
promoting prestige may well contribute to an individual’s reproductive success. Such
influences cannot be placed on a quantitative scale.
The individual, however, can have no social success until some very basic energy
and nutritional needs are met. So following somewhat on Leslie White (e.g. 1959), social
factors can be factored out from discussions of primary causation, but perhaps reintroduced
when leaving the middle range to discuss more general or higher range theory. It follows,
then, that a basic understanding of the subject matter (here, the nutritional value of snails)
will aid in shaping larger questions that can be addressed through application of optimal
foraging models to the theory of evolutionary.
82
83
Methods
Ten patches exploited during two collecting episodes (WWF and BFL2) were
compared. The data considered included length in patch, time to new patch, size of patch,
total number collected, numbers of juveniles and adults, and weights of each. For the data
to be relevant and applicable to the site, it was necessary to adjust the weight figures.
Snails collected at the site tended to be substantially larger then those collected
experimentally. The reasons for this are unclear, but may pertain to species hybridization,
seasonality, age of snails, selective gathering by site inhabitants, or some combination of
the above.
One hundred snails from the site test column were chosen for determination of site
weights. The snails were selected from two levels that showed internal synchronicity in
quantities of snail, mussel shell, bone, burned rocks, and lithic debitage, as it was felt these
levels would be most likely to represent actual site activities. Snails were selected for
completeness and to a lesser extent, for size. This idealizes the data somewhat, but also
creates a site maximum against which other internal or external assemblages can be tested.
Meat weight was established by simply filling the shell with water, and then
determining the difference between the shell weight and the gross weight. Initial attempts
at weighing individual shells were impractical, as it was felt an excess of error was being
introduced through the fine level of control necessary to cleanly fill and weigh each shell.
The snails were therefore divided into groups of ten. The individual width and height of
each shell was recorded, the shells were weighed per batch of ten, and then filled with water
and reweighed, producing a net “meat” weight, which was averaged between batches, and
then between levels. The total mean weight was then divided by the sample n (100), to
obtain an average weight per individual. To obtain the average weight of juveniles, a single
batch of previously recorded sub-adults (n=45) was subjected to the same process.
Rather than using actual numbers of adults and juveniles collected experimentally,
the mean site ratio (12.5% juveniles) was applied to the total number gathered from each
patch. Thus, if 100 snails weighing 78 gm and consisting of 60 adults and 40 juveniles had
been experimentally collected, the data was adjusted to reflect site means, which in this
84
case, to use an actual example, would be 100 snails, of which 12.5 were juveniles weighing
7.5 gm (12.5 x .58gm), and 78.5 adults weighing 121.7 gm (78.5 x 1.55 gm), for a total
weight of 129.2 gm (the multipliers are explained below). This allowed meaningful
comparisons to be made between the various collecting episodes and determination of
return rates based on site, rather than purely experimental data.
The processing of snails requires removing them from their shells. This might be
accomplished through breaking the shell, but would result in an archaeological signature
very different from that observed. A limited series of processing experiments were
conducted on the collected live snails. Live snails were virtually impossible to remove, as
they clung tightly to the interior of their shells. Another problem encountered was the
amount of mucus secreted by the snails, whether alive or dead, which made them very
difficult to grasp. It was found that by placing the live snail in cold water, and then slowly
heating it to 120 degrees Farenheit (49 degrees Celsius), the snail was killed as it was trying
to remove itself from the heat source: ie, the body was extruding partially from the shell.
At this point, the snail could be readily removed by way of a knife tip piercing the main
body, and then prying the remainder of the animal from the shell. A number of snails were
frozen, and it was found that they were removed just as easily. It is not suggested that
snails were frozen prehistorically, but the process allowed additional experimental data to
be gathered without subjecting the snail to the heating process
A 200 gm sample of Rabdotus mooreanus snail meat from the BFL1 collection was
submitted to Analytical Food Laboratories located in Grand Prairie, Texas for analysis of
nutritional value. Approximately 1/4 of the total number were removed from the shell after
parboiling, and the rest were removed from previously frozen shells. An effort was made to
extract all the animal, including entrails, and to include as much of the mucus-like material
as possible. The laboratory ground and processed the sample as a single unit.
Results
Looking first at size, and then weight, the mean height of snail from the site was
25.80 mm, and the width was 13.91 mm, compared to 20.48 and 11.65 mm from the
85
experimental sample. The width-to-height ratio for the snails was .539 and .570
respectively, indicating the snails from the site were somewhat fatter. The average weight
of an adult from the site was determined to be 1.55 gm, while that of juveniles was .58 gm,
37% the weight of the adult. These figures were applied back to the experimental returns,
which were also adjusted to reflect the ratio of juveniles to adults as recovered from the
archaeological deposits.
A total of 177 minutes were spent in 6660 square m gathering 831 shells that would
have weighed 1187 gm if based on site averages. This results in an average of 4.69 snails
gathered per minute, and translates to 6.7 gm per minute and .18 gm per square m. More
importantly, this results in 14.9 minutes per 100 grams, or 400 gm collected per hour. The
time trial data combined with adjusted weights and juvenile/adult ratios are summarized in
Table 1.
It was found that meat removal averaged 10 per minute, and could conceivably
reach 20 per minute, based on a test in which dry, empty shells were subjected to the
motions of meat removal. This type of processing, if used, would increase handling time by
approximately 33 percent. The most likely way that snails (and mussels) would be
processed would be through boiling, a process most effective for processing animal tissues
low in lipids and with relatively high amounts of proteins (Wandsnider 1997: 12, Table 5).
If snails, mussels, bone fragments, and perhaps other food items were boiled, a type of stew
would result. A portion of the experimentally gathered live snails were boiled for a period
of time. The broth that resulted had thickened considerably, and was pungent with the not
wholly unobjectionable odor of snails. It would make little sense, at this point, to process
the snails further. Instead, it is much more likely that the diners consumed the various
elements separately and individually, sucking or pulling the snails from the shells and
scooping the mussel meat in a similar fashion. A modern paella dish can be envisioned.
Handling time is therefore included with consumption time, and as some or much of the
nutritive value would become contained in the broth, there seems to be little point in
pursuing additional handling times in respect to overall return rates.
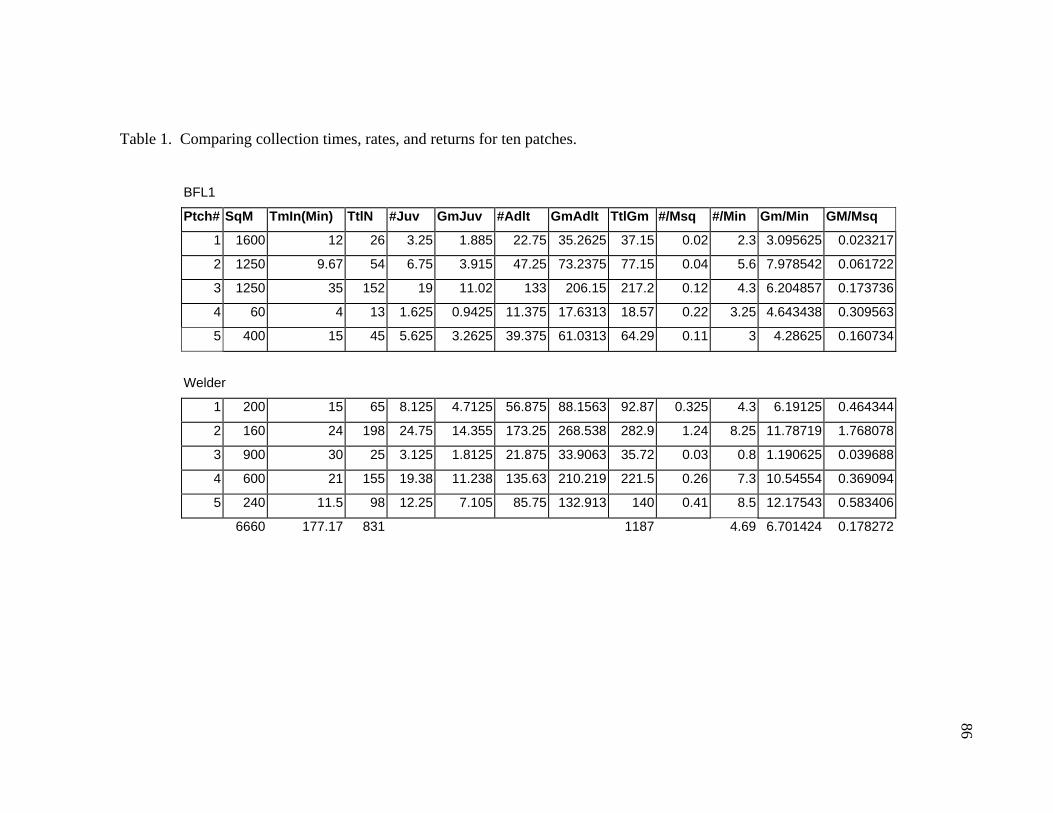
86
Table 1. Comparing collection times, rates, and returns for ten patches.
BFL1
Ptch# SqM TmIn(Min) TtlN #Juv GmJuv #Adlt GmAdlt TtlGm #/Msq #/Min Gm/Min GM/Msq
1 1600 12 26 3.25 1.885 22.75 35.2625 37.15 0.02 2.3 3.095625 0.023217
2 1250 9.67 54 6.75 3.915 47.25 73.2375 77.15 0.04 5.6 7.978542 0.061722
3 1250 35 152 19 11.02 133 206.15 217.2 0.12 4.3 6.204857 0.173736
4 60 4 13 1.625 0.9425 11.375 17.6313 18.57 0.22 3.25 4.643438 0.309563
5 400 15 45 5.625 3.2625 39.375 61.0313 64.29 0.11 3 4.28625 0.160734
Welder
1 200 15 65 8.125 4.7125 56.875 88.1563 92.87 0.325 4.3 6.19125 0.464344
2 160 24 198 24.75 14.355 173.25 268.538 282.9 1.24 8.25 11.78719 1.768078
3 900 30 25 3.125 1.8125 21.875 33.9063 35.72 0.03 0.8 1.190625 0.039688
4 600 21 155 19.38 11.238 135.63 210.219 221.5 0.26 7.3 10.54554 0.369094
5 240 11.5 98 12.25 7.105 85.75 132.913 140 0.41 8.5 12.17543 0.583406
6660 177.17 831 1187 4.69 6.701424 0.178272
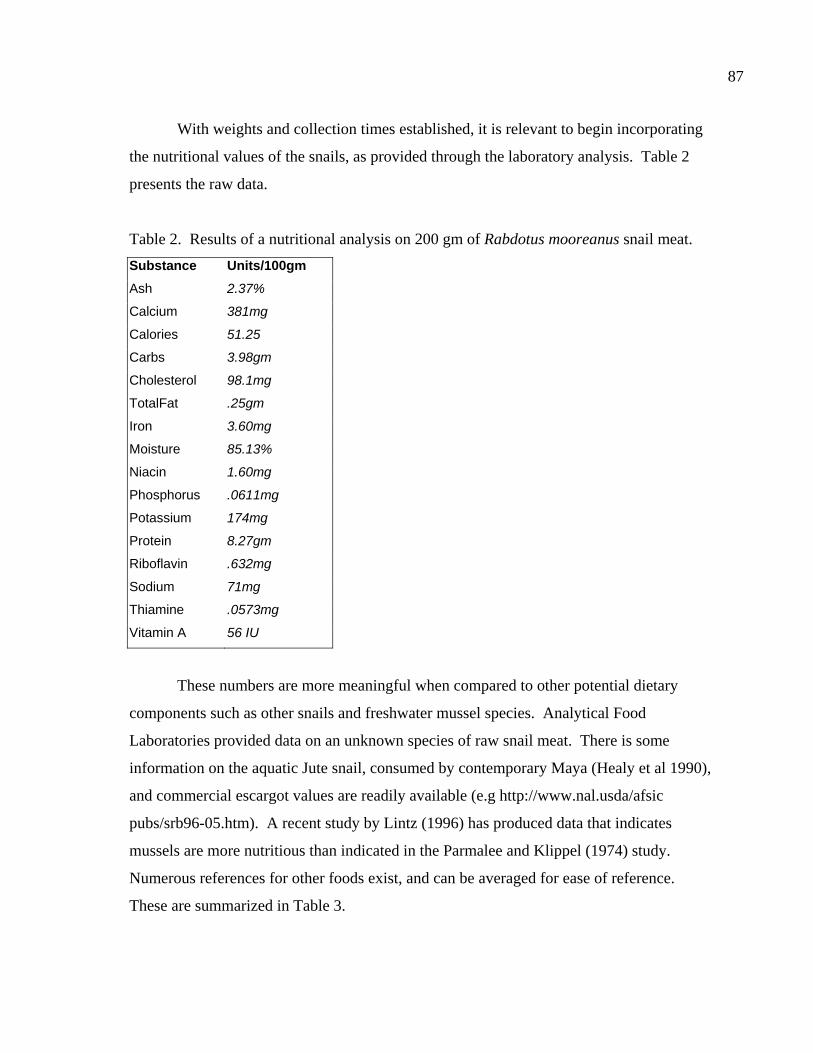
87
With weights and collection times established, it is relevant to begin incorporating
the nutritional values of the snails, as provided through the laboratory analysis. Table 2
presents the raw data.
Table 2. Results of a nutritional analysis on 200 gm of Rabdotus mooreanus snail meat. Substance Units/100gm Ash 2.37%
Calcium 381mg
Calories 51.25
Carbs 3.98gm
Cholesterol 98.1mg
TotalFat .25gm
Iron 3.60mg
Moisture 85.13%
Niacin 1.60mg
Phosphorus .0611mg
Potassium 174mg
Protein 8.27gm
Riboflavin .632mg
Sodium 71mg
Thiamine .0573mg
Vitamin A 56 IU
These numbers are more meaningful when compared to other potential dietary
components such as other snails and freshwater mussel species. Analytical Food
Laboratories provided data on an unknown species of raw snail meat. There is some
information on the aquatic Jute snail, consumed by contemporary Maya (Healy et al 1990),
and commercial escargot values are readily available (e.g http://www.nal.usda/afsic
pubs/srb96-05.htm). A recent study by Lintz (1996) has produced data that indicates
mussels are more nutritious than indicated in the Parmalee and Klippel (1974) study.
Numerous references for other foods exist, and can be averaged for ease of reference.
These are summarized in Table 3.
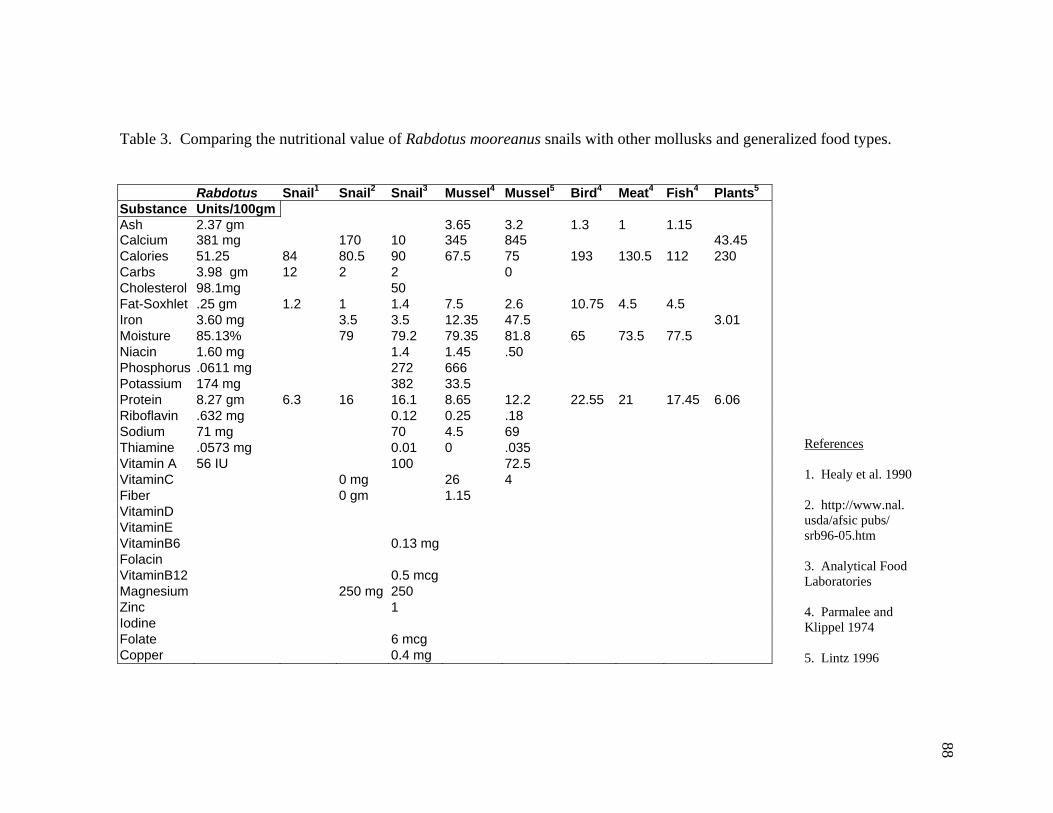
Table 3. Comparing the nutritional value of Rabdotus mooreanus snails with other mollusks and generalized food types.
Rabdotus Snail1 Snail2 Snail3 Mussel4 Mussel5 Bird4 Meat4 Fish4 Plants5
Substance Units/100gm Ash 2.37 gm 3.65 3.2 1.3 1 1.15 Calcium 381 mg 170 10 345 845 43.45Calories 51.25 84 80.5 90 67.5 75 193 130.5 112 230 Carbs 3.98 gm 12 2 2 0 Cholesterol 98.1mg 50Fat-Soxhlet .25 gm 1.2 1 1.4 7.5 2.6 10.75 4.5 4.5Iron 3.60 mg 3.5 3.5 12.35 47.5 3.01Moisture 85.13% 79 79.2 79.35 81.8 65 73.5 77.5 Niacin 1.60 mg 1.4 1.45 .50 Phosphorus .0611 mg 272 666 Potassium 174 mg 382 33.5Protein 8.27 gm 6.3 16 16.1 8.65 12.2 22.55 21 17.45 6.06 Riboflavin .632 mg 0.12 0.25 .18 Sodium 71 mg 70 4.5 69Thiamine .0573 mg 0.01 0 .035Vitamin A 56 IU 100 72.5VitaminC 0 mg 26 4 Fiber 0 gm 1.15VitaminD VitaminE VitaminB6 0.13 mgFolacin VitaminB12 0.5 mcgMagnesium 250 mg 250 Zinc 1Iodine Folate 6 mcg Copper 0.4 mg
References 1. Healy et al. 1990 2. http://www.nal. usda/afsic pubs/ srb96-05.htm 3. Analytical Food Laboratories 4. Parmalee and Klippel 1974 5. Lintz 1996
88
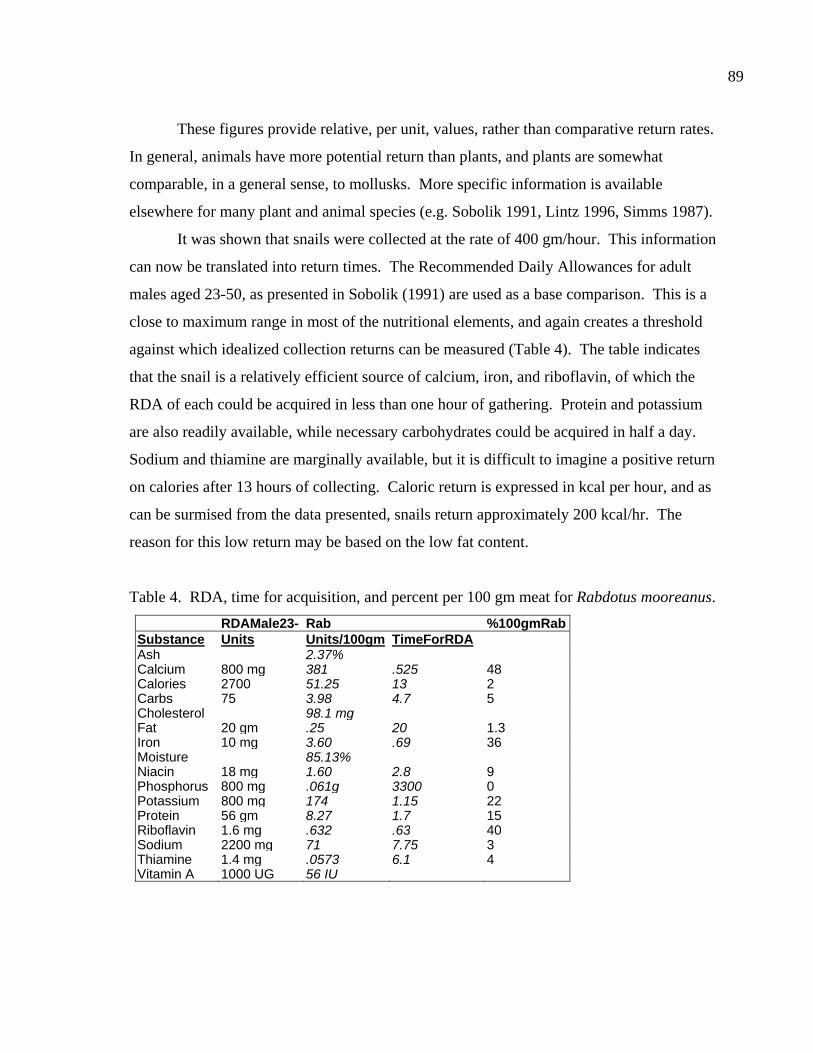
89
These figures provide relative, per unit, values, rather than comparative return rates.
In general, animals have more potential return than plants, and plants are somewhat
comparable, in a general sense, to mollusks. More specific information is available
elsewhere for many plant and animal species (e.g. Sobolik 1991, Lintz 1996, Simms 1987).
It was shown that snails were collected at the rate of 400 gm/hour. This information
can now be translated into return times. The Recommended Daily Allowances for adult
males aged 23-50, as presented in Sobolik (1991) are used as a base comparison. This is a
close to maximum range in most of the nutritional elements, and again creates a threshold
against which idealized collection returns can be measured (Table 4). The table indicates
that the snail is a relatively efficient source of calcium, iron, and riboflavin, of which the
RDA of each could be acquired in less than one hour of gathering. Protein and potassium
are also readily available, while necessary carbohydrates could be acquired in half a day.
Sodium and thiamine are marginally available, but it is difficult to imagine a positive return
on calories after 13 hours of collecting. Caloric return is expressed in kcal per hour, and as
can be surmised from the data presented, snails return approximately 200 kcal/hr. The
reason for this low return may be based on the low fat content.
Table 4. RDA, time for acquisition, and percent per 100 gm meat for Rabdotus mooreanus. RDAMale23- Rab %100gmRab
Substance Units Units/100gm TimeForRDA Ash 2.37%Calcium 800 mg 381 .525 48Calories 2700 51.25 13 2Carbs 75 3.98 4.7 5Cholesterol 98.1 mgFat 20 gm .25 20 1.3Iron 10 mg 3.60 .69 36Moisture 85.13%Niacin 18 mg 1.60 2.8 9Phosphorus 800 mg .061g 3300 0Potassium 800 mg 174 1.15 22Protein 56 gm 8.27 1.7 15Riboflavin 1.6 mg .632 .63 40Sodium 2200 mg 71 7.75 3Thiamine 1.4 mg .0573 6.1 4Vitamin A 1000 UG 56 IU
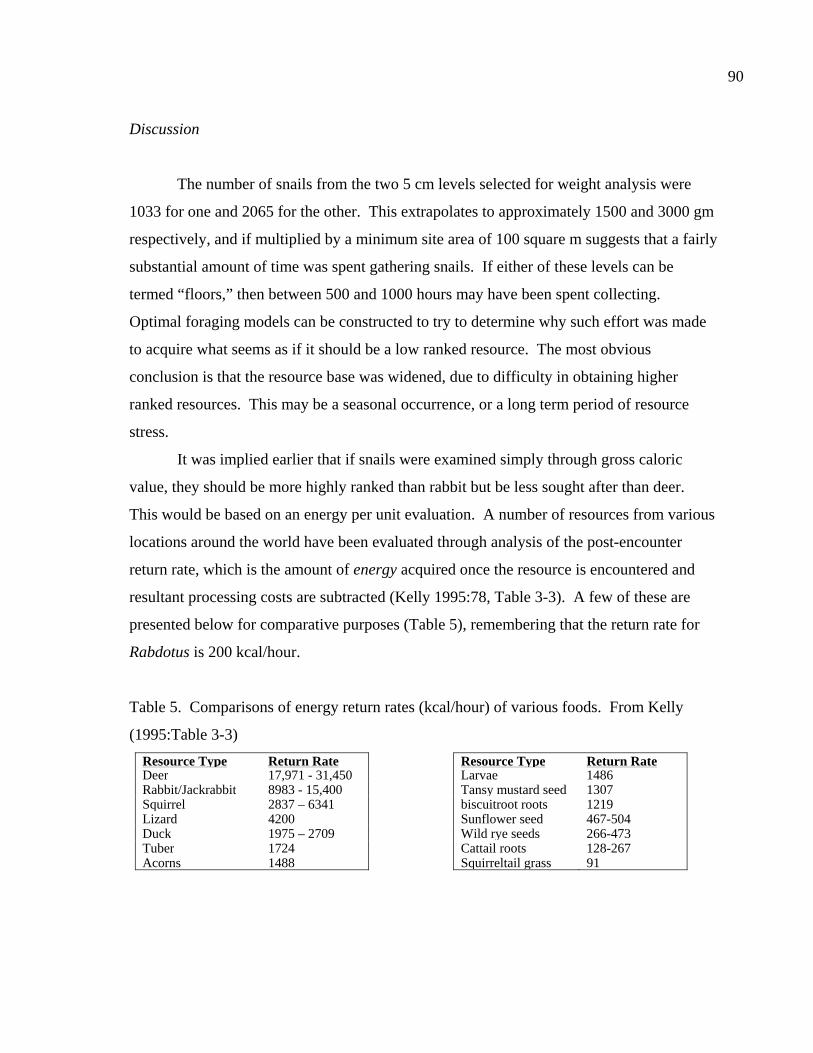
90
Discussion
The number of snails from the two 5 cm levels selected for weight analysis were
1033 for one and 2065 for the other. This extrapolates to approximately 1500 and 3000 gm
respectively, and if multiplied by a minimum site area of 100 square m suggests that a fairly
substantial amount of time was spent gathering snails. If either of these levels can be
termed “floors,” then between 500 and 1000 hours may have been spent collecting.
Optimal foraging models can be constructed to try to determine why such effort was made
to acquire what seems as if it should be a low ranked resource. The most obvious
conclusion is that the resource base was widened, due to difficulty in obtaining higher
ranked resources. This may be a seasonal occurrence, or a long term period of resource
stress.
It was implied earlier that if snails were examined simply through gross caloric
value, they should be more highly ranked than rabbit but be less sought after than deer.
This would be based on an energy per unit evaluation. A number of resources from various
locations around the world have been evaluated through analysis of the post-encounter
return rate, which is the amount of energy acquired once the resource is encountered and
resultant processing costs are subtracted (Kelly 1995:78, Table 3-3). A few of these are
presented below for comparative purposes (Table 5), remembering that the return rate for
Rabdotus is 200 kcal/hour.
Table 5. Comparisons of energy return rates (kcal/hour) of various foods. From Kelly
(1995:Table 3-3) Resource Type Return Rate Deer 17,971 - 31,450Rabbit/Jackrabbit 8983 - 15,400Squirrel 2837 – 6341Lizard 4200 Duck 1975 – 2709Tuber 1724 Acorns 1488
Resource Type Return Rate Larvae 1486 Tansy mustard seed 1307 biscuitroot roots 1219 Sunflower seed 467-504 Wild rye seeds 266-473 Cattail roots 128-267 Squirreltail grass 91

91
Snails fall well within the lower ranked food items, with even resources having
extremely high processing costs (seeds) often returning more energy per unit of time than
the snails. Generally, it is lower ranked seeds, roots, and tubers that are most similar to
snails in caloric return. It would appear, that based on optimal foraging principles, these
lower ranked resources should not be included within preferred diets.
Although the return rate is based on post-encounter costs, the diet-breadth model
requires inclusion of encounter rates to explain foraging choices. This can be thought of as
numbers of encounters per unit of time as a large muli-variate patch (the total environment)
is being searched (Kelly 1995:83-84). If, for example, hypothetically following Kelly, one
unit of deer is encountered for every four units of rabbit, taking both deer and rabbit would
raise the return rate of taking either alone, as rabbit would be more plentiful, thus making
up for smaller body size. The most likely scenario would have rabbit hunting embedded in
deer acquisition strategies. If six lizards were also encountered and taken, however, the
return rate would begin to fall, as the time spent acquiring lizards would decrease from the
potential higher return afforded by the deer and rabbit. It follows then, that a forager should
not choose to pursue snails (or other low ranked resources) when encounter rates for more
highly ranked items remain frequent.
Perhaps the most important aspect of the diet-breadth model concerns the issue of
abundance. The assumption is that when highly ranked resources are available, lower
ranked resources will not be chosen, regardless of how abundant they are, and that only as
the higher ranked resources decrease in abundance (increasing search costs and therefore
lowering net return rates) will the diet breadth widen to incorporate lower ranked resources
(Kelly 1995:86-87). The implications for snail gathering are clear. Snails should not be
taken until any number of other resources have decreased in availability to the point where
gathering at a rate of 200 kcal/hour would not lower the average return rate.
The diet-breadth model further assumes that resources are distributed evenly, and
the chances of encountering any given resource are equivalent to its relative abundance
(Kelly 1995:90). Many resources are not evenly distributed, however, but are clumped
within patches. Foragers, then, would have the opportunity to make decisions as to what
resource patches they might wish to exploit, most likely as they make plans prior to leaving
92
camp (Kelly 1995:92). The patch-choice model is used to predict which patches a forager
should exploit, and much like diet-breadth, can result in rankings of patches (Kelly
1995:91). The model is commonly used to predict how long a forager should remain in a
patch (Kaplan and Hill 1992:178).
The basic premise is that a patch will be exploited until its return falls below what
could be expected from the mean return of all patches within the environment, once the
costs of traveling to any new patch is factored in (Kelly 1995:91). Each individual patch
should be depleted to a density that nets the same return rate, and as overall resources
become less abundant, the time spent within patches will increase (Kaplan and Hill
1992:180). An important implication is that no patch should be completely exhausted
(Kelly 1995:91), as that would indicate that the environment itself was no longer capable of
sustaining the forager, who by this point presumably should have left for more favorable
climes.
Snails are distributed patchily and have a return rate of 200 kcal/hour. In order for
snail patches to be considered as a source of subsistence, the patch-choice model indicates
that the mean return rate for all patches at the time of snail acquisition could not exceed 200
kcal/hour. This suggests a very poor or depleted subsistence base, either because of long-
term environmental degradation or seasonal stress.
Using either of these models follows on the essential premise of optimal foraging
theory that resides in the approximation of reality, rather than an assumption of absolute
validity. When human choice is factored in, for example, some models become
inappropriate and can produce results that are unrealistic (Kaplan and Hill 1992:180). A
basic premise of optimal foraging—randomness of searching strategies—introduces
additional layers of complexity (such as knowledge of environment, the role of foraging
groups as opposed to foraging individuals, and risk or predictability in resource acquisition
[Kelly 1995:101]) that are difficult to incorporate in simple models. Combining diet-
breadth and patch-choice models and including tools such as linear programming and
indifference curves may help, but the debate between simple and complex approaches (Sih
and Milton 1985, Hawkes and O’Connell 1985) seems to continue. Much of this revolves
around the issue of energy as currency.
93
At 41BL116 there seems to be close to 2000 years of heavy reliance on snails as a
food source. A straightforward optimal foraging approach would suggest that these low-
ranked animals should only be gathered when other items that achieved a higher energy
return were scarce. Although it cannot be presently demonstrated, it seems unlikely that a
riverine ecotonal environment should have such long-term and repetitive environmental
stress resulting in what would appear to be near starvation conditions. As present evidence
indicates that the climate during principal site occupation was relatively wet and mild
(Johnson 1995, Collins 1995), it would not be expected that energy acquisition would have
been especially problematic. A base assumption, then, might be that calories were being
provided at a rate much greater than that which can be obtained by snail gathering. It thus
becomes necessary to explore reasons other than caloric returns for the entry of snails into
an aboriginal diet.
Alternatives
It was shown that a diet heavy in hunted resources may result in deficiencies of
other important nutrients. An excess of protein consumption can be especially problematic
(discussed below). Alternative explanations for the presence of snails might therefore be
found in currencies other than energy. If resource rankings are expanded to other
nutritional elements items such as snails might be seen to rise in importance. It is
conceivable that sorted rankings might be established for various food types which could
then be compared on various levels, thus expanding the range of optimal foraging models
and perhaps allowing them to more accurately predict or explain variation in foraging
behavior.
It has already been suggested that there are strong relationships between mussels
and Rabdotus. They are both mollusks, are similarly structured within their respective
habitats, and have similar nutritional value. At 41BL116 their archaeological presence is
also strongly correlated in relation to each other (Figure 12).
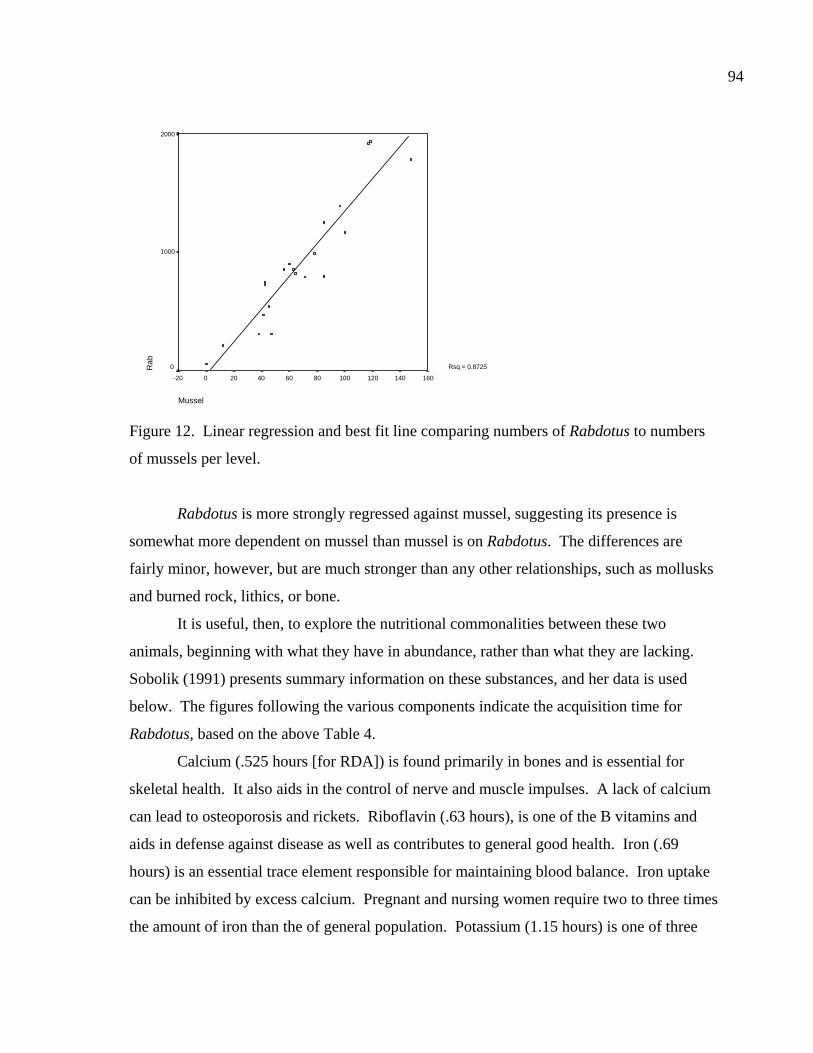
94
Mussel
160140120100806040200-20
Rab
2000
1000
0 Rsq = 0.8725
Figure 12. Linear regression and best fit line comparing numbers of Rabdotus to numbers
of mussels per level.
Rabdotus is more strongly regressed against mussel, suggesting its presence is
somewhat more dependent on mussel than mussel is on Rabdotus. The differences are
fairly minor, however, but are much stronger than any other relationships, such as mollusks
and burned rock, lithics, or bone.
It is useful, then, to explore the nutritional commonalities between these two
animals, beginning with what they have in abundance, rather than what they are lacking.
Sobolik (1991) presents summary information on these substances, and her data is used
below. The figures following the various components indicate the acquisition time for
Rabdotus, based on the above Table 4.
Calcium (.525 hours [for RDA]) is found primarily in bones and is essential for
skeletal health. It also aids in the control of nerve and muscle impulses. A lack of calcium
can lead to osteoporosis and rickets. Riboflavin (.63 hours), is one of the B vitamins and
aids in defense against disease as well as contributes to general good health. Iron (.69
hours) is an essential trace element responsible for maintaining blood balance. Iron uptake
can be inhibited by excess calcium. Pregnant and nursing women require two to three times
the amount of iron than the of general population. Potassium (1.15 hours) is one of three
95
electrolytes and helps maintain cell structure. Niacin (2.8 hours), another B vitamin, aids in
metabolic processes, and a deficiency can lead to disorders associated with the skin and
mucus membranes. Carbohydrates (4.7 hours) provides energy in the form of starches,
sugars, and cellulose, and is considered the best form of obtaining such energy, normally
contributing over one-half total calories. Protein (1.7 hours) is another constituent of total
energy, but is very difficult to evaluate fully, as it consists of several amino acids, ten of
which are considered essential. These aid the body in maintaining cell health and replacing
those lost through normal attrition.
Snails (and mussels) are thus potentially valuable sources of calcium, iron,
riboflavin and niacin, containing more per unit of each of these than many plants and
animals (Sobolik 1991, Table 24, Table 26). Proteins and carbohydrates, however, are
easily found in greater quantities among several other plant and animal species, and
Rabdotus has a very low fat content. Mussels, it should be noted, have low carbohydrate
values. Those analyzed by Lintz (1996) contained no carbohydrates, while Parmalee and
Klippel (1974) had an average of about 6 gm/100gm. These three elements (protein, fats
and carbohydrates) make up the majority of total energy sources (Sobolik 1991:81).
Energy needs are variable depending on factors such as age, weight, activity level, and
gender. Fat is the most directly accessible component, either converted immediately to
energy or stored for future use, and has approximately 2.25 times the caloric value of
proteins and carbohydrates (Outram 2000:401).
Snails appear to provide adequate amounts of carbohydrates and protein, but are
seriously deficient in fats. A diet consisting primarily of snails might result in nutritional
stress based on a relative lack of dietary fat. Diets high in proteins can precipitate
additional health issues. Because of the difficulty in metabolizing proteins, liver and
kidney problems, potentially leading to death, may occur if energy intake exceeds over 50%
proteins daily, and potentially far less for pregnant women (Speth 1991:206). RDAs as
presented above indicate that protein intake should be approximately 75% of carbohydrate
intake. Snail contains 200% more protein than carbohydrates. One way to manage for a
protein excess may be to consume additional fats (which should be 25% of proteins) and
carbohydrates (Speth 1991:267), with the present case benefiting most from additional fats.

96
Mussels analyzed by Lintz (1996: Table 3) have an average fat component of 2.6
gm/100 gm meat, nearly ten times that of Rabdotus, but still quite low when compared to
various animal and some plant species. The nutritional value of mussels may be subject to
seasonal or environmental bias, especially in regards to carbohydrates and protein (Lintz
1996:T-9), but in general are relatively consistent (Parmalee and Klippel 1974, Claassen
1991: Table 10.1). Claassen reports Anbarra women gathering up to 800 kcal/hour of an
unspecified (marine?) mollusk (Claassen 1991:279). The only Western Pacific mollusk for
which she gives caloric data, Pecten maximus, provides 105 kcal/100gm (Claassen
1991:Table 10.1), thus indicating a gathering rate of over 800 gm per hour. The size of
these mussels is not stated, so it is unknown how many individuals that might translate to,
however, the species, also known as the King Scallop, is available commercially with stated
weights of 10-12 per pound (http://www.kildavanan.com/Products.htm) which converts to
approximately 45 gm per individual, or 18 individuals per hour. Lintz provides size data
for mussels in Texas of 23.8 gm per individual (Lintz 1996:T-9) and for the Midwest of 58
gm per individual (Parmalee et al. 1972 in Lintz 1996: T-9). If 18 Texas mussels were
collected in one hour, there would be a net return of 420 gm (.9 pounds), which would
provide 315 kcal/hour and almost 11 gm of fat, which is about one-half the RDA.
If these figures are correct, moderate amounts of mussel would compensate for the
low fat content of Rabdotus. Unfortunately, experimental gathering of mussel may never
be satisfactorily accomplished due to declining populations (Lintz 1996:T-14) and
diminishing habitat (Howells et al. 1996:1). A return rate of 300 kcal/ hour seems
reasonable, however, and even if it were decreased to 200 kcal/hour, which seems to be
close to a minimum (Simms 1987: Table 2, Table 5, Kelly 1995: Table 3-3) the requisite
amount of fat could be acquired in less than three hours. Eighteen mussels per hour also
compares very well with the collection rate of snails; both are gathered at the rate of just
over 400 gm/hour.
It was noted above that the two taxa for which Lintz provides data, Quadrula and
Cyrtonais, provide no measurable carbohydrates. This is curious when compared with
Parmalee and Klippel’s data for two different species in the Midwest, but is supported to
some extent by measured carbohydrates being absent in at least one marine mollusk, as well
97
as some birds and several fish (Claassen 1991: Table 10.1). The implication of course, is
that snails make up for the carbohydrates missing in the mussels. The two animals are
therefore complementary to each other; either one could supply several important minerals
and vitamins, but either by itself would result in deficiencies rooted in relative protein
excesses. Snails are shown to provide the adult male RDA of carbohydrates in 4.7 hours,
and it is suggested here that mussels can do the same for fats in 2 hours. If this balance is
achieved, a site assemblage might be expected to contain 36 mussels (72 shells) for every
1320 snail shells.
This assumption was tested with the site-derived regression formula where mussels
were independent of snail populations (r = .934, p = .001, y = -13.74x – 29.8). This was
both a stronger correlation, and intuitively more appropriate, than looking at mussels as
dependent on snails, as unmitigated protein consumption (if only snails were consumed) is
potentially more deleterious than a lack of carbohydrates (if only mussels were consumed).
When 72 shells (shells rather than “individuals” were used in the equation) were used to
solve for y, the result was 939 snails, leaving a residual of 381 from an idealized and
presumed ratio of snails and mussels (the ratio that produced RDA’s of carbohydrates and
fats, 72 mussel shell for every 1320 snails). This is close to the maximum residual of 338.
An actual site figure of 97 mussel shells was used in the same formula to predict the actual
number of snail shell. The predicted result was 1333, while the actual number recovered
was 1388, leaving an extremely small residual of 55. Seventy-two mussel shells represents
5.5% of 1320 snail shells. The actual site mean ratio of mussel shell to snail was
7.68±2.95%, which places the predicted ratio (5.5%) within the 66% margin of error. The
predicted ratio of mussel shells to snails that allows for RDA’s of carbohydrates and fats to
be minimally acquired (72:1320) is well supported, with a seeming slight de-emphasis on
snail collection, and therefore carbohydrates.
Mussels and snails, of course, did not comprise the totality of the diet. Bone is
present at the site, and although very fragmentary in nature, has been cursorily identified as
deer, rabbit, bird, and fish, but most often as medium-sized mammal. A pollen analysis
indicates that Asteracaea (sunflower), Liguliflorae (dandelion), Brassicacae (mustard),
Cheno-Am (goosefoot or pigweed), Platyopuntia prickly pear), Poacae (various grasses),
98
Vitis (grape), Carya, (hickory or pecan), Celtis (hackberry), Quercus (oak), Rhus (sumac),
and TCT (juniper or bald cypress) were present in the site vicinity. Many of these, in
particular the nut bearing species and the Cheno-ams have the potential for adding fat to the
diet. At present, though, there are no identified quantities for these plants, and so all must
remain as only potential additions to the diet.
Brown (1999:250) suggested looking for evidence of grease processing in sites
where Rabdotus consumption is suspected. Bone grease is the processed remains of both
marrow and the grease found within the bone itself, which can account for up to one-third
the total bone weight (Brink 1997:260). Processing requires breaking the bone into small
pieces and then boiling it for extended periods of time, eventually skimming the residual fat
off the surface of the water. It would seem to be a time consuming and laborious process,
with limited return potential.
Archaeological signatures from such processing include fragmented bone, often
termed “indeterminate” (Outram 2000) and differential preservation of bones containing
higher or lower amounts of available grease (Madrigal and Capaldo 1998). Bone grease
processing appears to be more prevalent during times of resource stress, and is seen world-
wide (Outram 2000: 401). A paucity of complete longbones coupled with higher numbers
of grease-poor bones, in particular phalanges, would be indicators of such activities
(Madrigal and Capaldo 1998). Efficient grease processing requires storage until a sufficient
amount can be processed, which is difficult to accomplish in warm climates due to
problems with preservation, and may be mitigated by less intensive procedures such as
making bone broth or adding bone to stews (Outram 2000:402).
At site 41BL116 there is so far a very poor correlation between bone and other
artifact classes, including snail and mussel. Although general trends in quantities are
observed, there seems to be no direct connection between them. If site inhabitants were
depending on bone to provide the fats necessary to offset the high protein levels of snails,
there should be a more obvious correlation. So although the bone is generally in a very
fragmentary state, and the majority of easily identifiable or whole bones are phalanges, it
would seem that grease processing, if it occurred, was not intrinsically linked to molluscan
consumption. One explanation, based on the level of energy input represented by the
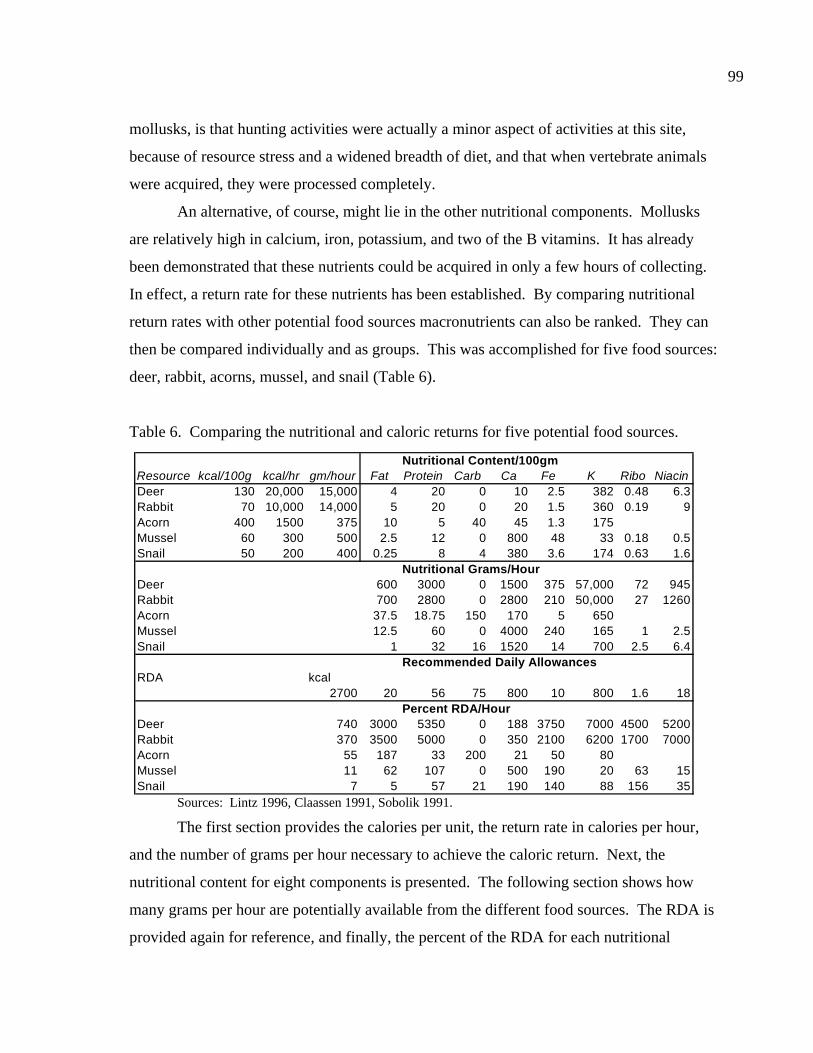
99
mollusks, is that hunting activities were actually a minor aspect of activities at this site,
because of resource stress and a widened breadth of diet, and that when vertebrate animals
were acquired, they were processed completely.
An alternative, of course, might lie in the other nutritional components. Mollusks
are relatively high in calcium, iron, potassium, and two of the B vitamins. It has already
been demonstrated that these nutrients could be acquired in only a few hours of collecting.
In effect, a return rate for these nutrients has been established. By comparing nutritional
return rates with other potential food sources macronutrients can also be ranked. They can
then be compared individually and as groups. This was accomplished for five food sources:
deer, rabbit, acorns, mussel, and snail (Table 6).
Table 6. Comparing the nutritional and caloric returns for five potential food sources.
Nutritional Content/100gmResource kcal/100g kcal/hr gm/hour Fat Protein Carb Ca Fe K Ribo NiacinDeer 130 20,000 15,000 4 20 0 10 2.5 382 0.48 6.3Rabbit 70 10,000 14,000 5 20 0 20 1.5 360 0.19 9Acorn 400 1500 375 10 5 40 45 1.3 175Mussel 60 300 500 2.5 12 0 800 48 33 0.18 0.5Snail 50 200 400 0.25 8 4 380 3.6 174 0.63 1.6
Nutritional Grams/HourDeer 600 3000 0 1500 375 57,000 72 945Rabbit 700 2800 0 2800 210 50,000 27 1260Acorn 37.5 18.75 150 170 5 650Mussel 12.5 60 0 4000 240 165 1 2.5Snail 1 32 16 1520 14 700 2.5 6.4
Recommended Daily AllowancesRDA kcal
2700 20 56 75 800 10 800 1.6 18Percent RDA/Hour
Deer 740 3000 5350 0 188 3750 7000 4500 5200Rabbit 370 3500 5000 0 350 2100 6200 1700 7000Acorn 55 187 33 200 21 50 80Mussel 11 62 107 0 500 190 20 63 15Snail 7 5 57 21 190 140 88 156 35
Sources: Lintz 1996, Claassen 1991, Sobolik 1991.
The first section provides the calories per unit, the return rate in calories per hour,
and the number of grams per hour necessary to achieve the caloric return. Next, the
nutritional content for eight components is presented. The following section shows how
many grams per hour are potentially available from the different food sources. The RDA is
provided again for reference, and finally, the percent of the RDA for each nutritional
100
component that can be acquired in one hour is shown. Both nutritional grams per hour and
percent RDA per hour can be used as indexes of return. As can be seen, both deer and
rabbit provide very high amounts of all the listed items except carbohydrates.
Unless deer and rabbit populations were extremely depressed, most of the
nutritional needs in question could be easily met without a widened diet breadth. Based on
this limited comparison, it is the carbohydrates that must be used to explain the molluscan
presence. Carbohydrates contribute starches and sugars towards energy needs, and as was
stated earlier, can provide over one-half of total calories. Neither fish, birds, or mammals
contribute carbohydrates to the diet; they are found only in plants (Sobolik 1991:Table 23)
and certain mollusks, including Rabdotus snails.
A basic biology textbook (Cambell 1993:809-811) expands on the role of
carbohydrates in the mammalian diet. Adenosine triphosphate (ATP) is the molecule that
allows cells to do work, and is generated from the oxidation of carbohydrates, fats, and
proteins. Fats oxidize at twice the value (kcal) of carbohydrates and proteins (1 gram of fat
provides 9.5 kcal). Fats and carbohydrates are the preferred energy source; proteins do not
metabolize except under extreme stress (starvation). Excess fats and carbohydrates are both
stored as fats in body tissues (carbohydrates are converted), to be held in reserve until
needed. If these stores are exhausted, the body’s proteins are broken down, and muscle and
even brain tissue is affected. To avoid permanent damage, calories (in the form of fats or
carbohydrates) are necessary to stave off cell depletion.
The actual numbers ,therefore, of deer or rabbit need not necessarily have been
reduced, only their fat content. This again points to environmental stress. By incorporating
mollusks in the diet, dependence on fat-bearing foods was lessened. The most likely
scenario involves periodic (seasonal) times of reduced primary production. Late
winter/early spring and late summer/early fall are the most likely times for this, when plants
are leaving dormancy (late winter) or have either expended or not yet realized reproductive
tissue potential (late summer). Secondary production (foraging herbivores) would begin to
lose stored energy resources, and perhaps initiate protein metabolization. The cascade
reaches the omnivores, such as humans, who must then diversify (broaden the diet breadth)

101
to maintain cell (and body) health. An abundant, predictable, low risk resource would be
particularly important at such times.
It is now possible to make predictions about the abundance and relative health of
highly ranked resources, such as deer. Deer have been shown to return 600 grams of fat per
hour. This is presumed to be from healthy and viable populations. Snails return 16 grams
of carbohydrates per hour, the equivalent caloric potential of 8 grams of fat. For snails to
efficiently replace the caloric potential of deer, the abundance and/or fat content of deer
would need to be substantially reduced. If meat weight return remained constant, the fat
return would drop to .0005 grams/hour. If the potential fat return of deer was at the
minimal value of 8 grams/hour, the meat return would be 200 grams/hour or less.
These are extremely low figures. Deer would essentially be non-existent or
undergoing starvation. The more likely explanation is that deer (and rabbit) were not
present within the foraging environment at times when mollusks were taken. The
implication is of a broad resource patch that has been depleted, but not exhausted. The
mean return rate of the total foraging environment would be at 200 cal/hour, or perhaps at 8
grams of fat (16 grams of carbohydrates)/hour. Such returns would still outweigh the costs
of moving to a new patch (foraging environment), especially if there was a regional
depression of a broad spectrum of resources. Again, this is most likely a seasonal
development. Exploitation of mussels might be most feasible during late summer, and
might attract human populations to mussel patches. As fall rains begin, snail returns would
rise in importance as availability increased. Fall seed crops would begin to reach fruition,
and as mast increased, the health and abundance of herbivores would increase as well.
Over-wintering may have occurred, but foragers may well have left for other patches if the
overall return rate began to increase again.
Somewhat different conclusions were presented by Klippel and Morey (1986), who
recovered hundreds of thousands of small-bodied aquatic snails at an Archaic site in
Tennessee. After establishing cultural introduction to the site they evaluated the nutritional
content (similar to Rabdotus) and compared it to deer. Their data, however, showed deer as
completely lacking in important vitamins and minerals such as the B vitamins, iron, and
potassium (compare with Table 6, above). Their conclusion was that the snails were an
102
important complementary portion of the diet, and procured during late summer when water
levels were manageable and, in Tennessee, other resources such as deer were healthy and
readily available. The snails provided nutritional needs difficult to obtain through other
means. Although the majority of the macronutrient information must be revised, a similar
argument can be made here for carbohydrates. Rather than higher ranked animals being
absent, a relative lack of other carbohydrate sources may have precipitated molluscan
gathering in addition to the continued acquisition of large and medium sized mammals.
By looking at nutritional returns as well as caloric values, it is possible to further
test and refine expectations presented by the optimal foraging model. The interpretations
presented above are highly speculative, but not unreasonable. Although energy returns
showed that mollusks should be low ranked, understanding the nutritional role of
carbohydrates potentially helps to explain a seeming importance as a food source. It is
possible that there are other reasons or complicating factors that might also contribute to the
presence of these animals. The next chapter will begin by testing other aspects of the
patch-choice model, and then conclude by revisiting the global model presented earlier.
This will be an attempt to link the middle range methodology to higher levels of model
building suggested by evolutionary ecology. The results may be tentative and perhaps even
untestable, but as above, may also be reasonable explanations for the seeming
incongruencies presented by the subsistence data.

CHAPTER 8
CONCLUSIONS
A Limited Test Of Optimal Foraging Concepts
Patch Choice, Time in Patch, and Search and Pursuit Times. Optimal foraging
models make presumptions based on net energy returns; when costs of acquisition are
outweighed by the energy return, a positive balance is achieved, and the rational forager
would theoretically pursue this successful strategy. Once the return no longer exceeded the
effort expended in acquisition, the forager would then make decisions, conscious or not, as
to how to best regain a positive return. This includes choice of prey, choice of gathering
locale (patch), breadth of diet, commitment of time, group size, and location of settlement
(Bettinger 1987:131). In some cases, optimization based on combinations of these various
factors may not be possible; environmental or social factors may be limiting. If this is not a
temporary situation, the forager will suffer, physically or socially, with the end result being
a loss of reproductive potential.
Actualistic studies designed to test such models can be inconclusive. Modern
gatherers making broad assumptions about gathering and processing techniques can
produce data that is useful, but perhaps questionable (e.g. Simms 1984, Smith et al. 2000),
and at times contradictory (Kornfeld 1994, Broughton 1995, cited in Smith et al. 2000).
Regardless, following on middle range theory (Binford 1981, Bettinger 1987), such efforts
help in developing a corpus of data that can be used comparatively by testing new studies
against it.
The present project looks at snails as a potential food source. It began by
establishing that snail populations within an archaeological site showed a significantly
different population structure than populations found in natural (non-site) settings. It was
also necessary to determine the return rate of snails, thus allowing their ranked placement
within possible diet choices. From this it may be possible to reach certain conclusions as to
general local conditions during site occupation. This is something of a coarse-grained
103

104
application. Although very specific data are being applied, they are being used in order to
ascertain a fairly broad level of interpretation.
Collection procedures also allow a more fine-grained application, here, specifically
related to search and pursuit times, and how they relate to patch choice. The normal
currency for such studies is energy, often expressed as calories (Kelly 1995:101, 102). As
intimated above, however, collecting episodes can result in highly conjectural and
unverifiable data; the modern archaeologist who gathers grass seeds, grasshoppers, or snails
is not subject to the same environmental and cultural factors of the prehistoric forager. It
must be reiterated, however, that such studies are necessary and are indeed a vital means of
establishing baseline data from which increasingly refined models can be derived and
tested.
Returning to the issue of currency and scale of application, there are two distinct
collecting episodes that can be used to test aspects of optimal foraging models. One
consisted of the collection of live snails, for ultimate nutritional analysis, and the other
consisted of the collection of dead snails (shells) as a proxy for live snails when it was
determined that no live snails were forthcoming at the collection site. This data can be used
not only for return rates, when either real or hypothesized nutritional value is determined,
but also to test for time spent within and between patches, and to explore the reasoning
processes that led to such choices.
The Collections. Two of the collections, the WWF and BFL1, were used to test for
time in patch, a component of the patch-choice model. The relevant data was time spent
collecting, area collected, the number collected, and the collecting density, i.e., the
encountered/collected number of snails per area unit rather than the actual number of snails
within the patch. As already stated, although travel times were recorded during the BFL1
episode, they were felt to be unrepresentative of prehistoric foraging, based largely on the
sample size and imprecise knowledge of the environment, and so were not included in
calculations, although they are presented in summary Table 7. These data allowed some
basic conclusions to be drawn in regards to relative energy expenditures.
The methodology can be evaluated in both subjective and objective terms.
Subjectively, as snail collection episodes progressed, it was felt that there was a
105
concomitant increase in knowledge, particularly at the BFL. Once a landform or
environmental setting produced positive results, similar settings became targeted. This is
most obvious in the high return per minute and low travel times seen at BFL patches 2 and
3. It was also noted that when collecting, there was a tendency to collect almost all
available specimens, regardless of size, once a particular collection had begun. The actual
process was surprisingly strenuous, and involved repeated stooping, at times requiring
reaching into thorny underbrush, which introduced a certain risk factor. By establishing a
lowered position it seemed desirable to maximize the return before returning to an upright
posture. Snail densities have been reported elsewhere as reaching up to 18 individual per
square m. Although not empirically quantified, it was noted that snails in the larger patches
were commonly seen in small groups, typically around 4-5, and commonly as many as ten
or so within a poorly defined space that might average 1-2 square m. These would be seen
within the larger patches, with the result being that a single patch would contain numerous
subpatches which could be individually targeted. It was at these times that maximization
was most fully indicated. The main patch would be either transected (as at the WWF) or
randomly walked (as at the BFL), until it was felt that all subpatches had been exploited.
The narrow transects of the WWF collection undoubtedly produced a greater level of
control, and as Table 7 shows, a greater recovery (by a factor of 4) then the random walks
at the BFL. The BFL data, however, most likely represent a greater level of reality.
Results. At the WWF 2100 square m produced 541 shell in 101.5 minutes, and at
the BFL 4200 square m produced 247 live snails in 61.34 minutes, for a total of 788 snails
collected from 6300 square m in 162.84 minutes (2.7 hours), averaging 4.8 snails per
minute and .125 snails per square m. The four patches for which search time is included
had returns of 221 snails pursued for 49.34 minutes for 4.5 snails per minute. When search
times were added (19.42 minutes) the return rates fell to 3.2 snails per minute,
approximately 80% of the total average return rate, and 70% of the return rate for the four
patches. Individual patch return times ranged from .8 to 8.5 snails per minute.
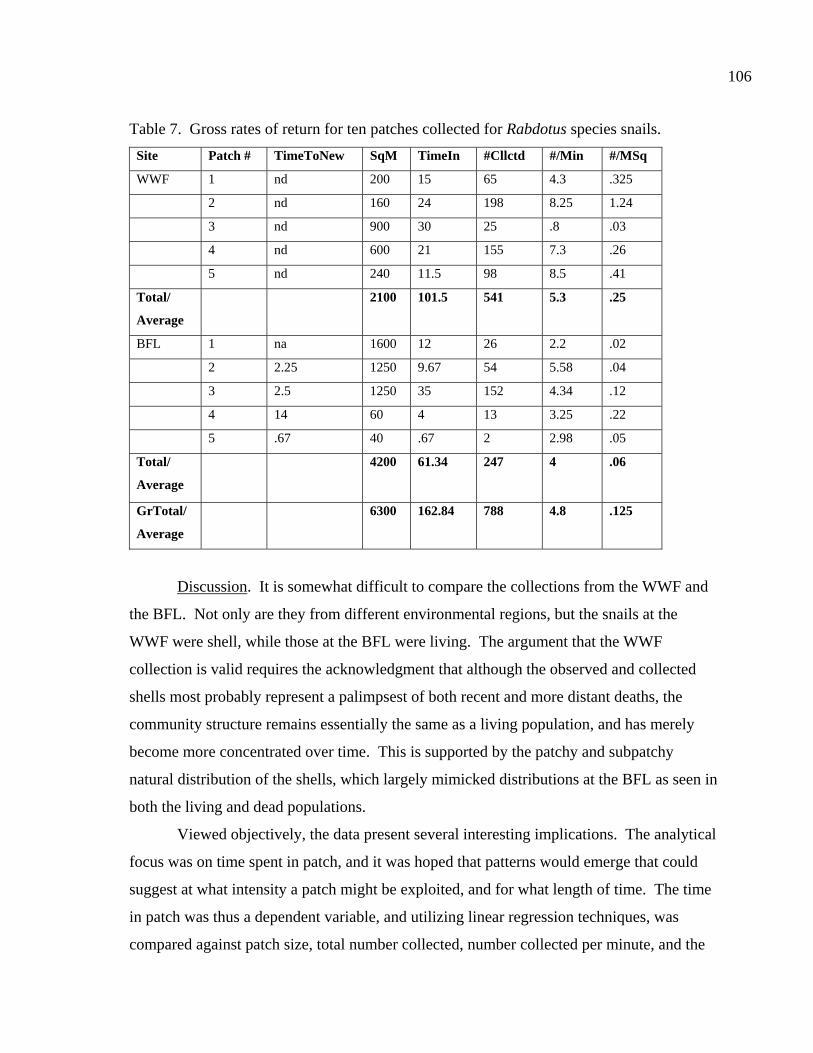
106
Table 7. Gross rates of return for ten patches collected for Rabdotus species snails. Site Patch # TimeToNew SqM TimeIn #Cllctd #/Min #/MSq
WWF 1 nd 200 15 65 4.3 .325
2 nd 160 24 198 8.25 1.24
3 nd 900 30 25 .8 .03
4 nd 600 21 155 7.3 .26
5 nd 240 11.5 98 8.5 .41
Total/
Average
2100 101.5 541 5.3 .25
BFL 1 na 1600 12 26 2.2 .02
2 2.25 1250 9.67 54 5.58 .04
3 2.5 1250 35 152 4.34 .12
4 14 60 4 13 3.25 .22
5 .67 40 .67 2 2.98 .05
Total/
Average
4200 61.34 247 4 .06
GrTotal/
Average
6300 162.84 788 4.8 .125
Discussion. It is somewhat difficult to compare the collections from the WWF and
the BFL. Not only are they from different environmental regions, but the snails at the
WWF were shell, while those at the BFL were living. The argument that the WWF
collection is valid requires the acknowledgment that although the observed and collected
shells most probably represent a palimpsest of both recent and more distant deaths, the
community structure remains essentially the same as a living population, and has merely
become more concentrated over time. This is supported by the patchy and subpatchy
natural distribution of the shells, which largely mimicked distributions at the BFL as seen in
both the living and dead populations.
Viewed objectively, the data present several interesting implications. The analytical
focus was on time spent in patch, and it was hoped that patterns would emerge that could
suggest at what intensity a patch might be exploited, and for what length of time. The time
in patch was thus a dependent variable, and utilizing linear regression techniques, was
compared against patch size, total number collected, number collected per minute, and the
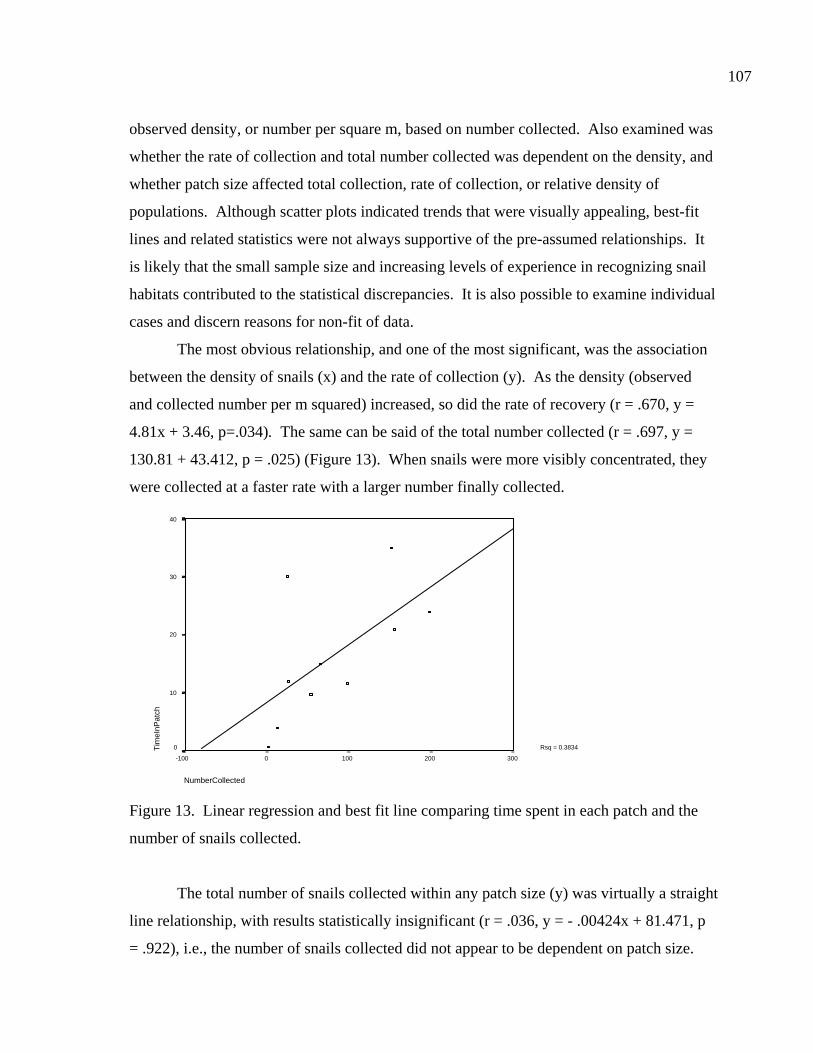
107
observed density, or number per square m, based on number collected. Also examined was
whether the rate of collection and total number collected was dependent on the density, and
whether patch size affected total collection, rate of collection, or relative density of
populations. Although scatter plots indicated trends that were visually appealing, best-fit
lines and related statistics were not always supportive of the pre-assumed relationships. It
is likely that the small sample size and increasing levels of experience in recognizing snail
habitats contributed to the statistical discrepancies. It is also possible to examine individual
cases and discern reasons for non-fit of data.
The most obvious relationship, and one of the most significant, was the association
between the density of snails (x) and the rate of collection (y). As the density (observed
and collected number per m squared) increased, so did the rate of recovery (r = .670, y =
4.81x + 3.46, p=.034). The same can be said of the total number collected (r = .697, y =
130.81 + 43.412, p = .025) (Figure 13). When snails were more visibly concentrated, they
were collected at a faster rate with a larger number finally collected.
NumberCollected
3002001000-100
Tim
eInP
atch
40
30
20
10
0 Rsq = 0.3834
Figure 13. Linear regression and best fit line comparing time spent in each patch and the
number of snails collected.
The total number of snails collected within any patch size (y) was virtually a straight
line relationship, with results statistically insignificant (r = .036, y = - .00424x + 81.471, p
= .922), i.e., the number of snails collected did not appear to be dependent on patch size.
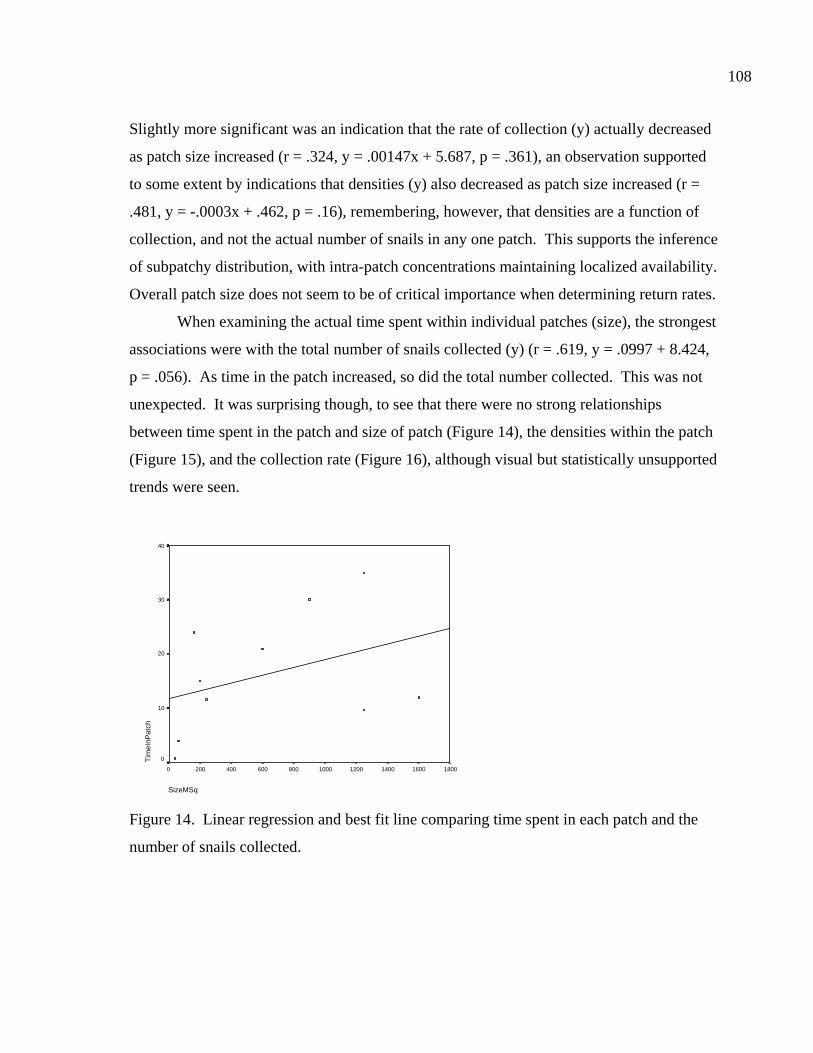
108
Slightly more significant was an indication that the rate of collection (y) actually decreased
as patch size increased (r = .324, y = .00147x + 5.687, p = .361), an observation supported
to some extent by indications that densities (y) also decreased as patch size increased (r =
.481, y = -.0003x + .462, p = .16), remembering, however, that densities are a function of
collection, and not the actual number of snails in any one patch. This supports the inference
of subpatchy distribution, with intra-patch concentrations maintaining localized availability.
Overall patch size does not seem to be of critical importance when determining return rates.
When examining the actual time spent within individual patches (size), the strongest
associations were with the total number of snails collected (y) (r = .619, y = .0997 + 8.424,
p = .056). As time in the patch increased, so did the total number collected. This was not
unexpected. It was surprising though, to see that there were no strong relationships
between time spent in the patch and size of patch (Figure 14), the densities within the patch
(Figure 15), and the collection rate (Figure 16), although visual but statistically unsupported
trends were seen.
SizeMSq
180016001400120010008006004002000
Tim
eInP
atch
40
30
20
10
0
Figure 14. Linear regression and best fit line comparing time spent in each patch and the
number of snails collected.
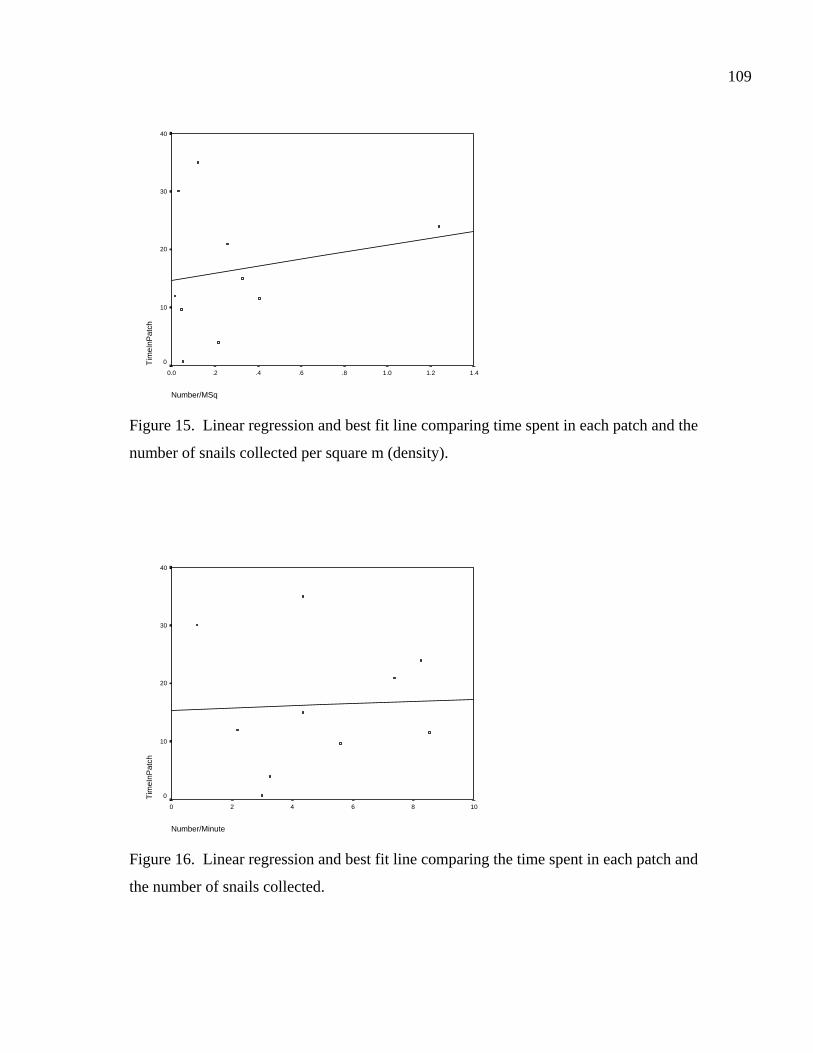
109
Number/MSq
1.41.21.0.8.6.4.20.0
Tim
eInP
atch
40
30
20
10
0
Figure 15. Linear regression and best fit line comparing time spent in each patch and the
number of snails collected per square m (density).
Number/Minute
1086420
Tim
eInP
atch
40
30
20
10
0
Figure 16. Linear regression and best fit line comparing the time spent in each patch and
the number of snails collected.
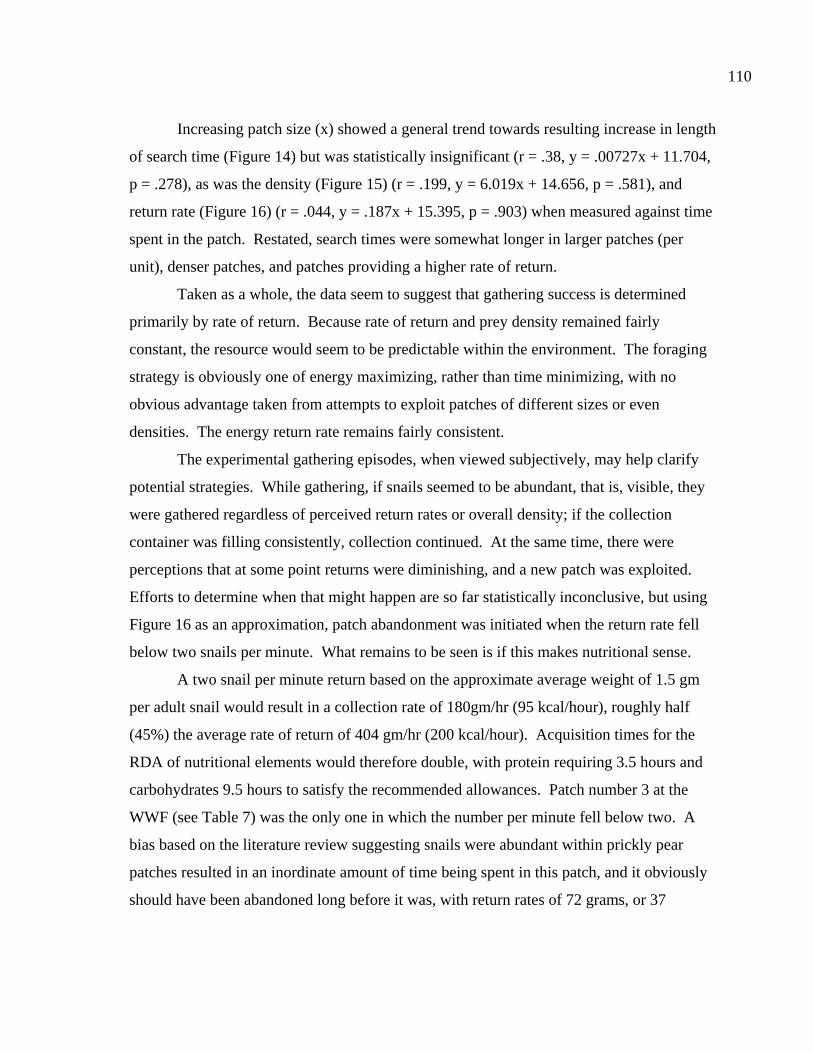
110
Increasing patch size (x) showed a general trend towards resulting increase in length
of search time (Figure 14) but was statistically insignificant (r = .38, y = .00727x + 11.704,
p = .278), as was the density (Figure 15) (r = .199, y = 6.019x + 14.656, p = .581), and
return rate (Figure 16) (r = .044, y = .187x + 15.395, p = .903) when measured against time
spent in the patch. Restated, search times were somewhat longer in larger patches (per
unit), denser patches, and patches providing a higher rate of return.
Taken as a whole, the data seem to suggest that gathering success is determined
primarily by rate of return. Because rate of return and prey density remained fairly
constant, the resource would seem to be predictable within the environment. The foraging
strategy is obviously one of energy maximizing, rather than time minimizing, with no
obvious advantage taken from attempts to exploit patches of different sizes or even
densities. The energy return rate remains fairly consistent.
The experimental gathering episodes, when viewed subjectively, may help clarify
potential strategies. While gathering, if snails seemed to be abundant, that is, visible, they
were gathered regardless of perceived return rates or overall density; if the collection
container was filling consistently, collection continued. At the same time, there were
perceptions that at some point returns were diminishing, and a new patch was exploited.
Efforts to determine when that might happen are so far statistically inconclusive, but using
Figure 16 as an approximation, patch abandonment was initiated when the return rate fell
below two snails per minute. What remains to be seen is if this makes nutritional sense.
A two snail per minute return based on the approximate average weight of 1.5 gm
per adult snail would result in a collection rate of 180gm/hr (95 kcal/hour), roughly half
(45%) the average rate of return of 404 gm/hr (200 kcal/hour). Acquisition times for the
RDA of nutritional elements would therefore double, with protein requiring 3.5 hours and
carbohydrates 9.5 hours to satisfy the recommended allowances. Patch number 3 at the
WWF (see Table 7) was the only one in which the number per minute fell below two. A
bias based on the literature review suggesting snails were abundant within prickly pear
patches resulted in an inordinate amount of time being spent in this patch, and it obviously
should have been abandoned long before it was, with return rates of 72 grams, or 37
111
kCal/hr. The rate of two snails per minute is therefore presented as a postulated minimal
return, below which a new patch would be searched for and subsequently collected.
Should this interpretation hold, it would indicate, based on the patch-choice model,
that the actual mean return rate of all patches in the environment, rather than being 200
kcal/hour, would actually be closer to 100 kcal/hour. As an exploited patch would of
necessity be less productive after collection, the total environment would be required to be
less productive than the 200 kcal/hour that would allow snails to be introduced in the first
place. This seems unlikely, and requires additional research before it can be stated as fact.
Snails may be more productive than suggested here, or, other reasons for snail-based
subsistence my need to be explored.
Testing The Global Model
A model based on global parameters was presented above. Based on assumptions of
broad ecological determinants and observed variability of human groups within a variety of
settings, predictions were made for what might be expected for Central Texas in terms of
what can broadly be termed settlement patterning. The snail data presented allow some of
these predictions to be more fully tested. These include models of population size,
seasonality and mobility, and social organization.
Population Size. An exercise often attempted involves the determination of human
population sizes based on the amount of food available for consumption. Normative figures
for band sizes have been postulated as ranging from between 25 and 500 individuals, with
bands of 25 perhaps being more common for nomadic groups, and much larger numbers
being observed for sedentary groups (Kelly 1995:209-211). Collins (1973), examined the
number of mussel shells found within a burned rock midden at the Devil’s Hollow site in
Travis County, Texas. By looking strictly at the number of individual mussels
(approximately 1200) and making arbitrary estimates for daily consumption rates, he
derived a range of periods in which the mussels, and hence the midden deposits, might
accumulate (Collins 1973:94-97).
112
Lintz, using similar reasoning, was able to show that discrete mussel features at
41TG307 and 41TG309 could have supplied the minimal daily requirements for between
one to nine individuals (Lintz 1996:T-14). Parmalee and Klippel, meanwhile, estimated
that a group of 25 persons would require around 2000 mussels per day to meet caloric
requirements, thus arguing that mussels of necessity would be a dietary supplement rather
than a mainstay (Parmalee and Klippel 1974:431, 433). Erlandson (1988) cites these
figures but then argues that the same group could achieve its protein needs (note the mixed
currencies) with only 300 mussels per day (Erlandson 1988:105-106), a figure comparable
to Lintz’s, whose data can be manipulated to show that about 390 Texas mussel would
supply adequate protein to a group of 25 persons (Lintz 1996:Table4).
If a minimum use area of 100 square m is assumed, some 300,000 grams, or almost
210,000 snails may have been collected during a single occupation sequence. This would
supply a group of 25 adult males necessary protein for 17 days, carbohydrates for 6.5 days,
and calories for 3. Using the regression formula presented earlier (36 mussels for every
1320 snails), approximately 5700 mussels (130,000 gm) would be expected within the same
level. The same 25 persons (adult males) would have the necessary protein for 11 days, fat
for 6.5 days, and calories for 1.5. Combined, protein is sufficient for close to a month,
carbohydrates and fats for one week, while calories are seriously deficient.
Although 300,000 grams seems a tremendous amount, it can be shown
(theoretically, based on Table 1) that one person could collect 3200 grams in an eight hour
day. It would therefore take this single person 93 days to collect 300,000 gm. It follows
that 10 persons could collect the same amount in nine days, and if all 25 persons were
collecting, approximately 3.7 days, which would come close to meeting the carbohydrate
and caloric needs, respectively, for the group of 25. If mussels are included, with collection
at the rate of 4000 gm/person/day, then 10 persons could provide a 6.5 day fat supply for 25
adult males in approximately 4 days. As long as labor and supply is sufficient, a positive
energy and basic nutritional balance would be maintained.
Seasonality and Mobility. Snails are most easily gathered beginning in late spring
through perhaps early to mid fall. During cold weather months they would be unavailable.
During the heat of the summer some species may be highly visible while estivating above
113
ground, but the experimental gathering exercises described here suggest that snails will be
most visible during rainy periods, which are most likely to occur during late spring and
early fall, in particular, May and September (Carr 1967:Figure 4).
Mussels, although having irregular reproductive strategies across species, as a group
tend to spawn in late spring through early fall (Howells et al. 1996:9), during which their
body mass may increase by as much as 30% (Lintz 1996:T-4). Gathering mussels,
meanwhile, would be easier (less labor intensive) during periods of low water (Claassen
1991:290) which can be assumed to be during late summer, especially for shallow water
species (Lintz 1996:T-4).
If mollusks are the main subsistence base, and were utilized for up to five months,
then indications are that prehistoric populations moved from this location to others on a
seasonal basis. Supporting a relatively high level of mobility (or at least a lowered level of
sedentarism) is the lithic assemblage, which consists of unequal proportions of formal to
informal tools. Out of 259 tools so far recovered, 159, or 61% are considered formal tools,
while the remaining 100, or 39%, are considered informal. Formal tools are defined as
bifaces, whether or not complete, projectile points, and well-made scrapers. The informal
tools are primarily flakes with evidence of edge modification, either through intentional
retouch or through use. This relatively low proportion of “situational gear” as compared to
“personal gear” (Binford 1979) can be used as a means of understanding mobility patterns
(Sulliven and Rozen 1985:74). A toolkit with low diversity indicates relatively high
mobility while more mobile groups might also be expected to carry a relatively large
number of flake tools sized from 1.5 to 3 times the minimum useable size (Kuhn 1994:435).
Bifaces are “maintainable” in a field situation, and so are to be expected within mobile task
groups or populations, while on-site activities allow for expediently manufactured flakes
(Bamforth 1991:229-230).
Tethered collectors, on the other hand, would tend to repeatedly occupy sites with a
resultant increase in artifact diversity, particularly at base camps (Binford 1980). While as
yet there are no in depth studies of the lithic debris from 41BL116, the high number of
formal tools coupled with a lack of immediately accessible chert resource areas suggests
that the site may have served as a retooling station, during which blanks or preforms,
114
prepared elsewhere, were reduced further while residents subsisted on the readily available
mollusks. Many of the bifaces and projectile points are broken, and, especially among the
Darl and Ensor assemblage, many are complete (unbroken) but appear exhausted. Cores
are also extremely rare, as are large cortical flakes. Reduction of blanks during retooling
would have produced the types of flakes sufficient for expedient cutting, sawing, and
scraping purposes.
Site 41BL116 is suggestive of people “mapping on” to a resource (mollusks) and
then moving the population to the resource, rather than sending out logistically based
parties as might be expected of collectors operating within Binford’s (1980)
collector/forager spectrum. A predictable and stable resource allowed a period of at least a
few weeks for refurbishing of the formal hunting assemblage prior to the group’s assumed
movement to areas more favorable for hunting endeavors.
Social Organization. Shellfish, and by extension, mollusks, are often described as a
low-ranked and generally undesirable food source (Claassen 1991: 278-279, Erlandson
1988:107, Bird and Bliege Bird 2000:471). As a gathered (as opposed to hunted) resource,
the task of acquisition most likely fell primarily on women (Glassow and Wilcoxen
1988:47, Erlandson 1988:107, Claassen 1991), and children (Bird and Bliege Bird 2000,
Hawkes et al. 1995) and as such should allow at least tenuous interpretations as to gendered
space and division of labor. Men are not necessarily excluded from such activities, but in
general men are described as hunters (Hawkes et al. 1991, Gero1991:167) or fishers
(Claassen 1991:286-287) even though if the entire range of what constitutes “hunting” is
considered, the role of women becomes much more significant (Brumbach and Jarvenpa
1997) or even central (Estioko-Griffin and Griffin 1981).
The role of children cannot be overlooked. The behavior of children when
gathering may differ significantly from that of adults, with the archaeological signature
likewise changing. As an example, it has been shown that Meriam children exploit a
greater variety of shellfish than their adult counterparts, and are less likely to “field
process” them with resultant midden deposits therefore skewed towards children’s
activities, which may inflate the on-site abundance of such resources (Bird and Bliege Bird
2000:473).

115
Gathered resources, meanwhile, are often consumed, either partially or wholly,
while gathering is in progress (Hawkes et al. 1995:690, Woodburn 1968:51) which would
result in that portion of activity to be lost to the archaeological record (Bird and Bliege Bird
2000:468) and so make population size and nutritional analyses largely irrelevant (Claassen
1991:286). The assumption is that immediate hunger is satisfied while gathering, with any
excess being returned to camp for communal consumption.
The sheer volume of mollusks at 41BL116 precludes differential presence due to
children’s activities, nor is it likely that greater quantities were consumed off-site. Rather,
the acquisition of these animals was an important and integral portion of the seasonal
subsistence patterns of local people. Ethnographic evidence suggests that women, and to
some extent, children, were the primary “breadwinners” at these times. It may have been a
period during which men conducted technological maintenance and renewal of inter (and
perhaps intra) band social ties at a time in which they were freed, to some extent, from the
more mundane aspects of day-to-day subsistence needs. Women were not necessarily
relegated to supporting roles through allowing men the opportunities to pursue these other
activities. It is entirely possible that this activity actually was recognized as a valuable
contribution with women achieving praise and status as a result of their efforts (Claassen
1991:285).
Conclusions. Consumption of mollusks at 41BL116 may have been an integral part
of site formation. The amounts present allow group size to be postulated, and the
population dynamics of the resource provide information from which periods of occupation
and lengths of stay can be suggested. Ethnographic comparisons are a means of gaining
insight into how labor was divided, and the role of men, women, and children within the
local social structure. The global model suggested that group size would be between 20 and
60 persons, they would be moderately to highly mobile, and women would provide the bulk
of the food. These assumptions all fall within the realm of possibilities as allowed by the
molluscan data, with the most likely discrepancy being a potential lower level of mobility
than that suggested by the model. The model also suggested little to no reliance on aquatic
resources. While this may have been true in other settings, at 41BL116, aquatic resources
116
appear to be intrinsically linked to settlement and subsistence strategies, with the collection
and consumption of Rabdotus species snails an important component of those strategies.
Summary
The issue of human consumption of Rabdotus species snail has been variously
assumed or denied, based primarily on the investigator’s experience and professional
biases. This study does not settle the issue, but it does provide multiple lines of evidence
that strongly support the intentional gathering and consumption of snails at 41BL116. It
has presented a method that can be replicated by others, and, for the first time, has
quantified important nutritional components of Rabdotus species snails.
Snail populations were found to be differently structured when found within an
archaeological site assemblages as opposed to a natural environment. The differences were
statistically significant, and therefore quantifiable. The result is a step by step methodology
that allows a site assemblage to be compared to a natural population. If they are similar,
human gathering is not supported; if they are different, humans most likely were purposely
acquiring the snails.
Optimal foraging theory is one means of trying to understand why snails might have
been gathered. The basic premise of diet-breadth and prey choice, coupled with new
empirical information on the nutritional value of snails indicates that they would not have
been the prey of choice when other food items were plentiful. The implications are that
there were most likely seasonal and repetitive periods when higher ranked preferred
resources became less abundant, and the acquisition of snails thus became a reasonable and
rational means of acquiring necessary energy.
Understanding this small portion of the foraging decision process provides an
opportunity to examine in greater detail other aspects of settlement and subsistence.
Models based on other aspects and interpretations of archaeological materials can be
compared and tested one against the other and, in reciprocal fashion, can become restated
and increasingly refined.

117
It is recognized that there are shortcomings with the approach. Most obviously, it
cannot be “proven” that humans consumed snails until diagnostic portions of the snail body
are recovered from human coprolites. This may never occur.
There may be other reasons than selective gathering for the observed difference
between on-site and off-site snail population structures. These might include differential
preservation of older, thicker shelled adults, or might involve a return to the commensal
scavenger theory, with more adults than juveniles making their way to human occupation
areas. As yet untested and perhaps unconceived differences in microenvironments,
including some aspect of anthrosols, may result in similar distributions.
Although these and other complaints may be voiced against the findings presented
here, the rule of Occam’s Razor perhaps provides the strongest level of support. Given the
wealth of data, the most parsimonious explanation, by far, is that humans were consuming
snails.
A wealth of additional work can still be supported with the data. The initial
questions of when, how and why can be further refined and addressed by collection of more
fine-grained information. The apparent long-term, repetitious use of the site for
functionally similar purposes has implications for a greater understanding of larger issues of
regional land use (Smith and McNees 1999). Studying human subsistence strategies in
greater detail can clearly help in exploring these larger issues. Studying human
consumption of mollusks adds detail, and thus clarity, to the data from which conclusions
are derived.
REFERENCES CITED
Allen, D. C. and E. P Cheatum 1960 Ecological Implications of Fresh-Water and Land Gastropods in Texas Archeological Studies. Bulletin of the Texas Archeological Society 31:291- 316. Bailey, R. C. 1991 The Behavioral Ecology of Efe Pygmy Men in the Ituri Forest, Zaire. Anthropological Papers No. 86. Museum of Anthropology, University of Michigan. Bamforth, D. B 1991 Technological Organization and Hunter-Gatherer Land Use: A California Example. American Antiquity 56(2):216-235. Belovsky, G. E. 1988 An Optimal Foraging-Based Model of Hunter-Gatherer Population Dynamics. Journal of Anthropological Archaeology 7:329-372. Bettinger, R. L. 1987 Archaeological Approaches to Hunter-Gatherers. Annual Review of Anthropology 16:121-142. Binford, L. R. 1972 An Archaeological Perspective. Seminar Press, New York. 1972a Archaeology as Anthropology. In An Archaeological Perspective, by Lewis R. Binford. Seminar Press, New York. 1979 Organization and Formation Processes: Looking at Curated Technologies. Journal of Anthropological Research 35(3)255-273. 1980 Willow Smoke and Dog’s Tails: Hunter Gatherer Settlement Systems and Archaeological Site Formation. American Antiquity 45(1):4-20.
118
119
1981 Bones: Ancient Men and Modern Myths. Academic Press, New York. 1982 The Archaeology of Place. Journal of Anthropological Archaeology 1:5-31. 1990 Mobility, Housing and Environment: A Comparative Study. Journal of Anthropological Research 46:119-152. Bird, D. W. and R. B. Bird 2000 The Ethnoarchaeology of Juvenile Foragers: Shellfishing Strategies among Meriam Children. Journal of Anthropological Archaeology 19:461-476. Blair, W. F. 1950 The Biotic Provinces of Texas. Texas Journal of Science 1(1):93-117. Boas, F. 1940 Race, Language and Culture. MacMillan Company, New York. Boone, J. L. and E. A. Smith 1998 Is it Evolution Yet? A Critique of Evolutionary Archaeology. Current Anthropology 39(Supplement):S141-S173. Brink, J. W. 1997 Fat Content in Leg Bones of Bison bison, and Applications to Archaeology. Journal of Archaeological Science 24:259-274. Broughton, J. M. 1995 Resource Depletion and Intensification During the Late Holocene, San Francisco Bay: Evidence from the Emeryville Shellmound Vertebrate Fauna. Ph.D. Dissertation, University of Washington, Ann Arbor. UMI Dissertation Services. Broughton, J. M. and J. F. O’Connell 1999 On Evolutionary Ecology, Selectionist Archaeology, and Behavioral Archaeology. American Antiquity 64(1):153-165.
120
Brown, F. ca. 1900 Annals of Travis County and the City of Austin from the Earliest Times to the Close of 1875. Manuscript on file, Austin History Center, Austin. Brown, K. M. 1999 Snails From the Quarter-Inch and Eighth-Inch Screens. Appendix F (pp. 213-275) In The Smith Creek Bridge Site (41DW270) A Terrace Site in DeWitt County, Texas, by Dale Hudler, Keith Prilliman, and Thomas Gustavson. Texas Archeological Research Laboratory, Studies in Archeology 35 and Texas Department of Transportation Environmental Affairs Division, Archeology Studies Program, Report 17, Austin. Brown, T., K.L. Killen, H. Simons, and V. Wulfkuhle 1982 Resource Protection Planning Process for Texas. Texas Historical Commission, Austin. Brumbach, H. J., and R. Jarvenpa 1997 Ethnoarchaeology of Subsistence Space and Gender: A Subarctic Dene Case. American Antiquity 62(3):414-436. Butler, W. B. 1987 Significance and Other Frustrations in the CRM Process. American Antiquity 52(4) 820-829. Cambell, N. A. 1993 Biology, Third Edition. Benjamin Cummings, New York. Carr, J.T. 1967 The Climate and Physiography of Texas. Report No. 53. Texas Water Development Board, Austin. Chang, C. 1992 Archaeological Landscapes: The Ethnoarchaeology of Pastoral Land Use in the Grevena Province of Northern Greece. In Space, Time, and Archaeological Landscapes, edited by J. Rossignol and L Wandsnider, pp. 257-282. Plenum Press, New York.

121
Cheatum, E. P. and R. W. Fullington 1971a The Aquatic and Land Mollusca of Texas. Part One: The Recent and Pleistocene Members of the Gastropod Family Polygyridae in Texas. Bulletin 1, Dallas Museum of Natural History, Dallas. 1971b The Aquatic and Land Mollusca of Texas: Supplement: Keys to the Families of the Recent Land and Fresh-Water Snails of Texas. Bulletin 1, Dallas Museum of Natural History, Dallas. 1973 The Aquatic and Land Mollusca of Texas. Part Two: The Recent and Pleistocene Members of the Puplidae and Urocoptidae (Gastropoda) in Texas. Bulletin 1, Dallas Museum of Natural History, Dallas. Claassen, C. P. 1991 Gender, Shellfishing, and the Shell Mound Archaic. In Engendering Archaeology: Women and Prehistory, edited by J. M. Gero and M. W. Conkey, pp. 276-300. Blackwell, Oxford. Clark, J. W. Jr. 1969 Implications of Land and Fresh-Water Gastropods in Archaeological Sites. Arkansas Academy of Science Proceedings 23:38-52. 1973 The Problem of the Land Snail Genus Rabdotus in Texas Archeological Sites. The Nautilus 87(1):24. 1976 Alvar Nunez and the Snail Rabdotus in Texas. The Nautilus 90(1):13-14. Collins, M. B. 1972 The Devil’s Hollow Site, A Stratified Archaic Campsite in Central Texas. Bulletin of the Texas Archeological Society 43:78-100. 1995 Forty Years of Archeology in Central Texas. Bulletin of the Texas Archeological Society 66:361-400.
122
2001 Archeology of the Lampasas Cut Plain from Paleoindians to Pioneers: 2001 TAS Field School – Archeological Survey, Testing, and Excavation. Texas Archeology: The Newsletter of the Texas Archeological Society 45(1): 3-6. Collins, M. B., C. B. Bousman and T. K. Perttula 1993 Quaternary Environments and Archeology in Northeast Texas. In Archeology in the Eastern Planning Region, Texas: A Planning Document, edited by N. A. Kenmotsu and T. K. Perttula, pp. 46-67. Cultural Resource Management Report 3. Department of Antiquities Protection, Texas Historical Commission, Austin. Cronk, L. 1991 Human Behavioral Ecology. Annual Review of Anthropology 20:25-53. Dennet, D. 1998 Comments. Current Anthropology. 39(Supplement):S157-S158. Drennan, R. D. 1996 Statistics for Archaeologists: A Common Sense Approach. Plenum Press, New York. Dunnell R. C. and W. S. Dancey 1983 The Siteless Survey: A Regional Scale Data Collection Strategy. In Advances in Archaeological Method and Theory, Vol. 5, edited by Michael B. Schiffer, pp. 267-287. Academic Press, New York. Dwyer, P. D. 1985 A Hunt in New Guinea: Some Difficulties for Optimal Foraging Theory. Man, New Series 20(2)243-253. Ebert, J. I. 1992 Distributional Archaeology. University of New Mexico Press, Albuquerque. Ellis, G. L., and G. A. Goodfriend 1994 Chronometric and Site-Formation Studies Using Land Snail Shell: Preliminary Results. In Archeological Investigations on 571 Prehistoric Sites at Fort Hood, Bell and Coryell Counties, Texas, edited by W. Nicholas

123
Trierweiler, pp. 183-201. Resource Management Series Research Report No. 31. United States Army Fort Hood Archeological Resource Management Series. Mariah Associates, Austin. Ellis, G. L., G. A. Goodfriend, J. T. Abbott, P. E. Hare, and D. W. Von Endt 1996 Assessment of Integrity and Geochronology of Archaeological Sites Using Amino Acid Racemization in Land Snail Shells: Examples from Central Texas. Geoarchaeology: An International Journal 11(3):189-213. Ellis, L. W. 1997 Hot Rock Technology. In Hot Rock Cooking the Greater Edwards Plateau: Four Burned Rock Midden Sites in West Central Texas, Volume 1. by S. L. Black, L. W. Ellis, D. G. Creel, and G. T. Goode, pp. 43-81. Studies in Archeology 22. Texas Archeological Research Laboratory, The University of Texas at Austin, and Report 2. Texas Department of Transportation and Environmental Affairs Department, Archeology Studies Program, Austin. Ellis, L.W., G. L. Ellis, and C. D. Frederick 1995 Implications of Environmental Diversity in the Central Texas Archeological Region. Bulletin of the Texas Archeological Society 66:401-426. Erlandson, J. M. 1988 The Role of Shellfish in Prehistoric Economies: A Protein Perspective. American Antiquity 53(1)102-109. Estioko-Griffin, A. and P. B. Griffin 1981 Woman the Hunter: The Agta. In Woman the Gatherer, edited by F. Dahlberg, pp. 121-151. Yale University Press, New Haven. Foley, R. 1985 Optimality Theory in Archaeology. Man, New Series 20(2)222-242. Fullington, R. W., and W. L. Pratt 1974 The Aquatic and Land Mollusca of Texas Part Three: The Helicinidae, Carychiidae, Achatinidae, Bradybaenidae, Bulimidae, Cionellidae, Haplotrematidae, Helicidae, Oreohelicidae, Spiraxidae, Streptaxidae,
124
Strobilopsidae, Thysanophoridae,,Valloniidae (Gastropoda) in Texas. Bulletin 1. Dallas Museum of Natural History, Dallas. Gatschet, A. S. 1891 The Karankawa Indians, The Coast People of Texas. Archaeological and Ethnological Papers of the Peabody Museum 1(2). Harvard University, Cambridge. Gaynor, F. 1959 Concise Dictionary of Science. Philosophical Library, New York. Gero, J. M. 1991 Genderlithics: Women’s Roles in Stone Tool Production. In Engendering Archaeology, edited by J. M. Gero and M. W Conkey, pp. 163-193. Blackwell, Oxford, UK. Glassow, M. A. and L. R. Wilcoxon 1988 Coastal Adaptations Near Point Conception, California, with Particular Regard to Shellfish Exploitation. American Antiquity 53(1):36-51. Goodfriend, G. A. 1989 Variation in Land-Snail Shell Form and Size and Its Causes: A Review. Systematic Zoology 35(2):204-223. 1992 The Use of Land Snail Shells in Paleoenvironmental Reconstruction. Quaternary Science Reviews. 11:665-685. Hall, G. D. 1981 Allens Creek: A Study in the Cultural Prehistory of the Lower Brazos River Valley, Texas. Research Report 61. Texas Archeological Survey, The University of Texas at Austin. 1998 Prehistoric Food Resource Patches on the Texas Coastal Plain. Bulletin of the Texas Archeological Society 69:1-10.

125
Harris, M. 1968 The Rise of Anthropological Theory. Thomas Y. Crowell, New York. Hastorf, C. A. 1991 Gender, Space and Food in Prehistory. In Engendering Archaeology, edited by J. M. Gero and M. W Conkey, pp. 132-159. Blackwell, Oxford, UK. Hawkes, K. and J. F. O’Connell 1985 Optimal Foraging Models and the Case of the !Kung. American Anthropologist 87:401-405. Hawkes, K., J. F. O’Conell, and N. G. Blurton Jones 1991 Hunting Income Patterns among the Hadza: Big Game, Common Goods, Foraging Goals and the Evolution of the Human Diet. Philosophical Transactions of the Royal Society of London, Series B 334:243-251. 1995 Hadza Children’s Foraging: Juvenile Dependency, Social Arrangements, and Mobility among Hunter-Gatherers. Current Anthropology 36(4):688- 700. Headland, T. N. and J. D. Headland 1997 Limitation of Human Rights, Land Exclusion and Tribal Extinction: The Agta Negritos of the Philippines. Human Organization 56:1:79-89. Healy, P. F., K. Emery, and L. E. Wright 1990 Ancient and Modern Maya Exploitation of the Jute Snail (Pachychilus). Latin American Antiquity 1(2):170-183. Henry, D. O. 1995 Cultural and Paleoenvironmental Successions Revealed by the Hog Creek Archeological Investigations, Central Texas. In Advances in Texas Archeology: Contributions From Cultural Resource Management, Volume 1, edited by J. E. Bruseth and T. K. Perttula, pp. 51-79. Cultural Resource Management Report 5. Texas Historical Commission, Department of Antiquities Protection, Austin.
126
Hester, T. R., and T. C Hill, Jr. 1975 Eating Land Snails in Prehistoric Southern Texas: Ethnohistoric and Experimental Data. The Nautilus 89(2):37-78. Hill, K. 1988 Macronutrient Modifications of Optimal Foraging Theory: An Approach Using Indifference Curves Applied to Some Modern Foragers. Human Ecology 16(2)157-197. Honea, K. H. 1962 The Rammadyat of Northwest Africa and the Burned Rock Middens of Texas. Bulletin of the Texas Archeological Society 32:316-320. Howells, R. G, R. W. Neck, and H. D. Murray 1996 Freshwater Mussels of Texas. Texas Parks and Wildlife Department, Inland Fisheries Division. Texas Parks and Wildlife Press, Austin. Hubricht, L. 1960 The Genus Bulimulus in Southern Texas. The Nautilus 74(2)68-70. 1985 The Distributions of the Native Land Mollusks of the Eastern United States. Fieldiana: New Series 24. Publication 1359. Field Museum of Natural History, Chicago. Huckabee, Jr, J. W., D. R. Thompson, J. C. Wyrick, and E. G. Pavlat 1977 Soil Survey of Bell County, Texas. United State Department of Agriculture. Jarman, M. R., C. Vita-Finzi, and E. S. Higgs 1972 Site Catchment and Analysis in Archaeology. In Man, Settlement and Urbanism, edited by P. J. Ucko, R. Tringham, and G. W. Dimbleby, pp. 61- 66. Duckworth. Jelks, E. B. 1962 The Kyle Site: A Stratified Central Texas Aspect Site in Hill County, Texas. Archeology Series 5. Department of Anthropology, The University of Texas at Austin.

127
Jochim, M. 1983 Optimization Models in Context. In Archaeological Hammers and Theories, edited by J. A. Moore and A. S. Keene, pp. 157-172. Academic Press, New York. Johnson, L. 1964 The Devils Mouth Site: A Stratified Campsite at Amistad Reservoir, Val Verde County, Texas. Archeology Series 6. Department of Anthropology, The University of Texas at Austin. 1989 Great Plains Interlopers in the Eastern Woodlands during Late Paleoindian Times: The Evidence from Oklahoma, Texas, and Areas Close By. Report 36. Office of the State Archeologist, Texas Historical Commission, Austin. 1991 Early Archaic Life at the Sleeper Archeological Site, 41BC65 of the Texas Hill Country, Blanco County, Texas. Report No. 39. Publications in Archaeology, Texas State Department of Highways and Public Transportation, Highway Design Division, Austin. 1994 The Life and Times of Toyah-Culture Folk: The Buckhollow Encampment, Site 41KM16, Kimble County, Texas. Report 38. Office of the State Archeologist, Texas Historical Commission, Austin. 1995 Past Cultures and Climates at Jonas Terrace, 41ME29, Medina County, Texas. Report No. 40. Office of the State Archeologist, Texas Department of Transportation and Texas Historical Commission, Austin. 1997 The Lion Creek Site (41BT105), Aboriginal Houses and Other Remains at a Prehistoric Rancheria in the Texas Hill Country (Burnet County). Report 1. Environmental Affairs Division, Archeology Studies Program, Texas Department Transportation, Austin, and Report 41. Office of the State Archeologist, Texas Historical Commission, Austin. 2000 Life and Death as Seen at the Bessie Kruze Site (41WM13) on the Blackland Prairie of Williamson County, Texas. Report 22. Archeology Studies Program, Environmental Affairs Division, Texas Department of Transportation, Austin.
128
Johnson, L. Jr. D. A. Suhm, and C. D. Tunnell 1962 Salvage Archeology of Canyon Reservoir: The Wunderlich, Footbridge, and Oblate Sites. Bulletin No. 5. Texas Memorial Museum, The University of Texas at Austin. Johnson, L. and G.T. Goode 1994 A New Try at Dating and Characterizing Holocene Climates, as Well as Archeological Periods, on the Edwards Plateau. Bulletin of the Texas Archeological Society 65:1-51. Kaplan, H., and K. Hill 1992 The Evolutionary Ecology of Food Acquisition. In Evolutionary Ecology and Human Behavior, edited by E. A. Smith and B. Winterhalder, pp. 167- 202. Aldine de Gruyter, New York. Keeley, L. H. 1988 Hunter-Gatherer Economic Complexity and “Population Pressure”: A Cross-Cultural Analysis. Journal of Anthropological Archaeology 7:373- 411. Keene, A. S. 1979 Economic Optimization and the Study of Hunter-Gatherer Subsistence Settlement Systems. In Transformations: Mathematical Approaches to Culture Change, edited by C. Renfrew and K. Cooke, pp. 367-404. Academic Press, London. 1983 Biology, Behavior, and Borrowing: A Critical Examination of Optimal Foraging Theory in Archaeology. In Archaeological Hammers and Theories, edited by J. A. Moore and A. S. Keene pp. 137-155. Academic Press, New York. Kelley, J. C. 1947 The Lehmann Rock Shelter: A Stratified Site of the Toyah, Uvalde, and Round Rock Foci. Bulletin of the Texas Archeological Society 18:115-128. Kelly, R. L. 1995 The Foraging Spectrum: Diversity in Hunter-Gatherer Lifeways. Smithsonian Institution Press. Washington.
129
Klein, R. G. and K. Cruz-Uribe 1984 The Analysis of Animal Bones from Archeological Sites. The University of Chicago Press, Chicago. Klipperl, W. E. and D. F. Morey 1986 Contextual and Nutritional Analysis of Freshwater Gastropods from Middle Archaic Deposits at the Hayes Site, Middle Tennessee. American Antiquity 51(4): 799-813. Kornfeld, M. 1994 Pull of the Hills: Affluent Foragers of the Western Black Hills. Ph.D. Dissertation. University of Massachusetts. An Arbor. UMI Dissertation Services. Krebs, C. J. 1994 Ecology: The Experimental Analysis of Distribution and Abundance. Harper Collins College Publishers. New York. Krebs, J. R. and N. Davies 1978 Behavioral Ecology: An Evolutionary Approach. Blackwell, Oxford. Kuhn, S. L 1994 A Formal Approach to the Design and Assembly of Mobile Toolkits. American Antiquity. 59(3)426-442. Kuhn, T. S. 1996 The Structure of Scientific Revolutions, Third Edition. University of Chicago Press, Chicago. Kuznar, L. A. 1997 Reclaiming a Scientific Anthropology. AltaMira Press, Walnut Creek, Ca. Lanata, J. L. 1998 Comments. Current Anthropology 39(5)636-637.
130
Lintz, C. 1996 Dietary Data of the Mussel Shell Assemblage. In Early Archaic
Use of the Concho River Terraces: Cultural Resource Investigations at 41TG307 and 41TG309, Tom Green County, San Angelo, Texas, by J. M. Quigg, J. Peck, C. Lintz, A, C. Treece, C. D. Frederick, R. Clem, G. L. Ellis, P. Schuchert, and J. T. Abbot, pp. T-1-T-19. Technical Report No. 11058. TRC Mariah Associates, Austin.
Lintz, C. and J. T. Abbot 1997 Chronometric Dating of Snail Shells and Charcoal as an Assessment of Sediment Integrity at Archeological Sites 41ZP39 and 41ZP176, Porcion 18 Tract, Near Falcon Reservoir, Zapata County, Texas. Project No. 21116. TRC Mariah and Associates Inc, Austin. Leach, E. 1970 Claude Levi-Strauss. Viking Press, New York. Lee, R. B. and I. DeVore 1968 Problems of the Study of Hunters and Gatherers. In Man the Hunter, edited by R. E. Lee and I. DeVore, pp. 3-12. Aldine Atherton, Chicago. Lyman, R. L. and M. J. O’Brien 1998 The Goals of Evolutionary Archeology. Current Anthropology 39(5)615- 651. Madrigal, T. C. and S. D. Capaldo 1999 White-Tailed Deer Marrow Yields and Late Archaic Hunter-Gatherers. Journal of Archaeological Science 26:241-249. Martin, J. F. 1983 Optimal Foraging Theory: A Review of Some Models and Their Applications. American Anthropologist 85:612-629. McGlade, J. 1995 Archaeology and the Ecodynamics of Human Modified Landscapes. Antiquity 69:113-132.
131
McMahon, C. A., R. G. Frye, and K. L. Brown 1984 The Vegetation Types of Texas Including Cropland. Texas Parks and Wildlife, Austin. Meffe, G. K. and C. R. Carroll 1994 Principles of Conservation Biology. Sinauer, Sunderland, Ms. Montesquieu 1900 [1748] The Spirit of Laws. Translated by Thomas Nugent. Colonial Press, New York. Moore, J. A. 1981 The Effects of Information Networks in Hunter-Gatherer Societies. In Hunter Gatherer Foraging Strategies, edited by B. Winterhalder and E. A Smith, pp. 194-217. University of Chicago Press. 1983 The Trouble with Know-It-Alls: Information as a Social and Ecological Resource. In Archaeological Hammers and Theories, edited by J. A. Moore and A. S. Keene, pp. 173-191. Academic Press, New York. Moore, J. D. 1997 Visions of Culture. Altamira Press, Walnut Creek. Morgan, L. H. 1982 [1877] Ancient Society. Tai Offset Press, Calcutta. Murdock, G. P. 1967 Ethnographic Atlas. University of Pittsburgh Press, Pittsburg. Naveh, Z. and A. S. Lieberman 1983 Landscape Ecology: Theory and Application. Springer-Verlag, New York. Neck, R 1994 Interpretation of Molluscan Remains from the Mustang Branch Site (41HY209). In Archaic and Late Prehistoric Human Ecology in the Middle Onion Creek Valley, Hays County, Texas, by R. A. Ricklis and M. B.
132
Collins, pp. 491-497. Studies in Archeology 19. Texas Archeological Research Laboratory, The University of Texas at Austin. 1997 Appendix: Environmental Assessment of the Immediate Vicinity of the Lion Creek Site (41BT105). In The Lion Creek Site (41BT105), Aboriginal Houses and Other Remains at a Prehistoric Rancheria in the Texas Hill Country (Burnet County), by Leroy Johnson, pp. 193-186. Report 1. Environmental Affairs Division, Archeology Studies Program, Texas Department of Transportation, Austin, and Report 41. Office of the State Archeologist, Texas Historical Commission, Austin. Netting, R. M. 1986 Cultural Ecology, Second Edition. Waveland Press. Prospect Heights, Illinois. Nordt, L. C. 1992 Archaeological Geology of the Fort Hood Military Reservation, Ft, Hood, Texas. Research Report No. 25. United States Army Fort Hood Archaeological Resource Management Series, College Station. O’Brien, M. J. 1996 Evolutionary Archaeology: An Introduction. In Evolutionary Archaeology: Theory and Application, edited by M. J. Obrien. pp. 1-15. University of Utah Press. O’Brien, M. J , and T. D. Holland 1995 The Nature and Premise of a Selection-Based Archaeology. In
Evolutionary Archaeology Methodological Issues, edited by P. A. Teltser, pp. 175-200. The University of Arizona Press, Tucson.
O’Dea, K. 1991 Traditional Diet and Food Preferences of Australian Aboriginal Hunter- Gatherers. Philosophical Transactions of the Royal Society of London B. 334:233-241.
133
Orton, R. B. 1969 The Climate of Texas. In Climates of the States Volume 2-Western States, by Officials of the National Oceanic and Atmospheric Administration, pp 827- 920. United States Department of Commerce. Outram, A. K 2001 A New Approach to Identifying Bone Marrow and Grease Exploitation: Why the “Indeterminate” Fragments should not be Ignored. Journal of Archaeological Science 28 :401-410. Owen, J. G. and D. J. Schmidly 1986 Environmental Variables of Biological Importance in Texas. Texas Journal of Science 38(2):99-119. Pallotino, M. 1991 A History of Earliest Italy. Translated by M. Ryle and K. Soper. University of Michigan Press, Ann Arbor. Parmalee, P. W. and W.E. Klippel 1974 Freshwater Mussels as A Prehistoric Food Resource. American Antiquity 39(3)421-434. Patterson, L. W. 1995 The Archeology of Southeast Texas. Bulletin of the Texas Archeological Society 66:239-264. Pearl, F. B. 1997 Geoarchaeological Investigations of the Upper Lampasas River, Texas. unpublished Master’s Thesis. Texas A&M University, College Station, Texas. Prewitt, E. R. 1981 Cultural Chronology in Central Texas. Bulletin of the Texas Archeological Society 52:65-90. 1985 From Circleville to Toyah: Comments on Central Texas Chronology. Bulletin of the Texas Archeological Society 54:201-238.
134
1991 Burned Rock Middens: A Summary of Previous Investigations and Interpretation. In The Burned Rock Middens of Texas, An Archeological Symposium, edited by T. R. Hester, pp. 25-32. Studies in Archeology 13. Texas Archeological Research Laboratory, The University of Texas at Austin. Purchon R. D. 1977 The Biology of the Mollusca, Second Edition, Pergamon Press, Oxford. Rafferty, J. E.
1985 The Archaeological Record on Sedentariness: Recognition, Development, and Implications. In Advances in Archaeological Method and Theory, Vol. 8, edited by M. Schiffer, pp. 113-156. Academic Press, New York.
Randolph, P. A. 1973 Influence of Environmental Variability on Land Snail Population Properties. Ecology 54(4):933-955. Rappaport, R. A. 1967 Pigs for the Ancestors. Yale University Press, New Haven. Reidhead, V. A. 1980 The Economics of Subsistence Change: Test of an Optimization Model. In Modeling of Prehistoric Subsistence Economics, edited by T. Earle and A. Christenson, pp. 141-186. Academic Press, New York. Root, D. 1983 Information Exchange and the Spatial Configuration of Egalitarian Societies. In Archaeological Hammers and Theories, edited by J. A. Moore and A. S. Kane, pp. 193-219. Academic Press, New York. Rosenzweig, M. L. 1968 Net Primary Productivity of Terrestrial Communities: Predictions from Climatological Data. The American Naturalist 102(923) 67-75.
135
Rousseau, Jean-Jacques 1998 [1775] A Discourse on the Origin of Inequality. In The Social Contract and Discourses. Translated by G. D. H. Cole, pp. 31-126. Everyman, London. Sahlins, M. 1968 Notes on the Original Affluent Society. In Man the Hunter, edited by R. B. Lee and I. DeVore, pp. 85-89. Chicago, Aldine. Schiffer, M. B. 1999 Behavioral Archaeology: Some Clarifications. American Antiquity 64(1)166-168. Shafer, H. S. 1963 Test Excavations at the Youngsport Site: A Stratified Terrace Site in Bell County, Texas. Bulletin of the Texas Archeological Society 34:57-81. Sih, A. and K. A. Milton 1985 Optimal Diet Theory: Should the !Kung Eat Mongongos? American Anthropologist. 87:396-401. Simmons, F. 1956 Snails of the Burnt Rock Middens. In Central Texas Archeologist No. 7,
edited by Frank Watt, pp. 48-51. Central Texas Archeologist, Waco, Texas.
Simms, S. R. 1987 Behavioral Ecology and Hunter-Gatherer Foraging: An Example for the Great Basin. BAR International Series 381. Smith, E. A. 1979 Human Adaptation and Energetic Efficiency. Human Ecology 7(1):53-74. 1998 Comments. Current Anthropology. 39(5)640-641.

136
Smith, C. S. and L. M. McNees 1999 Facilities and Hunter-Gatherer Long-Term Land Use Patterns: An Example from Southwest Wyoming. American Antiquity 64(1):117-136. Smith, E. A. and B. Winterhalder 1981 New Perspectives on Hunter-Gatherer Socioecology. In Hunter Gatherer Foraging Strategies, edited by B. Winterhalder and E. A. Smith, pp. 1-12. University of Chicago Press. Smith, E. A. and B. Winterhalder 1992 Natural Selection and Decision-Making: Some Fundamental Principles. In Evolutionary Ecology and Human Behavior, edited by E. A. Smith and B. Winterhalder, pp. 25-60. Aldine de Gruyter, New York. Sobolik, Kristen D. 1991 Prehistoric Diet and Subsistence in the Lower Pecos as Reflected in Coprolites from Baker Cave, Val Verde County, Texas. Studies in Archeology 7. Texas Archeological Research Laboratory. The University of Texas at Austin. Speth, J. D. 1991a Foreword. In The Behavioral Ecology of Efe Pygmy Men in the Ituri Forest, Zaire, by Robert C. Bailey, p. ix-xii. Anthropological Papers No. 86. Museum of Anthropology, University of Michigan,. 1991b Protein Selection and Avoidance Strategies of Contemporary and Ancestral Foragers: Unresolved Issues. Philosophical Transactions of the Royal Society of London Series B 334:265-270. Steward, J. H 1972 [1955] Theory of Culture Change: The Methodology of Multilinear Evolution. University of Illinois Press, Urbana. Suhm, D. A. 1960 A Review of Central Texas Archeology. Bulletin of the Texas Archeological Society 29:63-107.
137
Sullivan, A. P. and K. C. Rozen 1985 Debitage Analysis and Archaeological Interpretation. American Antiquity 50(4) 755-779. Tacitus 1942 [AD 98] Germany and Its Tribes. In The Complete Works of Tacitus. Translated by Alfred J. Church and W. J. Brodribb, pp. 709-732. The Modern Library, New York. Thomas, D. H. 1975 Nonsite Sampling in Archaeology: Up the Creek Without a Site? In Sampling in Archaeology, edited by James W. Mueller, pp. 61-81. University of Arizona Press, Tucson. Thornwaite, C. W. 1948 An Approach Towards a Rational Classification of Climate. Geographical Review 38:55-94. Tomka, S. A. 1998 The Chandler Collection, Prehistoric Artifacts from Ellis and Navarro Counties, Texas. In Archaeological Investigations in Support of the Superconducting Super Collider, Ellis County, Texas, by J. L. Yedlowski, K. L. Shaunesey, D. H. Jurney, and J. M Adovasio. Archaeology Research Program. Mercyhurst College, Erie Pennsylvania. Trigger, B. G. 1989 A History of Archaeological Thought. Cambridge University Press, Cambridge. Tylor, E. B 1871 Primitive Culture. John Murray, London. VanPool, C. S. and T. L. VanPool 1999 The Scientific Nature of Postprocessualism. American Antiquity 64(1):33- 53.
138
2001 Postprocessualism and the Nature of Science: A Response to Comments by Hutson and Arnold and Wilkens. American Antiquity 66(2):367-375. Wandsnider, L. 1992 Archaeological Landscape Studies. In Space, Time, and Archaeological Landscapes, edited by J. Rossignol and L Wandsnider, pp. 257-282. Plenum Press, New York. 1997 The Roasted and the Boiled: Food Composition and Heat Treatment with Special Emphasis on Pit-Hearth Cooking. Journal of Anthropological Archaeology 16(1):1-48. Winterhalder, B. 1981 Optimal Foraging Strategies and Hunter-Gatherer Research in Anthropology: Theory and Methods. In Hunter Gatherer Foraging Strategies, edited by B. Winterhalder and E. A. Smith, pp. 13-35. University of Chicago Press. Winterhalder, B. and E. A. Smith 1981 Preface. In Hunter Gatherer Foraging Strategies, edited by Bruce Winterhalder and E. A. Smith, pp. ix-x. University of Chicago Press. Winterhalder, B. and E. A. Smith 1992 Evolutionary Ecology and the Social Sciences. In Evolutionary Ecology and Human Behavior, edited by E. A. Smith, E. A. and B. Winterhalder. pp. 3-24. Aldine de Gruyter, New York. White, L. A 1943 Energy and the Evolution of Culture. American Anthropologist 45:335-356. 1959 The Evolution of Culture: The Development of Civilization to the Fall of Rome. McGraw-Hill, New York. 1973 The Concept of Culture. Burgess Publishing Co. Minneapolis.

139
Whittaker, C. R. 1993 The Poor. In The Romans, edited by A. Giardina, pp. 272-299. Translated by L. G. Cochrane. University of Chicago Press, Chicago. Woodburn, J. 1968 An Introduction to Hadza Ecology. In Man the Hunter, edited by R. B. Lee and I. DeVore, pp. 49-55. Aldine Atherton, Chicago. 1970 Hunters and Gatherers: The Material Culture of the Nomadic Hadza. Trustees of the British Museum, London.

VITA
Andrew F. Malof was born May 30, 1959 to Joseph and Delores Malof, in Santa Monica,
California. The family, including sister Jessica, moved to Austin, Texas in 1960, where
brother Peter was born. Andrew graduated from Austin High School in 1976, and pursued
various vocations, including raising a family that includes son Jacob, born in December,
1980. He returned to school full-time in 1993 and received a Bachelor of Arts Degree in
Anthropology and Archaeology in December of 1996. In May of 1996 he was hired as an
archaeologist at the Lower Colorado River Authority in Austin, Texas. This position led to
numerous publications which are on file at The Texas Historical Commission and at the
Texas Archeological Research Laboratory, both in Austin. He has also published in the
Bulletin of the Texas Archeological Society and in La Tierra, the Journal of the Southern
Texas Archaeological Association. In September, 1998 he was accepted into the Graduate
Anthropology Program at the University of Texas at San Antonio. He is currently still
employed at the Lower Colorado River Authority.


