Embed Size (px)
Citation preview

Journal of The Electrochemical Society, 161 (1) C77-C82 (2014) C770013-4651/2014/161(1)/C77/6/$31.00 © The Electrochemical Society
Features of Copper Passivity in Alkaline Solutions at Potentialsbelow Cu2O FormationD. Starosvetsky, N. Sezin, E. Abelev, T. Cohen-Hyams, and Y. Ein-Eli∗,z
Department of Materials Science and Engineering, Technion-Israel Institute of Technology, Haifa 3200003, Israel
In the present work we studied the anodic behavior of polycrystalline copper (Cu 99.995 wt%) in sodium hydroxide solutions atpotential range below the Cu2O formation potential (depending on sodium hydroxide concentration), as well as the effect of variousadditives to the alkaline solutions on copper anodic characteristics. Peaks of anodic current appeared in a wide potential rangebelow the reversible potential for Cu2O formation. The width of this potential range strongly depended on the solution alkalinity.An increase in NaOH concentration (from 0.0075 to 8.0 M) resulted in a shift of the anodic current onset to negative values, from−1.12 to −1.4 V vs. SCE and significant increase of anodic current, up to values above 10−3 A/cm2. A pronounced increase ofanodic current was detected for NaOH concentrations above 1.0 M. It is suggested that anodic current at potentials below the Cu2Oformation potential is preferably associated with Cu dissolution, forming both soluble complex-ions, Cu(OH)n
1-n (n > 1), and poorlysoluble CuOH. Poorly soluble CuOH precipitates over the Cu surface, suppressing Cu dissolution.© 2013 The Electrochemical Society. [DOI: 10.1149/2.087401jes] All rights reserved.
Manuscript submitted October 21, 2013; revised manuscript received November 25, 2013. Published December 4, 2013.
Copper passivity in neutral and alkaline solutions is associated inthe Pourbaix diagram with Cu(I) and Cu(II) oxides formation.1 Thelowest potential limit of Cu passivity region actually coincides withthe lowest potential of Cu2O formation. The potential region below thenegative limit of Cu passivity is associated in the Pourbaix diagramwith Cu immunity.1 However, a number of electrochemical studiesof copper in alkaline solutions revealed the appearance of an anodiccurrent peak (or peaks) far below Cu2O formation potential, i.e. in thepotential region of Cu immunity.2–19
Ambrose et al.2 were the first who detected the small anodic cur-rent peak at potentials negative to the Cu2O formation potential bya potentiodynamic measurement of Cu in 1.0 M NaOH. Based onexperimental results obtained by Miller3 who examined oxidationstates and electrode/solution mass distributions by Cu anodization inalkaline solution with a rotating ring-disk technique, Ambrose andco-workers suggested that this anodic current peak is a result of Cudissolution via the formation of soluble Cu(I) species, in particular,Cu(OH)2.
Later, the dissolution nature displayed by a Cu electrode in alka-line solutions at potentials below the Cu2O formation potential wassupported by Fletcher, et al.4 and Shirkhanzadeh, et al.5 Fletcher,et al.4 believed that the anodic current measured with saturated cop-per amalgam in 0.1 M LiOH in a wide potential range, below Cu2Oformation can be directly attributed to Cu dissolution in the form ofsoluble Cu(I) species (Cu(OH)n
1-n). The authors described Cu disso-lution as a two step reaction, as shown below:
Cu → Cu+ + e− [1]
Cu+ + nOH− → Cu(OH)n1−n [2]
where, n > 1 and Cu+-ions transition into the solution (step 1) isfollowed by their transfer to complex ions (step 2).
Shirkhanzadeh, et al.5 evaluated the electrochemical behavior ofCu in 1 M NaOH in a wide potential range between −1.16 and 0.09 Vvs. SHE (−1.4 and −0.15 V vs. SCE) with the use of a rotating ring-disk technique. A clear correlation between the anodic current from aCu disk electrode at potentials below Cu2O formation and generationof soluble Cu(I) species in the solution was demonstrated. The au-thors described the anodic behavior of copper below Cu2O formationpotential also as copper dissolution via the same two steps describedabove. The results obtained by Fletcher, et al.4 and Shirkhanzadeh,et al.5 can be considered as direct experimental evidence of the dis-solution nature of the specific anodic currents detected in potentialrange below the potential of Cu2O formation. However, the majorityof publications devoted to this phenomenon favored the explanation
∗Electrochemical Society Active Member.zE-mail: [email protected]
that the anodic current below the region of Cu2O formation potentialresults from hydroxide-ion adsorption (OH− → OHads + e−).
Droog, et al.6,7 were the first who associated the anodic currentpeaks detected at potentials negative to Cu2O formation with an elec-trosorption of oxygen species. This assumption was based on thereversibility of both current-voltage cyclic curves and ellipsomet-ric parameters, obtained in the potential range between −0.9 V vs.Ag/AgCl and the Cu2O formation potential. Later, Hartinger andDoblhofer,8 while examining the electrical double layer of Cu (111)in F− and SO4
2− containing solutions having different pH, also sug-gested an electrosorption of hydroxide-ions (OH−) at potentials belowCu2O formation.
Features of Cu behavior in alkaline solutions at potentialsbelow Cu2O formation were also studied with the use of Ra-man spectroscopy,9,10 in-situ electrochemical scanning tunnelingmicroscopy,11–15 atomic force microscopy,16 potentiostatic pulsetechnique,17 electrochemical impedance spectroscopy18 and contactelectrical resistance.19 All the results obtained thus far were also ana-lyzed from the OH− adsorption standpoint.
However, the claim that OH- adsorption is the main reason for thisphenomenon at potentials below the Cu2O formation potential hasnot been confirmed unequivocally. Hydroxide species on Cu surfacesat potentials below Cu2O formation were detected only by in-situsurface-enhanced Raman spectroscopy (SERS) as Cu-OH bonds, orCu-OH stretching modes.9,10 For example, the presence of Cu-OHbonds on Cu in the potential range between −1.4 V (SCE) and Cu2Oformation potential was established by Raman spectroscopy in 0.5 MNaOH solution, while conducting positive and negative stepwise po-tentiostatic polarization.9 A steep decrease in SERS signals inten-sity below −1.4 V (SCE) was interpreted as the disappearance ofCu-OH bonds from the Cu surface. These results are considered bymany researchers as evidence for OH− adsorption and formation ofCu(OH)SURF ad-layer on the Cu surface. Still, by itself, the presence ofCu-OH bonds does not necessarily confirm the adsorption mechanism.
It is unlikely that the adsorption of OH-ions is solely responsiblefor the appearance of Cu-OH bonds in the entire potential range. Onthe one hand, Cu-OH bonds were detected at very negative potentials[down to −1.4 V vs. SCE].9 On the other hand, the most negative valueknown of the zero charge potential (PZC) for Cu is close to −0.9 Vvs. SCE,20,21 i.e. much more positive than the potential of −1.4 V(SCE), associated with the electrosorption of hydroxide-ions. Thismeans that in the potential range between −1.4 V (SCE) and the CuPZC, OH-anions adsorb to a negatively charged Cu surface. It is wellknown that adsorption on negatively charged surfaces (at potentialsbelow PZC) is only possible for specifically adsorbed anions, such asCl−, Br−, I−, etc. As follows from the results presented by Delahay,22
Grahame23 and Conway,24 hydroxide ions cannot be considered asspecifically adsorbed anions and thus, cannot adsorb to the Cu surfaceat potentials below the PZC.
) unless CC License in place (see abstract). ecsdl.org/site/terms_use address. Redistribution subject to ECS terms of use (see 132.68.209.214Downloaded on 2015-07-06 to IP

C78 Journal of The Electrochemical Society, 161 (1) C77-C82 (2014)
The appearance of Cu-OH bonds on the Cu surface can be ex-plained in the context of the overall Cu dissolution. As describedabove,4,5 Cu dissolution in alkaline solutions below the Cu2O forma-tion potential can proceed in two steps, where the first step is Cu+
ions transfer to the solution followed by the second step of Cu+-iontransformation into a complex ion of Cu(OH)n
1-n. The possibility ofCuOH formation, in addition to Cu(OH)n
1-n, during the second stepcannot be ruled out, either.25
It is well known that the solubility of Cu(I) compounds is verylow, a few orders of magnitude lower than the corresponding Cu(II)compounds.26,27 For example, the solubility product constant forCuCl2 is 579, whereas for CuCl it is 1.2 · 10−6; for CuS and Cu2Sthese values are 6 · 10−37 and 2.5 · 10−48, respectively. It is reason-able to assume that this relationship is also valid for cupric andcuprous hydroxides (Cu(OH)2 and CuOH). That is, since the solu-bility product constant of Cu(OH)2 is defined as 4.8 × 10−20,26,27
one may suggest that for CuOH this constant will be at least not higherthan 4.8 × 10⁻²⁰. Interestingly, two different values of solubility prod-uct constant for CuOH are reported.27,28 These values strongly differfrom each other (∼10−8 and ∼10−15)27,28 and thus, one cannot dis-tinguish the actual value of the solubility product constant for CuOH.Nevertheless, both of them are low enough to indicate the rather poorsolubility of CuOH. Thus, one may suggest that Cu+-ions transferredto the solution allow the formation of both soluble and poorly solubleCu(I) species, (Cu(OH)n
1-n) and CuOH, respectively. The latter willthen precipitate on the Cu surface, suppressing Cu dissolution. It hadbeen reported that Cu(I) hydroxide is unstable in aqueous solutionand is rapidly transformed to Cu2O.1 This, however, is only valid forpotentials where Cu2O can exist, i.e. above the Cu2O formation po-tential. Below this potential, precipitated CuOH may be considered asvery stable. The possibility to produce cuprous hydroxide was shownmany years ago by Gillett.25
It is reasonable to suggest that the ratio of the soluble Cu(OH)n1-n
to the poorly soluble CuOH species should increase with solutionalkalinity. This will hold up the formation and surface precipitationof CuOH, leading to enhanced Cu dissolution and, thereby, to theappearance of anodic current at potentials below the Cu2O formationpotential. To gain a deeper insight into the described phenomenon, westudied the electrochemical behavior of Cu at potentials below Cu2Oformation potential in a wide range of NaOH concentrations alongwith the effect of different additives in the alkaline solution.
Experimental
Electrodes for electrochemical measurements were made bymounting a 5-mm diameter copper rod (Cu 99.995 wt%) in a roomtemperature-curing-epoxy resin. Before electrochemical testing theelectrode surface (cross-section) was ground through 1200-grit sili-con carbide metallurgical paper, degreased in acetone, washed withdeionized (DI) water and dried.
Sodium hydroxide (NaOH) solutions with concentrations rangingfrom 0.0075 to 8 M: 0.0075, 0.075, 0.75, 2, 4 and 8 M were used. Thesolutions were prepared with DI water. The electrochemical measure-ments were performed with a PARSTAT 2273a potentiostat (EG&G)in a 500-mL three-electrode electrochemical cell equipped with a sat-urated calomel reference electrode (SCE) and a Pt-wire counter elec-trode. The reference electrode was installed in the solution througha Luggin-Haber capillary tip assembly. All the potentials presentedfrom the electrochemical measurements are versus a saturated calomelelectrode (SCE). Just prior to electrochemical measurement all thetested electrodes underwent cathodic pretreatment for reduction (orremoval) of oxides that formed on the copper surface during speci-men fabrication and storage. According to the SERS measurements,the steep cathodic reduction of oxide formations can be achievedonly after relatively long copper exposure at potentials below −1.4 V(SCE).9 The cathodic pretreatments in our experiments were con-ducted by 5 min exposure at −1.5 V (SCE) in the case of solutionswith NaOH concentrations below 2 M, and at −2.0 V (SCE) whenthe NaOH concentration was 2 M or higher. Since the phenomenon of
interest is at potentials below the Cu2O formation potential, i.e. below∼−0.5 V vs. SCE, in the subsequent discussions of experimentalresult the main attention will be given mainly to this potential region.
Results and Discussion
Figure 1 presents anodic potentiodynamic polarization curves ofCu in 0.075 M NaOH solution obtained using a wide range of scanrates after 5 min cathodic pre-treatment at a potential of −1.5 V. Atscan rates above 5 mV/s the onset of anodic current occurred below−1.0 V. A broad anodic current peak appeared just above the onset ofanodic current. The higher the scan rate, the more negative the onset ofanodic current and the higher the current values at the peak maximum.The negative shift in the onset of the anodic current with the scan ratewas the result of very fast inhibition of the anodic process below theCu2O formation potential. The lowest onset of the anodic current wasfound to be at a potential of −1.25 V and the highest current peakmaximum was close to 10−3 A/cm2.
The broad current peak was not smooth; a current hump below−1.0 V and current maximum at −0.85 V can be clearly recognizedin the current peaks, especially in current peaks obtained at scan ratesof 100 and 500 mV/s. This shape of current peak is associated withsuperposition of two single peaks, which are situated close to eachother, approx. at −1.08 (peak 1) and −0.85 V (peak 2). By furtherpositive potentiodynamic sweeping (above −0.85 V), the anodic cur-rent decreased to a minimum and then rose once again. The sharpreduction in the anodic current intensity with a decrease in the scanrate was associated with inhibition of the anodic process in potentialrange below −0.5 V. No current peaks below −0.5 V were observedin the anodic curves at scan rates of 1 and 5 mV/sec and the onsetsof anodic current at these scan rates were detected at much higherpotentials, namely at −0.55 and −0.59 V, respectively.
The peculiarity of the anodic process inhibition at potentials be-low −0.5 V was examined by means of potentiostatic polarization.Figure 2 shows current transients measured in 0.075 M NaOH solutionunder different applied potentials below −0.5 V. Each given potentialwas applied after 5 min pre-exposure at a potential of −1.5 V.
As can be seen, the anodic current reached a maximum valuepromptly upon potential application. However, during further expo-sure under applied potential it decreased with time. At potentials below−0.5 V the anodic current dropped to zero in a very short period oftime, less than 2 seconds. Specifically, at potentials of −0.7, −0.9 and−1.0 V the measured anodic current dropped and reached zero in lessthan 2 seconds. At a potential of −0.5 V the anodic current droppedto zero in a much slower manner, in ∼15 sec. The more negative theapplied potential was, the faster was the reduction in anodic current.At potentials of −0.9 and −1.0 V the anodic current dropped to zerowithin a fraction of a second (Figure 2, inset). Similar measurementswere conducted in all tested NaOH solutions and it was found that
10-7 10-6 10-5 10-4 10-3 10-2
-1.2
-0.8
-0.4
0.0
0.4Scan Rate (mV/sec): 1 5 25 100 500 1000
Pot
entia
l (V
SC
E)
Current density (A/cm2)
1
2
Figure 1. Anodic potentiodynamic characteristics of Cu in 0.075 M NaOH(pH 12.8) solution obtained at different scan rate after a 5 min pre-exposureperiod at a potential of -1.5 V.
) unless CC License in place (see abstract). ecsdl.org/site/terms_use address. Redistribution subject to ECS terms of use (see 132.68.209.214Downloaded on 2015-07-06 to IP

Journal of The Electrochemical Society, 161 (1) C77-C82 (2014) C79
0 5 10 15 20-0.4
0.0
0.4
0.8
1.2
1.6
0.0 0.5 1.0
-0.2
0.0
0.2 -0.5 V -0.7 V -0.9 V -1.0 V
Cur
rent
den
sity
(m
A/c
m2 )
Time (sec)
Figure 2. Current-time transients of Cu in 0.075 M NaOH solution (pH 12.8)during exposure at different potentials. Potentials were applied after a 5 mincathodic pre-exposure period at a potential of −1.5 V. Inset: Current-timetransients of Cu obtained during a short initial time period under applicationsof −0.9 and −1.0 V.
during potentiostatic exposure the anodic current at first dropped tozero and then became cathodic during further exposure is transferredto a cathodic current. The origin of the observed cathodic current wasnot investigate out in this work. Based only on Pourbaix diagrams,we suggest that depending on the applied potential, the measured ca-thodic current can be attributed to either hydrogen reduction reaction,or oxygen reduction reaction. Oxygen reduction reaction can be as-sociated with a residual oxygen, dissolved in the solution. Figure 3presents anodic potentiodynamic curves of Cu in a 4 M NaOH so-lution obtained after a 5-min pre-exposure period under an appliedpotential of −2.0 V. Unlike measurements in the more dilute 0.075 MNaOH solution (Figure 1), in the 4 M solution the onset of the anodiccurrent was detected below a potential of −1.0 V, even at the 1 mV/sscan rate. Furthermore, the potential of anodic current onset detectedin the 4 M solution was far below the value detected one at the samescan rates in the 0.075 M solution (see Figures 1 and 3). This negativeshift in the anodic current onset potential was most probably a resultof pH increase. Two or three current peaks were clearly defined inthe anodic potentiodynamic profiles and they were positioned belowa potential of −0.5 V. In the anodic profiles obtained at scan rates of1 and 5 mV/s, the onset of the anodic currents was initiated at −1.12and −1.2 V, respectively, and two current peaks at −1.0 (peak 2) and−0.7 V (peak 3) appeared. At higher scan rates, the onset of the anodiccurrent shifted to more negative values, e.g. to −1.3 and −1.36 V at25 and 500 mV/s, and one more current peak with a maximum be-tween −1.25 and −1.2 V (peak 1) appeared in the curve. The excellentagreement in the position of the current peaks displayed at potentials
10-7 10-6 10-5 10-4 10-3 10-2
-1.2
-0.8
-0.4
0.0
0.4Scan rate (mV/s):
1 5 25 100 500 1000
Pot
entia
l (V
SC
E)
Current density (A/cm2)
1
2
3
Figure 3. Anodic potentiodynamic characteristics of Cu in 4 M NaOH solu-tion obtained at different scan rates after a 3 min pre-exposure at a potential of−2.0 V.
below −0.5 V for all the scan rates is remarkable. It should be alsonoted that the most negative value of the onset of anodic current (ata potential of −1.36 V) obtained in 4 M NaOH was very close to thelower limit (−1.4 V) of the potential region where Cu-OH bonds weredetected by SERS measurements.9
Figure 4 summarizes the effect of NaOH content on the potentialof anodic current onset and current value at −1.0 V. The data were col-lected from anodic potentiodynamic curves measured at scan rates of100 and 500 mV/s. One can see in Figure 4 that the potential for onsetof anodic current decreased and the anodic current values increased asthe NaOH concentration increased. For instance, an increase in NaOHcontent from 0.0075 to 8 M was accompanied by a shift of ∼0.3 V inthe onset of the anodic current, down to values close to −1.4 V, whilethe increase in the recorded anodic current was more than one orderof magnitude.
These results indicate that the anodic process at potentials belowCu2O formation is accelerated with increase in NaOH concentration,especially above 1.0 M. However, the reason for such accelerationis unclear. The increase in anodic process intensity with increase inNaOH content can be explained in the context of Cu dissolution.4,5
It was mentioned above that Cu can dissolve with the formation ofsoluble Cu(OH)n
1-n species and poorly soluble CuOH, which wouldprecipitate as a deposit over Cu surface, suppressing Cu dissolution. Inaccordance with the experimental results (Figure 4), one can suggestthat the relationship between formation rates of soluble Cu(OH)n
1-n
and insoluble CuOH shifts in favor of Cu(OH)n1-n formation with
increase in solution alkalinity, slowing down CuOH formation rateresulting in diminishing CuOH deposition and, consequently, accel-erating Cu dissolution. Increase of CuOH solubility was shown byPalmer.28
However, we cannot exclude acceleration of OH− adsorption withincrease in NaOH concentrations. In order to evaluate the contributionof OH− adsorption to the initiation of anodic current at potentials be-low Cu2O formation, similar experiments were conducted in NaOHsolutions containing the addition of NaCl. Here, we suggest that ifthe anodic current in the potential range of interest is indeed dueto the adsorption of hydroxide ions (and they are known not to bespecifically adsorbed ions), then in the presence of ions with a pro-nounced ability to be specifically adsorbed, such as chloride ions,a significant amplification of this effect can be expected. Figure 5presents anodic potentiodynamic curves of Cu obtained at differentscan rates in 0.075 M NaOH solution with the addition of 1.6 MNaCl. Comparing experimental results obtained in 0.075 M NaOHsolution free of additives (Figure 1) and in the 1.6 M NaCl (Figure 5),it can be seen that, even when NaCl was present at concentrationmuch higher than NaOH, there was no intensification of the anodicprocess at potentials below the Cu2O formation potential. This meansthat the addition of chloride-anions having a pronounced ability to bespecifically adsorbed, compared with hydroxides, neither increasedthe anodic current values at more negative potentials than the Cu2Oformation potential, nor extended the lower limit of the potential rangeof anodic current appearance.
The effect of sodium sulfide (Na2S) addition on the anodic behav-ior of Cu below the Cu2O formation potential in NaOH solution wasalso studied. It is well known that the Cu surface in sulfide-containingalkaline solutions is covered by a poorly protective copper sulfidefilm deposited in a wide potential range, down to approx. −1.0 V.29–32
These experiments were conducted in order to compare the anodicbehavior of Cu covered by a protective CuOH film (pure alkalinesolution) with the one covered by poorly protective Cu sulfide (al-kaline solution containing sulfide ions). Figure 6 presents corrosionpotential (ECORR) transients of Cu in 0.075 M NaOH solution priorto and after Na2S addition. Na2S solution was injected into the ini-tial NaOH solution after a 10 minute OCP exposure period. Sodiumsulfide content in the injected solution was adjusted in such a way toachieve the required resulting Na2S concentration. The experimentswere conducted in an air atmosphere, where the difference betweenECORR transients of Cu in NaOH solution without and with Na2Swas much more pronounced than the one observed in a de-aerated
) unless CC License in place (see abstract). ecsdl.org/site/terms_use address. Redistribution subject to ECS terms of use (see 132.68.209.214Downloaded on 2015-07-06 to IP

C80 Journal of The Electrochemical Society, 161 (1) C77-C82 (2014)
0.01 0.1 1 10-1.4
-1.3
-1.2
-1.1
-1.0
100 mV/sec 500 mV/sec
Pot
entia
l (V
SC
E)
[NaOH] (M)
(a)
0.01 0.1 1 10
0.0
0.4
0.8
1.2
1.6 (b) 100 mv/sec 500 mV/sec
Cur
rent
den
sity
(m
A/c
m2 )
[NaOH] (M)
Figure 4. The effect of NaOH concentration on theonset of anodic current (a) and the value of anodiccurrent at −1.0 V (b) obtained from anodic potentio-dynamic curves of Cu measured at scan rates of 100and 500 mV/s. Potentiodynamic sweep was appliedupon cathodic pretreatment.
solution. ECORR transients of Cu in both aerated and de-aerated0.075 M NaOH solutions are shown in the Figure 6 inset graph.
During the initial 10-min OCP exposure in Na2S-free 0.075 MNaOH solution, a protective Cu2O film covers Cu surface.1 However,the small addition of Na2S (0.12, 0.2, 0.4 or 0.8 g/L) to the NaOHsolution results in abrupt shift of ECORR to negative values (down toa potential of −1.0 V). The higher the Na2S concentration, the fasterwas the negative shift of ECORR. It should be noted that in solutionshaving 0.12 and 0.2 g/L of added Na2S the abrupt negative shift ofECORR proceeded only down to ∼−0.5 V, while during further OCPexposure the shift of ECORR in negative direction was much slower,especially with 0.12 g/L Na2S. A thick dark layer of Cu sulfides wasobserved to cover the entire electrode surface during OCP exposure.
The poorly protective characteristic of the Cu sulfide deposit isalso suggested by potentiodynamic measurements (Figures 7 and8). Figure 7 presents the anodic potentiodynamic curves of Cu in0.075 M NaOH with different Na2S content. The potential sweep wasapplied after a 15 minutes OCP exposure period (Figure 7a) and af-ter a 5 minute cathodic pretreatment period at a potential of −1.5 V(Figure 7b). Potentiodynamic polarization applied even at a low scanrate (1 mV/s) subsequent to a 15 minute OCP exposure in sulfidecontaining NaOH solution revealed the onset of anodic current closeto −1.0 V at all the sulfide concentrations studied and a current peakin the anodic curves appearing between −0.9 and −0.8 V (Figure 7a).The higher the sulfide content, the higher the current values recordedin the anodic curves. The anodic curves obtained after OCP expo-sure period in sulfide containing NaOH solution within the scan ratesstudied, up to 1000 mV/s, have a similar shape: the onset of theanodic current was also close to the potential of −1.0 V and the cur-rent peak appeared in the anodic curves just above the potential of−1.0 V. In the same 0.075 M NaOH solution having no sulfide ions,the onset of anodic current in the potentiodynamic measurements ap-
10-7 10-6 10-5 10-4 10-3 10-2
-1.2
-0.8
-0.4
0.0
0.4Scan rate (mV/sec):
1000 500 100 25 5
Pot
entia
l (V
SC
E)
Current density (A/cm2)
Figure 5. Anodic potentiodynamic characteristics of Cu in 0.075 M NaOHsolution having 1.6 M NaCl obtained at different scan rates after a 5 minpre-exposure period at a potential of −1.5 V.
plied subsequent to the OCP exposure was either close to −0.2 V(without de-aeration), or close to −0.5 V ((N2 atmosphere purging)when the Cu surface was covered by Cu2O.1
Figure 7b presents the anodic curves measured at a scan rate of100 mV/s subsequent to a cathodic pretreatment at a potential of−1.5 V. In these experiments, the onset of anodic current in all theprofiles presented in Figure 7b was far below −1.0 V (between −1.3and −1.4 V) and besides a current peak at ∼−0.9 V, a new anodicpeak at approximately −1.2 V appeared in the curves. The higherthe sulfide ions concentration, the more positive was the onset of theanodic current and higher the current peaks at −0.9 and −1.2 V were.It should be noted that the current peak at a potential of −1.2 V isappeared in the anodic potentiodynamic curves measured at a scanrates of 100 mV/s and above. Below a scan rate of 100 mV/s, thedisplayed anodic curves were similar to curves shown in Figure 7a.
The effect of the scan rate on the anodic behavior of Cu in sulfidecontaining 0.075 M NaOH solution after a cathodic pretreatment isshown in Figure 8. One can see that the onset of the anodic currentobtained subsequent to a cathodic pretreatment at scan rates below100 mV/s was close to −1.0 V; this means that the anodic curvesdisplayed following a cathodic pretreatment but at low scan rates(<100 mV/s) were similar to the profile displayed subsequent toan OCP exposure (Figures 7a & 8). At a scan rate of 100 mV/sand above, the onset of the anodic current was far below −1.0 V,namely, −1.3 V at a scan rate of 100 mV/s and close to −1.4 V ata scan rate of 500 mV/s. The anodic current peaks detected at scanrate of 100 mV/s were positioned at potentials of −1.2 and −0.8 V(Figure 7b).
The effect of Na2S addition to an alkaline solution on the electro-chemical behavior of Cu was also examined by means of potentiostaticpolarization. Figure 9 shows current transients measured in 0.075 MNaOH solution under different applied potentials, below the Cu2O
0 200 400 600 800
-1.0
-0.8
-0.6
-0.4
-0.2
0 1000 2000-0.5
-0.4
-0.3
-0.2
N2
air
0.075M NaOH0.075M
0.8
0.4
0.2
Na2S (g/l)
EC
OR
R (
VS
CE)
Time (sec)
NaOH
0.12 EC
OR
R (
VS
CE)
Time (sec)
Figure 6. ECORR–time profiles of Cu obtained during OCP exposure in0.075 M NaOH prior and after addition of different Na2S content. Inset:ECORR – time profiles of Cu in aerated and de-aerated (N2 purging) 0.075 MNaOH solution.
) unless CC License in place (see abstract). ecsdl.org/site/terms_use address. Redistribution subject to ECS terms of use (see 132.68.209.214Downloaded on 2015-07-06 to IP
Journal of The Electrochemical Society, 161 (1) C77-C82 (2014) C81
Current density (A/cm2)10-7 10-6 10-5 10-4 10-3 10-2
-1.2
-0.8
-0.4
0.0
0.4
Pot
entia
l (V
SC
E)
[Na2S], gr/l
0.12 0.2 0.4 0.8
(a)
10-7 10-6 10-5 10-4 10-3 10-2
(b)
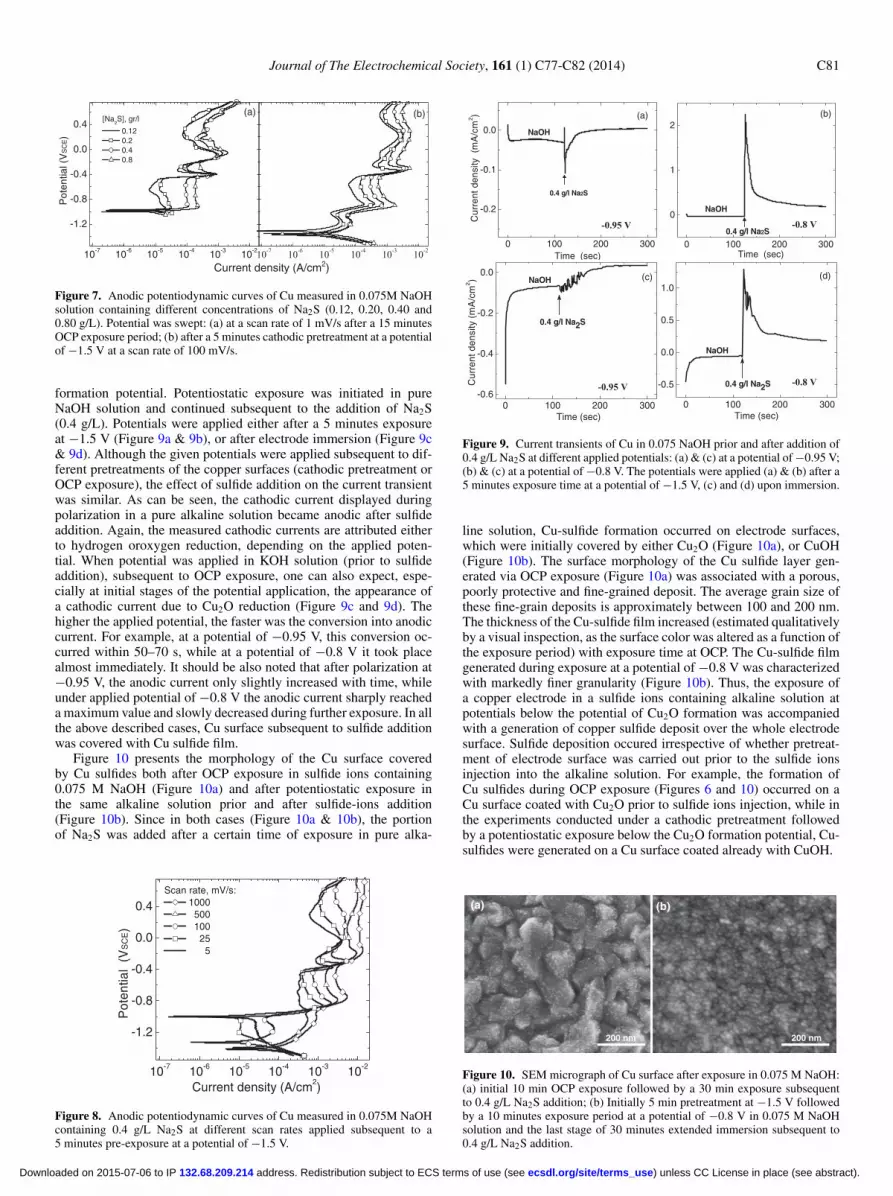
Figure 7. Anodic potentiodynamic curves of Cu measured in 0.075M NaOHsolution containing different concentrations of Na2S (0.12, 0.20, 0.40 and0.80 g/L). Potential was swept: (a) at a scan rate of 1 mV/s after a 15 minutesOCP exposure period; (b) after a 5 minutes cathodic pretreatment at a potentialof −1.5 V at a scan rate of 100 mV/s.
formation potential. Potentiostatic exposure was initiated in pureNaOH solution and continued subsequent to the addition of Na2S(0.4 g/L). Potentials were applied either after a 5 minutes exposureat −1.5 V (Figure 9a & 9b), or after electrode immersion (Figure 9c& 9d). Although the given potentials were applied subsequent to dif-ferent pretreatments of the copper surfaces (cathodic pretreatment orOCP exposure), the effect of sulfide addition on the current transientwas similar. As can be seen, the cathodic current displayed duringpolarization in a pure alkaline solution became anodic after sulfideaddition. Again, the measured cathodic currents are attributed eitherto hydrogen oroxygen reduction, depending on the applied poten-tial. When potential was applied in KOH solution (prior to sulfideaddition), subsequent to OCP exposure, one can also expect, espe-cially at initial stages of the potential application, the appearance ofa cathodic current due to Cu2O reduction (Figure 9c and 9d). Thehigher the applied potential, the faster was the conversion into anodiccurrent. For example, at a potential of −0.95 V, this conversion oc-curred within 50–70 s, while at a potential of −0.8 V it took placealmost immediately. It should be also noted that after polarization at−0.95 V, the anodic current only slightly increased with time, whileunder applied potential of −0.8 V the anodic current sharply reacheda maximum value and slowly decreased during further exposure. In allthe above described cases, Cu surface subsequent to sulfide additionwas covered with Cu sulfide film.
Figure 10 presents the morphology of the Cu surface coveredby Cu sulfides both after OCP exposure in sulfide ions containing0.075 M NaOH (Figure 10a) and after potentiostatic exposure inthe same alkaline solution prior and after sulfide-ions addition(Figure 10b). Since in both cases (Figure 10a & 10b), the portionof Na2S was added after a certain time of exposure in pure alka-
10-7 10-6 10-5 10-4 10-3 10-2
-1.2
-0.8
-0.4
0.0
0.4
Pot
entia
l (V
SC
E)
Current density (A/cm2)
Scan rate, mV/s: 1000 500 100 25 5
Figure 8. Anodic potentiodynamic curves of Cu measured in 0.075M NaOHcontaining 0.4 g/L Na2S at different scan rates applied subsequent to a5 minutes pre-exposure at a potential of −1.5 V.
-0.95 V -0.8 V
-0.95 V -0.8 V
0 100 200 300
-0.2
-0.1
0.0
Cur
rent
den
sity
(m
A/c
m2 )
Time (sec)
NaOH
0.4 g/l Na2S
(a)
0 100 200 300
0
1
2(b)
Time (sec)
NaOH
0.4 g/l Na2S
0 100 200 300-0.6
-0.4
-0.2
0.0 (c)NaOH
Cur
rent
den
sity
(m
A/c
m2 )
Time (sec)
0.4 g/l Na2S
0 100 200 300
-0.5
0.0
0.5
1.0(d)
NaOH
0.4 g/l Na2S
Time (sec)
Figure 9. Current transients of Cu in 0.075 NaOH prior and after addition of0.4 g/L Na2S at different applied potentials: (a) & (c) at a potential of −0.95 V;(b) & (c) at a potential of −0.8 V. The potentials were applied (a) & (b) after a5 minutes exposure time at a potential of −1.5 V, (c) and (d) upon immersion.
line solution, Cu-sulfide formation occurred on electrode surfaces,which were initially covered by either Cu2O (Figure 10a), or CuOH(Figure 10b). The surface morphology of the Cu sulfide layer gen-erated via OCP exposure (Figure 10a) was associated with a porous,poorly protective and fine-grained deposit. The average grain size ofthese fine-grain deposits is approximately between 100 and 200 nm.The thickness of the Cu-sulfide film increased (estimated qualitativelyby a visual inspection, as the surface color was altered as a function ofthe exposure period) with exposure time at OCP. The Cu-sulfide filmgenerated during exposure at a potential of −0.8 V was characterizedwith markedly finer granularity (Figure 10b). Thus, the exposure ofa copper electrode in a sulfide ions containing alkaline solution atpotentials below the potential of Cu2O formation was accompaniedwith a generation of copper sulfide deposit over the whole electrodesurface. Sulfide deposition occured irrespective of whether pretreat-ment of electrode surface was carried out prior to the sulfide ionsinjection into the alkaline solution. For example, the formation ofCu sulfides during OCP exposure (Figures 6 and 10) occurred on aCu surface coated with Cu2O prior to sulfide ions injection, while inthe experiments conducted under a cathodic pretreatment followedby a potentiostatic exposure below the Cu2O formation potential, Cu-sulfides were generated on a Cu surface coated already with CuOH.
200 nm
(a) (b)
200 nm
Figure 10. SEM micrograph of Cu surface after exposure in 0.075 M NaOH:(a) initial 10 min OCP exposure followed by a 30 min exposure subsequentto 0.4 g/L Na2S addition; (b) Initially 5 min pretreatment at −1.5 V followedby a 10 minutes exposure period at a potential of −0.8 V in 0.075 M NaOHsolution and the last stage of 30 minutes extended immersion subsequent to0.4 g/L Na2S addition.
) unless CC License in place (see abstract). ecsdl.org/site/terms_use address. Redistribution subject to ECS terms of use (see 132.68.209.214Downloaded on 2015-07-06 to IP

C82 Journal of The Electrochemical Society, 161 (1) C77-C82 (2014)
The transformation of protective cuprous oxides (Cu2O) and hy-droxides (CuOH) into Cu sulfides involved a transition from an initialcathodic current to an anodic one (Figure 9). Further reduction in an-odic currents with exposure time under applied potentials below Cu2Oformation can be associated with an increase in the thickness of theCu-sulfide film. All these results are in line with the above describedapproach related to Cu dissolution, explaining the phenomenon ofanodic current appearance below the Cu2O formation potential.4,5 Itwas noted that Cu can dissolve in pure NaOH solutions below Cu2Oformation potential via a two steps reaction, where at the 1st step Cu+-ions are transferred into the solution with a following formation of asoluble Cu(OH)n
1-n species as the 2nd step. We also suggested that apoorly soluble CuOH can also form along with soluble Cu(OH)n
1-n
species when Cu+-ions are present in the solution. CuOH possess-ing low solubility could precipitate and deposit over the Cu surface,eventually suppressing Cu dissolution.
The situation changes once sulfide ions were present in the alkalinesolution. As mentioned above, the solubility of Cu-sulfide is verylow, several orders of magnitude lower compared with that of Cuhydroxide. Hence, the appearance of monovalent Cu ions in sulfide-ions containing alkaline solution was associated with Cu2S formationand its precipitation over Cu surface. The formation of Cu-sulfideon the surface of Cu electrode was observed in our experiments,indicating that Cu sulfide formation was apparently the preferentialprocess, compared with Cu hydroxide formation in sulfide containingalkaline solution. Since the deposited film of Cu sulfide is poorlyprotective for the Cu surface,29–32 it did not completely suppress anyfurther Cu dissolution process, but only reduced the dissolution ratewith exposure time period due to increase in the thickness of Cusulfide film and, consequently, slowed down ions transport throughthis sulfide film.
Formation of Cu (I) hydroxides and sulfides via the describedmechanism (Cu dissolution and precipitation of low soluble Cu hy-droxides and sulfide over the electrode surface) seems reasonable,since the appearance of monovalent Cu ions in alkaline solutions at po-tentials below Cu2O formation was proven directly using rotating ring-disk electrode.5 However, since the suggested solution-precipitationof CuOH and Cu2S is yet not proven by direct experiments, the possi-bility of other parallel mechanisms of CuOH formation (e.g. throughsolid state reactions11–15,33 cannot be fully excluded. Further investiga-tions are needed to determine the exact mechanism of anodic currentappearance below the Cu2O formation potential.
Conclusions
Anodic potentiodynamic curves of Cu in NaOH solutions revealedthe appearance of broad current peaks below the Cu2O formation po-tential subsequent to a cathodic reduction of pristine oxides on theCu surface. The anodic current below the Cu2O formation potentialsharply decreased with the reduction of the scan rate, or during apotentiostatic exposure, indicating a fast inhibition of the anodic pro-cess. An increase in NaOH content results in a shift in the onset ofanodic current in anodic potentiodynamic curves in the negative di-rection down to −1.4 V and marked increase of the anodic current
values below Cu2O formation potential. Addition of chloride-ions toNaOH solution did not affect Cu behavior at potentials below Cu2Oformation. It seems reasonable to attribute the anodic current detectedbelow Cu2O formation potential to Cu dissolution via the formationof both soluble species, constituted of monovalent copper ions and in-soluble CuOH. The precipitation of CuOH over Cu surface suppressesfurther Cu dissolution. In order to validate the mechanism proposedhere, direct experimental methods along with sophisticated surfaceanalysis are needed.
Acknowledgments
Finance for the work of D.S. was provided by the Israeli Ministryof Immigrant Absorbance in the framework of KAMEA Program.
References
1. M. Pourbaix, Atlas of Electrochemical Equilibria in Aqueous Solutions, 2nd U.S.edition; NACE: Houston, TX, 1974.
2. J. Ambrose, R. G. Barradas, and D. W. Shoesmith, Electroanal. Chem. and InterfacialElectrochem., 47, 47 (1973).
3. B. Miller, J. Electrochem. Soc., 116, 1675 (1969).4. S. Fletcher, R. G. Barradas, and J. D. Porter, J. Electrochem. Soc., 125, 1960 (1978).5. M. Shirkhanzadeh, G. E. Thompson, and V. Ashworth, Corros. Sci., 31, 293 (1990).6. J. M. M. Droog, C. A. Alderliesten, P. T. Alderliesten, and G. A. Bootsma, J. Elec-
troanal. Chem., 111, 61 (1980).7. J. M. M. Droog and B. Schlenter, J. Electroanal. Chem., 112, 387 (1980).8. S. Hartinger and K. J. Doblhofer, J. Electroanal. Chem., 380, 185 (1995).9. S. Hartinger, B. Pettinger, and K. J. Doblhofer, J. Electroanal. Chem., 397, 335
(1995).10. H. H. Y. Chan, C. G. Takoudis, and M. J. Weaver, J. Phys. Chem. B, 103, 357 (1999).11. V. Maurice, H.-H. Strehblow, and P. Marcus, J. Electrochem. Soc., 146, 254 (1999).12. V. Maurice, H.-H. Strehblow, and P. Marcus, Surf. Sci., 458, 185 (2000).13. J. Kunze, V. Maurice, L. H. Klein, H.-H. Strehblow, and P. Marcus, J. Phys.
Chem. B, 105(19), 4263 (2001).14. J. Kunze, V. Maurice, L. H. Klein, H.-H. Strehblow, and P. Marcus, Corros. Sci.,
46(1), 245 (2004).15. J. Kunze, V. Maurice, L. H. Klein, H.-H. Strehblow, and P. Marcus, J. Electroanal.
Chem., 554–555, 113 (2003).16. M. Ikemia, T. Kubo, and S. Hara, Surf. Sci., 323, 81 (1995).17. V. D. Jovi and B. M. Jovi, J. Serb. Chem. Soc., 67(7), 531 (2002).18. V. D. Jovi and B. M. Jovi, J. Electroanal. Chem., 541, 13 (2003).19. V. V. Marichev, Electrochim. Acta, 43, 2203 (1998).20. A. Lukomska and J. Sobkowski, J. Electroanal. Chem., 567 95 (2004).21. W. R. Fawcett, Liquids, Solutions, and Interfaces: From Classical Macroscopic
Descriptions to Modern Microscopic Details, Oxford University Press, NY, 2004.22. P. Delahay, Double layer and electrode kinetics, INTERSCIECE PUBLISHERS, A
DIVISION OF JOHN WILEY & SONS, INC., New York, 1965, p.23.23. D. C. Grahame, E. M. Coffin, and J. I. Cummings et al., J. Am. Chem. Soc., 74, 1207
(1952).24. B. E. Conway, Electrochemical Data, Elsevier, Amsterdam, 1952, pp. 221-232.25. H. W. Gillett, J. Phys. Chem., 13(4), 332 (1909).26. Handbook of Chemistry and Physics, 64th edition, Editor-in-chief R. C. West, CRC
Press, Inc. 1983-1984, p. B219.27. http://www.ktf-split.hr/periodni/en/abc/kpt.html (Site ktf-split: solubility product
constants).28. D. A. Palmer, J. Solution Chem., 40, 1067 (2011).29. D. Vasques Moll, M. R. G. de Chialvo, R. C. Salvaressa, and A. J. Arvia,
Ellectrochim. Acta, 30, 1011 (1985).30. M. R. G. de Chialvo and A. J. Arvia, J. Appl. Electrochem., 15, 685 (1985).31. E. M. Khairy and N. A. Darwish, Corros. Sci., 13, 141 (1973).32. E. Protopopoff and P. Marcus, Corros. Sci., 45, 1191 (2003).33. P. Marcus and E. Protopopoff, J. Electrochem. Soc., 144, 1586 (1997).
) unless CC License in place (see abstract). ecsdl.org/site/terms_use address. Redistribution subject to ECS terms of use (see 132.68.209.214Downloaded on 2015-07-06 to IP


