Embed Size (px)
Citation preview

Federal Budget for
Fiscal Year 2015
Maria KightACC/548
Katherine ParksMarch 29, 2015

Total Revenue and Expenditures
What is the total revenues and expenditures that’s projected for the federal government FY15.
• Total Revenue: Is the measure of all of their sources of income that would include their sales for a time period? It’s not the same as the profits or earnings.
• Total Expenditure is for money that’s paid out.
• Outlays is a payment or obligation that’s in the form of cash, checks, bonds, notes, or mature coupons.

Table S-1

Federal Direct Revenue $3.2 trillion
Total Government Revenuein the United States
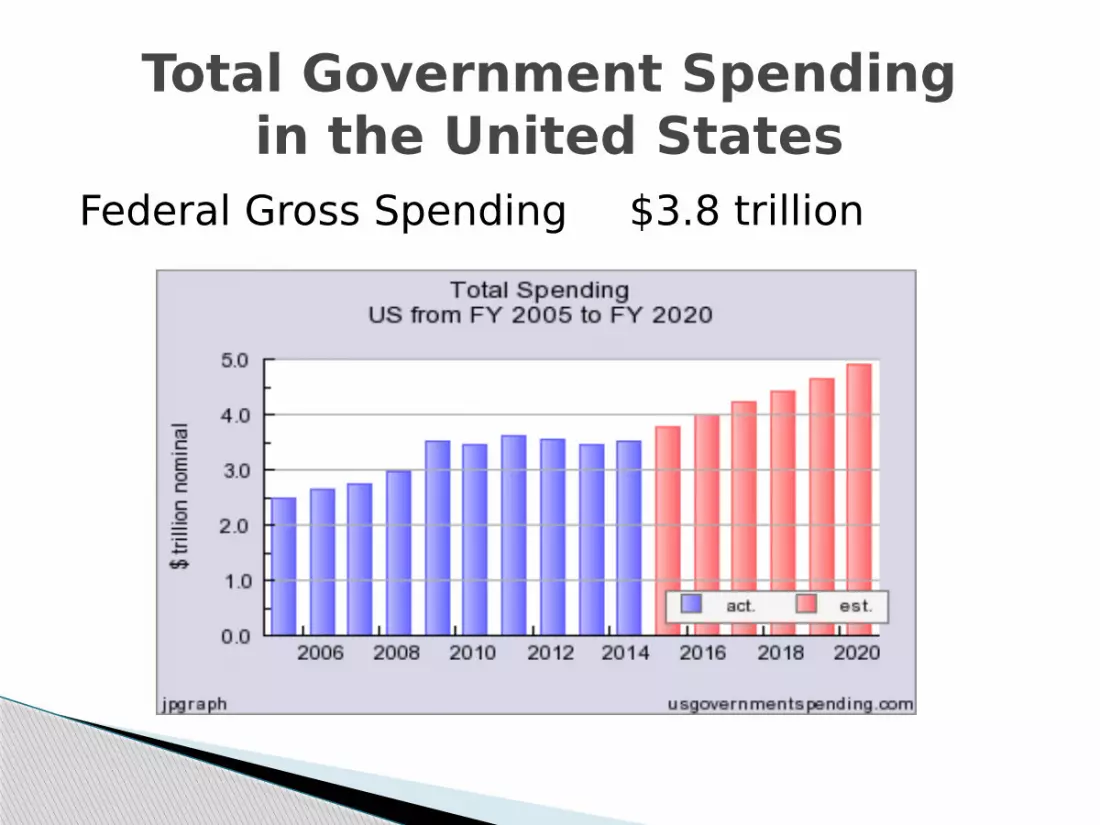
Federal Gross Spending $3.8 trillion
Total Government Spendingin the United States

Budget surplus is when an individual or entity income exceeds it’s spending over a period of time.
Budget deficit is when the spending exceeds the revenue. With the government it usually referred to the government spending than with a business or individual.
Does the FY15 budget project a surplus or deficit in spending?

Obama Deficits
FY 2016*: $474 FY 2015*: $583 FY 2014: $483 FY 2013: $680
FY 2012: $1,087 FY 2011: $1,300 FY 2010: $1,294
For the year FY 2015 the federal government has predicted its latest budget with an estimation that the deficit will be $564 billion.
FY15 Deficit

President Obama Deficit

Table S-5

Table S-5 Continued

The primary source of revenue for the federal government is the individual income taxes and payroll taxes. The table in S-5 shows the amount ranging from 2013 – 2024(predictions)
2013- 1,3162014 -1,3862015 -1,5342016 -1,648
*In billions of dollars
Key Sources of Revenue for the Federal Government
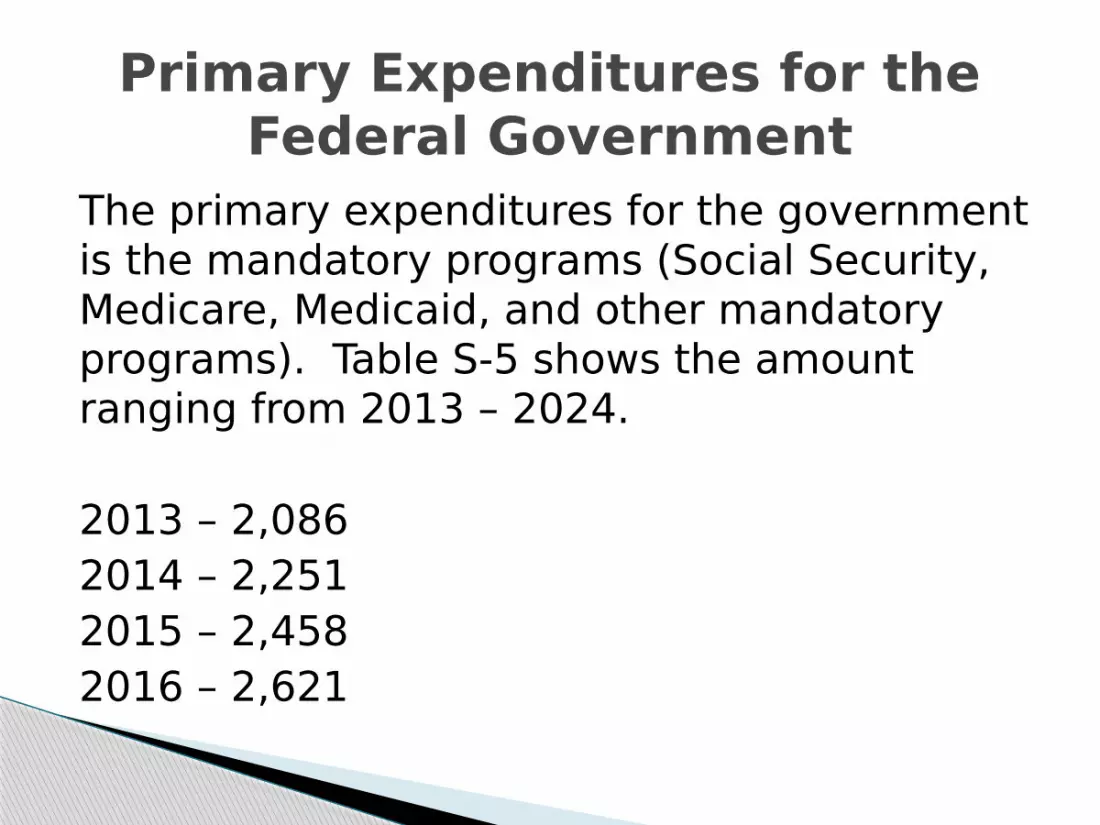
The primary expenditures for the government is the mandatory programs (Social Security, Medicare, Medicaid, and other mandatory programs). Table S-5 shows the amount ranging from 2013 – 2024.
2013 – 2,0862014 – 2,2512015 – 2,4582016 – 2,621
Primary Expenditures for the Federal Government

27% Accounts for Health Care and 25% Accounts for Pensions

The gross US Federal Government Debt for FY2015 is estimated to be $18,628 (in trillion)
The FY2015 the government debt which includes the federal, state, and local is expected to $21,694 (in trillion)
Current National Debt

The debt per citizens is equal to the US National Debt and is divided by the number of US Citizens.
The debt per taxpayers is equal to the US National debt and is divided by the numbers of US Taxpayers.
Debt per citizens: 56,665 Debt per taxpayers: 154,102 There’s only simple answer in my opinion that I can come up with and that is how
many are paying their taxes and how many are not? Since the major part of funding comes from taxpayers and taxpayers are citizens with the debt being so high for taxpayers only means that the citizens are not paying their taxes like they should and with the different entities reporting the information to the government (IRS) by way of quarterly and annually 940 and 941 the amounts are not adding up.
The only way I see that the national debt can be reduced is first the government needs to stop spending so much and then look at the taxpayers to pull them out. Stop paying such high top dollars to upper office is they can’t afford it and then pass it on to the taxpayers. Do more audits on the inside of how the government offices is managing money and not wait until it comes out on the news. Do a forecast to find out what citizens or companies is not paying their taxes and attach them.
http://www.usdebtclock.org/#
National Debt Per Citizen and Taxpayer.


