Embed Size (px)
Citation preview
Volume 85 • Number 4 • April 1999
Federal Reserve
BULLETIN
Board of Governors of the Federal Reserve System, Washington, D.C.
Digitized for FRASER http://fraser.stlouisfed.org/ Federal Reserve Bank of St. Louis
Table of Contents
217 HIGHLIGHTS OF DOMESTIC OPEN MARKETOPERATIONS DURING 1998
The Trading Desk at the Federal Reserve Bankof New York uses open market operations toimplement the policy directives of the FederalOpen Market Committee (FOMC). The FOMCexpresses its short-term objective for open mar-ket operations as a target level for the federalfunds rate—the interest rate at which depositoryinstitutions lend balances at the Federal Reserveto other depository institutions. To keep the fed-eral funds rate near the level specified by theFOMC, the Desk uses open market operationsto bring the supply of balances at the FederalReserve into line with the demand for them. In1998, the level of balances that depository insti-tutions were required to hold at the FederalReserve continued to decline, to historic lows.The primary reason for this was the ongoingproliferation of retail "sweep" programs, whichtransfer depositors' funds from transactionaccounts that are subject to reserve requirementsinto other deposit accounts that are not.
In past years, declines in required balanceshad been associated with greater volatility in thefederal funds rate because depository institu-tions have less flexibility in managing their dailybalance positions. However, through the firstthree quarters of 1998, the funds rate behavedmuch as it had in 1997, even though requiredbalances were lower. In the final quarter of1998, funds rate volatility rose when marketparticipants evinced greater concerns about thecredit quality of their counterparties at a time ofincreased uncertainty in financial markets.
236 INDUSTRIAL PRODUCTION AND CAPACITYUTILIZATION FOR FEBRUARY 1999
Industrial production increased 0.2 percent inFebruary, to 132.6 percent of its 1992 average.Overall capacity utilization in February slipped0.1 percentage point, to 80.3 percent, a levelPA percentage points below its long-term aver-age and 2'/i percentage points below its Febru-ary 1998 level.
239 STATEMENTS TO THE CONGRESS
Edward M. Gramlich, member. Board of Gover-nors, discusses social security reform and testi-fies that the broad objective of the ClintonAdministration's budget—to preserve most ofthe projected surpluses—seems responsible andappropriate. However, Governor Gramlich testi-fies further that the additional proposal by theAdministration to transfer general revenues tothe social security trust fund undermines thefiscal discipline imposed by the need to ensurethat income earmarked for social security issufficient to meet the entire cost of the program,both in the short run and long run. (Testimonybefore the Senate Committee on Finance, Febru-ary 9, 1999. Governor Gramlich presented iden-tical testimony before the House Committee onWays and Means on February 23, 1999.)
240 Alan Greenspan, Chairman, Board of Gover-nors, presents the views of the Federal Reserveon the need to enact legislation to modernize theU.S. financial system; he testifies that only theCongress can establish the ground rulesdesigned to ensure the maximum net publicbenefits, protect the safety and soundness of ourfinancial system, create a fair and level playingfield for all participants, and ensure the contin-ued primacy of U.S. financial markets. For thesereasons, the Federal Reserve supports and urgesprompt enactment of the financial moderniza-tion contained in H.R. 10. (Testimony before theHouse Committee on Banking and FinancialServices, February 11, 1999)
243 Chairman Greenspan presents the FederalReserve's semiannual report on monetary policyand testifies that over the past year the U.S.economy again performed admirably, despite thechallenges presented by severe economic down-turns in a number of foreign countries and epi-sodic financial turmoil abroad and at home. Hetestifies further that a continuation of respon-sible fiscal and monetary policies should affordAmericans the opportunity to make considerablefurther economic progress over time. (Testi-mony before the Senate Committee on Banking,
Digitized for FRASER http://fraser.stlouisfed.org/ Federal Reserve Bank of St. Louis
Housing, and Urban Affairs, February 23, 1999.Chairman Greenspan presented identical testi-mony before the House Committee on Bankingand Financial Services on February 24, 1999.)
250 Chairman Greenspan testifies that in designingfinancial modernization legislation, the FederalReserve believes that the Congress should focuson achieving two essential and indivisible objec-tives: removing outdated, competitively stiflingrestrictions on financial affiliations and, mostimportant, adopting a framework for this mod-ernization that promotes the safety and sound-ness of our banking and financial system andprevents the extension of the federal subsidy.Further, Chairman Greenspan states that theFederal Reserve urges prompt enactment offinancial modernization legislation that achievesthese two central and indivisible objectives.(Testimony before the Senate Committee onBanking, Housing, and Urban Affairs, Febru-ary 23, 1999)
252 Edward W. Kelley, Jr., member, Board of Gover-nors, testifies on behalf of the Board of Gover-nors on the Federal Reserve Board RetirementPortability Act and provides information on theFederal Reserve retirement system. He furthertestifies that the Board strongly supports thislegislation, which would allow certain employ-ees who leave the Board to work for otheragencies and who then retire under the FederalEmployees Retirement System to receive pen-sions reflecting all of their federal service,including post-1988 service at the Board. (Testi-mony before the Subcommittee on Civil Ser-vice of the House Committee on GovernmentReform and Oversight, February 25, 1999)
256 ANNOUNCEMENTS
Proposed changes to Regulation CC to providemore flexibility to depository institutions toexperiment with methods to return unpaidchecks electronically.
Addition of supplementary tables to the Z.Istatistical release on the flow of funds accounts.
Publication by an interagency task force of aconsumer brochure Looking for the Best Mort-gage: Shop, Compare, Negotiate.
Availability of the List of Foreign MarginStocks.
Enforcement actions.
Revisions to the money stock data.
263 LEGAL DEVELOPMENTS
Various bank holding company, bank servicecorporation, and bank merger orders; and pend-ing cases.
A1 FINANCIAL AND BUSINESS STATISTICS
These tables reflect data available as ofFebruary 24, 1999.
A3 GUIDE TO FABULAR PRESENTATION
A4 Domestic Financial StatisticsA42 Domestic Nonfinancial StatisticsA50 International Statistics
A63 GUIDE TO STATISTICAL RELEASES ANDSPECIAL FABLES
A64 INDEX TO STATISTICAL FABLES
A66 BOARD OF GOVERNORS AND STAFF
A68 FEDERAL OPEN MARKET COMMITTEE AND
STAFF; ADVISORY COUNCILS
A70 FEDERAL RESERVE BOARD PUBLICATIONS
A72 MAPS OF THE FEDERAL RESERVE SYSTEM
A74 FEDERAL RESERVE BANKS, BRANCHES,AND OFFICES
Digitized for FRASER http://fraser.stlouisfed.org/ Federal Reserve Bank of St. Louis

PUBLICATIONS C O M M I T T E E
Lynn S. Fox, Chair • S. David Frost . ! Karen H. Johnson '. Donald L. Kohn• J. Virgil Mattingly, Jr. • Michael J. Prell "J Dolores S. Smith J Richard Spillenkothen
The Federal Reseme Bulletin is issued monthly under the direction of the staff publications committee. This committee is responsible lor opinions expressedexcept in official statements and signed articles It is assisted by the F.conomic Editing Section headed by S. Ellen Dykes, the Multimedia Technologies Centerunder Ihe direction of Christine S. Griffith, and Publications Services supervised by Linda C. Kyles.
Digitized for FRASER http://fraser.stlouisfed.org/ Federal Reserve Bank of St. Louis
Highlights of Domestic Open Market Operationsduring 1998
This article is adapted from a report to the FederalOpen Market Committee by Peter R. Fisher, Execu-tive Vice President of the Federal Reserve Bank ofNew York and Manager of the System Open MarketAccount. Spence Hilton, Assistant Vice President,Federal Reserve Bank of New York, prepared thisarticle. Angela Goldstein and Wendy Wong providedresearch assistance.
The Trading Desk at the Federal Reserve Bank ofNew York uses open market operations to implementthe policy directives of the Federal Open MarketCommittee (FOMC). The FOMC expresses its short-term objective for open market operations as a targetlevel for the federal funds rate—the interest rate atwhich depository institutions lend balances at theFederal Reserve to other depository institutions. Tokeep the federal funds rate near the level specified bythe FOMC, the Desk uses open market operations tobring the supply of balances at the Federal Reserveinto line with the demand for them.
In 1998 the level of balances that depository insti-tutions were required to hold at the Federal Reservecontinued to slip, to historic lows. The primary rea-son for this decline was the ongoing proliferation ofretail "sweep" programs, which transfer depositors'funds from transaction accounts that are subject toreserve requirements into other deposit accounts thatare not.1 The decline in required balances encourageddepository institutions to hold more excess reservesduring the year.2
In past years, declines in required balances hadbeen associated with greater volatility in the federalfunds rate because depository institutions have less
1. Past annual reports on open market operations have discussedthe growth of sweep accounts and other developments surrounding theDesk's operations, and these remained themes in 1998. The annualreport for 1998 and those from other recent years are availableon the web site of the Federal Reserve Bank of New York(http://www.ny.frb.org).
2. Depository institutions hold balances at the Federal Reserve tosatisfy reserve and other balance requirements. Some institutions alsohold additional balances—called excess reserves—to guard againstunanticipated debits to their accounts at the Federal Reserve that couldleave the account overdrawn at the end of the day or short of the levelneeded to satisfy their requirements.
flexibility in managing their daily balance positions.With lower requirements, a depository institution isless able to substitute balances across days of themaintenance period to meet its balance requirement,which must be met by the average of its holdingsover the period, because the risk of overdrawing itsaccount at the end of the day is greater.3 However,through the first three quarters of 1998, the fundsrate behaved much as it had in 1997, even thoughrequired balances were lower. In the final quarterof 1998, funds rate volatility and levels of excessreserves rose when funds market participants evincedgreater concerns about the credit quality of theircounterparties at a time of increased uncertainty infinancial markets. These heightened credit concernsupset normal trading relationships among institu-tions in the federal funds market, and market partici-pants were more wary of approaching the FederalReserve's discount window to borrow for fear ofbeing perceived as being in unsound financial condi-tion, even though the identity of any institution thatborrows is strictly confidential. In this environment,many depository institutions bid aggressively for bal-ances at the Federal Reserve, thus lifting the fundsrate, especially early in the day, but often with theresult that the rate fell off in later trading after bor-rowers became confident that their demand for bal-ances would be satisfied. The Desk responded to theupward rate pressure it saw on many mornings byelevating the levels of excess reserves it provided.
The Desk's selection of open market operations in1998 was influenced by changing market circum-stances, such as the ongoing decline in required bal-ances. With the backdrop of falling required bal-ances, the Desk in managing reserve supply increasedits reliance on very short-term operations. It alsoadopted a somewhat different approach to addressingdeep seasonal reserve shortages around the end of the
3. For further detail on the operating practices and techniques usedby the Trading Desk, see Cheryl L. Edwards, "Open Market Opera-tions in the 1990s," Federal Reserve Bulletin, vol. 83 (November1997) pp. 859-74; Ann-Marie Meulendyke, US. Monetary Policy andFinancial Markets (Federal Reserve Bank of New York, 1998); andM. A. Akhtar. Understanding Open Market Operations (FederalReserve Bank of New York, 1997).
Digitized for FRASER http://fraser.stlouisfed.org/ Federal Reserve Bank of St. Louis
218 Federal Reserve Bulletin • April 1999
year—an approach designed to take advantage ofits new authority granted by the FOMC to arrangetemporary transactions with maturities of up to sixtydays. Largely as a consequence, fewer reserves wereadded on a permanent basis in 1998 than in 1997.
IMPLEMENTATION OF MONETARY POLICYIN 1998
Directives of the Federal Open MarketCommittee
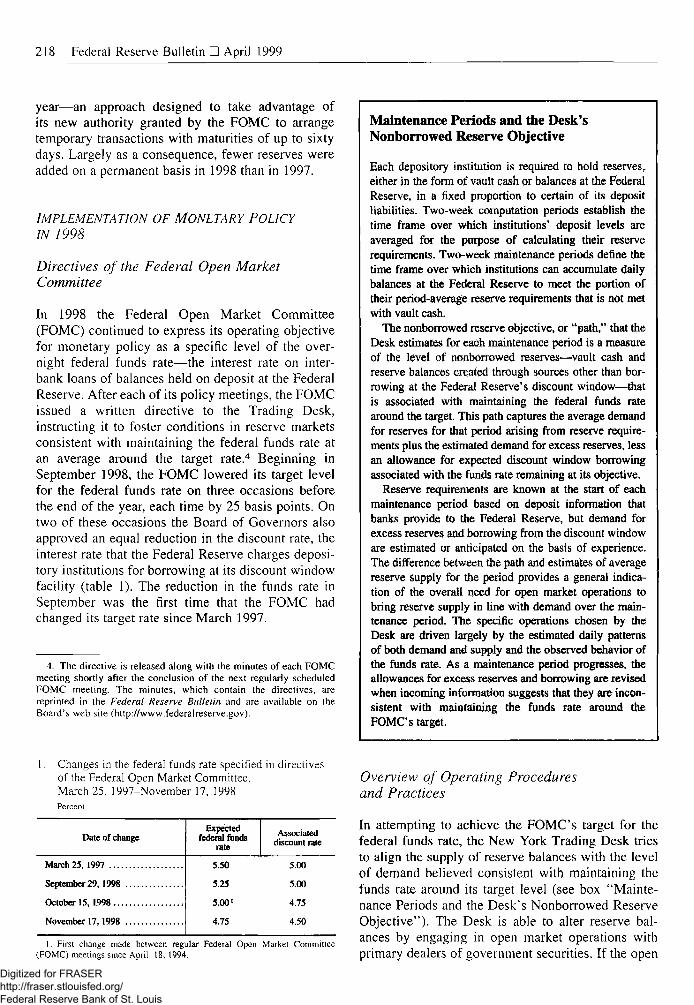
In 1998 the Federal Open Market Committee(FOMC) continued to express its operating objectivefor monetary policy as a specific level of the over-night federal funds rate—the interest rate on inter-bank loans of balances held on deposit at the FederalReserve. After each of its policy meetings, the FOMCissued a written directive to the Trading Desk,instructing it to foster conditions in reserve marketsconsistent with maintaining the federal funds rate atan average around the target rate.4 Beginning inSeptember 1998, the FOMC lowered its target levelfor the federal funds rate on three occasions beforethe end of the year, each time by 25 basis points. Ontwo of these occasions the Board of Governors alsoapproved an equal reduction in the discount rate, theinterest rate that the Federal Reserve charges deposi-tory institutions for borrowing at its discount windowfacility (table 1). The reduction in the funds rate inSeptember was the first time that the FOMC hadchanged its target rate since March 1997.
4. The directive is released along with the minutes of each FOMCmeeting shortly after the conclusion of the next regularly scheduledFOMC meeting. The minutes, which contain the directives, arereprinted in the Federal Reserve Bulletin and are available on theBoard's web site (http://www.federalreserve.gov).
Maintenance Periods and the Desk'sNonborrowed Reserve Objective
Each depository institution is required to hold reserves,either in the form of vault cash or balances at the FederalReserve, in a fixed proportion to certain of its depositliabilities. Two-week computation periods establish thetime frame over which institutions' deposit levels areaveraged for the purpose of calculating their reserverequirements. Two-week maintenance periods define thetime frame over which institutions can accumulate dailybalances at the Federal Reserve to meet the portion oftheir period-average reserve requirements that is not metwith vault cash.
The nonborrowed reserve objective, or "path," that theDesk estimates for each maintenance period is a measureof the level of nonborrowed reserves—vault cash andreserve balances created through sources other than bor-rowing at the Federal Reserve's discount window—thatis associated with maintaining the federal funds ratearound the target. This path captures the average demandfor reserves for that period arising from reserve require-ments plus the estimated demand for excess reserves, lessan allowance for expected discount window borrowingassociated with the funds rate remaining at its objective.
Reserve requirements are known at the start of eachmaintenance period based on deposit information thatbanks provide to the Federal Reserve, but demand forexcess reserves and borrowing from the discount windoware estimated or anticipated on the basis of experience.The difference between the path and estimates of averagereserve supply for the period provides a general indica-tion of the overall need for open market operations tobring reserve supply in line with demand over the main-tenance period. The specific operations chosen by theDesk are driven largely by the estimated daily patternsof both demand and supply and the observed behavior ofthe funds rate. As a maintenance period progresses, theallowances for excess reserves and borrowing are revisedwhen incoming information suggests that they are incon-sistent with maintaining the funds rate around theFOMC's target.
1. Changes in the federal funds rate specified in directivesof the Federal Open Market Committee,March 25, 1997-November 17, 1998Percent
Date of change
March 25, 1997
September 29, 1998
October 15, (998
November 17,1998
Expectedfederal funds
rate
Associateddiscount rate
5.50 5.00
5.25 5.00
5.00' 4.75
4.75 4.50
I. Firsl change made between regular Federal Open Market Committee(FOMC) meetings since April 18. 1994.
Overview of Operating Proceduresand Practices
In attempting to achieve the FOMC's target for thefederal funds rate, the New York Trading Desk triesto align the supply of reserve balances with the levelof demand believed consistent with maintaining thefunds rate around its target level (see box "Mainte-nance Periods and the Desk's Nonborrowed ReserveObjective"). The Desk is able to alter reserve bal-ances by engaging in open market operations withprimary dealers of government securities. If the open
Digitized for FRASER http://fraser.stlouisfed.org/ Federal Reserve Bank of St. Louis
Highlights of Domestic Open Market Operations during 1998 219
market operation is intended to add reserve balances,the Desk agrees to buy securities from one or moredealers. When the dealers deliver the agreed-uponsecurities to the Desk, it credits the dealers' accountsat their clearing banks, a process that creates reservebalances. If the operation is intended to drainreserves, the Desk sells securities, and reserve bal-ances are extinguished.
Each morning the Desk considers whether an openmarket operation is needed on the basis of estimatesof the demand for and supply of reserves. Any opera-tion designed to alter reserve balances that same dayis typically arranged shortly thereafter. Reserve needsin upcoming days and weeks are also considered andsometimes influence the choice of operations, as doesan assessment of possible errors in the forecasts ofdemand for and supply of reserves. Current tradingconditions in the funds market, which can shed lighton reserve imbalances, also play a role in determin-ing the structure of open market operations. Whenselecting open market operations, the Desk views itsobjective as keeping the funds rate on current andfuture days as close to the target as possible, but itdoes not target an average rate over any preset timeframe and thereby try to create high rates to offsetlow rates on past days, or vice versa.
New Developments in 1998
Two important changes in 1998 affected the Desk'sconduct of open market operations. The Board ofGovernors approved a return to lagged reserverequirements (LRR) beginning with the maintenanceperiod ended August 12, J998. LRR replaced con-temporaneous reserve requirements (CRR), whichhad been in place since 1984. LRR are designed toimprove the Desk's ability to estimate the demand forreserves to meet requirements and thus help it cali-brate open market operations. Under LRR, a deposi-tory institution's reserve requirement depends on itsaverage reservable deposit liabilities in a two-weekcomputation period that ends seventeen days beforethe start of the corresponding reserve maintenanceperiod. At the same time, the computation period forapplied vault cash, which was lagged one period evenunder CRR, was shifted back further to coincide withthe computation period for reservable deposit liabili-ties. Thus, under LRR, the Desk knows with virtualcertainty the aggregate level of reserve requirementsat the outset of each maintenance period, and eachdepository institution knows the average level ofrequired reserve balances it must hold over theperiod.
The second change involved the maximum lengthof repurchase agreements (RPs) permitted by theFOMC in its authorization for domestic open marketoperations. At its November meeting, the FOMCextended the maximum maturity of RPs that the Deskmay arrange to sixty calendar days from the previousfifteen-day limit.5 RPs are agreements that the Deskmakes with government securities dealers to pur-chase securities and then to sell the same securitiesback to the dealers on a specified date at a predeter-mined price. These operations are useful for increas-ing reserves on a temporary basis. The lengthening ofthe maturity limit provides the Desk with additionalmeans for addressing reserve shortages that are tem-porary but that are certain to exceed in length thefifteen-day maturity previously set for RPs. The useof long-term RPs in 1998 is discussed later in thisarticle.
Sweep Programs and Total. Required Balances
Since 1994 depository institutions have used retailsweep programs to reduce the amount of balancesthey must hold at the Federal Reserve to meet reserverequirements. Under these programs, depository insti-tutions shift their customers' funds from checkingaccounts that are reservable into special-purposemoney market deposit accounts that are not reserv-able. Thus, depository institutions can decrease thelevel of their deposits subject to reserve requirementsand, with no change in their vault cash holdings, theirtotal required balances, on which they earn no inter-est. Sweep programs are profitable because deposi-tory institutions can invest the balances that they areno longer required to hold in interest-bearing assets.6
The adoption of sweep programs over the past fewyears has led to a significant decrease in requiredreserves and required balances.7
In 1998, the spread of sweep programs slowed asthe proportion of deposit accounts not already cov~
5. The authorization is reprinted in the Federal Reserve Bulletinwith the minutes from the first FOMC meeting each year. For the textof the authorization in place at the end of 1998, see "Minutes ofthe Federal Open Market Committee Meeting Held on Novem-ber 17, 1998," Federal Reserve Bulletin, vol. 85 (February 1999),pp. 122-23.
6. For further information on sweep programs, see Edwards, "OpenMarket Operations in the 1990s," p. 870.
7. Total required balances consist of required reserve balances andrequired clearing balances. Required reserve balances are the portionof a depository institution's reserve requirement that is not satisfiedwith vault cash. Required clearing balances are balances depositoryinstitutions agree in advance to hold at the Federal Reserve, usually tofacilitate payments.
Digitized for FRASER http://fraser.stlouisfed.org/ Federal Reserve Bank of St. Louis
220 Federal Reserve Bulletin • April 1999
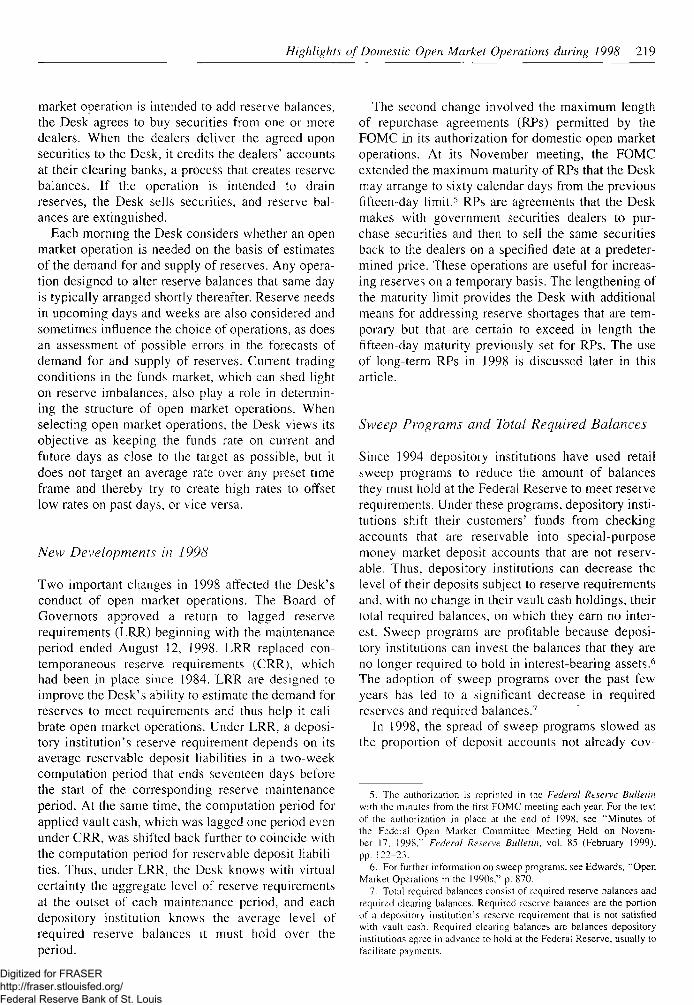
Deposits affected by new or expanded sweep programs, 1995-98
Billions of dollars
• Demand deposit accounts• NOW accounts
I - • • •
— 300
— 250
— 200
— 150
— 100
— 50
I I1995 1996 1997 1998
NOTE. Data are monthly averages.
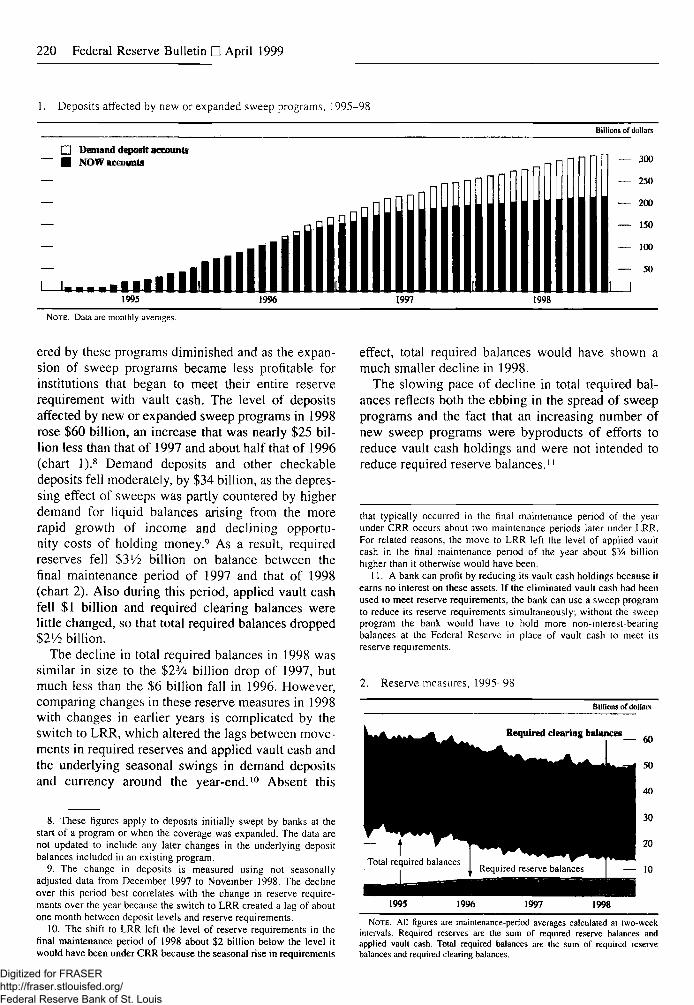
ered by these programs diminished and as the expan-sion of sweep programs became less profitable forinstitutions that began to meet their entire reserverequirement with vault cash. The level of depositsaffected by new or expanded sweep programs in 1998rose $60 billion, an increase that was nearly $25 bil-lion less than that of 1997 and about half that of 1996(chart I).8 Demand deposits and other checkabledeposits fell moderately, by $34 billion, as the depres-sing effect of sweeps was partly countered by higherdemand for liquid balances arising from the morerapid growth of income and declining opportu-nity costs of holding money.9 As a result, requiredreserves fell $3'/2 billion on balance between thefinal maintenance period of 1997 and that of 1998(chart 2). Also during this period, applied vault cashfell $1 billion and required clearing balances werelittle changed, so that total required balances dropped$2'/2 billion.
The decline in total required balances in 1998 wassimilar in size to the $2% billion drop of 1997, butmuch less than the $6 billion fall in 1996. However,comparing changes in these reserve measures in 1998with changes in earlier years is complicated by theswitch to LRR, which altered the lags between move-ments in required reserves and applied vault cash andthe underlying seasonal swings in demand depositsand currency around the year-end.10 Absent this
8. These figures apply to deposits initially swept by banks at thestart of a program or when the coverage was expanded. The data arenot updated to include any later changes in the underlying depositbalances included in an existing program.
9. The change in deposits is measured using not seasonallyadjusted data from December 1997 to November 1998. The declineover this period best correlates with the change in reserve require-ments over the year because the switch to LRR created a lag of aboutone month between deposit levels and reserve requirements.
10. The shift to LRR left the level of reserve requirements in thefinal maintenance period of 1998 about $2 billion below the level itwould have been under CRR because the seasonal rise in requirements
effect, total required balances would have shown amuch smaller decline in 1998.
The slowing pace of decline in total required bal-ances reflects both the ebbing in the spread of sweepprograms and the fact that an increasing number ofnew sweep programs were byproducts of efforts toreduce vault cash holdings and were not intended toreduce required reserve balances."
that typically occurred in the final maintenance period of the yearunder CRR occurs about two maintenance periods later under LRR.For related reasons, the move to LRR left the level of applied vaultcash in the final maintenance period of the year about $% billionhigher than it otherwise would have been.
11. A bank can profit by reducing its vault cash holdings because itearns no interest on ihese assets. If the eliminated vault cash had beenused to meet reserve requirements, the bank can use a sweep programto reduce its reserve requirements simultaneously; without the sweepprogram the bank would have to hold more non-interest-bearingbalances at the Federal Reserve in place of vault cash to meet itsreserve requirements.
2. Reserve measures, 1995-9
Billions of dollars
Required clearing balances
1995 1996 1997 1998
NOTE. All figures are mainlenance-period averages calculated a( Iwo-weekintervals. Required reserves are Ihe sum of required reserve balances andapplied vault cash. Total required balances are ihe sum of required reservebalances and required clearing balances.
Digitized for FRASER http://fraser.stlouisfed.org/ Federal Reserve Bank of St. Louis
Highlights of Domestic Open Market Operations during 1998 221
OUTRIGHT TRANSACTIONS FOR THE SYSTEMOPEN MARKET ACOVNT
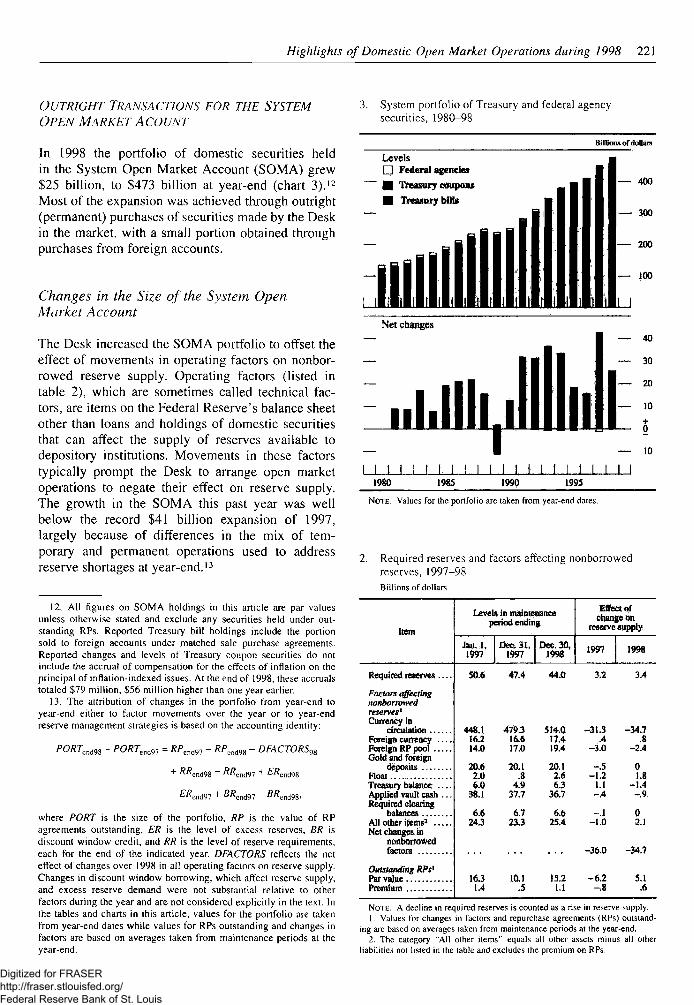
In 1998 the portfolio of domestic securities heldin the System Open Market Account (SOMA) grew$25 billion, to $473 billion at year-end (chart 3).12
Most of the expansion was achieved through outright(permanent) purchases of securities made by the Deskin the market, with a small portion obtained throughpurchases from foreign accounts.
Changes in the Size of the System OpenMarket Account
The Desk increased the SOMA portfolio to offset theeffect of movements in operating factors on nonbor-rowed reserve supply. Operating factors (listed intable 2), which are sometimes called technical fac-tors, are items on the Federal Reserve's balance sheetother than loans and holdings of domestic securitiesthat can affect the supply of reserves available todepository institutions. Movements in these factorstypically prompt the Desk to arrange open marketoperations to negate their effect on reserve supply.The growth in the SOMA this past year was wellbelow the record $41 billion expansion of 1997,largely because of differences in the mix of tem-porary and permanent operations used to addressreserve shortages at year-end.13
12. All figures on SOMA holdings in this article are par valuesunless otherwise stated and exclude any securities held under out-standing RPs. Reported Treasury bill holdings include the portionsold to foreign accounts under matched sale-purchase agreements.Reported changes and levels of Treasury coupon securities do notinclude the accrual of compensation for the effects of inflation on theprincipal of inflalion-indexed issues. At the end of 1998, these accrualstotaled $79 million, $56 million higher than one year earlier.
13. The attribution of changes in the portfolio from year-end toyear-end either to factor movements over the year or to year-endreserve management strategies is based on the accounting identity:
PORTenim - PORTcvi91 = /?/>Md97 - - DFACTORS9i
where PORT is the size of the portfolio, RP is the value of RPagreements outstanding, ER is the level of excess reserves, BR isdiscount window credit, and RjR is the level of reserve requirements,each for the end of the indicated year. DFACTORS reflects the neteffect of changes over 1998 in all operating factors on reserve supply.Changes in discount window borrowing, which affect reserve supply,and excess reserve demand were not substantial relative to otherfactors during the year and are not considered explicitly in the text. Inthe tables and charts in this article, values for the portfolio are takenfrom year-end dates while values for RPs outstanding and changes infactors are based on averages taken from maintenance periods at theyear-end.
3. System portfolio of Treasury and federal agencysecurities, 1980-98
Billions of dollars
Levels• Federal agencies• Treasury coupons• Treasury bills
— 400
— 300
— 200
— 100
Net changes
— 10
I I I I I 1 I. I I I I I I I I 1 t I I I I I1980 1985 1990 1995
NOTE. Values for the portfolio are taken from year-end dales.
2. Required reserves and factors affecting nonborrowedreserves, 1997-98Billions of dollars
Item
R e q u i t e d r e s e r v e s . . . .
Factors affectingnonborrowedreserves'Currency in
circulationForeign currencyForeign RP poolGold and foreign
depositsFloatTreasury balance . . . .Applied vault cash . . .Required clearing
balancesAll other items3
Net changes innonborrowedfactors
Outstanding RPs1
Par valuePremium
Levels in maintenanceperiod ending
Jan. 1,1997
Dec. 31,1997
Dee. 30,1998
Effect ofchange on
reserve supply
1997 1998
50.6 47.4 44.0 3.2 3.4
448.1 479,3 514.0 -31.3 -34.716.2 16.6 17.4 .4 .814.0 17.0 19.4 -3.0 -Z4
20.6 20.1 20.1 -J5 02.0 .8 2.6 -1.2 1.86.0 4.9 63 1.1 -1.4
38.1 37.7 36.7 -.4 -.9
6.6 6.7 6.6 -.1 024.3 23.3 25.4 -1.0 2.1
-36.0 -34.7
16.3 10.1 15.2 -6 .2 5.11.4 .5 1.1 -.8 .6
NOTE. A decline in required reserves is counted as a rise in reserve supply.1. Values for changes in faclors and repurchase agreements (RPs) outstand-
ing are based on averages taken from maintenance periods at the year-end.2. The category "All olher ilems" equals all olher assets minus all oiher
liabilities nol listed in Ihe table and excludes ihe premium on RPs.
Digitized for FRASER http://fraser.stlouisfed.org/ Federal Reserve Bank of St. Louis
222 Federal Reserve Bulletin LJ April 1999
Factors Affecting the Need for a Changein the SOMA Portfolio
Changes in the Supply of and Demand forNonborrowed Reserves
The expansion of the portfolio in 1998 was drivenprimarily by the need to offset the reserve draincaused by continued strong growth of currency incirculation, which increased nearly $35 billion duringthe year and reduced reserve supply by an equivalentamount (table 2). On balance, the other factors affect-ing supply were little changed over the year. The$3'/2 billion decline in required reserves reduced thedemand for reserves and lessened the need to offsetall of the decline in supply with open market opera-tions. Altogether, these movements in operating fac-tors and required reserves deepened reserve shortagesa little more than $30 billion in 1998, slightly lessthan their net effect in 1997.
The Effect of Year-End Reserve ManagementStrategies
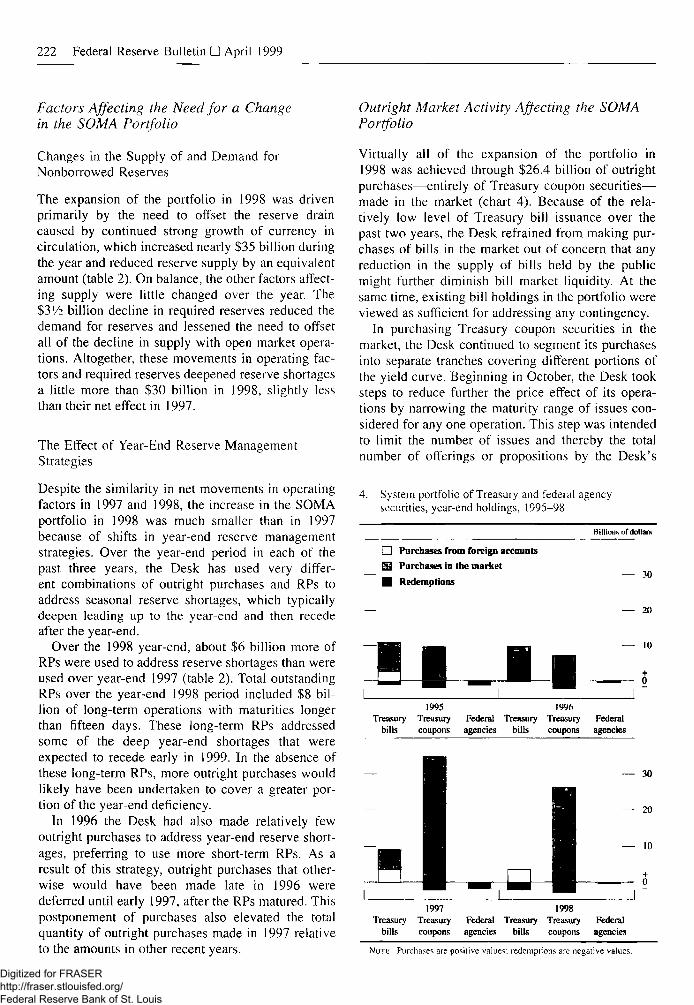
Despite the similarity in net movements in operatingfactors in 1997 and 1998, the increase in the SOMAportfolio in 1998 was much smaller than in 1997because of shifts in year-end reserve managementstrategies. Over the year-end period in each of thepast three years, the Desk has used very differ-ent combinations of outright purchases and RPs toaddress seasonal reserve shortages, which typicallydeepen leading up to the year-end and then recedeafter the year-end.
Over the 1998 year-end, about $6 billion more ofRPs were used to address reserve shortages than wereused over year-end 1997 (table 2). Total outstandingRPs over the year-end 1998 period included $8 bil-lion of long-term operations with maturities longerthan fifteen days. These long-term RPs addressedsome of the deep year-end shortages that wereexpected to recede early in 1999. In the absence ofthese long-term RPs, more outright purchases wouldlikely have been undertaken to cover a greater por-tion of the year-end deficiency.
In 1996 the Desk had also made relatively fewoutright purchases to address year-end reserve short-ages, preferring to use more short-term RPs. As aresult of this strategy, outright purchases that other-wise would have been made late in 1996 weredeferred until early 1997, after the RPs matured. Thispostponement of purchases also elevated the totalquantity of outright purchases made in 1997 relativeto the amounts in other recent years.
Outright Market Activity Affecting the SOMAPortfolio
Virtually all of the expansion of the portfolio in1998 was achieved through $26.4 billion of outrightpurchases—entirely of Treasury coupon securities—made in the market (chart 4). Because of the rela-tively low level of Treasury bill issuance over thepast two years, the Desk refrained from making pur-chases of bills in the market out of concern that anyreduction in the supply of bills held by the publicmight further diminish bill market liquidity. At thesame time, existing bill holdings in the portfolio wereviewed as sufficient for addressing any contingency.
In purchasing Treasury coupon securities in themarket, the Desk continued to segment its purchasesinto separate tranches covering different portions ofthe yield curve. Beginning in October, the Desk tooksteps to reduce further the price effect of its opera-tions by narrowing the maturity range of issues con-sidered for any one operation. This step was intendedto limit the number of issues and thereby the totalnumber of offerings or propositions by the Desk's
4. System portfolio of Treasury and federal agencysecurities, year-end holdings, 1995-98
Billions of dollars
• Purchases from foreign accounts53 Purchases in the market• Redemptions — 30
— 20
— 10
Treasurybills
1995Treasurycoupons
Federalagencies
Treasurybills
1996Treasurycoupons
Federalagencies
Treasurybills
1997Treasurycoupons
Federalagencies
Treasurybills
1998Treasurycoupons
Federalagencies
NOTE. Purchases are positive values; redempiions are negative values.
Digitized for FRASER http://fraser.stlouisfed.org/ Federal Reserve Bank of St. Louis
Highlights of Domestic Open Market Operations during 1998 223
counterparties—the primary dealers—that wouldhave to be evaluated in the selection process. Thetotal value of purchases made in each operation wasreduced accordingly. This modification permittedfaster turnaround times, which is a factor in thecompetitiveness of the propositions the Desk re-ceives, and also helped to reduce further any effect ofthe Desk's operations on market prices. At the sametime, in the messages announcing operations that aresent to the primary dealers, the Desk began to specifythose issues within the maturity range that it wouldnot purchase because of portfolio considerations.Specifying these issues in the announcements simpli-fied the submission and selection process further forthe Desk's counterparties.
In November, the Desk limited one of the tranches,to Treasury inflation-indexed securities (TIISs) forthe first time. The Desk judged that the different assetcharacteristics and market trading dynamics of TIISswarranted their separation from the operations innominal coupon issues. Previously, the Desk hadconsidered propositions on TIISs and nominal cou-pon issues together so long as they were in thespecified maturity range of a tranche, and it hadpurchased $100 million of inflation-indexed securi-ties in one operation in 1997. But the Desk had foundit difficult to make relative value judgements betweeninflation-indexed and nominal coupon issues duringthe process of selecting propositions.
Other Activity Affecting the Size of the SOMAPortfolio
Besides its market purchases, the Desk acquired secu-rities through transactions with foreign accounts, andit shrank some of its securities holdings throughredemptions. Many foreign central banks and inter-national organizations have custodial accounts at theFederal Reserve Bank of New York, and the FOMCauthorizes the Desk to transact with these foreignaccount holders. When the foreign account holdershave securities to sell, the Desk may purchase thesesecurities if doing so is consistent with reserve needs.The Desk accquired $3.6 billion of Treasury billsthrough such purchases in 1998.
The SOMA portfolio contains publicly offered U.S.Treasury securities. When these securities mature,the Desk is permitted to exchange them for newsecurities that settle on the same day. In 1998, whenmore than one auction for new securities settled onone of these dates, the distribution of issues newlyacquired by the Desk was proportional to the amountsthe Treasury was issuing to the public. The Desk canalso tender for fewer securities than mature on an
auction settlement date, but it cannot tender for more.Early in 1998, the Desk redeemed $2 billion inTreasury bills by letting them mature without replace-ment to address seasonal reserve surpluses. It alsoredeemed a portion of its holdings of original-issueseven-year notes (which are no longer issued). TheDesk held $4.3 billion of such notes that maturedduring the year, all on dates when new Treasuryinflation-indexed securities settled. Altogether, theDesk exchanged $1.6 billion of the maturing seven-year notes for TIISs, equal in value to 5 percent of theamount issued to the public, while the remaining$2.7 billion of the maturing notes was redeemed.
About $300 million of federal agency securitieswas redeemed in 1998 as part of the SOMA's ongo-ing reduction of its holdings of agency securities. TheDesk also sold $25 million of agency debt back to theoriginal issuer as part of that agency's program toretire or replace a portion of its outstanding debt. Atthe end of the year, SOMA agency holdings hadfallen to a little more than $300 million.
SOMA Portfolio Management
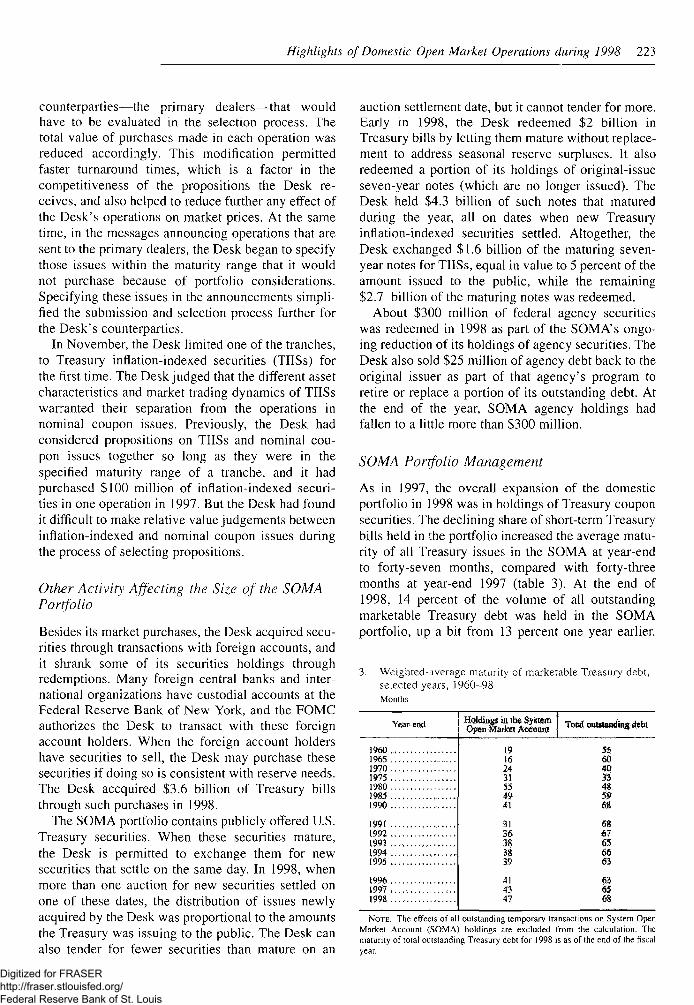
As in 1997, the overall expansion of the domesticportfolio in 1998 was in holdings of Treasury couponsecurities. The declining share of short-term Treasurybills held in the portfolio increased the average matu-rity of all Treasury issues in the SOMA at year-endto forty-seven months, compared with forty-threemonths at year-end 1997 (table 3). At the end of1998, 14 percent of the volume of all outstandingmarketable Treasury debt was held in the SOMAportfolio, up a bit from 13 percent one year earlier.
3. Weighted-average maturity of marketable Treasury debt,selected years, 1960-98Monlhs
Year-End
1960196519701975198019851990
19911992199319941995
199619971998
Holdings ia tbe SystemOpen Market Account Total outslanding debt
19 5516 SO24 4031 S355 4849 5841 68
31 6S36 671$ 6538 6639 S3
41 6343 US47 6S
NOTE. The effects of all outstanding temporary transactions on System OpenMarket Account (SOMA) holdings are excluded from the calculation. Thematurity of total outstanding Treasury debt for 1998 is as of the end of the fiscalyear.
Digitized for FRASER http://fraser.stlouisfed.org/ Federal Reserve Bank of St. Louis
224 Federal Reserve Bulletin • April 1999
The percentage of all outstanding Treasury bills thatwas held in the portfolio increased to 31 percentat the end of 1998 from about 30 percent in 1997,reflecting the decline in the volume of bills outstand-ing. A little more than 9 percent of the total outstand-ing volume of coupon issues, including TIISs, washeld in the portfolio at the end of 1998, about 1 per-centage point more than a year earlier.
TEMPORARY TRANSACTIONS FOR THE SYSTEMOPEN MARKET ACCOUNT
Period-Average Reserve Needs and Revisions
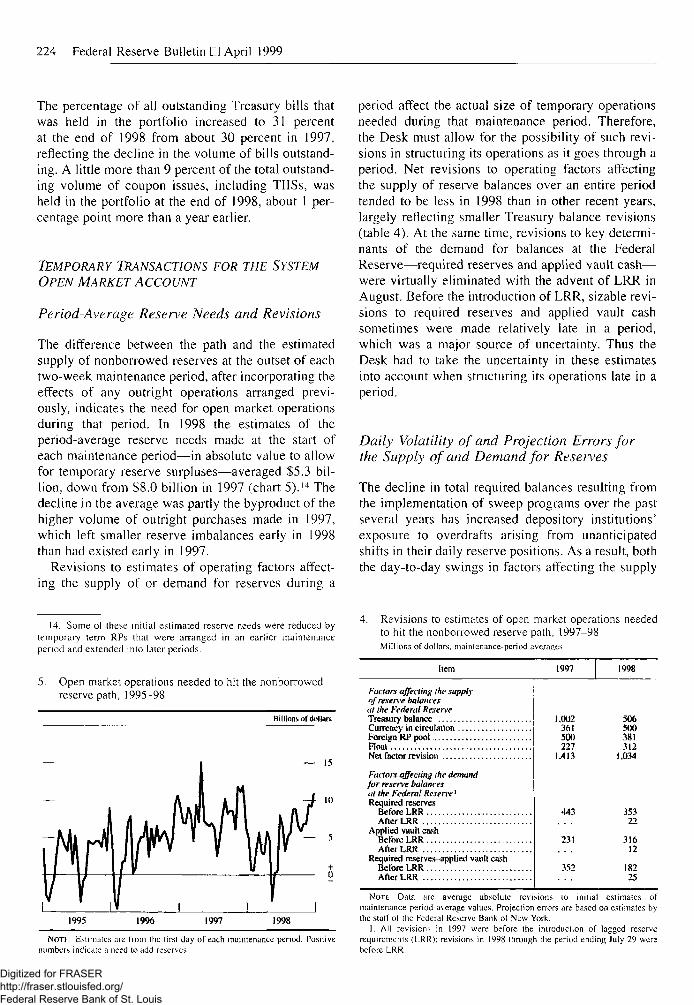
The difference between the path and the estimatedsupply of nonborrowed reserves at the outset of eachtwo-week maintenance period, after incorporating theeffects of any outright operations arranged previ-ously, indicates the need for open market operationsduring that period. In 1998 the estimates of theperiod-average reserve needs made at the start ofeach maintenance period—in absolute value to allowfor temporary reserve surpluses—averaged $5.3 bil-lion, down from $8.0 billion in 1997 (chart 5).14 Thedecline in the average was partly the byproduct of thehigher volume of outright purchases made in 1997,which left smaller reserve imbalances early in 1998than had existed early in 1997.
Revisions to estimates of operating factors affect-ing the supply of or demand for reserves during a
period affect the actual size of temporary operationsneeded during that maintenance period. Therefore,the Desk must allow for the possibility of such revi-sions in structuring its operations as it goes through aperiod. Net revisions to operating factors affectingthe supply of reserve balances over an entire periodtended to be less in 1998 than in other recent years,largely reflecting smaller Treasury balance revisions(table 4). At the same time, revisions to key determi-nants of the demand for balances at the FederalReserve—required reserves and applied vault cash—were virtually eliminated with the advent of LRR inAugust. Before the introduction of LRR, sizable revi-sions to required reserves and applied vault cashsometimes were made relatively late in a period,which was a major source of uncertainty. Thus theDesk had to take the uncertainty in these estimatesinto account when structuring its operations late in aperiod.
Daily Volatility of and Projection Errors forthe Supply of and Demand for Reserves
The decline in total required balances resulting fromthe implementation of sweep programs over the pastseveral years has increased depository institutions'exposure to overdrafts arising from unanticipatedshifts in their daily reserve positions. As a result, boththe day-to-day swings in factors affecting the supply
14. Some of these initial estimated reserve needs were reduced bytemporary term RPs that were arranged in an curlier maintenanceperiod and extended into later periods.
5. Open market operations needed to hit the nonborrowedreserve path, 1995-98
Billions of dollars
— 15
10
1995 1996 1997 1998
NrOTK Estimates are from [he lirst day of each maintenance period. Positivenumbers indicate a need to add reserves.
4. Revisions to estimates of open market operations neededto hit the nonborrowed reserve path, 1997-98Millions of dollars, maintenance-period averages
Item
Factor* affecting the supplyoj rexen'e balancesat the Federal ReserveTreasury balanceCurrency in circulationForeign RP poolFloat. .Ncl factor revision
Factors affecting the demandfor reserve balancesat the Federal Reserve'Required reserves
Before LRRAfter LRR
Applied vault cashBefore LRRAfter LRR
Requited reserves-applied vault cashBefore LRR .After LRR
1997
1.002361500227
1.413
443
231
1998
506500381312
1.034
35322
31612
18225
Nor£. Data arc average absolute revisions to initial estimates ofmaintenance-period-average values. Projection errors are based on estimates bythe staff of the Federal Reserve Bank of New York.
1. All revisions in 1997 were before the introduction of lagged reserverequirements (LRR); revisions in 1998 through the period ending July 29 werebefore LRR.
Digitized for FRASER http://fraser.stlouisfed.org/ Federal Reserve Bank of St. Louis
Highlights of Domestic Open Market Operations during 1998 225
5. Daily changes and forecast errors in key determinants of reserve balance supply, 1995-98Millions of dollars, average and maximum of absolute values
Item
Daily changesTreasury balanceCurrency in circulationForeign RP poolFloatNet value ,
Daily forecast errorTreasury balanceCurrency in circulationForeign RP poolFloatNet value
1995
Average Maximum
1996
Average Maximum
1997
Average Maximum
1998
Average Maximum
1.233 12.639 1.002 9.780 1,484 17,393 1,413 22,571655 1.582 646 2,016 679 2,474 709 2,788486 3,955 369 3,017 542 6,989 500 6,193515 3,748 790 8,154 548 4,605 791 5,449
1,491 11,470 1,413 11.787 1,896 18,366 1,751 23,727
642 4,188 732 4.921 726 5,969 620 3,407206 932 213 932 200 980 217 999124 617 113 617 203 1,433 150 935284 1,903 371 3,768 312 3,433 383 2,386743 4,139 898 5,042 848 5,991 744 3,664
NOTE. Projection errors are based on estimates by the staff of ihe FederalReserve Bank of New York.
of reserve balances and the potential for error in theprojections of these factors have taken on a greaterrole in the Desk's daily reserve management delibera-tions.15 For the same reason, the day-to-day volatilityin the demand for excess reserves and the potentialfor error in the judgment of daily excess demandhave also become more important considerations inthe Desk's management of reserves.
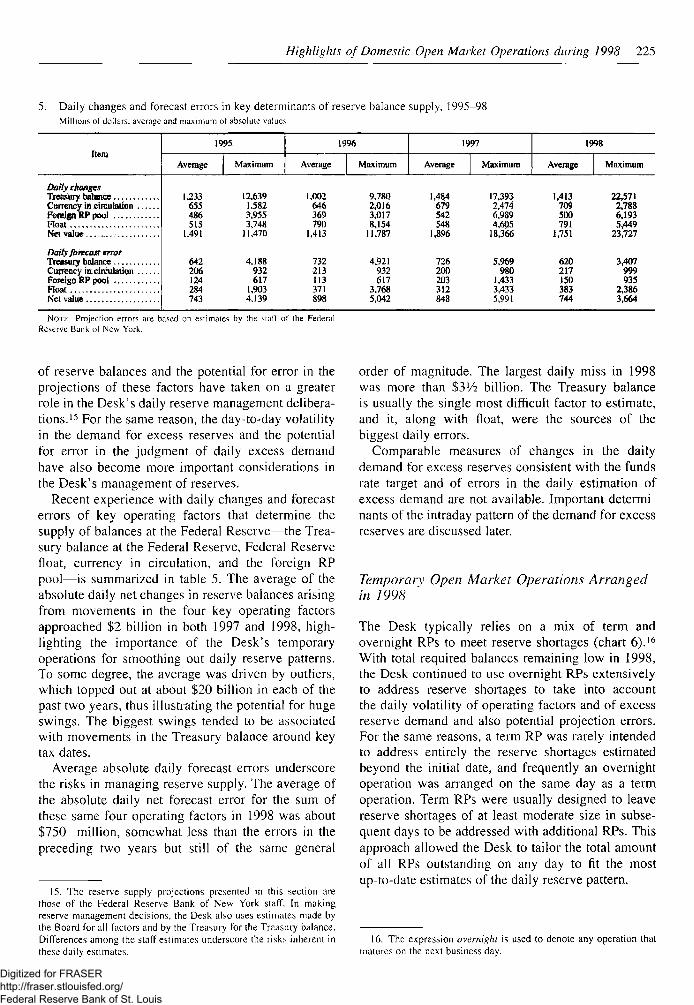
Recent experience with daily changes and forecasterrors of key operating factors that determine thesupply of balances at the Federal Reserve—the Trea-sury balance at the Federal Reserve, Federal Reservefloat, currency in circulation, and the foreign RPpool—is summarized in table 5. The average of theabsolute daily net changes in reserve balances arisingfrom movements in the four key operating factorsapproached $2 billion in both 1997 and 1998, high-lighting the importance of the Desk's temporaryoperations for smoothing out daily reserve patterns.To some degree, the average was driven by outliers,which topped out at about $20 billion in each of thepast two years, thus illustrating the potential for hugeswings. The biggest swings tended to be associatedwith movements in the Treasury balance around keytax dates.
Average absolute daily forecast errors underscorethe risks in managing reserve supply. The average ofthe absolute daily net forecast error for the sum ofthese same four operating factors in 1998 was about$750 million, somewhat less than the errors in thepreceding two years but still of the same general
15. The reserve supply projections presented in this section arethose of the Federal Reserve Bank of New York staff. In makingreserve management decisions, the Desk also uses estimates made bythe Board for all factors and by the Treasury for the Treasury balance.Differences among the staff estimates underscore the risks inherent inthese daily estimates.
order of magnitude. The largest daily miss in 1998was more than $3'/2 billion. The Treasury balanceis usually the single most difficult factor to estimate,and it, along with float, were the sources of thebiggest daily errors.
Comparable measures of changes in the dailydemand for excess reserves consistent with the fundsrate target and of errors in the daily estimation ofexcess demand are not available. Important determi-nants of the intraday pattern of the demand for excessreserves are discussed later.
Temporary Open Market Operations Arrangedin 1998
The Desk typically relies on a mix of term andovernight RPs to meet reserve shortages (chart 6).16
With total required balances remaining low in 1998,the Desk continued to use overnight RPs extensivelyto address reserve shortages to take into accountthe daily volatility of operating factors and of excessreserve demand and also potential projection errors.For the same reasons, a term RP was rarely intendedto address entirely the reserve shortages estimatedbeyond the initial date, and frequently an overnightoperation was arranged on the same day as a termoperation. Term RPs were usually designed to leavereserve shortages of at least moderate size in subse-quent days to be addressed with additional RPs. Thisapproach allowed the Desk to tailor the total amountof all RPs outstanding on any day to fit the mostup-to-date estimates of the daily reserve pattern.
16. The expression overnight is used to denote any operation thatmatures on the next business day.
Digitized for FRASER http://fraser.stlouisfed.org/ Federal Reserve Bank of St. Louis
226 Federal Reserve Bulletin • April 1999
6. System temporary operations, by type, 1995-9
• 1995~ O 1996_ • 1997
• 1998
~ •
Tent) rcpoichaseagreements1
IJ |• |I III
Ovcnsijilwrepurchaseagreements*
Term matchedsale-purchusc
agreements
.dl •i l 1 1Overnightmatched
sale-purchaseagreements
Number
— 140
— 120
— 100
— 80
— 60
— 40
| — 20
1. Includes fixed and withdrawable repurchase agreements.2. Includes system and customer repurchase agreements.
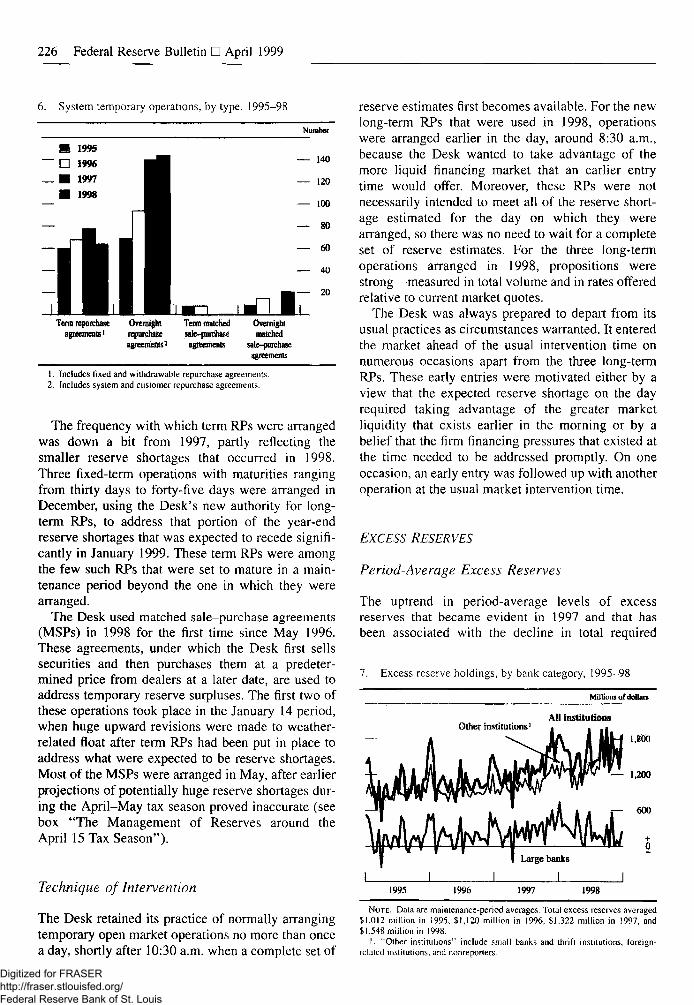
The frequency with which term RPs were arrangedwas down a bit from 1997, partly reflecting thesmaller reserve shortages that occurred in 1998.Three fixed-term operations with maturities rangingfrom thirty days to forty-five days were arranged inDecember, using the Desk's new authority for long-term RPs, to address that portion of the year-endreserve shortages that was expected to recede signifi-cantly in January 1999. These term RPs were amongthe few such RPs that were set to mature in a main-tenance period beyond the one in which they werearranged.
The Desk used matched sale-purchase agreements(MSPs) in 1998 for the first time since May 1996.These agreements, under which the Desk first sellssecurities and then purchases them at a predeter-mined price from dealers at a later date, are used toaddress temporary reserve surpluses. The first two ofthese operations took place in the January 14 period,when huge upward revisions were made to weather-related float after term RPs had been put in place toaddress what were expected to be reserve shortages.Most of the MSPs were arranged in May, after earlierprojections of potentially huge reserve shortages dur-ing the April-May tax season proved inaccurate (seebox "The Management of Reserves around theApril 15 Tax Season").
Technique of Intervention
The Desk retained its practice of normally arrangingtemporary open market operations no more than oncea day, shortly after 10:30 a.m. when a complete set of
reserve estimates first becomes available. For the newlong-term RPs that were used in 1998, operationswere arranged earlier in the day, around 8:30 a.m.,because the Desk wanted to take advantage of themore liquid financing market that an earlier entrytime would offer. Moreover, these RPs were notnecessarily intended to meet all of the reserve short-age estimated for the day on which they werearranged, so there was no need to wait for a completeset of reserve estimates. For the three long-termoperations arranged in 1998, propositions werestrong—measured in total volume and in rates offeredrelative to current market quotes.
The Desk was always prepared to depart from itsusual practices as circumstances warranted. It enteredthe market ahead of the usual intervention time onnumerous occasions apart from the three long-termRPs. These early entries were motivated either by aview that the expected reserve shortage on the dayrequired taking advantage of the greater marketliquidity that exists earlier in the morning or by abelief that the firm financing pressures that existed atthe time needed to be addressed promptly. On oneoccasion, an early entry was followed up with anotheroperation at the usual market intervention time.
EXCESS RESERVES
Period-Average Excess Reserves
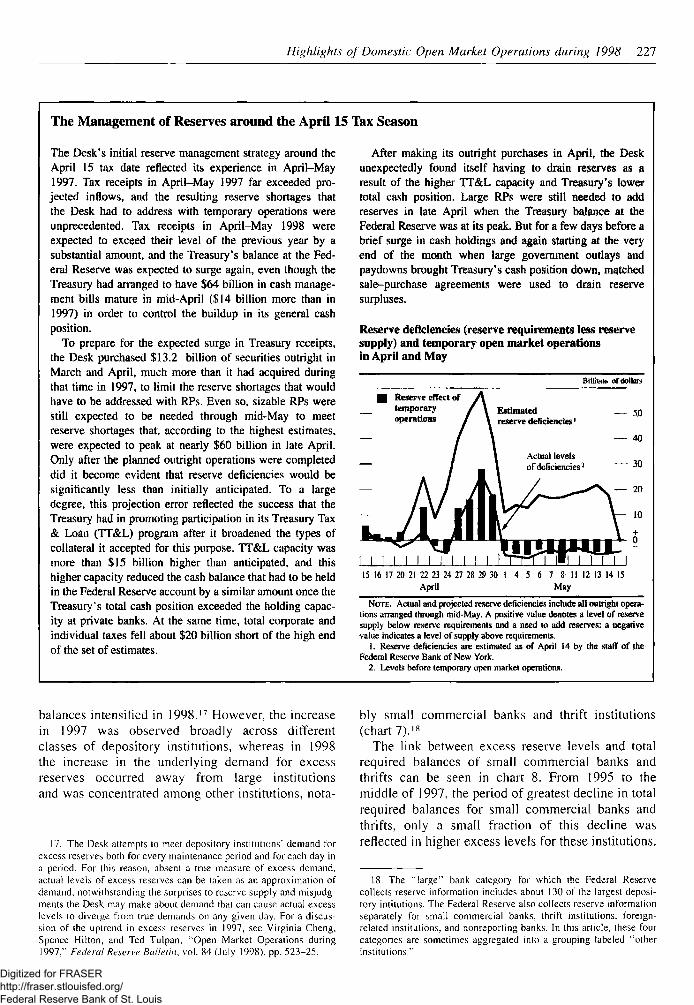
The uptrend in period-average levels of excessreserves that became evident in 1997 and that hasbeen associated with the decline in total required
7. Excess reserve holdings, by bank category, 1995-98
Millions of dollars
Other institutionsAll institutions
1,800
1,200
600
1995 1996 1997 1998
NOTE. Data are maintenance-period averages. Total excess reserves averaged$1,012 million in 1995. $1,120 million in T996, $1,322 million in 1997. and$1,548 million in 1998.
1. "Other institutions" include small banks and thrift institutions, foreign-related institutions, and nonreporters.
Digitized for FRASER http://fraser.stlouisfed.org/ Federal Reserve Bank of St. Louis
Highlights of Domestic Open Market Operations during 1998 227
The Management of Reserves around the April 15 Tax Season
The Desk's initial reserve management strategy around theApril 15 tax date reflected its experience in April-May1997. Tax receipts in April-May 1997 far exceeded pro-jected inflows, and the resulting reserve shortages thatthe Desk had to address with temporary operations wereunprecedented. Tax receipts in April-May 1998 wereexpected to exceed their level of the previous year by asubstantial amount, and the Treasury's balance at the Fed-eral Reserve was expected to surge again, even though theTreasury had arranged to have $64 billion in cash manage-ment bills mature in mid-April ($14 billion more than in1997) in order to control the buildup in its general cashposition.
To prepare for the expected surge in Treasury receipts,the Desk purchased $13.2 billion of securities outright inMarch and April, much more than it had acquired duringthat time in 1997, to limit the reserve shortages that wouldhave to be addressed with RPs. Even so, sizable RPs werestill expected to be needed through mid-May to meetreserve shortages that, according to the highest estimates,were expected to peak at nearly $60 billion in late April.Only after the planned outright operations were completeddid it become evident that reserve deficiencies would besignificantly less than initially anticipated. To a largedegree, this projection error reflected the success that theTreasury had in promoting participation in its Treasury Tax& Loan (TT&L) program after it broadened the types ofcollateral it accepted for this purpose. TT&L capacity wasmore than $15 billion higher than anticipated, and thishigher capacity reduced the cash balance that had to be heldin the Federal Reserve account by a similar amount once theTreasury's total cash position exceeded the holding capac-ity at private banks. At the same time, total corporate andindividual taxes fell about $20 billion short of the high endof the set of estimates.
After making its outright purchases in April, the Deskunexpectedly found itself having to drain reserves as aresult of the higher TT&L capacity and Treasury's lowertotal cash position. Large RPs were still needed to addreserves in late April when the Treasury balance at theFederal Reserve was at its peak. But for a few days before abrief surge in cash holdings and again starting at the veryend of the month when large government outlays andpaydowns brought Treasury's cash position down, matchedsale-purchase agreements were used to drain reservesurpluses.
Reserve deficiencies (reserve requirements less reservesupply) and temporary open market operationsin April and May
B Reserve effect of Atemporary / \operations / '
— /
— /
1 1 1 I I 1 ! I I 1 !15 16 17 20 21 22 23 24 27 28 29
April
Billions
EstimatedL reserve deficiencies1
\1 Actual levelsI of deficiencies'
[jrimmuiiVrHitiui
df dollars
— 50
— 40
— 30
— 20
V— 10
IsL—
1 130 1 4 5 6 7 8 11 12 13 14 15
May
NOTE. Actual and projected reserve deficiencies include all outright opera-tions arranged through mid-May. A positive value denotes a level or reservesupply below reserve requirements and a need to add reserves; a negativevalue indicates a level of supply above requirements.
1. Reserve deficiencies are estimated as of April 14 by the staff of theFederal Reserve Bank of New York.
2. Levels before temporary open market operations.
balances intensified in 1998.17 However, the increasein 1997 was observed broadly across differentclasses of depository institutions, whereas in 1998the increase in the underlying demand for excessreserves occurred away from large institutionsand was concentrated among other institutions, nota-
17. The Desk attempts to meet depository institutions' demand forexcess reserves both for every maintenance period and for each day ina period. For this reason, absent a true measure of excess demand,actual levels of excess reserves can be taken as an approximation ofdemand, notwithstanding the surprises to reserve supply and misjudg-ments the Desk may make about demand that can cause actual excesslevels to diverge from true demands on any given day. For a discus-sion of the uptrend in excess reserves in 1997, see Virginia Cheng,Spence Hilton, and Ted Tulpan, "Open Market Operations during1997," Federal Reserve Bulletin, vol. 84 (July 1998). pp. 523-25.
bly small commercial banks and thrift institutions(chart 7).18
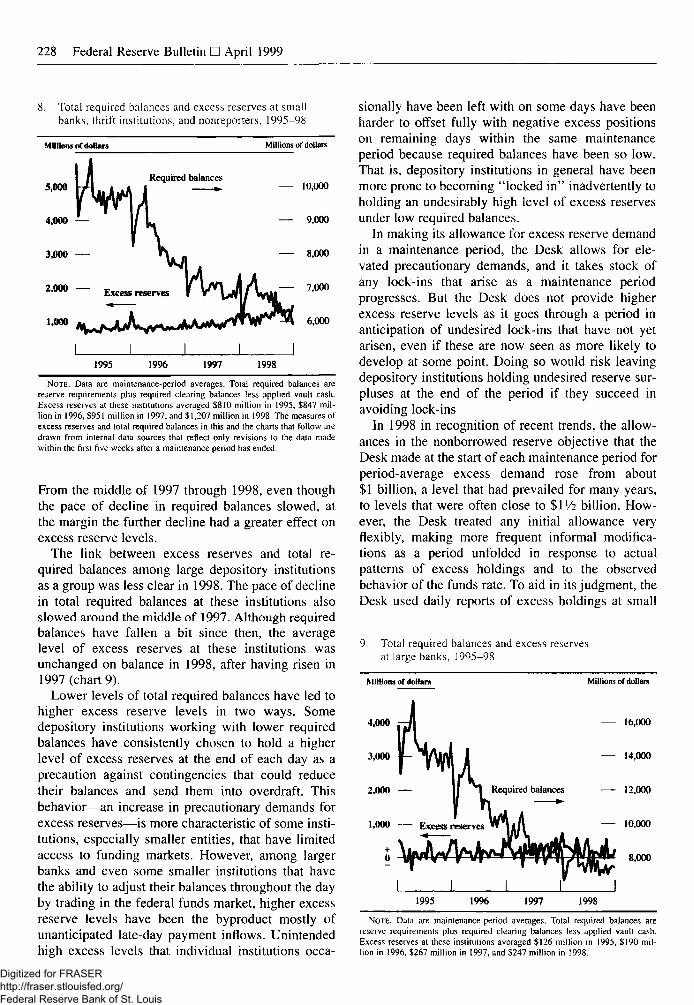
The link between excess reserve levels and totalrequired balances of small commercial banks andthrifts can be seen in chart 8. From 1995 to themiddle of 1997, the period of greatest decline in totalrequired balances for small commercial banks andthrifts, only a small fraction of this decline wasreflected in higher excess levels for these institutions.
18. The "large" bank category for which the Federal Reservecollects reserve information includes about 130 of the largest deposi-tory intilutions. The Federal Reserve also collects reserve informationseparately for small commercial banks, thrift institutions, foreign-related institutions, and nonreporting banks. In this article, these fourcategories are sometimes aggregated into a grouping labeled "otherinstitutions."
Digitized for FRASER http://fraser.stlouisfed.org/ Federal Reserve Bank of St. Louis
228 Federal Reserve Bulletin • April 1999
i. Total required balances and excess reserves at smallbanks, thrift institutions, and nonreporters, 1995-98
Millions of dollars
5,000 j / L . i^Jj
4,000 — '
3$U0w •"•'""
Required balances
'VIVl i
*m - Excess re*™* f V'XJ
1,000 M . MJ
1 11995
1 11996 1997
Millions of dollars
10,000
9,000
8,000
A M U — 7l000
TV/P^A 6,000
I1998
NOTE. Data are maintenance-period averages. Total required balances arereserve requirements plus required clearing balances less applied vault cash.Excess reserves at these institutions averaged $810 million in 1995, $847 mil-lion in 1996, $951 million in 1997, and $1,207 million in 1998. The measures ofexcess reserves and total required balances in this and the charts thai follow aredrawn from internal data sources that reflect only revisions to the data madewithin (he first five weeks after a maintenance period has ended.
From the middle of 1997 through 1998, even thoughthe pace of decline in required balances slowed, atthe margin the further decline had a greater effect onexcess reserve levels.
The link between excess reserves and total re-quired balances among large depository institutionsas a group was less clear in 1998. The pace of declinein total required balances at these institutions alsoslowed around the middle of 1997. Although requiredbalances have fallen a bit since then, the averagelevel of excess reserves at these institutions wasunchanged on balance in 1998, after having risen in1997 (chart 9).
Lower levels of total required balances have led tohigher excess reserve levels in two ways. Somedepository institutions working with lower requiredbalances have consistently chosen to hold a higherlevel of excess reserves at the end of each day as aprecaution against contingencies that could reducetheir balances and send them into overdraft. Thisbehavior—an increase in precautionary demands forexcess reserves—is more characteristic of some insti-tutions, especially smaller entities, that have limitedaccess to funding markets. However, among largerbanks and even some smaller institutions that havethe ability to adjust their balances throughout the dayby trading in the federal funds market, higher excessreserve levels have been the byproduct mostly ofunanticipated late-day payment inflows. Unintendedhigh excess levels that individual institutions occa-
sionally have been left with on some days have beenharder to offset fully with negative excess positionson remaining days within the same maintenanceperiod because required balances have been so low.That is, depository institutions in general have beenmore prone to becoming "locked in" inadvertently toholding an undesirably high level of excess reservesunder low required balances.
In making its allowance for excess reserve demandin a maintenance period, the Desk allows for ele-vated precautionary demands, and it takes stock ofany lock-ins that arise as a maintenance periodprogresses. But the Desk does not provide higherexcess reserve levels as it goes through a period inanticipation of undesired lock-ins that have not yetarisen, even if these are now seen as more likely todevelop at some point. Doing so would risk leavingdepository institutions holding undesired reserve sur-pluses at the end of the period if they succeed inavoiding lock-ins
In 1998 in recognition of recent trends, the allow-ances in the nonborrowed reserve objective that theDesk made at the start of each maintenance period forperiod-average excess demand rose from about$1 billion, a level that had prevailed for many years,to levels that were often close to $l'/2 billion. How-ever, the Desk treated any initial allowance veryflexibly, making more frequent informal modifica-tions as a period unfolded in response to actualpatterns of excess holdings and to the observedbehavior of the funds rate. To aid in its judgment, theDesk used daily reports of excess holdings at small
9. Total required balances and excess reservesat large banks, 1995-98
Millions of dollars Millions of dollars
4,000
3,000
2,000 —
1,000
16,000
14,000
12,000
10,000
8,000
1995 1996 1997 1998
NOTE. Data are maintenance-period averages. Total required balances arereserve requirements plus required clearing balances less applied vault cash.Excess reserves at these institutions averaged S126 million in 1995, $190 mil-lion in 1996, $267 million in 1997, and $247 million in 1998.
Digitized for FRASER http://fraser.stlouisfed.org/ Federal Reserve Bank of St. Louis
Highlights of Domestic Open Market Operations during 1998 229
10. Average levels of daily excess reserve holdings,by day in a maintenance period, 1995-98
Millions of dollars
Thins. F i t Mon. Tues. Wed. Ttara.
Week One
Fri. Mon. Toes.
Week Two
Wed.
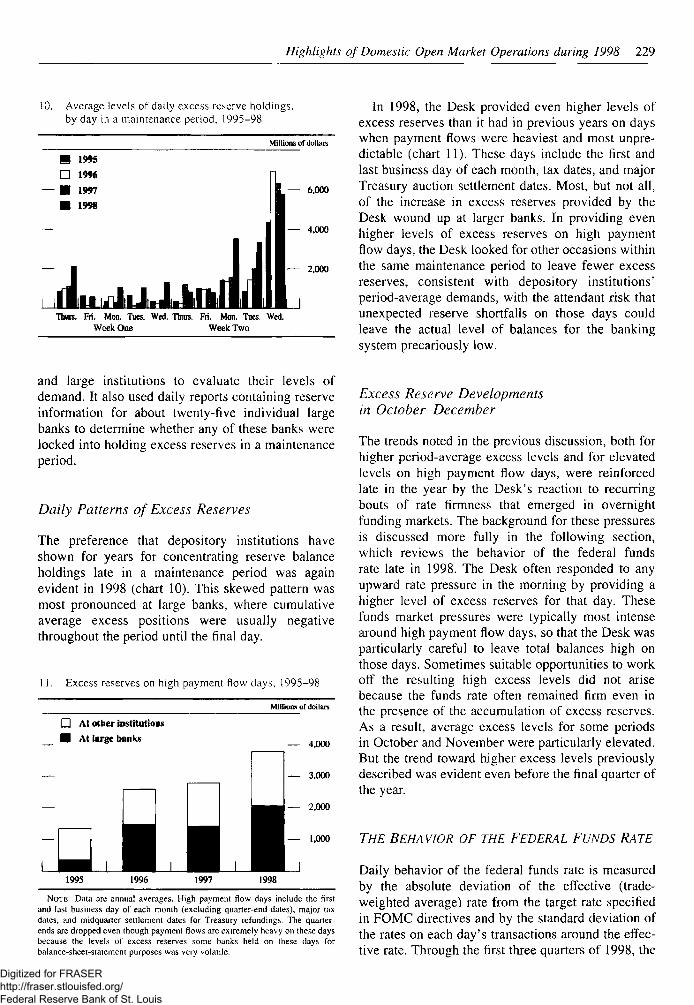
In 1998, the Desk provided even higher levels ofexcess reserves than it had in previous years on dayswhen payment flows were heaviest and most unpre-dictable (chart 11). These days include the first andlast business day of each month, tax dates, and majorTreasury auction settlement dates. Most, but not all,of the increase in excess reserves provided by theDesk wound up at larger banks. In providing evenhigher levels of excess reserves on high paymentflow days, the Desk looked for other occasions withinthe same maintenance period to leave fewer excessreserves, consistent with depository institutions'period-average demands, with the attendant risk thatunexpected reserve shortfalls on those days couldleave the actual level of balances for the bankingsystem precariously low.
and large institutions to evaluate their levels ofdemand. It also used daily reports containing reserveinformation for about twenty-five individual largebanks to determine whether any of these banks werelocked into holding excess reserves in a maintenanceperiod.
Daily Patterns of Excess Reserves
The preference that depository institutions haveshown for years for concentrating reserve balanceholdings late in a maintenance period was againevident in 1998 (chart 10). This skewed pattern wasmost pronounced at large banks, where cumulativeaverage excess positions were usually negativethroughout the period until the final day.
11. Excess reserves on high payment flow days, 1995-98
Millions or dollars
D At other institutions• At large banks
, I 1
— 4,0001 1
_
— 3.000
— 2,000
Excess Reserve Developmentsin October-December
The trends noted in the previous discussion, both forhigher period-average excess levels and for elevatedlevels on high payment flow days, were reinforcedlate in the year by the Desk's reaction to recurringbouts of rate firmness that emerged in overnightfunding markets. The background for these pressuresis discussed more fully in the following section,which reviews the behavior of the federal fundsrate late in 1998. The Desk often responded to anyupward rate pressure in the morning by providing ahigher level of excess reserves for that day. Thesefunds market pressures were typically most intensearound high payment flow days, so that the Desk wasparticularly careful to leave total balances high onthose days. Sometimes suitable opportunities to workoff the resulting high excess levels did not arisebecause the funds rate often remained firm even inthe presence of the accumulation of excess reserves.As a result, average excess levels for some periodsin October and November were particularly elevated.But the trend toward higher excess levels previouslydescribed was evident even before the final quarter ofthe year.
— 1,000
1995 1996 1997 1998
NOTE. Data are annual averages. High payment flow days include the firstand last business day of each month (excluding quarter-end dales), major taxdates, and midquaiier settlement dates for Treasury refundings. The quarter-ends are dropped even though payment flows are extremely heavy on these daysbecause the levels of excess reserves some banks held on these days forbalance-sheet-statement purposes was very volatile.
THE BEHAVIOR OF THE FEDERAL FUNDS RATE
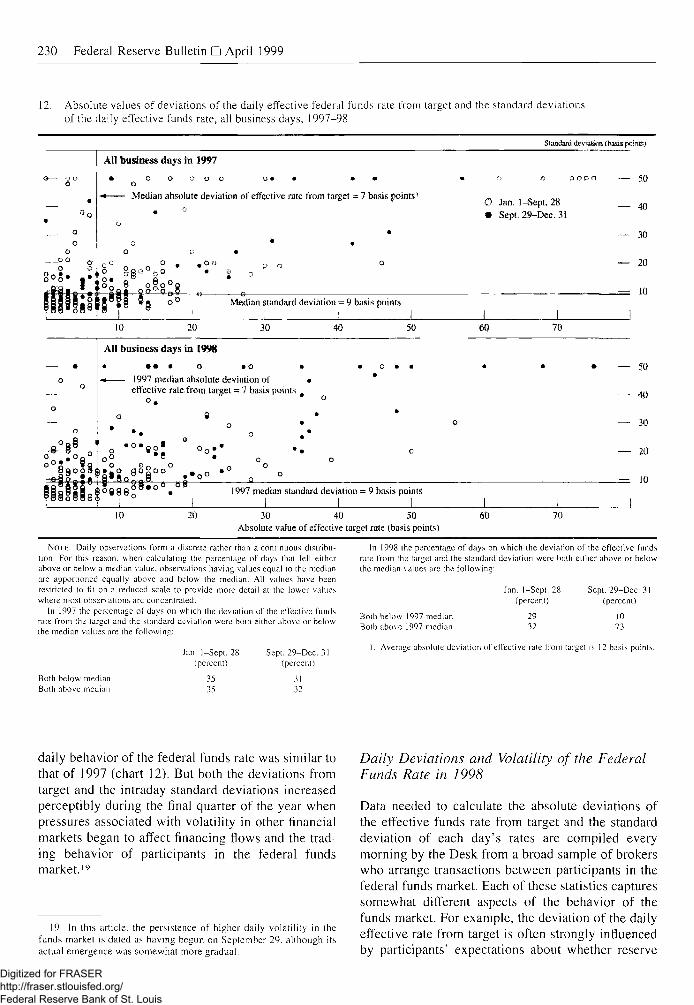
Daily behavior of the federal funds rate is measuredby the absolute deviation of the effective (trade-weighted average) rate from the target rate specifiedin FOMC directives and by the standard deviation ofthe rates on each day's transactions around the effec-tive rate. Through the first three quarters of 1998, the
Digitized for FRASER http://fraser.stlouisfed.org/ Federal Reserve Bank of St. Louis
230 Federal Reserve Bulletin • April 1999
Absolute values of deviations of the daily effective federal funds rate from target and the standard deviationsof the daily effective funds rate, all business days, 1997-98
Standard deviation (basis points)
All business days in 1997
• o o o o o o • • • •0
•• Median absolute deviation of effective rate from target = 7 basis points' O Jan. 1-Sepi. 28• Sept. 29-Dec. 3 i
o o o a — 50
— 40
- - 30
— 20
= 10Median standard deviation = 9 basis points
10 20 30 40 50 60 70
-8-o
o
°a8
88oSl
All business days in 1998
a • • • o to •
« 1997 median absolute deviation of ieffective rate from target = 7 basis points #
— 50
— 40
— 30
— 20
| * 8 c _— 101997 median standard deviation = 9 basis points
10 20 30 40 50Absolute value of effective target rate (basis points)
60 70
NOTE. Daily observations form a discrete rather than a continuous distribu-tion. For this reason, when calculating the percentage of days that fell eitherabove or below a median value, observations having values equal to the medianare apportioned equally above and below the median. All values have beenrestricted to fit on a reduced scale to provide more detail at the lower valueswhere most observations arc concentrated.
In 1997 the percentage of days on which ihe deviation of the effective fundsrate from the target and the standard deviation were both either above or belowihe median values are the following:
Both below medianBoth above median
Jan. 1-Sept. 28(percent)
3535
Sept. 29-Dcc. 31(percent)
.1132
In 1998 ihe percentage of days on which (lie deviation of the effective fundsrate from the target and the standard deviation were both either above or belowthe median values are the following:
Both below 1997 medianBoth above 1997 median
1. Average absolute deviation o( effective rate from target is 12 basis points.
Jan. 1-Sept. 28(percent)
2932
Sept. 29-Dec. 31(percent)
1073
daily behavior of the federal funds rate was similar tothat of 1997 (chart 12). But both the deviations fromtarget and the intraday standard deviations increasedperceptibly during the final quarter of the year whenpressures associated with volatility in other financialmarkets began to affect financing flows and the trad-ing behavior of participants in the federal fundsmarket.19
19. In this article, the persistence of higher daily volatility in thefunds market is dated as having begun on Septetnber 29. although itsactual emergence was somewhat more gradual.
Daily Deviations and Volatility of the FederalFunds Rate in 1998
Data needed to calculate the absolute deviations ofthe effective funds rate from target and the standarddeviation of each day's rates are compiled everymorning by the Desk from a broad sample of brokerswho arrange transactions between participants in thefederal funds market. Each of these statistics capturessomewhat different aspects of the behavior of thefunds market. For example, the deviation of the dailyeffective rate from target is often strongly influencedby participants' expectations about whether reserve
Digitized for FRASER http://fraser.stlouisfed.org/ Federal Reserve Bank of St. Louis
Highlights of Domestic Open Market Operations during 1998 231
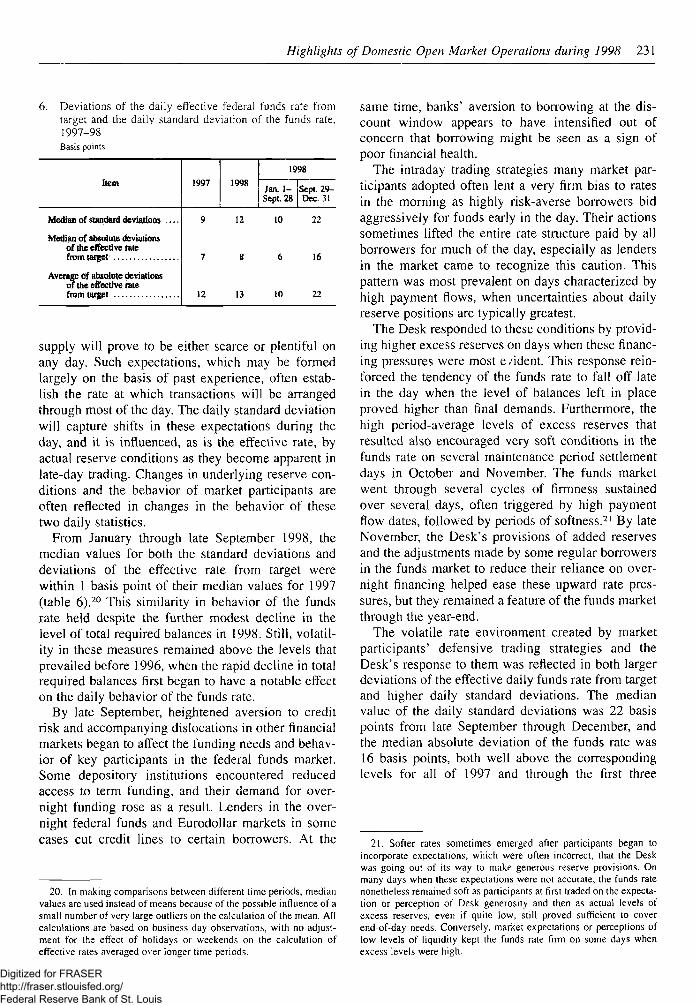
6. Deviations of the daily effective federal funds rate fromtarget and the daily standard deviation of the funds rate,1997-98Basis points
Item
Median of standard deviations
Median of absolute deviationsof the effective ratefrom target
Average of absolute deviationsol the effective ralefrom targe!
1997 199S
1998
Jan. 1-Sept. 28
Sept. 29-Dec. 31
9 12 10 22
7 8 6 16
12 13 10 22
supply will prove to be either scarce or plentiful onany day. Such expectations, which may be formedlargely on the basis of past experience, often estab-lish the rate at which transactions will be arrangedthrough most of the day. The daily standard deviationwill capture shifts in these expectations during theday, and it is influenced, as is the effective rate, byactual reserve conditions as they become apparent inlate-day trading. Changes in underlying reserve con-ditions and the behavior of market participants areoften reflected in changes in the behavior of thesetwo daily statistics.
From January through late September 1998, themedian values for both the standard deviations anddeviations of the effective rate from target werewithin 1 basis point of their median values for 1997(table 6),20 This similarity in behavior of the fundsrate held despite the further modest decline in thelevel of total required balances in 1998. Still, volatil-ity in these measures remained above the levels thatprevailed before 1996, when the rapid decline in totalrequired balances first began to have a notable effecton the daily behavior of the funds rate.
By late September, heightened aversion to creditrisk and accompanying dislocations in other financialmarkets began to affect the funding needs and behav-ior of key participants in the federal funds market.Some depository institutions encountered reducedaccess to term funding, and their demand for over-night funding rose as a result. Lenders in the over-night federal funds and Eurodollar markets in somecases cut credit lines to certain borrowers. At the
same time, banks' aversion to borrowing at the dis-count window appears to have intensified out ofconcern that borrowing might be seen as a sign ofpoor financial health.
The intraday trading strategies many market par-ticipants adopted often lent a very firm bias to ratesin the morning as highly risk-averse borrowers bidaggressively for funds early in the day. Their actionssometimes lifted the entire rate structure paid by allborrowers for much of the day, especially as lendersin the market came to recognize this caution. Thispattern was most prevalent on days characterized byhigh payment flows, when uncertainties about dailyreserve positions are typically greatest.
The Desk responded to these conditions by provid-ing higher excess reserves on days when these financ-ing pressures were most e/ident. This response rein-forced the tendency of the funds rate to fall off latein the day when the level of balances left in placeproved higher than final demands. Furthermore, thehigh period-average levels of excess reserves thatresulted also encouraged very soft conditions in thefunds rate on several maintenance period settlementdays in October and November. The funds marketwent through several cycles of firmness sustainedover several days, often triggered by high paymentflow dates, followed by periods of softness.21 By lateNovember, the Desk's provisions of added reservesand the adjustments made by some regular borrowersin the funds market to reduce their reliance on over-night financing helped ease these upward rate pres-sures, but they remained a feature of the funds marketthrough the year-end.
The volatile rate environment created by marketparticipants' defensive trading strategies and theDesk's response to them was reflected in both largerdeviations of the effective daily funds rate from targetand higher daily standard deviations. The medianvalue of the daily standard deviations was 22 basispoints from late September through December, andthe median absolute deviation of the funds rate was16 basis points, both well above the correspondinglevels for all of 1997 and through the first three
20. In making comparisons between different time periods, medianvalues are used instead of means because of the possible influence of asmall number of very large outliers on the calculation of the mean. Allcalculations are based on business day observations, with no adjust-ment for the effect of holidays or weekends on the calculation ofeffective rates averaged over longer time periods.
21. Softer rates sometimes emerged after participants began toincorporate expectations, which were often incorrect, that the Deskwas going out of its way to make generous reserve provisions. Onmany days when these expectations were not accurate, the funds ratenonetheless remained soft as participants at first traded on the expecta-tion or perception of Desk generosity and then as actual levels ofexcess reserves, even if quite low, still proved sufficient to coverend-of-day needs. Conversely, market expectations or perceptions oflow levels of liquidity kept the funds rate firm on some days whenexcess levels were high.
Digitized for FRASER http://fraser.stlouisfed.org/ Federal Reserve Bank of St. Louis
232 Federal Reserve Bulletin U April 1999
quarters of 1998 (table 6).22 While the degree ofvolatility observed in the daily behavior of the fundsrate during the final quarter was likely aggravated byrequired balance levels, which hovered near historiclows, the immediate cause was the changed marketclimate.
Average Levels of the Federal Funds Rate
Because of these pressures on the funds rate latein 1998, the Desk was less successful in maintainingthe average daily effective rate around the target(chart 13). For the maintenance periods that coveredthe fourth quarter, the absolute deviations of theperiod-average effective rates from target averaged10 basis points.23 The average absolute deviationfrom target of the period-average effective funds ratewas 5 basis points for earlier periods in 1998, and itwas 4 basis points in 1997.
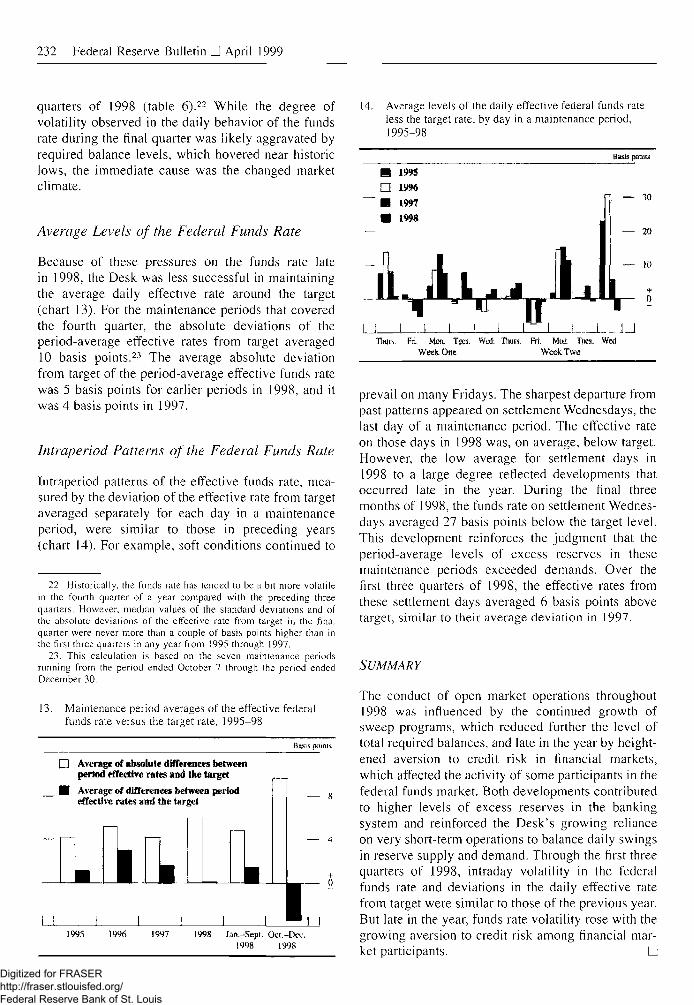
Intraperiod Patterns of the Federal Funds Rate
Intraperiod patterns of the effective funds rate, mea-sured by the deviation of the effective rate from targetaveraged separately for each day in a maintenanceperiod, were similar to those in preceding years(chart 14). For example, soft conditions continued to
14. Average levels of the daily effective federal funds rateless the target rate, by day in a maintenance period,1995-98
22. Historically, the funds rate has tended to be a bit more volatilein the fourth quarter of a year compared with the preceding threequarters. However, median values of the standard deviations and ofthe absolute deviations of the effective rate from target in the finalquarter were never more than a couple of basis points higher than inthe first three quarters in any year from 1995 through 1997.
23. This calculation is based on the seven maintenance periodsrunning from the period ended October 7 through the period endedDecember 30.
13. Maintenance period averages of the effective federalfunds rate versus the target rate, 1995-98
Basis, pmnls
• Average of absolute differences betweenperiod effective rates and the target
H Average of differences between periodeffective rates and the target
— 20
— 10
Times. Fri. Mon, Tues.Week One
1995 1996 1997 I99S Jan.-Sepl. Ocl.-Dei:.1998 1998
prevail on many Fridays. The sharpest departure frompast patterns appeared on settlement Wednesdays, thelast day of a maintenance period. The effective rateon those days in 1998 was, on average, below target.However, the low average for settlement days in1998 to a large degree reflected developments thatoccurred late in the year. During the final threemonths of 1998, the funds rate on settlement Wednes-days averaged 27 basis points below the target level.This development reinforces the judgment that theperiod-average levels of excess reserves in thesemaintenance periods exceeded demands. Over thefirst three quarters of 1998, the effective rates fromthese settlement days averaged 6 basis points abovetarget, similar to their average deviation in 1997.
SUMMARY
The conduct of open market operations throughout1998 was influenced by the continued growth ofsweep programs, which reduced further the level oftotal required balances, and late in the year by height-ened aversion to credit risk in financial markets,which affected the activity of some participants in thefederal funds market. Both developments contributedto higher levels of excess reserves in the bankingsystem and reinforced the Desk 's growing relianceon very short-term operations to balance daily swingsin reserve supply and demand. Through the first threequarters of 1998, intraday volatility in the federalfunds rate and deviations in the daily effective ratefrom target were similar to those of the previous year.But late in the year, funds rate volatility rose with thegrowing aversion to credit risk among financial mar-ket participants. LJ
Digitized for FRASER http://fraser.stlouisfed.org/ Federal Reserve Bank of St. Louis
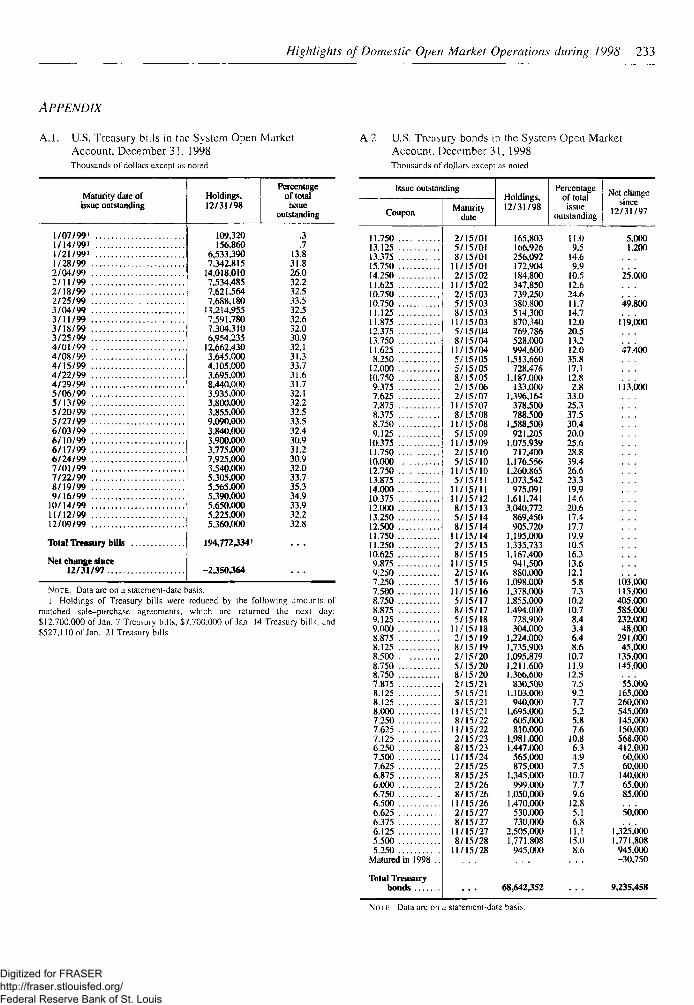
Highlights of Domestic Open Market Operations during 1998 233
APPENDIX
A.I. U.S. Treasury bills in the System Open Market
Account, December 31, 1998
Thousands of dollars except as noted
A.2. U.S. Treasury bonds in the System Open MarketAccount, December 31, 1998Thousands of dollars except as noied
Maturity date ofissue outstanding
1/07/99'1/14/99' . .1/21/99'1/28/99 . .2/04/992/11/992/18/992/25/993/04/993/U/993/18/993/25/994/01/994/08/994/15/994/22/99 . . . . . . .4/29/995/06/995/13/995/20/995/27/996/03/996/10/996/17/996/24/997/01/997/22/998/19/999/16/99
10/14/99 .11/12/9912/09/99
Total Treasury bills
Net change since12/31/97
Holdings,12/31/98
109,320156.860
6.533.3907,342,815
14,018,0107.534,4857.621,5647 688,180
13,214,9557.591,7807,304,3106,954,235
12,662,4303,645.0004.105,0003,695,0008,440.0003,935,0003,800,0003,855.0009.090.0003,840,0003,900,0003 775.0007,925.0003,540.0005.305,0005.565.0005,390.0005.650.0005 225,0005,360.000
194,772334'
-2,350,364
Percentageof totalissue
outstanding
.3
.713.831.826.032.232.533.532.532.632.030.932.131.333.731.631.732.132.232.533.532.430.931.230.932.033.735.334.93.3.932.232.8
Issue outstanding
NOTE. Data are on a slalernent-date basis.1 Holdings of Treasury bills were reduced by the following amounts of
matched snie-purchase agreements, which are returned the next day:$12,700,000 of Jan. 7 Treasury bills, $7,700,000 of Jan. 14 Treasury bills, and$527,110 of Jan. 21 Treasury bills.
Coupon
11.75013.12513.37515.75014.25011.62510.75010.75011.12511.87512.37513.75011.6258.230
12.00010.7509.3757.6257.8758.3758.7509.125
10.37511.75010.00012.7501.3.87514.00010.37512.00013.25012.50011.75011.25010.6259.8759.2507.2507.5008.7508.8759.1259.0008.8758.1258.5008.7508.7507.8758.1258.1258.0007.2507.6257.1256.2507.5007.6256.8756.0006.7506.5006.6256.3756.1255.5005.250
Matured in 1998 ..
Total Treasurybonds
Maturitydate
Holdings,12/31/98
Percentageof totalissue
outstanding
Net changesince
12/31/97
2/15/015/15/018/15/0111/15/012/15/0211/15/022/15/035/15/038/15/0311/15/035/15/048/15/0411/15/045/15/055/15/058/15/052/15/062/15/0711/15/078/15/0811/15/085/15/0911/15/092/15/105/15/1011/15/105/15/1111/15/1111/15/128/15/135/15/148/15/1411/15/142/15/158/15/1511/15/152/15/165/15/16
11/15/165/15/178/15/175/15/18
11/15/182/15/198/15/192/15/205/15/208/15/202/15/215/15/218/15/21
11/15/218/15/22
11/15/222/15/238/15/23
11/15/242/15/258/15/252/15/268/15/26
11/15/262/15/278/15/27
11/15/278/15/28
11/15/28
165,803166.926256,092172.904184,800347.850739.250380,800514,300870,340769,786528,000994,600
1.513,660728.476
1.187.000133,000
1,396,164378,500788,500
1.588,500921.205
1.075.939717.400
1.176.5561.260,8651.073,542
975,0911.611.7413.040.772
869.450905.720
1.195,0001.335.7331,167,400
941.500880,000
1.098.0001.378,0001.855.0001.494,000
728,900304.000
1,224.0001.735,9001.095.8791.211,6001,366,600
830.5001.103.000
940,0001.695.000
605.000810,000
1,981.0001.447.000
565.000875,000
1,345.000999.000
1.050,0001.470.000
530.000730.000
2,505,0001.771.808
945,000
68,642,352
U.O9.5
14.69.9
10.512.624.611.714.712.020.513.212.035.817.112.82.8
33.025.337.530.420.025.628.839.426.623.319.914.620.617.417.719.910.516.313.612.15.87.3
10.210.78.43.46.48.6
10.711.912.57.59.27.75.25.87.6
10.86.34.97.5
10.77.79.6
12.85.16.8
11.115.08.6
5.0001.200
25.000
49.800
119,000
47.400
113.000
103.000115,000405,000585.000232,00048.000
291.00045,000
135.000145.000
55.000165,000260.000545.000145,000150,000568.000412.000
60.00060.000
140,00065.00085.000
50.000
I..325.0001.771.808
945.000-30,750
9,235,458
NOT li. Dala arc on a statement-date basis.
Digitized for FRASER http://fraser.stlouisfed.org/ Federal Reserve Bank of St. Louis
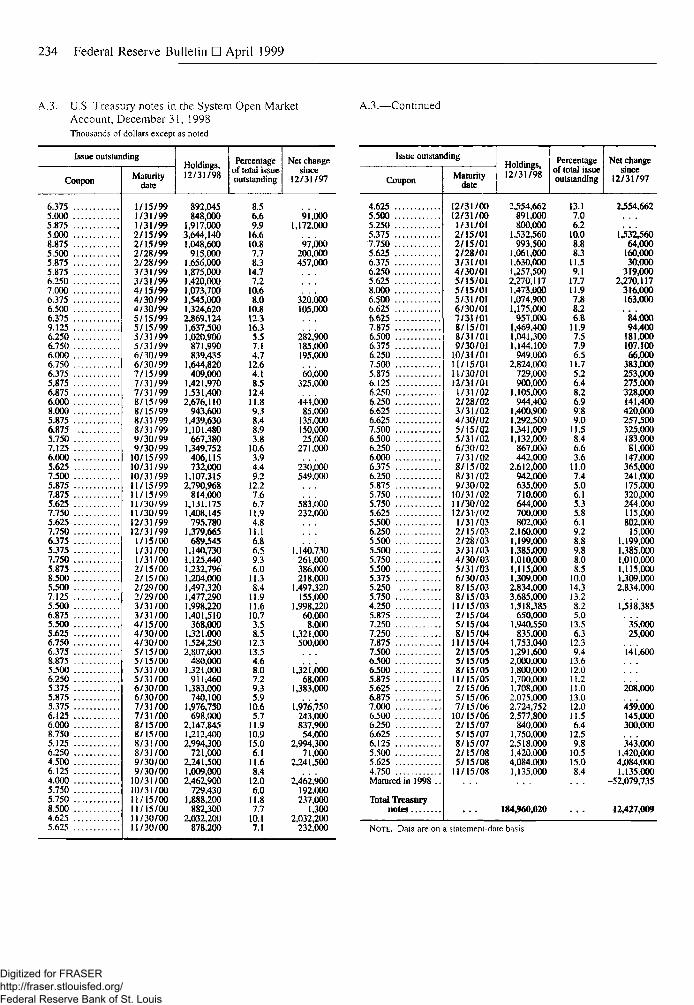
234 Federal Reserve Bulletin • April 1999
A.3. U.S. Treasury notes in the System Open MarketAccount, December 31, 1998Thousands of dollars except as noted
A.3.—Continued
Issue outstanding
Coupon
6.3755.0005.8755.0008.8755.5005.8755.8756.2507.0006.3756.5006.3759.1256.2506.7506.0006.7506.3755.8756.8756.0008.0005.8756.8755.7507.1256.0005.6257.5005.8757.8755.6257.7505.6257.7506.3755.3757.7505.8758.5005.5007.1255.5006.8755.5005.6256.7506.3758.8755.5006.2505.3755.8755.3756.1256.0008.7505.1256.2504.5006.1254.0005.7505.7508.5004.6255.625
Maturitydate
Holdings.12/31/98
Percentageof total issueoutstanding
Net changesince
12/31/97
Issue outstanding
1/15/991/31/991/31/992/15/992/15/992/28/992/28/993/31/993/31/994/15/994/30/994/30/995/15/995/15/995/31/995/31/996/30/996/30/997/15/997/31/997/31/998/15/998/15/998/31/998/31/999/30/999/30/9910/15/9910/31/9910/31/9911/15/9911/15/9911/30/9911/30/9912/31/9912/31/991/15/001/31/001/31/002/15/002/15/002/29/002/29/003/31/003/31/004/15/004/30/004/30/005/15/QO5/15/005/31/005/31/006/30/006/30/007/31/007/31/008/15/008/15/008/31/008/31/009/30/009/30/0010/31/0010/31/0011/15/0011/15/00lt/30/00U/30/00
892,045848,000
i,917,0003.644,1401.048,600915,000
1.656,0001,875,0001.420,0001,073,7001,545,0001,324,6202.869.1241,637,5001,020,900871.990839.435
1,644,820409,000
1,421,9701.531,4002,676,110943,600
1,439,6301,101.480667.380
1,349.752406,115732.000
1,1073152.790,968814.000
1,131.1751,408,145795.780
1,379,665689.545
1.140,7301.125.4401,232,7961,204.0001,497,3201,477,2901,998,2201.401.510368,000
1,321,0001.524,2502,807,000480,000
1,321,000911,460
1,383.000740,100
1,976,750698,000
2.147,8451.212,4002,994300721,000
2,241,5001,009,0002.462,900729.430
1.888,200882,300
2.032.200878.200
8.56.69.916.610.87.78.314.77.210.68.010.812.316.35.57.14.712.64.18.512.411.89.38.48.93.810.63.94.49.212.27.66.711.94.811.16.86.59.36.011.38.411.911.610.73.58.512.313.54.68.07.29.35.910.65.711.910.915.06.111.68.412.06.011.87.710.17.1
91,0001,172.000
97,000200,000457,000
320.000105.000
282.900185.000195,000
60.000325,000
444.00085.000135.000150,00025.000
271,000
230.000549,000
583,000232,000
1.140.730261,000386.000218.000
1.497,320155,000
1.998.22060.0008.000
1,321,000500,000
1,321,00068.000
1,383,000
1,976.750243.000837,90054.000
2,994,30071.000
2,241.500
2,462,900192,000237.000
1,3002,032,200
232.000
Coupon
4.6255.5005.2505.3757.7505.6256.3756.2505.6258.0006.5006.6256.6257.8756.5006.3756.2507.5005.8756.1256.2506.2506.6256.6257.5006.5006.2506.0006.37S6.2505.8755.7505.7505.6255.5006.2505.5005.5005.7505.5005.3755.2505.7504.2505.8757.2507.2507.8757.5006.5006.5005.8755.6256.8757.0006.5006.2506.6256.125S.SOO5.6254.750Matured in 1998 .
Total Treasurynotes
Maturitydate
Holdings,12/31/98
Percentageof total issueoutstanding
Net changesince
12/31/97
12/31/0012/31/001/31/012/15/012/15/012/28/013/31/014/30/015/15/015/15/015/31/016/30/017/31/018/15/018/31/019/30/01
10/31/01U/15/0111/30/0112/31/011/31/022/28/023/31/024/30/025/15/025/31/026/30/027/31/028/15/028/31/029/30/02
10/31/0211/30/0212/31/021/31/032/15/032/28/033/31/034/30/035/31/036/30/038/15/038/15/03
11/15/032/15/045/15/048/15/04
11/15/042/15/055/15/058/15/05
11/15/052/15/065/15/067/15/06
10/15/062/15/075/15/078/15/072/15/085/15/08
11/15/08
2,554,662891.000800,000
1,532,560993.500
1,061,0001,630,0001,257,5002,270,1171,473.0001,074,9001,175.000
957,0001,469,4001,041,3001,144,100
949.0002,824,000
729,000900,000
1.105,000944.400
1.400,9001.292,5001341,0091,132.000
867.000442,000
2.612,000942.000635.000710.000644.000700.000802.000
2.160.0001,199.0001.385.0001.010,0001,115,0001309,0002,834,0003.685,0001,518.385
650.0001.940.550
835.0001,753,0401.291.6002,000.0001,800,0001,700.0001,708,0002,075,0002,724,7522,577,800
840.0001,750,0002,518,0001,420.0004,084.0001,135,000
184,960,020
13.17.06.2
10.08.88.3
11.59.1
17.711.97.88.26.8
11.97.57.96.5
11.75.26.48.26.99.89.0
11.58.46.63.6
11.07.45.06.1535.86.19.28.89.88.08.5
10.014.313.28.25.0
13.56.3
12.39.4
13.612.011.211.013.012.011.56.4
12.59.8
10.515.08.4
2.554,662
1.53W6064.000
160.00030,000
319,0002,270,117
316.000163,000
'84.00094,400
181,000107,10066,000
383.000253,000275.000328,000141,400420,000257,500325.000183,00081.000
147.000365,000241,000175,000320,000244,000115,000802,000
15,0001.199.0001,385.0001,010,0001,115.0001309.0002,834.000
1,518,385
35.00025,000
141,600
208,000
459.000145.000300.000
343.0001.420,0004.084,0001.135.000
-52,079,735
12,427,009
NOTL. Data are on a slatement-dale basis.
Digitized for FRASER http://fraser.stlouisfed.org/ Federal Reserve Bank of St. Louis
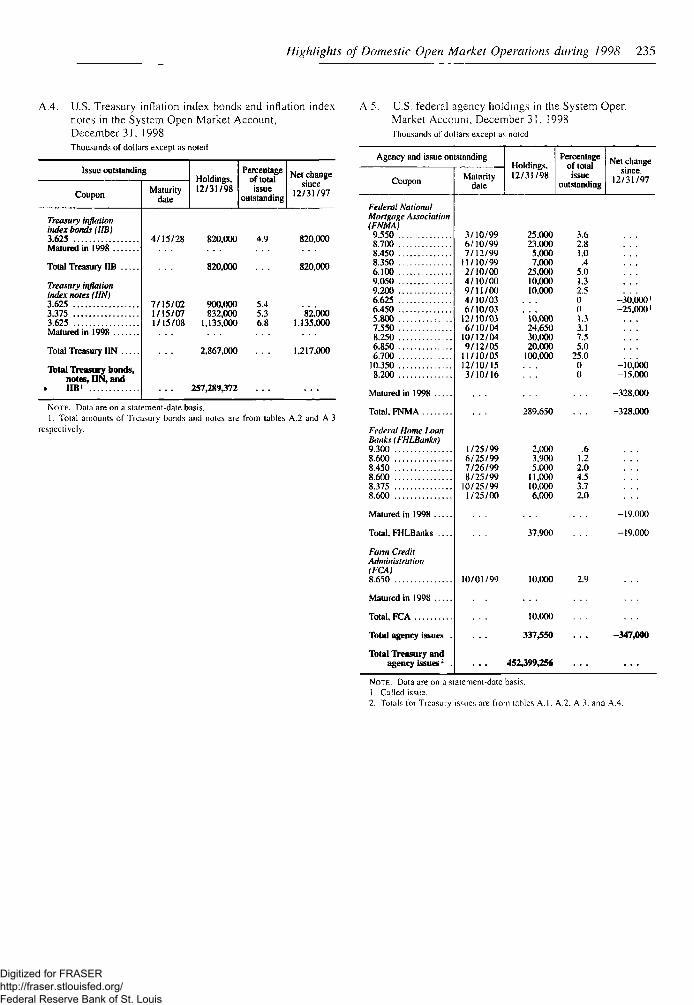
Highlights of Domestic Open Market Operations during 1998 235
A.4. U.S. Treasury inflation index bonds and inflation indexnotes in the System Open Market Account,December 31, 1998Thousands of dollars except as noted
Issue outstanding
Coupon
Treasury inflationindex bonds (1IB)3.625Matured in 1998
Total Treasury IIB
Treasury inflationindex notes (UN)3.6253.3753.625Matured in 1998
Total Treasury UN
Total Treasury bonds,notes, UN, andIIB1
Maturitydate
Holdings,12/31/98
Percentageof totalissue
outstanding
Net changesince
12/31/97
4/15/28 820.000 4.9 820.000
820,000 . . . 820.000
7/15/02 900.000 5.41/15/07 832,000 5.3 82,0001/15/08 1,135,000 6.8 1.135.000
2,867,000 . . . 1,217,000
257,289,372
NOTE. Data are on a statement-date basis.1. Total amounts of Treasury bonds and notes are from tables A.2 and A.3
respectively.
A.5. U.S. federal agency holdings in the System OpenMarket Account, December 31. 1998Thousands of dollars except as noted
Agency and issue outstanding
Coupon
Federal NationalMortgage Association(FNMA)
9.5508.7008.4508.3506.1009.0509.2006.6256.4505.8007.5508.2506.8506.700
10.3508.200
Matured in 1998 . . . .
Total. FNMA .
Federal Home LoanBanks (FHLBanks)9.3008.6008.4508.6O08.3758.6O0
Malured in 1998 . . . .
Total.FHLBanks . . .
Farm CreditAdministration(FCA)8.650
Matured in 1998
Total, FCA
Total agency issues .
Total Treasury andagency issues: .
Maturitydate
Holdings,12/31/98
Percentageof totalissue
outstanding
Net changesince
12/31/97
3/10/996/10/997/12/9911/10/992/10/004/10/009/li/OO4/10/036/10/03
12/10/036/10/0410/12/049/12/0511/10/0512/10/153/10/16
1/25/996/25/997/26/998/25/9910/25/991/25/00
10/01/99
25.00023.0005.0007,000
25,00010.00010.000
10.00024,65030.00020.000100,000
289.650
2,0003,9005.000
11,00010.0006,000
37.900
10.000
10.000
337350
452,399,256
3.62.81.0.4
5.01.32.5001.33.17.55.0
25.000
.61.22.04.53.72.0
2.9
-30.000'-25,0001
-10,000-15,000
-328.000
-328.000
-19.000
-19,000
-347,000
NOTE. Data are on a statemenl-date basis.1. Called issue.2. Toutls for Treasury issues are from tables A. I. A.2. A.3. and A.4.
Digitized for FRASER http://fraser.stlouisfed.org/ Federal Reserve Bank of St. Louis
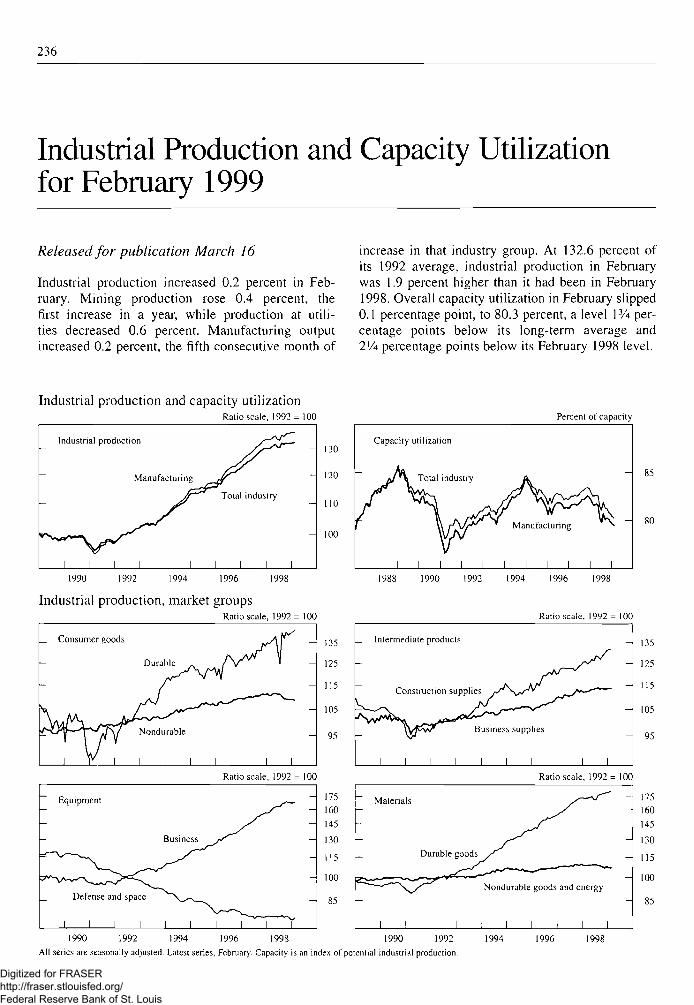
236
Industrial Production and Capacity Utilizationfor February 1999
Released for publication March 16
Industrial production increased 0.2 percent in Feb-ruary. Mining production rose 0.4 percent, thefirst increase in a year, while production at utili-ties decreased 0.6 percent. Manufacturing outputincreased 0.2 percent, the fifth consecutive month of
increase in that industry group. At 132.6 percent ofits 1992 average, industrial production in Februarywas 1.9 percent higher than it had been in February1998. Overall capacity utilization in February slipped0.1 percentage point, to 80.3 percent, a level P/4 per-centage points below its long-term average and2VA percentage points below its February 1998 level.
Industrial production and capacity utilization
Industrial production
~~ Manufacturing
1 1 1 1 1 1
Ratio scale, 1992 =
Total industry
1 1 1 1
100
—
-
-
130
120
110
100
Capacity
f
utilization
Total industry
VV
i i i i
Percent ot capacity
" Manufacturing >̂
1 1 1 1 1 1
- 85
- 80
1990 1992 1994 1996 1998 1988 1990 1992 1994 1996 1998
Industrial production, market groupsRatio scale
Consumer goods
Durable ,. /\A/^
•f^\~\^T\f Nondurable
V 1
, 1992
\
= 100
-
135
125
115
105
- 95
175
160
145
130
115
100
85
1990 1992 1994 1996 1998 1990 1992
All series are seasonally adjusted. Latest series, February. Capacity is an index of potential industrial production.
Ratio scale,
_ Intermediate products
/ ^Construction supplies y ' S v ^ ' ^~f~
Hr^vv^ Business supplies
1 1 1 1 1 1 1 1 1
1992 =
^
100
-
-
_
Equipment
-
_ Defense and space
1 1 1 1
Business
1 1
Ratio scale,
I i I
1992 = 100
-
Materials
—
1
Durable goods
1
Ratio scale, 1992 =
^r^- ~
Nondurable goods and energy
1 1 I 1 1
100
-
—
135
125
115
105
- 95
175
160
145
130
115
- 100
- 85
1994 1996 1998
Digitized for FRASER http://fraser.stlouisfed.org/ Federal Reserve Bank of St. Louis
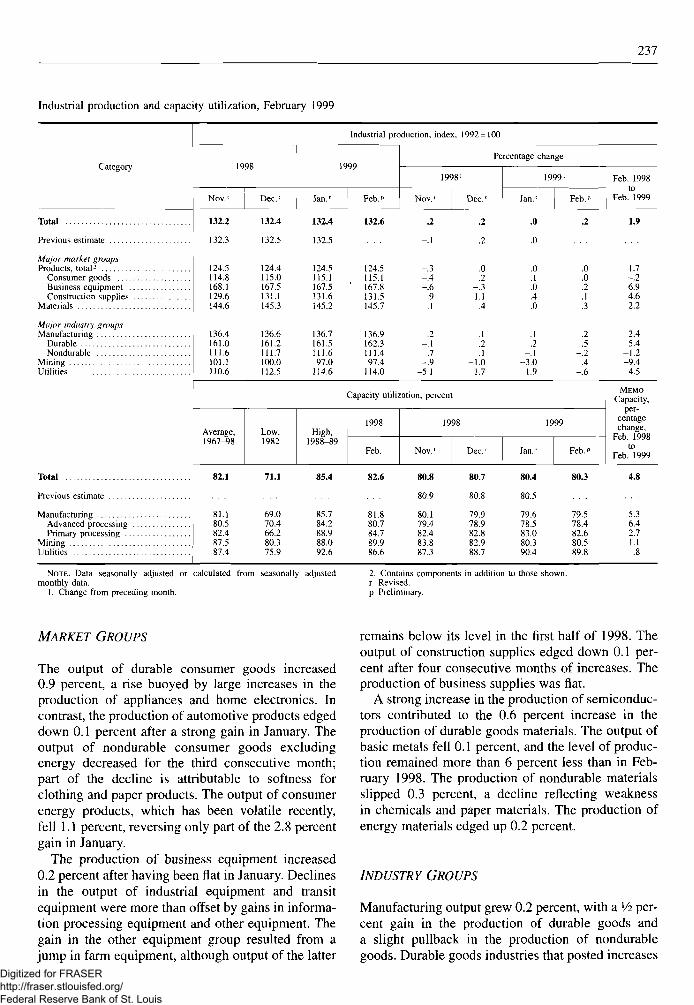
237
Industrial production and capacity utilization, February 1999
Category
Total
Previous estimate
Major market groupsProducts, total2
Construction suppliesMaterials
Major industry groupsManufacturing
DurableNondurable
Utilities
Total
Primary processingMiningUtilities
1998
Nov.'
132.2
132.3
124.5114.8168.1129.6144.6
136.4161.0111.6101.1110.6
Average,1967-98
82.1
81.180.582.487.587.4
Dec '
132.4
132.5
124.4115.0167.5131.1145.3
136.6161.2111.7100.0112.5
Low,1982
71.1
69.070.466.280.375.9
Jan.'
132.4
132.5
124.5115.1167.5131.6145.2
136.7161.5111.697.0
114.6
High,1988-89
85.4
85.784.288.988.092.6
Industrial production, index,
1999
Feb.?
132.6
124.5115.1
' 167.8131.5145.7
136.9162.3111.497.4
114.0
1998
Nov.'
-.2
— 1
-.3-.4-.6
.9
.1
2-.1
.7-.9
-5.1
Capacity utilization, percent
1998
Feb.
82.6
81.880.784.789.986.6
1998
Nov.'
80.8
80.9
80.179.482.483.887.3
1992=100
Percentage change
Dec '
.2
.2
.0
.2-.31.1.4
.1
.2
.1-1.0
1.7
Dec '
80.7
80.8
79.978.982.882.988.7
1999'
Jan.'
.0
.0
.0
.1
.0
.4
.0
.1
.2-.1
-3.01.9
1999
Jan.'
80.4
80.5
79.678.583.080.390.4
Feb.n
.2
.0
.0
.2-.1
.3
.2
.5-.2
.4-.6
Feb."
80.3
79.578.482.680.589.8
Feb. 1998
Feb. 1999
1.9
1.7_ 26.94.62.2
2.45.4
-1.2-9.4
4.5
MEMOCapacity,
per-centagechange,
Feb. 1998to
Feb. 1999
4.8
5.36.42.71.1.8
NOTE. Data seasonally adjusted or calculated from seasonally adjustedmonthly data.
1. Change from preceding month.
2. Contains components in addition to those shown,r Revised,p Preliminary.
MARKET GROUPS
The output of durable consumer goods increased0.9 percent, a rise buoyed by large increases in theproduction of appliances and home electronics. Incontrast, the production of automotive products edgeddown 0.1 percent after a strong gain in January. Theoutput of nondurable consumer goods excludingenergy decreased for the third consecutive month;part of the decline is attributable to softness forclothing and paper products. The output of consumerenergy products, which has been volatile recently,fell 1.1 percent, reversing only part of the 2.8 percentgain in January.
The production of business equipment increased0.2 percent after having been flat in January. Declinesin the output of industrial equipment and transitequipment were more than offset by gains in informa-tion processing equipment and other equipment. Thegain in the other equipment group resulted from ajump in farm equipment, although output of the latter
remains below its level in the first half of 1998. Theoutput of construction supplies edged down 0.1 per-cent after four consecutive months of increases. Theproduction of business supplies was flat.
A strong increase in the production of semiconduc-tors contributed to the 0.6 percent increase in theproduction of durable goods materials. The output ofbasic metals fell 0.1 percent, and the level of produc-tion remained more than 6 percent less than in Feb-ruary 1998. The production of nondurable materialsslipped 0.3 percent, a decline reflecting weaknessin chemicals and paper materials. The production ofenergy materials edged up 0.2 percent.
INDUSTRY GROUPS
Manufacturing output grew 0.2 percent, with a V2 per-cent gain in the production of durable goods anda slight pullback in the production of nondurablegoods. Durable goods industries that posted increases
Digitized for FRASER http://fraser.stlouisfed.org/ Federal Reserve Bank of St. Louis
238 Federal Reserve Bulletin • April 1999
in production included furniture and fixtures, indus-trial machinery, electrical machinery, and instru-ments. Those in which output fell included lumber;aircraft, which continued to edge down from the veryhigh level achieved last year; and motor vehicles andparts, which slipped again although remaining at ahigh level. The production of nondurable goodsedged down 0.2 percent after having declined 0.1 per-cent in January. Losses were widespread; gains wereposted in tobacco products, chemicals, and rubberand plastic products. Mining production increased, asgains in coal output outweighed losses elsewhere.
The factory operating rate slid 0.1 percentagepoint, to 79.5 percent—2 lA percentage points belowthe level of February 1998. The utilization rate foradvanced-processing industries inched down just0.1 percentage point, while the utilization rate forprimary-processing industries fell 0.4 percentagepoint. The utilization rate for mines edged up 0.2 per-centage point but remained well below its long-termaverage. Temperatures were relatively warm, as hasbeen the case all winter, and the operating rate forutilities dipped to 89.8 percent.
NOTICE
The capacity estimates in this month's release incor-porate a small change in the method used to interpo-late the annual estimates of capacity growth to themonthly frequency. The previous monthly capacityfigures were computed assuming that capacity growthis constant from the beginning of a year to the end,with potentially abrupt changes in growth ratesbetween the last months of one year and the firstmonths of the next. The new procedure allows capac-ity growth rates to change smoothly over time; it hasbeen applied to data beginning with October 1998. Atthe most detailed industry level, the new capacityestimates maintain the same fourth quarter overfourth quarter growth rates that were calculated underthe previous procedure. Table 4 now shows fourthquarter over fourth quarter growth rates instead ofDecember over December rates. •
Digitized for FRASER http://fraser.stlouisfed.org/ Federal Reserve Bank of St. Louis
239
Statements to the Congress
Statement by Edward M. Gramlich, Member, Boardof Governors of the Federal Reserve System, beforethe Committee on Finance, U.S. Senate, February 9,1999.
(Governor Gramlich presented identical testimonybefore the Committee on Ways and Means, U.S. Houseof Representatives, February 23, 1999.)
I appreciate the opportunity to appear before youtoday to discuss social security reform. I speak formyself, as past chair of the 1994-1996 QuadrennialAdvisory Council on Social Security, and not in mycurrent status as a member of the Federal ReserveBoard.
As you are all well aware, the U.S. population isaging. Today there are 3.4 workers per retiree; by2030 it is projected that there will be only two. Thisfundamental change in the demographics of ourpopulation poses a large challenge: How can weprovide adequate health and retirement benefits toour retired population without imposing undue bur-dens on tomorrow's workers?
Clearly, the answer to this question is that we mustact now to increase the total amount of resources tobe available in the future. By increasing the size ofour economy, we can devote a greater share of outputto the retired population without reducing the con-sumption of the working population. The only way toachieve this critical objective is for us to build up thestock of productive capital by increasing our rateof national saving. Indeed, in the current expansion,investment has expanded at a rapid clip withoutinducing a rise in interest rates. This investmentboom, and the accompanying step-up in the growthof the capital stock, is partly attributable to anincreased rate of national saving. Between 1992 and1998, national saving increased from 3.7 percent to7.5 percent of net national product. While private andstate and local government saving actually dippedduring this period, this decline was more than offsetby increased saving by the federal governmentthrough deficit reduction.
The stellar performance of the economy overrecent years provides the nation a unique opportunityto begin to tackle its long-run problems. In particular,the large budget surpluses that are projected over
the next fifteen years or so, if they are permitted tomaterialize, will significantly improve our fiscal andeconomic position as the baby boom starts to retire.From the government's perspective, using those sur-pluses to pay down the federal debt will reduce futureinterest payments and free up future tax revenue;from the macroeconomic perspective, the increase innational saving represented by the increase in govern-ment saving will lead to a larger capital stock, higherproductivity, and an improved standard of living.
From this standpoint, the broad objective of theClinton Administration's budget—that is, to preservemost of the projected surpluses—seems to me bothresponsible and appropriate. The Administrationwould devote about $1.4 trillion of the projected$4.9 trillion of current law surpluses over the nextfifteen years to new spending and use the remainderto pay down our national debt. According to theAdministration's calculations, the ratio of debt heldby the public to gross domestic product would fallfrom its current 44 percent to 7 percent by 2014. Ifsuch an outcome were to materialize, it would repre-sent a dramatic improvement in the fiscal position ofthe nation.
Under current law, the social security revenuesexceed outlays, creating surpluses that are credited tothe social security trust fund. Without any legislativechanges, the social security trust fund will continueto accumulate funds, reaching a peak in 2020 of$3.8 trillion, or almost 16 percent of GDP. Thesesurpluses both reduce the national debt and improvethe long-run fiscal condition of social security. Thisclaim does not stem from any accounting gimmickry:By reducing future interest payments, these surplusesdo indeed free up future revenues.
In addition to this accumulation already scheduledunder current law, the Administration is proposingto transfer $2.8 trillion of general revenues to thesocial security trust fund. While the Administration'srationale for these transfers is to ensure that thesurpluses actually materialize, the transfer of generalrevenues represents a major shift from past practice,under which social security has been financed almostentirely from dedicated payroll taxes.
During the deliberations of the 1994-1996 Qua-drennial Advisory Council on Social Security, weconsidered whether general revenues should be used
Digitized for FRASER http://fraser.stlouisfed.org/ Federal Reserve Bank of St. Louis
240 Federal Reserve Bulletin • April 1999
to help shore up the social security program. Thisidea was unanimously rejected, for a number of rea-sons. First, using general revenues to fund socialsecurity puts the social security system in competi-tion with other spending programs during the budgetcycle. But social security is a long-range program—people pay dedicated taxes today toward benefits thatmay not be received for thirty or forty years—andmany feel that it should not be part of an annualbudgetary allocation process.
Perhaps more important, using general revenues tofund social security undermines the fiscal disciplineimposed by the need to ensure that income earmarkedfor social security is sufficient to meet the entire costof the program, both in the short run and long run.Without a long-range budget constraint on socialsecurity, it will be much more difficult to limit futurebenefit growth. And, notwithstanding the large sur-pluses being projected, some reductions in benefitsare almost certain to be necessary as the U.S. popula-tion ages.
It is important to remember that the aging of thepopulation will bring pressures to programs otherthan social security. The trustees of the Medicaretrust fund project that Medicare expenditures as a
share of GDP will more than double—from 2.7 per-cent today, to more than 5.8 percent in 2030, andMedicaid spending on long-term care likely will facesimilar increases. Because under the current budgetsystem, Medicare Part B and Medicaid are financedwith general revenues, there is much less pressure totake measures now to improve their long-run financ-ing. But these programs too will put significantdemands on government resources in the future. Ifwe use the projected surpluses as a rationale for notmaking hard choices in social security, finding theresources to provide Medicare and Medicaid to ouraging population will prove that much harder.
Thus, there are serious drawbacks to relaxingsocial security's long-run budget constraint throughgeneral revenue transfers. I would prefer social secu-rity reforms that maintain the link between dedicatedtaxes and benefits and maintain the value of long-range actuarial analysis. This discipline is essential ifwe are to limit the impending explosion of entitle-ment spending. The President's budget proposal, bypreserving future surpluses and paying down ournational debt, makes an important contribution toraising national saving. But to me the proposal lookseven better without the general revenue transfer.
Statement by Alan Greenspan, Chairman, Board ofGovernors of the Federal Reserve System, before theCommittee on Banking and Financial Services, U.S.House of Representatives, February 11, 1999
It is a pleasure to appear before the committee topresent the views of the Federal Reserve on the needto enact legislation to modernize the U.S. financialsystem. The Federal Reserve continues to supportstrongly the enactment of such legislation andbelieves that H.R. 10 contains the fundamental prin-ciples that should be included in such legislation.I commend the committee for taking up this vitalmatter so promptly.
THE NEED FOR FINANCIAL REFORM
U.S. financial institutions are today among the mostinnovative and efficient providers of financial ser-vices in the world. They compete, however, in amarketplace that is undergoing major and fundamen-tal change driven by a revolution in technology, bydramatic innovations in the capital markets, and bythe globalization of the financial markets and thefinancial services industry.
For these reasons, we support, as we have formany years, major revisions, such as those includedin H.R. 10, to the Glass-Steagall Act and the BankHolding Company Act to remove the legislative bar-riers against the integration of banking, insurance,and securities activities. There is virtual unanimityamong all concerned—private and public alike—thatthese barriers should be removed. The technologi-cally driven proliferation of new financial productsthat enable risk unbundling have been increasinglycombining the characteristics of banking, insurance,and securities products into single financial instru-ments. These changes, which are occurring all overthe world, have also dramatically altered the wayfinancial services providers operate and the way theydeliver their products.
In the United States, our financial institutions havebeen required to take elaborate steps to develop anddeliver new financial products and services in a man-ner that is consistent with our outdated laws. Thecosts of these efforts are becoming increasingly bur-densome and serve no useful public purpose. Unlesssoon repealed, the archaic statutory barriers to effi-ciency could undermine the global dominance ofAmerican finance, as well as the continued competi-tiveness of our financial institutions and their ability
Digitized for FRASER http://fraser.stlouisfed.org/ Federal Reserve Bank of St. Louis
Statements to the Congress 241
to innovate and to provide the best and broadestpossible services to U.S. consumers.
We believe that it is important that the rules for ourfinancial services industry be set by the Congressrather than, as too often has been the case, by bank-ing regulators dealing with our outdated laws. Onlythe Congress has the ability to fashion rules that arecomprehensive and equitable to all participants andthat guard the public interest.
The market will continue to force change whetheror not the Congress acts. Without congressionalaction, changes will occur through exploitation ofloopholes and marginal interpretations of the law thatcourts feel obliged to sanction. This type of responseto market forces leads to inefficiencies and inconsis-tencies, expansion of the federal safety net, poten-tially increased risk exposure to the federal depositinsurance funds, and a system that will undermine thecompetitiveness and innovative edge of major seg-ments of our financial services industry. Delay inacting on financial modernization legislation limitsthe Congress's options as these developments prolif-erate and complicate, increases the difficulty of enact-ing the safeguards included in H.R. 10 to protectsafety and soundness and the public interest, anddenies to consumers the benefits that immediatechanges in our outdated banking laws will surelybring.
H.R. 10 also recognizes another dimension of thechanging nature of banking and financial markets:that financial modernization means more than autho-rizing new powers and affiliations. Not only are weexperiencing a revolution in financial products andtheir delivery, but the United States is also at ahistoric crossroads in financial services regulation. Itis becoming increasingly evident that the dramaticadvances in computer and telecommunications tech-nologies of the past decade have so significantlyaltered the structure of domestic, indeed, globalfinance as to render our existing modes of supervi-sion and regulation of financial institutions increas-ingly obsolescent.
The volume, sophistication, and rapidity of finan-cial dealings will inevitably lead to supervisoryemphasis on oversight of risk management of finan-cial institutions and a marked scaling back of out-moded loan file and balance sheet surveillance. Aswe move into the twenty-first century, the remnantsof nineteenth-century bank examination philosophieswill fall by the wayside. Banks, of course, will stillneed to be supervised and regulated, in no small partbecause they are subject to the safety net. My pointis, however, that the nature and extent of that effortneed to become more consistent with market reali-
ties. Moreover, affiliation with banks need not—indeed, should not—create bank-like regulation ofaffiliates of banks.
This shift in supervisory mode, which is alreadyunder way, is market driven. It is not the resultof some potentially reversible ideology. Such anapproach is captured in H.R. 10 in many of theso-called "Fed-light" provisions, and we at the Fedstrongly support this approach.
H.R. 10 also, in our judgment, has chosen theappropriate structure to combine banking, securities,and insurance firms using financial service holdingcompanies. While we enthusiastically support thenew powers granted to financial service holding com-panies, we just as strongly believe that they shouldbe financed by the marketplace, not by instrumentsbacked by the sovereign credit of the United States.The requirement that the new powers be conductedthrough holding company affiliates minimizes theexpansion of the use of the subsidies arising from asafety net backed by the U.S. taxpayer and serves topromote the safety and soundness and stability of ourbanking and financial system.
The rejection of expanded powers for subsidiariesof commercial banks, at least those conducted asprincipal, is a decision that will inhibit the wide-spread employment of federal subsidies over a widerange of activities. These activities, if conducted inbank subsidiaries, would accord banking organiza-tions an unfair competitive advantage over compa-rable insurance and securities firms operating inde-pendently or as bank holding company subsidiaries.
Even more important, to inject the substantial newsubsidies that would accrue to operating subsidiariesof banks into the currently mushrooming domesticand international financial system could distort capi-tal markets and the efficient allocation of both finan-cial and real resources that has been so central toAmerica's current prosperity. The choice of requiringthe new powers to be harbored in affiliates of hold-ing companies, not in the so-called op-subs of theirbanks, will significantly fashion the underlying struc-ture of twenty-first-century finance.
Another twenty-first-century issue is whether weshould move beyond affiliations among financial ser-vice providers and allow the full integration of bank-ing and commerce. As technology increasingly blursthe distinction among various financial products, itis already beginning to blur the distinctions betweenpredominately commercial and banking firms. Wecannot rule out whether sometime in our future fullintegration may occur, potentially with increased effi-ciencies. But how the underlying subsidies of depositinsurance, discount window access, and guaranteed
Digitized for FRASER http://fraser.stlouisfed.org/ Federal Reserve Bank of St. Louis
242 Federal Reserve Bulletin • April 1999
final settlement through Fedwire are folded into acommercial firm, should the latter purchase a bank, iscrucially important to the systemic stability of ourfinancial system.
It seems to us wise to move first toward the integra-tion of banking, insurance, and securities as envi-sioned in H.R. 10 and employ the lessons we learnfrom that important step before we consider whetherand under what conditions it would be desirable tomove to the second stage of the full integration ofcommerce and banking. Nothing is lost, in my judg-ment, by making this a two-stage process. Indeed,there is much to be gained. The Asian crisis last yearhighlighted some of the risks that can arise if relation-ships between banks and commercial firms are tooclose and make caution at this stage prudent in ourjudgment. In line with these considerations, the Boardcontinues to support elimination of the unitary thriftloophole, which currently allows any type of com-mercial firm to control a federally insured depositoryinstitution.
These principles, which we see as fundamental tofinancial modernization, are embodied in H.R. 10. Asin all such major legislation, there are, and will be,numerous provisions only indirectly associated withthe legislation's core principles that often foster dis-agreements. These surrounding details are doubtlessimportant, but not so important that they should beallowed to defeat the consensus that has developedaround the key principles embodied in H.R. 10. Itwould be a disservice to the public and the nation if,in the fruitless search for a bill that pleases everyonein every detail, the benefits of this vital consensus arelost or further delayed.
The decision to use the holding company structure,and not the universal bank, as the appropriate struc-ture to allow new securities and insurance affiliationsis strongly driven by several key principles embodiedin H.R. 10. These principles include that new powersand affiliations should be financed by the market andnot by the sovereign credit of the United States, andthat supervision of nonbank affiliates must not use theexhaustive bank examination method.
Importantly, that decision also prevents the spreadof the safety net that would inevitably lead to aweakening of the competitive strength of large seg-ments of our financial services industry because thosesecurities, insurance, and other financial services pro-viders that do not operate as subsidiaries of bankswould be at a serious disadvantage to similar firmsowned by banks. By fostering a level playing fieldwithin the financial services industry, we contributeto full, open, and fair competition as we enter thenext century.
This choice of the holding company structure isalso critical to the way in which the financial servicesindustry will develop because it provides better pro-tection for, and promotes the safety and soundness of,our banking and financial system without damagingthe national or state bank charters or limiting in anyway the benefits of financial modernization. Theother route toward full-powered commercial bankoperating subsidiaries and universal banking would,in our judgment, lead to greater risk for the depositinsurance funds and the taxpayer. It is for thesereasons that the Federal Reserve, Securities andExchange Commission, many state functional regula-tors, and many in the affected industries have sup-ported the holding company framework and haveopposed the universal bank approach.
In virtually every other industry, the Congresswould not be asked to address issues such as these,which are associated with technological and marketdevelopments; the market would force the necessaryinstitutional adjustments. Arguably, this differencereflects the painful experience that has taught us thatdevelopments in our banking system can have pro-found effects on the stability of our whole economy,rather than the limited impact we perceive from diffi-culties in most other industries.
Moreover, as a society we have made the choice tocreate a safety net for depository institutions, notonly to protect the public's deposits but also to mini-mize the impact of adverse banking developments onour economy. Although we have clearly been suc-cessful in doing so, the safety net has predictablyshielded bank shareholders from the full conse-quences of the risks their banks take. Moreover, sincethe sovereign credit of the United States fosters thestability of the banking system and guarantees theclaims of insured depositors, bank creditors do notapply the same self-interest monitoring of banks toprotect their own position as they would withoutdiscount window access and deposit insurance. As aconsequence, to redress the balance of risk-taking,entities with access to the safety net are requiredto be supervised and regulated. In this way, theU.S. government protects its own—that is, thetaxpayers'—interest, which is the cost of makinggood on the guarantee.
Put another way, the safety net requires that thegovernment replace with law, regulation, and super-vision much of the disciplinary role that the marketplays for other businesses. Our experience in the1980s with insured thrift institutions illustrates thenecessity of avoiding expanding risks to the depositinsurance funds and lax supervisory policies andrules. But this necessity has an obvious downside:
Digitized for FRASER http://fraser.stlouisfed.org/ Federal Reserve Bank of St. Louis
Statements to the Congress 243
These same rules limit innovative responses and theability to take the risks so necessary for economicgrowth. The last thing we should want, therefore, isto widen or spread this unintended, but neverthelesscorrosive, dimension of the safety net to other finan-cial and business entities and markets. It is clear thatto do so would not only spread a subsidy to newforms of risk-taking but would ultimately require theexpansion of bank-like supervision as well.
In our judgment, the holding company approachupon which H.R. 10 is premised avoids this pitfall;the universal bank approach cannot.
While financial modernization represents muchneeded reform, we should not forget that this modern-ization will, by itself, introduce dramatic changes inour financial services industry. We feel confident thatthe risks of this type of reform are manageable withinthe holding company framework set out in H.R. 10.
There is a final point I want to make because itappears to have driven Treasury's opposition to lastyear's version of H.R. 10. H.R. 10 would not dimin-ish the ability of the executive branch to continue toplay its meaningful role in the development of bank-ing or economic policy. Currently, the executivebranch influences such policy primarily through itssupervision of national banks and federal savingsassociations. H.R. 10 would not alter the executivebranch's supervisory authority for national banks orfederal savings associations, nor would it result inany reduction in the predominant and growing shareof this nation's banking assets controlled by nationalbanks and federal savings associations. Indeed, as ofSeptember 1998, nearly 58 percent of all banking
assets were under the supervision of the Comptrollerof the Currency, up from 55.2 percent at the end of1996. Moreover, after controlling for mergers of like-chartered banks, the number of national banks hasincreased over the period 1996-98 and the number ofstate banks has declined.
Furthermore, the Congress for sound public policyreasons has purposefully apportioned responsibilityfor this nation's financial institutions among theelected executive branch and independent regulatoryagencies. H.R. 10 retains this balance, and the Fed-eral Reserve does not believe it would serve anyuseful purpose to alter it. Such action would becontrary to the deliberate steps that the Congress hastaken to ensure a proper balance in the regulation ofthis nation's dual banking system.
CONCLUSION
The markets are demanding that we change outdatedstatutory limitations that stand in the way of moreefficiently and effectively delivering financial ser-vices to the public. Many of these changes will occureven if the Congress does not act, but only theCongress can establish the ground rules designed toensure the maximum net public benefits, protect thesafety and soundness of our financial system, create afair and level playing field for all participants, andensure the continued primacy of U.S. financial mar-kets. For these reasons, the Federal Reserve supportsand urges prompt enactment of the financial modern-ization contained in H.R. 10.
Statement by Alan Greenspan, Chairman, Board ofGovernors of the Federal Reserve System, before theCommittee on Banking, Housing, and Urban Affairs,U.S. Senate, February 23, 1999.
(Chairman Greenspan presented identical testimonybefore the Committee on Banking and Financial Ser-vices, U.S. House of Representatives, February 24,1999.)
I appreciate the opportunity to present the FederalReserve's semiannual report on monetary policy.
The U.S. economy over the past year again per-formed admirably. Despite the challenges presentedby severe economic downturns in a number of for-eign countries and episodic financial turmoil abroadand at home, our real gross domestic product grew
about 4 percent for a third straight year. In 1998,2% million jobs were created on net, bringing thetotal increase in payrolls to more than 18 millionduring the current economic expansion, which latelast year became the longest in U.S. peacetime his-tory. Unemployment edged down further to a 4 ]A per-cent rate, the lowest since 1970.
And despite taut labor markets, inflation also fellto its lowest rate in many decades by some broadmeasures, although a portion of this decline owed todecreases in oil, commodity, and other import pricesthat are unlikely to be repeated. Hourly labor com-pensation adjusted for inflation posted further impres-sive gains. Real compensation gains have been sup-ported by robust advances in labor productivity,which in turn have partly reflected heavy investmentin plant and equipment, often embodying innovativetechnologies.
Digitized for FRASER http://fraser.stlouisfed.org/ Federal Reserve Bank of St. Louis
244 Federal Reserve Bulletin • April 1999
Can this favorable performance be sustained? Inmany respects the fundamental underpinnings of therecent U.S. economic performance are strong. Flex-ible markets and the shift to surplus on the books ofthe federal government are facilitating the buildupin cutting-edge capital stock. That buildup in turnis spawning rapid advances in productivity that arehelping to keep inflation well behaved. The newtechnologies and the optimism of consumers andinvestors are supporting asset prices and sustainingspending.
But after eight years of economic expansion, theeconomy appears stretched in a number of dimen-sions, implying considerable upside and downsiderisks to the economic outlook. The robust increase ofproduction has been using up our nation's spare laborresources, suggesting that recent strong growth inspending cannot continue without a pickup in infla-tion unless labor productivity growth increases sig-nificantly further. Equity prices are high enough toraise questions about whether shares are overvalued.The debt of the household and business sectors hasmounted, as has the external debt of the country as awhole, reflecting the deepening current account defi-cit. We remain vulnerable to rapidly changing condi-tions overseas, which, as we saw last summer, can betransmitted to U.S. markets quickly and traumati-cally. I will be commenting on many of these issuesas I review the developments of the past year and theprospects going forward. In light of all these risks,monetary policy must be ready to move quickly ineither direction should we perceive imbalances anddistortions developing that could undermine the eco-nomic expansion.
RECENT DEVELOPMENTS
A hallmark of our economic performance over thepast year was the continuing sharp expansion ofbusiness investment spending. Competitive globalmarkets and persisting technological advances bothspurred the business drive to become more efficientand induced the price declines for many types ofnew equipment that made capital spending moreattractive.
Business success in enhancing productivity and theexpectation of still further, perhaps accelerated,advances buoyed public optimism about profit pros-pects, which contributed to another sizable boost inequity prices. Rising household wealth along withstrong growth in real income, related to better pay,slower inflation, and expanding job opportunities,
boosted consumption at the fastest clip in a decadeand a half. The gains in income and wealth last year,along with a further decrease in mortgage rates, alsoprompted considerable activity in the housing sector.
The impressive performance of the private sectorwas reflected in a continued improvement in thefederal budget. Burgeoning receipts, along with con-tinuing restraint on federal spending, produced thefirst unified budget surplus in thirty years, allowingthe Treasury to begin to pay down the federal debtheld by the public. This shift in the federal govern-ment's fiscal position has fostered an increase inoverall national saving as a share of GDP to 17'A per-cent from the 14'/2 percent low reached in 1993. Thisrise in national saving has helped to hold down realinterest rates and to facilitate the financing of theboom in private investment spending.
Foreign savers have provided an additional sourceof funds for vigorous domestic investment. The coun-terpart of our high and rising current account deficithas been ever-faster increases in the net indebtednessof U.S. residents to foreigners. The rapid wideningof the current account deficit has some disquietingaspects, especially when viewed in a longer-termcontext. Foreigners presumably will not want to raiseindefinitely the share of their portfolios in claimson the United States. Should the sustainability ofthe buildup of our foreign indebtedness come intoquestion, the exchange value of the dollar may welldecline, imparting pressures on prices in the UnitedStates.
In the recent economic environment, however, thewidening of the trade and current account deficits hadsome beneficial aspects. It provided a safety valvefor strong U.S. domestic demand, thereby helpingto restrain pressures on U.S. resources. It also cush-ioned, to some extent, economic weakness in ourtrading partners.
Moreover, decreasing import prices, which partlycame from the appreciation of the dollar throughmidsummer, contributed to low overall U.S. inflation,as did ample manufacturing capacity in the UnitedStates and lower prices for oil and other commoditiesstemming from the weak activity abroad. The markeddrop in energy prices significantly contributed tothe subdued, less than 1 percent, increase in the priceindex for total personal consumption expendituresduring 1998. In addition, supported by rapid accumu-lation of more efficient capital, the growth of laborproductivity picked up last year, allowing nominallabor compensation to post another sizable gain with-out putting added upward pressure on costs andprices. I shall return to an analysis of the extraor-dinary performance of inflation later in my remarks.
Digitized for FRASER http://fraser.stlouisfed.org/ Federal Reserve Bank of St. Louis
Statements to the Congress 245
The Federal Open Market Committee (FOMC)conducted monetary policy last year with the aim ofsustaining the remarkable combination of economicexpansion and low inflation. At its meetings fromMarch to July, the inflation risks accompanying thecontinued strength of domestic demand and the tight-ening of labor markets necessitated that the FOMCplace itself on heightened inflation alert. Althoughthe FOMC kept the nominal federal funds rateunchanged, it allowed the real funds rate to rise withcontinuing declines in inflation and, presumably,inflation expectations. In August, the FOMC returnedto an unbiased policy predilection in response to theadverse implications for the U.S. outlook of worsen-ing conditions in foreign economies and in globalfinancial markets, including our own.
Shortly thereafter, a further deterioration in finan-cial market conditions began to pose a more seri-ous threat to economic stability. In the wake of theRussian crisis and subsequent difficulties in otheremerging-market economies, investors perceived thatthe uncertainties in financial markets had broadenedappreciably, and as a consequence, they becamedecidedly more risk averse. Safe-haven demands forU.S. Treasury securities intensified at the expense ofprivate debt securities. As a result, quality spreadsescalated dramatically, especially for lower-ratedissuers. Many financial markets turned illiquid, withwider bid-asked spreads and heightened price volatil-ity, and issuance was disrupted in some private secu-rities markets. Even the liquidity in the market forseasoned issues of U.S. Treasury securities dried up,as investors shifted toward the more actively traded,recently issued securities and dealers pared inven-tories, fearing that heightened price volatility posedan unacceptable risk to their capital.
Responding to losses in foreign financial marketsand to pressures from counterparties, highly lever-aged investors began to unwind their positions, whichfurther weighed on market conditions. As creditbecame less available to business borrowers in capi-tal markets, their demands were redirected to com-mercial banks, which reacted to the enlarged bor-rowing and more uncertain business prospects bytightening their standards and terms on such lending.
To cushion the domestic economy from the impactof the increasing weakness in foreign economies andthe less accommodative conditions in U.S. financialmarkets, the FOMC, beginning in late September,undertook three policy easings. By mid-November,the FOMC had reduced the federal funds rate from5V2 percent to 43/4 percent. These actions were takento rebalance the risks to the outlook, and, in theevent, the markets have recovered appreciably. Our
economy has weathered the disturbances withremarkable resilience, though some yield and bid-asked spreads still reflect a hesitancy on the partof market participants to take on risk. The FederalReserve must continue to evaluate, among otherissues, whether the full extent of the policy easingsundertaken last fall to address the seizing-up of finan-cial markets remains appropriate as those distur-bances abate.
To date, domestic demand and hence employmentand output have remained vigorous. Real GDP isestimated to have risen at an annual rate exceeding5!/2 percent in the fourth quarter of last year.Although some slowing from this torrid pace is mostlikely in the first quarter, labor markets remain excep-tionally tight, and the economy evidently retains agreat deal of underlying momentum despite theglobal economic problems and the still-visible rem-nants of the earlier financial turmoil in the UnitedStates. At the same time, no evidence of any upturnin inflation has, as yet, surfaced.
Abroad the situation is mixed. In some East Asiancountries that, in recent years, experienced a loss ofinvestor confidence, a severe currency depreciation,and a deep recession, early signs of stabilization andeconomic recovery have appeared. This is particu-larly the case for Korea and Thailand. Authorities inthose countries, in the context of International Mone-tary Fund (IMF) stabilization programs, early onestablished appropriate macroeconomic policies andundertook significant structural reforms to buttressthe banking system and repair the finances of thecorporate sector. As investor confidence has returned,exchange rates have risen and interest rates havefallen. With persistence and follow-through onreforms, the future of those economies has promise.
The situations in some other emerging marketeconomies are not as encouraging. The Russian gov-ernment's decision in mid-August to suspend pay-ments on its domestic debt and devalue the ruble tookmarkets by surprise. Investor flight exacerbated thecollapse of prices in Russian financial markets andled to a sharp depreciation of the ruble. The earlierdecline in output gathered momentum, and by latein the year, inflation had moved up to a triple-digitannual rate. Russia's stabilization program with theIMF has been on hold since the financial crisis hit,and the economic outlook there remains troubling.
The Russian financial crisis immediately spilledover to some other countries, hitting Latin Americaespecially hard. Countering downward pressure onthe exchange values of the affected currencies, inter-est rates moved sharply higher, especially in Brazil.As a consequence of the high interest rates and
Digitized for FRASER http://fraser.stlouisfed.org/ Federal Reserve Bank of St. Louis
246 Federal Reserve Bulletin • April 1999
growing economic uncertainty, Brazil's economicactivity took a turn for the worse. Higher interestrates also had negative consequences for the fiscaloutlook, as much of Brazil's substantial domesticdebt effectively carries floating interest rates. Withbudget reform legislation encountering various set-backs, market confidence waned further and capitaloutflows from Brazil continued, drawing down for-eign currency reserves. Ultimately, the decision wastaken to allow the real to float, and it subsequentlydepreciated sharply.
Brazilian authorities must walk a very narrow,difficult path of restoring confidence and keepinginflation contained with monetary policy while deal-ing with serious fiscal imbalances. Although the sit-uation in Brazil remains uncertain, there has beenlimited contagion to other countries thus far. Appar-ently, the slow onset of the crisis has enabled manyparties with Brazilian exposures to hedge those posi-tions or allow them to run off. With the net exposuresmaller, and increasingly held by those who bothrecognized the heightened risk and were willing tobear it, some of the elements that might have contrib-uted to further contagion may have been significantlyreduced.
THE ECONOMIC OUTLOOK
These recent domestic and international develop-ments provide the backdrop for U.S. economic pros-pects. Our economy's performance should remainsolid this year, though likely with a slower pace ofeconomic expansion and a slightly higher rate ofoverall inflation than last year. The stocks of businessequipment, housing, and household durable goodshave been growing rapidly to quite high levels rela-tive to business sales or household incomes duringthe past few years, and some slowing in the growth ofspending on these items seems a reasonable prospect.Moreover, part of the rapid increase in spending,especially in the household sector, has resulted fromthe surge in wealth associated with a run-up in equityprices that is unlikely to be repeated. And the pur-chasing power of income and wealth has beenenhanced by declines in oil and other import prices,which also are unlikely to recur this year. Assumingthat aggregate demand decelerates, underlying infla-tion pressures, as captured by core price measures, inall likelihood will not intensify significantly in theyear ahead, though the Federal Reserve will need tomonitor developments carefully. We perceive stableprices as optimum for economic growth. Both infla-tion and deflation raise volatility and risks that thwartmaximum economic growth.
Most governors and Reserve Bank presidents fore-see that economic growth this year will slow to a2'/2 percent to 3 percent rate. Such growth wouldkeep the unemployment rate about unchanged. Thecentral tendency of the governors' and presidents'predictions of consumer price index (CPI) inflationis 2 percent to IVz percent. This level represents apickup from last year, when energy prices were fall-ing, but it is in the vicinity of core CPI inflation overthe last couple of years.
This outlook involves several risks. The continuingdownside risk posed by possible economic and finan-cial instability around the world was highlighted ear-lier this year by the events in Brazil. Although finan-cial contagion elsewhere has been limited to date,more significant knock-on effects in financial marketsand in the economies of Brazil's important tradingpartners, including the United States, are still pos-sible. Moreover, the economies of several of our keyindustrial trading partners have shown evidence ofweakness, which if it deepens could further depressdemands for our exports.
Another downside risk is that growth in capitalspending, especially among manufacturers, couldweaken appreciably if pressures on domestic profitmargins mount and capacity utilization drops further.And it remains to be seen whether corporate earningswill disappoint investors, even if the slowing of eco-nomic growth is only moderate. Investors appear tohave incorporated into current equity price levelsboth robust profit expectations and low compensationfor risk. As the economy slows to a more sustainablepace as expected, profit forecasts could be paredback, which together with a greater sense of vulner-ability in business prospects could damp appetites forequities. A downward correction to stock prices andan associated increase in the cost of equity capitalcould compound a slowdown in the growth of capitalspending. In addition, a stock market decline wouldtend to restrain consumption spending through itseffect on household net worth.
But on the upside, our economy has proved surpris-ingly robust in recent years. More rapid increases incapital spending, productivity, real wages, and assetprices have combined to boost economic growth farmore and far longer than many of us would haveanticipated.
This "virtuous cycle" has been able to persistbecause the behavior of inflation has also been sur-prisingly favorable, remaining well contained at lev-els of utilization of labor that in the past would haveproduced accelerating prices. That it has not done soin recent years has been the result of a combinationof special one-time factors holding down prices and
Digitized for FRASER http://fraser.stlouisfed.org/ Federal Reserve Bank of St. Louis
Statements to the Congress 247
more lasting changes in the processes determininginflation.
Among the temporary factors, the sizable declinesin the prices of oil, other internationally traded com-modities, and other imports contributed directly toholding down inflation last year and also indirectlyby reducing inflation expectations. But these pricesare not likely to fall further, and they could begin torise as some Asian economies revive and the effectsof the net depreciation of the dollar since midsummerare felt more strongly.
At the same time, however, recent experience doesseem to suggest that the economy has become lessinflation prone than in the past, so that the chancesof an inflationary breakout arguably are, at least fornow, less than they would have been under similarconditions in earlier cycles.
Several years ago 1 suggested that worker inse-curity might be an important reason for unusuallydamped inflation. From the early 1990s through 1996,survey results indicated that workers were becomingmuch more concerned about being laid off. Workers'underlying fear of technology-driven job obsoles-cence, and hence willingness to stress job securityover wage increases, appeared to have suppressedlabor cost pressures despite a reduced unemploy-ment rate. More recently, that effect seems to havediminished in part. So while job loss fears probablycontributed to wage and price suppression through1996, it does not appear that a further heightening ofworker insecurity about employment prospects canexplain the more recent improved behavior ofinflation.
Instead, a variety of evidence, anecdotal and other-wise, suggests that the source of recent restrainedinflation may be emanating more from employersthan from employees. In the current economic set-ting, businesses sense that they have lost pricingpower and generally have been unwilling to raisewages any faster than they can support at currentprice levels. Firms have evidently concluded thatif they try to increase their prices, their competitorswill not follow, and they will lose market share andprofits.
Given the loss of pricing power, it is not surprisingthat individual employers resist pay increases. Butwhy has pricing power of late been so delimited?Monetary policy certainly has played a role in con-straining the rise in the general level of prices anddamping inflation expectations over the 1980s and1990s. But our current discretionary monetary policyhas difficulty anchoring the price level over time inthe same way that the gold standard did in the lastcentury.
Enhanced opportunities for productive capitalinvestment to hold down costs also may have helpedto damp inflation. Through the 1970s and 1980s,firms apparently found it easier and more profitableto seek relief from rising nominal labor costs throughprice increases than through cost-reducing capitalinvestments. Price relief evidently has not been avail-able in recent years. But relief from cost pressureshas. The newer technologies have made capitalinvestment distinctly more profitable, enabling firmsto substitute capital for labor far more productivelythan they would have a decade or two ago.
Starting in 1993, capital investment, especially inhigh-tech equipment, rose sharply beyond normalcyclical experience, apparently the result of expectedincreases in rates of return on the new investment.Had the profit expectations not been realized, onewould have anticipated outlays to fall back. Instead,their growth accelerated through the remainder of thedecade.
More direct evidence confirms improved under-lying profitability. According to rough estimates,labor and capital productivity has risen significantlyduring the past five years. It seems likely that thesynergies of advances in laser, fiber optic, satellite,and computer technologies with older technologieshave enlarged the pool of opportunities to achieve arate of return above the cost of capital. Moreover, thenewer technologies have facilitated a dramatic fore-shortening of the lead times on the delivery of capitalequipment over the past decade, presumably allowingbusinesses to react more expeditiously to an actual orexpected rise in nominal compensation costs than,say, they could have in the 1980s. In addition, thesurge in investment not only has restrained costs, buthas also increased industrial capacity faster thanfactory output has risen. The resulting slack in prod-uct markets has put greater competitive pressure onbusinesses to hold down prices, despite taut labormarkets.
The role of technology in damping inflation ismanifest not only in its effects on U.S. productivityand costs but also through international trade, wheretechnological developments have progressivelybroken down barriers to cross-border trade. Theenhanced competition in tradable goods has enabledexcess capacity previously bottled up in one countryto augment worldwide supply and exert restraint onprices in all countries' markets. The resulting pricediscipline also has constrained nominal wage gainsin internationally tradable goods industries. As work-ers have attempted to shift to other sectors, gains innominal wages and increases in prices in nontrade-able goods industries have been held down as well.
Digitized for FRASER http://fraser.stlouisfed.org/ Federal Reserve Bank of St. Louis
248 Federal Reserve Bulletin • April 1999
The process of price containment has potentiallybecome, to some extent, self-reinforcing. Lowerinflation in recent years has altered expectations.Workers no longer believe that escalating gainsin nominal wages are needed to reap respectableincreases in real wages, and their remaining sense ofjob insecurity is reinforcing this. Because neitherfirms nor their competitors can count any longer ona general inflationary tendency to validate decisionsto raise their own prices, each company feels com-pelled to concentrate on efforts to hold down costs.The availability of new technology to each com-pany and its rivals affords both the opportunity andthe competitive necessity of taking steps to boostproductivity.
It is difficult to judge whether these significantshifts in the market environment in which firms func-tion are sufficient to account for our benign overallprice behavior during the past half decade. Undoubt-edly, other factors have been at work as well, includ-ing those temporary factors I mentioned earlier andsome more lasting I have not discussed, such asworldwide deregulation and privatization, and thefreeing-up of resources previously employed to pro-duce military products that was brought about by theend of the cold war. There also may be other con-tributory forces lurking unseen in the wings that willonly become clear in time. Over the longer run, ofcourse, the actions of the central bank determine thedegree of overall liquidity and hence rate of inflation.It is up to us to validate the favorable inflationdevelopments of recent years.
Although the pace of productivity increase haspicked up in recent years, the extraordinary strengthof demand has meant that the substitution of capitalfor labor has not prevented us from rapidly depletingthe pool of available workers. This worker depletionconstitutes a critical upside risk to the inflation out-look because it presumably cannot continue for verymuch longer without putting increasing pressure onlabor markets and on costs.
The number of people willing to work can beusefully defined as the unemployed component of thelabor force plus those not actively seeking work, andthus not counted in the labor force, but who nonethe-less say they would like a job if they could get one.This pool of potential workers aged sixteen to sixty-four currently numbers about 10 million, or just53A percent of that group's population—the lowestsuch percentage on record, which begins in 1970, and2Vi percentage points below its average over thatperiod. The rapid increase in aggregate demand hasgenerated growth of employment in excess of growthin population, causing the number of potential work-
ers to fall since the mid-1990s at a rate of a bit lessthan 1 million annually. We cannot judge with preci-sion how much further this level can decline withoutsparking ever-greater upward pressures on wages andprices. But, should labor market conditions continueto tighten, there has to be some point at which the risein nominal wages will start increasingly outpacingthe gains in labor productivity, and prices inevitablywill begin to accelerate.
RANGES FOR MONEY AND CREDIT
At its February meeting, the Committee elected toratify the provisional ranges for all three aggregatesthat it had established last July. Specifically, the Com-mittee again has set growth rate ranges over the fourquarters of 1999 of 1 percent to 5 percent for M2,2 percent to 6 percent for M3, and 3 percent to7 percent for domestic nonfinancial debt. As in previ-ous years, the Committee interpreted the ranges forthe broader monetary aggregates as benchmarks forwhat money growth would be under conditions ofprice stability and sustainable economic growth,assuming historically typical velocity behavior.
Last year, these monetary aggregates far overshotthe upper bounds of their annual ranges. Althoughnominal GDP growth did exceed the rate likely con-sistent with sustained price stability, the rapid growthof M2 and M3 also reflected outsized declines in theirvelocities, that is, the ratio of nominal GDP to money.M2 velocity dropped about 3 percent, while M3velocity plunged 5Vi percent.
Part of these velocity declines reflected some re-duction in the opportunity cost of holding money;interest rates on Treasury securities, which representan alternative return on nonmonetary assets, droppedmore than did the average of interest rates on depositsand money market mutual funds in M2, drawingfunds into the aggregate. Even so, much of last year'saberrant behavior of broad money velocity cannotreadily be explained by conventional determinants.Although growth of the broad aggregates was strongearlier in the year, it accelerated in the fourth quarterafter credit markets became turbulent. Perhaps robustmoney growth late in the year partly reflected areaction to this turmoil by the public, who beganscrambling for safer and more liquid financial assets.Monetary expansion has moderated so far this year,evidently in lagged response to the calming of finan-cial markets in the autumn. Layered on top of theseinfluences, though, the public also may have beenreapportioning their savings flows into money bal-ances because the huge run-up in stock prices in
Digitized for FRASER http://fraser.stlouisfed.org/ Federal Reserve Bank of St. Louis
Statements to the Congress 249
recent years has resulted in an uncomfortable portionof their net worth in equity.
For the coming year, the broad monetary aggre-gates could again run high relative to these ranges. Tobe sure, the decline in the velocities of the broaderaggregates this year should abate to some extent, asmoney demand behavior returns more to normal, andgrowth in nominal GDP should slow as well, assuggested by the governors' and presidents' centraltendency. Both factors would restrain broad moneyexpansion relative to last year. Still, the growth of M2and M3 could well remain outside their price-stabilityranges this year. Obviously, considerable uncertaintycontinues to surround the prospective behavior ofmonetary velocities and growth rates.
Domestic nonfinancial debt seems more likely thanthe monetary aggregates to grow within its range forthis year. Indeed, domestic nonfinancial debt alsocould grow more slowly this year than last year's6Vi percent pace, which was in the upper part of its3 percent to 7 percent annual range. With the federalbudget surplus poised to widen further this year,federal debt should contract even more quickly thanlast year. And debt in each of the major nonfederalsectors in all likelihood will decelerate as well fromlast year's relatively elevated rates, along with theprojected slowing of nominal GDP growth.
THE FOMC'S DISCLOSURE POLICY
The FOMC at recent meetings has discussed not onlythe stance of policy but also when and how it commu-nicates its views of the evolving economic situationto the public. The FOMC's objective is to release asmuch information about monetary policy decision-making, and as promptly, as is consistent with main-taining an effective deliberative process and avoidingroiling markets unnecessarily. Since early 1994, eachchange in the target nominal federal funds rate hasbeen announced immediately with a brief rationalefor the action. The FOMC resolved at its Decembermeeting to take advantage of an available, but unusedpolicy, originally stated in early 1995, of releasing,on an infrequent basis, a statement immediately aftersome FOMC meetings at which the stance of mone-tary policy has not been changed. The FederalReserve will release such a statement when it wishesto communicate to the public a major shift in itsviews about the balance of risks or the likely direc-tion of future policy. Such an announcement need notbe made after every change in the tilt of the directive.Instead, this option would be reserved for situationsin which the consensus of the Committee clearly had
shifted significantly, though not by enough to changecurrent policy, and in which the absence of an expla-nation risked misleading markets about the prospectsfor monetary policy.
YEAR 2000 ISSUES
Before closing, I'd like to address an issue that hasbeen receiving increasing attention—the century datechange. While no one can say that the rollover to theyear 2000 will be trouble free, I am impressed bythe efforts to date to address the problem in thebanking and financial system. For our part, the Fed-eral Reserve System has now completed remediationand testing of 101 of its 103 mission-critical applica-tions, with the remaining two to be replaced by theend of March. We opened a test facility in June atwhich more than 6,000 depository institutions to datehave conducted tests of their Y2K compliant sys-tems, and we are well along in our risk mitigation andcontingency planning activities. As a precautionarymeasure, the Federal Reserve has acted to increasethe currency in inventory about one-third to approxi-mately $200 billion in late 1999 and has other contin-gency arrangements available if needed. Although wedo not expect currency demand to increase dramati-cally, the Federal Reserve believes it is importantfor the public to have confidence in the availability ofcash in advance of the rollover. As a result of thesekinds of activities, I can say with assurance that theFederal Reserve will be ready in both its operationsand planning activities for the millennium rollover.
The banking industry is also working hard, andwith evident success, to prepare for the event. By theend of the first quarter, every institution in the indus-try will have been subject to two rounds of on-siteY2K examinations. The Federal Reserve, like theother regulators, has found that only a small minorityof institutions has fallen behind in their preparations,and those institutions have been targeted for addi-tional follow-up and, as necessary, formal enforce-ment actions. The overwhelming majority of theindustry has made impressive progress in their reme-diation, testing, and contingency planning efforts.
CONCLUDING COMMENT
Americans can justifiably feel proud of their recenteconomic achievements. Competitive markets, withopen trade both domestically and internationally,have kept our production efficient and on the expand-ing frontier of technological innovation. The deter-
Digitized for FRASER http://fraser.stlouisfed.org/ Federal Reserve Bank of St. Louis
250 Federal Reserve Bulletin • April 1999
mination of Americans to improve their skills andknowledge has allowed workers to be even moreproductive, elevating their real earnings. Macroeco-nomic policies have provided a favorable setting forthe public to take greatest advantage of opportunitiesto improve its economic well-being. The restrainedfiscal policy of the Administration and the Congress
has engendered the welcome advent of a unifiedbudget surplus, freeing up funds for capital invest-ment. A continuation of responsible fiscal and, wetrust, monetary policies should afford Americans theopportunity to make considerable further economicprogress over time.
Statement by Alan Greenspan, Chairman, Board ofGovernors of the Federal Reserve System, before theCommittee on Banking, Housing, and Urban Affairs,U.S. Senate, February 23,1999
The committee has asked that, in addition to myreport on the economy, I present today the viewsof the Federal Reserve on the need for legislationto modernize the U.S. financial system. The FederalReserve continues to support strongly the enactmentof such legislation, and I commend the committee fortaking up this vital matter so promptly.
NEED FOR FINANCIAL MODERNIZATION
U.S. financial institutions are today among the mostinnovative and efficient providers of financial ser-vices in the world. They compete, however, in amarketplace that is undergoing major and fundamen-tal change driven by a revolution in technology, bydramatic innovations in the capital markets, and bythe globalization of the financial markets and thefinancial services industry.
The technologically driven proliferation of newfinancial products that enable risk unbundling hascreated new financial instruments that increasinglycombine the characteristics of banking, insurance,and securities products. These changes, which areoccurring all over the world, have also dramaticallyaltered the way financial services providers operateand the way they market and deliver their products.
In the United States, our financial institutions havebeen required to take elaborate steps to develop anddeliver new financial products and services in a man-ner that is consistent with our outdated laws. Thecosts of these efforts are becoming increasingly bur-densome and serve no useful public purpose. Unlesssoon repealed, the archaic statutory barriers to effi-ciency could undermine the competitiveness of ourfinancial institutions, their ability to innovate and toprovide the best and broadest possible services toU.S. consumers, and ultimately, the global dominanceof American finance.
Without congressional action to update our laws,the market will force ad hoc administrative responsesthat lead to inefficiencies and inconsistencies, expan-sion of the federal safety net, and potentiallyincreased risk exposure to the federal deposit insur-ance funds. Such developments will undermine thecompetitiveness and innovative edge of major seg-ments of our financial services industry. We believethat it is important that the rules for our financialservices industry be set by the Congress rather than,as too often has been the case, by banking regulatorsdealing with our outdated laws. Only the Congresshas the ability to fashion rules that are comprehensiveand equitable to all participants and that guard thepublic interest.
For these reasons, we support removal of the leg-islative barriers that prohibit the straightforwardintegration of banking, insurance, and securitiesactivities. There is virtual unanimity among allconcerned—private and public alike—that these bar-riers should be removed.
In designing financial modernization legislation,we firmly believe that the Congress should focus onachieving two essential and indivisible objectives:removing outdated, competitively stifling restrictionson financial affiliations and, most important, adoptinga framework for this modernization that promotes thesafety and soundness of our banking and financialsystem and prevents the extension of the federalsubsidy.
FRAMEWORK FOR FINANCIAL MODERNIZATION
The first objective is achieved by amending theGlass-Steagall Act and the Bank Holding CompanyAct to permit financial affiliations and broader finan-cial activities.
In our judgment, the other objective of preservingsafety and soundness and preventing the spread of thefederal subsidy is best achieved by allowing banks,securities firms, and insurance companies to combinein the financial service holding company structure.While we enthusiastically support the new powers
Digitized for FRASER http://fraser.stlouisfed.org/ Federal Reserve Bank of St. Louis
Statements to the Congress 251
granted to financial service holding companies, wejust as strongly believe that they should be financedby the marketplace, not by instruments backed by thesovereign credit of the United States. The require-ment that the new powers, at least those conducted asprincipal, be conducted through holding companyaffiliates minimizes the expansion of the use of thesubsidies arising from a safety net backed by the U.S.taxpayer.
The choice of requiring the new powers to beharbored in affiliates of holding companies, not inoperating subsidiaries of their banks, will signifi-cantly fashion the underlying structure of twenty-firstcentury finance. To inject the substantial new subsi-dies that would accrue to operating subsidiaries ofbanks into the currently mushrooming domestic andinternational financial system could distort capitalmarkets and the efficient allocation of both finan-cial and real resources that has been so central toAmerica's current prosperity.
New affiliations, if allowed through bank subsidi-aries, would accord banking organizations an unfaircompetitive advantage over comparable insuranceand securities firms—both those operating indepen-dently and those that are bank holding companysubsidiaries. By fostering a level playing field withinthe financial services industry, we contribute to full,open, and fair competition.
This choice of the holding company structure isalso critical to the way in which the financial servicesindustry will develop because it provides better pro-tection for and promotes the safety, soundness, andstability of our banking and financial system. At thesame time, it accomplishes much-needed financialmodernization without damaging the national or statebank charters or limiting in any way the benefits offinancial modernization. The other route toward full-powered commercial bank operating subsidiaries anduniversal banking would, in our judgment, lead togreater risk for the deposit insurance funds and thetaxpayer.
In addition, the holding company structure pro-motes effective supervision and the functional regula-tion of different activities. The United States is at ahistoric crossroads in financial services regulation. Itis becoming increasingly evident that the dramaticadvances in computer and telecommunications tech-nologies of the past decade have so significantlyaltered the structure of domestic, indeed, globalfinance as to render our existing modes of supervi-sion and regulation of financial institutions increas-ingly obsolescent.
The volume, sophistication, and rapidity of finan-cial dealings should continue to lead to supervisory
emphasis on oversight of risk management of finan-cial institutions and a marked scaling back of out-moded loan file and balance sheet surveillance. Forthe same reasons, affiliation with banks need not—indeed, should not—create bank-like regulation ofaffiliates of banks. A constructive approach to super-vision for the twenty-first century is captured in theso-called "Fed-light" provisions of various bills,which focus on and enhance the functional regulationof securities firms, insurance companies, insureddepository institutions, and their affiliates. We at theFed strongly support this approach.
BANKING AND COMMERCE
A twenty-first century issue that has become a part ofthe financial modernization debate is whether weshould move beyond affiliations among financial ser-vice providers and allow the full integration of bank-ing and commerce. As technology increasingly blursthe distinction among various financial products, it isalready beginning to blur the distinctions betweenpredominately commercial and banking firms. Buthow the underlying subsidies of deposit insurance,discount window access, and guaranteed final settle-ment through Fed wire are folded into a commercialfirm, should the latter affiliate with a bank, is cru-cially important to the systemic stability of our finan-cial system. It seems to us wise to move first towardthe integration of banking, insurance, and securitiesand employ the lessons we learn from that importantstep before we consider whether and under whatconditions it would be desirable to move to thesecond stage of the full integration of commerce andbanking.
Nothing is lost, in my judgment, by making this atwo-stage process. Indeed, there is much to be gained.The Asian crisis highlighted some of the risks thatcan arise if relationships between banks and commer-cial firms are too close and makes caution at thisstage prudent in our judgment. In line with theseconsiderations, the Board continues to support elimi-nation of the unitary thrift loophole, which currentlyallows any type of commercial firm to control afederally insured depository institution.
PRESERVATION OF EXECUTIVE BRANCHINFLUENCE
There is a final point I want to make because itappears to have driven the Treasury's opposition tofinancial modernization legislation considered last
Digitized for FRASER http://fraser.stlouisfed.org/ Federal Reserve Bank of St. Louis
252 Federal Reserve Bulletin • April 1999
year. That legislation would not have altered theexecutive branch's supervisory authority for nationalbanks or federal savings associations; nor would ithave resulted in any reduction in the predominant andgrowing share of this nation's banking assets con-trolled by national banks and federal savings associa-tions. Indeed, as of September 1998, nearly 58 per-cent of all banking assets were under the supervisionof the Comptroller of the Currency, up from 55.2 per-cent at the end of 1996. Moreover, after havingcontrolled for mergers of like-chartered banks, thenumber of national banks has increased over theperiod 1996-98 and the number of state banks hasdeclined.
Furthermore, the Congress for sound public policyreasons has purposefully apportioned responsibilityfor this nation's financial institutions among theelected executive branch and independent regulatoryagencies. Action to alter this balance would be con-trary to the deliberate steps that the Congress hastaken to ensure a proper balance in the regulation ofthis nation's dual banking system.
CONCLUSION
In virtually every other industry, the Congress wouldnot be asked to address issues such as these, which
are associated with technological and market devel-opments; the market would force the necessaryinstitutional adjustments. Arguably, this differencereflects the painful experience that has taught us thatdevelopments in our banking system can have pro-found effects on the stability of our whole economy,rather than the limited impact we perceive from diffi-culties in most other industries.
Moreover, as in all major legislation, there are, andwill be, numerous provisions only indirectly associ-ated with the legislation's core objectives that oftenfoster disagreements. These surrounding issues aredoubtless important, but not so important that theyshould be allowed to defeat the consensus that hasdeveloped around these key goals. It would be adisservice to the public and the nation if, in thefruitless search for a bill that pleases everyone inevery detail, the benefits of this vital consensus arelost or further delayed.
The markets are demanding that we change out-dated statutory limitations that stand in the way ofmore efficiently and effectively delivering financialservices to the public. The Federal Reserve agreesand urges prompt enactment of financial moderniza-tion legislation that achieves the two central andindivisible objectives that I have outlined today.
Statement by Edward W. Kelley, Jr., Member, Boardof Governors of the Federal Reserve System, beforethe Subcommittee on Civil Service of the Committeeon Government Reform and Oversight, U.S. House ofRepresentatives, February 25,1999
I am pleased to testify on behalf of the Board ofGovernors on the Federal Reserve Board RetirementPortability Act and to provide the subcommittee withinformation on the Federal Reserve retirement sys-tem. The Board strongly supports this legislation.The bill would allow certain employees who leavethe Board to work for other agencies and who thenretire under the Federal Employees Retirement Sys-tem (FERS) to receive pensions reflecting all of theirfederal service, including post-1988 service at theFederal Reserve Board. On behalf of the Board andits employees, let me particularly thank you, Chair-man Scarborough, and Representatives Cummings,Morella, Mica, Waxman, Norton, Davis, Hoyer, andMoran for introducing this important legislation.
By way of background, the Federal Reserve Sys-tem has its own defined benefit retirement plan,
which has two benefit structures: the Board Plan,covering Board employees hired pre-1984, which ismodeled on the Civil Service Retirement System(CSRS); and the Bank Plan, covering Board employ-ees hired after 1983 and all employees of the FederalReserve Banks. The Board Plan and the CSRS havehistorically had reciprocity with regard to servicecredit portability. However, as a result of an oversightthat occurred when the FERS statute was first passed,post-1988 service at the Federal Reserve Board byemployees enrolled in the Bank Plan and, in somelimited situations, those enrolled in the Board Plan, isnot creditable service under the FERS.
SERVICE CREDIT PROBLEM
The Board gains and loses employees in transfersbetween the Board and other government agencieseach year. In particular, transfers between the Boardand the other bank regulatory agencies—the FederalDeposit Insurance Corporation, the Office of theComptroller of the Currency, and the Office of ThriftSupervision—are common. The Board grants credit
Digitized for FRASER http://fraser.stlouisfed.org/ Federal Reserve Bank of St. Louis
Statements to the Congress 253
under its retirement plan to newly hired employeeswith previous CSRS and FERS service if the em-ployee renounces benefits under the previous retire-ment plan (to prevent dual credit). Thus, there isservice portability when employees come to theBoard. And, generally, there has been portabilitybetween the Board and other government agencies increditing Board Plan service under CSRS. However,because of the oversight mentioned above, post-1988Bank Plan service at the Federal Reserve Board is notcreditable under FERS.
As a result, if a Board employee hired after 1983(and participating in the Bank Plan) leaves the Boardto work for another federal agency and then retiresfrom that agency under FERS, that employee wouldreceive a reduced pension that would not reflect all ofthat employee's federal government service. Thisproblem also affects any employee who participatedin the Board Plan, did not complete five years ofservice before 1987, and left the Board and reenteredfederal employment after a break in service of morethan one year. In this situation, under current law,the employee would be placed under FERS with nocredit for post-1988 Board service. My testimonywill refer to these situations as the "service credit"problem.
Under current law, an employee affected by theservice credit problem could receive two pensions:the reduced pension from FERS and, if he or she hadworked long enough to be vested, a pension from theBoard. In this case, because of the way the pensionsare calculated, the sum of those pensions wouldusually be less than a single FERS pension that gavecredit for all of the individual's federal governmentservice. Alternatively, if the employee was not vestedat the Board, he or she would receive only thereduced FERS pension.
Thus, current law creates a dollars-and-cents prob-lem in retirement security. Depending on the indi-vidual's final average salary and years of other fed-eral service, the lack of portability of post-1988Board service can mean the loss of hundreds orthousands of dollars a year in retirement income.
We have identified about fifty former employees ofthe Board who have gone to work for other federalagencies and who will have this service credit prob-lem when they retire under FERS. In addition, thoseof the Board's current workforce covered by theBank Plan (about two-thirds of the staff) would havethe same problem if they should go to another federalagency and retire under FERS. Over time, a growingpercentage of Board staff could encounter similarproblems since virtually all new hires will have ser-vice that is not creditable under FERS.
The service credit problem has festered withoutresolution since the FERS statute was enacted in1986. Employees at the Board are very aware of it.The problem is damaging to employee morale, and,just as important, some Board employees are deterredfrom making sound career moves because their pen-sions will suffer. And, government agencies' effortsto recruit these employees are hampered.
The bill before the subcommittee would correct theunidirectional service credit problem. It would amendthe FERS statute to make post-1988 Board servicecreditable service under FERS. As a result, whenaffected former Board employees retire under FERS,their pensions will reflect all their federal governmentservice.
To receive credit for post-1988 Board serviceunder FERS, the bill appropriately requires theemployee to do two things. First, the employee wouldhave to renounce the entitlement (if any) to receive apension from the Board. This would prevent receiptof credit for post-1988 Board service under bothFERS and the Bank Plan.
Second, the bill requires the employee to make acontribution to FERS that, in effect, would "buy"FERS credit for his or her Board service. This contri-bution would equal the amount the employee wouldhave contributed to FERS if he or she had beencovered by FERS during the service in question, plusinterest to the date of payment. This contributionis appropriate because all FERS participants arerequired to contribute toward their pension benefit.
These two requirements mirror provisions in cur-rent law that provide service credit for employeeswith previous service under the Foreign Service pen-sion program.
We believe that virtually all affected employeeswould be better off with this legislation than undercurrent law. This includes the Bank Plan employeewho transfers to another agency and is placed underFERS, as well as the Board Plan employee who hascompleted five years service (but not before 1987)and who was placed under FERS after a break inservice of more than one year. As FERS employees,they will receive service credit for their post-1988Board service. Future government hires in the secondsituation (prior Board Plan) would be placed in CSRSOffset as a result of the legislation, where their post-1988 Board service would be creditable.
To ensure that no one is inadvertently hurt, the billwould, in effect, allow affected employees to choosewhether or not to get FERS credit for their post-1988Board service. With that option, the employeecould make whichever choice would be moreadvantageous.
Digitized for FRASER http://fraser.stlouisfed.org/ Federal Reserve Bank of St. Louis
254 Federal Reserve Bulletin • April 1999
In conclusion, the Board and its employeesstrongly support this legislation, and we hope that theCongress can approve it quickly.
I would now like to respond to the subcommittee'srequest for an overview of the Federal ReserveRetirement Plan and information on the managementof pension plan assets.
OVERVIEW OF THE FEDERAL RESERVERETIREMENT PLAN
The Federal Reserve System Retirement Plan is agovernmental defined benefit plan that is qualifiedunder section 401 (a) of the tax code. The plan pro-vides retirement benefits for virtually all employeesof the Federal Reserve Board and Reserve Banks.(Exceptions are approximately thirty employees atthe Board who are in FERS or CSRS.) Plan benefitsare determined under two separate benefit structures:the Board Benefit Structure (Board Plan), which cov-ers approximately 600 Board employees; or the BankPlan, which covers all eligible Reserve Bank staff(about 23,000 employees) and approximately 1,000Board employees. There are approximately 500 annu-itants receiving payments from the Board Plan andapproximately 12,000 annuitants receiving paymentsfrom the Bank Plan, with another 5,000 who haveearned a benefit but have not yet begun drawingpayments.
The Federal Reserve Banks and the Board, asemployers, are responsible to ensure the fundingrequired to pay the benefits promised to participantsand have contributed to the plan at varying levelsthroughout the years as determined necessary by theplan actuary. Since 1986, the actuary has determinedthat no employer contributions are required. Cur-rently, the Retirement Plan's assets exceed both theplan's accrued liability as well as total liability ascalculated by the plan actuary. Plan assets based on afive-year moving average as of January 1, 1998, were$4.0 billion. The total benefit obligation—whichincludes both future service and future salaryincreases—was $3.5 billion. Accrued benefits—based on service and salary up to the date of thevaluation—were valued at $2.8 billion. The value ofplan assets at the end of 1998 was $5.8 billion.
The Board Plan covers Board employees hiredbefore 1984; its plan design is nearly identical to thatof the Civil Service Retirement System. Participantsdo not pay social security tax but have contributed tothe Board Plan at the same rate as CSRS participantsover the years (except that the Board did not increasethe employee contribution rate from 7.0 percent
to 7.25 percent in 1999 as CSRS did). The benefitfeatures of the Board Plan mirror those of CSRS inmost important respects. The most significant differ-ences are as follows: The Board Plan credits FederalReserve Bank service, while CSRS does not; theBoard Plan has adopted a benefit formula for employ-ees with part-time service after April 6, 1986, that isdifferent from the CSRS; and the Board Plan does notallow incorporation of retired military pay into theBoard Plan annuity as allowed by CSRS. A detailedlisting of the differences between the two plans isfound in attachment A.'
The Bank Plan covers all eligible employees of theFederal Reserve Banks. When the Congress passedlegislation requiring that federal employees hiredafter 1983 be subject to social security tax, the Boarddecided to place all newly hired Board employees inthe Bank Plan as well. Unlike the Board Plan, theBank Plan does not require employee contributions,but all Bank Plan participants are covered undersocial security and thus are subject to the FICAwithholding requirement. The basic annuity formulafor the Bank Plan is integrated with social security.The annuity formula is based on years of creditableservice and the average of the five highest earningyears of the employee's career. The benefit formulaprovides 1.3 percent of High-5 salary up to the socialsecurity integration level times the number of yearsof creditable service plus 1.8 percent of High-5 salaryabove the integration level times years of creditableservice.
While the Bank Plan is similar to FERS in that it isdesigned to work together with social security, theplan design features differ. For example, the BankPlan requires no employee contributions as FERSdoes; it uses the highest five years of earnings tocompute the pension benefit rather than the highestthree years under FERS; and it provides for annuityreductions for retirements before age sixty, whileFERS allows unreduced retirement below age sixty ifthe participant has thirty years of service. A detailedcomparison of the plan features of FERS and theBank Plan are provided in attachment B.
The Federal Reserve Thrift Plan is the System'sdefined contribution plan comparable to the govern-ment's Thrift Savings Plan (TSP). Both Board Planand Bank Plan employees are eligible to participateand receive employer matching funds. The FederalReserve Thrift Plan differs from TSP in that it offersboth pretax and after-tax savings components and a
1. The attachments to this statement are available from Publica-tions Services, Mail Stop 127, Board of Governors of the FederalReserve System, Washington, DC 20551. and on the Board's site onthe World Wide Web (http://www.federalreserve.gov).
Digitized for FRASER http://fraser.stlouisfed.org/ Federal Reserve Bank of St. Louis
Statements to the Congress 255
wider variety of investment options. It also allowshigher contribution rates from participants (up to20 percent of salary), subject to IRS limitations.
MANAGEMENT OF PENSION PLAN ASSETS
The Federal Reserve System, composed of the Boardof Governors and twelve Reserve Banks, vests fidu-ciary responsibility for the investments of its definedbenefit (pension) and defined contribution (savings)plans in a committee of five senior System officers.The System's investment oversight committee is cur-rently composed of three Reserve Bank presidents,one member of the Board, and the first vice presidentof the New York Reserve Bank. The pension andsavings plans had investments valued at $8.1 billionas of year-end 1998, with $5.8 billion representingpension plan assets. I represent the Board on thiscommittee and have done so since 1994. The commit-tee is chaired by one of the Reserve Bank presidents(currently Gary Stern of the Minneapolis ReserveBank). Day-to-day oversight of the investments is theresponsibility of a small staff (three) in New Yorkdirected by our Chief Investment Officer, Paul Lip-son, CFA.
Our oversight committee has long sought to dis-tance itself from asset allocation decisions becausesuch activity might bring with it the appearance ofa conflict of interest for the System. Instead, thecommittee functions as a manager-of-managers—selecting independent investment firms and givingthem a common balanced investment mandate. Thatmandate is set forth in our Investment Objectives andGuidelines document, which has been provided to thesubcommittee. This document is part of the invest-
ment advisory agreement with each firm and dele-gates to them asset allocation decisions (within broadparameters set by the committee), securities selectiondecisions, and the voting of proxies.
Currently, eight firms are retained to manage our$5.8 billion in pension assets (of which about two-thirds were invested in equities as of year-end 1998).Those balanced accounts range in size from $350 mil-lion to $1 billion. Managers are selected by cri-teria that include past performance, desired equityand fixed-income investment "styles," trading andresearch capabilities, expense levels, and so on. Man-agement expenses for the entire plan are less thanone-quarter of 1 percent of invested assets. No pen-sion assets are managed in-house. The staff in NewYork monitors portfolio activity and performance,reporting on both to the committee on a monthlybasis. The committee meets with its portfolio manag-ers at least once a year; the staff meets with most ofthem quarterly. No consultants are retained for anyaspect of the investment process, although the staff inNew York makes extensive use of generally availableanalytical software to assess returns and various mea-sures of risk.
Performance of invested assets is measured againstthree benchmarks: versus the expected long-term rateof return for plan investments used in actuarial valua-tion (currently 9 percent), versus a trailing thirty-six-month composite return (60 percent Standard &Poor's 500/40 percent Lehman Bros. Aggregate), andin comparison to the plan's peer group in the WilshireTrust Universe Comparison Service, the largest tax-exempt institutional performance database in theUnited States. I am pleased to report that the plan hasmet or exceeded each of those benchmarks overmany years. •
Digitized for FRASER http://fraser.stlouisfed.org/ Federal Reserve Bank of St. Louis
256
Announcements
PROPOSED ACTION
The Federal Reserve Board on February 22, 1999,requested comment on proposed changes to its Reg-ulation CC (Availability of Funds and Collectionof Checks) that would provide more flexibility todepository institutions to experiment with methods toreturn unpaid checks electronically. Comments arerequested by April 30, 1999.
ADDITION OF SUPPLEMENTARY TABLES TO THEFLOW OF FUNDS ACCOUNTS
The Federal Reserve Board on February 17, 1999,announced that it will include in future issues ofthe Flow of Funds Accounts of the United States(Z.I statistical release) supplementary tables thatcombine the assets and liabilities of all governmententities in the United States. The title of the newtables is "Consolidated Statement for Federal, State,and Local Governments," and they will be num-bered F.106.C for financial flows and L.106.C foroutstanding amounts of financial assets and liabilitiesat the end of the periods shown. The release willcontinue to show separately the assets and liabili-ties of the federal government and state and localgovernments.
The inclusion of table F.106.C and table L. 106.C ismotivated by the International Monetary Fund's Spe-cial Data Dissemination Standards (SDDS), whichwere established in 1996 to provide guidance on thedissemination of economic and financial data forcountries that have, or might seek, access to inter-national capital markets. The United States is a sub-scriber to the IMF's SDDS.
The Z.I statistical release, "Flow of FundsAccounts of the United States," is updated about tenweeks after the end of a quarter. The release isavailable from the Board's Publications Services(Mail Stop 127, Board of Governors of the Fed-eral Reserve System, Washington, DC 20551)and electronically on the Board's web site(http://www.federalreserve.gov/releases/Zl).
PUBLICATION BY AN INTERAGENCY TASKFORCE OF A CONSUMER BROCHURE ABOUTSHOPPING AND NEGOTIATING FOR THE BESTMORTGAGE
The federal Interagency Task Force on Fair Lendinghas published a brochure for consumers Looking forthe Best Mortgage: Shop, Compare, Negotiate. Thebrochure notes that shopping around for a home loanor mortgage is similar to shopping for a car—consumers should obtain information on all costs ofthe loan and negotiate for the best deal.
The brochure describes how comparing and negoti-ating interest rates, fees, and other payment terms onloans may help consumers get the best financing andpossibly save thousands of dollars, whether it is ahome purchase loan, a refinancing, or a home equityloan. It advises consumers to do the following:
• Obtain information from several lenders• Make sure to obtain all important cost
information• Negotiate for the best deal.
For example, the brochure notes that on any givenday, lenders and brokers may offer different prices forthe same loan to different consumers, even if consum-ers have the same loan qualifications. These differentprices may result because loan officers and brokersare often allowed to keep some or all of the differ-ence between the lowest available price and anyhigher price that the consumer agrees to pay. Thiscompensation arrangement helps explain why it isimportant for consumers to ask questions about costsand negotiate for the best deal. The brochure containsa worksheet consumers can use to compare costswhile shopping. The worksheet lists commonlycharged fees and closing costs and includes a usefullist of questions consumers may wish to ask lenderswhen they shop for a loan.
The brochure outlines common sources for homeloans and explains the difference between rates,points, and fees. It highlights some of the laws thatprotect consumers from unfair lending practices. Italso emphasizes that even consumers with past credit
Digitized for FRASER http://fraser.stlouisfed.org/ Federal Reserve Bank of St. Louis
257
problems should shop around and negotiate for thebest deal. Finally, the brochure includes a mortgageloan shopping form that consumers can use to recordloan data quoted by two or more lenders or brokersand then compare that data to help identify or negoti-ate the best deal.
The members of the Interagency Task Forceinclude the Department of Housing and Urban Devel-opment, the Department of Justice, the Department ofthe Treasury, the Federal Deposit Insurance Corpora-tion, the Federal Housing Finance Board, the FederalReserve Board, the Federal Trade Commission, theNational Credit Union Administration, the Office ofFederal Housing Enterprise Oversight, the Officeof the Comptroller of the Currency, and the Office ofThrift Supervision.
Single copies of the brochure are available free ofcharge from the Board's Publications Services, MailStop 127, Board of Governors of the Federal ReserveSystem, Washington, DC 20551; it is also on theBoard's web site (http://www.federalreserve.gov).Single copies are also available free of chargefrom other members of the Interagency Task Force.The brochure is available at 50 cents per copy fromthe Consumer Information Center, Pueblo, CO81009, or from the center's web site (http://www.pueblo.gsa.gov).
AVAILABILITY OF THE LIST OF FOREIGNMARGIN STOCKS
The Federal Reserve Board on February 22, 1999,initiated semiannual publication of its List of ForeignMargin Stocks. The list, which was effective March 1and supersedes the November 9, 1998, list, is the lastto be accompanied by a press release. Future lists(the next is scheduled for September 1999), willbe published directly on the Board's Internet site(http://www.federalreserve.gov).
Stocks on the list meet the Board's criteria insection 220.11 of Regulation T (Credit by Brokersand Dealers) and are eligible for margin treatment atbrokers and dealers on the same basis as domesticmargin stocks. Other foreign stocks are also eligibleif they are deemed by the Securities and ExchangeCommission (SEC) to have a "ready market" forpurposes of the SEC's net capital rule. The foreignstocks on the Financial Times/Standard & Poor'sActuaries World Indices (FT/S&P list) are notincluded in the Board's list, but they all qualify formargin treatment under an SEC "no action" letter,
which effectively treats these securities as having aready market.
With the Board's December 23, 1997, amendmentsto its margin regulations, all brokers and dealersbecame able as of January 1, 1999, to offer margincredit on all stocks trading in the Nasdaq StockMarket. Therefore the Board ceased publication of itsquarterly List of Marginable OTC Stocks with theNovember 9, 1999, list.
It is unlawful for any person to cause any represen-tation to be made that inclusion of a stock on the Listof Foreign Margin Stocks indicates that the Board orthe SEC has in any way passed upon the merits ofany such stock or transaction therein. Any referencesto the Board in connection with the list or any stocksthereon in any advertisement or similar communica-tion is unlawful.
ENFORCEMENT ACTIONS
The Federal Reserve Board on February 5, 1999,announced the execution of a written agreement byand among First Utah Bancorporation, the FirstUtah Bank, and Premier Data Corporation, all ofSalt Lake City, Utah, and the Federal Reserve Bankof San Francisco. The written agreement includesprovisions addressing Year 2000 readiness.
On February 11, 1999, the Federal Reserve Boardannounced the issuance of a prompt corrective actiondirective against the Zia New Mexico Bank, Tucum-cari, New Mexico.
REVISIONS TO THE MONEY STOCK DATA
Measures of the money stock were revised in Feb-ruary of this year to incorporate the results of theannual benchmark and seasonal factor review. Datain tables 1.10 and 1.21 in the statistical appendix tothe Federal Reserve Bulletin reflect these changesbeginning with this issue.
The revisions had no effect on the annual growthrate of M2 over 1998, but they raised the annualgrowth rate of Ml by 0.1 percentage point and low-ered that of M3 by 0.1 percentage point over the pastyear.
The benchmark incorporates minor revisions todata reported on the weekly and quarterly depositreports, and it takes account of deposit data from callreports for banks and thrift institutions that are notweekly or quarterly deposit reporters. These revisions
Digitized for FRASER http://fraser.stlouisfed.org/ Federal Reserve Bank of St. Louis
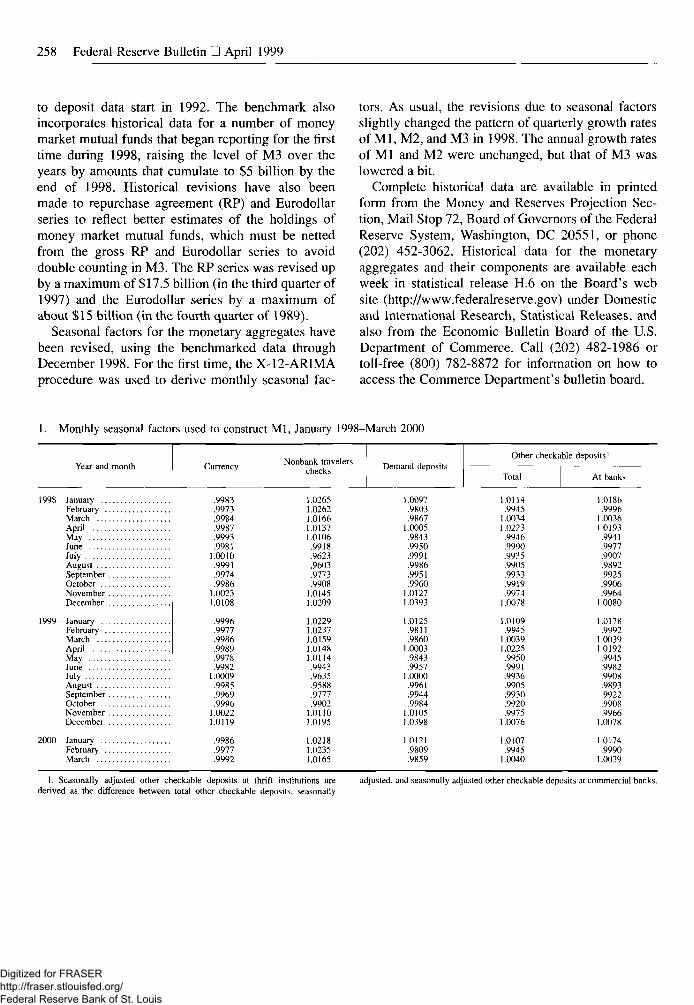
258 Federal Reserve Bulletin • April 1999
to deposit data start in 1992. The benchmark alsoincorporates historical data for a number of moneymarket mutual funds that began reporting for the firsttime during 1998, raising the level of M3 over theyears by amounts that cumulate to $5 billion by theend of 1998. Historical revisions have also beenmade to repurchase agreement (RP) and Eurodollarseries to reflect better estimates of the holdings ofmoney market mutual funds, which must be nettedfrom the gross RP and Eurodollar series to avoiddouble counting in M3. The RP series was revised upby a maximum of $17.5 billion (in the third quarter of1997) and the Eurodollar series by a maximum ofabout $15 billion (in the fourth quarter of 1989).
Seasonal factors for the monetary aggregates havebeen revised, using the benchmarked data throughDecember 1998. For the first time, the X-12-ARIMAprocedure was used to derive monthly seasonal fac-
tors. As usual, the revisions due to seasonal factorsslightly changed the pattern of quarterly growth ratesof Ml, M2, and M3 in 1998. The annual growth ratesof Ml and M2 were unchanged, but that of M3 waslowered a bit.
Complete historical data are available in printedform from the Money and Reserves Projection Sec-tion, Mail Stop 72, Board of Governors of the FederalReserve System, Washington, DC 20551, or phone(202) 452-3062. Historical data for the monetaryaggregates and their components are available eachweek in statistical release H.6 on the Board's website (http://www.federalreserve.gov) under Domesticand International Research, Statistical Releases, andalso from the Economic Bulletin Board of the U.S.Department of Commerce. Call (202) 482-1986 ortoll-free (800) 782-8872 for information on how toaccess the Commerce Department's bulletin board.
1. Monthly seasonal factors used to construct Ml, January 1998-March 2000
Year and month
1998—JanuaryFebruaryMarchAprilMayJuneJulyAugustSeptemberOctoberNovemberDecember
1999—JanuaryFebruaryMarchAprilMayJuneJulyAugustSeptemberOctoberNovemberDecember
2000—JanuaryFebruaryMarch
Currency Nonbank travelerschecks
.9983
.9973
.9984
.9987
.9993
.99811.0010.9991.9974.9986
1.00231.0108
.9996
.9977
.9986
.9989
.9978
.99821.0009.9985.9969.9996
1.00221.0119
.9986
.9977
.9992
Demand depositsOther checkable deposits'
Total At banks
.0265 1.0097 1.0114 1.0186
.0262 .9803 .9945 .9996
.0166 .9867 1.0034 1.0036
.0137 1.0005 1.0223 1.0193
.0106 .9843 .9946 .9941
.9918 .9950 .9990 .9977
.9623 .9991 .9935 .9907
.9603 .9986 .9905 .9892
.9773 .9951 .9933 .9925
.9908 .9960 .9919 .9906
.0145 1.0127 .9974 .9964
.0209 1.0393 1.0078 1.0080
.0229 1.0125 1.0109 1.0178
.0237 .9811 .9945 .9992
.0159 .9860 1.0039 1.0039
.0148 1.0003 1.0225 1.0192
.0114 .9843 .9950 .9945
.9943 .9957 .9991 .9982
.9635 1.0000 .9936 .9908
.9588 .9961 ,9905 .9893
.9777 .9944 .9930 .9922
.9902 .9984 .9920 .9908
.0110 1.0105 .9975 .9966
.0195 1.0398 1.0076 1.0078
.0218 1.0121 1.0107 1.0174
.0235 .9809 .9945 .9990
.0165 .9859 1.0040 1.0039
1. Seasonally adjusted other checkable deposits at thrift institutions arederived as the difference between total other checkable deposits, seasonally
adjusted, and seasonally adjusted other checkable deposits at commercial banks.
Digitized for FRASER http://fraser.stlouisfed.org/ Federal Reserve Bank of St. Louis
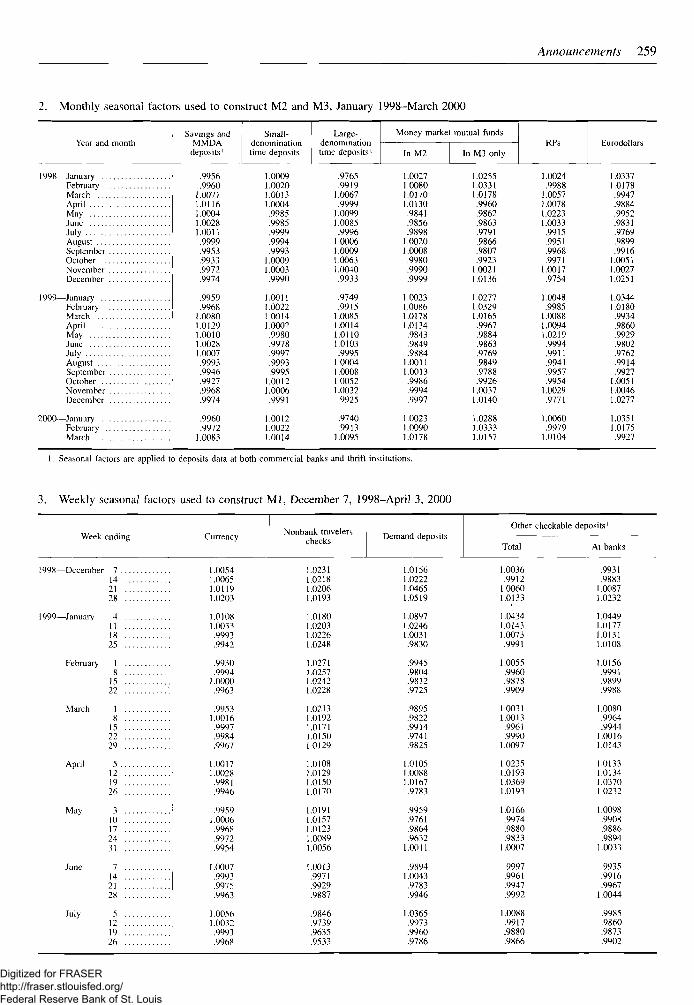
Announcements 259
Monthly seasonal factors used to construct M2 and M3, January 1998-March 2000
Year and month
1998—January . . .February ..MarchAprilMayJuneJulyAugustSeptember .October ..November .December .
1999—January . . .February ..MarchAprilMayJuneJulyAugustSeptember .October . . .November .December .
2000—January . . .February ..March
Savings andMMDAdeposits'
.9956
.99601.00711.01161.00041.00281.0011.9999.9953.9933.9972.9974
.9959
.99681.00801.01291.00101.00281.0007.9993.9946.9927.9968.9974
.9960
.99721.0083
Small-denominationtime deposits'
1.00091.00201.00131.0004.9985.9985.9999.9994.9993
1.00091.0003.9990
1.00111.00221.00141.0002.9980.9978.9997.9993.9995
1.00121.0006.9991
1.00121.00221.0014
Large-denominationtime deposits1
Money market mutual funds
.9765
.99191.0067.9999
1.00991.0085.9996
1.00061.00091.00631.0040.9933
.9749
.99151.00851.00141.01101.0103.9995
1.00041.00081.00521.0032.9925
.9740
.99131.0095
In M2 In M3 only
1.00271.00801.01701.0130.9841.9856.9898
1.00201.0008.9980.9990.9999
1.00231.00861.01781.0134.9843.9849.9884
1.00111.0013.9986.9994.9997
1.00231.00901.0178
1.02551.03311.0178.9960.9862.9863.9791.9866.9807.9923
1.00211.0136
1.02771.03291.0165.9967.9884.9863.9769.9849.9788.9926
1.00371.0140
1.02881.03331.0157
RPs
1.0024.9988
1.00571.00781.02231.0033.9915.9951.9968.997'I
1.0017.9754
1.0048.9985
1.00881.00941.0219.9994.9911.9941.9957.9954
1.0029.9771
1.0060.9979
1.0104
Eurodollars
1.03371.0178.9947.9884.9952.9831.9769.9899.9916.0051.0027.0251
.0344
.0180
.9934
.9860
.9929
.9802
.9762
.9914
.99271.00511.00461.0277
1.03511.0175.9927
1. Seasonal factors are applied to deposits data at both commercial banks and thrift institutions.
3. Weekly seasonal factors used to construct Ml, December 7, 1998—April 3, 2000
Week ending
1998—December 7142128
1999—January 4 . .111825
February 181522 '.
March 181521
29
April 5121976
May 310172431
142128
July 5121926
Currency
1.00541.00651 01191.0203
1.01081.0033.9993.9942
.9930
.99941.0000.9963
.99531.0016.99979984.9967
1.00171.0028.9981.9946
.99591 0006.9968.9972.9954
I 0007.99939975.9963
1.00561.0032.9993.9968
Nonbank travelerschecks
1.02311.02181 02061.0193
1.01801.02031.02261.0248
1.02711.02571.02421.0228
1.02131.01921.01711 01501.0129
1.01081.01291.01501.0170
1.01911 01571.01231.00891.0056
I (X)I3.99719929.9887
.9846
.9739
.9635
.9533
Demand deposits
1.0156.0222.0465.0519
.0897
.0246
.0031
.9830
.9945
.9804
.9812
.9725
.9895
.9822
.99149741.9825
1.01051.0088.0167.9783
.9959
.9761
.9864
.96321.0011
.98941.00439783.9946
1.0365.9973.9960.9786
Other checkable deposits1
Total
1.0036.99121 00601.0133
1.04341.01431.0073.9991
1.0055.9960.9878.9909
1.00311.0013.99619990
1.0097
1.02351.01931.03691.0193
1.0166.9974.9880.98331.0007
.9997
.9961
.9947
.9992
1.0088.9917.9880.9866
At banks
.9931
.98831 00871.0232
1.04491.01771.01311.0108
1.0156.9991.9899.9988
1.0080.9964.99441 00161.0143
1.01331.01341.03701.0232
1.0098.9908.9886.98941.0033
.9935
.9916
.99671.0044
.9985
.9860
.9873
.9902
Digitized for FRASER http://fraser.stlouisfed.org/ Federal Reserve Bank of St. Louis
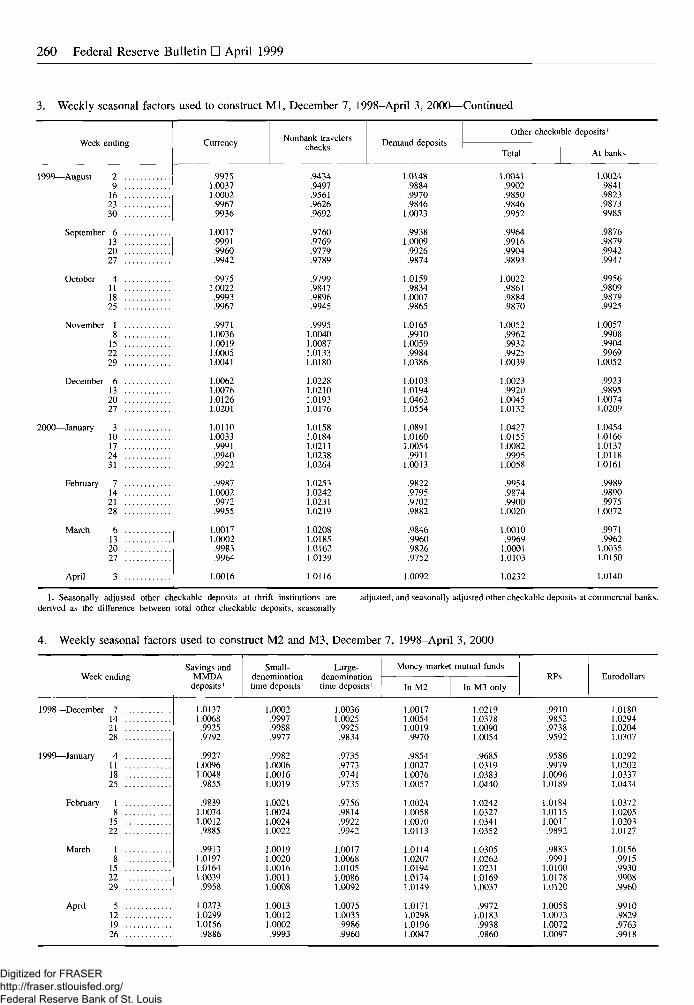
260 Federal Reserve Bulletin • April 1999
3. Weekly seasonal factors used to construct Ml, December 7, 1998-April 3, 2000—Continued
Week ending
1999—August 2 .9
16 ..2330
132027
111825
November I8
15 ..2229
13 ..2027 . . .
2000—January 310172431
February 7142128
132027
April 3
Currency
.99751.00371.0002.9967.9936
1.0017.9991.99609942
.99751.0022.9993.9967
.9971100361.00191.000510041
1.00621.00761.01261.0201
1.01101.0033.9991.9940.9922
.99871.0002.99729955
1.001710002.99839964
1.0016
Nonbank travelerschecks
.9434
.9497
.9561
.96269692
.9760
.9769
.97799789
.9799
.9847
.9896
.9945
.99951 00401.00871.01331 0180
1.02281.02101.01931.0176
1.01581.01841.02111.02381.0264
1.02531.02421.02311 0219
1.02081 01851.01621.0139
1.0116
Demand deposits
1.0148.9884.9970.9846
1 0023
.99381.0009.99269874
1.0159.9834
1.0007.9865
1.01659910
1.0059.9984
1 0386
1.01031 01941.04621.0554
1.08911.01601.0054
99111.0013
.9822
.9795
.97029882
.98469960.98269752
1.0092
Other checkable deposits'
Total At banks
1.0041 1.0024.9902 .9841.9850 .9823.9846 .98739952 .9985
.9964 .9876
.9916 .9879
.9904 .99429893 .9947
1.0022 .9956.9861 .9809.9884 .9879.9870 .9925
1.0052 1.00579962 .9908.9932 .9904.9925 .9969
10039 1.0052
1.0023 .99239920 .9895
1.00451.0132
1.04271.01551.0082
99951.0058
.9954
.9874
.99001 0020
.0074
.0209
.0454
.0166
.0137
.0118
.0161
.9989
.9890
.99751.0072
1.0010 .99719969 .9962
1.0001 1.00351 0103 1.0150
1.0232 1.0140
1. Seasonally adjusted other checkable deposits at thrift institutions arederived as the difference between total other checkable deposits, seasonally
adjusted, and seasonally adjusted other checkable deposits at commercial banks.
4. Weekly seasonal factors used to construct M2 and M3, December 7, 1998-April 3, 2000
Week ending
1998—December 7142128
1999—January 4
1825
February 18
1522
March 18
152229
April 5121926
Savings andMMDAdeposits'
Small-denominationtime deposits'
Large-denominationtime deposits'
Money market mutual funds
In M2 In M3 onlyRPs
1.0137 1.0002 1.0036 1.0017 1.02191.0068 .9997 1.0025 1.0054 1.0378.9925 .9988 .9925 1.0019 1.0090.9792 .9977 .9834 .9970 1.0054
.9927 .9982 .9735 .9854 .96851.0096 1.0006 .9773 1.0027 1.03191.0048 1.0016 .9741 1.0076 1.0383.9855 1.0019 .9735 1.0057 1.0440
.9839 1.0021 .9756 1.0024 1.02421.0074 1.0024 .9814 1.0058 1.03271.0012 1.0024 .9922 1.0070 1.0341.9885 1.0022 .9942 1.0113 1.0352
.9913 1.0019 1.0017 1.0114 1.03051.0197 1.0020 1.0068 1.0207 1.02621.0164 1.0016 1.0105 1.0194 1.02311.0039 1.0011 1.0086 1.0174 1.0169.9958 1.0008 1.0092 1.0149 1.0037
1.0273 1.0013 1.0075 1.0171 .99721.0299 1.0012 1.0035 1.0298 1.01831.0156 1.0002 .9986 1.0196 .9938.9886 .9993 .9960 1.0047 .9860
Eurodollars
.9910 1.0180
.9852 1.0294
.9738 1.0204
.9592 1.0307
.9586 1.0292
.9979 1.0202
.0096 1.0337
.0189 1.0434
.0184 1.0372
.0115 1.0205
.0011 1.0203
.9892 1.0127
.9883 1.0156
.9991 .9915
.0100 .9930
.0178 .9908
.0120 .9960
.0058 .9910
.0073 .9829
.0072 .9763
.0097 .9918
Digitized for FRASER http://fraser.stlouisfed.org/ Federal Reserve Bank of St. Louis
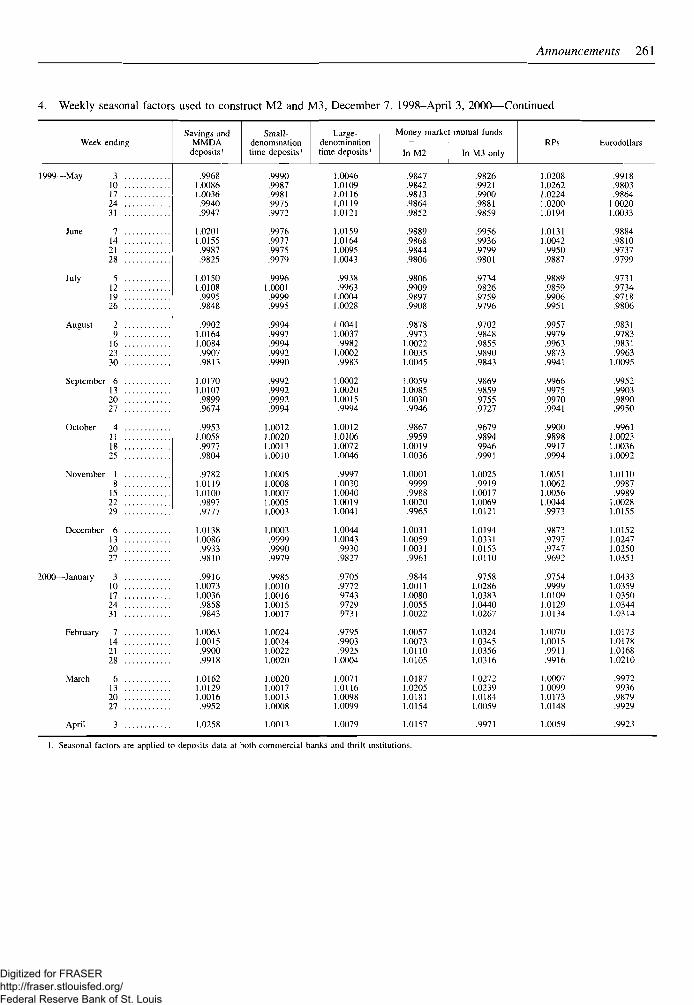
Announcements 261
4. Weekly seasonal factors used to construct M2 and M3, December 7, 1998-April 3, 2000—Continued
Week endingSavings and
MMDAdeposits'
Small-denominationtime deposits'
Large-denominationtime deposits'
Money marke
In M2
.9847
.9842
.9813
.9864
.9852
.9889
.9868
.9844
.9806
.9806
.9909
.9897
.9908
.9878
.99731.00221.00351.0045
1.00591.00851.0030.9946
.9867
.99591.00191.0036
1.0001.9999.99881.0020.9965
1.00311.00591.0031.9961
.98441.00111.00801.00551.0022
1.00571.00731.01101.0105
1.01871.02051.01811.0154
mutual funds
In M3 onlyRPs
.9826 1.0208
.9921
.9900
.9881
.9859
.9956
.9936
.0262
.0224
.0200
.0194
.0131
.0042.9799 .9950.9801 .9887
.9734 .9889
.9826 .9859
.9759 .9906
.9796 .9951
.9702 .9957
.9848 .9979
.9855 .9963
.9890 .9873
.9843 .9941
.9869 .9966
.9859 .9975
.9755 .9970
.9727 .9941
.9679 .9900
.9894 .9898
.9946 .9917
.9991 .9994
1.0025 1.0051.9919 1.00621.0017 1.00561.0069 1.00441.0121 .9973
1.0194 .98731.0331 .97971.0153 .97471.0110 .9692
.9758 .97541.0286 .99991.0383 1.01091.0440 .01291.0267 1.0134
1.0324 1.00701.0345 1.00151.0356 .99111.0316 .9916
1.0272 1.00071.0239 1.00991.0184 1.01731.0059 1.0148
Eurodollars
.9918
.9803
.98641.00201.0033
.9884
.9810
.9737
.9799
.9731
.9734
.9718
.9806
.9831
.9783
.9831
.99631.0095
.9952
.9903
.9890
.9950
.99611.00231.00361.0092
1.0110.9987.99891.00281.0155
1.01521.02471.02501.0351
1.0433.0359.0350.0344.0314
.0173
.0178
.0168
.0210
.9972
.9936
.9879
.9929
1999—May
June
July
August
310172431
7142128
5121926
2
9162330
October 4111825
February 7 . .14 . .21 . .28 . .
.99681.00861.0036.9940.9947
1.02011.0155.9987.9825
1.01501.0108.9995.9848
.99021.01641.0084.9907.9813
September 6132027
.0170,0107
November 18
152229
December 6132027
2000—January 310172431
March 6132027
.9674
.9953
.0058
.9977
.9804
.9782
.0119
.0100
.9897
.9777
.0138
.0086
.9933
.9810
.9916
.0073
.0036
.9858
.9843
.0063
.0015
.9900
.9918
.0162
.0129
.0016
.9952
April 3 1.0258
.9990
.9987
.9981
.9975
.9972
.9976
.9977
.9975
.9979
.99961.0001.9999.9995
.9994
.9997
.9994
.9992
.9990
.9992
.9992
.9992
.9994
.0012
.0020
.0013
.0010
.0005
.0008
.00071.00051.0003
1.0003.9999.9990.9979
.9985
.0010
.0016
.0015
.0017
.0024
.0024
.0022
.0020
.0020
.0017
.0013
.0008
1.0013
1.00461.01091.01161.01191.0121
1.01591.01641.00951.0043
.9938
.99631.00041.0028
1.00411.0037.9982
1.0002.9983
1.00021.00201.0015.9994
1.00121.01061.00721.0046
.99971.00301.00401.00191.0041
1.00441.0043.9930.9827
.9705
.9772
.9743
.9729
.9731
.9795
.9903
.99251.0004
1.00711.01161.00981.0099
1.0079 1.0157 .9971 1.0059 .9923
1. Seasonal factors are applied to deposits data at both commercial banks and thrift institutions.
Digitized for FRASER http://fraser.stlouisfed.org/ Federal Reserve Bank of St. Louis
Legal Developments
263
FINAL RULE — AMENDMENTS TO RISK-BASEDCAPITAL STANDARDS
The Office of the Comptroller of the Currency ("OCC"),the Board of Governors of the Federal Reserve System("Board"), the Federal Deposit Insurance Corporation("FDIC"), and the Office of Thrift Supervision ("OTS")(collectively, "the agencies"), are amending 12 C.F.R.Parts 3, 208, 325, and 567, their respective risk-based andleverage capital standards for banks and thrifts (institu-tions).1 This final rule represents a significant step inimplementing section 303 of the Riegle Community Devel-opment and Regulatory Improvement Act of 1994, whichrequires the agencies to work jointly to make uniform theirregulations and guidelines implementing common statu-tory or supervisory policies. The intended eifect of thisfinal rule is to make the risk-based capital treatments forconstruction loans on presold residential properties, realestate loans secured by junior liens on 1- to 4-familyresidential properties, and investments in mutual fundsconsistent among the agencies. It is also intended to sim-plify and make uniform the agencies' Tier 1 leveragecapital standards.
Effective April 1, 1999, 12 C.F.R. Parts 3, 208, 325, and567 are amended as follows:
Part 3 — Minimum Capital Ratios; Issuance ofDirectives
1. The authority citation for Part 3 continues to read asfollows:
Authority: 12U.S.C. 93a, 161, 1818, 1828(n), 1828 note,183In note, 1835, 3907 and 3909.
2. In section 3.6, paragraph (c) is revised to read asfollows:
Section 3.6 Minimum capital ratios.
* * * * *
(c) Additional leverage ratio requirement. An institutionoperating at or near the level in paragraph (b) of thissection should have well-diversified risks, including noundue interest rate risk exposure; excellent control sys-
1. An amended risk-based capital standard for bank holding compa-nies is included in a separate Board notice; references to "institu-tions" in this final rule generally do not apply to bank holdingcompanies.
terns; good earnings; high asset quality; high liquidity; andwell managed on- and off-balance sheet activities; and ingeneral be considered a strong banking organization, ratedcomposite 1 under the Uniform Financial Institutions Rat-ing System (CAMELS) rating system of banks. For all butthe most highly-rated banks meeting the conditions setforth in this paragraph (c), the minimum Tier 1 leverageratio is 4 percent. In all cases, banking institutions shouldhold capital commensurate with the level and nature of allrisks.
3. In Appendix A to part 3, section 3, the second undesig-nated paragraph and paragraphs (a)(3)(iii) and (a)(3)(iv)introductory text are revised to read as follows:
Appendix A to Part 3 — Risk-Based CapitalGuidelines
Section 3. Risk Categories/Weights for On-BalanceSheet Assets and Off-Balance Sheet Items
Some of the assets on a bank's balance sheet may representan indirect holding of a pool of assets, e.g., mutual funds,that encompasses more than one risk weight within thepool. In those situations, the bank may assign the asset tothe risk category applicable to the highest risk-weightedasset that pool is permitted to hold pursuant to its statedinvestment objectives in the fund's prospectus. Alterna-tively, the bank may assign the asset on a pro rata basis todifferent risk categories according to the investment limitsin the fund's prospectus. In either case, the minimum riskweight that may be assigned to such a pool is 20 percent. Ifa bank assigns the asset on a pro rata basis, and the sum ofthe investment limits in the fund's prospectus exceeds100 percent, the bank must assign the highest pro rataamounts of its total investment to the higher risk category.If, in order to maintain a necessary degree of liquidity, thefund is permitted to hold an insignificant amount of itsassets in short-term, highly-liquid securities of superiorcredit quality (that do not qualify for a preferential riskweight), such securities generally will not be taken intoaccount in determining the risk category into which thebank's holding in the overall pool should be assigned. Theprudent use of hedging instruments by a fund to reduce therisk of its assets will not increase the risk weighting of theinvestment in that fund above the 20 percent category.However, if a fund engages in any activities that are
Digitized for FRASER http://fraser.stlouisfed.org/ Federal Reserve Bank of St. Louis
264 Federal Reserve Bulletin • April 1999
deemed to be speculative in nature or has any other charac-teristics that are inconsistent with the preferential riskweighting assigned to the fund's assets, the bank's invest-ment in the fund will be assigned to the 100 percent riskcategory. More detail on the treatment of mortgage-backedsecurities is provided in section 3(a)(3)(vi) of this Appen-dix A.
(a)* * *(3)* * *
(iii) Loans secured by first mortgages on one-to-fourfamily residential properties, either owner-occupied or rented, provided that such loans arenot otherwise 90 days or more past due, or onnonaccrual or restructured. It is presumed thatsuch loans will meet prudent underwriting stan-dards. If a bank holds a first lien and junior lienon a one-to-four family residential property andno other party holds an intervening lien, thetransaction is treated as a single loan secured bya first lien for the purposes of both determiningthe loan-to-value ratio and assigning a riskweight to the transaction. Furthermore, residen-tial property loans made for the purpose of con-struction financing are assigned to the 100 per-cent risk category of section 3(a)(4) of thisAppendix A; however, these loans may be in-cluded in the 50 percent risk category of thissection 3(a)(3) of this Appendix A if they aresubject to a legally binding sales contract andsatisfy the requirements of section 3(a)(3)(iv) ofthis Appendix A.
(iv) Loans to residential real estate builders for one-to-four family residential property construction,if the bank obtains sufficient documentationdemonstrating that the buyer of the home intendsto purchase the home (i.e., a legally bindingwritten sales contract) and has the ability toobtain a mortgage loan sufficient to purchase thehome (i.e., a firm written commitment for per-manent financing of the home upon completion),subject to the following additional criteria:
Part 208 — Membership of State BankingInstitutions in the Federal Reserve System(Regulation H)
1. The authority citation for Part 208 is revised to read asfollows:
Authority: 12 U.S.C. 24, 36, 92a, 93a, 248(a), 248(c), 321-338a, 371d, 461, 481-186, 601, 611, 1814, 1816, 1818,1820(d), 1823(j), 1828(o), 1831o, 1831p-l, 1831r-l,1835a, 1882, 2901-2907, 3105, 3310, 3331-3351, and3906-3909; 15 U.S.C. 78b, 781(b), 781(g), 781(i), 78o-
4(c)(5), 78q, 78q-l, and 78w; 31 U.S.C. 5318; 42 U.S.C.4012a, 4104a, 4104b, 4106, and 4128.
2. In Appendix A to Part 208, section III. A., footnote 21 isrevised to read as follows:
Appendix A to Part 208 - Capital AdequacyGuidelines for State Member Banks: Risk-BasedMeasure
III. * * *A * * *2I
3. In Appendix A to part 208, section II1.C.3., footnote 34is revised to read as follows:
* * *Q * * *
3 * * * 34
4. In Appendix A to Part 208, section III.C.3. is amendedby adding a new sentence to the end of the first paragraphof footnote 35 to read as follows:
21. An investment in shares of a fund whose portfolio consistsprimarily of various securities or money market instruments that, ifheld separately, would be assigned to different risk categories, gener-ally is assigned to the risk category appropriate to the highest risk-weighted asset that the fund is permitted to hold in accordance withthe stated investment objectives set forth in its prospectus. A bankmay, at its option, assign a fund investment on a pro rata basis todifferent risk categories according to the investment limits in thefund's prospectus. In no case will an investment in shares in any fundbe assigned to a total risk weight less than 20 percent. If a bankchooses to assign a fund investment on a pro rata basis, and the sum ofthe investment limits of assets in the fund's prospectus exceeds100 percent, the bank must assign risk weights in descending order. If,in order to maintain a necessary degree of short-term liquidity, a fundis permitted to hold an insignificant amount of its assets in short-term,highly liquid securities of superior credit quality that do not qualifyfor a preferential risk weight, such securities generally will be disre-garded when determining the risk category into which the bank'sholding in the overall fund should be assigned. The prudent use ofhedging instruments by a fund to reduce the risk of its assets also willnot increase the risk weighting of the fund investment. For example,the use of hedging instruments by a fund to reduce the interest raterisk of its government bond portfolio will not increase the risk weightof that fund above the 20 percent category. Nonetheless, if a fundengages in any activities that appear speculative in nature or has anyother characteristics that are inconsistent with the preferential riskweighting assigned to the fund's assets, holdings in the fund will beassigned to the 100 percent risk category.
34. If a bank holds the first and junior lien(s) on a residentialproperty and no other party holds an intervening lien, the transactionis treated as a single loan secured by a first lien for the purposes ofdetermining the loan-to-value ratio and assigning a risk weight.
Digitized for FRASER http://fraser.stlouisfed.org/ Federal Reserve Bank of St. Louis
Legal Developments 265
III. * * *C. * * *
2 * * * 35
4. In Appendix B to Part 208, section Il.a. is revised to readas follows:
Appendix B to Part 208 — Capital AdequacyGuidelines for State Member Banks: Tier 1Leverage Measure
(2) For all but the most highly-rated institutionsmeeting the conditions set forth in paragraph(b)(l) of this section, the minimum leveragecapital requirement for a bank (or for an insureddepository institution making an application tothe FDIC) shall consist of a ratio of Tier 1capital to total assets of not less than 4 percent.
3. In Appendix A to part 325, section U.S., paragraph 1. isrevised to read as follows:
a. The minimum ratio of Tier 1 capital to total assets forstrong banking institutions (rated composite " 1 "under the UFIRS rating system of banks) is 3.0percent. For all other institutions, the minimum ratioof Tier 1 capital to total assets is 4.0 percent. Bank-ing institutions with supervisory, financial, opera-tional, or managerial weaknesses, as well as institu-tions that are anticipating or experiencing significantgrowth, are expected to maintain capital ratios wellabove the minimum levels. Moreover, higher capitalratios may be required for any banking institution ifwarranted by its particular circumstances or risk pro-file. In all cases, institutions should hold capitalcommensurate with the level and nature of the risks,including the volume and severity of problem loans,to which they are exposed.
Part 325 — Capital Maintenance
1. The authority citation for Part 325 continues to read asfollows:
Authority: 12U.S.C. 1815(a), 1815(b), 1816, 1818(a),1818(b), 1818(c), 1818(t), 1819(Tenth), 1828(c), 1828(d),1828(i), 1828(n), 1828(o), 1831o, 1835, 3907, 3909, 4808;Pub. L. 102-233, 105 Stat. 1761, 1789, 1790 (12U.S.C.183 In note); Pub. L. 102-242, 105 Stat. 2236, 2355, 2386(12U.S.C. 1828 note).
2. Paragraph (b)(2) in 325.3 is revised to read as follows:Section 325.3 Minimum leverage capital requirement.
(b)*
35. * * * Such loans to builders will be considered prudentlyunderwritten only if the bank has obtained sufficient documentationthat the buyer of the home intends to purchase the home (i.e., has alegally binding written sales contract) and has the ability to obtaina mortgage loan sufficient to purchase the home (i.e., has a firmwritten commitment for permanent financing of the home upon com-pletion). * * *
Appendix A to Part 325 — Statement of Policy onRisk-Based Capital
B * * *1. Indirect Holdings of Assets. Some of the assets on
a bank's balance sheet may represent an indirectholding of a pool of assets; for example, mutualfunds. An investment in shares of a mutual fundwhose portfolio consists solely of various securi-ties or money market instruments that, if heldseparately, would be assigned to diiferent riskcategories, generally is assigned to the risk cate-gory appropriate to the highest risk-weighted as-set that the fund is permitted to hold in accor-dance with the stated investment objectives setforth in its prospectus. The bank may, at its op-tion, assign the investment on a pro rata basis todifferent risk categories according to the invest-ment limits in the fund's prospectus, but in nocase will indirect holdings through shares in anymutual fund be assigned to a risk weight less than20 percent. If the bank chooses to assign its in-vestment on a pro rata basis, and the sum of theinvestment limits in the fund's prospectus exceeds100 percent, the bank must assign risk weights indescending order. If, in order to maintain a neces-sary degree of short-term liquidity, a fund is per-mitted to hold an insignificant amount of its assetsin short- term, highly liquid securities of superiorcredit quality that do not qualify for a preferentialrisk weight, such securities will generally be dis-regarded in determining the risk category to whichthe bank's holdings in the overall fund should beassigned. The prudent use of hedging instrumentsby a mutual fund to reduce the risk of its assetswill not increase the risk weighting of the mutualfund investment. For example, the use of hedginginstruments by a mutual fund to reduce the inter-est rate risk of its government bond portfolio willnot increase the risk weight of that fund above the20 percent category. Nonetheless, if the fund en-gages in any activities that appear speculative innature or has any other characteristics that areinconsistent with the preferential risk weighting
Digitized for FRASER http://fraser.stlouisfed.org/ Federal Reserve Bank of St. Louis
266 Federal Reserve Bulletin • April 1999
assigned to the fund's assets, holdings in the fundwill be assigned to the 100 percent risk category.
4. In Appendix A to Part 325, section II.C, footnotenumber 26 is revised to read as follows:
II. * * *Q * * * 26 * * *
Part 567 — Capital
1. The authority citation for Part 567 continues to read asfollows:
Authority: 12 U.S.C. 1462,1462a, 1463, 1464, 1467a, 1828(note).
2. Section 567.1 is amended by adding a new sentencefollowing the third sentence in the definition of qualifyingmortgage loan, revising paragraphs (l)(ii) and (l)(iii) intro-ductory text in the definition of qualifying residential con-struction loan and adding the definitions of Tier 1 capitaland Tier 2 capital as follows:
Section 567.1 — Definitions.
* * * * *
Qualifying mortgage loan. * * * If a savings associationholds the first and junior lien(s) on a residential propertyand no other party holds an intervening lien, the transactionis treated as a single loan secured by a first lien for thepurposes of determining the loan-to-value ratio and theappropriate risk weight under section 567.6(a).
* * * * *
Qualifying residential construction loan.
( 1 ) * * *(ii) The residence being constructed must be a \-4
family residence sold to a home purchaser;(iii) The lending savings association must obtain
sufficient documentation from a permanentlender (which may be the construction lender)demonstrating that:
Tier 1 capital. The term Tier 1 capital means core capitalas computed in accordance with section 567.5(a) of thispart. Tier 2 capital. The term Tier 2 capital means supple-mentary capital as computed in accordance with section567.5 of this part.
3. Section 567.2(a)(2)(ii) is revised to read as follows:
Section 567.2 — Minimum regulatory capitalrequirement.
(a)* * *(2) Leverage ratio requirement. * * *
(ii) A savings association must satisfy this require-ment with core capital as defined in section567.5(a) of this part.
* * * * *
26. If a bank holds the first and junior lien(s) on a residentialproperty and no other party holds an intervening lien, the transactionsare treated as a single loan secured by a first lien for purposes ofdetermining the loan-to-value ratio and assigning a risk weight.
4. Section 567.6(a)(l)(vi) is revised to read as follows:
Section 567.6 Risk-based capital credit risk-weightcategories.
(a)* * *(1)***
(vi) Indirect ownership interests in pools of assets.Assets representing an indirect holding of a poolof assets, e.g., mutual funds, are assigned torisk-weight categories under this section basedupon the risk weight that would be assigned tothe assets in the portfolio of the pool. An invest-ment in shares of a mutual fund whose portfolioconsists primarily of various securities or moneymarket instruments that, if held separately,would be assigned to different risk-weight cate-gories, generally is assigned to the risk-weightcategory appropriate to the highest risk-weighted asset that the fund is permitted to holdin accordance with the investment objectives setforth in its prospectus. The savings associationmay, at its option, assign the investment on apro rata basis to different risk-weight categoriesaccording to the investment limits in its pro-spectus. In no case will an investment in sharesin any such fund be assigned to a total riskweight less than 20 percent. If the savings asso-ciation chooses to assign investments on a prorata basis, and the sum of the investment limitsof assets in the fund's prospectus exceeds100 percent, the savings association must assignthe highest pro rata amounts of its total invest-ment to the higher risk categories. If, in order tomaintain a necessary degree of short-term li-quidity, a fund is permitted to hold an insignifi-cant amount of its assets in short-term, highlyliquid securities of superior credit quality thatdo not qualify for a preferential risk weight,such securities will generally be disregarded indetermining the risk-weight category into whichthe savings association's holding in the overallfund should be assigned. The prudent use ofhedging instruments by a mutual fund to reducethe risk of its assets will not increase the riskweighting of the mutual fund investment. For
Digitized for FRASER http://fraser.stlouisfed.org/ Federal Reserve Bank of St. Louis
Legal Developments 267
example, the use of hedging instruments by amutual fund to reduce the interest rate risk of itsgovernment bond portfolio will not increase therisk weight of that fund above the 20 percentcategory. Nonetheless, if the fund engages inany activities that appear speculative in natureor has any other characteristics that are inconsis-tent with the preferential risk-weighting as-signed to the fund's assets, holdings in the fundwill be assigned to the 100 percent risk-weightcategory.
5. Section 567.8 is revised to read as follows:
Section 567.8 — Leverage ratio.
(a) The minimum leverage capital requirement for a sav-ings association assigned a composite rating of 1, as de-fined in section 516.3 of this chapter, shall consist of a ratioof core capital to adjusted total assets of 3 percent. Thesegenerally are strong associations that are not anticipatingor experiencing significant growth and have well-diversified risks, including no undue interest rate risk expo-sure, excellent asset quality, high liquidity, and good earn-ings.(b) For all savings associations not meeting the conditionsset forth in paragraph (a) of this section, the minimumleverage capital requirement shall consist of a ratio of corecapital to adjusted total assets of 4 percent. Higher capitalratios may be required if warranted by the particular cir-cumstances or risk profiles of an individual savings associ-ation. In all cases, savings associations should hold capitalcommensurate with the level and nature of all risks, includ-ing the volume and severity of problem loans, to whichthey are exposed.
FINAL RULE—AMENDMENT TO REGULATION Y
The Board of Governors of the Federal Reserve System(Board) is amending 12C.F.R. Pan 225, its Regulation Y(Risk-Based Capital Standards; Construction Loans on Pre-sold Residential Properties; Junior Liens on 1- to 4-FamilyResidential Properties; and Investments in Mutual Funds).The intended effect of this final rule is to keep the Board'sbank holding company risk-based capital standards forconstruction loans on presold residential properties, realestate loans secured by junior liens on 1- to 4-familyresidential properties, and investments in mutual fundsconsistent with the risk-based capital standards for banksand thrifts.
Effective April 1, 1999, 12C.F.R. Part 225 is amendedas follows:
Part 225 — Bank Holding Companies and Changein Bank Control (Regluation Y)
1. The authority citation for Part 225 continues to read asfollows:
Authority: 12U.S.C. 1817(j)(13). 1818, 1828(o). 1831i,1831p-l, I843(c)(8), 1844(b), 1972(1), 3106, 3108, 3310,3331-3351,3907, and 3909.
2. In Appendix A to Part 225, section III.A., footnote 24 isrevised to read as follows:
Appendix A to Part 225 — Capital Adequacy Guidelinesfor Bank Holding Companies: Risk-Based Measure
III. * * *^ * * * 2*
* * * * *
* * * *3. In Appendix A to Part 225, section ITI.C.3. footnote 37 isrevised to read as follows:
* * * * *III. * * *
Q ***J * * * 37
4. In Appendix A to Part 225, section III.C.3. is amendedby adding a new sentence to the end of footnote 38 to readas follows:
24. An investment in shares of a fund whose portfolio consistsprimarily of various securities or money market instruments that, ifheld separately, would be assigned to different risk categories, gener-ally is assigned to the risk category appropriate to the highest risk-weighted asset that the fund is permitted to hold in accordance withthe stated investment objectives set forth in the prospectus. An organi-zation may, at its option, assign a fund investment on a pro rata basisto different risk categories according to the investment limits in thefund's prospectus. In no case will an investment in shares in any fundbe assigned to a total risk weight of less than 20 percent. If anorganization chooses to assign a fund investment on a pro rata basis,and the sum of the investment limits of assets in the fund's prospectusexceeds 100 percent, the organization must assign risk weights indescending order. If. in order to maintain a necessary degree ofshort-term liquidity, a fund is permitted to hold an insignificantamount of its assets in short-term, highly liquid securities of superiorcredit quality that do not qualify for a preferential risk weight, suchsecurities generally will be disregarded when determining the riskcategory into which the organization's holding in the overall fundshould be assigned. The prudent use of hedging instruments by a fundto reduce the risk of its assets will not increase the risk weighting ofthe fund investment. For example, the use of hedging instruments by afund to reduce the interest rate risk of its government bond portfoliowill not increase the risk weight of that fund above the 20 percentcategory. Nonetheless, if a fund engages in any activities that appearspeculative in nature or has any other characteristics that are inconsis-tent with the preferential risk weighting assigned to the fund's assets,holdings in the fund will be assigned to the 100 percent risk category.
37. If a banking organization holds the first and junior lien(s) on aresidential property and no other party holds an intervening lien, thetransaction is treated as a single loan secured by a first lien for thepurposes of determining the loan-to-value ratio and assigning a riskweight.
Digitized for FRASER http://fraser.stlouisfed.org/ Federal Reserve Bank of St. Louis
268 Federal Reserve Bulletin • April
III. * * *C * * *
3 * * * 38
ORDERS ISSUED UNDER BANK HOLDING COMPANYACT
Orders Issued Under Section 3 of the Bank HoldingCompany Act
First Banks, Inc.Creve Coeur, Missouri
First Banks America, Inc.Clayton, Missouri
Order Approving Acquisition of a Bank HoldingCompany
First Banks, Inc., and First Banks America, Inc. (collective-ly, "First Banks"), bank holding companies within themeaning of the Bank Holding Company Act ("BHC Act"),have requested the Board's approval under section 3 of theBHC Act (12 U.S.C. § 1842) to acquire Redwood Bancorp("Redwood"), and thereby indirectly acquire Redwood'ssubsidiary bank, Redwood Bank ("Bank"), both inSan Francisco, California.
Notice of the proposal, affording interested persons anopportunity to submit comments, has been published(63 Federal Register 55,389 (1998)). The time for filingcomments has expired, and the Board has considered theproposal and all comments received in light of the factorsset forth in section 3 of the BHC Act.
First Banks, with total consolidated assets of approxi-mately $4.3 billion, operates subsidiary banks in Missouri,California and Texas.1 First Banks is the 37th largestcommercial banking organization in California, controllingdeposits of $974.4 million, representing less than 1 percentof total deposits in commercial banking organizations inthe state. Redwood is the 74th largest commercial bankingorganization in California, controlling deposits of$384 million, representing less than 1 percent of totaldeposits in commercial banking organizations in the state.On consummation of the proposal. First Banks wouldbecome the 28th largest commercial banking organizationin California, controlling deposits of $1.36 billion, repre-senting less than 1 percent of total deposits in the state.
38. * * * Such loans to builders will be considered prudentlyunderwritten only if the bank holding company has obtained sufficientdocumentation that the buyer of the home intends to purchase thehome (i.e., has a legally binding written sales contract) and has theability to obtain a mortgage loan sufficient to purchase the home (i.e.,has a firm written commitment for permanent financing of the homeupon completion).
Interstate Analysis
Section 3(d) of the BHC Act allows the Board to approvean application by a bank holding company to acquirecontrol of a bank located in a state other than the homestate of such bank holding company if certain conditionsare met.2 For purposes of the BHC Act, the home state ofFirst Banks is Missouri, and First Banks proposes to ac-quire a bank in California. All conditions for an interstateacquisition enumerated in section 3(d) are met in this case.3
In light of all the facts of record, the Board is permitted toapprove this proposal under section 3(d) of the BHC Act.
Competitive Factor
Section 3 of the BHC Act prohibits the Board from approv-ing a proposal that would result in a monopoly, or wouldbe in furtherance of any attempt to monopolize the busi-ness of banking.4 The BHC Act also prohibits the Boardfrom approving a proposal that would substantially lessencompetition in any relevant banking market, unless theBoard finds that the anticompetitive effects of the proposalin that banking market are clearly outweighed in the publicinterest by the probable effect of the proposal in meetingthe convenience and needs of the community to be served.5
First Banks and Redwood compete directly in theSan Francisco-Oakland-San Jose banking market.6 TheBoard has carefully reviewed the competitive effects ofthe proposal in this banking market in light of all the factsof record, including the characteristics of the market andthe projected increase in the concentration of total depositsin depository institutions7 in the market ("market depos-
1. All banking data are as of June 30, 1997.
2. 12 U.S.C. § 1842(d). A bank holding company's home state isthat state in which the operations of the bank holding company'sbanking subsidiaries were principally conducted on July 1, 1966, orthe date on which the company became a bank holding company,whichever is later.
3. 12 U.S.C. §§ 1842(d)(l)(A) and (B) and 1842(d)(2)(A) and (B).First Banks meets the capital and managerial requirements establishedby applicable law. On consummation of the proposal, First Banks andits affiliates would control less than 10 percent of the total amount ofdeposits of insured depository institutions in the United States, andless than 30 percent of the total amount of deposits in California. SeeCal. Financial Code § 3753 (West 1999). All other requirements ofsection 3(d) of the BHC Act also would be met on consummation ofthe proposal.
4. 12 U.S.C. § 1842(c)(l)(A).5. 12 U.S.C. § 1842(c)(l)(B).6. The San Francisco-Oakland-San Jose banking market is approxi-
mated by the San Francisco-Oakland-San Jose Ranally MetropolitanArea, including the city of Pescardero.
7. For this purpose, depository institution includes all insured banks,savings banks, and saving associations. Market share data are basedon calculations that include the deposits of thrift institutions at50 percent. The Board previously has indicated that thrift institutionshave become, or have the potential to become, significant competitorsof commercial banks. See, e.g., Midwest Financial Croup, 75 FederalResen'e Bulletin 386 (1989); National City Corporation, 70 FederalReserve Bulletin 743 (1984). Thus, the Board has regularly includedthrift deposits in the calculation of market share on a 50-percentweighted basis. See, e.g., First Hawaiian, Inc., 77 Federal ReserveBulletin 52 (1991).
Digitized for FRASER http://fraser.stlouisfed.org/ Federal Reserve Bank of St. Louis
Legal Developments 269
its") as measured by the Herfindahl-Hirschman Index("HHI") under the Department of Justice Merger Guide-lines ("DOJ Guidelines").8 Consummation of the proposalwould be consistent with the DOJ Guidelines and priorBoard precedent in the San Francisco-Oakland-San Josebanking market.9 The HHI would remain unchanged at1579. The DOJ has reviewed the proposal and advised theBoard that consummation of the proposal would not likelyhave a significantly adverse competitive effect in theSan Francisco-Oakland-San Jose banking market or anyother relevant market.
Based on these and all the facts of record, the Boardconcludes that consummation of the proposal would notresult in any significantly adverse effects on competitionor on the concentration of banking resources in theSan Francisco-Oakland-San Jose banking market, or in anyother relevant banking market, and that competitive factorsare consistent with approval of the proposal.
Financial, Managerial and Other Considerations
The BHC Act also requires the Board to consider thefinancial and managerial resources and future prospects ofthe companies and banks involved in the proposal, theconvenience and needs of the communities to be served,and certain supervisory factors. The Board has reviewedcarefully these factors in light of all the factors of record,including supervisory reports of examination assessing thefinancial and managerial resources of the organizations andconfidential financial information provided by First Banks.Based on these and all the other facts of record, the Boardconcludes that the financial and managerial resources andfuture prospects of First Banks, Redwood and their subsid-iary banks are consistent with approval, as are the othersupervisory factors that the Board must consider undersection 3 of the BHC Act.10
8. Under the DOJ Guidelines, 49 Federal Register 26,823 (1984), amarket in which the post-merger HHI is between 1000 and 1800 isconsidered to be moderately concentrated. The Department of Justice("DOJ") has informed the Board that a bank merger or acquisitiongenerally will not be challenged (in the absence of other factorsindicating anticompetitive effects) unless the post-merger HHI is atleast 1800 and the merger or acquisition increases the HHI by at least200 points. The DOJ has stated that the higher than normal HHIthresholds for screening bank mergers or acquisitions for anticompeti-tive effects implicitly recognize the competitive effects of limited-purpose lenders and other nondepository financial institutions.
9. On consummation of the proposal, First Banks would become the31st largest depository institution in the San Francisco-Oakland-San Jose banking market, controlling deposits of $205 million, repre-senting less than 1 percent of market deposits. The HHI would remainunchanged at 1579.
10. The Board has received a letter from a director of Bankrequesting an indefinite suspension of the acquisition. The directorstates that he was placed on the board of directors of Bank as arepresentative of the Republic of the Philippines (the "Philippines")in accordance with a consent order issued by a United States DistrictCourt. The director requested that the processing of the application besuspended until the appropriate authorities in the Philippines havereviewed the transaction. The Board has contacted the appropriate
In considering the convenience and needs factor, theBoard has reviewed the records of First Banks's subsidiarybanks and Bank under the Community Reinvestment Act("CRA").U The Board notes that First Banks does notintend to make any material changes in the products andservices provided by Bank. The Board has evaluated theconvenience and needs factor in light of examinations ofthe CRA performance records of First Banks's subsidiarybanks and Bank. Each of First Banks's subsidiary banksreceived a rating of "satisfactory" at its most recent exam-ination for CRA performance in 1998 from its federalsupervisory agency. Bank received a rating of "satisfacto-ry" at its most recent examination of CRA performance asof March 4, 1997, by the Federal Deposit Insurance Corpo-ration. Based on all the facts of record, the Board con-cludes that convenience and needs considerations, includ-ing the CRA performance records of the relevantinstitutions, are consistent with approval of the proposal.
Conclusion
Based on the foregoing, and in light of all the facts ofrecord the Board has determined that the applicationsshould be, and hereby, are approved. Approval of theapplications is specifically conditioned on compliance byFirst Banks with all the commitments made in connectionwith the proposal. For purposes of this order, the commit-ments and conditions referred to above shall be deemed tobe conditions imposed in writing by the Board in connec-tion with its findings and decision and, as such, may beenforced in proceedings under applicable law.
The acquisition of Redwood shall not be consummatedbefore the fifteenth calendar day after the effective date ofthe order, or later than three months after the effective dateof this order, unless such period is extended for good causeby the Board, or by the Federal Reserve Bank of St. Louisacting pursuant to delegated authority.
By order of the Board of Governors, effective Febru-ary 12, 1999.
Voting for this action: Chairman Greenspan, Vice Chair Rivlin, andGovernors Kelley, Meyer, Ferguson, and Gramlich.
ROBERT DEV. FRIERSONAssociate Secretary of the Board
The Bane CorporationBirmingham, Alabama
Order Approving the Acquisition of a SavingsAssociation
The Bane Corporation ("TBC"), a bank holding companywithin the meaning of the Bank Holding Company Act
authorities in the Philippines and has considered the director's com-ments in light of information provided by the Philippines government.
11. 12U.S.C. §2901 etseq.
Digitized for FRASER http://fraser.stlouisfed.org/ Federal Reserve Bank of St. Louis
270 Federal Reserve Bulletin • April
("BHC Act"'), has requested the Board's approval undersection 4(c)(8) of the BHC Act (12 U.S.C. § 1843(c)(8))and section 225.24 of the Board's Regulation Y (12 C.F.R.225.24)) to merge with Emerald Coast Bancshares, Inc.and thereby acquire its wholly owned savings association.Emerald Coast Bank, both of Panama City Beach, Florida("Emerald") after that institution's conversion from astate-chartered savings bank to a federally chartered sav-ings association.1
Notice of the proposal, affording interested persons anopportunity to submit comments, has been published(63 Federal Register 68,768 (1998)). The time for filingcomments has expired, and the Board has considered theproposal and all comments received in light of the factorsset forth in section 4 of the BHC Act.
TBC currently operates one subsidiary bank in Alabama,with total consolidated assets of $104 million. TBC is the73rd largest commercial banking organization in Alabama,controlling approximately $93 million in deposits, repre-senting less than 1 percent of total deposits in commercialbanking organizations in the state ("state deposits").2 Em-erald is the 173rd largest depository institution in Florida,controlling $31 million in deposits, representing less than1 percent of state deposits.3 TCB and Emerald do notcompete in any relevant banking markets.
The Board previously has determined by regulation thatthe operation of a savings association by a bank holdingcompany is closely related to banking for purposes ofsection 4(c)(8) of the BHC Act.4 In making this determina-tion, the Board requires that savings associations acquiredby bank holding companies conform their direct and indi-rect activities to those permissible for bank holding compa-nies under section 4 of the BHC Act. TBC has committedto conform all of Emerald's activities to those permissibleunder section 4(c)(8) of the BHC Act and Regulation Y.
In order to approve the proposal, the Board must deter-mine that the proposed activities are a proper incident tobanking, that is, that the proposal "can reasonably beexpected to produce benefits to the public, such as greaterconvenience, increased competition, or gains in efficiency,that outweigh possible adverse effects, such as undue con-centration of resources, decreased or unfair competition,conflicts of interests, or unsound banking practices."5 Inassessing the balance of public benefits and adverse effectsof this proposal, the Board has considered comments sub-mitted by the Director of Banking of the Florida Depart-ment of Banking and Finance ("Director"). The Directorexpressed concern that TBC's proposal to convert Emerald
1. The conversion of Emerald from a bank to a savings associationwould occur before the merger. The Office of Thrift Supervision("OTS") approved the conversion of Emerald from a bank to asavings association on December 16, 1998.
2. Asset and deposit data, including rankings, are as of Septem-ber 30, 1998.
3. Deposit data and rankings are as of June 30, 1997. In this context,depository institutions include commercial banks, savings banks, andsavings associations.
4. 12 C.F.R. 225.28(b)(4).5. 12 U.S.C. § 1843(cj(8).
to a savings association and acquire it pursuant to section 4of the BHC Act was designed to evade Florida's interstatebanking statute, which requires a Florida bank to be inexistence and continuously operating for more than threeyears before it can be acquired by an out-of-state holdingcompany.6
The Board has reviewed the Director's comments inlight of the factors that the Board must consider undersection 4 of the BHC Act. The Board concludes that aviolation of law is a factor it must consider in determiningwhether a proposal under section 4(c)(8) would producenet public benefits. In this case, however, the Board doesnot believe that the acquisition of Emerald as a savingsassociation would result in a violation of law. Unlikesection 3 of the BHC Act, section 4 does not apply aminimum age limitation on the ability of out-of-state bankholding companies to acquire savings associations.7 Inaddition, once Emerald has converted to a savings associa-tion, the minimum operating requirement that applies tothe acquisition of banks under Florida state law does notapply. Moreover, TBC has stated that it plans to acquireand operate Emerald as a savings association, and that ithas no plans to convert Emerald back to a bank. TBC maynot operate Emerald as a bank without prior Board ap-proval under section 3 of the BHC Act and without meet-ing the requirements of section 3(d) of the Act. TBC hascommitted that it will maintain Emerald as a savingsassociation until August 31, 1999.
The Board also has considered the financial and manage-rial resources of TBC, its subsidiaries, and Emerald and theeffect the transaction would have on such resources in lightof all the facts of record.8 The Board has reviewed, amongother things, confidential reports of examination and othersupervisory information received from the appropriate su-pervisory authorities for the organizations. Based on all thefacts of record, the Board concludes that the financial andmanagerial resources of the organizations involved in thisproposal are consistent with approval.
The record indicates that consummation of the proposalwould produce benefits for consumers. TBC states that theproposed acquisition of Emerald would allow TBC to offera wider range of deposit accounts and loan products andwould result in improved automated services available toEmerald customers. In addition, the Board has recognizedthat there are public benefits to be derived from permittingcapital markets to operate so that banking organizationsmay make potentially profitable investments in nonbankingcompanies and allocate their resources in the manner theybelieve to be most efficient when such investments areconsistent, as in this case, with the relevant considerations
6. Fla. Stat. Ann. § 658.295(8)(a). Emerald began operations onAugust 30, 1996.
7. Section 3(d) of the BHC Act specifically authorizes a state toenact laws that limit the ability of an out-of-state bank holdingcompany to acquire a bank in that state by requiring that the bank tobe acquired be in existence for a minimum period of time, as long asthat period does not exceed five years. 12 U.S.C. § 1842(d).
8. See 12 C.F.R. 225.26.
Digitized for FRASER http://fraser.stlouisfed.org/ Federal Reserve Bank of St. Louis
Legal Developments 271
under the BHC Act.9 The Board believes that the conductof the proposed activities within the framework establishedin Regulation Y is not likely to result in significantlyadverse effects, such as an undue concentration or re-sources, decreased or unfair competition, conflicts of inter-ests, or unsound banking practices that would outweigh thepublic benefits of the proposal, such as increased consumerconvenience. Accordingly, the Board has determined thatthe balance of factors considered under the proper incidentto banking standards of section 4(c)(8) of the BHC Act isconsistent with approval.
Conclusion
Based on the foregoing and all the facts of record, theBoard has determined that the notice should be, and herebyis, approved. The Board's approval of the proposal isspecifically conditioned on compliance by TBC with thecommitments made in connection with the notice. TheBoard's determination also is subject to all the conditionsin Regulation Y, including those in sections 225.7 and225.25(c) (12C.F.R. 225.7 and 225.25(c)), and to theBoard's authority to require such modification or termina-tion of the activities of a holding company or any of itssubsidiaries as the Board finds necessary to ensure compli-ance with, or to prevent evasion of, the provisions andpurposes of the BHC Act and the Board's regulations andorders issued thereunder. The commitments and conditionsrelied on by the Board in reaching this decision are deemedto be conditions imposed in writing by the Board in con-nection with its findings and decision, and, as such, may beenforced in proceedings under applicable law.
The transaction shall not be consummated later thanthree months after the effective date of this order, unlesssuch period is extended for good cause by the Board or bythe Federal Reserve Bank of Atlanta, acting pursuant todelegated authority.
By order of the Board of Governors, effective Febru-ary 1, 1999.
Voting for this action: Chairman Greenspan, Vice Chair Rivlin, andGovernors Kelley, Meyer, Ferguson, and Gramlich.
ROBERT DEV. FRIERSONAssociate Secretary of the Board
BankAmerica CorporationCharlotte, North Carolina
BancWest CorporationHonolulu, Hawaii
BB&T CorporationWinston-Salem, North Carolina
First Union CorporationCharlotte, North Carolina
SunTrust Banks, Inc.Atlanta, Georgia
Wachovia CorporationWinston-Salem, North Carolina
Zions BancorporationSalt Lake City, Utah
Order Approving Notices to Conduct Certain DataProcessing Activities and Other Nonbanking Activities
BankAmerica Corporation, BancWest Corporation, BB&TCorporation, First Union Corporation, SunTrust Banks,Inc., Wachovia Corporation, and Zions Bancorporation(collectively, "Notificants"), bank holding companieswithin the meaning of the Bank Holding Company Act("BHC Act"), have requested the Board's approval undersection 4(c)(8) of the BHC Act (12 U.S.C. 1843(c)(8)) andsection 225.24 of the Board's Regulation Y (12C.F.R.225.24) to acquire and merge Honor Technologies, Inc.,Maitland, Florida, and Star Systems, Inc., San Diego, Cali-fornia, and to engage in providing data processing services,pursuant to section 225.28(b)(14) of Regulation Y(12 C.F.R. 225.28(b)(14)).' In addition, Notificants,through H&S, would engage in providing check verifica-tion services, in accordance with section 225.28(b)(2) ofRegulation Y (12 C.F.R. 225.28(b)(2)), and managementconsulting services related to the activities of H&S, inaccordance with section 225.28(b)(9) of Regulation Y(12C.F.R. 225.28(b)(9)).
Currently, Honor Technologies, Inc. operates two elec-tronic funds transfer ("EFT") networks under the servicenames HONOR and HONOR West (collectively,"HONOR"), and Star Systems, Inc. operates the Star EFTnetwork ("Star"). These EFT networks provide data pro-cessing and transmission services to financial institutionsand merchants that are members of their respective brandedautomated teller machine ("ATM") and point of sale("POS") networks.2 H&S would engage through HONORand Star in certain nonbanking activities related to theoperation of ATM and POS networks, including variousdata processing and transmission services, in accordance
9. See Bane One Corporation, 84 Federal Reserve Bulletin 553(1998).
1. Notificants would form a de novo company, H&S HoldingCompany, Maitland, Florida ("H&S"), that would indirectly acquireall the voting shares of the two companies to be acquired. Notificantsare shareholders or members of the companies to be acquired and,under the proposal, each would receive, directly or indirectly, morethan 5 percent of the voting shares of H&S.
2. In general, an ATM network is an arrangement whereby morethan one ATM and more than one depository institution (or thedepository records of such institutions) are connected by electronic ortelecommunications means to one or more computers, processors orswitches for the purpose of providing ATM services to retail custom-ers of the depository institutions. POS terminals are generally locatedin merchant establishments. POS terminals accept ATM or similarcards from retail customers and, using an ATM network or a parallelPOS-only network, provide access to a retail customer's account totransfer funds to a merchant's account.
Digitized for FRASER http://fraser.stlouisfed.org/ Federal Reserve Bank of St. Louis
272 Federal Reserve Bulletin • April
with section 225.28(b)(14) of Regulation Y (12C.F.R.225.28(b)(14)).
Notice of the proposal, affording interested persons anopportunity to submit comments, has been published(63 Federal Register 67,693 and 70,131 (1998)). The timefor filing comments has expired, and the Board has consid-ered the notice and all comments received in light of thefactors set forth in section 4(c)(8) of the BHC Act. As insimilar cases, the Board also sought comments from theDepartment of Justice on the competitive effects of theproposal. The Department of Justice indicated that it hadno objection to consummation of the proposed transaction.
Notificants are large commercial banking organizationswith headquarters in Georgia, Hawaii, North Carolina, andUtah. Notificants each engage directly and through subsid-iaries in a broad range of banking and permissible non-banking activities in the United States.3
Section 4(c)(8) of the BHC Act provides that a bankholding company may, with Board approval, engage in anyactivity that the Board determines to be "so closely relatedto banking or managing and controlling banks as to be aproper incident thereto." The Board previously has deter-mined that all the activities proposed in the notice areclosely related to banking within the meaning of sec-tion 4(c)(8) of the BHC Act.4 Notificants would conductthe proposed activities in accordance with Regulation Yand previous Board decisions.5
The Board also must consider whether the performanceof the proposed activities by Notificants through H&S"can reasonably be expected to produce benefits to thepublic . . . that outweigh possible adverse effects, such asundue concentration of resources, decreased or unfair com-petition, conflicts of interests, or unsound banking prac-tices."6 As part of this review under section 4(c)(8) of theBHC Act, the Board considers the financial and managerialresources of Notificants, their subsidiaries, and any com-pany to be acquired and the effect of the proposal on thoseresources.7 Based on all the facts of record, includingreports of examination and other supervisory information,the Board concludes that financial and managerial consid-erations are consistent with approval of the proposal. Inaddition, there is no evidence in the record that the pro-posal would result in conflicts of interests or unsoundbanking practices.
3. Asset and deposit data for each Notificant are set forth in theAppendix.
4. See 12C.F.R. 225.28(b)(2), (9), and (14); 12C.F.R. 225.131(permissible consulting services); Barnett Banks of Florida, Inc.,65 Federal Reserve Bulletin 263 (1979) (check verification services);Compagnie Financiere de Paribas, 82 Federal Reserve Bulletin 348(1996) (fraud detection services); Bank of New York Company, Inc..80 Federal Reserve Bulletin 1107 (1994) ("InfiNet Order") (ATMnetwork services); Bane One Corporation , 81 Federal Reserve Bulle-tin 492 (1995) ("EPS Order") (ATM network services).
5. The Board notes that ATM activities must be conducted inaccordance with applicable federal and state laws, including applica-ble branching laws.
6. See 12U.S.C. 1843(c)(8).l.See 12 C.F.R. 225.26.
Competitive Considerations
The proposal would result in the combination of two EFTnetworks, one operating primarily in the mid-Atlantic andsoutheastern states and the other operating primarily in thewestern states.8 A number of other large regional networksand national networks that link financial institutions andlocal and regional networks nationwide would continue tooperate in these areas.
To determine whether a particular transaction is likely todecrease competition, the Board traditionally has consid-ered the area of effective competition between parties. Thearea of effective competition has been defined by referenceto the line of commerce or product market involved and ageographic market. In this case, the Board has carefullyconsidered the relevant product and geographic markets inwhich to analyze the competitive effects of the proposal inlight of all the facts of record, including information pro-vided by Notificants and the geographic scope of andservices provided by existing EFT networks and otherproviders of EFT services.
The Board previously has identified three distinct prod-ucts that are typically offered by EFT networks:
(1) Network access (access to an EFT network identi-fied by a common trademark or logo displayed onATMs, POS terminals, and access cards);
(2) Network services (operation of a "network switch"to receive and route electronic messages betweenATMs, POS terminals, and data processing facili-ties used by depository institutions to authorizeEFT transactions and the provision of "gateway"access to other networks); and
(3) ATM/POS processing (data processing and trans-mission used to drive ATMs and POS terminals,monitor their activity, authorize ATM and POStransactions, and reconcile accounts).9
HONOR provides all three services to its network mem-bers. Star directly provides only network access; a thirdparty provides network services and ATM/POS processing.Under the proposal, H&S would not acquire the facilitiesto provide network services or ATM/POS processing ser-vices to the Star network or any other network or the rightto provide these services. Accordingly, the relevant productmarket in which to examine the competitive effects of theproposal is the market for network access.
The Board previously has determined that the geo-graphic market for network access is an area significantlylarger than local banking markets and has considered themarket area of an EFT network to consist of regions
8. HONOR and Star are among the largest EFT regional networks inthe United States. Star has the largest number of ATMs, POS termi-nals, and EFT transactions per month, and HONOR has the secondlargest number of ATMs and EFT transactions per month and the thirdlargest number of POS terminals. HONOR has the largest number andStar has the seventh largest number of financial institutions participat-ing in a network. Sources: EFT Network Data Book (1999); BankNetwork News (September 25, 1998).
9. See EPS Order at 493-94.Digitized for FRASER http://fraser.stlouisfed.org/ Federal Reserve Bank of St. Louis
Legal Developments 273
comprising several states.10 Based on all the facts of record,the Board believes that HONOR has a significant competi-tive presence in the mid-Atlantic and southeastern states(Alabama, Florida, Georgia, Maryland, North Carolina,South Carolina, Tennessee, Virginia, and the District ofColumbia) and, to a lesser extent, in Kansas and Missouri.Star's primary service area is located in the western UnitedStates (Arizona, California, Colorado, Hawaii, Idaho,Nevada, Oregon, Utah, and Washington). Thus, the pri-mary service areas for HONOR and Star do not overlap.
There are a number of areas outside these primary ser-vice areas in which HONOR and Star somewhat overlap inproviding network access. Changes in market concentra-tion in these other areas would not be significant, however,and in each area a number of other networks, includingother large regional networks, and third party processorswill continue to operate and to provide both direct andpotential competition for HONOR and Star." Nationalnetworks also offer an alternative to regional networks forsome financial institutions, particularly in the southeastregion served by HONOR, where relatively fewer financialinstitutions are members of any regional EFT network andnational networks appear to be increasing their competitivepresence.12
The Board also has considered the proposed operatingrules for HONOR and Star.13 The rules appear to facilitatecompetition and to ensure access to the network for alldepository institutions. For example, all depository institu-tions would be able to participate in HONOR and Star on anondiscriminatory basis, to join other regional networks,and to co-brand their cards and ATM terminals. Eachmember of the network would be able to set for itself thefees it charges its retail customers for ATM or POS transac-tions.14 The operating rules also would permit the use ofthird-party processors and unbranded subswitching oftransactions.15 The Board notes that transactions initiatedat an ATM in the HONOR or Star network and routedthrough a national network to another network would notbe required to pass through the HONOR or Star gateway.In addition, H&S's proposed corporate structure ensures
10. See EPS Order at 494.11. The Board also notes the rapid growth in recent years in the
volume of POS transactions, which serve as an alternative for certainATM transactions, and the presence of a number of competitors thatprovide POS network services across regional boundaries.
12. See Bamett Banks, Inc., 83 Federal Resent Bulletin 131,133 n.20 (1997) ("HONOR/Most Order"). In October 1998, Visabegan operations of its Visa Check II card, a debit card offeringissuers higher fees for POS transactions but prohibiting co-brandingwith other networks.
13. The Board previously has determined that ATM network operat-ing rules are an important consideration in assessing the competitiveimpact of a proposal under the section 4(c)(8) factors. See InfiNetOrder: EPS Order.
14. See HONOR/Most Order at 132.15. "Subswitching" refers to the routing of transactions between
members of the same regional network without accessing that net-work, and, therefore, without paying the network's switch fee. Typi-cally, this is accomplished by routing the transaction through a third-party processor that provides ATM processing services for bothnetwork members.
that its board of directors would represent a wide range ofinterests and that H&S's policymaking would not be domi-nated by the organizations with the largest shareholdings.16
The proposal, therefore, would provide services to Noti-ficants' subsidiary banks, other shareholders of H&S, andother financial institutions that participate in HONOR orStar under operating rules that would promote open accessto the network.17 Smaller financial institutions would havethe opportunity to provide their customers with greateraccess to their deposit accounts and thereby could competewith larger, multistate organizations for retail deposit fundswithout substantial investments in their own proprietaryATM networks. In addition, the operating rules of HONORand Star would promote competition between the HONORand Star networks and alternative providers of EFT-relatedservices, including national ATM and POS networks, otherregional networks, and third-party providers of EFTswitching and processing services, and thereby encourageprice and other competition for the services provided byHONOR and Star.
In this light, and based on all the facts of record, theBoard concludes that the proposal would not result inadverse effects such as undue concentration of resources orunfair competition. For these reasons, and based on all thefacts of record, the Board concludes that consummation ofthe proposal is not likely to have a significantly adverseeffect on competition in any relevant market.
Public Benefits
Section 4(c)(8) of the BHC Act requires that, in order toapprove a proposal, the Board must determine that thepublic benefits that could reasonably be expected from theproposal would outweigh potential adverse effects. This isa balancing process that takes into account the extent of thepotential for adverse effects, which, for the reasons indi-cated above, the Board does not believe to be significant inthis case.
Consumers would benefit from the added account avail-ability and convenience resulting from consummation ofthe proposal. In particular, an ATM network with a largenumber of financial institution members and that providesnetwork access at more locations over a broad geographi-cal area would have greater value to network cardholdersbecause they would have broader and more convenientaccess to their deposit accounts. In this case, the geo-graphic markets served by H&S would include all thesouthern United States and the Pacific northwest states and,accordingly, the proposal would enhance benefits to con-
16. The proposed bylaws of H&S provide that the board of directorswould consist of 30 members, and this number may not be changedexcept by the affirmative vote of two-thirds of the directors or share-holders. No more than one director may be an affiliate of or have anymaterial business relationship with any one shareholder, and votingfor directors is cumulative. No shareholder may hold more than19 percent of H&S voting shares. See also HONOR/Most Order at133 n.21.
17. See HONOR/Most Order at 132-33.
Digitized for FRASER http://fraser.stlouisfed.org/ Federal Reserve Bank of St. Louis
274 Federal Reserve Bulletin • April
sumers in these areas, particularly as consumer travel in-creases and business activity continues to grow.18
In addition, H&S would offer services to all financialinstitutions, and smaller financial institutions would havethe opportunity to provide their customers with greateraccess to their deposit accounts. As noted, membership inthe H&S networks would enable smaller financial institu-tions to compete with larger, multistate organizations toretain deposit funds without having to make substantialinvestments in branch systems or their own proprietaryATM networks.
Consummation of the proposal also would result in otherpublic benefits. The proposal is expected to produce econ-omies of scale, for example, and to reduce average costsfor the combined networks.19 Members of each networkalso would benefit from the technical expertise and theexpanded research and development programs of the othernetwork. Star network members would have access to abroader array of products and services, including cardproduction and website design and maintenance. HONORnetwork members would benefit from the introduction of aservice provided by Star that permits bill payments bytelephone without the use of a personal identification num-ber.
For the foregoing reasons, and after careful consider-ation of all the facts of record, the Board has determinedthat consummation of the proposal can reasonably be ex-pected to produce public benefits that would outweigh anypossible adverse effects under the proper incident to bank-ing standard of section 4(c)(8) of the BHC Act.
Conclusion
Based on all the facts of record, the Board has determinedthat the notices should be, and hereby are, approved. TheBoard's approval is specifically conditioned on Notifi-cants' compliance with the commitments made in connec-tion with these notices and the conditions referred to in thisorder. The Board's determination also is subject to all theterms and conditions set forth in Regulation Y, includingthose in sections 225.7 and 225.25(c) (12 C.F.R. 225.7 and225.25(c)), and to the Board's authority to require modifi-cation or termination of the activities of a bank holdingcompany or any of its subsidiaries that the Board findsnecessary to ensure compliance with, or to prevent evasionof, the provisions and purposes of the BHC Act and theBoard's regulations and orders issued thereunder. For pur-poses of this action, the commitments and conditions shallbe deemed to be conditions imposed in writing by theBoard in connection with its findings and decision and, assuch, may be enforced in proceedings under applicablelaw.
This proposal shall not be consummated later than threemonths after the effective date of this order, unless suchperiod is extended for good cause by the Board, or theFederal Reserve Banks of Atlanta, Richmond or San Fran-cisco, acting pursuant to delegated authority.
By order of the Board of Governors, effective Febru-ary 1, 1999.
Voting for this action: Chairman Greenspan, Vice Chair Rivlin, andGovernors Kelley, Meyer, Ferguson, and Gramlich.
ROBERT DEV. FRIERSON
Associate Secretary of the Board
Appendix
Asset and Deposit Data for Notificants1
BankAmerica Corporation, with approximately $594.7 bil-lion in total consolidated assets, is the second largestcommercial banking organization in the United States,controlling $287.6 billion in deposits. BankAmerica Cor-poration operates subsidiary banks in 23 states and theDistrict of Columbia. Bane West Corporation, with approx-imately $8.2 billion in total consolidated assets, is the63rd largest commercial banking organization in the UnitedStates, controlling $5.9 billion in deposits. BancWest Cor-poration operates subsidiary banks in five states.
BB&T Corporation, with approximately $33.9 billion intotal consolidated assets, is the 27th largest commercialbanking organization in the United States, controlling$20.6 billion in deposits. BB&T Corporation operates sub-sidiary banks in four states and the District of Columbia.
First Union Corporation, with approximately $234.6 bil-lion in total consolidated assets, is the sixth largest com-mercial banking organization in the United States, control-ling $134 billion in deposits. First Union Corporationoperates subsidiary banks in 12 states and the District ofColumbia.
SunTrust Banks, Inc., with approximately $86.6 billionin total consolidated assets, is the 11th largest commercialbanking organization in the United States, controlling$53.3 billion in deposits. SunTrust Banks, Inc., operatessubsidiary banks in six states and the District of Columbia.
Wachovia Corporation, with approximately $65.6 billionin total consolidated assets, is the 17th largest commercialbanking organization in the United States, controlling$37 billion in deposits. Wachovia Corporation operatessubsidiary banks in six states.
18. See HONOR/Most Order at 134.19. Notificants expect that any network services and ATM pro-
cessing that are consolidated in the future would result in economiesof scale for computer facilities, operations personnel, programmingstaff, and other support services and would likely reduce the cost ofoperation of the HONOR and Star networks.
1. Asset data are as of September 30, 1998, and deposit data are asof June 30, 1998, and are adjusted to reflect acquisitions consummatedafter that date.
Digitized for FRASER http://fraser.stlouisfed.org/ Federal Reserve Bank of St. Louis
Legal Developments 275
Zions Bancorporation, with approximately $12.4 billionin total consolidated assets, is the 53rd largest commercialbanking organization in the United States, controlling$8.1 billion in deposits. Zions Bancorporation operatessubsidiary banks in eight states.
htituto Bancario San Paolo di Torino-IstitutoMobiliare Italiano S.p.A.Turin, Italy
Order Approving Notice to Engage in NonbankingActivities
Istituto Bancario San Paolo di Torino-Istituto MobiliareItaliano S.p.A. ("San Paolo-IMI"), a foreign banking orga-nization subject to the provisions of the Bank HoldingCompany Act ("BHC Act"),1 has requested the Board'sapproval to engage through Mabon Securities Corp. ("Ma-bon") and, in certain cases, through Mabon's whollyowned subsidiary, Cedar Street Securities Corp. ("CedarStreet"), both of New York, New York,2 in the followingnonbanking activities:
(1) Extending credit and servicing loans, in accordancewith section 225.28(b)(l) of Regulation Y(12 C.F.R. 225.28(b)(l));
(2) Engaging in activities related to extending credit, inaccordance with section 225.28(b)(2) of RegulationY (12 C.F.R. 225.28(b)(2));
(3) Providing financial and investment advisory ser-vices, in accordance with section 225.28(b)(6) ofRegulation Y (12 C.F.R. 225.28(b)(6));
(4) Providing securities brokerage, riskless principal,private placement, futures commission merchant,and other agency transactional services, in accor-dance with section 225.28(b)(7) of Regulation Y(12 C.F.R 225.28(b)(7));
(5) Underwriting and dealing in government obliga-tions and money market instruments in which statemember banks may underwrite and deal under12 U.S.C. §§ 335 and 24(7) ('-bank-eligible securi-ties"), engaging in investing and trading activities,and buying and selling bullion and related activi-ties, in accordance with section 225.28(b)(8) ofRegulation Y (12 C.F.R. 225.28(b)(8)); and
(6) Underwriting and dealing in, to a limited extent, alltypes of debt and equity securities, except owner-
1. As a foreign banking organization operating a branch in theUnited States, San Paolo-IMI is subject to certain provisions of theBHC Act pursuant to section 8(a) of the International Banking Act of1978. 12 U.S.C. § 31O6(a).
2. San Paolo-IMI was formed in November 1998 through themerger of Istituto San Paolo di Torino S.p.A., Turin, Italy ("SanPaolo"), and Istituto Mobiliare Italiano S.p.A., Rome, Italy ("IMI").In connection with this merger, San Paolo-IMI received approvalunder section 4(c)(9) of the BHC Act to retain temporarily the UnitedStales subsidiaries of IMI. See Letter dated July 27.1998, from RobertdeV. Frierson, Associate Secretary of the Board, to Randal K. Quarles,Esq.
ship interests in open-end investment companies("bank-ineligible securities") through Mabon.3
Notice of the proposal, affording interested persons anopportunity to submit comments, has been published(63 Federal Register 67,693 (1998)). The time for filingcomments has expired, and the Board has considered thenotice and all comments received in light of the factors setforth in section 4(c)(8) of the BHC Act.
San Paolo-IMI, with total consolidated assets of approx-imately $200 billion, is the largest banking organization inItaly.4 In the United States, San Paolo-IMI operates afederally licensed branch in New York, New York, and arepresentative office in Los Angeles, California.5 Mabonengages in securities transactions in the United States onbehalf of San Paolo-IMI's European affiliates and providesresearch and investment management services to both U.S.and foreign investors. Mabon and Cedar Street are and willcontinue to be broker-dealers registered with the Securitiesand Exchange Commission ("SEC") under the SecuritiesExchange Act of 1934 (15 U.S.C. § 78a et seq.) and mem-bers of the National Association of Securities Dealers. Inc.("NASD"). Accordingly, Mabon and Cedar Street are andwill continue to be subject to the recordkeeping and report-ing obligations, fiduciary standards, and other requirementsof the Securities Exchange Act, the SEC, and the NASD.
Underwriting and Dealing in Bank-Ineligible Securities
The Board previously has determined-subject to the frame-work of prudential limitations established in previous deci-sions to address the potential for conflicts of interests,unsound banking practices, or other adverse effects-that
3. Cedar Street currently is an inactive subsidiary of Mabon. SanPaolo-IMl has indicated that in the future Cedar Street may com-mence the activities listed above, except underwriting and dealing inbank-ineligible securities. San Paolo-IMI has agreed to consult withthe Federal Reserve System before Cedar Street commences anybank-ineligible underwriting and dealing activities so that it can bedetermined whether an additional notice pursuant to section 4(c)(8) ofthe BHC Act would be required.
4. Asset and ranking data are as of June 30, 1998.5. Compagnia di San Paolo (the "Foundation"), an Italian public
law foundation, previously controlled a majority of the voting sharesof San Paolo. See Istituto Bancario San Paolo di Torino, S.p.A..82 FederalResene Bulletin 1147 (1996). The Foundation has signifi-cantly reduced its ownership interest in San Paolo over time andcurrently owns approximately 16 percent of the voting shares of SanPaolo-IMI. One director and two other representatives of the Founda-tion also serve on San Paolo-IMF s current 17-member board ofdirectors. Italian law requires that the Foundation terminate its direc-tor interlock with San Paolo-IMI by April 15, 1999, and prohibits theFoundation from being involved in the management of San Paolo-IMIafter November 18, 1999. The Foundation also has entered into ashareholders' agreement that permits the Foundation to vote only5 percent of San Paolo-IMI's shares al the next election ofSan Paolo-IMI's board of directors. San Paolo-IMI has representedthat the Foundation will not have the right or ability to independentlyelect any director to the future boards of directors of San Paolo-IMI.Based on these and all other facts of record, including the limitednature of the continuing business relationships between the Founda-tion and San Paolo-IMI, the Board has determined that the Foundationis not required to join this notice.
Digitized for FRASER http://fraser.stlouisfed.org/ Federal Reserve Bank of St. Louis
276 Federal Reserve Bulletin • April
underwriting and dealing in bank-ineligible securities is soclosely related to banking as to be a proper incident theretowithin the meaning of section 4(c)(8) of the BHC Act.6
The Board also has determined that underwriting and deal-ing in bank-ineligible securities is consistent with sec-tion 20 of the Glass-Steagall Act (12 U.S.C. § 377), pro-vided that the company engaged in the activity derives nomore than 25 percent of its gross revenues from underwrit-ing and dealing in bank-ineligible securities.7
San Paolo-IMI has committed that Mabon will conductits underwriting and dealing activities using the methodsand procedures and subject to the prudential limitationsestablished by the Board in the Section 20 Orders.San Paolo-IMI also has committed that Mabon will con-duct its bank-ineligible securities underwriting and dealingsubject to the Board's revenue restriction. As a conditionof this order, San Paolo-IMI is required to conduct itsbank-ineligible securities activities subject to the revenuerestrictions and Operating Standards established for section20 subsidiaries ("Operating Standards").8
Other Activities Approved by Regulation
The Board previously has determined that credit and credit-related activities; financial and investment advisory activi-ties; securities brokerage, riskless principal, private place-
6. See J.P. Morgan & Co., Incorporated, et ai, 75 Federal ReserveBulletin 192 (1989), aff'd sub nom. Securities Industry Ass'n v. Boardof Governors of the Federal Resen'e System, 900 F.2d 360 (D.C. Cir.1990); Citicorp, et al., 73 Federal Reserve Bulletin 473 (1987), aff'dsub nom. Securities Industry Ass'n v. Board of Governors of theFederal Reserve System, 839 F.2d 47 (2d Cir.), cert, denied, 486 U.S.1059 (1988); as modified by Review of Restrictions on Director,Officer and Employee Interlocks, Cross-Marketing Activities, and thePurchase and Sale of Financial Assets Between a Section 20 Subsid-iary and an Affiliated Bank or Thrift, 61 Federal Register 57.679(1996); Amendments to Restrictions in the Board's Section 20 Orders,62 Federal Register 45,295 (1997); and Clarification to the Board'sSection 20 Orders, 63 Federal Register 14,803 (1998) (collectively,"Section 20 Orders").
7. Compliance with the revenue limitation shall be calculated inaccordance with the methods stated in the Section 20 Orders, asmodified by the Order Approving Modifications to the Section20 Orders, 75 Federal Reserve Bulletin 751 (1989); 10 PercentRevenue Limit on Bank-Ineligible Activities of Subsidiaries of BankHolding Companies Engaged in Underwriting and Dealing in Securi-ties, 61 Federal Register 48,953 (1996); and Revenue Limit on Bank-Ineligible Activities of Subsidiaries of Bank Holding Companies En-gaged in Underwriting and Dealing in Securities, 61 Federal Register68,750 (1996) (collectively, "Modification Orders"). In light of thefact that Mabon was a going concern on the date of the merger of SanPaolo and IMI, the Board believes that allowing Mabon to calculatecompliance with the revenue limitation on an annualized basis duringthe first year after the date that the merger of San Paolo and IMI wasconsummated and thereafter on a rolling quarterly basis is consistentwith the Section 20 Orders. See, e.g., Dresdner BankAG, 82 FederalReserve Bulletin 850 (1996): Dauphin Deposit Corporation, 77 Fed-eral Reserve Bulletin 672 (1991).
8. 12C.F.R. 225.200. Mabon may provide services that are neces-sary incidents to the proposed underwriting and dealing activities.Unless Mabon receives specific approval under section 4(c)(8) of theBHC Act to conduct the activities independently, any revenues fromthe incidental activities must be treated as ineligible revenues subjectto the Board's revenue limitation.
ment, and other agency transactional activities;underwriting and dealing in bank-eligible securities; invest-ing and trading activities; and buying and selling bullionand related activities are all closely related to bankingwithin the meaning of section 4(c)(8) of the BHC Act.9
San Paolo-IMI has committed that it will conduct theseactivities in accordance with the limitations set forth inRegulation Y and the Board's orders and interpretationsrelating to each of these activities.
Other Considerations
In order to approve the notice, the Board also must deter-mine that performance of the proposed activities is a properincident to banking, that is, that the proposed activities"can reasonably be expected to produce benefits to thepublic, such as greater convenience, increased competition,or gains in efficiency, that outweigh possible adverse ef-fects, such as undue concentration of resources, decreasedor unfair competition, conflicts of interests, or unsoundbanking practices."10 As part of its evaluation of thesefactors, the Board considers the financial condition andmanagerial resources of the notificant and its subsidiariesand the effect of the proposed transaction on those resourc-es.11 San Paolo-IMI's capital ratios satisfy applicable risk-based standards under the Basle Accord and are consideredequivalent to the capital levels that would be required of aUnited States banking organization. The Board also hasreviewed the capitalization of San Paolo-IMI and Mabon inaccordance with the standards set forth in the Section 20Orders and finds the capitalization of each to be consistentwith approval. This determination is based on all the factsof record, including San Paolo-IMI's projections of thevolume of Mabon's bank-ineligible underwriting and deal-ing activities. The Board also has reviewed the managerialresources of San Paolo-IMI and Mabon in light of relevantreports of examination and all the facts of record. Based onthe foregoing, the Board has concluded that financial andmanagerial considerations are consistent with approval ofthe notice.
The Board also has carefully considered the competitiveeffects of the proposal. Prior to its merger with IMI,San Paolo did not engage in the United States in thenonbanking activities conducted by Mabon. Furthermore,the Board notes that the markets for the proposed activitiesare unconcentrated and there are numerous existing andpotential competitors. As a result, consummation of theproposal would have a de minimis effect on competition,and the Board has concluded that the proposal would notresult in a significantly adverse effect on competition inany relevant market.
The Board expects that continuation of the proposedactivities would provide added convenience to the ex-
9. See 12 C.F.R. 225.28(b)(l), (2). (6), (7), and (8).10. 12 U.S.C. § 1843(c)(8).11. See 12 C.F.R. 225.26(b); see also The Fuji Bank, Limited,
75 Federal Reserve Bulletin 94 (1989); Bayerische Vereinsbank AG,73 Federal Reserve Bulletin 155 (1987).
Digitized for FRASER http://fraser.stlouisfed.org/ Federal Reserve Bank of St. Louis
Legal Developments 277
panded customer base of San Paolo-IMI. San Paolo-IMIalso has indicated that it intends to expand the product andservice offerings of Mabon, thereby increasing competitionin the relevant product markets. The Board also has recog-nized the public benefits of permitting capital markets tooperate so that banking organizations may make poten-tially profitable investments in nonbanking companies andallocate their resources in the manner they believe is mostefficient when such investments are consistent, as in thiscase, with the relevant consideration under the BHC Act.12
Under the framework and conditions established in thisorder and the Section 20 Orders, and based on all the factsof record, the Board concludes that the performance of theproposed activities by San Paolo-IMI can reasonably beexpected to produce public benefits that outweigh anyadverse effects of the proposal. Accordingly, the Board hasdetermined that the performance of the proposed activitiesby San Paolo-IMI is a proper incident to banking forpurposes of section 4(c)(8) of the BHC Act.
Conclusion
On the basis of the foregoing and all other facts of record,the Board has determined that the notice should be, andhereby is, approved, subject to all the terms and conditionsdiscussed in this order and in the Section 20 Orders, asmodified by the Modification Orders. The Board's ap-proval of the proposed underwriting and dealing activitiesextends only to activities conducted within the limitationsof those orders and this order, including the Board's reser-vation of authority to establish additional limitations toensure that Mabon's activities are consistent with safetyand soundness, avoidance of conflict of interests, and otherrelevant considerations under the BHC Act. Underwritingand dealing in any manner other than as approved in thisorder and the Section 20 Orders (as modified by the Modi-fication Orders), is not within the scope of the Board'sapproval and is not authorized for Mabon.
The Board's approval of the proposal to underwrite anddeal in all types of bank-ineligible securities is conditionedon a determination by the Board that San Paolo-IMI andMabon have established policies and procedures to ensure
12. See Bane One Corporation, 84 Federal Reserve Bulletin 553(1998).
compliance with the Operating Standards and the otherrequirements of this order, the Section 20 Orders, and theModification Orders, including computer, audit, and ac-counting systems, internal risk management controls, andthe necessary operation and managerial infrastructure forunderwriting and dealing in all types of debt and equitysecurities. San Paolo-IMI proposes to expand the existingbank-ineligible securities activities of Mabon, and has re-quested a delay in conducting the infrastructure review toallow San Paolo-IMI to develop enhanced policies andprocedures for the proposed expanded bank-ineligible se-curities activities of Mabon. As part of the request,San Paolo-IMI has committed not to expand the scope ofMabon's current bank-ineligible securities activities untilthe Board determines that a satisfactory infrastructure is inplace.
The Board's determination also is subject to all termsand conditions set forth in Regulation Y, including those insections 225.7 and 225.25(c) (12C.F.R. 225.7 and225.25(c)), and to the Board's authority to require modifi-cation or termination of the activities of a bank holdingcompany or any of its subsidiaries as the Board findsnecessary to ensure compliance with, and prevent evasionof, the BHC Act and the Board's regulations and ordersissued thereunder. The Board's decision is specificallyconditioned on compliance with all the commitments madein connection with the notice, including the commitmentsdiscussed in this order and the conditions set forth in thisorder and the Board's regulations and orders noted above.The commitments and conditions are deemed to be condi-tions imposed in writing by the Board in connection withits findings and decision and, as such, may be enforced inproceedings under applicable law.
The proposal shall not be consummated later than threemonths after the effective date of this order, unless suchperiod is extended for good cause by the Board or by theFederal Reserve Bank of New York, acting pursuant todelegated authority.
By order of the Board of Governors, effective Febru-ary 1, 1999.
Voting for this action: Chairman Greenspan, Vice Chair Rivlin, andGovernors Kelley, Meyer, Ferguson, and Gramlich.
ROBERT DEV. FRIERSONAssociate Secretary of the Board
INDEX OF ORDERS ISSUED OR ACTIONS TAKEN BY THE BOARD OF GOVERNORS OF THE FEDERAL RESERVE SYSTEM(OCTOBER 1, J998-DECEMBER 31, 1998)
Applicant Merged or Acquired Bank or Activity Date of Approval
BulletinVolumeand Page
Bank One Corporation,Chicago, Illinois
CAB Holding, LLC,Wilmington, Delaware
EquiServe Limited Partnership,A Delaware limited partnership
The Chinese American Bank,New York, New York
November 16, 1998 85, 65
November 30, 1998 85, 51
Digitized for FRASER http://fraser.stlouisfed.org/ Federal Reserve Bank of St. Louis
278 Federal Reserve Bulletin • April 1999
Index of Orders—Continued
Applicant Merged or Acquired Bank or Activity Date of Approval
BulletinVolumeand Page
CFBanc Holdings, Inc.,Washington, D.C.
CFBanc Corporation,Washington, D.C.
Charter One Financial, Inc.,Cleveland, Ohio
Charter-Michigan Bancorp, Inc.,Cleveland, Ohio
Chinatrust Commercial Bank, Ltd.,Taipei, Taiwan
City Holding CompanyCharleston, West Virginia
Cooper Life Sciences,New York, New York
Greater American Financial Group,New York, New York
Credit Suisse,Zurich, Switzerland
Erste Bank dersterreichischen SparkassenAktiengesellschaft,Vienna, Austria
Firstar Corporation,Milwaukee, Wisconsin
FirstMerit Corporation,Akron, Ohio
KeyCorp,Cleveland, Ohio
City First Bank of D.C,Washington, D.C.
ALBANK Financial Corporation,Albany, New York
ALBANK Commercial,Albany, New York
ALBANK, F.S.B.,Albany, New York
To establish a state-licensed branch inNew York, New York
Horizon Bancorp, Inc.,Beckley, West Virginia
Bank of Raleigh,Beckley, West Virginia
First National Bank in Marlinton,Marlinton, West Virginia
Greenbrier Valley National Bank,Lewisburg, West Virginia
National Bank of Summers,Hinton, West Virginia
The Twentieth Street,Huntington, West Virginia
The Berkshire Bank,New York, New York
To establish representative offices inMiami, Florida; New York, New York;and Houston, Texas
To establish a federally-licensed branch inNew York, New York
Star Bane Corporation,Cincinnati, Ohio
Star Bank, N.A.,Cincinnati, Ohio
Signal Corp.,Wooster, Ohio
Signal Bank, N.A.,Wooster, Ohio
Summit Bank, N.A.,Akron, Ohio
First Federal Savings Bank of NewCastle,New Castle, Pennsylvania
McDonald & Company Investments, Inc.,Cleveland, Ohio
McDonald & Company Securities, Inc.,Cleveland, Ohio
November 9, 1998
October 28, 1998
October 5, 1998
November 30, 1998
December 14, 1998
November 23, 1998
October 14. 1998
October 28, 1998
December 7, 1998
October 21, 1998
85,52
84, 1079
84, 1121
85,53
85, 125
85. 68
84, 1123
84, 1083
85, 128
84, 1075
Digitized for FRASER http://fraser.stlouisfed.org/ Federal Reserve Bank of St. Louis
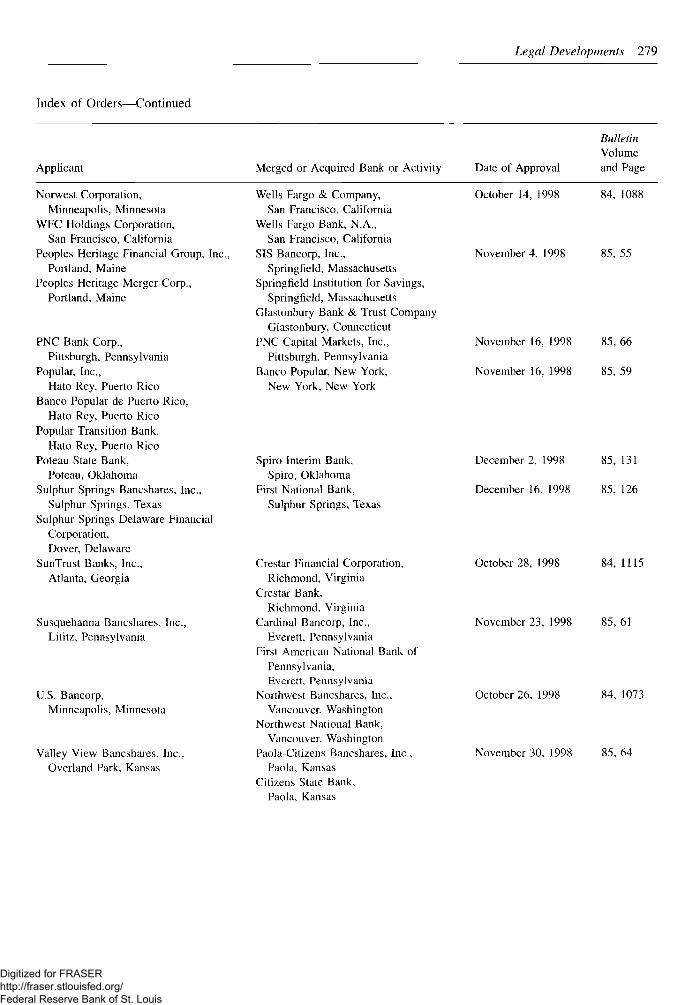
Legal Developments 279
Index of Orders—Continued
Applicant Merged or Acquired Bank or Activity Date of Approval
BulletinVolumeand Page
Norwest Corporation,Minneapolis, Minnesota
WFC Holdings Corporation,San Francisco, California
Peoples Heritage Financial Group, Inc.,Portland, Maine
Peoples Heritage Merger Corp.,Portland, Maine
PNC Bank Corp.,Pittsburgh, Pennsylvania
Popular, Inc.,Hato Rey, Puerto Rico
Banco Popular de Puerto Rico,Hato Rey, Puerto Rico
Popular Transition Bank,Hato Rey, Puerto Rico
Poteau State Bank,Poteau, Oklahoma
Sulphur Springs Bancshares, Inc.,Sulphur Springs, Texas
Sulphur Springs Delaware FinancialCorporation,Dover, Delaware
SunTrust Banks, Inc.,Atlanta, Georgia
Susquehanna Bancshares, Inc.,Lititz, Pennsylvania
U.S. Bancorp,Minneapolis, Minnesota
Valley View Bancshares, Inc..Overland Park, Kansas
Wells Fargo & Company,San Francisco, California
Wells Fargo Bank, N.A.,San Francisco, California
SIS Bancorp, Inc.,Springfield, Massachusetts
Springfield Institution for Savings,Springfield, Massachusetts
Glastonbury Bank & Trust CompanyGlastonbury, Connecticut
PNC Capital Markets, Inc.,Pittsburgh, Pennsylvania
Banco Popular, New York,New York, New York
Spiro Interim Bank,Spiro, Oklahoma
First National Bank,Sulphur Springs, Texas
Crestar Financial Corporation,Richmond, Virginia
Crestar Bank,Richmond. Virginia
Cardinal Bancorp, Inc.,Everett, Pennsylvania
First American National Bank ofPennsylvania,Everett, Pennsylvania
Northwest Bancshares, Inc.,Vancouver. Washington
Northwest National Bank,Vancouver, Washington
Paola-Citizens Bancshares, Inc.,Paola, Kansas
Citizens State Bank,Paola, Kansas
October 14, 1998
November 4, 1998
84, 1088
85. 55
November 16, 1998 85, 66
November 16, 1998 85, 59
December 2, 1998 85, 131
December 16, 1998 85, 126
October 28, 1998 84, 1115
November 23, 1998 85, 61
October 26, 1998 84, 1073
November 30, 1998 85, 64
Digitized for FRASER http://fraser.stlouisfed.org/ Federal Reserve Bank of St. Louis
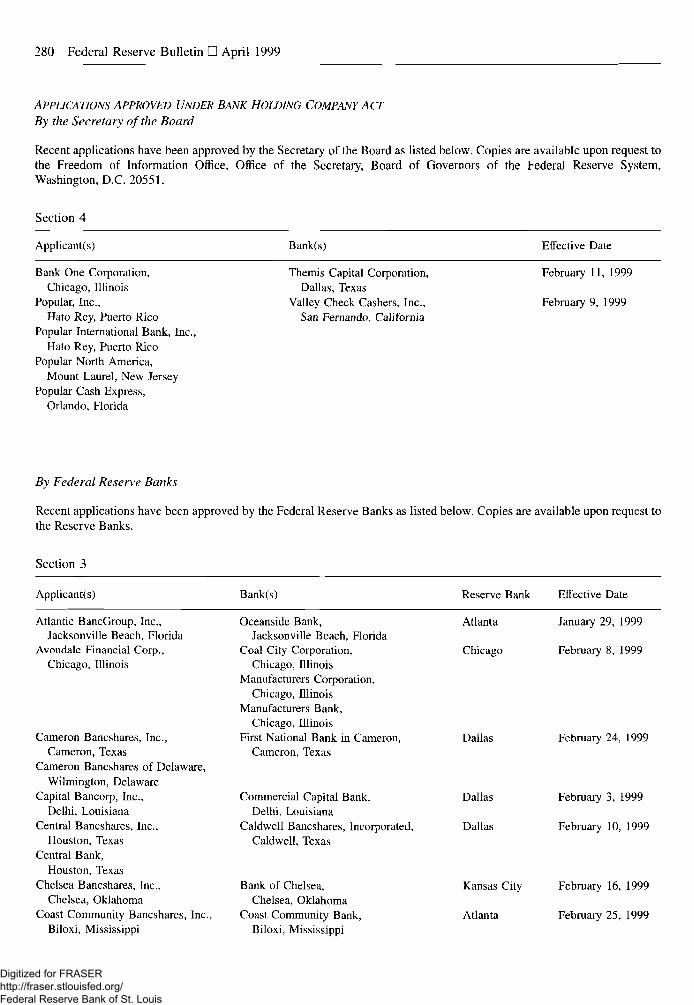
280 Federal Reserve Bulletin • April 1999
APPLICATIONS APPROVED UNDER BANK HOLDING COMPANY ACTBy the Secretary of the Board
Recent applications have been approved by the Secretary of the Board as listed below. Copies are available upon request tothe Freedom of Information Office, Office of the Secretary, Board of Governors of the Federal Reserve System,Washington, D.C. 20551.
Section 4
Applicant(s) Bank(s) Effective Date
Bank One Corporation,Chicago, Illinois
Popular, Inc.,Hato Rey, Puerto Rico
Popular International Bank, Inc.,Hato Rey, Puerto Rico
Popular North America,Mount Laurel, New Jersey
Popular Cash Express,Orlando, Florida
Themis Capital Corporation,Dallas, Texas
Valley Check Cashers, Inc.,San Fernando, California
February 11, 1999
February 9, 1999
By Federal Reserve Banks
Recent applications have been approved by the Federal Reserve Banks as listed below. Copies are available upon request tothe Reserve Banks.
Section 3
Applicant(s) Bank(s) Reserve Bank Effective Date
Atlantic BancGroup, Inc.,Jacksonville Beach, Florida
Avondale Financial Corp.,Chicago, Illinois
Cameron Bancshares, Inc.,Cameron, Texas
Cameron Bancshares of Delaware,Wilmington, Delaware
Capital Bancorp, Inc.,Delhi, Louisiana
Central Bancshares, Inc.,Houston, Texas
Central Bank,Houston, Texas
Chelsea Bancshares, Inc.,Chelsea, Oklahoma
Coast Community Bancshares, Inc.,Biloxi, Mississippi
Oceanside Bank,Jacksonville Beach, Florida
Coal City Corporation,Chicago, Illinois
Manufacturers Corporation,Chicago, Illinois
Manufacturers Bank,Chicago, Illinois
First National Bank in Cameron,Cameron, Texas
Commercial Capital Bank,Delhi, Louisiana
Caldwell Bancshares, Incorporated,Caldwell, Texas
Atlanta
Chicago
Dallas
Dallas
Dallas
January 29, 1999
February 8, 1999
February 24, 1999
February 3, 1999
February 10, 1999
Bank of Chelsea,Chelsea, Oklahoma
Coast Community Bank,Biloxi, Mississippi
Kansas City February 16, 1999
Atlanta February 25, 1999
Digitized for FRASER http://fraser.stlouisfed.org/ Federal Reserve Bank of St. Louis
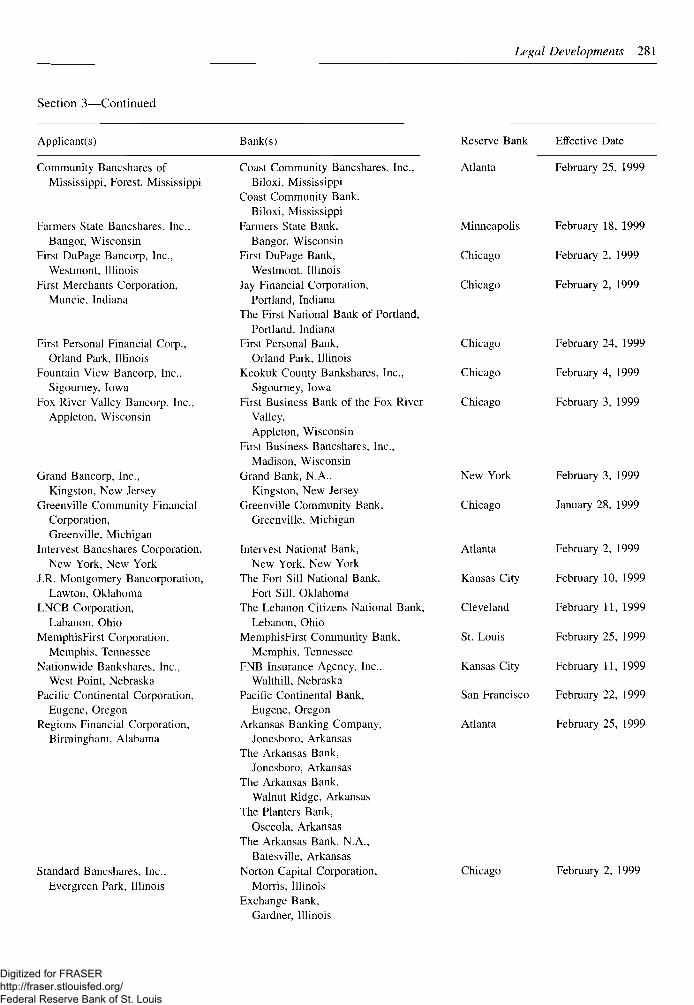
Legal Developments 281
Section 3—Continued
Applicant(s) Bank(s) Reserve Bank Effective Date
Community Bancshares ofMississippi, Forest, Mississippi
Farmers State Bancshares, Inc..Bangor, Wisconsin
First DuPage Bancorp, Inc.,Westmont, Illinois
First Merchants Corporation,Muncie. Indiana
First Personal Financial Corp.,Orland Park, Illinois
Fountain View Bancorp, Inc.,Sigourney, Iowa
Fox River Valley Bancorp. Inc.,Appleton, Wisconsin
Grand Bancorp, Inc.,Kingston, New Jersey
Greenville Community FinancialCorporation,Greenville. Michigan
Intervest Bancshares Corporation,New York, New York
J.R. Montgomery Bancorporation,Lawton, Oklahoma
LNCB Coiporation,Labanon, Ohio
MemphisFirst Corporation.Memphis, Tennessee
Nationwide Bankshares. Inc.,West Point, Nebraska
Pacific Continental Corporation,Eugene, Oregon
Regions Financial Corporation,Birmingham, Alabama
Standard Bancshares, Inc.,Evergreen Park, Illinois
Coast Community Bancshares, Inc., AtlantaBiloxi, Mississippi
Coast Community Bank,Biloxi, Mississippi
Farmers State Bank,Bangor, Wisconsin
First DuPage Bank,Westmont, Illinois
Jay Financial Corporation,Portland, Indiana
The First National Bank of Portland,Portland, Indiana
First Personal Bank,Orland Park, Illinois
Keokuk County Bankshares, Inc.,Sigourney, Iowa
First Business Bank of the Fox RiverValley,Appleton, Wisconsin
First Business Bancshares. Inc.,Madison, Wisconsin
Grand Bank, N.A.,Kingston, New Jersey
Greenville Community Bank,Greenville, Michigan
Intervest National Bank, AtlantaNew York, New York
The Fort Sill National Bank, Kansas CityFort Sill, Oklahoma
The Lebanon Citizens National Bank, ClevelandLebanon, Ohio
MemphisFirst Community Bank, St. LouisMemphis, Tennessee
FNB Insurance Agency, Inc.. Kansas CityWalthill. Nebraska
Pacific Continental Bank, San FranciscoEugene, Oregon
Arkansas Banking Company, AtlantaJonesboro, Arkansas
The Arkansas Bank,Jonesboro, Arkansas
The Arkansas Bank,Walnut Ridge, Arkansas
The Planters Bank,Osceola, Arkansas
The Arkansas Bank, N.A.,Batesville, Arkansas
Norton Capital Corporation, ChicagoMorris, Illinois
Exchange Bank.Gardner, Illinois
February 25, 1999
Minneapolis February 18, 1999
Chicago February 2, 1999
Chicago February 2, 1999
Chicago February 24, 1999
Chicago February 4, 1999
Chicago February 3, 1999
New York February 3, 1999
Chicago January 28, 1999
February 2, 1999
February 10, 1999
February 11, 1999
February 25, 1999
February 11, 1999
February 22, 1999
February 25, 1999
February 2, 1999
Digitized for FRASER http://fraser.stlouisfed.org/ Federal Reserve Bank of St. Louis
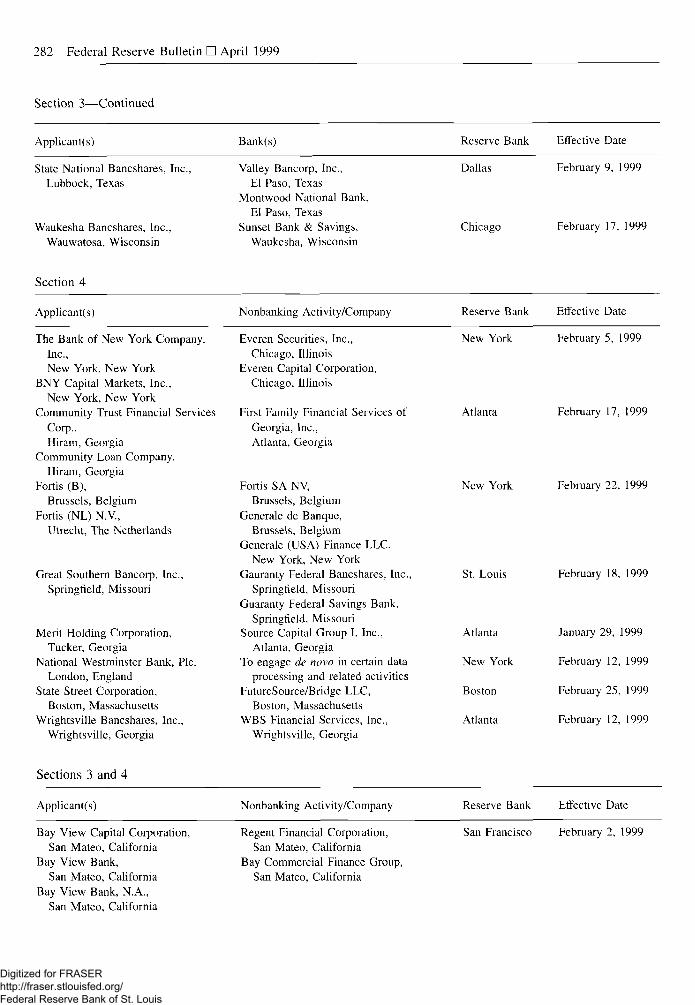
282 Federal Reserve Bulletin • April 1999
Section 3—Continued
Applicant! s) Bank(s) Reserve Bank Effective Date
State National Bancshares, Inc..Lubbock, Texas
Waukesha Bancshares, Inc.,Wauwatosa, Wisconsin
Valley Bancorp, Inc.,El Paso, Texas
Montwood National Bank,El Paso, Texas
Sunset Bank & Savings,Waukesha, Wisconsin
Dallas
Chicago
February 9, 1999
February 17, 1999
Section 4
Applicant(s) Nonbanking Activity/Company Reserve Bank Effective Date
The Bank of New York Company,Inc.,New York, New York
BNY Capital Markets, Inc.,New York, New York
Community Trust Financial ServicesCorp.,Hiram, Georgia
Community Loan Company,Hiram, Georgia
Fortis (B),Brussels, Belgium
Fortis (NL) N.V.,Utrecht, The Netherlands
Great Southern Bancorp. Inc.,Springfield, Missouri
Merit Holding Corporation,Tucker, Georgia
National Westminster Bank, Pic,London, England
State Street Corporation,Boston, Massachusetts
Wrightsville Bancshares, Inc.,Wrightsville, Georgia
Everen Securities, Inc.,Chicago, Illinois
Everen Capital Corporation,Chicago, Illinois
First Family Financial Services ofGeorgia, Inc.,Atlanta, Georgia
Fortis SA NV,Brussels, Belgium
Generale de Banque,Brussels, Belgium
Generale (USA) Finance LLC,New York, New York
Gauranty Federal Bancshares, Inc.,Springfield, Missouri
Guaranty Federal Savings Bank,Springfield, Missouri
Source Capital Group I, Inc.,Atlanta, Georgia
To engage de novo in certain dataprocessing and related activities
FutureSource/Bridge LLC,Boston, Massachusetts
WBS Financial Services, Inc.,Wrightsville, Georgia
New York February 5, 1999
Atlanta
St. Louis
February 17, 1999
New York February 22, 1999
February 18, 1999
Atlanta
New York
Boston
Atlanta
January 29,
February 12
February 25
February 12
1999
, 1999
, 1999
, 1999
Sections 3 and 4
Applicant(s) Nonbanking Activity/Company Reserve Bank Effective Date
Bay View Capital Corporation,San Mateo, California
Bay View Bank,San Mateo, California
Bay View Bank, N.A.,San Mateo, California
Regent Financial Corporation,San Mateo, California
Bay Commercial Finance Group,San Mateo, California
San Francisco February 2, 1999
Digitized for FRASER http://fraser.stlouisfed.org/ Federal Reserve Bank of St. Louis
Legal Developments 283
Sections 3 and 4—Continued
Applicant(s) Nonbanking Activity/Company Reserve Bank Effective Date
M&T Bank Corporation.Buffalo, new York
Olympia Financial Corporation,Buffalo, New York
Troy Financial Corporation,Troy, New York
FNB Rochester Corp.,Rochester, New York
First National Bank of Rochester,Rochester, New York
The Troy Savings Bank,Troy, new York
The Family Investment Services Co.,Troy, New York
T.S. Real Property, Inc.,Troy, New York
New York February 22, 1999
New York February 16, 1999
APPLICATIONS APPROVED UNDER BANK MERGER ACT
By Federal Reserve Banks
Recent applications have been approved by the Federal Reserve Banks as listed below. Copies are available upon request tothe Reserve Banks.
Applicant(s) Bank(s) Reserve Bank Effective Date
Baylake Bank,Sturgeon Bay, Wisconsin
F&M Bank-Northern Virginia.Fairfax, Virginia
First Liberty Bank & Trust,Jermyn, Pennsylvania
First Virginia Bank-Southwest.Roanoke, Virginia
Manufacturers and Traders TrustCompany,Buffalo, New York
Baylake Bank, N.A., ChicagoPoy Sippi, Wisconsin
Security Bank Corporation, RichmondManassas. Virginia
NBO National Bank, PhiladelphiaOlyphant. Pennsylvania
First Virginia Bank-Clinch Valley, RichmondTazewell, Virginia
First Virginia Bank-Piedmont,Lynchburg, Virginia
First Virginia Bank-Franklin county,Rocky Mount, Virginia
First National Bank of Rochester, New YorkRochester, New York
February 5, 1999
February 17, 1999
February 12, 1999
February 11. 1999
February 22, 1999
PENDING CASES INVOLVING THE BOARD OF GOVERNORS
This list of pending cases does not include suits against theFederal Reserve Banks in which the Board of Governors is notnamed a party.
Folstad v. Board of Governors, No. 1:99 CV 124 (W.D. Mich.,filed February 17, 1999). Freedom of Information Act com-plaint.
Nelson v. Greenspan, No. l:99CV00215 (EGS) (D.D.C., filedJanuary 28, 1999). Employment discrimination complaint.
Fraternal Order of Police v. Board of Governors, No.l:98CV03116 (D.D.C., filed December 22, 1998). Declara-tory judgment action challenging Board labor practices.
Inner City Press/Community on the Move v. Board of Gover-nors, No.98-9604 (2d Cir., filed December 3, 1998). Appeal
of district court order dated October 6, 1998, grantingsummary judgment for the Board in a Freedom of Informa-tion Act case.
Attorneys Against American Apartheid v. Board of Governors,No. 98-1483 (D.C. Cir., filed October 21, 1998). Petition forreview of denial of reconsideration of a Board order datedAugust 17, 1998, approving the merger of NationsBankCorporation, Charlotte, North Carolina, and BankAmerica.Corporation, San Francisco, California. On December 7,1998, the Board filed a motion to dismiss the petition. Thecourt of appeals granted the motion on January 19, 1999.
Independent Bankers Association of America v. Board of Gov-ernors, No. 98-1482 (D.C. Cir., filed October 21, 1998).Petition for review of a Board order dated September 23,
Digitized for FRASER http://fraser.stlouisfed.org/ Federal Reserve Bank of St. Louis
284 Federal Reserve Bulletin • April 1999
1998, conditionally approving the applications of TravelersGroup, Inc., New York, New York, to become a bankholding company by acquiring Citicorp, New York. NewYork, and its bank and nonbank subsidiaries.
Jones v. Board of Governors, No. 98-30138 (5th Cir., filedFebruary 9, 1998). Appeal of district court dismissal ofcomplaint alleging violations of the Fair Housing Act. OnNovember 19, 1998, the court dismissed the appeal.
Cunningham v. Board of Governors, No. 98-1459 (D.C. Cir.,filed September 30, 1998). Petition for review of a Boardorder dated September 23, 1998, conditionally approvingthe applications of Travelers Group, Inc., New York, NewYork, to become a bank holding company by acquiringCiticorp, New York, New York, and its bank and nonbanksubsidiaries. On December 4, 1998, the Court granted theBoard's motion to dismiss the petition.
Clarkson v. Greenspan, No.98-5349 (D.C. Cir., filed July 29,1998). Appeal of district court order granting Board's mo-tion for summary judgment in a Freedom of InformationAct case. On September 14, 1998, the Board filed a motionfor summary affirmance of the district court dismissal.
Board of Governors v. Carrasco, No. 98 Civ. 3474 (LAIC)(S.D.N.Y., filed May 15, 1998). Action to freeze assets ofindividual pending administrative adjudication of civilmoney penalty assessment by the Board. On May 26, 1998,the court issued a preliminary injunction restraining thetransfer or disposition of the individual's assets and appoint-ing the Federal Reserve Bank of New York as receiver forthose assets.
Board of Governors v. Pharaon, No. 98-6101 (2d Cir., filedMay 4, 1998). Appeal and cross-appeal of district courtorder granting in part and denying in part the Board'smotion for summary judgment seeking prejudgment interestand a statutory surcharge in connection with a civil moneypenalty assessed by the Board. On February 24, 1999, thecourt granted the Board's appeal and denied the cross-appeal, and remanded the matter to the district court fordetermination of prejudgment interest due to the Board.
Fenili v. Davidson, No. C-98-O1568-CW (N.D. California,filed April 17, 1998). Tort and constitutional claim arisingout of return of a check. On June 5, 1998, the Board filed itsmotion to dismiss.
Logan v. Greenspan, No. l:98CV00049 (D.D.C., filed Janu-ary 9, 1998). Employment discrimination complaint.
Goldman v. Department of the Treasury, No. 98-9451 (1 lthCircuit, filed November 10, 1998). Appeal from a DistrictCourt order dismissing an action challenging Federal Re-serve notes as lawful money.
Kerr v. Department of the Treasury, No. CV-S-97-01877-DWH (D. Nev., filed December 22, 1997). Challenge toincome taxation and Federal Reserve notes. On Septem-ber 3, 1998, a motion to dismiss was filed on behalf of allfederal defendants.
Towe v. Board of Governors, No. 97-71143 (9th Cir., filedSeptember 15, 1997). Petition for review of a Board orderdated August 18, 1997, prohibiting Edward Towe andThomas E. Towe from further participation in the bankingindustry. On February 23, 1999, the court affirmed theBoard's order.
Bettersworth v. Board of Governors, No. 97-CA-624 (W.D.Tex., filed August 21, 1997). Privacy Act case.
FINAL ENFORCEMENT DECISION ISSUED BY THE
BOARD OF GOVERNORS
In the Matter ofIncus Co., Ltd.Tortola, British Virgil Islands AndCarlos Hank RhonAn Institution-Affiliated Party ofIncus Co., Ltd., andLaredo National BancsharesLaredo, Texas
Docket Nos. 98-038-B-FHC, 98-038-B-I,98-038-CMP-FHC, 98-038-CMP-I, 98-038-E-I
Determination on Request for Private Hearing
Background
This is an enforcement proceeding brought by the Board ofGovernors of the Federal Reserve System (the "Board")against Incus Co., Ltd., and Carlos Hank Rhon (the "Re-spondents") pursuant to the Federal Deposit Insurance Act(the '"FDI Act"). Hank Rhon is the registered owner ofIncus, an offshore shell bank holding company that con-trols Laredo National Bancshares ("LNB"). In a Notice ofIntent to Prohibit and Notice of Charges and of Hearing(the "Notice") issued December 16, 1998, the Board al-leged that Hank Rhon used nominees to secretly acquireadditional LNB stock without Board approval, that hetransferred significant equity interests in Incus to his fatherand two business associates in violation of commitmentsand representations made to the Board, and that he causedLaredo National Bank, LNB"s principal subsidiary, to en-gage in lending and other transactions with affiliates thatviolated commitments made to the Board. The Noticeseeks an order of prohibition against Hank Rhon, a ceaseand desist order requiring divestiture of Incus's interest inLNB, and significant civil money penalties against bothRespondents.
In accordance with section 8(u)(2) of the FDI Act,12U.S.C. § 1818(u)(2), the Notice advised the Respon-dents that any hearing held in this matter would be public,unless the Board determines that an open hearing would becontrary to the public interest. The Notice informed Re-spondents that they could submit a statement detailing anyreasons why the hearing should not be public. On Janu-ary 11, 1999, Respondents duly filed a motion with theBoard seeking a private hearing in this matter. BoardEnforcement Counsel opposed the motion.
Respondents make three principal arguments in supportof their request for a closed hearing. First, they assert thatthe safety and soundness of the financial institutions in-volved could be jeopardized as a result of a public hearing.They note that Hank Rhon is currently the chairman of the
Digitized for FRASER http://fraser.stlouisfed.org/ Federal Reserve Bank of St. Louis
Legal Developments 285
board of LNB and is active in its management, and expressconcern that the allegations lodged against Hank Rhon"could well affect the public's confidence in the involvedinstitutions." Second, they assert that a public hearingwould compromise substantial individual privacy and repu-tational interests, not only of the Respondents themselvesbut also of the other individuals whose private dealingswith Hank Rhon and Incus would be made part of thepublic proceedings. Third, they suggest that Mexican andU.S. cross-border investments could be adversely affectedby a public hearing. Specifically, they argue that publiciz-ing "private and personal business affairs" could act as adisincentive for foreign investors, with unidentified reper-cussions in Mexico.
Discussion
In 1990, Congress amended the FDI Act to provide that allhearings held on the record in enforcement cases such asthis "shall be open to the public, unless the agency, in itsdiscretion, determines that holding an open hearing wouldbe contrary to the public interest." 12 U.S.C. § 1818(u)(2).Simultaneously, Congress required that a transcript of alltestimony and documentary evidence be prepared and thatthe transcripts of all public hearings be made availablethrough the Freedom of Information Act, 12 U.S.C.§ 1818(u)(4), provided that the agency may file a docu-ment under seal in an administrative proceeding "if disclo-sure of the document would be contrary to the publicinterest," 12 U.S.C. § 1818(u)(6), and required agencies toprovide Congress with a written report of any determina-tion to close a hearing, 12 U.S.C. § 1818(u)(3).
These amendments, which reversed the prior presump-tion in favor of closed hearings, reveal a congressionalbelief that the public benefits of open hearings wouldgenerally outweigh the disruptions inherent in them. In theMatter of Zbinden, 80 Federal Reserve Bulletin 360, 361(1994). As the Chairman of the Senate Banking Committeeobserved at the time, publicity is "the greatest disinfec-tant." 136 Cong. Rec. SI7,599 (daily ed. October 27,1990).
Accordingly, before the Board exercises its discretion toclose a hearing, there should be a substantial basis forconcluding that the case reflects unusual circumstances thatovercome the presumption in favor of open hearings. Ingeneral, in light of the congressional requirement that theproceedings be open unless "contrary to the public inter-est," those circumstances should involve serious safety andsoundness concerns flowing from a public hearing. Gener-alized claims of a possible loss of confidence or a "run onthe bank," or claims of impairment of the privacy orreputational interests of respondents and third parties,should not be sufficient to result in a closed hearing.Rather, a party seeking a closed hearing should be requiredto demonstrate how the effects of this proceeding differ sosignificantly from those involving other banks in terms ofthe public interest as to warrant special treatment. See Inthe Matter of Citizens Bank of Clovis, FDIC-91-^06b, 2FDIC Enf. Dec. (P-H) 8012 (March 2, 1992).
The arguments advanced by Respondents do not meetthis standard. Although Respondents speculate that thepublic's confidence in LNB's subsidiary banks may beadversely affected by an open proceeding, they provide noevidence to support their argument and no basis for theBoard to distinguish this case from any other case involv-ing an open institution. The Board has previously rejectedsuch conclusory and speculative arguments as a basis forclosing an enforcement hearing. See In the Matter of Na-tional Bank of Pakistan, No. 92-065-B-FB (August 20,1992). Moreover, the Board and other banking agencieshave held public enforcement hearings without a seriouseffect on public confidence in open institutions, includingenforcement actions involving the ownership and controlof the bank involved. E.g., Interamericas Investments, Ltd.,v. Board of Governors of the Federal Reserve System, 111F.3d 376 (5th Cir. 1997).
Similarly, the privacy interests of the Respondents andthird parties do not implicate the "public interest" neces-sary to justify a closed hearing. As the Board observed inIn the Matter of Zbinden, "Enforcement proceedings, bytheir nature, involve allegations that, if made public, couldadversely affect a respondent's reputation or career. Never-theless, in establishing a statutory presumption in favor ofopen hearings, Congress implicitly determined that thepublic benefit from conducting proceedings in the openoutweighs the privacy interests of the individuals in-volved." In the Matter of Zbinden, 80 Federal ReserveBulletin 361 (1994). As in Zbinden, the Board here "doesnot believe that the disruptions cited by Respondents],which are a normal consequence of such proceedings, aresufficient to overcome the statutory presumption favoringpublic hearings." Id. at 361-62.' The same is true forasserted privacy interests of third parties. In the Matter ofInterbank Holding Company, et al, No. 96-018-B-HC(August 14, 1996) (rejecting claim that potential harm tothird parties justifies closing enforcement hearing).
Respondents have provided no evidentiary support fortheir final argument, that an open hearing would inhibitMexican and U.S. cross-border investment. In particular,they offer no reason why Mexicans who are willing tocomply with U.S. laws would be reluctant to do so if theirdealings were made public. Foreign nationals who invest inregulated industries in the United States are subject toUnited States laws and are not entitled to special treatmentreflecting their differing "business customs and practices."As one federal court put it, the argument that nationalitycan act as a predicate for different standards for BHC Actliability is "beyond frivolous." Interamericas Investments,Ltd., I l l F.3dat384.
In short, because Respondents have not shown that anopen hearing is contrary to the public interest, the requestfor a private hearing in this matter must be denied.
Respondents' separate request that all documents relatedto this proceeding be kept confidential is also denied. Asnoted above, the FDI Act provides that the Board may filea particular document or part of a document under seal "ifdisclosure of the document would be contrary to the publicinterest." 12 U.S.C. § 1818(u)(6). Pursuant to the Board's
Digitized for FRASER http://fraser.stlouisfed.org/ Federal Reserve Bank of St. Louis
286 Federal Reserve Bulletin • April 1999
Rules of Practice for Hearings, this authority has beendelegated to Board Enforcement Counsel, who has thediscretion to determine which documents, if any, should befiled under seal. 12 C.F.R. 263.33(b). If Respondents haveparticular concerns about public disclosure of a specificdocument or part of a document, they may address theseconcerns to Board Enforcement Counsel. In the Matter ofZbinden, 80 Federal Reserve Bulletin 362-63 (1994).
By Order of the Board of Governors, this 12th day ofFebruary, 1999.
BOARD OF GOVERNORS OF THEFEDERAL RESERVE SYSTEM
Jennifer J. JohnsonSecretary of the Board
FINAL ENFORCEMENT ORDERS ISSUED BY THEBOARD OF GOVERNORS
Hogi Patrick HyunFormer Employee of BT Singapore
The Federal Reserve Board announced on February 25,1999, the issuance of a combined Order to Cease andDesist and of Assessment of a Civil Money Penalty againstHogi Patrick Hyun, a former employee of BT Singapore, awholly owned nonbank subsidiary of Bankers Trust NewYork Corporation, New York, New York.
Daniel K. WalkerLong Beach, California
The Federal Reserve Board announced on February 25,1999, the issuance of a Consent Order against Daniel K.
Walker, senior vice-president, a director, and an institution-affiliated party of the Farmers and Merchants Bank of LongBeach, Long Beach, California, a state member bank.
Kenneth G. WalkerLong Beach, California
The Federal Reserve Board announced on February 25,1999, the issuance of a Consent Order against Kenneth G.Walker, president, chairman of the board of directors, chiefexecutive officer, and institution-affiliated party of theFarmers and Merchants Bank of Long Beach, Long Beach,California, a state member bank.
Zia New Mexico BankTucumcari, New Mexico
The Federal Reserve Board announced on February 11,1999, the issuance of a Prompt Corrective Action Directiveagainst the Zia New Mexico Bank, Tucumcari, New Mex-ico.
WRITTEN AGREEMENTS APPROVED BY FEDERALRESERVE BANKS
First Utah BancorporationSalt Lake City, Utah
The Federal Reserve Board announced on February 5,1999, the execution of a Written Agreement by and amongFirst Utah Bancorporation, the First Utah Bank, PremierData Corporation, all of Salt Lake City, Utah, and theFederal Reserve Bank of San Francisco.
Digitized for FRASER http://fraser.stlouisfed.org/ Federal Reserve Bank of St. Louis
Al
Financial and Business Statistics
A3 GUIDE TO TABULAR PRESENTATION
DOMESTIC FINANCIAL STATISTICS
Monev Stock and Bank Credit
A4 Reserves, money stock, liquid assets, and debtmeasures
A5 Reserves of depository institutions and Reserve Bankcredit
A6 Reserves and borrowings—Depositoryinstitutions
Policy Instruments
A7 Federal Reserve Bank interest ratesA8 Reserve requirements of depository institutionsA9 Federal Reserve open market transactions
Federal Reserve Banks
A10 Condition and Federal Reserve note statementsA 11 Maturity distribution of loan and security
holding
Monetary and Credit Aggregates
A12 Aggregate reserves of depository institutionsand monetary base
A13 Money slock, liquid assets, and debt measures
Commercial Banking Institutions—Assets and Liabilities
A15 All commercial banks in the United StatesA16 Domestically chartered commercial banksA17 Large domestically chartered commercial banksA19 Small domestically chartered commercial banksA20 Foreign-related institutions
Financial Markets
A22 Commercial paper and bankers dollaracceptances outstanding
A22 Prime rate charged by banks on short-termbusiness loans
A23 Interest rates—Money and capital marketsA24 Stock market—Selected statistics
Federal Finance
A25 Federal fiscal and financing operationsA26 U.S. budget receipts and outlaysA27 Federal debt subject to statutory limitation
Federal Finance—Continued
All Gross public debt of U.S. Treasury—Types and ownership
A28 U.S. government securitiesdealers—Transactions
A29 U.S. government securities dealers—Positions and financing
A30 Federal and federally sponsored creditagencies—Debt outstanding
Securities Markets and Corporate Finance
A31 New security issues—Tax-exempt state and localgovernments and corporations
A32 Open-end investment companies—Net salesand assets
A32 Corporate profits and their distributionA32 Domestic finance companies—Assets and
liabilitiesA33 Domestic finance companies—Owned and managed
receivables
Real Estate
A34 Mortgage markets—New homesA35 Mortgage debt outstanding
Consumer Credit
A36 Total outstandingA36 Terms
Flow of Funds
A37 Funds raised in U.S. credit marketsA39 Summary of financial transactionsA40 Summary of credit market debt outstandingA41 Summary of financial assets and liabilities
DOMESTIC NONFINANCIAL STATISTICS
Selected Measures
A42 Nonfinancial business activityA42 Labor force, employment, and unemploymentA43 Output, capacity, and capacity utilizationA44 Industrial production—Indexes and gross valueA46 Housing and constructionA47 Consumer and producer pricesA48 Gross domestic product and incomeA49 Personal income and saving
Digitized for FRASER http://fraser.stlouisfed.org/ Federal Reserve Bank of St. Louis
A2 Federal Reserve Bulletin • April 1999
INTERNATIONAL STATISTICS
Summary Statistics
A50 U.S. international transactionsA51 U.S. foreign tradeA51 U.S. reserve assetsA51 Foreign official assets held at Federal Reserve
BanksA52 Selected U.S. liabilities to foreign official
institutions
Reported by Banks in the United States
A52 Liabilities to, and claims on, foreignersA53 Liabilities to foreignersA55 Banks' own claims on foreignersA56 Banks' own and domestic customers' claims on
foreignersA56 Banks' own claims on unaffiliated foreignersA57 Claims on foreign countries—Combined
domestic offices and foreign branches
Reported by Nonbanking Business
Enterprises in the United States
A58 Liabilities to unaffiliated foreignersA59 Claims on unaffiliated foreigners
Securities Holdings and Transactions
A60 Foreign transactions in securitiesA61 Marketable U.S. Treasury bonds and
notes—Foreign transactions
Interest and Exchange Rates
A62 Foreign exchange rates
A63 GUIDE TO STATISTICAL RELEASES AND
SPECIAL TABLES
A64 INDEX TO STATISTICAL TABLES
Digitized for FRASER http://fraser.stlouisfed.org/ Federal Reserve Bank of St. Louis
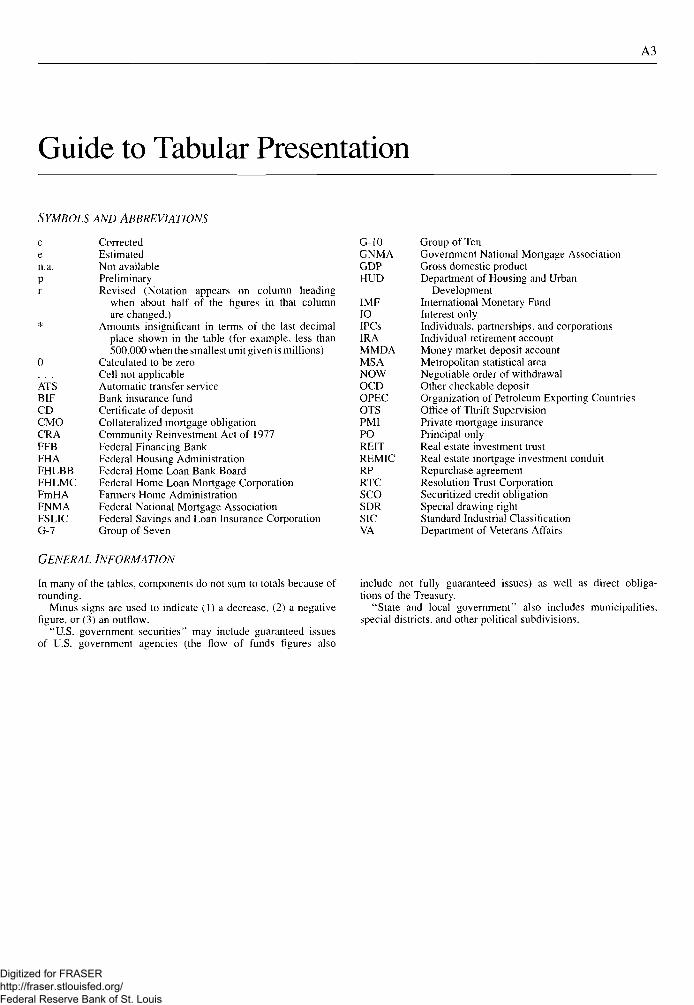
Guide to Tabular Presentation
A3
SYMBOLS AND ABBREVIATIONS
cen.a.Pr
0
ATSBIFCDCMOCRAFFBFHAFHLBBFHLMCFmHAFNMAFSLICG-7
CorrectedEstimatedNot availablePreliminaryRevised (Notation appears on column heading
when about half of the figures in that columnare changed.)
Amounts insignificant in terms of the last decimalplace shown in the table (for example, less than500,000 when the smallest unit given is millions)
Calculated to be zeroCell not applicableAutomatic transfer serviceBank insurance fundCertificate of depositCollateralized mortgage obligationCommunity Reinvestment Act of 1977Federal Financing BankFederal Housing AdministrationFederal Home Loan Bank BoardFederal Home Loan Mortgage CorporationFarmers Home AdministrationFederal National Mortgage AssociationFederal Savings and Loan Insurance CorporationGroup of Seven
G-10GNMAGDPHUD
IMFIOIPCsIRAMMDAMSANOWOCDOPECOTSPMIPOREITREMICRPRTCSCOSDRSICVA
GENERAL INFORMATION
In many of the tables, components do not sum to totals because ofrounding.
Minus signs are used to indicate ( D a decrease, (2) a negativefigure, or (3) an outflow.
"U.S. government securities" may include guaranteed issuesof U.S. government agencies (the flow of funds figures also
Group of TenGovernment National Mortgage AssociationGross domestic productDepartment of Housing and Urban
DevelopmentInternational Monetary FundInterest onlyIndividuals, partnerships, and corporationsIndividual retirement accountMoney market deposit accountMetropolitan statistical areaNegotiable order of withdrawalOther checkable depositOrganization of Petroleum Exporting CountriesOffice of Thrift SupervisionPrivate mortgage insurancePrincipal onlyReal estate investment trustReal estate mortgage investment conduitRepurchase agreementResolution Trust CoiporationSecuritized credit obligationSpecial drawing rightStandard Industrial ClassificationDepartment of Veterans Affairs
include not fully guaranteed issues) as well as direct obliga-tions of the Treasury.
"State and local government" also includes municipalities,special districts, and other political subdivisions.
Digitized for FRASER http://fraser.stlouisfed.org/ Federal Reserve Bank of St. Louis
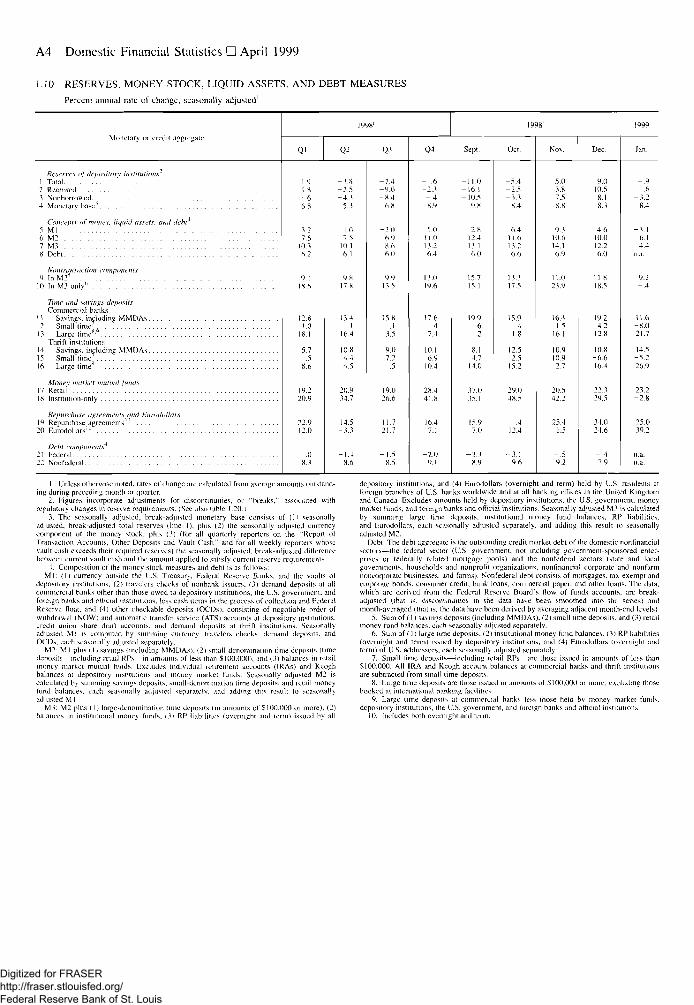
A4 Domestic Financial Statistics • April 1999
.10 RESERVES, MONEY STOCK, LIQUID ASSETS. AND DEBT MEASURES
Percent annual rate of change, seasonally adjusted1
Monetary or credit aggregate
Rewires <<f depositor mstitutions1
1 Total '2 Required3 Nonborrowed4 Monetary base"
Concepts of m<me\. liquid assets, and debt*5 Ml6 M27 M.I8 Debt
Nonlransaetion components9 In M2S
K) In MJ only'1
Time and savings depositsConnnereial banks
1 1 Savings, including MMDAs12 Small time'1 3 Large lime '
Thrift institutions14 Savings, including MMDAs15 Small t i m e 7 . . . . '16 Large time8
Money market mutual binds17 Retail18 Institution-only
Repurclwse agreement* and Eurodollar*19 Repurchase agreements111
20 Eurodollars1 '
Debt components*21 Federal22 Nonfedcral
19981
Ql
-1.9- I . R- .66.8
1.27.6
10.36.2
9.1IS.6
12.81.0
18.1
5.7-.58.6
19.220.9
22.912.0
.0S.3
- 3 S-2.5-4.3
5.3
1.07.5
10 16.1
9.S1 7 8
13.4.1
16.4
10.8- 4 . 4-4 .5
20.934.7
14.5-3 .3
-1 .48.6
Q3
- 7 4-<P.ll- 8 . 4
6.8
- 2 06.98.66.0
9.91.1.5
15.8
.13.5
9.0- 7 . 2
.5
19.026.6
11.721.7
-1 .58.5
Q4
-1 .6-2.3- 48.9
5.011.011.26.4
n.o19.6
17.6.4
7.4
10.1- 6 . 910.4
28.441.8
16.47.1
-2 .09.1
1998'
Sept.
-11.0-16.1-10.5
9.8
2.812.4n.i6.0
15.715.1
19 9.6.2
8.1-4 .714.0
37.035.1
15.97.0
- 3 . 18.9
Oct.
-5 .4-2 .5- 3 . 3
8.4
6.411.613.26.6
13.317.5
15.9- . 41.8
12.5— 2.515.2
29.048.5
.412.4
-3 .19 6
Nov.
5.03.87.58.8
9.110.614.16.9
11.023.9
16.41.5
16.1
10.9-10.9
2.7
20.542.2
25 41.5
- . 59.2
Dec.
9.010.58.18.3
4 610.012.26.0
11.818.5
19.2-4 212.8
10.8-6.616.4
22.129.5
34.0-24.6
- . 47.9
1999
Jan.
- . 9.6
-3 .28.4
-3.16 14.4
n.a.
9.2- . 4
11.6-8.021.7
14.5- 5 226.9
23.2-2 .8
-25.0-39.2
n.a.u a.
1. Unless otherwise noted, rates of change are calculated from average amounts outstand-ing during preceding month or quarter.
2. Figures incorporate adjustments tor discontinuities, or "breaks," associated withregulator) changes in reserve requirements. (See also cable 1.20.1
3. The seasonally adjusted, break-adjusted monetary base consists of ( h seasonallyadjusted, break-adjusted total reserves (line 1). plus (2) the seasonally adjusted currencycomponent of the money stock, plus (3) (for all quarterly reporters on the "Report otTransaction Accounts, Other Deposits and Vault Cash" and for all weekly reporters whosevault cash exceeds their required reserves) the seasonally adjusted, break -adjusted differencehetweeu current vault cash and the amount applied to satisfy current reserve requirements.
4. Composition of the money stock measures and debt is as follows:Ml: (I) currency outside the U.S. Treasury, Federal Reserve Banks, and the vaults of
depository institutions, (2) travelers checks of nonbank issuers, (3) demand deposits at allcommercial banks other than those owed to depository institutions, the U.S. government, andforeign banks and official institutions, less cash items in the process ot" collection ant! FederalReserve float, and (4) other checkable deposits (OCDs). consisting of negotiable order ofwithdrawal (NOW) and automatic transfer service (ATS) accounts al depository institutions,credit union share draft accounts, and demand deposits al thrift institutions. Seasonallyadjusled Ml is computed by summing currency, travelers checks, demand deposits, andOCDs, each seasonally adjusted separately.
M2: Ml plus (1) savings (including MMDAs). (2) sniall-denominaiion time deposit (timedeposits—including retail RPs—in amounts of less than $100,000), and (3) balances in retailmoney market mutual funds. Excludes individual retirement accounts (IRAs) and Keoghbalances al depository institutions and money market funds. Seasonally adjusted M2 iscalculated by -dimming savings deposits, small-denomination time deposits, and retail moneyfund balances, each seasonally adjusted separate Iv, .Hid adding (his result to seasonallyadjusted Ml
M3: M2 plus (I) large-dcnominalion lime deposits (in amounts of S 100,000 or more). (2)balances in instituiional money funds. (}) RP liabilities (overnight and term) issued by all
depository institutions, and (4) Eurodollars (overnight and term) held by U.S. residents atforeign branches of U.S. banks worldwide and at all banking offices in the United Kingdomand Canada Excludes amounts held by depository institutions, ihe U.S. government, moneymarket funds, and foreign banks and official institutions. Seasonally adjusted M3 is calculatedby summing large time deposits, institutional money fund balances, RP liabilities.and Eurodollars, each seasonally adjusted separately, and adding this result to seasonallyadjusted M2.
Debt; The debt aggregate is the outstanding credit market debt of the domestic nonfinancialsectors—the federal sector (U.S. government, not including government-sponsored enter-prises or federally related mortgage pools) and the nonfederal sectors (state and localgovernments, households and nonprofit organizations, nonfinancial corporate and nonfarmnoncoiporatc businesses, and farms). Nonfederal debt consists of mortgages, tax-exempt andcorporate bonds, consumer credit, bank loans, commercial paper, and other loans. The data,which arc derived from (he Federal Reserve Board's flow of funds accounts, are break-adjusted uhiit is. discontinuities in the data have been smoothed into the series) andmonth-averaged (tnat is. the data have been derived by averaging adjacent month-end levels)
5. Sum of (1) savings deposits (including MMDAs). (2) small time deposits, and (3) retailmoney fund balances, each seasonally adjusted separately.
6. Sum of (1) large time deposits, (2) institutional money fund halances. (3) RP liabilities('overnight and term) issued by depository institutions, and (4) Eurodollars (overnight andterm) of U.S. addressees, each seasonally adjusted separately.
7. Small time deposits—including retail RPs—are those issued in amounts of less than$100,000. All IRA and Keogh account balances at commercial banks and thrill institutionsare subtracted from small time deposits.
8. Large time deposits are those issued in amounts of $100,000 or more, excluding thosebooked at international banking facilities
9. Large tune deposits at commercial banks less those held by money market funds,depository institutions, the U.S. government, and foreign banks and official institutions.
10. Includes both overnight and term.
Digitized for FRASER http://fraser.stlouisfed.org/ Federal Reserve Bank of St. Louis
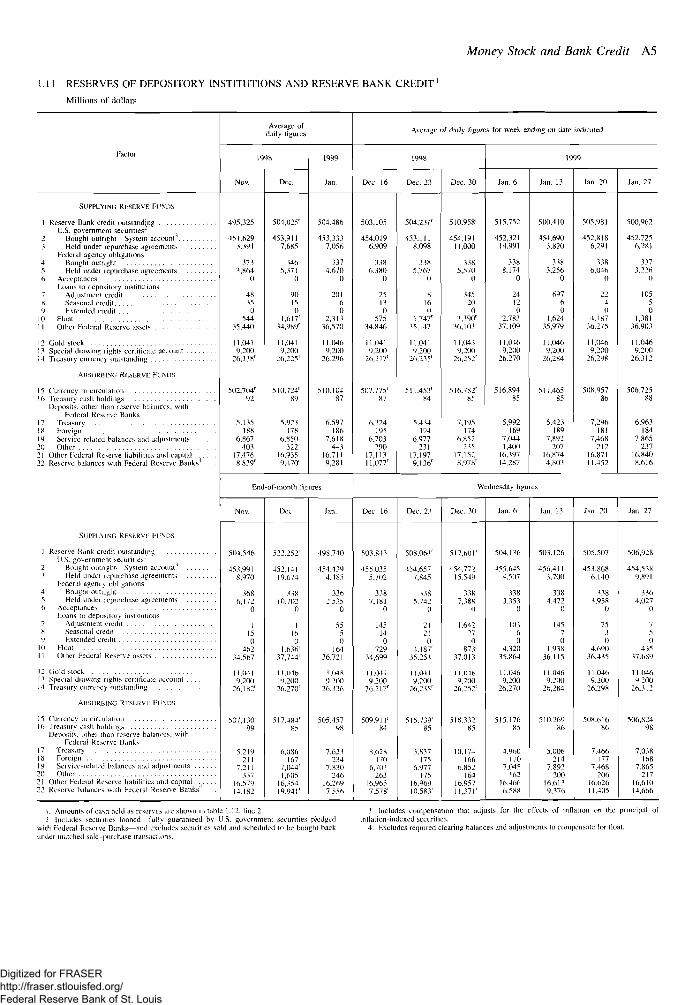
Money Stock and Bank Credit A5
1.11 RESERVES OF DEPOSITORY INSTITUTIONS AND RESERVE BANK CREDIT'
Millions of dollars
Factor
SUPPLYING RESERVE FUNDS
1 Reserve Bank credit outstandingU.S. government securities2
2 Bought outright—System account1
3 Held under repurchase agreements
Federal agency obligations4 Bought outright5 Held under repurchase agreements6 Acceptances
Loans to depository institutions7 Adjustment credit8 Seasonal credit9 Extended credit
10 Float1 1 Other Federal Reserve assets
12 Gold stock13 Special drawing rights certificate account14 Treasury currency outstanding
AHSORRINC; RESERVE FUNDS
5 Currency in circulation16 Treasury cash holdings
Deposits, other than reserve balances, withFederal Reserve Banks
17 Treasury18 Foreign19 Service-related balances and adiustmeuls . . . ."'O Other21 Other Federal Reserve liabilities and capital22 Reserve balances with Federal Reserve Banks4
SUPPLYING RESERVE F I N D S
1 Reserve Bank credit outstandingU.S. government securities"
2 Bought outright—System account1
3 Held under repurchase agreementsFederal agency obligations
4 Bought outright5 Held under repurchase agreements6 Acceptances
Loans to depository institutions7 Adjustment credit8 Seasonal credit9 Extended credit
10 Float11 Other Federal Reserve assets
12 Oold slock13 Special diawttig rights certificate account14 Treasury currency outstanding
ABSORBING RESERVE FUNDS
15 Currency in circulation16 Treasury cash holdings
Deposits, other than reserve balances, withFederal Reserve Banks
7 Treasury18 Foreign9 Service-related balances and adjustments
20 Other21 Other Federal Reserve liabilities and capital22 Reserve balances with Federal Reserve Banks4
Average ofdaily figures
1998
Nov.
495.325
•151.6293.391
3733,864
0
4835
0544
35.440
11,0419.200
26.1.18'
502.704'92
5.135188
6,867403
17,4768.839'
Dec
504,025'
453,9117,685
1465,371
0
90150
1,617'34,989'
11,0419.200
26.225'
510,724'89
5,923178
6,850322
16.9359,470'
1999
Jan.
504,486
453,3337,056
3374.670
0
20160
2,31336,570
11,0469,200
26.296
510.10487
6.597186
7,618443
16,7119,281
End-of-month ligures
Nov.
504.546
45!,99I8,970
3686,172
0
115
0462
34.567
11.0419,200
26,182'
507,130'99
5,219
7.211337
16,57914.182
Dec
522,252'
452.14119.674
338I0 7IP
0
1160
1,636'37,744'
1 1.0469.200
26.270'
517.484'85
6.086167
7,044'1,605
16,35419.941'
Jan.
498.740
454.4394,485
3362,5.35
0
5550
16436.721
1 1.0489.200
26,326
505,45798
7.621234
7,830246
16 2697.556
Average of daily figures for week ending on date indicaled
1998
Dec. 16
503.105
454,0196.909
3386,380
0
25130
57534,846
11,0419,200
26,217'
507.775'87
6.324195
6.703290
17,11311,077'
Dec. 23
504,231'
453.1118.098
3385,767
0
8160
1.747'35.147
11,0419.200
26.235'
511.453'84
5.434194
6,977231
17,1979,136'
Dee. 30
510.958'
454,19111,000
3385,570
0
345200
3.390'36,103
11,0439,200
26,252'
516.782'85
7.195174
6,852235
17,1528,978'
1999
Jan. 6
515,752
452,32114,991
3388,174
0
24120
2.78.137.109
11,0469,200
26.270
516,89485
5,992169
7.0441,400
16.39714.287
Jan. 13
500.410
JM6903.820
3383,256
0
69760
1,62435,979
11,0469,20(1
26,284
511,46585
5,423189
7,892207
16,8744,803
Jan. 20
505,981
452,8186,291
1386,046
0
2240
4.18736,275
11,0469,200
26,298
508.95786
7,296181
7,468212
16.87111.452
Jan. 27
500,962
452,7256,281
3373.226
0
10550
1,38136,903
11,0469 200
26.312
506.72588
6,963184
7,865237
16,8408,616
Wednesday figures
Dec. 16
503.843
455,0355.702
3187,181
0
145140
72934,699
11.0419.200
26.217'
509.911'84
8.628170
6,70326!
16,9657.578'
Dec. 23
508.064'
454,6577,845
3385.742
0
21210
4.187'35.254
11,(Ml9,200
26.235'
515.739'85
1.817175
6.977175
16.96910,583'
Dec. 30
517,601'
454,77215.549
33K7,388
0
1.642270
873'.37,013
11,0469.200
26.2521
518,332'85
10,174166
6.852164
16.95711,371'
Jan. 6
504.136
455.6454.507
3381.353
0
10160
4,32035,864
11,0469.200
26,270
515,17685
4 960170
7.045162
16.4666,588
Jan. 13
503.126
456,4113.700
3384,472
0
14570
1,93836,115
11.0469.200
26,284
510.26986
5,006214
7,892200
16,6139.376
Jan. 2(1
505,507
453,8686,140
3383,958
0
75.10
4,69036.435
11.0469,200
26.298
508,61686
7.466177
7,468206
16,62611.405
Jan. 27
506,928
454,5389,891
3364.027
0
750
43537.689
11.0469,200
26.312
506,82498
7,038168
7.865217
16.61014,666
1. Amounts of cash held as reserve.-* are shown in table 1.12. line 2.2. Includes securities loaned—fully guaranteed by U.S. government securities pledged
with Federal Reserve Banks—and excludes securities sold and scheduled to be bought backunder matched sale-purchase lrans;ic!ions.
3. Includes compensation that adjusts for the effects of inflation on the principal ofinflation-indexed securities.
4. Excludes required clearing balances and adjustments ID compensate for float.
Digitized for FRASER http://fraser.stlouisfed.org/ Federal Reserve Bank of St. Louis
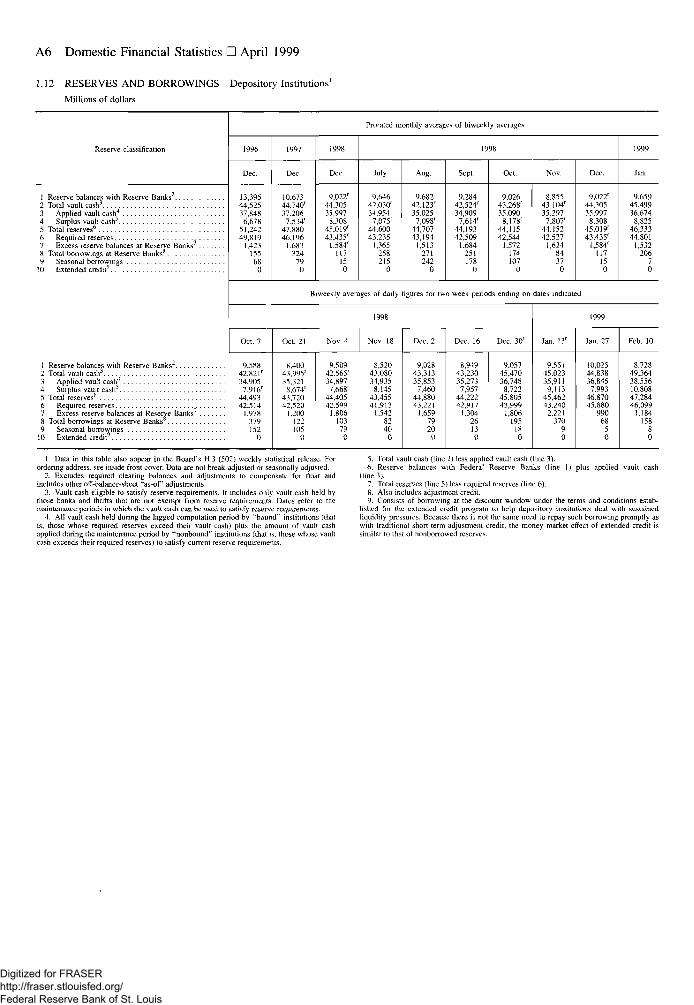
A6 Domestic Financial Statistics • April 1999
1.12 RESERVES AND BORROWINGS Depository Institutions'
Millions of dollars
Reserve classification
1 Reserve balances with Reserve Banks2 Total vault cash3
3 Applied vault cash4
5 Total reserves6
7 Excess reserve balances at Reserve Banks8 Total borrowings at Reserve Banks*
10 Extended credit9
1 Reserve balances with Reserve Banks"2 Total vault cash3
4 Surplus vault cash5
7 Excess reserve balances at Reserve Banks7
9 Seasonal borrowings10 Extended credit9
Prorated monthly averages of biweekly averages
1996
Dec,
13.39544,52537,8486,678
51,24249,819
1.423155680
1997
Dec,
10,67344,740'37,206
7,534'47,88046,196
1.683324790
1998
Dec.
9,022'44.30535,997
8.30845.019'43,435'
1,584'117150
Biweekly avert
1998
July
9,64642,030'34.9547,075'
44,60043.235
1,365258215
0
ges of daily
Aug.
9,68242,123'35.0257,098'
44,70743,194
1,513271242
0
Sept.
9,28442,524'34,9097,614'
44,19342,509
1.684251178
0
Oct.
9.02643,268'35,090
8,178'44,11542,544
1.572174107
0
Nov.
8,85543,104'35,297
7,807'44,15242,527
1,62484370
Dec.
9,022'44,30535,997
8,30845,019'43,435r
1,584'117
150
igures for two week periods ending on dates indicated
1998
Oct. 7
9,58842,821'34,9057,916'
44 49342,514
1,978379152
0
Oct. 21
8.40043,995'35,321
8,674'43 72042,520
1.200122105
0
Nov. 4
9.S0942.565'34,8977,668'
44 40542.599
1.806103790
Nov. 18
8,52043,08034,935
8,1454145541,913
1,5428240
0
Dec. 2
9,02843,31335,853
7,46044,88043,221
1,65979200
Dec. 16
8,94943,23035,2737,957
44 22242,917
1.30426130
Dec. 30'
9.05745,47036,7488,722
45 80543,999
1,806195
180
1999
Jan.
9,65945,49936,674
8,82546,33344,801
1,532206
70
1999
Jan. 13'
9.55145.02335,9119,113
45 46243.240
2.221370
90
Jan. 27
10,02544,83836,845
7.99346,87045,880
99068
50
Feb. 10
8,72849,36438,55610,80847 28446,099
1,184158
80
1. Data in this table also appear in the Board's H.3 (502) weekly statistical release. Forordering address, see inside front cover. Data are not break-adjusted or seasonally adjusted.
2. Excludes required clearing balances and adjustments to compensate for float andincludes other off-balance-sheet "as-of' adjustments.
3. Vault cash eligible to satisfy reserve requirements. It includes only vault cash held bythose banks and thrifts that are not exempt from reserve requirements. Dates refer to themaintenance periods in which the vault cash can be used to satisfy reserve requirements.
4. All vault cash held during the lagged computation period by "bound" institutions (thatis, those whose required reserves exceed their vault cash) plus the amount of vault cashapplied during the maintenance period by "nonbound" institutions (that is, those whose vaultcash exceeds their required reserves) to satisfy current reserve requirements.
5. Total vault cash (line 2) less applied vault cash (line 3).6. Reserve balances with Federal Reserve Banks (line 1) plus applied vault cash
(line 3).7. Total reserves (line 5) less required reserves (line 6).8. Also includes adjustment credit.9. Consists of borrowing at the discount window under the terms and conditions estab-
lished for the extended credit program to help depository institutions deal with sustainedliquidity pressures. Because there is not the same need to repay such borrowing promptly aswith traditional short-term adjustment credit, the money market effect of extended credit issimilar to that of nonborrowed reserves.
Digitized for FRASER http://fraser.stlouisfed.org/ Federal Reserve Bank of St. Louis
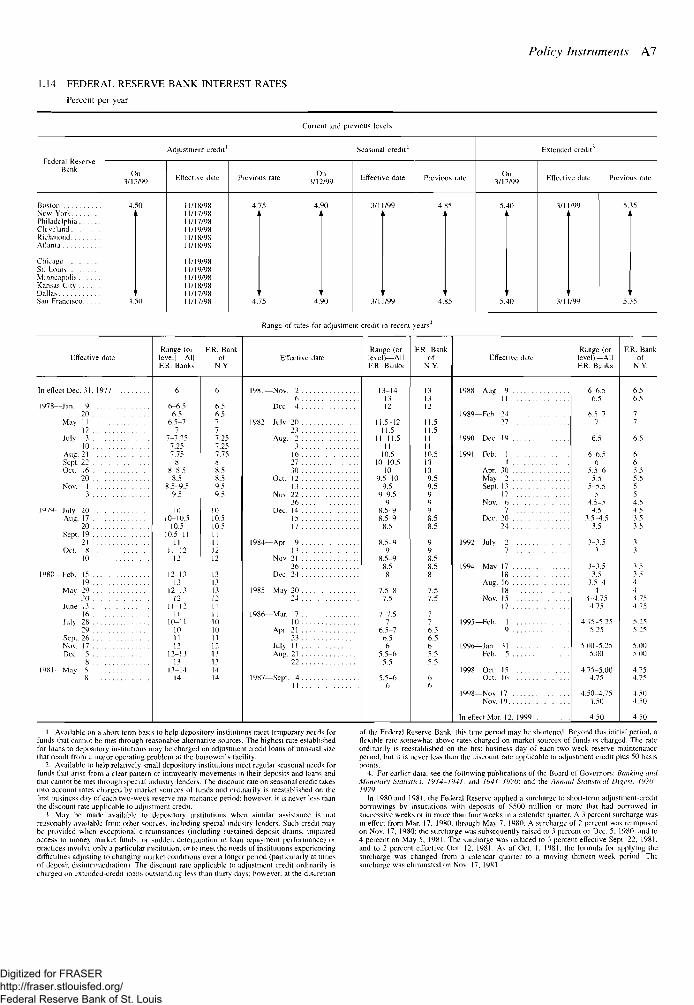
Policy Instruments A 7
1.14 FEDERAL RESERVE BANK INTEREST RATES
Percent per year
Current and previous levels
Federal ReserveBank
Adjustment credit1
On3/12199
Seasonal credit"
On3/12/09
Extended credit
On3/12/99
Effective dale Previous rale
BostonNew York. . . .Philadelphia. .Cleveland. .RichmondAtlanta
ChicapoSt. Louis . . . .Minneapolis .Kansas City . .DallasSan Francisco.
11/18/9811/17/9811/17/9811/19/9811/18/9811/18/98
11/19/9811/19/9811/19/9811/18/9811/17/9811/17/98
Range of rates for adjustment credit in recent years'1
Effective date
In effect Dec. 31, 1977
1978—Jan. 920
May 1112
Julv 310
Aug. 21Sept. 22Oct. 16
20Nov. 1
3
1979—July 20Aim. 17
20Sept. 19
21Oel. 8
10
1980— Feti. 519
May 29.10
June 1316
July 2829
.Sept. 26Nov. 17Dec. 5
81981 —May 5
8
Range (orlevel)—AllF.R. Banks
6
6-6 56 5
6.5-77
7-7.257.257.75
X8-8.58.5
8.5-9.59.5
1(110-10.5
10.510.5-11
1111-12
12
12-1313
12-1312
11-121 1
10-1110) |12
12-1313
13-1414
F.R. Bankof
N Y
6
6.5rSS777.257.257.7588.58.59.59.5
1010.510.511II1212
1313131211II1010II1213131414
Effective date
1981—Nov. 26
Dec 4
1982—Julv 2023
Aug. 23
162730
Oct. 1213
No% 2226
Dec. 141517
1984—Apr 9
nNov. 2126
Dec. 24
1985—May 2024
1986—Mar. 710
Apr. 2123
July IIAug. 21
22
1987—Sept. 41 j
Range (orlevel)—AllF.R Banks
13-141312
11.5-1211.5
11-11.511
10.510-10.5
109.5-10
9.59-9.5
98.5-98.5-9
8.5
8.5-99
8 5-98.58
7.5-87.5
7-7.57
6.5-76.56
5.5-65.5
5.5-6
F.R. Bankof
NY.
131312
11.511.51 ]1110.510109.59.59998.58.5
998.58.58
7.57.5
776.56.565.55.5
6
Effeclivc date
1988—Alii!. 9] |
1989—Feb 2427
1990—Dec. 19
1991—Feb. 14
Apr. 30May 2Sept. 13
17Nov. 6
7Dec. 20
24
1992—July 27
1994—May 1718
Aug. 1618
Nov. 1517
1995—Feh. 19
1996—Jan 31Feb. 5
1998—Oct. 15Oct. 16
1998—Nuv 17Nov. 19
In effect Mar. 12, 1999
Range (orlevel)—AllF.R. Banks
6-6.56.5
6.5-77
6.5
6-6.5(i
5.5-65.5
5-5.5s
4.5-54 5
3.5 -4<i3.5
3-3.5}
3-3.53.5
3.5^t4
4—1.754.75
4.75-5.255.25
5.00-5255.0(1
4.75-5.004.75
4.50-4.754.50
4.50
F.R. Bankof
N.Y.
6.56.5
77
6.5
665.55.5554.54.53.53.5
3 53.5444.754.75
5.255 25
5.005 (10
4.754.75
4.504.50
4.50
I Available on a .short-term basis to help depository institutions meet temporary needs forfunds that cannot be met through reasonable alternative sources. The highest rate establishedfor loans to depository institutions may be charged on adjustment credit loans of unusual size(hat result from a major operating problem at the borrower's facility.
2. Available to help relatively small depository institutions meet regular seasonal needs forfunds that arise from a clear pattern of intrayearly movements in their deposits and loan1; andthat cannot be met through special industry lenders. The discount rate on seasonal credit Likesinto account rates charged by market sources of funds and ordinarily is reestablished on thefirst business day of each two-week reserve maintenance period; however, it is never less thanthe discount rate applicable to adjustment credit.
3. May be made available K> depository institutions when similar assistance is notreasonably available from olber sruuees, inchiding special industry lenders. Such credit maybe provided when exceptional circumstances (including sustained deposit drains, impairedaccess to money market funds, or sudden deteri oral ion in loan repayment performance) orpractices involve only a particular institution, orlo meet the needs of institutions experiencingdifficulties adjusting to changing market conditions over a longer period (particularly at timesof deposit disinicrnieduuioni The discount rate applicable to adjustment credit ordinarily ischarged on extended-credit loans outstanding less than thirty days; however, at the discretion
of the Federal Reserve Bank, this time period may be shortened. Beyond this initial period, aflexible rale somewhat above rates charged on market sources of funds is charged. The rateordinarily is reestablished on the first business day of each two-week reserve maintenanceperiod, but it is never less than the discount rate applicable to adjustment credit plus 50 basispoints.
4. For earlier data, see the following publications of the Board of Governors: Banking andMonetary StunntU-y 1914-1941. and 1941-1970; and the Annual Statistwal Digest, 197(1-1979.
In 1980 and 1981, the Federal Reserve applied a surcharge to short-term adjustment-creditborrowings by institutions with deposits of $500 million or more that had borrowed insuccessive weeks or in more than four weeks in a calendar quarter. A 3 percent surcharge wasin effect from Mar. 17, 19X0. through May 7, 19X0. A surcharge of 2 percent was reimposedon Nov. 17, 1^80; the surcharge was subsequently raised to 3 percent on Dec. 5. 1980, and to4 percent on May 5, 1981. The surcharge was reduced to 3 percent effective Sept. 22, 1981,and to 2 percent effective Oct 12, 1981. As of Oct. I, 1981, the formula for applying thesurcharge was changed from a calendar quarter to a moving thirteen-week period Thesurcharge was eliminated on No\ 17, 1981
Digitized for FRASER http://fraser.stlouisfed.org/ Federal Reserve Bank of St. Louis
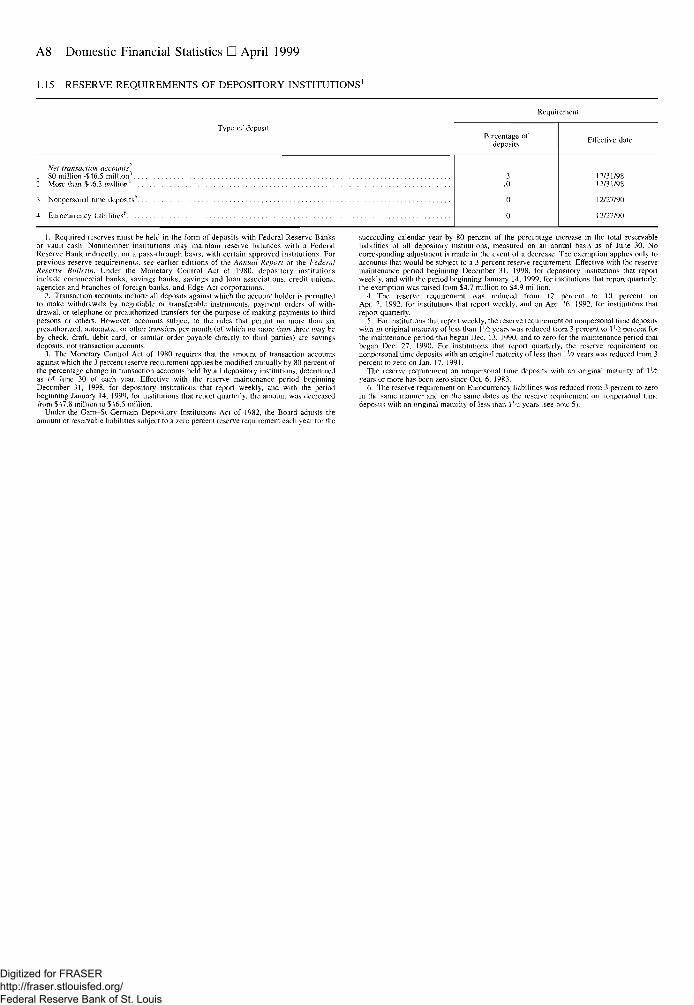
A8 Domestic Financial Statistics • April 1999
1.15 RESERVE REQUIREMENTS OF DEPOSITORY INSTITUTIONS'
Type of deposit
Net transaction accounts2
1 $0 million-$46.5 million3
2 More than $46.5 million4
3 Nonpersonal time deposits'1
4 Eurocurrency liabilities6
Requirement
Percentage ofdeposits
310
0
0
Effective date
12/31/9812/31/98
12/27/90
12/27/90
1. Required reserves must be held in the form of deposits with Federal Reserve Banksor vault cash Nonmember institutions may maintain reserve balances with a FederalReserve Bank indirectly, on a pass-through basis, with certain approved institutions. Forprevious reserve requirements, see earlier editions of the Annual Report or the FederalReserve Bulletin. Under the Monetary Control Act of 1980, depository institutionsinclude commercial banks, savings banks, savings and loan associations, credit unions,agencies and branches of foreign banks, and Edge Act corporations.
2. Transaction accounls include all deposits against which the account holder is permittedto make withdrawals by negotiable or transferable instruments, payment orders of with-drawal, or telephone or preauthorized transfers ior the purpose of making payments to thirdpersons or others. However, accounts subject to the rules that permit no more than sixpreauthorized, automatic, or other transfers per month (of which no more than three may beby check, draft, debit card, or similar order payable directly to third parties) are savingsdeposits, not transaction accounts.
X The Monetary Control Act of 1980 requires that the amount of transaction accountsagainst which the 3 percent reserve requirement applies be modified annually by 80 percent ofthe percentage change in transaction accounls held by all depository institutions, determinedas of June 30 of each year. Effective with the reserve maintenance period beginningDecember 31, 1998, for depository institutions that report weekly, and with the periodbeginning January 14, 199°, for institutions thai report quarterly, the amount was decreasedfrom $47.8 million to $46.5 million.
Under the Garn-St Germain Depository Institutions Act of 1982, the Board adjusts theamount of reservable liabilities subject to a zero percent reserve requirement each year for the
succeeding calendar year by 80 percent of the percentage increase in the total reservableliabilities of all depository institutions, measured on an annual basis as of June 30. Nocorresponding adjustment is made in the event of a decrease. The exemption applies only toaccounls that would be subject to a 3 percent reserve requirement. Effective with the reservemainienance period beginning December 31, 1998, for depository institutions that reportweekly, and with the period beginning January 14, 1999, for institutions that report quarterly,the exemption was raised from $4.7 million to $4.9 million.
4 The reserve requirement was reduced from 12 percent to 10 percent onApr. 2. 1992. for institutions that report weekly, and on Apr 16. 1992. for institutions thatreport quarterly.
?. For institutions that report weekly, the reserve requirement on nonpersonal time depositswith an original maturity of less than 1 '/2 years was reduced from 3 percent to 1 '/i percent forthe maintenance period that began Dec. 13, 1990. and to zero for the maintenance period thatbegan Dec. 27, 1990. For institutions that report quarterly, the reserve requirement onnonpersonal lime deposits with an original maturity of less than 1 Vi years was reduced from 3percent to zero on Jan. 17, 1991.
The reserve requirement on nonpersonal time deposits with an original maturity of 1 [/iyears or more has been zero since Oct. 6, 1983.
6. The reserve requirement on Eurocurrency liabilities was reduced from 3 percent to zeroin the same manner and on the same dates as the reserve requirement on nonpersonal timedeposits with an original maturity of less ihan 11/2 years tsee note 5).
Digitized for FRASER http://fraser.stlouisfed.org/ Federal Reserve Bank of St. Louis
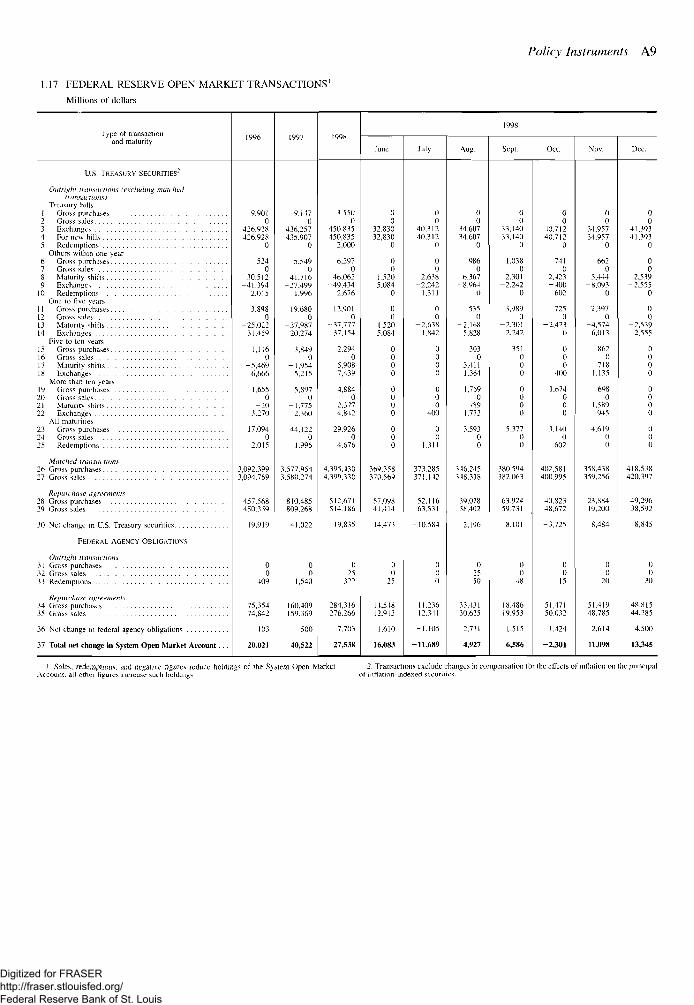
Policy Instruments A9
1.17 FEDERAL RESERVE OPEN MARKET TRANSACTIONS'
Millions of dollars
Type of transactionand maturity
US. TREASURY SECURITIES2
Outright transactions (excluding matchedtransactions)
Treasury bills1 Gross purchases2 Gross sales3 Exchanges4 For new bills5 Redemptions
Others within one year6 Gross purchases7 Gross sales8 Maturity shifts9 Exchanges
10 RedemptionsOne lo five years
1 Gross purchasesL2 Gross sales13 Maturity shifts14 Exchanges
Five to ten years15 Gross purchases16 Gross sales17 Maturity shifts18 Exchanges
More than ten years19 Gross purchases20 Gross sales21 Maturity shifts22 Exchanges
All maturities23 Gross purchases24 Gross sales2? Redemptions
Marched transactions26 Gross purchases27 Gross sales
Repurchase agreements28 Gross purchases29 Gross sales
30 Net change in U.S. Treasury securities
FEDERAL AGENCY OBLIGATIONS
Outright transactions31 Gross purchases32 Gross sales33 Redemptions
Repurchase agreements34 Gross purchases35 Gross sales
36 Net change in federal agency obligations
37 Total net change in System Open Market Account. . .
1996
9.9010
426,928426.928
0
5240
30.512-41,394
2.015
3.8980
-25.02231.459
1,1160
-5,4696,666
1.6550
-103.270
17.0940
2.015
3 092 3993,094,769
457.568450.359
19,919
00
409
75,35474.842
103
20.021
1997
9.1470
436,257435.907
0
5.5490
41,716-27,499
1.996
19,6800
-37,98720,274
3,8490
-1,9545.215
5.8970
-1.7752.360
44,1220
1.996
3 577 9543.580.274
810,485809,268
41,022
00
1.540
160,409159.369
-500
40,522
1998
3,5500
450,835450,835
2,000
6,2970
46,062-49,434
2,676
12,9010
-37,77737,154
2,2940
-5,9087,439
4,8840
-2,3774,842
29,9260
4.676
4,395,4304,399,330
512,671514.186
19.835
02S
322
284,316276,266
7.703
27,538
June
00
32.83032,830
0
00
1.520-5.084
0
00
- 1,5205.084
0000
0000
000
369 " 8370.569
57.09841,414
14,473
00
25
14,54812.913
1.610
16.083
July
00
40,31240.312
0
00
2,638-2,242
1,311
00
-2,6381,842
0000
000
400
00
1,311
W285371.142
52.11663.531
-10.584
0I)0
11,23612.341
-1.105
-11,689
Aug.
00
34,60734,607
0
9860
b.367-8.964
0
5350
-2,1685,828
3030
-3.4111.364
1.7690
-7891,772
3.59300
446 245348.318
39.07838.402
2,196
0
50
33,43130,625
2.731
4.927
1998
Sept.
00
33,14033,140
0
1,0380
2,301-2.242
0
3,9890
-2,3012,242
351000
0000
5,37700
380 594382.063
63,92459,731
8.101
00
48
18,48619.953
-1,515
6.586
Oct.
00
40.71240.712
0
7410
2.423-400
602
7250
-2,4230
000
400
1,674000
3.1400
602
402.581400.995
40,82348,672
-3,725
00
15
51,47150,0.32
1.424
-2,301
Nov.
00
34,95734,957
0
6620
5,444-8,093
0
2,3970
-4,5746,013
8620
7181,135
6980
-1.589945
4.61900
358,438359,256
23,88419,200
8,484
00
20
51,41948,785
2,614
11,098
Dec.
00
41,39341,393
0
00
2,539- 2.555
0
00
- 2,5392.555
0000
00(10
000
418,538420,397
49,29638.592
8,845
00
30
48,81544.285
4,500
13,345
1. Sales, redemplions. and negaine figures reduce holdings of ihe S\siem Open MarketAccount, all other figures increase such holdings
2. Transactions exclude changes in compensation for the effects of" inflation on the principalof inflation-indexed securities.
Digitized for FRASER http://fraser.stlouisfed.org/ Federal Reserve Bank of St. Louis
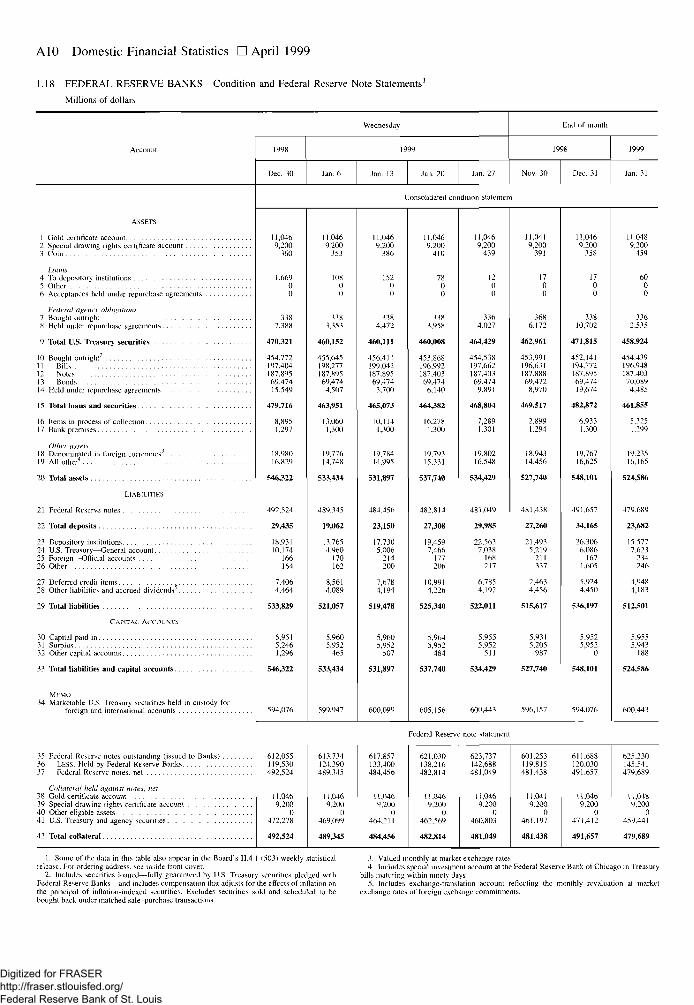
A10 Domestic Financial Statistics • April 1999
1.18 FEDERAL RESERVE BANKS Condition and Federal Reserve Note Statements1
Millions of dollars
Account
ASSETS
1 Gold certificate account2 Special drawing rights certiticate account3 Coin
4 To depository institutions5 Other6 Acceptances held under repurchase agreements
Federal agency obligations7 Bought outright8 Held under repurchase agreements
11 Bills12 Notes . . . .13 Bonds14 Held under repurchase agreements
15 Total loans and securities
16 Items in process of collection17 Bank premises
Mm assets 118 Denominated in foreign currencies"19 All other'1
20 Total assets
LIABILITIES
21 Federal Reserve notes
22 Total deposits
23 Depository institutions
25 Foreign—Official accounts26 Other
27 Deferred credit items28 Other liabilities and accrued dividends5
29 Total liabilities
CAPITAL ACCOUNTS-
31 Surplus32 Other capital accounts
33 Total liabilities and capital accounts
MEMO34 Marketable U.S. Treasury securities held in custody for
foreign and international accounts
35 Federal Reserve notes outstanding (issued to Banks)36 LESS. Held by Federal Reserve Banks37 Federal Reserve notes, net
Collateral held against notes, net38 Gold certificate account39 Special drawing rights certificate account40 Other eligible assets41 U.S. Treasury and agency securities
42 Total collateral
Wednesday
1998
Dec. 30
1999
Jan. 6 Jan. 13 Jan. 20 Jan. 27
End of month
1998
Nov. 30 Dec. 31
1999
Jan. 31
Consolidated condition statement
11,0469,200
360
1.66900
3387,388
470,321
454,772197,404187.89569,47415,549
479,716
8,8951,297
18,98016 829
546,322
492,524
29,435
18,93110.174
166164
7,4064.464
533,829
5,9515,2461,296
546,322
594,076
11,0469,200
35.3
10800
3383,353
460,152
455,645198,277187,89569,4744,507
463,951
13,0601,300
19,77614 748
533,434
489.345
19,062
13,7654,960
170162
8,5614,089
521,057
5,9605,952
465
533,434
599,947
11,0469,200
386
15200
3384.472
460 111
456,411199,042187,89569.474
3,700
465,073
10.1141,300
19.78414 995
531,897
484.456
23,150
17,7305,006
214200
7,6784,194
519,478
5,9605,952
507
531,897
600,099
11,0469.200
410
7800
3383,958
460,008
453,868196,992187,40369.474
6,140
464.382
16,2781,300
19,79315 331
537,740
482,814
27,308
19,4597,466
177206
10,9914,226
525,340
5,9645,952
484
537,740
605,156
11,0469,200
439
1200
3364.027
464,429
454,538197,662187,40369,4749,891
468,804
7,2891.301
19,80216 548
534,429
481,049
29,985
22,5637,038
168217
6,7854,192
522,011
5,9555,952
511
534,429
600,443
11,0419,200
391
1700
3686,172
462,961
453,991196,631187.88869.472
8,970
469,517
2,8991.294
18,94314,456
527,740
4K 1,438
27.260
21,4935,219
337
2,4634,456
515,617
5,9315.205
987
527,740
596,157
11,0469,200
358
1700
33810,702
471,815
452,141194,772187,89569,47419,674
482,872
6,9331,300
19,76716,625
548,101
491,657
34,165
26.3066,086
1671,605
5,9244,450
536,197
5,9525,952
0
548,101
594,076
11,0489,200
459
6000
3362,535
458.924
454,439196,948187.40370.0894.485
461.855
5 3251,299
19.23516 165
524,586
479.689
23,682
15 5777,623
234246
4.9484,183
512,501
5.9555.943
188
524,586
600,443
Federal Reserve note statement
612,055119,530492,524
11,0469,200
0472,278
492,524
613,734124,390489,345
11,0469,200
0469,099
489,345
617,857133,400484,456
11,0469,200
0464.211
484,456
621,030138,216482,814
11,0469.200
0462,569
482,814
623,737142,688481,049
11,0469.200
0460,803
481,049
601,253119.815481,438
11.0419.200
0461.197
481,438
611.688120,030491,657
11,0469,200
0471,412
491,657
625.230145,541479,689
11,0489.200
0459.441
479,689
1. Some of the data in ihis table also appear in the Board's H.4 ! (503) weekly statisticalrelease. For ordering address, see inside from cover.
2. Includes securities loaned—fully guaranteed by U.S. Treasury securities pledged withFederal Reserve Banks—and includes compensation that adjusts for the effects of inflation onthe principal of inflation-indexed securities. Excludes securities sold and scheduled to bebought back under matched sale-purchase transactions.
3. Valued monthly at market exchange rates4. Includes special investment account at the Federal Reserve Bank of Chicago in Treasury
bills maturing within ninety days.5. Includes exchange-translation account reflecting the monthly revaluation at market
exchange rales of foreign exchange commitments.
Digitized for FRASER http://fraser.stlouisfed.org/ Federal Reserve Bank of St. Louis
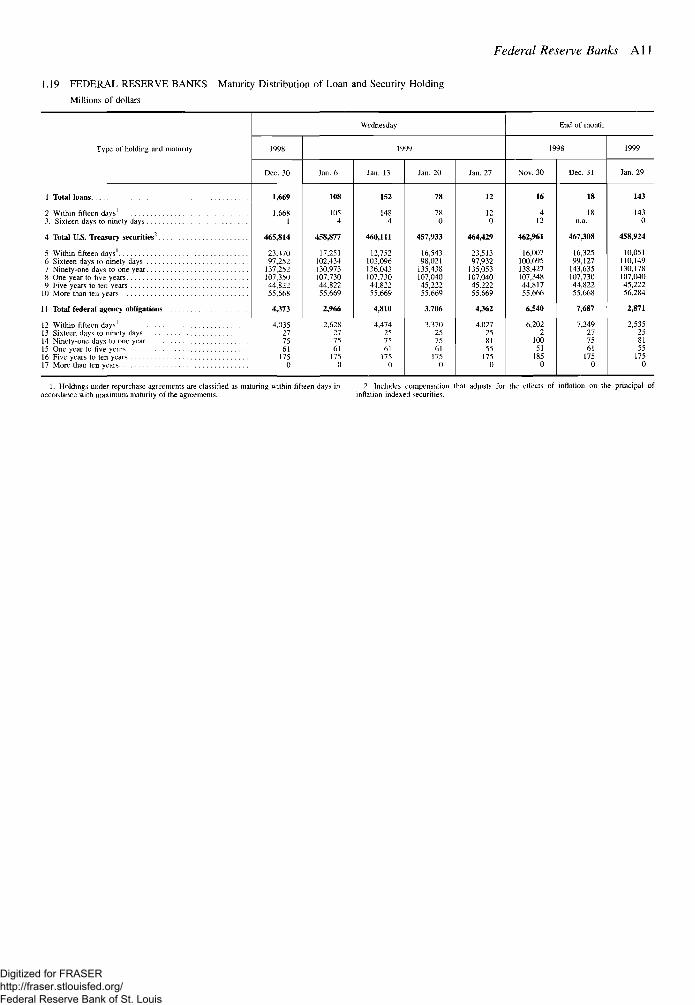
1.19 FEDERAL RESERVE BANKS Maturity Distribution of Loan and Security Holding
Millions of dollars
Federal Resei-ve Banks A11
Type of holding and maturity
Wednesday
Dec. 30 Nov. 30
2 Within fifteen days'
3. Sixteen days to ninety days
4 Total U.S. Treasury securities2
5 Within fifteen days'6 Sixteen days to ninety days7 Ninety-one days to one year8 One year to live years9 Five years to ten years
10 More than ten years11 Total federal agency obligations
12 Within fifteen days'13 Sixteen days to ninety days14 Ninety-one days to one year. . . .15 One year to five years16 Five years to ten years17 More than ten vears
1,669
1,6681
465,814
23,47097,252
137,252107,35044,82255,668
4,373
4,035277561
1750
108
1054
458,877
17,251102,434130,973107,73044,82255,669
2,966
2,628277561
1750
1484
460,111
12,752103,096136.043107.73044.82255.669
4,810
4,474257561
1750
78
780
457,933
16,54398,021
i35,438107,04045,22255.669
3,706
3,370257561
1750
120
464,429
23,51397,932
135,053107,04045.22255.669
4,362
4,027258155
1750
16
412
462,961
16,007100,695138,427107,34844,81755,666
6440
6 2022
10051
1850
467,308
16,32599,127
143,635107,73044,82255,668
7,687
7,349277561
1750
1430
458,924
10,051110,149130,178107,04045,22256,284
2,871
2,535258155
1750
1. Holdings under repurchase agreements are classified as maturing within fifteen days inaccordance with maximum maturity of the agreements.
2 Includes compensation thai adjusts for the effects of inflation on the principal ofinflation-indexed securities.
Digitized for FRASER http://fraser.stlouisfed.org/ Federal Reserve Bank of St. Louis
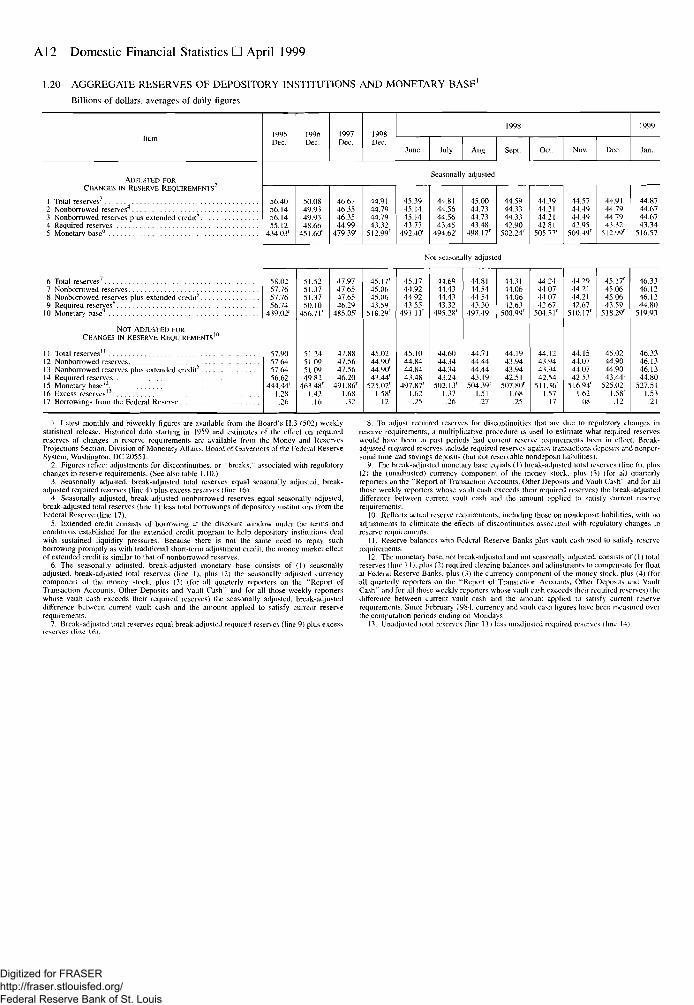
A12 Domestic Financial Statistics • April 1999
1.20 AGGREGATE RESERVES OF DEPOSITORY INSTITUTIONS AND MONETARY BASE1
Billions of dollars, averages of daily figures
ADJUSTED FORCHANGES IN RESERVE REQUIREMENTS-
I Total reserves3
2 Nonborrowed reserves4
3 Nonborrowed reserves plus extended credit^4 Required reserves . . . .5 Monetary base6
6 Total reserves7
7 Nonborrowed reserves8 Nonborrowed reserves plus extended eredit"9 Required reserves*
NOT ADJUSTRD FORCHANGES IN RESERVE REQUIREMENTS'"
12 Nonborrowed reserves13 Nonborrowed reserves plus extended credit1"
15 Monetary base12
17 Borrowings from the Federal Reserve
1995Dee.
19%Dec.
1997Dec.
1998Dei-.
June July Aug.
1998
Sept. Oct. Nov. Dec.
1999
Jan.
Seasonally adjusted
56.4056.1456.1455.12
434.03'
58.0257.7657.7656.74
439.02'
57 9057.6457.6456 61
444.44'1 28.26
50.0849.9349.9348.66
45l.60r
51.5251.3751.3750.10
456.71'
51 2451.0951.0949 8 '
463.48'1 A"1
.16
46 6746.3546.3544.99
479.39'
47.9747.6547.6546.29
485.05'
47 8847.5647.5646 20
491.86'1 68.32
44.9144.7944 7943.32
512.99'
45.17'45.0645.1)643 si
518.29'
45 0244.90'44.90'43 44'
525.02'1 58'.12
45.3945.1445.1443.77
492.40'
44.8144.5644.5643.45
494.62'
Nol sci.sona
45.1744.9244.9243.55
491.11'
45 1044.8444.844148
497.87'1 62.25
44.6944.4344.4343.32
495.28'
44 6044 3444.3443 24
502.13'1 17.26
45.0044.7344.7343.48
498.17'
44.5944.3344.3342.90
502.24'
lly adjusted
44.8144.5444.544.3.30
497.49'
447144.4444.4443.19
504.39'1 51.27
44.3144.0644.0642.63
500.99'
44 1943.9443.9442 51
507.80r
1 68.25
44.3944.2144.2142.81
505.77'
44 2444.0744.0742.67
504.51'
44 1">419443.9442 54
511.36'1 57
17
44.5744.4944.4942.95
509.49'
44 2944.2144.2142.67
510.17'
44 1544.0744.0742.53
516.94'1.62
(18
44.9144 7944.7943.32
512.99'
45.17'45.0645.0643.59
518.29'
45.0244.90'44.90'43.44'
525.02'1.58'.12
44.8744.6744.6743.34
516.57
46.3346.1246.1244.80
519.93
46 3346.1346.1344.80
527.511.53.21
1. Latest monthly and biweekly figures are available from the Board's H.3 (502) weeklystatistical release. Historical data starting in 1959 and estimates of Ihe effect on requiredreserves of changes in reserve requirements arc available from the Money and ReservesProjections Section, Division of Monetary Affairs. Board of Guvextiors of the Federal ReserveSystem, Washington. DC 20551.
2. Figures reflect adjustments for discontinuities, or "breaks," associated with regulatorychanges in reserve requirements. (See also table J.JO.)
3. Seasonally adjusted, break-adjusted tola! reserves equal seasonally adjusted, break-adjusled required reserves (line 4) plus excess reserves (line 16).
4. Seasonally adjusted, break-adjusted nonborrowed reserves equal seasonally adjusted,break-adjusted total reserves (line 1) less total borrowings of depository institutions from theFederal Reserve (line 17).
5. Extended credit consists of borrowing at the discount window under the terms andconditions established for the extended credit program to help depository inslitutions dealwith sustained liquidity pressures. Because there is not the same need lo repay suchborrowing promptly as with traditional short-term adjustment credit, the money market effectof extended credit is similar to that of nonborrowed reserves.
6. The seasonally adjusted, break-adjusted monetary base consists of (1) seasonallyadjusted, break-adjusted total reserves (line 1), plus (2) the seasonally adjusted currencycomponent of the money stock, plus (3) (for all quarterly reporters on the "Report ofTransaction Accounts, Other Deposits and Vault Cash" and for all those weekly reporterswhose vault cash exceeds their required reserves) the seasonally adjusted, break-adjusteddifference between current vault cash and the amount applied to satisfy current reserverequirements.
7. Break-adjusted total reserves equal break-adjusted required reserves (line 9) plus excessreserves (line 16).
8. To adjust required reserves for discontinuities that are due to regulatory changes inreserve requirements, a multiplicative procedure is used to estimate what required reserveswould have been in past periods had current reserve requi b i fl B k
j q gy greserve requirements, a multiplicative procedure is used to estimate what required reserveswould have been in past periods had current reserve requirements been in cfleet. Break-adjusted required reserves include required reserves against transactions deposits and nonper-sonal lime and savings deposits (bul nol rescrvable nondeposit liabilities).
O Thp hrpfil'-fiHmcT^H iv\fsi\£»t i r \ i K'*t-*> •^jm^lc I M hr^^jL -'iHiiict^ri t(M?al r^cr»n;pc flirts Al nine
LLjUIJ L. JIIL 111 -̂
10, Reflects actual reserve requirements, including those on nondeposit liabilities, with noadjustments to eliminate ihe effects of discontinuities associated with regulatory changes inreserve requirements.
11. Reserve balances with Federal Reserve Banks plus vault cash used to satisfy reservxiuirements.
LUILLj.llllJlH.lll [JCIHJU^ l_[IUUIg Ull IVIUllUiiyS.
!3. Unadjusted toial reserves (line 1 1) lest, unadjusted required (line 14).
Digitized for FRASER http://fraser.stlouisfed.org/ Federal Reserve Bank of St. Louis
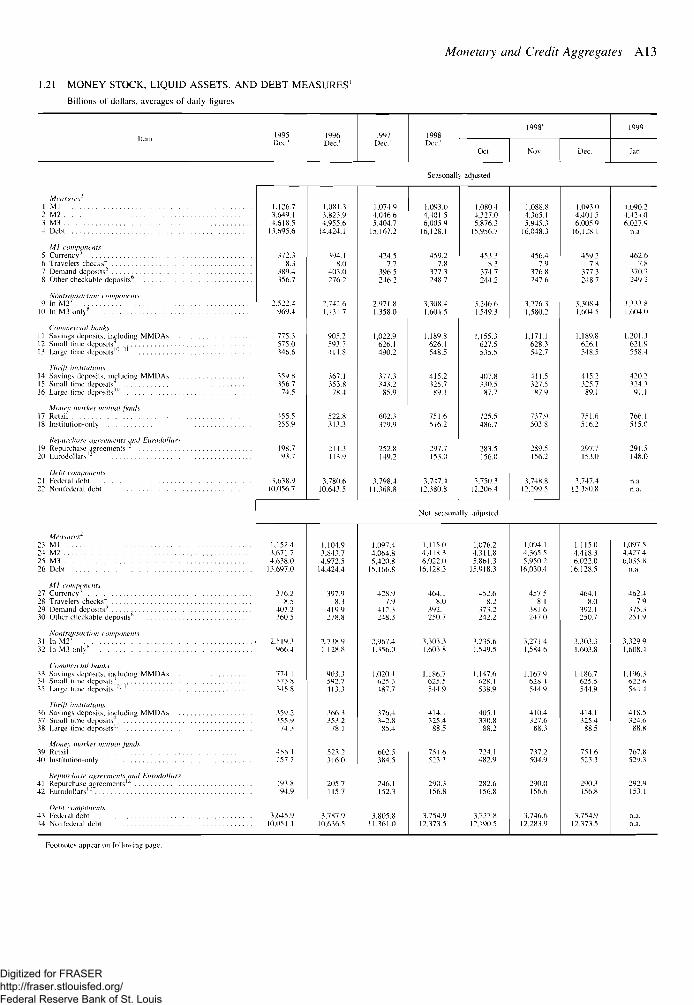
Monetary and Credit Aggregates A13
1.21 MONEY STOCK, LIQUID ASSETS, AND DEBT MEASURES1
Billions of dollars, averages of daily figures
Memutet1
1 Ml2 M 2 . . .3 M34 Debt
Ml components5 Currency1
6 Travelers checks"1
7 Demand deposits5
8 Other checkable deposits6
Nontrunsucllon components9 In M27
10 In M.I only"
Commercial banks11 Savings deposits, including MMDAs12 Small time deposits9
13 Large time deposits10' "
Thrift institutions14 Savings deposits, including MMDAs15 Small time deposits'16 Large time deposits'"
17 Relail18 Institution-only
Repurchase agreements and Eurodollars19 Repurchase agreements'2
^0 Eurodollars'2
Debt components21 Federal debt22 Nonfederal debt
Measures23 M124 M225 M326 Debt
Ml components27 Currency1
28 Travelers checks4
29 Demand deposits5
30 Other checkable deposits6
Nontninsaction components31 In M27
32 In M3 only"
Commercial hanks33 Savings deposits, including MMDAs .34 Small lime deposits''35 Large time deposits"1 "
Thrift institutions36 Savings deposits, including MMDAs37 Small lime deposits38 Large time deposits'"
Mone\ market mutual funds39 Retail . . .40 Institution-only
Repurchase agreements and Eurodollars41 Repurchase agreements'"42 Eurodollars'2
Debt components4.3 Federal debt44 Nonfederal debl
1995Dec.'
1996Dec.'
1997Dec.1
1998Dec.'
1998'
Oct. Nov. Dec.
1999
Jan.
Seasonally adjusted
1.126.73.649.14.618.5
11 695 6
372.38.3
389.4356.7
2.5224969.4
775.3575.0346.6
356.774.5
455.5255.9
198.79^7
3.638.910.056.7
1,081.33.823.94,955.6
14 424 1
394.18.0
403.0276.2
2.742.61,131.7
905.2593.7414.8
367.1353.878.4
522.8313.3
211.3113 9
3,780.610,643.5
1.074.94,046.65,404.7
15 167 2
424.57.7
396.5246.2
2,971.81,358.0
1,022.9626.1490.2
377.3"<4V2
859
602.3379.9
252.8149 ">
3.798.411,368.8
1,093.04,401 56,005 9
16 128 1
459.27.8
377.3248.7
3.308.41,604.5
1,189.8626.1548.5
415.2325.789.1
751.6516.2
297.7153 0
3.747.J12.380.8
1.080.44,327.05,876.3
15 956 7
453.38.3
374.7244.2
i.246.61,549.3
1,155.3627.5535.5
407.8330.587.7
725.5486.7
283.5156 0
3.750 312,206.4
1,088.84.365.15,945.3
16 048 3
456.47.9
376.8247.6
3,276.31,580.2
1,171.1628.3542.7
411.5327.587.9
737.9503.8
289.5156"1
3.748.812.299 5
1.093.04,401 56.005.9
16 P 8 1
459.27.8
377.3248.7
1.W8.41.604.5
1,189.8626.1548.5
415.2325.789.1
751.6516.2
297.7153 0
3 747.412,3808
1.090.24.424.06,027.9
462.67.8
370.7249 2
3.333.81.604.0
1,201.3621.9558.4
420.2324.391.1
766.1515.0
291.5148 0
n.an.a.
Not seasonally adjusted
1,152.43,671.74,638.0
13,697.0
376.285
407.2360.5
2,519.3966.4
774.1.573.8345.8
359.2355.9
74 3
45b. 1257 7
193 894 9
3,645.910,051 1
1,104.93,843.74,972.5
14.424.4
397.98.3
419 9278.8
2.738.91.I28.S
903.3592.7413.3
366.3353.278.1
523.2316.0
205.7115 7
3,787.910.636.5
1.097.44.064.85,420.8
15.166.8
428.97.9
412.3248.3
2.967.41.356.0
1,020.4
487.7
376.4342.885.4
602.5384.5
246.1152 3
3.805.811.361.0
1.115.04,418.36,022.0
16,128.5
464.18.0
392.1250.7
3,303.31.603.8
1,186.7625.5544.9
414.1325 488.5
751.6523.3
290.3156 8
3,754.912,373.5
1,076.24.311.85.861.3
15.918.3
452.68.2
373.2242.2
3.235.61.549.5
1,147.6628.1538.9
405.13.30.888.2
724.1482.9
282.6156 8
3,727.812.190.5
1,094.14,365.55,950.2
16.030.4
457 58.1
381.6247.0
3,271.41,584.6
1.167.9628.4544.9
410.4327.688.3
737.2504.9
290.0156 6
3.746.612.283.9
1.115.04,418.36.022.0
16.128.5
464.18.0
392.1250.7
3,303.31.60.3.8
1.186.7625.5544.9
414.1325.4
88.5
75 1.6523.3
290.3156 8
3.754.912.373.5
1,097.54.427 46.1)358
n.a
462.479
375.3251.9
3,329 91,608.4
1.196.3622.6544 4
418.5.324.6
88.8
767.8529.3
292.9153 1
n.a.n.a.
Foe-moles appear on following page.
Digitized for FRASER http://fraser.stlouisfed.org/ Federal Reserve Bank of St. Louis
A14 Domestic Financial Statistics • April 1999
NOTES TO TABLE 1.21
1. Latest monthly and weekly figures are available from the Board's H.6 (508) weeklystatistical release. Historical data starting in 1959 are available from the Money and ReservesProjections Section, Division of Monetary Affairs. Board of Governors of the Federal ReserveSystem, Washington, DC 20551.
2. Composition of the money stock measures and debt is as follows:Ml: (1) currency outside the U.S. Treasury, Federal Reserve Banks, and the vaults of
depository institutions, (2) travelers checks of notibank issuers, (3) demand deposits at allcommercial banks other than Iliose owed to depository institutions, the U.S. government, andforeign banks and official institutions, less cash items in the process of collection and FederalReserve float, and (4) other checkable deposits (OCDs), consisting of negotiable order ofwithdrawal (NOW) and automatic transfer service (ATS) accounts at depository institutions,credit union share draft accounts, and demand deposits at thrift institutions. Seasonallyadjusted Ml is computed by summing currency, travelers checks, demand deposits, andOCDs, each seasonally adjusted separately.
M2: Ml plus (1) savings deposits (including MMDAs), (2) small-denomination timedeposits (time deposits—including retail RPs—in amounts of less than $100,0001. and (})balances in reiail money market mutual funds. Excludes individual retirement accounts(IRAs) and Keogh balances at depository institutions and money market funds. Seasonallyadjusted M2 is calculated by summing savings deposits, small-denomination time deposits,and retail money fund balances, each seasonally adjusted separately, and adding this result toseasonally adjusted Ml.
M3: M2 plus (1) large-denomination time deposits (in amounts of $100,000 or more)issued by all depository institutions, (2) balances in institutional money funds. (3) RPliabilities (overnight and term) issued by all depository institutions, and (4) Eurodollars(overnight and term) held by U.S. residents at foreign branches of U.S. banks worldwide andat all banking offices in the United Kingdom and Canada. Excludes amounts held bydepository institutions, the U.S. government, money market funds, and foreign banks andofficial institutions. Seasonally adjusted M3 is calculated by summing large time deposits,institutional money fund balances, RP liabilities, and Eurodollars, each seasonally adjustedseparately, and adding this result to seasonally adjusted M2.
Debt: The debt aggregate is the outstanding credit market debt of the domestic nonfinancialsectors—the federal sector (U.S. government, not including government-sponsored enter-
prises or federally related mortgage pools) and the nonfederal sectors (state and localgovemmems, households and nonprofit organizations, nonfinanual corporate and nonfarmnoncorporate businesses, and farms). Nonfederal debt consists of mortgages, tax-exempt andcorporate bonds, consumer credit, bank loans, commercial paper, and other loans. The data,which are derived from the Federal Reserve Board's flow of funds accounts, are break-adjusted (that is, discontinuities in the data have been smoothed into the series) andmonth-averaged (that is, the data have been derived by averaging adjacent month-end levels).
3. Currency outside the U.S. Treasury, Federal Reserve Banks, and vaults of depositoryinstitutions.
4 Outstanding amount of U.S. dollar-denominated travelers checks of notibank issuers.Travelers checks issued by depository institutions are included in demand deposits.
5. [)emand deposits at commercial banks and foreign-related institutions other than thoseowed to depository institutions, the U.S. government, and foreign banks and official institu-tions, less cash items in the process of collection and Federal Reserve float.
6. Consists of NOW and ATS account balances at all depository institutions, credit unionshare draft account balances, and demand deposits at thrift institutions.
7. Sum of (1) savings deposits (including MMDAs). (2) small lime deposits, and (3) retailmoney fund balances.
8. Sum of (1) large time deposits, (2) institutional money fund balances, (3) RP liabilities(overnight and term) issued by depository institutions, and (4) Eurodollars (overnight andIcnn) of U.S. addressees.
9. Small time deposits—including retail RPs—are those issued in amounts of less than$100,000. All IRAs and Keogh accounts at commercial banks and thrift institutions aresublrauted from small time deposits.
10. Large time deposits are those issued in amounts of $100,000 or more, excluding thosebooked at international banking facilities.
11. Large time deposits at commercial banks less those held by money market funds,depository institutions, the U.S. government, and foreign banks and official institutions.
12. Includes both overnight and term.
Digitized for FRASER http://fraser.stlouisfed.org/ Federal Reserve Bank of St. Louis
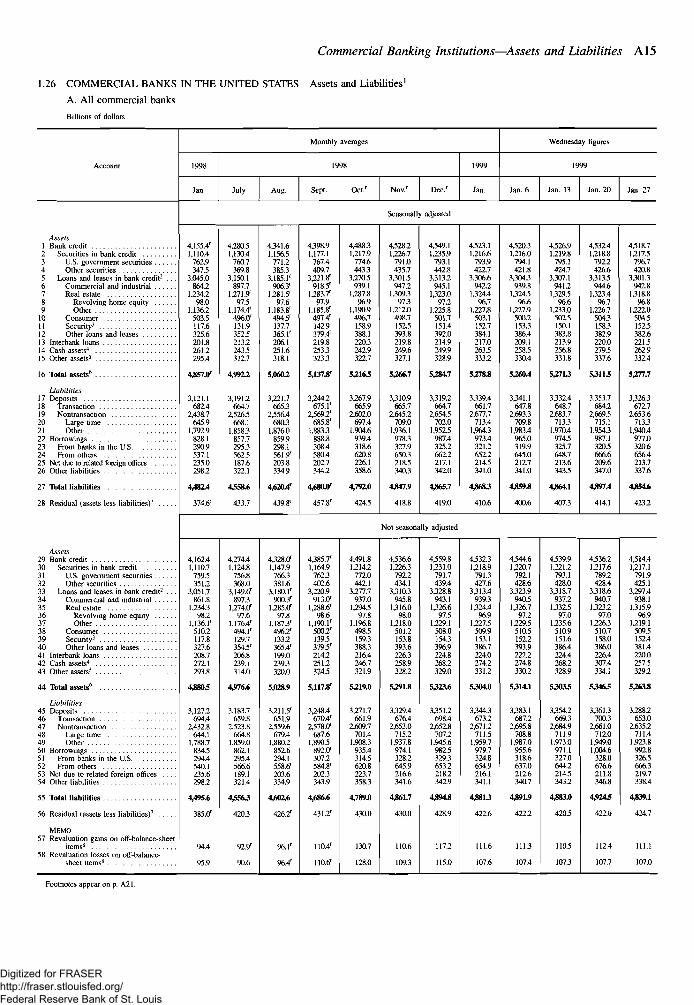
Commercial Banking Institutions—Assets and Liabilities A15
1.26 COMMERCIAL BANKS IN THE UNITED STATES Assets and Liabilities1
A. All commercial banks
Billions of dollars
Monthly averages
1998
July Aug. Sept. Nov.r Dec/ Jan.
Wednesday figures
Jan. 13 Jan. 20
Seasonally adjusted
Assets1 Bank credit2 Securities in bank credit3 U.S. government securities4 Other securities5 Loans and leases in bank credit2 . . .6 Commercial and industrial7 Real estate8 Revolving home equity9 Other
10 Consumer11 Security1
12 Other loans and leases13 Interbank loans14 Cash assets4
15 Other assets5
16 Total assets6
Liabilities17 Deposits18 Transaction19 Nontransaction20 Large time21 Other22 Borrowings23 From banks in the US24 From others25 Net due lo related foreign offices26 Other liabilities
27 Total liabilities
28 Residual (assets less liabilities)7
Assets29 Bank credit30 Securities in bank credit31 U.S. government securities32 Other securities33 Loans and leases in bank credit2 . . .34 Commercial and industrial35 Real estate36 Revolving home equity37 Other38 Consumer39 Security5
40 Other loans and leases41 Interbank loans42 Cash assets4
43 Other assets5
44 Total assets6
Liabilities45 Deposits46 Transaction47 Nontransaction48 Large time49 Other50 Borrowings51 From banks in the US52 From others53 Net due to related foreign offices54 Other liabilities
55 Total liabilities
56 Residual (assets less liabilities)7
MEMO57 Revaluation gains on off-balance-sheet
items8
58 Revaluation losses on off-balance-sheet items8
4,155.4'1,110.4
762.9347.5
3,045.0864.2
1,234.298.0
1,136.2503.5117.6325.6201.8261.2295.4
4357.0'
3,121.1682.4
2,438.7645.9
1,792.9828.1290.9537.1235.0298.2
4,482.4
374.6r
4.280.51,130.4
760.7369.8
3,150.1897.7
I,271.9r
97.51,174.4'
496.01
131.9352.5213.2243.5312.7
3,191.2664.7
2,526.5668.1
1,858.3857.7295.3562.5187.6322.1
4358.6
433.7
4,341.61,156.5
771.2385.3
3,185.1'906.3'
1281.5'97.6
1,183.8'494.5'137.7365.1'206.1251.6318.1
5,0602
3,221.7665.3
2,556.4680.3
1,876.0859.9298.1561.9203.8334.9
439.8'
4,398.91,177.1
767.4409.7
3221.8'918.5'
1,283. /97.9
1,185.8'497.4'142.9379.4'219.8253.3323.3
5,1373'
3,244.2675.1'
2,569.2'685.8'
1,883.3888.8308.4580.4202.7344.2
4^80.0'
457.8'
4,488.31,217.9
774.6443.3
3,270.5939.1
1,287.896.9
1,190.9496.7158.9388.1220.3242.9322.7
5,2163
3,267.9665.9
2,602.0697.4
1,904.6939.4318.6620.8226.1358.6
4,792.0
424.5
4,528.21,226.7
791.0435.7
3301.5947.2
1,309.397.3
1,212.0498.7152.5393.8219.8249.6327.1
5,266.7
3310.9665.7
2,645.2709.0
1,936.1978.3327.9650.3218.5340.3
4347.9
418.8
4,549.11,235.9
793.1442.8
3,313.2945.1
1323.097.2
1,225.8501.7151.4392.0214.9249.9328.9
5,284.7
3,319.2664.7
2,654.5702.0
1,952.5987.4325.2662.2217.1342.0
43*5.7
419.0
4,523.11,216.6
793.9422.7
3,306.6942.2
1,324.496.7
1227.8503.1152.7384.1217.0263.5333.2
5,278*
3,339.4661.7
2,677.7713.4
1,964.3973.4321.2652.2214.5341.0
43683
410.6
4^20.31,216.0
794.1421.8
3304.3939.8
1324.596.6
1227.9500.2153.3386.4209.1258.5330.4
5,2*0.4
3341.1647.8
2,693.3709.8
1,983.4965.0319.9645.0212.7341.0
4,859.8
400.6
4,526.91,219.8
795.1424.7
3307.1941.2
1329.596.6
1233.0502.5150.1383.8213.9256.8331.8
5,271.3
3,332.4648.7
2.683.7713.3
1,970.4974.5325.7648.7213.6343.5
4,864.1
407.3
4,532.41,218.8
792.2426.6
3,313.5944.6
1323.496.7
1226.7504.3158.3382.9220.0279.5337.6
53113
3,353.7684.2
2,669.5715.1
1,954.3987.1320.5666.6209.6347.0
43974
414.1
4318.71217.5
796.7420.8
33013942.8
1,318.896.8
1,222.0504.5152.5382.6221.5262.9332.4
5,277.7
3326.3672.7
2,653.6713.3
1,940.4977.0320.6656.4213.7337.6
4354.6
423.2
Not seasonally adjusted
4,162.41,110.7
759.5351.2
3,051.7861.8
1,234.398.2
1,136.1'510.2117.8327.6208.7272.1293.8
43803
3,127.2694.4
2,432.8644.1
1,788.7834.5294.4540.1235.6298.2
4495.6
385.O1
94.4
95.9
4,274.41,124.8
756.8368.0
3,149.6'897.3
1274.0*97.6
1,176.4'494.1'129.7354.5'206.8239.1314.0
4.V76.6
3,183.7659.8
2323.8664.8
1,859.0862.1295.4566.6189.1321.4
4356J
420.3
92.?
90.6
4,328.0'1,147.9
766.3381.6
3,180.1'900.3'
1285.O1
97.81,187.3'
496.2'133.2365.4'199.0239.3320.0
5,028.9
3.211.5'651.9
2.559.6679.4
1,880.2852.6294.1558.6'203.6334.9
4.602.6
426.21
96.1'
96.4'
4,385.7'1,164.9
762.3402.6
3,220.99ll.Cf
1,288.6'98.6
1,190.1'500.21
139.5379.5'214.2251.2324.5
5,1173r
3248.4670.4'
2378.0*687.6
1,890.5892.0'307.2584.8'202.3343.9
4,686.6
431.2'
110.4'
110.6'
4,491.812142
772.0442.1
3277.7937.0
1294.597.8
1,196.8498.5159.3388.3216.4246.7321.9
5219.0
3271.7661.9
2,609.7701.4
1,908.3935.4314.5620.8223.7358.3
4,789.0
430.0
130.7
128.0
4,536.61,226.3
792.2434.1
3,310.3945.8
1316.098.0
1218.0501.2153.8393.6226.3258.9328.2
5,291.8
3,329.4676.4
2,653.0715.2
1,937.8974.1328.2645.9216.6341.6
4361.7
430.0
110.6
109.3
4359.81231.0
791.7439.4
3,328.8943.1
1,326.697.5
1,229.1508.0154.3396.9224.8268.2329.0
5,323.6
3,351.2698.4
2,652.8707.2
1,945.6982.5329.3653.2218.2342.9
43948
428.9
117.2
115.0
4,532.31218.9
791.3427.6
3313.4939.3
1,324.496.9
1,227.5509.9153.1386.7224.0274.2331.2
53040
3,344.3673.2
2,671.2711.5
1,959.7979.7324.8654.9216.1341.1
43813
422.6
111.6
107.6
4344.61,220.7
792.1428.6
3,323.9940.5
1,326.797.2
1229.5510.5152.2393.92222274.8330.2
5314.1
3,383.1687.2
2,695.8708.8
1,987.0955.6318.6637.0212.6340.7
4391.9
422.2
111.3
107.4
4,539.91,221.2
793.1428.0
3318.7937.2
1,332.597.0
1,235.6510.9151.6386.4224.4268.2328.9
53033
3,354.2669.3
2,684.9711.9
1.973.0971.1327.0644.2214.5343.2
4383.0
420.5
110.5
107.3
433621217.6
789.2428.4
3,318.6940.7
1,323.297.0
1,226.3510.7158.0386.0226.4307.4334.1
5,3463
3,361.3700.3
2,661.0712.0
1,949.01,004.6
328.0676.6211.8346.8
4»245
422.0
112.4
107.7
4,514.41,217.1
791.9425.1
3297.4938.1
1,315.996.9
1,219.1509.5152.4381.4220.0257.5329.2
5,2633
3,288.2653.0
2,635.2711.4
1,923.8992.8326.5666.3219.7338.4
4339.1
424.7
111.1
107.0
Footnotes appear on p. A21.
Digitized for FRASER http://fraser.stlouisfed.org/ Federal Reserve Bank of St. Louis
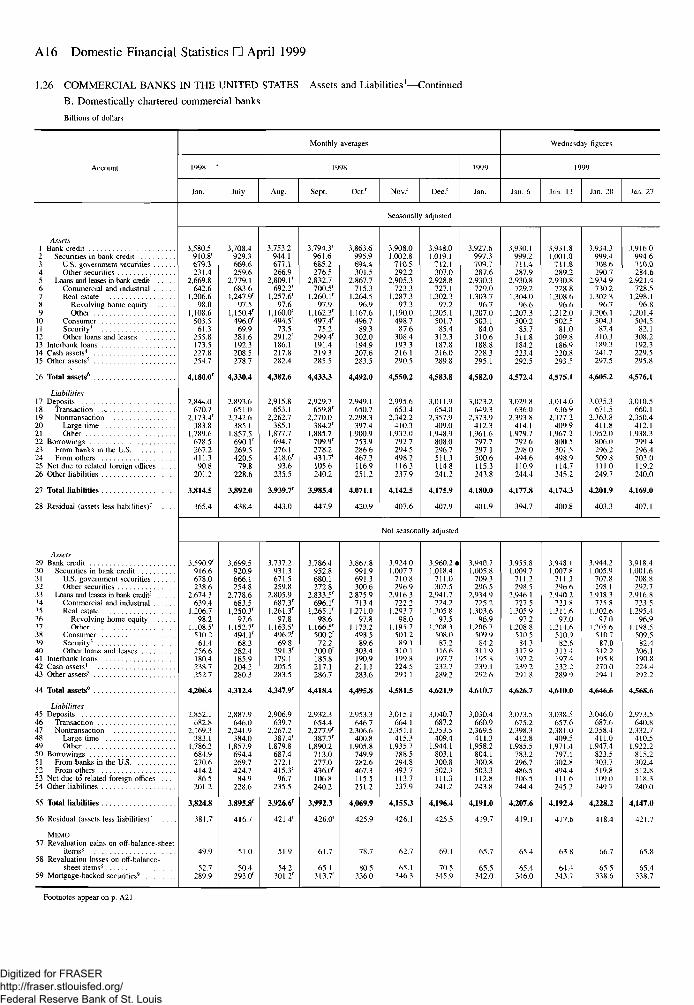
A16 Domestic Financial Statistics • April 1999
1.26 COMMERCIAL BANKS IN THE UNITED STATES Assets and Liabilities'—Continued
B. Domestically chartered commercial banks
Billions of dollars
Account
Assets1 Bank credit2 Securities in bank credit3 L'.S. government securities4 Other securities5 Loans and leases in bank credit1
6 Commercial and industrial7 Real estate8 Revolving home equity9 Other
10 Consumer11 Security1
12 Other loans and leases13 Interbank loans14 Cash assets4
15 Other assets5
16 Total assets6
Liabilities17 Deposits18 Transaction ^19 Nontransaction20 Large time21 Other22 Borrowings25 From banks in the US24 From others25 Net due to related foreign offices . . . .26 Other liabilities
27 Total liabilities
2 8 R e s i d u a l ( a s s e t s l e s s l i a b i l i t i e s ) ' . . . .
Assets29 Bank credit30 Securities in bank credit31 U.S. government securities32 Other securities33 Loans and leases in bank credit2
34 Commercial and industrial35 Real estate36 Revolving home equity37 Other38 Consumer39 Security3
40 Other loans and leases41 Interbank loans42 Cash assets4
43 Other assets^
44 Total assets6 . . .
Liabilities45 Deposits46 Transaction47 Nontransaction48 Large time49 Other50 Borrowings51 From banks in the US52 From others53 Net due to related foreign offices . . .54 Other liabilities
55 Total liabilities
56 Residual (assets less liabilities)7 . . . .
MEMO57 Revaluation gains on off-balance-sheet
items*58 Revaluation losses on off-balance-
sheet items8
59 Mortgage-backed securities9
Monthly averages
1998
Jan.
1998
July Aug. Sept. Oct.' Nov.' Dec'
1999
Jan.
Wednesday figures
1999
Jan. 6 Jan. 13 Jan. 20 Jan. 27
Seasonally adjusted
3,580.5910.8'679.3231.4
2,669.8642.6
1 206.698.0
1,108.6503.561.3
255.8173.5227.8254.7
4,180.0'
2.844.0670.7
2.173.4'383.8
1,789.6678.5267.2411.3
90.8201.2
3,814.5
365.4
3,708.4929.3669.6259.6
2,779.1683.6
1,247.9'97.5
l,150.4r
496.0'69.9
281.6192.3208.5278.7
4,330.4
2.893.6651.0
2.242.6385.1
1,857.5690 1'269.5420.5
79.8228.6
3,892.0
438.4
3,753.2944.1677.1266.9
2,809.1'692.2'
1,257.6'97.6
1,160.0'494.5'
73.5291.2'186.1217.8282.4
4,382.6
2,915.8653 1
2,262.7385.1
1,877.7694.7276.1418.6'
93.6235.5
3,939.7'
443.0
3.794.3'961.66S5.2276 5
2,832.7700.5'
1,260.1'97.9
1,162.3'497.4'
75.2299.4'191.4219.3285.5
4,433.3
2,929.7659.8'
2,270.0384.2'
1,885.7709.9'278.2431.7'105.6240.2
3,985.4
447.9
3,863.6995.9694.4301.5
2,867.7715.3
1,264.596.9
1,167.6496.7
89.3302.0194.9207.6283.5
4,492.0
2,949.1650.7
2,298.3397.4
1,900.9753.9286.6467.3116.9251.2
4,071.1
420.9
3.908.01,002.8
710.5292.2
2,905.3723.3
1,287.397.3
1,190.0498.7
87.6308.4193.3216.1290.5
4,550.2
2,995.6653 4
2.342.2410.3
1,932.0792.7294.5498.2116.3237.9
4,142.5
407.6
3,948.01,019.1
712.1307.0
2,928.8727.1
1 302 397.2
1,205.1501.7
85.4312.3187.8216.0289.8
4,583.8
3,011.9654.0
2,357.9409.0
1,948.9808.0296.7511.3114.8241.2
4,175.9
407.9
3,927.6997.3709.7287.6
2,930.3729.0
1,303.796.7
1,207.0503.1
84.0310.6188.8228.3295.1
4,582.0
3,023.2649.3
2,373.9412.3
1,961.6Till297.1500.6115.3243.8
4,180.0
401.9
3,930.1999.2711.4287.9
2,930.8729.2
1,304.096.6
1,207.3500.2
85.7311.8184.2223.4292.5
4,572.4
3,029.8636.0
2,393 S414.1
1,979.77926298.0494.6110.9244.4
4,177.8
394.7
3,931.81,001.0
711.8289.2
2.930.8728.8
1.308.696.6
1.212.0502.5
81.0309.8186.9220.8293.5
4,575.1
3.014.00.369
2,377.2409.9
1,967.2800.5301.5498.9114.7245.2
4,174.3
400.8
1.934.3999.4708.6290.7
2,934 9730.2
1,302.896.7
1,206.1504.3
87.4310.3189.3241.7297.5
4,605.2
3.035.3671.5
2,363.8411.8
1,952.0806.0296.2509.8II 1.0249.7
4,201.9
403.3
3,916.0994.6710.0284.6
2,921.4728.5
1,298 196.8
1,201.4504.5
82.1308.2192.3229.5295.8
4,576.1
3,010.5660.1
2,350.4412.1
1,938.3799.4296.4503.0119.2240.0
4,169.0
407.1
Not seasonally adjusted
3,590.9'916.6678.0238.6
2,674.3639.4
1.206.798.2
1,108.5'510.2
61.4256.6180.4238.7252.7
4,206.4
2,852.1682.8
2,169.3383.1
1,786.2684.9270.6414.2
86.5201.2
3,824.8
381.7'
49.9
52.7289.9
3,699.5920.9666.1254.8
2,778.6683.5
1,250.3'97.6
1,152.7'494.1'
68.3282.4185.9204.2280.3
4,312.4
2,887.9646.0
2,241.9384.0
1,857.9694.4269.7424.7
84.9228.6
3,895.8r
416.7
51.0
50.4293.0'
3,737.2931.3671.5259.8
2,805.9687.3'
1,261.3'97.8
1,163.5'496.2'
69.8291.3'179.1205.5283.5
4,347.9'
2,906.9639.7
2,267.2387.4'
1,879.8687.4272.1415.3'
96.7235.5
3,926.6r
421.4'
51.9
54.2301.2'
3,786.4952.8680.1272.8
2,833.5'696.1'
1,265.1'98.6
1,166.5'500.2'72.2
300.0'185.8217.1286.7
4,418.4
2,932.3654.4
2,277.9'387.7'
1,890.2713.0277.0436.0'106.8240.2
3,992.3
426.0'
61.7
65.1313.7'
3,867.8991.9691.3300.6
2,875.9713.4
1,271 097.8
1.173.2498.5
89.6303.4190.9211.1283.6
4,495.8
2,953.3646.7
2,306.6400.8
1,905.8749.9282.6467 3115.5251.2
4,069.9
425.9
78.7
80.5336.0
3,924.01,007.7
710.8296.9
2,916.3722.2
1,293.798.0
1,195.7501.2
89.)310.1199.8224.5291.1
4,581.5
3,015.1664.1
2,351.1415.3
1,935.7788.5294.8493.7113.7237.9
4,155.3
426.1
62.7
65.1346.3
3,960.2 •1,018.4
711.0307.5
2.941.7724.2
1.305.897.5
1.208.3508.0
87.2316.6197.7232.7289.2
4,621.9
3.040.7687.2
2,353.5409.4
1,944.1803.1300.8502.3111.3241.2
4,196.4
425.5
69.1
70.5345.9
3.940.71.005.8
709.3296.5
2,934.9725.2
1.303.696.9
1.206.7509.9
84.2311.9195.8239.1292.6
4,610.7
3,030.4660.9
2.369.5411.3
1,958.2804.1300.8503.3112.8243.8
4,191.0
419.7
65.7
65.5342.0
3,955.81,009.7
711.2298.5
2,946.1727.5
1,305.997.2
1.208.8510.5
B4.3317.9197.2239.2291.8
4,626.7
3,073.5675.2
2,398.3412.8
1.985.5783.2296.7486.5106.5244.4
4,207.6
419.1
65.4
65.4346.0
3,948.11,007 8
711.2296 6
2.940.272.1.8
1,311 697.0
1.214.6510.9
82.6311.4197.4232.2289.9
4.610.0
3,038.5657.6
2,381.0409.5
1,971.4797.1302.8494.4111.6245.2
4,192.4
417.6
63.8
64.4343.7
3.944.21,005.9
707.8298.1
2.938.3725 8
1,102 697 0
1,205 6510.7
87.03122195.8270.0294.1
4,646.6
3,046.0687.6
2,358.4411.0
1.947.4823.5303.7519.8109.0249.7
4,228.2
418.4
66.7
65.5338.6
3,918.41,001.6
708.8292.7
2,916.8723.5
1,295.496.9
1.198.5509.5
82.4306.1190.8224.4292.2
4,568.6
2,973.5640.8
2,332.7410.5
1,922.2815.2302.4512.8118.3240.0
4,147.0
421.7
65.8
65.4338.7
Footnotes appear on p, A21.
Digitized for FRASER http://fraser.stlouisfed.org/ Federal Reserve Bank of St. Louis
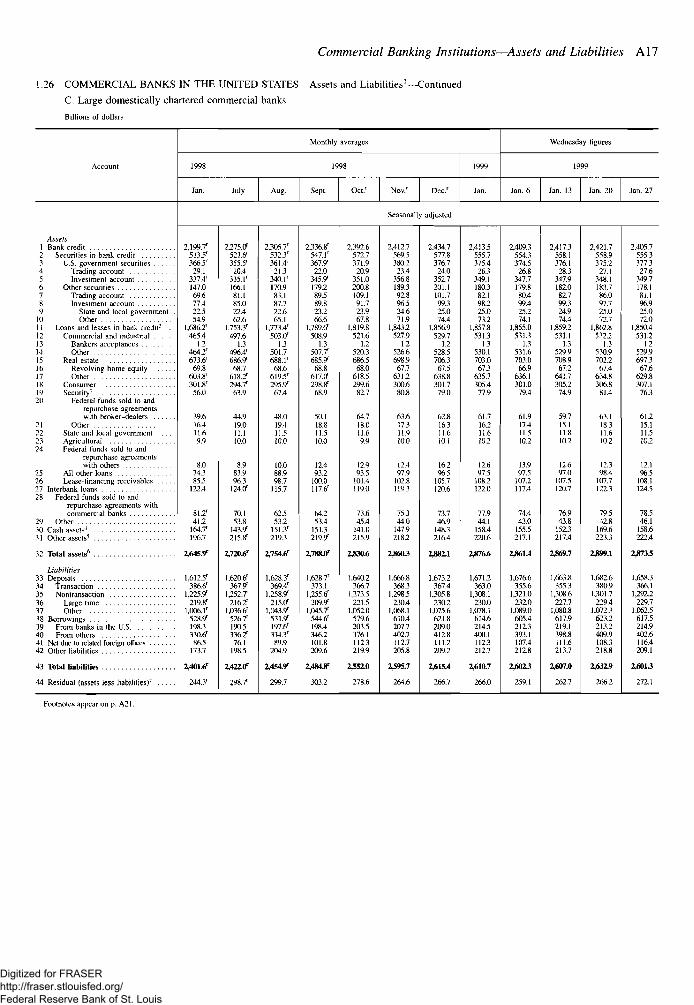
Commercial Banking Institutions—Assets and Liabilities A17
1.26 COMMERCIAL BANKS IN THE UNITED STATES Assets and Liabilities'—Continued
C. Large domestically chartered commercial banks
Billions of dollars
Account
Assets1 Bank credit2 Securities in bank credit3 U.S. government securities4 Trading account5 Investment account6 Other securities7 Trading account8 Investment account9 State and local government .
10 Other11 Loans and leases in bank credit' , . ,12 Commercial and industrial13 Bankers acceptances14 Other15 Real estatelb Revolving home equity17 Other18 Consumer19 Security'20 Federal funds sold to and
repurchase agreementswith broker-dealers
21 Other22 State and local government23 Agricultural24 Federal funds sold to and
repurchase agreementswith others
25 All other loans26 Lease-financing receivables27 Interbank loans28 Federal funds sold to and
repurchase agreements withcommercial banks
29 Other30 Cash assets4
31 Other assets5
32 Total assets6
Liabilities33 Deposits34 Transaction35 Nontransaction36 Large time37 Other18 Borrowings39 From banks in the U.S40 From others41 Net due to related foreign offices42 Other liabilities
43 Total liabilities
44 Residua] (assets less liabilities)7
Monthly averages
1998
Jan.
2,199.7'513.5'366.5'
29.1337.4'147.069.677.422.554.9
1,686.2'465.4
1.2464.2'673.6'
69.8603.8'301.8'
56.0
39.616.411.69.9
8.074.385.5
122.4
81.2'41.2
164.7'196.7
2,645.9'
1,612.5'386.6'
1,225.9"219.8'
1.006.1'528.9'198.33106'86.5
173 7
2y401.6r
244.3'
1998
July
2215Q521.6'355.5'20.4
335.1'166.181.185.022.462.6
1,753.3'497.6
1.3496.4'686.9'68.7
618.2'294.7'63.9
44.919.011.110.0
8.983.996.3
124.0'
70.153.8
143.9215.8'
2,720.6'
1.620.6'367.9'
1.252.7216.2'
1,036.6'526.7'190.5336.2'
76.1198.5
1422.0 '
298.7'
Aug.
2,305.7'532.3'361.4'
21.3340.1'170.9
83.187.722.665.1
1,773.4'5O3.O1
1.3501.7688.1 '
68.6619.5'295.9
67.4
48.019.411.510.0
10.088.998.7
115.7
62.553.2
151.3'219.3
2,754.6'
1.628.3'369.4'
1.258.91
2]5.Cf1.043.9'
531.9"197.6'334.3'
89.9204.9
299.7
Sept.
2,336.8'547.1'361.9
22.0345.9179.289.589.823.266.6
1,789.6'508.9
1.3507.7'685.9
68.8617.1}298.8'
68.9
50.118.811.510.0
12.493.2
100.0117.6'
M.253.4
151.3219.9'
2,788.0"
1,628.7'373.1
1,255.6'209.9"
1.045.7'544.6'198.4346.2101.8209.6
2y4843r
303,2
Oct.'
2,3926572.7371.9
20.9351.0200.8109.191.723.967.8
1,819.8521.6
1.2520.3686.5
68.0618.5299.6
82.7
64.718.011.69.9
12.993.5
101.4119.0
73.645.4
141.0215.9
1,640.2366.7
1,273.5221 S
1,052.0579 6203.5176 1112.1219.9
2^52.0
278.6
Nov.' D e c '
Seasonally adjusted
2,412.7569.5380.2
23.4356.8189.392.896524.671.9
1,843.2527.9
1.2526.6698967.7
631.230O.6
80.8
63.617.311.910.0
12.497.9
102.8119.3
75.344.0
147.9218.2
23603
1.666.8368.3
1,298,52104
1,068.1610.4207.74027112.7205.8
2595.7
264.6
24347577.8376.7
24.0352.7201.1101.799.325.074.4
1,856.9529.7
1.2528.5706.3
67.5638.8301.7
79.0
62.816.311.610.1
16.296.5
105.7120.6
73.746.9
148.3216.4
2382.1
1.673.2367.4
1.305.8230.2
1,075.6621.8209.0412.8111.2209.2
2,615.4
266.7
1999
Jan.
2.413.5555.7375.4
26.3349.1180.382.198.225.073.2
1,857.8531.3
1.3530.1703.0
67.3635.7305.477.9
61.716.211.610.2
12.697.5
108.2122.0
77.944.1
158.4220.6
2376.6
1,671.2363.0
1,308,1230.0
1.078.1614.6214.54001112.3212.7
2,610.7
266.0
Wednesday figures
1999
Jan. 6
2,409.3554.3374.5
26.8347.7179.880.499.425.274.1
1,855.0531.3
1.3531.6703 0
66.9636.1301.0
79.4
61.917.411.510.2
13.997.5
107.2117.4
74.443.0
155.5217.1
2361.4
1,676.6355.6
1,321.0212.0
1,089.0605.4212.3393.1107.4212.8
2.602.3
259.1
Jan. 13 Jan. 20
2.417.3558.1376.1
28.3347.9182.082.799.324.974.4
1.859.2531.1
1.3529.9708.9
67.2641.7305.2
74.9
59715.111.810.2
12.697.0
107.5120.7
76.943.8
152.3217.4
2369.7
1,663.8355.3
1,308.6227.7
1.080.8617.9219.1398.8111.6213.7
2^07.0
262.7
2,421.7558.9375.2
27.1348.1183.786.097.725.072.7
1,862.8532.2
1.3530.9702.2
67 4634.8306.8
81.4
63.118.311.610.2
12.398.4
107.7122.3
79.542.8
169.6223.3
2399.I
1,682.6380.9
1,301.7229.4
1,072.3621.2213.2409.9108.3218.8
2,632.9
266.2
Jan. 27
2.405.7555.3377.327.6
349.7178.181.196.925.072.0
1,850.4531.2
1.2529.9697.3
67.6629.8307.176.3
61.215.111.510.2
12.196.5
108.1124.5
78.546.1
158.6222.4
2373.5
1,658.3366.1
1,292.2229.7
1.062.5617.5214.9402.6116.4209.1
2.601J
272.1
Footnotes appear on p. A21.
Digitized for FRASER http://fraser.stlouisfed.org/ Federal Reserve Bank of St. Louis
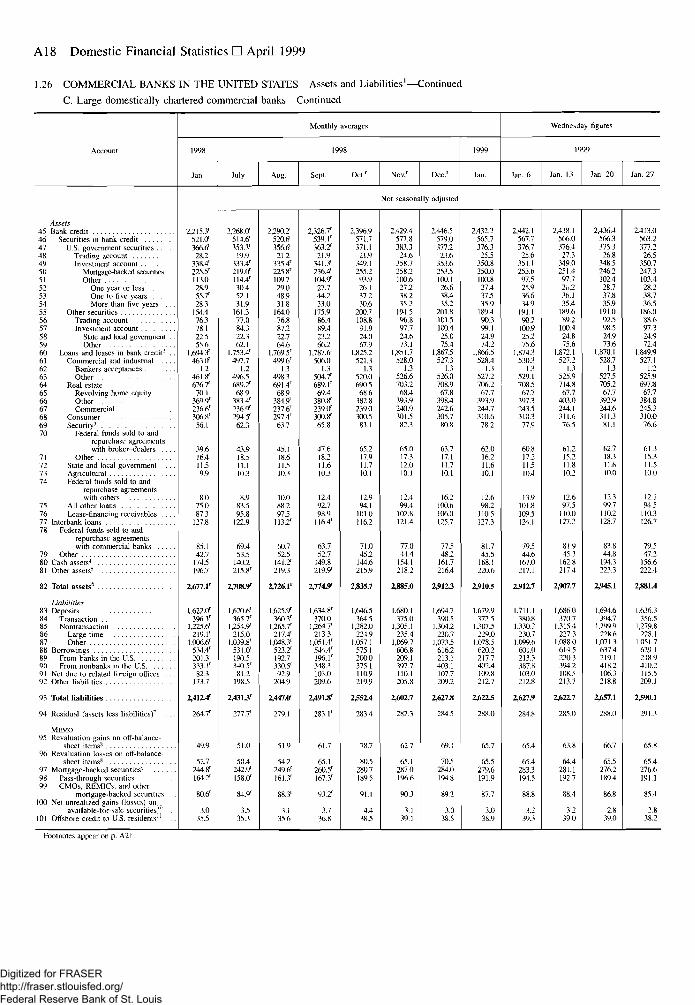
A18 Domestic Financial Statistics • April 1999
1.26 COMMERCIAL BANKS IN THE UNITED STATES Assets and Liabilities'—Continued
C. Large domestically chartered commercial banks—Continued
Account
Assets45 Bank credit46 Securities in bank credit47 US. government securities48 Trading account49 Investment account50 Mortgage-backed securities51 Other52 One year or less53 One to five years54 More than five years . . .55 Other securities56 Trading account57 Investment account58 State and local government . .59 Other60 Loans and leases in bank credit- . .61 Commercial and industrial62 Bankers acceptances63 Other64 Real estate65 Revolving home equity . . .66 Other67 Commercial68 Consumer69 Security'70 Federal funds sold to and
repurchase agreementswith broker-dealers . . . .
71 Other72 State and local government73 Agricultural74 Federal funds sold to and
repurchase agreementswith others
75 All other loans76 Lease-financing receivables . . . .77 Interbank loans78 Federal funds sold to and
repurchase agreementswith commercial banks
79 Other80 Cash assets4
81 Other assets5
82 Total assets6
Liabilities83 Deposits84 Transaction85 Nontransaction86 Large time87 Other88 Borrowings89 From banks in the U S90 From nonbanks in the U.S91 Net due to related foreign offices . . .92 Other liabilities
93 Total liabilities
94 Residual (assets less liabilities)7
M E M O
95 Revaluation gains on off-balance-sheet items*
96 Revaluation losses on off-balance-sheet items8
97 Mortgage-backed securities1'98 Pass-through securities99 CMOs, REMICs, and other
mortgage-backed securities100 Net unrealized gains (losses) on
available-for-sale securities10 .101 Offshore credit to U.S. residents" . .
Monthly averages
1998
Jan.
2,215.3'521.0'366.6'
28.23.38.4'22.5.5'113.028.955.7'28.3
154.476.378.122.555.6
1,694.3'463.0'
1.2461.8'676.7'
70.1369.O/236.6'306.8'
56.1
39.616.411.59.9
8.075.087.3
127.8
85.142.7
174.5196.7
2,677.1'
1,622.0'396.3'
1,225.6'219.1'
1.006.6'534.4'201.3333.1'
82.3173.7
2,4124'
264.7'
49.9
52.7244.8'164.2'
80.6'
3.035.5
1998
July
2,268.0'514.6'353.3'
19.9333.4'219.0'114.4'30.452.131.9
161.377.084.322.362.1
1.753.4'497.7
1.2496.5689.2'68.9
383.4'236.91
294.5'62.3
43.918.511.110.3
8.983.595.8
122.9
69.453.5
140.2215.8'
2,708.9r
1.620.6'365.7'
1,254.9'215.0
1,039.8'531.0*190.5340.5'
81.2198.5
2,4313'
277.7'
51.0
50.4242.9"l58.Or
84.9*
3.535.3
Aug.
2,290.2'520.6'356.6'21.2
335.4'225.8'109.729.048.931.8
164.076.887.222.764.6
1,769.5'499.6'
1.3498.3691.4'
68.9384.91
237.6'297.4'63.7
45.118.611.510.3
10.088.297.5
113.2'
60.752.5
141.2'219.3
2,726.1r
1,625.9'360.3'
1,265.7'217.4'
1,048.3'523.2'192.7330.5"92.9
204.9
2,447.0'
279.1
51.9
54.2249.6'161.3'
88.3'
3.135.6
Sept.
2,326.7'539.1'363.2'21.9
341.3'236.4'10H.927.744.233.0
175.986.489.423.266.2
1,787.6'506.0
1.3504.7'689.1'69.4
380.8'239 o"3018 '65.8
47.618.211.610.3
12.492.798.9
116.4'
63.752.7
149.8219.9'
2,774.9r
1,634.8'370.0
1,264.7'213.3
1,051.4'544.4'196.1'348.3103.0209.6
2,491.8'
283.1'
61.7
65.1260.5'167.3'
93.2'
3.736.8
Oct.'
2,396.9571.7371.1
21.9349.1255.29.3.926.137.230.6
200.7108.891.924.067.9
1,825.2521.3
1.3520.0690.568.6
382.8239.0300.583.1
65.217.911.710.1
12.994.1
101.0116.2
71.045.2
144.6215.9
2,835.7
1,646.5364.5
1,282.0224.9
1.057.1575.1200.0375.1110.9219.9
2,552.4
283.4
78.7
80.52807189 5
91 1
4.438.5
Nov.1"
Not seasona
2,429.4577.8383.324.6
358.7258.2100.627.238.235.2
194.596.897.724.673.)
1,851.7528.0
1.3526.6703.268.4
393.9240.9301.582.3
65.017.312.010.1
12.499-4
102.8121.4
77.044.4
154.1218.2
2^85.0
1,680.1375-0
1,305.1235.4
1,069.7606.8209.1397.7110.1205.8
2,602.7
282.3
62 7
65.1287.0196.6
90.3
3.139.1
D e c '
lly adjusted
2,446.5579 0J77.2
23.6353.6253.5100.126.638.435.2
201.8101.5100.425.075.4
1,867.5527.3
1.3526.0708.967.8
398.4242.6305.7
80.8
63.717.111.710.1
16.2100.6106.0125.7
77.548.2
161.7216.4
1,694.7390.5
1.304.2230.7
1,073.5616.2213.1403.1107.7209.2
2,627.8
284.5
69.1
70.5284.0194.8
89 2
.3.038.5
1999
Jan.
2,432.2565.7376.325.5
350.8250.0100.827.437.535.9
189.490.399.124.974.2
1,866.5528.4
1.3527.2706.267.7
393.9244.7310.678.2
62.016.211.610.1
12.698.2
110.5127.3
81.745.5
168.1220.6
2,910.5
1.679.9372 5
1.307.5229.0
1.078.5620.2217.7402.4109.8212.7
2,622.5
288.0
65.7
65.5279.6191.9
87.7
3.038.9
Wednesday figures
1999
Jan. 6
2,442.1567.7376.725.6
351.125.3.697.525.936.634.9
191.190.2
100.925.275.6
1,874.3530.3
1.3529.1708.567.7
397.3243.5310.377.9
60.817.211.510.4
13.9101.8109.5124.1
79.544.6
167.0217.1
2,912.7
1,711.1380.8
1,330.2230.7
1,099.6601.0213.3387.8103.0212.8
2,627.9
284.8
65.4
65.4283.3194.5
88.8
3.239.3
Jan. 13 Jan. 20
2,438.1566.0376.427.3
H9.0251.497.720.236.1.35.4
189.689.2
100.424.875.6
1,872.1527.2
1.3525.9714.867.7
403.0244.1311.676.5
61.215.211.810.2
12.697.5
110.0127.2
81.945.3
162.8217.4
2,907,7
1,686.0370.7
1.315.4227.3
1.088.0614.5220.3394.2108.5213.7
2,622.7
285.0
63.8
64.4281.1192.7
88.4
3239.0
2,436.4566.3375.3
26.8348.5246.2102.428.737.835.9
191.092.598.524.973.6
1,870.152S.7
1.3527.5705.267.7
192.9244.6311.381.1
62 718.311.610.0
12.399.7
110.2128.7
83.844.8
194,3223.3
2^(45.1
1,694.6394.7
1,299 92286
1,071.3637.4219.1418.2106.3218.8
2,657.1
288.0
66.7
65.5276.2189 4
86.8
2.839.0
Jan. 27
2,413.056.3.2.177.2
26.5350.7247.3103.428.238.736.5
186.088.697.324.972.4
1,849.9527.1
1.25Z5.9697.8
67.7384.8245.3310.076.6
61.315.311.510.0
12.194.5
110.3126.7
79.547.2
156.6222.4
2,881.4
1.636.3356.5
1,279.8228.1
1.051.7629.1218.9410.2115.5209.1
2,590.1
291.3
65.8
65.4276.6191.1
85.4
2.838.2
Fooinotes appear on p. A21.
Digitized for FRASER http://fraser.stlouisfed.org/ Federal Reserve Bank of St. Louis
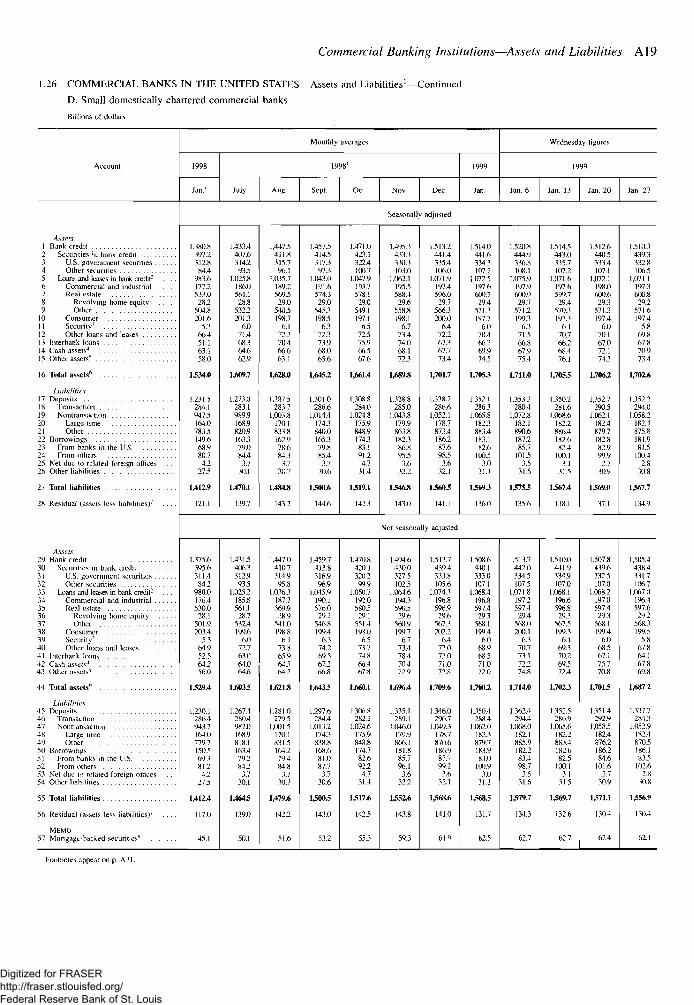
1.26 COMMERCIAL BANKS IN THE UNITED STATES
D. Small domestically chartered commercial banks
Billions of dollars
Commercial Banking Institutions—Assets and Liabilities A19
Assets and Liabilities1—Continued
Monthly averages
July Aug. Sept. Oc Nov. Dec.
Wednesday figures
Seasonally adjusted
Assets1 Bank credit2 Securities in bank credit3 U.S. government securities .4 Other securities5 Loans and leases in bank credit2
6 Commercial and industrial .7 Real estate8 Revolving home equity9 Other
10 Consumer11 Security'12 Other loans and leases13 Interbank loans14 Cash assets4
15 Other assets5
16 Total assets6
Lutbitilies17 Deposits18 Transaction19 Nontransaction20 Large time21 Other22 Borrowings23 From banks in the U.S24 From others25 Net due to related foreign offices26 Other liabilities
27 Total liabilities
28 Residual {assets less liabilities)7
1534.0
1.231.5284.1947.5164.0783.5149.668.980.74.2
27.5
M12.9
121.1
1,433.4407.6314.293.5
1,025.8186.0561.128.8
532.2201.3
6.07!.468.364.662.9
1.609.7
1,273.0283.19S9.9168.9820.9163.379.084.4
3.730.1
1,470.1
139.7
1,447.5411.8315.7
96.11,035.7
189.2569 5
29.0540.5198.7
6.172.270.466.663.1
1,628.0
1,287.5283.7
1,003.8170.1833.8162.978.684.33.7
3C.7
1,484.8
143.2
1,457.5414.5317.397.3
1,043.0191.6574.329.0
545.3198.5
6.372.373.968.065.6
1,645.2
1,301.0286.6
1,014.4174.3840.0165.379.885.4
3730.6
1500.6
144.6
1,471.0423.1322.4100.7
1,047.9193.7578.1
•>9.0549.1197.1
6.572.575.966.567.6
1,661.4
1,308.8284.0
1,024.8175.9848.9174.383.191.24.7
31.4
1519.1
142.3
1,495.3433.3130.3103.0
1,062.1195.5588.4
29.6558.8198.1
6.773.474.068.172.3
1,689.8
1,328.8285.0
1.043.8179.9863.8182.386.895.5
3.6
1346.8
143.0
1,513.2441.4335.4106.0
1,071.9197.4596.0
29.7566 3200.0
6.472.267.367.773.4
1,701.7
1,338.7286.6
1,052.1178.7873.4186.287.698.5
3.632.1
15605
141.1
1,514.0441.6334.3107.2
1.072.5197.6600.7
29.4571.1197.7
6.070.466.769.974.5
1.7053
1,352.1286.3
1,065.8182.3883.4183.182.6
100.510
31.1
1569J
136.0
1.520.8444.9336.8108.1
1,075.9197.9600.9
29.7571.2199.3
6.371.566.867.975.4
1,711.0
1.353.2280.4
1,072.8182.1890.6187.285.7
101.53.5
31.6
1575.5
135.6
1.514.5443.0335.7107.2
1,071.6197.6599.729 4
570.3197.3
6.170.766.268.476.1
1,7055
1,350.2281.6
1.068.6IS2.2886.4182.682.4
100 13.1
31.5
1567.4
138.1
1,512.6440.5133.4107.1
1,072.1198.0600.629.3
571.3197.4
6.070.167.072.174.3
1,706.2
1,352.7290.5
1.062.1182.4879.7182.882.999.9
2730.9
1569.0
137.1
1.510.3439.3332.8106.5
1,071.1197.3600.829.2
571.6197.4
5.869.867.870.973.4
1.70Z6
1,352.2294.0
1.058.2182.4875.8181.981.5
100.42.8
30.8
1567.7
134.9
Assets29 Bank credit30 Securities in bank credit11 U.S. government securities32 Other securities33 Loans and leases in bank credit2
34 Commercial and industrial35 Real estate36 Revolving home equity37 Other38 Consumer39 Security1
40 Other loans and leases41 Interbank loans42 Cash assets4
43 Other assets'
44 Total assets*
Liabilities45 Deposits46 Transaction47 Nontransaclion48 Large nine49 Other50 Borrowings51 From banks in the U.S52 From others53 Net due t-.i related foreign offices54 Other liabilities
55 Total liabilities
5 6 R e s i d u a l ( a s s e t s l e s s l i a b i l i t i e s ) 7 . . . .
MEMO57 Mortgage-backed securities4
Not seasonally adjusted
1.375.6395.6311.484.2
980.0176.4530.0
28.1501.9203.4
53M.952.564.256.0
1529.4
1,230.1286.4943.7164.0779.7I W S69 38124.2
27.5
14124
117.0
45.1
1.431.5406.3312.9935
1.025.2185.8561.1
28.7532.4199.6
6.072.763.064.064.6
1,6035
1,267.4280.4987.0168.9818.1163.479.284.2
3.730.1
1,4645
139.0
50.1
1,447.0410.7314.995.8
1,0.16.1187.7569.9
28.9541.01988
6 173865.964.364.2
1.621.8
1,281.0279.5
1,001.5170.1S31.5164.279.484.8
1730.7
1,479.6
142.2
51.6
1.459.7413.8316.996.9
1.045.9190.1576.029.2
546.8199.4
6.374.269.567.266.8
1,6435
1,297.6284.4
1,013.2174.3838.8168.681.087.7
3.730.6
15005
143.0
53.2
1,470.8420 1320.299.9
1,050.7192 0580.529.1
551.4198.0
6.571774.866.467.8
1,660.1
1.306.8282.2
1,024.6175.9848.8174.782.692.2
4.731.4
1517.6
142.5
55.3
1,494.6430.0327.5102.5
1.064.6194.3590.529.6
560.9199.7
6.773.478.470.472.9
1,696.4
1.335.1289.1
1.046.0179.9866.1181.885.796.1
3.632.2
1552.6
143.8
59.3
1,513.7439.4333.8105.6
1,074.3196.8596.929.6
567.3202.2
6.472.072.071.072.8
1,709.6
1.346.0296.7
1,049.3178.7870.6186.987.799.2
3.632.1
1568.6
141.0
61.9
1.508.6440.1333.0107.1
1,068.4196.8597.4
29.3568.1199.4
6.068.968.571.072.0
1,700.2
1.350.4288.4
1,062.0182.3879.7183.983.0
100.93.0
31.1
15685
131.7
62.5
1,513.7442.0334.5107.5
1,071.8197.2597.4
29.4568.0200.1
6.370.773.172.274.8
1,714.0
1,362.4294.4
1,068.0182.1885.9182.283.498.7
3.531.6
1579.7
134.3
62.7
1.510.0441.9334.9107.0
1.068.1196.6596.829.3
567.5199.3
6.169.370.269.572.4
l,702J
1,352.5286.9
1,065.6182.2883.4182.682.5
100.13.1
11.5
1569.7
132 6
62.7
1,507.8439.6132.5107.0
1.068.2197.0597.429.3
568 1199.4
6068.567.175.770.8
1,7015
1,351.4292.9
1,058.5182.4876.2186.284.6
101.62.7
30.9
1571.1
130.4
62.4
1.505.4438.4331.71067
1,067 0196.4597.629 2
568.3199.5
5.867.864.167.869.8
1,687.2
1,337.2284.3
1,052.9182.4870.5186.183.5
102.62.8
30.8
1556.9
130.4
62.1
Foolnotes appear on p. A21.
Digitized for FRASER http://fraser.stlouisfed.org/ Federal Reserve Bank of St. Louis
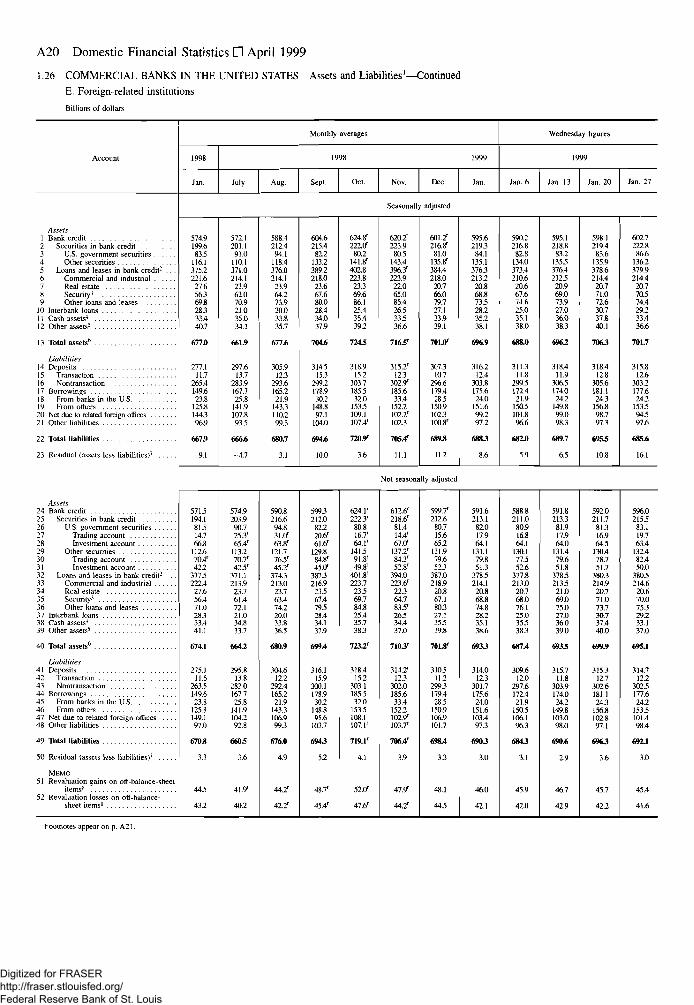
A20 Domestic Financial Statistics • April 1999
1.26 COMMERCIAL BANKS IN THE UNITED STATES Assets and Liabilities'—Continued
E. Foreign-related institutions
Billions of dollars
Monthly averages
July Sept. Oct. Nov. Dec.
1999
Jan.
Wednesday figures
1999
Jan. 6 Jan. 13
Seasonally adjusted
Assets1 Bank credit2 Securities in bank credit3 U.S. government securities . . .4 Other securities5 Loans and leases in bank credit6 Commercial and industrial . . .7 Real estate8 Security1
9 Other loans and leases10 Interbank loans11 Cash assets4
12 Other assets5
13 Total assets6
Liabilities14 Deposits15 Transaction16 Nontransaction17 Borrowings18 From banks in the U S19 From others20 Net due to related foreign offices21 Other liabilities
22 Total liabilities
23 Residual (assets less liabilities)7 . .
Assets24 Bank credit25 Securities in bank credit26 U.S. government securities27 Trading account28 Investment account29 Other securities30 Trading account31 Investment account32 Loans and leases in bank credit2 . .33 Commercial and industrial34 Real estate35 Security3
36 Other loans and leases37 Interbank loans38 Cash assets4
39 Other assets5
40 Total assets6
Liabilities41 Deposits42 Transaction43 Nontransaction44 Borrowings45 From banks in the US46 From others47 Net due to related foreign offices48 Other liabilities
49 Total liabilities
50 Residual (assets less liabilities)7
MEMO
51 Revaluation gains on off-balance-sheetitems8
52 Revaluation losses on off-balance-sheet items8
574.9199.683.5
116.1375.2221.6
27.656359.828.333.440.7
677 A
277.111.7
265.4149.623.8
125.8144.396.9
6675
9.1
572.1201.191.0
110.1371.0214.1
23.962.070.921.035.034.1
661.9
297.613.7
283.9167.725.8
141.9107.893.5
666.6
-4.7
588.4212.494.1
118.4376.0214.1
23.964.273.920.033.835.7
677.6
305.912.3
293.6165.221.9
143.3110.299.3
680.7
-3.1
604.6215.482.2
133.2389.2218.0
23.667.680.028.434.037.9
704.6
314.515.3
299.2178.930.2
148.897.1
104.0
694.6
10.0
624.8'222.r/
80.2141.8r
402.8223.823.369.686.125.435.439.2
7245
318.915.2
303.7185.532.0
153.5109.1107.4'
720.91-
620.2'223.9
80.5143.4396.3'223.922.065.085.426.533.536.6
716.5'
315.2'12.3
302.9'185.633.4
152.2102.2'102.3
7054'
II.1
601.2'216.8'
81.0135.8'384.4218.0
20.766.079.727.133.939.1
701.0r
307.310.7
296.6179.428.5
150.9102.3100.8'
689.8
11.2
595.6219.3
84.1135.1376.3213.220.868.873.528.235.238.1
696.9
316.212.4
303.8175.624.0
151.699.297.2
688J
590.2216.882.8
134.0373.4210.6
20.667.674.625.035.138.0
688.0
311.311.8
299.5172.421.9
150.5101.896.6
682.0
595.1218.883.2
135.5376.4212.520.969.073.927.036.038.3
318.411.9
306.5174.024.2
149.899.098.3
689.7
598.1219.4
83.6135.9378.6214.4
20.771.072.630.737.840.1
706J
318.412.8
305.6181.124.3
156.898.797.3
695.5
602.7222.886.6
136.2379.9214.4
20.770.574.429.233.436.6
701.7
315.812.6
303.2177.624.2
153.594.597.6
685.6
Not seasonally adjusted
571.5194.181.514.766.8
112.670.4'42.2
377.5222.4
27.656.471.028.333.441.1
674.1
275.111.6
263.5149.623.8
125.8149.197.0
670.8
3.3
44.5
43.2
574.9203.990.725.3'65.4'
113.270.7'42.5'
371.1213.9
23.761.472.121.034.833.7
664.2
295.813.8
282.0167.725.8
141.9104.292.8
6605
41.9'
40.2
590.8216.694.83I.0F63.8'
121.776.5'45.2'
374.3213.023.763.474.220.033.836.5
680.9
304.612.2
292.4165.221.9
143.3106.999.3
676.0
44.2'
42.2'
599.3212.0
82.220.6'61.6'
129.884.8'45.0'
387.3216.923.567.479.528.434.137.9
6994
316.115.9
300.1178.930.2
148.895.6
103.7
694.3
48.7'
45.4'
624.1'222.3'80.816.7'64.1'
141.591.8'49.8'
401.8'223.723.569.784.825.435.738.3
7233r
318.415.2
303.1185.532.0
153.5108.1107.1'
7i9.r
52.0'
47.6'
612.6'218.6'81.414.4'67.01
137.2'84.3'52.8'
394.0223.6'22.364.783.5'26.534.437.0
710Jr
314.2'12.3
302.0185.633.4
152.2102.9'103./
7064r
47.91
44.2'
599.7'212.6
80.715.665.2
131.979.652.3
387.0218.9
20.867.180.327.135.539.8
701.8'
310.511.2
299.3179.428.5
150.9106.9101.7
6984
48.1
44.5
591.6213.1
82.017.964.1
131.179.851.3
378.5214.120.868.874.828.235.138.6
6933
314.012.3
301.7175.624.0
151.6103.497.3
690.3
46.0
42.1
588.8211.0
80.916.864.1
130.177.552.6
377.8213.0
20.768.076.125.035.538.3
6874
309.612.0
297.6172.421.9
150.5106.196.3
684J
3.1
45.9
42.0
591.8213.381.917.964.0
131.479.651.8
378.5213.521.069.075.027.036.039.0
6915
315.711.8
303.9174.024.2
149.8103.098.0
690.6
2.9
46.7
42.9
592.0211.781.316.964.5
130.478.751.7
380.3214.920.771.073.730.737.440.0
699.9
315.312.7
302.6181.124.3
156.8102.897.1
696J
3.6
45.7
42.2
596.0215.583.119.763.4
132.482.450.0
380.5214.6
20.670.075.329.233.137.0
695.1
314.712.2
302.5177.624.2
153.5101.498.4
692.1
45.4
41.6
Footnotes appear on p. A21.
Digitized for FRASER http://fraser.stlouisfed.org/ Federal Reserve Bank of St. Louis
Commercial Banking Institutions—Assets and Liabilities A21
NOTES TO TABLE 1.26
NOTE. Tables 1.26, 1.27, and 1.28 have been revised to reflect changes in the Board's H.8statistical release, "Assets and Liabilities of Commercial Banks in the United States." Table1.27, "Assets and Liabilities of Large Weekly Reporting Commercial Banks," and table 1.28,"Large Weekly Reporting U.S. Branches and Agencies of Foreign Banks," are no longerbeing published in the Bulletin. Instead, abbreviated balance sheets for both large and smalldomestically chartered banks have been included in table 1.26, parts C and D. Data are bothmerger-adjusted and break-adjusted. In addition, data from large weekly reporting U.S.branches and agencies of foreign banks have been replaced by balance sheet estimates of allforeign-related institutions and are included in table 1.26, part E These data are break-adjusted.
The not-seasonally-adjusted data for all tables now contain additional balance sheet items,which were available as of October 2, 1996.
1. Covers the following types of institutions in the fifty states and the District ofColumbia: domestically chartered commercial banks that submit a weekly report of condition(large domestic), other domestically chartered commercial banks (small domestic); branchesand agencies of foreign banks, and Edge Act and agreement corporations (foreign-relatedinstitutions). Excludes International Banking Facilities. Data are Wednesday values or prontta averages of Wednesday values. Large domestic banks constitute a universe; data forsmall domestic banks and foreign-related institutions are estimates based on weekly samplesand on quarter-end condition reports. Data are adjusted for breaks caused by ^classificationsof asselsand liabilities.
The data for large and small domestic banks presented on pp. A17-19 are adjusted toremove the estimated effects of mergers between these two groups. The adjustment formergers changes past levels to make them comparable with current levels. Estimatedquantities of balance sheet items acquired in mergers are removed from past data for the bank
group that contained the acquired bank and put into past data for the group containing theacquiring bank. Balance sheet data for acquired banks are obtained from Call Reports, and aratio procedure is used to adjust past levels.
2. Excludes federal funds sold to, reverse RPs with, and loans made to commercial banksin the United States, all of which are included in "Interbank loans."
3. Consists of reverse RPs with brokers and dealers and loans to purchase and carrysecurities.
4. Includes vault cash, cash items in process of collection, balances due from depositoryinstitutions, and balances due from Federal Reserve Banks.
5. Excludes the due-from position with related foreign offices, which is included in "Netdue to related foreign offices."
6 Excludes unearned income, reserves for losses on loans and leases, and reserves fortransfer risk. Loans are reported gross of these items.
7. This balancing item is not intended as a measure of equity capital for use in capitaladequacy analysis. On a seasonally adjusted basis this item reflects any differences in theseasonal patterns estimated for total assets and total liabilities.
8. Fair value of derivative contracts (interest rate, foreign exchange rate, other commodity andequity contracts) in a gain/loss position, as determined under FASB Interpretation No. 39.
9. Includes mortgage-backed securities issued by U.S. government agencies, U.S.government-sponsored enterprises, and private entities.
10. Difference between fair value and historical cost for securities classified as avaiiable-for-sale under FASB Statement No. 115. Data are reported net of tax effects. Data shown arerestated to include an estimate of these tax effects.
11. Mainly commercial and industrial loans but also includes an unknown amount of creditextended to other than nonfmancial businesses.
Digitized for FRASER http://fraser.stlouisfed.org/ Federal Reserve Bank of St. Louis
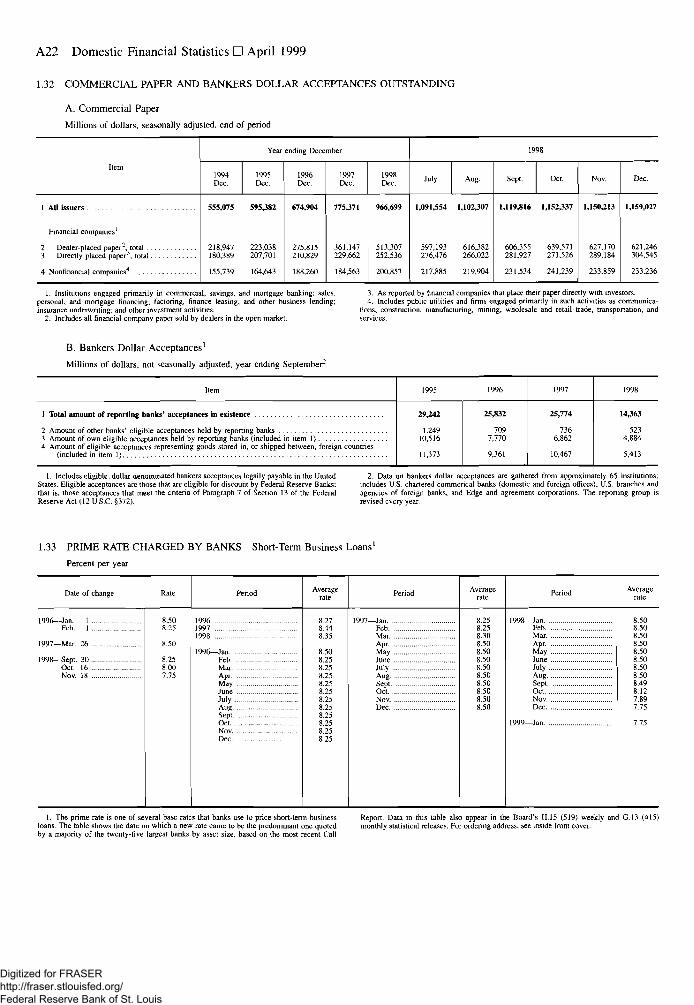
A22 Domestic Financial Statistics • April 1999
1.32 COMMERCIAL PAPER AND BANKERS DOLLAR ACCEPTANCES OUTSTANDING
A. Commercial Paper
Millions of dollars, seasonally adjusted, end of period
Item
1 All issuers
Financial companies1
2 Dealer-placed paper2, total3 Directly placed paper3, total
4 Nonfinancial companies4
Year ending December
1994Dec.
555,075
218,947180,389
155,739
1995Dec.
595,382
223,038207,701
164,643
1996Dec.
674,904
275.815210,829
188,260
1997Dec.
775,371
361.147229,662
184,563
1998Dec.
966,699
513,307252,536
200.857
1998
July
1,091,554
597,193276,476
217,885
Aug.
1,102,307
616,382266,022
219.904
Sept.
1,119,816
606.355281,927
231,534
Oct.
1,152,337
639,571271,526
241,239
Nov.
1,150,213
627,170289,184
233,859
Dec.
1,159,027
621,246304,545
233,236
1. Institutions engaged primarily in commercial, savings, and mortgage banking; sales,personal, and mortgage financing; factoring, finance leasing, and other business lending;insurance underwriting; and olher investment activities.
2. Includes all financial-company paper sold by dealers in the open market.
3. As reported by financial companies that place their paper directly with investors.4. Includes public utilities and firms engaged primarily in such activities as communica-
tions, construction, manufacturing, mining, wholesale and retail trade, transportation, andservices.
B. Bankers Dollar Acceptances1
Millions of dollars, not seasonally adjusted, year ending September2
Item
1 Total amount of reporting banks* acceptances in existence
2 Amount of other banks' eligible acceptances held by reporting banks3 Amount of own eligible acceptances held by reporting banks (included in item 1)4 Amount of eligible acceptances representing goods stored in, or shipped between, foreign countries
(included in item 1)
1995
29,242
1.24910,516
11,373
1996
25,832
7097,770
9,361
1997
25,774
7366,862
10,467
1998
14,363
5234,884
5,413
1. Includes eligible, dollar-denominated bankers acceptances legally payable in the UnitedStates. Eligible acceptances are those that are eligible for discount by Federal Reserve Banks;that is, those acceptances that meet the criteria of Paragraph 7 of Section 13 of the FederalReserve Act (12 U.S.C. §372).
2, Data on bankers dollar acceptances are gathered from approximately 65 institutions;includes U.S. chartered commerical banks (domestic and foreign offices), US branches andagencies of foreign banks, and Edge and agreement corporations. The reporting group isrevised every year.
1.33 PRIME RATE CHARGED BY BANKS Short-Term Business Loans1
Percent per year
Date of change
1996—Jan. 1Feb. 1
1997—Mar. 26
1998—Sept. 30Oct. 16Nov. 18
Rate
8.508.25
8.50
8.258.007.75
Period
199619971998
1996—JanFebMarAprMayJuneJulyAugSeptOctNov.Dec
Averagerate
8.278.448.35
8.508.258.258.258.258.258.258.258.258.258.258.25
Period
1997—JanFebMarApr.MayJuneJulyAugSeptOctNov.Dec
Averagerate
8.258.258.308.508.508.508.508.508.508.508.508.50
Period
1998—JanFebMar.Apr.MayJuneJulyAugSeptOctNovDec
1999—Jan
Averagerate
8.508.508.508.508.508.508.508.508.498.127.897.75
7.75
1. The prime rate is one of several base rates that banks use to price short-term businessloans. The table shows the date on which a new rate came to be the predominant one quotedby a majority of the twenty-five largest banks by asset size, based on the most recent Call
Report. Data in this table also appear in the Board's H.15 (519) weekly and G.13 (415)monthly statistical releases. For ordering address, see inside front cover.
Digitized for FRASER http://fraser.stlouisfed.org/ Federal Reserve Bank of St. Louis
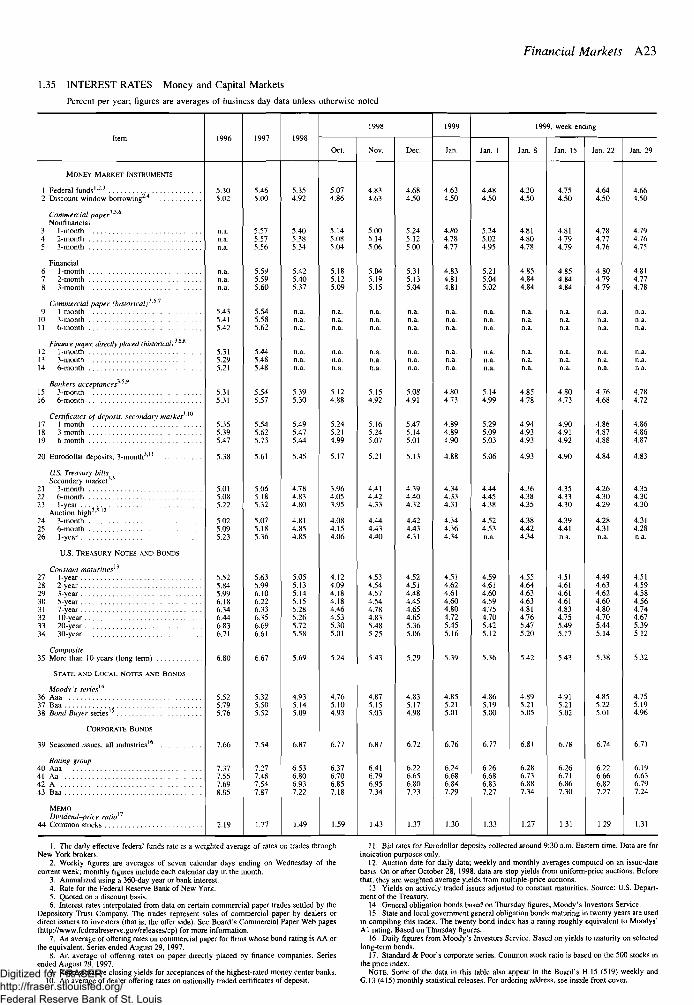
Financial Markets A23
1.35 INTEREST RATES Money and Capita! Markets
Percent per year; figures are averages of business day data unless otherwise noted
Item
MONEY MARKET INSTRUMENTS
1 Federal funds121
2 Discount window borrowing2'4
Commercial paper56
Nonfinancial
4 2-month
Financial
7 2-month8 3-month
Commercial paper (historical)9 1 -month
10 3-month
Finance paper, directly placed (historical)'""
13 3-month14 6-month
Bankers acceptances'"15 3-month
Certificates of deposit, secondary marker1'^
18 3-month19 6-month
20 Eurodollar deposits, 3-month3'"
U.S. Treasury billsSecondary market^
22 6-month
Auction high35 l2
25 6-month26 1-year
U.S. TREASURY NOTES AND BONDS
Constant maturities^27 1-year28 2-year29 3-year30 5-year31 7-year32 10-year33 20-year .34 30-year . . .
Composite35 More than 10 years (long-term)
STATE AND LOCAL NOTES AND BONDS
Moody's series14
37 Baa
CORPORATE BONDS
39 Seasoned issues, all industries
Rating qraup40 Aaa41 Aa42 A43 Baa
MEMODividend-price ratio17
1996
5.305.02
n.a.
n.a.n.a.
5.435.415.42
5.315.295.21
5.315.31
5 155.395.47
5.38
5.015.085.22
5.025.095.23
5.525.845.996.186 346.446.836.71
6.80
5 525.795 76
7.66
7.377 557.698.05
2.19
1997
5.465.00
5 575.575.56
5 595.595.60
5.545.585.62
5.445.485.48
5.545.57
5 545.625.73
5.61
5.065.185.32
5.075.185.36
5.635.996.106.226 336.356.696.61
6.67
5 325.505 52
7.54
7.277 487.547.87
1.77
1998
5.354.92
5 405.385.34
5 425.405.37
n.a.n.a.
n.a.n.a.n.a.
5.395.30
5 495.475.44
5.45
4.784.834.80
4.814.854.85
5.055.135.145.155 285.265.725.58
5.69
4 935.145 09
6.87
6.536 806.937.22
1.49
1998
Oct.
5.074.86
5.145.085.04
5 185.125.09
n.a.n.a.
n.a.n.a.n.a.
5.124.88
5.245.214.99
5.17
3.964.053.95
4.084.154.06
4.124.094.184.184.464.535.305.01
5.24
4 765.104 93
6.77
6.376 706.857.18
1.59
NQV.
4.834.63
5005.145.06
5045.195.15
n.a.n.a.
n.a.n.a.n.a.
5.154.92
5 165.245.07
5.21
4.414.424.33
4.444.434.40
4.534.544.574.544 784.835.485.25
5.43
4 875.155 03
6.87
6.416 796.957.34
1.43
Dec.
4.684.50
5 245.125.00
5315.135.04
n.a.n.a.
n.a.n.a.n.a.
5.084.91
5 475.145.01
5.13
4.394.404.32
4.424.434.31
4.524.514.484.454.654.655.365.06
5.29
4 835.174 98
6.72
6.226.656.807.23
1.37
1999
Jan.
4.634.50
4.804.784.77
4 834.814.81
n.a.n.a.
n.a.n.a.n.a.
4.804.73
4.894.894.90
4.88
4.344.334.31
4 344.364.34
4.514.624.614.604.804.725.455.16
5.39
4.855.215.01
6.76
6.246 686.847.29
1.30
1999, week ending
Jan. 1
4.484.50
5 245.024.95
5 215.045.02
n.a.n.a.
n.a.n.a.n.a.
5.144.99
5.295.095.03
5.06
4.444.454.38
4.524.53
4.594.614.604.594.754.705.425.12
5.36
4.865.19500
6.77
6.266 686.837.27
1.33
Jan. 8
4.304.50
4814.804.78
4 854.844.84
n.a.n.a.
n.a.n.a.n.a.
4.854.78
4 944.934.93
4.93
4.364.384.35
4.384.424.34
4.554.644.634.634.814.765.475.20
5.42
4 895.215.05
6.81
6.286.736.887.34
1.27
Jan. 15
4.754.50
4814.794.79
4 854.844.84
n.a.n.a.
n.a.n.a.
4.804.73
4 904.914.92
4.90
4.354.334.30
4.394.41
4.514.614.614.614.834.755.495.17
5.43
4915.215 02
6.78
6.266.716.867.30
1.31
Jan. 22
4.644.50
4 784.774.76
4 804.794.79
n.a.n.a.
n.a.n.a.n.a.
4.764.68
4.864.874.88
4.84
4.264.304.29
4.284.31
4.494.634.624.604.804.705.445.14
5.38
4.855.225.01
6.74
6.226 666.827.27
1.29
Jan. 29
4.664.50
4 794.764.75
4 814.774.78
n.a.n.a.
n.a.n.a.n.a.
4.784.72
4.864.864.87
4.83
4.354.304.30
4.314.28n.a.
4.514.594.584.564.744.675.395.12
5.32
4.755.194.96
6.71
6.196.636.797.24
1.31
1. The daily effective federal funds rate is a weighted average of rates on trades throughNew York brokers.
2. Weekly figures are averages of seven calendar days ending on Wednesday of thecurrent week; monthly figures include each calendar day in the month.
3. Annualized using a 360-day year or bank interest.4. Rate for the Federal Reserve Bank of New York.5. Quoted on a discount basis.6. Interest rates interpolated from data on certain commercial paper trades settled by the
Depository Trust Company. The trades represent sales of commercial paper by dealers ordirect issuers to investors (that is, the offer side). See Board's Commercial Paper Web pages(http://www.federalreserve.gov/releases/cp) for more information.
7. An average of offering rates on commercial paper for firms whose bond rating is AA orthe equivalent. Series ended August 29, 1997.
8. An average of offering rates on paper directly placed by finance companies. Seriesended August 29, 1997.
9. Representative closing yields for acceptances of the highest-rated money center banks.10. An average of dealer offering rates on nationally traded certificates of deposit.
11. Bid rates for Eurodollar deposits collected around 9:30 a.m. Eastern time. Data are forindication purposes only.
12. Auction date for daily data; weekly and monthly averages computed on an issue-datebasis. On or after October 28, 1998, data are stop yields from uniform-price auctions. Beforethat, they are weighted average yields from multiple-price auctions.
13. Yields on actively traded issues adjusted to constant maturities. Source: U.S. Depart-ment of the Treasury.
14. General obligation bonds based on Thursday figures; Moody's Investors Service.15. State and local government general obligation bonds maturing in twenty years are used
in compiling this index. The twenty-bond index has a rating roughly equivalent to Moodys'Al rating. Based on Thursday figures.
16. Daily figures from Moody's Investors Service. Based on yields to maturity on selectedlong-term bonds.
17. Standard & Poor's corporate series. Common stock ratio is based on the 500 stocks inthe price index.
NOTE. Some of the data in this table also appear in the Board's H.15 (519) weekly andG.13 (415) monthly statistical releases. For ordering address, see inside front cover.
Digitized for FRASER http://fraser.stlouisfed.org/ Federal Reserve Bank of St. Louis
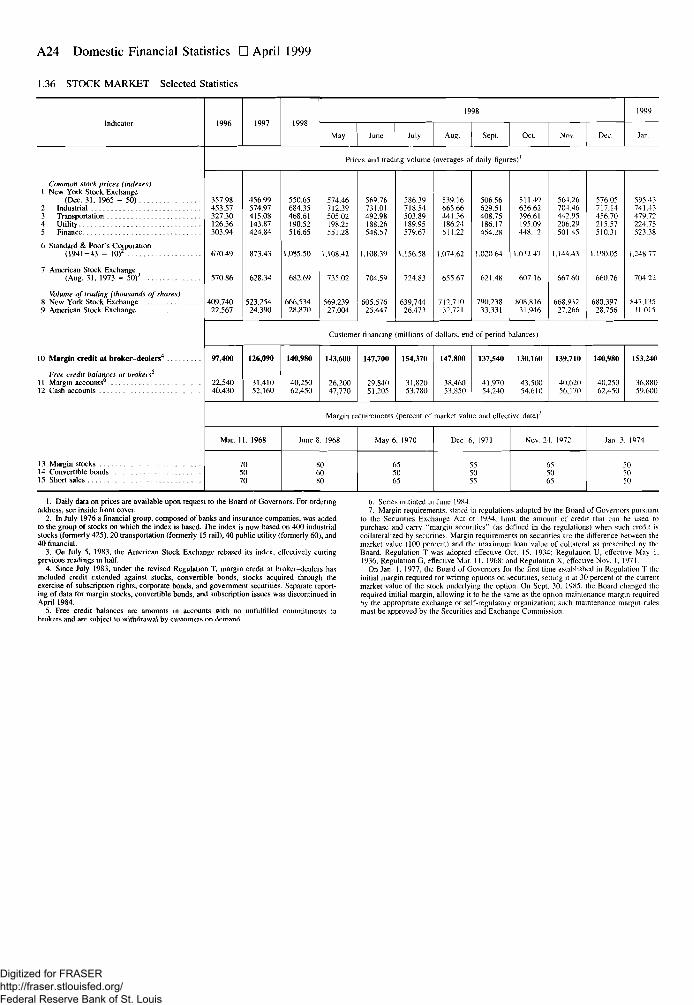
A24 Domestic Financial Statistics • April 1999
1.36 STOCK MARKET Selected Statistics
Indicator
Common slock prices (indexes)1 New York Stock Exchange
(Dec. 31, 1965 = 50)
3 Transportation4 Utility
6 Standard & Poor's Corporation(1941-43 = 10)2
7 American Stock Exchange(Aug. 31, 1973 = 50)'
Volume of trading (thousands of shares)8 New York Stock Exchange9 American Stock Exchange
10 Margin credit at broker-dealers4
Free credit balances at brokers^11 Margin accounts6
13 Margin stocks14 Convertible bonds15 Short sales
1996 1997 1998
1998
May June July Aug. Sept. Oct. Nov. Dec.
1999
Jan.
Prices and trading volume (averages of daily figures)1
357.98453.57327.30126.36303.94
670.49
570.86
409,74022,567
456.99574.97415.08143.87424.84
873.43
628.34
523,25424.390
550.65684.35468.61190.52516.65
1,085.50
682.69
666,53428,870
574.46712.39505.02198.25551.28
1,108.42
735.02
569,23927,004
569.76731.01492.98188.26548.57
1.108.39
704.59
605,57625.447
586.39718.54503.89189.95579.67
1,156.58
724.83
639,74426.473
539.16665.66441.36186.24511.22
1.074.62
655.67
712,71032.721
506.56629.51408.75186.17454.28
1.020 64
621.48
790,23833.331
511.49636.62396.61195.09448.12
1.032.47
607.16
808,81631,946
564.26704.46442.95206.2950145
1.144.43
667.60
668.93227.266
576.05717.14456.70215.57510.31
1,190.05
660.76
680,39728.756
595.43741.43479.72224.75523.38
1,248.77
704.22
847,13531,015
Customer financing (millions of dollars, end-of-period balances)
97,400
22,54040,430
126,090
31,41052.160
140,980
40,25062,450
143,600
26,20047,770
147,700
29.84051.205
154,370
31,82053,780
147,800
3S.46053,850
137,540
41,97054,240
130,160
43,50054,610
139,710
40.62056.170
140,980
40,25062,450
153,240
36,88059,600
Margin requirements (percent of market value and effective date)7
Mar. 11. 1968
705070
June 8. 1968
806080
May 6, 1970
655065
Dec 6. 1971
555055
Nov. 24. 1972
655065
Jan. 3, 1974
505050
1. Daily data on prices are available upon request to the Board of Governors. For orderingaddress, see inside front cover.
2. In July 1976 a financial group, composed of banks and insurance companies, was addedto the group of stocks on which the index is based. The index is now based on 400 industrialstocks (formerly 425), 20 transportation (formerly 15 rail), 40 public utility (formerly 60), and40 financial.
3. On July 5, 1983, the American Stock Exchange rebased its index, effectively cuttingprevious readings in half.
4. Since July 1983, under the revised Regulation T, margin credit at broker-dealers hasincluded credit extended against stocks, convertible bonds, stocks acquired through theexercise of subscription rights, corporate bonds, and government securities. Separate report-ing of data for margin stocks, convertible bonds, and subscription issues was discontinued inApril 1984.
5. Free credit balances are amounts in accounts with no unfulfilled commitments tobrokers and are subject to withdrawal by customers on demand.
6. Series initiated in June 1984.7. Margin requirements, slated in regulations adopted by the Board of Governors pursuant
to the Securities Exchange Act of 1934, limit the amount of credit that can be used topurchase and cany "margin securities" fas defined in the regulations) when such credit iscollateralized by securities. Margin requirements on securities are the difference between themarket value (100 percent) and the maximum loan value of collateral as prescribed by theBoard. Regulation T was adopted effective Oct. 15. 1934; Regulation U, effective May 1,1936; Regulaiion G, effective Mar. II, 1968; and Regulation X. effective Nov. !, 1971.
On Jan, 1, 1977, the Board of Governors for the first time established in Regulation T theinitial margin required for writing options on securities, setting it at 30 percent of the currentmarket value of the stock underlying the option. On Sept, 30, 1985, the Board changed therequired initial margin, allowing it to be the same as the option maintenance margin requiredby the appropriate exchange or self-regulatory organization; such maintenance margin rulesmust be approved by the Securities and Exchange Commission.
Digitized for FRASER http://fraser.stlouisfed.org/ Federal Reserve Bank of St. Louis
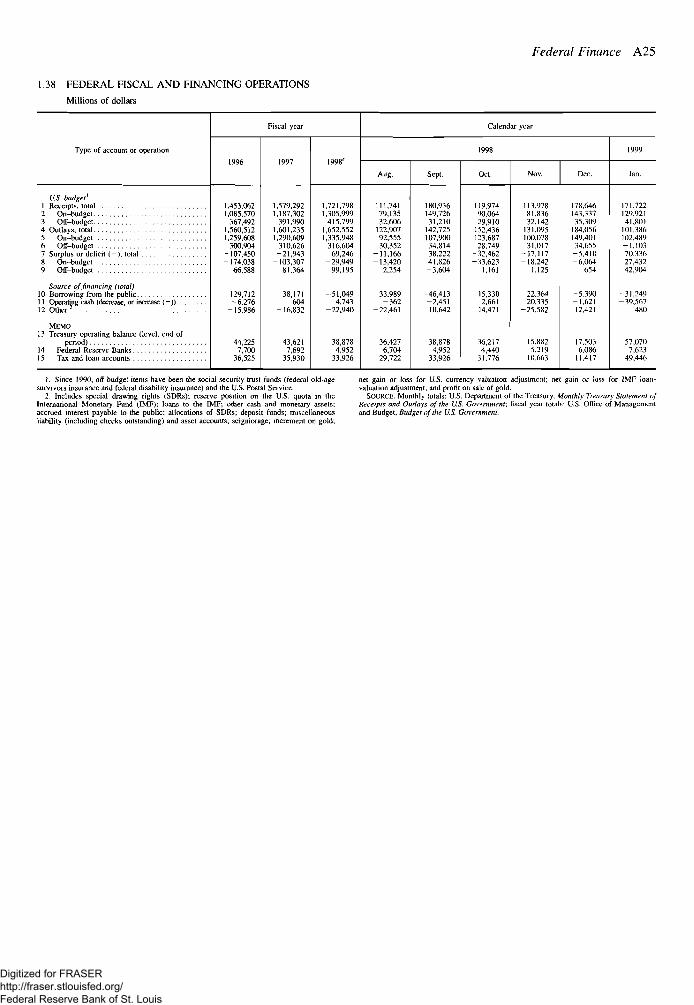
1.38 FEDERAL FISCAL AND FINANCING OPERATIONS
Millions of dollars
Federal Finance A25
Type of account or operation
Fiscal year
1997 1998'
Calendar year
Aug. Sept. Oct.
US. budget'1 Receipts, total2 On-budget3 Off-budget4 Outlays, total5 On-budget6 Off-budget7 Surplus or deficit ( - ) . tola]8 On-budget9 Off-budget
Source of financing (lolal)10 Borrowing from the public11 Operating cash (decrease, or increase {-))..12 Other2
MEMO13 Treasury operating balance (level, end of
period)14 Federal Reserve Banks15 Tax and loan accounts
1,453,0621,085,570
367,4921,560,5121,259,608
300,904-107,450-174.038
66,588
129,712-6.276
-15,986
44,2257,700
36,525
1,579,2921,187,302
391,9901,601,2351,290,609
310,626-21,943
-103,30781,364
38,171604
-16,832
43,6217,692
35,930
1,721,7981,305,999
415,7991,652,5521,335,948
316,60469,246
-29,94999,195
-51,0494,743
-22,940
38,8784,952
33,926
111,74179,13532,606
122,90792,55530,352
-11,166-13,420
2,254
33,989-362
-22,461
36,4276,704
29,722
180,936149,72631,210
142,725107,90034,81438.22241,826-3,604
-46,413-2,45110.642
38,8784,952
33.926
119,97490,06429,910
152,436123.68728.749
-32,462-33.623
1,161
15,3302.661
14,471
36,2174,440
31,776
113,97881,83632,142
131,095100,07831.017
-17.117-18,242
1,125
22,36420,335
-25,582
15,8825,219
10,663
178,646143,33735,309
184,056149,40134,655
-5,410-6.064
654
-5,390-1,62112,421
17,5036,086
11,417
171,722129,92141,801
101,386102,489-1,10370.33627,43242,904
-31,249-39,567
480
57,0707,623
49,446
1. Since 1990, off-budget items have been the social security trust funds (federal old-agesurvivors insurance and federal disability insurance) and the U.S. Postal Service.
2. Includes special drawing rights (SDRs); reserve position on the U.S. quota in theInternational Monetary Fund (IMF); loans to the IMF; other cash and monetary assets:accrued interest payable to the public; allocations of SDRs; deposit funds; miscellaneousliability (including checks outstanding) and asset accounts; seigniorage; increment on gold;
net gain or loss for U.S. currency valuation adjustment; net gain or loss for IMF loan-valuation adjustment; and profit on sale of gold.
SOURCE. Monthly totals: U.S. Department of the Treasury, Monthly Treasury Statement ofReceipts and Outlays of the US. Government; fiscal year totals: U.S. Office of Managementand Budget. Budget of the US. Government.
Digitized for FRASER http://fraser.stlouisfed.org/ Federal Reserve Bank of St. Louis
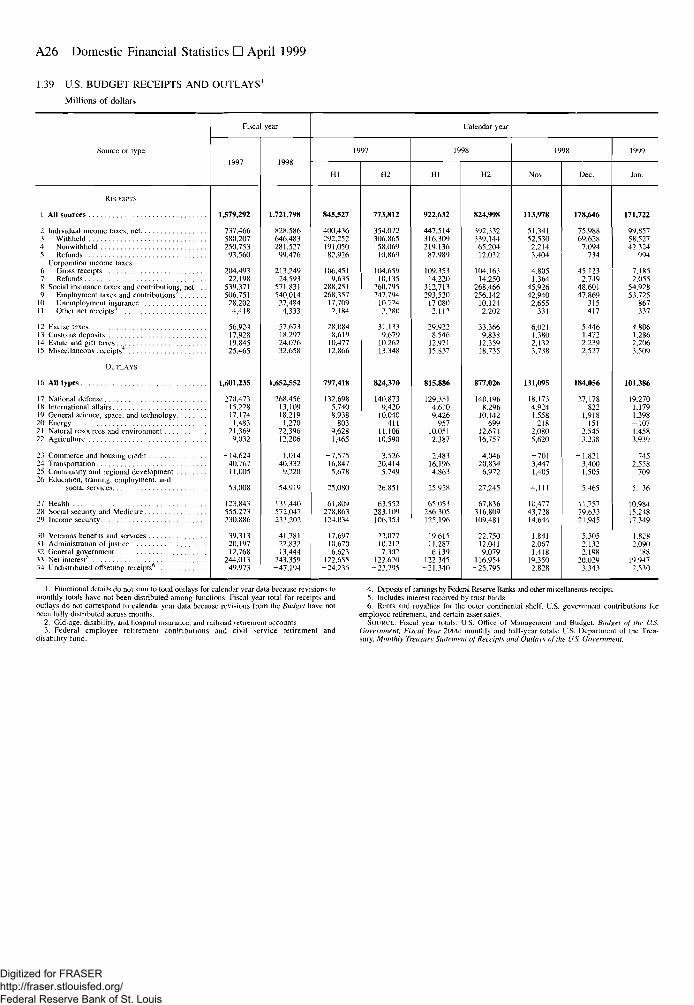
A26 Domestic Financial Statistics • April 1999
1.39 US. BUDGET RECEIPTS AND OUTLAYS'
Millions of dollars
Source or type
Fiscal year Calendar year
H2
1998
Jan.
All suurces .
2 Individual income taxes, net3 Withheld4 Nonwithheld5 Refunds
Corporation income taxes6 Gross receipts7 Refunds8 Social insurance taxes and contributions, net9 Employment taxes and contributions2 . . .
10 Unemployment insurance11 Other net receipts*
12 Excise taxes13 Customs deposits14 Estate and gift taxes15 Miscellaneous receipts4 . . .
OUTLAYS
16 All types
17 National defense18 International affairs19 General science, space, and technology.20 Energy21 Natural resources and environment . . . .22 Agriculture
23 Commerce and housing credit24 Transportation25 Community and regional development .26 Education, training, employment, and
social services
27 Health28 Social security and Medicare29 Income security
30 Veterans benefits and services . . .31 Administration of justice32 General government33 Net interest5
34 Undistributed offsetting receipts6
1,579,292
737,466580,207250,75393,560
204,49322,198
539,371506,75128.2024,418
56,92417,92819,84525,465
1,601,235
270,47315.22817.1741,483
21,3699,032
-14,62440,76711,005
53,008
123,843555,273230.886
39,31320,19712,768
244,013-49.973
1,721,798
828,586646,483281,52799,476
213,24924,593
571,831540,01427,4844.333
57,67318,29724,07632,658
1.652,552
268,45613,10918,2191,270
22,39612,206
1,01440,3329,720
54,919
131,440572,047233,202
41,78122,83213,444
243,359-47,194
845,527
400,436292,252191.05082.926
106,4519,635
288,251268,35717,7092.184
28,0848,61910,47712.866
797,418
132,6985,7408,938803
9,6281,465
-7,57516,8475,678
25,080
61,809278,863124.034
17,69710.6706.623
122.655-24,235
773,812
354,072306.86558,06910,869
104,65910,135
260,795247,79410,7242,280
31,1339,67910,26213,348
824370
140,8739,420
10.040411
11.10610,590
-3,52620,414
5.749
26,851
63,552283,109106,353
22,07710,2127.302
122.620-22.795
922,632
447,514316,309219,13687,989
109,35314,220
312,713293,520
17,0802,112
29.9228,546
12,97115.837
815,886
129,3514,6109,426957
10,0512,387
-2,48316.1964,863
65.053286.305125,196
19,61511,2876,139
122,345-21.340
824,998
392,332339,14465,20412,032
104,16114,250
268,466256,14210,1212.202
33,3669,83812,35918.735
877.026
140.1968.29610,142
699
12,671
16,757
4,04620,8346,972
27,245
67.836316,809109,481
22,75012,0419,079
116,954-25,795
113,978
51,34152,5302,2143,404
4,8051,364
45,92642,9402,655331
6,0211,3802,1323,738
131,095
18,1734,9241,558-2182,0805,620
-7013,4471,405
4,111
10,47743,72814,644
1,8412,0671,418
19,350-2.828
178,646
75.98869.628
7,094734
45,1232.749
48.60147,869
315417
5,4461,4722,2392,527
184,056
27,178822
1,918151
2.5453,238
-1,8213,4001,505
5.465
11,75779,63321,945
5,3052,1322,198
20,029-3 ,343
171,722
99,85758.52742.324
994
7.1852,055
54,92853,725
867337
4 8061,2862,2063,509
101.386
19,2701,1791,398-1071.4583.939
7452.558
709
5.136
10,98415,24817,349
1.8282,090
18819.947•2,530
1. Functional details do nol sum to total outlays for calendar year data because revisions tomonthly totals have not been distributed among functions. Fiscal year total for receipts andoutlays do not correspond to calendar year data because revisions from the Budget have notbeen fully distributed across months.
2. Old-age, disability, and hospital insurance, and railroad retirement accounts3. Federal employee retirement contributions and civil service retirement and
disability fund.
4. Deposits of earnings by Federal Reserve Banks and other miscellaneous receipts.5. Includes interest received by trust funds.6. Rents and royalties for the outer continental shelf. U.S. government contributions for
employee retirement, and certain asset sales.SOURCE. Fiscal year totals: U.S. Office of Management and Budget, Budget of the U.S.
Government. Fiscal Year 2000: monthly and half-year totals: U.S. Department of the Trea-sury, Monthly Treasury Sliitftnt'tit of Receipts and Outlays njthe U.S. Government.
Digitized for FRASER http://fraser.stlouisfed.org/ Federal Reserve Bank of St. Louis
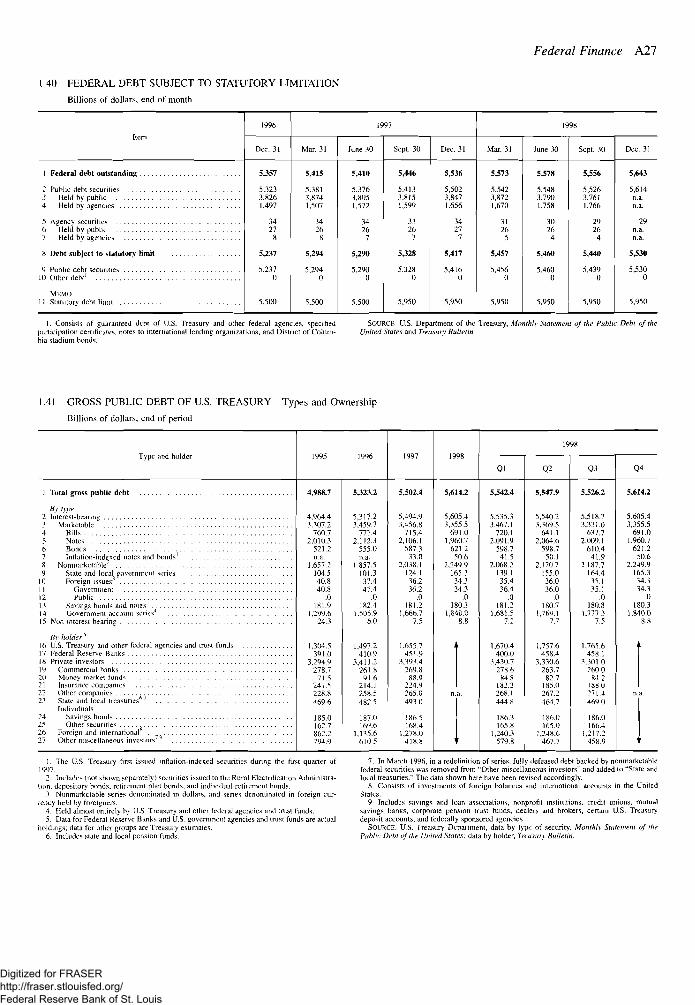
Federal Finance A27
1.40 FEDERAL DEBT SUBJECT TO STATUTORY LIMITATION
Billions of dollars, end of month
hem
1 Federal debt outstanding
2 Public debt securities3 Held by public4 Held by agencies
6 Held by public7 Held by agencies
8 Debt subject to statutory limit
9 Public debt securities10 Other debt1
MHMO11 Statutory debt limit
1996
Dec. 31
5,357
5,3233,8261,497
3427
8
5,237
5,2370
5,500
Mar. 31
5,415
5.3813,8741.507
3426
8
5,294
5,2940
5,500
1997
June 30
5,410
5.3763,8051,572
3426
7
5,290
5,2900
5.500
Sept. 30
5,446
5.4133.8151,599
33267
5,328
5.3280
5,950
Dec. 31
5,536
5,5023,8471.656
34277
5,417
5,4160
5,950
Mar. 31
5,573
5,5423,8721,670
3126
5
5,457
5,4560
5,950
1998
June 30
5,578
5.5483.7901,758
30264
5,460
5,4600
5,950
Sept. 30
5,556
5,5263.7611,766
29264
5,440
5,4390
5,950
Dec. 31
5,643
5.614n.a.n.a.
29n.a.n.a.
5,530
5,5300
5.950
1. Consists of guaranteed debt of U.S. Treasury and other federal agencies, specifiedparticipation certificates, notes to international lending organizations, and District of Colum-bia stadium bonds.
SOURCE U.S. Department of the Treasury, Monthly Statement of the Public Debt of theUnited States and Treasury Bulletin,
1.41 GROSS PUBLIC DEBT OF U.S. TREASURY Types and Ownership
Billions of dollars, end of period
Type and holder
1 Total gross public debt
By type2 Interest-bearing1 Marketable4 Bills5 Notesb Bonds7 Inflation-indexed notes and bonds'8 Nonmarketable^9 State and local government scries
10 Foreign issues11 Government12 Public13 Savings bonds and notes
15 Non-intcresl-bearing
By holder5
16 U.S. Treasury and other federal agencies and trust funds17 Federal Reserve Banks18 Private investors19 Commercial banks20 Money market fund';21 Insurance companies22 Other companies2.1 State and local treasuries
Individuals24 Savings bonds25 Other securities26 Foreign and international'1 . .27 Other miscellaneous investors •'
1995
4,988.7
4,964.43.307.2
760.72,010.3
521.2n.a.
1,657.2104.540.840.8
.0181.9
1 ?99 f,24.3
1,304.5391.0
3,294.9278.7
71.5241.5228.8469.6
185.0162.7862.2794.9
1996
5.323.2
5,317.23,459.7
777.42.112.3
555.0n.a.
1.857.5101.337.447.4
.0182.4
1 505 96.0
1,497.2410.9
3,411.2261.8
91.6214.1258.5482.5
187.0169.6
1.135.6610.5
1997
5,502.4
5,494.93,456.8
715.42,106.1
587 ~i31.0
2,038.1124 136.236.2
.0181.2
1 666 77̂ 5
1,655.7451.9
3,393.4269.888.9
224.9265.0493.0
186 5168.4
1.278.0418.8
1998
5,614.2
5,605.43,355.5
691.01,960.7
621.250.6
2,249.9165.334.334.3
.0180.3
1,840 0
J
n.a.
Ql
5,542.4
5.535.33,467.1
720.12,091.9
598.741.5
2,068.2139.135.436.4
.0181.2
1 681 57~2
1,670.4400.0
3.430.7278.6
84.8182.2268.1444.8
186.3165.8
1,240.3579.8
1998
Q2
5,547.9
5,540.23.369.5
641.12.064.6
598.750.1
2,170.7155.036.036.0
.0180.7
1 769 17.7
1,757.6458.4
3,330.6263.7
82.7185.0267.2464.7
186.0165.0
1,248.6467.7
Q 3
5,526.2
5,518.73.331.0
637.72,009.1
610.441.9
2.187.7164.435.135.1
.0180.8
1 777 37.5
1,765.6458.1
3,301.0260.0
84.2IS80271.4469 0
186.0166.4
1,217.2458.9
Q4
5.614.2
5,605.43,355.5
691.01,960.7
621 250.6
2,249.9165.334.334.3
.0180.3
1,840.08.8
n.a.
1. The U.S. Treasury first issued in flat ion-indexed securities during the first quarter of1997.
2. Includes (not shown separately) securities issued to the Rural Electrification Administra-tion, depository bonds, retirement plan bonds, and individual retirement bonds.
3 Nonmarkctable series denominated in dollars, and series denominated in foreign cur-rency held by foreigners.
4. Held almost entirely by U.S Treasury and other federal agencies and trust funds.5. Data for Federal Reserve Banks and U.S. government agencies and trust funds are actual
holdings; data for other groups are Treasury estimates.6. Includes slate and local pension funds.
7. In March 1996, in a redefinition of series, fully defeased debt backed by nonmarketablefederal securities was removed from "Other miscellaneous investors" and added to "State andlocal treasuries." The data shown here have been revised accordingly.
8. Consists of investments of foreign balances and international accounts in the UnitedStates.
9 Includes savings and loan associations, nonprofit institutions, credit unions, mutualsavings banks, corporate pension trust funds, dealers and brokers, certain U.S. Treasurydeposit accounts, and federally sponsored agencies
SOURCE. U.S. Treasury Department, data by type of security. Monthly Statement of thePublic Debt of the United States; data by holder, Treasury Bulletin.
Digitized for FRASER http://fraser.stlouisfed.org/ Federal Reserve Bank of St. Louis
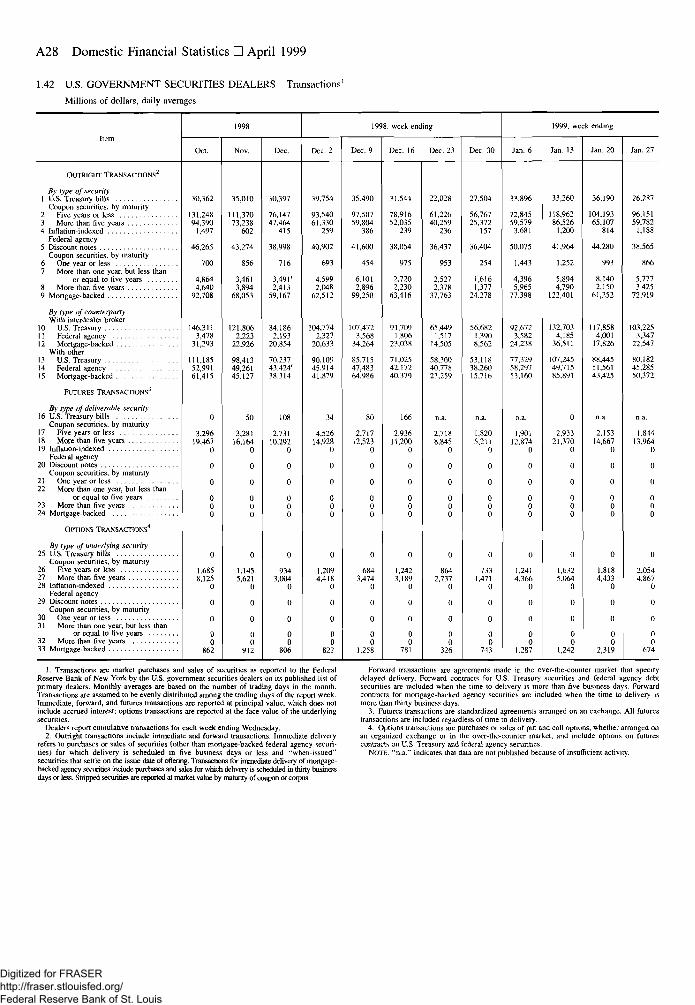
A28 Domestic Financial Statistics • April 1999
1.42 U.S. GOVERNMENT SECURITIES DEALERS Transactions1
Millions of dollars, daily averages
1998
Dec.
1998, weekending
Dec. 9 Dec. 16 Dec. 23 Dec. 30
1999. week ending
Jan. 6 Jan. 13 Jan. 20 Jan. 27
OUTRIGHT TRANSACTIONS2
By type of security1 U.S. Treasury bills
Coupon securities, by maturity2 Five years or less3 More than five years4 Inflation-indexed
Federal agency5 Discount notes
Coupon securities, by maturity6 One year or less7 More than one year, but less than
or equal to five years8 More than five years9 Mortgage-backed
By type of counterpartyWith interdealer broker
10 U.S. Treasury11 Federal agency12 Mortgage-backed
With other13 US. Treasury14 Federal agency15 Mortgage-backed
FUTURES TRANSACTIONS3
By type of deliverable security16 U.S. Treasury bills
Coupon securities, by maturity17 Five years or less18 Mare than five years19 Inflation-indexed
Federal agency20 Discount notes
Coupon securities, by maturity21 One year or less22 More than one year, but less than
or equal to five years23 More than five years24 Mortgage-backed
OPTIONS TRANSACTIONS4
By type of underlying security25 U.S. Treasury bill's
Coupon securities, by maturity26 Five years or less27 More than five years28 Inflation-indexed
Federal agency29 Discount notes
Coupon securities, by maturity30 One year or less31 More than one year, but less than
or equal to five years32 More than five years33 Mortgage-backed
30,362
131.24894,390
1,497
46,265
7004,8644 640
92,708
146.3113,478
31,293
111,18552,99161,415
3,29619,467
0
0
0000
1.6858,125
0
0
000
862
35,010
111,37073,238
602
43,274
856
3,4613,894
68,053
121,8062,223
22,926
98,41349,26145,127
50
3,28116,164
0
0
0000
1,1455,621
0
0
0
00
912
30,397
76,14747,464
415
38,998
716
3,491r
2,41359,167
84,1862,193
20.854
70,23743,424'38,314
108
2,73110,292
0
0
0000
9343.004
0
0
0
00
806
39.754
93,54061,330
259
40,902
693
4.5992.048
62,512
104,7742,327
20,633
90,10945,91441,879
4,52614,928
0
0
0000
1.2094,418
0
0
000
822
35,490
97,50759,804
386
41,600
454
6,1012,896
99,250
107,4723,568
34,264
85,71547,48364,986
2,71712,523
0
6843,474
0
00
1,258
31.544
78,91652,035
239
38,054
975
2,7202,230
63,416
91.7091.806
23,038
71,02542,17240,379
2,93611,200
0
0
0000
1,2423,189
0
00
781
22,028
61,22640,259
236
36,437
953
2,5272,378
37,763
65,4491,517
14,505
58,30040,77823,259
2,7188,845
0
0
0000
8642,737
0
00
326
27,504
56,76725,372
157
1,6161,377
24,278
56,6821,3908,562
53,11838,26015,716
1,8205,211
0
0
0000
7331,471
0
00
743
33,896
72,84559,579
3,681
50,075
1,443
4,3965,965
77.398
92.6723.582
24.238
77,32958,29753,160
1,90112,874
0
0
0000
1,2414,366
0
00
1,287
33,260
118,96286,526
1,200
41,964
1.252
5,8944,790
122,401
132,7034,185
36,511
107,24549,71585,891
2,93321,370
0
0
0000
1,6325.064
0
00
1,242
36,190
104,19365,107
814
44,280
993
8.1402,150
61,252
117,8584,001
17,826
88,44551,56143,425
2,15314,667
0
1,8184,433
0
00
2,319
26,287
96,15159,782
1,188
38.565
866
5.7773,425
72,919
103,2253 347
22.547
80,18245,28550,372
1.84413,964
0
0
0000
2,0544,867
0
00
674
1. Transactions are market purchases and sales of securities as reported to the FederalReserve Bank of New York by the U.S. government securities dealers on its published list ofprimary dealers. Monthly averages are based on the number of trading days in the month.Transactions are assumed to be evenly distributed among the trading days of the report week.Immediate, forward, and futures transactions are reported at principal value, which does notinclude accrued interest; options transactions are reported at the face value of the underlyingsecurities.
Dealers report cumulative transactions for each week ending Wednesday.2. Outright transactions include immediate and forward transactions. Immediate delivery
refers to purchases or sales of securities (other than mortgage-backed federal agency securi-ties) for which delivery is scheduled in five business days or less and "when-issued"securities that settle on the issue date of offering. Transactions for immediate delivery of mortgage-backed agency securities include purchases and sales for which delivery is scheduled in thirty businessdays or less. Stripped securities are reported at market value by maturity of coupon or corpus.
Forward transactions are agreements made in the over-the-counter market that specifydelayed delivery. Forward contracts for U.S. Treasury securities and federal agency debtsecurities are included when the time to delivery is more than five business days. Forwardcontracts for mortgage-backed agency securities are included when the time to delivery ismore than thirty business days.
3. Futures transactions are standardized agreements arranged on an exchange. All futurestransactions are included regardless of time to delivery.
4. Options transactions are purchases or sales of put and call options, whether arranged onan organized exchange or in the over-the-counter market, and include options on futurescontracts on U.S. Treasury and federal agency secunties.
NOTE, "n.a." indicates thai data are not published because of insufficient activity.
Digitized for FRASER http://fraser.stlouisfed.org/ Federal Reserve Bank of St. Louis
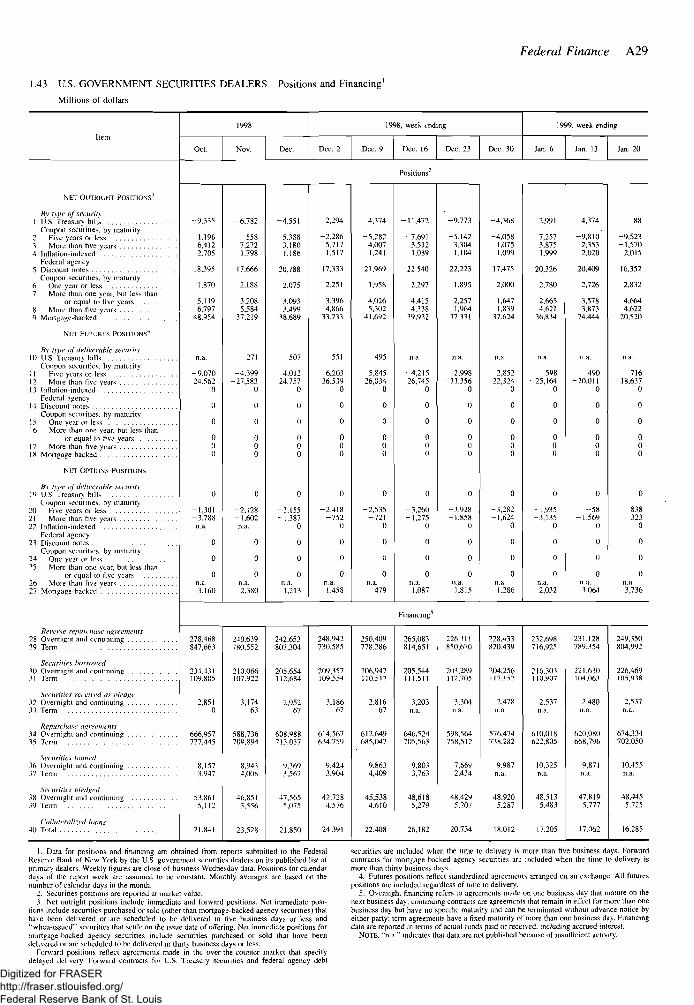
Federal Finance A29
1.43 U.S. GOVERNMENT SECURITIES DEALERS Positions and Financing1
Millions of dollars
Item
NET OUTRIGHT POSITIONS1
Bv type of security1 U.S. Treasury bills
Coupon securities, by maturity2 Five years or less3 More than five years4 Inflation-indexed
Federal agency5 Discount notes
Coupon securities, by maturity6 One year or less7 More than one year, but less than
or equal to live years8 More than five years9 Mortgage-backed
NET FUTURES POSITIONS4
Bv type of deliverable security10 U.S. Treasury bills
Coupon securities, by maturity11 Five years or less12 More than five years1.1 Inflation-indexed
Federal agency14 Discount notes
Coupon securities, by maturity15 One year or less1b More than one year, but less lhan
or equal lo live years17 More than five years18 Mortgage-backed
NET OPTIONS POSITIONS
Bv type of deliverable security19 U.S.'Treasury bills '.
Coupon securities, by maturity20 Five years or less21 More than five years22 Inflation-indexed
Federal agency23 Discount notes
Coupon securities, bv maturity24 One year or less25 More than one year, but less than
or equal lo five years26 More than five vears27 Mortgage-backed '
Reverse repurchase agreements28 Overnight and continuing29 Term
Securities borrowed30 Overnight and continuing31 Term
32 Overnight and continuing33 Term
Repurdutse agreements34 Overnight and continuing35 Terra '
Securities loaned36 Overnight and continuing17 Term
Securities pledged38 Overnight and continuing39 Term ."
Collateralized loans40 Total
1998
Oct. Nov. Dec.
1998, week ending
Dec. 2 Dec. 9 Dec. 16 Dec. 23 Dec. 30
1999. week end
Jan. 6 Jan. 13
ng
Jan. 20
Positions2
-9,335
1,1966,4122.705
18,395
1,870
5,1196,797
48.954
n.a.
-9.070-24.562
0
0
0
000
0
-1,301-3.788n.a.
0
0
0n.a.3.160
-6,782
5587,2721.798
17,666
2,188
3,2085,584
37,219
271
-4,399-27,583
0
0
0
000
0
-2.128-1,602n.a.
0
0
0n.a.2.380
-4,551
-5.3883,1801,186
20,788
2.075
3.093'499
38,689
507
-4,012-24,757
0
0
0
000
0
-3,155-1,387
0
0
0
0n.a.1,213
2,294
-2,2865,7171,517
17,333
2,251
3,3964,866
33,233
551
-6,203-26,539
0
0
0
000
0
-2,418-752
0
0
0
0n.a.1,458
4,374
-5,2824,0071.241
21,969
1,958
4,0265,302
41,692
495
-5,845-26,034
0
0
0
000
0
-2,535-721
0
0
0
0n.a.
479
-11,472
-7,6913.5121,089
22,540
2,297
4.4154,338
39,932
n.a.
-4,215-26,745
0
0
0
000
0
-3,260-1,275
0
0
0
0n.a.1,087
-9,773
-5,1423,3041,104
22,223
1,895
2,2571,964
37,331
n.a.
-2,998-23,356
0
0
0
000
0
-3,928-1,858
0
0
0
0n.a.1,815
-4,368
-4,0581,0751,099
17,475
2,000
1,6471,839
37,624
n.a.
-2,852-22,324
0
0
0
000
0
-3,282-1,624
0
0
0
0n.a.1,286
2,991
-7,2573.8751,999
20,326
2,780
2,6654,621
36,834
n.a.
-598-25,164
0
0
0
000
0
-1,935-3.135
0
0
0
0n.a.2,032
4,374
-9,8102,3532,020
20,409
2,726
3,5783,873
24,444
n.a.
-490-20,011
0
0
0
000
0
- 5 8-1,569
0
0
0
0n.a.3.064
88
-9,523-1,570
2,015
16,352
2,832
4,6644,622
20,520
n.a.
-716-18,637
0
0
0
000
0
838-323
0
0
0
0n.a.3,736
Financing5
278.468847,663
234,431109,805
2,8510
666,957777,445
8,1573 947
53.8615.112
21.841
240,639780,552
210,066107.922
3,17463
588,736709,894
8,9434,008
46,8513,556
23,528
242,653807,304
205.654112,684
2,95267
608.988713,037
9,3693,567
47.5655,075
21,850
248,942730,585
209,357109,554
3,18667
614,567634.759
9,4243,904
42,7284.576
24.391
250,409778.286
206,947110,517
2,81667
612,649685,047
9,8634,409
45,5384.610
22,408
265,083814,651
205,544111,511
3,203n.a.
646,524705,563
9,8033,763
48,6185,279
26,182
226.311850,670
203,289112,705
3,304n.a.
598,564758.512
7,6692,434
48.4295,207
20,734
228,433820,439
204,256117,152
2,478n.a.
576,474738,282
9,987n.a.
48,9205,287
18.012
232,698716,925
216.303110.907
2.537n.a.
610.018622,805
10,325n.a.
48,5135,483
17.205
231,128789,354
221,630104,063
2,480n.a.
620,080668.796
9,871n.a.
47,8195,777
17,062
249.350804,992
226,469105,938
2,537n.a.
674,334702.050
10,455n.a.
48.4455,725
16,285
1. Data for positions and financing are obtained from reports submitted to the FederalReserve Bank of New York by the U.S. government securities dealers on its published list ofprimary dealers. Weekly figures are close-of-business Wednesday data. Positions for calendardays of the report week are assumed to be constant. Monthly averages are based on thenumber of calendar days in the month.
2. Securities positions are reported at market value.3. Net outright positions include immediate and forward positions. Net immediate posi-
tions include securities purchased or sold (other than mortgage-backed agency securities) thatha\e been delivered or are scheduled to be delivered in five business days or less and"when-issued" securities thai settle on (he issue date of offering. Net immediate positions tormortgage-backed agency securities include securities purchased or sold that have beendelivered or are scheduled to be delivered in thirty business days or less.
Forward positions reflect agreements made in the over-the-counter market that specifydelayed delivery. Forward contracts for U.S. Treasury securities and federal agency debt
securities are included when the time to delivery is more than five business days. Forwardcontracts for mortgage-backed agency securities arc included when the time to delivery ismore than thirty business days.
4. Futures positions reflect standardized agreements arranged on an exchange. All futurespositions are included regardless of time to delivery.
5. Overnight financing refers to agreements made on one business day that mature on thenext business day: continuing contracts are agreements that remain in effect for more than onebusiness day bui have no specific maturity and can be terminated without advance notice byeither party; term agreements have a fixed maturity of more than one business day. Financingdata are reported in tenns of actual funds paid or received, including accrued interest.
NOTE, "n.a " indicates that data are not published because of insufficient activity.
Digitized for FRASER http://fraser.stlouisfed.org/ Federal Reserve Bank of St. Louis
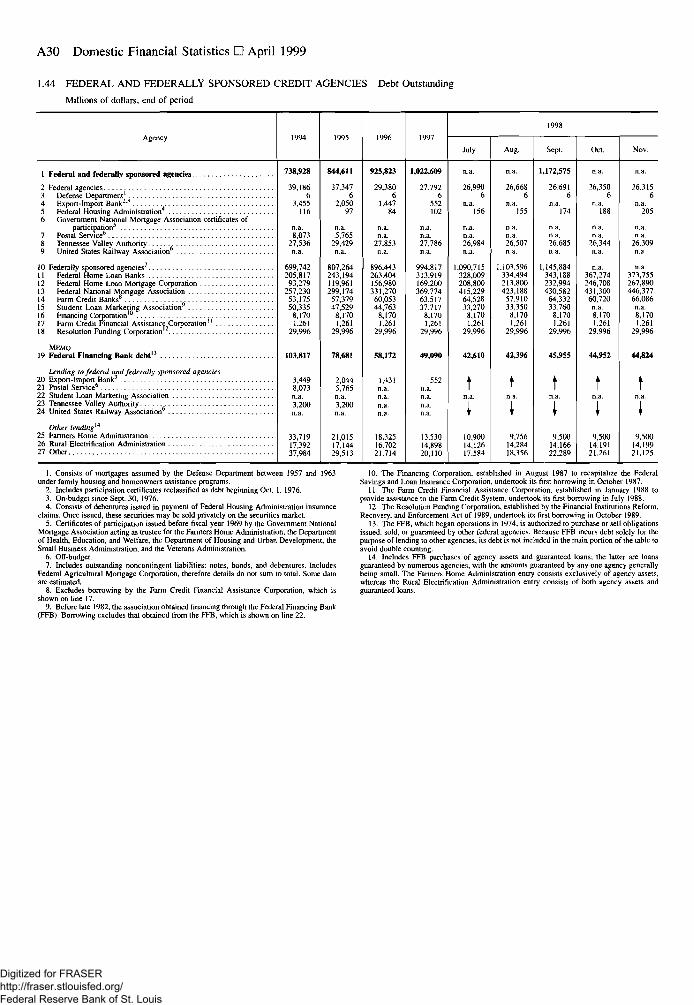
A30 Domestic Financial Statistics • April 1999
1.44 FEDERAL AND FEDERALLY SPONSORED CREDIT AGENCIES Debt Outstanding
Millions of dollars, end of period
Agency 1996
1998
July Aug. Sept. Oct.
1 Federal and federally sponsored agencies.
2 Federal agencies3 Defense Department1
4 Export-Import Bank2-1
Federal Housing AdministrationGovernment National Mortgage Association certificates of
participation5
Postal Service6 .Tennessee Valley AuthorityUnited States Railway Association6
10 Federally sponsored agencies7..1112131415161718
Federal Home Loan Banks .Federal Home Loan Mortgage Corporation .Federal National Mortgage AssociationFarm Credit Banks8
Student Loan Marketing Association9
Financing CorporationFarm Credit Financial Assistance Corporation" .Resolution Funding Corporation
MEMO19 Federal Financing Bank debt13
Lending to federal and federally sponsored agencies20 Export-Import Bank' ".21 Postal Service6
22 Student Loan Marketing Association23 Tennessee Valley Authority24 United States Railway Association6
Other lending'4
25 Farmers Home Administration26 Rural Electrification Administration27 Other
738,928
39,1866
3,455116
n.a.8,073
27,536n.a.
699,742205,81793,279
257,23053,17550,335
8,1701.261
29,996
103,817
3,4498,073n.a.3,200n.a.
33,71917,39237,984
844,611
37,3476
2,05097
5,76529,429n.a.
807,264243,194119,961299,174
57,37947,529
8,1701,261
29,996
78,681
2,0445,765n.a.3,200n.a.
21,01517,14429,513
925,823
29,3806
1,44784
n.a.n.a.
27,853n.a.
896.443263.404156,980331,27060,05344,763
8,1701.261
29,996
58,172
1,431n.a.
18,32516,70221.714
1,022,609
27,7926
552102
27,786n.a.
994,817313,919169,200369,77463,51737,7178,1701,261
29,996
49,090
552n.a.n.a.
13,53014,89820,110
26,9906
n.a.156
n.a.n.a.26,984n.a.
1,090,715328,009208,800415,229
64,52833,2708,1701,261
29,996
42,610
10,90014,12617.584
26,6686
n.a.26,507
1.103,596334,494213,800423,188
57,91033,350
8,1701,261
29,996
42,396
tn.a.
9,75614,28418,356
1,172475
26,6916
n.a.174
n.a.n.a.26,685
1,145,884343,188232,994430,582
64,33233,760
8.1701.261
29.996
45,955
tn.a.
9,50014,16622,289
26,3506
n.a.26,344n.a.
367,274246,708431,300
60,720n.a.8,1701,261
29,996
44,952
9,50014,19121,261
n.a.
26.3156
n.a.205
n.a.n.a.
26..1O9
373,755267,890446,377
66,086n.a.8.1701,261
29,996
44,824
tn.a.
9,50014,19921,125
1. Consists of mortgages assumed by the Defense Department between 1957 and 1963under family housing and homeowners assistance programs.
2. Includes participation certificates reclassified as debt beginning Oct. 1, 1976.3. On-budget since Sept. 30, 1976.4. Consists of debentures issued in payment of Federal Housing Administration insurance
claims. Once issued, these securities may be sold privately on the securities market.5. Certificates of participation issued before fiscal year 1969 by the Government National
Mortgage Association acting as trustee for the Farmers Home Administration, the Departmentof Health, Education, and Welfare, the Department of Housing and Urban Development, theSmall Business Administration, and the Veterans Administration.
6. Off-budget.7. Includes outstanding noncontingent liabilities: notes, bonds, and debentures. Includes
Federal Agricultural Mortgage Corporation, therefore details do not sum to total. Some dataare estimated.
8. Excludes borrowing by the Farm Credit Financial Assistance Corporation, which isshown on line 17.
9. Before late 1982, the association obtained financing through the Federal Financing Bank(FFB). Borrowing excludes that obtained from the FFB, which is shown on line 22.
10. The Financing Corporation, established in August 1987 to recapitalize the FederalSavings and Loan Insurance Corporation, undertook its first borrowing in October 1987.
11. The Farm Credit Financial Assistance Corporation, established in January 1988 toprovide assistance to the Farm Credit System, undertook its first borrowing in July 1988.
12. The Resolution Funding Corporation, established by the Financial Institutions Reform,Recovery, and Enforcement Act of 1989, undertook its first borrowing in October 1989.
13. The FFB, which began operations in 1974, is authorized to purchase or sell obligationsissued, sold, or guaranteed by other federal agencies. Because FFB incurs debt solely for thepurpose of lending to other agencies, its debt is not included in the main portion of the table toavoid double counting.
14. Includes FFB purchases of agency assets and guaranteed loans; the latter are loansguaranteed by numerous agencies, with the amounts guaranteed by any one agency generallybeing small. The Farmers Home Administration entry consists exclusively of agency assets,whereas the Rural Electrification Administration entry consists of both agency assets andguaranteed loans.
Digitized for FRASER http://fraser.stlouisfed.org/ Federal Reserve Bank of St. Louis
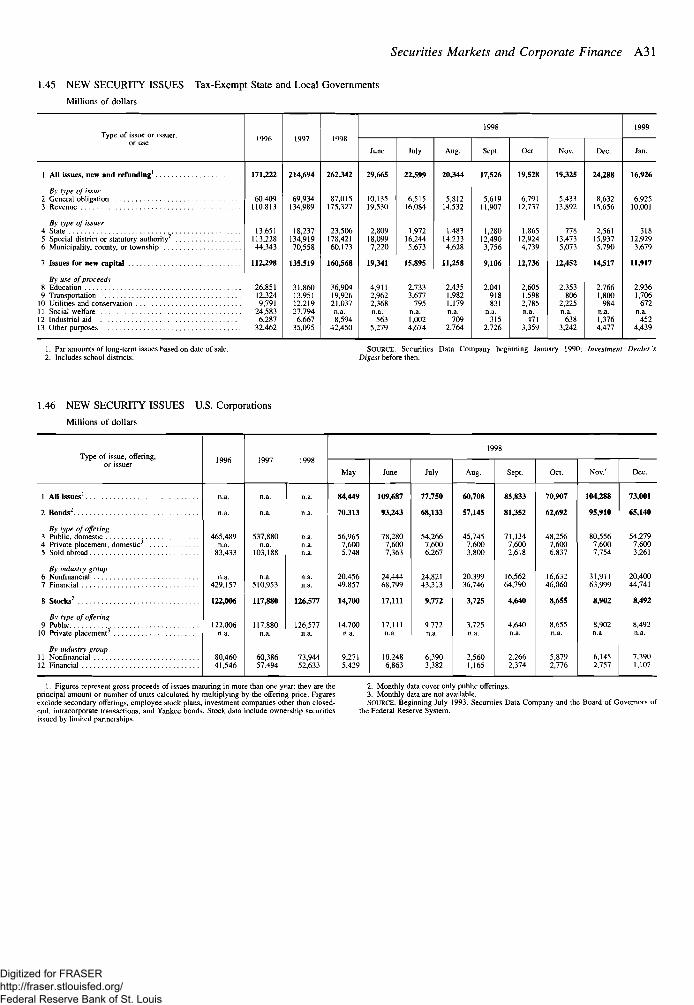
Securities Markets and Corporate Finance A31
1.45 NEW SECURITY ISSUES Tax-Exempt State and Local Governments
Millions of dollars
Type of issue or issuer,or use
July Aug. Sept. Dec.
1 All issues, new and refunding1 . . . .
B\ type of issue2 General obligation3 Revenue
By type of issuer4 State5 Special district or statutory authority3
6 Municipality, county, or township . .
7 Issues for new capital
By use of proceeds8 Education9 Transportation
10 Utilities and conservation11 Social welfare12 Industrial aid13 Other purposes
171,222
60.409110,813
13,651113,22844,343
112,298
26,85112,3249,791
24,5836,287
32.462
214,694
69,934134,989
18,237134,91970,558
135,519
31,86013,95112,21927.7946,667
35,095
262,342
87,015175,327
23,506178,42160,173
160,568
36.90419,92621,037n.a.8,594
42,450
29,665
10,13519,530
2,80918,0997,220
19341
4,9112,9622,368n.a.
5635,279
22,599
6.51516,084
1.97216,2445,673
15,895
2.7333.677795
n.a.1,0024,674
20,344
5,81214.532
1,48314,2334,628
11,258
2,4351,9821,179n.a.
7092,764
17,526
5,61911,907
1,28012,4903,756
9,106
2,041918831
n.a.315
2,726
19,528
6,79112,737
1,86512,9244,739
12,736
2,6051.5982,785n.a.
4713,359
19,325
5,43313,892
77813,4735,073
12,452
2.353806
2,225n.a.
6383,242
24288
8,63215,656
2,56115,9375.790
14,517
2,7661,800
984n.a.1,3764,477
16,926
6,92510,001
31812,9293,679
11,917
2,9361,706
672n.a.
4524,439
1. Par amounts of long-term issues based on date of sale.2. Includes school districts.
SOURCE. Securities Data Company beginning January 1990; Investment Dealer'sDigest before then.
1.46 NEW SECURITY ISSUES U.S. Corporations
Millions of dollars
Type of issue, offering,or issuer
May July Aug. Sept. Nov.'
1 All issues1
2 Bonds2
By type of offering3 Public, domestic4 Private placement, domestic-5 Sold abroad
By industry group6 Nonfinancial7 Financial
8 Stocks2
Bv type of offering9 Pubitc
10 Private placement3
By industry group11 Nonfinancia!12 Financial
n.a.
n.a.
465.489n.a.
83,433
429,157
122,006
80,46041,546
n.a.
n.a.
537,880n.a.
103,188
117,880
117,880n.a.
60,38657,494
n.a.
126,577
126,577n.a.
73,94452,633
84,449
70,313
56,9657,6005,748
20,45649,857
14,700
14,700
9,2715,429
109,687
93,243
78,2807,6007,363
24,44468.799
17,111
17,1
10,2486,863
77,750
68,133
54,2667,6006.267
24,82143,313
9,772
9,772n.a.
6,3903,382
60,708
57,145
45,7457,6003,800
20,39936,746
3,725
2,5601,165
85,833
81,352
71,1347,6002,618
16,56264,790
4,640
4,640
2,2662,374
70,907
62,692
48,2567,6006.837
16,63246,060
8,655
8,655
5,8792,776
104,288
95,910
80,5567,6007,754
31,91163,999
8,902
8,902
6,1452,757
73,001
65,140
54,2797,6003,261
20,40044,741
8,492
8,492n.a.
7,3901,102
1. Figures represent gross proceeds of issues maturing in more than one year: they are theprincipal amount or number of units calculated by multiplying by the offering price. Figuresexclude secondary offerings, employee stock plans, investment companies other than closed-end, intracorporate transactions, and Yankee bonds. Stock data include ownership securitiesissued by limited partnerships.
2. Monthly data cover only public offerings.3. Monthly data are not available.SOURCE. Beginning July 1993, Securities Data Company and the Board of Governors of
the Federal Reserve System.
Digitized for FRASER http://fraser.stlouisfed.org/ Federal Reserve Bank of St. Louis
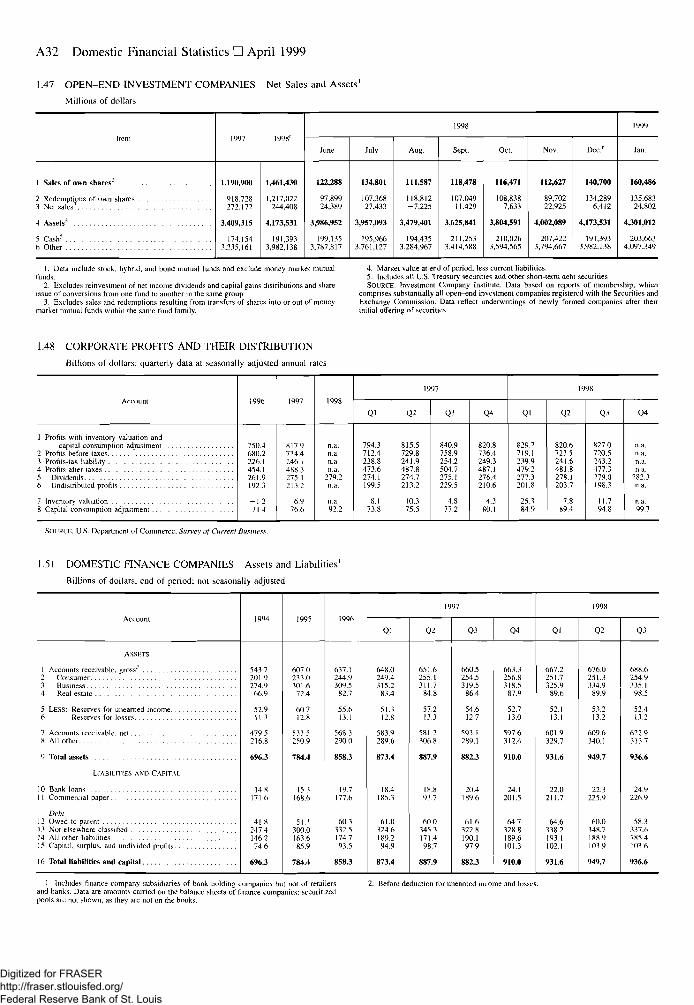
A32 Domestic Financial Statistics • April 1999
1.47 OPEN-END INVESTMENT COMPANIES Net Sales and Assets'
Millions of dollars
Item
1 Sales of own shares7
2 Redemptions of own shares3 Net sales3
4 Assets4
5 Cash5
6 Other
1997
1,190,900
918,728272.172
3,409,315
174,1543,235,161
1998'
1,461,430
1,217,022244,408
4,173,531
191,3933,982,138
1998
June
122,288
97,89924,389
3,986,952
199,1353,787,817
July
134,801
107,36827,433
3,957,093
195,9663,761,127
Aug.
111,587
118,812-7,225
3,479,401
194,4353,284,967
Sept.
118,478
107,04911.429
3,625,841
211,2533.414,588
Oct.
116,471
108,8387,633
3,804,591
210,0263,594,565
Nov.
112,627
89,70222,925
4,002,089
207,4223,794,667
Dec.'
140,700
134,2896,412
4,173,531
191,3933.982,138
1999
Jan.
160,486
135,68324,802
4301,012
203,6634,097,349
1. Data include stock, hybrid, and bond mutual funds and exclude money market mutualfunds.
2. Excludes reinvestmenl of net income dividends and capital gains distributions and shareissue of conversions from one fund to another in the same group.
3. Excludes sales and redemptions resulting from transfers of shares into or out of moneymarket mutual funds within the same fund family.
4. Market value at end of period, less current liabilities.5. Includes all U.S. Treasury securities and other short-term debt securities.
1.48 CORPORATE PROFITS AND THEIR DISTRIBUTION
Billions of dollars: quarterly data at seasonally adjusted annual rates
Account
1 Profits with inventory valuation andcapital consumption adjustment
2 Profits before taxes3 Profits-tax liability4 Profits after laxes
6 Undistributed profits
7 Inventory valuationS Capita) consumption adjustment
1996
750.4680.2226.1454.1261.9192.3
- 1 271 4
1997
817.9734.4246.1488.3275 1213.2
6.976.6
1998
n.a.n.a.n.a.n.a.
279.2n.a.
n.a.92.2
1997
Ql
794.3712.4238.8473.6274.1199.5
8.173.8
Q2
815.5729.8241.9487.8274.7213.2
10.375.5
Q3
840.9758.9254.2504.7275.1229.5
4.877.2
Q4
820.8716.4249.3487.1276.4210.6
4.380.1
1998
Ql
829.2719.1239.9479 2277.3201.8
25.3849
Q2
820.6723.5241.6481.8278.1203.7
7.889.4
Q3
827.0720.5243.2477.3279.0198.3
11.794.8
Q4
n.a.n.a.n.a.n.a.
282.3n.a.
n.a.99.7
SOURCE. U.S. Department of Commerce, Survey of Current Business.
1.51 DOMESTIC FINANCE COMPANIES Assets and Liabilities1
Billions of dollars, end of period: not seasonally adjusted
ASSETS
1 Accounts receivable, gross'2 Consumer3 Business4 Real estate
5 LESS: Reserves for unearned income6 Reserves for losses
7 Accounts receivable, net8 All other
9 Total assets
LiABim its AND CAPITAL
10 Bank loans11 Commercial paper
Debt12 Owed to parent13 Not elsewhere classified14 All other liabilities15 Capital, surplus, and undivided profits
16 Total liabilities and capital
541.7201.9274.966.9
5r9113
479.5216.8
696.3
14.8171.6
41.8247.4146.274.6
696.3
607.0233.0301.672.4
60.712.8
533.5250.9
784 4
15.3168.6
51.1300.0163.685.9
784.4
637.1244.9309.582.7
55.613.1
568 32900
858 3
19.7177.6
60.3332.5174.793.5
858.3
1997
Ql
648.0249 4315.2
83.4
51.312.8
583.9289.6
873.4
18.4185.3
61.03246189.294.9
873.4
Q2
651.6255.1311.7
84.8
57.213.3
581.2306.8
887.9
18.8193.7
60.0345.3171.498.7
887.9
Q3
660.5254.5319.5
86.4
54.612.7
593.1289.1
882.3
20.4189.6
61.6322.8190.197.9
882.3
Q4
663.3256.8318.5
87.9
52.713.0
597.6312.4
910.0
24.1201.5
64.7328.8189.6101.3
910.0
1998
Ql
667.2251.7325.9
89.6
52.113.1
601.9329.7
9316
22.0211.7
64.6338.2193.1102.1
931.6
Q2
676.0251.3334.989.9
53.213.2
609.6340.1
949 7
22.3225.9
60.0348.7188.9103.9
949.7
Q3
688.6254 9335.198.5
52.413.2
622.9313.7
936 6
24.9226.9
58.3337.6185.4103.6
936.6
1. Includes finance company subsidiaries of bank holding companies but not of retailersand banks. Data are amounts carried on the balance sheets of finance companies; securitizedpools are not shown, as they are not on the books.
2. Before deduction for unearned income and loss
Digitized for FRASER http://fraser.stlouisfed.org/ Federal Reserve Bank of St. Louis
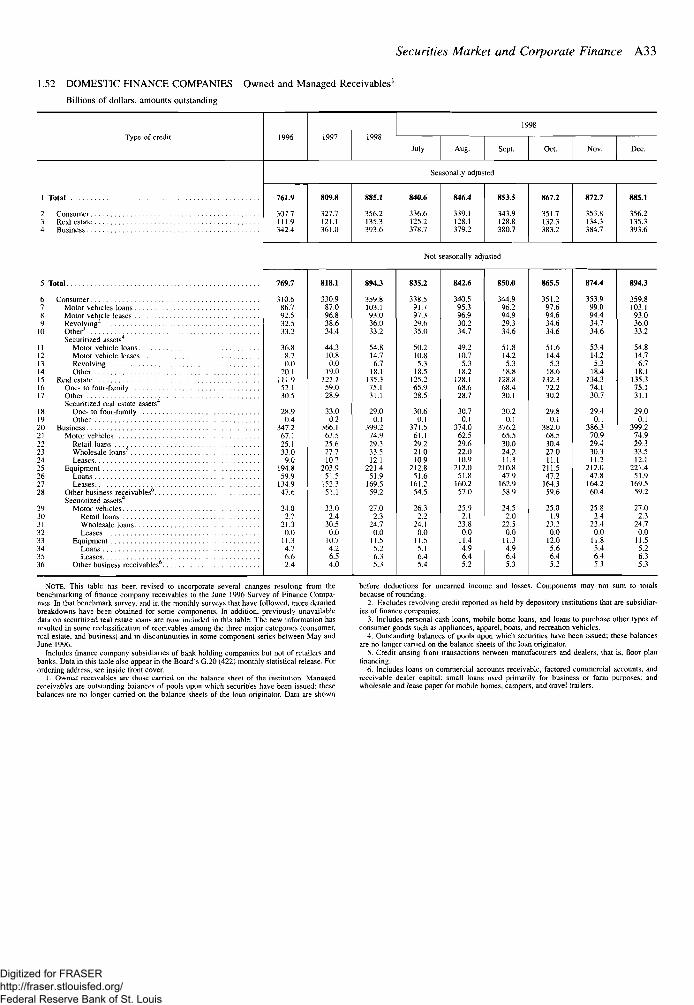
Securities Market and Corporate Finance A33
1.52 DOMESTIC FINANCE COMPANIES Owned and Managed Receivables'
Billions of dollars, amounts outstanding
Type of credit
I Total
3 Real estate
5 Total
6 Consumer
8 Motor vehicle leases9 Revolving"
10 Other3
Securitized assets4
12 Motor vehicle leases
14 Other15 Real estale16 One- to four-familv17 Other
Securitized real estate assets4
19 Other
21 Motor vehicles
23 Wholesale loans5
25 Equipment
27 Leases28 Other business receivables6
Securiti2ed assets4
29 Motor vehicles30 Retail loans
32 Leases
35 Leases.36 Other business receivables6
1996 1997 1998
1998
July Aug. Sept. Oct. Nov. Dec.
Seasonally adjusted
761.9
307 7111.9342.4
809.8
327 7121.1361.0
885.1
356 2135.3393.6
840.6
336 6125.2378.7
846.4
339.1128.1379.2
853.5
343 9128.8380.7
867.2
351 7132.3383.2
872.7
353 8134.3384.7
885.1
356 2135.3393.6
Not seasonally adjusted
769.7
310.686.792.532.533.2
36.88.70.0
20.1111.952.130 5
28.90.4
347 267.125.133.090
194.859.9
134.947.6
24.02.7
21 30.0
11.34.76.62.4
818.1
330.987.096.838.634.4
44.310.80.0
19.0121.159.028.9
33.00.2
366 163.525.627.710 2
203.951.5
152.351.1
33.02.4
30 50.0
10.74.26.54.0
894.3
359.8103.193.036.033.2
54.814.76.7
18.1135.375.131 1
29.00.1
399 274.929.333.512 1
221.451.9
169.559.2
27.02.3
24 70.0
11.55.26.35.3
835.2
336.591.797.329.635.0
50.210.85.3
18.5125.265.928 5
30.60.1
371 561.129.221.010 9
212.851.6
161.254.5
26.32.2
24 10.0
11.55.16.45.4
842.6
340.595.396.930.234.7
49.210.75.3
18.2128.168.628.7
30.70.1
374.062.529.622.010.9
212.051.8
160.257.0
25.92.1
23.80.0
11.44.96.45.2
850.0
344.996.294.929.334.6
51.814.25.3
18.8128.868.430 1
30.20.1
376 265.530.024.2
210.847.9
162.958.9
24.52.0
22.50.0
11.34.96.45.3
865.5
351.297.694.634.634.6
51.614.45.3
18.6132.372.230 2
29.80.1
382 068.530.427.011 1
211.547.2
164.359.6
25.01.9
23.20.0
12.05.66.45.2
874.4
353.999.094.434.734.6
53.414.25.3
18.4134.374.130.7
29.40.1
386.370.929.430.311.2
212.047.8
164.260.4
25.82.4
23.40.0
11.85.46.45.3
894.3
359.8103.193.036.033.2
54.814.76.7
18.1135.375.131.1
29.00.1
399.274.929.333.512.1
221.451.9
169.559.2
27.02.3
24.70.0
11.55.26.35.3
NOTE. This table has been revised to incorporate several changes resulting from thebenchmarking of finance company receivables to the June 1996 Survey of Finance Compa-nies. In that benchmark survey, and in the monthly surveys ihat have followed, more detailedbreakdowns have been obtained for some components. In addition, previously unavailabledata on securitized real eslale loans are now included in this table. The new information hasresulted in some ^classification of receivables among the three major categories (consumer,real estate, and businessj and in discontinuities in some component series between May andJune 1996.
Includes finance company subsidiaries of bank holding companies but not of retailers andbanks. Data in this table also appear in the Board's G.20 (422) monthly statistical release. Forordering address, see inside front cover.
1. Owned receivables are those carried on the balance sheet of the institution. Managedreceivables are outstanding balances of pools upon which securities have been issued; thesebalances are no longer carried on the balance sheets of the loan originator. Data are shown
before deductions for unearned income and losses. Components may not sum to totalsbecause of rounding.
2. Excludes revolving credit reported as held by depository institutions that are subsidiar-ies of finance companies.
3. Includes personal cash loans, mobile home loans, and loans to purchase other types ofconsumer goods such as appliances, apparel, boats, and recreation vehicles.
4. Outstanding balances of pools upon which securities have been issued; these balancesare no longer earned on the balance sheets of the loan originator.
5. Credit arising from transactions between manufacturers and dealers, that is, floor planfinancing.
6. Includes loans on commercial accounts receivable, factored commercial accounts, andreceivable dealer capital; small loans used primarily for business or farm purposes; andwholesale and lease paper for mobile homes, campers, and travel trailers.
Digitized for FRASER http://fraser.stlouisfed.org/ Federal Reserve Bank of St. Louis
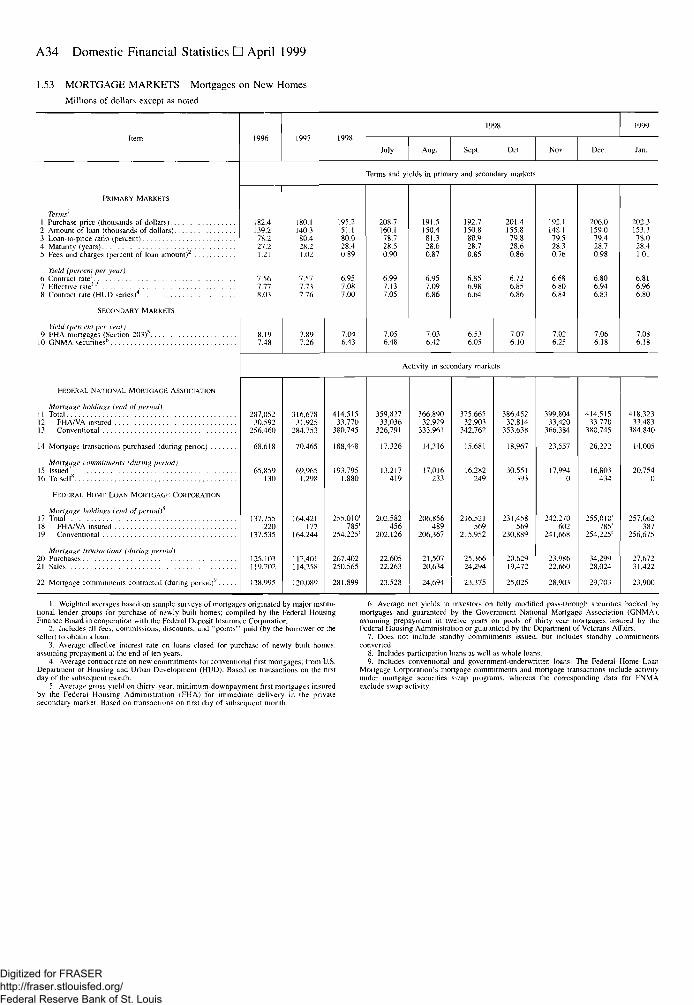
A34 Domestic Financial Statistics • April 1999
1.53 MORTGAGE MARKETS Mortgages on New Homes
Millions of dollars except as noted
PRIMARY MARKETS
Terms1
1 Purchase price (thousands of dollars)2 Amount of loan (thousands of dollars)3 Loan-lo-pnce ratio (percent)4 Maturity (years)5 Fees and charges (percent of loan amount)
Yield {percent per year)6 Contract rate7 Effective rale1 '8 Contracl rale (HUD series)4
SECONDARY MARKETS
Yield (percent per \ear]9 FHA mortgages (Section 203)5
10 GNMA securities6
FEDERAL NATIONAL MORTGAGE ASSOCIATION
Mortgage holdings (end of periodi1 1 Total12 FHA/VA insured
14 Mortgage transactions purchased (during period)
Mortgage commitments (during period)15 Issued7
16 To sell8
FEDERAL HOME LOAN MORTGAGE CORPORATION
Mortizcwe htMin^b (end t>f period?17 Total18 FHA/VA insured19 Conventional
Mortgage transactions (during period)20 Purchases21 Sales
22 Mortgage commitments contracted (during period)9
182.4139.278.227.21.21
7.567.778.03
8.197.48
180.1140.380.428.21.02
7.577.737.76
7.897.26
195.2151.180.028.40.89
6.957.087.00
7.046.43
1998
July Aug. Sept. Oct.
Terms and yields in primary and secondary markets
208.7160.178.728.50.90
6.997.137.05
7.056.48
191.5150.481.328.60.87
6.957.096.86
7.036.42
192.7150.880.928.70.85
6.856.986.64
6.536.05
201.4155.879.828.60.86
6.726.856.86
7.076.10
Nov.
192.1148.179.528.30.76
6.686.806.84
7.026.25
Dec.
206.0159.079.428.70.98
6.806.946.83
7.066.18
1999
Jan.
202.3153.378.028.41.01
6.816.966.80
7.086.18
Activity in secondary markets
287,05230,592
256,460
68,618
65,859130
137,755220
137,535
125,103119,702
128,995
316,67831,925
284,753
70,465
69,9651 298
164,421177
164.244
117,401114,258
120,089
414.51533.770
380.745
188,448
193.7951 880
255.010'785'
254.225'
267.402250.565
281.899
359,82733,036
326,791
17,326
13.217419
202.582456
202,126
22.60522.263
23,528
366,89032 929
333.961
14,316
17.016233
206.856489
206,367
21.50720.634
24,694
375,66532.903
342,762
15,681
16.282249
216.521569
215,952
25.36624,294
23,375
386,45232,814
353,638
18,967
30.551193
231,458569
230,889
20.62919,472
25,025
399,80433,420
366,384
23,557
17,9940
242.270602
241,668
23.98622,660
28,903
414,515?3.770
380,745
26,222
16,803434
255,010'785'
254,225'
34,29928,024
29,703
418,3233.3,483
384,840
14,005
20,7540
257,062387
256,675
27,67231,422
23,900
1. Weighted averages based on sample suncys uf mortgages originated by major institu-tional lender groups for purchase of newly built homes; compiled by the Federal HousingFinance Board in cooperation with the Federal Deposit Insurance Corporation.
2. Includes all fees, commissions, discounts, and "points" paid (by the borrower or theseller) to obtain a loan.
3. Average effective interest rate on loans closed for purchase of newly built homes,assuming prepayment a; the end of ten years.
4. Average contract rate on new commitments for conventional first mortgages; from U.S.Department of Housing and Urban Development (HUD). Based on transactions on the firstday of the subsequent month.
5. Average gross yield on thirty-year, minimum-downpayment first mortgages insuredby the Federal Housing Administration iFHA) for immediate delivery in the privatesecondary market. Based on transactions on first day of subsequent month.
6. Average net yields to investors on fully modified pass-through securities backed bymortgages and guaranteed by the Government National Mortgage Association (GNMA),assuming prepayment in twelve years on pools of thirty-year mortgages insured by theFederal Housing Administration or guaranteed by the Department of Veterans Affairs.
7. Does not include standby commitments issued, but includes standby commitmentsconverted.
8. Includes participation loans as well as whole loans.9. Includes conventional and government-underwritten loans. The Federal Home Loan
Moitgage Corporation's mortgage commitments and mortgage transactions include activityunder mortgage securities ssvap programs, whereas the corresponding data for FNMAexclude swap activity.
Digitized for FRASER http://fraser.stlouisfed.org/ Federal Reserve Bank of St. Louis
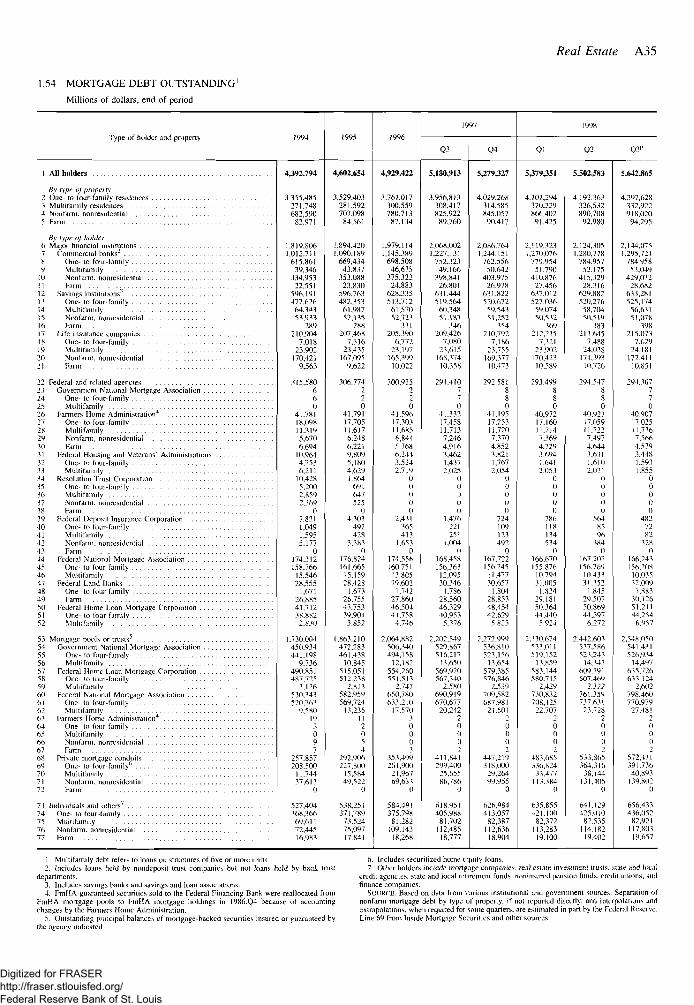
Real Estate A35
1.54 MORTGAGE DEBT OUTSTANDING'
Millions of dollars, end of period
Type of holder and property 1995
Q3 Q4 Ql Q3P
1 All holders
Bv type oj property2 One- lo four-family residences3 Mullifamily residences4 Nonfarm. nonresidential5 Farm
By type of holder6 Major financial institutions . .7 Commercial banks2
8 One- to fo'ir-famtly . . . .9 Mullifamily
10 Nonfarm, nonresidential11 Farm12 Savings institutions^ . . . .13 One- lo four family . . . .14 Multifamily15 Nonfarm, nonresidential16 Farm17 Life insurance companies .18 One- to four-family . . . .19 Mullifamily20 Nonfarm, nonresidential21 Farm
22 Federal and related agencies23 Government National Mortgage Association . . .24 One- to four-family25 Multifamily26 Farmers Home Administration4
27 One- to four-family28 Multifamily29 Nonfarm. nonresidentiui30 Farm31 Federal Housing and Veterans' Administrations32 One to four-family33 Multifamily34 Resolution Trust Corporation35 One- to tour-family36 Multifamily37 Nonfarm. nonresidential38 Farm39 Federal Deposit Insurance Corporation40 One- to four-family41 Multifamily42 Nonfatm. nonresidential43 Farm44 Federal National Mortgage Association45 One- to four-family46 Multifamily47 Federal Land Banks48 One- to four-family49 Farm50 Federal Home Loan Mortgage Corporation . . . .51 One- lo four-family52 Muhtfamily
53 Mortgage pools or trusts5
54 Government National Mortgage Association . . .55 One- to four-family56 Multifamily57 Federal Home Loan Mortgage Corporation . . . .58 One- lo four-family59 Muliifjinily60 Federal National Mortgage Association61 One- to four-family62 Multifamily63 Farmers Home Administration4
64 One- to four-family65 Multifamily66 Nonfarm. nonresidenlial67 Farm68 Private mortgage conduits69 One- to four-family'1
70 Multifamily71 Nonfarm. nonresidential72 Farm
73 Individuals and others7 . . .74 One- to rbiir-fainily . . . .75 Mullifamily76 Nonfarm. nonresidential77 Farm
4,392,794
3,355,485271,748682,590
82,971
1.819.8061.012.711
615,86139,346
334,95322,551
596,191477,626
64.34353.933
210,9047,01823,902170,4219,563
315.580660
41,78118,09811.3195,6706,69410,9644,7536,21110,4285,2002.8592.369
07,8211,0491,5955,177
0174.312158,76615,54628,5551,671
26.88541.7123S.8822.830
1.730.004450,934441,1989,736
490,851487.725
3.126530,343520,7639,580
19
097
257.857208,50011,74437.613
0
527,404368,36669,61172,44516,983
4,602.654
3,529,403281,592707,09884,561
1,894.4201,090.189669,43443,837353.08823,830
596.763482,35361.98752.135
288207.468
7.31623,435167.0959.622
306.774220
41.79117,70511.6176.2486,2219,8095,1804.6291.864691647525
04,303492428
3.3830
176,824161,66515,15928,4281,673
26.75543.75339.9013.852
1.863,210472.283461,43810.845
515.051512.238
2.813582.959569,72413,235
II
054
292,906227,80015,58449,522
0
538,251371,78973.52475.09717.841
4,929,422
3.761.017300.559780.71387,134
1,979.1141,145,389698,50846,675375,32'24.883
628.335513.71261,57052.723
331205,3906,77223,197165,39910,022
300,935
041.59617,30!11.6856,8415.7686.2443,5242,719
00000
2,431365413
1,6530
174.556160.75113.80529,6021,742
27.86046,50441,7584,746
2.064,882506,340494,15812,182
554,260551,5132.747
650,780633,21017,570
30001
353.499261,90021,96769,633
0
584,491375.79881,282109,14318,268
5,180,913
3,956,813308,417825,92289,760
2,068,0021.227,131752,32349.166398,84126,801
631,444519,56460,34851.187
346209.4267,08023,615168,37410,358
291,410770
41,33217,45811,7137,2464,9163,4621,4372,025
00300
1,476221251
1.0040
168,458156,36312,09530,3461,786
28,56046,32940,9535.376
2,202,549529,867516,21711.650
569,920567,3402,580
690,919670,67720,242
20002
411,841299.40025.65586,786
0
618,951405.98881,702112,485
18,777
5,279,327
4,029.268314,585845,057
90,417
2,086,7641,244.151
762,55650,642
403,97526,978
631,822520,672
59,54351,252
154210,792
7.18623,755
169.37710.473
292,581
041,19517,25311,7207.3704,8523,8211,7672.054
00000
724109123492
0167.V2156,245
11.47730,657
1.80428,85348,45442.629
5.825
2.272,999536,810523,156
13,654579,385576.846
2.539709,582687.981
21.601
0002
447,219318,000
29,26499.955
0
626,984413,057
82,387112,63618.904
5,379,351
4.101.294320.229866,40291.425
2,119.3231,270 076779,95451,790
410,87627,456
637,012527,03659.07450.532
369212,235
7,32123,902170,42310.589
293.499880
40,97217.16011.7147.3694.7293.6941.6412.051
00t)00
786118134534
0166.670155.87610.79431,0051.824
29,18150.36444 4405.924
2.330,674533,011519,15213,859
583.144580.7! 5
2.429730.832708.12522,707
0002
483.685.1.36,82433,477113.384
0
635,855421,10082,172I 13,28319.100
5.502,583
4.192.363326,532890,70892,980
2,124,3051,280,778784.95752.175415,32928.316629.882520.27658.70450,519
383213.6457.48824,038171,39310.726
294,547880
40,92117,05911,7227,4974,6443,6311,6102,021
00000
56485963840
167,202156,76910.43331,3521,845
29,50750,86944.5976.272
2.442,603537.586523.24314.343
609,791607.4692.322
761.359737.63123,728
2000
533,865364,31638,144131,405
0
641,129425.01082.535114,18219,402
5,642,865
4,297,628332,922918,02094.295
2,144,0751,295.721784.95853,049
429.03228.682633,281525.17456.63151.078
398215,0737,62924,181172,41110.851
294.307770
40.90717 02511.7367,5664,5793,4481,5931,855
00000
4827282
3280
166,243156,20810,03532,0091,883
30,12651.21144,2546.957
2,548,050541,431526,93414,497
635,726633.1242.602
798.460770,97927,48!
0I)0
572,4 II391.73640,893139,802
0
656,433436.05282,921117,80319,657
1 Multifamily debt refers to loans on structures of live or more units.2. includes loans held hy nondeposil trust companies but not loans held by bank trust
departments.3. Includes savings banks and savings and loan associations.4. FmHA-guaranteed securities sold to the Federal Financing Bank were reallocated from
FmHA mortgage pools lo FmHA mortgage holdings in 1986:Q4 because of accountingchanges by the Fanners Home Administration.
5. Outstanding principal balances of mortgage-backed securities insured or guaranteed bythe agency indicated.
6. Includes securilized home equity loans.7. Other holders include mortgage companies, real estate investment trusts, state and local
credit agencies, state and local retirement funds, noninsured pension funds, credit unions, andfinance companies.
SOURCE. Based on data from various institutional and government sources. Separation ofnonfarm mortgage debt by type of property, if not reported directly, and interpolations andextrapolations, when required for some quarters, are estimated in part by the Federal Reserve.Line 69 from Inside Mortgage Securilies and other sources
Digitized for FRASER http://fraser.stlouisfed.org/ Federal Reserve Bank of St. Louis
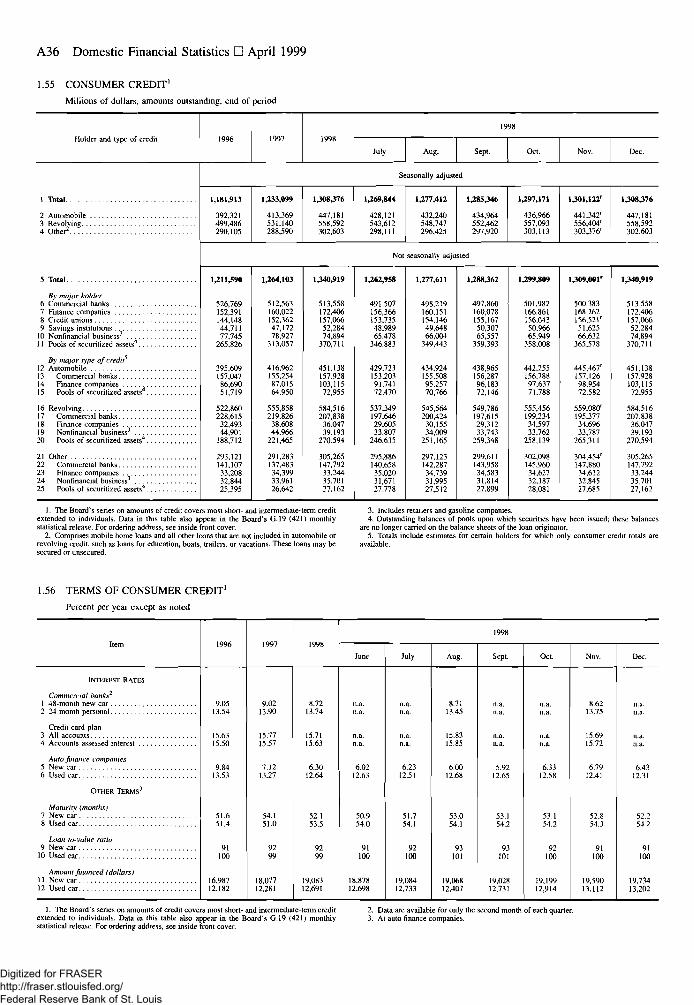
A36 Domestic Financial Statistics • April 1999
1.55 CONSUMER CREDIT1
Millions of dollars, amounts outstanding, end of period
Holder and type of credit 1996 1991
July Aug. Sepl. Oct.
1 Total
2 Automobile3 Revolving. .4 Other2
5 Total
By major holder6 Commercial banks7 Finance companies8 Credit unions9 Savings institutions
10 Nonfinancial business"11 Pools of securitized assets4
By major type of credit12 Automobile13 Commercial banks14 Finance companies15 Pools of securitized assets4
16 Revolving17 Commercial banks18 Finance companies19 Nonrinancial business3
20 Pools of securitized assets
21 Other22 Commercial banks23 Finance companies24 Nonfinancial business3
25 Pools of securitized assets4
1,181,913
392,321499,486290.105
1,211,590
526,769152,391144,14844,71177,745265,826
395,609157,04786,69051,719
522,860228,61532,49344,901188,712
293,121141,10733,20832,84425,395
Seasonally adjusted
1,233,099
413,369531,140288,590
1,308,376
447,181558,592302,603
1,269,844
428,121543,612298,111
1,277,412
432,240548,747296,425
1,285,346
434,964552,462297,920
1,297,171
436,966557,093303,113
1,301,122'
441,342'556,404'303,376'
Not seasonally adjusted
1,264,103
512,563160,022152,36247,17278.927313,057
416,962155,25487,01564,950
555,858219,82638,60844.966221,465
291,283137,48334,39933,96126,642
1,340,919
513,558172,406157,06652,28474,894
370,711
451,138157.928103,11572,955
584,516207,838
36,04739.193
270.594
305,265147,79233,24435.70127,162
1,262,958
491.507156,366153,73548.98965,478346,883
429,723153.20391.74172.470
537,349197,64629,60533,807246.635
295,886140,65835,02031,67127,778
1,277,611
498.219160,151154.14649,64866,004349,443
434,924155,50895,25770,766
545,564200,42430,15534,009251,165
297,123142,28734,73931,99527,512
1,288,362
497,860160,078155,16750,30765,557359,393
438,965156,28796,18372,146
549,786197,61529,31233,743
259,348
299,611143,95834,58331,81427,899
1,299,809
501,982166,861156,04350,96665,949358,008
442,255156,78897,63771,788
555,456199,23434,59733,762
258,139
302,098145,96034,62732,18728,081
1,309,001'
500,383168,262156,521'51,62566,632365,578
445,467'157,12698,95472,582
559,080'195,37734,69633,787
265,311
304,454'147,88034,61232,84527,685
1,308,376
447,181558,592302,603
1,340,919
513,558172,406157,06652.28474,894
370,711
451.138157.928103,11572.955
584,516207,838
36,04739,193
270,594
305.265147,79233,24435,70127,162
1. The Board's series on amounts of credit covers most short- and intermediate-term creditextended to individuals. Data in this table also appear in the Board's G.19 (421) monthlystatistical release. For ordering address, see inside front cover.
2. Comprises mobile home loans and all other loans that are not included in automobile orrevolving credit, such as loans for education, boats, trailers, or vacations. These loans may besecured or unsecured.
3. Includes retailers and gasoline companies.4. Outstanding balances of pools upon which securities have been issued; these balances
are no longer carried on the balance sheets of the loan originator.5. Totals include estimates for certain holders for which only consumer credit totals are
available.
1.56 TERMS OF CONSUMER CREDIT1
Percent per year except as noted
July Aug. Sept. Oct.
INTEREST RATES
Commercial banks1 48-monlh new car2 24-month personal
Credit card plan3 All accounts4 Accounts assessed interest . .
Auto finance companies5 New car6 Used car
OTHER TERMS'
Maturity (months)7 New car8 Used car
Loan-to-value ratio9 New car
10 Used car
Amount financed {dollars)11 New car12 Used car
9.0513.54
15.6315.50
9.8413.53
51.651.4
91100
16,98712,182
9.0213.90
15.7715.57
7.1213.27
54.151.0
9299
18,07712,281
8.7213.74
15.7115.63
6.3012.64
52.153.5
9299
19,08312,691
n.a.n.a.
6.0212.63
50.954.0
91100
18,87812,698
n.a.n.a.
n.a.n.a.
6.2312.51
51.754.1
92100
19,08412,733
8.7113.45
15.8315.85
6.0012.68
53.054.1
93101
19.06812.407
5.9212.65
53.154.2
93101
19,02812,731
n.a.n.a.
6.3312.58
53.154.2
92100
19,19912,914
8.6213.75
15.6915.72
6.7912.41
52.854.3
91100
19,59013,112
n.a.n.a.
n.a.n.a.
6.4312.31
52.254.2
91100
19,73413,202
1. The Board's series on amounts of credit covers most short- and intermediate-term creditextended to individuals. Data in this table also appear in the Board's G.19 (421) monthlystatistical release. For ordering address, see inside front cover.
2. Data are available for only the second month of each quarter.3. At auto finance companies.
Digitized for FRASER http://fraser.stlouisfed.org/ Federal Reserve Bank of St. Louis
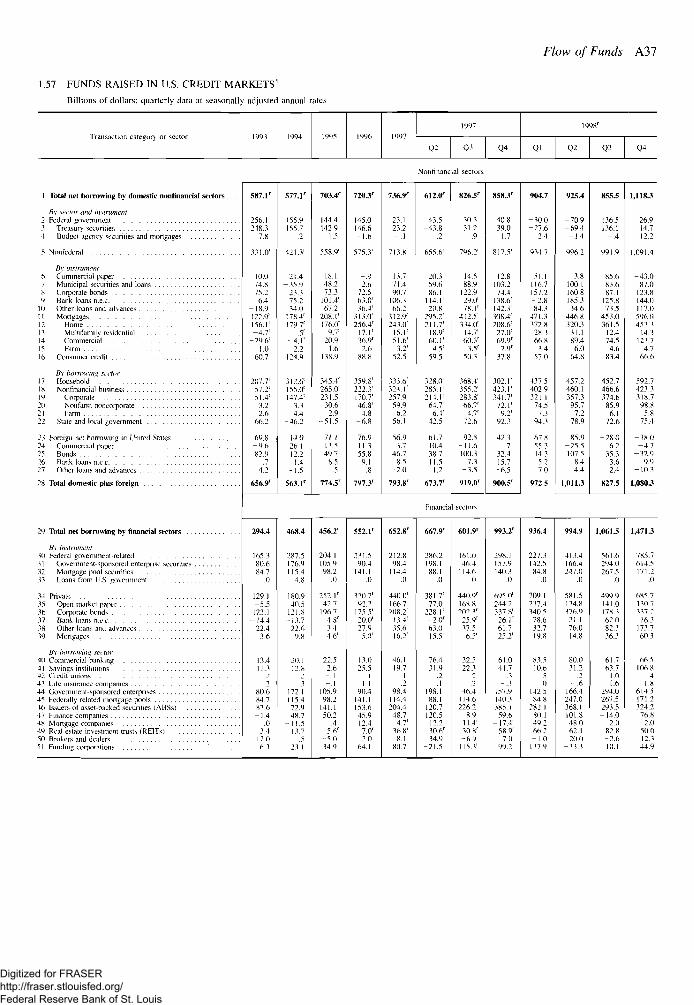
Flow of Funds A37
1.57 FUNDS RAISED IN US. CREDIT MARKETS'
Billions of dollars; quarterly data at seasonally adjusted annual rates
Transaction category or sector
1 T o t a l n e t b o r r o w i n g b y d o m e s t i c n o n t i n a n c i a l s e c t o r s . . . .
By sector and instrument1 Federal "overmnent1 Treasury securities4 Budget agency securities and mortgages
5 Nonfederal
By instrument6 Commercial paper7 Municipal securities and loansS Corporate bondsl) Bank loans n.e.e
10 Other loans and advances11 Mortgages12 Home13 Multifamily residential14 Commercial15 Farm16 Consumer credit
By horrtnvini! .sector17 Household18 Nonfinancial business19 Corporate . . .""0 Noiifann noncorporate21 Farm22 Stale and local government
2} Foreign net borrowing in United States24 Commercial paper25 Bonds16 Bank loans n e e21 Other loans and advances
28 Total domestic plus foreign
29 Total net borrowing by financial sectors
By instrument30 Federal government-related31 Government-sponsored enterprise securities32 Mortgage pool securities33 Loans from US. government
34 Private35 Open market paper3b Corporate bonds37 Bank loans n.ec38 Other loans ami advances39 Mortgages
Bv bt'rrawing serlor40 Commercial banking4] Savings institutions42 Credit unions43 Lite insurance companies44 Government-sponsored enteiprises45 Federally related mortgage pools4d Issuers of asset-hacked securities (ABSs)47 Finance companies48 Mortgage companies44 Real estate investment trusts (RElTs)50 Brokers and dealers11 Funding corporations '
1993
587.1'
256.1248.3
7.8
331.0'
10.074.875.26.4
-18.9122.9'156.1'- 4 . 7 '
-29 .6 '1.0
60.7
207.7'57.2r
51.4'3.22.6
66.2
69 8-9 .682.9
.7-4 .2
656.9r
294.4
165.380.684.7
.0
129.1-5.5123.1
-14.422.4
3.6
13.411.3
.21
so!&84.7R3.6-1.4
.03.4
12 06.3
1994
S77.I'
155.9155.7
.2
421.3'
21.4-35.9
23.375.234.0
178 4'179.7'
.5'- 4 . 1 '
2.2124.9
312.6'155.0'147.4'
3 34.4
-J6.2
- 14.0-26 1
12.2! 4
-1.5
563.1'
468.4
287.5176.9115.4-4 .8
180.940.5
121.8-13.7
22.69.8
20.112.8
23
17Z 1115 472.948.7
- 1 1 513 7
.521.1
1995
703.41"
144.4142.9
1.5
558.9'
18.1-48.2
73.3101.4'67.2
208.1'176.0'
9.7'20.9'
1.6138.9
345.4'265.0'2.31.5'
30.6'2.9
-51.5
71.113.549.7
8.5- .5
774.51"
456.2r
204.1105 498.2
.0
252. l r
42.7196.7
4.8'3.44.6'
22.52.6- l-.1
105.998.2
141.150.2
.45.6'
-5 .034.9
1996
720.3'
145.0146.6-1.6
575.3'
_ g
2.b72.563.0'36.4'
313.0'256.4'
17.1'36.9'
2.688.8
359.8'222.3'170.7'46.8'4.8
-6.8
76.911.355.89.1
.8
797.3r
552.1'
231.590.4
141.1.0
320.7'92.2
175.5'20.0'27.9
5.0'
13.025.5
11 1
90.4141.1153.645.912.47.0'
-2.064.1
1497
736.9'
23.123.2
- • '
713.8'
13.771.490.7
106.3'66.2'
312.9'243.0'
15.1'51.6'
3.2'52.5
333.6'
m r257.9'59.9'
6.2'56.1
56.91.7
46.785
-2 .0
793.8'
652.8'
212.898.4
114.4.0
440.0'166 7208.2'
114'35.616.2'
46.119.7
12
98.4114.4204.4
48.7-4 .7 '36.8'8.1
80.7
Q2
Nonfinanc
612.0r
-43 .5-43.8
.2
655.6'
20.359.686.1
114.1'20.8
295.2'211.7'
18.9'60.1'
4.5'59.5
328.0'285.1'214.1'
64.7'6.4'
42.5
61.710.438.711.51.2
673.71"
Financia
667.9r
286.2198.188.1
.0
381.7'77.0
228.1'-2 .0 '61.015.5'
76.431.9
.2
.1198.188.1
120.7120.5
-12.230.6'34.9
-21.5
1997
C-i
lal sectors
826.5'
30 131.2-.9
796.2'
14.588.9
122.929.0'78.1'
412.5'3 14 <l'
14.7'60.3'
3.5'50.3
.168.4'355.2'283.8'
66.7'4.7'
72.6
92.5-11.6100..1
7.3-3.5
919.0'
sectors
601.9'
161.046.4
114.60
440.9'168.8202.3'
25.9'37.56.5'
32.522.3
2
246.4
1146226.2
8.911.4'30. Sr
-6.9115.3'
Q4
858.3'
40.839.0
1.7
817.5'
12.8103.274.4
138.6'142.3'308.4'208.6'
27.0'69.9'
2.9'37.8
302.1'423.1'341.7'
72.1'9.2'
92.3
42.3.7
32.415.7
-6.5
900.5r
993.2'
298.1157.9140.3
.0
695.0'244.2337.8'
26.1'61.725.2'
61.041.7
3- .3
157.9140.3385.1
W 6-17.4'
58.9'7.0
99.2
Q l
904.7
- 3 0 0-27.6
-2 .4
934.7
51.1116.7157.2-2 .884.3
471.3172 828.366.8
3.457.0
437.5402.9.121.1
74.57 3
94.3
67.855.314.35.2
-7 .0
972.5
936.4
227.3142.584 8
.0
709 1237.4340.578.632.719.8
81.510.6
s0
142.584 8
282.180.140.26 6 2-1.0
137 9
1998'
Q2
925.4
-70.9-69.4-1 .4
996.2
3.8100.1160.8185.334.6
446.8320.3
31.189.46.0
64.8
457.2460.1357.3
95.77.2
78.9
85.")-25.5107.5
8.4-4 .4
1,011.3
994.9
413.4166.4247.0
.0
581.5134.8176.9
-21 176.014.8
80.031.2
2- . 6
166.4247.0368.1101.8
-48.062.120.0
-33.3
Q3
855.5
-136.5-136.1
- .4
991.9
85.683.687.1
125.873.5
453.0361.5
12.474.54.6
83.4
452.7466.6374.6
85.96.1
72.6
- 2 8 06.2
-35.33.6
- 2 . 4
827.5
1.061.5
561.6294.0267.5
.0
499.9141.0178.362.082.336.3
61.763.7
1.01.6
294.0267.5293.5
-14.02.0
82.8-2.610.1
04
1,118.3
26.914.712.2
1.091.4
-43.087.0
123.8144.0117.0596.045.3.3
14.3123.7
4.766.6
592.7423.3318.7
98.85.8
75.4
-38.0-4 .7
-32.99.9
-10.3
1,080.3
1,471.3
785.7614.5171.2
.0
685.7130.7337.2- 16.3173.760.3
66.5106 8
41.8
614.5171.2324.2
76.82.0
50.012.344.9
Digitized for FRASER http://fraser.stlouisfed.org/ Federal Reserve Bank of St. Louis
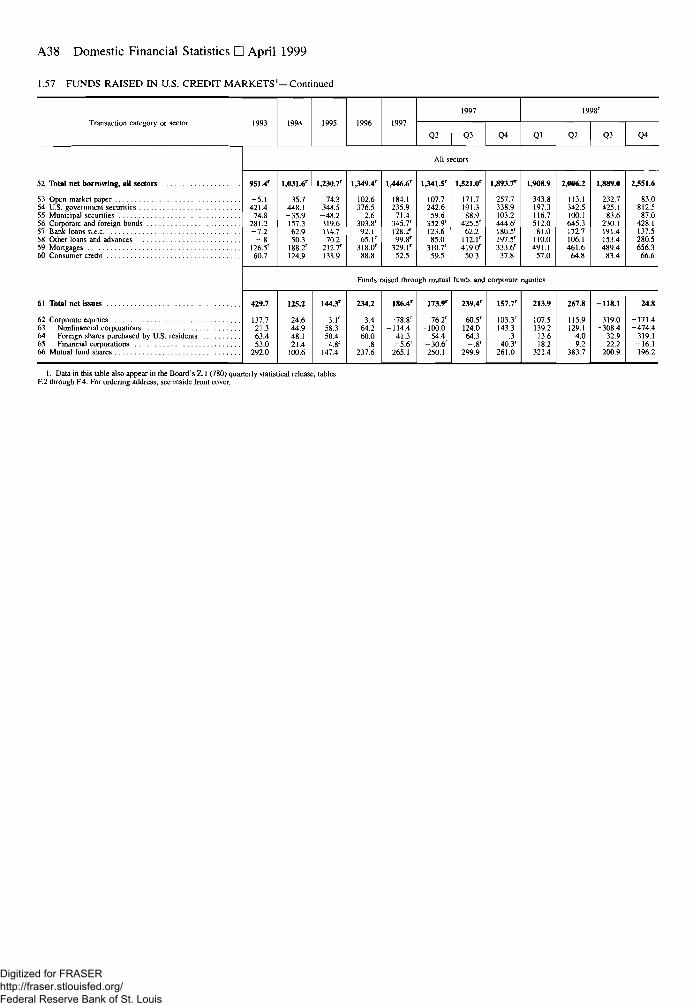
A38 Domestic Financial Statistics • April 1999
1.57 FUNDS RAISED IN U.S. CREDIT MARKETS'—Continued
Transaction category or sector 1997
Q2 Q3 04
1998'
Ql Q2 Q3 Q4
52 Total net borrowing, all sectors
53 Open market paper54 U.S. government securities55 Municipal securities56 Corporate and foreign bonds . . . .57 Bank loans n.e.c58 Other loans and advances59 Mortgages60 Consumer credit
951.4r
-5.1421.4
74.8281.2-7.2
- . 8126.5'60.7
1,031.6'
35.7448.1-35.9157.362.950.3
188.2'124.9
1,230.7'
74.3348.5
-48.2319.61H.770.2
212.7'138.9
1^49.4'
102.6376.5
2.6303.8'92.165.1'
318.0'88.8
1,446.6'
184.1235.9
71.4345.7'128.2'99.8r
329.1'52.5
1,341.5'
107.7242.659.6
352.9'123.685.0
310.7'59.5
1,521.0'
171.7191.388.9
425.5'62.2
112.1'419.0'
50.3
1,893.7'
257.7338.9103.2444.6'180.5'197.5'333.6'
37.8
1,908.9
343.8197.3116.7512.081.0
110.0491.1
57.0
2,006.2
113.1342.5100.1645.3172.7106.1461.6
64.8
1,889.0
232.7425.1
83.6230.1191.4153.4489.4
83.4
61 Total net issues
62 Corporate equities63 Nonfinancial corporations64 Foreign shares purchased by U.S. residents65 Financial corporations66 Mutual fund shares
429.7
137.721.363.453.0
292.0
Funds raised through mutual funds and corporate equities
2,551.6
83.0812.587.0
428.1137.5280.5656.366.6
125.2
24.6-44.9
48.121.4
100.6
144.3'
- 3 . 1 '-58.3
50.44.8'
147.4
234.2
-3.4-64.2
60.0.8
237.6
186.4'
-78 .8 '-114.4
41.3-5 .6 '
265.1
173.9'
-76.2 '-100.0
54.4-30.6 '250.1
239.4'
-60.5 '-124.0
64.3- . 8 '
299.9
157.7'
-103.3'-143.3
~ ^40.3'
261.0
213.9
- 107.5-139.2
13.618.2
321.4
267.8
-115.9-129.1
4.09.2
383.7
-118.1
-319.0-308.4-32.9
22.2200.9
24.8
-171.4-474.4
319.1-16 .1196.2
1. Data in this table also appear in the Board's Z.I (780) quarterly statistical release, tablesF.2 through F.4. For ordering address, see inside front cover.
Digitized for FRASER http://fraser.stlouisfed.org/ Federal Reserve Bank of St. Louis
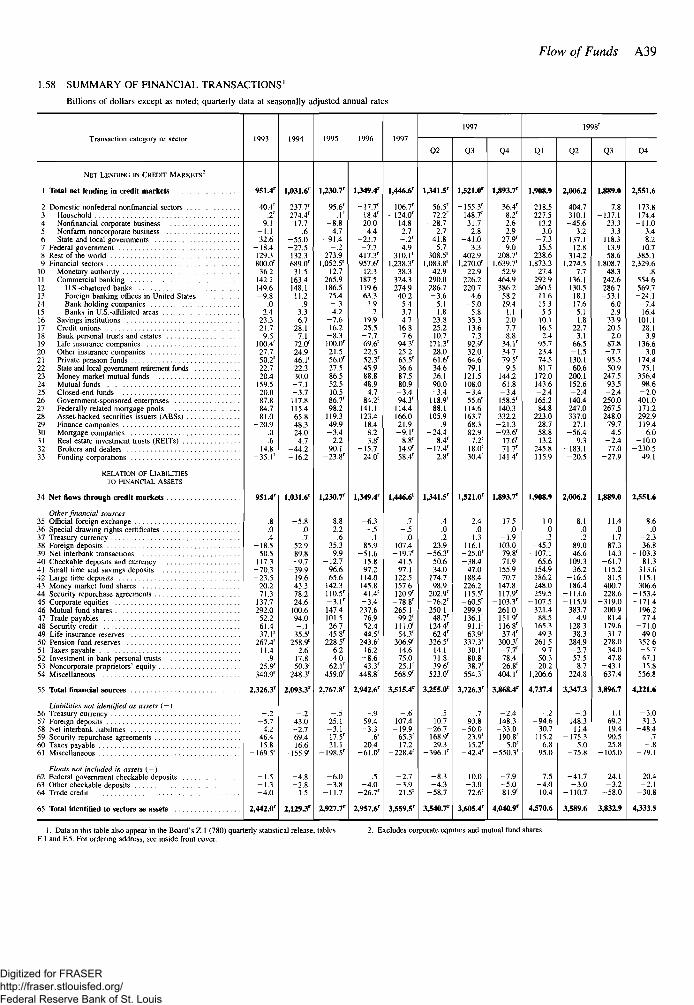
1.58 SUMMARY OF FINANCIAL TRANSACTIONS1
Billions of dollars except as noted; quarterly data at seasonally adjusted annual rates
Flow of Funds A39
Transaction category or sector
Q2 Q3 04
1998'
Ql 02 Q3 Q4
NET LENDING IN CREDIT MARKETS
] Total net lending in credit markets
2 Domeslic nonfederal nonfinancial sectors3 Household4 Nonfinancial corporate business5 Nonfarm noncorporate business6 State and local governments7 Federal government8 Rest of the world9 Financial sectors
101112131415161718192021222324252627282930313233
Monetary authorityCommercial banking
U.S.-chartered banksForeign banking offices in United StalesBank holding companiesBanks in US-affiliated areas
Savings institutionsCredit unionsBank personal trusts and estatesLife insurance companiesOther insurance companiesPrivate pension fundsState and local government retirement fundsMoney market mutual fundsMutual fundsClosed-end fundsGovernment-sponsored enterprisesFederally related mortgage poolsAsset-backed securities issuers (ABSs)Finance companiesMortgage companiesReal estate investment trusts (REITs)Brokers and dealersFunding corporations
RELATION OF LIABILITIESTO FINANCIAL ASSETS
34 Net flows through credit markets
Other financial sources35 Official foreign exchange36 Special drawing rights certificates37 Treasury currency38 Foreign deposits39 Net interbank transactions40 Checkable deposits and currency41 Small time and savings deposits42 Large time deposits43 Money market fund shares44 Security repurchase agreements45 Corporate equities46 Mutual fund shares47 Trade payables48 Security credit49 Life insurance reserves50 Pension fund reserves51 Taxes payable52 Investment in bank personal trusts53 Noncorporate proprietors' equity54 Miscellaneous
9S1.4r
40.4'- . 2 '9.1
-1.132.6
- 1 8 . 4129.3800.01
36.2142.2149.6-9.8
.02.4
-23.321.79.5
100.4'27.750.2'22.720.4
159.520.087.884.781.0
- 20 .9.0.6
14.8-35 .1 '
55 Total financial sources
Liabilities not identified as assets (—)56 Treasury currency57 Foreign deposits58 Net interbank liabilities59 Security repurchase agreements60 Taxes payable61 Miscellaneous
Floats not included in assets ( —)62 Federal government checkable deposits63 Other checkable deposits64 Trade credit
65 Total identified to sectors as assets
.0
.4-18.5
50.5117.3
-70 .3-23.5
20.271.3
137.7292.0
52.261.437.1'
267.4'11.4
.925.91
340.9'
2,326.3'
- . 2-5.7
4.246.415.8
-169.5'
-1.5-1.3-4 .0
2,442.0'
1,031.6'
237.7'274.4'
17.7.6
-55.0-27.5132.3689.0'
31.5163.4148.1
11.2.9
3.36.7
28.17.1
72.0'24.946.1'22.330.0-7.1-3.7117.8115.465.848.3
-24.04.7
-44.2-16.2
1,031.6'
-5.8.0.7
52.989.8-9.7
-39.919.643.378.224.6
100.694.0- .1
35.5'258.9'
2.617.850.3'
248.3'
2,093.3'
- . 243.0-2.769.416.6
-155.9'
-4.8-2.8
1.5
2,129.3'
1,230.7'
- 9 5 . 6 '
4.7-91.4
- . 2273.9
1,052.5'12.7
265.9186.575.4- .34.2
-7.616.2
-8.3100.0'21.556.01
27.586.552.510.586.7'98.2
119.349.9-3.4
2.290.1
-23.8 '
1,230.7'
2.2.6
35.39.9
-12.796.665.6
142.3110.5'- 3 . 1 '147.4101.526.745.8'
228.5'6.24.0
62.1'
2,767.8'
- . 525.1-3.117.5'21.1
-198.5'
-6.0-3.8
-11.7
2,927.7'
1349.4'
- 17 .7 '-18.4'
20.04.4
-23.7-7.7
417.3'957.6'
12.3187 5119.663.3
3.9.7
19.925.5-7.769.6'22.552.3'45.988.848.9
4.784.2'
141.1123.4
18.48.23.8'
-15 .724.C
1,349.4'
-6 .3- . 5
.185.9
- 51 .615.897.2
114.0145.841.4'-3.4
237.676.952.444.5'
243.6'16.2
-8.643.3'
448.8'
2,942.6'
- . 959.4-3.3
.6'20.4
- 6 1 . C
.5-4 .0
-26.7 '
2,957.6'
1,446.6'
-106.7'-124.0'
14.82.7
- . 2 '4.9
310.1'1,238.3'
38.3324.3274.940.25.43.7
- 4 716.87.6
94.3'25.265.5'36.687.580.9-3.494.3'
114.4166.021.9
- 9 . 1 '8.8'
14.9'58.4'
1,446.6'
.7- . 5
.0107.4
-19.7 '41.597.1
122.5157.6120.9'
-78.8 '265.199.2'
111.0'54.3'
306.9'14.675.025.1'
568.9'
3^15.4'
- . 6107.4
-19.965.3'17.2
-228.4'
-2.7-3 .921.5'
3359.5'
1,341.5'
-56.5 '-72.2 '-28.7
2.741.8
5.7308.5'
1,083.8'42.9
290.0286.7- 3 . 6
5.11.8
23.825.210.7
171.3'28.061.6'34.626.190.0-3.4118.9'88.1
105.9.9
-24.48.4'
-17.4 '2.8'
1,341.5'
.4
.0
.223.9
-56.3 '50.634.0
174.798.9
202.9'- 7 6 . 2 '250.148.7'
124.4'62.4'
326.5'14.171.839.6'
523.0'
3,255.0'
- .510.7
-26.7168.9'29.3
-396.1'
-8 .3-4 .3
-58.7
3,540.7'
1,521.0'
-155.3'-148.7'
31.72.8
-41.03.3
402.91.270.0'
22.9226.2220.7
4.6-5.0
5.8-35.3
13.67.3
92.9'32.064.6'79.1
121.5108.0-3.455.6'
114.6163.768.382.9
7.2'18.01
30.4'
1,521.0'
2.4.0
1.3116.1
-25.0 '-38.4
47.0188.4226.2115.5'
-60.5 '299.9136.1'91.1'63.9/
337.3'30.1 '80.838.7'
554.3'
3,726.3'
.793.8
-50.023.9'15.2'
-42.4'
10.0-3.072.6'
3,605.4'
1,893.7'
36.4'8.2'
-2.62.9
27.9'9.0
208.7'1,639.7'
52.9464.9386.258.219.41.1
-2.07.78.8
34.1'34.779.5'9.5
144.261.8-3.4158.5'140.3332.2
-21 .3-93.6'
17.6'71.7'
141.4'
1,893.7'
17.5.0
-1.9103.079.8'71.9
155.970.7
147.8117.9'
-103.3'261.0151.91
116.8'37.4'
300.3'-7 .7 '78.4
-26.8 '404.1'
3,868.4'
-2 .4148.3
-33.0190.8'
5.C-550.3'
-7.9-5.081.9'
4,040.9'
1,908.9
-218.5-227.5
13.23.0
-7 .315.5
238.61,873.3
27.4292.9260.5
11.615.35.5
10.116.52.4
95.723.474.581.7
172.0143.6- 2 . 4165.284.8
223.028.758.813.2
245.8115.9
1,908.9
1.0.0.3
-45.3-107.1
65.6154.9186.2248.0259.5
-107.5321.4
88.5165.349.3
261.59.7
50.320.2
1,206.6
4,737.4
- . 2-94 .6
30.7115.2
6.895.0
7.5-4.010.4
4,570.6
2,006.2
404.7310.1
-45 .63.2
137.112.8
314.21,274.5
7.7136.1130.518.1
-17 .65.1
-1.822.73.1
66.5-1.5130.160.6
200.1152.6-2.4140.4247.0337.0
27.1- 5 6 . 4
9.3-183.1
-20.5
2,006.2
8.1.0.2
89.046.6
109.336.2
-16.5186.4
-113.6-115.9
383.74.9
128.338.3
284.9-2.757.5-8.7
224.8
3,347.3
- . 3148.311.4
-175.35.0
-75.8
-41.7-3.0
-110.7
3,589.6
1,889.0
7.8-137.1
23.33.3
118.313.958.6
1,808.748.3
242.6286.7
-53.16.02.9
33.920.5
2.087.8-7.795.550.9
247.593.5-2.4
250.0267.5248.079.74.5
-2.477.0
-27.9
1^89.0
11.4.0
1.787.314.3
-61.7115.281.5
400.7228.6
-319 .0200.981.4
179.631.7
278.034.047.8
-43.1637.4
3,896.7
1.169.219.490.525.8
-105.0
24.1-3.2
-58.0
3,832.9
2,551.6
-173.8-174.4
-11.03.48.2
10.7385.1
2,329.6.8
554.6569.7-24.1-7.416.4
101.128.1
3.9136.6
3.0174.475.1
356.498.6-2.0
401.0171.2292.9119.4
6.0-10 .0
-230.549.1
2,551.6
8.6.0
-2.336.8
-103.381.3
313.6115.1306.6
-153.4-171.4
196.277.4
- 7 1 . 049.0
352.6-5767.115.8
556.8
4421.6
-3.031.3
- 4 8 . 4.7.8
-79.1
20.4-2.1
-30.8
4,333.5
1. Data in this table also appear in the Board's Z.1 (780) quarterly statistical release, tablesF. 1 and F.5. For ordering address, see inside front cover.
2. Excludes corporate equities and mutual fund shares.
Digitized for FRASER http://fraser.stlouisfed.org/ Federal Reserve Bank of St. Louis
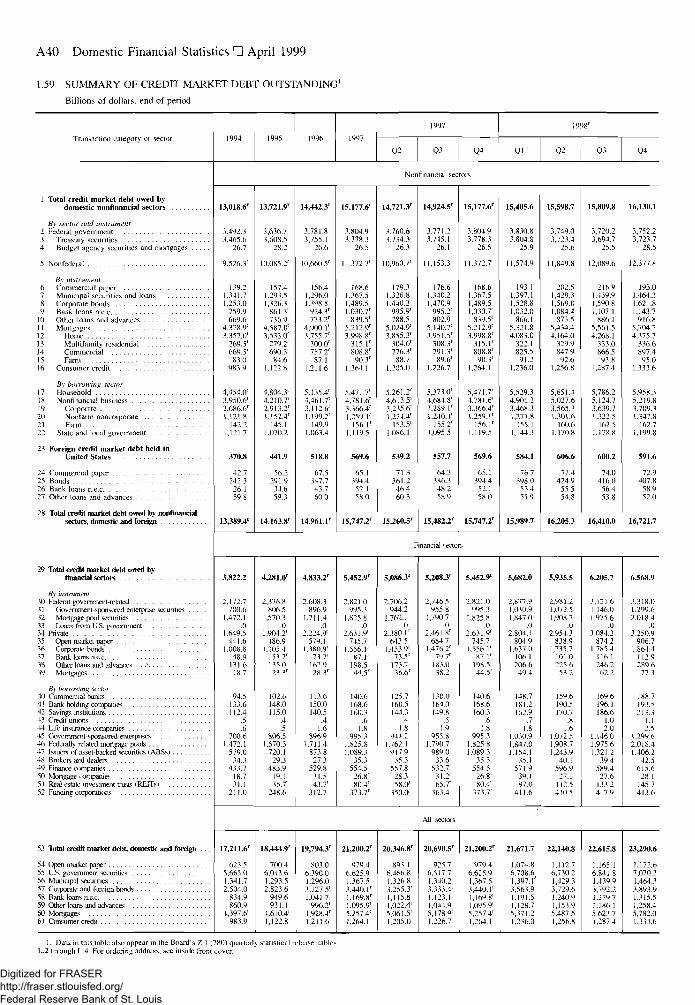
A40 Domestic Financial Statistics • April 1999
1.59 SUMMARY OF CREDIT MARKET DEBT OUTSTANDING1
Billions of dollars, end of period
Transaction category or sector
1 Total credit market debt owed bydomestic nonfinancial sectors
By sector and instrument2 Federal government3 Treasury securities4 Budget agency securities and mortgages
5 Nonfederal
By mwiimjem6 Commercial paper7 Municipal securities and loans8 Corporate bonds9 Bank loans n.e.c
10 Other loans and advances11 Mortgages12 Home13 Multifamily residential14 Commercial15 Farm16 Consumer credit
By borrowing secwr17 Household18 Nonfinancial business19 Corporate20 Nont'arm noncorporate21 Farm22 State and local government
23 Foreign credit market debt held inUnited States
24 Commercial paper25 Bonds26 Bank loans n e e27 Other loans and advances
28 Total credit market debt owed by nonnnancialsectors, domestic and foreign
29 Total credit market debt owed byfinancial sectors
By instrument30 Federal government-related31 Government-sponsored enterprise securities32 Mortgage pool securities33 Loans trom U.S. government34 Private35 Open market paper36 Corporale bonds37 Bank loans n.e.c38 Other loans and advances . .'39 Mortgages
By borrowing sector40 Commercial banks41 Bank holding companies42 Savings institutions43 Credit unions44 Life insurance companies45 Government-sponsored enterprises46 Federally related mortgage pools . . .47 Issuers of asset-backed .securities (ABSsj48 Brokers and dealers49 Finance companies50 Mortgage companies51 Real estate investment trusts (REITs)52 Fundine corporations
53 Total credit market debt, domestic and foreign
54 Open market paper55 U.S. government securities56 Municipal securities57 Corporate and foreign bonds58 Bank loans ae.c59 Other loans and advances60 Mortgages6) Consumer credit
1994 1995 1996 1997
1997
Q2 Q3 Q4
1998'
Ql Q2 Q3 Q4
Nonnnancial sectors
13,018.6'
3,492.33,465.6
26.7
9,526.3'
139.21,341.71,253.0
759.9669.6
4,378.9'3,357.0'
269.5'669.5'
83.0983 9
4,454.0'3,950.6'2,686.6'1,121.8
142.21,121.7
370.8
42.7242.3
26.159.8
13,389.4'
13,721.9'
3.636.73,608.5
28.2
10.085.2'
157.41.293.51.326.3
861.3'736.9
4.587.0'3,533.0'
279.2'690.3'
84.61.122.8
4,804.3'4,210.7'2.913.2'1,152.4'
145.11,070.2
441.9
56.2291.9
^4.659.3
14,163.8'
14,442.3'
3.781.83,755.1
26.6
10,660.5'
156.41,296.01.398.8
924.3'773.2'
4,900.1'S.755.7'
300.0'757.2'
87.11.211.6
5,135.4'4,461.7'3,1126'1,199.2'
149.91,063.4
518.8
67.5347.743.760.0
14,961.1r
15,177.6'
3.S04.93,778."!
26.5
11.372.7'
168.61,367.51,489.51.030.7'
839.5'5,212.9'3,998.8'
315.1'808.8'90.3'
1.264.1
5,471.7'4.781.6'3.366.4'1.259.1'
156.1'1.119.5
569.6
65.1394.4
52.158.0
15,747.2'
14,721.3'
3.760.63 734.3
26.3
10,960.7'
179.31.326.81.440.2
995.9'788.5
5 024.9'3.855.3'
304.6'776.3'
88.71,205.0
5,261.2'4,613.5'3 2V.6 '1.224.4'
153.5'1.086.1
539.2
71.3361.2
46.460.3
15.260.5'
14,924.5'
3,771.23.745.1
26.1
11,153.3'
176.61.340.21,470.9
995.2'802.9
5.140.7'3.951.5'
308.3'791.3'
89.6'1.226.7
5,373.0'4,684.8'3.289 1'1.240.4'
155.2'1,095.5
557.7
64.3386.348.258.9
15,482.2'
15,177.6'
3.804.93.778.3
26.5
11,372.7'
168.61.367.51,489.51,030.7'
839.5'5.212.9'3.998.8'
315.1'808.8'
90.3'1.264 1
5,471.7'4.781.6'3.366.4'1,259.1'
156.1'1,119.5
569.6
65.1394.4
52 158.0
15,747.2'
15,405.6
3,830.83.804.8
25.9
11,574.9
193.11,397.11,528.81,0320
866.15.321.84.083.0
322.1825.5
91.21,236.0
5,529.34,901.23,468.31.277.8
155.11,144.3
584.1
7o.7398.0
53.455.9
15,989.7
15,598.7
3.749 03,723.4
25.6
11,849.8
202.51,429.31,569.01,084 4
873.55.434.44.164.0
329.9847.9
92.61,256.8
5,651.45,027.63,565.31,301.6
160.61,170.8
606.6
71.4424.9
55.554.8
16,205.3
15,809.8
3.720.23,694.7
25.5
12,089.6
21b.91.439.91,590.81,107.1
886.15,561.54.268.1
333.0866.5
93.81,287 4
5,786.25,124.73,639.71,3225
162.51,178.8
600.2
74.0416.0
56.453.8
16,410.0
16,130.1
3,752.23,723.7
28.5
12,377.8
193.01,464.31,621.81,143.7
916.85,704.74,375.7
336.6897.4
95.01.333.6
5.958.35.219.83.709.31.347.8
162.71,199.8
591.6
72.9407.8
58.952.0
16,721.7
Financial sectors
3,822.2
2,172.7700.6
1,472.1.0
1,649.5441.6
1,008.848.9
131.618.7
94.5133.6112.4
.5
.6700.6
1,472.1579.0
34.3433.7
18.731.1
211.0
17,211.6'
623.55,665.01,341.72,504.0
8.34.9860.9
4.397.6'983.9
4,281.0'
2,376.8806.5
1.570.3.0
1.904.2'486.9
1,205.453.7'
135.023.3'
102.6148.0115.0
.4
.5806.5
1,570.3720.1
29.3483.9
19.136.7'
248.6
4,833.2'
2.608.3896.9
1,711.4.0
2.224 9'579.1
1.380.9'73.7'
162.928.3'
113.6150.0140.5
.41.6
896.91,711.4
873.827.3
529.831.543.7'
312.7
5,452.9'
2.821.0995.3
1.825.8.0
2,631.9'745.7
1,556.1'87.1'
198.544.5'
140.6168.6160.3
.61.8
995 11.825.81,089.3
35.3554.5
268'80.4'
373.7'
5,086.3'
2,706.2944.2
1,762.1.0
2 380.1'642.5
1.453.9'73.5'
173.736.6'
125.7160.5144.3
.41.8
944.21.762.1
917.935.3
557.828.358.0'
350.O
5,208.3'
2,746.5955.8
1,790.7.0
2,461.8'684.7
1.476.2'79.7'
183.038.2
130 0164.0149.8
.51.9
955.81.790.7
989.033.6
532.731.2'65.7'
363.4
5,452.9'
2.821.0995.3
1,825.8.0
2.631.9'745.7
1.556.1'87.1'
198.S44.5'
140.6168.6160.3
.6I S
995.31,825.81,089.3
35.3554.5
26.8'80.4'
373.7'
All sectors
18,444.9'
700.46.013.61,293.52,823.6
949.6931.1
4.610.4'1,122.8
19,794.3'
803.06,390.01,296.03.127.5'1,041.7
996.2'4.928.4'1.211.6
21,200.2'
979.46.625.91,367.53.440.1'1.169.8'1.095.9'5.257.4'1.264.1
20,346.8'
893 16.466.81.326.83.255.3'1.115.81.022.4'5 061.5'1.205.0
20,690.5'
925.76.517.71.340 21,313.4'1.123.11,044.95,178 9'1.226.7
21,200.2'
979.46.625.91,367.53,440.1'1,169.8'1,095.9'5.257 4'1.264.1
5,682.0
2,877 91,030.91,847.0
.02,804.1
804.91.637.0
106 1206.6
49.4
148.7181.2162.9
.71.8
1.030.91,847.01.154.1
35.1571 9
39.197.0
411.6
5,935.5
2,981.21,072.51,908.7
.02,954.3
838.91,735.7
101.0225.6
53.2
159.6190.5170.7
.81.6
1,072.51,908.71,243.9
40.1596.9
27.1112 54105
6,205.7
3,121.61,146.01.975.6
.03.084.2
874.21.785.4
116.1246.2
62.2
169.6196.1186.6
1.02.0
1,146.01,975.61,321.2
39.4589.4
27.6133.2417.9
6.568.9
3,318.01,299.62,018.4
.03.250.9
906.71,864.4
112.9289.6
77.3
188.7193.5213.3
I.I2.5
1.299.62,018.41.406.2
42.5615.6
28.1145 7413.6
21,671.7
1,074.86.708.61,397.1'3,563.91.191.51,128.75.371.21.236.0
22,140.8
1,112.76.730.21,429.33,729.61.240.91,153.95,487.51,256.8
22.615.8
1,165.16.841.81.439.93.792.21,279.71,186.15,623.71,287 4
23,290.6
1,172.67.070.21,464.3*.893 91.315.51,258.45.782.01.3.33.6
]. Dala in this table also appear in the Board's Z. 1 (780) quarterly statistical release, tablesL.2 through L.4. For ordering address, sec inside front cover.
Digitized for FRASER http://fraser.stlouisfed.org/ Federal Reserve Bank of St. Louis
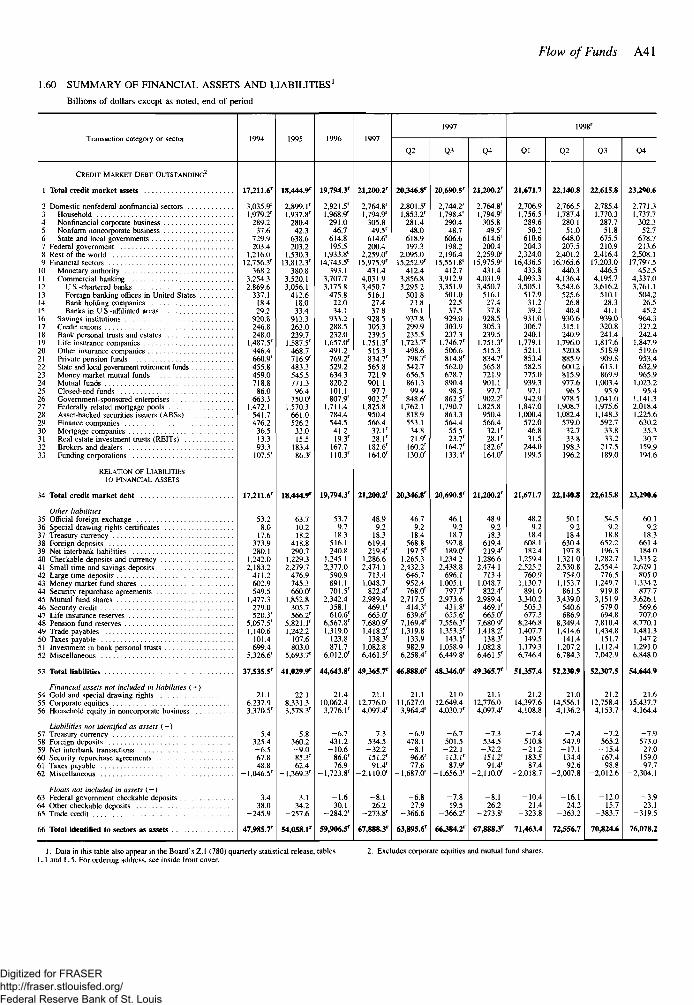
1.60 SUMMARY OF FINANCIAL ASSETS AND LIABILITIES1
Billions of dollars except as noted, end of period
Flow of Funds A41
Transaction category or sector
Q2 Q3 04 Ql Q2 Q4
CREDIT MARKET DEBT OUTSTANDING2
1 Total credit market assets
2 Domestic nonfedera] nonfinancial sectors3 Household4 Nonfinancial corporate business5 Nonfarm noncorporate business6 State and local governments7 Federal government8 Rest of the world9 Financial sectors
10 Monetary authority11 Commercial banking12 US-chartered banks13 Foreign banking offices in United States14 Bank holding companies15 Banks in US.-afiiliated areas16 Savings institutions17 Credit unions18 Bank personal trusts and estates19 Life insurance companies20 Other insurance companies21 Private pension funds22 State and local government retirement funds23 Money market mutual funds24 Mutual funds25 Closed-end funds26 Government-sponsored enterprises27 Federally related mortgage pools28 Asset-backed securities issuers (ABSs)29 Finance companies30 Mortgage companies31 Real estate investment trusts (REITs)32 Brokers and dealers33 Funding corporations
RELATION OF LIABILITIESTO FINANCIAL ASSETS
34 Total credit market debt
Other liabilities35 Official foreign exchange36 Special drawing rights certificates37 Treasury currency38 Foreign deposits39 Net interbank liabilities40 Checkable deposits and currency41 Small time and savings deposits42 Large time deposits43 Money market fund shares44 Security repurchase agreements45 Mutual fund shares46 Security credit47 Life insurance reserves48 Pension fund reserves49 Trade payables50 Taxes payable51 Investment in bank personal trusts52 Miscellaneous
53 Total liabilities
Financial assets not included in liabilities ( + )54 Gold and special drawing rights55 Corporate equities56 Household equity in noncorporate business . . .
Liabilities not identified as assets ( —)57 Treasury currency58 Foreign deposits59 Net interbank transactions60 Security repurchase agreements61 Taxes payable62 Miscellaneous
Floats not included in assets (—)63 Federal government checkable deposits .64 Other checkable deposits65 Trade credit
17,211.6'
3,035.9'1,979.2'
289.237.6
729.9203.4
1,216.012,756.3'
368.23,254.32,869.6
337.118.429.2
920.8246.8248.0
1,487.5'446.4660.9'455.8459.0718.8
86.0663.3
1.472.1541.7476.2
36.513.393.3
107.5'
17,211.6'
53.28.0
17.6373.9280.1
1.242.02,183.2
411.2602.9549.5
1,477.3279.0520.3'
5,057.5'1,140.6
66 Total identified to sectors as assets
101.4699.4
5,326.6'
37,535.5'
21.16,237.93.370.5'
-5.4325.4-6.567.848.8
1,046.5'
3.438.0
-245.9
47,985.7'
18,444.9'
2,899.1'1,937.8'
280.442.3
638.6203.2
1,530.313,812.3'
380.83.520.13,056.1
412.618.033.4
913.3263.0239.7
1.587.5'468.7716.9'483.3545.5771.396.4
750.0'1,570.3
661.0526.2
33.015.5
183.486.3'
18,444.9'
63.710.218.2
418.8290.7
1.229.32.279.7
476.9745.3660.0'
1,852.8305.7566.2'
5.821.1'1,242.2
19,794.3'
2,921.5'1,968.9'
291.046.7
614.8195.5
1,933.8'14,743.5'
393.13,707.73,175.8
475.822.034.1
933.2288.5232.0
1,657.0'491.2769.2'529.2634.3820.2101.1807.91
1,711.4784.4544.541.219.3'
167.7110.3'
19,794.3'
53.79.7
18.3516.1240.8
1,245.12.377.0
590.9891.1701.5'
2,342.4358.1610.6'
6,567.8'1,319.0
107.6803.0
5,693.7'
41,029.9'
22.18,331.33,578.3'
-5.8360.2-9.085.3'62.4
-1,369.3'
3.134.2
-257.6
54,058.1r
123.8871.7
6,012.0'
44,643.8'
21.410,062.43,776.1'
-6.7431.2- 10 .6
86.0'76.9
-1,723.8'
-1 .630.1
-284.2'
59,906.5'
21,200.2'
2,764.8'1.794.91
305.849.5'
614.6'200.4
2,259.0'15,975.9'
431.44,031.93,450.7
516.127.437.8
928.5305.3239.5
1,751.3'515.3834.7'565.8721.9901.1
97.7902.2'
1.825.8950.4566.4
32.1'28.1'
182.6'164.0'
21,200.2'
48.99.2
18.3619.4219.4'
1.286.62,474.1
713.41.048.7
822.4'2,989.4
469.1'665.V
7,680.9'1,418.2'
138.3'1,082.86,461.5'
49,365.7'
21.112,776.04.097.4'
-7 .3534.5-32.2151.2'91.4'
-2,110.0'
-8.126.2
-273.8'
67,88«.3C
20,346.8'
2,801.5'1,853.2'
281.448.0
618.9197.3
2,095.015,252.9'
412.43,856.83,295.2
501.823.836.1
937.8299.9235.5
1,723.7'498.6798.7'542.7656.5861.399.4
848.6'1.762.1
818.9553.1
34.821.9'
160.2'130.0'
20,346.8'
46.79.2
18.4568.8197.5'
1.265.32,432.3
646.7952.4768.rf
2,717.5414.3'639.6'
7,169.4'1,319.8
133.9982.9
6,258.4'
46,888.0'
21.111,627.03,964.4'
-6.9478.1-8.196.6'77.6
-1,687.0'
-6.827.9
-366.6
63,895.6'
20,690.5'
2,744.2'1,798.4'
290.448.7
606.6198.2
2,196.415,551.8'
412.73,912.93,351.9
501.022.537.5
929.0303.9237.3
1,746.7'506.6814.8'562.0678.7890.498.5
862.5'1,790.7
863.3564.455.523.7'
164.7'133.4'
20,6*0.5'
46.19.2
18.7597.8189.0'
1.234.22,438.8
696.11,005.1
797.7'2,973.6
431.8'655.6'
7,556.3'1,353.5'
143.1'1.058.96.449.8'
48.346.0'
21.012,649.44,030.7'
-6.7501.5-22.1113.1'87.9'
-1.656.3'
-7.819.5
-366.2'
66^84.2'
21,200.2'
2.764.8'1,794.9'
305.849.5'
614.6'200.4
2,259.0'15,975.9'
431.44,031.93,450.7
516.127.437.8
928.5305.3239.5
1,751.3'515.3834.7'565.8721.9901.1
97.7902.2'
1,825.8950.4566.4
32.1 '28.1'
182.6'164.0'
21,200.2'
48.99.2
18.3619.4219.4'
1,286.62,474.1
713.41,048.7
822.4'2,989.4
469.1'665.0'
7,680.9'1,418.2'
138.3'1,082.86,461.5'
49365.7'
21.112,776.04,097.4'
-7.3534.5-32.2151.2'91.4'
-2,110.0'
-8.126.2
-273 .8 '
67,888.3'
21,671.7
2,706.91,756.5
289.650.2
610.6204.3
2,324.016,436.5
433.84,093.33,505.1
517.931.239.2
931.0306.7240.1
1,779.1521.1853.4582.5775.0939.397.1
942.91,847.01,000.4
572.046.831.5
244.0199.5
21,671.7
48.29.2
18.4608.1182.4
1,259.42.525.2
750.91,130.7
891.03,340.2
505.3677.3
8,246.81,407.7
149.51,179.36,746.4
51357.4
21.214,397.64,108.8
-7.4510.8-21.2183.587.4
-2,018.7
-10.421.4
-323.8
71,463.4
22,140.8
2,766.51,787.4
280.151.0
648.0207.5
2,401.216,765.6
440.34,136.43,543.6
525.626.840.4
930.6315.1240.9
1,796.0520.8885.9600.2815.9977.696.5
978.51,908.71.082.4
579.032.733.8
198.3196.2
22,140.8
50.19.2
18.4630.4197.8
1,321.02.530.8
754.01,153.7
861.53,439.0
540.6686.9
8,349.41,414.6
141.41.207.26.784.3
52,230.9
21.014,556.14,136.2
-7.4547.9-17.1134.492.6
-2,007.8
-16.124.2
-363.2
72,556.7
22,615.8
2,785.41,770.3
287.751.8
675.5210.9
2,416.417,203.0
446.54,195.73,616.2
510.128.341.1
939.0320.8241.4
1,817.6518.9909.8613.1869.9
1,003.495.9
1,041.01,975.61,148.3
592.733.833.2
217.5189.0
22,615.8
54.59.2
18.8652.2196.3
1,282.72,554.4
776.51.249.7
919.83,151.9
579.0694.8
7,810.41,434.8
151.71,112.47,042.9
52307.5
21.212,758.44.153.7
-7.2565.2-15.4167.498.8
-2,012.6
-12.015.7
-383.7
70,824.6
23,290.6
2.771.31.737.7
302.352.7
678.7213.6
2,508.117,797.5
452.54,337.03,761.1
504.226.545.2
964.3327.2242.4
1,847.9519.6953.4632.9965.9
1,023.295.4
1,141.32,018.41.225.6
630.235.330.7
159.9194.6
23,290.6
60.19.2
18.3661.4184.0
1,335.22,629.1
805.01.334.2
877.73,626.1
569.6707.0
8,770.11.481.3
147 21.291.06.848.0
54.644.9
21.615,437.74,164.4
-7.9573.0-27.0159.097.7
-2,304.1
-3.923.1
-319.5
76,078.2
1. Data in this table also appear in the Board's Z. I (780) quarterly statistical release, tablesL.I and L.5. For ordering address, see inside front cover.
2. Excludes corporate equities and mutual fund shares.
Digitized for FRASER http://fraser.stlouisfed.org/ Federal Reserve Bank of St. Louis
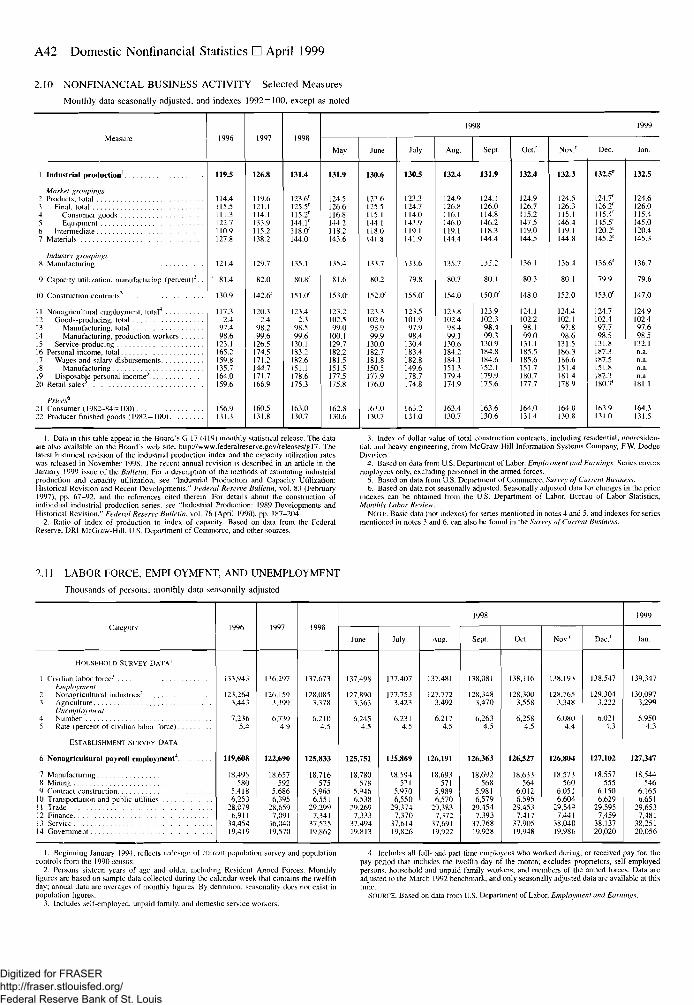
A42 Domestic Nonfinancial Statistics • April 1999
2.10 NONFINANCIAL BUSINESS ACTIVITY Selected Measures
Monthly data seasonally adjusted, and indexes 1992=100, except as noted
Measure
1 Industrial production1
Market groupings1 Products total3 Final, total4 Consumer goods5 Equipment6 Intermediate7 Materials
Indusux groupings8 Manufacturing
9 Capacity utilization, manufacturing (percent)". .
10 Construction contracts^
11 Nonagricultural employment, total4
12 Goods-producing, total13 Manufacturing, total14 Manufacturing, production workers15 Service-producing16 Personal income, total17 Wages and salary disbursements18 Manufacturing19 Disposable personal income5
20 Retail sales5
Prices'1
21 Consumer (1982-84=100)22 Producer finished goods (1982= 100)
1996
119.5
114.4115.5111.3122.7110.9127.8
121.4
' 81.4
130.9
117.32.4
97.498.6
123.1165.2159.8135.7164.0159.6
156.9131.3
1997
126.8
119.6121.1114.1133.9115.2138.2
129.7
82.0
142.6'
120.324
98.299.6
126.5174.5171.2144.7171.7166.9
160.5131.8
1998
131.4
123.6'125.5'115.2'144.1'118.0'144.0
135.1
80.8'
151.0'
123.42.3
98.599.6
130.1183.2182.6151.1178.6175.3
163.0130.7
1998
May
131.9
124.5126.6116.8144.2118.2143.6
135.4
81.6
153r/
123.2102.599.0
100.1129.7182.2181.5151.5177.5175.8
162.8130.6
June
130.6
123.6125.5115.1144.1118.0141.8
133.7
80.2
152.0'
123.3102.698.999.9
130.0182.7181.8150.5177.9176.0
163.0130.7
July
130.5
123.3124.7114.0143.91 19.1141.9
133.6
79.8
155.0'
123.5101.997.998.4
130.4183.4182.8149.6178.7174.8
163.2131.0
Aug.
132.4
124.9126.8116.1146.0119.1144.4
135.7
80.7
154.0
123.8102.498.499.1
130.6184.2184.1151.3179.4174.9
163.4130.7
Sept.
131.9
124.1126.0114.8146.2118.3144.4
1J3.2
80.1
150.0'
123.9102.398.499.3
130.9184.8184.6152.1179.9175.6
163.6130.6
Oct.'
132.4
124 9126.7115.2147.5119.0144.5
136.1
80.3
148.0
124.1102.298.199.0
131.1185.5185.6151.7180.7177.7
164.01314
Nov.'
132.3
124.5126.3115.1146.4119.1144.8
13b.4
80.1
152.0
124.4102.197 898.6
131.5186.3186.6151.4181.4178.9
164.0130.8
Dec.
132.5'
124.7'126.2'115.4'145.5'120.2'145.2'
136.6'
79.9
153.0'
124.7102.497.798.5
131.8187.3187.5151.8182.3180.7'
163.9131.0
1999
Jan.
132.5
124.6126.0115.4145.0120.4145.3
136.7
79.6
147.0
124.9102.497.698.5
132.1n.a.n.a.n.a.n.a.
181.1
164.3131.5
1. Daia in this table appear in the Board's G.17 (419) monthly statistical release. The dataare ako available on the Board's web site. hllp://www.federalreserve.gov/releases/gl7. Theiaiesi historical revision of the industrial production index and Ihe capacity utilization rateswas released in November 1998. The remit annual revision is described in an article in theJanuaiy 1999 issue of the Bulletin. For a description of the methods of estimating industrialproduction and capacity utilization, see "Industrial Production and Capacity Utilization:Historical Revision and Recent Development." Federal Risen-e Bulletin, vol. 83 (February1997), pp. 67-92, and the references cited Iherein For details about the construction ofindividual industrial production series, see "Industrial Production: 1989 Developments andHistorical Revision," Federal Reserve Bulletin, vol. 76 (April 1990), pp. 187-204.
2. Ratio of index of production to index of capacity. Based on data from the FederalReserve, DRI McGraw-Hill. U.S. Department of Commerce, and other sources.
3. Index of dollar value of total construction contracts, including residential, nonresiden-lial. and heavy engineering, from McGraw-Hill Information Systems Company, F.W. DodgeDivision.
A. Based on dala from U.S. Department of Labor. Employment and Earnings. Series coversemployeu-s only, excluding personnel in the armed forces.
5. Based on data from U.S. Department of Commerce. Surrey of Current Business.b. Based on data not seasonally adjusted. Seasonally adjusted data for changes in the price
indexes can be obtained from the U.S. Department of Labor. Bureau of Labor Statistics,Monthly Labor Review.
NOTE. Basic data (not indexes) for series mentioned in notes 4 and 5, and indexes for seriesmentioned in notes 3 and 6. can also be found in the Survey of Current Business.
2.11 LABOR FORCE, EMPLOYMENT, AND UNEMPLOYMENT
Thousands of persons; monthly data seasonally adjusted
Category
HOUSEHOLD SURVEY DATA1
1 Civilian labor force'Employment
2 Nonagricultural industries^3 Agriculture
Unemployment4 Number5 Rale (percent of civilian labor force)
ESTABLISHMENT SURVEY DATA
6 Nonagricultural payroll employment4
7 Manufacturing8 Mining9 Contract construction
[0 Transportation and public utilities11 Trade12 Finance13 Service14 Government
1996
133,943
123,2643.443
7,2365.4
119,608
18,495580
5.4186,253
28,0796,911
34,45419,419
1997
136,297
126.1593,399
6,7394.9
122,690
18,657592
5,6866,395
28,6597,091
36,04019,570
1998
137.673
128,0853.378
6.2104.5
125,833
18.716575
5,9656,551
29.2997,341
37,52519,862
1998
June
137,498
127,8903,363
6.2454.5
125,751
18,780578
5.9466.538
29.2697,333
37.49419.813
July
137,407
127,7533,423
6,2314.5
125,849
18,594571
5,9706.550
29,3747,370
37,61419,826
'Vug.
137,481
127,7723.492
6.2174.5
126,191
18,693571
5,9896,570
29,3837,372
37,69119,922
Sept.
138,081
128,3483,470
6,2634.5
126,363
18,692568
5,9816,579
29,4547,393
37,76819.928
Oct.
138,116
128,3003,558
6,2584.5
126,527
18,633564
6,0126.595
29.4537,417
37.90519,948
Nov'
138.193
128,7653,348
6.0804.4
126,804
18,573560
6,0516,604
29,5497,441
38,04019,986
Dec.1
138,547
129,3043,222
6.0214.3
127,102
18.557555
6,1506,629
29,5957,459
38,13720,020
1999
Jan.
139,347
130,0973,299
5.9504.3
127,347
18,544546
6.1656,651
29,6537,481
38,25120,056
1. Beginning January 1994, reflects redesign of current population survey and populationcontrols from the 1990 census.
2. Persons sixteen years of age and older, including Residenl Armed Forces. Monthlyfigures are based on sample data collected during the calendar week that contains the twelfthday; annual data arc averages of monthly figures. By definition, seasonality does not exist inpopulation figures.
3. Includes self-employed, unpaid family, and domestic service workers.
4 Includes all full- and part-time employees who worked during, or received pay for, thepay period thai includes the twelfth day of Ihe month; excludes proprietors, self-employedpersons, household and unpaid family workers, and members of Ihe armed forces. Data areadjusted lo the March 1992 benchmark, and only seasonally adjusted data are available at thistime.
SOURCE. Based on data from U.S. Department of Labor. Employment and Earnings.
Digitized for FRASER http://fraser.stlouisfed.org/ Federal Reserve Bank of St. Louis
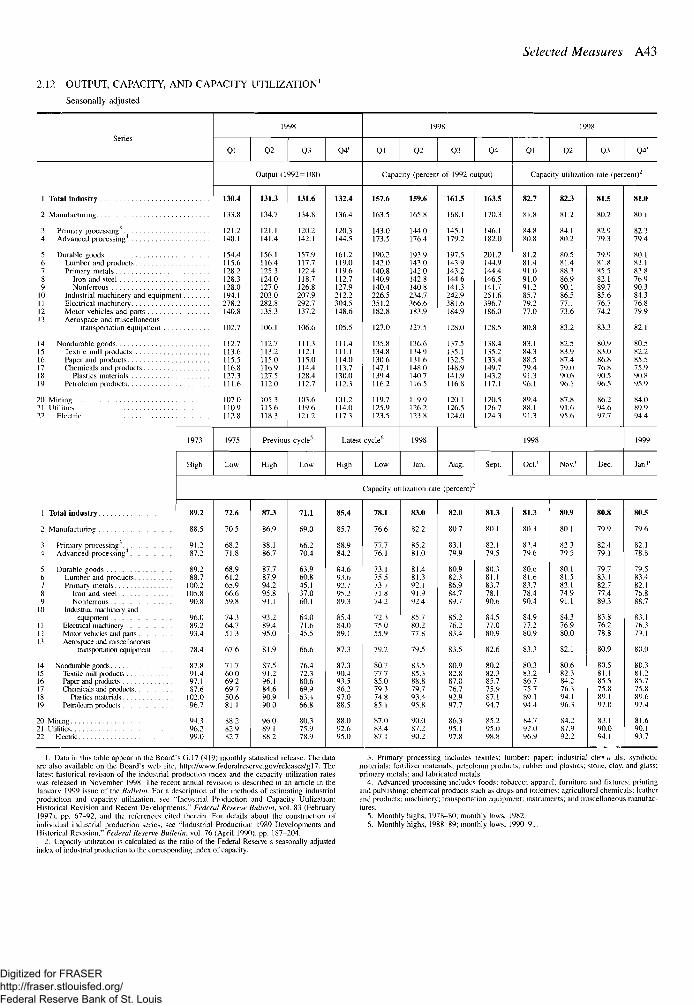
Selected Measures A43
2.12 OUTPUT, CAPACITY, AND CAPACITY UTILIZATION1
Seasonally adjusted
Series
1 Total industry
2 Manufacturing
3 Primary processing4 Advanced processing4
5 Durable goods6 Lumber and products7 Primary melals8 Iron and steel9 Nonferrous
10 Induslrial machinery and equipment11 Electrical machinery12 Motor vehicles and parts13 Aerospace and miscellaneous
transportation equipment
14 Nondurable goods15 Textile mill products16 Paper and products17 Chemicals and products18 Plastics materials19 Petroleum products
20 Mining21 Utilities22 Electric
1 Total industry
2 Manufacturing?
3 Primary processing4 Advanced processing
5 Durable goods6 Lumber and products7 Primary metals8 Iron and steel9 Nonfcrrous
10 Industrial machinery andequipment
11 Electrical machinery12 Motor vehicles and parts13 Aerospace and miscellaneous
transportation equipment
14 Nondurable goods15 Textile mill products16 Paper and products17 Chemicals and products18 Plastics materials19 Petroleum products
20 Mining21 Utilities22 Electric
1973
High
89.2
88.5
91.287.2
89.288.7
100.2105.890.8
96.089.293.4
78.4
87.891.497.1S7.6
102.096.7
94.396.299.0
01
1998
02 Q3 Q4'
Output (1992=100)
130.4
133.8
121.2140.1
154.4115.6128.2128.3128.0194.1278.2140.8
102.7
112.7113.6115.5116.8127.3111.6
107 0110.9112.8
1975
Low
72.6
70.5
68.271.8
68.961.265.966.659.8
74.364.751.3
67.6
71.760.069.269.750.681.1
88.282.982.7
131.3
134.7
121.1141.4
156.1116.4125.3124.0127.0203.0282.8135.3
106.1
112.7113.2115.0116.9127.5112.0
IO"i 3115.6118.3
131.6
134.8
120.2142.1
157.9117.7122.4118.7126.8207.9292.7137.2
106.6
111.3112.1115.0114.4128.4112.7
103 6119.6121.2
Previous cycles
High
87.3
86.9
88.186.7
87.787.994.295.891.1
93.289.495.0
81.9
87.591.296.184.690.990.0
96.089.188.2
Low
71.1
69.0
66.270.4
63.960.845.137.060.1
64.071.645.5
66.6
76.472.380.669.963.466.8
80.375.978.9
132.4
136.4
120.3144.5
161.2119.0119.6112.7127.9212.2304.5148.6
105.5
111.4111.1114.0113.7130.0112.3
101.2114.0117.3
01
1998
1
Q2 Q3 Q4
Capacity (percent of 1992 output)
157.6
163.5
143.0173.5
190.2142.0140.8140.9140.4226.5351.2182.8
127.0
135.81.34.8130.6147.1139.4116.2
119.7125.9123.5
Latest cycle6
High
85.4
85.7
88.984.2
84.693.692.795.289.3
85.484.089.1
87.3
87.390.493 586.297.088.5
88.092.695.0
Low
Capacity ut
78.1
76.6
77.776.1
73.175.57.3.771.874.2
72.375.055.9
79.2
80.711185.079.374.885.1
87 083.487.1
159.6
165.8
144.0176.4
193.9143.0142.0142.8140.8234.7366.6183.9
127.5
136.6134.9131.6148.0140.7116.5
119.9126.2123.8
1998
Jan.
161.5
168.1
145.1179.2
197.5143.9143.2144.6141.3242.9381.6184.9
128.0
137.5135.1132.5148.9141.9116.8
120.1126.5124.0
Aug.
lization rate (percent)
83.0
82.2
85.281.0
81.481.392.191.992.4
85.780.277.8
79.5
83.585.388.879.79.3.495.8
90.087.290.2
82.0
80.7
83.179.9
80.982.386.984.789.7
85.276.283.4
83.5
80.982.887.076.792.997.7
86.395.197.8
163.5
170.3
146.1182.0
201.2144.9144.4146.5141.7251.6396.7186.0
128.5
138.4135.2133.4149.7143.2117.1
120.5126.7124.3
Qi
1998
02 03 Q4'
Capacity utilization rale (percent)
82.7
81.8
84.880.8
81.281.491.091.091.285.779.277.0
80.8
83.184.388.579.491.396.1
89.488.191.3
1998
Sept.
81.3
80.1
82.179.5
80.381.183.778.190.6
84.577.080.9
82.6
80.282.385.775.987.194.7
85.295.098.8
Oct.'
81.3
80.3
82.479.6
80.681.683.778.490.4
84.977.280.9
83.3
80.383.286.775.789.194.4
84.792.096.9
82.3
81.2
84.180.2
80.581.488.386.990.186.577.173.6
83.2
82.583.987.479.090.696.1
87.891.695.6
81.5
80.2
82.979.3
79.981.885.582.189.785.676.774.2
83.3
80.983.086.876.890.596.5
86.294.697.7
Nov.' Dec.
80.9
80.1
82.379.5
80.181.582.174.991.1
84.376.980.0
82.1
80.682.384.276.394.196.3
84.287.992.2
80.8
79.9
82.479.1
79.783.182.777.489.3
83.876.278.8
80.9
80.581.185.575.889.197.0
83.190.094.1
81.0
80.1
82.379.4
80.182.182.876.990.384.376.879.9
82.1
80.582.285.575.990.895.9
84.089.994.4
1999
Jan.p
80.5
79.6
82.178.8
79.583.482.176.888.7
8.3.176.379.1
80.0
80.381.285.775.889.697.4
81.690.193.7
1. Data in this table appear in the Board's G.17 (419) monthly statistical release. The dataare also available on the Board's web :>ite, http://www.fedcralreserve.gov/releases/gl7. Thelatest historical revision of the industrial production index and the capacity utilization rateswas released in November 1998. The recent annual revision is described in an article in theJanuary 1999 issue of the Bulletin. For a description of the methods of estimating industrialproduction and capacity utilization, see "Industrial Production and Capacity Utilization:Historical Revision and Recent Developments," Federal Reserve Bulletin, vol. 83 (February1997), pp. 67-92, and the references cited therein. For details about the construction ofindividual industrial production series, see "Industrial Production: 1989 Developments andHistorical Revision." Federal Reser\'e Bulletin, vol. 76 (April 1990), pp. 187-204.
2. Capacity utilization is calculated as the ratio of the Federal Reserve's seasonally adjustedindex of industrial production to the corresponding index of capacity.
3. Primary processing includes textiles; lumber: paper; industrial clu1* u uls; syntheticmaterials; fertilizer materials; petroleum products: rubber and plastics; stone, clay, and glass;primary metals; and fabricated metals.
4. Advanced processing includes foods: tobacco; apparel; furniture and fixtures; printingand publishing; chemical products such as drugs and toiletries; agricultural chemicals; leatherand products; machinery; transportation equipment: instruments; and miscellaneous manufac-tures.
5. Monthly highs. 1978-80; monthly lows, 1982.6. Monthly highs, 1988-89; monthly lows, 1990-91.
Digitized for FRASER http://fraser.stlouisfed.org/ Federal Reserve Bank of St. Louis
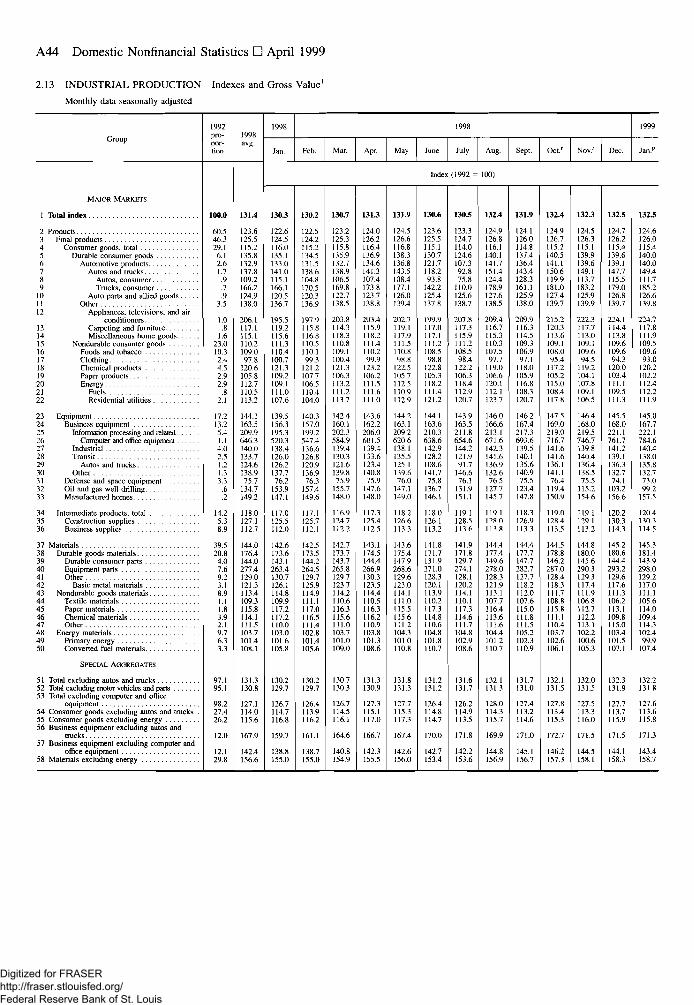
A44 Domestic Nonfinancial Statistics • April 1999
2.13 INDUSTRIAL PRODUCTION Indexes and Gross Value1
Monthly data seasonally adjusted
Group
1992pro-por-tion
1998ave.
1998 1998
Apr. May July Aug. Sept. Oct.r Nov.r Dec.
1999
Jan.p
Index (1992= 100)
MAJOR MARKETS
1 Total index
2 Products3 Final products4 Consumer goods, total5 Durable consumer goods6 Automotive products7 Autos and trucks8 Autos, consumer9 Trucks, consumer
10 Auto parts and allied goods11 Other12 Appliances, televisions, and
conditioners13 Carpeting and furniture14 Miscellaneous home goods15 Nondurable consumer goods16 Foods and tobacco17 Clothing18 Chemical products19 Paper products20 Energy21 Fuels22 Residential utilities
23 Equipment24 Business equipment25 Information processing and related26 Computer and office equipment27 Industrial28 Transit29 Autos and trucks30 Other31 Defense and space equipment32 Oil and gas well drilling33 Manufactured homes
34 Intermediate products, total35 Construction supplies36 Business supplies
37 Materials38 Durable goods materials39 Durable consumer parts40 Equipment parts41 Other42 Basic metal materials43 Nondurable goods materials44 Textile materials45 Paper materials46 Chemical materials47 Other48 Energy materials49 Primary energy50 Converted fuel materials
SPECIAL AGGREGATES
51 Total excluding autos and trucks52 Total excluding motor vehicles and parts53 Total excluding computer and office
equipment54 Consumer goods excluding autos and trucks55 Consumer goods excluding energy56 Business equipment excluding autos and
trucks57 Business equipment excluding computer and
office equipment58 Materials excluding energy
100.0
60.546.329.16.12.61.7.9.7.9
3.5
1.0.8
1.623.010.32.44.52.92.9
.82.1
17.213.25.41.14.02.51.21.33.3
.6
.2
14.25.38.9
39.520.84.07.69.23.18.9I.I1.83.92.19.76.33.3
97.195.1
98.227.426.2
12.129.8
131.4
123.6125.5115.2135.8132.9137.8109.2166.2124.9138.0
206.1117.1115.1110.2109.097.8
120.6105.8112.7110.5113.2
144.1163.5209.9646.3140.0133.7124.6138.975.7
134.7149.2
118.0127.1112.7
144.0176.4144.0277.4129.0121.3113.4109.3115.8114.1111.5103.7101.4108.1
131.3130.8
127.1114.0115.6
142.4156.6
1303
122.6124.5116.0135.1133.0141.0115.1166.1120.5136.7
195.5119.2115.6111.3110.4100.7121.3109.2109.1111.0107.6
139.5156.3195.3520.3138.4126.0126.2137.776.2
153.9147.1
117.0125.5112.0
142.6173.6143.1263.4130.7126.1114.8109.9117.2117.2110.0103.0101.6105.8
130.2129.7
126.7114.7116.8
138.8155.0
130.2
122.5124.2115.2134 5131.5138.6104.8170.5120.3136.9
197.9115.8116.8110 5110.199.3
121.2107.7106.5110.4104.0
140.3157.0199.2547.4136.6126.8120.9136.976.3
157.4149.6
117.1125.7112.1
142.5173.5144.2264.5129.7125.9114.9111.1117.0116.5111.4102.8101.4105.6
130.2129.7
126.4113.9116.2
161.1
138.7155.0
130.7
123.2125.3115.8135.9132.7138.9106.5169.8122.7138.5
203.8114.3118.3110.8109.1100.4121.3106.3113.2111.2113.7
142.4160.1202.3584.9139.4130.3121.6139.875.9
155.7148.0
116.9124.7112.2
142.7173.7143.7265.8129.7123.7114.2110.6116.3115.6111.0103.7101.0109.0
130.7130.3
126.7114.5116.1
164.6
140.8154.9
131.3
124.0126.2116.4136.9134.6141.3107.4173.8123.7138.8
203.4115.9118.2111.4110.299.9
123.2106.2111.5111.6111.0
143.6162.2206.0601.5139.4133.6123.4140.875.9
147.6148.0
117.3125.4112.5
143.1174.5144.4266.9130.3123.5114.4110.5116.3116.2110.9103.8101.3108.6
131.3130.9
127.3115.1117.0
166.7
142.3155.5
131.9
124.5126.6116.8138.3136.8143.5108.4177.1126.0139.4
202.7119.1117.9111.5110.898.8
122.5105.7112.5110.9112.9
144.2163.1209.2620.6138.1135.5125.1139.676.0
147.1149.0
118.2126.6113.3
143.6175.4147.9268.6129.6123.0114.1111.0115.5115.6111.2104.3101.0110.8
131.8131.3
127.7115.3117.3
167.4
142.6156.0
130.6
123.6125.5115.1130.7121.7118.293.8
142.2125.4137.8
199.9117.0117.1111.2108.598.8
122.8105.3118.2111.4121.2
144.1163.6210.3638.6142.9128.2108.6141.775.8
136.7146.1
118.0126.1113.2
141.8171.7131.9271.0128.3120.1113.9110.2117.3114.8110.6104.8101.8110.7
131.2131.2
126.4114.8114.7
170.0
142.7153.4
130.5
123.3124.7114.0124.6107.392.875.8
110.0125.6138.7
207.8117.3115.9m i108.598.4
122.2106.3118.4112.9120.7
143.9163.5211.8654.6144.2121.991.7
146.676.1
131.9151.1
119.1128.5113.6
141.9171.8129.7274.1128.1120.2114.1110.1117.3114.6111.7104.8102.9108.6
131.6131.7
126.2114.9113.5
171.8
142.2153.6
132.4
124.9126.8116.1140.1141.7151.4124.4178.9127.6138.5
209.4116.7115.3110.3107.597.7
119.0106.6120.1112.1123.7
146.0166.6213.1671.6142.3141.6136.9132.676.5
127.7145.7
119.1128.0113.8
144.4177.4149.6278.0128.3121.9113.1107.7116.4113.6111.6104.4101.2110.7
132.1131.3
128.0114.3115.7
169.9
144.8156.9
131.9
124.1126.0114.8137.4136.4143.4128.3161.1125.9138.0
209.9116.3114.5109.3106.997.1
118.0105.9116.8108.3120.7
146.2167.4217.3693.6139.5140.1135.6140.975.5
123.4147.8
118.3126.9113.3
144.4177.7147.7282.7127.7118.2112.0107.6115.0111.8111.5105.2102.3110.9
131.7131.0
ill A113.2114.6
171.0
145.1156.7
132.4
124.9126.7115.2140.5141.1150.6119.9181.0127.4139.7
215.2120.3113.6109.1108.095.4
117.2105.2115.0108.4117.8
147.5169.0219.0716.7141.6141.6136.1141.176.4
119.4150.9
119.0128.4113.5
144.5178.8146.2287.0128.4118.3111.7108.8115.8111.1110.4103.7102.6106.1
132.1131.5
127.8113.4115.3
172.7
146.2157.3
132.3
124.5126.3115.1139.9139.6149.1113.7183.2125.9139.9
222.3117.7113.0109.1109.694.5
119.2104.1107.8109.1106.5
146.4168.0219.5746.7139.8140.4136.4138.575.5
115.2154.6
119.1129.1113.2
144.8180.0145.6290.3129.3117.4111.9106.8112.7112.2113.1102.2100.6105.3
132.0131.5
127.5113.3116.0
171.5
144.5158.1
132.5
124.7126.2115.4139.6139.1147.7115.5179.0126.8139.7
224.1114.4113.8109.6109.694.3
120.0103.4111.1109.5111.3
145.5168.0221.1761.7141.2139.1136.3132.774.1
103.2156.6
120.2130.3114.3
145.2180.6144.4293.2129.6117.6111.3106.2113.1109.8115.0103.4101.5107.1
132.3131.9
127.7113.7115.9
171.5
144.1158.3
132.5
124.6126.0115.4140.0140.0149.4111.7185.2126.6139.8
224.7117.8111.9109.5109.693.0
120.2102.2112.4112.2111.9
145.0167.7222.1784.6140.4138.0135.8132.773.099.2
157.5
120.4130.3114.5
145.3181.4143.9298.0129.2117.0111.1105.6114.0109.4114.3102.499.9
107.4
132.2131.8
127.6113.6115.8
143.4158.7
Digitized for FRASER http://fraser.stlouisfed.org/ Federal Reserve Bank of St. Louis
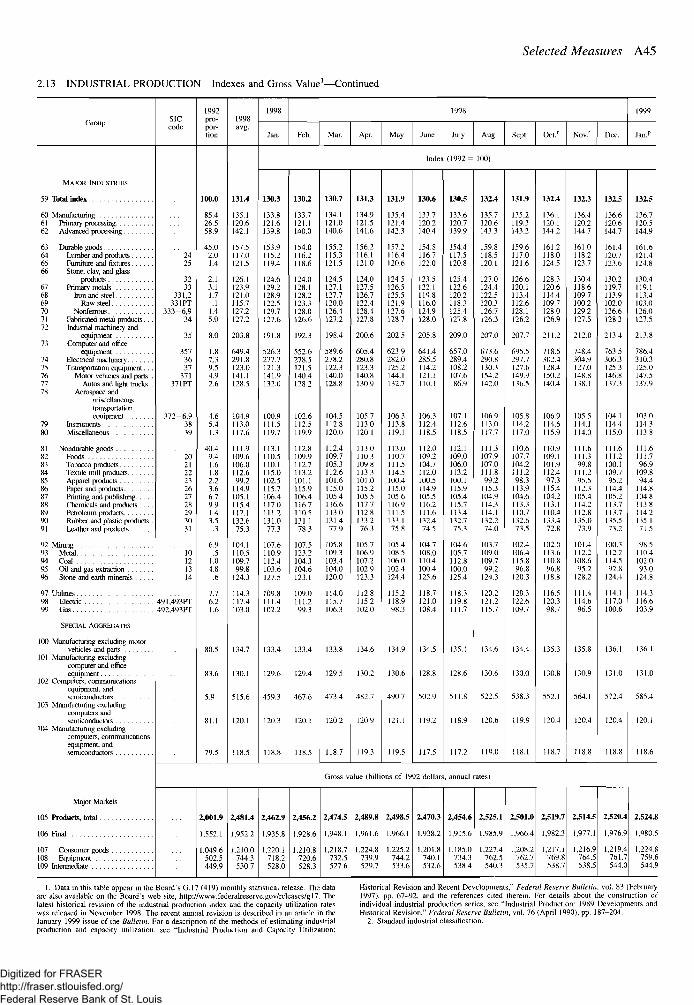
Selected Measures A45
2.13 INDUSTRIAL PRODUCTION Indexes and Gross Value1—Continued
Group
MAJOR INDUSTRIES
59 Ibtal index
60 Manufacturing61 Primary processing62 Advanced processing
63 Durable goods64 Lumber and products65 Furniture and fixtures66 Stone, clay, and glass
products67 Primary metals68 Iron and steel69 Raw steel70 Nonferrous71 Fabricated metal products. . .72 Industrial machinery and
equipment73 Computer and office
equipment74 Electrical machinery75 Transportation equipment.. .76 Motor vehicles and parts .77 Autos and light trucks .78 Aerospace and
miscellaneoustransportationequipment
79 Instruments80 Miscellaneous
81 Nondurable goods82 Foods83 Tobacco products84 Textile mill products85 Apparel products86 Faper and products87 Printing and publishing88 Chemicals and products . . . .89 Petroleum products90 Rubber and plastic products .91 Leather and products
92 Mining93 Metal94 Coal95 Oil and gas extraction% Stone and earth minerals
97 Utilities98 Electric99 Gas
SPECIAL AGGREGATES
100 Manufacturing excluding motorvehicles and parts
101 Manufacturing excludingcomputer and officeequipment
102 Computers, communicationsequipment, andsemiconductors
103 Manufacturing excludingcomputers andsemiconductors
104 Manufacturing excludingcomputers, communicationsequipment, andsemiconductors
Major Markets
105 Products, total
106 Final
107 Consumer goods108 Equipment109 Intermediate
SICcode
2425
3233
331,2331PT
333-6,934
35
3573637
371371PT
372-6,93839
20212223262728293031
10121314
491.493PT492.493PT
1992pro-por-tion
100.0
85.426.558.9
45.02.01.4
2.13.11.7.1
1.45.0
8.0
1.87.39.54.92.6
4.65.41.3
40.4941.61.82.23.66.79.91 43.5
.3
6.9.5
1.04.8
.6
7.76.21.6
80.5
83.6
5.9
81.1
79.5
2,001.9
1.552.1
1,049.6'502.5449.9
1998avg.
131.4
135.1120.6142.1
157.5117.0121.5
126.1123.9121.0115.7127.2127.2
203.8
649.4291.8123.0141.1128.5
104.9113.0117.6
111.9109.6106.0112.699.2
114.9105.1115.4112.1132.675.3
104.1110.5109.799.8
124.3
114.3117.4103.0
134.7
130.1
515.6
120.1
118.5
2,481.4
1,952.2
1,210.0744.3530.7
1998
Jan.
130.3
133.8121.6139.8
153.9115.2119.4
124.6129.2128.9122.5129.7127.6
191.8
526.3277.7121.3141.9132.0
100.9111.5119.7
113.1110.5110.1115.0102.5115.7106.4117.0111.2131.077.3
107.6110.9112.4103.6127.5
109.8111.4102.2
133.4
129.6
459.3
120.3
118.8
2,462.9
1,935.8
1 ^20 1'718.2528.0
Feb.
130.2
133.7121.1140.0
154.0116.2118.6
124.0128.1128.2123.328.0
126.6
192.3
552.6278.5121.5140.4128.2
102.6112.5119.9
112.8109.9112.7113.2101.1115.9106.4116.7110.5131.178.3
107.5123.2104.1104.6123.1
109.0111.299.3
133.4
129.4
467.6
120.1
118.5
2,456.2
1.928.6
1.210.8720.6528.3
Mar.
130.7
134.1121.0140.6
155.2115.3121.5
124.5127.1127.7120.0126.4127.2
198.4
589.6278.2122.3140.0128 8
104.5112.8120.0
112.4109.7105.3112.6101.6115.0105.4116.6113.0131.477.9
105.8109.3103.4104.0120.0
114.0115.7106.3
133.8
129.5
473.4
120.2
118.7
Gross v
2,474.5
1,948.1
1,218.7732.5527.6
Apr.
131.3
134 9121.5141.6
156.2116.1121.0
124.0127.5126.7122.4128.4127.8
200.6
605.4280.8123.3140.8130.9
105.7113.0120.1
113.0110.3109.8113.3101.0115.2105.5117.7112.8133.276.3
105.7106.9107.2102.9123.3
112.8115.2102.0
134.6
130.2
482.7
120.9
119.3
May
131.9
135.4121.4142.3
157.2116.4120.6
124.5126.5125.5121.9127.6128.7
202.5
623 9282.0125.2144.1132.7
106.3113.8119.1
113.0110.7111.5114.5100.4115.0105.6116.9111.5133.175.8
105.4108.5106.0102.4124.4
115.2118.998.3
134.9
130.6
490.7
121.1
119.5
June
1998
July
Index (1992 =
130.6
133.7120.2140.4
154.S116.7122.0
123.5122.1119.8116.0124.9128.0
205.8
641.4285.5114.2121.1110.1
106.3112.4118.5
112.0109.2104.7112.0100.5114.9105.5116.2111.6132.474.5
104.7108.0110.4100.4125.6
118.7121.0108.4
134.5
128.8
502.9
119.2
117.5
alue (billions of 1992 dollars
2,489.8
1,961.6
1 224 8739.9529.7
2,498.5
1,966.1
1 225 2744.2533.6
2,470.3
1.938.2
1 201 8740.1512.6
130.5
133.6120.7139.9
154.4117.5120.8
125.4122.6120.2118.3125.4127.8
209.0
657.0289.4108.2107.686.9
107.1112.6118.5
112.1109.0106.0113.21O0.1115.9105.4115.7113.4132.775.3
104.6105.7112.8100.0125.4
1183119.8111.7
135.1
128.6
511.8
118.9
117.2
Aug.
100)
132.4
135.7120.6143.3
159.8118.5120.1
127.0124.4122.5120.3126.7126.3
207.0
673.6290.8130.3154.2142.0
106.9113.0117.7
111.3107.9107.0111.899.2
115.3104.9114.3114.1132.274.0
103.7109.0109.799.2
124.3
120.2121.2115.7
134.6
130.6
522.5
120.6
119.0
, annual rates)
2,454.6
1,915.6
1 185 0734.3538.4
2,525.1
1.985.9
1 227 4762.5540.3
Sept.
131.9
135.2119.3143.2
159.6117.0121.6
126.6120.1113.4112.6128.1126.2
207.7
695.5297.7127.6149.91 '6.5
105.8114.2117.0
110.6107.7104.2111.298.3
113.9104.6113.3110.7132.673.5
102.4106.4115.896.8
120.3
120.1122.6109.7
134.4
130.0
538.3
119.9
118.1
2,501.0
1,966.4
1 208 2762.7535.7
Oct.'
132.4
136.1120.1144.2
161.2118.0124.5
128.3120.6114.4109.7128.0126.9
211.2
718.5302.4128.4150.2140.4
106.9114.6115.9
110.9109.1101.9112.497.3
115.4104.2113.1110.4133.472.8
102.0113.6110.896.8
118.8
116.5120.398.7
135.3
130.8
552.1
120.4
118.7
2,519.7
1,982.3
1 217 1769.8538.7
Nov.r
132.3
136.4120.2144.7
161.0118.2123.7
130.4118.6109.7100.2129.2127.5
212.0
748.4304.9127.0148.8138.1
105.5114.1114.0
111.6111.399.8
111.295^5
112.3105.41142112.8135.073.9
101.4112.2108.695.2
128.2
111.4114.696.5
135.8
130.9
564.1
120.4
118.8
2,514.5
1,977.1
1,216.9764.5538.5
Dec.
132.5
136.6120.6144.7
161.4120.7123.6
130.2119.7113.9102.0126.6128.3
213.4
763 5306.3125.3146.8137.3
104.1114.4115.0
111.6111.2100.1109.795.2
114.4105.2113.711.1.7135.573.2
100.3112.2114.192.8
124.4
114.1117.0100.6
136.1
131.0
572.4
120.4
118.8
2,520.4
1,976.9
1,219.4761.7544.0
1999
Jan.p
132.5
136.7120.5144.9
161.6121.4124.8
130.4119.1113.4103.0126.0127.5
213.8
786 4310.3125.0147.5117 9
103.0114.3113.8
111.6111.796.9
109.894.4
114.8104.8113.8114.2135.171.5
98.5110.4102.093.0
124.8
114.3116.6103.9
136.1
131.0
585.4
120.1
118.6
2,524.8
1 980.5
1 224.8759.6544.9
I. Data in this table appear in the Board's G.17 (419) monthly statistical release. The dataare also available on the Board's web site, http://www.federalreserve.gov/releases/gl7. Thelatest historical revision of the industrial production index and the capacity utilization rateswas released in November 1998. The recent annual revision is described in an article in theJanuary 1999 issue of the Bulteiin. For a description of the methods of estimating industrialproduction and capacity utilization, see "Industrial Production and Capacity Utilization:
Historical Revision and Recent Developments," Federal Reserve Bulletin, voi. 83 (February1997), pp, 67-92, and the references cited therein. For details about the construction ofindividual industrial production series, see "Industrial Production: 1989 Developments andHistorical Revision," Federal Reserve Bulletin, vol. 76 (April 1990), pp. 187-204.
2. Standard industrial classification.
Digitized for FRASER http://fraser.stlouisfed.org/ Federal Reserve Bank of St. Louis
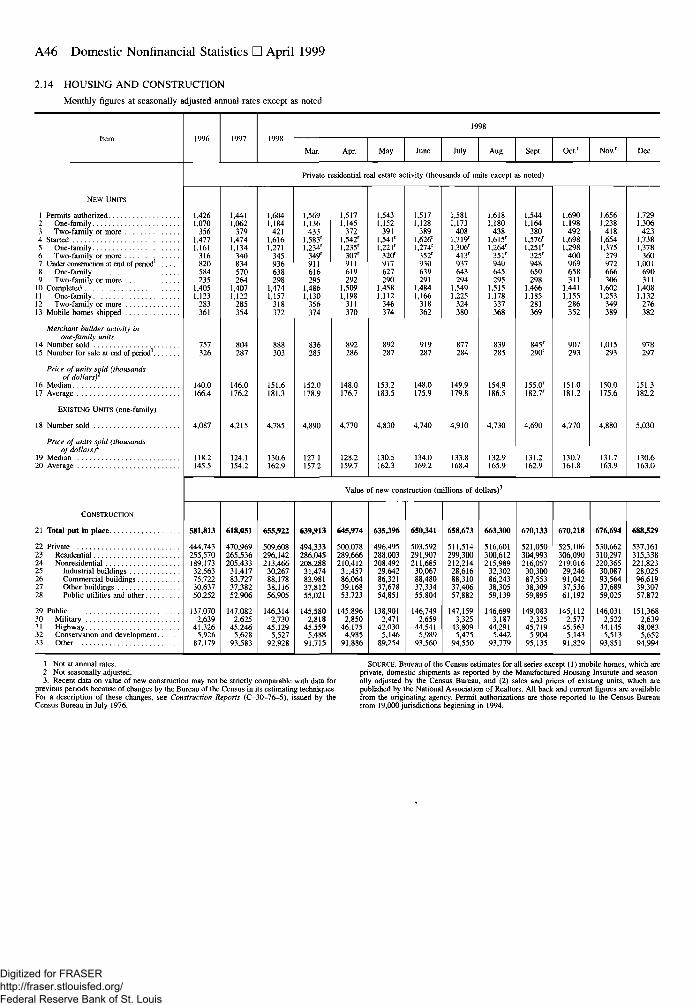
A46 Domestic Nonfinancial Statistics • April 1999
2.14 HOUSING AND CONSTRUCTION
Monthly figures at seasonally adjusted annual rates except as noted
1998
Mar. Apr. May June July Aug. Sept. Oct Nov.' Dec.
NEW UNITS
1 Permits authorized2 One-family3 Two-family or more4 Started5 One-family6 Two-family or more7 Under constroction al end of period1.8 One-family9 Two-family or more
10 Completed11 One-family12 Two-family or more13 Mobile homes shipped
Merchant builder activity inone-family units
14 Number sold15 Number for sale at end of period1..
Price of units sold (thousandsof dollars)1
16 Median17 Average
EXISTING UNITS (one-family)
18 Number sold
Price of units sold (thousandsof dollars)1
19 Median20 Average
CONSTRUCTION
21 Total put in place
22 Private23 Residential24 Nonresidential25 Industrial buildings26 Commercial buildings27 Other buildings28 Public utilities and other
29 Public30 Military31 Highway32 Conservation and development.33 Other
1,4261,070
3561,4771,161
316820584235
1,4051,123
283361
757326
140.0166.4
4,087
118.2145.5
Private residential real estate activity (thousands of units except as noted)
1,4411,062379
1,4741,134340834570264
1,4071,122285354
804287
146.0176.2
4,215
124.1154.2
1,6041,184421
1,6161,271345936638298
1,4741,157318372
888303
151.6181.3
4,785
130.6162.9
1,5691,136
4331,583'1,234'349'911616295
1,4861,130356374
836285
152.0
178.9
4,890
127.1157.2
1,5171.145372
1,542'1,235'307'911619292
1,5091,198311370
892286
148.0
176.7
4,770
128.2159.7
1,5431,152391
1,541'1,221'320'917627290
1.4581.112346374
892287
153.2183.5
4,830
130.5162.3
1,5171,128389
1,626'1,274'352'930639291
1,4841,166318362
919287
148.0175.9
4,740
134.0169.2
1,5811,173408
1,719'1,306'413'937643294
1,5491,225324380
877284
149.9179.8
4,910
133.8168.4
1,6181,180438
1,615'1,264'351'940645295
1,5151,178337368
839285
154.9
186.5
4,730
132.9165.9
1,5441,164380
1,576'1,251'325'948650298
1,4661,185281369
845'2<Xf
182.7'
4,690
131.2162.9
1.6901,198492
1,6981,298400969658311
1,4411,155286352
907293
151.0181.2
4,770
130.7161.8
1,6561.238418
1,6541,375279972666306
1,6021.253349389
1,015293
150.0175.6
4,880
131.7163.9
Value of new construction (millions of dollars)
1,7291,306423
1,7381,378360
1,001690311
1,4081,132276
382
978297
151.3182.2
5,030
130.6163.0
581,813
444,743255,570189,17332,56375,72230,63750,252
137,0702,639
41,3265,92687,179
618,051
470,969
265,536205.43331.41783.72737,38252,906
147,0822,625
45.2465,62893,583
655,922
509,608296,142213,46630,26788,17838,11656,905
146,3142,730
45,1295,527
92,928
639,913
494,333
286,045208,28831.47483,98137,81255,021
145,5802,818
45,5595,488
91.715
645,974
500,078
289,666210,41231,45786,06439,16853,723
145.8962,850
46.1754,98591,886
6353%
496,495288,003208,49229,64286,32137,67854,851
138,9012,471
42,0305,14689,254
650341
503,592291,907211,68530,06788,48037,33455,804
146,7492,659
44,5415,98993.560
658,673
511.514299.300212,21428,61688,31037,40657,882
147,1593,325
43,8095,47594,550
663^00
516,601
300,612215,98932,30286,24338,30559,139
146,6993.187
44,2915,442
93,779
670,133
521,050
304,993216,05730,30087,55338,30959,895
149,0832,325
45,7195,904
95,135
670,218
525.106
306,090219,01629,24691,04237,53661,192
145,1122,577
45,5635.143
91.829
676,694
530,662310,297220,36530,08793,56437,68959,025
146,0312,522
44,1455,513
93,851
688,529
537,161
315,338221,82328,02596,61939,30757,872
151,3682,639
48,0835,652
94,994
1. Not at annual rates.2. Not seasonally adjusted.3. Recent data on value of new construction may not be strictly comparable with data for
previous periods because of changes by the Bureau of the Census in its estimating techniques.For a description of these changes, see Construction Reports (C-30-76-5), issued by theCensus Bureau in July 1976.
areason-
SOURCE. Bureau of the Census estimates for all series except (1) mobile homes, whichprivate, domestic shipments as reported by the Manufactured Housing Institute and seasally adjusted by the Census Bureau, and (2) sales and prices of existing units, which arepublished by the National Association of Realtors. All back and current figures are availablefrom the originating agency. Permit authorizations are those reported to the Census Bureaufrom 19,000 jurisdictions beginning in 1994.
Digitized for FRASER http://fraser.stlouisfed.org/ Federal Reserve Bank of St. Louis
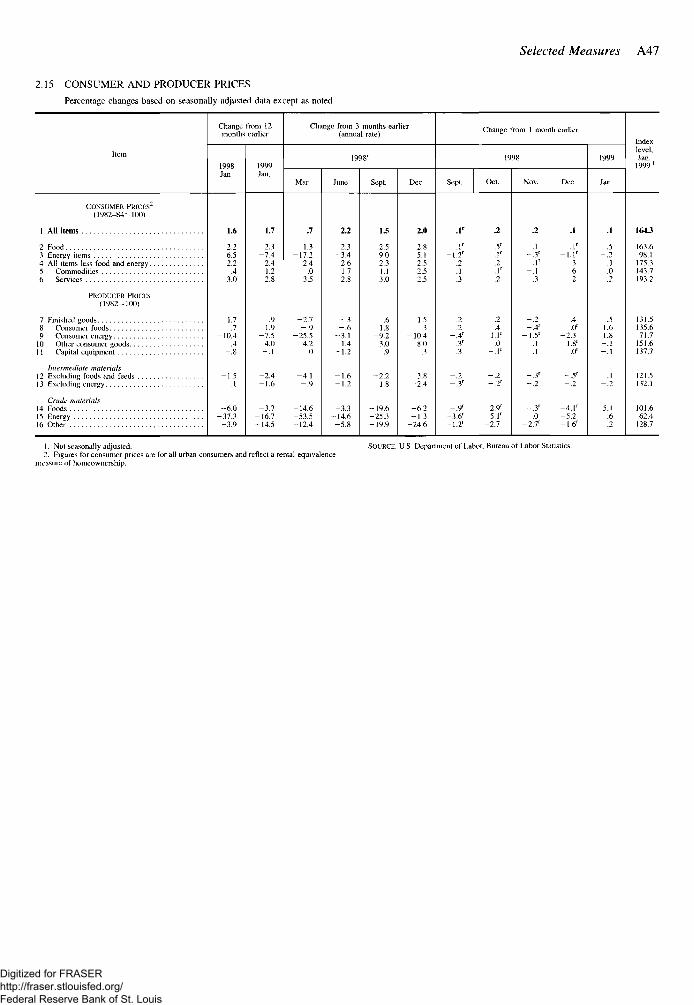
Selected Measures A47
2.15 CONSUMER AND PRODUCER PRICES
Percentage changes based on seasonally adjusted data except as noted
Change from 12months earlier
1998Jan.
1999Jan.
Change from 3 months earlier(annual rate)
1998r
Sept.
Change from 1 month earlier
Sept. Oct. Nov. Dec.
1999
Indexlevel,Jan.
1999'
CONSUMER PRICES^(1982-84=100)
1 All items
2 Food3 Energy items4 All items less food and energy.5 Commodities6 Services
PRODUCER PRICES(1982=100)
7 Finished goods8 Consumer foods9 Consumer energy
10 Other consumer goods11 Capital equipment
Intermediate materials12 Excluding foods and feeds13 Excluding energy
Crude materials14 Foods15 Energy16 Other
1.6
-6.52.2
.43.0
-1.7- .7
-10.4.4
-1.5.1
- 6 . 0-37 .3
-3.9
1.7
2.1- 7 . 4
2.41.22.8
.91.9
-7.54.0
-2.4-1.6
- 3 . 7-16 .7-14.5
.7
1.3-17.2
2.4.0
3.5
-2.7- . 9
-25.54.2
.0
-4.1- . 9
-14.6-53.5-12.4
2.2
2.3- 3 . 4
2.61.7
- . 3- . 6
-3.11.4
-1.2
-1.6-1.2
-3.3-14.6
-5.8
1.5
2.5- 9 . 0
2.31.13.0
-9.23.0
.9
- 2 . 2- 1 . 8
-19.6-25.3-19.9
2.0
2.8-5.1
2.5252.5
1.5- . 3
-10.48.0
-3.8-2.4
-6.2-1.3
-24.6
. 1 '- 1 . 2 '
.2- . 1
.3
- . 9 '-3.6'-1.2'
.0- . 1 '
- . 2- . 2 '
2.9'5.1'
-2.7
.1- . 3 '
. 1 '
- . 4 '- 1 . 5 '
.1
.1
- . 3 '- . 2
.0- 2 . 7 '
.1 '-1.1 '
3.6.2
.4Sf
-2.31.8'.0'
- . 5 '- . 2
- 4 . 1 '-5.2-1.6 '
.5!.(>1.8
- . )- . 1
5.1.6
164.3
163.698.1
175.3143.7193.2
131.5135.671.7
151.6137.7
121.5132.1
101.662.4
128.7
1. Not seasonally adjusted.2. Figures for consumer prices are for all urban consumers and reflect a rental-equivalence
measure of homeownership.
SOURCE. US Department of Labor. Bureau of Labor Statistics.
Digitized for FRASER http://fraser.stlouisfed.org/ Federal Reserve Bank of St. Louis
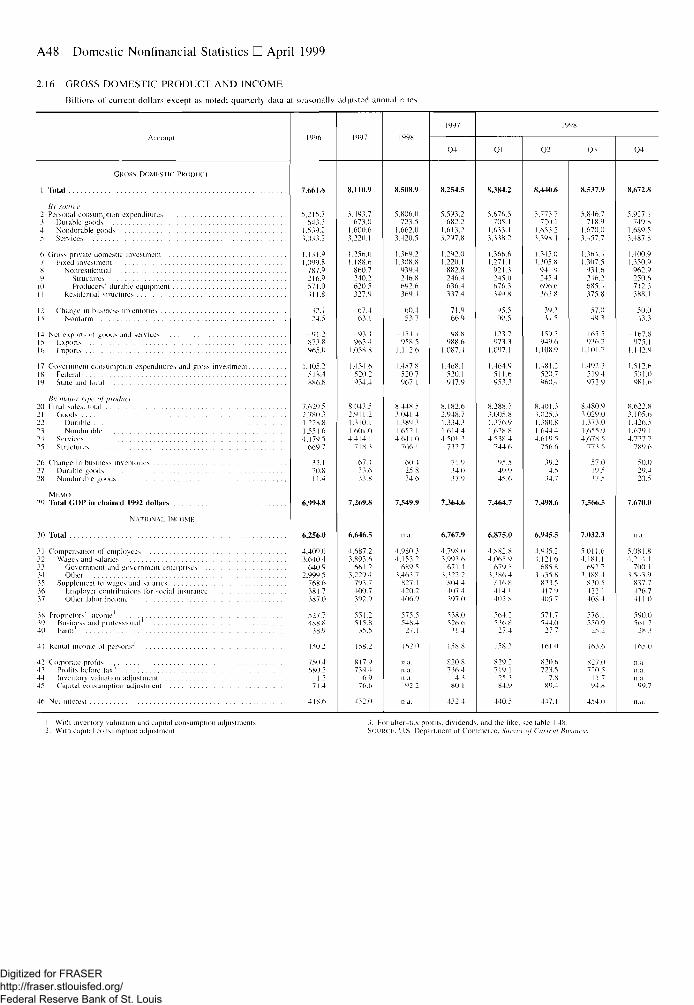
A48 Domestic Nonfinancial Statistics D April 1999
2.16 GROSS DOMESTIC PRODUCT AND INCOMEBillions of current dollars except as noted; quarterly data at seasonally adjusted annual rates
GROSS DOMI.STIC PRODI ICI
1 Total
BY source
3 Durable goods4 Nondurable goods5 Services
7 Fixed investment8 Nonrcsitiential9 Structures
10 Producers' durable equipment11 Residential Mrucliircs
12 Change in business inventoriesI ^ Nontarni
LS Hxpoits16 Imports
IS Federal14 State and local
flv nitij(>r rv/h' of product^0 Final sales total2 1 Goods2.1. Durahle23 Nondurable"M Services25 Structures
27 Durable goods28 Nondurable goods
Ml-M()29 Total GDP in chained 1992 dollars
NATIONAL INCOMH
30 Total
3 1 Compensation of employees32 Wages and salaries '33 Government and government enterprises34 Other 135 Supplement to wages mid salaries36 Hmployer eonlribtuions lor social insurance37 Other labor income
V) Busing and prolessionul1
40 Farm1
4 ! Rental income ot persons2
42 Corporate profits1
43 Profits before tax1
4? Capital consumption adjustment
46 Nel interest
7.661.6
5.215.7643.3
1.539.21,033.2
1.131.')1.099.8
787.')216.9571.0311.8
32.1^4 s
- 9 1 . :K73.8965.1)
5 1 8.48R6.X
7.629.52.780.11.228.81.55 1 f>4.179.5
669.7
32.120.81 1.4
6.994.8
6,256.0
4,409.03.640.4
640.92.999.5
768.6381.7387.0
527.7488.8
38.9
150.2
750.46K0.2
71.4
4 IK.6
8.110.9
5,493.7673.0
1,600.63,220.1
l,"'56.01,188.6
860.7240.2620.5327.9
67.461 1
-93.4965.4
1.058.8
5202934.4
8,(143.52,911.21.310.11.601.04.414 1
718.3
67.411.631.8
7,269.8
6,646.5
4,687.23.893.6
664.23 229 4
791.7400.7392.9
551.2515.8
35.5
158.2
817.9754.4
6 976.6
432.0
8,508.9
5,806.072.1.5
1.662.03.420.5
1,369.^1.308.8
919.4246.8692.6369.4
60.4517
-154. ]958.5
1.1 12.6
520.7967.1
8.448.53.041 41,189.11.652.14.641.0
766.1
60.425.834.6
7,549.9
,,.a.
4.980.14.151.2
689.53,463.7
827.1420.2406.9
575.5548.4
27.1
162.0
n.a.n.a.
n.a.
1997
0 4
8,254.5
5.593.2682.2
1.611.23.297.8
1.29">.O1.220.1
882.8246.4636.4337.4
71.966 9
-98.8988.6
1.087.4
520.1947.9
8,182.62.948.71.334.31.614.44,501.2
732.7
71.914.037.9
7.J64.6
6,767.9
4.798.03,993.6
671.41 1 " > ^ ~>
804.4407.4197.0
558.0526 6
M.4
158.8
820.8736.4
4.180.1
412.4
1998
01
8.384.2
5.676.5705.1
1.611.13.138.2
1.366.61.271.1
921.3245.0676.3349.8
95.590 5
-121.7971.1
1.097.1
511.6953.3
8,288.71.005.81.376.91.628.84.538.4
744.6
95.549.945.6
7.464.7
6.875.0
4.882.84.065 9
679.53.3864
816.8414.1402.8
564.2516.8
27.4
158.1
829.2719.1
25.184.9
440.5
02
8.440.6
5.771.7720.1
1.655.21.198.4
1.345.01.105.8
941 9245.4696.6365 8
19.211 i
-159.3949.6
1,108.9
520.7960.4
8.401.31.025.11,380.81.644.44.619.5
756.6
39.24.5
34.7
7,498.6
6.945.5
4.945.24.121.6
685.81.435.8
821.5417 9405 7
571.7544.0
27 7
161 0
820.6723.5
7.889.4
447.1
03
8,537.9
5.846.7718.9
1 670 01.457.7
[. 164.41.107.5
911.6246.2685.4175.8
57.049 1
-165.5936.2
1,101.7
1 497 1519.4972.9
8,480.91,029.01.171.01.655.94,678.5
773.5
57 019.517.5
7,566.5
7.032.3
5.011.64.181.1
692 71,488.4
830.5422.1408.4
576.1550.9
25.2
161.6
827.0720.5
1 1.794.8
454.0
04
8,672.8
5.927.1749.8
1.689.53.487.8
1.400.91.150.9
962.9250.6712.1.188.1
50.041 1
-167 .8 '975.1
1.142.9
531.0981.6
8.62^ 83.105.61.426.51.679.14.727.7
789.6
50.029.420.5
7.670.0
n.a.
5.081.84.244.1
700 11.543.9
817.7426.741 1.0
590.0561 7
28.3
165.0
n.an.a.n.a.
99 7
n..i.
I With inventory valuation and capital consumption adju:2. With capital consumption adjustment.
3. For after-tax profits, dividends, and the like.SOURCK. U.S. Department of Commerce, Survc
,ee table I 4S.of CitiTvm Bw
Digitized for FRASER http://fraser.stlouisfed.org/ Federal Reserve Bank of St. Louis
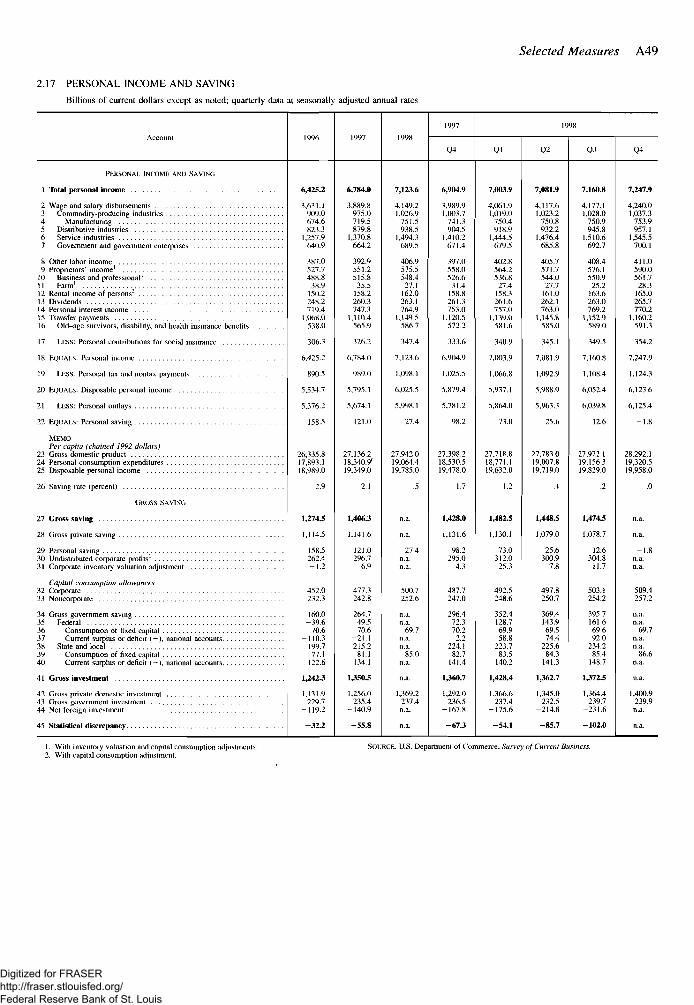
Selected Measures A49
2.17 PERSONAL INCOME AND SAVING
Billions of current dollars except as noted; quarterly data at seasonally adjusted annual rates
PERSONAL INCOME AND SAVING
I Total personal income
2 Wage and salary disbursements3 Commodity-producing industries
9 Proprietors' income1
11 Farm1
14 Personal interest income
16 Old-age survivors, disability, and health insurance benefits
18 EQUALS: Personal income
19 LESS: Personal tax and nontax payments
MEMOPer capita (chained 1992 dollars)
23 Gross domestic product24 Personal consumption expenditures
26 Saving rate (percent)
GROSS SAVING
27 Gross saving
28 Gross private saving
Capital consumption allowances32 Corporate
35 Federal
38 State and local
41 Gross investment
43 Gross government investment
45 Statistical discrepancy
6,425.2
3,631.1909.0674.6823.3
1,257.9640.9
387.0527.7488.8
38.9150.2248.2719.4
1 068.0538.0
306.3
6,425.2
890.5
5 534 7
1376 2
158 5
26,335.817,893.118 989 0
2.9
1,274.5
1,114.5
158.5262.4-1.2
452.0232.3
160.0-39.6
70.6-110.3
199.777.1
122.6
1,242.3
1,131.9229.7
-119.2
-32.2
6,784.0
3,889.8975.0719.5879.8
1,370.8664.2
392.9551.2515.835.5
158.2260.3747.3
1 110 4565.9
326.2
6,784.0
989.0
5,795.1
5,674 1
121 0
27,136.218,340.9'19 349 0
2.1
1,4063
1.141.6
121.0296.7
6.9
477.3242.8
264.749.570.6
— 21.1215.2
81.1114.1
1,350.5
1,256.0235.4
-140.9
-55.8
7,123.6
4,149.21,026.9
751.5938.5
1,494.3689 5
406.9575.5548.427.1
162.0263.1764.9
1,149 5586.7
347.4
7,123.6
1,098.1
6,025.5
5,998.1
27 4
27,942.019,064.419,785.0
.5
n.a.
n.a.
27.4n.a.n.a.
500.7252 6
n.a.
69.7n.a.
85.0
n.a.
1,369.2237.4n.a.
n.a.
1997
04
6,904.9
3.989.91,003.7
741.3904.5
1.410.2671 4
397.0558.0526.6
31.4158.8261.3753.0
1,120.5572.2
333.6
6,904.9
1,025.5
5,879.4
5,781.2
98.2
27,398.218,530.519,478.0
1.7
1,428.0
1,131.6
98.2295.0
4.3
487.7247 0
296.472.370.2
2.2224.1
82.7141.4
1360.7
1,292.0236.5
-167.8
-67.3
1998
Ql
7,003.9
4,061.91,019.0
750.4918.9
1,444.5679 5
402.8564.2536.8
27.4158.3261.6757.0
1 139 0581.6
3409
7,003.9
1.066.8
5,937 1
5,864.0
73.0
27.718.818,771.119,632.0
1.2
1,482.5
1,130.1
73.0312.0
25.3
492.5248.6
352.4128.769.958.8
223.783.5
140.2
1,428.4
1,366.6237.4
-175.6
-54.1
Q2
7,081.9
4,117.61,023.2
750.8932.2
1,476.4685 8
405.7571.7544.0
27.7161.0262.1763.0
1 145 8585.0
345.1
7,081.9
1,092.9
5 988 9
5 963 3
25 6
27,783.019,007.819,719.0
.4
1,448.5
1,079.0
25.6300.9
7.8
497.8250.7
369.4143.969.574.4
225.684.3
141.3
1,362.7
1,345.0232.5
-214.8
-85.7
Q3
7,160.8
4,177.11,028.0
750.9945.8
1,510.6692 7
408.4576.1550.9
25.2163.6263.0769.2
1 152 9589.0
349.5
7,160.8
1,108.4
6,052 4
6 039 8
126
27,972.119,156.319 829 0
.2
1,474.5
1,078.7
12.6304.8
11.7
503.1254.2
395.7161.669.692.0
234.285.4
148.7
1372.5
1,364.4239.7
-231.6
-102.0
Q4
7,247.9
4,240.01,037.3
753.9957.1
1,545.5700.1
411.0590.0561.7
28.3165.0265.7770.2
1,160.2591.3
354.2
7,247.9
1,124.3
6,123.6
6 125 4
- 1 8
28,292.119,320.519,958.0
.0
n.a.
n.a.
-1.8n.a.
509.4257.2
n.a.69.7
n.a.
86.6
n.a.
1,400.9239.9n.a.
1. Wilh inventory valuation and capital consumption adjustments.2. With capital consumption adjustment.
SOURCE. U.S. Department of Commerce, Survey of Current Business.
Digitized for FRASER http://fraser.stlouisfed.org/ Federal Reserve Bank of St. Louis
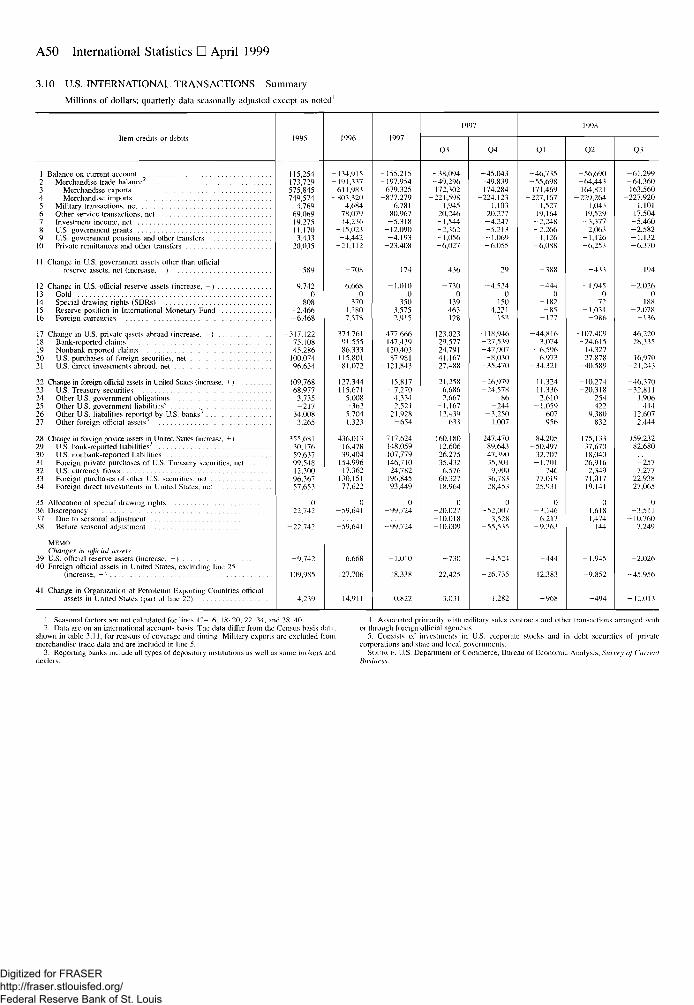
A50 International Statistics • April 1999
3.10 U.S. INTERNATIONAL TRANSACTIONS Summary
Millions of dollars; quarterly data seasonally adjusted execpt as noted1
llem credits or debits
1 Balance on current account
6 Other service transactions, net
8 U.S. government grants9 U.S. government pensions and other transfers
10 Private remittances and other transfers
11 Change in U.S. government assets other than officialreserve assets, net (increase, - )
12 Change in U.S. official reserve assets (increase, - )13 Gold14 Special drawing rights (SDRs)15 Reserve position in International Monetary Fund16 Foreign currencies
17 Change in U.S. private assets abroad (increase. - )18 Bank-reported claims1
19 Nonbank-rcportcd claims
21 U.S. direct investments abroad, net
22 Change in foreign official assets in United States (increase, +)23 U.S. Treasury securities24 Other U.S. government obligations25 Other U.S. government liabilities4
26 Other US liabilities reported by U S banks27 Other foreign official assets^
28 Change in foreign private assets in United States (increase. +129 U.S. bank-reported liabilities30 U.S. nonbank-rcported liabilities31 Foreign private purchases of U.S. Treasury securities, net32 U.S. currency Hows
34 Foreign direct investments in United States, net
35 Allocation of special drawing rights36 Discrepancy
38 Before seasonal adjustment
MEMOChanges in official assets
39 U.S. official reserve assets (increase, - )40 Foreign official assets in United States, excluding line 25
(increase, +1
41 Change in Organization ot Petroleum Exporting Countries officialassets in United States (part of line 22)
-115,254-173,729
575 845-749,574
4,76969,06919,275
-11,170-3,433
-20,035
-589
-9.7420
-808- 2,466-6.468
-317,122-75,108-45,286
-100,074-96,654
109,76868,977
3,735-217
34,0083,265
355,68130,17659,63799.54812,30096.36757,653
(I-22,742
-22.742
-9.742
109,985
4,239
-134,915-191,337
611,983-803,320
4,68478,07914,236
-15,023-4,442
-21.112
-708
6.6680
170-1.280
7.578
-374,761-91,555-86.333
-115,801-81.072
127,344115,671
5,008-3625,7041,323
436,01316,47839,404
154.99617.362
130,15177,622
0-59,641
-59,641
6.668
127,706
14,911
-155.215-197,954
679,325-877,279
6,78180.967-5.318
-12,090-4,193
-23.408
174
-1.0100
- 350-3,575
2,915
-477,666-147,439-120,403
-87,981-121.843
15.817-7.270
4.334-2.52121.928-654
717,624148.059107,779146,71024,782
196,84593,449
0-99.724
-99,724
-1,010
18,338
10,822
1997
03
- 38,094-49,296172,302
-221,5981,945
20,246-1,544-2,362-1,056-6,027
436
-7300
-139-463-128
-123.023-29,577-24.791-41,167-27,488
21,2586,6862,667
-1,16712.439
633
160,18012.60626,27535,4326.576
60.32718.964
0-20,027-10,018-10,009
-730
22,425
3.0.11
04
-45,043-49,839174,284
-224.1231.10.1
20,277-4,247-5,213•1,069
-6,055
29
-4,5240
-150-4.221
-153
-118,946-27,539-47,907
-8,030-35,470
-26,979-24,578
86-244
-3.2501,007
247,47089,64347,39035.3019.900
36.78328.453
0-52.007
3,528-55.535
-4.524
-26.735
-1,282
1998
01
-46,735-55,698171,469
-227,1671,527
19,164- 2,248- 2.266-1.126-6.088
-388
-4440
-182-85
-177
-44,8163,074
-6,596- 6 973
-34,321
11,32411,3362.610
-1,059-607-956
84,205-50,497
32,707-1,701
74677,01925.931
0-1.146
6,217-9.363
-444
12.383
-968
Q2
-56,690-64,443164,821
-229,2641,043
19,529-1,377-2,063-1,126-6,253
-4.13
- 1.9450
72-1.031
-986
-107,409-24,615-14,327-27,878-40,589
-10.274-20,318
254-4229,380
832
175,13337,67018,04026,9162,149
71.01719.141
01.6181,474
144
-1,945
-9.852
-494
Q i
-hi,299-64,360163,560
-227.9201,101
17,504-5,460-2,582-1,132-6,370
194
-2,0260
188-2.078
-136
-46.22(1- 28,335
16.970-21.243
-46.170-32.811
1.906-414
-12.607-2.444
159,23282,680
-2577,277
22.93827,065
0-3,511
-10,7607.249
-2,026
-45,956
-12.013
1. Seasonal factors are not calculated for line* 12-16, 18-20, 22-34, and 38^102. Data are on an international accounts basis. The data differ from (he Census basis data,
shown in table 3.11, for reasons of coverage and timing. Military exports arc excluded frommerchandise trade data and are included in line 5.
3. Reporting banks include all types of depository institutions as well as some brokers anddealers.
4. As iated priior through foreign ofri<
5. Consists of inve:corporations and state
SOURCE. U.S. Depai
Business.
ly with military sales contracts and other transaction1; arranged wiihial agencies..tments in U.S. corporate stocks and in debt securities of privatend local governments.tnent of Commerce, Bureau of Economic Analysis, Survey of Current
Digitized for FRASER http://fraser.stlouisfed.org/ Federal Reserve Bank of St. Louis
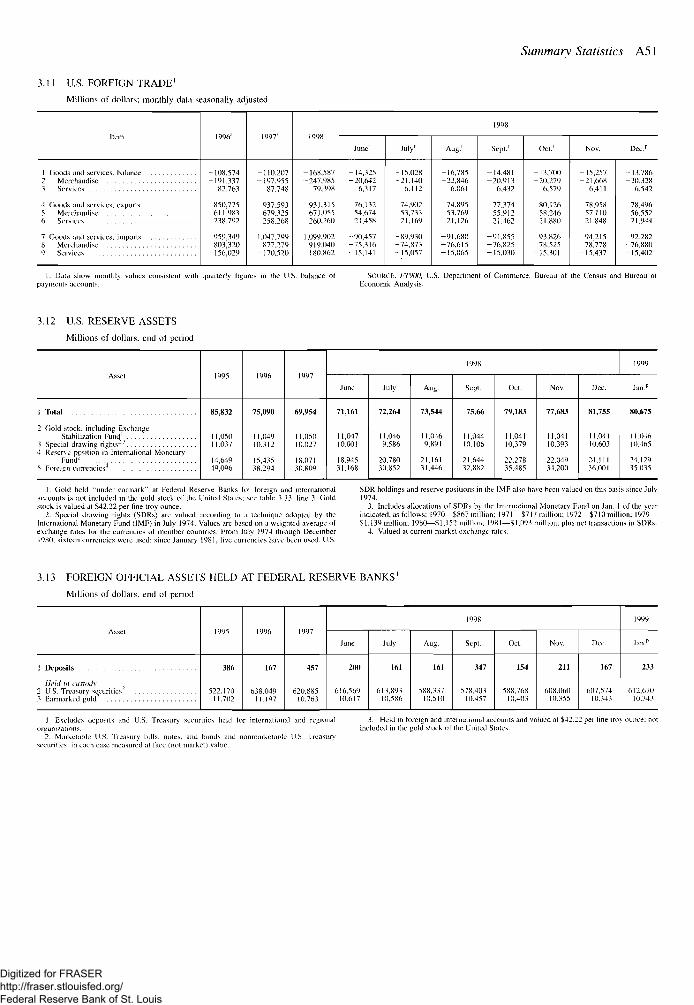
Summary Statistics A51
3.11 U.S. FOREIGN TRADE'
Millions of dollars: monthly dala seasonally adjusted
Hem
I Goods and services, balance2 Merchandisei Services
4 Goods and services, exports5 Merchandise
7 Goods and services, imports8 Merchandise9 Services
1996'
-108,574-191,337
82,76.3
850,775611,983238,792
-959,349-803,320-156,029
1997'
-110,207-197,955
87,748
"37.59?679.325258.268
-1,047 799-877,279-170,520
1998
-168,587-247,985
79,398
931.315671,055260.260
- 1 099.902-919,(140-18(1.862
1998
June'
-14,325-20,642
6.317
76,13254.67421,458
-90,457-75,316-15,141
July'
-15.028-21.140
6,112
74,90253,73321,169
-89,930-74,873-15,057
Aug.'
-16,785-22,846
6.061
74,89553,76921,126
-91,680-76,615-15,065
Sept.'
-14,481-20,913
6,432
77.37455.91221.462
-91,855-76,825-15,030
Oct.1
-13,700-20,279
6.579
80,12658,24621.880
-9 i .82b-78.525-15.301
Nov,
-15,257-21,668
6,411
78,95857,11021.848
-94,215-78.778-15,437
Dec.11
-13,786-20,328
6,542
78,49656.55221,944
-92,282-76,880-15,402
I. Dala show monthly values consistent with quarterly figures in ihe U.S. balance ofpayments accounts.
SOURCE. FT900, U.S. Department of Commerce. Bureau of the Census and Bureau olEconomic Analysis.
3.12 U.S. RESERVE ASSETS
Millions of dollars, end of period
Asset
1 Total
2 Gold stock, including ExchangeStabilization Fund1
3 Special drawing rights2'"'4 Reserve position in International Monetary
Fund"5 Foreign currencies
1995
85,832
11,05011.037
14,64949,096
1996
75,090
11,04910.312
15.43538.294
1997
69,954
11.05010.027
18.07130.809
1998
June
71,161
11,04710.001
18.94531.168
July
72,264
1 1,0469,586
20.78030,852
Aug.
73,544
11,0469,891
21,16131,446
Sept.
75.66
11,04410,106
21,64432,882
Oct.
79,183
11,04110,379
22,27835,485
Nov.
77,683
11,04110.393
22.04934.200
Dec.
81,755
1 1,04110,603
24,1 1136,001
1999
Jan.1*
80.675
1 1 ,(«610,465
24,12935,035
1. Gold held "under earmark" at Federal Reserve Banks for foreign and internationalaccounts is not included in the gold stock of the United States: see labile 3.13, line 3. Goldstock is valued at $42.22 per fine troy ounce.
2. Special drawing rights (SDRs) are valued according to a technique adopted by theInternational Monetary Fund (IMF) in July 1974. Values are based on a weighted average ofexchange rates for Ihe currencies of member countries. Froin July 1974 through December1980. sixteen currencies were used: since January 1981, five currencies have been used. U.S.
SDR holdings and reserve positions in the IMF also have been valued on this basis since July1974.
3. Includes allocations of SDRs by the International Monetary Fund on Jan. I of the yearindicated, as follows: 1970—$867 million; 1971— $717 million; 1972—$710 million; 1979—$1,139 million; 1980—$1,152 million; 1981—$1,093 million: plus net transactions in SDRs.
4. Valued at current market exchange rates.
3.13 FOREIGN OFFICIAL ASSETS HELD AT FEDERAL RESERVE BANKS1
Millions of dollars, end of period
Asset
1 Deposits
ih'ld in tusloily2 US, Treasury securities"< tiamtarked gold1
1995
386
522.17011.702
1996
167
638.04911.197
1997
457
620,88510.763
1998
June
200
616,56910.617
July
161
613,89310,586
Aug.
161
588,33710,510
Sept.
347
578.40110,457
Oct.
154
588,76810,403
Nov.
211
608,06010.355
Dec.
167
607,57410.343
1999
Jan.'
233
612,67010.343
1. Eidudes deposits and U.S. Treasury securities held lor international and regionalorganizations.
2. Marketable U.S. Treasury bills, notes, and bonds and nonmarkelable U.S. Treasurysecurities, in each case measured at face (not market) value.
3. Held in foreign and international accounts and valued at $42.22 per tine troy ounce; notincluded in the gold stock of the United Slates.
Digitized for FRASER http://fraser.stlouisfed.org/ Federal Reserve Bank of St. Louis
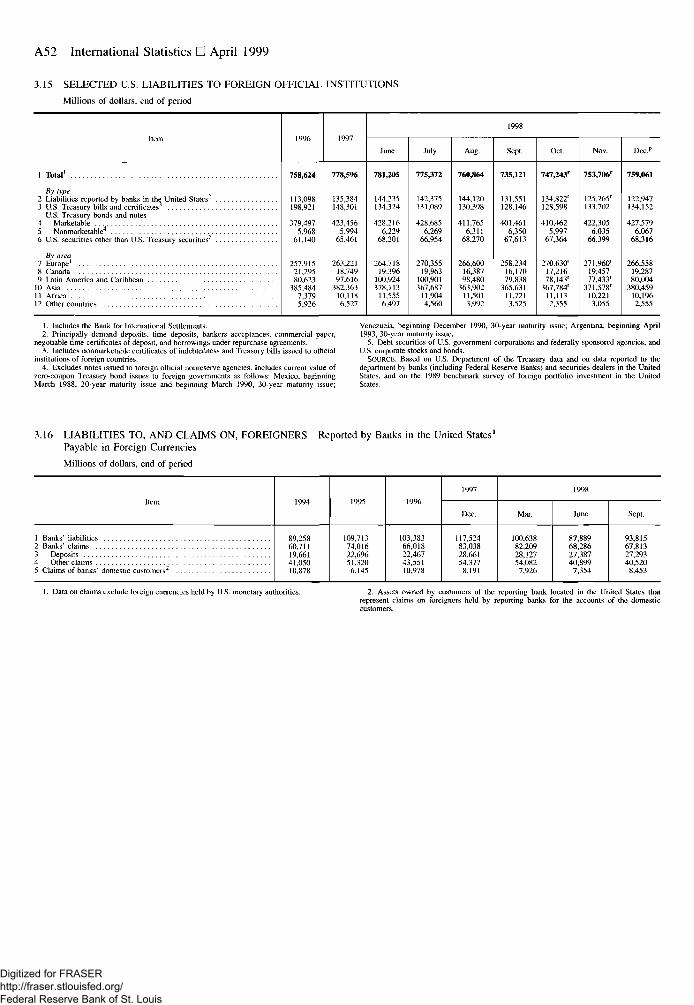
A52 International Statistics • April 1999
3.15 SELECTED U.S. LIABILITIES TO FOREIGN OFFICIAL INSTITUTIONS
Millions of dollars, end of period
Item
1 Total1
By type2 Liabilities reported by banks in the United States"3 U.S. Treasury bills and certificates3
U.S. Treasury bonds and notes4 Marketable
6 U.S. securities other than U.S. Treasury securities5
By area
8 Canada9 Latin America and Caribbean
10 Asia11 Africa12 Other countries
1996
758,624
113,098198,921
379,4975,968
61,140
257,91521,29580,623
385,4847,3795,926
1997
778,596
135,384148,301
423,4565,994
65,461
263.22118,74997.616
382.36310,1186,527
1998
June
781,205
144,235134,324
428,2166,229
68,201
264,71819,396
100,924378 113
11,5556.497
July
775,372
142,375131,089
428,6856,269
66,954
270,35519,963
100,901367,687
11,9044,560
Aug.
760,864
144,120130,398
411,7656,311
68,270
266,60016,38798,480
363,90211,5013,992
Sept.
735,121
131,551128,146
401,4616,350
67,613
258.23416,17079,838
365,63111,7213,525
Oct.
747,243'
134,822'128,598
410,4625,997
67,364
270.630'17,21678,143'
367.784'11,1132,355
Nov.
753,706'
125,265'133,702
422,3056,035
66,399
271,960'19,45777,433'
371,578'10,2213,055
Dec.p
759,061
122,947134,152
427,5796,067
68,316
266,55819,28780,004
380,45910,1962,555
1. Includes the Bank for International Settlements.2. Principally demand deposits, time deposits, bankers acceptances, commercial paper,
negotiable time certificates of deposit, and borrowings under repurchase agreements.3. Includes nonmarketable certificates of indebtedness and Treasury bills issued to official
institutions of foreign countries.4. Excludes notes issued to foreign official nonreserve agencies. Includes current value of
zero-coupon Treasury bond issues to foreign governments as follows: Mexico, beginningMarch 1988, 20-year maturity issue and beginning March 1990, 30-year maturity issue;
Venezuela, beginning December 1990, 30-year maturity issue; Argentina, beginning April1993, 30-year maturity issue.
5. Debt securities of US. government corporations and federally sponsored agencies, andU.S. corporate stocks and bonds.
SOURCE. Based on U.S. Department of the Treasury data and on data reported to thedepartment by banks {including Federal Reserve Banks) and securities dealers in the UnitedStates, and on the 1989 benchmark survey of foreign portfolio investment in the UnitedStates.
3.16 LIABILITIES TO, AND CLAIMS ON, FOREIGNERSPayable in Foreign Currencies
Millions of dollars, end of period
Reported by Banks in the United States1
Item
1 Banks' liabilities
4 Other claims
1994
89,25860,71119,66141,05010,878
1995
109,71374,01622,69651,3206,145
1996
103,38366,01822,46743,55110.978
1997
Dec.
117,52483,03828,66154,3778,191
1998
Mar.
100,63882,20928,12754,082
7,926
June
87,88968,28627,38740,899
7,354
Sept.
93,81567,81327,29340,520
8,453
I. Data on claims exclude foreign currencies held by U.S. monetary authorities. 2, Assets owned by customers of the reporting bank located in the United States thatrepresent claims on foreigners held by reporting banks for the accounts of the domesticcustomers.
Digitized for FRASER http://fraser.stlouisfed.org/ Federal Reserve Bank of St. Louis
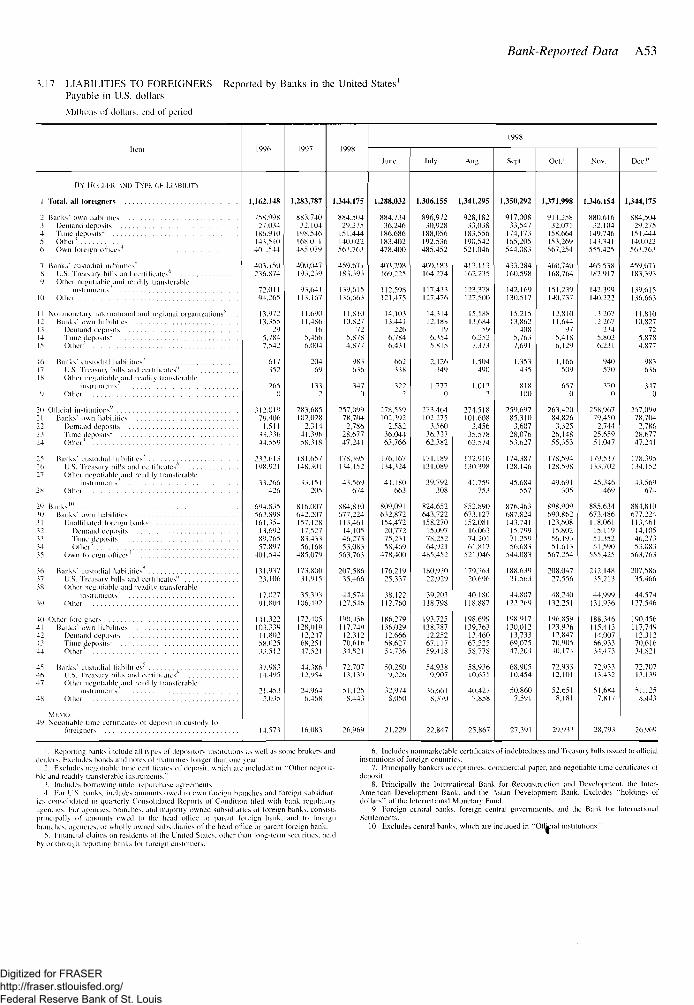
Bank-Reported Data A53
3.17 LIABILITIES TO FOREIGNERS Reported by Banks in the United States'Payable in U.S. dollars
Millions oi dollars, end of period
lleni
BY HOI.DI.R \ND TYPh Of LIABILITY
1 Total, all foreigners
2 Banks' own liabilities3 Demand deposits4 Time deposits2
5 Ochei"'6 Own foreign olliees'
7 Banks' custodial liabilities'X U.S. Treasury bills anil ccrlilicnlcsb
9 Other negotiabkyind readily Iransterableinstruments
10 Other
1 1 Nonmonelary inlenialional ;ind regional organizations^12 Banks' own liabilities "13 Demand deposits14 Time deposits'15 Other
17 U..S. Treasury bills and cerlilicatcs"IS Other negotiable;and readily transferable
instruments'1" Other
20 Olheial institutions''21 Banks' own liabilities22 Demand deposits23 Time deposits"24 Other1
2? Banks' custodial liabilities'26 U.S. Treasury bills and certificates"27 Other negotiable and readily transferable
instruments2S Other
•") Banks1"W Banks' own liabilities31 Unanibalcd foreign banks32 Demand depositsV Time deposits'34 Other'35 Own foreign olliees4
36 Banks' custodial liabilities'37 U.S. Treasury bills and certilicates"38 Other negotiable and readily transferable
instruments'39 Other
40 Other foreigners41 Banks' own liabilities42 Demand deposits4^ Time deposits"44 Other
45 Banks' custodial liabilities'46 U.S. Treasury bills and eerlilieales''47 Olhei negotiable and readily transferable
instruments'4« Other
Mr.MO49 Negotiable time certificates ol deposil in custody loi
foreigners
1996
1,162.148
758.99827,034
1X6.910143,510401.544
403.150236.874
72.01194.265
13.97213.355
295,7847.542
617352
2650
312,01979,406
15.13644.559
232.613198.921
31.266426
694,835562.898161,354
1 1,69289,76557.897
401,544
131,93723.106
17.(1279I.S04
141.322103.339
1 1,80258 02533.512
37,98314.495
21.4532.035
14.571
1997
1,283,787
883.74032,104
198,546168,1)1 1485,079
400,047193,239
93,641113.167
11.6901 1,486
165,4666.004
i()4
69
133i
783 685102,028
2,31441.39658.31X
181.657148.301
1.1.151205
8 16.007642.207157.128
17,52783.43356,168
485,079
173,8003 1.915
35.393106,492
172.405128,01912,24768 ^5147,521
44,3861 2,954
24.9646,468
16,083
1998
1.344,175
884,50429,275
151.444140.02256.1.76.1
459.67118X393
139,615136,663
11,81010.827
725.8784,877
983636
3470
^57 09978.7042,786
28,67747,241
178,395134.152
43.569674
884,810677,224113,461
14,10546,27353,083
563,763
207,58635,466
44,574127.546
190.456117,74912,31270,61634.821
72.7071.1.139
51,1258.443
26,969
1998
June
1.288,032
884,73436,246
186.686183,402478,400
403,298169.225
112,598121,475
14.10,313,441
2266.7846.431
662338
322•>
178 559102.392
2.58236,04463,766
176.167134,324
41.180663
809,091632,872154,47220,77275,23158.469
478.4IK)
176,21925,337
38.1221 12.760
186.279136.029-12.66668.62754,736
50.2509,226
32,974S.050
21.229
July
1,306,155
896,97230,928
188,056192.536485.452
409,183164.274
117,433127.476
14,31412.188
196.3545.815
2 126349
1.7770
173 464102.275
3.56036.33362,382
171,189131,089
39.792308
824.652643,722158,27015.09778.25264,921
485,452
180,93022,929
19.203118.798
193,725138,78712.2.5267,11759,418
54.9389,907
36,6618,370
22.847
Aug.
1,341,295
928,18233,038
183,556190,542521.046
413,113162,235
123,378127,500
15,18813,684
596.2527.373
I 504490
1,0122
^74 518101,608
3,45635.57862.574
172,910130.398
41.759753
852,890673.127152,081
16,06374,20161,817
521,046
179,76320.696
40,180118.887
198.699139,76313,46067,52558,778
58,93610,651
40,4277,858
25,867
Sept.
1,350,292
917,00833,547
174,173165,205544.083
433,284160,598
142,169130,517
15,215I3.S62
4085,7637,691
1 353435
818100
259 69785,3103,607
28,07653,627
174,387128.146
45,684557
876.463687.824143.74115.79971.25956,Mil
544.083
188,63121.563
44.S07122.269
198,917130,01213,73369,07547,204
68,90510.454
50 8607,591
27.391
Oct.'
1,371,998
911.25832,071
158.664153,269567.254
460,740168,764
151,2.19140.737
12.8101 1.644
975,4186,129
1 166.509
6570
263.42084,826
3,32526,14855,353
178,594128.598
49.691305
898.909690.862123,608
15,80256.19351.613
567.254
208.04727.556
48,240132.251
196,859123,926
12,84770,90540,174
72,93312.101
52.6518,181
29,933
Nov.
1,346,154
S80.6I632.104
149.746143.341555.425
465.538IK2.9I7
142.399140.222
13.20712.267
2345,8026,231
940570
3700
258.96779.4502,744
25.65951.047
179,517133.702
45.346469
885.634673.486118,06115,11951,35251,590
555 475
212,14835,213
44.999131,936
188.346115,41314,00766,93334.473
72,93313.432
51.6847,817
28.793
Dee.1'
1,344,175
884,50429 275
151.444140.02256.1.763
459 671183,393
139.615136.663
1 1,81010,827
725,8784,877
983636
3470
257.09978.7042,786
28,67747,241
17X.W5134.152
4.1.569674
884,810677,224113,46114,10546,27353.083
563,763
207,58635,466
44,574127,546
190.456117,749
12,31270,61634,821
72.70713.139
51.1258.443
26.969
1, Reporting banks include all lypes of depositor} institutions as well as some brokers anddealers. Excludes bonds and notes of maturities longer than one year.
2. Excludes negotiable time certificates of deposit, which are included m "Other negotia-ble and readily transferable insirumenis."
.V Includes borrowing under repurchase agreements.•4. For I'.S. banks, includes amounts owed to ovwi foreign branches and foreign subsidiar-
ies consolidated in quarterly Consolidated Reports of Condition tiled with bank regulatoryagencies. For agencies, branches, and majority-owned subsidiaries of foreign banks, consistsprincipally o( amounts owed to the head otlice or parent foreign bank, and to foreignbranches, agencies, or wholly owned subsidiaries of the head ollice or parent foreign bank.
\ Financial claims on residents of the United Stales, other than loni;-term securities, heldby or through reporting banks for foreign customers.
6. Includes nonmarketublc certificates of indebtedness and Treasury hills issued to ollicialinstitutions of foreign countries.
7. Principally bankers acceptances, commercial paper, and negotiable time certilieates o|'deposil.
8. Principally Ihc International Bank For Reconstruction and Development, the Inter-American Development Bank, and the Asian Development Bank, Excludes "holdings ofdollars" of the lnlernational Monetary Fund.
9. Foreign mural banks, foreign central governments, and the Bank for InternationalSettlements.
10. Excludes centra! banks, which are included in "'Oflkial institutions.1'
Digitized for FRASER http://fraser.stlouisfed.org/ Federal Reserve Bank of St. Louis
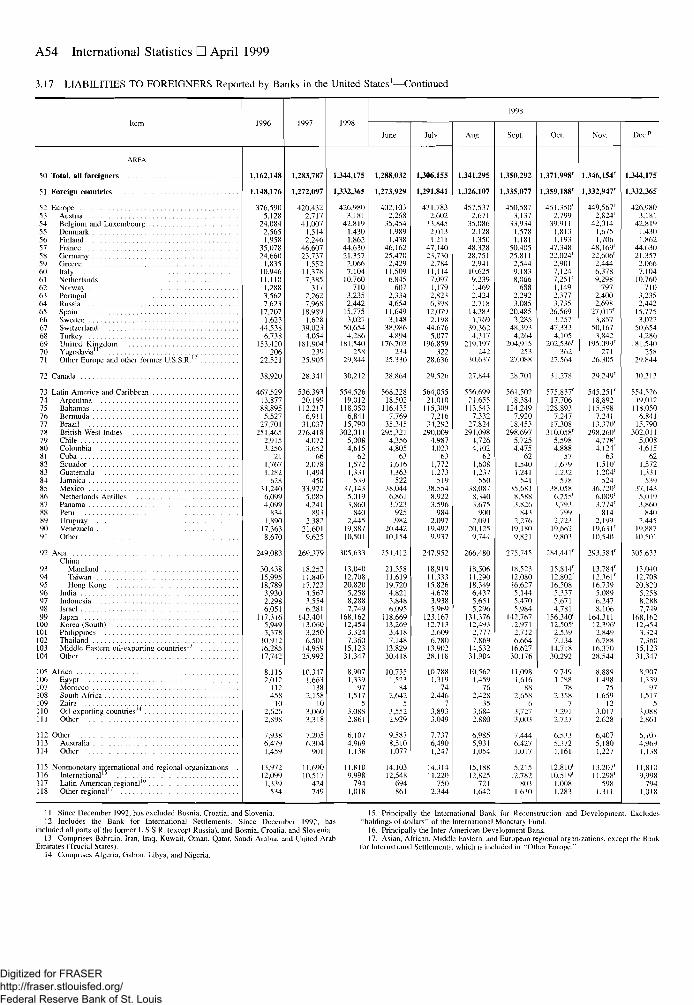
A54 International Statistics • April 1999
3.17 LIABILITIES TO FOREIGNERS Reported by Banks in the United States'—Continued
Item
AREA
50 Total, all foreigners
51 Foreign countries
52 Europe53 Austria54 Belgium and Luxembourg55 Denmark56 Finland57 France58 Germany59 Greece60 Italy61 Netherlands62 Norway63 Portugal64 Russia65 Spain66 Sweden67 Switzerland68 Turkey69 United Kingdom70 Yugoslavia"71 Other Europe and other former U.S.S.R.12
72 Canada
73 Latin America and Caribbean74 Argentina75 Bahamas76 Bermuda77 Brazil78 British West Indies79 ChileSO Colombia81 Cuba82 Ecuador83 Guatemala84 Jamaica85 Mexico86 Netherlands Antilles87 Panama88 Peru89 Uruguay90 Venezuela91 Other
92 Asia
China93 Mainland94 Taiwan95 Hong Konc96 India97 Indonesia98 Israel99 Japan
100 Korea (South)101 Philippines102 Thailand103 Middle Eastern oil-exporting countries'3
104 Other
105 Africa106 Et-vpt107 Morocco108 South Africa109 Zaire110 Oil-exporting countries14
11 1 Other
112 Other113 Australia114 Other
115 Nonmonetary international and regional organizations116 International15
117 Latin American regional'*1
118 Other regional17
1996
1,162,148
1,148,176
376,5905,128
24,0842,5651,958
35,07824,660
1,83510.94611,110
1,2883,5627 621
17.7071.623
44.5386.738
153.420206
22.521
38,92(1
467 52913,87788,8955,527
27,701251.465
2.9153.256
211,7671.282
62831,2406.0994,099
8341,890
17,3638.670
249,083
30,43815,99518,7893,9302,2986,051
117,3165,9493,378
10,91216,28517,742
8,1162012
112458
102,6262,898
7,9386,4791,459
13,97212,099
1,339534
1997
1,283,787
1,272,097
420,4322,717
41,0071,5142,246
46,60723,737
1,55211,3787,385
3172.2627.968
18.9891.628
39,0234.054
181,904239
25,905
28.341
536 39320.199
112.2176,911
31,037276,418
4,0723,652
662,0781,494
45033,972
5,0854,241
8932.582
21.6019.625
269.379
18.25211.84017.7224,5673,5546,281
143,40113,0603,2506,501
14,95925,992
10.3471 663
M82,158
103,0603,318
7,2056.304
901
11,69010,517
424749
1998
1,344,175
1,332,365
426.9803.181
42.8191.4301,862
44,63021 357
2.0667,104
10.760710
3,2352,442
15,7753,027
50,6544.286
181.540258
29.844
30,212
554,52619,012
118,0506,841
15,790302,011
5,0084,615
621,5721,331
53937,143
5.0193,860
8402,445
19,88710,501
305,633
13,04012,70820,8205,2588,2887,749
168,16212,4543,3247,360
15,12331,347
8,9071 339
971,517
53.0882.861
6.1074.9691.138
11.8109 998
7941,018
1998
June
1,288,032
1,273,921
402,1012,268
35,4541.9891,438
46,16225,470
2,42911,5096,845
6072,3344,654
11,6493,148
38,9864,894
176.703234
25,330
28.864
568.22818.502
116.4357.769
35,345295,321
4,3564,805
631,6161,363
52238,044
6,8613.723
9251.982
20,44210,154
254,412
21,55811,61919,7204,8213,8486,095
118,66913,2693,4187,148
13,82930,418
10,7351,523
842.642
53,5522.929
9,5878,5101.077
14,10312.548
694861
July
1,306,155
1,291,841
431.7832,602
33,8452,0131.211
47,14023,730
2.78411,1147.0971,1792,8236,398
12,0792,198
44,6765,077
196,859322
28.636
29.526
564,05521,010
115,3097,216
34,292290,009
4,9874.023
631,7721,273
51938,5548,9223.596
9842,097
19,4929,937
247.952
18,91911,33315,8264.6783,9385.969
123.16712.7132.6096.780
13.90228.118
10,7881,319
742,446
73,8933.049
7,7376,4901,247
14,31411.220
7502,344
Aug.
1,341,295
1,326,107
457,5372,671
35,0862.1281,350
48.32828,751
2,94110,6259.2391,4692.4242.718
14,2831,769
39.3624.317
219 197242
30.637
27.844
556.69921,655
113,5437.332
27.824291.098
4,7264,102
621,6081,237
55038,087
8,3403.675
9002,091
20,1259,744
266.480
18,50611,29018,3496.4375.6515,296
131,37612,4912,7777,869
14,53231,904
10,5621,459
762,428
353,6842.880
6,9855,9311,054
15,18812,825
7211,642
Sept.
1,350,292
1,335,077
450,5873,137
33,9341,5781,181
50,40525,811
2,5449 1838,066
6882,292i.085
20,4853,285
48,3934,264
204,915253
27.088
28,701
561,50218,384
124,2497,920
18,453298,697
5,7254.475
621,5401.241
54135.6818.5883.826
8432,276
19,1809,821
275.745
18,52312,08016,6275,1445,4705,984
142,76712.9712.7126.664
16.62730,176
11,0981.616
882,658
63.7273,003
7,4446,4271,017
15,21512.782
8031,630
Oct.
l,371,998r
l,359,188r
451.350'2,799
39.91 11.8131,193
47,34822,024'
2,9017,1247,251'1,1492.3771,735
26.5693.257
47,3324,105
202,536'362
27.564
31,278
575,837'17,706
128.8937.247
17.308310,058'
5,5984.888
571,6791.232
57818 0586,255'3,793
7992,223
19,6r>29,803
284,441'
15,814'12,802'16,5085,3375,6714,781
156,340'12.505'2,5397,134
14.71830.292
9,7491.288
782.358
73.2912.727
6.5 3?5.3721,161
12,810'10,519'1,0081,283
Nov.
1.346,154'
1,332,947'
449,567'2,824'
42,0141,6751,706
48,169'22,606'
2.4446,3789,298
7972,4002,698
27,017'3,857
50,1673,842
195.099'271
26.31)5
29,249'
545,251'18,892
1 15,5987,241
13,370'298.260'
4,778'4 124"
631.510'1.204'
52436.720'6,009'3.774'
8142,199
19,631'10,540
293,584'
13,784'12,361'16,7395,0896,2478,106
164,31112,396'2,8496,788
16,37028.544
8.8891,498
751.659
123,0172.628
6,4075,1801,227
13.207'11,298'
598i.311
Dec.!1
1.344,175
1,332,365
426,9803,181
42.8191,4301,862
44,63021,357
2,0667,104
10,760710
3,2352,442
15,7753,027
50,6544,286
181,540258
29,844
30.212
554.52619.012
118,0506,841
15,790302,011
5,0084,615
621,5721,331
53937,14?5,0193,860
8402.445
19,88710,501
305.633
13.04012.70S20.8205.2588.2887.749
168.16212.4543.3247,360
15.12331,347
8,9071,339
971,517
3.0882,861
6,1074,9691,138
11,8109.998
7941.018
11. Since December 1992, has excluded Bosnia, Croatia, and Slovenia.12. Includes the Bank for International Settlements. Since December 1992. has
included all parts of the former U.S.S.R. (except Russia), and Bosnia, Croatia, and Slovenia,13. Comprises Bahrain. Iran, Iraq, Kuwait, Oman, Qatar, Saudi Arabia, and United Arab
Emirates (Trucial States).14. Comprises Algeria. Gabon, Libya, and Nigeria.
15. Principally the International Bank for Reconstruction and Development. Excludes"holdings of dollars" of the International Monciary Fund.
16. Principally the Inter-American Development Bank.17. Asian, African. Middle Eastern, and European regional organizations, except the Bank
for International Settlements, which is included in "Other Europe."
Digitized for FRASER http://fraser.stlouisfed.org/ Federal Reserve Bank of St. Louis
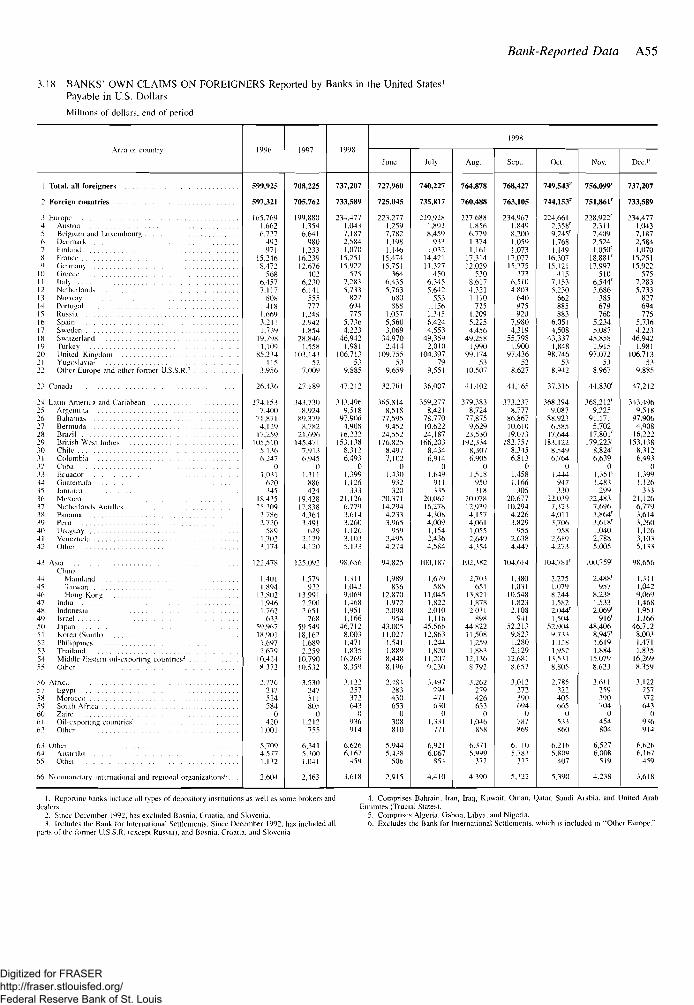
Bank-Reported Data A55
3.18 BANKS' OWN CLAIMS ON FOREIGNERS Reported by Banks in the United States'Payable in U.S. Dollars
Millions of dollars, end of period
Area or country
1 Total, all foreigners
2 Foreign countries
3 Europe . .4 Austria5 Belgium and Luxembourg6 Denmark7 Finland8 France9 German}
10 Greece '1 1 Italv12 Netherlands13 Norway14 Portugal15 Russia16 Spain17 Sweden18 Switzerland19 Turkev20 United Kingdom21 Yugoslavia2
22 Other Kuiope and other former U.S.S.R.'
23 Canada
24 Latin America and Caribbean25 Argentina26 Bahamas27 Bermuda28 Brazil29 British West Indies30 Chile11 Colombia . . . . . . .32 Cuba.13 Ecuador14 Guatemala15 J-imaica36 Mexico37 Netherlands Antilles38 Panama19 Peru40 Uruguay41 Venezuela42 Other
43 AsiaChina
44 Mainland45 Taiwan46 Honiz Kong47 India48 Indonesia49 Israel50 Japan51 Korea (South)52 Philippines5? Thailand54 Middle Eastern oil-exporting countries4
55 Other
S6 Africa57 Egypt58 Morocco59 South Africa60 Zaire61 Oil-exporling countries^62 Other
63 Other64 ^uwal ia65 Othei
66 Nonmonelary international and regional organizations'* . . .
1996
599,925
597,321
165,76"1.6626.727
492971
15,2468,472
5686,4577.117
BOS418
1.6693.21 !1J.VJ
19,7981,109
85.234115
3,956
26,436
274,1537.400
71.8714,129
17,259105,510
5.1366.247
01,031
620345
IS.4252\209
2,7362,720
5S91.7023.174
122,478
1,4011,894
12,8021,9461.762
63359.96718.901
1,6972.679
10.4248.172
"• 776247524584
0420
1.001
5.7094,5771,1.12
2.604
1997
708,225
705,762
199.8801,3546.641
9801,233
16,23912,676
4026,2306.141
555777
1.2482,9421.854
28,8461,558
103,14352
7,009
27.189
.143,7308,924
89.3798,782
21,696145,471
7,9136.945
01.311
8S6424
19,42817.8384,3643,491
6292,1294,120
125,092
1.579922
13,9912.2002,651
76859,54918,162
1,6892,259
10.79010,532
3 530247511805
01.212
755
6,3415.1001.041
2,463
1998
737,207
733,589
234.4771.0437,1872.5841.070
15,25115,922
5757.2835.713
827694775
5,7364,223
46,9421,981
106.71353
9.885
47.212
343,4969,518
97,9064.90S
16.222153.138
8,3126,493
01,3991,126
33321,1266,7793,6143.2601,1263.1035.133
9K.656
l . l l l1,0429,0691,4681,9511,166
46,7128.0031,4711,835
16,2698,359
1 P2257372643
0936914
6.6266.167
459
3,618
1998
June
727,960
725.045
22.1.2771,2597,7821.1981.146
15,47415,751
1646.4355.763
680888
1,0575,5603,069
34.9702,414
109,75553
9,659
32.701
165.8148,518
77,5959.452
24,552176,825
8,4977,102
01.410
932320
20,37114,2944,2333,965
9592,4954.274
94.825
1,989836
12,8701,9722.098
95443.00511,027
1,5411.8898.4488.196
2 484283430653
0308810
5.9445.418
506
2.915
July
740,227
735.817
229,9281,8928.459
9331,032
14,42111,327
4506,3455,642
5531.1561.3456.4244.553
49,3592,010
104,39779
9,551
36,007
159,2778,421
78.77010.62224,187
166,2038,4346,914
01.649
911.135
20.06216,2784,3084 0091,1542,4364,584
100,187
1,679585
11 0451,8222.0101,116
45.56612.863
1.2441,820
11,2079,210
1.497294471630
01,331
771
6,9216,067
854
4.410
Aug.
764.878
760,488
227.6881,8566,7791,3741,161
17,31412,029
5308.6174.3211,110
7251.2095.2254,456
49,2581,990
99 17453
10.507
41.402
379.3838,724
77,8759,629
23,530192,334
8,3076.905
01.518
950318
20,07812,9394,1574,0611,0552,6494.354
102.382
2,70365!
13,8211,8782,031
89844,82211,508
1,2591.883
12.1368,792
1 262279426653
01.046
858
6.3715.999
372
4,390
Sept.
768,427
763.105
234,9671,8498,2001.0591.073
17,07715,375
3736,5104,803
640975920
7,9804,319
55,7981,900
97,43653
8,627
41,165
373.2378.777
86.86710.61019.071
182,7578,3456,813
01,4581.166
10520,67710,2944,2263.829
9552,6384,447
104.61 A
1,3801,011
10.5481.82.12,108
94152,213
9,8231.2802,129
12,6818.657
3012272390694
0787869
6,1 105.783
327
5,322
Oct.
749.543'
744.153r
224,6612,358r
9,245r
1.7681,149
16.30715.121
4157.1535.230
662885883
6.0514,508
43,3371,848
98.74653
8.942
37.316
168 1949,087
88,9236,585
17,644183.122
8.5496 764
01.444
947330
22,0397,3234.0113,706
9582.6894.273
104,781'
2.2751.0798,2441.5822,044'1,504
52.9049.7331.I2S1.952
13.5318,805
2,785322405665
0533860
6.2165.809
407
5.390
Nov.
756,099'
751,861'
228.922'2,3117,4092,5241,050'
18,881'17.997
5106,544'5,686
385679760
5,2345.087
45.8581.915
97,07253
8,967
44,830'
368,212'9,2.25
91,1715,702
17,801'179,223'
8,824'6,639
01,351'1.483
^9922.483
7.696.1.864'3,618'1.0402,7885.005
100.759'
2,488'957
8,2381,5332,069'
916'48,406
8,947'1.6191.884
15,0798.62.1
2 61 1259390704
0454804
6,5276.008
519
4.238
Dec.P
737,207
733,589
234.4771.0437,1872,5841,070
15,25115,922
5757.2835,733
827694775
5,7364.223
46,9421,981
106,71353
9,885
47,212
34.1.4969.518
97.9064,908
16,222153,138
8,3126,493
01,1991.126
33321,126
6,7793.6143,2601,1263,1035,133
98,656
1,3111,0429,0691,4681,9511.166
46.7128,0031.4711,815
16,2698,359
1,122257372643
0916914
6,6266.167
459
3,618
1. Reporting hank.s include all types of depository institutions as well as some brokers anddealers.
2. Since December IS)92, has excluded Bosnia, Croatia, and Slovenia.3. Includes ihc Bank for International Settlements. Since December 1<J92. has included all
parts of the former U.S.S.R. (except Russia), and Bosnia, Croatia, and Slovenia
4. Comprises Bahrain, Iran, Iraq, Kuwait. Oman, Qatar, Saudi Arabia, and United ArabEmirates (Trucial States).
5. Comprises Algeria, Gabon, Libya, and Nigeria.6. Excludes the Bank for International Settlements, which is included in "Other Europe."
Digitized for FRASER http://fraser.stlouisfed.org/ Federal Reserve Bank of St. Louis
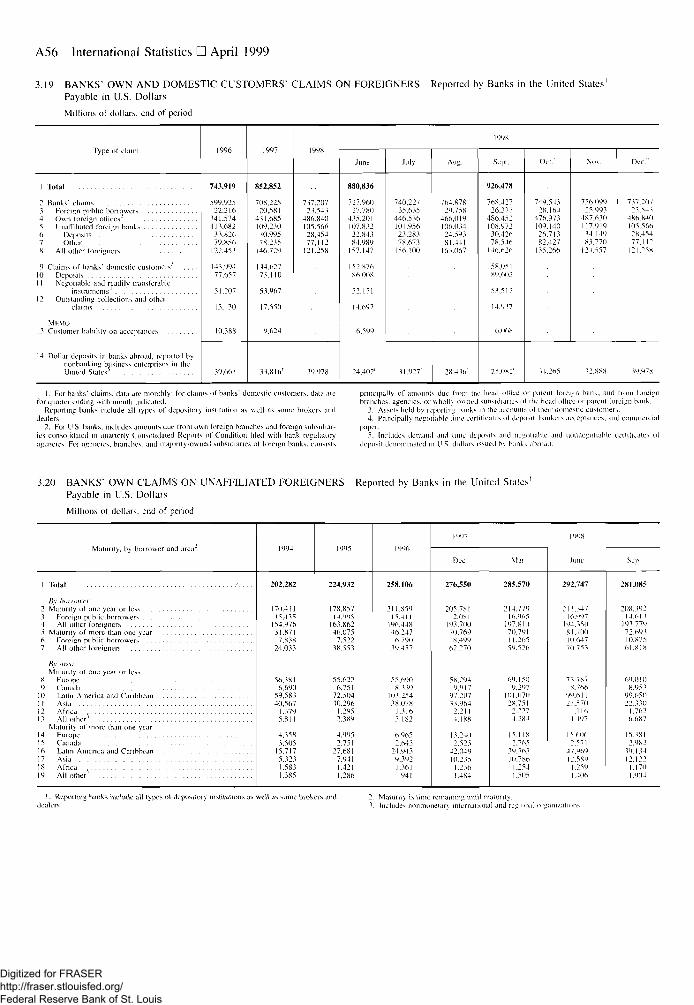
A56 International Statistics • April 1999
3.19 BANKS1 OWN AND DOMESTIC CUSTOMERS' CLAIMS ON FOREIGNERS Reported by Banks in the United States'Payable in U.S. Dollars
Millions of dollars, end of period
Type ol claim
1 Total
2 Banks' L'laims1 Foreign public borrowers4 Own foreign oliices2
5 Unafliliated foreign banks6 Deposits7 Oilier8 All other foreigners
9 Claims of banks' domestic customers' . . . .10 Deposits11 Negotiable and readily transferable
instruments4
12 Outstanding collections and otherclaims
MhMO13 Customer liability on acceptances
14 Dollar deposits in banks abroad, reported bynonhanking business enterprises in theUniled States5
1996
743,919
599,92522.216
341.574113.68233.S2679.856
122.453
143.99477.657
51,207
15.130
10,388
39,661
1997
852.852
708,22520.581
431,685109,23010.9957S.235
146.729
144.62771.110
53,967
17.550
9.624
33.816'
199S
717.20723.543
486.840105.56028,45477.112
121.258
39.978
199K
June
880,836
727,96027,780
435,201107.83222.84384,989
157.147
152.87686.008
52.171
14.697
6.599
24.402'
July
740,22735,635
446,536101,95623,28378.673
156.100
11.927'
Aug.
764.87829.758
466,019106.03424.59381.441
163.067
28.4.16'
Sept.
926,478
768.42726.377
486.452108.97230.42678.546
146.626
158,05189.602
5.1.512
14.917
6.068
2X082'
Oct.1
749,54328.164
476.973109.14026.71382.427
135.266
U.265
N m .
756.09925.993
487.610117.919
14.1498.1.770
1 24.557
12.888
Dec1'
737.2072.1.54.1
486.K40105.56628.45477.1 12
121.258
39.978
1, For banks' claims, data arc monthly; tor claim1- of banks' domestic customers, data arefor quarter ending with month indicated.
Reporting hanks include all types of depository institution as well as some brokers anddealers.
2. For II.S banks, includes amounts due from own foreign branches and foreign subsidiar-ies consolidated in quarterly Consolidated Reports nf Condition hied with bank regulatoryagencies. Foi agencies, hnmehev and majority-owned subsidiaries of foreign banks, consist's
principally of amounts due from the head oil ice or parent loreign bank, and Irom Inreignbranches, agencies, or \vholl\ owned subsidiaries-, of the head oihee or parent loreign bank.
3. Assets held by reporlim: banks in (he accounts of their domestic customers.4. Principally negotiable lime ueiiilicates ol deposit, bankers acceptances, and commercial
paper.5. Includes demand and lime deposit1* and ncgoiiahlc and iiouneiiotiahle certitiuiles ol
deposit denominated in U.S. dnllars Usual b> h.niks abroud.
3.20 BANKS" OWN CLAIMS ON UNAFFILIATED FOREIGNERS Reported hy Banks in the United States'Payable in U.S. Dollars
Millions of dollars, end of period
Malurity, bv borrower and area
1 Total '....
liy hnrnwi-r2 Maturity ol one year or less3 Foreign public borrower*. . . . .4 All other foreigners
6 Foreign public borrowers7 Al l other foreigners
fly areaMatiuity of one year or less
8 Europe . . . . . . . .9 Canada
10 Lat in Amer ica and Caribbean1 1 Asia!2 Af r ica13 Al l oilier1
Maturity of more than one year14 Europe15 Canada16 Latin America and Caribbean17 Asia18 Africa19 A l l other'
|s>94
202.282
170.41 ]15,415
IM.97f>31 87 1
7.S3824.033
56.3816,690
59.58.340,567
1.3795.811
4.1583.505
15,7175.3231.5811,385
1995
224,932
I7S.X5714 995
163.86246,075
7,52238,553
55,6226,751
72.50440.296
1,2952.389
4,9952.751
27,6817.9411.4211,286
1996
258.106
21 I.S591 54 1 I
196.44846 ^47
6.79039.457
55.6908.139
103.25438.078
1,3165.182
6.9652.645
24.9439.3921.361
941
1997
Dec
276,550
205,78112.081
193.70070 769
8.49962.270
58.294>).l> 1 7
97.207Vf 964
2.2114.188
13.2402.525
42.04910.215
1.2361.484
1998
M.n
285.570
214.77916,965
197. KI470 791i 1.26559.526
6*1.1509.297
IOI.07O28.75 1
2.2274.284
15.1 182.765
.10.16110.786
1.2541.505
June
292.747
211.34716/197
194.150SI 40010.64770.713
73.7878.766
99.61 121.570
I.I 164.497
I.Vf2,
4 7 .
1 2.|1..
0 6
7169
89
590 6
Sepl
281.085
208.39214.61 1
191.779
1 o!s7561,818
69,0108 951
99.65022.110
1.7626.687
15.1812.982
19.1.1412.122
1.1701.904
I. Reporting hanks include all types of depository institutions as welldealers
Mime brokers and 2. Maturity is. time remaining until maturity.v Includes nonmone!ai\ mlernaiional and regional orgai
Digitized for FRASER http://fraser.stlouisfed.org/ Federal Reserve Bank of St. Louis
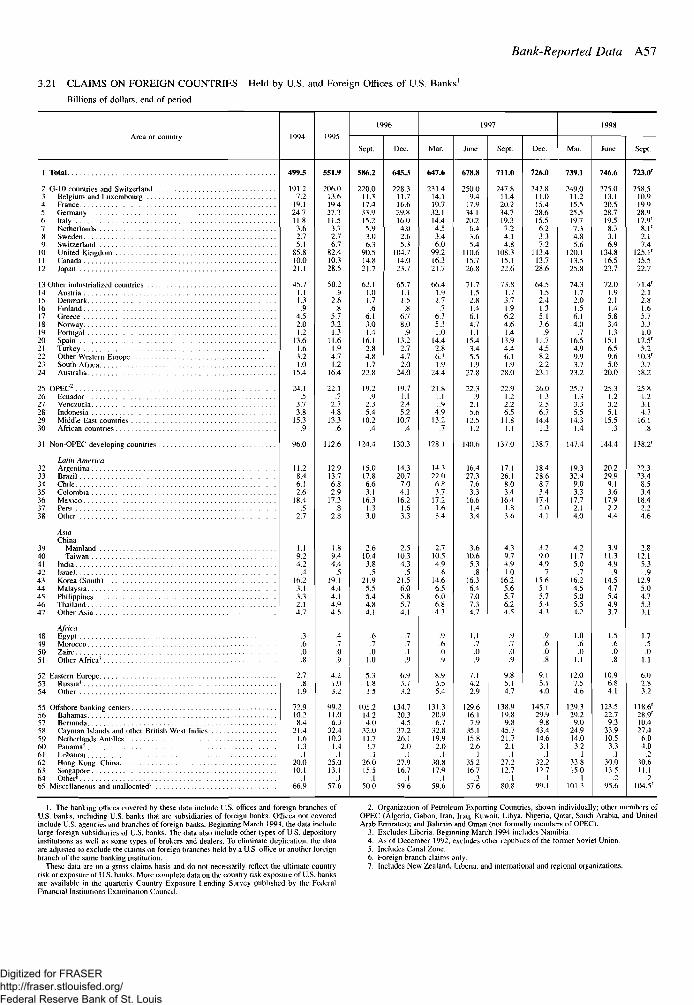
Bank-Reported Data A57
3.21 CLAIMS ON FOREIGN COUNTRIES Held by U.S. and Foreign Offices of U.S. Banks1
Billions of dollars, end of period
Area or country
Sept. Sept.
Total..
2 G-10 countries and Switzerland3 Belgium and Luxembourg4 France5 Germany6 Italy7 Netherlands8 Sweden9 Switzerland
10 United Kingdom11 Canada12 Japan
13 Other industrialized countriesAustriaDenmarkFinlandGreeceNorwayP l
141516171819 Portugal .20 Spain21 Turkey22 Other Western Europe23 South Africa24 Australia
25 OPEC2
26 Ecuador27 Venezuela28 Indonesia29 Middle East countries30 African countries
31 Non-OPEC developing countries
394041424344454647
48495051
Latin AmericaArgentinaBrazilChileColombiaMexicoPeruOther
AsiaChina
MainlandTaiwan
IndiaIsraelKorea (South) . . .MalaysiaPhilippinesThailandOther Asia
AfricaEgyptMorocco... .ZaireOther Africa1
52 Eastern Europe.53 Russia4
54 Other
55 Offshore banking centers.56 Bahamas57 Bermuda5859606162636465 Miscellaneous and unallocated7
Cayman Islands and other British West Indies .Netherlands AntillesPanamas
LebanonHong Kong. ChinaSingaporeOther*..
499.5
191.27.2
19.124.711.83.62.75.1
85.810 021.1
45.71.11.3.9
4.52.01.2
13.61.61.21.0
15.4
24.1.5
3.73.8
15.3.9
96.0
11.28.46.12.6
18.4.5
2.7
1.19.24.2
.416.23.13.32.14.7
.3
.6
.0
.8
2.7.8
1.9
72.910.28.4
21.41.61.3
I20.010.1
.166.9
551.9
206.013.619427.311.5
172.76.7
82.410.328.5
50.2.9
2.6.8
5.73.21.3
11.61.94.71.2
16.4
22.1.7
2.74.8
13.3.6
112.6
12.913.76.82.9
17.3
1.89.44.4
.519.14.44.14.94.5
4.7.0.9
4.21.03.2
99.211.06.3
32.410.31.4.1
25.013.1
.157.6
586.2
220.011.317.433.915.25.93.06.3
90.514.821.7
62.11.01.7.6
6.13.01.4
16.12.84.81.7
22.8
19.2.9
2.35.4
10.2.4
15.017.86.63.1
16.31.33.0
2.610.43.8
.521.9
5.55.4
.01.0
5.31.83.5
105.214.24.0
32.011.7
1.7.1
26.015.5
.150.0
645.3
228.311.716.629.816.04.02.65.3
104.714.023.7
65.7I.I1.5.8
6.78.0
.913.22.74.72.0
24.0
19.71.12.45.2
10.7.4
14.320.7
7.04.1
16.21.63.3
2.510.34.3
.521.56.05.85.7
7.7.1.9
6.93.73.2
134.720.34.5
37.226.1
2.0.1
27.916.7
.159.6
647.6
231.414.119.732.114.44.53.46.0
99.216.321.7
66.41.91.7
76.35.31.0
14.42.86.31.9
24.4
21.81.11.94.9
13.2.7
128.1
14.322.06.83.7
17.21.63.4
2.710.54.9
.614.66.56.06.84.3
.6
.0
.9
8.93.55.4
131.320.96.7
32.819.92.0
.130.817.9
.159.6
678.8
250.09.4
17.934,120.26.43.65.4
110.615.726.8
71.71.52.81.46.14.71.1
15.43.45.51.9
27.8
22.3.9
2.15.6
12.51.2
16427.37.63.3
16.61.43.4
3.610.65.3
.816.36.47.07.34.7
1.1.7.0.9
7.14.22.9
129.616.17.9
35.115.82.6
.135.216.7
.357.6
711.0
247.811.420.234.719.37.24.14.8
108.315.122.6
73.81.73.71.96.24.61.4
13.94.46.11.9
28.0
22.91.22.26.5
11.81.1
17.126.18.03.4
16.41.83.6
4.39.74.91.0
16.25.65.76.24.5
.9
.7
.0
.9
9.85.14.7
138.919.89.8
45.721.72.1
.127.212.7
.1
726.0
242.811.015.428.615.56.23.37.2
113.413.728.6
64.51.52.41.35.13.6
.911.74.58.22.2
23.1
26.01.32.56.7
14.41.2
138.7
18.428.68.71.4
17.42.04.1
3.29.04.9
.715.65.15.75.44.3
.9
.6
.0
.8
9.15.14.0
145.729.99.8
43.414.63.1
.132.212.7
I99.1
739.1
249.011.215.525.519.77.34.85.6
120.113.525.8
74.31.72.01.56.14.0
.716.54.99.93.7
23.2
25.71.33.35.5
14.31.4
147.4
19.332.49.03.3
17.72.14.0
4.211.75.0
.716.24.55.05.54.2
1.0.6.0
1.1
12.07.54.6
129.329.29.0
24.914.03.2
.133.815.0
.1101.3
746.6
275.013.120.528.719.58.33.16.9
134.816.523.7
72.01.92.11.45.83.41.3
15.16.59.65.0
20.0
25.31.23.25.1
15.5.3
144.4
20.229.99.13.6
17.92.24.4
3.911.34.9
.914.54.75.44.93.7
1.5.6.0
10.96.84.1
123.522.79.3
33.910.53.3
.130.013.5
295.6
1. The banking offices covered by these data include U.S. offices and foreign branches ofU.S. banks, including U.S. banks that are subsidiaries of foreign banks. Offices not coveredinclude U.S. agencies and branches of foreign banks. Beginning March 1994. the data includelarge foreign subsidiaries of U.S. banks. The data also include other types of US. depositoryinstitutions as well as some types of brokers and dealers. To eliminate duplication, the dataare adjusted to exclude the claims on foreign branches held by a U.S. office or another foreignbranch of the same banking institution.
These data are on a gross claims basis and do not necessarily reflect the ultimate countryrisk or exposure of U.S. banks. More complete data on the country risk exposure of U.S. banksare available in the quarterly Country Exposure Lending Survey published by the FederalFinancial Institutions Examination Council.
2. Organization of Petroleum Exporting Countries, shown individually; other members ofOPEC (Algeria, Gabon, Iran, Iraq, Kuwait, Libya, Nigeria. Qatar, Saudi Arabia, and UnitedArab Emirates); and Bahrain and Oman (not formally members of OPEC).
3. Excludes Liberia. Beginning March 1994 includes Namibia.4. As of December 1992. excludes other republics of the former Soviet Union.5. Includes Canal Zone.6. Foreign branch claims only.7. Includes New Zealand, Liberia, and international and regional organizations.
Digitized for FRASER http://fraser.stlouisfed.org/ Federal Reserve Bank of St. Louis
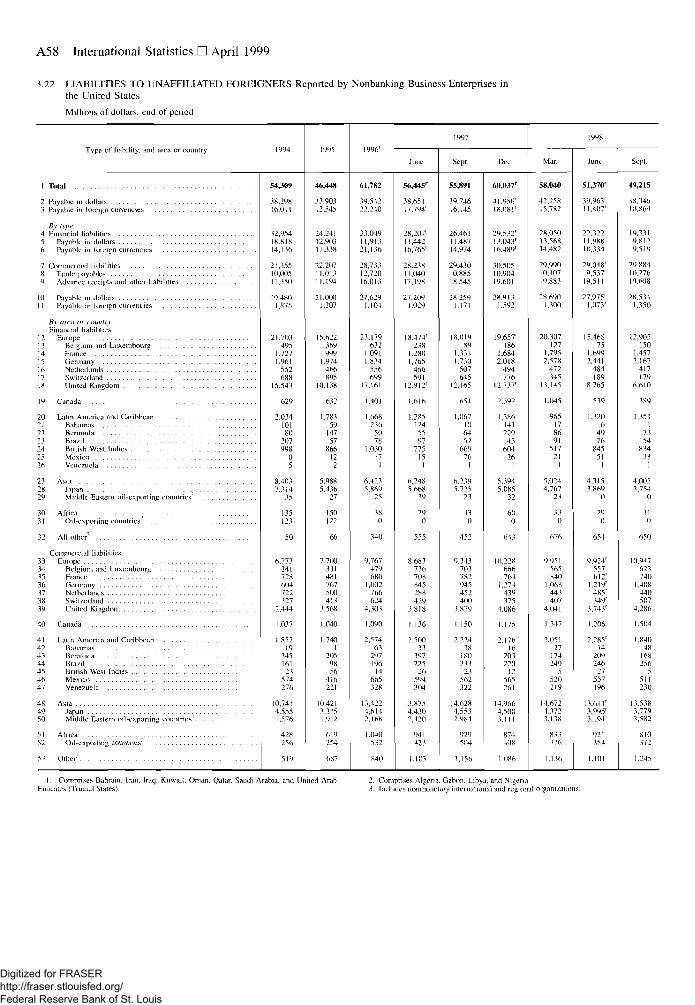
A58 International Statistics • April 1999
3.22 LIABILITIES TO UNAFFILIATED FOREIGNERS Reported by Nonbanking Business Enterprises inthe United States
Millions of dollars, end of period
Type of liability, and area or country
1 Total
2 Payable in dollars? Payable in foreign currencies
4 Financial liabilities5 Payable in dollars6 Payable in foreign currencies
7 Commercial liabilities8 Trade payablcs9 Advance receipts and other liabilities
10 Payable in dollars1 1 Payable in foreign currencies
Rv tiicn or countryFinancial liabilities
12 Europe13 Belgium and Luxembourg14 France - - . . .15 Germany16 Netherlands17 .Switzerland18 United Kingdom
19 Canada
20 Latin America and Caribbean21 Bahamasi? Bermuda">3 Bra7il24 British West Indies25 Mexico26 Venezuela
27 Asia28 Japan29 Middle Eastern oil-exporting countries'
30 Africa31 Oil-exporting countries2
32 A l l other1
Commercial liabilities33 Europe34 Belgium and Luxembourg35 France36 Germany37 Netherlands38 Switzerland39 United Kingdom
40 Canada
41 Latin America and Caribbean42 Bahamas43 Bermuda44 Brazil45 British West Indies46 Mexico47 Venezuela
48 Asia49 Japan50 Middle Eastern oil-exporting countries1
51 Africa52 Oil-exporting countries
51 Other
1994
54,309
38.298Ift.O I I
32,95418.81814,136
21,35510,00511,350
19,4801,875
21.703495
1,7271,961
552688
15.541
629
2,03410180
207998
05
8,4017,314
35
135123
50
6,771241728604722327
2,444
1.037
1.85719
34516123
574276
10,7414.5551,576
428256
519
1995
46,448
11.90312.545
24,24112,90311,338
22,20711,01311.194
21.0001.207
15,622369999
1.974466895
10.138
632
1,78.159
14757
866122
5,9885.436
27
150122
66
7 700331481767500413
3.568
1.040
1.7401
2059856
416221
10,4213,3151,912
619254
6X7
1996'
61,782
19.54222.240
33.04911,91121,136
28,73312,72016.013
27,6291.104
23.179632
1.0911,834
556699
17.161
1.401
1,668236
507S
1.03017
1
6,4215,869
25
380
340
9,767479680
1,002766624
4,303
1.090
2,57463
297196
14665328
13.4224,6142,168
1.040532
840
1997
June
56,445r
38,65117.794'
28,207'11,44216,765'
28,23811,04017,198
27,2091.029
18.474'238
1.2801,765
466591
12.912'
1.616
1.2851245597
77515
1
6.2485.668
39
290
555
8,683736708845288429
3.818
1,136
2,50033
397225
26594304
13,8754,4302,420
941423
1.103
Sept.
55,891
39,74616,145
26,4611 1,48714,974
29,43010,88518,545
28,2591.171
18.01989
1,1141.730
507645
12.165
651
1,067106452
66976
1
6,2395,725
23
110
452
9.343703782945452400
3.829
1,150
2,22438
ISO213
23562322
14,6284,5532,984
929504
1,156
Dec.
60,037'
41.956'18.081'
29.532'1 3.043'16.489'
30.50510.90419.601
28,9131.592
19,657'186
1,6842.018
494lib
12,737'
2.392
1.386141229143604
261
5.3945.085
12
600
643
10,228666764
1,274439375
4,086
1,175
2,17616
203220
12565261
14,9664,5003,111
874408
1.086
1998
Mar.
58.040
42.25S15.782
28.05013,56814,482
29,99010,10719,883
28,6901,300
20,307127
1,7952.578
472345
13,145
1,045
965178691
51721
1
5,0244,767
21
330
676
9 951565840
1,068443407
4,041
1,347
2,05127
174249
5520219
14,6724,3723,138
83.1376
1.136
June
51J70r
39,963'11,407'
22,32211,98810,334
29,048'9,537'
19,511
27,975'1.073'
15,46875
1,6992,441
484189
8,765
5.19
1,3206
4976
84551
1
4,3153,869
0
290
651
9.924'5576ir
1.219'485'349'
3.741'
1.206
2.285'14
209246
27557196
13,611'3,995'3.194
921354
1.101
Sept.
49,215
38.14610,869
19,3319,8129,519
29,88410.27619,608
28,5141,350
12,905150
1,4572,167
417179
6,610
.389
1,3511
73154834
231
4,0053,754
0
310
650
10,947621740
1,408440507
4,286
1,504
1,84048
168256
511230
13,5.183,779.1,582
810372
1,245
I, Comprises Bahrain, Iran. Iraq. Kuwait, Oman, Qatar. Saudi Arabia, and United ArabEmirates (Trucial Stales).
2. Comprises Algeria. Gabon. Libya, and Nigeria3. Includes nontnoneuiry international und regional organization:
Digitized for FRASER http://fraser.stlouisfed.org/ Federal Reserve Bank of St. Louis
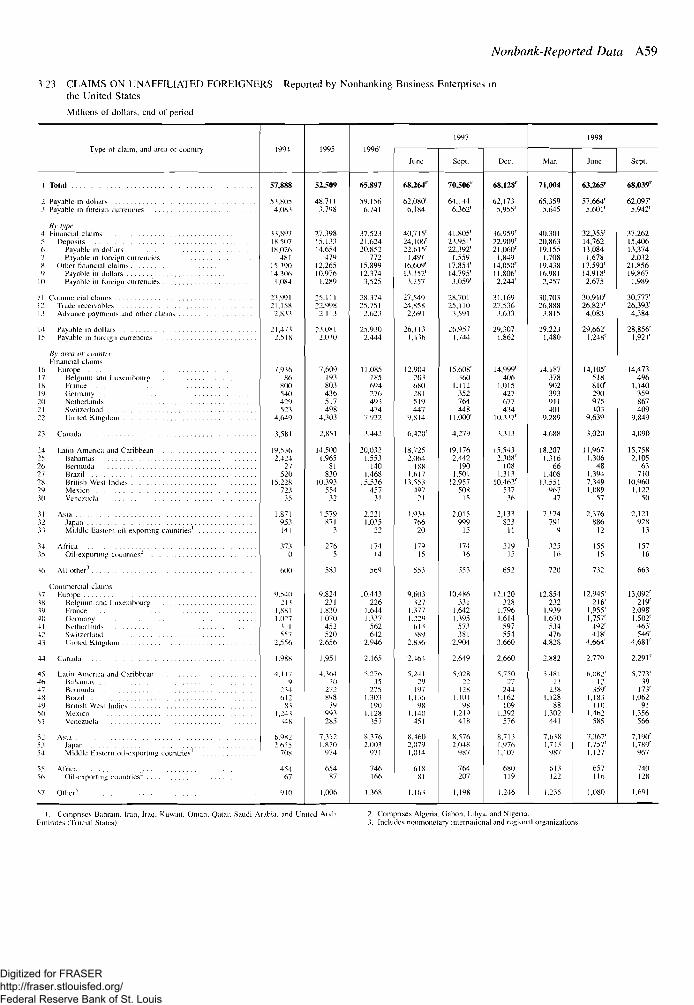
Nonbank-Reported Data A59
3.23 CLAIMS ON UNAFFILIATED FOREIGNERS Reported by Nonbanking Business Enterprises inthe United States
Millions of dollars, end of period
Type ot claim, and area or country
1 Toral
2 Payable in dollars3 Payable in foreign currencies
By type4 Financial claims5 Deposils6 Payable in dollars7 Payable in foreign currenciesX Other financial claims'>• Payable in dollars
10 Payable in foreign currencies
1 1 Commercial claims12 Trade receivables13 Advance payments and other claims
14 Payable in dollars15 Payable in foreign currencies
By area tir imtntivFinancial claims
16 Europe17 Belgium and Luxembourg18 France ~.19 Germany20 Netherlands21 Swilzerland22 United Kingdom
23 Canada
24 Latin America and Caribbean25 Bahamas26 Bermuda27 Brazil28 British West Indies29 Mexico30 Venezuela
31 Asia32 Japan33 Middle Easiern oil-exporting countries'
34 Africa35 Oil-exporting cnunlrics2
16 A l l other'
Commercial claims37 Europe38 Belgium and Luxembourg39 France40 Germany41 Netherlands42 Swilzerland43 United Kingdom
44 Canada
45 Latin America and Caribbean46 Ualiamas47 Bermuda48 Brazil . .49 British West Indies50 Mexico51 Venezuela
52 Asia53 Japan54 Middle Eastern oil-exporting countries'
55 Africa ^56 Oil-exporting countries"
57 Other1
1994
57,888
53.8054.083
33.8971 S.50718.026
4SI15,39014,306
1,084
23,99121,158
2,833
21,4712 518
7.93686
800540429523
4,649
3,581
19,5362.424
27520
15,228723
35
1.S71953141
3730
600
9.540213
1.881l,0">7
311557
2,556
1.988
4,1179
234612
811,241
148
6.9822.655
708
45467
910
1995
52,509
48,7113.798
27,39815,13314.654
47912,26510,976
1,289
25,11122.998
2.113
23,0812,030
7,609193803436517498
4,303
2,851
14,5001,965
81830
10.393554
32
1.579871
3
2765
583
9.824231
1,8301.070
452520
2.656
1,951
4.30410
272898
79991285
7,3121,870
974
65487
1,006
1996'
65,897
59,1566.741
37,52321.62420.852
77215,89912,3743.525
28,37425.751
2.623
25,9302.444
11.085185694276493474
7,922
3.442
20,0321,553
1401,468
15,536457
31
2,2211.035
22
17414
569
10.443226
1.6441.337
562642
2,946
2,165
5.27635
2751.303
1901,128
157
8.3762.003
971
746166
1,368
1997
June
68.264r
62,080'6,184
40,715'24,106'22,615'
1,49116,609'13.352'3.257
27.54924.858
2,691
26,1131,436
12,9042036S0281519447
9,814
6,420'
18,7252.064
1881.617
13.551497
21
1.934766
20
17915
553
9,603127
1.1771.229
613189
2,836
2.464
5,24129
1971,136
981.140
451
8,4602,0791,014
61881
1,161
Sept.
70,506 r
64,1446,362'
41.805'21,951'22,392'
1,55917,854'14,795'3,059'
28,70125,110
3,591
26.9571.744
15.608'360
1,111352764448
11.000'
4,279
19,1762 442
1901.501
12,957508
15
2,015999
15
I7J16
553
10.4H6331
1,6421.395
571381
2.904
2,649
5,028
1281,101
981,219
418
8.5762,048
987
764207
1.198
Dec.
68,128r
62,1735,955'
16,959'22.909'21,060'
1,84914,050'11,806'2,244'
31,16927,536
3.633
29,3071,862
14.999'406
1,015427677434
10.337'
3.313
15.5432.308'
1081.313
10,462'537
36
2,133823
11
31915
652
12,120328
1,7961.614
597554
3,660
2,660
5.75027
2441.162
1091,392
576
8,7131,9761,107
680119
1,246
1998
Mar.
71,004
65,3595.645
40,30120,86319,155
1.70819,43816.9812,457
30.70326.888
3.815
29.2231,480
14.187378902393911401
9.289
4.688
18,2071,316
661,408
13.551967
47
2.174791
9
12516
720
12,8542.32
1.9391.670
534476
4.828
2,882
5.48113
2.181,128
881,302
441
7.6181,713
987
613122
1.235
June
63,265r
57,664'5.601'
32,355'14,76213.084
1,67817.593'14,918'2,675
30,910'26,827'
4,083
29,662'1,248'
14,105'518810'290975403
9,639
3,020
11,9671.306
481,3947,3491.089
57
2,376886
12
15515
732
12,945'216'
1,955'1,757'
492'418'
4,664'
2.779
6,082'12
359'1,183
1 101.462
585
7,367'1.757'1.127
657116
1,080
Sept.
68,039r
62,097'5.942'
37,26215,40613,3742,032
21,85619,867
1,989
30,777'26,393'
4,384
28,856'1,921'
14,473496
1,140359867409
9,849
4,090
15.7582,105
63710
10,9601.122
50
2,121928
13
15716
663
13,092'219'
2,098'1.502'
46 V546'
4,681'
2.291'
5.773'39
173'1,062
911.356
566
7,190'1,789'
967
740128
1,691
1. Comprises Bahrain, Iran, Iraq. Kuwaii, Oman, Qatar, Saudi Arabia, and United ArabFmirates (Trueial States).
2. Comprises Algeria, Gabon, Libya, and Nigeria.3. Includes nonmonetary international and regional organizations.
Digitized for FRASER http://fraser.stlouisfed.org/ Federal Reserve Bank of St. Louis
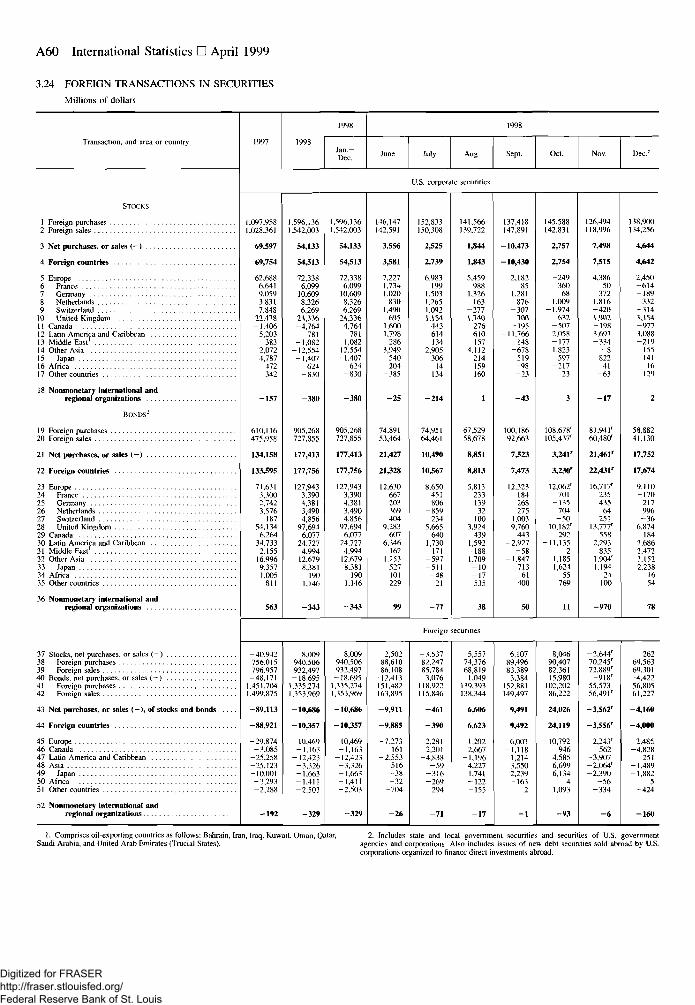
A60 International Statistics • April 1999
3.24 FOREIGN TRANSACTIONS IN SECURITIES
Millions of dollars
Transaction, and area or counln 1997Jan.—Dec. July Aug. Sept.
STOCKS
1 Foreign purchases . .2 Foreign sates
3 Net purchases, or sales ( - )
4 Foreign countries
5 Europe6 France7 Germany8 Netherlands9 Switzerland
10 United Kingdom11 Canada12 Latin America and Caribbean13 Middle East1
14 Other Asia15 Japan16 Africa17 Other countries
18 Nonmonetary international andregional organizations
19 Foreign purchases
20 Foreign sales
21 Net purchases, or sales (—)
22 Foreign countries
23 Europe24 France25 Germany26 Netherlands27 Switzerland28 United Kingdom29 Canada30 Latin America and Caribbean31 Middle East'32 Other Asia33 Japan34 Africa35 Other countries
36 Nonmonetary international andregional organizations
U.S. corporate securities
1,097,9581,028.361
69.597
69,754
62,6886,6419,0593,8317,848
22.478-1,406
5,203383
2,0724,787
472342
610.116
475,958
134,158
133,59571,6313,3002,7423,576
18754,134
6,26434,7332,155
16,9969,3571.005
811
563
1,596,1361,542,003
54,133
54,513
72,3386,099
10,6098,3266,269
24,336-4,764
781-1,082
-12,554-1,407
624-830
905,268
727.855
177,413
177,756127,943
3,3904.3813,4904,856
97,6946,077
24,7274,994
12,6798,381
1901,146
-343
1,596,1361,542.003
54,133
54,513
72,3386,099
10,6098,3266,269
24,336-4,764
781-1,082
-12,554-1,407
624-830
-380
905,268
727,855
177,413
177,756127,943
3,3904,3813,4904,856
97,6946,077
24.7274.994
12,6798,381
1901,146
146,147142,591
3,581
7,2271,7341,020830
1,490695
-1,6001,798286
-3,949-540204
-385
74.89153.464
21,427
21,328
12,630667203369404
9,283607
6,346162
1,253527101229
152,833150,308
2,525
2,739
6,983199
1,5031.2651,0921,154-443-614-134
-2,905-306- 1 4
-134
-214
74,95164,461
10,490
10367
8,650451806
-859234
5,665640
1,730171
-597-511
-4821
141,566
139,722
1,844
1,843
5,459988
1,326163
-2771,740-276
610-157
-4.112214159160
67,52958,678
8,851
8,813
5,81323313932
1003,924
4391,592-1881,709- 1 0- 1 7
-535
38
137,418147,891
-10,473
-10,430
2,18285
1,281876
-307700195
-11,766148
-678519-98
-43
100,18692,663
7323
7,473
12.323184268275
1.0039.760
443- 2.927
-58-1.847
-713-61
-400
145,588142,831
2,757
2,754
-24936068
1,009-1,974
632-5072,058-1771,823
597-217
23
108,678'105.437'
3,241'
3,230'
12,062'701
-135704
- 5 010,182'
292-11,135
21,1851,624
55769
126,494118,996
7,498
7,515
4,38650
3721,816-4201,902-1983,691-334
- 882241
-63
-17
81,941'60,480'
21,461'
22,431r
16,717'235435
64251
13,777'558
2,293835
1,904'1.194
24100
-970
Foreign securities
37 Stocks, nel purchases, or sales ( —)38 Foreign purchases39 Foreign sales40 Bonds, net purchases, or sales ( - )41 Foreign purchases42 Foreign sales
43 Net purchases, or sales (->, of stocks and bonds
44 Foreign countries
45 Europe46 Canada47 Latin America and Caribbean48 Asia49 Japan50 Africa51 Other countries
-40.942756,015796,957-48.171
1.451,704
1.499,875
-89,113
-88,921-29,874
-3,085-25,258
25,123-10,001-3,293-2,288
52 Nonmonetary international andregional organizations
8,009940,506932,497-18,695
1,335,274
1,353,969
-10,686
-1035710,469
-1.163-12,423
-3,326-1,663-1,411-2,503
8,009940,506932,497-18,695
1,335,274
1,353,969
-10,686
-10,35710,469
-1,163-12,423-3,326-1,663-1,411-2.503
2,50288,61086,108
-12,413151,482163,895
-9,911
-9,885
-7,273161
-2,553516-38-32
-704
- 2 6
-3.53782,24785,784
3,076118.922115,846
-461
-390
2,281
2,201-4,838
-59-316-269294
-71
5,55774,37668,8191,049
139,393138.344
6,606
6,623
1,2022,667
-1,1964,2271,741-122-155
-17
6,10789,49683,3893,384
152,88)149,497
9,491
9,492
6,007-1.1181,2143,5502,239-163
8,04690,40782,36115,980102,20286,222
24,026
24,119
10,792
9464,5856,6996,134
41,093
-93
-2,644'70,245'72,889'-918'
55,57356,491'
-3,562r
-3,556'
2,243'562
-3,907-2,064'-2,390
-56-334
-6
138,900134,256
4,644
4,642
2,450-614-189332
-3143,154-9773,088-21915514116129
58,88241,130
17,752
17,674
9.110
-170217996-366,874184
2,6862,4723.1522,238
1654
26269,56369,301-4,42256.80561,227
-4,160
-4,000
2,485
—4,82825!
-1,489-1,882
5-424
-160
1. Comprises oil-exporting countries as follows: Bahrain, Iran, Iraq. Kuwait. Oman, Qatar,Saudi Arabia, and United Arab Emirates (Trucial States).
2. Includes state and local government securities and securities of U.S. governmentagencies and corporations. Also includes issues of new debt securities sold abroad by U.S.corporations organized to finance direct investments abroad.
Digitized for FRASER http://fraser.stlouisfed.org/ Federal Reserve Bank of St. Louis
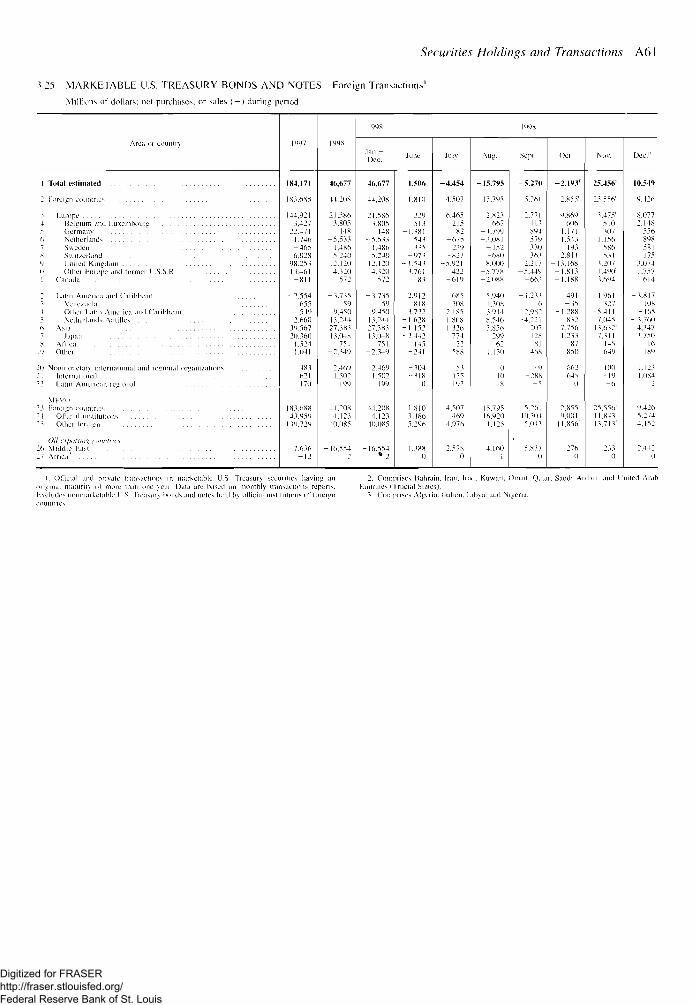
Securities Holdings and Transactions A61
.V25 MARKETABLE U.S. TREASURY BONDS AND NOTES Foreign Transactions'
Million', of dollars; net purchases, or sales ( —) during period
Area or countr\
1 Total estimated
2 ["nrcign countries
3 httrope-1 Belgium and Luxembourg5 Germany6 Netherlands7 Sweden . . .8 Su K/er!ai)d . . . . . .9 Lni led Kingdom
10 Othei huropc and funnel US S.R.1 1 Canada
12 Latin America and Caribbean1 1 Venezuela14 Othci Latin America and Caribbean15 Nclhcilamls Antilles . . . .16 Asia17 Japan18 AfiicaI1) Other
21 International . . .22 Latin American regional .
Mr-Mci2} foreign countries . . . .24 Olfieial institutions25 Other loreign
26 Middle hast '27 Af r ica '
1997
184,171
181.688
144,9213.427
22.4711.746- 4 6 56.02<8
98.2531.1.461- 8 1 1
-2.554655
-549- 2.66019.56720,360
1.5241.041
481621170
181.68843.959
1 19.729
7.616
1998
46,677
44.208
21,5863.805
148-5,533
I.4K65.240
12.1204.320
572
-3.73559
9.450-13.244
27.38.113.048
751-2.349
1.502199
44.2084,123
40.085
-16.5542
1998
Jan.-Dcc.
46,677
44,208
21,5863.805
148-5.553
1 4865.241)
12.1204.320
572
-3.73559
9.450-13.244
27.38313.IMS
751-2 .349
i 4oo
1.502199
44.2084,123
40,085
-16.554» 2
11>98
June
1,506
1.810
229- 5 1 3
- 1 . 1 8 1543355
- 9 7 1- 1.543
1.76183
2.912818
1.722- 1 . 6 2 8- 1 . 1 5 2• 2.442
145- 2 4 1
104- M S
0
1.810- 3 , 4 8 6
5,296
- 1.3880
July
-4 .454
-4 .507
-6.465215
82- 6 7 5
-•V)-827
-5.921422
- 6 1 9
685108
2,185-1.808
1.326774
22588
U s192
-4.507469
-4 .976
-2.5780
Aug.
-15.795
-15.795
-2.823667
- 1.799-5.081
- 1 5 2- 6808.000
-5,778-2,088
-5.940- 1.308
1.914-8.546
.1.856299
62- 1.150
Q
108
-15.795-16.920
1.125
-4.1601
Sept
-5,2711
-5.261
-2.7711 11894
-579-330
3632.217
-5,449-663
-1.2336
2,982-4.221
207128SI
468
- a
-288
-5 .26 i-10.104
5.041
5.8370
Oel
-2.I9.V
-2.855'
- 9.869'- 6061.1711.541
1932.811
-11,168- I . 8 I 3 1
-1,188
491- 3 5
-1.288832
7.7561.23.1
87850
66 "*64 s
II
-2.855'9.001
-11.856'
-2760
Nciv.
25.456r
25.556'
- 1 .
\1 .V
1.
- 5 .7.
11.7.
75'10075686310790'
)94
'612711
145>32'11
145649
00- 19- 6
25.556'1 1.84313.711'
2330
Dec.11
10.541*
9.426
8 0772.148-556
898581175
1.0741.757
614
-1.817I0K
-165- 1 760
4.3471,750
16189
1 I '11.084
1
9.4265.2744.152
-2.4420
I. OlHcial aiul private transacti,m,,nal mah,m> ,,i more ihan onkxdmlcs nonmaikuiihk- US. IYLMM
in marketable U S Treasury secunticur Data are based on monthly transactlonds and notes held b \ official insiiinm
having ;m 2. Comprises Bahrain, Iran, Iraq. Kuwait. Oman. Qatar. Saudi Arabia ,ind United ArabMIS reports. Hniirates ITITILIIII Suilcs).s nrtbreiyii ^ CompnsL-s Algeria. Gabon. Lib\a. and Nigmii.
Digitized for FRASER http://fraser.stlouisfed.org/ Federal Reserve Bank of St. Louis
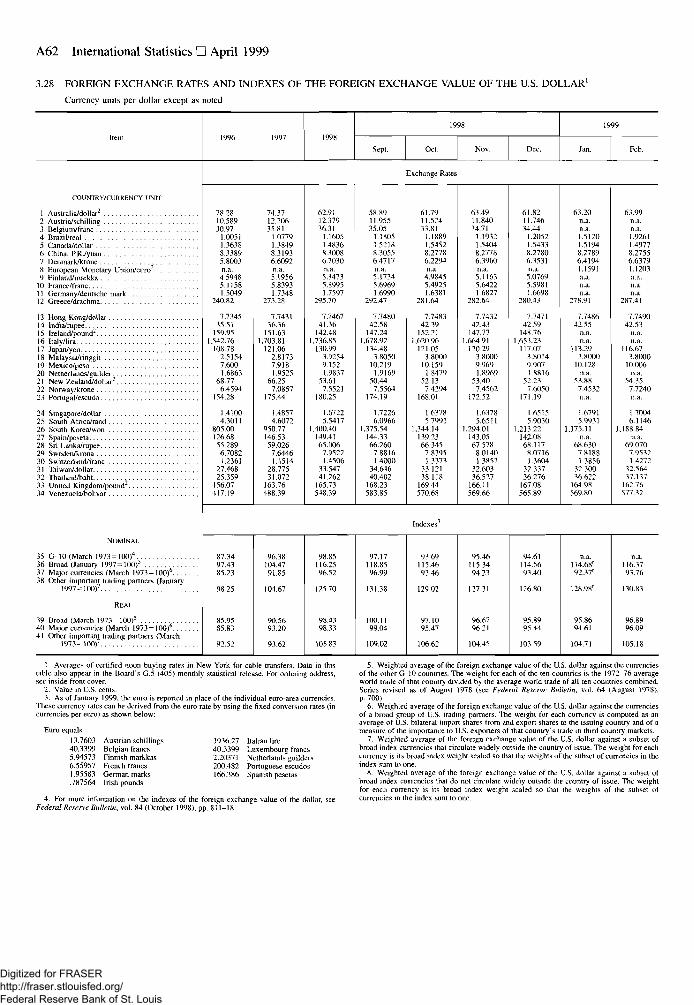
A62 International Statistics • April 1999
3.28 FOREIGN EXCHANGE RATES AND INDEXES OF THE FOREIGN EXCHANGE VALUE OF THE U.S. DOLLAR'
Currency units per dollar except as noted
Item
COUNTRY/CURRENCY UNIT
1 Australia/dollar2
6 China, P.RVyuan7 Denmark/krone8 European Monetary Union/euro1
9 Finland/markka
11 Germany/deutsche mark12 Greece/drachma
13 Hong Kong/dollar
15 Ireland/pound2
17 Japan/yen18 Malaysia/ringgit19 Mexico/peso20 Netherlands/guilder21 New Zealand/dollar2
22 Norway/krone23 Portugal/escudo
24 Singapore/dollar25 South Africa/rand26 South Korea/won27 Spain/peseta
29 Sweden/krona30 Switzerland/franc31 Taiwan/dollar..32 Thailand/baht33 United Kingdom/pound34 Venezuela/holivar
NOMINAL
35 G-10 (March 1973= 100)4
36 Broad (January 1997= 100)5
37 Major currencies (March I973 = 1OO)6
38 Other important trading partners (January1997= 100)7
REAL
39 Broad (March 1973 = 1OO)5
40 Major currencies (March 1973= 100)'41 Other important trading partners (March
1973= 100)7
1996 1997 1998
1998
Sept. Ocl. Nov. Dec.
1999
Jan. Feb.
Exchange Rates
78.2810.58930.97
1.00511.36*88.33895.8003n.a.4 59485.11581.5049
240.82
7.734535.51
159.951,542.76
108.782.51547.6001.6863
68.776.4594
154.28
1.41004.3011
805.00126.6855.2896.70821.2361
27.46825.359
156.07417.19
74.3712.20635.81
1.07791.38498.31936.6092n.a.5.19565.83931.7348
273.28
7.743136.36
151.631,703.81
121.062.81737.9181.9525
66.257.0857
175.44
1.48574.6072
950.77146.5359.026
7.64461.4514
28.77531.072
163.76488.39
62.9112.37936.31
1.16051.48368.30086.7030n.a.5.34735.89951.7597
295.70
7.746741.36
142.481,736.85
130.993.92549.1521.9837
53.617.5521
180.25
1.67225.5417
1,400.40149.4165.006
7.95221.4506
33.54741.262
165.73548.39
58.8911.95535.05
1.18051.52)88.30556.4717n.a.5.17345.69691.6990
292.47
7.748042.58
147.241,678.92
134.483.8050
10.2191.9169
50.447.5564
174.19
1.72266.0966
1.375.54144.3366.2607.88161.4000
34.64640.402
168.23583.85
61.7911.52433.81
1.18891.54S28.27786.2294n.a.4.98455.49251.638)
281.64
7.748342 39
152.211,620.96
121.053.8000
10.1591.8479
52.137.4294
168.01
1.63785.7991
1,344.14139.2366.345
7.83951.3373
33.12138.118
169.44570.68
63.4911.84014.71
1.19321.54048.27786.3960n.a.5.11635.64221.6827
282.64
7.743242.43
147.771,664.91
120.293.80009.9691.8969
53.407.4562
172.52
1.63785.6511
1.294.01143.0567.578
8.01401.3852
32.60336.527
166.11569.66
61.8211.74634.44
1.20521.54338.27806.3531n.a.5.07695.59811.6698
280.43
7.747142.59
148.761,653.23
117.073.80149.9071.8816
52.237.6050
171.19
1.65155.9030
1,213.22142.0868.117
8.07161.3604
32.33736.276
167.08565.89
63.20n.a.n.a.1.51201.51948.27896.41941.1591n.a.n.a.n.a.
278.91
7.748642 55
n.a.
113.293.8000
10.128n.a.
53.887.4532n.a.
1.67915.9931
1.175.11n.a.
68.6307.81881.3856
32.30036.622
164.98569.80
63.99n.a.n.a.1.92611.49778.27556.63791.1203n.a.n.a.n.a.
287.41
7.749042.53
n.a.
116.673.8000
10.006n.a.
M 357.7240n.a.
1.70046.1146
J.I 88.84n.a.
69.0707.95321.4272
32.56437.137
162.76577.32
Indexes1
87.3497.4385.23
98.25
85.9585.83
92.52
96.38104.4791.85
104.67
90.5693.20
93.62
98.85116.2596.52
125.70
98.4398.33
105.83
97.17118.8596.99
131.38
100.1 199.04
109.02
93.69115.4693.46
129.02
97.1095.47
106.62
95.46115.3494.23
127.31
96.6796.21
104.45
94.61114.5693.40
126.80
95.8995 44
103.59
n.a.114.68'92.37'
128.98'
95.8694.61
104.71
n.a.116.3793.76
130.83
96.8996.09
105.18
1. Averages of certified noon buying rates in New York for cable transfers. Data in thistable also appear in the Board's G.5 (405) monthly statistical release. For ordering address,see inside front cover.
2. Value in U.S. cenis.3. As of January 1999, the euro is reported in place of the individual euro-area currencies.
These currency rates can be derived from the euro rate by using the fixed conversion rates (incurrencies per euro) as shown below:
1936.27 Italian lire40.3399 Luxembourg francs2.20371 Netherlands guilders200.482 Portuguese escudos166.386 Spanish pesetas
Euro equals13.760340.33995.945736.559571.95583
Austrian schillingsBelgian francsFinnish markkasFrench francsGerman marks
Series revised as of August 1978 (see Fed'eral Resen-e Bulletin, vol. 64 (August 1978)
neasure of the importance to U.S. exporters of that country's trade in third coun—T » » F r I . 1 J* . 1. . f • 1. . I . . . f . I ¥ T *"• I I I '
.787564 Irish pounds
4. For more information on the indexes of the foreign exchange value of the dollar, seeFederal Reserve Bulletin, vol. 84 (October 1998), pp. 811-18.
index sum to one.8. Weighted average of the foreign exchange value of the U.S. dollar against a subset of
broad index currencies that do not circulate widely outride the country of issue. The weightfor each currency is its broad index weight scaled so that the weights of the subset ofcurrencies in the index sum to one.
Digitized for FRASER http://fraser.stlouisfed.org/ Federal Reserve Bank of St. Louis
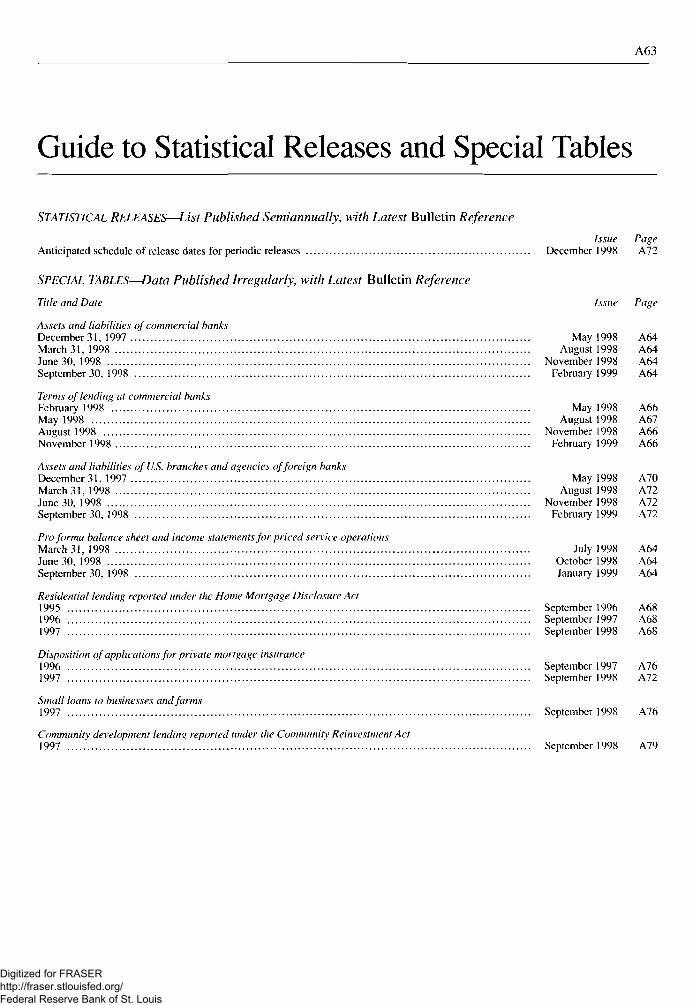
A63
Guide to Statistical Releases and Special Tables
STATISTICAL RELEASES—List Published Semiannually, with Latest Bulletin Reference
Issue PageAnticipated schedule of release dates for periodic releases December 1998 A72
SPECIAL TABLES—Data Published Irregularly, with Latest Bulletin Reference
Title and Date Issue Page
Assets and liabilities of commercial banksDecember 31, 1997 May 1998 A64March31, 1998 August 1998 A64June 30. 1998 November 1998 A64September 30, 1998 February 1999 A64
Terms of lending at commercial banksFebruary 1998 May 1998 A66May 1998 August 1998 A67August 1998 November 1998 A66November 1998 February 1999 A66
Assets and liabilities of U.S. branches and agencies of foreign banksDecember 31, 1997 May 1998 A70March31, 1998 August 1998 A72June 30, 1998 November 1998 A72September 30, 1998 February 1999 A72
Pro forma balance sheet and income statements for priced service operationsMarch 31, 1998 July 1998 A64June30, 1998 October 1998 A64September 30, 1998 January 1999 A64
Residential lending reported under the Home Mortgage Disclosure Act1995 September 1996 A681996 September 1997 A681997 September 1998 A68
Disposition of applications for private mortgage insurance1996 September 1997 A761997 September 1998 A72
Small loans to businesses and farms1997 September 1998 A76
Community development lending reported under the Community Reinvestment Act1997 September 1998 A79
Digitized for FRASER http://fraser.stlouisfed.org/ Federal Reserve Bank of St. Louis
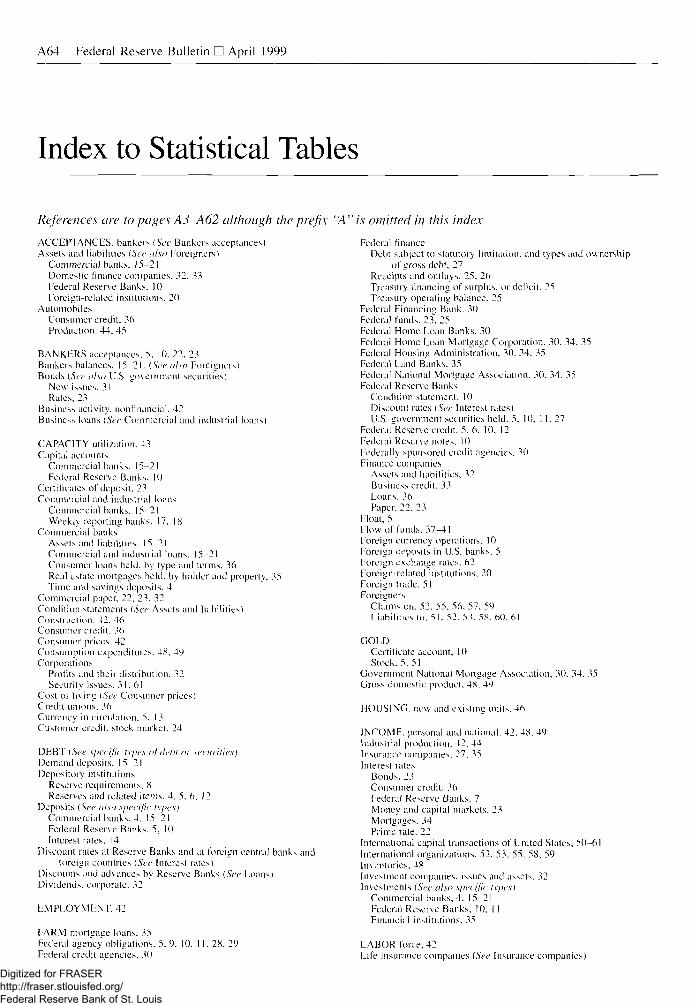
A64 Federal Reserve Bulletin • April 1999
Index to Statistical Tables
References are to pages A3-A62 although the prefix "A" is omitted in this index
. 15-2110
ACCEPTANCES, bankers (See Bankers acceptances)Assets and liabilities (Sec ulso Foreigners)
Commercial banks. 15-21Domestic finance companies. 32, 33Federal Reserve Banks, 10Foreign-related institutions. 20
AutomobilesConsumer credit. 36Production, 44. 45
BANKERS acceptances. 5. 10. 22, 23Bankers balances, 15-21. (See also Foreigners)Bonds (See also U.S. government securities)
New issues, 31Rates. 23
Business activity, nonfinancial, 42Business loans (See Commercial and industrial loans)
CAPACITY utilization. 43Capital accounts
Commercial banks. ,.,-.Federal Reserve Banks.
Certificates of deposit. 23Commercial and industrial loans
Commercial banks. 15-21Weekly reporting banks, 17, 18
Commercial banksAssets and liabilities. 15-21Commercial and industrial loans. 15-21Consumer loans held, by type and terms, 36Real estate mortgages held, by holder and property, 35Time and savings deposits. 4Dmmei
ConditiiConstruction. 42. 46Consumer credit, 30Consumer prices. 42Consumption expenditures. 48, 49Corporations
Profits and their distribution, 32Security issues. 31.61
Cost of living (See Consumer prices)Credit unions. 36Currency in circulation. 5. 13Customer credit, stock market. 24
DEBT {See sjiecific types of debt or securities)Demand deposits. 15-21Depository institutions
Reserve requirements. 8Reserves and related items, 4. 5. 6. 12
Deposits (See ulso .specific types)Commercial hanks. 4. 15-21Federal Reserve Banks. 5, 10Interest rates, 14
Discount rales at Reserve Banks and at foreign central banks andforeign countries {See Interest rates)
Discounts and advances by Reserve Banks (See Loans)Dividends, corporate. 32
EMPLOYMENT, 42
FARM mortgage loans. 35Federal agency'obligations. 5. 9. 10. I 1. 28. 29Federal credit agencies, 30
Commercial paper, 22, 23, 32" "tion statements (See Assets and liabilities)
nrlinn -P 46
Federal financeDebt subject to statutory liniitauou. and types and ownership
of gross debt. 27Receipts and outlays. 25. 26Treasury linancing of surplus, or deficit. 25Treasury operating balance. 25
Federal Financing Bank. 30Federal funds. 23. 25Federal Home Loan Banks. 30Federal Home Loan Mortgage Corporation. 30, 34. 35Federal Housing Administration. 30. 34. 35Federal Land Banks, 35Federal National Mortgage Association, 30. 34, 35Federal Reserve Banks
Condition statement. 10Discount rates (See Interest rates)U.S. government securities held. 5. 10, 11, 27
Federal Reserve credit. 5. 6. 10, 12Federal Reserve notes. 10Federally sponsored credit agencies. 30Finance companies
Assets and liabilities. 32Business credit. 33Loans. 36Paper, 22. 23
Float, 5Flow of funds, 37-41Foreign currency operations. 10Foreign deposits in U.S. banks. 5Foreign exchange rates. 62Foreign-related institutions. 20Foreign trade, 51Foreigners
Claims on, 52. 55. 56. 57, 59Liabilities to. 51. 52. 53. 58. 60. 61
GOLDCertificate account. 10Stock. 5. 51
Government National Mortgage Association. 30. 34. 35Gross domestic product. 48, 49
HOUSING, new and existing units, 46
INCOME, personal and national. 42. 48. 49Industrial production. 42. 44Insurance companies. 27, 35Interest rates
Bonds, 23Consumer credit. 36Federal Reserve Banks, 7Money and capital markets, 23Mortgages. 34Prime rate. 22
International capital transactions of United States. 50-61International organizations. 52, 53. 55, 58. 59Inventories, -18Investment companies, issues and assets. 32Investments (See also specific types)
Commercial banks, 4. 15-21Federal Reserve Banks, 10. 11Financial institutions. 35
LABOR force, 42Life insurance companies (See Insurance companies)
Digitized for FRASER http://fraser.stlouisfed.org/ Federal Reserve Bank of St. Louis
A65
Loans (See also specific types)Commercial banks, 15-21Federal Reserve Banks, 5, 6, 7, 10. 11Financial institutions, 35Insured or guaranteed by United States, 34, 35
MANUFACTURINGCapacity utilization, 43Production, 43, 45
Margin requirements, 24Member banks (See also Depository institutions)
Reserve requirements, 8Mining production, 45Mobile homes shipped, 46Monetary and credit aggregates, 4, 12Money and capital market rates, 23Money stock measures and components, 4, 13Mortgages (See Real estate loans)Mutual funds, 13, 32Mutual savings banks (See Thrift institutions)
NATIONAL defense outlays, 26National income, 48
OPEN market transactions, 9
PERSONAL income. 49Prices
Consumer and producer, 42. 47Stock market, 24
Prime rate, 22Producer prices, 42, 47Production, 42. 44Profits, corporate, 32
REAL estate loansBanks, 15-21,35Terms, yields, and activity, 34Type of holder and property mortgaged, 35
Reserve requirements, 8Reserves
Commercial banks. 15-21Depository institutions. 4, 5. 6, 12Federal Reserve Banks. 10U.S. reserve assets, 51
Residential mortgage loans, 34, 35Retail credit and retail sales, 36, 42
SAVINGFlow of funds, 37-41National income accounts, 48
Savings institutions, 35. 36, 37—41Savings deposits (See Time and savings deposits)Securities (See also specific types)
Federal and federally sponsored credit agencies. 30Foreign transactions, 60New issues, 31Prices, 24
Special drawing rights, 5, 10, 50, 51State and local governments
Holdings of U.S. government securities, 27New security issues, 31Rates on securities, 23
Stock market, selected statistics, 24Stocks (See also Securities)
New issues, 31Prices, 24
Student Loan Marketing Association, 30
TAX receipts, federal, 26Thrift institutions, 4. (See also Credit unions and Savings
institutions)Time and savings deposits, 4, 13, 15-21Trade, foreign, 51Treasury cash. Treasury currency, 5Treasury deposits, 5, 10, 25Treasury operating balance, 25
UNEMPLOYMENT, 42U.S. government balances
Commercial bank holdings, 15-21Treasury deposits at Reserve Banks, 5, 10, 25
U.S. government securitiesBank holdings, 15-21,27Dealer transactions, positions, and financing, 29Federal Reserve Bank holdings, 5, 10, 11. 27Foreign and international holdings and
transactions. 10, 27, 61Open market transactions, 9Outstanding, by type and holder, 27, 28Rates, 23
U.S. international transactions, 50-62Utilities, production, 45
VETERANS Administration, 34, 35
WEEKLY reporting banks, 17, 18Wholesale (producer) prices, 42, 47
YIELDS (See Interest rates)
Digitized for FRASER http://fraser.stlouisfed.org/ Federal Reserve Bank of St. Louis
A66 Federal Reserve Bui letin • April 1999
Federal Reserve Board of Governorsand Official Staff
ALAN GREENSPAN, ChairmanALICE M. RIVLIN, Vice Chair
EDWARD W. KELLEY, JR.LAURENCE H. MEYER
OFFICE OF BOARD MEMBERS
LYNN S. FOX, Assistant to the BoardDONALD J. WINN, Assistant to the BoardTHEODORE E. ALLISON, Assistant to the Board for Federal
Reserve System AffairsWINTHROP P. HAMBLEY, Deputy Congressional LiaisonBOB STAHLY MOORE. Special Assistant to the BoardDIANE E. WERNEKE, Special Assistant to the Board
LEGAL DIVISION
J. VIRGIL MATTINGLY, JR., General CounselSCOTT G. ALVAREZ, Associate General CounselRICHARD M. ASHTON, Associate General CounselOLIVER IRELAND, Associate General CounselKATHLEEN M. O'DAY, Associate General CounselKATHERINE H. WHEATLEY, Assistant General Counsel
OFFICE OF THE SECRETARY
JENNIFER J. JOHNSON, Secretary
ROBERT DEV. FRIERSON, Associate SecretaryBARBARA R. LOWREY, Associate Secretary and Ombudsman
DIVISION OF BANKINGSUPERVISION AND REGULATIONRICHARD SPILLENKOTHEN, Director
STEPHEN C. SCHEMERING, Deputy DirectorHERBERT A. BIERN, Associate DirectorROGER T. COLE, Associate DirectorWILLIAM A. RYBACK, Associate DirectorGERALD A. EDWARDS, JR.. Deputy Associate DirectorSTEPHEN M. HOFFMAN, JR.. Deputy Associate DirectorJAMES V. HOUPT, Deputy Associate DirectorJACK P. JENNINGS, Deputy Associate DirectorMICHAEL G. MARTINSON, Deputy Associate DirectorSIDNEY M. SUSSAN, Deputy Associate DirectorMOLLY S. WASSOM, Deputy Associate DirectorHOWARD A. AMER, Assistant DirectorNORAH M. BARGER, Assistant DirectorBETSY CROSS, Assistant DirectorRICHARD A. SMALL, Assistant DirectorWILLIAM C. SCHNEIDER, JR., Project Director,
National Information Center
DIVISION OF INTERNATIONAL FINANCE
KAREN H. JOHNSON, Director
LEWIS S. ALEXANDER, Deputy DirectorPETER HOOPER III, Deputy DirectorDALE W. HENDERSON, Associate DirectorDAVID H. HOWARD, Senior AdviserDONALD B. ADAMS, Assistant DirectorTHOMAS A. CONNORS, Assistant Director
DIVISION OF RESEARCH AND STATISTICS
MICHAEL J. PRELL, Director
EDWARD C. ETTIN, Deputy DirectorDAVID J. STOCKTON, Deputy DirectorWILLIAM R. JONES. Associate DirectorMYRON L. KWAST, Associate DirectorPATRICK M. PARKINSON, Associate DirectorTHOMAS D. SIMPSON, Associate DirectorLAWRENCE SLIFMAN, Associate DirectorMARTHA S. SCANLON, Deputy Associate DirectorSTEPHEN D. OLINER, Assistant DirectorSTEPHEN A. RHOADES, Assistant DirectorJANICE SHACK-MARQUEZ, Assistant DirectorCHARLES S. STRUCKMEYER. Assistant DirectorALICE PATRICIA WHITE, Assistant Director
JOYCE K. ZICKLER, Assistant DirectorGLENN B. CANNER. Senior AdviserDAVID S. JONES, Senior AdviserJOHN J. MINGO, Senior Adviser
DIVISION OF MONETARY AFFAIRS
DONALD L. KOHN, Director
DAVID E. LINDSEY, Deputy DirectorBRIAN F. MADIGAN. Associate DirectorRICHARD D. PORTER, Deputy Associate DirectorVINCENT R. REINHART, Deputy Associate DirectorWILLIAM C. WHITESELL, Assistant DirectorNORMAND R.V. BERNARD, Special Assistant to the Board
DIVISION OF CONSUMERAND COMMUNITY AFFAIRSDOLORES S. SMITH, Director
GLENN E. LONEY, Deputy DirectorSANDRA F. BRAUNSTEIN, Assistant DirectorMAUREEN P. ENGLISH, Assistant DirectorADRIENNE D. HURT. Assistant DirectorIRENE SHAWN MCNULTY. Assistant Director
Digitized for FRASER http://fraser.stlouisfed.org/ Federal Reserve Bank of St. Louis
A67
ROGER W. FERGUSON, JR.EDWARD M. GRAMLICH
OFFICE OFSTAFF DIRECTOR FOR MANAGEMENT
S. DAVID FROST, Staff DirectorJOHN R. WEIS, Adviser
MANAGEMENT DIVISION
S. DAVID FROST. Director
STEPHEN J. CLARK. Associate Director. Finance FunctionDARRELL R. PAULEY, Associate Director, Human Resources
FunctionSHEILA CLARK, EEO Programs Director
DIVISION OF SUPPORT SERVICES
ROBERT E. FRAZIER, Director
GEORGE M. LOPEZ, Assistant DirectorDAVID L. WILLIAMS, Assistant Director
DIVISION OF INFORMATION RESOURCESMANAGEMENT
STEPHEN R. MALPHRUS, Director
RICHARD C. STEVENS. Deputy DirectorMARIANNE M. EMERSON, Assistant DirectorMAUREEN HANNAN, Assistant DirectorPo KYUNG KIM, Assistant DirectorRAYMOND H. MASSEY. Assistant DirectorEDWARD T. MULRENIN, Assistant DirectorDAY W. RADEBAUGH. JR., Assistant DirectorELIZABETH B. RIGGS. Assistant Director
DIVISION OF RESERVE BANK OPERATIONSAND PAYMENT SYSTEMS
CLYDE H. FARNSWORTH, JR., Director
LOUISE L. ROSEMAN, Associate DirectorPAUL W. BETTGE, Assistant DirectorKENNETH D. BUCKLEY, Assistant DirectorJACK DENNIS, JR., Assistant DirectorJOSEPH H. HAYES, JR., Assistant DirectorJEFFREY C. MARQUARDT, Assistant DirectorMARSHA REIDHILL, Assistant DirectorJEFF STEHM, Assistant Director
OFFICE OF THE INSPECTOR GENERAL
BARRY R. SNYDER, Inspector GeneralDONALD L. ROBINSON, Assistant Inspector General
Digitized for FRASER http://fraser.stlouisfed.org/ Federal Reserve Bank of St. Louis
A68 Federal Reserve Bulletin • April 1999
Federal Open Market Committeeand Advisory Councils
FEDERAL OPEN MARKET COMMITTEE
MEMBERS
ALAN GREENSPAN, Chairman
EDWARD G. BOEHNE
ROGER W. FERGUSON, JR.
EDWARD M. GRAMLICH
EDWARD W. KELLEY, JR.
LAURENCE H. MEYER
ROBERT D. MCTEER, JR.
WILLIAM J. MCDONOUGH, Vice Chairman
MICHAEL H. MOSKOW
GARY H. STERN
ALICE M. RIVLIN
ALTERNATE MEMBERS
J. ALFRED BROADDUS, JR.
JACK GUYNN
JERRY L. JORDAN
ROBERT T. PARRY
JAMIE B. STEWART, JR.
STAFF
DONALD L. KOHN, Secretary and EconomistNORMAND R.V. BERNARD, Deputy SecretaryLYNN S. FOX, Assistant SecretaryGARY P. GILLUM, Assistant SecretaryJ. VIRGIL MATTINGLY, JR., General CounselTHOMAS C. BAXTER, JR., Deputy General CounselMICHAEL J. PRELL, Economist
KAREN H. JOHNSON, Economist
LEWIS S. ALEXANDER, Associate Economist
STEPHEN G. CECCHETTI, Associate EconomistPETER HOOPER III, Associate EconomistWILLIAM C. HUNTER, Associate EconomistRICHARD W. LANG, Associate EconomistDAVID E. LINDSEY, Associate EconomistARTHUR J. ROLNICK, Associate EconomistHARVEY ROSENBLUM, Associate EconomistLAWRENCE SLIFMAN, Associate EconomistDAVID J. STOCKTON, Associate Economist
PETER R. FISHER, Manager, System Open Market Account
FEDERAL ADVISORY COUNCIL
ROBERT W. GILLESPIE, President
KENNETH D. LEWIS,Vice President
LAWRENCE K. FISH, First DistrictDOUGLAS A. WARNER HI, Second DistrictRONALD L. HANKEY, Third DistrictROBERT W. GILLESPIE, Fourth DistrictKENNETH D. LEWIS, Fifth DistrictSTEPHEN A. HANSEL, Sixth District
NORMAN R. BOBINS, Seventh DistrictKATIE S. WINCHESTER, Eighth DistrictRICHARD A. ZONA, Ninth DistrictC. Q. CHANDLER, Tenth DistrictRICHARD W. EVANS, JR., Eleventh DistrictWALTER A. DODS, JR., Twelfth District
JAMES ANNABLE, Co-Secretary
WILLIAM J. KORSVIK, Co-Secretary
Digitized for FRASER http://fraser.stlouisfed.org/ Federal Reserve Bank of St. Louis
A69
CONSUMER ADVISORY COUNCIL
YVONNE S. SPARKS STRAU [ HER. St. Louis, Missouri, ChairmanDWIGHT GOLANN, Boston. Massachusetts. Vice Chairman
LAUREN ANDERSON. New Orleans. LouisianaWAITER J. BOYER. Garland. TexasWAYNE-KENT A. BRADSHAW, LOS Angeles, CaliforniaMALCOLM M. BUSH, Chicago, IllinoisMARY ELLEN DOMEIER. New Ulm. Minnesota
JEREMY D. EISLER, Biloxi, MississippiROBERT F. ELLIOT, Prospect Heights, IllinoisJOHN C. GAMBOA. San Francisco. CaliforniaROSE M. GARCIA. El Paso. TexasVINCENT J. GIBLIN. West Caldwell, New JerseyKARLA S. IRVINE. Cincinnati, OhioWILLIE M. JONES, Boston, MassachusettsJANET C. KOEMLER. Jacksonville. FloridaGWENN S. KYZ.KR, Allen, Texas
JOHN C. LAMB. Sacramento. CaliforniaANNE S. LI . Trenton, New JerseyMARTHA W. MILLER. Greensboro. North CarolinaDANIEL W. MORTON. Columbus. OhioCAROL J. PARRY. New York. New YorkPHILIP PRICE, JR.. Philadelphia. PennsylvaniaMARTA RAMOS. San Juan, Puerto RicoDAVID L. RAMP, St. Paul. MinnesotaMARILYN ROSS, Omaha. NebraskaROBERT G. SCHWEMM, Lexington, KentuckyDAVID J. SHIRK, Eugene. OregonGAIL M. SMALL, Lame Deer, MontanaGARY S. WASHINGTON. Chicago. IllinoisROBERT L. WYNN, II. Madison, Wisconsin
THRIFT INSTITUTIONS ADVISORY COUNCIL
WILLIAM A. FITZGERALD, Omaha, Nebraska, PresidentF. WEI LER MEYER. Falls Church. Virginia. Vice President
GAROLD R. BASE. Piano. TexasJAMES C. BLAINE. Raleigh, North CarolinaDAVID A. BOCHNOWSKI. Munster. IndianaLAWRENCE L. BOUDREAUX III. New Orleans, LouisianaRICHARD P. COUGHLIN. Stoneham, Massachusetts
BABETI'K E. HEIMBUCH. Santa Monica. CaliforniaTHOMAS S. JOHNSON, New York, New YorkWILLIAM A. LONGBRAKE. Seattle. WashingtonKATHLEEN E. MARINANGEL. McHenry. IllinoisANTHONY J. POPP, Marietta. Ohio
Digitized for FRASER http://fraser.stlouisfed.org/ Federal Reserve Bank of St. Louis
A70 Federal Reserve Bulletin • April 1999
Federal Reserve Board Publications
For ordering assistance, write PUBLICATIONS SERVICES,MS-127, Board of Governors of the Federal Reserve System.Washington, DC 20551, or telephone (202) 452-3244, or FAX(202) 728-5886. You may also use the publications orderform available on the Board's World Wide Web site(http://www.federalreserve.gov). When a charge is indicated, pay-ment should accompany request and be made payable to theBoard of Governors of the Federal Reserve System or may beordered via Mastercard, Visa, or American Express. Payment fromforeign residents should be drawn on a U.S. bank.
BOOKS AND MISCELLANEOUS PUBLICATIONSTHE FEDERAL RESERVE SYSTEM —PURPOSES AND FUNCTIONS.
1994. 157 pp.ANNUAL REPORT, 1997.ANNUAL REPORT: BUDGET REVIEW, 1998-99.FEDERAL RESERVE BULLETIN. Monthly. $25.00 per year or $2.50
each in the United States, its possessions. Canada, andMexico. Elsewhere, $35.00 per year or $3.00 each.
ANNUAL STATISTICAL DIGEST: period covered, release date, num-ber of pages, and price.
198119821983198419851986198719881980-89199019911992199319941990-95
October 1982December 1983October 1984October 1985October 1986November 1987October 1988November 1989March 1991November 1991November 1992December 1993December 1994December 1995November 1996
239 pp.266 pp.264 pp.254 pp.231pp.288 pp.272 pp.256 pp.712 pp.185 pp.215 pp.215 pp.281 pp.190 pp.404 pp.
$ 6.50$ 7.50$11.50$12.50$15.00$15.00$15.00$25.00$25.00$25.00$25.00$25.00$25.00$25.00$25.00
SELECTED INTEREST AND EXCHANGE RATES —WEEKLY SERIES OFCHARTS. Weekly. $30.00 per year or $.70 each in the UnitedStates, its possessions, Canada, and Mexico. Elsewhere,$35.00 per year or $.80 each.
REGULATIONS OF THE BOARD OF GOVERNORS OF THE FEDERALRESERVE SYSTEM.
ANNUAL PERCENTAGE RATE TABLES (Truth in Lending—Regulation Z) Vol. I (Regular Transactions). 1969. 100 pp.Vol. II (Irregular Transactions). 1969. 116 pp. Each volume$5.00.
GUIDE TO THE FLOW OF FUNDS ACCOUNTS. 672 pp. $8.50 each.FEDERAL RESERVE REGULATORY SERVICE. Loose-leaf; updated
monthly. (Requests must be prepaid.)Consumer and Community Affairs Handbook. $75.00 per year.Monetary Policy and Reserve Requirements Handbook. $75.00
per year.Securities Credit Transactions Handbook. $75.00 per year.The Payment System Handbook. $75.00 per year.Federal Reserve Regulatory Service. Four vols. (Contains all
four Handbooks plus substantial additional material.) $200.00per year.
Rates for subscribers outside the United States are as followsand include additional air mail costs.
Federal Reserve Regulatory Service, $250.00 per year.Each Handbook, $90.00 per year.
FEDERAL RESERVE REGULATORY SERVICE FOR PERSONAL
COMPUTERS. CD-ROM; updated monthly.Standalone PC. $300 per year.Network, maximum 1 concurrent user. $300 per year.Network, maximum 10 concurrent users. $750 per year.Network, maximum 50 concurrent users. $2,000 per year.Network, maximum 100 concurrent users. $3,000 per year.Subscribers outside the United States should add $50 to cover
additional airmail costs.THE FEDERAL RESERVE ACT AND OTHER STATUTORY PROVISIONS
AFFECTING THE FEDERAL RESERVE SYSTEM, as amendedthrough October 1998. 723 pp. $20.00 each.
THE U.S. ECONOMY IN AN INTERDEPENDENT WORLD: A MULTI-COUNTRY MODEL, May 1984. 590 pp. $14.50 each.
INDUSTRIAL PRODUCTION—1986 EDITION. December 1986.
440 pp. $9.00 each.FINANCIAL FUTURES AND OPTIONS IN THE U.S. ECONOMY.
December 1986. 264 pp. $10.00 each.FINANCIAL SECTORS IN OPEN ECONOMIES: EMPIRICAL ANALY-
SIS AND POLICY ISSUES. August 1990. 608 pp. $25.00 each.RISK MEASUREMENT AND SYSTEMIC RISK: PROCEEDINGS OF A
JOINT CENTRAL BANK RESEARCH CONFERENCE. 1996.578 pp. $25.00 each.
EDUCATION PAMPHLETSShort pamphlets suitable for classroom use. Multiple copies areavailable without charge.
Consumer Handbook on Adjustable Rate MortgagesConsumer Handbook to Credit Protection LawsA Guide to Business Credit for Women, Minorities, and Small
BusinessesSeries on the Structure of the Federal Reserve System
The Board of Governors of the Federal Reserve SystemThe Federal Open Market CommitteeFederal Reserve Bank Board of DirectorsFederal Reserve Banks
A Consumer's Guide to Mortgage Lock-InsA Consumer's Guide to Mortgage Settlement CostsA Consumer's Guide to Mortgage. RefinancingsHome Mortgages: Understanding the Process and Your Right
to Fair LendingHow to File a Consumer ComplaintMaking Sense of SavingsSHOP: The Card You Pick Can Save You MoneyWelcome to the Federal ReserveWhen Your Home is on the Line: What You Should Know
About Home Equity Lines of CreditKeys to Vehicle LeasingLooking for the Best Mortgage
Digitized for FRASER http://fraser.stlouisfed.org/ Federal Reserve Bank of St. Louis
A71
STAFF STUDIES: Only Summaries Printed in theBULLETIN
Studies and papers on economic and financial subjects that arc ofgeneral interest. Requests to obtain single copies of the full text orto be added to the mailing list for the series may be sent toPublications Services.
Staff Studies 1-157. 161, and 168-169 are out of print.
158. THE ADEQUACY AND CONSISTENCY OF MARGIN REQUIRE-MENTS IN THE MARKETS FOR STOCKS AND DERIVATIVEPRODUCTS, by Mark J. Warshawsky with the assistance ofDietrich Earnhart. September 1989. 23 pp.
159. NEW DATA ON THE PERFORMANCE OF NONBANK SUBSIDI-ARIES OF BANK HOLDING COMPANIES, by Nellie Liang andDonald Savage. February 1990. 12 pp.
160. BANKING MARKETS AND THE USE OF FINANCIAL SER-VICES BY SMALL AND MEDIUM-SIZED BUSINESSES, byGregory E. Elliehausen and John D. Wolken. September1990. 35 pp.
162. EVIDENCE ON THE SIZE OF BANKING MARKETS FROM MORT-GAGE LOAN RATES IN TWENTY CITIES, by Stephen A.Rhoades. February 1992. 11 pp.
163. CLEARANCE AND SETTLEMENT IN U.S. SECURITIES MAR-KETS, by Patrick Parkinson. Adam Gilbert, Emily Gollob,Lauren Hargraves, Richard Mead, Jeff Stehm, and MaryAnn Taylor. March 1992. 37 pp.
164. THE 1989-92 CREDIT CRUNCH FOR REAL ESTATE, byJames T. Fergus and John L. Goodman, Jr. July 1993.20 pp.
165. THE DEMAND FOR TRADE CREDIT: AN INVESTIGATION OFMOTIVES FOR TRADE CREDIT USE BY SMALL BUSINESSES, byGregory E. Elliehausen and John D. Wolken. September1993. 18 pp.
166. THE ECONOMICS OF THE PRIVATE PLACEMENT MARKET, byMark Carey, Stephen Prowse, John Rea, and Gregory Udell.January 1994. I l l pp.
167. A SUMMARY OF MERGER PERFORMANCE STUDIES IN BANK-ING, 1980-93, AND AN ASSESSMENT OF THE "OPERATINGPERFORMANCE" AND "EVENT STUDY" METHODOLOGIES,by Stephen A. Rhoades. July 1994. 37 pp.
170. THE COST OF IMPLEMENTING CONSUMER FINANCIAL REGU-LATIONS: A N ANALYSIS OF EXPERIENCE WITH THE TRUTHIN SAVINGS ACT, by Gregory Elliehausen and Barbara R.Lowrey, December 1997. 17 pp.
171. THE COST OF BANK REGULATION: A REVIEW OF THE EVI-DENCE, by Gregory Elliehausen, April 1998. 35 pp.
Digitized for FRASER http://fraser.stlouisfed.org/ Federal Reserve Bank of St. Louis
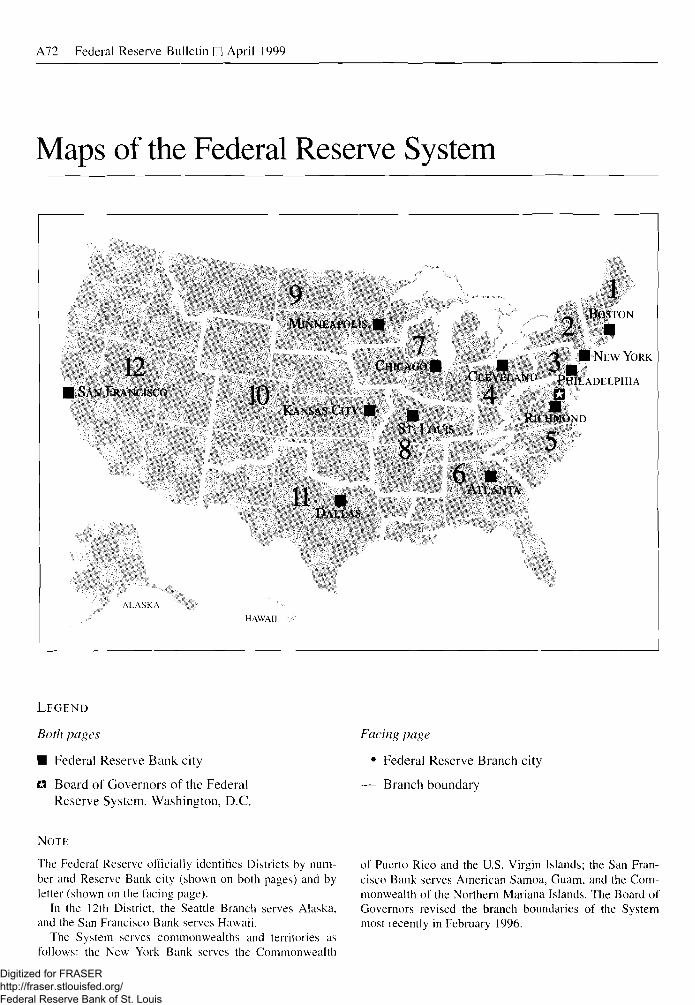
A72 Federal Reserve Bulletin • April 1999
Maps of the Federal Reserve System
12• SAN F R W LSCO
ALASKA
10
HAWAII
9VlfNMiM'OI.IS • 7
CHIIAIIO
KANSAS Cirv P • •
11 •DALLAS
•Sr. 1
8
• , •(.LIATI AND
4KuOUIS
6 •All ASIA
21
UOSION
•"1 • N i vv YORK
Fill!
•'HMOND
5
\DI LPHIA
LEGEND
Both pages
• Federal Reserve Bank city
E3 Board of Governors of the FederalReserve System. Washington, D.C.
Facing page
• Federal Reserve Branch city
— Branch boundary
NOTE
The Federal Reserve officially identifies Districts by num-ber and Reserve Bank city (shown on both pages) and byletter (shown on the facing page).
In the 12th District, the Seattle Branch serves Alaska,and the San Francisco Bank serves Hawaii.
The System serves commonwealths and territories asfollows: the New York Bank serves the Commonwealth
of Puerto Rico and the U.S. Virgin Islands; the San Fran-cisco Bank serves American Samoa, Guam, and the Com-monwealth of the Northern Mariana Islands. The Board ofGovernors revised the branch boundaries of the Systemmost recently in February 1996.
Digitized for FRASER http://fraser.stlouisfed.org/ Federal Reserve Bank of St. Louis
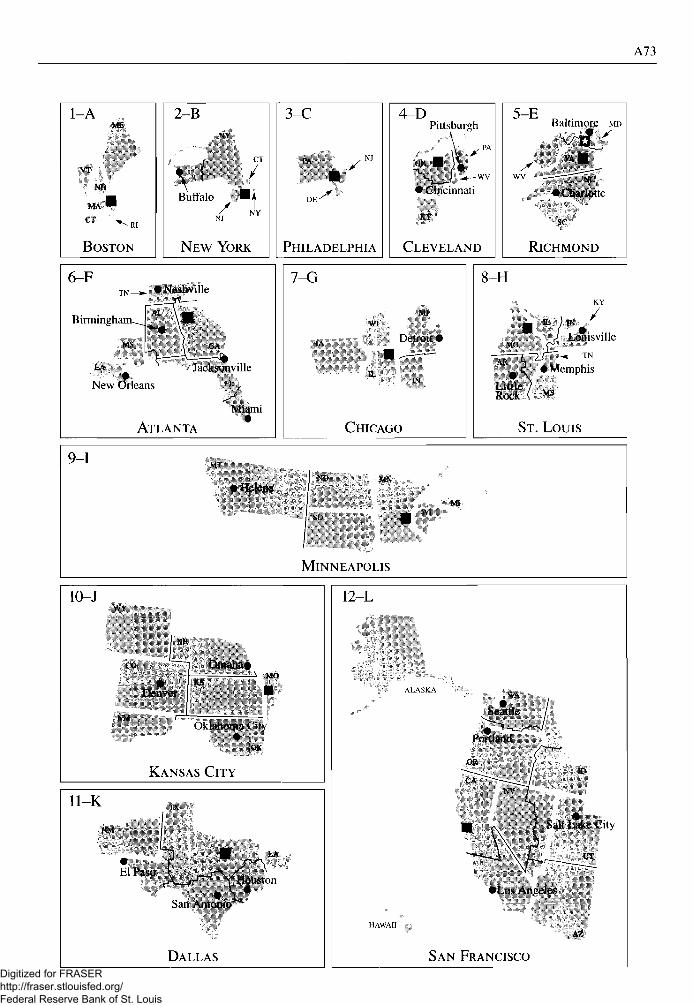
A73
1 Ai n
vrNH
MA •
CT
BOSTON
2-B
NY
NEW YORK
3-C
PHILADELPHIA
4-DPittsburgh
1 Cincinnati
CLEVELAND
5-EBaltimore MD
"It*RICHMOND
6-F
Birmingham
Mm, ifiir *"New Orleans
"ill
ATLANTA
Jacksonville
Miami
7-G
Wl
IL
I )otroil •
CHICAGO
8-H
B, )
MOJ L«»isville
T~^ • B f Memphis
ST. LOUIS
9-1 MT
• HelenaM l
SD
MINNEAPOLIS
10-J
M
• ii Oll lai l . i*M-l
S.M
KANSAS CITY
U-K
NM
I ' Pa-..)
S.ni Antonio
DALLAS
12-L
Salt Lake Cpity
•Los Angeles
AZ
SAN FRANCISCODigitized for FRASER http://fraser.stlouisfed.org/ Federal Reserve Bank of St. Louis
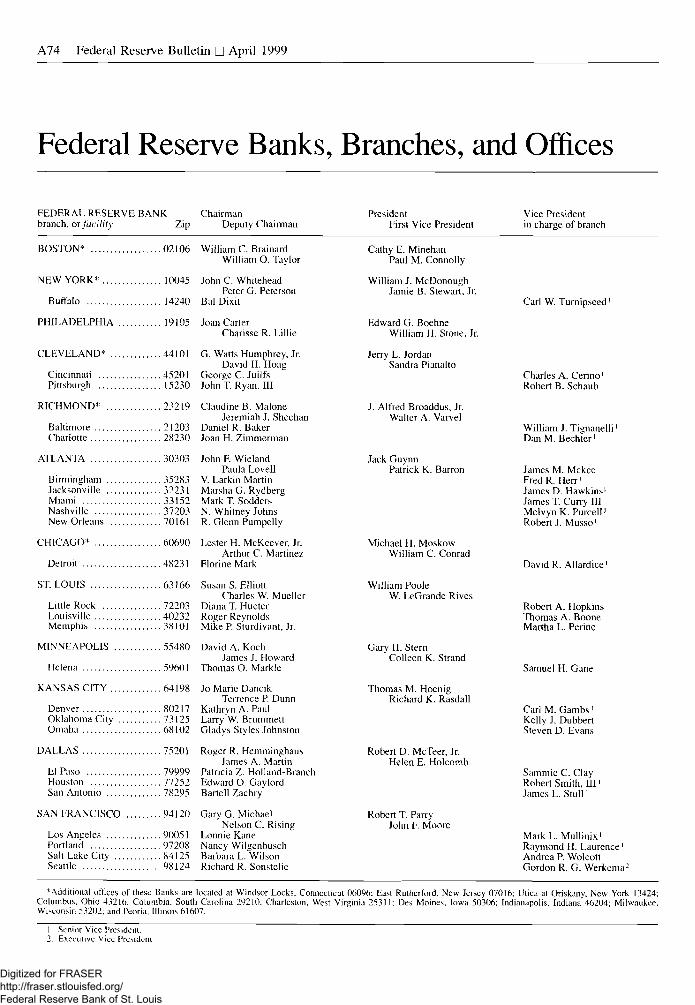
A74 Federal Reserve Bulletin • April 1999
Federal Reserve Banks, Branches, and Offices
FEDERAL RESERVE BANKbranch, or facility Zip
ChairmanDeputy Chairman
PresidentFirst Vice President
Vice Presidentin charge of branch
BOSTON* 02106 William C. BrainardWilliam O.Taylor
NEW YORK* 10045 John C. WhiteheadPeter G. Peterson
Buffalo 14240 Bal Dixit
PHILADELPHIA 19105 Joan CarterCharisse R. Lillie
CLEVELAND* 44101 G. Watts Humphrey, Jr.David H. Hoag
Cincinnati 45201 George C. JuilfsPittsburgh 15230 John T. Ryan, III
RICHMOND* 23219 Claudine B. MaloneJeremiah J. Sheehan
Baltimore 21203 Daniel R. BakerCharlotte 28230 Joan H. Zimmerman
ATLANTA 30303 John F. WielandPaula Lovell
Birmingham 35283 V. Larkin MartinJacksonville 32231 Marsha G. RydbergMiami 33152 Mark T. SoddersNashville 37203 N. Whitney JohnsNew Orleans 70161 R. Glenn Pumpelly
CHICAGO* 60690 Lester H. McKeever, Jr.Arthur C. Martinez
Detroit 48231 Florine Mark
ST. LOUIS 63166 Susan S. ElliottCharles W. Mueller
Little Rock 72203 Diana T. HueterLouisville 40232 Roger ReynoldsMemphis 38101 Mike P. Sturdivant, Jr.
MINNEAPOLIS 55480 David A. KochJames J. Howard
Helena 59601 Thomas O. Markle
KANSAS CITY 64198 Jo Marie DancikTenence P. Dunn
Denver 80217 Kathryn A. PaulOklahoma City 73125 Larry W. BrummettOmaha 68102 Gladys Styles Johnston
DALLAS 75201 Roger R. HemminghausJames A. Martin
El Paso 79999 Patricia Z. Holland-BranchHouston 77252 Edward O. GaylordSan Antonio 78295 Bartell Zachry
SAN FRANCISCO 94120 Gary G. MichaelNelson C. Rising
Los Angeles 90051 Lonnie KanePortland 97208 Nancy WilgenbuschSalt Lake City 84125 Barbara L."WilsonSeattle 98124 Richard R. Sonstelie
Cathy E. MinehanPaul M. Connolly
William J. McDonoughJamie B. Stewart, Jr.
Edward G. BoehneWilliam H. Stone. Jr.
Jerry L. JordanSandra Pianalto
J. Alfred Broaddus, Jr.Walter A. Varvel
Jack GuynnPatrick K. Barron
Michael H. MoskowWilliam C. Conrad
William PooleW. LeGrande Rives
Gary H. SternColleen K. Strand
Thomas M. HoenigRichard K. Rasdall
Robert D. McTeer, Jr.Helen E. Holcomb
Robert T. ParryJohn F. Moore
Carl W. Turnipseed'
Charles A. Cerino'Robert B. Schaub
William J. Tignanelli'DanM. Bechter1
James M. MckeeFredR. Herr1
James D. Hawkins'James T. Curry HIMelvyn K. Purcel!'Robert J. Musso1
David R. Allardice'
Robert A. HopkinsThomas A. BooneMartha L. Perine
Samuel H. Gane
Carl M. Gambs'Kelly J. DubbertSteven D. Evans
Sammie C. ClayRobert Smith, III'James L. Stull'
MarkL. Mullinix1
Raymond H. Laurence'Andrea P. WolcottGordon R. G. Werkema2
•Additional offices of these Banks are located at Windsor Locks, Connecticut 06096; East Rutherford, New Jersey 07016; Utica at Oriskany, New York 13424;Columbus, Ohio 43216; Columbia, South Carolina 29210; Charleston, West Virginia 25311: Des Moines. Iowa 50306; Indianapolis. Indiana 46204; Milwaukee.Wisconsin 53202; and Peoria, Illinois 61607.
1. Senior Vice President.2. Executive Vice President
Digitized for FRASER http://fraser.stlouisfed.org/ Federal Reserve Bank of St. Louis