Embed Size (px)
Citation preview
Arizona Department of Health Services
AZ Health Zone Annual Report
Federal Fiscal Year 2017
PAGE INTENTIONALLY BLANK
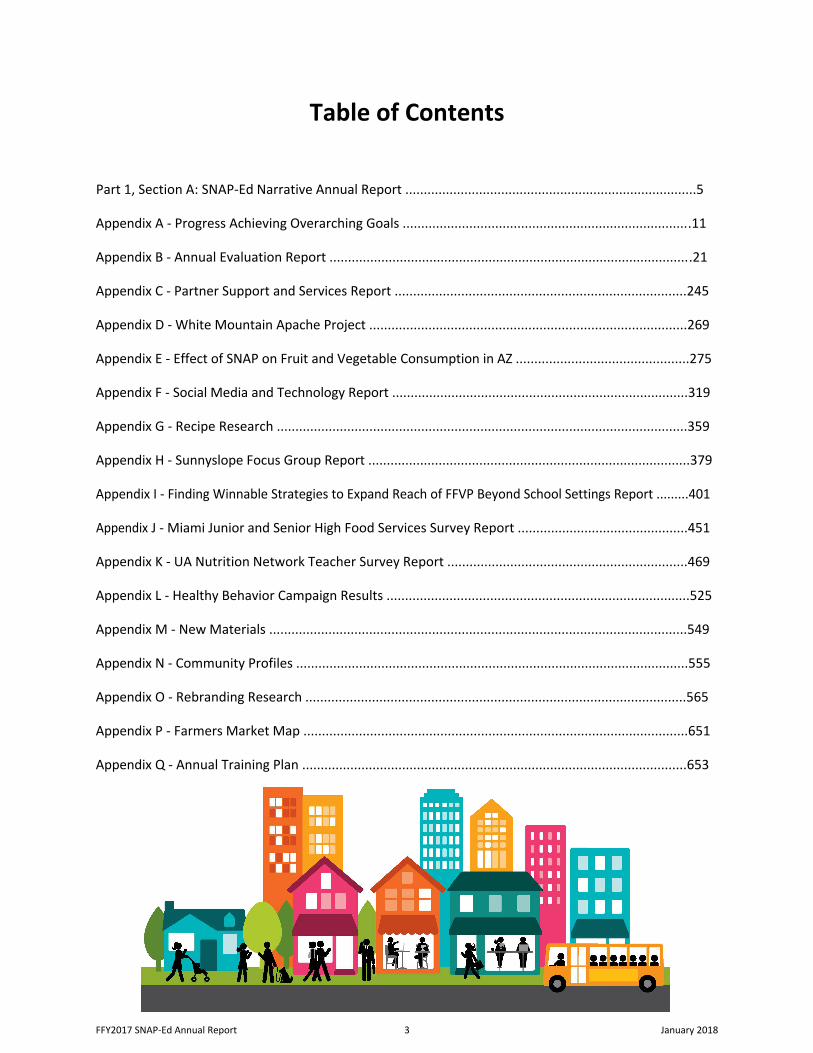
Table of Contents
Part 1, Section A: SNAP-Ed Narrative Annual Report ...............................................................................5
Appendix A - Progress Achieving Overarching Goals ..............................................................................11
Appendix B - Annual Evaluation Report ..................................................................................................21
Appendix C - Partner Support and Services Report ...............................................................................245
Appendix D - White Mountain Apache Project ......................................................................................269
Appendix E - Effect of SNAP on Fruit and Vegetable Consumption in AZ ...............................................275
Appendix F - Social Media and Technology Report ................................................................................319
Appendix G - Recipe Research ...............................................................................................................359
Appendix H - Sunnyslope Focus Group Report .......................................................................................379
Appendix I - Finding Winnable Strategies to Expand Reach of FFVP Beyond School Settings Report .........401
Appendix J - Miami Junior and Senior High Food Services Survey Report ..............................................451
Appendix K - UA Nutrition Network Teacher Survey Report .................................................................469
Appendix L - Healthy Behavior Campaign Results ..................................................................................525
Appendix M - New Materials .................................................................................................................549
Appendix N - Community Profiles ..........................................................................................................555
Appendix O - Rebranding Research .......................................................................................................565
Appendix P - Farmers Market Map ........................................................................................................651
Appendix Q - Annual Training Plan ........................................................................................................653
FFY2017 SNAP-Ed Annual Report 3 January 2018

FFY2017 SNAP-Ed Annual Report 4 January 2018
PAGE INTENTIONALLY BLANK
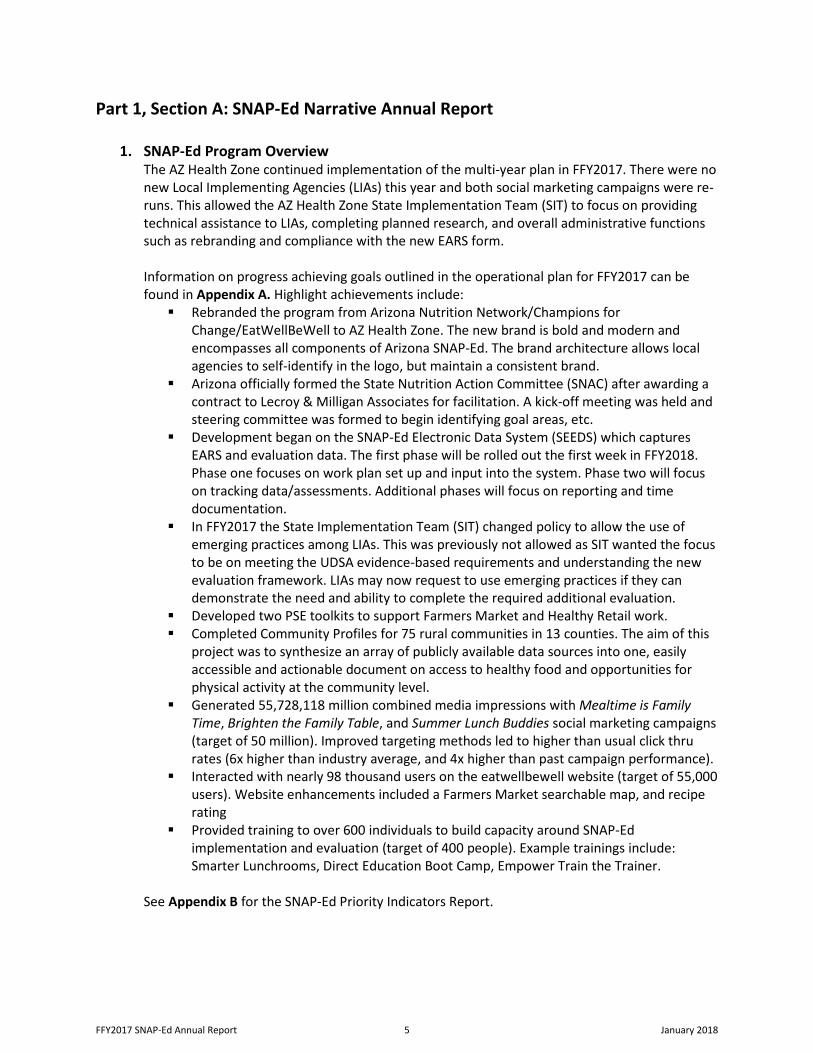
Part 1, Section A: SNAP-Ed Narrative Annual Report
1. SNAP-Ed Program OverviewThe AZ Health Zone continued implementation of the multi-year plan in FFY2017. There were nonew Local Implementing Agencies (LIAs) this year and both social marketing campaigns were re-runs. This allowed the AZ Health Zone State Implementation Team (SIT) to focus on providingtechnical assistance to LIAs, completing planned research, and overall administrative functionssuch as rebranding and compliance with the new EARS form.
Information on progress achieving goals outlined in the operational plan for FFY2017 can befound in Appendix A. Highlight achievements include: Rebranded the program from Arizona Nutrition Network/Champions for
Change/EatWellBeWell to AZ Health Zone. The new brand is bold and modern andencompasses all components of Arizona SNAP-Ed. The brand architecture allows localagencies to self-identify in the logo, but maintain a consistent brand.
Arizona officially formed the State Nutrition Action Committee (SNAC) after awarding acontract to Lecroy & Milligan Associates for facilitation. A kick-off meeting was held andsteering committee was formed to begin identifying goal areas, etc.
Development began on the SNAP-Ed Electronic Data System (SEEDS) which capturesEARS and evaluation data. The first phase will be rolled out the first week in FFY2018.Phase one focuses on work plan set up and input into the system. Phase two will focuson tracking data/assessments. Additional phases will focus on reporting and timedocumentation.
In FFY2017 the State Implementation Team (SIT) changed policy to allow the use ofemerging practices among LIAs. This was previously not allowed as SIT wanted the focusto be on meeting the UDSA evidence-based requirements and understanding the newevaluation framework. LIAs may now request to use emerging practices if they candemonstrate the need and ability to complete the required additional evaluation.
Developed two PSE toolkits to support Farmers Market and Healthy Retail work. Completed Community Profiles for 75 rural communities in 13 counties. The aim of this
project was to synthesize an array of publicly available data sources into one, easilyaccessible and actionable document on access to healthy food and opportunities forphysical activity at the community level.
Generated 55,728,118 million combined media impressions with Mealtime is FamilyTime, Brighten the Family Table, and Summer Lunch Buddies social marketing campaigns(target of 50 million). Improved targeting methods led to higher than usual click thrurates (6x higher than industry average, and 4x higher than past campaign performance).
Interacted with nearly 98 thousand users on the eatwellbewell website (target of 55,000users). Website enhancements included a Farmers Market searchable map, and reciperating
Provided training to over 600 individuals to build capacity around SNAP-Edimplementation and evaluation (target of 400 people). Example trainings include:Smarter Lunchrooms, Direct Education Boot Camp, Empower Train the Trainer.
See Appendix B for the SNAP-Ed Priority Indicators Report.
FFY2017 SNAP-Ed Annual Report 5 January 2018
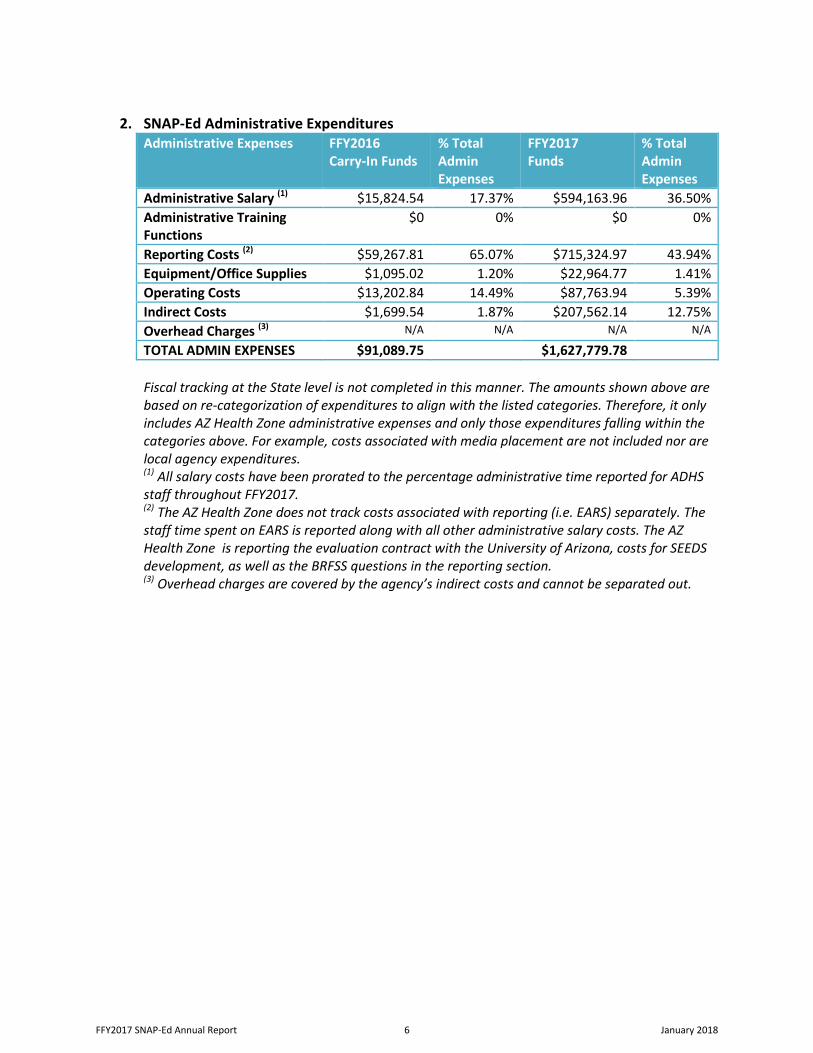
2. SNAP-Ed Administrative ExpendituresAdministrative Expenses FFY2016
Carry-In Funds % Total Admin Expenses
FFY2017 Funds
% Total Admin Expenses
Administrative Salary (1) $15,824.54 17.37% $594,163.96 36.50% Administrative Training Functions
$0 0% $0 0%
Reporting Costs (2) $59,267.81 65.07% $715,324.97 43.94% Equipment/Office Supplies $1,095.02 1.20% $22,964.77 1.41% Operating Costs $13,202.84 14.49% $87,763.94 5.39% Indirect Costs $1,699.54 1.87% $207,562.14 12.75% Overhead Charges (3) N/A N/A N/A N/A
TOTAL ADMIN EXPENSES $91,089.75 $1,627,779.78
Fiscal tracking at the State level is not completed in this manner. The amounts shown above are based on re-categorization of expenditures to align with the listed categories. Therefore, it only includes AZ Health Zone administrative expenses and only those expenditures falling within the categories above. For example, costs associated with media placement are not included nor are local agency expenditures. (1) All salary costs have been prorated to the percentage administrative time reported for ADHSstaff throughout FFY2017.(2) The AZ Health Zone does not track costs associated with reporting (i.e. EARS) separately. Thestaff time spent on EARS is reported along with all other administrative salary costs. The AZHealth Zone is reporting the evaluation contract with the University of Arizona, costs for SEEDSdevelopment, as well as the BRFSS questions in the reporting section.(3) Overhead charges are covered by the agency’s indirect costs and cannot be separated out.
FFY2017 SNAP-Ed Annual Report 6 January 2018
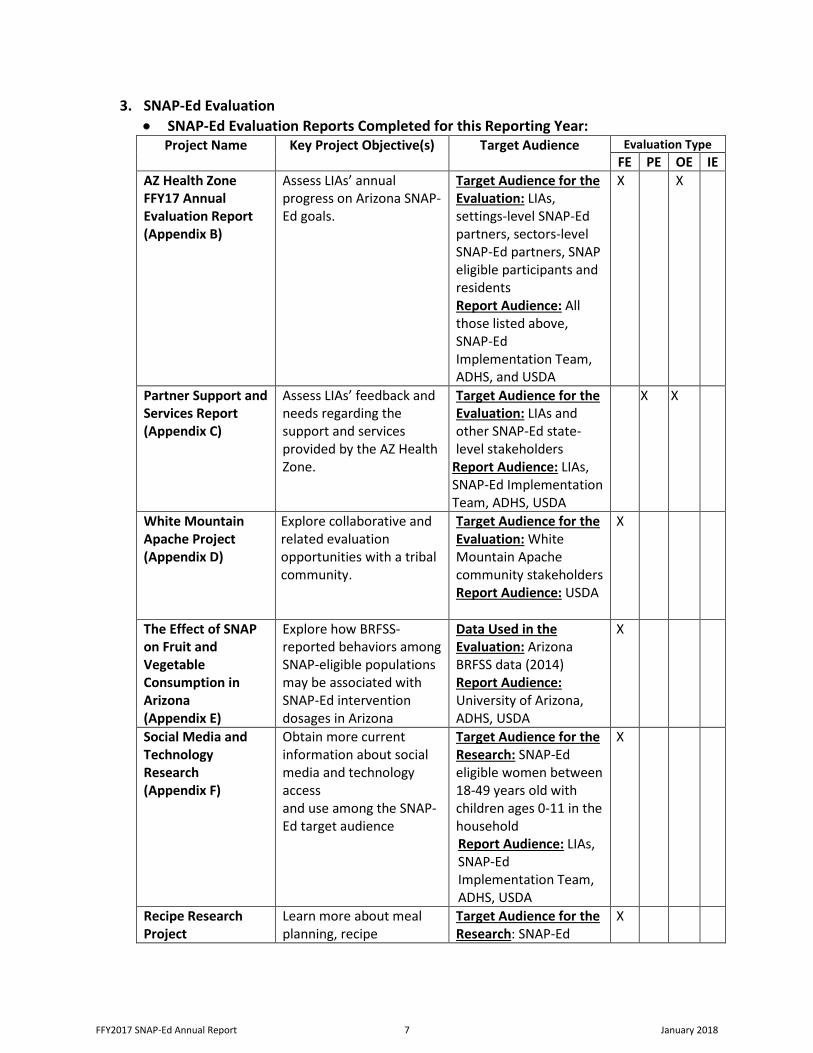
3. SNAP-Ed Evaluation• SNAP-Ed Evaluation Reports Completed for this Reporting Year:
Project Name Key Project Objective(s) Target Audience Evaluation Type FE PE OE IE
AZ Health Zone FFY17 Annual Evaluation Report (Appendix B)
Assess LIAs’ annual progress on Arizona SNAP-Ed goals.
Target Audience for the Evaluation: LIAs, settings-level SNAP-Ed partners, sectors-level SNAP-Ed partners, SNAP eligible participants and residents Report Audience: All those listed above, SNAP-Ed Implementation Team, ADHS, and USDA
X X
Partner Support and Services Report (Appendix C)
Assess LIAs’ feedback and needs regarding the support and services provided by the AZ Health Zone.
Target Audience for the Evaluation: LIAs and other SNAP-Ed state-level stakeholders
Report Audience: LIAs, SNAP-Ed Implementation Team, ADHS, USDA
X X
White Mountain Apache Project (Appendix D)
Explore collaborative and related evaluation opportunities with a tribal community.
Target Audience for the Evaluation: White Mountain Apache community stakeholders Report Audience: USDA
X
The Effect of SNAP on Fruit and Vegetable Consumption in Arizona (Appendix E)
Explore how BRFSS-reported behaviors among SNAP-eligible populations may be associated with SNAP-Ed intervention dosages in Arizona
Data Used in the Evaluation: Arizona BRFSS data (2014) Report Audience: University of Arizona, ADHS, USDA
X
Social Media and Technology Research (Appendix F)
Obtain more current information about social media and technology access and use among the SNAP-Ed target audience
Target Audience for the Research: SNAP-Ed eligible women between 18-49 years old withchildren ages 0-11 in thehouseholdReport Audience: LIAs,SNAP-Ed Implementation Team, ADHS, USDA
X
Recipe Research Project
Learn more about meal planning, recipe
Target Audience for the Research: SNAP-Ed
X
FFY2017 SNAP-Ed Annual Report 7 January 2018
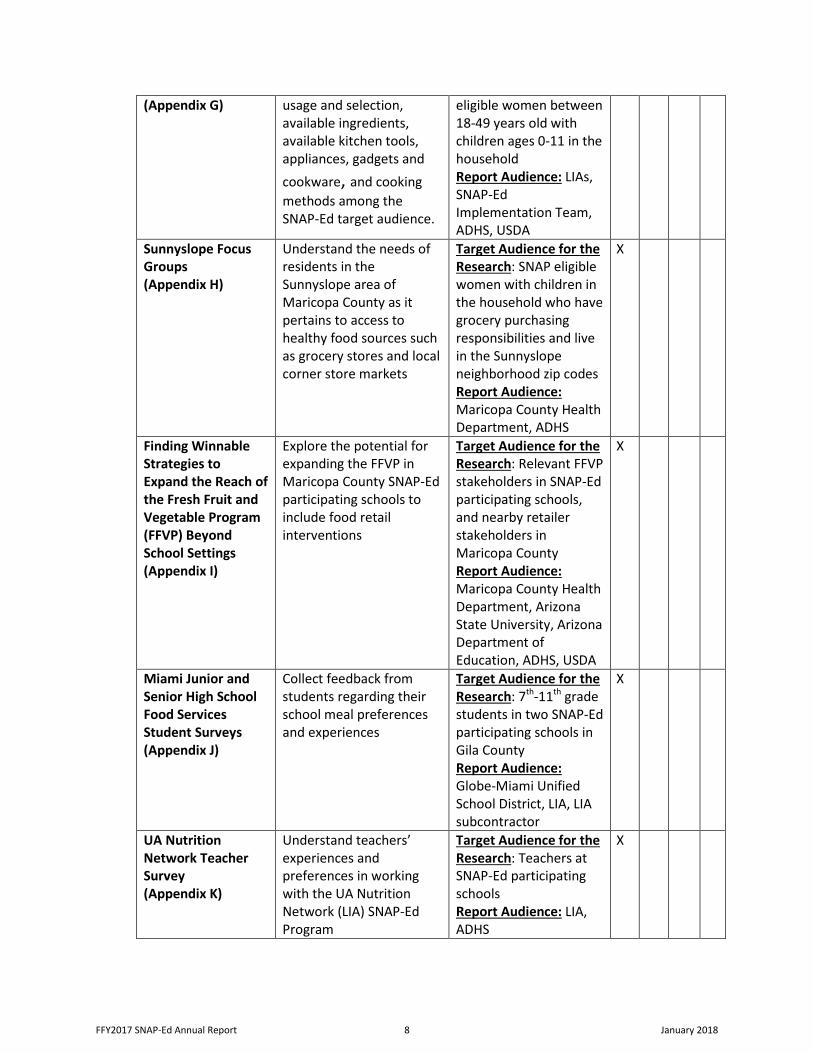
(Appendix G) usage and selection, available ingredients, available kitchen tools, appliances, gadgets and cookware, and cookingmethods among the SNAP-Ed target audience.
eligible women between 18-49 years old withchildren ages 0-11 in thehouseholdReport Audience: LIAs,SNAP-Ed Implementation Team, ADHS, USDA
Sunnyslope Focus Groups (Appendix H)
Understand the needs of residents in the Sunnyslope area of Maricopa County as it pertains to access to healthy food sources such as grocery stores and local corner store markets
Target Audience for the Research: SNAP eligible women with children in the household who have grocery purchasing responsibilities and live in the Sunnyslope neighborhood zip codes Report Audience: Maricopa County Health Department, ADHS
X
Finding Winnable Strategies to Expand the Reach of the Fresh Fruit and Vegetable Program (FFVP) Beyond School Settings (Appendix I)
Explore the potential for expanding the FFVP in Maricopa County SNAP-Ed participating schools to include food retail interventions
Target Audience for the Research: Relevant FFVP stakeholders in SNAP-Ed participating schools, and nearby retailer stakeholders in Maricopa County Report Audience: Maricopa County Health Department, Arizona State University, Arizona Department of Education, ADHS, USDA
X
Miami Junior and Senior High School Food Services Student Surveys (Appendix J)
Collect feedback from students regarding their school meal preferences and experiences
Target Audience for the Research: 7th-11th grade students in two SNAP-Ed participating schools in Gila County Report Audience: Globe-Miami Unified School District, LIA, LIA subcontractor
X
UA Nutrition Network Teacher Survey (Appendix K)
Understand teachers’ experiences and preferences in working with the UA Nutrition Network (LIA) SNAP-Ed Program
Target Audience for the Research: Teachers at SNAP-Ed participating schools Report Audience: LIA, ADHS
X
FFY2017 SNAP-Ed Annual Report 8 January 2018
4. SNAP-Ed Planned ImprovementsThe AZ Health Zone will continue to focus on implementation of the multi-year plan. The AZHealth Zone State Implementation Team (SIT) and DES will continue to meet quarterly tostrengthen collaboration.
The new project management tools introduced in FFY2017 were extremely helpful, but noteasily adjustable to program changes. Therefore, FFY2018 will see a new project managementtool called Flow which offers an online portal that can be used by State Implementation andState Evaluation staff.
The main focus of FFY2018 will be rollout of the new SNAP-Ed Electronic Data System (SEEDS)which will capture EARS data and evaluation indicators.
5. AppendicesAppendix A: Progress Achieving Overarching GoalsAppendix B: Annual Evaluation ReportAppendix C: Partner Support and Services ReportAppendix D: White Mountain Apache ProjectAppendix E: Effect of SNAP on Fruit and Vegetable Consumption ReportAppendix F: Social Media & Technology ResearchAppendix G: Recipe ResearchAppendix H: Sunnyslope Focus GroupsAppendix I: Finding Winnable Strategies to Expand Reach of FFVP Beyond School Settings ReportAppendix J: Miami Junior and Senior High School Food Services Students SurveysAppendix K: UA Nutrition Network Teacher Survey ReportAppendix L: Healthy Behavior Campaign ResultsAppendix M: New MaterialsAppendix N: Community ProfilesAppendix O: Rebranding ResearchAppendix P: Farmers Market MapAppendix Q: Annual Training Plan
FFY2017 SNAP-Ed Annual Report 9 January 2018

PPAGE INTENTIONALLY BLANK
FFY2017 SNAP-Ed Annual Report 10 January 2018
Appendix A
Progress Achieving Overarching Goals
FFY2017 SNAP-Ed Annual Report 11 January 2018
AZ Health Zone Program Overview – Progress Achieving Overarching Goals
Result 1: By September 30, 2018, develop, conduct, and evaluate three effective social marketing campaigns to promote increased consumption of fruits and vegetables targeting SNAP eligible individuals with an annual overall marketing reach of at least 25 million to include media impressions, website visitors, HRMP campaign(s), and social media supporting local contractors in the five service areas of Food Systems, Active Living, School Health, Early Childhood Development, and Direct Education.
In late FFY2016, the Bureau of Nutrition and Physical Activity (BNPA) changed direction in relation to marketing firms. Many of the marketing/communications projects were slightly delayed in FFY2017 due to unanticipated challenges with the change in firms. Luckily, both FFY2017 paid media campaigns were re-running existing creative.
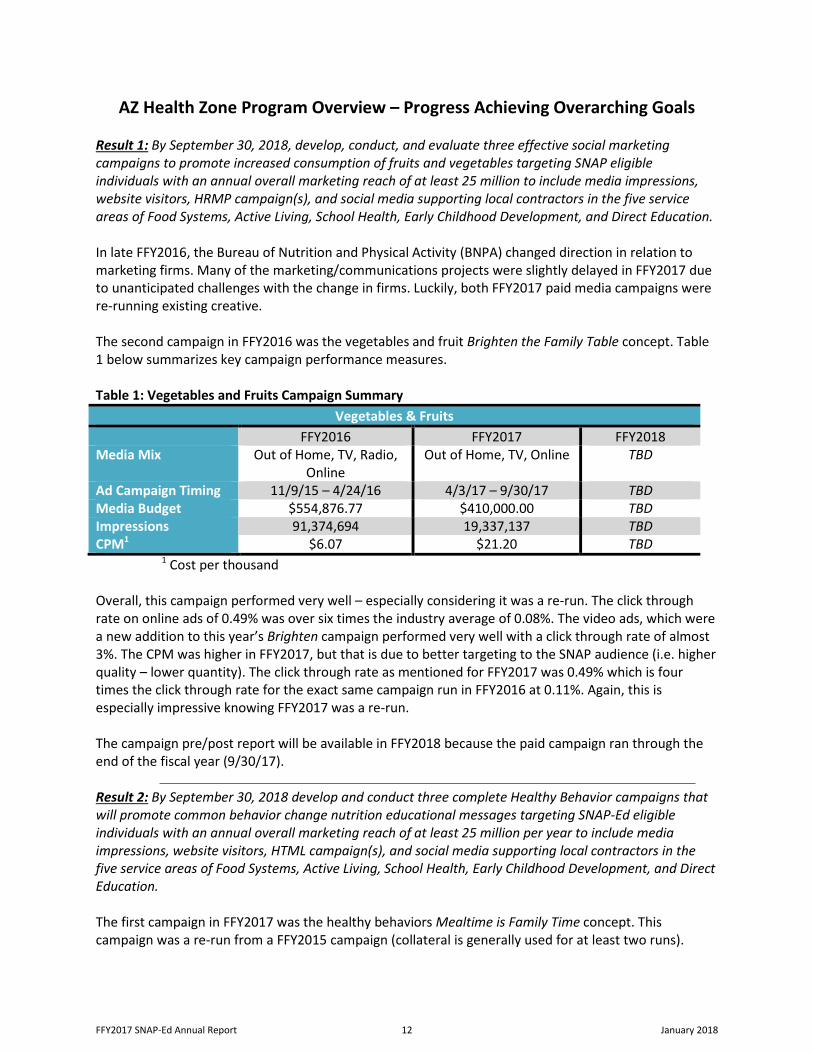
The second campaign in FFY2016 was the vegetables and fruit Brighten the Family Table concept. Table 1 below summarizes key campaign performance measures.
Table 1: Vegetables and Fruits Campaign Summary Vegetables & Fruits
FFY2016 FFY2017 FFY2018 Media Mix Out of Home, TV, Radio,
Online Out of Home, TV, Online TBD
Ad Campaign Timing 11/9/15 – 4/24/16 4/3/17 – 9/30/17 TBD Media Budget $554,876.77 $410,000.00 TBD Impressions 91,374,694 19,337,137 TBD CPM1 $6.07 $21.20 TBD
1 Cost per thousand
Overall, this campaign performed very well – especially considering it was a re-run. The click through rate on online ads of 0.49% was over six times the industry average of 0.08%. The video ads, which were a new addition to this year’s Brighten campaign performed very well with a click through rate of almost 3%. The CPM was higher in FFY2017, but that is due to better targeting to the SNAP audience (i.e. higher quality – lower quantity). The click through rate as mentioned for FFY2017 was 0.49% which is four times the click through rate for the exact same campaign run in FFY2016 at 0.11%. Again, this is especially impressive knowing FFY2017 was a re-run.
The campaign pre/post report will be available in FFY2018 because the paid campaign ran through the end of the fiscal year (9/30/17).
Result 2: By September 30, 2018 develop and conduct three complete Healthy Behavior campaigns that will promote common behavior change nutrition educational messages targeting SNAP-Ed eligible individuals with an annual overall marketing reach of at least 25 million per year to include media impressions, website visitors, HTML campaign(s), and social media supporting local contractors in the five service areas of Food Systems, Active Living, School Health, Early Childhood Development, and Direct Education.
The first campaign in FFY2017 was the healthy behaviors Mealtime is Family Time concept. This campaign was a re-run from a FFY2015 campaign (collateral is generally used for at least two runs).
FFY2017 SNAP-Ed Annual Report 12 January 2018
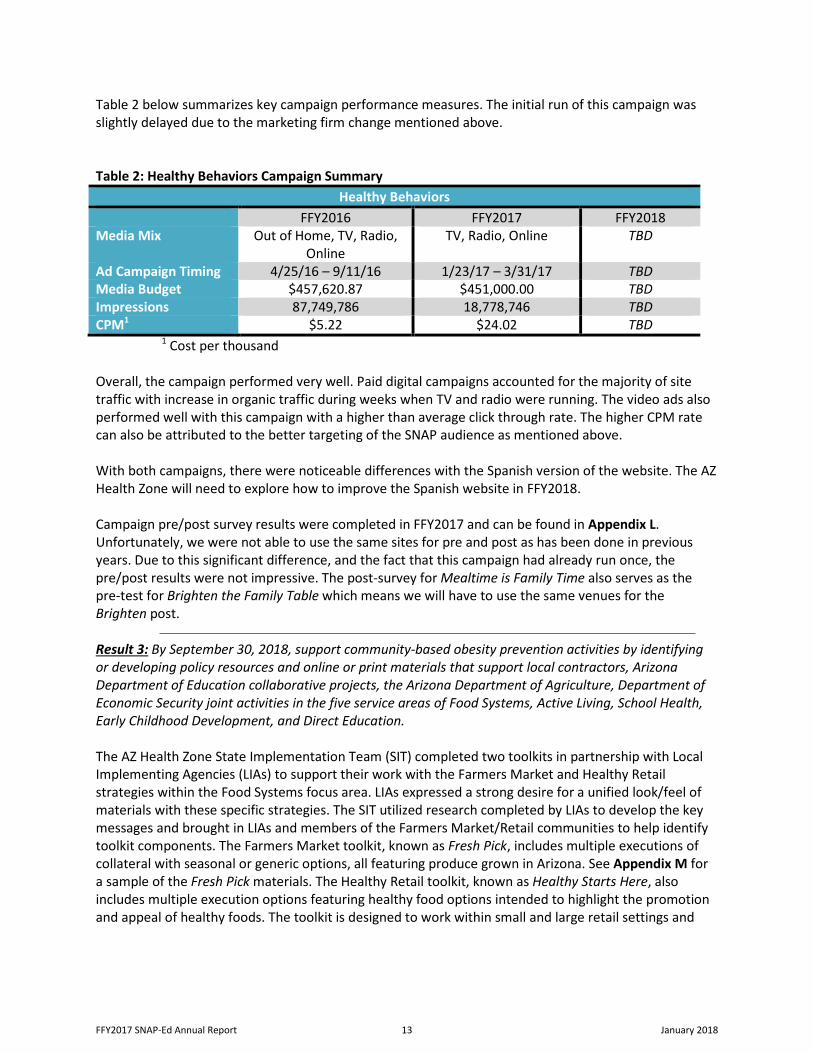
Table 2 below summarizes key campaign performance measures. The initial run of this campaign was slightly delayed due to the marketing firm change mentioned above.
Table 2: Healthy Behaviors Campaign Summary Healthy Behaviors
FFY2016 FFY2017 FFY2018 Media Mix Out of Home, TV, Radio,
Online TV, Radio, Online TBD
Ad Campaign Timing 4/25/16 – 9/11/16 1/23/17 – 3/31/17 TBD Media Budget $457,620.87 $451,000.00 TBD Impressions 87,749,786 18,778,746 TBD CPM1 $5.22 $24.02 TBD
1 Cost per thousand
Overall, the campaign performed very well. Paid digital campaigns accounted for the majority of site traffic with increase in organic traffic during weeks when TV and radio were running. The video ads also performed well with this campaign with a higher than average click through rate. The higher CPM rate can also be attributed to the better targeting of the SNAP audience as mentioned above.
With both campaigns, there were noticeable differences with the Spanish version of the website. The AZ Health Zone will need to explore how to improve the Spanish website in FFY2018.
Campaign pre/post survey results were completed in FFY2017 and can be found in Appendix L. Unfortunately, we were not able to use the same sites for pre and post as has been done in previous years. Due to this significant difference, and the fact that this campaign had already run once, the pre/post results were not impressive. The post-survey for Mealtime is Family Time also serves as the pre-test for Brighten the Family Table which means we will have to use the same venues for the Brighten post.
Result 3: By September 30, 2018, support community-based obesity prevention activities by identifying or developing policy resources and online or print materials that support local contractors, Arizona Department of Education collaborative projects, the Arizona Department of Agriculture, Department of Economic Security joint activities in the five service areas of Food Systems, Active Living, School Health, Early Childhood Development, and Direct Education.
The AZ Health Zone State Implementation Team (SIT) completed two toolkits in partnership with Local Implementing Agencies (LIAs) to support their work with the Farmers Market and Healthy Retail strategies within the Food Systems focus area. LIAs expressed a strong desire for a unified look/feel of materials with these specific strategies. The SIT utilized research completed by LIAs to develop the key messages and brought in LIAs and members of the Farmers Market/Retail communities to help identify toolkit components. The Farmers Market toolkit, known as Fresh Pick, includes multiple executions of collateral with seasonal or generic options, all featuring produce grown in Arizona. See Appendix M for a sample of the Fresh Pick materials. The Healthy Retail toolkit, known as Healthy Starts Here, also includes multiple execution options featuring healthy food options intended to highlight the promotion and appeal of healthy foods. The toolkit is designed to work within small and large retail settings and
FFY2017 SNAP-Ed Annual Report 13 January 2018
utilizes a tag line of “small steps to healthy habits”. See Appendix M for a sample of the Healthy Starts Here materials.
The AZ Health Zone continues to support nutrition education with the Fresh Fruit and Vegetable Program (FFVP) run through the Arizona Department of Education (ADE). The AZ Health Zone SIT purchases nutrition education resources for schools participating in FFVP, coordinates LIA participation in all trainings for FFVP implementers, and connects FFVP schools to LIAs in their communities. With input from AZ Health Zone, ADE selects the nutrition education resources for the FFVP schools.
The AZ Health Zone completed the first set of Community Profiles which focused on 75 rural communities in 13 counties (urban communities will follow in FFY2018). The aim of this project was to synthesize an array of publicly available data sources into one, easily accessible and actionable document on access to healthy food and opportunities for physical activity at the community level. The profiles will be utilized by LIAs when working with decision makers and community members to support community changes. Appendix N has sample profiles as well as the full methodology. Community Profiles have been shared with LIAs and will be available on the program website once enhancements have been completed (FFY2018).
In collaboration with the Arizona Department of Agriculture (ADA), the Harvest Calendar was updated in FFY2017 and renamed the Eat in Season Guide (found in Appendix M). The newly designed material is easier to read, better promotes seasonality of foods, and aligns with programming efforts happening in and out of gardens/farmers markets. Breaking the harvest calendar into four seasonal documents increases opportunities for promotion, and also allows for “fresh” materials when interacting with the SNAP-Ed audience. LIAs once again played an integral part of the material development process helping with piloting materials etc.
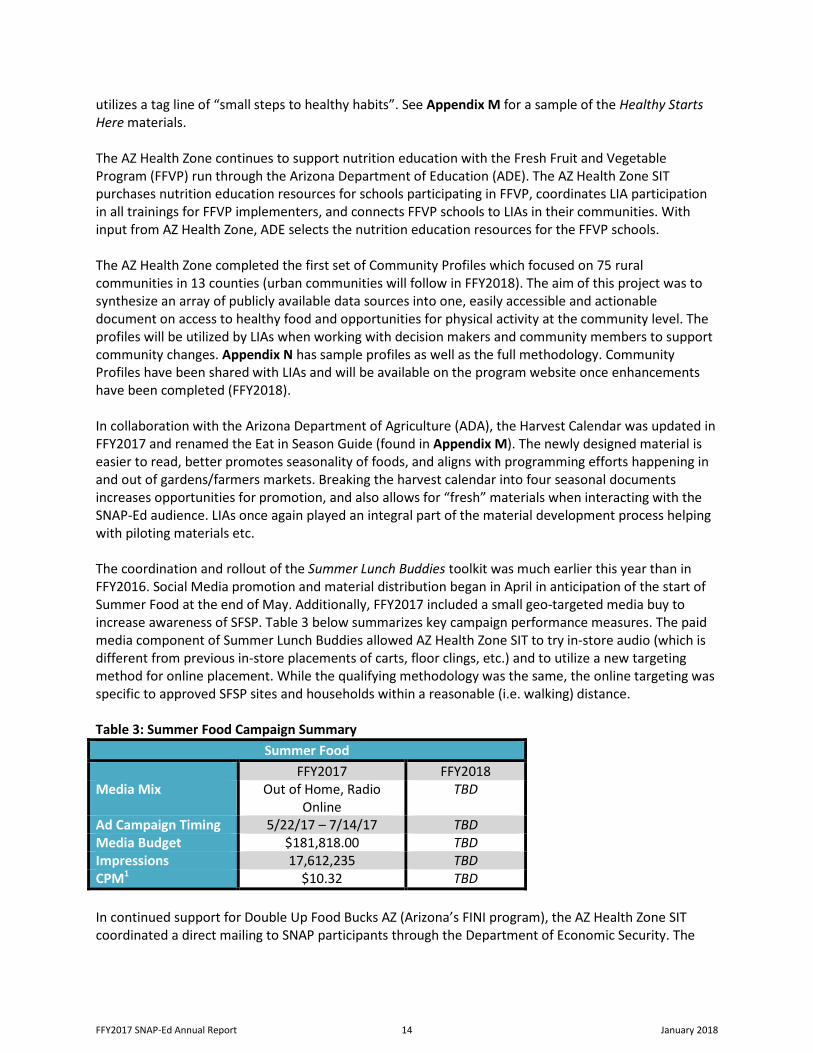
The coordination and rollout of the Summer Lunch Buddies toolkit was much earlier this year than in FFY2016. Social Media promotion and material distribution began in April in anticipation of the start of Summer Food at the end of May. Additionally, FFY2017 included a small geo-targeted media buy to increase awareness of SFSP. Table 3 below summarizes key campaign performance measures. The paid media component of Summer Lunch Buddies allowed AZ Health Zone SIT to try in-store audio (which is different from previous in-store placements of carts, floor clings, etc.) and to utilize a new targeting method for online placement. While the qualifying methodology was the same, the online targeting was specific to approved SFSP sites and households within a reasonable (i.e. walking) distance.
Table 3: Summer Food Campaign Summary Summer Food
FFY2017 FFY2018 Media Mix Out of Home, Radio
Online TBD
Ad Campaign Timing 5/22/17 – 7/14/17 TBD Media Budget $181,818.00 TBD Impressions 17,612,235 TBD CPM1 $10.32 TBD
In continued support for Double Up Food Bucks AZ (Arizona’s FINI program), the AZ Health Zone SIT coordinated a direct mailing to SNAP participants through the Department of Economic Security. The
FFY2017 SNAP-Ed Annual Report 14 January 2018
mailing included eight flyers customized to eight regions of the state with participating Double Up markets. Each SNAP participant in the identified zip codes would receive a flyer pointing them to the nearest participating market. Additionally, Pinnacle Prevention (FINI recipient) and AZ Health Zone partnered to train market navigators to assist SNAP families at the markets in the weeks following the mailing.
Result 4: By September 30, 2018, utilize formative research to develop consistent and comprehensive communications strategies to be used in direct education and PSE interventions in the five service areas of Food Systems, Active Living, School Health, Early Childhood Development, and Direct Education.
One of the most exciting projects completed in FFY2017 was the rebranding of the Arizona Nutrition Network/Champions for Change to the AZ Health Zone. The new brand is bold and modern and lends itself nicely to messaging for all components of Arizona SNAP-Ed (DE and PSE). The best feature of the new brand is the ability for Local Agencies to share in the identity with custom local logos that fit within the brand architecture.
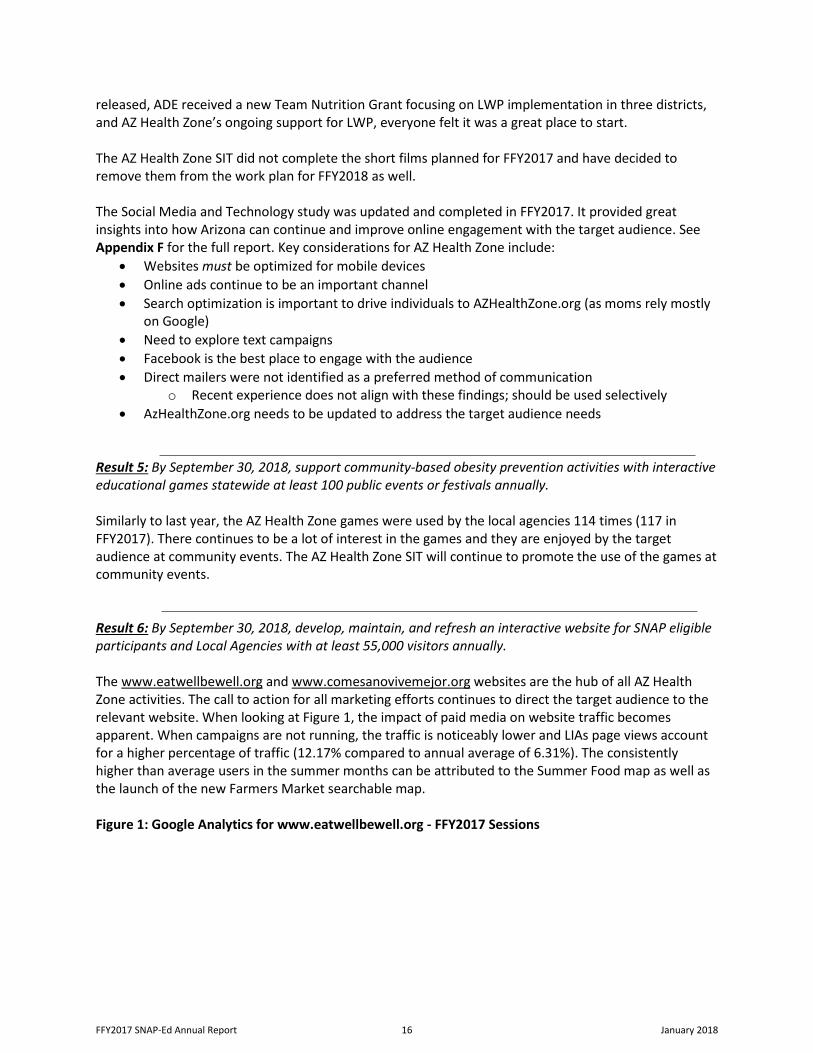
The rebranding process was completed in four steps:
Staff from the State teams, the LIAs, and sister programs participated in focus groups to gather feedback on the current brand structure (Arizona Nutrition Network, Champions for Change, and EatWellBeWell.org). The research findings from this group were provided to four marketing firms in Arizona who each developed 1-10 brand concepts. Three were selected for testing with the target audience with the final winner being AZ Health Zone. See Appendix O for the rebranding research reports. Rollout of the new AZ Health Zone brand began in late September and will continue throughout FFY2018.
Due to the marketing firm changes mentioned previously, the PSE campaign research was once again pushed back to FFY2018. However, a topic area was selected and discussions have begun. Formal research is planned for early FFY2018 with rollout of the new campaign also occurring in FFY2018. The AZ Health Zone has decided, in collaboration with the ADE, to develop a campaign/toolkit around Local Wellness Policy (LWP) and engaging parents in the process. When considering that the final rule was
FFY2017 SNAP-Ed Annual Report 15 January 2018
released, ADE received a new Team Nutrition Grant focusing on LWP implementation in three districts, and AZ Health Zone’s ongoing support for LWP, everyone felt it was a great place to start.
The AZ Health Zone SIT did not complete the short films planned for FFY2017 and have decided to remove them from the work plan for FFY2018 as well.
The Social Media and Technology study was updated and completed in FFY2017. It provided great insights into how Arizona can continue and improve online engagement with the target audience. See Appendix F for the full report. Key considerations for AZ Health Zone include:
• Websites must be optimized for mobile devices• Online ads continue to be an important channel• Search optimization is important to drive individuals to AZHealthZone.org (as moms rely mostly
on Google)• Need to explore text campaigns• Facebook is the best place to engage with the audience• Direct mailers were not identified as a preferred method of communication
o Recent experience does not align with these findings; should be used selectively• AzHealthZone.org needs to be updated to address the target audience needs
Result 5: By September 30, 2018, support community-based obesity prevention activities with interactive educational games statewide at least 100 public events or festivals annually.
Similarly to last year, the AZ Health Zone games were used by the local agencies 114 times (117 in FFY2017). There continues to be a lot of interest in the games and they are enjoyed by the target audience at community events. The AZ Health Zone SIT will continue to promote the use of the games at community events.
Result 6: By September 30, 2018, develop, maintain, and refresh an interactive website for SNAP eligible participants and Local Agencies with at least 55,000 visitors annually.
The www.eatwellbewell.org and www.comesanovivemejor.org websites are the hub of all AZ Health Zone activities. The call to action for all marketing efforts continues to direct the target audience to the relevant website. When looking at Figure 1, the impact of paid media on website traffic becomes apparent. When campaigns are not running, the traffic is noticeably lower and LIAs page views account for a higher percentage of traffic (12.17% compared to annual average of 6.31%). The consistently higher than average users in the summer months can be attributed to the Summer Food map as well as the launch of the new Farmers Market searchable map.
Figure 1: Google Analytics for www.eatwellbewell.org - FFY2017 Sessions
FFY2017 SNAP-Ed Annual Report 16 January 2018
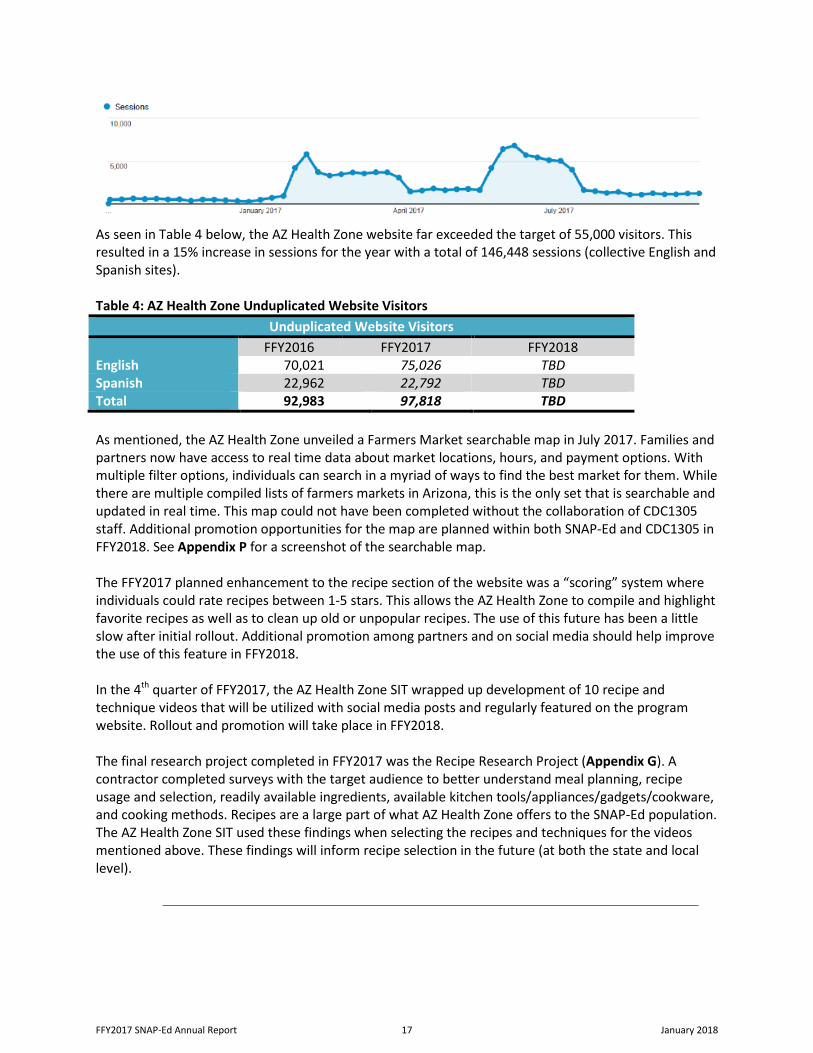
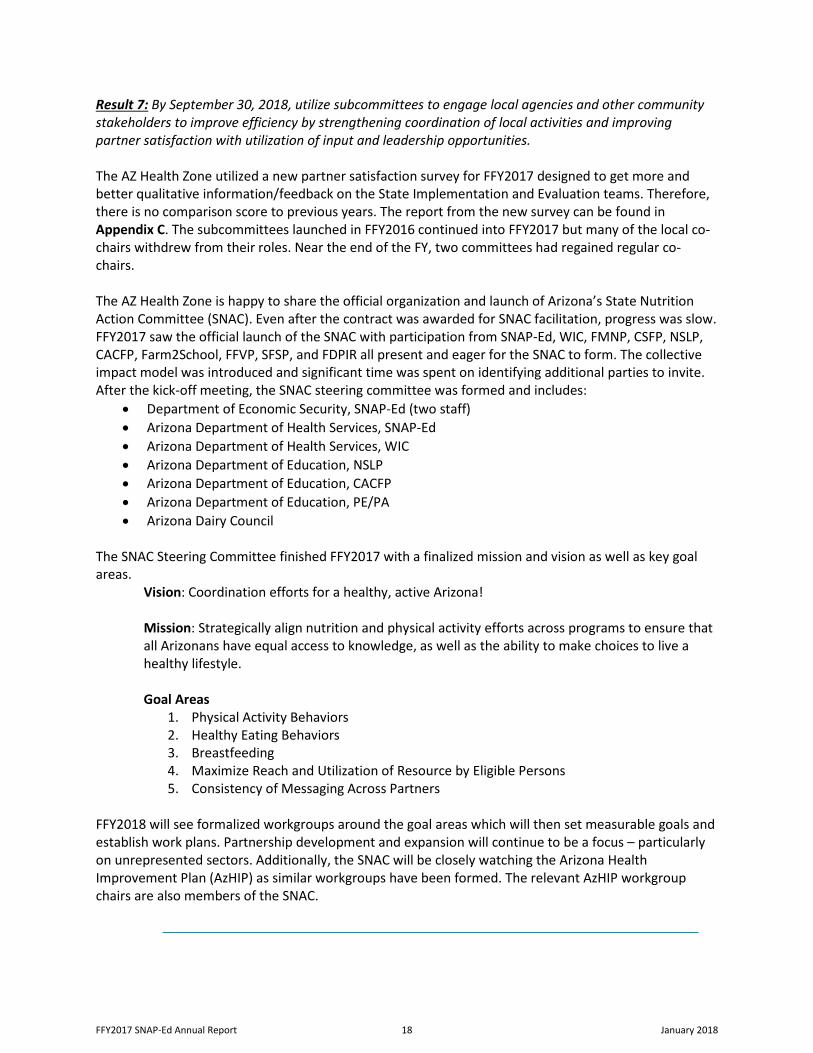
As seen in Table 4 below, the AZ Health Zone website far exceeded the target of 55,000 visitors. This resulted in a 15% increase in sessions for the year with a total of 146,448 sessions (collective English and Spanish sites).
Table 4: AZ Health Zone Unduplicated Website Visitors Unduplicated Website Visitors
FFY2016 FFY2017 FFY2018 English 70,021 75,026 TBD Spanish 22,962 22,792 TBD Total 92,983 97,818 TBD
As mentioned, the AZ Health Zone unveiled a Farmers Market searchable map in July 2017. Families and partners now have access to real time data about market locations, hours, and payment options. With multiple filter options, individuals can search in a myriad of ways to find the best market for them. While there are multiple compiled lists of farmers markets in Arizona, this is the only set that is searchable and updated in real time. This map could not have been completed without the collaboration of CDC1305 staff. Additional promotion opportunities for the map are planned within both SNAP-Ed and CDC1305 in FFY2018. See Appendix P for a screenshot of the searchable map.
The FFY2017 planned enhancement to the recipe section of the website was a “scoring” system where individuals could rate recipes between 1-5 stars. This allows the AZ Health Zone to compile and highlight favorite recipes as well as to clean up old or unpopular recipes. The use of this future has been a little slow after initial rollout. Additional promotion among partners and on social media should help improve the use of this feature in FFY2018.
In the 4th quarter of FFY2017, the AZ Health Zone SIT wrapped up development of 10 recipe and technique videos that will be utilized with social media posts and regularly featured on the program website. Rollout and promotion will take place in FFY2018.
The final research project completed in FFY2017 was the Recipe Research Project (Appendix G). A contractor completed surveys with the target audience to better understand meal planning, recipe usage and selection, readily available ingredients, available kitchen tools/appliances/gadgets/cookware, and cooking methods. Recipes are a large part of what AZ Health Zone offers to the SNAP-Ed population. The AZ Health Zone SIT used these findings when selecting the recipes and techniques for the videos mentioned above. These findings will inform recipe selection in the future (at both the state and local level).
FFY2017 SNAP-Ed Annual Report 17 January 2018
Result 7: By September 30, 2018, utilize subcommittees to engage local agencies and other community stakeholders to improve efficiency by strengthening coordination of local activities and improving partner satisfaction with utilization of input and leadership opportunities.
The AZ Health Zone utilized a new partner satisfaction survey for FFY2017 designed to get more and better qualitative information/feedback on the State Implementation and Evaluation teams. Therefore, there is no comparison score to previous years. The report from the new survey can be found in Appendix C. The subcommittees launched in FFY2016 continued into FFY2017 but many of the local co-chairs withdrew from their roles. Near the end of the FY, two committees had regained regular co-chairs.
The AZ Health Zone is happy to share the official organization and launch of Arizona’s State Nutrition Action Committee (SNAC). Even after the contract was awarded for SNAC facilitation, progress was slow. FFY2017 saw the official launch of the SNAC with participation from SNAP-Ed, WIC, FMNP, CSFP, NSLP, CACFP, Farm2School, FFVP, SFSP, and FDPIR all present and eager for the SNAC to form. The collective impact model was introduced and significant time was spent on identifying additional parties to invite. After the kick-off meeting, the SNAC steering committee was formed and includes:
• Department of Economic Security, SNAP-Ed (two staff)• Arizona Department of Health Services, SNAP-Ed• Arizona Department of Health Services, WIC• Arizona Department of Education, NSLP• Arizona Department of Education, CACFP• Arizona Department of Education, PE/PA• Arizona Dairy Council
The SNAC Steering Committee finished FFY2017 with a finalized mission and vision as well as key goal areas.
Vision: Coordination efforts for a healthy, active Arizona!
Mission: Strategically align nutrition and physical activity efforts across programs to ensure that all Arizonans have equal access to knowledge, as well as the ability to make choices to live a healthy lifestyle.
Goal Areas 1. Physical Activity Behaviors2. Healthy Eating Behaviors3. Breastfeeding4. Maximize Reach and Utilization of Resource by Eligible Persons5. Consistency of Messaging Across Partners
FFY2018 will see formalized workgroups around the goal areas which will then set measurable goals and establish work plans. Partnership development and expansion will continue to be a focus – particularly on unrepresented sectors. Additionally, the SNAC will be closely watching the Arizona Health Improvement Plan (AzHIP) as similar workgroups have been formed. The relevant AzHIP workgroup chairs are also members of the SNAC.
FFY2017 SNAP-Ed Annual Report 18 January 2018
Result 8: By September 30, 2018, strengthen the statewide public health system and maximize effectiveness by providing skill-building training to at least 400 individuals per year.
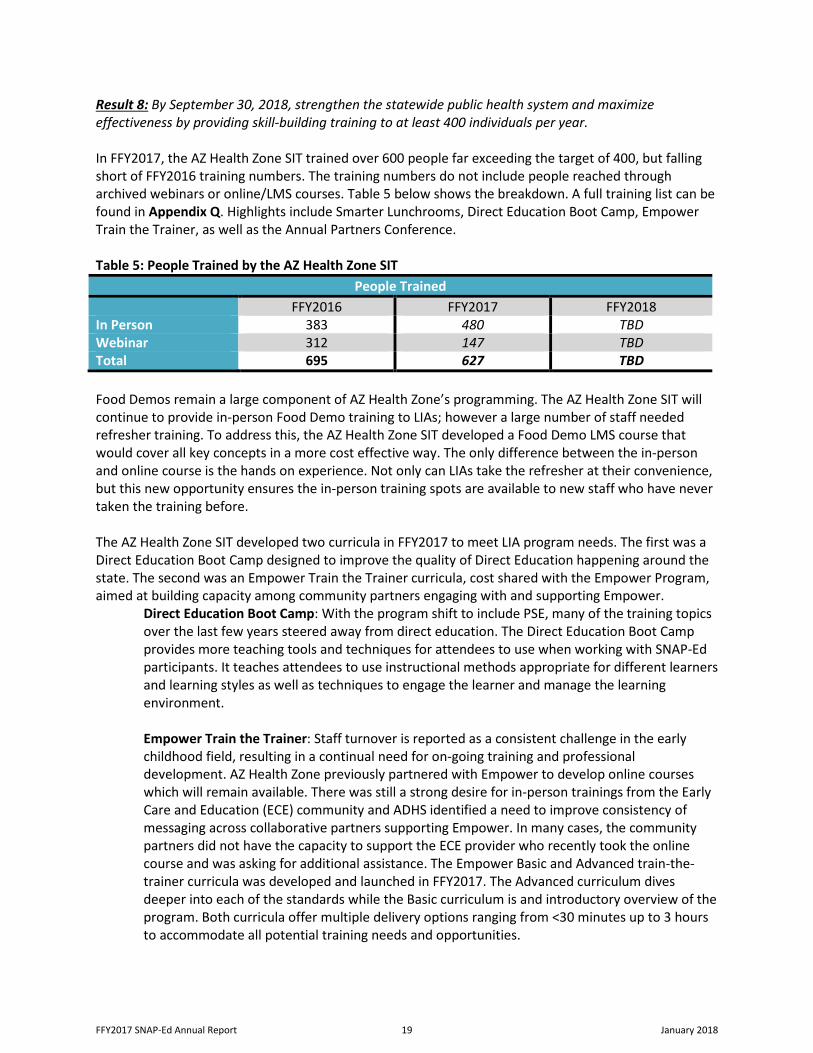
In FFY2017, the AZ Health Zone SIT trained over 600 people far exceeding the target of 400, but falling short of FFY2016 training numbers. The training numbers do not include people reached through archived webinars or online/LMS courses. Table 5 below shows the breakdown. A full training list can be found in Appendix Q. Highlights include Smarter Lunchrooms, Direct Education Boot Camp, Empower Train the Trainer, as well as the Annual Partners Conference.
Table 5: People Trained by the AZ Health Zone SIT People Trained
FFY2016 FFY2017 FFY2018 In Person 383 480 TBD Webinar 312 147 TBD Total 695 627 TBD
Food Demos remain a large component of AZ Health Zone’s programming. The AZ Health Zone SIT will continue to provide in-person Food Demo training to LIAs; however a large number of staff needed refresher training. To address this, the AZ Health Zone SIT developed a Food Demo LMS course that would cover all key concepts in a more cost effective way. The only difference between the in-person and online course is the hands on experience. Not only can LIAs take the refresher at their convenience, but this new opportunity ensures the in-person training spots are available to new staff who have never taken the training before.
The AZ Health Zone SIT developed two curricula in FFY2017 to meet LIA program needs. The first was a Direct Education Boot Camp designed to improve the quality of Direct Education happening around the state. The second was an Empower Train the Trainer curricula, cost shared with the Empower Program, aimed at building capacity among community partners engaging with and supporting Empower.
Direct Education Boot Camp: With the program shift to include PSE, many of the training topics over the last few years steered away from direct education. The Direct Education Boot Camp provides more teaching tools and techniques for attendees to use when working with SNAP-Ed participants. It teaches attendees to use instructional methods appropriate for different learners and learning styles as well as techniques to engage the learner and manage the learning environment.
Empower Train the Trainer: Staff turnover is reported as a consistent challenge in the early childhood field, resulting in a continual need for on-going training and professional development. AZ Health Zone previously partnered with Empower to develop online courses which will remain available. There was still a strong desire for in-person trainings from the Early Care and Education (ECE) community and ADHS identified a need to improve consistency of messaging across collaborative partners supporting Empower. In many cases, the community partners did not have the capacity to support the ECE provider who recently took the online course and was asking for additional assistance. The Empower Basic and Advanced train-the-trainer curricula was developed and launched in FFY2017. The Advanced curriculum dives deeper into each of the standards while the Basic curriculum is and introductory overview of the program. Both curricula offer multiple delivery options ranging from <30 minutes up to 3 hours to accommodate all potential training needs and opportunities.
FFY2017 SNAP-Ed Annual Report 19 January 2018

PAGE LEFT BLANK INTENTIONALLY
FFY2017 SNAP-Ed Annual Report 20 January 2018
Appendix B
Annual Evaluation Report
FFY2017 SNAP-Ed Annual Report 21 January 2018
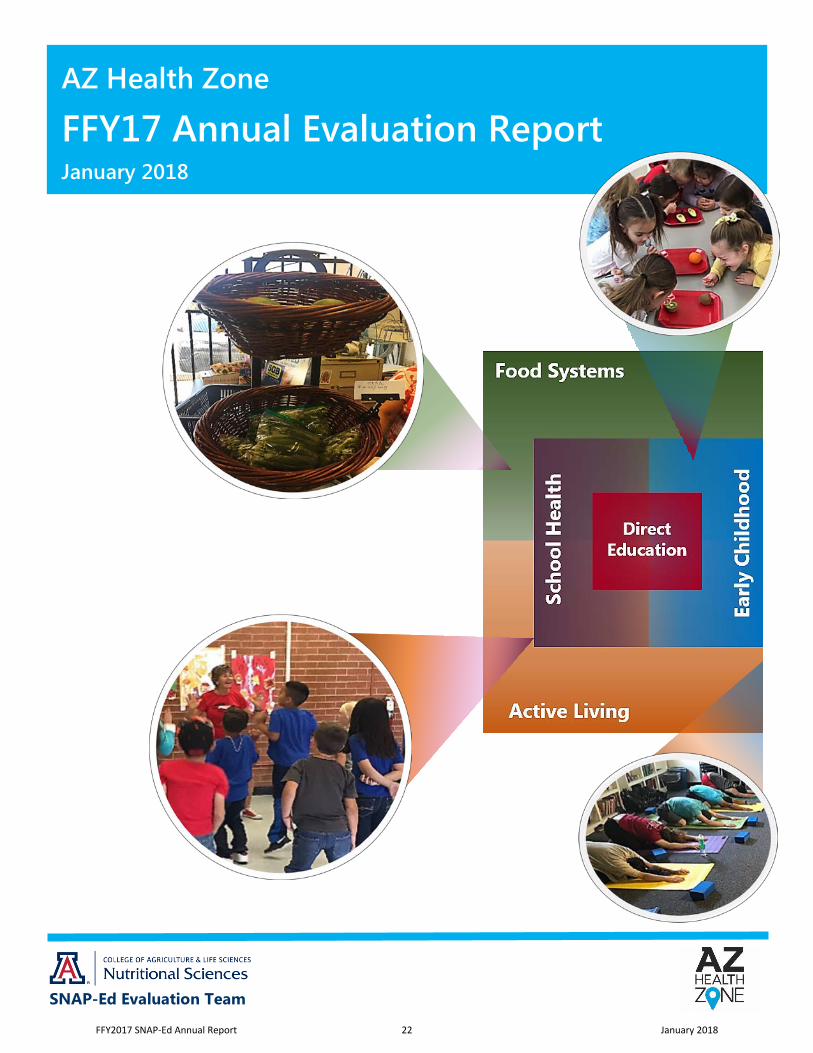
SNAP-Ed Evaluation Team
AZ Health Zone
FFY17 Annual Evaluation Report January 2018
FFY2017 SNAP-Ed Annual Report 22 January 2018
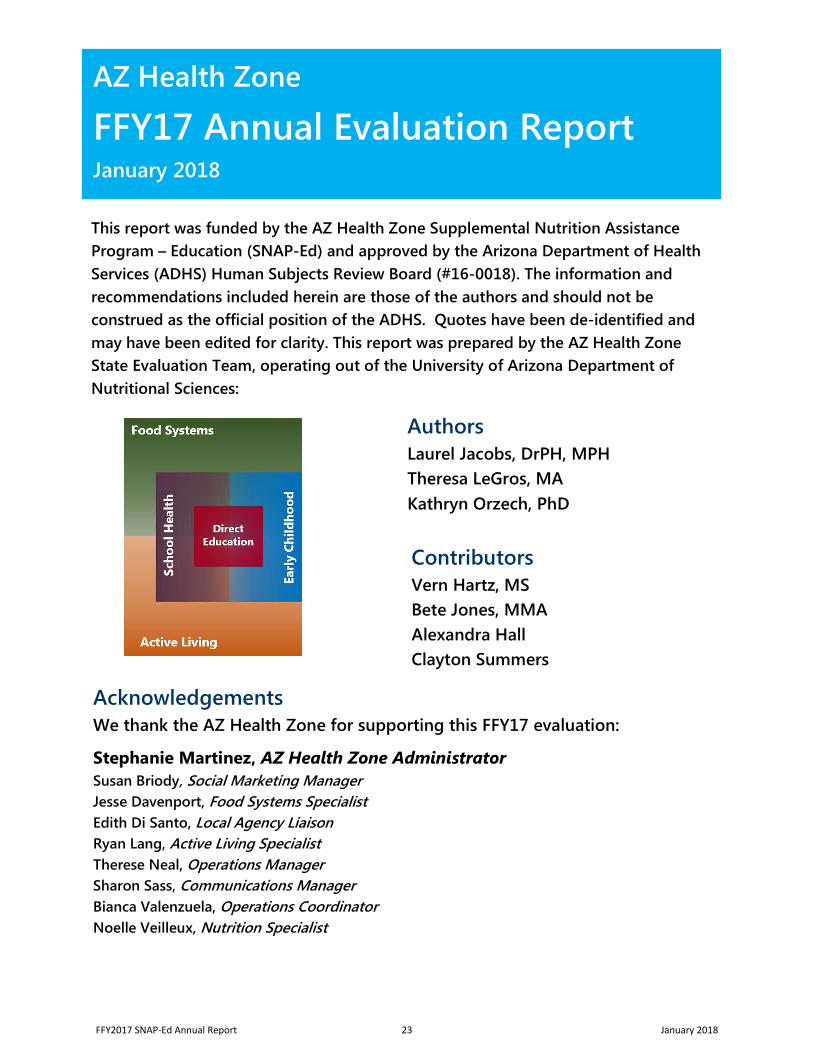
Authors Laurel Jacobs, DrPH, MPH Theresa LeGros, MA Kathryn Orzech, PhD
Contributors Vern Hartz, MS Bete Jones, MMA Alexandra Hall Clayton Summers
Acknowledgements We thank the AZ Health Zone for supporting this FFY17 evaluation:
Stephanie Martinez, AZ Health Zone Administrator Susan Briody, Social Marketing Manager Jesse Davenport, Food Systems Specialist Edith Di Santo, Local Agency Liaison Ryan Lang, Active Living Specialist Therese Neal, Operations Manager Sharon Sass, Communications Manager Bianca Valenzuela, Operations Coordinator Noelle Veilleux, Nutrition Specialist
AZ Health Zone FFY17 Annual Evaluation Report January 2018
This report was funded by the AZ Health Zone Supplemental Nutrition Assistance Program – Education (SNAP-Ed) and approved by the Arizona Department of Health Services (ADHS) Human Subjects Review Board (#16-0018). The information and recommendations included herein are those of the authors and should not be construed as the official position of the ADHS. Quotes have been de-identified and may have been edited for clarity. This report was prepared by the AZ Health Zone State Evaluation Team, operating out of the University of Arizona Department of Nutritional Sciences:
FFY2017 SNAP-Ed Annual Report 23 January 2018
Table of Contents
Executive Summary ............................................... ii
Introduction ............................................................. 1
Food Systems .......................................................... 7
Active Living ............................................................. 48
School Health .......................................................... 79
Early Childhood ...................................................... 111
Direct Education ..................................................... 129
Youth .................................................................... 129
Adult ..................................................................... 159
Appendices ............................................................. 178
A: List of Acronyms……………. ....................... 178
B: FFY17 Evaluation Framework Matrix .. 180
C: Supplemental PARA Data ………………. 197
D: KAN-Q Survey ……………………………… 209
FFY2017 SNAP-Ed Annual Report 24 January 2018
Executive Summary
The United States Department of Agriculture (USDA) Supplemental Nutrition Assistance Program-Education (SNAP-Ed) provides nutrition education and obesity prevention programming with the goal of increasing the likelihood that SNAP-eligible families will choose healthful diet and physical activity behaviors on a limited budget. Through the Arizona Department of Health Services (ADHS), the Arizona SNAP-Ed program, called the AZ Health Zone, coordinates initiatives with state-level partners and eight local implementing agencies (LIAs) to encourage increased fruit and vegetable consumption, regular physical activity, and caloric balance throughout the life cycle. This report describes evaluation findings from the second year of the AZ Health Zone’s current three-year program cycle.
Food Systems. Progress was evident in healthy retail, where baseline assessments indicated that healthy purchase supports were limited in 18 partner stores, although the mean scores for Beverages and Frozen Foods (40%), as well as Food Program Supports (54%) were comparatively stronger. SNAP-Ed gardening efforts benefited from strong champions, sustainability supports, and new cross-sector partnerships. Continued barriers included lack of staff capacity, environmental challenges in the gardens, and inconsistent sustainability. Farm to Institution efforts progressed into meaningful collaborations, implementation, and the achievement of new supports for several LIAs in FFY17, including garden- or farmer- supplied procurement at two schools. Supports for the Summer Food Service Program grew substantially, with a notable increase in SNAP-Ed supported kick-off promotional events and direct education (DE) during meal times. LIAs in several counties have successfully implemented new policy, systems, and environment (PSE) supports with their farmers’ market partners, including starting a new market as well as new payment or purchase incentive programs.
Active Living. LIAs implemented more active living policy activities at both site- and community- levels in FFY17, including reviewing community-level general plans and
FFY2017 SNAP-Ed Annual Report 25 January 2018
developing technical assistance resources for partners. LIAs completed 71 baseline assessments of physical activity (PA) resources in their communities, with large parks being the most common type of resource assessed. Results indicated that amenities and features increased with the size of the PA resource, whereas negative characteristics (litter, graffiti) were most common at sports facilities. LIAs also expanded their family-friendly PA offerings in FFY17 and demonstrated more involvement in the planning process for these events at both the citywide and site levels.
School Health. In FFY17, LIAs completed the National Healthy Schools Award Checklist (NHSAC) with participating schools in order to assess Local Wellness Policy implementation. The highest mean scores (N=102) were found for the Nutrition Services and School Health and Safety Policies and Environment sections (63%), and the lowest mean score was found for the Health Promotion for Staff section (45%). While SNAP-Ed-participating schools in Arizona are generally able to implement PSEs related to nutrition services, they often struggle to implement PSEs related to the Comprehensive School Physical Activity Program and Health Promotion for School Staff.
Early Childhood. LIAs are building upon Early Childhood (EC) PSE initiatives by leveraging established relationships, expanding successful programs, making more frequent contact, and combining other focus areas with EC efforts. In addition, higher ratios of meetings and trainings per unique child care center suggested a greater intensity of reach in FFY17. State and local collaboration with Empower was broadly successful, and LIAs benefitted from the continued coordination between the AZ Health Zone and the Empower program.
Direct Education. Adults reached (N=184) by an evaluated SNAP-Ed lesson series showed more improvement in food behaviors than PA behaviors, in contrast to FFY16, when PA improved more. More participants met the Dietary Guidelines for Americans’ recommendations for fruit than for vegetables. Youth who participated (N=563) in evaluated lesson series reported some knowledge gains but little behavior change beyond healthier milk intake. These findings were similar to the FFY16 outcomes.
FFY2017 SNAP-Ed Annual Report 26 January 2018
Recommendations based on the FFY17 findings include:
• Continued training and technical assistance for LIAs to build capacity for supportingprogress towards stronger PSE changes
• Enhancement of LIA participation in relevant PSE cross-sector partnerships toincrease momentum for community-level changes
• Continued integration of DE with PSE efforts as multilevel interventions tostrengthen the likelihood of impacting healthy behaviors
• Ongoing and enhanced collaboration with state-level partners implementinginterrelated efforts, including the Special Program for Women, Infants, and Children,the Department of Economic Security, and the Arizona Department of Education
The FFY18 SNAP-Ed evaluation will report on the first wave of two-year outcomes related to statewide SNAP-Ed program interventions at the individual-, site- and community-levels. This data will inform the AZ Health Zone’s long-term goals of reducing rates of overweight and obesity, and supporting the health of all Arizonans.
FFY2017 SNAP-Ed Annual Report 27 January 2018
Introduction
The United States Department of Agriculture (USDA) Supplemental Nutrition Assistance Program (SNAP) supports the country’s social safety net by providing food assistance funds to low-income individuals and families who qualify. The SNAP Education (SNAP-Ed) program is a potent supplement to SNAP by providing community-based nutrition education and obesity prevention initiatives in each state. The primary goal of the program is to reduce health disparities by increasing the likelihood that SNAP-eligible families will choose healthful diet and physical activity behaviors on a limited budget.1
Through the Arizona Department of Health Services (ADHS), the Arizona SNAP-Ed program, recently rebranded as the AZ Health Zone, coordinates initiatives with state-level partners and eight local implementing agencies (LIAs) to encourage behavioral outcomes, including increased fruit and vegetable consumption, regular physical activity, and caloric balance throughout the life cycle.
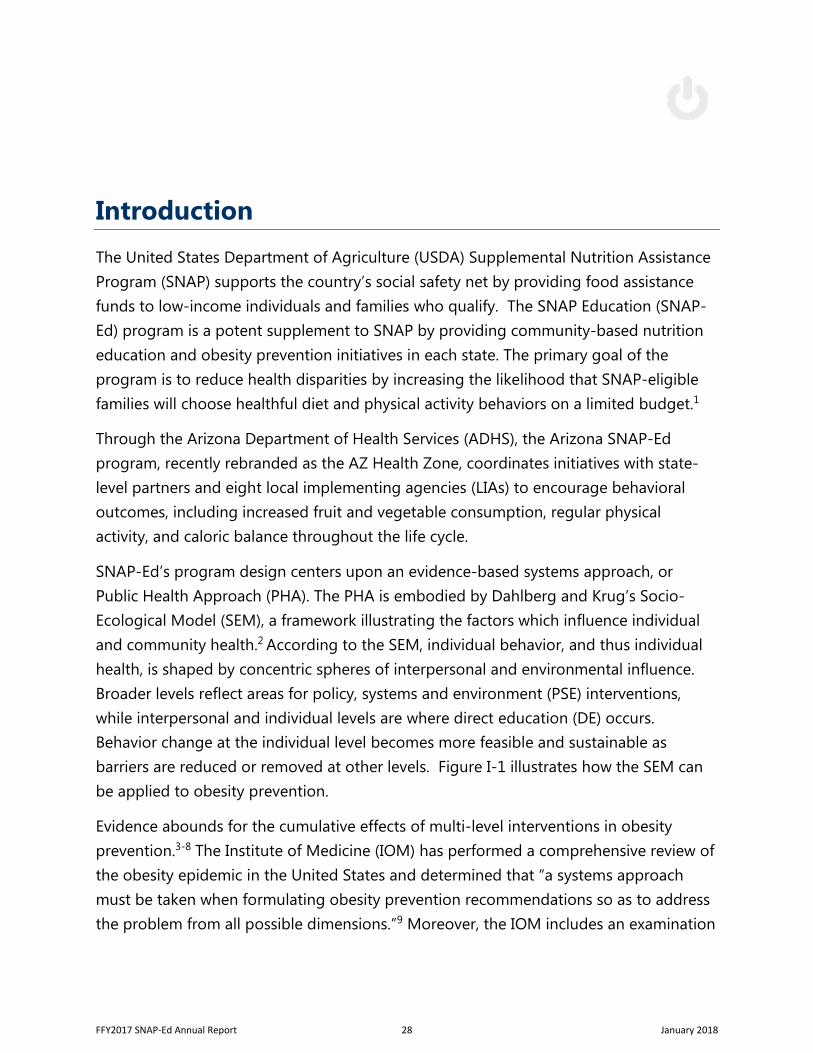
SNAP-Ed’s program design centers upon an evidence-based systems approach, or Public Health Approach (PHA). The PHA is embodied by Dahlberg and Krug’s Socio-Ecological Model (SEM), a framework illustrating the factors which influence individual and community health.2 According to the SEM, individual behavior, and thus individual health, is shaped by concentric spheres of interpersonal and environmental influence. Broader levels reflect areas for policy, systems and environment (PSE) interventions, while interpersonal and individual levels are where direct education (DE) occurs. Behavior change at the individual level becomes more feasible and sustainable as barriers are reduced or removed at other levels. Figure I-1 illustrates how the SEM can be applied to obesity prevention.
Evidence abounds for the cumulative effects of multi-level interventions in obesity prevention.3-8 The Institute of Medicine (IOM) has performed a comprehensive review of the obesity epidemic in the United States and determined that “a systems approach must be taken when formulating obesity prevention recommendations so as to address the problem from all possible dimensions.”9 Moreover, the IOM includes an examination
FFY2017 SNAP-Ed Annual Report 28 January 2018
of income, age, and racial and ethnic disparities and highlights the imperative of programming specific to low-income, minority populations and youth, all of which are characteristic of the SNAP-Ed target audience.
In Arizona, SNAP-Ed operates out of the Department of Economic Security and Bureau for Nutrition and Physical Activity within ADHS by coordinating with state partners and local implementing agencies (LIAs) to make progress using PHAs in achieving the following behavioral outcomes with SNAP-Ed eligible audiences:
• Make half your plate fruits and vegetables, at least half your grains whole grains, and switch to fat-free or low-fat milk and milk products
• Increase physical activity and reduce time spent in sedentary behaviors as part of a healthy lifestyle
Figure I-1. The Socio-Ecological Model Applied to Obesity Prevention2
FFY2017 SNAP-Ed Annual Report 29 January 2018
• Maintain appropriate calorie balance during each stage of life—childhood,adolescence, adulthood, pregnancy and breastfeeding, and older age
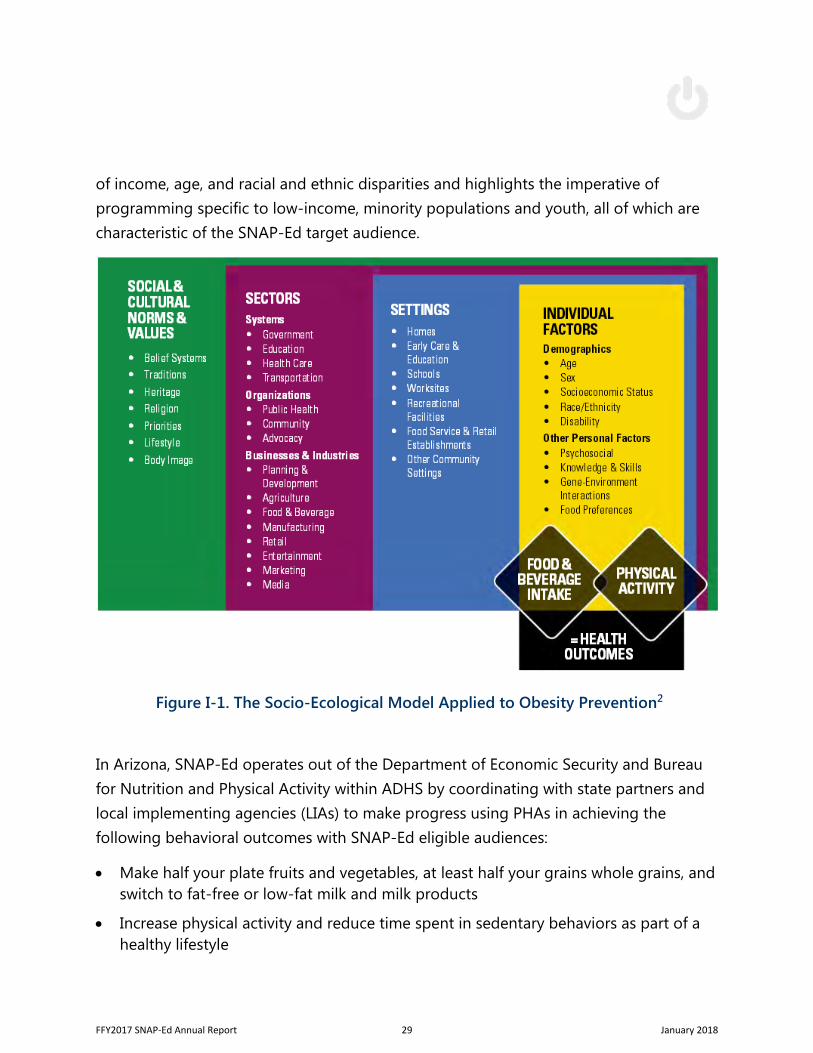
To that end, SNAP-Ed implements integrated DE, PSE, and social marketing efforts in each of Arizona’s 15 counties. The program’s key objectives for federal fiscal years 2016-2018 (FFY16-18) include the following strategies in five priority focus areas:
Figure I-2. The AZ Health Zone’s Key Objectives, by Focus Area
FFY2017 SNAP-Ed Annual Report 30 January 2018
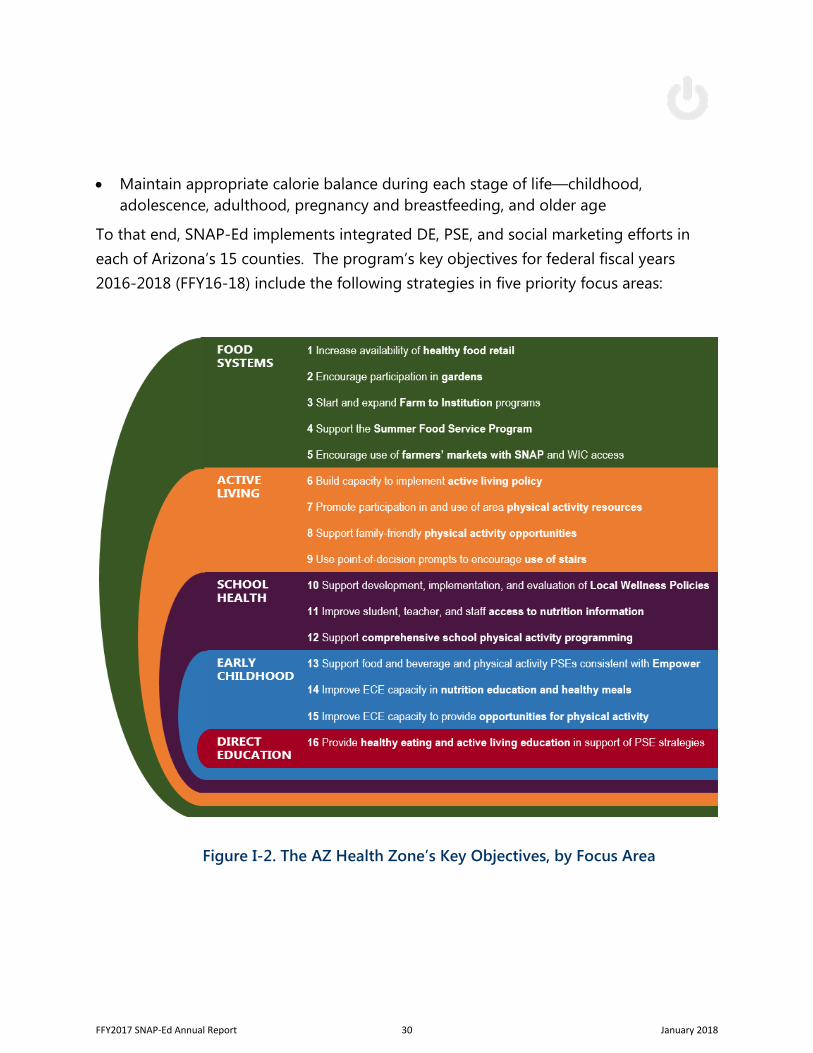
Eight LIAs were funded statewide to conduct SNAP-Ed’s local programming during the three-year program cycle: the University of Arizona Cooperative Extension (UA Extension), and seven county health departments. An external state-level evaluation team (SET) from the University of Arizona, Department of Nutritional Sciences performs process, outcome, and impact evaluations for LIAs’ integrated PSE and DE efforts and in alignment with the USDA’s SNAP-Ed Evaluation Framework below.10
This report explicates the evaluation findings from year two of the three-year program cycle in all PSE focus areas as well as DE behavioral outcomes for youth and adults. The following priority indicators from the SNAP-Ed Evaluation Framework highlighted in grey throughout the report:
Figure I-3. The National SNAP-Ed Evaluation Framework
FFY2017 SNAP-Ed Annual Report 31 January 2018
• ST7 - Organizational Partnerships• ST8 - Multilevel Partnerships and Planning• MT1 - Healthy Eating• MT2 - Food Resource Management• MT3 - Physical Activity and Reduced Sedentary Behavior• MT5 - Nutrition Supports
In alignment with Arizona’s SNAP-Ed Evaluation Framework, additional outcome indicators are reported by work plan strategy and summarized in Appendix B.
While this report is presented by focus area, which emphasizes progress in each topical PSE area, representative examples are included within each chapter of how LIAs across Arizona are linking their DE to PSE work as multilevel interventions in order to enhance the impact of their interventions. We also present two evaluation deep dives, which detail our approaches and results from “evaluating the evaluations” of school health and youth DE efforts.
This report is dedicated to Arizona’s LIA staff who endeavor to implement best practices in every county, and to the SNAP-Ed eligible families and communities who inspire us keep striving to ensure optimal health and wellness for all Arizonans.
FFY2017 SNAP-Ed Annual Report 32 January 2018
References 1. USDA, Food and Nutrition Service. Supplemental Nutrition Assistance Program Education
guidance: Nutrition education and obesity prevention grant program; 2016. Available at:https://snaped.fns.usda.gov/snap//Guidance/FinalFY2016SNAP-EdGuidance.pdf
2. Dahlberg LL and Krug EG. Violence—a global public health problem. In: Krug E, Dahlberg LL,Mercy JA, Zwi AB, Lozano R, eds. World Report on Violence and Health. Geneva, Switzerland:World Health Organization; 2002:1–56.
3. Keener D, Goodman K, Lowry A, et al. Recommended community strategies andmeasurements to prevent obesity in the United States: Implementation and measurementguide. Atlanta, GA: U.S. Department of Health and Human Services, Centers for DiseaseControl and Prevention; 2009.
4. Gregson J, Foerster SB, Orr R, et al. System, environmental, and policy changes: Using thesocial-ecological model as a framework for evaluating nutrition education and socialmarketing programs with low-income audiences. Journal of Nutrition Education. 2001;33:S4-S15.
5. Kellou N, Sandalinas F, Copin N, et al. Prevention of unhealthy weight in children bypromoting physical activity using a socio-ecological approach: What can we learn fromintervention studies? Diabetes and Metabolism. 2014;40(4):258-71.
6. Novak NL, Brownell KD. Role of policy and government in the obesity epidemic. Circulation.2012;126(19):2345-2352.
7. USDA, Center for Research Translation, and National Collaborative on Childhood ObesityResearch. SNAP-Ed strategies and interventions: An obesity prevention toolkit for states.2016. Available at:https://snaped.fns.usda.gov/snap/SNAPEdStrategiesAndInterventionsToolkitForStates.pdf
8. Wang Y, Wu Y, Wilson RF, et al. Childhood obesity prevention programs: Comparativeeffectiveness review and meta-analysis. Comparative Effectiveness Review No. 115. (Preparedby the Johns Hopkins University Evidence-based Practice Center under Contract No. 290-2007-10061-I.) AHRQ Publication No. 13-EHC081-EF. Rockville, MD: Agency for HealthcareResearch and Quality; 2013. Available at: www.effectivehealthcare.ahrq.gov/reports/final.cfm.
9. Institute of Medicine. Accelerating Progress in Obesity Prevention: Solving the Weight of theNation. Washington, DC: The National Academies Press; 2012:4.
10. USDA, Food and Nutrition Service. The Supplemental Nutrition Assistance ProgramEducation (SNAP-Ed) Evaluation Framework: Nutrition, physical activity, and obesityprevention indicators: Interpretive guide to the SNAP-Ed evaluation framework. 2016.Available at https://snaped.fns.usda.gov.
FFY2017 SNAP-Ed Annual Report 33 January 2018
Food Systems
Background AZ Health Zone’s Food Systems strategies address two persistent and inter-related health issues: food insecurity and obesity.1 Eighteen percent of adults and 25% of children in Arizona live in poverty,2 and stubbornly high adult overweight (34%) and obesity (29%) rates3 continue to impact Arizona families and communities due to obesity-related chronic diseases such as diabetes and hypertension. A key component in supporting healthy, hunger-free families is regular consumption of the foods necessary for good health. However, in this largely rural state, a multitude of food deserts exist where residents lack sufficient access to the foods recommended by MyPlate.4 The community assets necessary to address low food access include a multitude of grocery and small stores with healthy options that also accept SNAP and WIC, summer meal programs for children, healthful emergency food options, affordable farmers’ markets, locally-grown procurement at schools and other institutions, and abundant, accessible gardens. Shopping and eating healthy on a budget is one of the key messages promoted by SNAP-Ed, and in order to do so, healthier foods must be accessible, affordable, and appealing through each of these channels and beyond.5
The AZ Health Zone is responding through evidence-based coordinated approaches in local communities. AZ Health Zone’s food systems initiatives emphasize key policy, systems, and environment (PSE) approaches that integrate local agriculture, food retail, schools, feeding programs, gardens, and coalitions to promote healthy eating and improve food security. These activities complement direct education (DE) efforts by increasing the likelihood that individuals who receive SNAP-Ed educational lessons and messages will also have the access, skills, and resources necessary to consume a variety of appealing and affordable foods encouraged by MyPlate.
The Food Systems initiatives implemented by Arizona SNAP-Ed Local Implementing Agencies (LIAs) include:
FFY2017 SNAP-Ed Annual Report 34 January 2018
• Healthy Food Retail in locations such as grocery stores, small stores, and farmers’markets. Key efforts in this area include: 1) enhancing the appeal, availability, and/orpromotion of healthier food items offered by retailers; 2) increasing the number ofretailers that accept SNAP; and 3) cultivating new growers and locally-sourcedproduce.
• Gardens, including those that reach individuals and families in their homes,communities, schools, and child care sites. Gardening opportunities provideparticipants with the skills and resources to harvest their own produce and learnwhere food comes from, while encouraging physical activity and enhancing thecommunities’ surroundings. They may also provide opportunities for new communitypartnerships that can realize additional PSE initiatives.
• Farm to Institution programs increase the locally-produced foods served at schools,child care sites, and other community settings, while also providing expandedmarkets for local growers. Arizona’s SNAP-Ed efforts include partnerships to expandthe procurement of local ingredients for food service, certifying school gardens foron-site consumption,6 and integration with complementary nutrition education.
• The Summer Food Service Program (SFSP) provides free, federally-fundednutritious meals through the Arizona Department of Education (ADE) for low-incomechildren at community sites each summer. SNAP-Ed’s food security emphasissupports the SFSP by encouraging families to participate in meals and providingfamily-friendly activities during meal hours, participating in kick-off events, andpromoting meal sites.
• Encouraging Farmers’ Markets with SNAP, including supporting the establishmentof new farmers’ markets in SNAP-Ed eligible communities. Complementary SNAP-Edefforts seek to encourage new and existing markets to become certified to acceptSNAP and other food programs, and boosting market turnout by eligible families.
In year two of SNAP-Ed’s multi-year program cycle, gardens were notably mature as a PSE intervention, while farm to institution programs remained nascent. Support for the SFSP gained momentum in FFY17 as LIAs gained greater understanding and confidence to implement their programming efforts. The two remaining Food Systems strategies – healthy retail and farmers’ markets with SNAP – saw positive progress towards local
FFY2017 SNAP-Ed Annual Report 35 January 2018
and state-level goals, primarily through partnerships with local retailers and market managers, participation in coalitional efforts, and partnership with the Double Up Food Bucks program. Below, Food Systems short-term (ST5, ST6, ST7, ST8) and medium-term (MT5) outcomes in FFY17 are reported in alignment with the National SNAP-Ed Evaluation Framework.7
Healthy Food Retail
Methods Quantitative. The Store Opportunities in the Retail Environment (STORE) tool was developed by the AZ Health Zone State Evaluation Team (SET) to assess the baseline availability, appeal, and promotion of healthier foods at stores with which LIAs partnered (MT5).
Data Collection. All LIAs in the healthy retail strategy completed assessment modules with their store partners related to the inventory of fresh produce, healthier canned foods, dry goods (grains and beans), healthier snacks, beverages and frozen produce, the proportion of healthier to less healthy advertisements (e.g. whole versus low and fat free milk), and the presence of Electronic Benefit Transfer (EBT) programs (SNAP and WIC). There was also a module for large stores only, which captured additional supports for fresh produce in the larger retail environment.
Small stores were those with two checkout registers or fewer, including convenience, corner, and global specialty markets. A store with three or more registers was categorized as a large store, including grocery stores, supermarkets, and supercenters.
Assessment Tool. The STORE development process was iterative and included the following steps in Figure FS-1:
FFY2017 SNAP-Ed Annual Report 36 January 2018
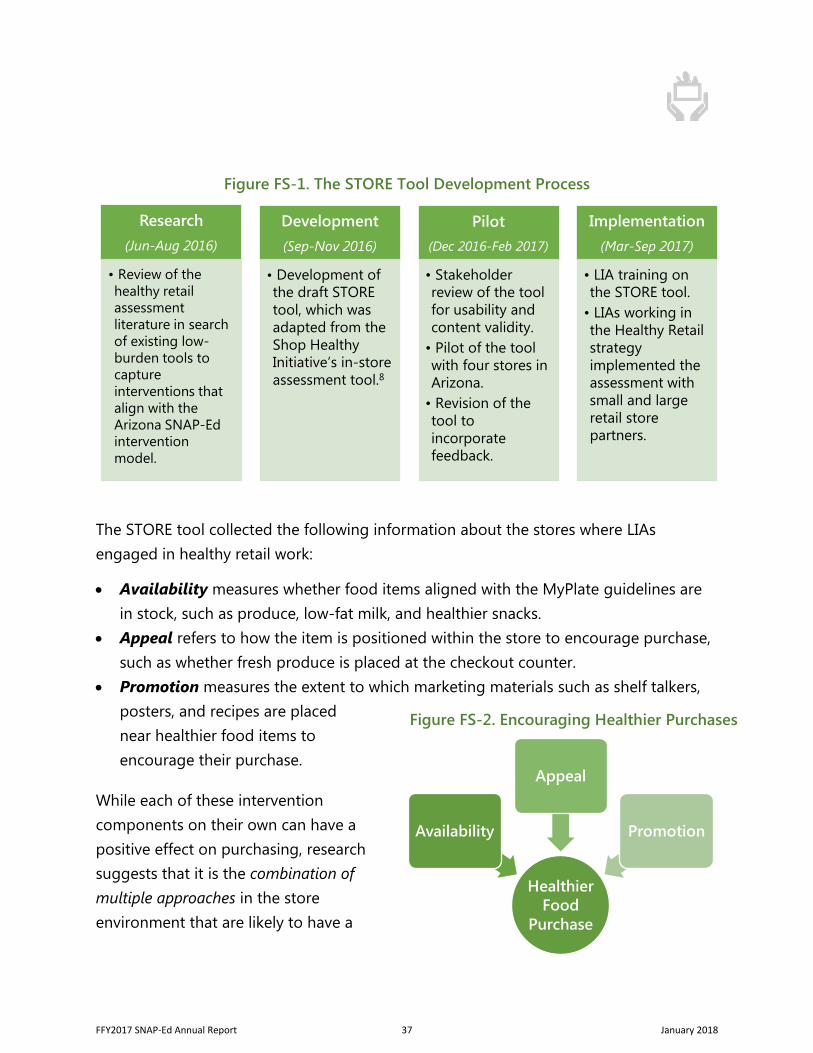
Figure FS-1. The STORE Tool Development Process
The STORE tool collected the following information about the stores where LIAs engaged in healthy retail work:
• Availability measures whether food items aligned with the MyPlate guidelines arein stock, such as produce, low-fat milk, and healthier snacks.
• Appeal refers to how the item is positioned within the store to encourage purchase,such as whether fresh produce is placed at the checkout counter.
• Promotion measures the extent to which marketing materials such as shelf talkers,posters, and recipes are placed near healthier food items to encourage their purchase.
While each of these intervention components on their own can have a positive effect on purchasing, research suggests that it is the combination of multiple approaches in the store environment that are likely to have a
Healthier Food
Purchase
Availability
Appeal
Promotion
Figure FS-2. Encouraging Healthier Purchases
Research(Jun-Aug 2016)
• Review of thehealthy retailassessmentliterature in searchof existing low-burden tools tocaptureinterventions thatalign with theArizona SNAP-Edinterventionmodel.
Development(Sep-Nov 2016)
• Development ofthe draft STOREtool, which wasadapted from theShop HealthyInitiative’s in-storeassessment tool.8
Pilot(Dec 2016-Feb 2017)
• Stakeholderreview of the toolfor usability andcontent validity.
• Pilot of the toolwith four stores inArizona.
• Revision of thetool toincorporatefeedback.
Implementation(Mar-Sep 2017)
• LIA training onthe STORE tool.
• LIAs working inthe Healthy Retailstrategyimplemented theassessment withsmall and largeretail storepartners.
FFY2017 SNAP-Ed Annual Report 37 January 2018
stronger impact on shoppers’ purchasing decisions.9 For this reason, the STORE tool measures all three (Figure FS-2).
Data Analysis. The assessment responses were tallied into total and by-section numerical scores. The following three interventions were weighted in the scoring as particularly strong motivators for healthier purchases:
• The availability of healthier items (e.g. fresh produce). The healthier item must firstbe in stock in order to be positioned and promoted to encourage purchase.
• The appeal of produce placement at the checkout counter or front entrance,which are two locations where all shoppers visit.
• The availability of WIC and SNAP redemption programs at the store, which mayincrease the likelihood that SNAP-Ed’s target population will patronize the store.
Because each section of the STORE tool varies in length, and maximum point assignments depend upon the number and category of questions therein, point scores were standardized by converting into percentages (points scored/maximum achievable points) for all modules except Advertising. Advertising scores were calculated by comparing the proportion of less healthy advertisements posted inside and outside the store to their healthier counterparts, such as advertisements for sugar-sweetened beverages versus low sugar drinks and water.
Qualitative Analysis. To further understand store owner readiness to engage in healthy retail efforts (ST5) and the settings-level partnerships (ST7) that LIAs developed with them, a qualitative inquiry was conducted. The SET used NVivo v11.0 for coding and theme analysis of narrative data pertaining to LIAs’ FY17 work described in their Semi-Annual Report Narratives (SARNs). Additional quantitative data from Semi-Annual Report Tables (SARTs) were analyzed to assess LIAs’ progress toward achieving their healthy retail goals.
FFY2017 SNAP-Ed Annual Report 38 January 2018
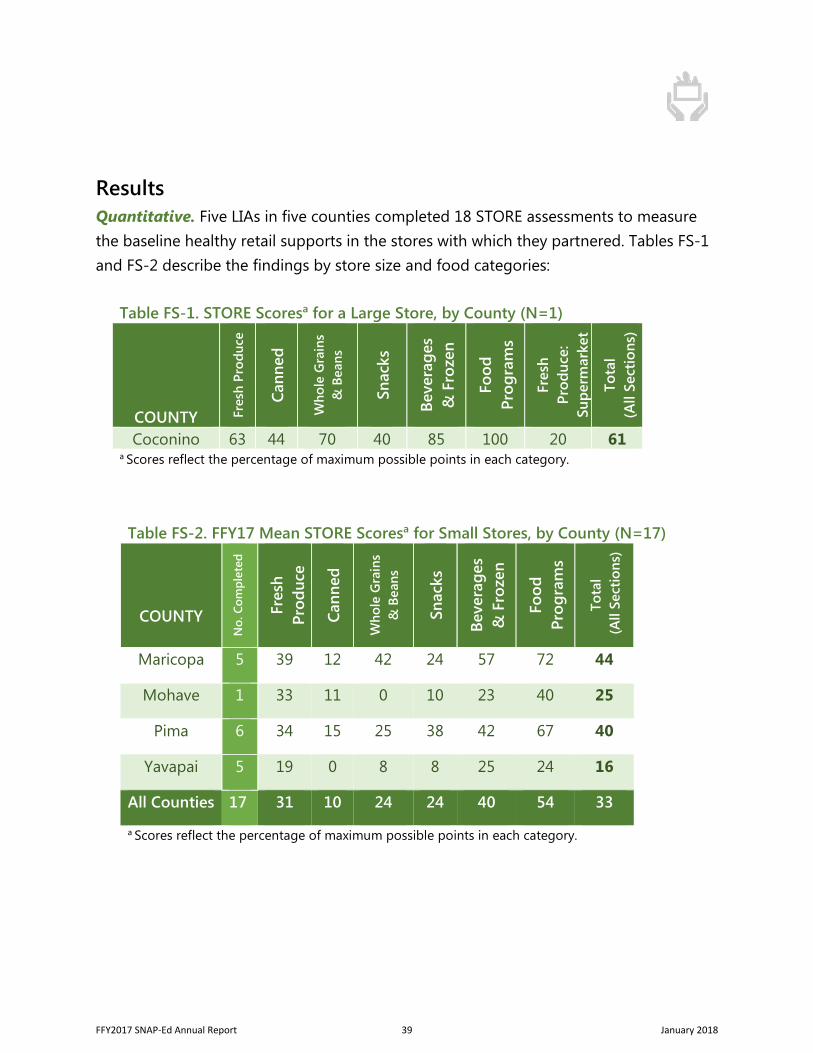
Results Quantitative. Five LIAs in five counties completed 18 STORE assessments to measure the baseline healthy retail supports in the stores with which they partnered. Tables FS-1 and FS-2 describe the findings by store size and food categories:
Table FS-1. STORE Scoresa for a Large Store, by County (N=1)
COUNTY Fres
h Pr
oduc
e
Cann
ed
Who
le G
rain
s &
Bea
ns
Snac
ks
Beve
rage
s &
Fro
zen
Food
Pr
ogra
ms
Fres
h Pr
oduc
e:
Supe
rmar
ket
Tota
l (A
ll Se
ctio
ns)
Coconino 63 44 70 40 85 100 20 61 a Scores reflect the percentage of maximum possible points in each category.
Table FS-2. FFY17 Mean STORE Scoresa for Small Stores, by County (N=17)
COUNTY
No.
Com
plet
ed
Fres
h Pr
oduc
e
Cann
ed
Who
le G
rain
s &
Bea
ns
Snac
ks
Beve
rage
s &
Fro
zen
Food
Pr
ogra
ms
Tota
l (A
ll Se
ctio
ns)
Maricopa 5 39 12 42 24 57 72 44
Mohave 1 33 11 0 10 23 40 25
Pima 6 34 15 25 38 42 67 40
Yavapai 5 19 0 8 8 25 24 16
All Counties 17 31 10 24 24 40 54 33
a Scores reflect the percentage of maximum possible points in each category.
FFY2017 SNAP-Ed Annual Report 39 January 2018
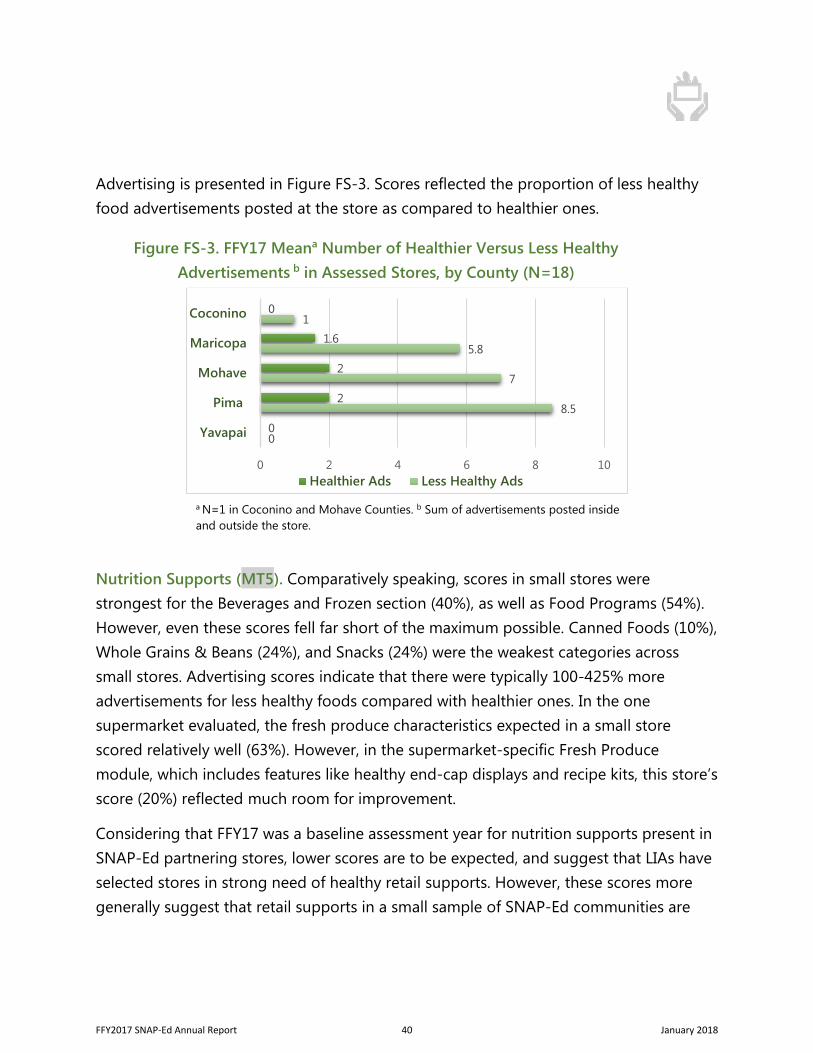
Advertising is presented in Figure FS-3. Scores reflected the proportion of less healthy food advertisements posted at the store as compared to healthier ones.
Nutrition Supports (MT5). Comparatively speaking, scores in small stores were strongest for the Beverages and Frozen section (40%), as well as Food Programs (54%). However, even these scores fell far short of the maximum possible. Canned Foods (10%), Whole Grains & Beans (24%), and Snacks (24%) were the weakest categories across small stores. Advertising scores indicate that there were typically 100-425% more advertisements for less healthy foods compared with healthier ones. In the one supermarket evaluated, the fresh produce characteristics expected in a small store scored relatively well (63%). However, in the supermarket-specific Fresh Produce module, which includes features like healthy end-cap displays and recipe kits, this store’s score (20%) reflected much room for improvement.
Considering that FFY17 was a baseline assessment year for nutrition supports present in SNAP-Ed partnering stores, lower scores are to be expected, and suggest that LIAs have selected stores in strong need of healthy retail supports. However, these scores more generally suggest that retail supports in a small sample of SNAP-Ed communities are
0
8.5
7
5.8
1
0
2
2
1.6
0
0 2 4 6 8 10
Yavapai
Pima
Mohave
Maricopa
Coconino
Healthier Ads Less Healthy Ads
Figure FS-3. FFY17 Meana Number of Healthier Versus Less Healthy Advertisements b in Assessed Stores, by County (N=18)
a N=1 in Coconino and Mohave Counties. b Sum of advertisements posted inside and outside the store.
FFY2017 SNAP-Ed Annual Report 40 January 2018
indeed lacking in the presence and magnitude necessary to encourage purchasing behaviors in alignment with the MyPlate guidelines.
STORE assessment scores in rural counties were generally lower than in the urban ones (Maricopa and Pima). This suggests that the broader challenges in rural areas to supporting healthy food access are also reflective of the specific stores selected by LIAs for SNAP-Ed intervention. It may also be symptomatic of greater challenges in rural areas to gain access to regular inventories of fresh produce, which was a priority intervention measured by the STORE.
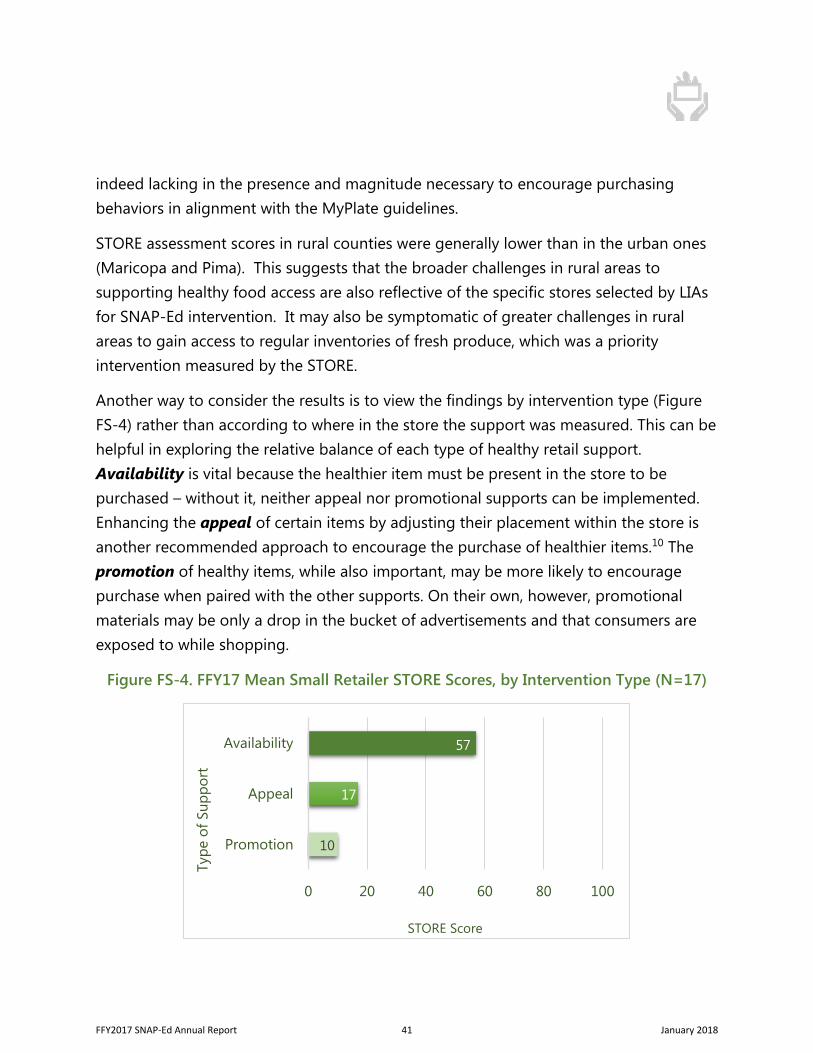
Another way to consider the results is to view the findings by intervention type (Figure FS-4) rather than according to where in the store the support was measured. This can be helpful in exploring the relative balance of each type of healthy retail support. Availability is vital because the healthier item must be present in the store to be purchased – without it, neither appeal nor promotional supports can be implemented. Enhancing the appeal of certain items by adjusting their placement within the store is another recommended approach to encourage the purchase of healthier items.10 The promotion of healthy items, while also important, may be more likely to encourage purchase when paired with the other supports. On their own, however, promotional materials may be only a drop in the bucket of advertisements and that consumers are exposed to while shopping.
Figure FS-4. FFY17 Mean Small Retailer STORE Scores, by Intervention Type (N=17)
10
17
57
0 20 40 60 80 100
Promotion
Appeal
Availability
STORE Score
Type
of S
uppo
rt
FFY2017 SNAP-Ed Annual Report 41 January 2018
In FFY17, availability and appeal supports scored higher than promotion, but as with the previous analysis, were low in all categories relative to the maximum possible scores.
Overall, the baseline results suggest that LIAs have successfully identified and engaged with stores that are in need of healthy retail supports. The fact that scores were relatively low across all counties in all store categories provides a panoply of possible interventions to implement. Because there is room to improve across all categories, LIAs may find greater flexibility in working with storeowners to select interventions that also reflect their needs and desires.
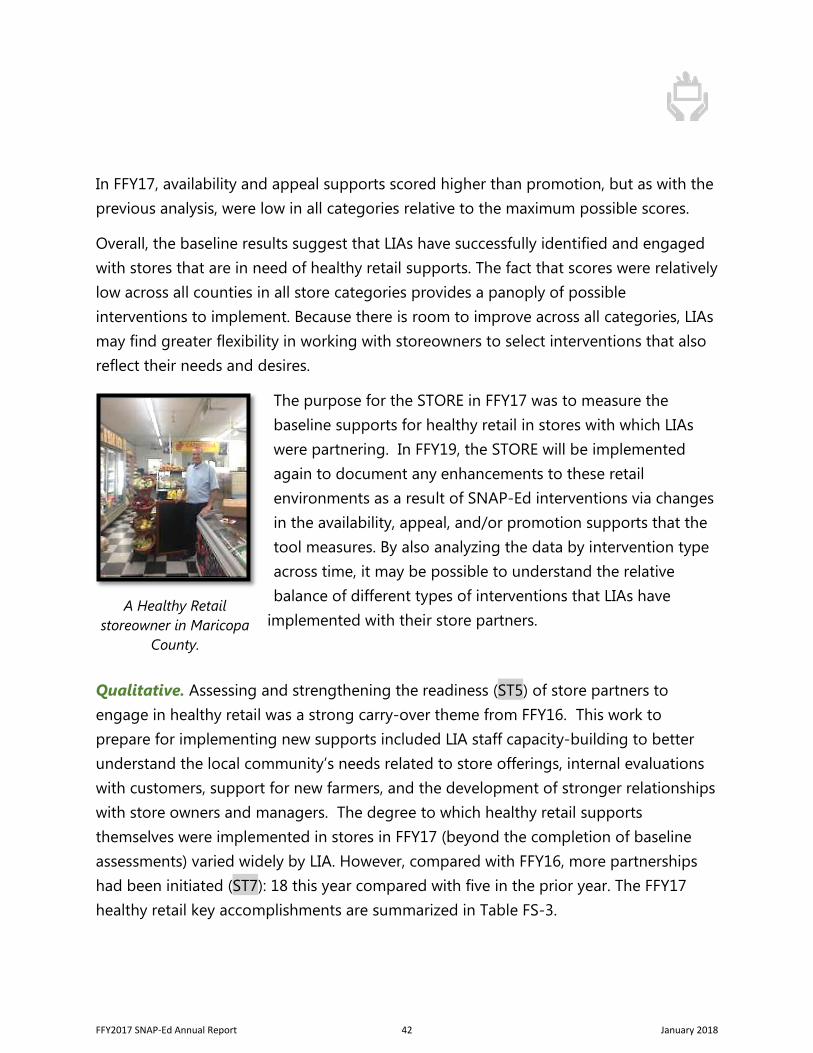
The purpose for the STORE in FFY17 was to measure the baseline supports for healthy retail in stores with which LIAs were partnering. In FFY19, the STORE will be implemented again to document any enhancements to these retail environments as a result of SNAP-Ed interventions via changes in the availability, appeal, and/or promotion supports that the tool measures. By also analyzing the data by intervention type across time, it may be possible to understand the relative balance of different types of interventions that LIAs have
implemented with their store partners.
Qualitative. Assessing and strengthening the readiness (ST5) of store partners to engage in healthy retail was a strong carry-over theme from FFY16. This work to prepare for implementing new supports included LIA staff capacity-building to better understand the local community’s needs related to store offerings, internal evaluations with customers, support for new farmers, and the development of stronger relationships with store owners and managers. The degree to which healthy retail supports themselves were implemented in stores in FFY17 (beyond the completion of baseline assessments) varied widely by LIA. However, compared with FFY16, more partnerships had been initiated (ST7): 18 this year compared with five in the prior year. The FFY17 healthy retail key accomplishments are summarized in Table FS-3.
A Healthy Retail storeowner in Maricopa
County.
FFY2017 SNAP-Ed Annual Report 42 January 2018
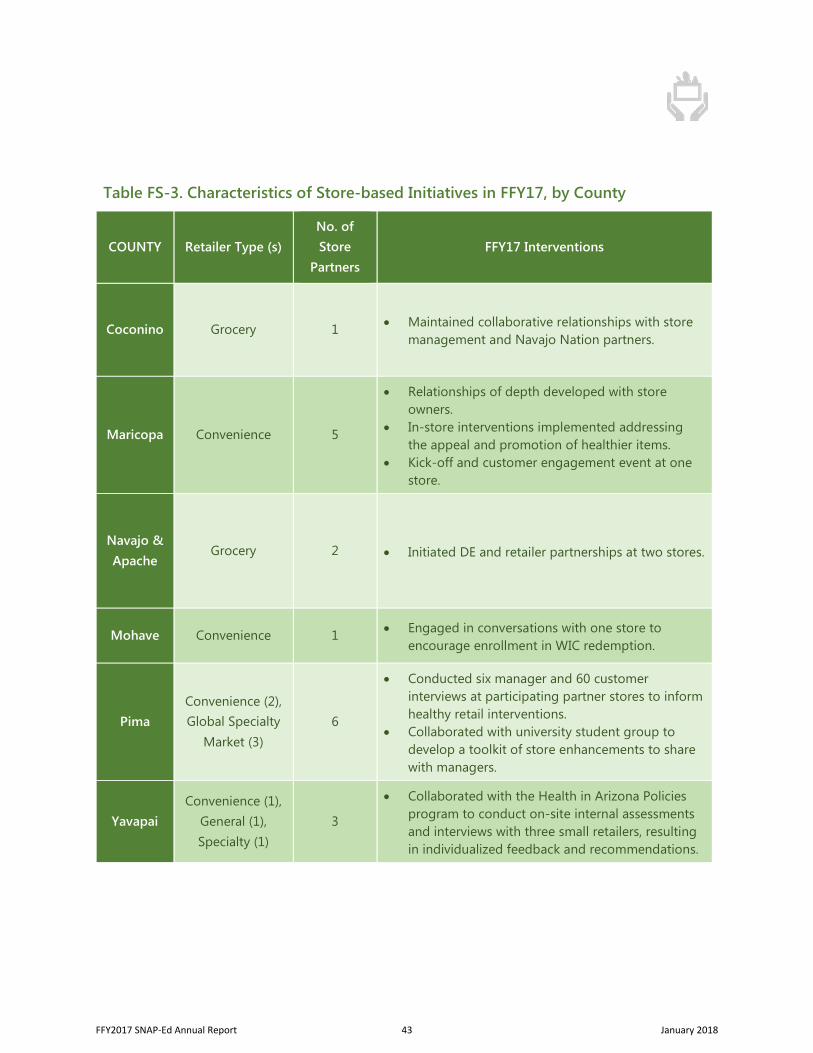
Table FS-3. Characteristics of Store-based Initiatives in FFY17, by County
COUNTY Retailer Type (s) No. of Store
Partners FFY17 Interventions
Coconino Grocery 1 • Maintained collaborative relationships with store management and Navajo Nation partners.
Maricopa Convenience 5
• Relationships of depth developed with store owners.
• In-store interventions implemented addressing the appeal and promotion of healthier items.
• Kick-off and customer engagement event at one store.
Navajo & Apache
Grocery 2 • Initiated DE and retailer partnerships at two stores.
Mohave Convenience 1 • Engaged in conversations with one store to encourage enrollment in WIC redemption.
Pima Convenience (2), Global Specialty
Market (3) 6
• Conducted six manager and 60 customer interviews at participating partner stores to inform healthy retail interventions.
• Collaborated with university student group to develop a toolkit of store enhancements to share with managers.
Yavapai Convenience (1),
General (1), Specialty (1)
3
• Collaborated with the Health in Arizona Policies program to conduct on-site internal assessments and interviews with three small retailers, resulting in individualized feedback and recommendations.
FFY2017 SNAP-Ed Annual Report 43 January 2018
In addition, two LIAs worked on supply-side healthy retail efforts in alignment with their Farm to Institution work, to develop more growers and supply chain partners to sell locally-sourced produce at small retailers as well as farm stands and farmers’ markets.
This work also connects with efforts in the Farmers’ Market strategy to bolster the produce supply in local communities’ food sheds, where gaps in grower capacity can challenge SNAP-Ed success within both strategies.
“Our support includes working with individuals and groups to obtain the Good Agricultural Practices (GAP) certification, forming a farming cooperative, and providing technical assistance with resources, trainings, and materials…[Our] Food Access coordinator also supported the planning, implementation, promotion and launch of the Spaces of Opportunity Farm Stand and Community Supported Agriculture (CSA). Currently nine CSAs are being distributed with twenty-two individuals stopping by each Saturday at the farm stand.”
FFY2017 SNAP-Ed Annual Report 44 January 2018
Multilevel Intervention Highlights
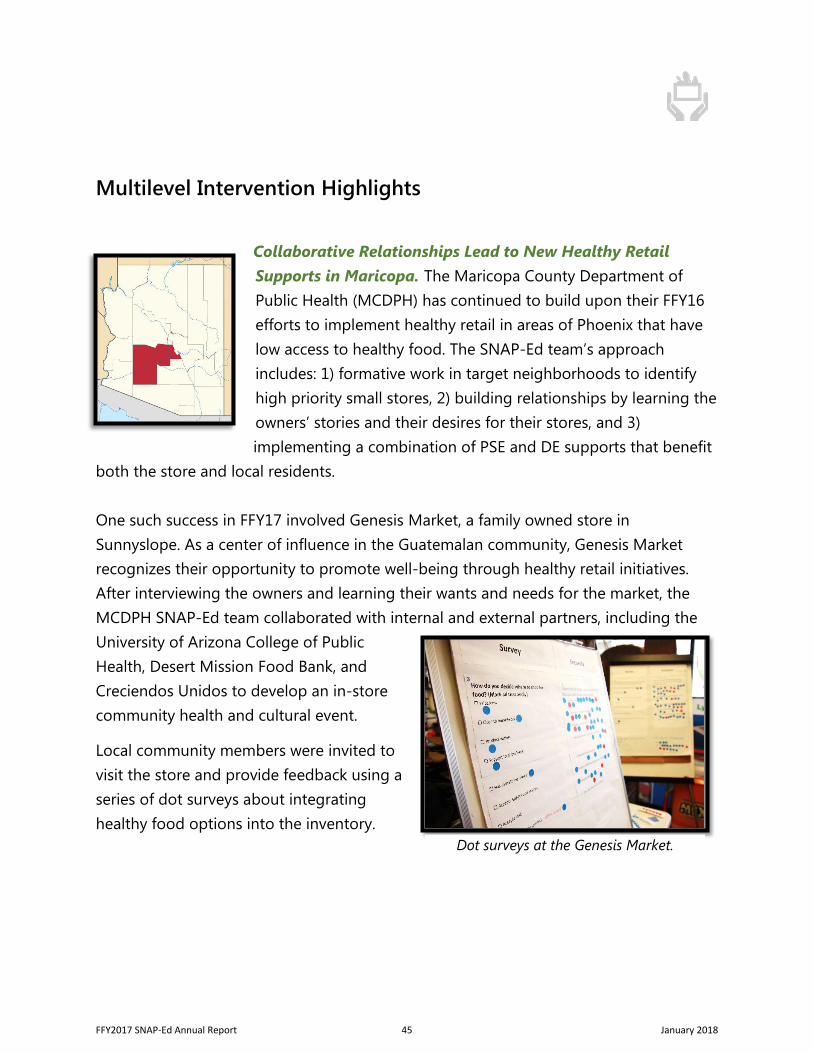
Collaborative Relationships Lead to New Healthy Retail Supports in Maricopa. The Maricopa County Department of Public Health (MCDPH) has continued to build upon their FFY16 efforts to implement healthy retail in areas of Phoenix that have low access to healthy food. The SNAP-Ed team’s approach includes: 1) formative work in target neighborhoods to identify high priority small stores, 2) building relationships by learning the owners’ stories and their desires for their stores, and 3) implementing a combination of PSE and DE supports that benefit
both the store and local residents.
One such success in FFY17 involved Genesis Market, a family owned store in Sunnyslope. As a center of influence in the Guatemalan community, Genesis Market recognizes their opportunity to promote well-being through healthy retail initiatives. After interviewing the owners and learning their wants and needs for the market, the MCDPH SNAP-Ed team collaborated with internal and external partners, including the University of Arizona College of Public Health, Desert Mission Food Bank, and Creciendos Unidos to develop an in-store community health and cultural event.
Local community members were invited to visit the store and provide feedback using a series of dot surveys about integrating healthy food options into the inventory.
Dot surveys at the Genesis Market.
FFY2017 SNAP-Ed Annual Report 45 January 2018
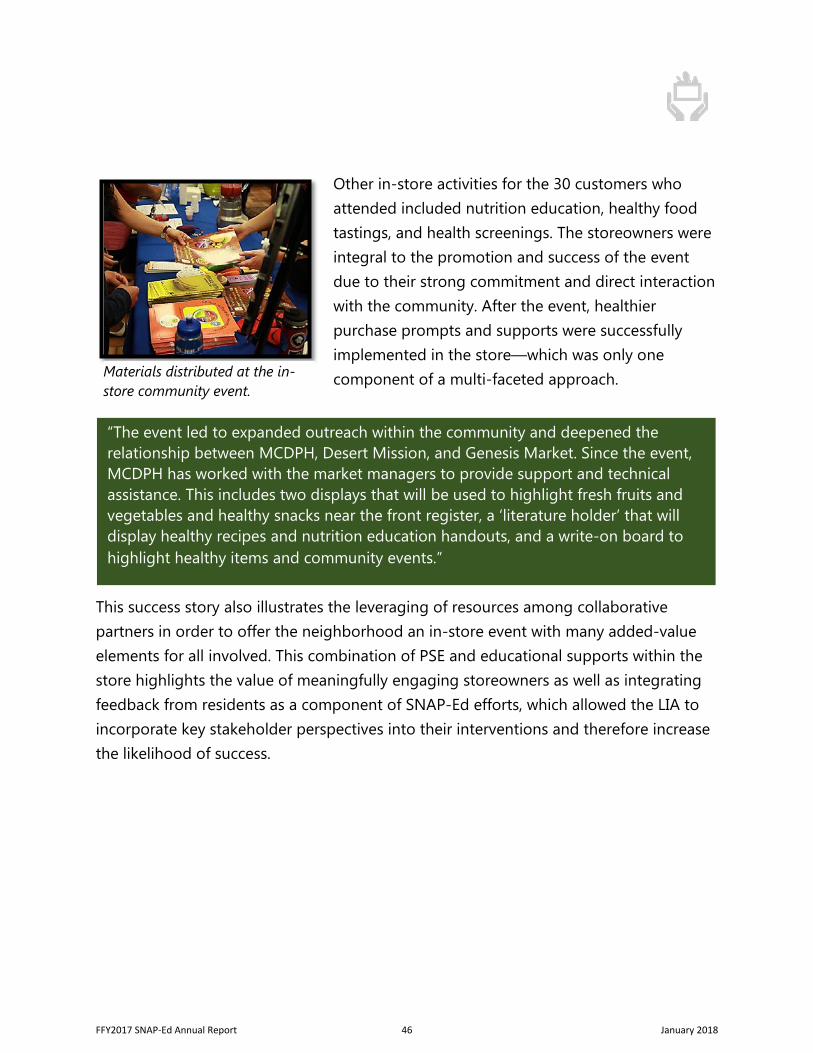
Other in-store activities for the 30 customers who attended included nutrition education, healthy food tastings, and health screenings. The storeowners were integral to the promotion and success of the event due to their strong commitment and direct interaction with the community. After the event, healthier purchase prompts and supports were successfully implemented in the store—which was only one component of a multi-faceted approach.
This success story also illustrates the leveraging of resources among collaborative partners in order to offer the neighborhood an in-store event with many added-value elements for all involved. This combination of PSE and educational supports within the store highlights the value of meaningfully engaging storeowners as well as integrating feedback from residents as a component of SNAP-Ed efforts, which allowed the LIA to incorporate key stakeholder perspectives into their interventions and therefore increase the likelihood of success.
“The event led to expanded outreach within the community and deepened the relationship between MCDPH, Desert Mission, and Genesis Market. Since the event, MCDPH has worked with the market managers to provide support and technical assistance. This includes two displays that will be used to highlight fresh fruits and vegetables and healthy snacks near the front register, a ‘literature holder’ that will display healthy recipes and nutrition education handouts, and a write-on board to highlight healthy items and community events.”
Materials distributed at the in-store community event.
FFY2017 SNAP-Ed Annual Report 46 January 2018
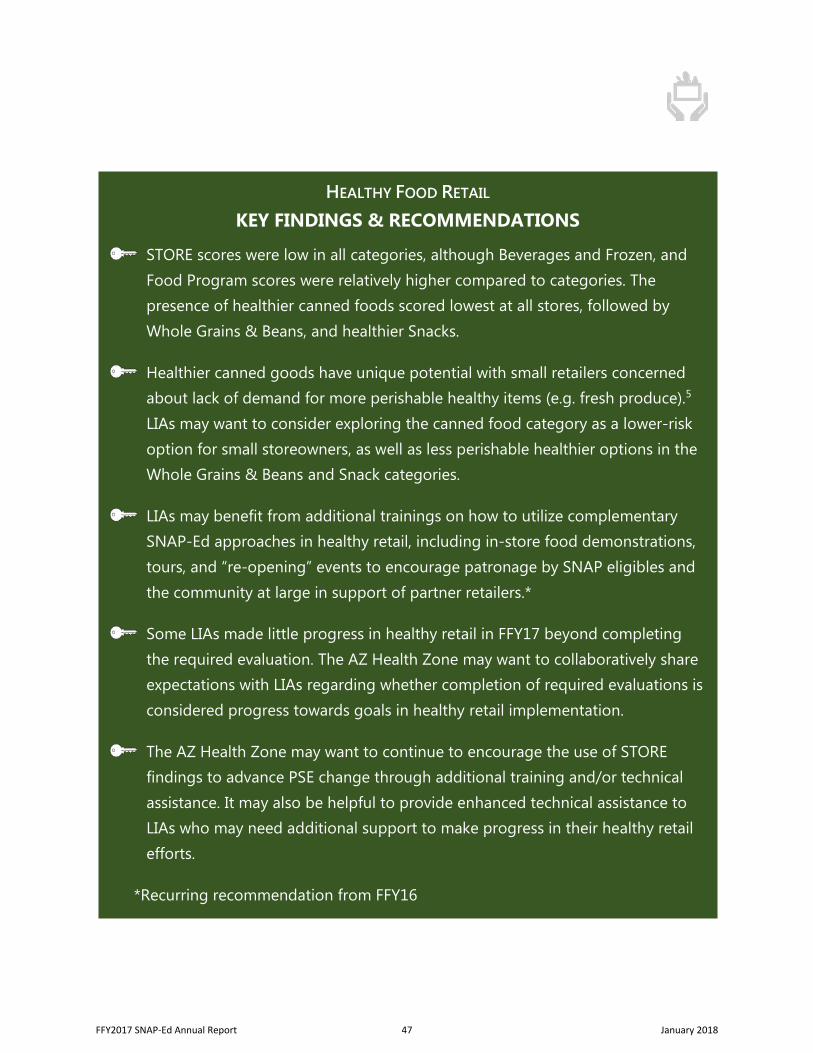
HEALTHY FOOD RETAIL KEY FINDINGS & RECOMMENDATIONS
STORE scores were low in all categories, although Beverages and Frozen, and Food Program scores were relatively higher compared to categories. The presence of healthier canned foods scored lowest at all stores, followed by Whole Grains & Beans, and healthier Snacks.
Healthier canned goods have unique potential with small retailers concerned about lack of demand for more perishable healthy items (e.g. fresh produce).5 LIAs may want to consider exploring the canned food category as a lower-risk option for small storeowners, as well as less perishable healthier options in the Whole Grains & Beans and Snack categories.
LIAs may benefit from additional trainings on how to utilize complementary SNAP-Ed approaches in healthy retail, including in-store food demonstrations, tours, and “re-opening” events to encourage patronage by SNAP eligibles and the community at large in support of partner retailers.*
Some LIAs made little progress in healthy retail in FFY17 beyond completing the required evaluation. The AZ Health Zone may want to collaboratively share expectations with LIAs regarding whether completion of required evaluations is considered progress towards goals in healthy retail implementation.
The AZ Health Zone may want to continue to encourage the use of STORE findings to advance PSE change through additional training and/or technical assistance. It may also be helpful to provide enhanced technical assistance to LIAs who may need additional support to make progress in their healthy retail efforts.
*Recurring recommendation from FFY16
FFY2017 SNAP-Ed Annual Report 47 January 2018
Gardens
Methods Mixed-methods Analysis. Site-based garden partnerships (ST7) and champions (ST6) cultivated by Arizona’s LIAs, as well as the implementation of garden supports (MT5), were assessed qualitatively. The narrative data was collected through the SARNs, and NVivo v11.0 software was used for coding and theme analysis. Additional quantitative data from SARTs was analyzed to assess LIAs’ progress toward achieving gardening goals, including meetings, technical assistance, and trainings provided throughout the year.
Results Gardens remain one of Arizona SNAP-Ed’s most popular and enduring strategies for engaging community partners. Gardens physically beautify a site and tangibly connect people to the foods recommended by MyPlate, while also encouraging a form of physical activity that is accessible to many people across the life cycle. Year two of the three-year SNAP-Ed work plan cycle was prolific for garden initiation and sustainability.
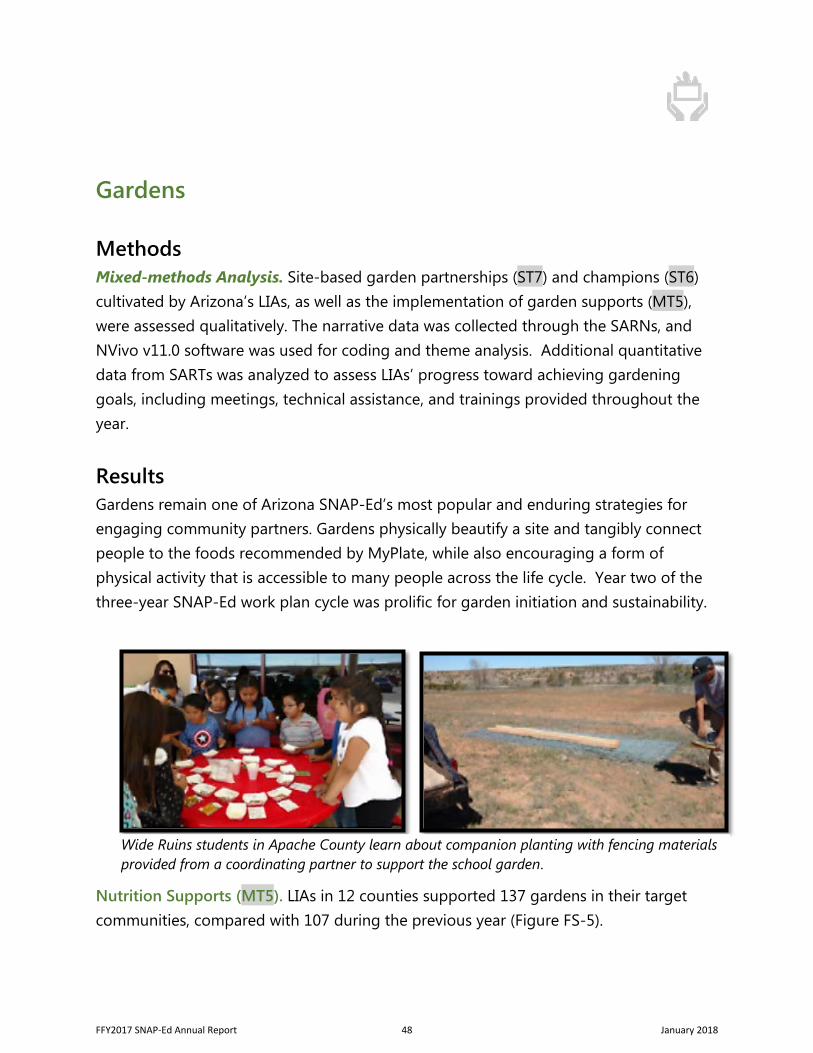
Nutrition Supports (MT5). LIAs in 12 counties supported 137 gardens in their target communities, compared with 107 during the previous year (Figure FS-5).
Wide Ruins students in Apache County learn about companion planting with fencing materials provided from a coordinating partner to support the school garden.
FFY2017 SNAP-Ed Annual Report 48 January 2018
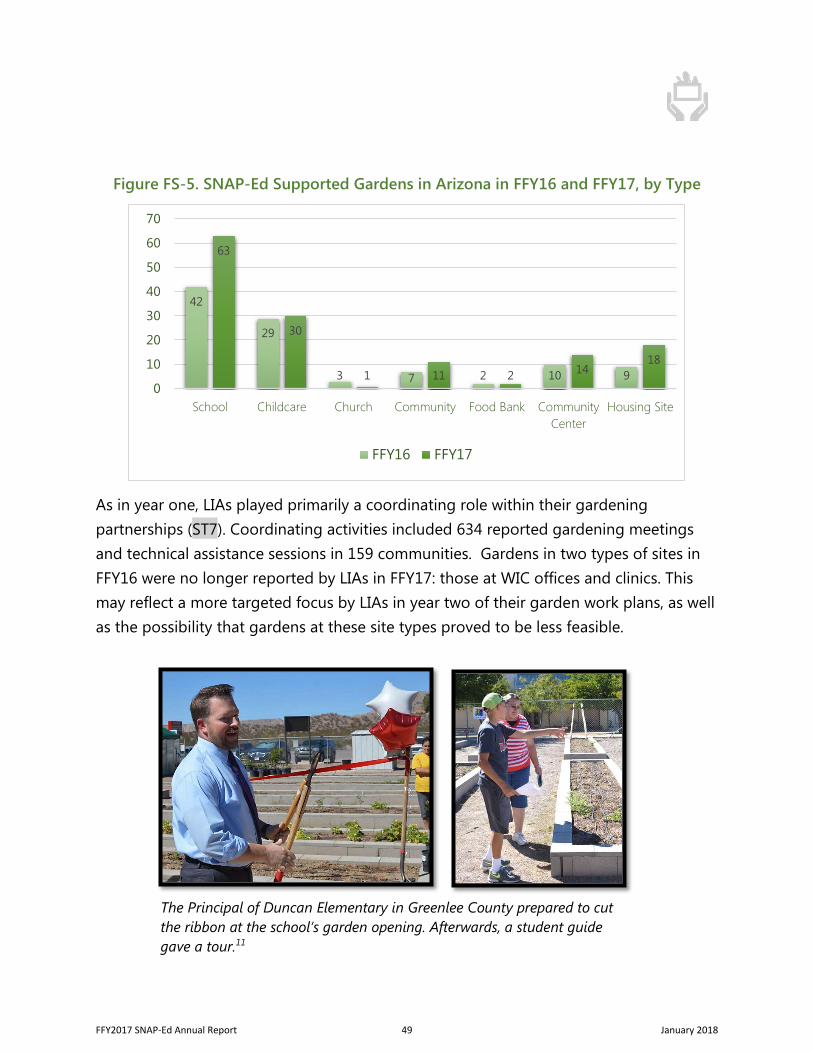
Figure FS-5. SNAP-Ed Supported Gardens in Arizona in FFY16 and FFY17, by Type
As in year one, LIAs played primarily a coordinating role within their gardening partnerships (ST7). Coordinating activities included 634 reported gardening meetings and technical assistance sessions in 159 communities. Gardens in two types of sites in FFY16 were no longer reported by LIAs in FFY17: those at WIC offices and clinics. This may reflect a more targeted focus by LIAs in year two of their garden work plans, as well as the possibility that gardens at these site types proved to be less feasible.
42
29
3 7 2 10 9
63
30
1 11 2 1418
0
10
20
30
40
50
60
70
School Childcare Church Community Food Bank CommunityCenter
Housing Site
FFY16 FFY17
The Principal of Duncan Elementary in Greenlee County prepared to cut the ribbon at the school’s garden opening. Afterwards, a student guide gave a tour.11
FFY2017 SNAP-Ed Annual Report 49 January 2018
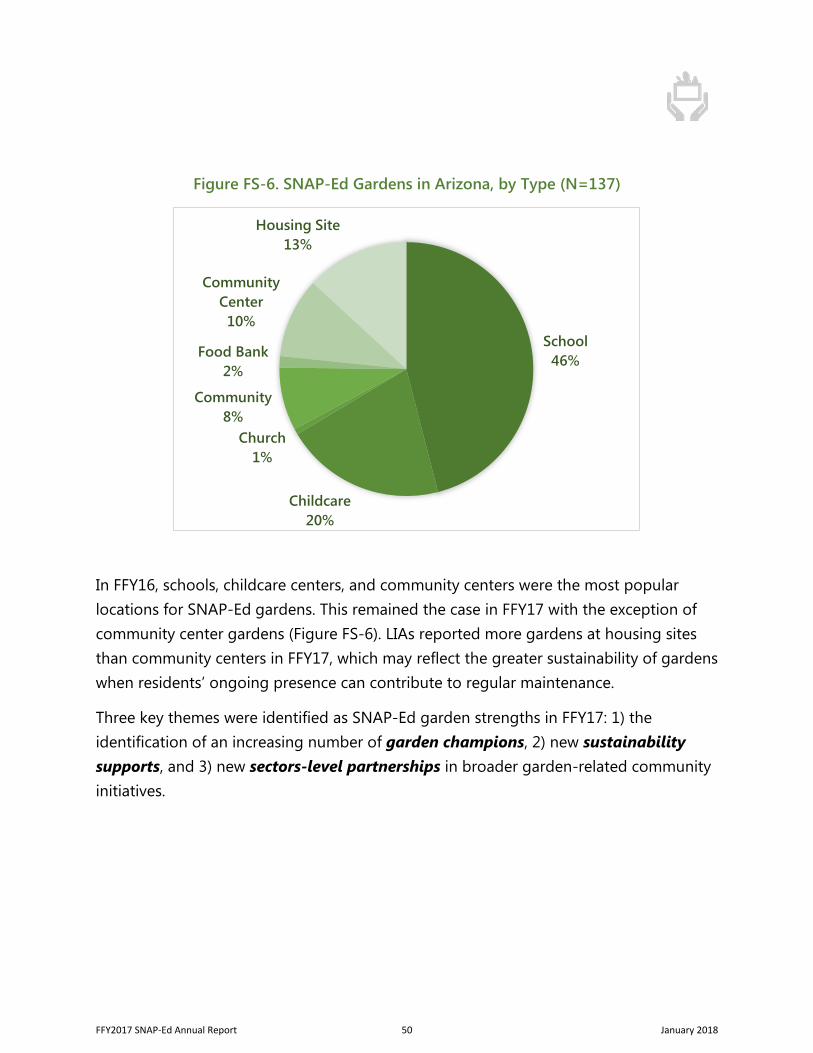
Figure FS-6. SNAP-Ed Gardens in Arizona, by Type (N=137)
In FFY16, schools, childcare centers, and community centers were the most popular locations for SNAP-Ed gardens. This remained the case in FFY17 with the exception of community center gardens (Figure FS-6). LIAs reported more gardens at housing sites than community centers in FFY17, which may reflect the greater sustainability of gardens when residents’ ongoing presence can contribute to regular maintenance.
Three key themes were identified as SNAP-Ed garden strengths in FFY17: 1) the identification of an increasing number of garden champions, 2) new sustainability supports, and 3) new sectors-level partnerships in broader garden-related community initiatives.
School46%
Childcare20%
Church1%
Community8%
Food Bank2%
Community Center10%
Housing Site13%
FFY2017 SNAP-Ed Annual Report 50 January 2018
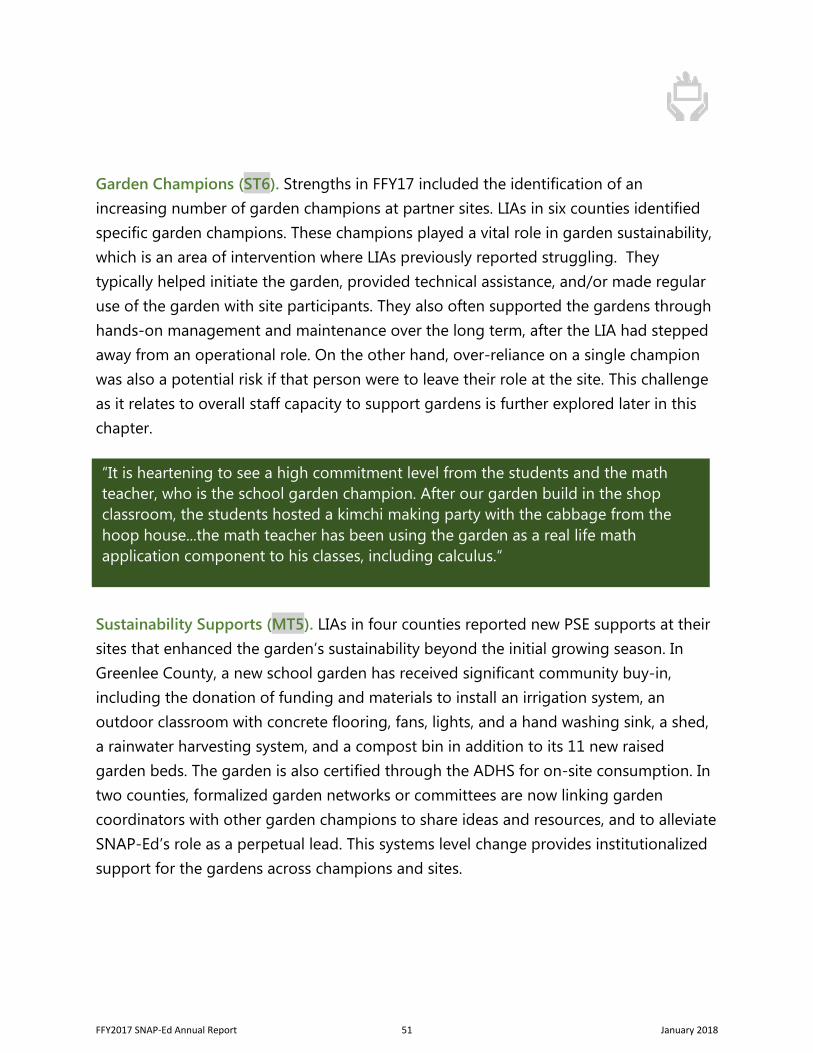
Garden Champions (ST6). Strengths in FFY17 included the identification of an increasing number of garden champions at partner sites. LIAs in six counties identified specific garden champions. These champions played a vital role in garden sustainability, which is an area of intervention where LIAs previously reported struggling. They typically helped initiate the garden, provided technical assistance, and/or made regular use of the garden with site participants. They also often supported the gardens through hands-on management and maintenance over the long term, after the LIA had stepped away from an operational role. On the other hand, over-reliance on a single champion was also a potential risk if that person were to leave their role at the site. This challenge as it relates to overall staff capacity to support gardens is further explored later in this chapter.
Sustainability Supports (MT5). LIAs in four counties reported new PSE supports at their sites that enhanced the garden’s sustainability beyond the initial growing season. In Greenlee County, a new school garden has received significant community buy-in, including the donation of funding and materials to install an irrigation system, an outdoor classroom with concrete flooring, fans, lights, and a hand washing sink, a shed, a rainwater harvesting system, and a compost bin in addition to its 11 new raised garden beds. The garden is also certified through the ADHS for on-site consumption. In two counties, formalized garden networks or committees are now linking garden coordinators with other garden champions to share ideas and resources, and to alleviate SNAP-Ed’s role as a perpetual lead. This systems level change provides institutionalized support for the gardens across champions and sites.
“It is heartening to see a high commitment level from the students and the math teacher, who is the school garden champion. After our garden build in the shop classroom, the students hosted a kimchi making party with the cabbage from the hoop house...the math teacher has been using the garden as a real life math application component to his classes, including calculus.“
FFY2017 SNAP-Ed Annual Report 51 January 2018
In several counties, additional environmental supports were put in place to support garden sustainability, including a greenhouse at one garden and a wheeled container system to address theft issues at another.
Sectors-level Partnerships. Settings-level partnerships continue to dominate garden efforts, but unique sectors-level activities also occurred in FFY17 in several counties. While this work does not yet meet the USDA’s definition of multi-sector partnerships and planning (ST8),7 it does reflect new collaborative work with entities at the sectors, rather than settings level of the SNAP-Ed intervention model. In one county, the LIA lead staff has been a pivotal convener for an emergent coalition that will bring together cross-sector partners to open a future community garden in a SNAP-Ed eligible location.
In another county, the LIA was invited by the County Zoning Commission and the nonprofit Watershed Management Group to participate in discussions around zoning for home chicken-keeping and rainwater management for home gardens.
“Our health educators have worked with schools with the 21st Century grant to create a Garden Champion Program for each of the schools we work with. This was necessary to help the schools take ownership of their school gardens, and allows for greater sustainability of school gardens in our partner sites.”
“The City's Planning and Zoning approached [our coalition] with a proposal to partner with them to develop a community garden and complementary healthy community design initiatives in an at-risk area that is targeted for a revitalization strategy by the City. The project could potentially be supported by Community Development Block Grant funding. We will be developing and submitting our concept and engaging in further discussions with the City team.”
FFY2017 SNAP-Ed Annual Report 52 January 2018
These opportunities illustrate how SNAP-Ed gardening work has expanded in some counties to address community-level gardening issues that have the potential to reach more participants than one garden at a single site.
In spite of supporting many thriving gardens in FFY17, LIAs’ challenges in this strategy were also significant. They reported three key types of barriers: 1) managing the physical environment, 2) gaining buy-in at many levels, and 3) a lack of capacity in the form of human capital. Figure FS-7 further illustrates related subthemes, along with the number of counties who reported the barrier.
Some of these barriers are arguably outside of the LIA’s scope, such as turnover in site leadership and staff, or equipment issues (e.g. irrigation systems) that are not in their purview. Some barriers, like on-site theft, were mitigated with rolling carts to transport container gardens to secure areas when necessary. With respect to staff and leadership turnover, several LIAs utilize sustainability plans with their sites to enhance the likelihood that the garden can weather changes in personnel.
“Through these meetings, the Garden Kitchen was able to promote the interests of our participants by sharing that backyard chickens can be a great way to stretch a limited food budget by providing a low-cost lean protein source (eggs) and can reduce the waste associated with gardening...[the] Watershed Management Group has approached us to help facilitate a program where low-income participants have access to small grants and supplies to practice water harvesting in their home gardens.”
FFY2017 SNAP-Ed Annual Report 53 January 2018
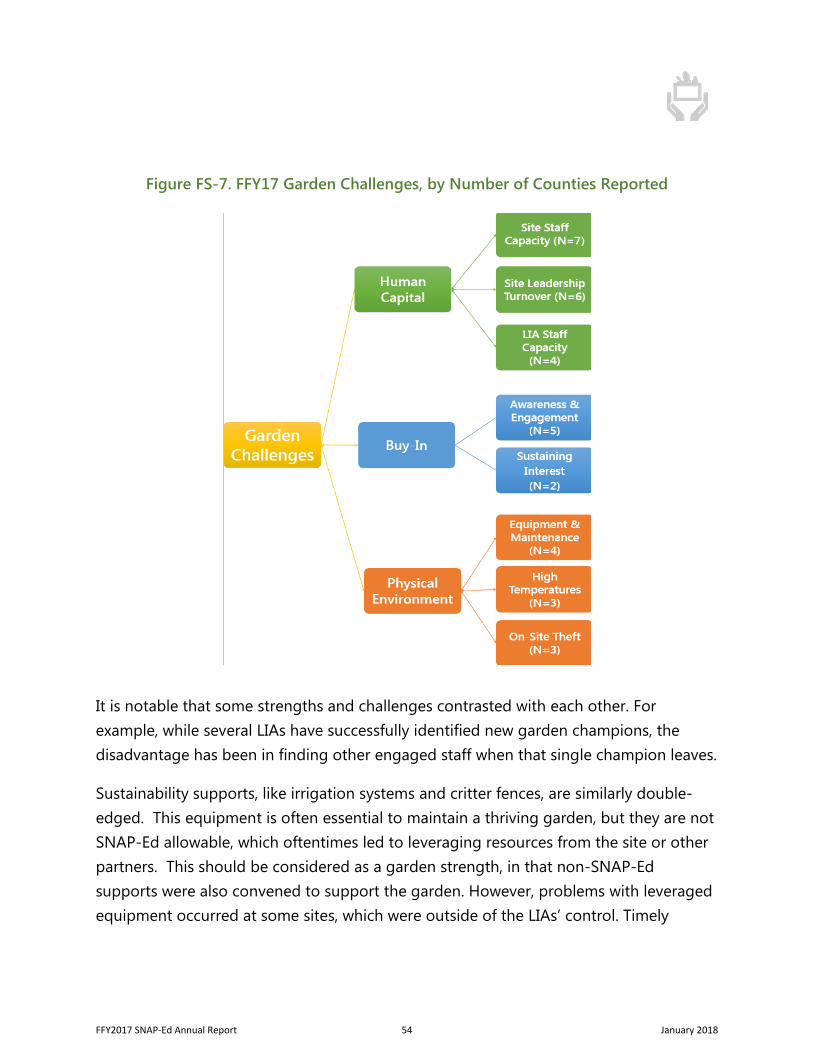
Figure FS-7. FFY17 Garden Challenges, by Number of Counties Reported
It is notable that some strengths and challenges contrasted with each other. For example, while several LIAs have successfully identified new garden champions, the disadvantage has been in finding other engaged staff when that single champion leaves.
Sustainability supports, like irrigation systems and critter fences, are similarly double-edged. This equipment is often essential to maintain a thriving garden, but they are not SNAP-Ed allowable, which oftentimes led to leveraging resources from the site or other partners. This should be considered as a garden strength, in that non-SNAP-Ed supports were also convened to support the garden. However, problems with leveraged equipment occurred at some sites, which were outside of the LIAs’ control. Timely
FFY2017 SNAP-Ed Annual Report 54 January 2018
repairs were reportedly inconsistent at some sites and threatened the season’s harvest, which was a barrier reported in four counties.
GARDENS KEY FINDINGS & RECOMMENDATIONS
SNAP-Ed gardening efforts in FFY17 continued to progress, and benefited from strong champions, the installation of garden sustainability supports, and new sectors-level partnerships.
Many garden challenges persist. Most frequent among them were a lack of staff capacity at garden sites, challenges with the physical environment, and inconsistent buy-in to sustain efforts. Additional investigation by the AZ Health Zone SET may help identify strategies to address garden capacity and sustainability challenges.
LIAs may benefit from additional peer-led sharing or AZ Health Zone training on how to assess and support a garden site’s staff capacity prior to installation, in order to ensure greater sustainability. This may also allow SNAP-Ed staff to more successfully transfer operations after a garden’s initial establishment.
LIAs may benefit from training or technical assistance regarding other issues that can be proactively addressed prior to garden installation. For example, discussing expectations about seasonal weather so that all stakeholders anticipate enhanced maintenance needs, or proactive planning for a fallow season while sustaining enthusiasm for the garden initiative.
FFY2017 SNAP-Ed Annual Report 55 January 2018
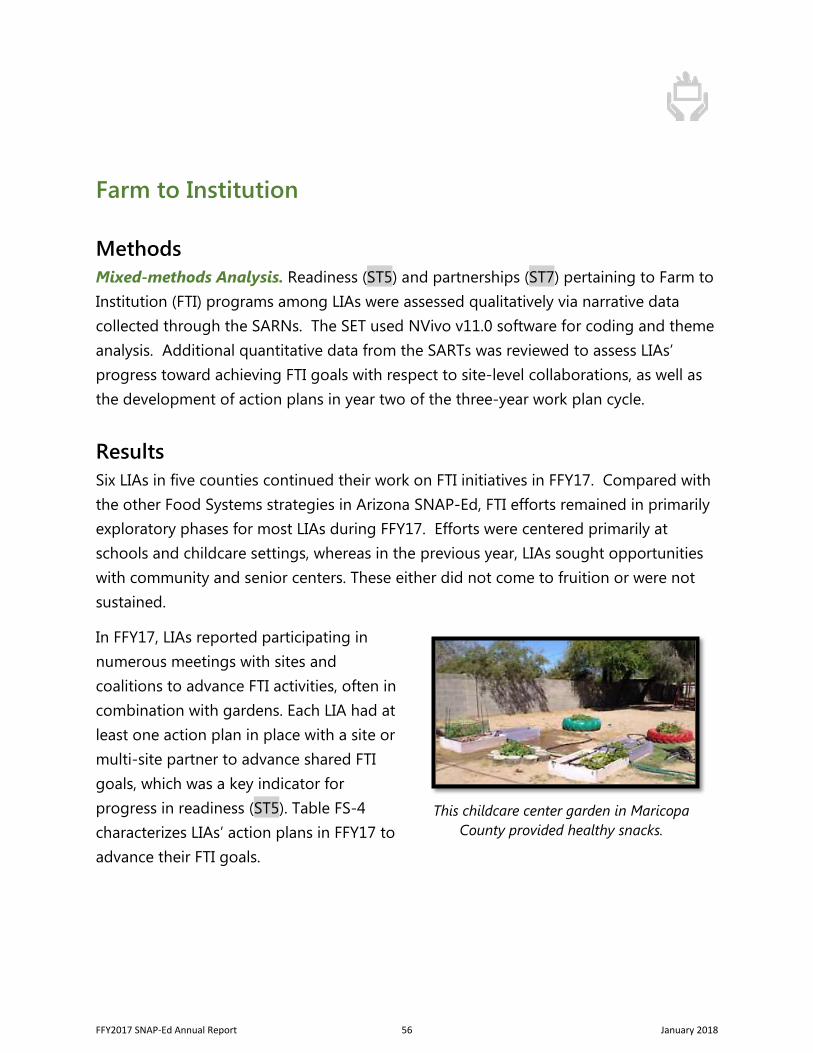
Farm to Institution
MethodsMixed-methods Analysis. Readiness (ST5) and partnerships (ST7) pertaining to Farm to Institution (FTI) programs among LIAs were assessed qualitatively via narrative data collected through the SARNs. The SET used NVivo v11.0 software for coding and theme analysis. Additional quantitative data from the SARTs was reviewed to assess LIAs’ progress toward achieving FTI goals with respect to site-level collaborations, as well as the development of action plans in year two of the three-year work plan cycle.
Results Six LIAs in five counties continued their work on FTI initiatives in FFY17. Compared with the other Food Systems strategies in Arizona SNAP-Ed, FTI efforts remained in primarily exploratory phases for most LIAs during FFY17. Efforts were centered primarily at schools and childcare settings, whereas in the previous year, LIAs sought opportunities with community and senior centers. These either did not come to fruition or were not sustained.
In FFY17, LIAs reported participating in numerous meetings with sites and coalitions to advance FTI activities, often in combination with gardens. Each LIA had at least one action plan in place with a site or multi-site partner to advance shared FTI goals, which was a key indicator for progress in readiness (ST5). Table FS-4 characterizes LIAs’ action plans in FFY17 to advance their FTI goals.
This childcare center garden in Maricopa County provided healthy snacks.
FFY2017 SNAP-Ed Annual Report 56 January 2018
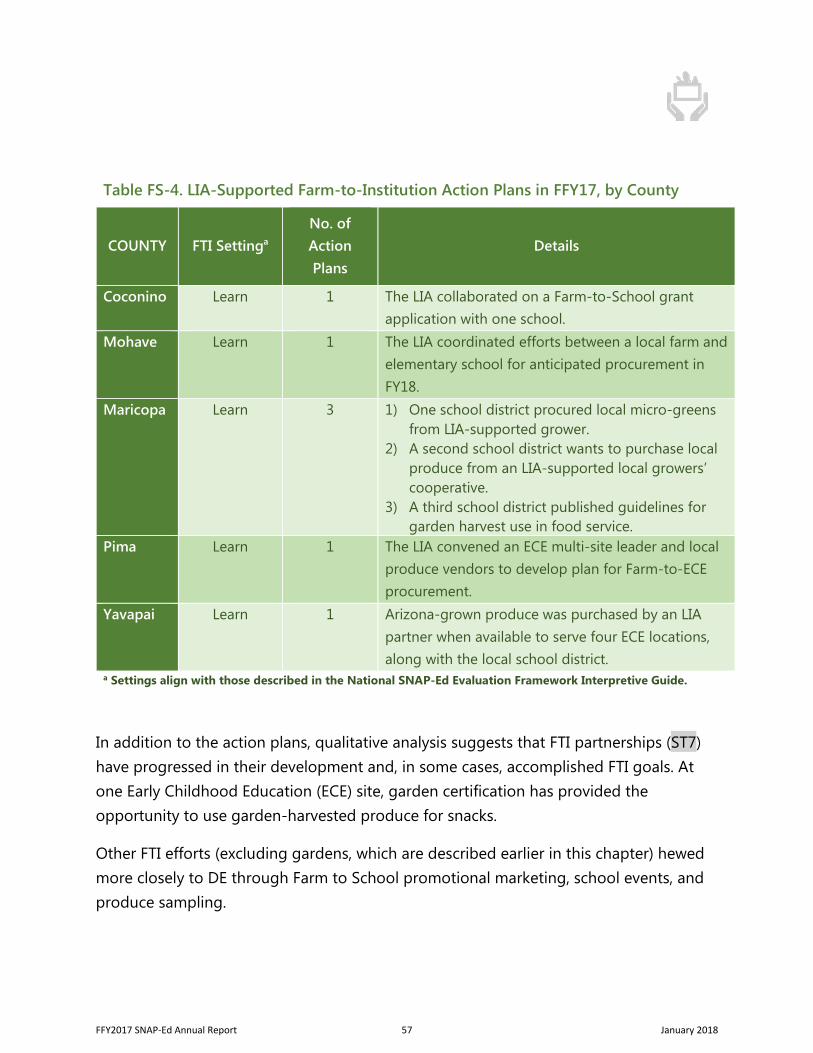
In addition to the action plans, qualitative analysis suggests that FTI partnerships (ST7) have progressed in their development and, in some cases, accomplished FTI goals. At one Early Childhood Education (ECE) site, garden certification has provided the opportunity to use garden-harvested produce for snacks.
Other FTI efforts (excluding gardens, which are described earlier in this chapter) hewed more closely to DE through Farm to School promotional marketing, school events, and produce sampling.
Table FS-4. LIA-Supported Farm-to-Institution Action Plans in FFY17, by County
COUNTY FTI Settinga No. of Action Plans
Details
Coconino Learn 1 The LIA collaborated on a Farm-to-School grant application with one school.
Mohave Learn 1 The LIA coordinated efforts between a local farm and elementary school for anticipated procurement in FY18.
Maricopa Learn 3 1) One school district procured local micro-greensfrom LIA-supported grower.
2) A second school district wants to purchase localproduce from an LIA-supported local growers’cooperative.
3) A third school district published guidelines forgarden harvest use in food service.
Pima Learn 1 The LIA convened an ECE multi-site leader and local produce vendors to develop plan for Farm-to-ECE procurement.
Yavapai Learn 1 Arizona-grown produce was purchased by an LIA partner when available to serve four ECE locations, along with the local school district.
a Settings align with those described in the National SNAP-Ed Evaluation Framework Interpretive Guide.
FFY2017 SNAP-Ed Annual Report 57 January 2018
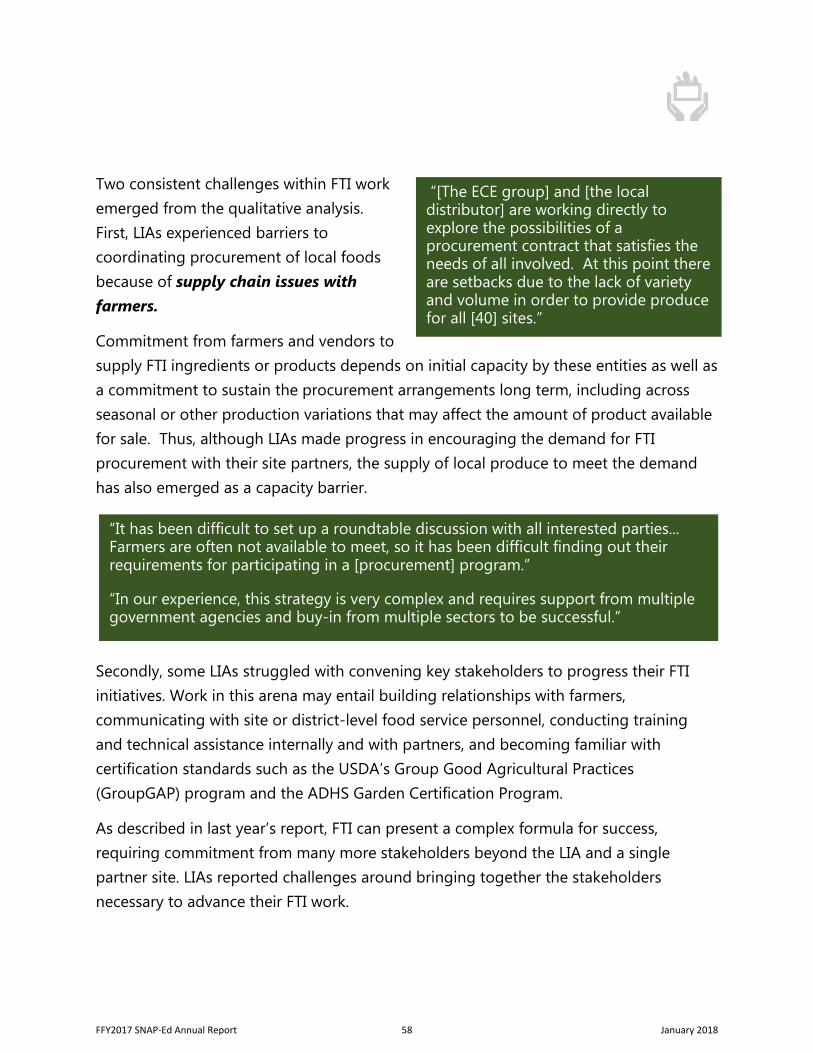
Two consistent challenges within FTI work emerged from the qualitative analysis. First, LIAs experienced barriers to coordinating procurement of local foods because of supply chain issues with farmers.
Commitment from farmers and vendors to supply FTI ingredients or products depends on initial capacity by these entities as well as a commitment to sustain the procurement arrangements long term, including across seasonal or other production variations that may affect the amount of product available for sale. Thus, although LIAs made progress in encouraging the demand for FTI procurement with their site partners, the supply of local produce to meet the demand has also emerged as a capacity barrier.
Secondly, some LIAs struggled with convening key stakeholders to progress their FTI initiatives. Work in this arena may entail building relationships with farmers, communicating with site or district-level food service personnel, conducting training and technical assistance internally and with partners, and becoming familiar with certification standards such as the USDA’s Group Good Agricultural Practices (GroupGAP) program and the ADHS Garden Certification Program.
As described in last year’s report, FTI can present a complex formula for success, requiring commitment from many more stakeholders beyond the LIA and a single partner site. LIAs reported challenges around bringing together the stakeholders necessary to advance their FTI work.
“[The ECE group] and [the local distributor] are working directly to explore the possibilities of a procurement contract that satisfies the needs of all involved. At this point there are setbacks due to the lack of variety and volume in order to provide produce for all [40] sites.”
“It has been difficult to set up a roundtable discussion with all interested parties... Farmers are often not available to meet, so it has been difficult finding out their requirements for participating in a [procurement] program.”
“In our experience, this strategy is very complex and requires support from multiple government agencies and buy-in from multiple sectors to be successful.”
FFY2017 SNAP-Ed Annual Report 58 January 2018
Some LIAs reported minimal FTI progress from FFY16. For these agencies, it may be worthwhile to consider whether continued participation in FTI fits with their current goals and capacity. Overall, however, the FTI strategy in Arizona’s SNAP-Ed program has matured, and has progressed from an initial understanding of the contours of FTI work, to digging deeper into meaningful planning and implementation.
FFY2017 SNAP-Ed Annual Report 59 January 2018
FARM TO INSTITUTION KEY FINDINGS & RECOMMENDATIONS
SNAP-Ed FTI efforts have progressed into meaningful collaborations, implementation, and the achievement of new supports for several LIAs, such as garden-supplied onsite procurement and new farmer-supplied ingredients in two schools. For other LIAs, FTI work was either less substantial in FFY17 or hewed toward DE.
DE activities, such as Farm to School month promotion, one-time events, and produce samplings play a role in building awareness and momentum for FTI initiatives. On their own, however, they do not institutionally change policies, systems, or environments as measured by the National SNAP-Ed Evaluation Framework.7 The AZ Health Zone may want to consider providing additional technical assistance regarding the spectrum of PSE work as it pertains to FTI.
For LIAs whose FTI work was less substantial in FFY17, it may be worthwhile to consider whether FTI still fits within their work plans relative to other SNAP-Ed efforts.
LIAs could benefit from training and technical assistance on how to progress early efforts with partners and coalitions in the area of procurement, including effective methods for engaging farmers and other stakeholders to ensure consistent supply chains for relevant FTI products and ingredients.
FFY2017 SNAP-Ed Annual Report 60 January 2018
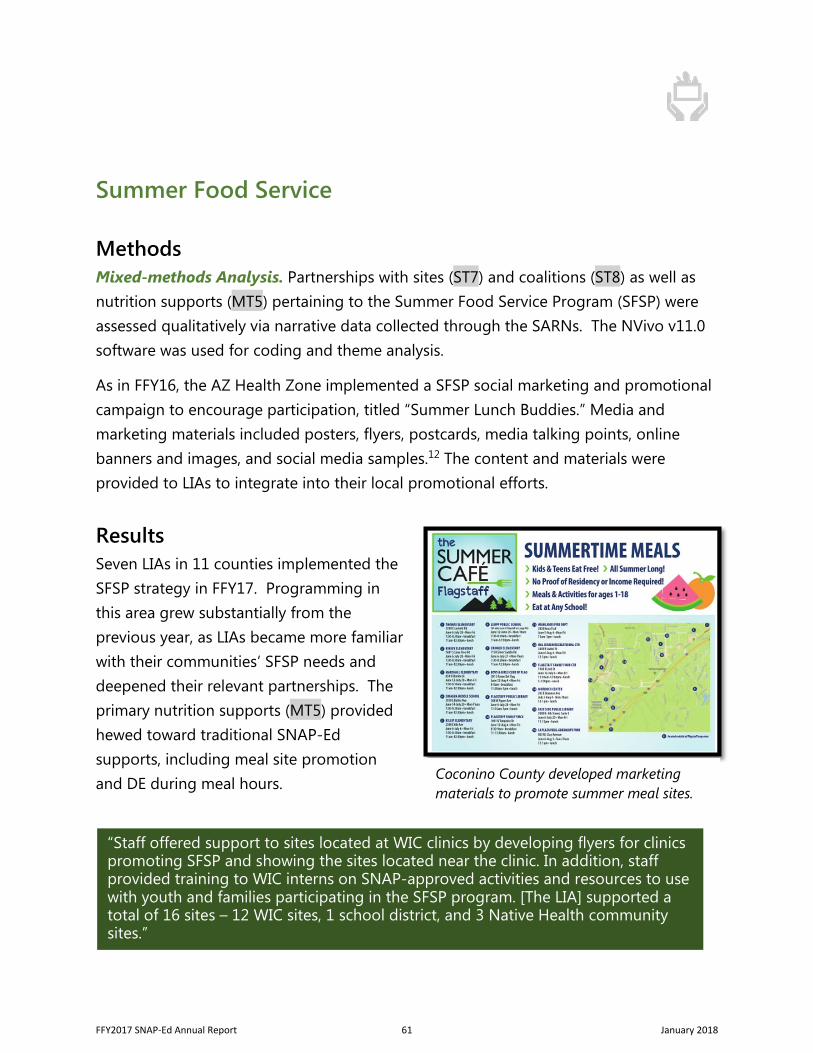
Summer Food Service
Methods Mixed-methods Analysis. Partnerships with sites (ST7) and coalitions (ST8) as well as nutrition supports (MT5) pertaining to the Summer Food Service Program (SFSP) were assessed qualitatively via narrative data collected through the SARNs. The NVivo v11.0 software was used for coding and theme analysis.
As in FFY16, the AZ Health Zone implemented a SFSP social marketing and promotional campaign to encourage participation, titled “Summer Lunch Buddies.” Media and marketing materials included posters, flyers, postcards, media talking points, online banners and images, and social media samples.12 The content and materials were provided to LIAs to integrate into their local promotional efforts.
Results Seven LIAs in 11 counties implemented the SFSP strategy in FFY17. Programming in this area grew substantially from the previous year, as LIAs became more familiar with their communities’ SFSP needs and deepened their relevant partnerships. The primary nutrition supports (MT5) provided hewed toward traditional SNAP-Ed supports, including meal site promotion and DE during meal hours.
“Staff offered support to sites located at WIC clinics by developing flyers for clinics promoting SFSP and showing the sites located near the clinic. In addition, staff provided training to WIC interns on SNAP-approved activities and resources to use with youth and families participating in the SFSP program. [The LIA] supported a total of 16 sites – 12 WIC sites, 1 school district, and 3 Native Health community sites.”
Coconino County developed marketing materials to promote summer meal sites.
FFY2017 SNAP-Ed Annual Report 61 January 2018
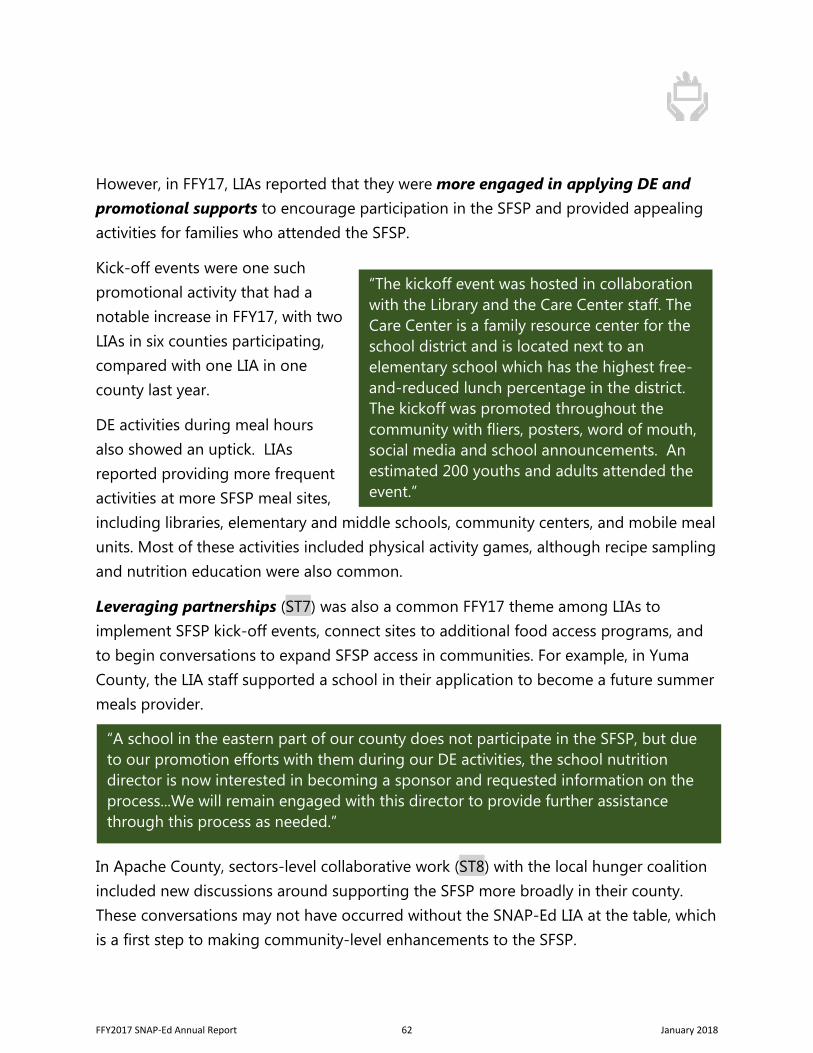
However, in FFY17, LIAs reported that they were more engaged in applying DE and promotional supports to encourage participation in the SFSP and provided appealing activities for families who attended the SFSP.
Kick-off events were one such promotional activity that had a notable increase in FFY17, with two LIAs in six counties participating, compared with one LIA in one county last year.
DE activities during meal hours also showed an uptick. LIAs reported providing more frequent activities at more SFSP meal sites, including libraries, elementary and middle schools, community centers, and mobile meal units. Most of these activities included physical activity games, although recipe sampling and nutrition education were also common.
Leveraging partnerships (ST7) was also a common FFY17 theme among LIAs to implement SFSP kick-off events, connect sites to additional food access programs, and to begin conversations to expand SFSP access in communities. For example, in Yuma County, the LIA staff supported a school in their application to become a future summer meals provider.
In Apache County, sectors-level collaborative work (ST8) with the local hunger coalition included new discussions around supporting the SFSP more broadly in their county. These conversations may not have occurred without the SNAP-Ed LIA at the table, which is a first step to making community-level enhancements to the SFSP.
“The kickoff event was hosted in collaboration with the Library and the Care Center staff. The Care Center is a family resource center for the school district and is located next to an elementary school which has the highest free-and-reduced lunch percentage in the district. The kickoff was promoted throughout the community with fliers, posters, word of mouth, social media and school announcements. An estimated 200 youths and adults attended the event.”
“A school in the eastern part of our county does not participate in the SFSP, but due to our promotion efforts with them during our DE activities, the school nutrition director is now interested in becoming a sponsor and requested information on the process...We will remain engaged with this director to provide further assistance through this process as needed.”
FFY2017 SNAP-Ed Annual Report 62 January 2018
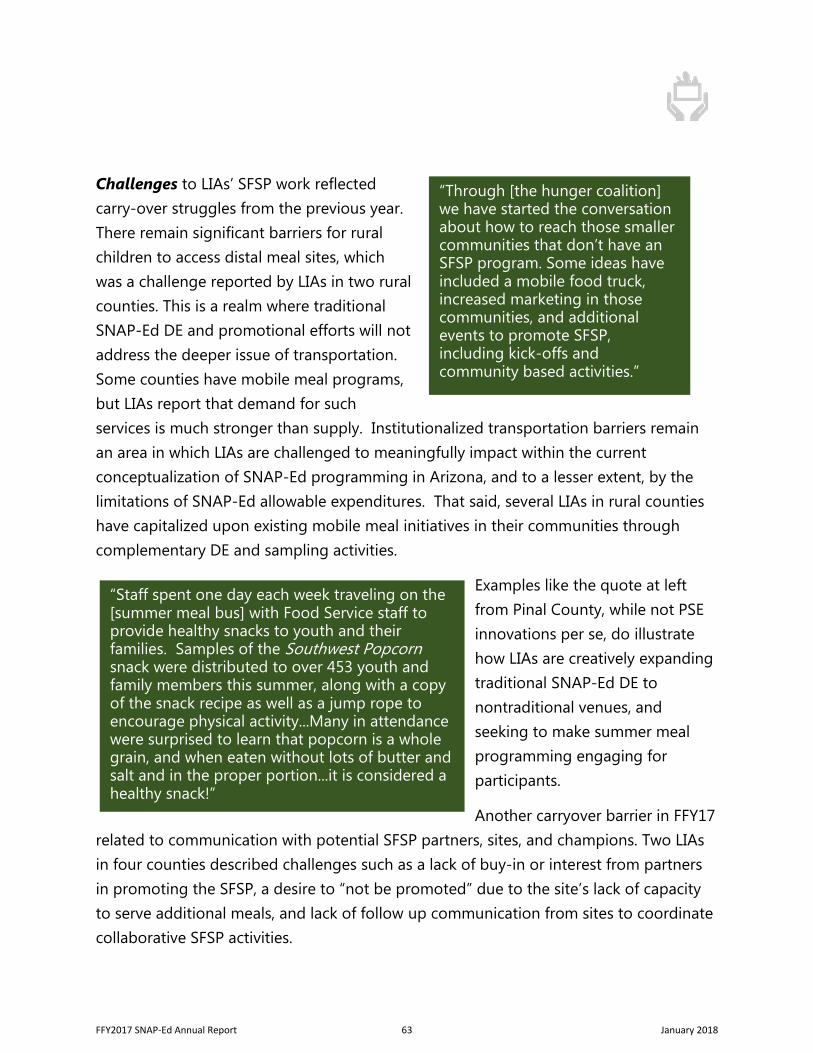
Challenges to LIAs’ SFSP work reflected carry-over struggles from the previous year. There remain significant barriers for rural children to access distal meal sites, which was a challenge reported by LIAs in two rural counties. This is a realm where traditional SNAP-Ed DE and promotional efforts will not address the deeper issue of transportation. Some counties have mobile meal programs, but LIAs report that demand for such services is much stronger than supply. Institutionalized transportation barriers remain an area in which LIAs are challenged to meaningfully impact within the current conceptualization of SNAP-Ed programming in Arizona, and to a lesser extent, by the limitations of SNAP-Ed allowable expenditures. That said, several LIAs in rural counties have capitalized upon existing mobile meal initiatives in their communities through complementary DE and sampling activities.
Examples like the quote at left from Pinal County, while not PSE innovations per se, do illustrate how LIAs are creatively expanding traditional SNAP-Ed DE to nontraditional venues, and seeking to make summer meal programming engaging for participants.
Another carryover barrier in FFY17 related to communication with potential SFSP partners, sites, and champions. Two LIAs in four counties described challenges such as a lack of buy-in or interest from partners in promoting the SFSP, a desire to “not be promoted” due to the site’s lack of capacity to serve additional meals, and lack of follow up communication from sites to coordinate collaborative SFSP activities.
“Through [the hunger coalition] we have started the conversation about how to reach those smaller communities that don’t have an SFSP program. Some ideas have included a mobile food truck, increased marketing in those communities, and additional events to promote SFSP, including kick-offs and community based activities.”
“Staff spent one day each week traveling on the [summer meal bus] with Food Service staff to provide healthy snacks to youth and their families. Samples of the Southwest Popcorn snack were distributed to over 453 youth and family members this summer, along with a copy of the snack recipe as well as a jump rope to encourage physical activity...Many in attendance were surprised to learn that popcorn is a whole grain, and when eaten without lots of butter and salt and in the proper portion...it is considered a healthy snack!”
FFY2017 SNAP-Ed Annual Report 63 January 2018
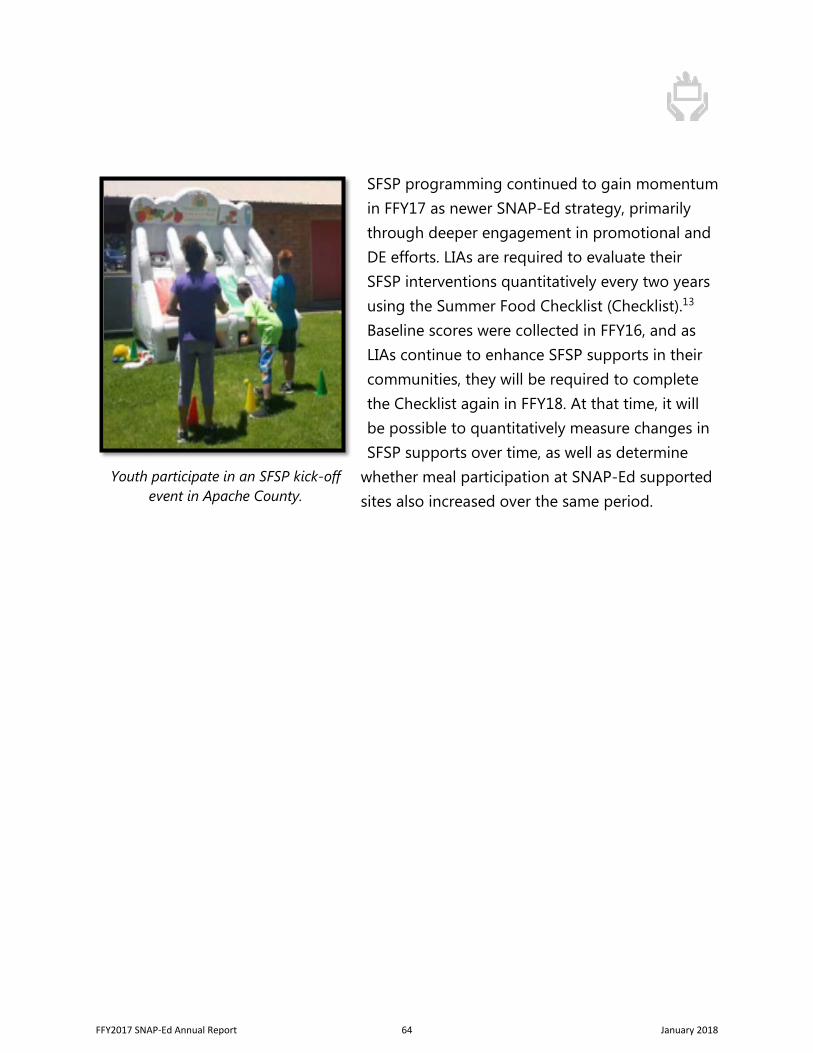
SFSP programming continued to gain momentum in FFY17 as newer SNAP-Ed strategy, primarily through deeper engagement in promotional and DE efforts. LIAs are required to evaluate their SFSP interventions quantitatively every two years using the Summer Food Checklist (Checklist).13 Baseline scores were collected in FFY16, and as LIAs continue to enhance SFSP supports in their communities, they will be required to complete the Checklist again in FFY18. At that time, it will be possible to quantitatively measure changes in SFSP supports over time, as well as determine
whether meal participation at SNAP-Ed supported sites also increased over the same period.
Youth participate in an SFSP kick-off event in Apache County.
FFY2017 SNAP-Ed Annual Report 64 January 2018
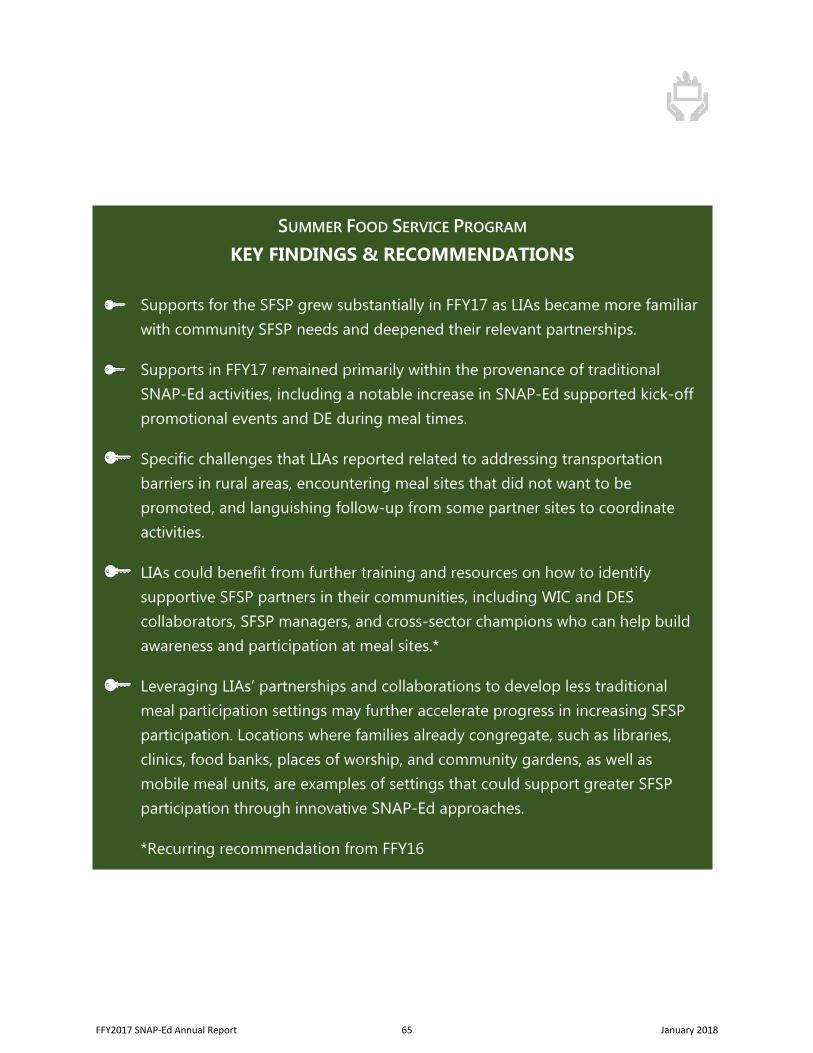
SUMMER FOOD SERVICE PROGRAM KEY FINDINGS & RECOMMENDATIONS
Supports for the SFSP grew substantially in FFY17 as LIAs became more familiar with community SFSP needs and deepened their relevant partnerships.
Supports in FFY17 remained primarily within the provenance of traditional SNAP-Ed activities, including a notable increase in SNAP-Ed supported kick-off promotional events and DE during meal times.
Specific challenges that LIAs reported related to addressing transportation barriers in rural areas, encountering meal sites that did not want to be promoted, and languishing follow-up from some partner sites to coordinate activities.
LIAs could benefit from further training and resources on how to identify supportive SFSP partners in their communities, including WIC and DES collaborators, SFSP managers, and cross-sector champions who can help build awareness and participation at meal sites.*
Leveraging LIAs’ partnerships and collaborations to develop less traditional meal participation settings may further accelerate progress in increasing SFSP participation. Locations where families already congregate, such as libraries, clinics, food banks, places of worship, and community gardens, as well as mobile meal units, are examples of settings that could support greater SFSP participation through innovative SNAP-Ed approaches.
*Recurring recommendation from FFY16
FFY2017 SNAP-Ed Annual Report 65 January 2018
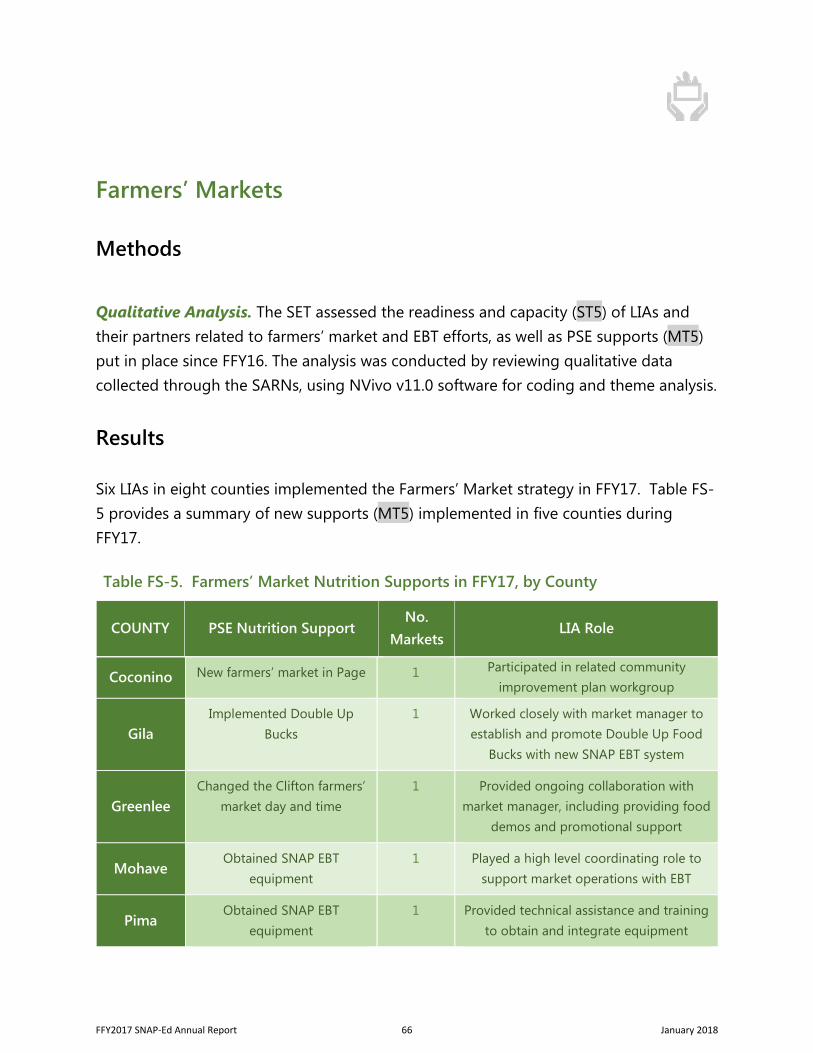
Farmers’ Markets
Methods
Qualitative Analysis. The SET assessed the readiness and capacity (ST5) of LIAs and their partners related to farmers’ market and EBT efforts, as well as PSE supports (MT5) put in place since FFY16. The analysis was conducted by reviewing qualitative data collected through the SARNs, using NVivo v11.0 software for coding and theme analysis.
Results
Six LIAs in eight counties implemented the Farmers’ Market strategy in FFY17. Table FS-5 provides a summary of new supports (MT5) implemented in five counties during FFY17.
Table FS-5. Farmers’ Market Nutrition Supports in FFY17, by County
COUNTY PSE Nutrition Support No.
Markets LIA Role
Coconino New farmers’ market in Page 1 Participated in related community improvement plan workgroup
Gila Implemented Double Up
Bucks 1 Worked closely with market manager to
establish and promote Double Up Food Bucks with new SNAP EBT system
Greenlee Changed the Clifton farmers’
market day and time 1 Provided ongoing collaboration with
market manager, including providing food demos and promotional support
Mohave Obtained SNAP EBT
equipment 1 Played a high level coordinating role to
support market operations with EBT
Pima Obtained SNAP EBT
equipment 1 Provided technical assistance and training
to obtain and integrate equipment
FFY2017 SNAP-Ed Annual Report 66 January 2018
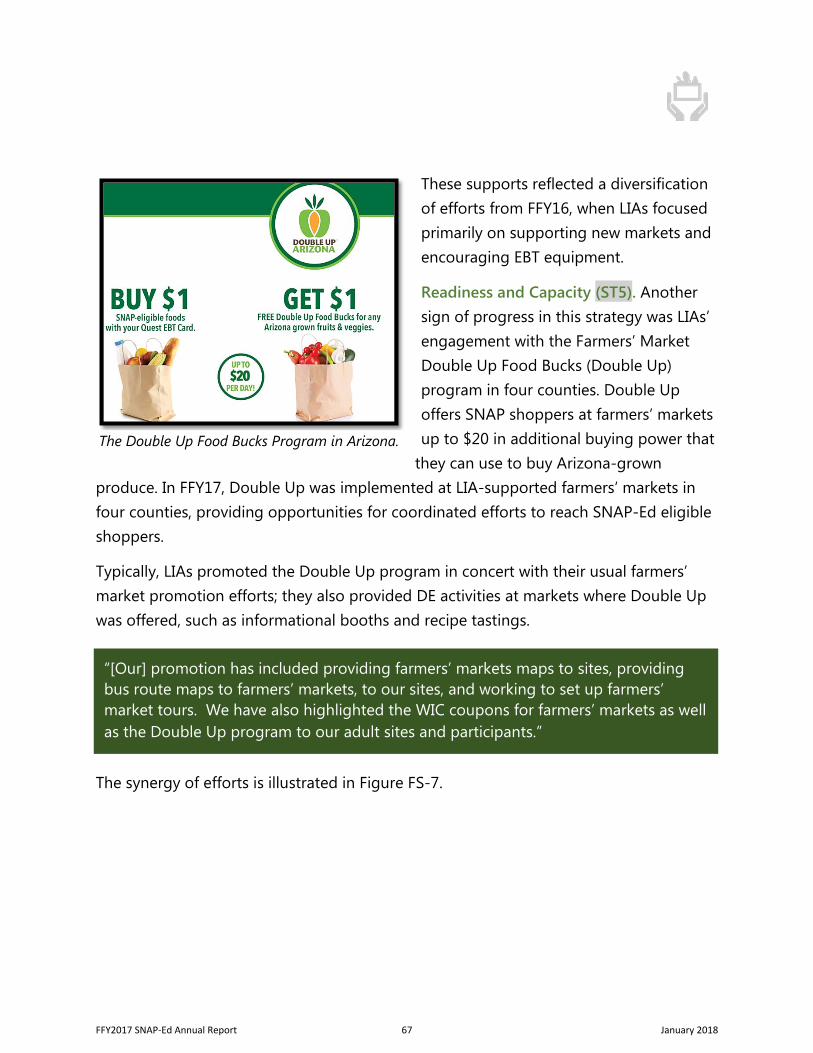
These supports reflected a diversification of efforts from FFY16, when LIAs focused primarily on supporting new markets and encouraging EBT equipment.
Readiness and Capacity (ST5). Another sign of progress in this strategy was LIAs’ engagement with the Farmers’ Market Double Up Food Bucks (Double Up) program in four counties. Double Up offers SNAP shoppers at farmers’ markets up to $20 in additional buying power that
they can use to buy Arizona-grown produce. In FFY17, Double Up was implemented at LIA-supported farmers’ markets in four counties, providing opportunities for coordinated efforts to reach SNAP-Ed eligible shoppers.
Typically, LIAs promoted the Double Up program in concert with their usual farmers’ market promotion efforts; they also provided DE activities at markets where Double Up was offered, such as informational booths and recipe tastings.
The synergy of efforts is illustrated in Figure FS-7.
“[Our] promotion has included providing farmers’ markets maps to sites, providing bus route maps to farmers’ markets, to our sites, and working to set up farmers’ market tours. We have also highlighted the WIC coupons for farmers’ markets as well as the Double Up program to our adult sites and participants.”
The Double Up Food Bucks Program in Arizona.
FFY2017 SNAP-Ed Annual Report 67 January 2018
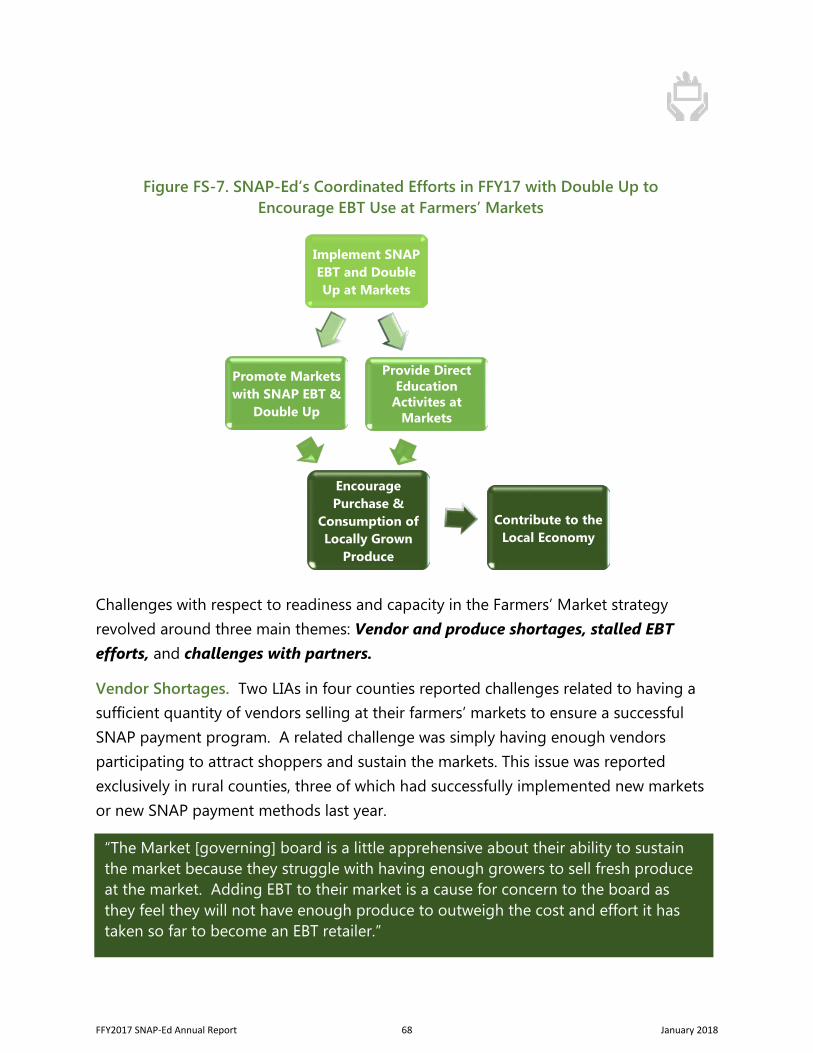
Challenges with respect to readiness and capacity in the Farmers’ Market strategy revolved around three main themes: Vendor and produce shortages, stalled EBT efforts, and challenges with partners.
Vendor Shortages. Two LIAs in four counties reported challenges related to having a sufficient quantity of vendors selling at their farmers’ markets to ensure a successful SNAP payment program. A related challenge was simply having enough vendors participating to attract shoppers and sustain the markets. This issue was reported exclusively in rural counties, three of which had successfully implemented new markets or new SNAP payment methods last year.
Promote Markets with SNAP EBT &
Double Up
Implement SNAP EBT and Double Up at Markets
Provide Direct Education
Activites at Markets
Encourage Purchase &
Consumption of Locally Grown
Produce
Contribute to the Local Economy
Figure FS-7. SNAP-Ed’s Coordinated Efforts in FFY17 with Double Up to Encourage EBT Use at Farmers’ Markets
“The Market [governing] board is a little apprehensive about their ability to sustain the market because they struggle with having enough growers to sell fresh produce at the market. Adding EBT to their market is a cause for concern to the board as they feel they will not have enough produce to outweigh the cost and effort it has taken so far to become an EBT retailer.”
FFY2017 SNAP-Ed Annual Report 68 January 2018
In one county, the LIA is responding to vendor shortages by leveraging partnerships with the local economic development corporation as well as their relationships with farmers’ markets in other counties to encourage the participation of more vendors.
Stalled EBT Efforts. After gaining momentum with market managers in FFY16, LIAs in four counties reported that their efforts to encourage application for EBT equipment had stalled. Again, these challenges were reported in rural counties and were in some cases related to concomitant challenges in attracting enough vendors to the markets.
Other challenges relating to advancing progress in implementing EBT at more markets included unfamiliarity with the application process and wariness regarding the potential bureaucracy.
Promotion with DES. LIAs in two counties reported barriers with promoting farmers’ markets at DES offices, while no LIAs mentioned this barrier in FFY16. The change may reflect LIAs’ progressing efforts to promote farmers’ markets with additional partners in year two of the work plan cycle. LIAs’ reported experiences with DES suggested that the local offices were unaware of or seemingly unwilling to partner with SNAP-Ed on farmers’ market promotion, in contrast to strong state-level collaboration between the two programs. This is an area in which LIAs requested AZ Health Zone’s support in making connections and contacts with local offices.
“The stress of the out-of-state move by the largest produce vendor at the Farmers’ Market was felt by all. The region is not easily accessible by larger growers located outside of the county, and refrigerated transportation options are also limited among those growers that the markets would typically recruit.”
“The team has found it challenging to make contact with DES and WIC office managers. The team is looking to present to office staff that work directly with clients to educate and promote the use of EBT at farmers’ markets and gardening. Many of these staff are unaware that this is possible.”
FFY2017 SNAP-Ed Annual Report 69 January 2018
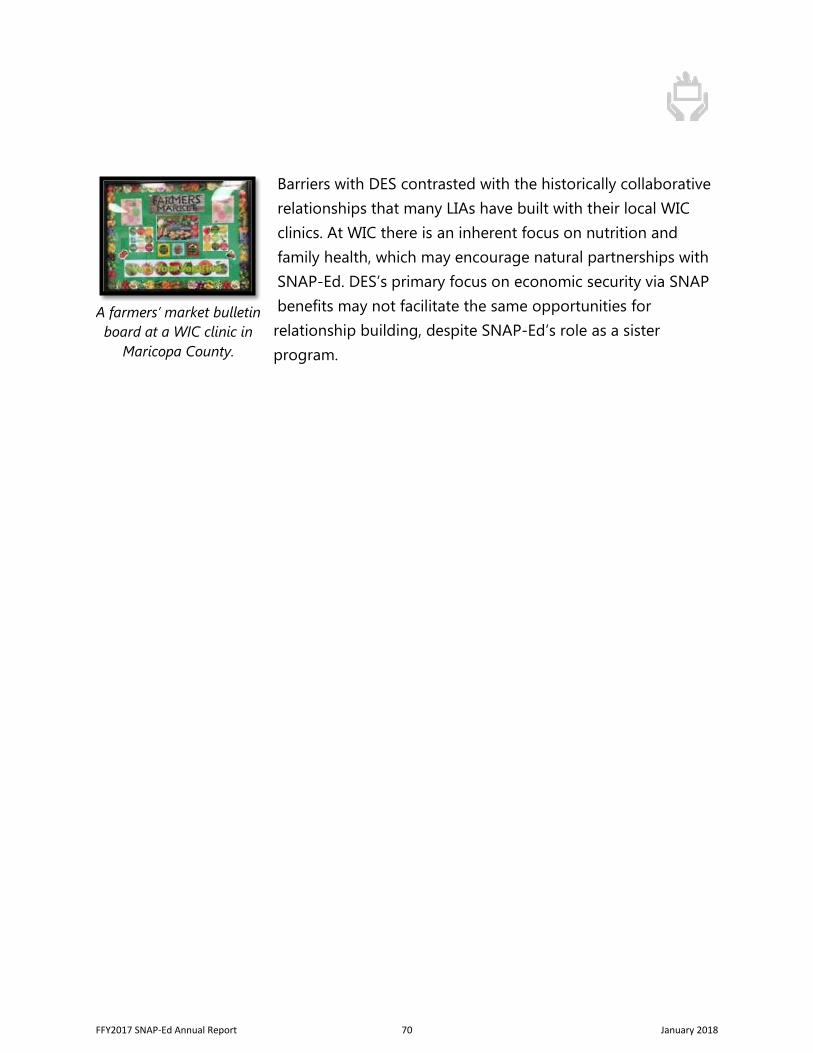
Barriers with DES contrasted with the historically collaborative relationships that many LIAs have built with their local WIC clinics. At WIC there is an inherent focus on nutrition and family health, which may encourage natural partnerships with SNAP-Ed. DES’s primary focus on economic security via SNAP benefits may not facilitate the same opportunities for relationship building, despite SNAP-Ed’s role as a sister program.
A farmers’ market bulletin board at a WIC clinic in
Maricopa County.
FFY2017 SNAP-Ed Annual Report 70 January 2018
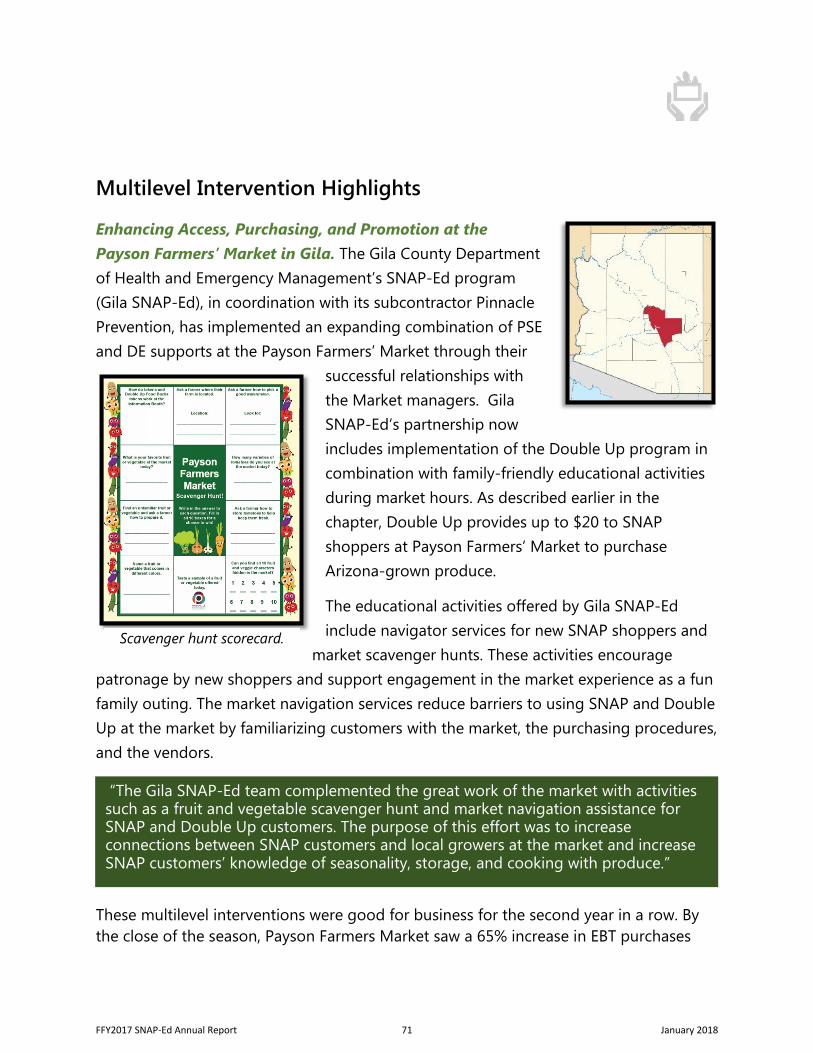
Multilevel Intervention Highlights
Enhancing Access, Purchasing, and Promotion at the Payson Farmers’ Market in Gila. The Gila County Department of Health and Emergency Management’s SNAP-Ed program (Gila SNAP-Ed), in coordination with its subcontractor Pinnacle Prevention, has implemented an expanding combination of PSE and DE supports at the Payson Farmers’ Market through their
successful relationships with the Market managers. Gila SNAP-Ed’s partnership now includes implementation of the Double Up program in combination with family-friendly educational activities during market hours. As described earlier in the chapter, Double Up provides up to $20 to SNAP shoppers at Payson Farmers’ Market to purchase Arizona-grown produce.
The educational activities offered by Gila SNAP-Ed include navigator services for new SNAP shoppers and
market scavenger hunts. These activities encourage patronage by new shoppers and support engagement in the market experience as a fun family outing. The market navigation services reduce barriers to using SNAP and Double Up at the market by familiarizing customers with the market, the purchasing procedures, and the vendors.
These multilevel interventions were good for business for the second year in a row. By the close of the season, Payson Farmers Market saw a 65% increase in EBT purchases
“The Gila SNAP-Ed team complemented the great work of the market with activities such as a fruit and vegetable scavenger hunt and market navigation assistance for SNAP and Double Up customers. The purpose of this effort was to increase connections between SNAP customers and local growers at the market and increase SNAP customers’ knowledge of seasonality, storage, and cooking with produce.”
Scavenger hunt scorecard.
FFY2017 SNAP-Ed Annual Report 71 January 2018
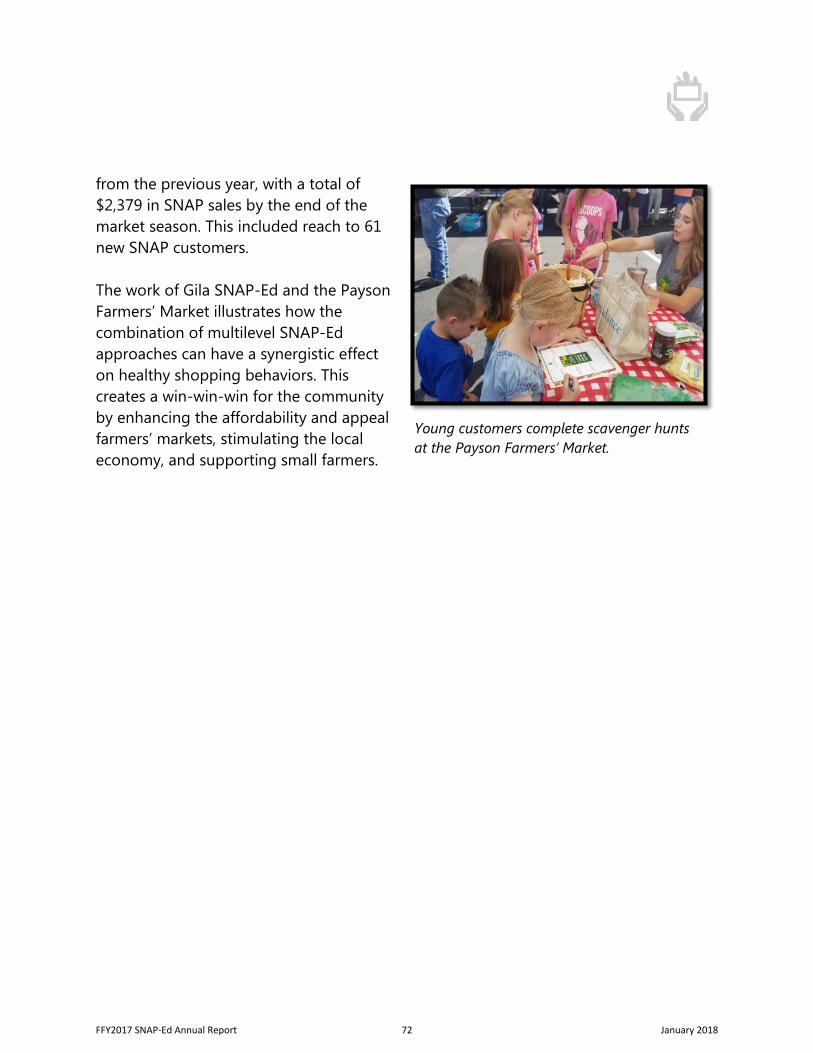
from the previous year, with a total of $2,379 in SNAP sales by the end of the market season. This included reach to 61 new SNAP customers.
The work of Gila SNAP-Ed and the Payson Farmers’ Market illustrates how the combination of multilevel SNAP-Ed approaches can have a synergistic effect on healthy shopping behaviors. This creates a win-win-win for the community by enhancing the affordability and appeal farmers’ markets, stimulating the local economy, and supporting small farmers.
Young customers complete scavenger hunts at the Payson Farmers’ Market.
FFY2017 SNAP-Ed Annual Report 72 January 2018
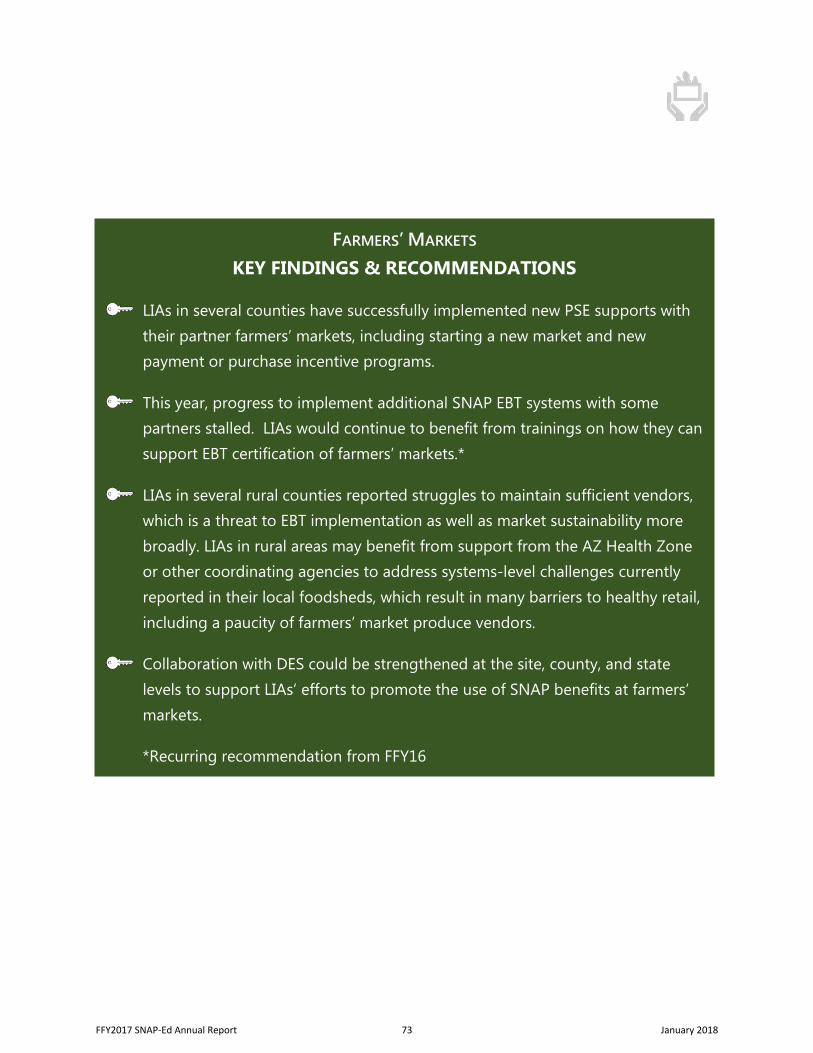
FARMERS’ MARKETS KEY FINDINGS & RECOMMENDATIONS
LIAs in several counties have successfully implemented new PSE supports with their partner farmers’ markets, including starting a new market and new payment or purchase incentive programs.
This year, progress to implement additional SNAP EBT systems with some partners stalled. LIAs would continue to benefit from trainings on how they can support EBT certification of farmers’ markets.*
LIAs in several rural counties reported struggles to maintain sufficient vendors, which is a threat to EBT implementation as well as market sustainability more broadly. LIAs in rural areas may benefit from support from the AZ Health Zone or other coordinating agencies to address systems-level challenges currently reported in their local foodsheds, which result in many barriers to healthy retail, including a paucity of farmers’ market produce vendors.
Collaboration with DES could be strengthened at the site, county, and state levels to support LIAs’ efforts to promote the use of SNAP benefits at farmers’ markets.
*Recurring recommendation from FFY16
FFY2017 SNAP-Ed Annual Report 73 January 2018
References 1. Dinour LM, Bergen D, Yeh M. The food insecurity–obesity paradox: a review of the literature
and the role food stamps may play. J Am Diet Assoc. 2006; 107:1952-1961. 2. US Census Bureau. American community survey, 2011-15. Available at:
http://www.census.gov/programs-surveys/acs/. 3. U.S. Centers for Disease Control and Prevention. The Behavioral Risk Factor Surveillance
System, Survey Data and Documentation. 2016. Available at: https://www.cdc.gov/brfss/data_documentation/index.htm.
4. USDA, Economic Research Service. USDA - Food access research atlas; 2010. Available at: https://www.ers.usda.gov/data-products/food-access-research-atlas.
5. The Food Trust. Access to healthy food and why it matters: a review of the research. 2013. Available at: http://healthyfoodaccess.org/sites/default/files/GROCERYGAP_FINAL_NOV2013_0.pdf
6. ADHS, Food Safety and Environmental Services. School Garden Program. 2017. Available at: http://www.azdhs.gov/preparedness/epidemiology-disease-control/food-safety-environmental-services/index.php
7. USDA, Food and Nutrition Service. The Supplemental Nutrition Assistance Program Education (SNAP-Ed) Evaluation Framework: Nutrition, physical activity, and obesity prevention indicators: Interpretive guide to the SNAP-Ed evaluation framework. 2016. Available at https://snaped.fns.usda.gov.
8. Dannefer R, Williams DA, Baronberg S et al. Healthy bodegas: Increasing and promoting healthy foods at corner stores in New York City. Am J Public Health. 2012; 102(10): e27–e31.
9. Kaiser Permanente. Measuring and increasing the “dose” of community health interventions. 2012. Available at: https://share.kaiserpermanente.org/media_assets/pdf/communitybenefit/assets/pdf/our_work/global/chi/CHI%20dose%20guide%206.2012.pdf.
10. Gittelsohn J, Laska MN, Karpyn A, et al. Lessons learned from small store programs to increase healthy food access. Am J Health Behav. 2014;38(2):307-15.
11. Showers, K. Elementary School Garden has grand opening in Duncan. The Copper Era. October 6, 2017. Available at: http://www.eacourier.com/copper_era/news/elementary-school-garden-has-grand-opening-in-duncan/article_7381e00e-a948-11e7-9fe9-3fc4eba371e3.html.
12. Arizona Department of Health Services, AZ Health Zone. Summer Lunch Buddies. 2017. Available at: https://www.eatwellbewell.org/summerfood#summer-lunch-buddies.
13. Jacobs L, LeGros T, Orzech K. Arizona Nutrition Network FFY16 Annual Evaluation Report. 2016. Available at: https://nutritioneval.arizona.edu/results.
FFY2017 SNAP-Ed Annual Report 74 January 2018
Active Living
Background
Arizona’s SNAP-Ed program has embraced work in the area of active living in order to improve the physical activity environment to specifically benefit our SNAP-eligible population - the 13.3% of families in the state living in poverty.1 In this predominantly rural state, it can be difficult to find information about the physical activity environment for small communities. However in FFY17, researchers at the University of Arizona Norton School of Family and Consumer Sciences prepared hyper-local community profiles for small rural communities across the state. According to these profiles, the percentage of the population able to walk to a public park (measured as a walk of ½-mile or less) in lower-income rural towns in Arizona averages 23% (range 0– 72%).2 In Maricopa and Pima counties, home to the state’s largest cities, the percentage of the city population within a 10-minute walk from a park is, on average, 59%.3 These statistics reflect poor access to physical activity resources, especially for the 7% of Arizona households that lack a vehicle.4 These data suggest that supporting ongoing active living opportunities as well as mobilizing communities to advocate for changes to active living policies in Arizona are vital for reducing statewide rates of overweight and obesity.
Active living initiatives supported by Arizona SNAP-Ed to address these challenges encompass four distinct, yet intersecting strategies:
1. Strengthening Active Living Policy at the community level and building the capacityof community organizations to effect change. Key efforts in this area include: 1)understanding the policy landscape and determining where SNAP-Ed efforts can bemost effective, and 2) building capacity among both SNAP-Ed staff and communitypartners through trainings and technical assistance to affect active living policy.
FFY2017 SNAP-Ed Annual Report 75 January 2018
2. Promoting participation in and use of local Physical Activity Resources. Thisstrategy includes: 1) identifying, promoting, and enhancing free and low-costphysical activity (PA) resources, and 2) building partnerships with parks and trailsorganizations and other community organizations to promote and enhance PAresources.
3. Supporting Family-Friendly Physical Activity Opportunities. Key efforts in this areainclude: 1) building partnerships with other organizations invested in active living forfamilies at the community level, such as biking clubs and organizations that promoteneighborhood walkability, and 2) increasing capacity among SNAP-Ed staff to planand/or lead PA event efforts in order to maximize participation by and benefit toSNAP-eligible individuals.
4. Using Point-of-Decision Prompts to Encourage Use of Stairs. Point-of-decision(POD) prompts encourage individuals to increase functional activity in smallincrements throughout the day by choosing stairs over elevators. Prompts such asthese in SNAP-Ed settings can support other PSE changes that encourage PA.
Below, Active Living short-term (ST5, ST6, ST7, ST8) and medium-term (MT6) outcomes in FFY17 are reported in alignment with the National SNAP-Ed Evaluation Framework.
Active Living Policy
Methods Progress toward local implementing agency (LIA) goals in active living policy were evaluated using quantitative analysis in Excel of LIA semi-annual report tables (SARTs) and qualitative analysis of text from LIA semi-annual report narratives (SARNs). NVivo v11.0 software facilitated coding and theme analysis of SARN text. Findings were considered in terms of LIA strengths and challenges regarding active living policy-related activities, including building readiness and capacity (ST5), cultivating champions (ST6), strengthening multi-sector partnerships (ST8), and increasing physical activity and reduced sedentary behavior supports (MT6).
FFY2017 SNAP-Ed Annual Report 76 January 2018
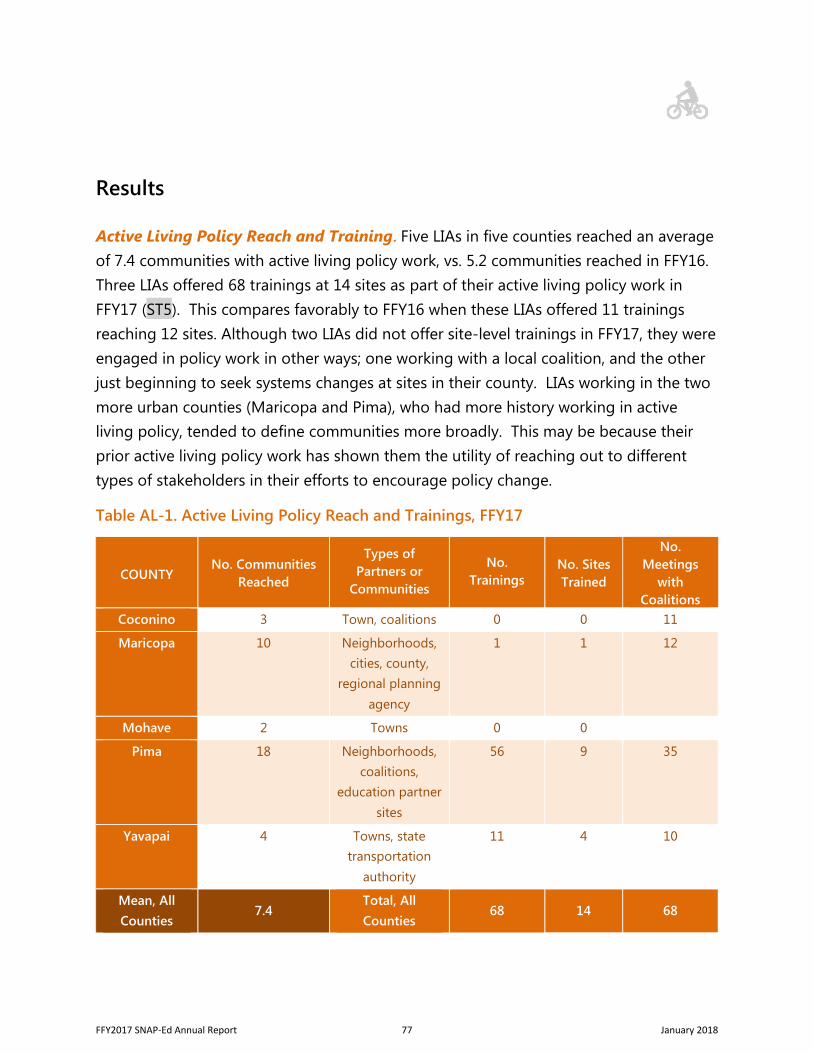
Results
Active Living Policy Reach and Training. Five LIAs in five counties reached an average of 7.4 communities with active living policy work, vs. 5.2 communities reached in FFY16. Three LIAs offered 68 trainings at 14 sites as part of their active living policy work in FFY17 (ST5). This compares favorably to FFY16 when these LIAs offered 11 trainings reaching 12 sites. Although two LIAs did not offer site-level trainings in FFY17, they were engaged in policy work in other ways; one working with a local coalition, and the other just beginning to seek systems changes at sites in their county. LIAs working in the two more urban counties (Maricopa and Pima), who had more history working in active living policy, tended to define communities more broadly. This may be because their prior active living policy work has shown them the utility of reaching out to different types of stakeholders in their efforts to encourage policy change.
Table AL-1. Active Living Policy Reach and Trainings, FFY17
COUNTY No. Communities
Reached
Types of Partners or
Communities
No. Trainings
No. Sites Trained
No. Meetings
with Coalitions
Coconino 3 Town, coalitions 0 0 11
Maricopa 10 Neighborhoods, cities, county,
regional planning agency
1 1 12
Mohave 2 Towns 0 0
Pima 18 Neighborhoods, coalitions,
education partner sites
56 9 35
Yavapai 4 Towns, state transportation
authority
11 4 10
Mean, All Counties
7.4 Total, All Counties
68 14 68
FFY2017 SNAP-Ed Annual Report 77 January 2018
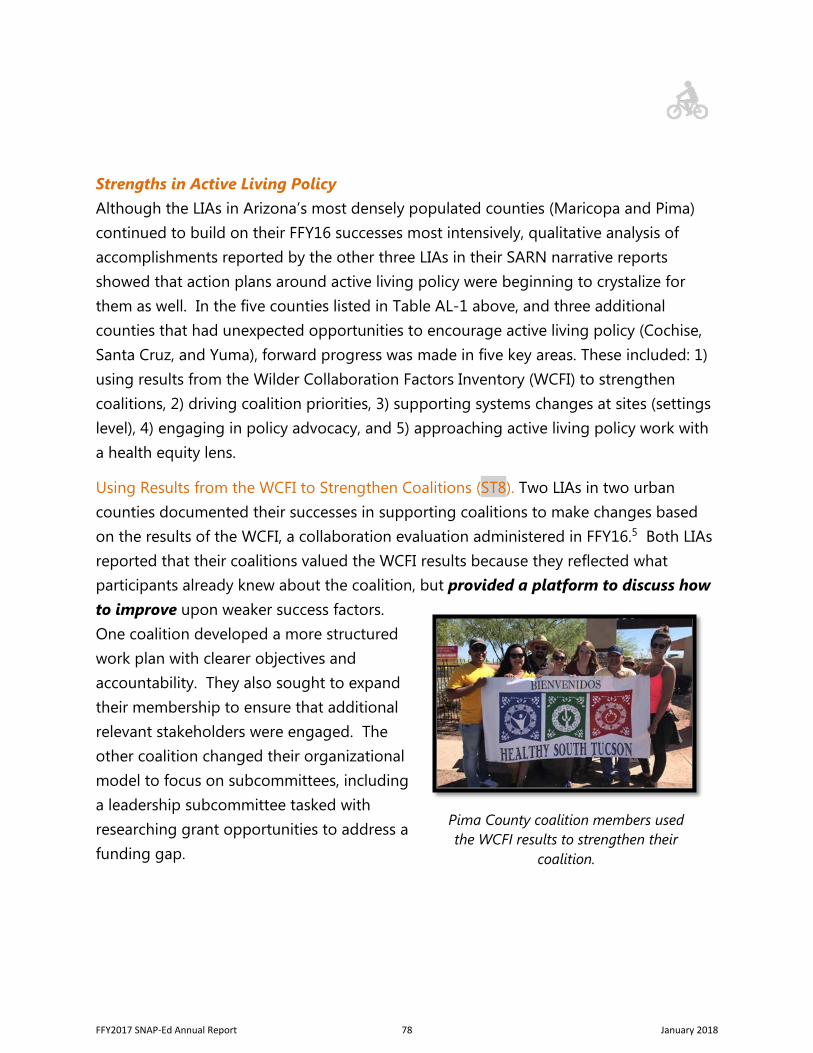
Strengths in Active Living Policy Although the LIAs in Arizona’s most densely populated counties (Maricopa and Pima) continued to build on their FFY16 successes most intensively, qualitative analysis of accomplishments reported by the other three LIAs in their SARN narrative reports showed that action plans around active living policy were beginning to crystalize for them as well. In the five counties listed in Table AL-1 above, and three additional counties that had unexpected opportunities to encourage active living policy (Cochise, Santa Cruz, and Yuma), forward progress was made in five key areas. These included: 1) using results from the Wilder Collaboration Factors Inventory (WCFI) to strengthen coalitions, 2) driving coalition priorities, 3) supporting systems changes at sites (settings level), 4) engaging in policy advocacy, and 5) approaching active living policy work with a health equity lens.
Using Results from the WCFI to Strengthen Coalitions (ST8). Two LIAs in two urban counties documented their successes in supporting coalitions to make changes based on the results of the WCFI, a collaboration evaluation administered in FFY16.5 Both LIAs reported that their coalitions valued the WCFI results because they reflected what participants already knew about the coalition, but provided a platform to discuss how to improve upon weaker success factors. One coalition developed a more structured work plan with clearer objectives and accountability. They also sought to expand their membership to ensure that additional relevant stakeholders were engaged. The other coalition changed their organizational model to focus on subcommittees, including a leadership subcommittee tasked with researching grant opportunities to address a funding gap.
Pima County coalition members used the WCFI results to strengthen their
coalition.
FFY2017 SNAP-Ed Annual Report 78 January 2018
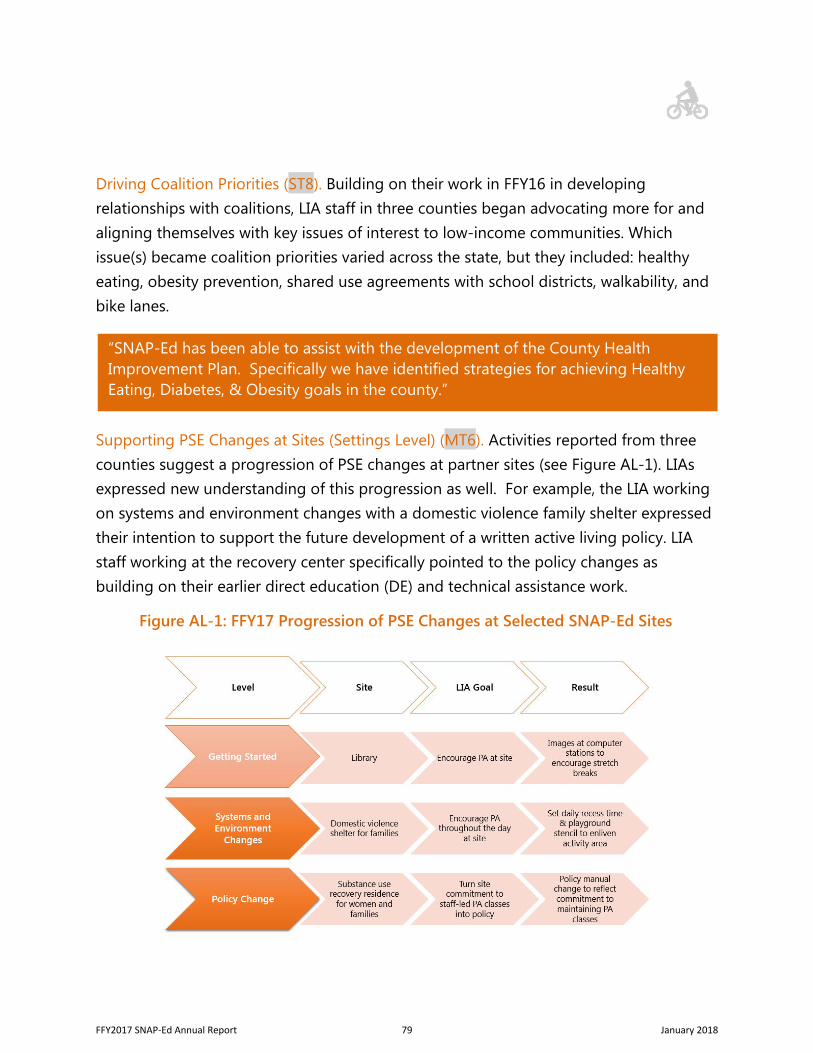
Driving Coalition Priorities (ST8). Building on their work in FFY16 in developing relationships with coalitions, LIA staff in three counties began advocating more for and aligning themselves with key issues of interest to low-income communities. Which issue(s) became coalition priorities varied across the state, but they included: healthy eating, obesity prevention, shared use agreements with school districts, walkability, and bike lanes.
Supporting PSE Changes at Sites (Settings Level) (MT6). Activities reported from three counties suggest a progression of PSE changes at partner sites (see Figure AL-1). LIAs expressed new understanding of this progression as well. For example, the LIA working on systems and environment changes with a domestic violence family shelter expressed their intention to support the future development of a written active living policy. LIA staff working at the recovery center specifically pointed to the policy changes as building on their earlier direct education (DE) and technical assistance work.
“SNAP-Ed has been able to assist with the development of the County Health Improvement Plan. Specifically we have identified strategies for achieving Healthy Eating, Diabetes, & Obesity goals in the county.”
Figure AL-1: FFY17 Progression of PSE Changes at Selected SNAP-Ed Sites
FFY2017 SNAP-Ed Annual Report 79 January 2018
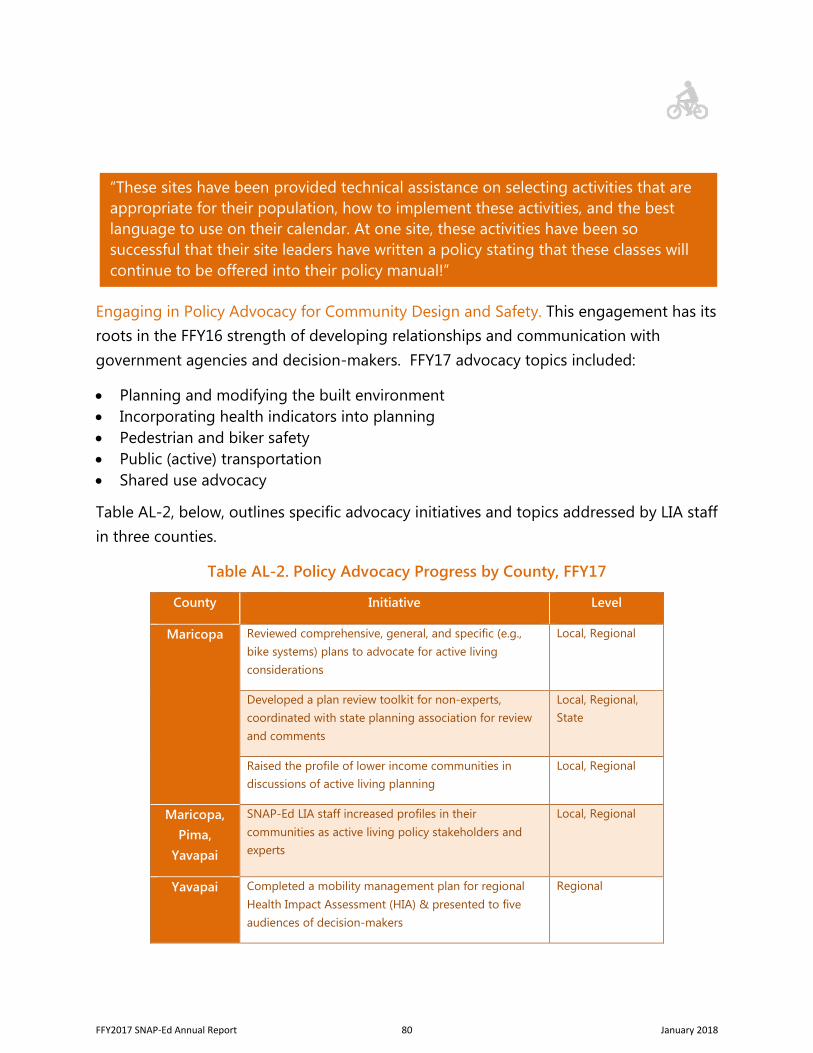
Engaging in Policy Advocacy for Community Design and Safety. This engagement has its roots in the FFY16 strength of developing relationships and communication with government agencies and decision-makers. FFY17 advocacy topics included:
• Planning and modifying the built environment • Incorporating health indicators into planning • Pedestrian and biker safety • Public (active) transportation • Shared use advocacy
Table AL-2, below, outlines specific advocacy initiatives and topics addressed by LIA staff in three counties.
Table AL-2. Policy Advocacy Progress by County, FFY17
County Initiative Level
Maricopa
Reviewed comprehensive, general, and specific (e.g., bike systems) plans to advocate for active living considerations
Local, Regional
Developed a plan review toolkit for non-experts, coordinated with state planning association for review and comments
Local, Regional, State
Raised the profile of lower income communities in discussions of active living planning
Local, Regional
Maricopa, Pima,
Yavapai
SNAP-Ed LIA staff increased profiles in their communities as active living policy stakeholders and experts
Local, Regional
Yavapai Completed a mobility management plan for regional Health Impact Assessment (HIA) & presented to five audiences of decision-makers
Regional
“These sites have been provided technical assistance on selecting activities that are appropriate for their population, how to implement these activities, and the best language to use on their calendar. At one site, these activities have been so successful that their site leaders have written a policy stating that these classes will continue to be offered into their policy manual!”
FFY2017 SNAP-Ed Annual Report 80 January 2018
In addition to the advocacy activities mentioned above, state legislative representatives called on staff at one urban county LIA as experts to take part in a discussion of community health concerns. This was an encouraging sign for both the LIA and the progress of active living policy at the state level. LIA staff turned the opportunity to speak at the meeting into a chance to inform active living policy work at the state level, speaking directly to legislators about the realities of safe physical activity spaces in many lower-income communities.
Approaching Active Living Work with a Health Equity Lens. The two urban LIAs continued to demonstrate strength in active living policy, specifically by focusing more on the ways that active living improvements in cities and towns had the potential to improve health equity. This theme is distinct from driving coalition priorities, because in this case, LIAs are not just infusing low-income concerns into coalition work, but reaching out to decision makers, influencers and governing bodies to encourage them to engage more deeply in similar considerations (ST5). This health equity focus showed positive results in FFY17, including a commitment from a regional transportation authority to be more inclusive.
For the second urban LIA, active living policy was a way to tie their historic focus on health equity as an agency more strongly to their SNAP-Ed work specifically. Through a project focused on tree planting and maintenance, and leveraged by another grant, the LIA agency was able to:
• Expand their active living programming by mobilizing the community around tree-planting events and community clean-ups.
“…As part of this session we discussed the barriers that low-income communities face in getting enough physical activity, specifically the lack of safe spaces for people to be active in their neighborhoods. We also used this discussion to highlight the opportunities for system and environmental changes that the state could help to implement in order to overcome these challenges.”
“The presentation initiated a good discussion and [the transportation authority] indicated that it wants to involve underserved populations in the planning process and ensure that the county bike and pedestrian network serves all users. We will continue to be part of this process and will provide [the authority] with a list of organizations/groups we are already working with for their outreach.”
FFY2017 SNAP-Ed Annual Report 81 January 2018
• Support community walkability in the long term through provision of shadier places to walk.
• Seek equity in shade cover in their targeted neighborhood by aiming to match the city’s overall average percentage of shade cover.
Challenges in Active Living Policy Challenges in active living policy centered on several perennial and related themes: 1) lack of funding for infrastructure improvements, 2) a desire for more community involvement, 3) a lack of site champions and 4) a need for more outreach to policy-makers.
The theme regarding lack of funding for infrastructure improvements recurred from FFY16, but in FFY17, it was specifically linked to a second theme, a desire for more community involvement, and a concern that a lack of funding could cause community partners to feel that their mobilization and advocacy efforts were in vain. As LIAs invest more time and effort in policy advocacy and bringing community concerns to their coalitions and decision-makers, a lack of funding for needed active living enhancements is a critical concern. If LIAs encourage community involvement but then as a result, nothing changes, residents may be less likely to become involved in the future.
A third challenge, which builds on the challenge raised in FFY16 of competing site priorities, was concern about a lack of site champions (ST6) who would be able to take over systems changes and policy advocacy efforts when the SNAP-Ed LIA staff stepped away. One LIA raised a related concern when they found that, despite success in their efforts to encourage a coalition in which they participated to work on a joint use agreement with a local school district, the selected school district did not have a
“During FFY17, [our partner] moved away from providing Neighborhood Walkability Assessments. They noted frustration from participants that upon completion of an assessment, there was a lack of funds to finance the solutions needed to overcome the walking challenges of the neighborhood. After the county bond that included funds for walking and biking infrastructure failed to pass, they decided to move away from actively seeking neighborhoods for assessment.”
FFY2017 SNAP-Ed Annual Report 82 January 2018
relationship with the LIA specifically. This required the development of new relationships to allow the LIA to support joint-use activities with the district over the longer term.
Finally, one LIA identified a need for additional outreach to policy-makers (ST6) as a critical challenge in securing support, and ultimately funding, for active living efforts.
In all PSE areas, but particularly
active living, where momentum
is still building in Arizona,
making change is a complicated
balancing act. SNAP-Ed LIA
staff find that they must
understand the interests in their
communities related to the
active living environment, and then package those interests in a way that also appeals to
decision-makers at local, regional, and state levels. Those decision-makers may have
multiple, competing priorities, so the meta-challenge is to provide education to
decision-makers that aligns with multiple priorities, and emphasizes the ways in which
active living improvements in lower-income areas have multiple benefits. SNAP-Ed
LIA staff who provide consistent messaging and information to decision-makers can
prime them for when a window of active living opportunity opens.
Although research indicates people prefer to live in walkable communities with large amounts of open space, city/county officials continue to advocate for fast-moving streets with less walkability and bikeability. Also, this tends to be the less expensive avenue so it takes even more convincing to push through complete streets and other important built environment policies.”
FFY2017 SNAP-Ed Annual Report 83 January 2018
ACTIVE LIVING POLICY KEY FINDINGS AND RECOMMENDATIONS
LIAs built on the relationships they developed in FFY16 with government agencies, community groups, and SNAP-qualified sites, and in FFY17 expanded their active living policy work to strengthen coalitions, encourage systems change at sites, engage in policy advocacy, and view active living policy work through a health equity lens.
LIAs should continue to build on success in both strengthening coalitions and driving coalition priorities, seeking to influence decision-makers to view active living policy issues (such as improved walkability and the value of open space) more favorably.
Using the progression of PSE changes (Figure AL-1) as a guide, LIAs should strive to meet sites where they are in terms site-level systems changes, and encourage physical activity through multilevel interventions that may ultimately evolve into stronger PSEs.
As active living policy work is established, LIAs should consider focusing their efforts on including additional community members in the policy process and/or advocating for health equity through active living policy.
Information should continue to be provided to LIAs about sources of funding for infrastructure improvements that may be targeted at lower-income communities; both small and larger grants may be useful in advancing active living policy goals.*
* Recurring recommendation from FFY16
FFY2017 SNAP-Ed Annual Report 84 January 2018
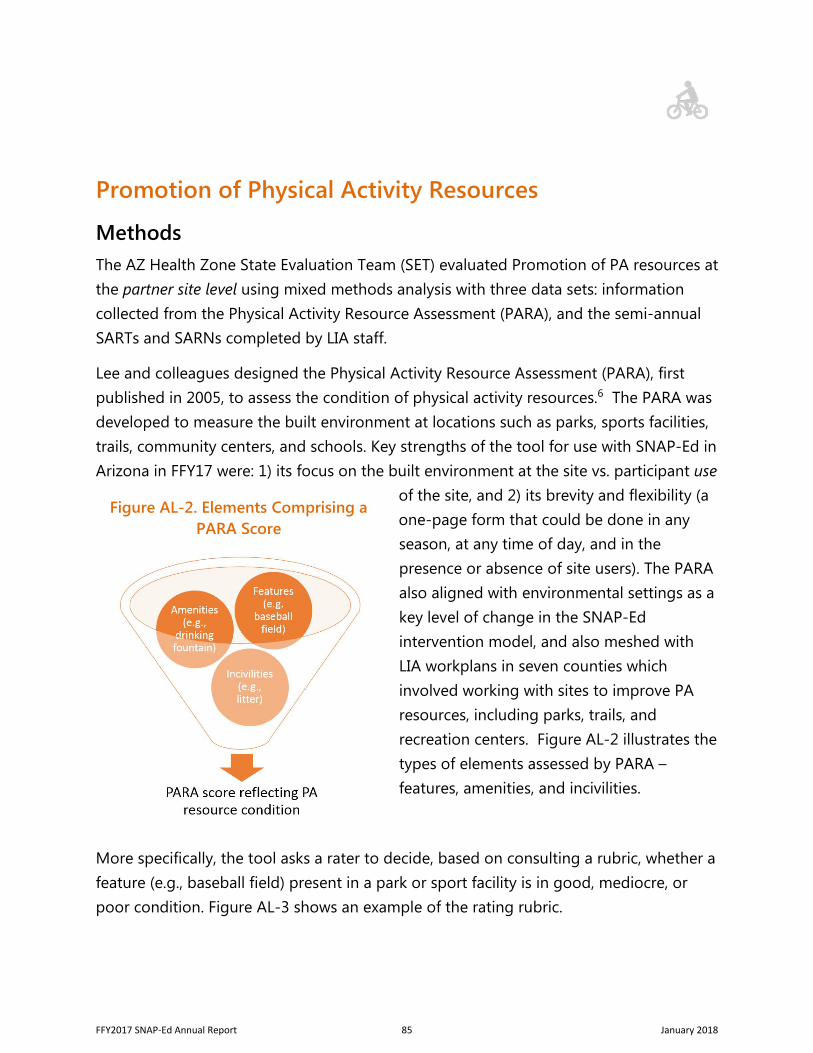
Promotion of Physical Activity Resources
Methods The AZ Health Zone State Evaluation Team (SET) evaluated Promotion of PA resources at the partner site level using mixed methods analysis with three data sets: information collected from the Physical Activity Resource Assessment (PARA), and the semi-annual SARTs and SARNs completed by LIA staff.
Lee and colleagues designed the Physical Activity Resource Assessment (PARA), first published in 2005, to assess the condition of physical activity resources.6 The PARA was developed to measure the built environment at locations such as parks, sports facilities, trails, community centers, and schools. Key strengths of the tool for use with SNAP-Ed in Arizona in FFY17 were: 1) its focus on the built environment at the site vs. participant use
of the site, and 2) its brevity and flexibility (a one-page form that could be done in anyseason, at any time of day, and in the presence or absence of site users). The PARA also aligned with environmental settings as a key level of change in the SNAP-Ed intervention model, and also meshed with LIA workplans in seven counties which involved working with sites to improve PA resources, including parks, trails, and recreation centers. Figure AL-2 illustrates the types of elements assessed by PARA – features, amenities, and incivilities.
More specifically, the tool asks a rater to decide, based on consulting a rubric, whether a feature (e.g., baseball field) present in a park or sport facility is in good, mediocre, or poor condition. Figure AL-3 shows an example of the rating rubric.
Figure AL-2. Elements Comprising a PARA Score
FFY2017 SNAP-Ed Annual Report 85 January 2018
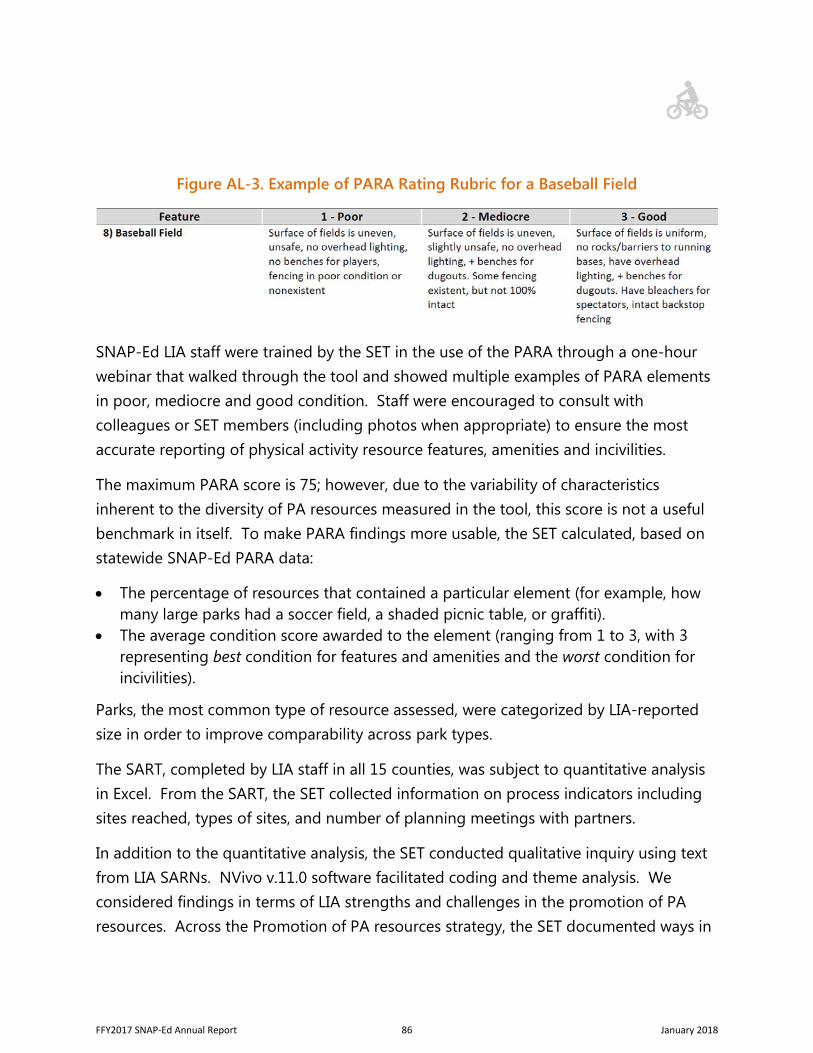
Figure AL-3. Example of PARA Rating Rubric for a Baseball Field
SNAP-Ed LIA staff were trained by the SET in the use of the PARA through a one-hour webinar that walked through the tool and showed multiple examples of PARA elements in poor, mediocre and good condition. Staff were encouraged to consult with colleagues or SET members (including photos when appropriate) to ensure the most accurate reporting of physical activity resource features, amenities and incivilities.
The maximum PARA score is 75; however, due to the variability of characteristics inherent to the diversity of PA resources measured in the tool, this score is not a useful benchmark in itself. To make PARA findings more usable, the SET calculated, based on statewide SNAP-Ed PARA data:
• The percentage of resources that contained a particular element (for example, how many large parks had a soccer field, a shaded picnic table, or graffiti).
• The average condition score awarded to the element (ranging from 1 to 3, with 3 representing best condition for features and amenities and the worst condition for incivilities).
Parks, the most common type of resource assessed, were categorized by LIA-reported size in order to improve comparability across park types.
The SART, completed by LIA staff in all 15 counties, was subject to quantitative analysis in Excel. From the SART, the SET collected information on process indicators including sites reached, types of sites, and number of planning meetings with partners.
In addition to the quantitative analysis, the SET conducted qualitative inquiry using text from LIA SARNs. NVivo v.11.0 software facilitated coding and theme analysis. We considered findings in terms of LIA strengths and challenges in the promotion of PA resources. Across the Promotion of PA resources strategy, the SET documented ways in
FFY2017 SNAP-Ed Annual Report 86 January 2018
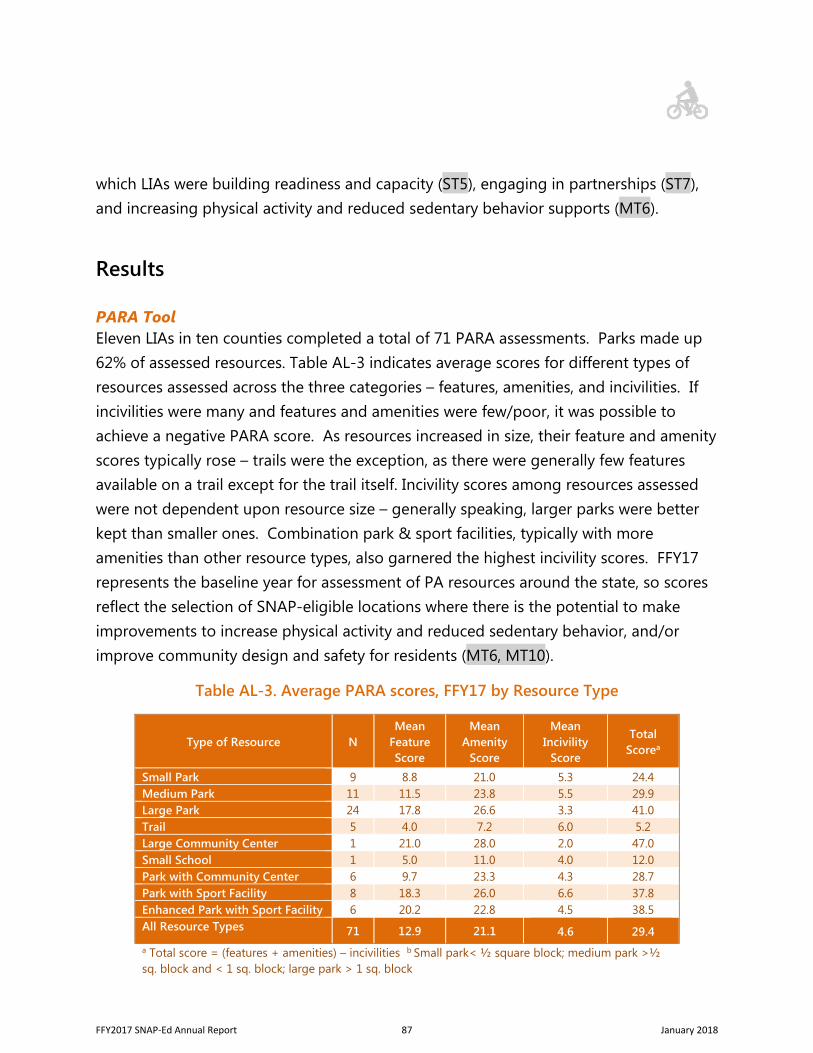
which LIAs were building readiness and capacity (ST5), engaging in partnerships (ST7), and increasing physical activity and reduced sedentary behavior supports (MT6).
Results
PARA Tool Eleven LIAs in ten counties completed a total of 71 PARA assessments. Parks made up 62% of assessed resources. Table AL-3 indicates average scores for different types of resources assessed across the three categories – features, amenities, and incivilities. If incivilities were many and features and amenities were few/poor, it was possible to achieve a negative PARA score. As resources increased in size, their feature and amenity scores typically rose – trails were the exception, as there were generally few features available on a trail except for the trail itself. Incivility scores among resources assessed were not dependent upon resource size – generally speaking, larger parks were better kept than smaller ones. Combination park & sport facilities, typically with more amenities than other resource types, also garnered the highest incivility scores. FFY17 represents the baseline year for assessment of PA resources around the state, so scores reflect the selection of SNAP-eligible locations where there is the potential to make improvements to increase physical activity and reduced sedentary behavior, and/or improve community design and safety for residents (MT6, MT10).
Table AL-3. Average PARA scores, FFY17 by Resource Type
Type of Resource N Mean
Feature Score
Mean Amenity
Score
Mean Incivility
Score
Total Scorea
Small Park 9 8.8 21.0 5.3 24.4 Medium Park 11 11.5 23.8 5.5 29.9 Large Park 24 17.8 26.6 3.3 41.0 Trail 5 4.0 7.2 6.0 5.2 Large Community Center 1 21.0 28.0 2.0 47.0 Small School 1 5.0 11.0 4.0 12.0 Park with Community Center 6 9.7 23.3 4.3 28.7 Park with Sport Facility 8 18.3 26.0 6.6 37.8 Enhanced Park with Sport Facility 6 20.2 22.8 4.5 38.5 All Resource Types 71 12.9 21.1
4.6
29.4 a Total score = (features + amenities) – incivilities b Small park< ½ square block; medium park >½ sq. block and < 1 sq. block; large park > 1 sq. block
FFY2017 SNAP-Ed Annual Report 87 January 2018
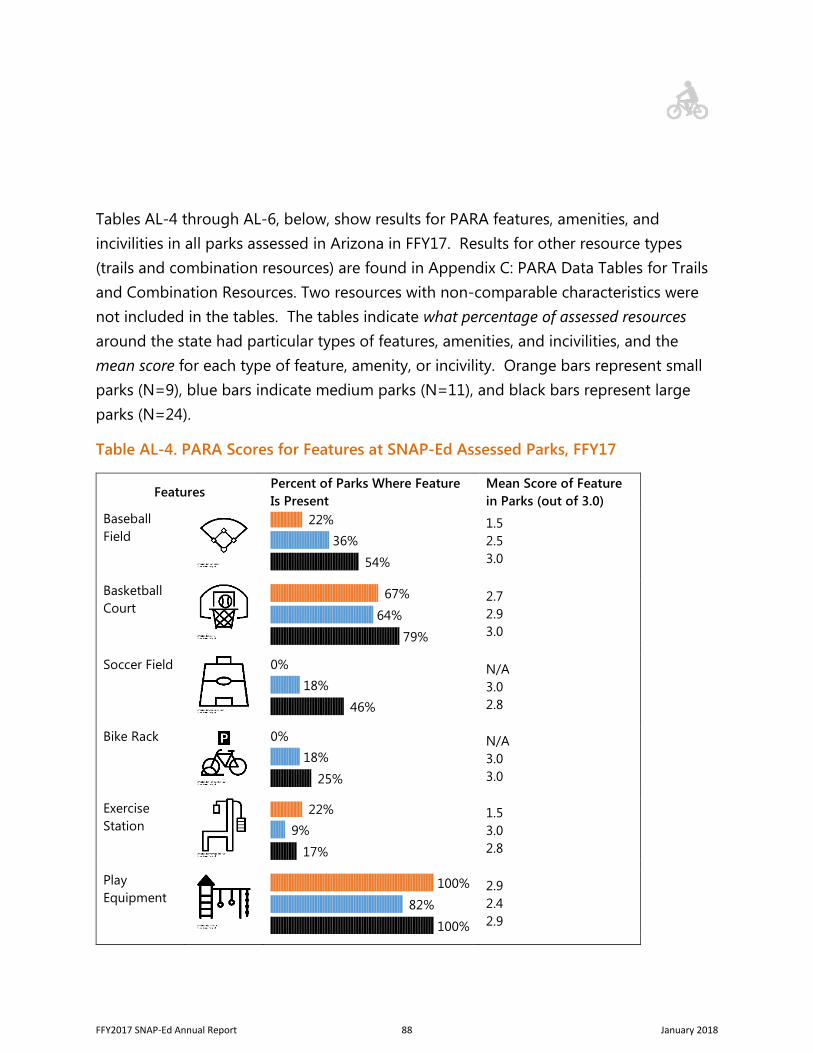
Tables AL-4 through AL-6, below, show results for PARA features, amenities, and incivilities in all parks assessed in Arizona in FFY17. Results for other resource types (trails and combination resources) are found in Appendix C: PARA Data Tables for Trails and Combination Resources. Two resources with non-comparable characteristics were not included in the tables. The tables indicate what percentage of assessed resources around the state had particular types of features, amenities, and incivilities, and the mean score for each type of feature, amenity, or incivility. Orange bars represent small parks (N=9), blue bars indicate medium parks (N=11), and black bars represent large parks (N=24).
Table AL-4. PARA Scores for Features at SNAP-Ed Assessed Parks, FFY17
Features Percent of Parks Where Feature Is Present
Mean Score of Feature in Parks (out of 3.0)
Baseball Field
|||||||||||||||||||||| 22%|||||||||||||||||||||||||||||||||||| 36%
|||||||||||||||||||||||||||||||||||||||||||||||||||||| 54%
1.5 2.5 3.0
Basketball Court
|||||||||||||||||||||||||||||||||||||||||||||||||||||||||||||||||| 67%
||||||||||||||||||||||||||||||||||||||||||||||||||||||||||||||| 64%
||||||||||||||||||||||||||||||||||||||||||||||||||||||||||||||||||||||||||||||| 79%
2.7 2.9 3.0
Soccer Field 0% |||||||||||||||||| 18%
||||||||||||||||||||||||||||||||||||||||||||| 46%
N/A 3.0 2.8
Bike Rack 0% |||||||||||||||||| 18%
||||||||||||||||||||||||| 25%
N/A 3.0 3.0
Exercise Station
|||||||||||||||||||||| 22%||||||||| 9%
|||||||||||||||| 17%
1.5 3.0 2.8
Play Equipment
|||||||||||||||||||||||||||||||||||||||||||||||||||||||||||||||||||||||||||||||||||||||||||||||||||| 100% ||||||||||||||||||||||||||||||||||||||||||||||||||||||||||||||||||||||||||||||||| 82%
|||||||||||||||||||||||||||||||||||||||||||||||||||||||||||||||||||||||||||||||||||||||||||||||||||| 100%
2.9 2.4 2.9
FFY2017 SNAP-Ed Annual Report 88 January 2018
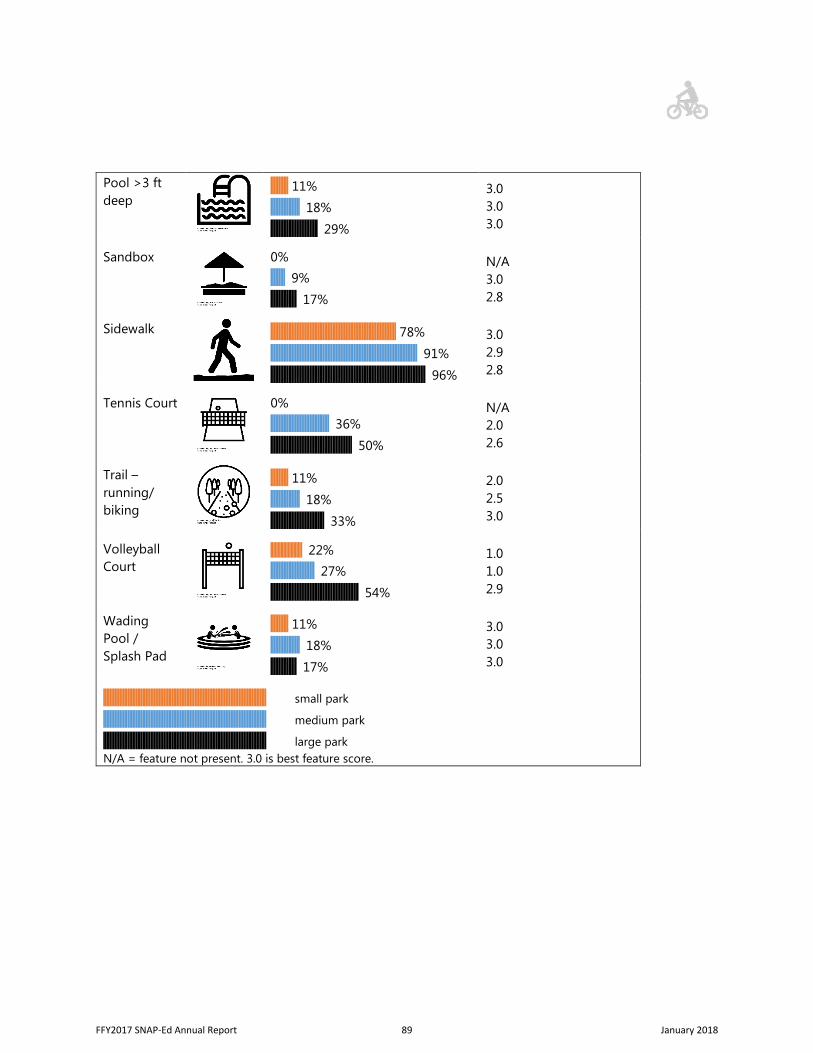
Pool >3 ft deep
||||||||||| 11% |||||||||||||||||| 18%
||||||||||||||||||||||||||||| 29%
3.0 3.0 3.0
Sandbox
0% ||||||||| 9%
|||||||||||||||| 17%
N/A 3.0 2.8
Sidewalk
||||||||||||||||||||||||||||||||||||||||||||||||||||||||||||||||||||||||||||| 78%
|||||||||||||||||||||||||||||||||||||||||||||||||||||||||||||||||||||||||||||||||||||||||| 91%
||||||||||||||||||||||||||||||||||||||||||||||||||||||||||||||||||||||||||||||||||||||||||||||| 96%
3.0 2.9 2.8
Tennis Court
0% |||||||||||||||||||||||||||||||||||| 36%
|||||||||||||||||||||||||||||||||||||||||||||||||| 50%
N/A 2.0 2.6
Trail – running/ biking
||||||||||| 11%
|||||||||||||||||| 18%
||||||||||||||||||||||||||||||||| 33%
2.0 2.5 3.0
Volleyball Court
|||||||||||||||||||||| 22%
||||||||||||||||||||||||||| 27%
|||||||||||||||||||||||||||||||||||||||||||||||||||||| 54%
1.0 1.0 2.9
Wading Pool / Splash Pad
||||||||||| 11% |||||||||||||||||| 18%
|||||||||||||||| 17%
3.0 3.0 3.0
|||||||||||||||||||||||||||||||||||||||||||||||||||||||||||||||||||||||||||||||||||||||||||||||||||| small park
|||||||||||||||||||||||||||||||||||||||||||||||||||||||||||||||||||||||||||||||||||||||||||||||||||| medium park
|||||||||||||||||||||||||||||||||||||||||||||||||||||||||||||||||||||||||||||||||||||||||||||||||||| large park N/A = feature not present. 3.0 is best feature score.
FFY2017 SNAP-Ed Annual Report 89 January 2018
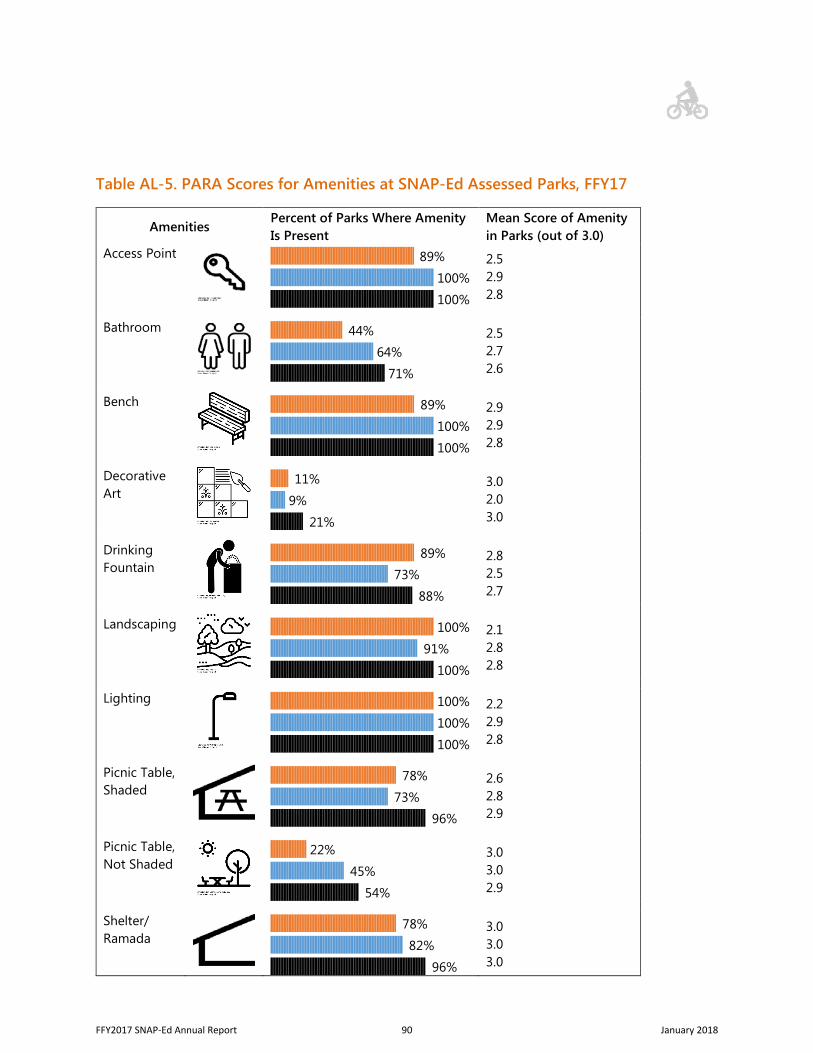
Table AL-5. PARA Scores for Amenities at SNAP-Ed Assessed Parks, FFY17
Amenities Percent of Parks Where Amenity Is Present
Mean Score of Amenity in Parks (out of 3.0)
Access Point
|||||||||||||||||||||||||||||||||||||||||||||||||||||||||||||||||||||||||||||||||||||||| 89% |||||||||||||||||||||||||||||||||||||||||||||||||||||||||||||||||||||||||||||||||||||||||||||||||||| 100%
|||||||||||||||||||||||||||||||||||||||||||||||||||||||||||||||||||||||||||||||||||||||||||||||||||| 100%
2.5 2.9 2.8
Bathroom
|||||||||||||||||||||||||||||||||||||||||||| 44% ||||||||||||||||||||||||||||||||||||||||||||||||||||||||||||||| 64%
|||||||||||||||||||||||||||||||||||||||||||||||||||||||||||||||||||||| 71%
2.5 2.7 2.6
Bench
|||||||||||||||||||||||||||||||||||||||||||||||||||||||||||||||||||||||||||||||||||||||| 89% |||||||||||||||||||||||||||||||||||||||||||||||||||||||||||||||||||||||||||||||||||||||||||||||||||| 100%
|||||||||||||||||||||||||||||||||||||||||||||||||||||||||||||||||||||||||||||||||||||||||||||||||||| 100%
2.9 2.9 2.8
Decorative Art
||||||||||| 11% ||||||||| 9% |||||||||||||||||||| 21%
3.0 2.0 3.0
Drinking Fountain
|||||||||||||||||||||||||||||||||||||||||||||||||||||||||||||||||||||||||||||||||||||||| 89% |||||||||||||||||||||||||||||||||||||||||||||||||||||||||||||||||||||||| 73% ||||||||||||||||||||||||||||||||||||||||||||||||||||||||||||||||||||||||||||||||||||||| 88%
2.8 2.5 2.7
Landscaping
|||||||||||||||||||||||||||||||||||||||||||||||||||||||||||||||||||||||||||||||||||||||||||||||||||| 100% |||||||||||||||||||||||||||||||||||||||||||||||||||||||||||||||||||||||||||||||||||||||||| 91%
|||||||||||||||||||||||||||||||||||||||||||||||||||||||||||||||||||||||||||||||||||||||||||||||||||| 100%
2.1 2.8 2.8
Lighting
|||||||||||||||||||||||||||||||||||||||||||||||||||||||||||||||||||||||||||||||||||||||||||||||||||| 100%
|||||||||||||||||||||||||||||||||||||||||||||||||||||||||||||||||||||||||||||||||||||||||||||||||||| 100%
|||||||||||||||||||||||||||||||||||||||||||||||||||||||||||||||||||||||||||||||||||||||||||||||||||| 100%
2.2 2.9 2.8
Picnic Table, Shaded
||||||||||||||||||||||||||||||||||||||||||||||||||||||||||||||||||||||||||||| 78% |||||||||||||||||||||||||||||||||||||||||||||||||||||||||||||||||||||||| 73% ||||||||||||||||||||||||||||||||||||||||||||||||||||||||||||||||||||||||||||||||||||||||||||||| 96%
2.6 2.8 2.9
Picnic Table, Not Shaded
|||||||||||||||||||||| 22% ||||||||||||||||||||||||||||||||||||||||||||| 45% |||||||||||||||||||||||||||||||||||||||||||||||||||||| 54%
3.0 3.0 2.9
Shelter/ Ramada
||||||||||||||||||||||||||||||||||||||||||||||||||||||||||||||||||||||||||||| 78% ||||||||||||||||||||||||||||||||||||||||||||||||||||||||||||||||||||||||||||||||| 82% ||||||||||||||||||||||||||||||||||||||||||||||||||||||||||||||||||||||||||||||||||||||||||||||| 96%
3.0 3.0 3.0
FFY2017 SNAP-Ed Annual Report 90 January 2018
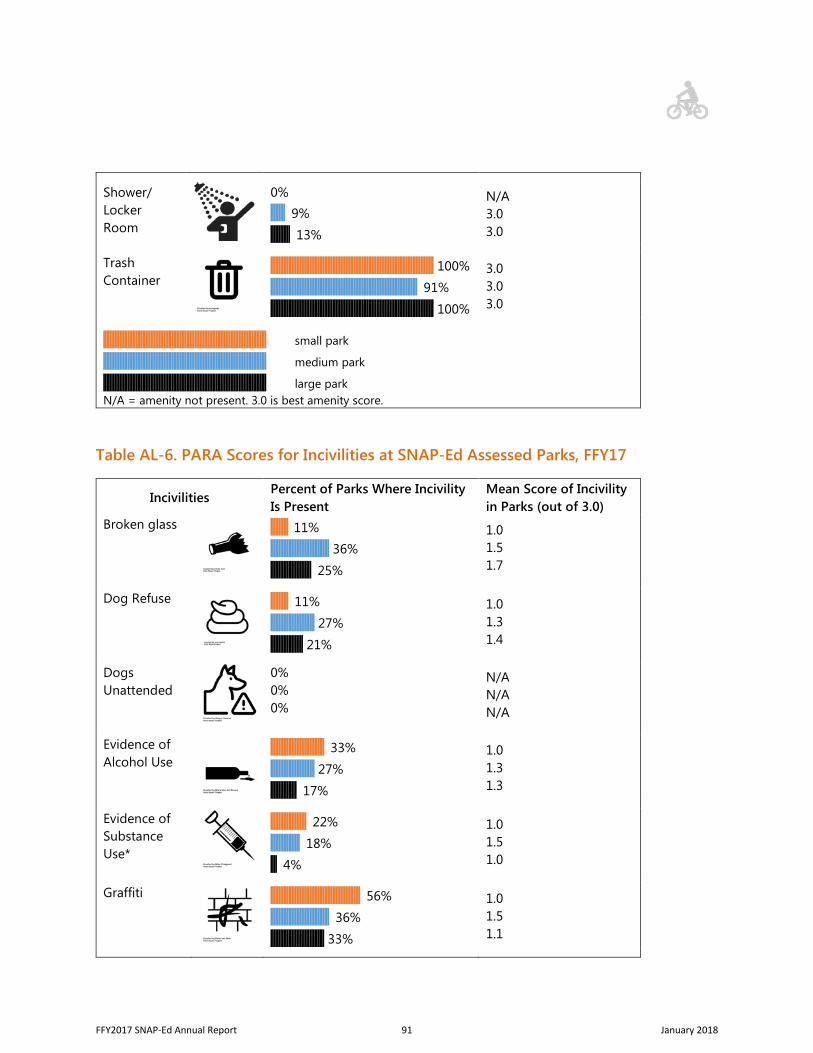
Shower/ Locker Room
0% ||||||||| 9% |||||||||||| 13%
N/A 3.0 3.0
Trash Container
|||||||||||||||||||||||||||||||||||||||||||||||||||||||||||||||||||||||||||||||||||||||||||||||||||| 100%
|||||||||||||||||||||||||||||||||||||||||||||||||||||||||||||||||||||||||||||||||||||||||| 91% |||||||||||||||||||||||||||||||||||||||||||||||||||||||||||||||||||||||||||||||||||||||||||||||||||| 100%
3.0 3.0 3.0
|||||||||||||||||||||||||||||||||||||||||||||||||||||||||||||||||||||||||||||||||||||||||||||||||||| small park
|||||||||||||||||||||||||||||||||||||||||||||||||||||||||||||||||||||||||||||||||||||||||||||||||||| medium park
|||||||||||||||||||||||||||||||||||||||||||||||||||||||||||||||||||||||||||||||||||||||||||||||||||| large parkN/A = amenity not present. 3.0 is best amenity score.
Table AL-6. PARA Scores for Incivilities at SNAP-Ed Assessed Parks, FFY17
Incivilities Percent of Parks Where Incivility Is Present
Mean Score of Incivility in Parks (out of 3.0)
Broken glass ||||||||||| 11% |||||||||||||||||||||||||||||||||||| 36%
||||||||||||||||||||||||| 25%
1.0 1.5 1.7
Dog Refuse ||||||||||| 11% ||||||||||||||||||||||||||| 27% |||||||||||||||||||| 21%
1.0 1.3 1.4
Dogs Unattended
0% 0% 0%
N/A N/A N/A
Evidence of Alcohol Use
||||||||||||||||||||||||||||||||| 33% ||||||||||||||||||||||||||| 27% |||||||||||||||| 17%
1.0 1.3 1.3
Evidence of Substance Use*
|||||||||||||||||||||| 22% |||||||||||||||||| 18% |||| 4%
1.0 1.5 1.0
Graffiti ||||||||||||||||||||||||||||||||||||||||||||||||||||||| 56% |||||||||||||||||||||||||||||||||||| 36% ||||||||||||||||||||||||||||||||| 33%
1.0 1.5 1.1
FFY2017 SNAP-Ed Annual Report 91 January 2018
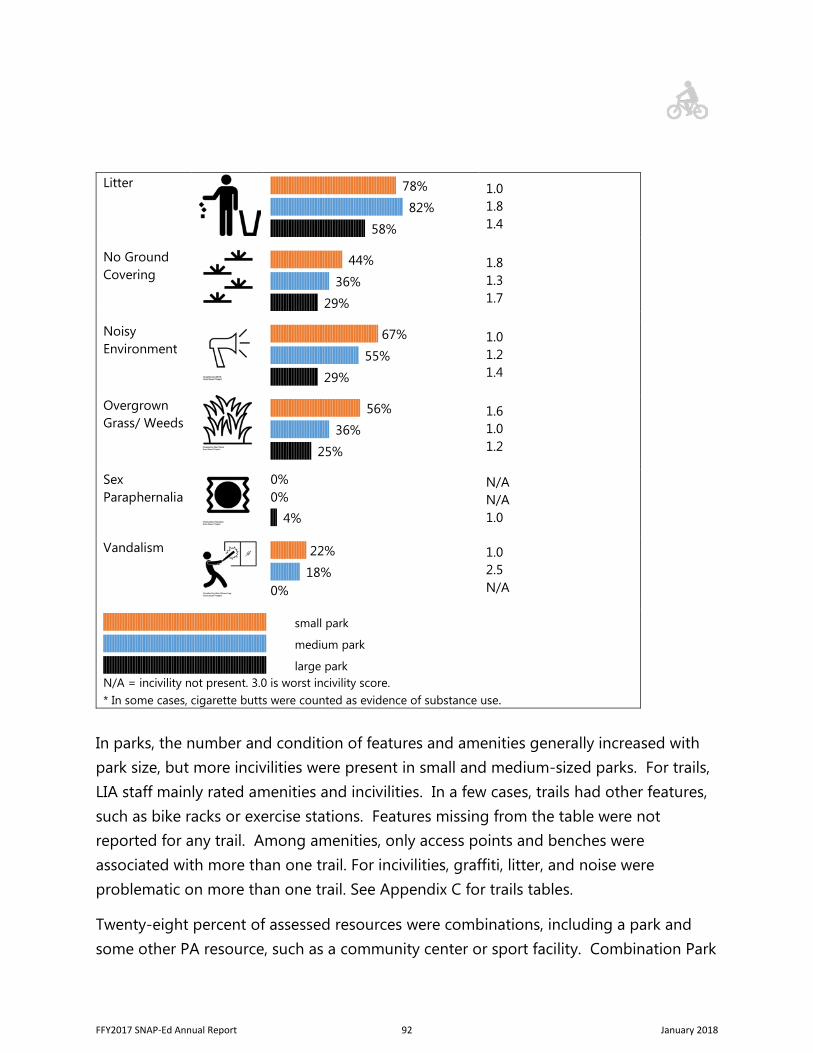
Litter ||||||||||||||||||||||||||||||||||||||||||||||||||||||||||||||||||||||||||||| 78% ||||||||||||||||||||||||||||||||||||||||||||||||||||||||||||||||||||||||||||||||| 82% |||||||||||||||||||||||||||||||||||||||||||||||||||||||||| 58%
1.0 1.8 1.4
No Ground Covering
|||||||||||||||||||||||||||||||||||||||||||| 44% |||||||||||||||||||||||||||||||||||| 36% ||||||||||||||||||||||||||||| 29%
1.8 1.3 1.7
Noisy Environment
|||||||||||||||||||||||||||||||||||||||||||||||||||||||||||||||||| 67% |||||||||||||||||||||||||||||||||||||||||||||||||||||| 55% ||||||||||||||||||||||||||||| 29%
1.0 1.2 1.4
Overgrown Grass/ Weeds
||||||||||||||||||||||||||||||||||||||||||||||||||||||| 56% |||||||||||||||||||||||||||||||||||| 36%
||||||||||||||||||||||||| 25%
1.6 1.0 1.2
Sex Paraphernalia
0% 0% |||| 4%
N/A N/A 1.0
Vandalism |||||||||||||||||||||| 22% |||||||||||||||||| 18% 0%
1.0 2.5 N/A
|||||||||||||||||||||||||||||||||||||||||||||||||||||||||||||||||||||||||||||||||||||||||||||||||||| small park
|||||||||||||||||||||||||||||||||||||||||||||||||||||||||||||||||||||||||||||||||||||||||||||||||||| medium park
|||||||||||||||||||||||||||||||||||||||||||||||||||||||||||||||||||||||||||||||||||||||||||||||||||| large park N/A = incivility not present. 3.0 is worst incivility score. * In some cases, cigarette butts were counted as evidence of substance use.
In parks, the number and condition of features and amenities generally increased with park size, but more incivilities were present in small and medium-sized parks. For trails, LIA staff mainly rated amenities and incivilities. In a few cases, trails had other features, such as bike racks or exercise stations. Features missing from the table were not reported for any trail. Among amenities, only access points and benches were associated with more than one trail. For incivilities, graffiti, litter, and noise were problematic on more than one trail. See Appendix C for trails tables.
Twenty-eight percent of assessed resources were combinations, including a park and some other PA resource, such as a community center or sport facility. Combination Park
FFY2017 SNAP-Ed Annual Report 92 January 2018
& Sport Facilities were more likely to include exercise stations, play equipment, tennis courts and wading pools/splash pads. Feature and amenity conditions for Enhanced Combination Park & Sport Facilities tended to be rated lower compared to Combination Park & Sport Facilities. Although Combination Park & Sport Facilities had better-condition features and amenities, they also had the highest level of reported incivilities, both in terms of having a higher percentage of incivilities present and higher (worse) condition scores. See Appendix C for results related to features, amenities and incivilities documented at these combination sites.
As SNAP-Ed efforts shift toward settings and sectors level across the Socio-Ecological Model to affect PSE changes, the PARA is a useful tool to engage in conversations with relevant stakeholders about how to increase PA levels in low-income communities.
PARA resource comparisons by type and size can also inform LIAs’ efforts to improve their PA resources (advocating for additional amenities or a reduction in incivilities, or seeking to improve condition scores). Conversely, if PA resources were in good condition, the results can support efforts to advocate for systems changes such as regularly occurring programming aimed at the SNAP-eligible audience at these facilities. Also, by analyzing PA resource characteristics across the state, the SET was able to see patterns of resource quality to better support LIA staff in their efforts to promote participation in and use of physical activity resources. By asking LIAs to complete PARA assessments in FFY17 and again at the same locations in FFY19, the AZ Health Zone will be able to assess changes in the features, amenities, and incivilities of these PA resources across time and statewide, and the ways in which these changes may specifically support an improved physical activity environment.
Interaction with Partner Sites Reach and Meetings with Partner Sites. In FFY17, eleven LIAs in ten counties reached an average of 11.2 sites, although with Maricopa removed from analysis, the average across counties was five sites reached. To promote PA resources, LIAs engaged with varying types of sites. In some cases, they worked together with a town, coalition, or sites where they offered youth or adult education to promote multiple PA resources in a geographic area. In other cases, they promoted specific free or low-cost resources, most often
FFY2017 SNAP-Ed Annual Report 93 January 2018
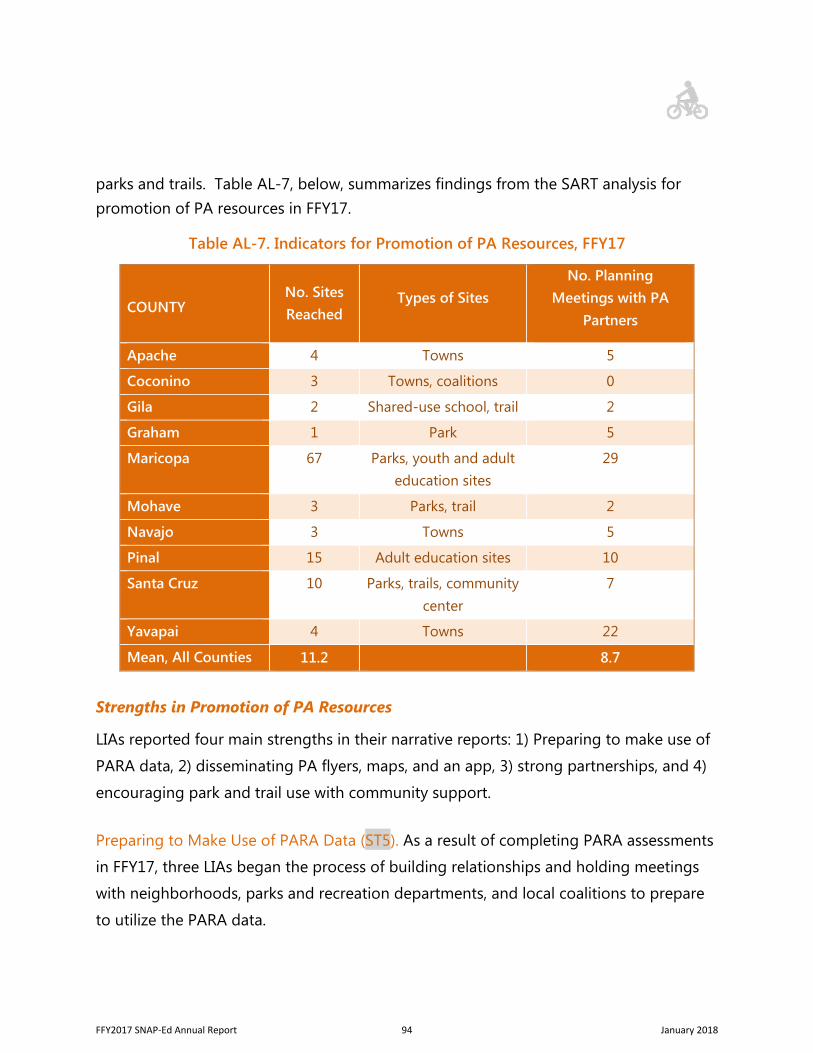
parks and trails. Table AL-7, below, summarizes findings from the SART analysis for promotion of PA resources in FFY17.
Table AL-7. Indicators for Promotion of PA Resources, FFY17
COUNTY No. Sites Reached
Types of Sites No. Planning
Meetings with PA Partners
Apache 4 Towns 5
Coconino 3 Towns, coalitions 0
Gila 2 Shared-use school, trail 2
Graham 1 Park 5
Maricopa 67 Parks, youth and adult education sites
29
Mohave 3 Parks, trail 2
Navajo 3 Towns 5
Pinal 15 Adult education sites 10
Santa Cruz 10 Parks, trails, community center
7
Yavapai 4 Towns 22
Mean, All Counties 11.2 8.7
Strengths in Promotion of PA Resources
LIAs reported four main strengths in their narrative reports: 1) Preparing to make use of
PARA data, 2) disseminating PA flyers, maps, and an app, 3) strong partnerships, and 4)
encouraging park and trail use with community support.
Preparing to Make Use of PARA Data (ST5). As a result of completing PARA assessments
in FFY17, three LIAs began the process of building relationships and holding meetings
with neighborhoods, parks and recreation departments, and local coalitions to prepare
to utilize the PARA data.
FFY2017 SNAP-Ed Annual Report 94 January 2018
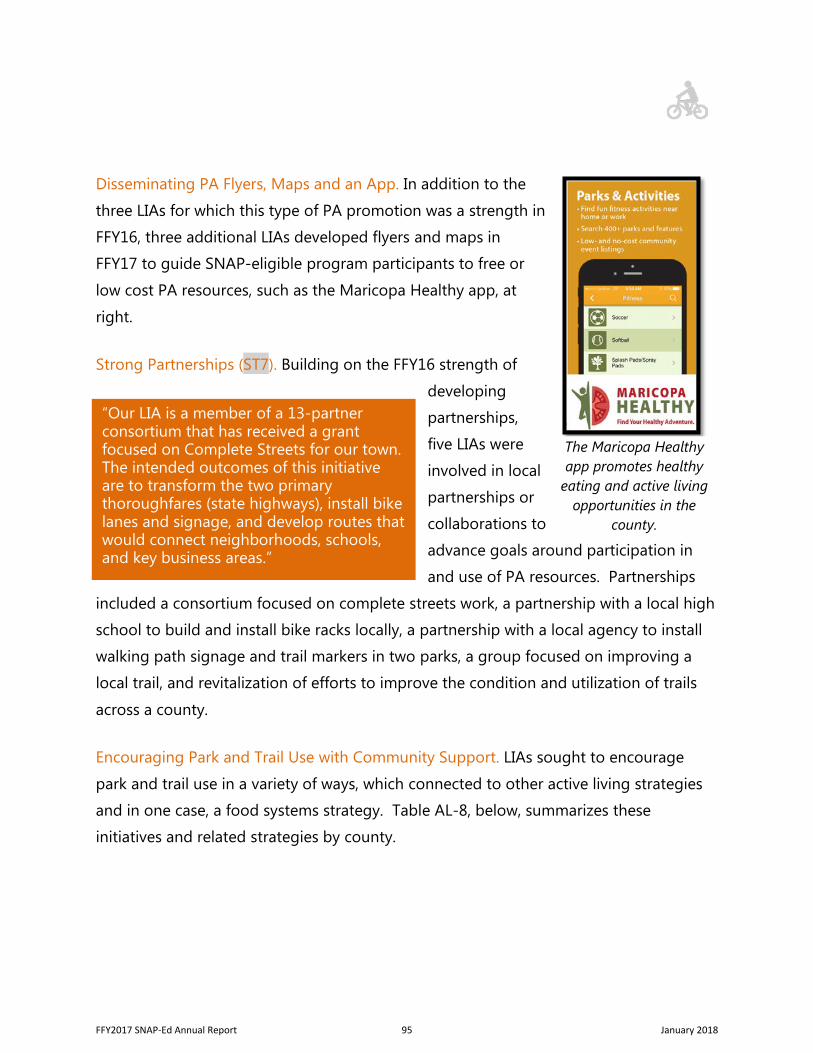
Disseminating PA Flyers, Maps and an App. In addition to the
three LIAs for which this type of PA promotion was a strength in
FFY16, three additional LIAs developed flyers and maps in
FFY17 to guide SNAP-eligible program participants to free or
low cost PA resources, such as the Maricopa Healthy app, at
right.
Strong Partnerships (ST7). Building on the FFY16 strength of
developing
partnerships,
five LIAs were
involved in local
partnerships or
collaborations to
advance goals around participation in
and use of PA resources. Partnerships
included a consortium focused on complete streets work, a partnership with a local high
school to build and install bike racks locally, a partnership with a local agency to install
walking path signage and trail markers in two parks, a group focused on improving a
local trail, and revitalization of efforts to improve the condition and utilization of trails
across a county.
Encouraging Park and Trail Use with Community Support. LIAs sought to encourage
park and trail use in a variety of ways, which connected to other active living strategies
and in one case, a food systems strategy. Table AL-8, below, summarizes these
initiatives and related strategies by county.
“Our LIA is a member of a 13-partner consortium that has received a grant focused on Complete Streets for our town. The intended outcomes of this initiative are to transform the two primary thoroughfares (state highways), install bike lanes and signage, and develop routes that would connect neighborhoods, schools, and key business areas.”
The Maricopa Healthy app promotes healthy
eating and active living opportunities in the
county.
FFY2017 SNAP-Ed Annual Report 95 January 2018
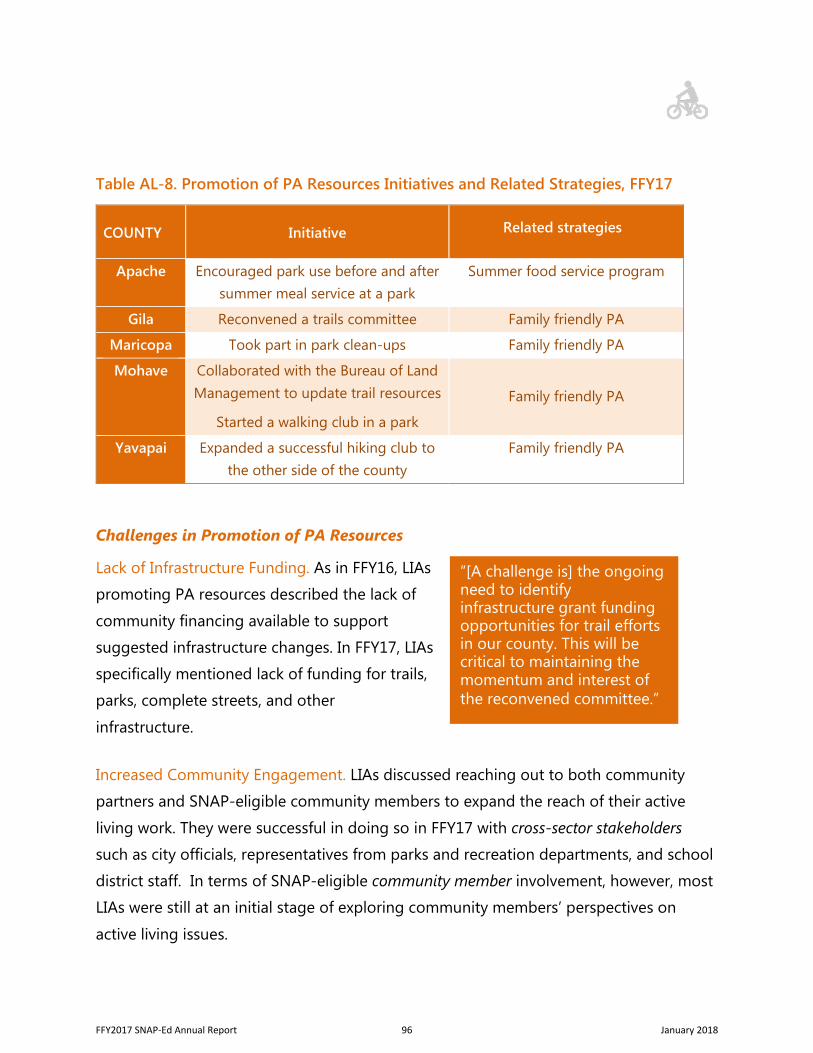
Table AL-8. Promotion of PA Resources Initiatives and Related Strategies, FFY17
COUNTY Initiative Related strategies
Apache Encouraged park use before and after summer meal service at a park
Summer food service program
Gila Reconvened a trails committee Family friendly PA
Maricopa Took part in park clean-ups Family friendly PA
Mohave Collaborated with the Bureau of Land Management to update trail resources
Started a walking club in a park
Family friendly PA
Yavapai Expanded a successful hiking club to the other side of the county
Family friendly PA
Challenges in Promotion of PA Resources
Lack of Infrastructure Funding. As in FFY16, LIAs
promoting PA resources described the lack of
community financing available to support
suggested infrastructure changes. In FFY17, LIAs
specifically mentioned lack of funding for trails,
parks, complete streets, and other
infrastructure.
Increased Community Engagement. LIAs discussed reaching out to both community
partners and SNAP-eligible community members to expand the reach of their active
living work. They were successful in doing so in FFY17 with cross-sector stakeholders
such as city officials, representatives from parks and recreation departments, and school
district staff. In terms of SNAP-eligible community member involvement, however, most
LIAs were still at an initial stage of exploring community members’ perspectives on
active living issues.
“[A challenge is] the ongoing need to identify infrastructure grant funding opportunities for trail efforts in our county. This will be critical to maintaining the momentum and interest of the reconvened committee.”
FFY2017 SNAP-Ed Annual Report 96 January 2018
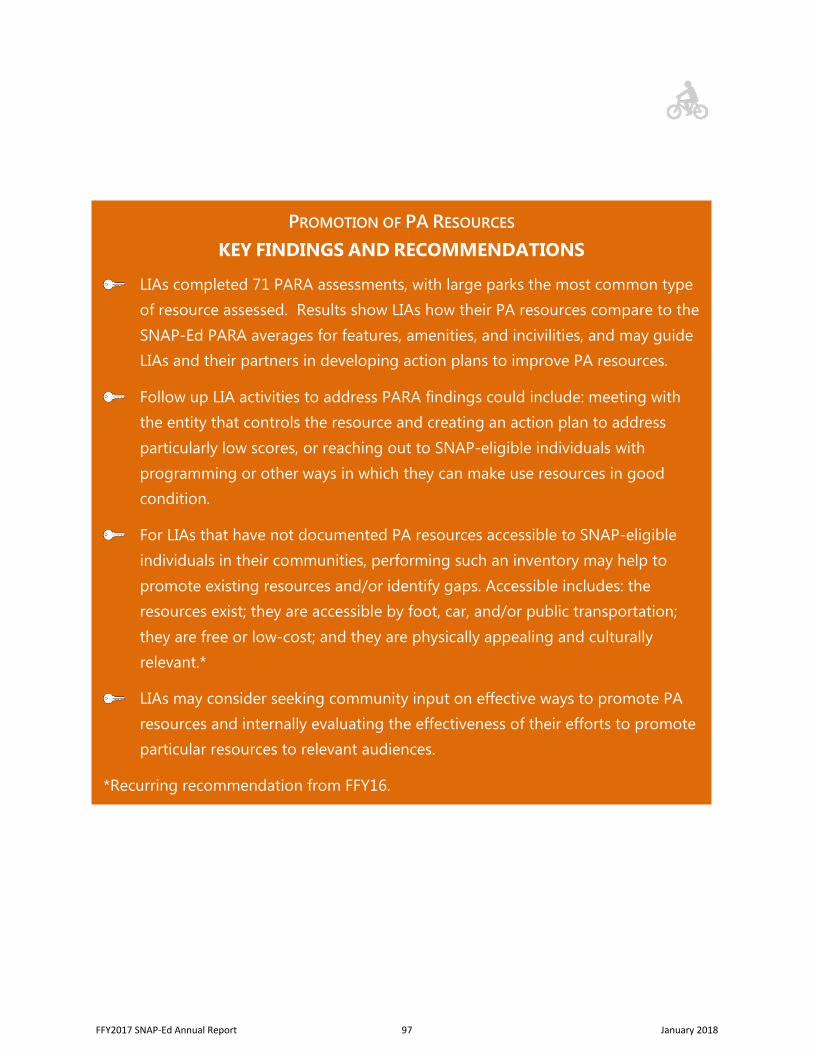
PROMOTION OF PA RESOURCES KEY FINDINGS AND RECOMMENDATIONS
LIAs completed 71 PARA assessments, with large parks the most common type of resource assessed. Results show LIAs how their PA resources compare to the SNAP-Ed PARA averages for features, amenities, and incivilities, and may guide LIAs and their partners in developing action plans to improve PA resources.
Follow up LIA activities to address PARA findings could include: meeting with the entity that controls the resource and creating an action plan to address particularly low scores, or reaching out to SNAP-eligible individuals with programming or other ways in which they can make use resources in good condition.
For LIAs that have not documented PA resources accessible to SNAP-eligible individuals in their communities, performing such an inventory may help to promote existing resources and/or identify gaps. Accessible includes: the resources exist; they are accessible by foot, car, and/or public transportation; they are free or low-cost; and they are physically appealing and culturally relevant.*
LIAs may consider seeking community input on effective ways to promote PA resources and internally evaluating the effectiveness of their efforts to promote particular resources to relevant audiences.
*Recurring recommendation from FFY16.
FFY2017 SNAP-Ed Annual Report 97 January 2018
Family-Friendly Physical Activity
Methods To evaluate SNAP-Ed support for family-friendly PA throughout the community, the SET used quantitative analysis of the SART and the SNAP-Ed Education and Administrative Reporting System (EARS) using Excel. Although EARS was recently revised by the USDA, the data in this report were collected in FFY17 using the previous EARS system. The SET used the SART to collect data on process indicators, including sites reached and the number of planning meetings with partners. From EARS, the SET collected the number of PA opportunities conducted with youth and adults, the reach of those events, and whether the LIA was involved in sponsoring/hosting the event (when such information was available). We filtered monthly report data to capture direct and indirect events reaching 20 or more people, primarily focused on PA, and did not utilize a curriculum.
NVivo v11.0 software facilitated qualitative analysis of SARN text. Findings were considered in terms of LIA strengths and challenges with respect to family-friendly PA programming in the community.
Considering both quantitative and qualitative data, the SET assessed readiness and capacity for family-friendly PA programming (ST5), and organizational partnerships that supported such events (ST7).
Results Physical Activity Event Reach. After reporting successes in FFY16 with planning and/or participating in family-friendly PA events, 13 LIAs in 11 counties continued to make progress in this area in FFY17 (Table AL-9). LIAs reached an average of 9.5 communities (range of 1 to 60) per county with family-friendly PA events in FFY17, comparable to the 9.1 communities reached (range of 1 to 66) in FFY16. The wide range in both years reflects the fact that communities were LIA-defined, often geographically but in some cases by particular target demographics or particular sites. An additional measure was added to the SART in FFY17, asking LIAs to report the number of events
FFY2017 SNAP-Ed Annual Report 98 January 2018
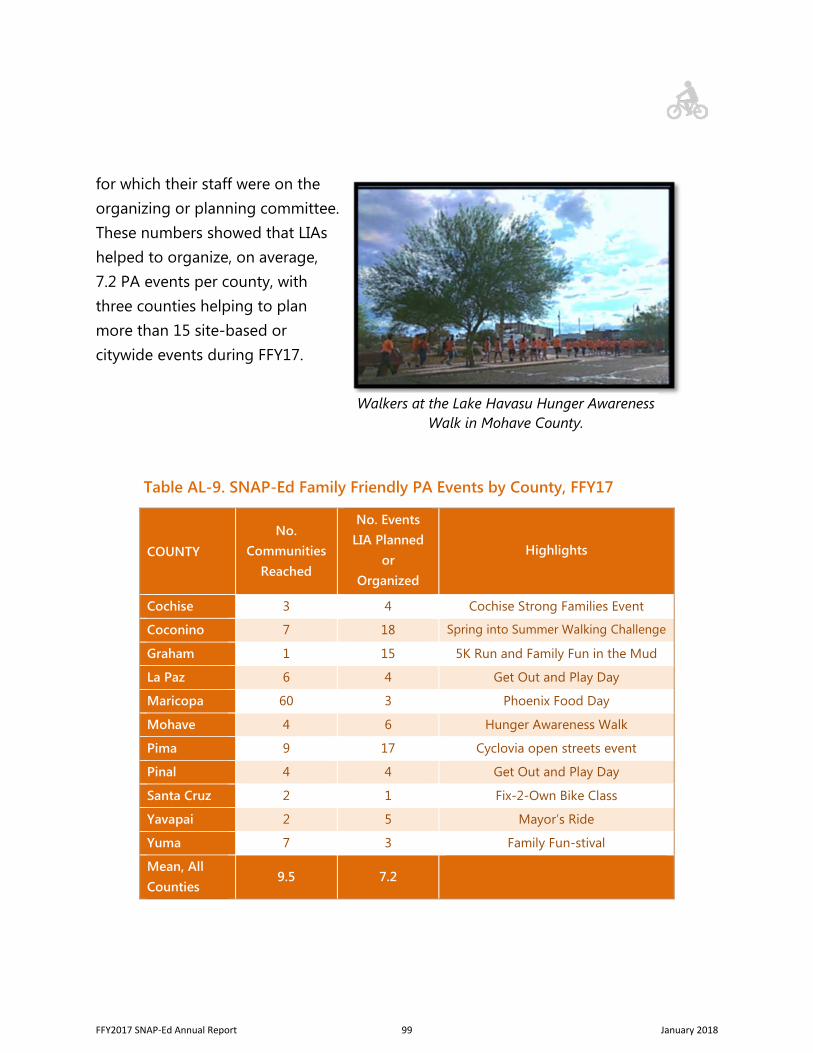
for which their staff were on the organizing or planning committee. These numbers showed that LIAs helped to organize, on average, 7.2 PA events per county, with three counties helping to plan more than 15 site-based or citywide events during FFY17.
Table AL-9. SNAP-Ed Family Friendly PA Events by County, FFY17
COUNTY No.
Communities Reached
No. Events LIA Planned
or Organized
Highlights
Cochise 3 4 Cochise Strong Families Event
Coconino 7 18 Spring into Summer Walking Challenge
Graham 1 15 5K Run and Family Fun in the Mud
La Paz 6 4 Get Out and Play Day
Maricopa 60 3 Phoenix Food Day
Mohave 4 6 Hunger Awareness Walk
Pima 9 17 Cyclovia open streets event
Pinal 4 4 Get Out and Play Day
Santa Cruz 2 1 Fix-2-Own Bike Class
Yavapai 2 5 Mayor’s Ride
Yuma 7 3 Family Fun-stival
Mean, All Counties
9.5 7.2
Walkers at the Lake Havasu Hunger Awareness Walk in Mohave County.
FFY2017 SNAP-Ed Annual Report 99 January 2018
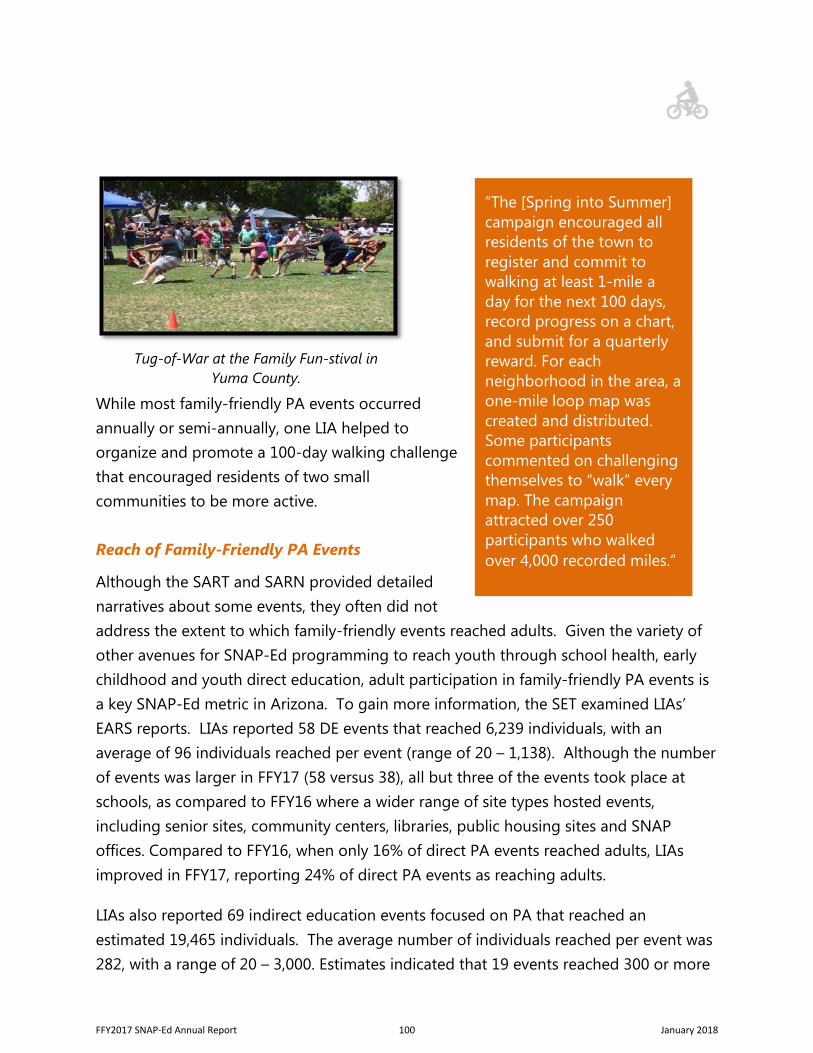
While most family-friendly PA events occurred annually or semi-annually, one LIA helped to organize and promote a 100-day walking challenge that encouraged residents of two small communities to be more active.
Reach of Family-Friendly PA Events
Although the SART and SARN provided detailed narratives about some events, they often did not address the extent to which family-friendly events reached adults. Given the variety of other avenues for SNAP-Ed programming to reach youth through school health, early childhood and youth direct education, adult participation in family-friendly PA events is a key SNAP-Ed metric in Arizona. To gain more information, the SET examined LIAs’ EARS reports. LIAs reported 58 DE events that reached 6,239 individuals, with an average of 96 individuals reached per event (range of 20 – 1,138). Although the number of events was larger in FFY17 (58 versus 38), all but three of the events took place at schools, as compared to FFY16 where a wider range of site types hosted events, including senior sites, community centers, libraries, public housing sites and SNAP offices. Compared to FFY16, when only 16% of direct PA events reached adults, LIAs improved in FFY17, reporting 24% of direct PA events as reaching adults.
LIAs also reported 69 indirect education events focused on PA that reached an estimated 19,465 individuals. The average number of individuals reached per event was 282, with a range of 20 – 3,000. Estimates indicated that 19 events reached 300 or more
“The [Spring into Summer] campaign encouraged all residents of the town to register and commit to walking at least 1-mile a day for the next 100 days, record progress on a chart, and submit for a quarterly reward. For each neighborhood in the area, a one-mile loop map was created and distributed. Some participants commented on challenging themselves to “walk” every map. The campaign attracted over 250 participants who walked over 4,000 recorded miles.”
Tug-of-War at the Family Fun-stival in Yuma County.
FFY2017 SNAP-Ed Annual Report 100 January 2018
individuals. Because indirect activities rely on an estimation of total participation without demographic counts, the number of adults reached by these efforts is unknown. Of the 69 reported events, 24 were sponsored by SNAP-Ed LIAs. This represents an increase in sponsorship of events compared to FFY16 (35% in FFY17 versus 27% in FFY16).
A Strength in Family-Friendly PA Collaborative events that addressed multiple SNAP-Ed focus areas. Building on the FFY16 strength of partnerships, nine LIAs described events that they took part in, helped
plan with other organizational partners, or both (ST7). For LIAs engaged in event planning, the partnership was typically at the coordination level.
Of 16 events highlighted in narrative reports, 12 overlapped with other SNAP-Ed focus areas, including: five with food systems, two with school health, two with early childhood, and three with direct education opportunities. This focus on collaborative events and multiple focus areas meant that LIAs had increased capacity (ST5), and could rely on a broader array of partners for help in all facets of event development and accomplishment. It also enabled LIAs without a history of strong active living connections to begin active living PSE work, building a network that will enable them to move into stronger site and community-based PSEs in the future.
A Challenge in Family-Friendly PA Building community support (ST5). Five LIAs found that while they were able to participate in or host successful family-friendly events in a certain area of their county, in
“The “Walk to the Farmers’ Market” event took place at two senior and residential housing sites after the Farmers’ Market 101 lesson, which followed the Eat Healthy, Be Active class series. The senior participants engaged in 30 minutes of walking and learned about nutritious options and how to “double-up their SNAP dollars” at their local farmers’ market.”
“Collaborative efforts between our LIA and members of the community, including the homeowners association, elementary school teachers, and food bank leadership have begun to identify community needs. We are just in the beginning stages, but there is interest in developing a walking trail and community garden that will help support community-wide physical activities.”
FFY2017 SNAP-Ed Annual Report 101 January 2018
other communities they still needed to engage in relationship-building to be able to replicate the success of their events in a new setting. This was particularly true in rural and tribal communities where LIA staff were new faces. These LIAs continued to seek out like-minded partners in those new communities, however, and worked hard to overcome barriers. They did this by consistently showing up to events when invited, seeking out individuals and organizations to serve as local healthy living champions, identifying the most valuable media outlets to use in publicizing events, and informing community partners of their enthusiasm for helping with planning and implementation of family-friendly PA events.
FAMILY-FRIENDLY PA KEY FINDINGS AND RECOMMENDATIONS
Moving beyond a focus on building partnerships, LIAs have expanded their family-friendly PA offerings and demonstrated more involvement in the planning process for these events at both the city and site levels.
Although the percentage of events reaching adults increased in FFY17, the AZ Health Zone could provide guidance and technical assistance to LIAs on how to reach more adults within communities to interest them in participating in PA events.*
LIAs may wish to investigate longer-term PA campaigns to extend the reach of one-day events and mobilize larger audiences to engage in family-friendly PA more consistently.
* Recurring recommendation from FFY16.
FFY2017 SNAP-Ed Annual Report 102 January 2018
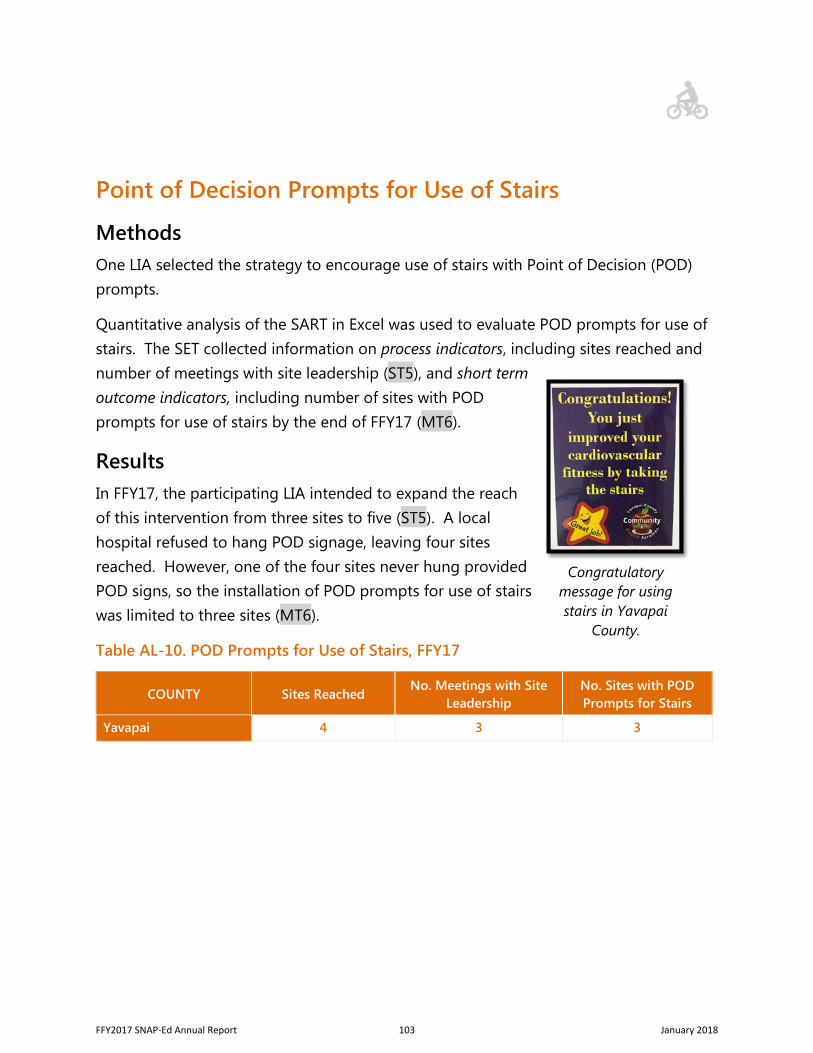
Point of Decision Prompts for Use of Stairs
Methods One LIA selected the strategy to encourage use of stairs with Point of Decision (POD) prompts.
Quantitative analysis of the SART in Excel was used to evaluate POD prompts for use of stairs. The SET collected information on process indicators, including sites reached and number of meetings with site leadership (ST5), and short term outcome indicators, including number of sites with POD prompts for use of stairs by the end of FFY17 (MT6).
Results In FFY17, the participating LIA intended to expand the reach of this intervention from three sites to five (ST5). A local hospital refused to hang POD signage, leaving four sites reached. However, one of the four sites never hung provided POD signs, so the installation of POD prompts for use of stairs was limited to three sites (MT6).
Table AL-10. POD Prompts for Use of Stairs, FFY17
COUNTY Sites Reached No. Meetings with Site
Leadership No. Sites with POD Prompts for Stairs
Yavapai 4 3 3
Congratulatory message for using stairs in Yavapai
County.
FFY2017 SNAP-Ed Annual Report 103 January 2018
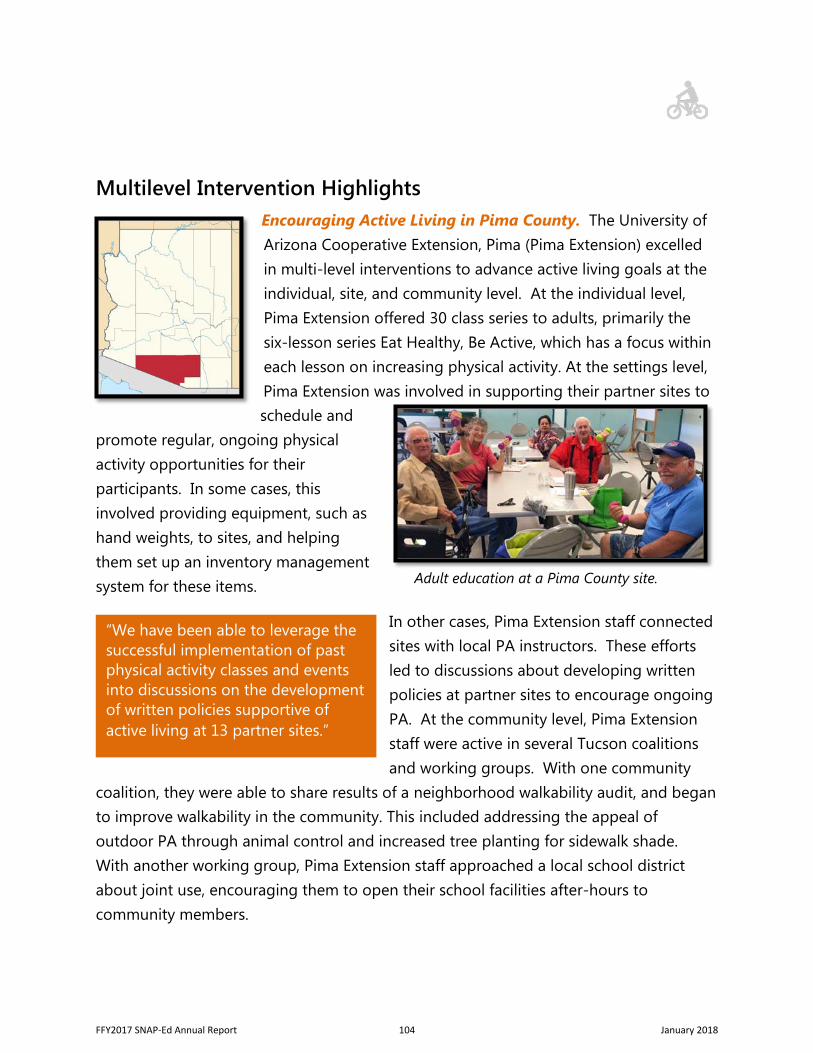
Multilevel Intervention Highlights Encouraging Active Living in Pima County. The University of Arizona Cooperative Extension, Pima (Pima Extension) excelled in multi-level interventions to advance active living goals at the individual, site, and community level. At the individual level, Pima Extension offered 30 class series to adults, primarily the six-lesson series Eat Healthy, Be Active, which has a focus within each lesson on increasing physical activity. At the settings level, Pima Extension was involved in supporting their partner sites to schedule and
promote regular, ongoing physical activity opportunities for their participants. In some cases, this involved providing equipment, such as hand weights, to sites, and helping them set up an inventory management system for these items.
In other cases, Pima Extension staff connected sites with local PA instructors. These efforts led to discussions about developing written policies at partner sites to encourage ongoing PA. At the community level, Pima Extension staff were active in several Tucson coalitions and working groups. With one community
coalition, they were able to share results of a neighborhood walkability audit, and began to improve walkability in the community. This included addressing the appeal of outdoor PA through animal control and increased tree planting for sidewalk shade. With another working group, Pima Extension staff approached a local school district about joint use, encouraging them to open their school facilities after-hours to community members.
“We have been able to leverage the successful implementation of past physical activity classes and events into discussions on the development of written policies supportive of active living at 13 partner sites.”
Adult education at a Pima County site.
FFY2017 SNAP-Ed Annual Report 104 January 2018
References 1. Arizona Health Matters. Healthy Arizona: Indicators: Community Dashboard, All Arizona
Data. http://www.arizonahealthmatters.org/index.php?module=indicators&controller=index&action=dashboard&alias=alldata. Accessed January 20, 2017.
2. AZ Health Zone. Rural Community Profiles, 2017. Received by request. Phoenix, AZ. Accessed November 30; 2017.
3. The Trust for Public Land. ParkScore. http://parkscore.tpl.org/#sm.0000xyyc791e8xfrmsfqy5x2m3ao3. Accessed November 24, 2017.
4. U.S. Census Bureau. 2011-2015 American Community Survey 5-Year Estimates, Table B25044, Households with no vehicle available, Arizona. 2016. https://factfinder.census.gov/faces/tableservices/jsf/pages/productview.xhtml?pid=ACS_15_5YR_B25044&prodType=table. Accessed November 28, 2017.
5. Jacobs L, LeGros T, Orzech K. Arizona Nutrition Network FFY16 Annual Evaluation Report. Phoenix, AZ: Arizona Nutrition Network; 2016. https://nutritioneval.arizona.edu/results.
6. Lee RE, Booth KM, Reese-Smith JY, Regan G, Howard HH. The Physical Activity Resource Assessment (PARA) instrument: evaluating features, amenities and incivilities of physical activity resources in urban neighborhoods. Int J Behav Nutr Phys Act. 2005;2:13. doi:10.1186/1479-5868-2-13.
Image/Icon credits Image of adult education in Pima County courtesy of the community center website: https://www.tucsonaz.gov/parks/FredArcherCenter
Icon credits: All downloaded from Noun Project (https://thenounproject.com/) as community commons images, requiring attribution to the creators. The icons contain the creator names but as they are too small to read. They are, in the order in which they appear in the chapter: Baseball Field: Ryan Choi ,Basketball Court: SBTS, Soccer Field: Adrien Coquet, Bicycle Parking: Thomas Le Bas, Multi Station :Vectors Market, Playground: icon 54, Swimming Pool: Sathish Selladurai, Sandbox :Ilsur Aptukov, Trail: public domain, Tennis Court: anbileru adaleru, Trail: Juraj Sedlák, Volleyball: anbileru adaleru, Inflatable Pool: Gan Khoon Lay, Key: il Capitano, Restroom: yejinland, Bench: Ben Davis, Tiling: lastspark, Drinking Fountain: Gan Khoon Lay, Landscape: Becris, Lamp Post: Arthur Shlain, Picnic Shelter: public domain, Park: Nikita Tcherednikov, Shelter: public domain, Shower: public domain, Trash: icongeek, Broken Bottle :Olivier Guin, Poop: Icon Island, Dog Warning: Gregor Cresnar, Drunk: Marie Van den Broeck, Injection Needle: Mike Zuidgeest, Graffiti: Peter van Driel, Litter: public domain, Grassland: public domain, Noise Pollution: SBTS, Grass: Ben Davis, Condom: Ramesha, Man Smashing Window: Gan Khoon Lay
FFY2017 SNAP-Ed Annual Report 105 January 2018
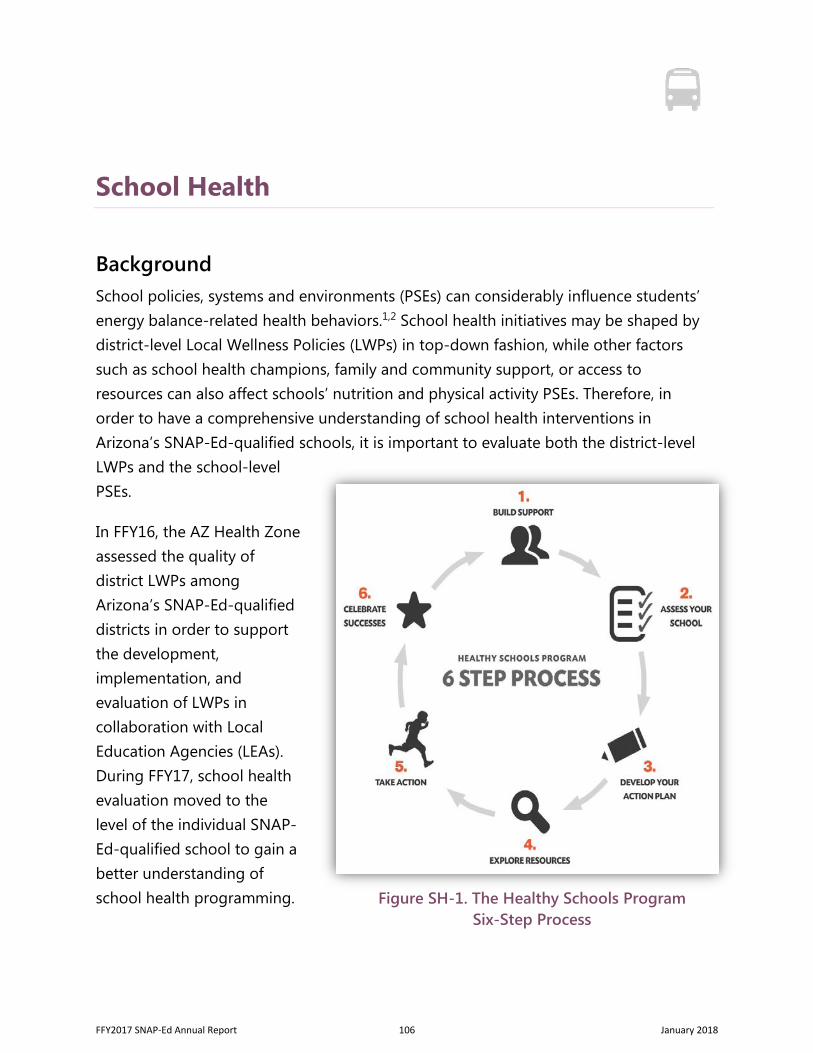
School Health
Background School policies, systems and environments (PSEs) can considerably influence students’ energy balance-related health behaviors.1,2 School health initiatives may be shaped by district-level Local Wellness Policies (LWPs) in top-down fashion, while other factors such as school health champions, family and community support, or access to resources can also affect schools’ nutrition and physical activity PSEs. Therefore, in order to have a comprehensive understanding of school health interventions in Arizona’s SNAP-Ed-qualified schools, it is important to evaluate both the district-level LWPs and the school-level PSEs.
In FFY16, the AZ Health Zone assessed the quality of district LWPs among Arizona’s SNAP-Ed-qualified districts in order to support the development, implementation, and evaluation of LWPs in collaboration with Local Education Agencies (LEAs). During FFY17, school health evaluation moved to the level of the individual SNAP-Ed-qualified school to gain a better understanding of school health programming. Figure SH-1. The Healthy Schools Program
Six-Step Process
FFY2017 SNAP-Ed Annual Report 106 January 2018
The Alliance for a Healthier Generation’s evidence-based Healthy Schools Program (HSP)3 works to prevent childhood obesity in the U.S. Specifically, the HSP supports changes to school-based nutrition and physical activity PSEs using a six-step process (Figure SH-1). Step 2: Assess Your School uses the HSP assessment tool to measure school-level nutrition and physical activity initiatives. Schools that complete the assessment and score high across sections can apply for national recognition in the form of bronze, silver, and gold award status.
In FFY17, the AZ Health Zone developed a Memorandum of Understanding (MOU) with the Alliance for a Healthier Generation’s HSP, which enabled sharing of the HSP assessment data for all Arizona schools working with Local SNAP-Ed Implementing Agencies (LIAs). For LIAs working with SNAP-Ed partner schools that were not enrolled in the HSP, the AZ Health Zone’s State Evaluation Team (SET) developed an alternate form of data collection. Together, these data were used to evaluate LIA progress in the School Health focus area across three AZ Health Zone strategies:
Local Wellness Policies. Support the development, implementation, and evaluation of nutrition and physical activity LWPs in collaboration with Local Education Agencies (ST7, MT5, MT6).
Nutrition Capacity. Improve student, teacher, and staff access to nutrition information through menu labeling and classroom curriculum to improve student understanding of nutrition information (MT5).
Comprehensive School Physical Activity Programming. Support Comprehensive School Physical Activity Programming (CSPAP) (MT6).
Methods This FFY17 assessment serves as: (1) a site-level evaluation of school health PSEs to provide actionable information to the AZ Health Zone, LIAs, and partner schools, and (2) the baseline for an FFY19 outcomes evaluation.
Assessment Tools. An FFY17 MOU with the HSP made HSP data available to the SET for SNAP-Ed-participating schools. LIAs with interest or experience in supporting
FFY2017 SNAP-Ed Annual Report 107 January 2018
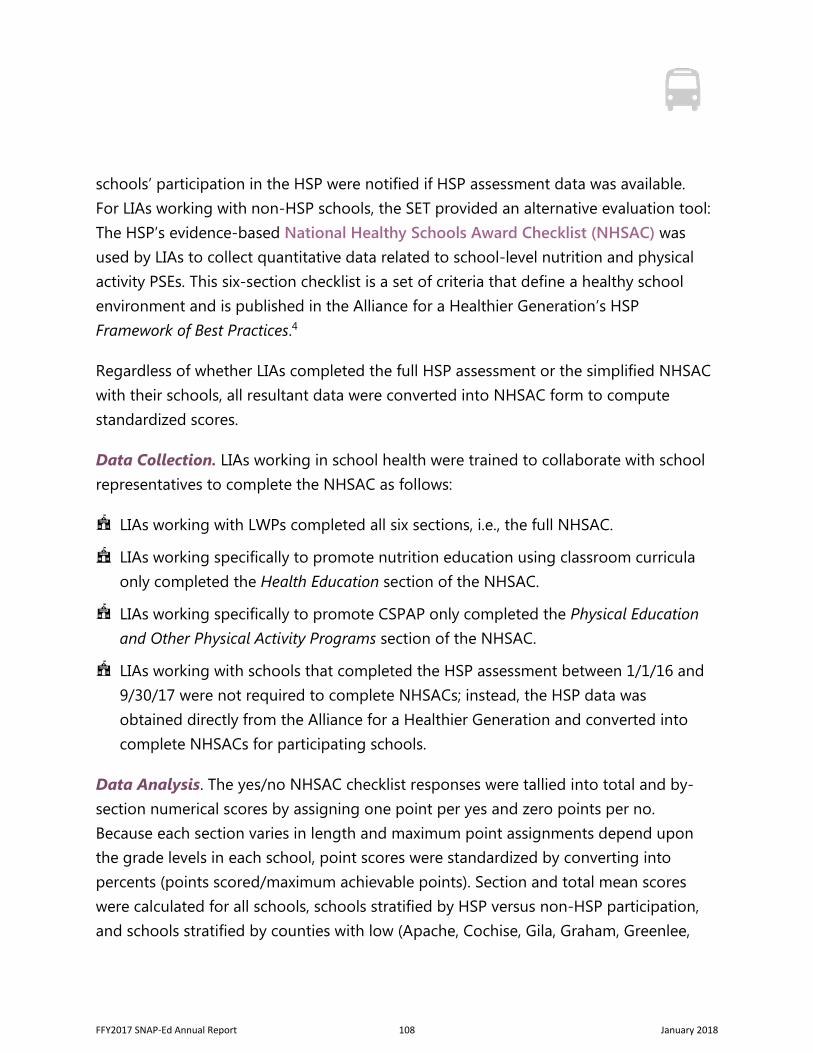
schools’ participation in the HSP were notified if HSP assessment data was available. For LIAs working with non-HSP schools, the SET provided an alternative evaluation tool: The HSP’s evidence-based National Healthy Schools Award Checklist (NHSAC) was used by LIAs to collect quantitative data related to school-level nutrition and physical activity PSEs. This six-section checklist is a set of criteria that define a healthy school environment and is published in the Alliance for a Healthier Generation’s HSP Framework of Best Practices.4
Regardless of whether LIAs completed the full HSP assessment or the simplified NHSAC with their schools, all resultant data were converted into NHSAC form to compute standardized scores.
Data Collection. LIAs working in school health were trained to collaborate with school representatives to complete the NHSAC as follows:
LIAs working with LWPs completed all six sections, i.e., the full NHSAC.
LIAs working specifically to promote nutrition education using classroom curricula only completed the Health Education section of the NHSAC.
LIAs working specifically to promote CSPAP only completed the Physical Education and Other Physical Activity Programs section of the NHSAC.
LIAs working with schools that completed the HSP assessment between 1/1/16 and 9/30/17 were not required to complete NHSACs; instead, the HSP data was obtained directly from the Alliance for a Healthier Generation and converted into complete NHSACs for participating schools.
Data Analysis. The yes/no NHSAC checklist responses were tallied into total and by-section numerical scores by assigning one point per yes and zero points per no. Because each section varies in length and maximum point assignments depend upon the grade levels in each school, point scores were standardized by converting into percents (points scored/maximum achievable points). Section and total mean scores were calculated for all schools, schools stratified by HSP versus non-HSP participation, and schools stratified by counties with low (Apache, Cochise, Gila, Graham, Greenlee,
FFY2017 SNAP-Ed Annual Report 108 January 2018
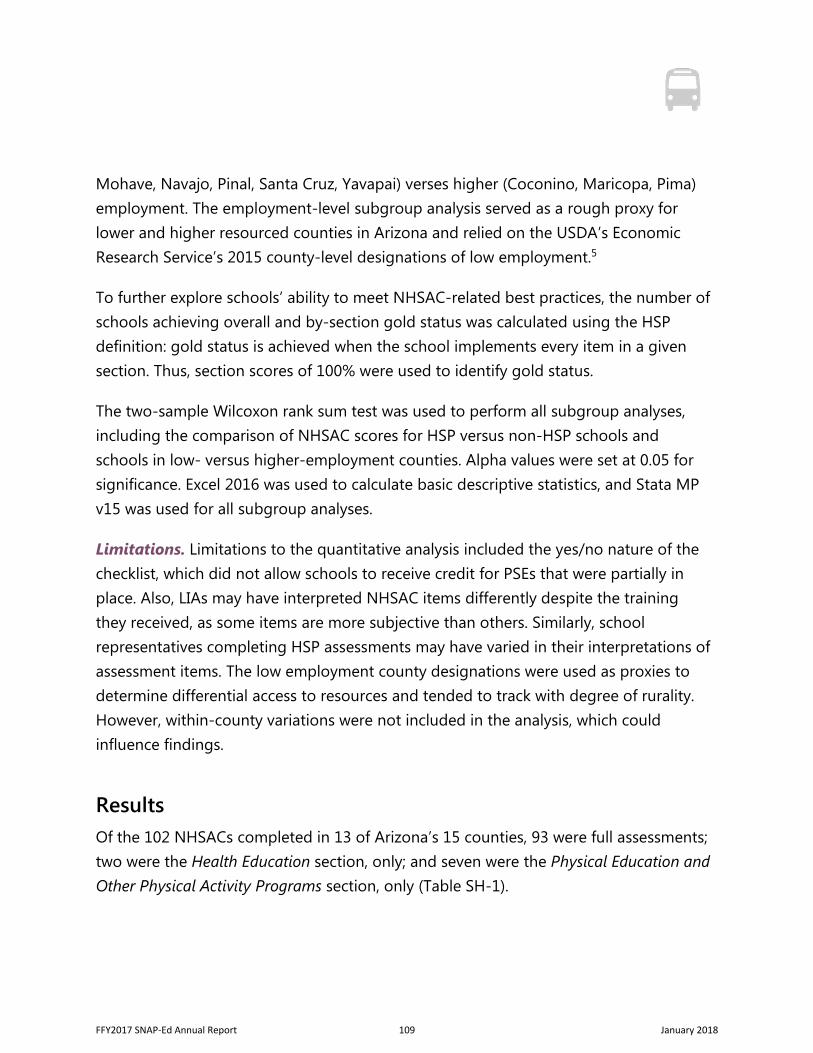
Mohave, Navajo, Pinal, Santa Cruz, Yavapai) verses higher (Coconino, Maricopa, Pima) employment. The employment-level subgroup analysis served as a rough proxy for lower and higher resourced counties in Arizona and relied on the USDA’s Economic Research Service’s 2015 county-level designations of low employment.5
To further explore schools’ ability to meet NHSAC-related best practices, the number of schools achieving overall and by-section gold status was calculated using the HSP definition: gold status is achieved when the school implements every item in a given section. Thus, section scores of 100% were used to identify gold status.
The two-sample Wilcoxon rank sum test was used to perform all subgroup analyses, including the comparison of NHSAC scores for HSP versus non-HSP schools and schools in low- versus higher-employment counties. Alpha values were set at 0.05 for significance. Excel 2016 was used to calculate basic descriptive statistics, and Stata MP v15 was used for all subgroup analyses.
Limitations. Limitations to the quantitative analysis included the yes/no nature of the checklist, which did not allow schools to receive credit for PSEs that were partially in place. Also, LIAs may have interpreted NHSAC items differently despite the training they received, as some items are more subjective than others. Similarly, school representatives completing HSP assessments may have varied in their interpretations of assessment items. The low employment county designations were used as proxies to determine differential access to resources and tended to track with degree of rurality. However, within-county variations were not included in the analysis, which could influence findings.
Results Of the 102 NHSACs completed in 13 of Arizona’s 15 counties, 93 were full assessments; two were the Health Education section, only; and seven were the Physical Education and Other Physical Activity Programs section, only (Table SH-1).
FFY2017 SNAP-Ed Annual Report 109 January 2018
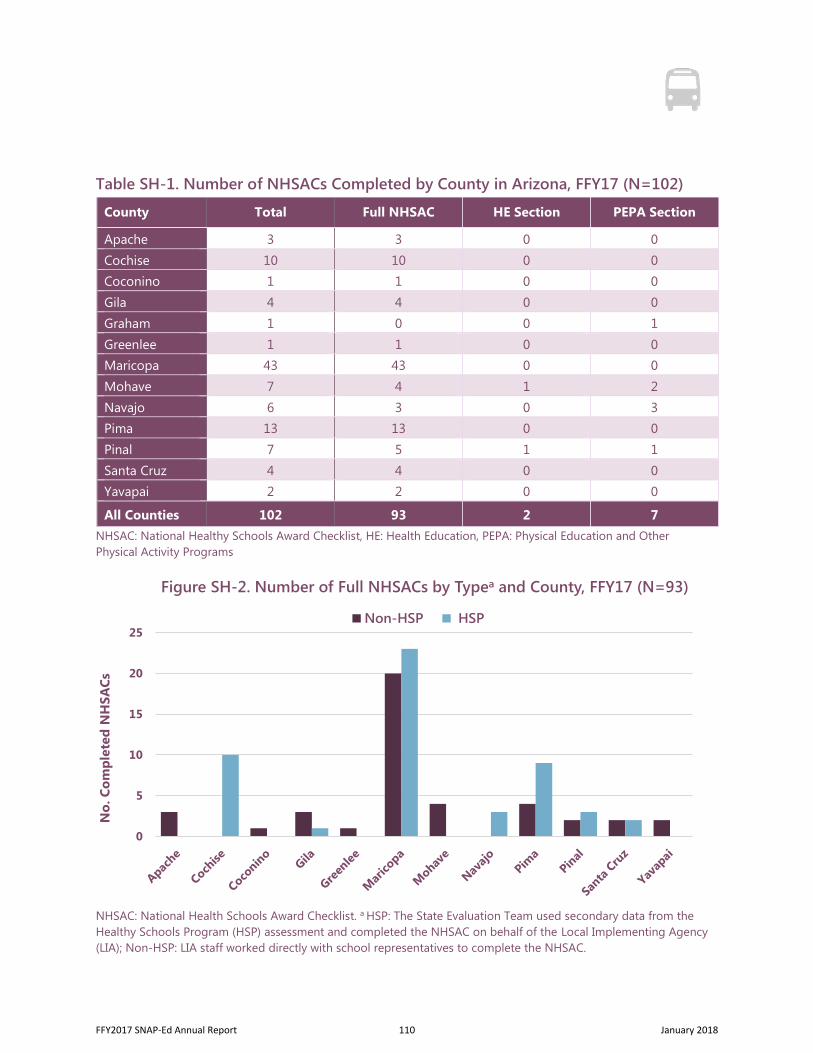
0
5
10
15
20
25
No.
Com
plet
ed N
HSA
Cs
Figure SH-2. Number of Full NHSACs by Typea and County, FFY17 (N=93)
Non-HSP HSP
Table SH-1. Number of NHSACs Completed by County in Arizona, FFY17 (N=102)
County Total Full NHSAC HE Section PEPA Section
Apache 3 3 0 0 Cochise 10 10 0 0 Coconino 1 1 0 0 Gila 4 4 0 0 Graham 1 0 0 1 Greenlee 1 1 0 0 Maricopa 43 43 0 0 Mohave 7 4 1 2 Navajo 6 3 0 3 Pima 13 13 0 0 Pinal 7 5 1 1 Santa Cruz 4 4 0 0 Yavapai 2 2 0 0
All Counties 102 93 2 7 NHSAC: National Healthy Schools Award Checklist, HE: Health Education, PEPA: Physical Education and Other Physical Activity Programs
NHSAC: National Health Schools Award Checklist. a HSP: The State Evaluation Team used secondary data from the Healthy Schools Program (HSP) assessment and completed the NHSAC on behalf of the Local Implementing Agency (LIA); Non-HSP: LIA staff worked directly with school representatives to complete the NHSAC.
FFY2017 SNAP-Ed Annual Report 110 January 2018
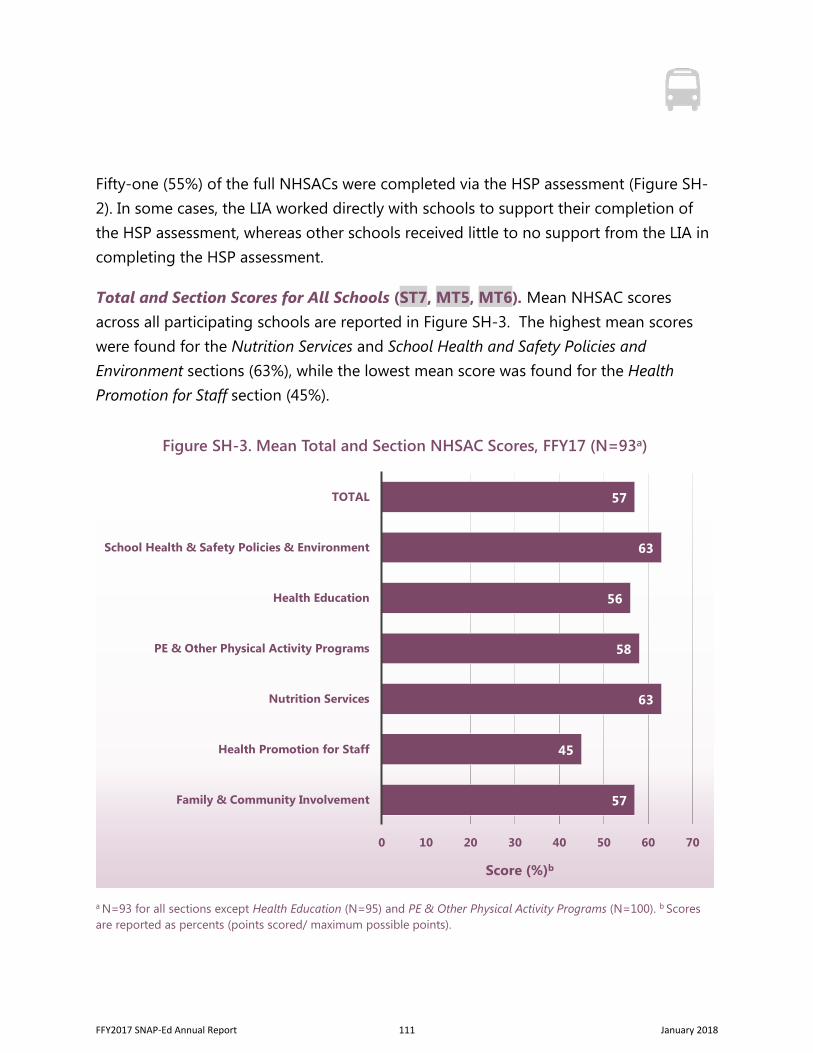
Fifty-one (55%) of the full NHSACs were completed via the HSP assessment (Figure SH-2). In some cases, the LIA worked directly with schools to support their completion of the HSP assessment, whereas other schools received little to no support from the LIA in completing the HSP assessment.
Total and Section Scores for All Schools (ST7, MT5, MT6). Mean NHSAC scores across all participating schools are reported in Figure SH-3. The highest mean scores were found for the Nutrition Services and School Health and Safety Policies and Environment sections (63%), while the lowest mean score was found for the Health Promotion for Staff section (45%).
a N=93 for all sections except Health Education (N=95) and PE & Other Physical Activity Programs (N=100). b Scores are reported as percents (points scored/ maximum possible points).
57
45
63
58
56
63
57
0 10 20 30 40 50 60 70
Family & Community Involvement
Health Promotion for Staff
Nutrition Services
PE & Other Physical Activity Programs
Health Education
School Health & Safety Policies & Environment
TOTAL
Score (%)b
Figure SH-3. Mean Total and Section NHSAC Scores, FFY17 (N=93a)
FFY2017 SNAP-Ed Annual Report 111 January 2018
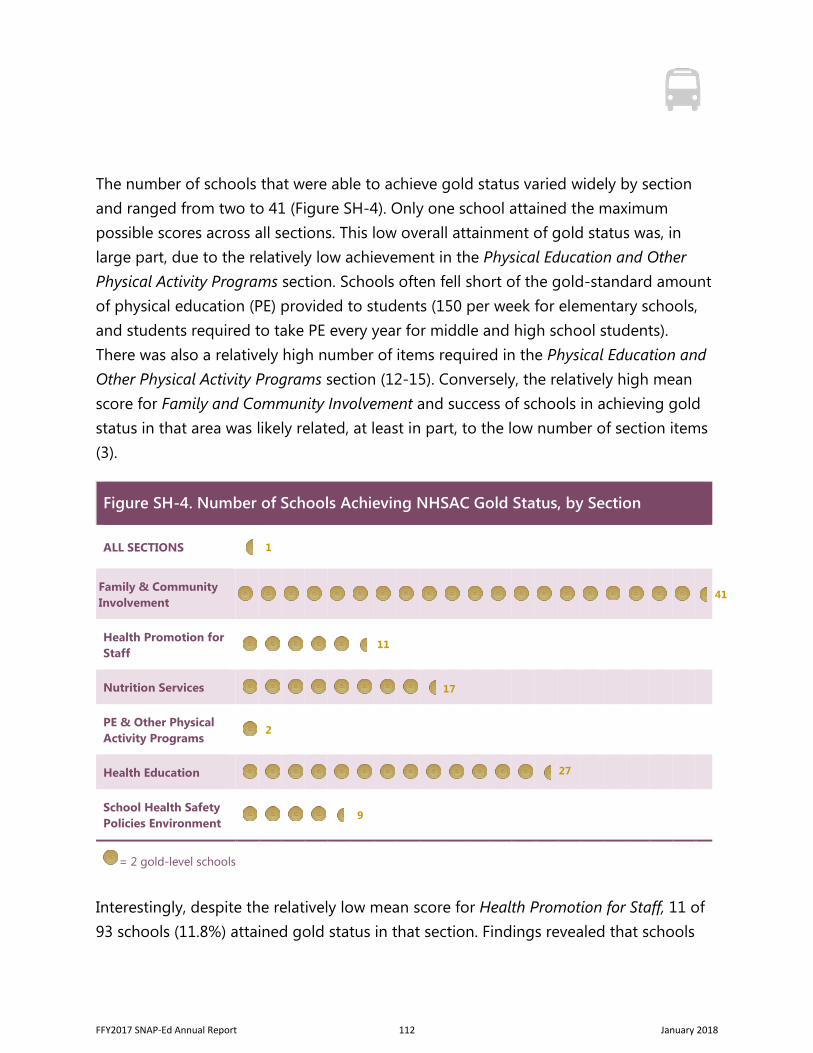
The number of schools that were able to achieve gold status varied widely by section and ranged from two to 41 (Figure SH-4). Only one school attained the maximum possible scores across all sections. This low overall attainment of gold status was, in large part, due to the relatively low achievement in the Physical Education and Other Physical Activity Programs section. Schools often fell short of the gold-standard amount of physical education (PE) provided to students (150 per week for elementary schools, and students required to take PE every year for middle and high school students). There was also a relatively high number of items required in the Physical Education and Other Physical Activity Programs section (12-15). Conversely, the relatively high mean score for Family and Community Involvement and success of schools in achieving gold status in that area was likely related, at least in part, to the low number of section items (3).
Figure SH-4. Number of Schools Achieving NHSAC Gold Status, by Section
ALL SECTIONS 1
Family & Community Involvement
41
Health Promotion for Staff
Nutrition Services
PE & Other Physical Activity Programs
2
Health Education
School Health Safety Policies Environment
9
= 2 gold-level schools
Interestingly, despite the relatively low mean score for Health Promotion for Staff, 11 of 93 schools (11.8%) attained gold status in that section. Findings revealed that schools
11
17
27
FFY2017 SNAP-Ed Annual Report 112 January 2018
with any staff wellness programs tended to achieve silver or gold status, while the lower mean score was influenced by schools that had no staff wellness activities at all.
Schools interested in national recognition at any HSP award level must actively apply to the Alliance for a Healthier Generation and achieve bronze, silver, or gold status across all HSP sections. In 2017, 30 Arizona schools earned a National Healthy Schools Award. Twelve were SNAP-Ed-participating elementary schools, 18 were non-SNAP-Ed-participating elementary schools, and all were located in Mesa, AZ.6 We attribute the success of these schools to the district-wide implementation of the Mesa Public Schools’ Elementary Physical Education Program.7
HSP versus non-HSP Schools. When NHSAC scores were grouped by involvement in the HSP, a clear association emerged of higher scores with HSP participation (Figure SH-5). HSP schools scored significantly higher in all sections except for Family and Community Involvement. The most notable difference was in the Health Promotion for Staff section: while non-HSP schools had a median score of 0% and (mean score of 21%), HSP schools had a median score of 83% (mean 64%).
An interesting question related to these findings is whether HSP schools scored higher because of their participation in the HSP, or whether schools that chose to participate in the HSP were more apt to already have more school health activities in place. Both factors likely influenced the overall difference in scores, however further investigation is warranted to better understand those influences. Moreover, the LIA’s role in facilitating the HSP-school relationship is not yet clear. In some cases, LIAs had little to no involvement in the FFY17 HSP assessment process. In other cases, LIAs participated in the HSP assessment; and in still other cases, the LIA played a central role in linking the school to the HSP and the subsequent assessment. Future systematic tracking of the LIA’s role supporting HSP involvement would improve understanding of the part played by SNAP-Ed LIAs in advancing school health initiatives.
FFY2017 SNAP-Ed Annual Report 113 January 2018
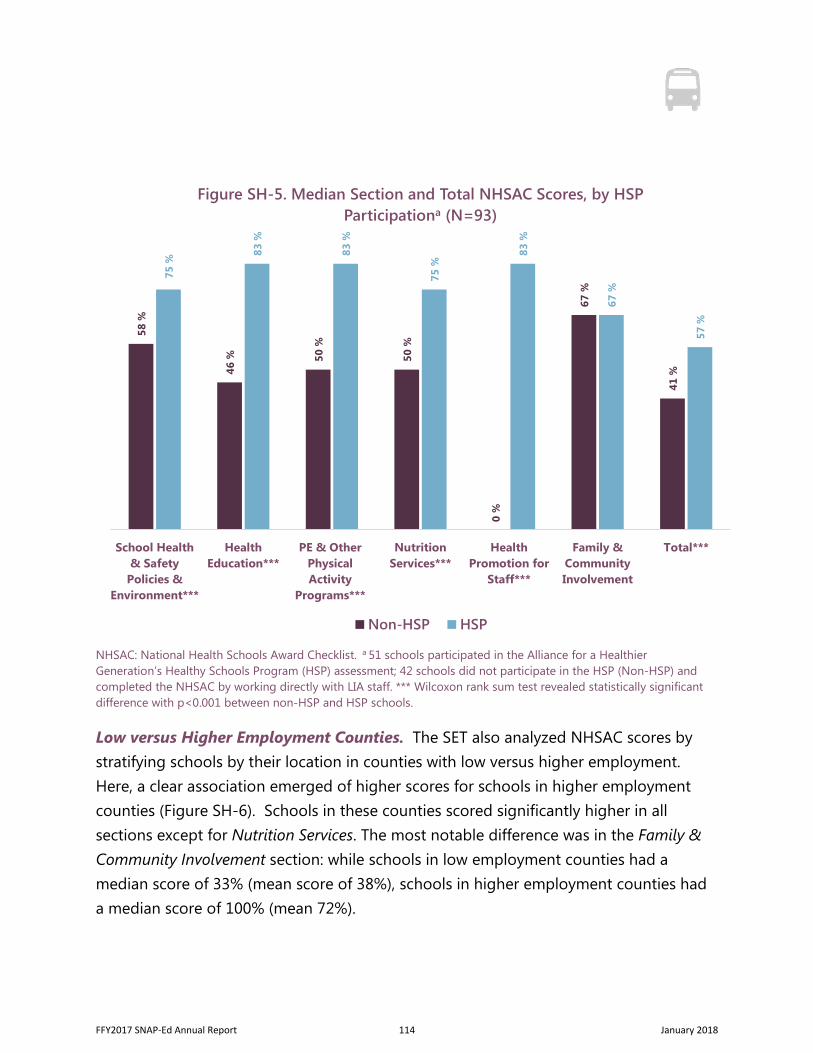
NHSAC: National Health Schools Award Checklist. a 51 schools participated in the Alliance for a Healthier Generation’s Healthy Schools Program (HSP) assessment; 42 schools did not participate in the HSP (Non-HSP) and completed the NHSAC by working directly with LIA staff. *** Wilcoxon rank sum test revealed statistically significant difference with p<0.001 between non-HSP and HSP schools.
Low versus Higher Employment Counties. The SET also analyzed NHSAC scores by stratifying schools by their location in counties with low versus higher employment. Here, a clear association emerged of higher scores for schools in higher employment counties (Figure SH-6). Schools in these counties scored significantly higher in all sections except for Nutrition Services. The most notable difference was in the Family & Community Involvement section: while schools in low employment counties had a median score of 33% (mean score of 38%), schools in higher employment counties had a median score of 100% (mean 72%).
58%
46 % 50
%
50 %
0 %
67 %
41 %
75 %
83 %
83 %
75 %
83 %
67 %
57 %
School Health& Safety
Policies &Environment***
HealthEducation***
PE & OtherPhysicalActivity
Programs***
NutritionServices***
HealthPromotion for
Staff***
Family &CommunityInvolvement
Total***
Figure SH-5. Median Section and Total NHSAC Scores, by HSP Participationa (N=93)
Non-HSP HSP
FFY2017 SNAP-Ed Annual Report 114 January 2018
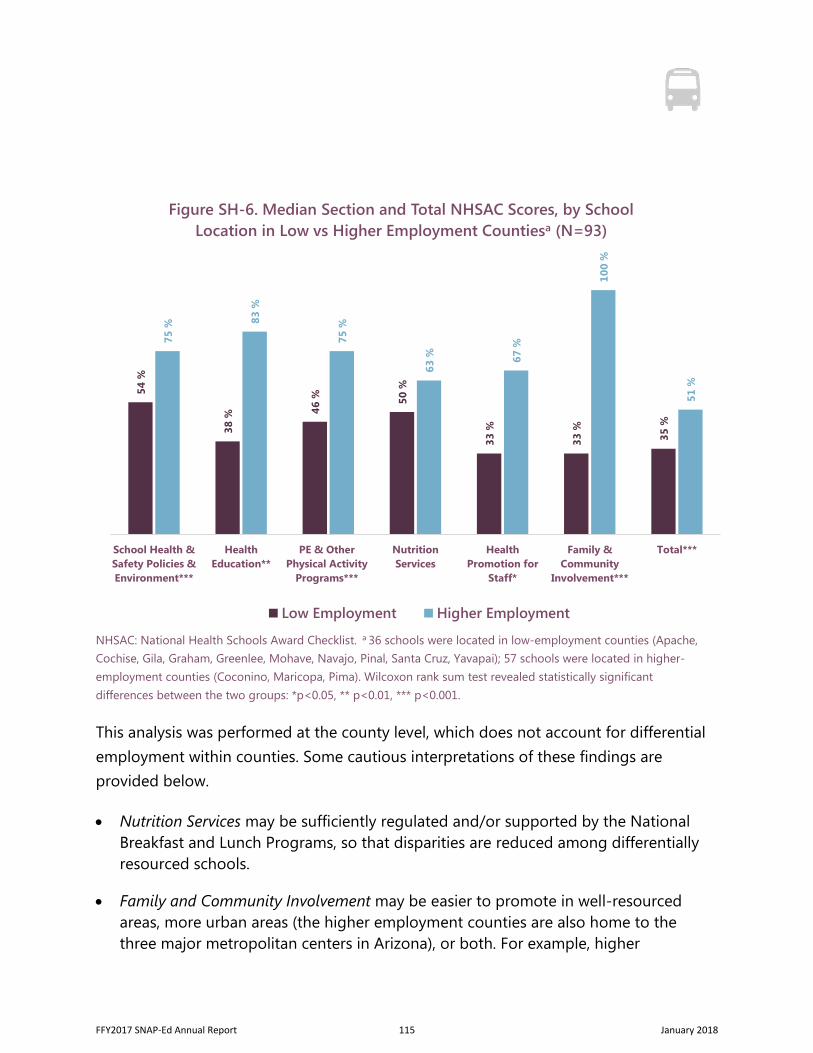
NHSAC: National Health Schools Award Checklist. a 36 schools were located in low-employment counties (Apache, Cochise, Gila, Graham, Greenlee, Mohave, Navajo, Pinal, Santa Cruz, Yavapai); 57 schools were located in higher-employment counties (Coconino, Maricopa, Pima). Wilcoxon rank sum test revealed statistically significant differences between the two groups: *p<0.05, ** p<0.01, *** p<0.001.
This analysis was performed at the county level, which does not account for differential employment within counties. Some cautious interpretations of these findings are provided below.
• Nutrition Services may be sufficiently regulated and/or supported by the National Breakfast and Lunch Programs, so that disparities are reduced among differentially resourced schools.
• Family and Community Involvement may be easier to promote in well-resourced areas, more urban areas (the higher employment counties are also home to the three major metropolitan centers in Arizona), or both. For example, higher
54 %
38 %
46 % 50
%
33 %
33 %
35 %
75 %
83 %
75 %
63 % 67
%
100
%
51 %
School Health &Safety Policies &Environment***
HealthEducation**
PE & OtherPhysical Activity
Programs***
NutritionServices
HealthPromotion for
Staff*
Family &Community
Involvement***
Total***
Figure SH-6. Median Section and Total NHSAC Scores, by School Location in Low vs Higher Employment Countiesa (N=93)
Low Employment Higher Employment
FFY2017 SNAP-Ed Annual Report 115 January 2018
employment rates or closer family proximity to schools may enable better communication than in low employment areas or rural areas. Also, closer proximity to schools may encourage the development of programming such as joint use agreements that allow family and community access to school facilities outside of school hours.
• Schools in the low employment counties may have less overall support for any non-essential educational activities. Barriers to school health may include fewer school staff, less funding (e.g., no designated grant writer), transportation challenges (especially in rural areas), fewer training opportunities, and more limited access to facilities.
Presence of an Active School Health Advisory Committee (ST7). An active School Health Advisory Committee (SHAC) provides a forum for advancing school health initiatives among the school community, and provides a natural partner for LIAs as they reach out to schools. The very first NHSAC item addresses the existence of an active SHAC: “School has a representative committee or team that meets at least four times a year and oversees school health and safety policies and programs.” More than three quarters (78.5%) of schools that completed this NSHAC item reported having an active SHAC. HSP participation was likely central to SHAC development, as schools benefit from convening a team to work through the HSP process (Figure SH-1). However, regardless of whether the initial SHAC was developed in conjunction with the HSP, out of a school’s internal initiative, or from working with a SNAP-Ed partner, the reported widespread existence of active, school-level teams is encouraging in that they can provide LIAs with a means by which to collaborate and communicate regularly.
Classroom Curricula to Improve Access to Nutrition Information (MT5). As a PSE strategy, LIAs can provide trainings for school staff (usually teachers) on AZ Health Zone-approved curricula. The Health Education section of the NHSAC provides an excellent measure of success in this area: Section items capture whether standards-based, behaviorally-focused health education is in place at schools at all grade levels, what essential topics are covered, and whether professional development for teachers is provided. In FFY17, 27 of 95 schools (28%) that completed this section achieved perfect scores (Figure SH-4), and on average, schools implemented over half of all the
FFY2017 SNAP-Ed Annual Report 116 January 2018
section items (56.3%). Scores were far higher in schools that participated in the HSP (Figure SH-5) and in schools that were located in high employment counties (SH-6). This suggests that access to health education resources is vital to institutionalizing a health education program at schools that includes professional development and the school-wide adoption of standards-based curricula. Given SNAP-Ed’s familiarity with a variety of behaviorally-focused, AZ Health Zone-approved, and standards-based curricula, LIAs are well poised to fill this need by providing teacher trainings and information regarding free and low-cost curricula that align with other academic standards. This support is especially needed in lower-resourced schools.
CSPAP (MT6). The Physical Education and Other Physical Activity Programs section of the NHSAC covers the amount and type of PE in place at schools at all grade levels, professional development of staff, active transport, before and after school programs, recess, physical activity breaks for students, and community involvement in school-based physical activity. In FFY17, only two of 100 schools (2%) that completed this section achieved perfect scores (Figure SH-4). However, on average schools implemented over half of all the section items (58%), and the difficulty in achieving gold status was likely due to the large number of section items and the progressive requirement for greater amounts of PE at each level (bronze, silver, and gold). In fact, 31 schools (31%) achieved bronze status for this section, where the minimum amount of weekly PE is only 60 minutes per week for elementary students and one semester of PE for middle and high school students. Section scores were significantly higher in schools that participated in the HSP (Figure SH-5) and in schools that were located in high employment counties (SH-6). This, like Health Education, suggests that access to PE and physical activity resources is vital to institutionalizing CSPAP at schools. As Arizona’s LIAs become increasingly familiar with a variety of methods to address CSPAP, their services may prove critical to developing CSPAP in lower-resourced schools. Specifically, LIAs who are unable to address PE programs can target the “other physical activity” elements of the NHSAC to promote physical activity opportunities throughout the normal and extended school day.
FFY2017 SNAP-Ed Annual Report 117 January 2018
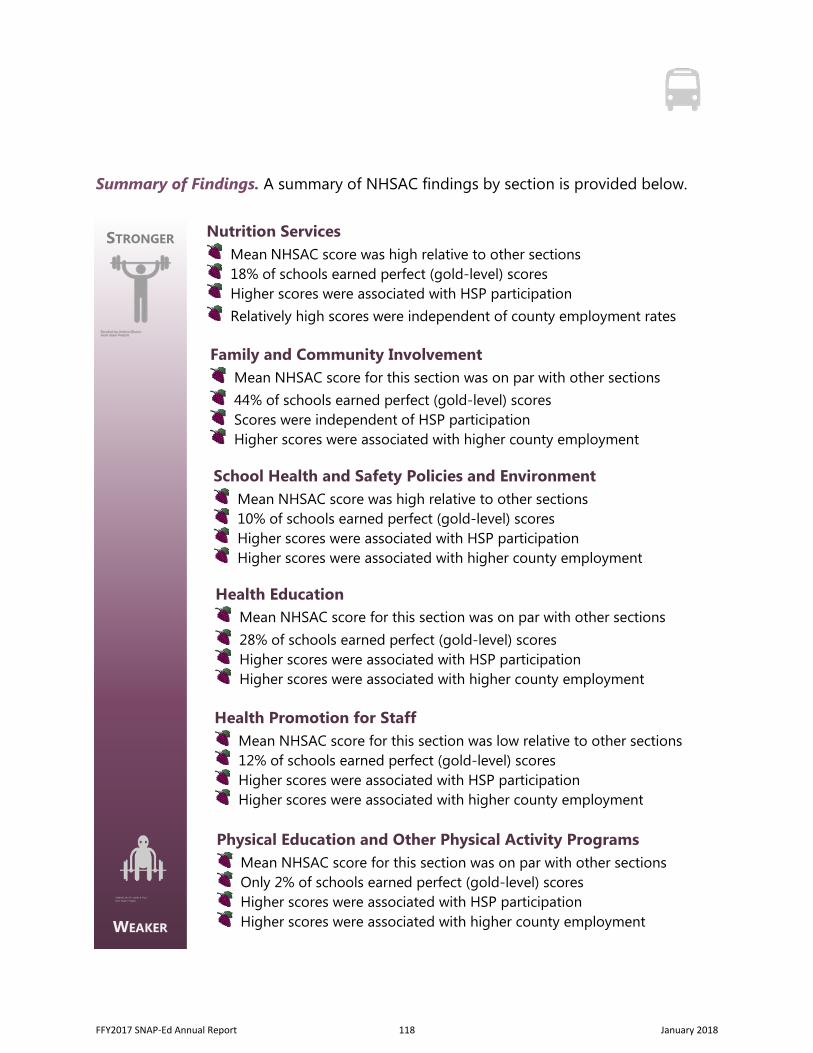
STRONGER
WEAKER
Summary of Findings. A summary of NHSAC findings by section is provided below.
School Health and Safety Policies and Environment Mean NHSAC score was high relative to other sections 10% of schools earned perfect (gold-level) scores Higher scores were associated with HSP participation Higher scores were associated with higher county employment
Health Education Mean NHSAC score for this section was on par with other sections 28% of schools earned perfect (gold-level) scores Higher scores were associated with HSP participation Higher scores were associated with higher county employment
Family and Community Involvement Mean NHSAC score for this section was on par with other sections 44% of schools earned perfect (gold-level) scores Scores were independent of HSP participation Higher scores were associated with higher county employment
Health Promotion for Staff Mean NHSAC score for this section was low relative to other sections 12% of schools earned perfect (gold-level) scores Higher scores were associated with HSP participation Higher scores were associated with higher county employment
Physical Education and Other Physical Activity Programs
Mean NHSAC score for this section was on par with other sections Only 2% of schools earned perfect (gold-level) scores Higher scores were associated with HSP participation Higher scores were associated with higher county employment
Nutrition Services Mean NHSAC score was high relative to other sections 18% of schools earned perfect (gold-level) scores Higher scores were associated with HSP participation Relatively high scores were independent of county employment rates
FFY2017 SNAP-Ed Annual Report 118 January 2018
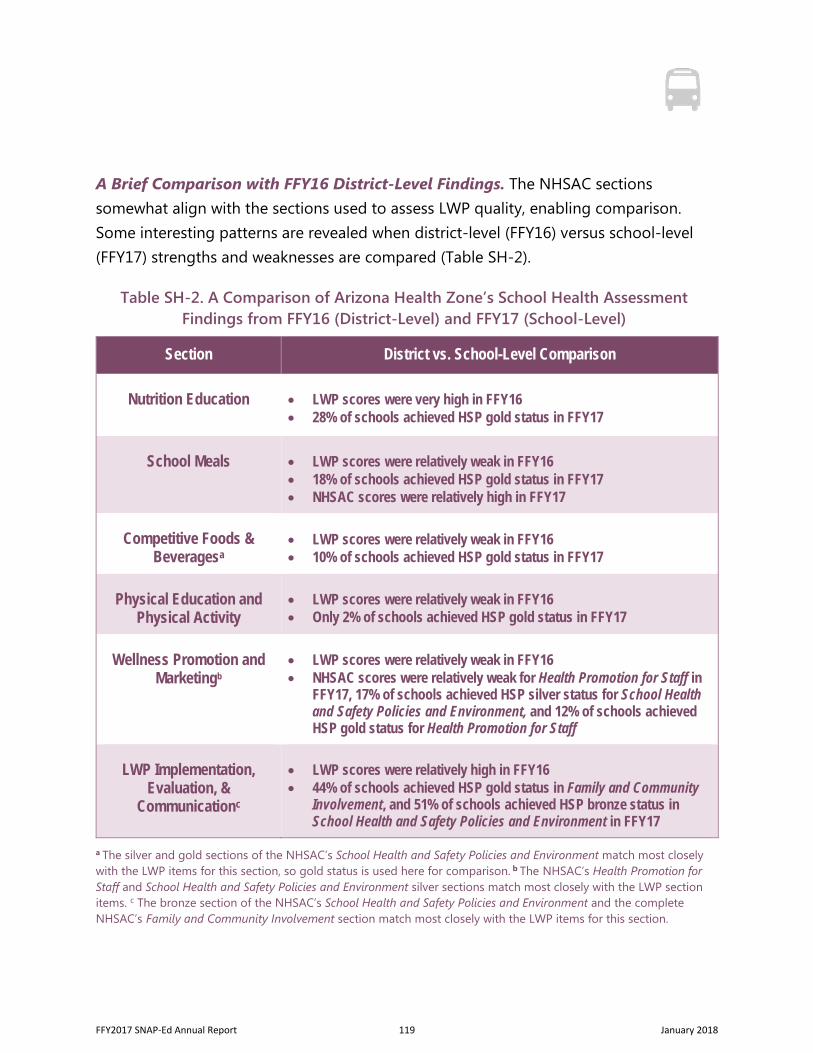
A Brief Comparison with FFY16 District-Level Findings. The NHSAC sections somewhat align with the sections used to assess LWP quality, enabling comparison. Some interesting patterns are revealed when district-level (FFY16) versus school-level (FFY17) strengths and weaknesses are compared (Table SH-2).
Table SH-2. A Comparison of Arizona Health Zone’s School Health Assessment Findings from FFY16 (District-Level) and FFY17 (School-Level)
Section District vs. School-Level Comparison
Nutrition Education • LWP scores were very high in FFY16• 28% of schools achieved HSP gold status in FFY17
School Meals • LWP scores were relatively weak in FFY16• 18% of schools achieved HSP gold status in FFY17• NHSAC scores were relatively high in FFY17
Competitive Foods & Beveragesa
• LWP scores were relatively weak in FFY16• 10% of schools achieved HSP gold status in FFY17
Physical Education and Physical Activity
• LWP scores were relatively weak in FFY16• Only 2% of schools achieved HSP gold status in FFY17
Wellness Promotion and Marketingb
• LWP scores were relatively weak in FFY16• NHSAC scores were relatively weak for Health Promotion for Staff in
FFY17, 17% of schools achieved HSP silver status for School Healthand Safety Policies and Environment, and 12% of schools achievedHSP gold status for Health Promotion for Staff
LWP Implementation, Evaluation, &
Communicationc
• LWP scores were relatively high in FFY16• 44% of schools achieved HSP gold status in Family and Community
Involvement, and 51% of schools achieved HSP bronze status in School Health and Safety Policies and Environment in FFY17
a The silver and gold sections of the NHSAC’s School Health and Safety Policies and Environment match most closely with the LWP items for this section, so gold status is used here for comparison. b The NHSAC’s Health Promotion for Staff and School Health and Safety Policies and Environment silver sections match most closely with the LWP section items. c The bronze section of the NHSAC’s School Health and Safety Policies and Environment and the complete NHSAC’s Family and Community Involvement section match most closely with the LWP items for this section.
FFY2017 SNAP-Ed Annual Report 119 January 2018
In general, Arizona’s SNAP-Ed-participating schools and districts appear to be relatively strong in promoting health education (MT5), however school-level implementation of comprehensive, standards-based curricula at all grade levels is not as strong as district policies often require. The implementation of LWPs and communication with families (MT5, MT6) also appear to be an overall strength, while CSPAP (MT6) emerges as a weakness common across districts and schools. Another weak area spanning both the district and school level is wellness promotion and marketing (MT5, MT6), although schools that do address this area tend to do so comprehensively. Interestingly, written LWPs scored low in school meal standards and nutrition standards for competitive foods and beverages, however schools appear to be implementing USDA guidelines and other best practices in these areas (MT5). This difference may be partly due to recent federal legislation calling for greater adherence to the USDA’s Smart Snack Standards for competitive foods and beverages. Also, school meal standards may be absent from written LWPs but adhered to in other school and district policies due to the USDA’s oversight of the National School Breakfast and Lunch Programs.
Implications of Findings. State-level implications of the findings reported here are related to interagency coordination, LIA trainings on targeted topics, and the continued involvement of the AZ Health Zone in the HSP.
CSPAP. The AZ Health Zone has already prioritized physical education and other physical activity programs by developing a dedicated school health strategy for CSPAP. Nonetheless, Arizona schools continue to struggle with implementing and sustaining PE and other physical activity programs. Specifically, PE in schools from K-12 tends to fall far short of the National Association for Sport and Physical Education (NASPE) recommendations (150 minutes of weekly instructional PE for elementary school students and 225 minutes for middle and high school students). Interagency coordination to enhance state-level requirements for proving minimum minutes of weekly PE could have far-reaching, positive effects in Arizona. Moreover, schools in counties with low employment appear to struggle disproportionately with CSPAP. Coordination at the state agency- and local agency-levels could include: transportation supports (e.g., families in more rural or lower resourced areas may be unable to transport students to and from extracurricular physical activities), facilities supports
FFY2017 SNAP-Ed Annual Report 120 January 2018
(e.g., mapping community facilities for joint use by schools), facilitating connections to community partners (e.g., distributing contact lists for schools with LIAs and other community partners who may provide free physical activity programs), and dedicated CSPAP funding (for hiring PE teachers, purchasing equipment, etc.).
LIA Training. The findings reported here underscore the need for LIAs to receive training focused upon: (1) school staff wellness promotion, including the critical role that staff play in modelling behaviors for students, (2) CSPAP that can be implemented in lower-resourced or more rural areas, and (3) how to support school participation in the HSP. Moreover, the AZ Health Zone may wish to communicate with the Mesa Public Schools elementary PE program to learn more about their successful approach to CSPAP.
The Healthy Schools Program. Not surprisingly, schools that participated in the HSP attained higher scores on the NHSAC. That said, the difference in scores between non-HSP versus HSP schools was striking for all but one section. These results bolster the AZ Health Zone’s decision to engage in an MOU with the Alliance for a Healthier Generation and provide LIAs with HSP trainings in FFY17. In the future, the AZ Health Zone may wish to track how LIAs use the HSP with schools, capturing information such as whether the LIA played a pivotal role in the school’s HSP participation, what support the LIA provided during any HSP assessments, and what support the LIA provided beyond the assessment step of the HSP process.
FFY2017 SNAP-Ed Annual Report 121 January 2018
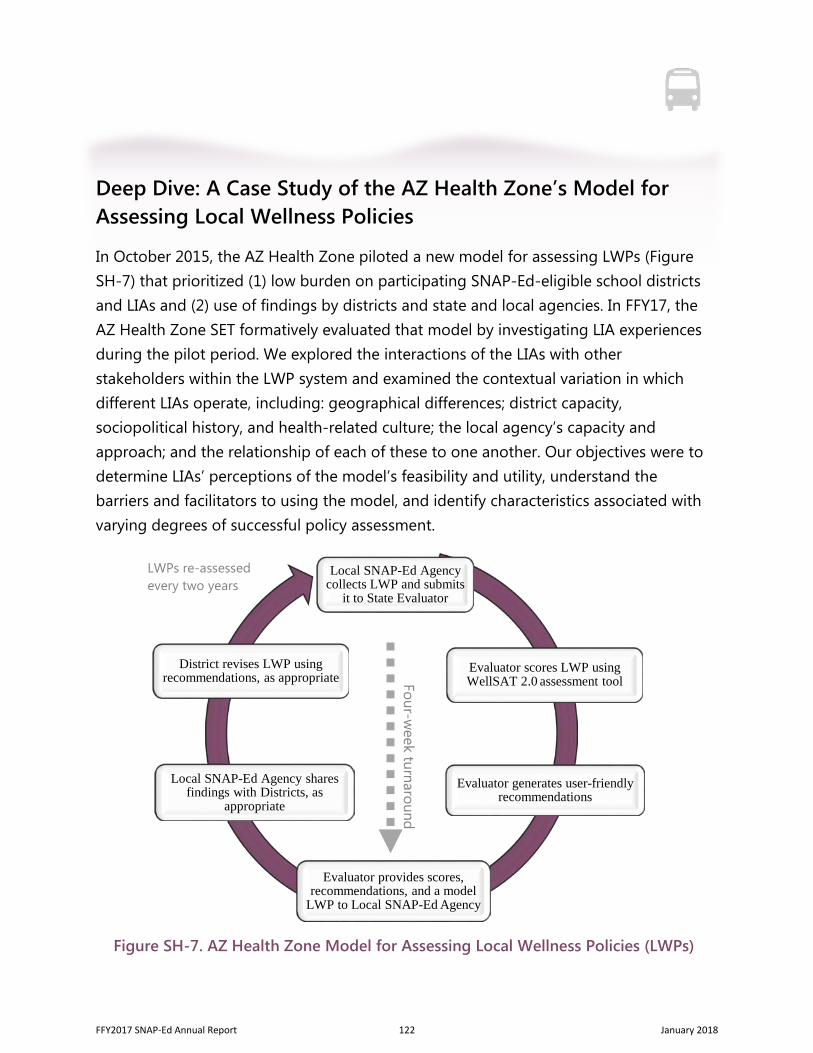
Deep Dive: A Case Study of the AZ Health Zone’s Model for Assessing Local Wellness Policies
In October 2015, the AZ Health Zone piloted a new model for assessing LWPs (Figure SH-7) that prioritized (1) low burden on participating SNAP-Ed-eligible school districts and LIAs and (2) use of findings by districts and state and local agencies. In FFY17, the AZ Health Zone SET formatively evaluated that model by investigating LIA experiences during the pilot period. We explored the interactions of the LIAs with other stakeholders within the LWP system and examined the contextual variation in which different LIAs operate, including: geographical differences; district capacity, sociopolitical history, and health-related culture; the local agency’s capacity and approach; and the relationship of each of these to one another. Our objectives were to determine LIAs’ perceptions of the model’s feasibility and utility, understand the barriers and facilitators to using the model, and identify characteristics associated with varying degrees of successful policy assessment.
Figure SH-7. AZ Health Zone Model for Assessing Local Wellness Policies (LWPs)
Local SNAP-Ed Agency collects LWP and submits
it to State Evaluator
Evaluator scores LWP using WellSAT 2.0 assessment tool
Evaluator generates user-friendly recommendations
Evaluator provides scores, recommendations, and a model
LWP to Local SNAP-Ed Agency
Local SNAP-Ed Agency shares findings with Districts, as
appropriate
District revises LWP using recommendations, as appropriate Four-w
eek turnaround
LWPs re-assessed every two years
FFY2017 SNAP-Ed Annual Report 122 January 2018
Methods. To gather information-rich cases from local agencies across the state, we combined criterion and maximum variation sampling strategies.8 Criterion-based sampling was used to identify key informants who were involved in each phase of the LWP assessment process (Figure SH-7). To maximize the heterogeneity of responses, all staff meeting this criterion were invited to participate. This enabled the identification of central themes pervading all agency experiences and the exploration of contextual variation by geography and other factors.
Participants. Thirteen LIAs met the study criterion: eight cooperative extension units and five county health departments across 11 of Arizona’s 15 counties. LIAs were asked to confirm which staff members were actively involved in all LWP assessment phases for targeted recruitment, however inclusion was not based upon level of LWP experience. We achieved maximum heterogeneity, conducting 13 interviews (30-60 minutes) with 15 LIA staff across 11 counties. Eleven were phone interviews, and two were in person.
Data Collection. We used open-ended semi-structured interviews to explore LIA staff experiences with the LWP assessment model. A standardized script ensured interviews covered the same topics and included a series of questions covering general perceptions of the statewide LWP assessment process, experience with each phase, what they learned if anything from the process, and any opportunities that resulted from their participation in LWP assessment. The interviewer recorded verbatim responses in real time by typing shorthand into the script. Responses were translated back to longhand immediately following the interview.
Data Analysis. After data collection, Word documents for all interviews were imported into NVivo v11.0 software for coding and theme analysis by the interviewer and a second SET member. Using constant comparative analysis,8 we reviewed interviews to develop grounded (emergent) codes and refined those codes with iterative review. Our sensitizing framework for analysis centered on these questions:
• How did LIAs perceive the LWP assessment model in terms of feasibility and utility? • What characteristics were associated with different levels of success in
implementing the process?
FFY2017 SNAP-Ed Annual Report 123 January 2018
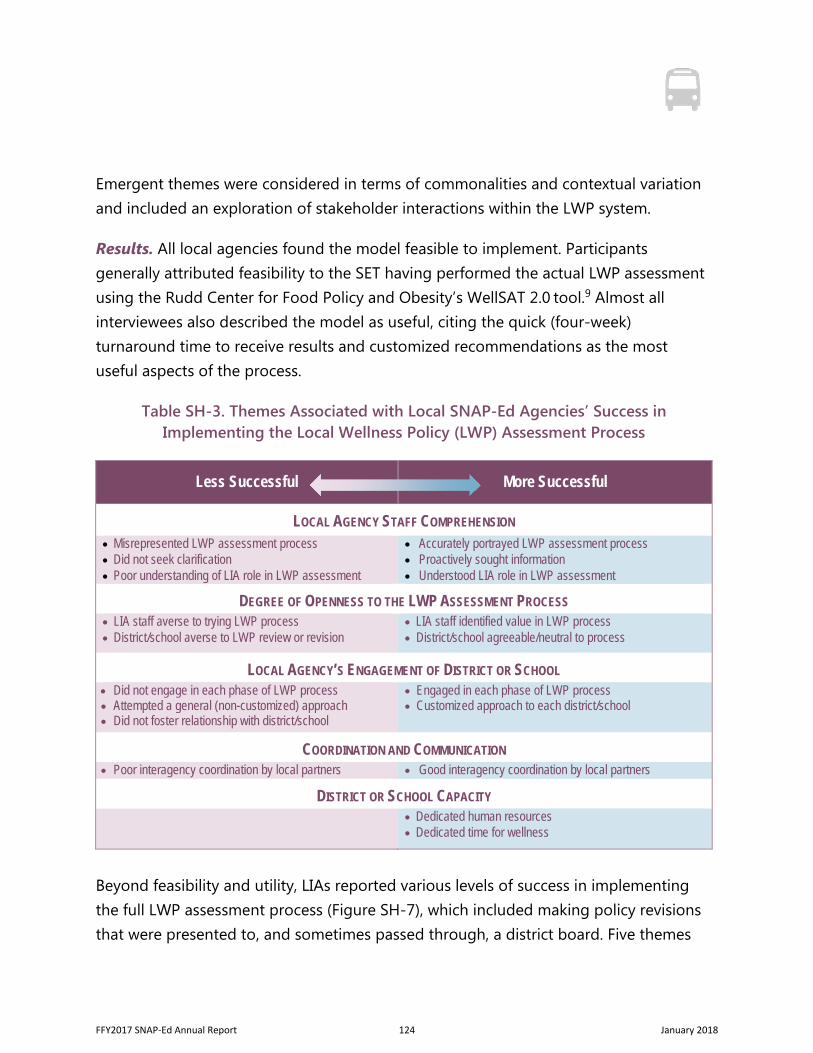
Emergent themes were considered in terms of commonalities and contextual variation and included an exploration of stakeholder interactions within the LWP system.
Results. All local agencies found the model feasible to implement. Participants generally attributed feasibility to the SET having performed the actual LWP assessment using the Rudd Center for Food Policy and Obesity’s WellSAT 2.0 tool.9 Almost all interviewees also described the model as useful, citing the quick (four-week) turnaround time to receive results and customized recommendations as the most useful aspects of the process.
Table SH-3. Themes Associated with Local SNAP-Ed Agencies’ Success in Implementing the Local Wellness Policy (LWP) Assessment Process
Less Successful More Successful
LOCAL AGENCY STAFF COMPREHENSION • Misrepresented LWP assessment process• Did not seek clarification• Poor understanding of LIA role in LWP assessment
• Accurately portrayed LWP assessment process• Proactively sought information• Understood LIA role in LWP assessment
DEGREE OF OPENNESS TO THE LWP ASSESSMENT PROCESS • LIA staff averse to trying LWP process• District/school averse to LWP review or revision
• LIA staff identified value in LWP process• District/school agreeable/neutral to process
LOCAL AGENCY’S ENGAGEMENT OF DISTRICT OR SCHOOL • Did not engage in each phase of LWP process• Attempted a general (non-customized) approach• Did not foster relationship with district/school
• Engaged in each phase of LWP process• Customized approach to each district/school
COORDINATION AND COMMUNICATION • Poor interagency coordination by local partners • Good interagency coordination by local partners
DISTRICT OR SCHOOL CAPACITY• Dedicated human resources• Dedicated time for wellness
Beyond feasibility and utility, LIAs reported various levels of success in implementing the full LWP assessment process (Figure SH-7), which included making policy revisions that were presented to, and sometimes passed through, a district board. Five themes
FFY2017 SNAP-Ed Annual Report 124 January 2018
emerged that were associated with degree of success (Table SH-3). Three themes tracked strongly with success across all agencies: 1) Local Agency Staff’s Comprehension, 2) Degree of Openness to the LWP Assessment Process, and 3) Local Agency Engagement of the District or School. Coordination and Communication and District or School Capacity were recurrent interview themes, however they were not as clearly associated with success in carrying out LWP review and revision. Local Agency Staff Comprehension. Respondents varied in how well they understood LWPs, the AZ Health Zone LWP assessment process, and their role in that process. They also differed in the degree to which they pursued more information about these topics. This theme was not associated with agency capacity, but it did track with openness of the interviewee to learning about policies and engaging in the assessment process. The most successful agencies were ones that anticipated the importance of policy work in promoting school health, valued (and referred to) the training they received on the assessment process, and were proactive in seeking more information:
Less successful LIAs were either unaware of their lack of understanding or did not seek clarification given a dearth of knowledge: “Maybe [I could have used] more explanation about what comprehensiveness and strength scores meant. You may have covered it but in the hustle and bustle it got lost.”
Degree of Openness to the LWP Assessment Process. Numerous interviewees described district and school representatives who were reticent to revise policies because they
“When I first heard about the process, it was a matter of finding as much information as I could. I went to the WellSAT website, read extensively to have a better understanding of what the WellSAT was to assist my programming work. I started working on wellness policies the year before we started this, so I knew it was coming and had done a lot of research on wellness policies, and I had already started talking to districts about updating wellness policies.”
FFY2017 SNAP-Ed Annual Report 125 January 2018
anticipated rejection, especially during the board approval stage. In some cases, respondents reported the LEA’s fear of potential litigation:
LIA staff often interpreted these concerns as reflecting the need for greater top-down support from state and local leadership to coordinate efforts and guide policy improvements.
Advocacy by champions such as LIA staff, district or school personnel, and other local partners for making policy improvements had a substantial influence on whether the review and revision process was completed. Examples include a district administrator who was “all for it,” a wellness committee member who was “very passionate about improving the policy,” and a local agency staff person who could “feel intuitively that the policy review process was the direction we had to go.” LIA staff who were particularly receptive to the assessment model described how it benefitted their SNAP-Ed work; many portrayed the process as helping to launch or further engage wellness committees.
Local Agency Engagement of the District or School. The most successful agencies had staff who engaged the district or school early in the LWP assessment process and continued to provide support through final board approval. Early engagement included contacting LEA representatives, either for a copy of the policy or to verify that the policy found online was the correct version. One successful interviewee explained, “[W]e verified it with the district because I wanted them to be in charge of giving me the go-ahead.”
“Most of the districts used the ASBA [Arizona School Board Association] template for their wellness policies, and we’re finding that they’re really concerned about deviating at all from that language. In [one district], she made it seem like they thought that if they deviated they would not necessarily be covered in case of a lawsuit.”
FFY2017 SNAP-Ed Annual Report 126 January 2018
After having received results and recommendations, agency staff who took time to review and interpret findings before sharing these with districts were generally better received:
Once findings were shared, follow-up was vital to their use by districts or schools and was most effective when the interviewee was a member of the district or school wellness committee. The supportive role of the local agency was typified in this participant’s summary of the process: “Upon receiving results, we brought them to the next…wellness committee meeting, gave copies to everybody, and went through them step by step.”
Less successful LIAs usually failed to engage the LEA at one or more stages of the assessment process. Some did not establish early buy-in (“[I]f we could find [the LWP] easily online, we never contacted a district person”), while others began by building relationships but did not follow through after sharing results (“They were appreciative for any information, but whether or not they’re going to use the information is another story”).
It was also important for LIAs to customize their engagement approach to each district or school. Overall, participants showed an impressive awareness of inter-district variation and how that should influence their approach. One interviewee emphasized “learning about the district, who’s the movers and shakers, knowing what each can do…talking to teachers, community leaders, just paying attention when you go into the office, what’s on the counter, ‘cause it gives you an idea of what’s going on in the district.” Moreover, interviewees who were less successful because they attempted a broad, top-down approach appeared to have learned from their mistake: “At this point we’re in the process of making our own connections with districts without relying on the [county-level agency], so that we can be in charge of our own message.”
“I remember feeling like wow this is a lot, and then I pared it down for the partner. I’d already reviewed all of the recommendations before meeting…then we…said we’d like to get together to put these recommendations to work in an enhanced wellness policy. And with the exception of one district, who later came back and was willing to examine their policy, everyone was totally ready to start.”
FFY2017 SNAP-Ed Annual Report 127 January 2018
While LEA engagement occurred across the spectrum of rural to urban regions, we should note that the state’s two most urban counties did describe more complex educational systems that often slowed progress by requiring more time and resources to move through multiple layers of bureaucracy.
Coordination and Communication. Interviewees recognized the importance of coordination and communication at the state, county, and within-district levels, however their ability to implement the assessment model was not as deeply tied to this theme. Success appeared to be most influenced by the quality of coordination at the county level. In one county, conflict between local agencies was described as creating “non-coordination of efforts” that confused districts, while another developed such a strong collaboration with another local organization that they developed a formal, shared process and reported, “We partner with 12 districts. Nine were reviewed, eight did revisions, and five of the eight have gotten board approval, with others in the queue.”
District or School Capacity. All interviewees described competing demands upon school districts and lack of dedicated resources as barriers to completing the LWP assessment process. However, LIA success in actually implementing the model was only marginally associated with respondents’ perceptions of financial resources, and surprisingly, competing demands on districts tracked inversely with success (i.e., LIAs who most often described competing demands upon districts tended to be more successful in supporting policy revisions). Instead, the two recurring facilitators of policy review and revision were (1) the presence of dedicated human resources such as a wellness committee or school health champion and (2) dedicated time provided by the LEA (e.g., via regular wellness meetings) for improving policies. Alternatively, where turnover was high, district and school capacity to focus upon LWP improvement was low, and local agencies had difficulty in maintaining progress: “In one school, everyone is new–the teachers, the principal, etc., are all new and now we’re starting all over with relationships. Sometimes no one is designated to take the place of the person who left, which has us at a standstill.”
FFY2017 SNAP-Ed Annual Report 128 January 2018
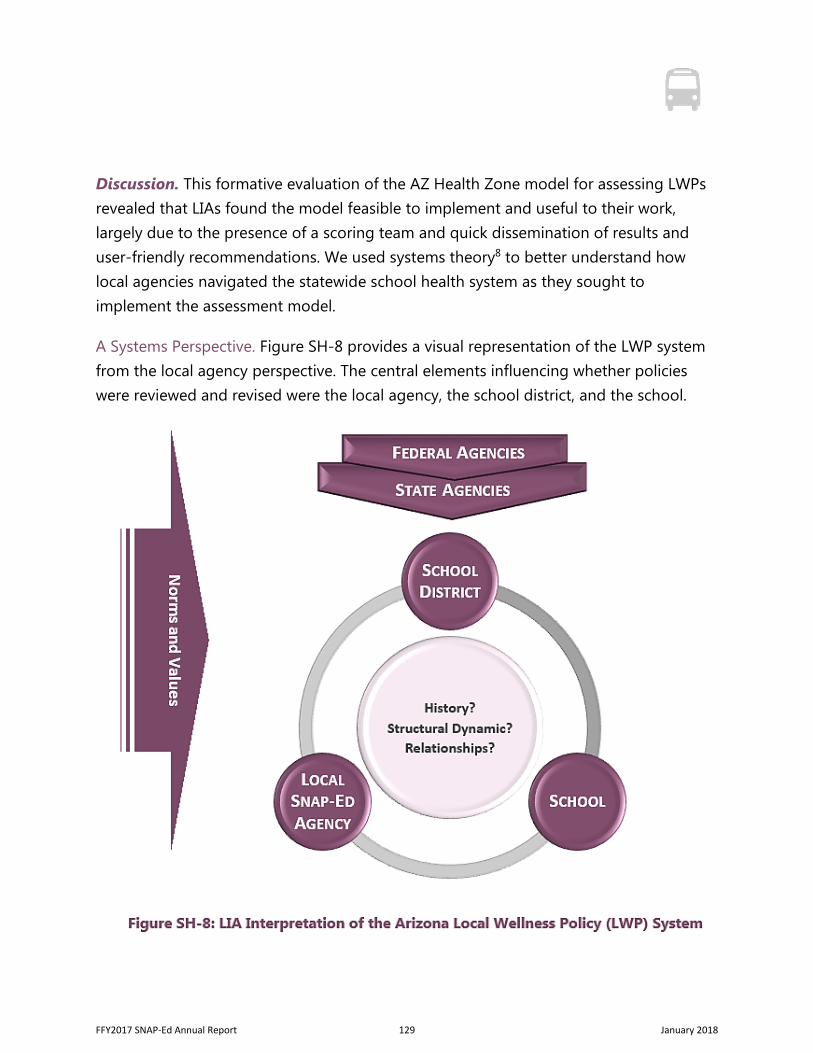
Discussion. This formative evaluation of the AZ Health Zone model for assessing LWPs revealed that LIAs found the model feasible to implement and useful to their work, largely due to the presence of a scoring team and quick dissemination of results and user-friendly recommendations. We used systems theory8 to better understand how local agencies navigated the statewide school health system as they sought to implement the assessment model.
A Systems Perspective. Figure SH-8 provides a visual representation of the LWP system from the local agency perspective. The central elements influencing whether policies were reviewed and revised were the local agency, the school district, and the school.
FFY2017 SNAP-Ed Annual Report 129 January 2018
These were embedded in the state system, which was in turn guided by federal agencies (the USDA and the Centers for Disease Control and Prevention). Various norms and values fed into the system and were dependent upon the stakeholder group’s sphere of influence and community and individual histories: Certain stakeholders (e.g., SNAP-Ed) were focused specifically upon nutrition and physical activity, while others (e.g., the Arizona Department of Education, or ADE) had a comprehensive school focus. For example, interviewees described the ADE as only monitoring policy compliance, while they saw the AZ Health Zone as concerned with LWP quality beyond compliance.
Participants were acutely aware of how state and federal leadership had influenced their interactions at the local level. Some called for stronger national or state governance related to LWPs, and many discussed the potential to leverage the USDA’s Final Rule, the ADE’s compliance requirements for districts, and the popularity of the Arizona School Boards Association template to accelerate LWP progress. Other researchers have likewise documented the importance of federal and state leadership: Even before the Healthy, Hunger-Free Kids Act (HHKA), Agron et al.10 identified the critical roles that state leadership, legislation, and well-coordinated agencies play in supporting LWPs, and other researchers have reported stronger district policies and practices in states that have stronger legislation.11-16
System elements (Figure SH-8) were consistently identified by interviewees, while contextual variation was embedded in the interactions of system elements. The unique relationships, structural dynamics, and histories among groups affected participants’ success and frequently varied within the same county: Where an LIA might have made impressive progress with District A, it might have made no progress with District B. One explanation is that stakeholders with various norms and values may have been differentially receptive to reviewing and revising policies. This seems even more likely when we consider that further qualitative analysis using matrix coding queries revealed that readiness to engage in the assessment process was found to be unrelated to county size, weakly associated with district or agency capacity, and strongly tied to the presence of a larger, supportive culture of school health that valued the role of the LWP. Similarly, Lucarelli et al.17 found that a positive school health climate and high
FFY2017 SNAP-Ed Annual Report 130 January 2018
perceived level of support correlated with a greater number of nutrition-related accomplishments in schools, and Hager18 reported that while system actions generated a low level of LWP success, stakeholders’ perceptions of system actions plus the actions themselves led to greater success. Cheung19 found that the sustainability of school health teams was heavily dependent on district- and school-level administrative support, and Agron et al.10 listed “long-term, top-level commitment to student health and wellness from administrators and the school board” and “a community environment that values wellness” among factors that contributed to policy success.
One particularly influential stakeholder group in Arizona was the school board. Local agencies often perceived the board as a barrier to policy improvement by blocking LWP revisions. Conversely, when a district board was supportive, improvements were more likely to be made and passed.
More generally, we found that the presence of any wellness champion, an active SHAC, or particularly proactive LIA staff considerably influenced the likelihood of success. This is consistent with other studies that have reported the most successful school health initiatives to be associated with the presence of SHACs, and, in some cases, intensely committed individuals.10,18-21 In this study, dedicated human resources and time were the only elements of School or District Capacity that were strongly correlated with policy improvements. Lack of funding was addressed during multiple interviews and described as a barrier, however it did not track with local agency success in revising policies. The literature certainly supports lack of funding as a perceived barrier to school health initiatives,15,17,19,22-24 however our findings suggest that stakeholder perceptions may not reflect the need for funding to be set aside for LWP assessment and revisions, specifically. On the other hand, budgetary constraints that lead to the general absence of or reduction in available human resources (wellness champions, SHACs) may be more detrimental to the school health climate,16,17,23 an idea supported by our findings.
Interestingly, a number of interviewees described competing demands on districts and schools as a barrier to LWP revision, but these local agencies were also the most successful. Like funding, competing demands are regularly reported as a perceived
FFY2017 SNAP-Ed Annual Report 131 January 2018
obstacle to school health,17,19,22-24 and because they have the potential to adversely impact the availability of dedicated human resources, the inverse relationship found in our study was surprising. However, when we consider our project’s focus upon LIAs who were specifically charged with improving school health as compared to the many priorities of the overburdened district or school, our findings may reveal just how important an intermediary agency can be to policy review and revision. As one interviewee explained, “The…administrator actually resurrected their SHAC and had tried to do the WellSAT on their own once but were overwhelmed, so this was a big help for them.” We suggest that the LIAs who were more sensitive to limited LEA capacity found ways to leverage their role as a cost-free support and fill an existing need.
Limitations. As members of the SET, we were familiar to interviewees and had led the LWP assessment process, which may have biased their willingness to report negative perceptions of the LWP assessment process or of the AZ Health Zone in general. We took multiple steps to engender trust, making clear at the invitation and interview stages that: 1) participation was fully optional, 2) the researchers valued both positive and negative feedback to help improve the state model, and 3) names and other identifying information shared during interviews would be de-identified.
We also recognize that the LEA perspectives presented here were interpreted through the lens of the local agency. Future exploration of the statewide LWP system should include the perspectives of other state and local stakeholder groups to identify areas of concordance and dissonance across groups who likely have different perspectives on policy.
Conclusions. The AZ Health Zone LWP assessment model was determined to be feasible and useful from the local agency perspective, which is encouraging given that the local agency is one primary end user (with districts and schools being others). The five emergent themes we identified were broadly addressed by all interviewees, which suggests that they pervaded the system at multiple levels. In general, level of success and associated themes did not vary by geography; the most and least successful agencies were located in urban and rural counties alike. Instead, the likelihood that local SNAP-Ed agencies could support policy review and revision was strongly tied to:
FFY2017 SNAP-Ed Annual Report 132 January 2018
local agency staff comprehension of the process and their role in it; openness of the local agency staff, district personnel, and school administrators to the process; and the local agency’s consistent engagement of the district or school during each assessment phase.
FFY2017 SNAP-Ed Annual Report 133 January 2018
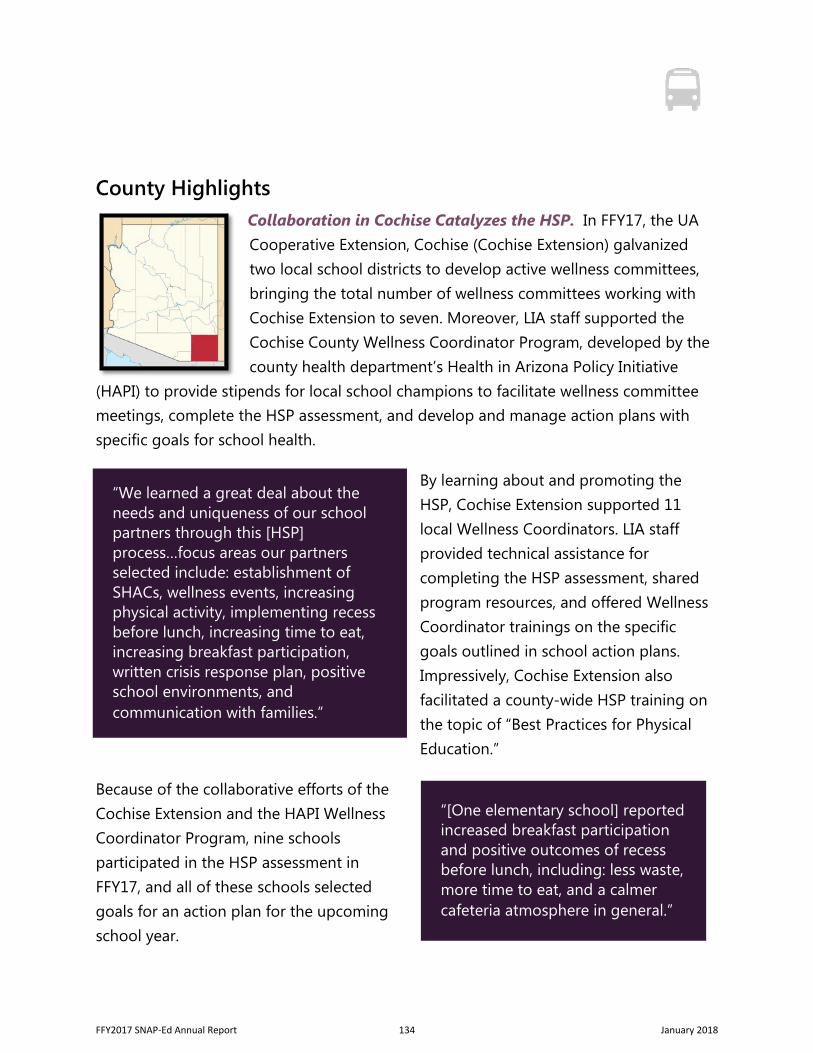
County Highlights Collaboration in Cochise Catalyzes the HSP. In FFY17, the UA Cooperative Extension, Cochise (Cochise Extension) galvanized two local school districts to develop active wellness committees, bringing the total number of wellness committees working with Cochise Extension to seven. Moreover, LIA staff supported the Cochise County Wellness Coordinator Program, developed by the county health department’s Health in Arizona Policy Initiative
(HAPI) to provide stipends for local school champions to facilitate wellness committee meetings, complete the HSP assessment, and develop and manage action plans with specific goals for school health.
By learning about and promoting the HSP, Cochise Extension supported 11 local Wellness Coordinators. LIA staff provided technical assistance for completing the HSP assessment, shared program resources, and offered Wellness Coordinator trainings on the specific goals outlined in school action plans. Impressively, Cochise Extension also facilitated a county-wide HSP training on the topic of “Best Practices for Physical Education.”
Because of the collaborative efforts of the Cochise Extension and the HAPI Wellness Coordinator Program, nine schools participated in the HSP assessment in FFY17, and all of these schools selected goals for an action plan for the upcoming school year.
“We learned a great deal about the needs and uniqueness of our school partners through this [HSP] process…focus areas our partners selected include: establishment of SHACs, wellness events, increasing physical activity, implementing recess before lunch, increasing time to eat, increasing breakfast participation, written crisis response plan, positive school environments, and communication with families.”
“[One elementary school] reported increased breakfast participation and positive outcomes of recess before lunch, including: less waste, more time to eat, and a calmer cafeteria atmosphere in general.”
FFY2017 SNAP-Ed Annual Report 134 January 2018
KEY FINDINGS AND RECOMMENDATIONS
NHSAC results for HSP-participating schools support the AZ Health Zone’s decision to engage in an MOU with the Alliance for a Healthier Generation and provide LIAs with HSP trainings in FFY17.
While SNAP-Ed-participating schools in Arizona are generally able to implement PSEs related to nutrition services, they often struggle to implement PSEs related to CSPAP and Health Promotion for School Staff.
To accelerate progress in LWP implementation related to PE, the AZ Health Zone may need to collaborate more deeply with the ADE or other state or federal agencies.
In FFY18 and beyond, the AZ Health Zone should consider these LIA training topics: wellness promotion for school staff and CSPAP for more rural regions.
In FFY18, the AZ Health Zone should encourage LIAs to proactively seek LWP information by providing trainings and access to additional LWP resources.
In FFY18, the AZ Health Zone should encourage LIAs to communicate with districts and schools during all stages of the LWP assessment process.
FFY2017 SNAP-Ed Annual Report 135 January 2018
References 1. Institute of Medicine. Accelerating Progress in Obesity Prevention: Solving the Weight of the
Nation. Washington, DC: The National Academies Press; 2012.
2. Schwartz MB, Henderson KE, Falbe J, et al. Strength and comprehensiveness of districtschool wellness policies predict policy implementation at the school level. J Sch Health.2012; 82:262-267.
3. Schools.HealthierGeneration.org/
4. Alliance for a Healthier Generation, Inc. Healthy Schools Program Framework of BestPractices. 2016. Available at: https://www.healthiergeneration.org/_asset/l062yk/07-278_HSPFramework.pdf.
5. Economic Research Service, USDA. Atlas: County Classifications, Low Employment Counties.2015 Edition. Available at: https://www.ers.usda.gov/data-products/atlas-of-rural-and-small-town-america/go-to-the-atlas/
6. https://www.healthiergeneration.org/healthiestschools/
7. http://www.mpsaz.org/elempe
8. Patton MQ. Qualitative Research and Evaluation Methods. 3rd ed. Thousand Oaks: SagePublications, 2002.
9. WellSAT.org
10. Agron P, Berends V, Ellis K, Gonzalez M. School wellness policies: Perceptions, barriers, andneeds among school leaders and wellness advocates. J Sch Health. 2010; 80: 527–535.
11. Slater SJ, Nicholson L, Chriqui JF, Turner L, Chaloupka FJ. The impact of state laws anddistrict policies on physical education and recess practices in a nationally-representativesample of U.S. public elementary schools. Arch Pediatr Adolesc Med. 2012 April;166(4):311–316.
12. Turner L, Chriqui JF, Chaloupka FJ. Classroom parties in US elementary schools: the potentialfor policies to reduce student exposure to sugary foods and beverages. J Nutr Educ Behav.2013;45:611-619.
13. Piekarz-Porter E, Chriqui JF, Schermbeck RM, Leider J, Lin W. The Active Role States
Have Played in Helping to Transform the School Wellness Environment through Policy,School Years 2006-07 through 2014-15. Chicago, IL: Bridging the Gap Program and theNational Wellness Policy Study, Institute for Health Research and Policy, University of Illinoisat Chicago, 2017, www.go.uic.edu/NWPSproducts.
14. Taber DR, Chriqui JF, Chaloupka FJ. Association and diffusion of nutrition and physicalactivity policies on the state and district level. J Sch Health. 2012; 82: 201-209.
FFY2017 SNAP-Ed Annual Report 136 January 2018
15. Longley CH, Sneed J. Effects of federal legislation on wellness policy formation in schooldistricts in the United States. J Am Diet Assoc. 2009;109:95-101.
16. Chriqui JF, Eyler A, Carnoske C, Slater S. State and district policy influences on district-wideelementary and middle school physical education practices. J Public Health ManagementPractice. 2013;19(3) E-Supp, S41-S48.
17. Lucarelli JF, Alaimo K, Mang E, et al. Facilitators to promoting health in schools: is schoolhealth climate the key? J Sch Health. 2014; 84: 133-140.
18. Hager ER, Rubio DS, Eidel GS, et al. Implementation of local wellness policies in schools: roleof school systems, school health councils, and health disparities. J Sch Health. 2016; 86: 742-750.
19. Cheung K, Lesesne CA, Rasberry CN, et al. Barriers and facilitators to sustaining schoolhealth teams in coordinated school health programs. Health Promotion Practice.201;18(3):418–427.
20. Chriqui JF, Chaloupka FJ. Transparency and oversight in local wellness policies. J Sch Health.2011; 81: 114-121.
21. Buffington A, McKee C, Ragsdale K, Blanchard TC, Baggett D, Southward LH. Impact ofMississippi Healthy Students Act of 2007 on district- and school-level health policies: schoolofficials’ perspectives. J Sch Health. 2014; 84: 285-293.
22. Cornish D, Askelson N, Golembiewski E. ‘‘Reforms looked really good on paper’’: rural foodservice responses to the Healthy, Hunger-Free Kids Act of 2010. J Sch Health. 2016; 86: 113-120.
23. Bruce E, Klein R, Keleher H. Parliamentary inquiry into health promoting schools in Victoria:analysis of stakeholder views. J Sch Health. 2012; 82: 441-447.
24. Howie EK, Stevick ED. The ‘‘ins’’ and ‘‘outs’’ of physical activity policy implementation:inadequate capacity, inappropriate outcome measures, and insufficient funds. J Sch Health.2014; 84: 581-585.
FFY2017 SNAP-Ed Annual Report 137 January 2018
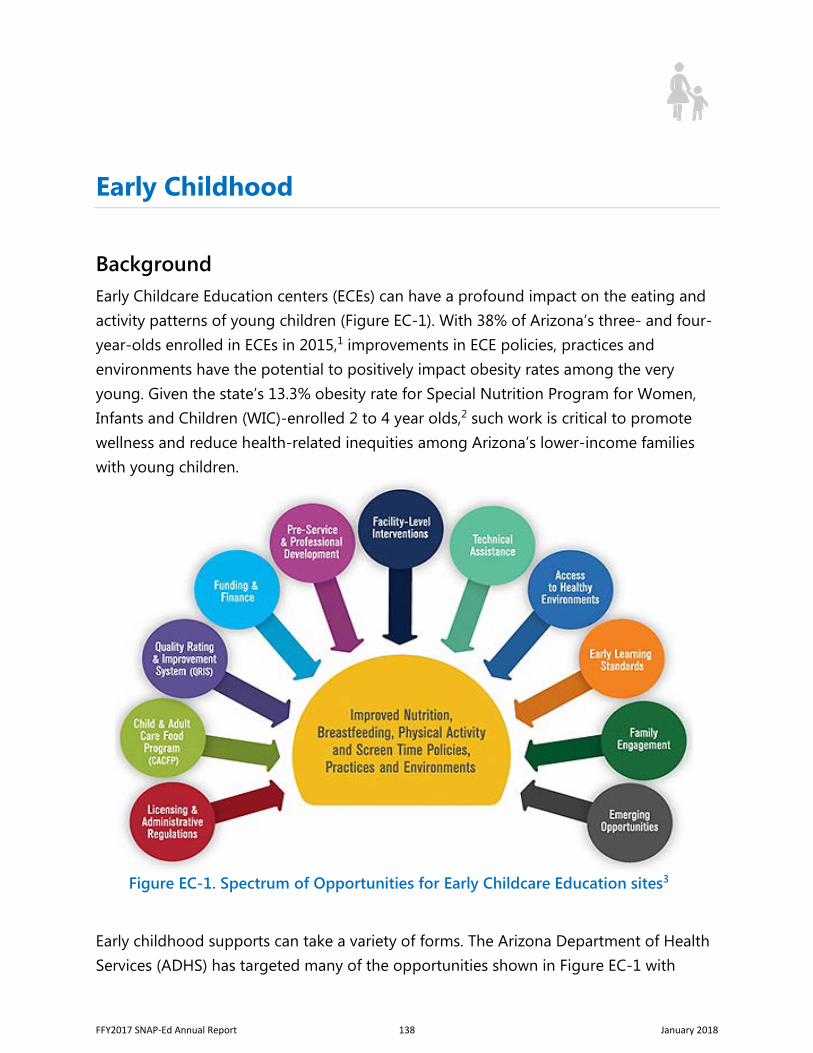
Early Childhood
Background Early Childcare Education centers (ECEs) can have a profound impact on the eating and activity patterns of young children (Figure EC-1). With 38% of Arizona’s three- and four-year-olds enrolled in ECEs in 2015,1 improvements in ECE policies, practices and environments have the potential to positively impact obesity rates among the very young. Given the state’s 13.3% obesity rate for Special Nutrition Program for Women, Infants and Children (WIC)-enrolled 2 to 4 year olds,2 such work is critical to promote wellness and reduce health-related inequities among Arizona’s lower-income families with young children.
Early childhood supports can take a variety of forms. The Arizona Department of Health Services (ADHS) has targeted many of the opportunities shown in Figure EC-1 with
Figure EC-1. Spectrum of Opportunities for Early Childcare Education sites3
FFY2017 SNAP-Ed Annual Report 138 January 2018
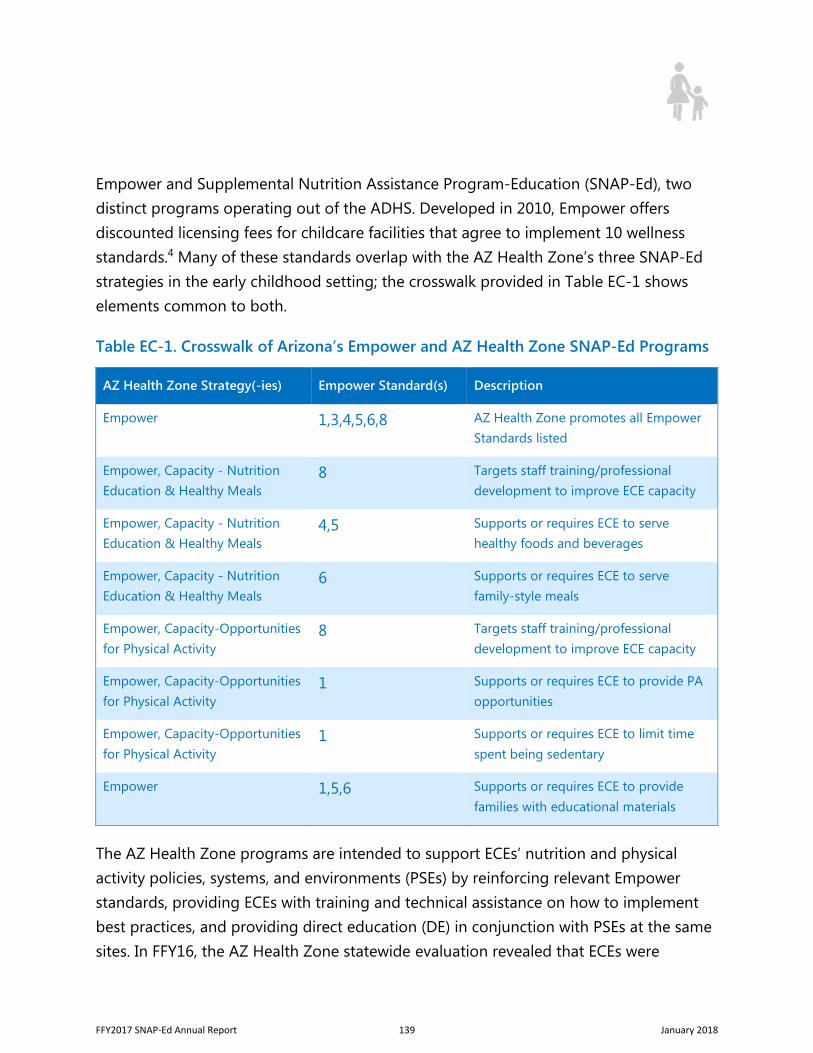
Empower and Supplemental Nutrition Assistance Program-Education (SNAP-Ed), two distinct programs operating out of the ADHS. Developed in 2010, Empower offers discounted licensing fees for childcare facilities that agree to implement 10 wellness standards.4 Many of these standards overlap with the AZ Health Zone’s three SNAP-Ed strategies in the early childhood setting; the crosswalk provided in Table EC-1 shows elements common to both.
Table EC-1. Crosswalk of Arizona’s Empower and AZ Health Zone SNAP-Ed Programs
AZ Health Zone Strategy(-ies) Empower Standard(s) Description
Empower 1,3,4,5,6,8 AZ Health Zone promotes all Empower Standards listed
Empower, Capacity - Nutrition Education & Healthy Meals
8 Targets staff training/professional development to improve ECE capacity
Empower, Capacity - Nutrition Education & Healthy Meals
4,5 Supports or requires ECE to serve healthy foods and beverages
Empower, Capacity - Nutrition Education & Healthy Meals
6 Supports or requires ECE to serve family-style meals
Empower, Capacity-Opportunities for Physical Activity
8 Targets staff training/professional development to improve ECE capacity
Empower, Capacity-Opportunities for Physical Activity
1 Supports or requires ECE to provide PA opportunities
Empower, Capacity-Opportunities for Physical Activity
1 Supports or requires ECE to limit time spent being sedentary
Empower 1,5,6 Supports or requires ECE to provide families with educational materials
The AZ Health Zone programs are intended to support ECEs’ nutrition and physical activity policies, systems, and environments (PSEs) by reinforcing relevant Empower standards, providing ECEs with training and technical assistance on how to implement best practices, and providing direct education (DE) in conjunction with PSEs at the same sites. In FFY16, the AZ Health Zone statewide evaluation revealed that ECEs were
FFY2017 SNAP-Ed Annual Report 139 January 2018
generally doing well in serving healthy foods and beverages, however areas for improvement spanned multiple categories: written policies, family education, professional development of staff, time provided for physical activity, and family-style dining.
Below, Early Childhood medium-term (MT5, MT6) outcomes in FFY17 are reported in alignment with the National SNAP-Ed Evaluation Framework.
Methods This FFY17 assessment serves as: (1) a mixed methods evaluation of Local Implementing Agency (LIA) progress in delivering PSEs and multi-level interventions to partner ECEs, and (2) a qualitative inquiry into early evidence for positive outcomes related to ECE nutrition and physical activity supports (MT5 and MT6).
Quantitative Analysis. Process indicators from all LIAs’ end-of-year Semi-Annual Report Tables (SARTs) were compiled to examine intended versus actual reach of individual ECE sites, and the number of LIA-ECE interactions reported in SARTs was used as a proxy for the intensity of reach. When the same site was reached with more than one strategy, the site was only counted once as a unique entity reached. Conversely, meetings and trainings that occurred at the same ECE site on different dates were added together to calculate the total number of meetings and trainings with LIAs throughout FFY17 to approximate the intensity of efforts.
Qualitative Analysis. To further understand LIA progress in supporting ECEs and examine evidence for positive outcomes related to these supports, a qualitative inquiry was undertaken using data from Semi-Annual Report Narratives (SARNs). NVivo v10.0 software was used for coding and theme analysis.
Results Quantitative Results. In FFY17, 13 LIAs worked across 12 of Arizona’s 15 counties to support 60 unique ECEs (Table EC-2). While the number of ECEs targeted exactly
FFY2017 SNAP-Ed Annual Report 140 January 2018
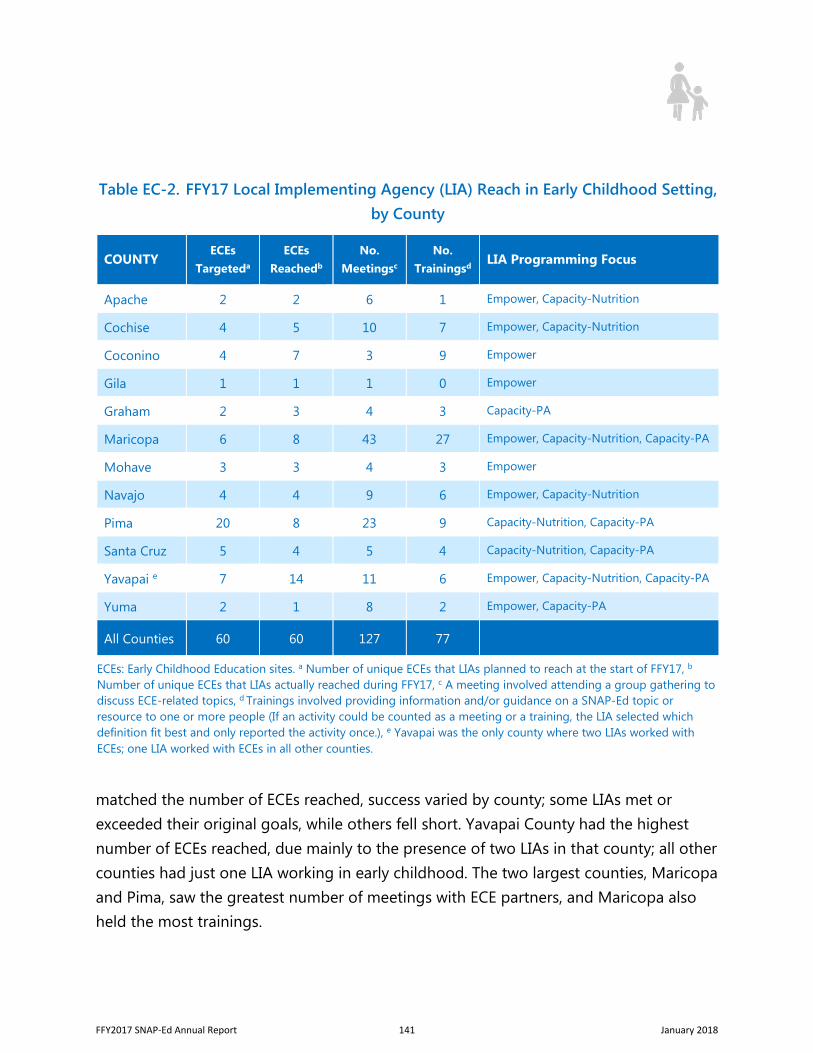
matched the number of ECEs reached, success varied by county; some LIAs met or exceeded their original goals, while others fell short. Yavapai County had the highest number of ECEs reached, due mainly to the presence of two LIAs in that county; all other counties had just one LIA working in early childhood. The two largest counties, Maricopa and Pima, saw the greatest number of meetings with ECE partners, and Maricopa also held the most trainings.
Table EC-2. FFY17 Local Implementing Agency (LIA) Reach in Early Childhood Setting, by County
COUNTY ECEs
Targeteda ECEs
Reachedb No.
Meetingsc No.
Trainingsd LIA Programming Focus
Apache 2 2 6 1 Empower, Capacity-Nutrition
Cochise 4 5 10 7 Empower, Capacity-Nutrition
Coconino 4 7 3 9 Empower
Gila 1 1 1 0 Empower
Graham 2 3 4 3 Capacity-PA
Maricopa 6 8 43 27 Empower, Capacity-Nutrition, Capacity-PA
Mohave 3 3 4 3 Empower
Navajo 4 4 9 6 Empower, Capacity-Nutrition
Pima 20 8 23 9 Capacity-Nutrition, Capacity-PA
Santa Cruz 5 4 5 4 Capacity-Nutrition, Capacity-PA
Yavapai e 7 14 11 6 Empower, Capacity-Nutrition, Capacity-PA
Yuma 2 1 8 2 Empower, Capacity-PA
All Counties 60 60 127 77
ECEs: Early Childhood Education sites. a Number of unique ECEs that LIAs planned to reach at the start of FFY17, b Number of unique ECEs that LIAs actually reached during FFY17, c A meeting involved attending a group gathering to discuss ECE-related topics, d Trainings involved providing information and/or guidance on a SNAP-Ed topic or resource to one or more people (If an activity could be counted as a meeting or a training, the LIA selected which definition fit best and only reported the activity once.), e Yavapai was the only county where two LIAs worked with ECEs; one LIA worked with ECEs in all other counties.
FFY2017 SNAP-Ed Annual Report 141 January 2018
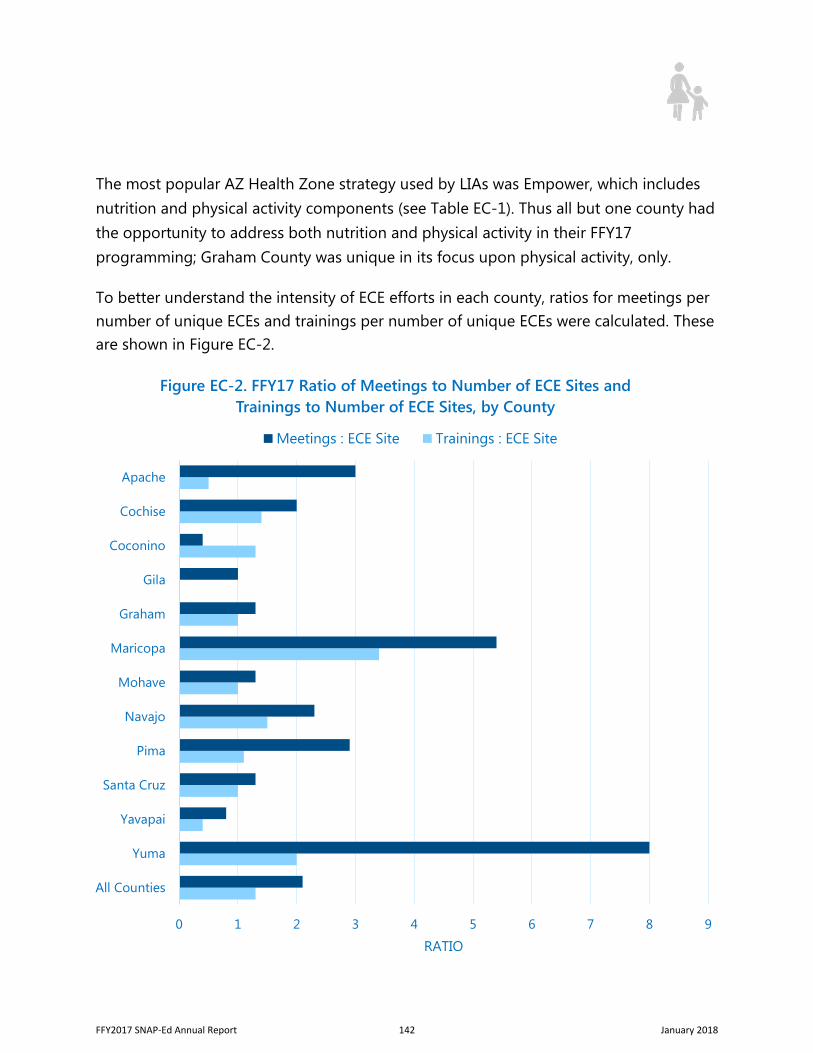
The most popular AZ Health Zone strategy used by LIAs was Empower, which includes nutrition and physical activity components (see Table EC-1). Thus all but one county had the opportunity to address both nutrition and physical activity in their FFY17 programming; Graham County was unique in its focus upon physical activity, only.
To better understand the intensity of ECE efforts in each county, ratios for meetings per number of unique ECEs and trainings per number of unique ECEs were calculated. These are shown in Figure EC-2.
0 1 2 3 4 5 6 7 8 9
All Counties
Yuma
Yavapai
Santa Cruz
Pima
Navajo
Mohave
Maricopa
Graham
Gila
Coconino
Cochise
Apache
RATIO
Figure EC-2. FFY17 Ratio of Meetings to Number of ECE Sites and Trainings to Number of ECE Sites, by County
Meetings : ECE Site Trainings : ECE Site
FFY2017 SNAP-Ed Annual Report 142 January 2018
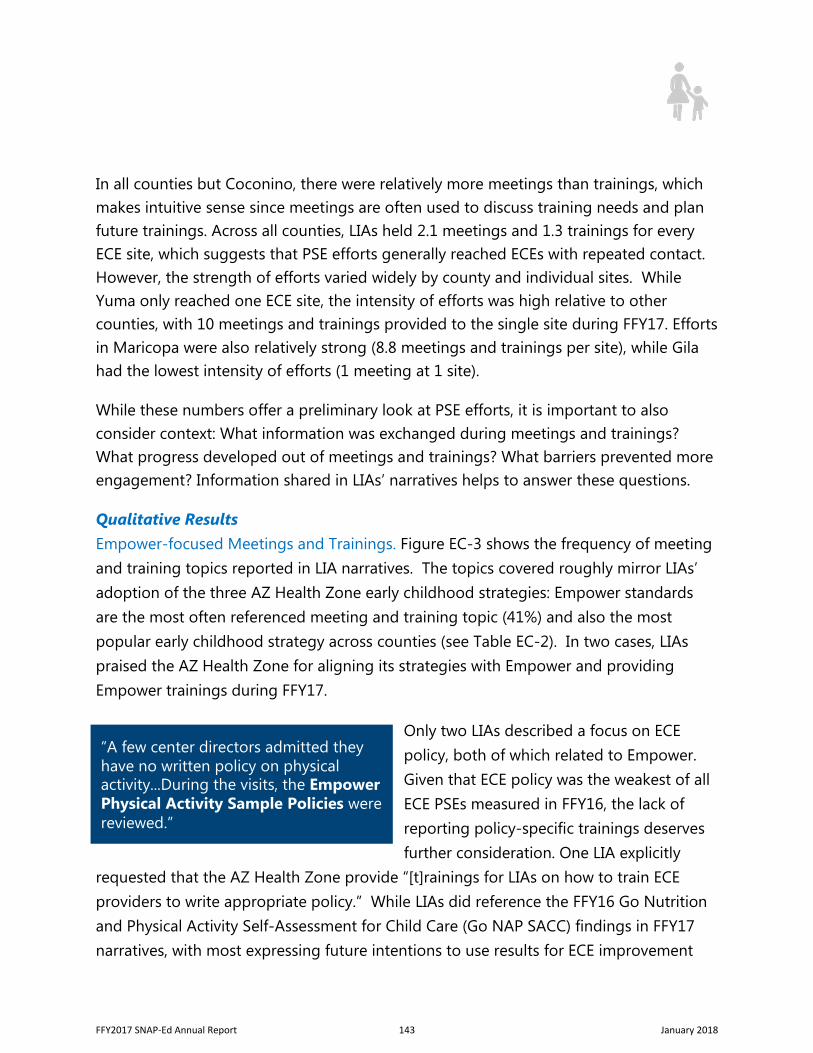
In all counties but Coconino, there were relatively more meetings than trainings, which makes intuitive sense since meetings are often used to discuss training needs and plan future trainings. Across all counties, LIAs held 2.1 meetings and 1.3 trainings for every ECE site, which suggests that PSE efforts generally reached ECEs with repeated contact. However, the strength of efforts varied widely by county and individual sites. While Yuma only reached one ECE site, the intensity of efforts was high relative to other counties, with 10 meetings and trainings provided to the single site during FFY17. Efforts in Maricopa were also relatively strong (8.8 meetings and trainings per site), while Gila had the lowest intensity of efforts (1 meeting at 1 site).
While these numbers offer a preliminary look at PSE efforts, it is important to also consider context: What information was exchanged during meetings and trainings? What progress developed out of meetings and trainings? What barriers prevented more engagement? Information shared in LIAs’ narratives helps to answer these questions.
Qualitative Results Empower-focused Meetings and Trainings. Figure EC-3 shows the frequency of meeting and training topics reported in LIA narratives. The topics covered roughly mirror LIAs’ adoption of the three AZ Health Zone early childhood strategies: Empower standards are the most often referenced meeting and training topic (41%) and also the most popular early childhood strategy across counties (see Table EC-2). In two cases, LIAs praised the AZ Health Zone for aligning its strategies with Empower and providing Empower trainings during FFY17.
Only two LIAs described a focus on ECE policy, both of which related to Empower. Given that ECE policy was the weakest of all ECE PSEs measured in FFY16, the lack of reporting policy-specific trainings deserves further consideration. One LIA explicitly
requested that the AZ Health Zone provide “[t]rainings for LIAs on how to train ECE providers to write appropriate policy.” While LIAs did reference the FFY16 Go Nutrition and Physical Activity Self-Assessment for Child Care (Go NAP SACC) findings in FFY17 narratives, with most expressing future intentions to use results for ECE improvement
“A few center directors admitted they have no written policy on physical activity...During the visits, the Empower Physical Activity Sample Policies were reviewed.”
FFY2017 SNAP-Ed Annual Report 143 January 2018
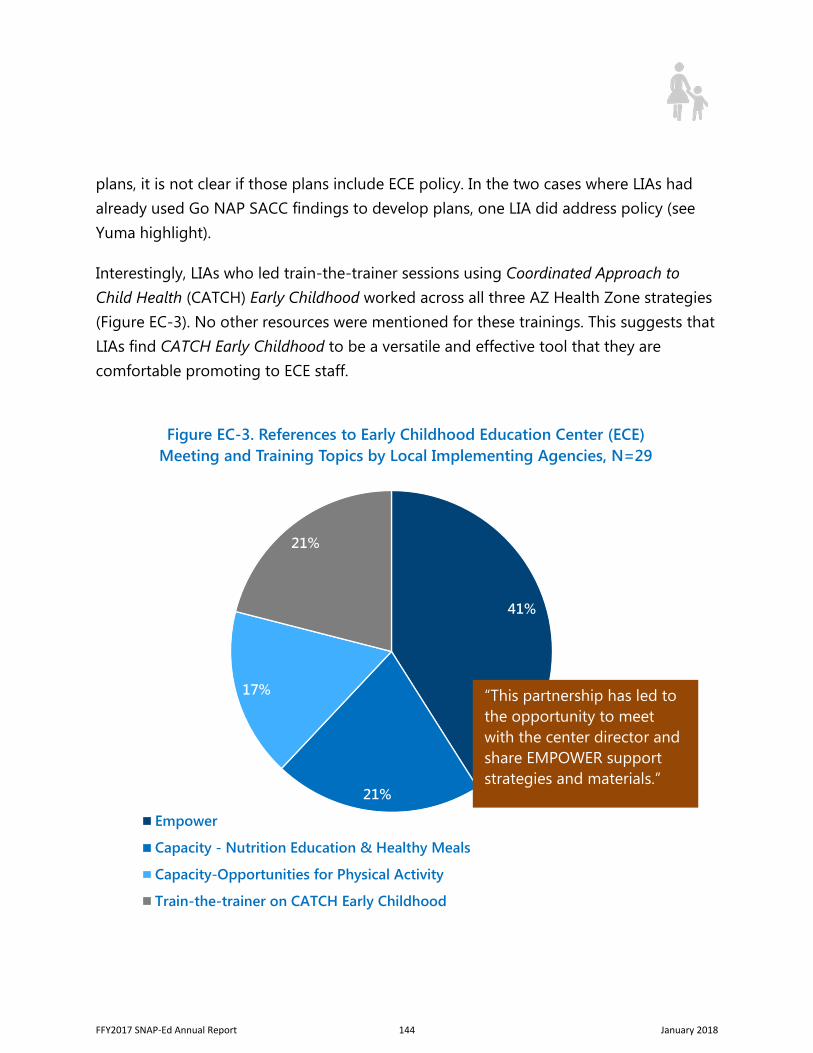
plans, it is not clear if those plans include ECE policy. In the two cases where LIAs had already used Go NAP SACC findings to develop plans, one LIA did address policy (see Yuma highlight).
Interestingly, LIAs who led train-the-trainer sessions using Coordinated Approach to Child Health (CATCH) Early Childhood worked across all three AZ Health Zone strategies (Figure EC-3). No other resources were mentioned for these trainings. This suggests that LIAs find CATCH Early Childhood to be a versatile and effective tool that they are comfortable promoting to ECE staff.
41%
21%
17%
21%
Figure EC-3. References to Early Childhood Education Center (ECE) Meeting and Training Topics by Local Implementing Agencies, N=29
Empower
Capacity - Nutrition Education & Healthy Meals
Capacity-Opportunities for Physical Activity
Train-the-trainer on CATCH Early Childhood
“This partnership has led to the opportunity to meet with the center director and share EMPOWER support strategies and materials.”
FFY2017 SNAP-Ed Annual Report 144 January 2018
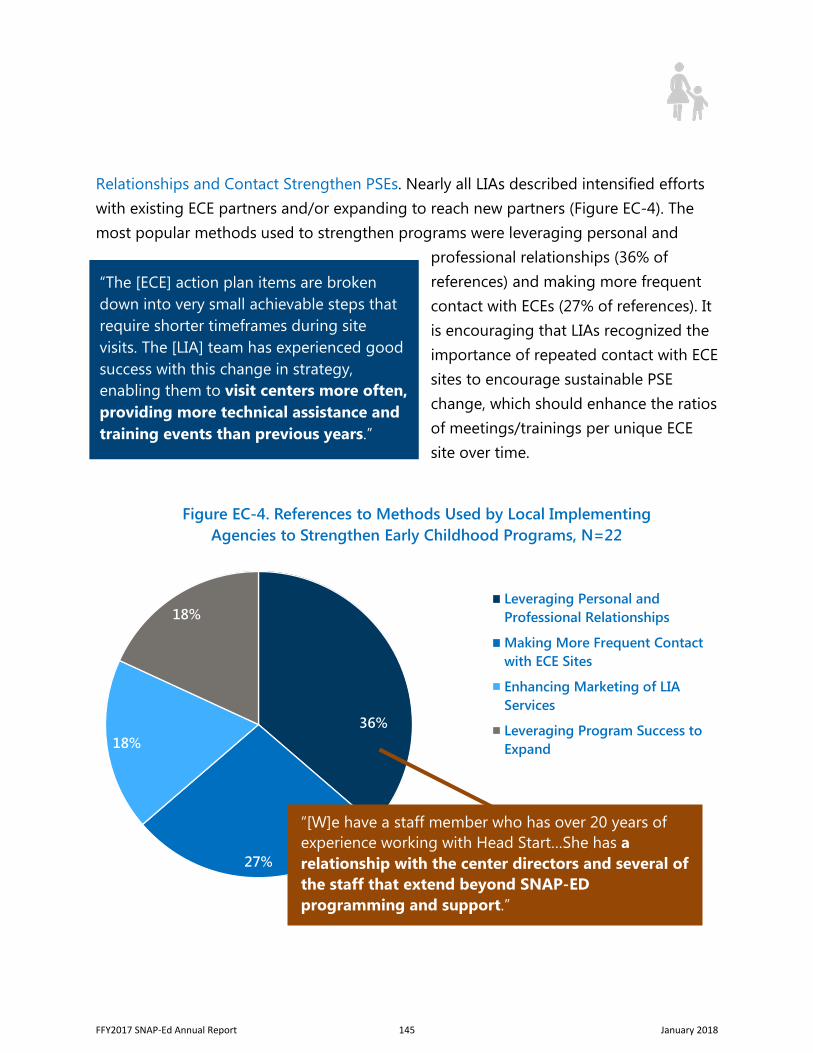
Relationships and Contact Strengthen PSEs. Nearly all LIAs described intensified efforts with existing ECE partners and/or expanding to reach new partners (Figure EC-4). The most popular methods used to strengthen programs were leveraging personal and
professional relationships (36% of references) and making more frequent contact with ECEs (27% of references). It is encouraging that LIAs recognized the importance of repeated contact with ECE sites to encourage sustainable PSE change, which should enhance the ratios of meetings/trainings per unique ECE site over time.
“The [ECE] action plan items are broken down into very small achievable steps that require shorter timeframes during site visits. The [LIA] team has experienced good success with this change in strategy, enabling them to visit centers more often, providing more technical assistance and training events than previous years.”
36%
27%
18%
18%
Figure EC-4. References to Methods Used by Local Implementing Agencies to Strengthen Early Childhood Programs, N=22
Leveraging Personal andProfessional Relationships
Making More Frequent Contactwith ECE Sites
Enhancing Marketing of LIAServices
Leveraging Program Success toExpand
“[W]e have a staff member who has over 20 years of experience working with Head Start…She has a relationship with the center directors and several of the staff that extend beyond SNAP-ED programming and support.”
FFY2017 SNAP-Ed Annual Report 145 January 2018
Multi-Level, Multi-Focused Programs. Most of the PSE activities described in narratives include elements of multi-level programming: LIAs provided DE in conjunction with PSEs promoting Empower standards and ECE capacity in nutrition and physical activity. In some cases, they actively engaged families—especially parents—in the learning process. However, the most common theme related to multi-level interventions in ECEs was the LIAs’ assimilation of their work in other focus areas with their work in early childhood. This integrative approach to programming often connected new partners or helped to bolster sustainability. Examples of how LIA connected their Early Childhood PSEs to Food Systems, Active Living and School Health PSEs are provided below.
Food Systems (Farmers’ Markets) and Early Childhood
“SNAP-Ed staff assisted [the ECE] with conducting a "Farmers Market" event. Parents donated fruits and vegetables, and the children walked around and 'shopped' as if they were at a farmer’s market. This has become an annual event…It introduces the concept of Farmer's Markets and casts them in a positive light to children and their parents. [LIA staff] will coordinate the promotion of nearby farmer’s markets with their participants through [a] mobile app and printed materials at next year’s event.”
Food Systems (Farm-to-School, Gardens) and Early Childhood
“[W]e have asked a member of the Head Start administration to be a part of the Farm to School Committee so that we can work to incorporate [the] Head Start into the program so that it is inclusive of all ages and is relevant to our Native American population.”
“We provided a Gardening 101 training in September that focused heavily on food safety and incorporating produce from the garden into healthy meal preparation efforts. During this training, 11 sites were represented that received information on how to safely grow and harvest edible produce for children to eat as part of their healthy meals and snacks on site.”
FFY2017 SNAP-Ed Annual Report 146 January 2018
Unbroken Barriers. In FFY17, LIAs referenced the same number of barriers (48) as they did in FFY16. This unlikely coincidence enabled the AZ Health Zone State Evaluation Team (SET) to compare the type of barriers reported in both years and the relative frequency of those barriers across years. In FFY16, barriers fell into four categories. The three top barriers (competing demands on ECEs, ECE staff turnover, and limited capacity of LIAs) were also the three top barriers in FFY17 (Figure EC-5). While LIAs no longer mentioned the inability to systematically track ECEs in FFY17, they did discuss a greater breadth of new challenges to their programming. Lack of ECE interest or follow through included non-response of ECE sites as well as a failure of ECEs to pursue further development after meetings or trainings.
Active Living and Early Childhood
“The Story on the Trail effort…combine[s] our active living and early childhood efforts...Our goal is to better connect young families with the area trails as a free resource that can be enjoyed by all ages. To achieve this, our event outreach included First Things First, Head Start, and WIC. We also select stories for the Story on the Trail events that are intended for the younger early childhood audience.”
“[W]e have continued to try and establish partnerships with the [tribal] Head Start Organization but we have been unable to do so. We have presented the MOU to the Head Start Organization which was going to present it to the tribe for their approval but we have not had any progress to date.”
“Although four ECE centers received the Empower Breastfeeding Support Training, they did not pursue the recognition program.”
School Health and Early Childhood
“[LIA] Staff attended the Empower Advanced training this period and was able to provide an Empower Basics Training to 50 High School students who are part of an Early Childhood track...These high school students work directly with preschool students…while receiving child development education.”
FFY2017 SNAP-Ed Annual Report 147 January 2018
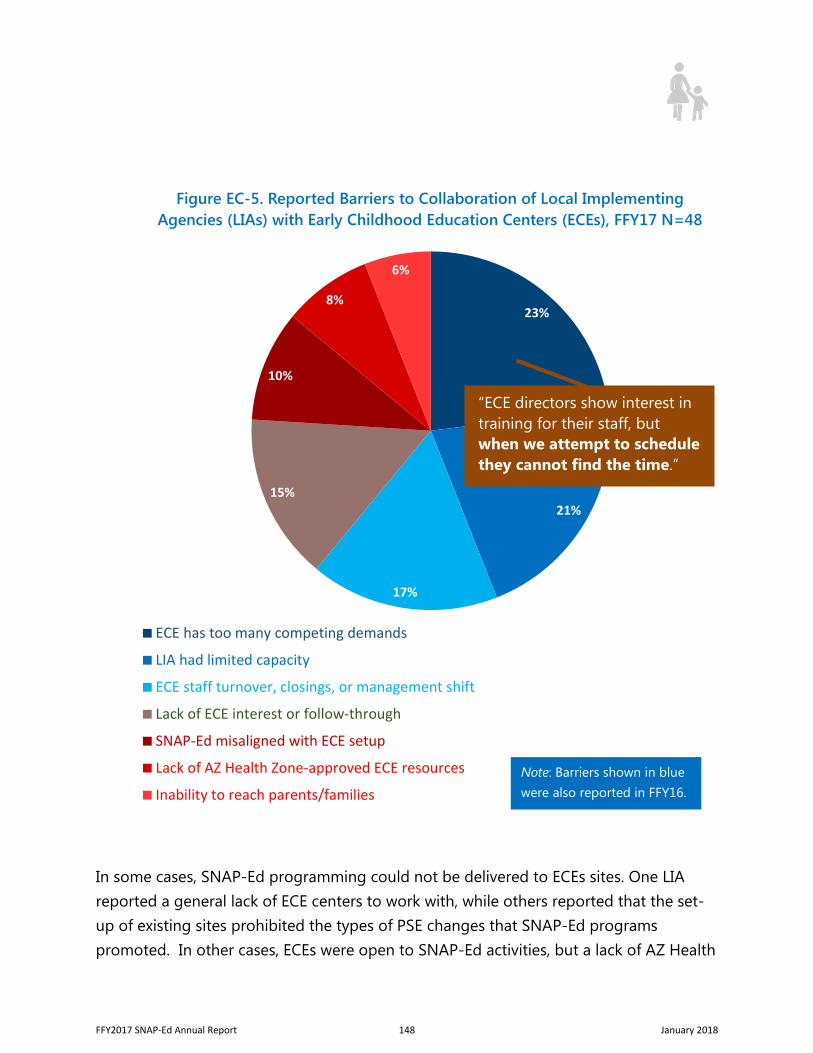
In some cases, SNAP-Ed programming could not be delivered to ECEs sites. One LIA reported a general lack of ECE centers to work with, while others reported that the set-up of existing sites prohibited the types of PSE changes that SNAP-Ed programs promoted. In other cases, ECEs were open to SNAP-Ed activities, but a lack of AZ Health
23%
21%
17%
15%
10%
8%
6%
Figure EC-5. Reported Barriers to Collaboration of Local Implementing Agencies (LIAs) with Early Childhood Education Centers (ECEs), FFY17 N=48
ECE has too many competing demands
LIA had limited capacity
ECE staff turnover, closings, or management shift
Lack of ECE interest or follow-through
SNAP-Ed misaligned with ECE setup
Lack of AZ Health Zone-approved ECE resources
Inability to reach parents/families
“ECE directors show interest in training for their staff, but when we attempt to schedule they cannot find the time.”
Note: Barriers shown in blue were also reported in FFY16.
FFY2017 SNAP-Ed Annual Report 148 January 2018
Zone-approved resources that met their needs inhibited progress. Moreover, as LIAs sought to enhance multi-level programming by reaching ECE families, they encountered many of the same barriers that they have struggled with in adult DE: recruitment for face-to-face education was difficult, so LIAs were exploring alternative methods to reach families.
Early Signs of Progress Align with Meeting and Training Topics. Despite persistent barriers, LIAs described a variety of emergent PSE changes that suggest their efforts in FFY16 and FFY17 are resulting in ECEs’ adoption of nutrition (MT5) and physical activity (MT6) supports. These PSE changes aligned with the meeting and training topics reported in Figure EC-3, including the AZ Health Zone’s early childhood strategies and train-the-trainer success with the CATCH Early Childhood curriculum:
Empower (MT5 and MT6)
One LIA collaborated with the Health in Arizona Policy Initiative (HAPI) to present an Empower training that informed the ECE’s improvement plan (see Yuma Highlight).
One LIA received USDA approval for a Breastfeeding Friendly Childcare Training & Recognition Program. They also initiated a pilot project to provide breastfeeding education through WIC along with the SNAP-Ed nutrition education. Due to early
success in one city, classes expanded to a second city, and participation numbers increased across both locations.
“In FFY17 it was discovered that only one of [the county’s] approved providers prepare food for their children.”
“Many of the Home Providers in [the county] are Spanish speaking…all of the CATCH Early Childhood materials are in English.”
“Our unit spent the majority of the first half of this year collaborating with ADHS, Cochise County Breastfeeding Taskforce, and UA Extension Research Team to create the justification for our plan…we are excited about moving forward with this project!”
FFY2017 SNAP-Ed Annual Report 149 January 2018
Capacity - Nutrition Education & Healthy Meals (MT5)
One LIA worked with a school district and food service provider to plan a pilot program intended to address food insecurity with 'grab and go dinner' using the Child and Adult Care Food Program (CACFP) program. Progress included the identification of schools most in need of the program. (Note: the pilot also aligns with Empower Standard 4.)
Four LIAs collaborated to reach Head Start food service staff across four counties through a presentation at a Northern Arizona Council of Governments (NACOG) training.
Capacity - Opportunities for Physical Activity (MT6)
An LIA presented the idea of playground stencils to enhance physical activity. In response, the ECE’s owner expanded the concrete patio (see Yuma Highlight).
Another LIA worked with an ECE to place garden watering cans far from the garden, so that when the children water it, they run back and forth repeatedly.
Train-the-Trainer on CATCH Early Childhood (MT5 and MT6)
Five LIAs saw evidence for the implementation of CATCH Early Childhood at ECEs after providing train-the-trainer sessions.
“Follow up visits with the sites show staff are implementing the activities presented such as using scarves for throwing and catching (hand eye coordination) and requesting laminated geometric shapes and numbers to use in their daily activities.”
“By working top down in this instance, we ensured both the reach and embeddedness of our work throughout the culture of Head Start in Northern Arizona.”
FFY2017 SNAP-Ed Annual Report 150 January 2018
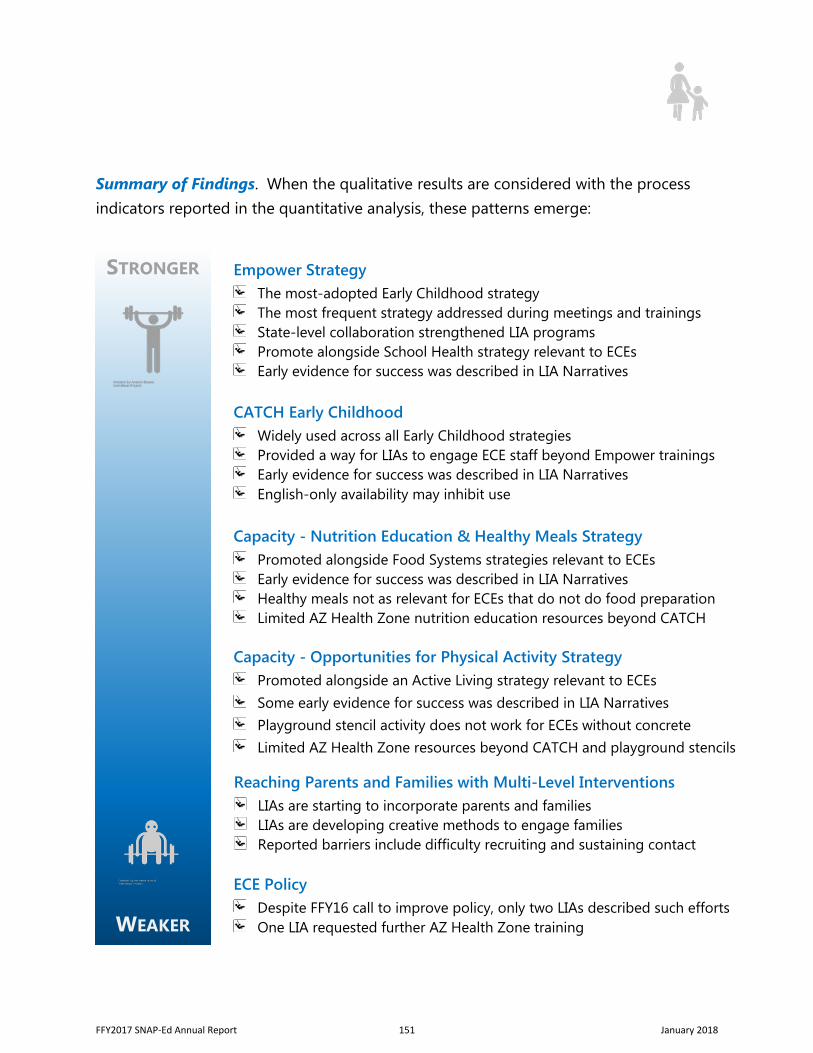
Summary of Findings. When the qualitative results are considered with the process indicators reported in the quantitative analysis, these patterns emerge:
Reaching Parents and Families with Multi-Level Interventions LIAs are starting to incorporate parents and families LIAs are developing creative methods to engage families Reported barriers include difficulty recruiting and sustaining contact
ECE Policy Despite FFY16 call to improve policy, only two LIAs described such efforts One LIA requested further AZ Health Zone training
CATCH Early Childhood Widely used across all Early Childhood strategies Provided a way for LIAs to engage ECE staff beyond Empower trainings Early evidence for success was described in LIA Narratives English-only availability may inhibit use
Empower Strategy The most-adopted Early Childhood strategy The most frequent strategy addressed during meetings and trainings State-level collaboration strengthened LIA programs Promote alongside School Health strategy relevant to ECEs Early evidence for success was described in LIA Narratives
STRONGER
WEAKER
Capacity - Opportunities for Physical Activity Strategy Promoted alongside an Active Living strategy relevant to ECEs Some early evidence for success was described in LIA Narratives Playground stencil activity does not work for ECEs without concrete Limited AZ Health Zone resources beyond CATCH and playground stencils
Capacity - Nutrition Education & Healthy Meals Strategy Promoted alongside Food Systems strategies relevant to ECEs Early evidence for success was described in LIA Narratives Healthy meals not as relevant for ECEs that do not do food preparation Limited AZ Health Zone nutrition education resources beyond CATCH
FFY2017 SNAP-Ed Annual Report 151 January 2018
Multilevel Intervention Highlights
Quality Over Quantity Shows Success in Yuma. Yuma County Public Health Services (YCPHS) only worked with one ECE, but the intensity of its multi-level programming was outstanding. Of all LIAs working in early childhood, the YCPHS had the highest ratio of meetings/trainings to ECE site (10:1). Because they only reached one site, it is clear that all eight meetings and two trainings occurred with that site. This intensity of efforts can provide a model for other
LIAs seeking to accelerate their progress in the Early Childhood focus area.
Moreover, the YCPHS was the only LIA to present the ECE with FFY16 Go NAP SACC findings, follow up by supporting action plan formation and implementation, and promote policy changes with the ECE director. In fact, following these conversations, the YCPHS’s HAPI partner was able to aid in the ECE’s policy development, which aligned with Empower standards. By the close of FFY17, the policy was nearly finalized.
The YCPHS’s progress in supporting the ECE’s capacity to provide physical activity opportunities was also impressive. LIA staff discussed playground stencils with the ECE’s owner, who expanded the concrete patio in preparation for implementation. This inspired excitement among the ECE site staff, who have already begun to recruit volunteers.
In terms of multi-level programming strengths, the YCPHS addressed barriers to reaching families by collaborating with the ECE to plan an ECE family newsletter that will highlight accomplishments, events, and other family activities.
“[I]n collaboration with HAPI, we arranged an after-hours meeting with the director and staff to present the [Go NAP SACC] assessment results. We provided a brief training on the Empower Standards, including an infographic and interactive discussion. HAPI conducted an interactive goal-setting activity…[the ECE] shared some well-thought out goals: Family-style meals (the director has even purchased the equipment); build their capacity to lead structured physical activity with the children, especially indoors; provide education and material for the families.”
FFY2017 SNAP-Ed Annual Report 152 January 2018
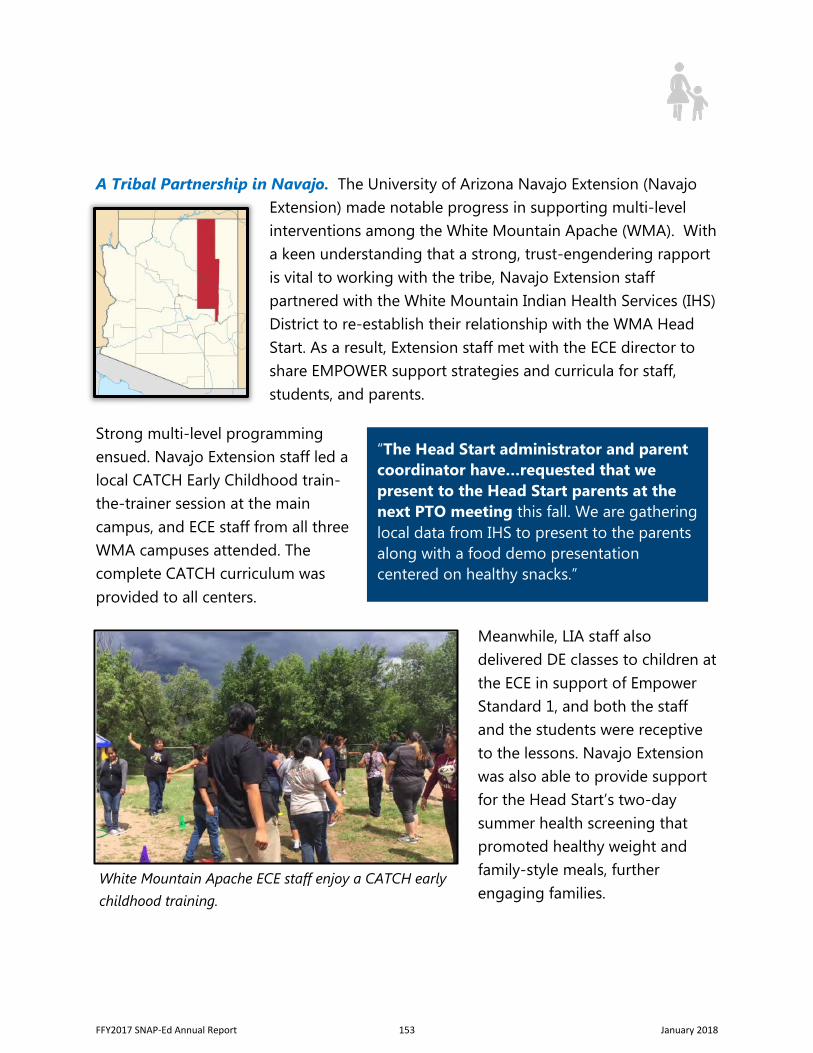
A Tribal Partnership in Navajo. The University of Arizona Navajo Extension (Navajo Extension) made notable progress in supporting multi-level interventions among the White Mountain Apache (WMA). With a keen understanding that a strong, trust-engendering rapport is vital to working with the tribe, Navajo Extension staff partnered with the White Mountain Indian Health Services (IHS) District to re-establish their relationship with the WMA Head Start. As a result, Extension staff met with the ECE director to share EMPOWER support strategies and curricula for staff, students, and parents.
Strong multi-level programming ensued. Navajo Extension staff led a local CATCH Early Childhood train-the-trainer session at the main campus, and ECE staff from all three WMA campuses attended. The complete CATCH curriculum was provided to all centers.
Meanwhile, LIA staff also delivered DE classes to children at the ECE in support of Empower Standard 1, and both the staff and the students were receptive to the lessons. Navajo Extension was also able to provide support for the Head Start’s two-day summer health screening that promoted healthy weight and family-style meals, further engaging families.
White Mountain Apache ECE staff enjoy a CATCH early childhood training.
“The Head Start administrator and parent coordinator have…requested that we present to the Head Start parents at the next PTO meeting this fall. We are gathering local data from IHS to present to the parents along with a food demo presentation centered on healthy snacks.”
FFY2017 SNAP-Ed Annual Report 153 January 2018
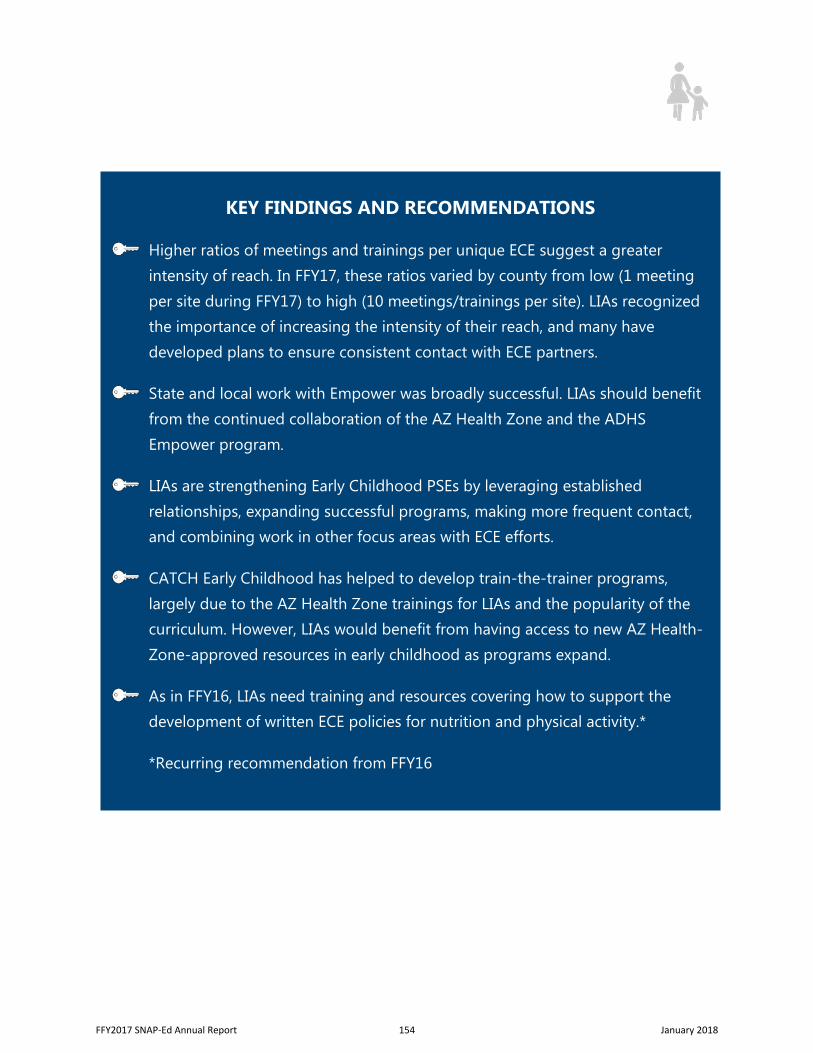
KEY FINDINGS AND RECOMMENDATIONS
Higher ratios of meetings and trainings per unique ECE suggest a greater intensity of reach. In FFY17, these ratios varied by county from low (1 meeting per site during FFY17) to high (10 meetings/trainings per site). LIAs recognized the importance of increasing the intensity of their reach, and many have developed plans to ensure consistent contact with ECE partners.
State and local work with Empower was broadly successful. LIAs should benefit from the continued collaboration of the AZ Health Zone and the ADHS Empower program.
LIAs are strengthening Early Childhood PSEs by leveraging established relationships, expanding successful programs, making more frequent contact, and combining work in other focus areas with ECE efforts.
CATCH Early Childhood has helped to develop train-the-trainer programs, largely due to the AZ Health Zone trainings for LIAs and the popularity of the curriculum. However, LIAs would benefit from having access to new AZ Health-Zone-approved resources in early childhood as programs expand.
As in FFY16, LIAs need training and resources covering how to support the development of written ECE policies for nutrition and physical activity.*
*Recurring recommendation from FFY16
FFY2017 SNAP-Ed Annual Report 154 January 2018
References
1. National Center for Education Statistics. Digest of Education Statistics. Available at: http://nces.ed.gov/programs/digest/current_tables.asp.
2. Segal, LM, Rayburn, J, and A Martin. The state of obesity: Better policies for a healthier America, 2016. Trust for America's Health and Robert Wood Johnson Foundation; 2017. Available at: https://stateofobesity.org/states/az
3. www.healthykidshealthyfuture.org
FFY2017 SNAP-Ed Annual Report 155 January 2018
Direct Education - Youth
Background
In Arizona, 26.9% of youth aged 10 to 17 are overweight or obese. Only 26.0% of high schoolers participate in 60 minutes per day of physical activity, and this proportion is even lower (22.9%) for 6 to 11 year-olds.1
Numerous studies within the U.S. link children’s nutrition and physical activity behaviors to their success as students2-5 (see box at left). In Arizona, the AZ Health Zone supports school-aged youth by promoting policy, systems, and environment (PSE) changes and providing direct nutrition and physical activity education (DE) for students. In FFY16, a statewide evaluation revealed that youth-focused DE was broadly and successfully delivered by AZ Health Zone Local Implementing Agencies (LIAs) in conjunction with PSE-level programming.
Lessons learned from the FFY16 evaluation included the need to: (1) expand the quantitative assessment beyond one curriculum and two grades, (2) approve more curricula for use by LIAs to enable greater flexibility in delivery across diverse contexts, and (3) measure more short-term behavioral indicators to better gauge individual-level changes expected to occur over relatively short time periods (e.g., months).6 Each of these needs were addressed during FFY17: the AZ Health Zone State Evaluation Team (SET) expanded the quantitative evaluation to multiple curricula, as detailed in the Methods and Results that follow; the AZ Health Zone State Implementation Team (SIT) established an
According to data from the 2015 National Youth Risk Behavior Surveillance System, students with higher grades are more likely than students with lower grades to be physically active and play on a sports team, and less likely to watch TV or play video games for three or more hours a day.
Students with higher grades are also more likely to have healthy dietary behaviors, including eating breakfast, eating fruits and vegetables, and avoiding soda.
Meanwhile, obesity is associated with poorer educational outcomes, including more school absences, parents more frequently contacted by the school about problems, and lower educational engagement.1
FFY2017 SNAP-Ed Annual Report 156 January 2018
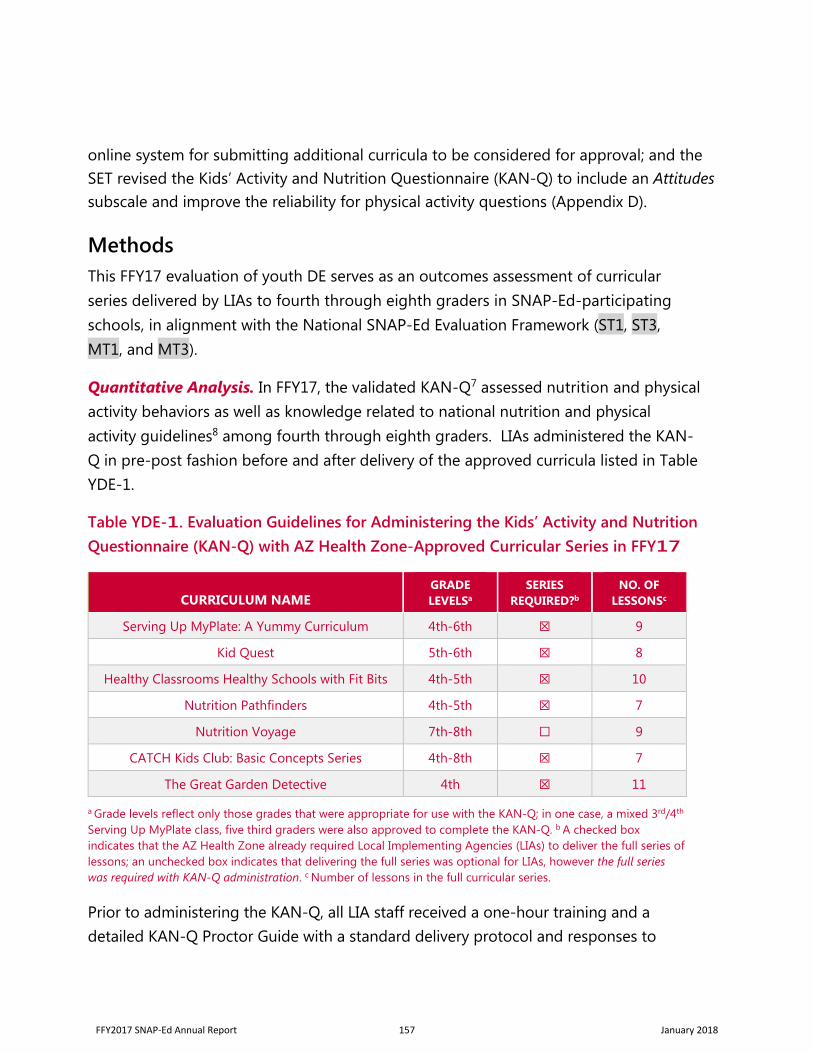
online system for submitting additional curricula to be considered for approval; and the SET revised the Kids’ Activity and Nutrition Questionnaire (KAN-Q) to include an Attitudes subscale and improve the reliability for physical activity questions (Appendix D).
Methods This FFY17 evaluation of youth DE serves as an outcomes assessment of curricular series delivered by LIAs to fourth through eighth graders in SNAP-Ed-participating schools, in alignment with the National SNAP-Ed Evaluation Framework (ST1, ST3, MT1, and MT3).
Quantitative Analysis. In FFY17, the validated KAN-Q7 assessed nutrition and physical activity behaviors as well as knowledge related to national nutrition and physical activity guidelines8 among fourth through eighth graders. LIAs administered the KAN-Q in pre-post fashion before and after delivery of the approved curricula listed in Table YDE-1.
Table YDE-1. Evaluation Guidelines for Administering the Kids’ Activity and Nutrition Questionnaire (KAN-Q) with AZ Health Zone-Approved Curricular Series in FFY17
CURRICULUM NAME GRADE LEVELSa
SERIES REQUIRED?b
NO. OF LESSONSc
Serving Up MyPlate: A Yummy Curriculum 4th-6th ☒ 9
Kid Quest 5th-6th ☒ 8
Healthy Classrooms Healthy Schools with Fit Bits 4th-5th ☒ 10
Nutrition Pathfinders 4th-5th ☒ 7
Nutrition Voyage 7th-8th ☐ 9
CATCH Kids Club: Basic Concepts Series 4th-8th ☒ 7
The Great Garden Detective 4th ☒ 11
a Grade levels reflect only those grades that were appropriate for use with the KAN-Q; in one case, a mixed 3rd/4th Serving Up MyPlate class, five third graders were also approved to complete the KAN-Q. b A checked box indicates that the AZ Health Zone already required Local Implementing Agencies (LIAs) to deliver the full series of lessons; an unchecked box indicates that delivering the full series was optional for LIAs, however the full series was required with KAN-Q administration. c Number of lessons in the full curricular series.
Prior to administering the KAN-Q, all LIA staff received a one-hour training and a detailed KAN-Q Proctor Guide with a standard delivery protocol and responses to
FFY2017 SNAP-Ed Annual Report 157 January 2018
students’ frequently asked questions. Each KAN-Q administrator was also required to pass an online proctor certification quiz to ensure the quality of data collected.
The SET analyzed results across all participants as well as by county and by curriculum. In the primary and by-county analyses, paired t-tests were used for continuous variables, and the McNemar test was applied to binary data. For the by-curriculum analysis, ANOVA and Mood's median test were used for continuous and binary data respectively. No data were imputed for skipped questions. Significance was set a priori at p<0.05. Stata version 13.1 (StataCorp LP, College Station, TX) was used for all statistical analyses.
There were several limitations to the quantitative assessment. During FFY17, the KAN-Q was undergoing revisions to improve reliability and precision, however the revised version was not yet available for the FFY17 evaluation. Therefore, questions regarding physical activity behaviors that were identified as problematic7 may have impacted findings. Moreover, the KAN-Q relies on self-report for behavioral data and is thus subject to recall bias. While the instrument poses behavioral questions about yesterday to enhance recall, those items cannot be assumed to reflect usual intake of each respondent, and repeated measures were not feasible.
Qualitative Analysis. Semi-annual report narratives (SARNs) were examined to better understand DE programming targeting school-aged youth as well as barriers and facilitators to the evaluation of this programming. SARNs were analyzed for these and other, emergent themes using NVivo v11.0.
Results Quantitative Results. During the 2016-17 school year, 563 students completed the KAN-Q pre and post assessments. This was nearly double the number of completed pre-posts collected for the previous year (N=244) and is likely due to the expanded number of curricula and, to a lesser degree, grade levels assessed. Six of Arizona’s 15 counties participated. LIAs paired three of the seven approved curricula with the KAN-Q assessment: the CATCH Kids Club Basic Concepts (CATCH), N=297; the Serving Up MyPlate: A Yummy Curriculum (Serving Up MyPlate), N=210; and the Nutrition Voyage: The Quest To Be Our Best (Nutrition Voyage), N=56.
FFY2017 SNAP-Ed Annual Report 158 January 2018
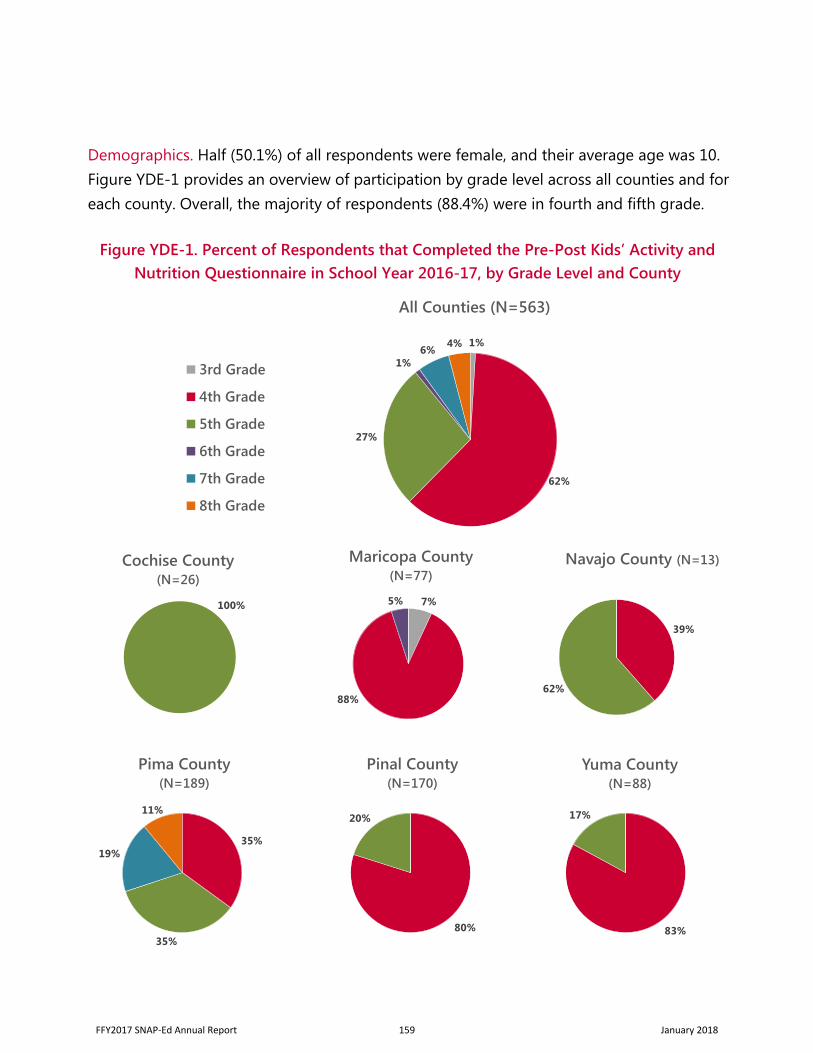
Demographics. Half (50.1%) of all respondents were female, and their average age was 10. Figure YDE-1 provides an overview of participation by grade level across all counties and for each county. Overall, the majority of respondents (88.4%) were in fourth and fifth grade.
1%
62%
27%
1%6% 4%
All Counties (N=563)
3rd Grade
4th Grade
5th Grade
6th Grade
7th Grade
8th Grade
100%
Cochise County (N=26)
7%
88%
5%
Maricopa County (N=77)
39%
62%
Navajo County (N=13)
83%
17%
Yuma County (N=88)
80%
20%
Pinal County (N=170)
Figure YDE-1. Percent of Respondents that Completed the Pre-Post Kids’ Activity and Nutrition Questionnaire in School Year 2016-17, by Grade Level and County
35%
35%
19%
11%
Pima County (N=189)
FFY2017 SNAP-Ed Annual Report 159 January 2018
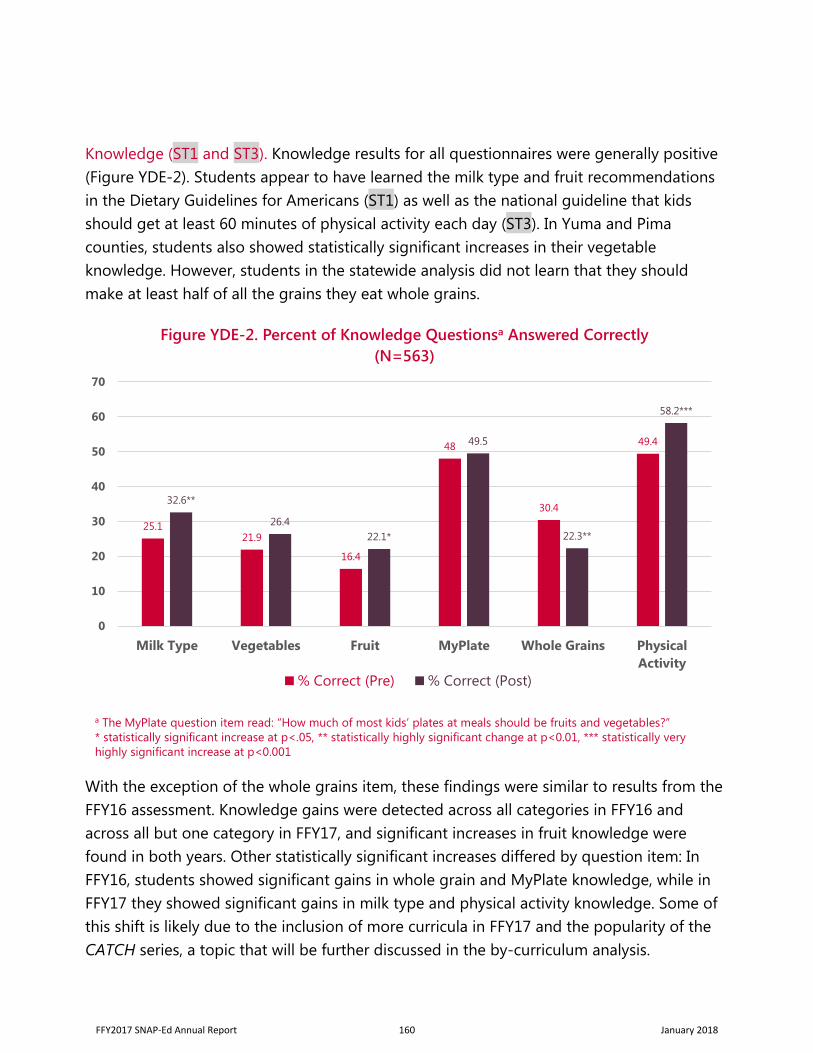
Knowledge (ST1 and ST3). Knowledge results for all questionnaires were generally positive (Figure YDE-2). Students appear to have learned the milk type and fruit recommendations in the Dietary Guidelines for Americans (ST1) as well as the national guideline that kids should get at least 60 minutes of physical activity each day (ST3). In Yuma and Pima counties, students also showed statistically significant increases in their vegetable knowledge. However, students in the statewide analysis did not learn that they should make at least half of all the grains they eat whole grains.
a The MyPlate question item read: “How much of most kids’ plates at meals should be fruits and vegetables?” * statistically significant increase at p<.05, ** statistically highly significant change at p<0.01, *** statistically very highly significant increase at p<0.001
With the exception of the whole grains item, these findings were similar to results from the FFY16 assessment. Knowledge gains were detected across all categories in FFY16 and across all but one category in FFY17, and significant increases in fruit knowledge were found in both years. Other statistically significant increases differed by question item: In FFY16, students showed significant gains in whole grain and MyPlate knowledge, while in FFY17 they showed significant gains in milk type and physical activity knowledge. Some of this shift is likely due to the inclusion of more curricula in FFY17 and the popularity of the CATCH series, a topic that will be further discussed in the by-curriculum analysis.
25.121.9
16.4
48
30.4
49.4
32.6**
26.422.1*
49.5
22.3**
58.2***
0
10
20
30
40
50
60
70
Milk Type Vegetables Fruit MyPlate Whole Grains PhysicalActivity
Figure YDE-2. Percent of Knowledge Questionsa Answered Correctly (N=563)
% Correct (Pre) % Correct (Post)
FFY2017 SNAP-Ed Annual Report 160 January 2018
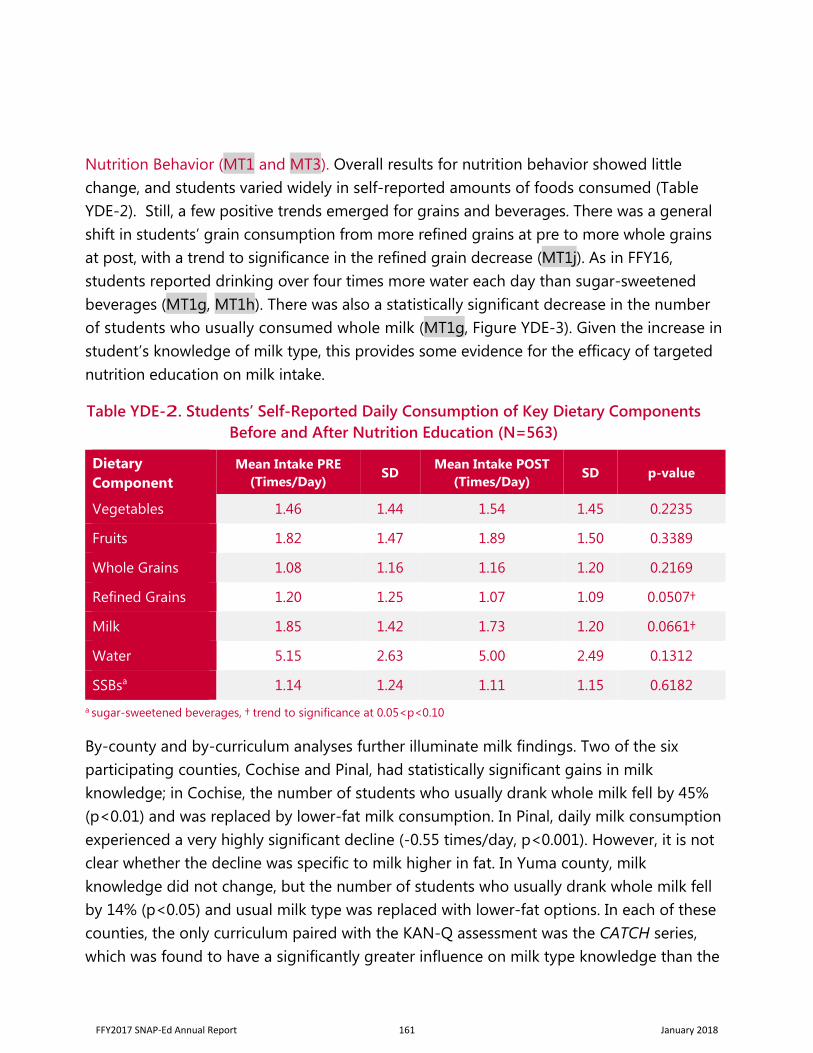
Nutrition Behavior (MT1 and MT3). Overall results for nutrition behavior showed little change, and students varied widely in self-reported amounts of foods consumed (Table YDE-2). Still, a few positive trends emerged for grains and beverages. There was a general shift in students’ grain consumption from more refined grains at pre to more whole grains at post, with a trend to significance in the refined grain decrease (MT1j). As in FFY16, students reported drinking over four times more water each day than sugar-sweetened beverages (MT1g, MT1h). There was also a statistically significant decrease in the number of students who usually consumed whole milk (MT1g, Figure YDE-3). Given the increase in student’s knowledge of milk type, this provides some evidence for the efficacy of targeted nutrition education on milk intake.
Table YDE-2. Students’ Self-Reported Daily Consumption of Key Dietary Components Before and After Nutrition Education (N=563)
Dietary Component
Mean Intake PRE (Times/Day)
SD Mean Intake POST
(Times/Day) SD p-value
Vegetables 1.46 1.44 1.54 1.45 0.2235
Fruits 1.82 1.47 1.89 1.50 0.3389
Whole Grains 1.08 1.16 1.16 1.20 0.2169
Refined Grains 1.20 1.25 1.07 1.09 0.0507†
Milk 1.85 1.42 1.73 1.20 0.0661†
Water 5.15 2.63 5.00 2.49 0.1312
SSBsa 1.14 1.24 1.11 1.15 0.6182 a sugar-sweetened beverages, † trend to significance at 0.05<p<0.10
By-county and by-curriculum analyses further illuminate milk findings. Two of the six participating counties, Cochise and Pinal, had statistically significant gains in milk knowledge; in Cochise, the number of students who usually drank whole milk fell by 45% (p<0.01) and was replaced by lower-fat milk consumption. In Pinal, daily milk consumption experienced a very highly significant decline (-0.55 times/day, p<0.001). However, it is not clear whether the decline was specific to milk higher in fat. In Yuma county, milk knowledge did not change, but the number of students who usually drank whole milk fell by 14% (p<0.05) and usual milk type was replaced with lower-fat options. In each of these counties, the only curriculum paired with the KAN-Q assessment was the CATCH series, which was found to have a significantly greater influence on milk type knowledge than the
FFY2017 SNAP-Ed Annual Report 161 January 2018
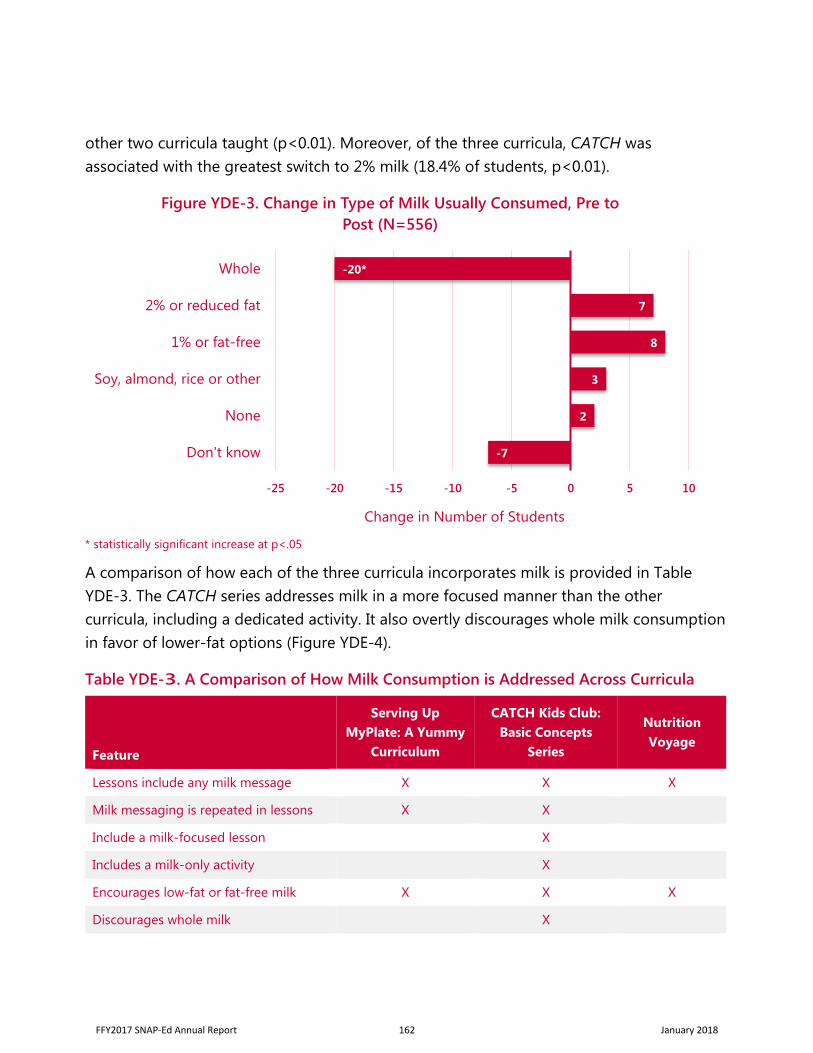
other two curricula taught (p<0.01). Moreover, of the three curricula, CATCH was associated with the greatest switch to 2% milk (18.4% of students, p<0.01).
* statistically significant increase at p<.05
A comparison of how each of the three curricula incorporates milk is provided in Table YDE-3. The CATCH series addresses milk in a more focused manner than the other curricula, including a dedicated activity. It also overtly discourages whole milk consumption in favor of lower-fat options (Figure YDE-4).
Table YDE-3. A Comparison of How Milk Consumption is Addressed Across Curricula
Feature
Serving Up MyPlate: A Yummy
Curriculum
CATCH Kids Club: Basic Concepts
Series
Nutrition Voyage
Lessons include any milk message X X X
Milk messaging is repeated in lessons X X
Include a milk-focused lesson X
Includes a milk-only activity X
Encourages low-fat or fat-free milk X X X
Discourages whole milk X
-7
2
3
8
7
-20*
-25 -20 -15 -10 -5 0 5 10
Don't know
None
Soy, almond, rice or other
1% or fat-free
2% or reduced fat
Whole
Change in Number of Students
Figure YDE-3. Change in Type of Milk Usually Consumed, Pre to Post (N=556)
FFY2017 SNAP-Ed Annual Report 162 January 2018
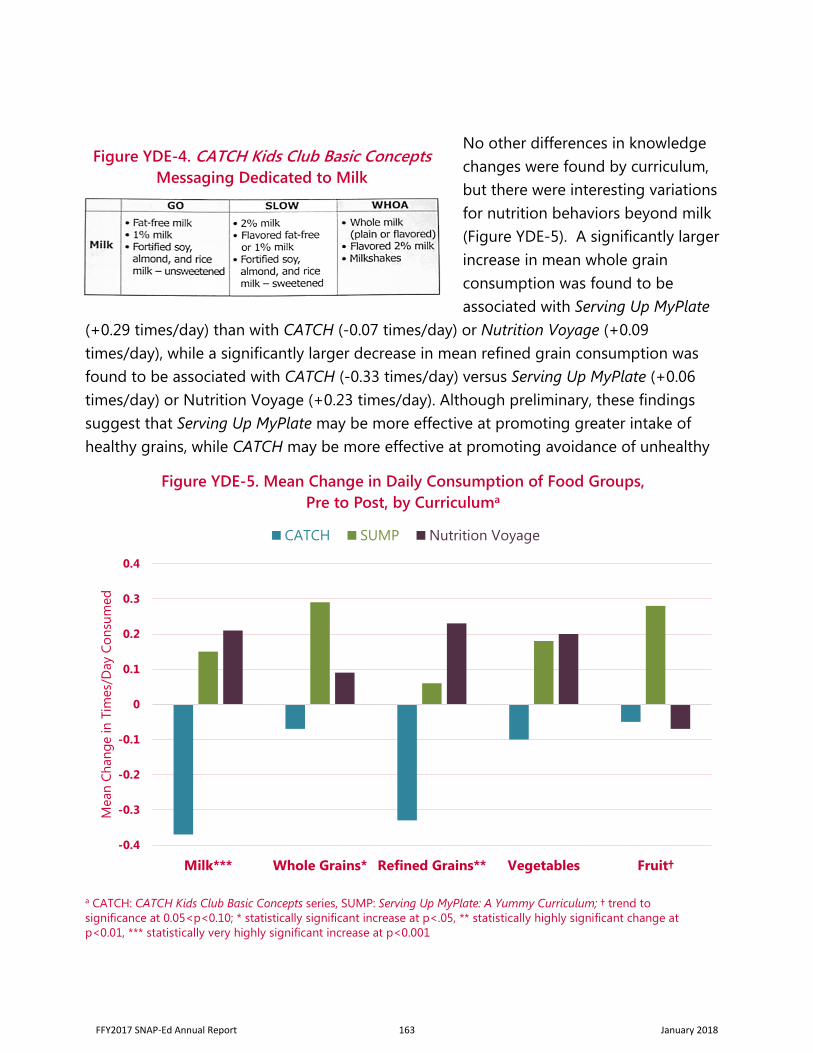
No other differences in knowledge changes were found by curriculum, but there were interesting variations for nutrition behaviors beyond milk (Figure YDE-5). A significantly larger increase in mean whole grain consumption was found to be associated with Serving Up MyPlate
(+0.29 times/day) than with CATCH (-0.07 times/day) or Nutrition Voyage (+0.09 times/day), while a significantly larger decrease in mean refined grain consumption was found to be associated with CATCH (-0.33 times/day) versus Serving Up MyPlate (+0.06 times/day) or Nutrition Voyage (+0.23 times/day). Although preliminary, these findings suggest that Serving Up MyPlate may be more effective at promoting greater intake of healthy grains, while CATCH may be more effective at promoting avoidance of unhealthy
a CATCH: CATCH Kids Club Basic Concepts series, SUMP: Serving Up MyPlate: A Yummy Curriculum; † trend to significance at 0.05<p<0.10; * statistically significant increase at p<.05, ** statistically highly significant change at p<0.01, *** statistically very highly significant increase at p<0.001
Figure YDE-4. CATCH Kids Club Basic Concepts Messaging Dedicated to Milk
-0.4
-0.3
-0.2
-0.1
0
0.1
0.2
0.3
0.4
Milk*** Whole Grains* Refined Grains** Vegetables Fruit†
Mea
n Ch
ange
in T
imes
/Day
Con
sum
ed
Figure YDE-5. Mean Change in Daily Consumption of Food Groups, Pre to Post, by Curriculuma
CATCH SUMP Nutrition Voyage
FFY2017 SNAP-Ed Annual Report 163 January 2018
grains. More generally, CATCH appeared to encourage the reduction of unhealthy eating behaviors, whereas Serving Up MyPlate and Nutrition Voyage may have encouraged an increase in the consumption of certain types of nutritious foods. Interestingly, while all three curricula reference MyPlate, the CATCH series relies upon the Go, Slow, Whoa model and includes energy balance as one of three key messages, while Serving Up MyPlate centers on using MyPlate to frame messages and guide student activities. Nutrition Voyage has students visit http://choosemyplate.gov and other USDA websites, with lessons largely designed around Math, Science, and English Language Arts standards.
Physical Activity Behavior (MT3). While students’ knowledge of physical activity guidelines increased, we found little change in their physical activity behaviors. The percent of respondents who met the national recommendation for getting 60 minutes of physical activity yesterday remained stable before and after direct education (38.2% vs 37.1%, respectively). Findings are roughly consistent with those in FFY16, when physical activity behaviors changed little and 42.5% of respondents met the national recommendation of 60 minutes of activity per day.
It is important to note that both the FFY16 and FFY17 evaluations used the unrevised version of the KAN-Q, which was found to have a problematic physical activity subscale that inhibited the SET’s ability to interpret findings.6 Starting in FFY18, the AZ Health Zone’s KAN-Q assessments have begun implementing the revised KAN-Q with an improved physical activity subscale (Appendix D) that is intended to enable a more robust interpretation of future results.
Qualitative Results. Nineteen LIAs submitted mid-year and end-year SARNs, including seven health departments and 12 units within the University of Arizona Cooperative Extension. Of these, 17 addressed DE among school-aged youth in their narratives.
Based upon narrative reports, LIAs appear to have expanded their use of and comfort with more AZ Health Zone-approved curricula. Compared with FFY16, there was an increase in the number of curricula discussed by LIAs in the FFY17 SARNs (Figure YDE-6). Activity and Eating, Dig In!, Growing Healthy Habits, and Nutrition Pathfinders were newly mentioned, while only one curriculum—Exercise Your Options—was no longer referenced. Moreover, the number of LIAs referencing curricula in FFY17 increased from FFY16. As in FFY16, CATCH Kids Club received the most narrative coverage. However, Serving Up MyPlate was mentioned less, and Junior Master Gardener and Cooking Matters for Chefs and Kids received greater attention despite their lack of a required evaluation component. Notably,
FFY2017 SNAP-Ed Annual Report 164 January 2018
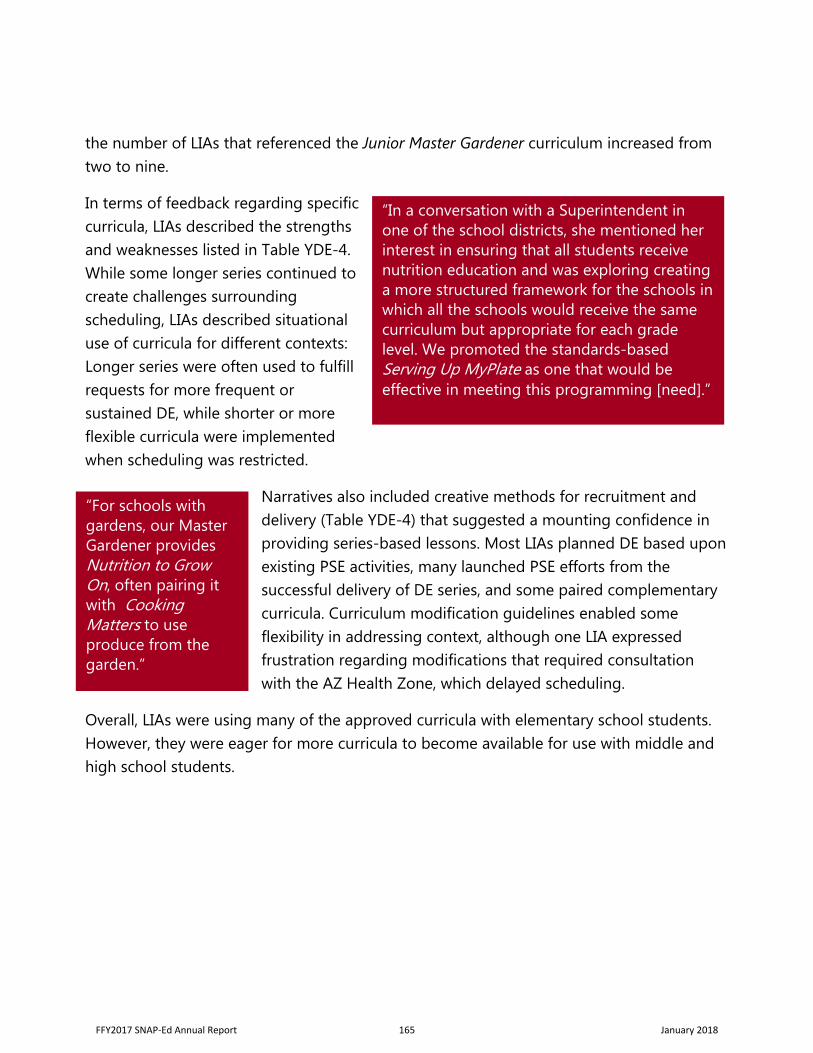
the number of LIAs that referenced the Junior Master Gardener curriculum increased from two to nine.
In terms of feedback regarding specific curricula, LIAs described the strengths and weaknesses listed in Table YDE-4. While some longer series continued to create challenges surrounding scheduling, LIAs described situational use of curricula for different contexts: Longer series were often used to fulfill requests for more frequent or sustained DE, while shorter or more flexible curricula were implemented when scheduling was restricted.
Narratives also included creative methods for recruitment and delivery (Table YDE-4) that suggested a mounting confidence in providing series-based lessons. Most LIAs planned DE based upon existing PSE activities, many launched PSE efforts from the successful delivery of DE series, and some paired complementary curricula. Curriculum modification guidelines enabled some flexibility in addressing context, although one LIA expressed frustration regarding modifications that required consultation with the AZ Health Zone, which delayed scheduling.
Overall, LIAs were using many of the approved curricula with elementary school students. However, they were eager for more curricula to become available for use with middle and high school students.
“In a conversation with a Superintendent in one of the school districts, she mentioned her interest in ensuring that all students receive nutrition education and was exploring creating a more structured framework for the schools in which all the schools would receive the same curriculum but appropriate for each grade level. We promoted the standards-based Serving Up MyPlate as one that would be effective in meeting this programming [need].”
“For schools with gardens, our Master Gardener provides Nutrition to Grow On, often pairing it with Cooking Matters to use produce from the garden.”
FFY2017 SNAP-Ed Annual Report 165 January 2018
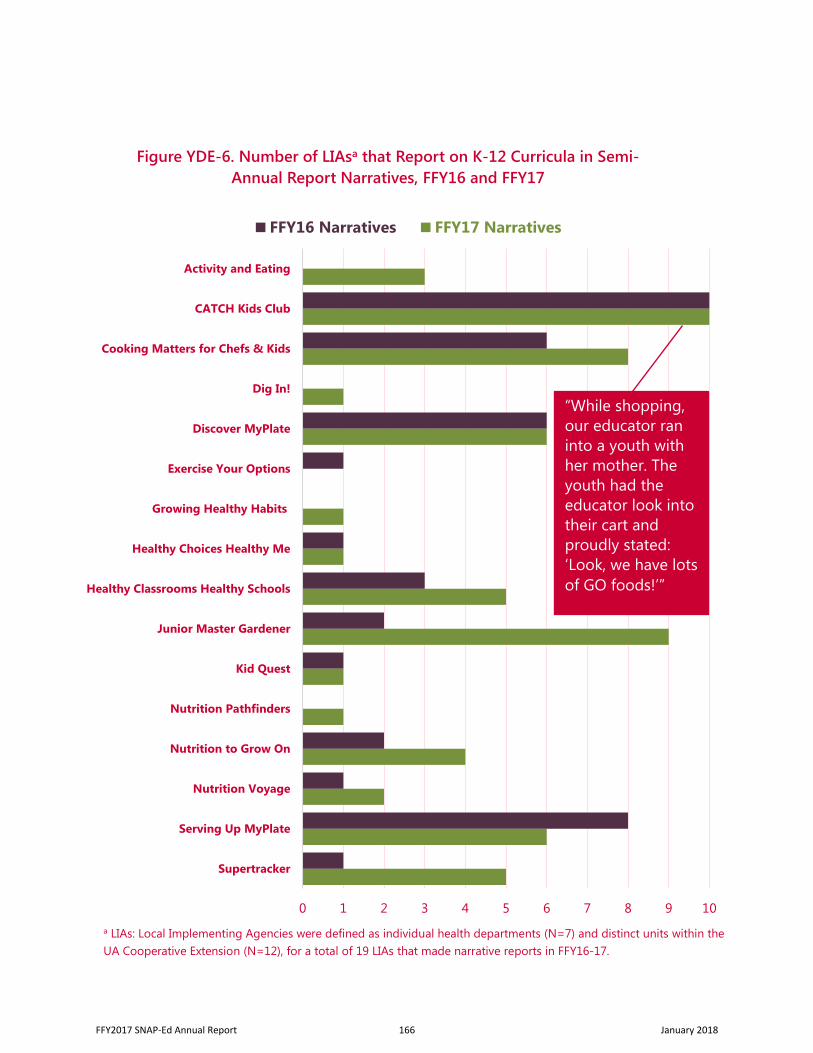
a LIAs: Local Implementing Agencies were defined as individual health departments (N=7) and distinct units within the UA Cooperative Extension (N=12), for a total of 19 LIAs that made narrative reports in FFY16-17.
0 1 2 3 4 5 6 7 8 9 10
Supertracker
Serving Up MyPlate
Nutrition Voyage
Nutrition to Grow On
Nutrition Pathfinders
Kid Quest
Junior Master Gardener
Healthy Classrooms Healthy Schools
Healthy Choices Healthy Me
Growing Healthy Habits
Exercise Your Options
Discover MyPlate
Dig In!
Cooking Matters for Chefs & Kids
CATCH Kids Club
Activity and Eating
Figure YDE-6. Number of LIAsa that Report on K-12 Curricula in Semi-Annual Report Narratives, FFY16 and FFY17
FFY16 Narratives FFY17 Narratives
“While shopping, our educator ran into a youth with her mother. The youth had the educator look into their cart and proudly stated: ‘Look, we have lots of GO foods!’”
FFY2017 SNAP-Ed Annual Report 166 January 2018
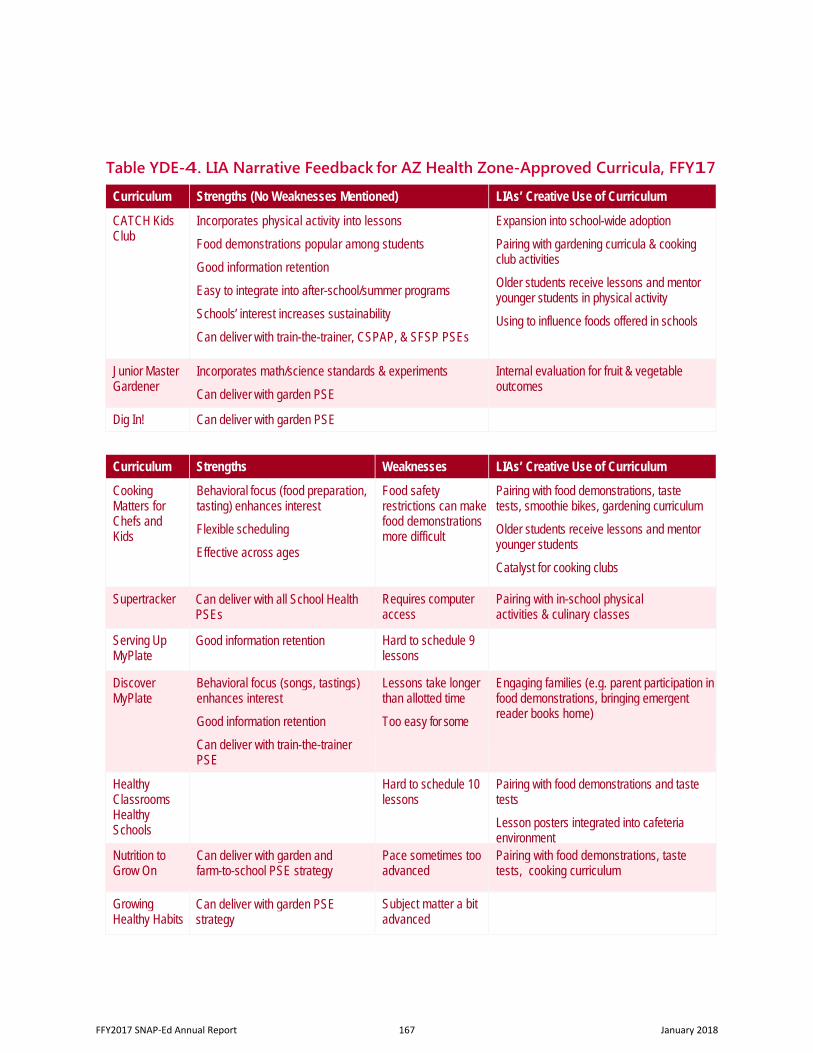
Table YDE-4. LIA Narrative Feedback for AZ Health Zone-Approved Curricula, FFY17
Curriculum Strengths (No Weaknesses Mentioned) LIAs’ Creative Use of Curriculum
CATCH Kids Club
Incorporates physical activity into lessons
Food demonstrations popular among students
Good information retention
Easy to integrate into after-school/summer programs
Schools’ interest increases sustainability
Can deliver with train-the-trainer, CSPAP, & SFSP PSEs
Expansion into school-wide adoption
Pairing with gardening curricula & cooking club activities
Older students receive lessons and mentor younger students in physical activity
Using to influence foods offered in schools
Junior Master Gardener
Incorporates math/science standards & experiments
Can deliver with garden PSE
Internal evaluation for fruit & vegetable outcomes
Dig In! Can deliver with garden PSE
Curriculum Strengths Weaknesses LIAs’ Creative Use of Curriculum
Cooking Matters for Chefs and Kids
Behavioral focus (food preparation, tasting) enhances interest
Flexible scheduling
Effective across ages
Food safety restrictions can make food demonstrations more difficult
Pairing with food demonstrations, taste tests, smoothie bikes, gardening curriculum
Older students receive lessons and mentor younger students
Catalyst for cooking clubs
Supertracker Can deliver with all School Health PSEs
Requires computer access
Pairing with in-school physical activities & culinary classes
Serving Up MyPlate
Good information retention Hard to schedule 9 lessons
Discover MyPlate
Behavioral focus (songs, tastings) enhances interest
Good information retention
Can deliver with train-the-trainer PSE
Lessons take longer than allotted time
Too easy for some
Engaging families (e.g. parent participation in food demonstrations, bringing emergent reader books home)
Healthy Classrooms Healthy Schools
Hard to schedule 10 lessons
Pairing with food demonstrations and taste tests
Lesson posters integrated into cafeteria environment
Nutrition to Grow On
Can deliver with garden and farm-to-school PSE strategy
Pace sometimes too advanced
Pairing with food demonstrations, taste tests, cooking curriculum
Growing Healthy Habits
Can deliver with garden PSE strategy
Subject matter a bit advanced
FFY2017 SNAP-Ed Annual Report 167 January 2018
Beyond references to specific curricula, SARNs described strengths, opportunities and threats related to general DE programming targeting youth. These themes emerged:
DE Expansion. LIAs often described DE expansion into new sites as well as a shift toward the more systematic integration of DE into classrooms. Expansion was motivated by both LIAs and school leadership: LIAs described leaders’ heightened interest in intensifying efforts after successful DE delivery at their school, and LIAs used success stories in other locations to spur expansion into new sites or with new partners. Notable areas of DE growth included implementing lesssons at new gardening sites; a growing presence in middle and high schools, in particular related to cooking and the Supertracker curricula; and the pursuit of tribal and Indian Health Services partnerships in Navajo and Maricopa counties. Some LIAs also described an impressive ability to meet the increased demand for DE by incorporating peer mentorship or developing a train-the-trainer model.
As work with middle and high schools increased, many LIAs called for more AZ Health Zone-approved curricula targeting these older age groups.
Behaviorally-focused DE Reinforced Learning and Generated New DE Opportunities. As in FFY16, FFY17 narratives revealed that LIAs, teachers and students valued the skill-building components of curricula (e.g. label reading, cooking) as well as food demonstrations and taste tests, which often led to requests for more of the same.
“[W]e problem solved with the administration and decided to partner with the middle school ‘mentor students’ to help teach the CATCH physical activity lessons. Each week, our educator meets with the mentor students and presents the physical activity lessons for the elementary students...we divide the 6o elementary students into three groups, and the mentor students teach the physical activity demonstrations.”
“We have found that this combination of an interactive lesson combined with a physical or arts and crafts activity keeps the children’s attention and helps the children remember the lesson. When [LIA staff] arrived at a site for the nutrition lesson, the children cried out, ‘Yay! Nutrition is here!’”
FFY2017 SNAP-Ed Annual Report 168 January 2018
Growing Sophistication of Internal Evaluation. In FFY16, five LIAs reported positive outcomes related to DE lessons for school-aged youth. In FFY17, eight LIAs
described internal evaluations that also provided evidence for the strength of DE programming. Furthermore, LIAs grew in terms of the quality of their internal assessments. This included: 1) using findings from a partner program’s assessment to compare student interest in various activities pre to post for program improvement; 2) the widespread administration of teacher
surveys by multiple LIAs for program improvement; 3) adopting and administering a validated tool to assess grades K-2; 4) developing a tool to assess fruit and vegetable outcomes among students, which revealed positive intentions to changes and behavior changes; and 5) the use of a Turning Technologies audience response system to administer pre-post surveys with third through eighth grades.
Programming Threatened by Common Barriers. As in FFY16, competing demands on the educational system and lack of top-down support for regular nutrition education in the classroom were reported to limit classroom time,
especially for series-based curricula. For rural LIAs, school staff turnover inhibited relationship-building and scheduling. In FFY17, LIAs also referenced a new commonly-experienced challenge: increased demand for DE was difficult to meet
with limited LIA staff. However, unlike the previous year, many LIAs described attempts to overcome these familiar barriers through creative scheduling and partnerships.
“After years of a great working relationship, the pressure for teachers to meet [academic] performance levels has limited our opportunity…to teach or organize events. We are working with other organizations within the area to partner on projects to limit [duplication of efforts] in the school.”
“Of all the students polled at the post-test: 100% would recommend this class to another student, 100% were more excited about gardening…favorite activities were planting/gardening 75%, solar oven 69%, [and] dehydrating/cooking/ making snacks/cutting 56%.”
FFY2017 SNAP-Ed Annual Report 169 January 2018
Robust plans to provide multi-level, school-based interventions. LIA narratives described the development and implementation of multi-level interventions that incorporated DE, site-level PSEs, and in some cases, community-level PSEs. While connections between DE and gardening were also made in FFY16, more curricula were paired with gardening in FFY17, and other PSEs were referenced, including: farm-to-school, the SFSP, LWP implementation, menu planning, train-the-trainer, and CSPAP. Moreover, some narratives reflected a deeper understanding of how to leverage state, district, and community partner support for PSE and DE programming.
Enthusiasm for Evaluating Multi-Level Interventions. As in FFY16, some LIAs reported frustration related to the use of the KAN-Q in FFY17 with specific curricula only. However, fewer complaints were reported and some successful KAN-Q data collection efforts were described. Encouragingly, most KAN-Q comments were focused upon enthusiasm for the revised version of the survey and the new administration model, which was introduced in July 2017. This new model requires pre-tests at the start of the school year, prior to any interventions being delivered, and post-test at the end of the school year, after interventions have been delivered. It is designed to assess the influence of both PSEs and DE on students’ knowledge, attitudes and behaviors, and thus evaluates multi-level interventions (see the Deep Dive section for more information).
Summary of Findings. Overall, the FFY17 KAN-Q results for the CATCH series, Serving Up MyPlate, and Nutrition Voyage suggest that student outcomes improved for knowledge
“[T]he school has an herb garden, and the teacher involved with the garden has asked us to present lessons to the culinary arts students to help bridge the connection between gardening efforts and their use in nutrition and cooking. The students can then use that knowledge and what they produce in the garden to sell seedlings at the [City] Farmers’ Market.”
“With the impetus of the ADE making school health a priority by requiring districts to track LWP implementation, schools will likely be more receptive and engaged in conversation about bringing more resources and supports…there is an opportunity to match those efforts with nutrition and physical activity education.”
FFY2017 SNAP-Ed Annual Report 170 January 2018
but had a limited influence on behaviors. Narratives revealed that LIAs have gained extensive experience with more AZ Health-Zone-approved curricula, developed a deeper understanding of school-based multi-level interventions, and learned how to leverage success to expand reach.
Nutrition and Physical Activity Knowledge Students appeared to have learned some key messages for MyPlate food groups
Students appeared to have learned national recommendations for physical activity
Other short-term indicators like attitudes were not measured; this inhibits interpretation
Nutrition and Physical Activity Behaviors Positive changes were found for healthier milk consumption
Some trends suggested positive changes in healthy grain consumption
No notable changes were found for other nutrition or physical activity behaviors
Findings for physical activity are difficult to interpret given poor reliability of these scale items
Differences by Curriculum (CATCH, Serving Up MyPlate, Nutrition Voyage) CATCH appeared to have had the strongest influence on healthy milk consumption
CATCH may have encouraged the greatest reduction in refined grains
Serving Up MyPlate appeared to have had the strongest influence on whole grain intake
Overall, CATCH seemed to reduce the consumption of unhealthy foods
Overall, Serving Up MyPlate seemed to encourage the consumption of healthy foods
Youth DE Evaluation LIAs nearly doubled the number of KAN-Qs competed in FFY17 versus FFY16
LIAs independently conducted several successful internal evaluations to improve programs
LIAs were enthusiastic about using the KAN-Q with multi-level interventions
AZ Health Zone-Approved Curricula CATCH, Junior Master Gardener, and Cooking Matters were popular among LIAs and were used in conjunction with appropriate PSE strategies
LIAs largely relied on Supertracker as they expanded into high schools; more age-appropriate curricula for older students may provide further support for this expansion
LIAs are learning to match curricula to schools’ specific needs, navigate scheduling barriers for series, and employ creative delivery methods to enhance learning
Multi-Level Intervention Highlights
FFY2017 SNAP-Ed Annual Report 171 January 2018
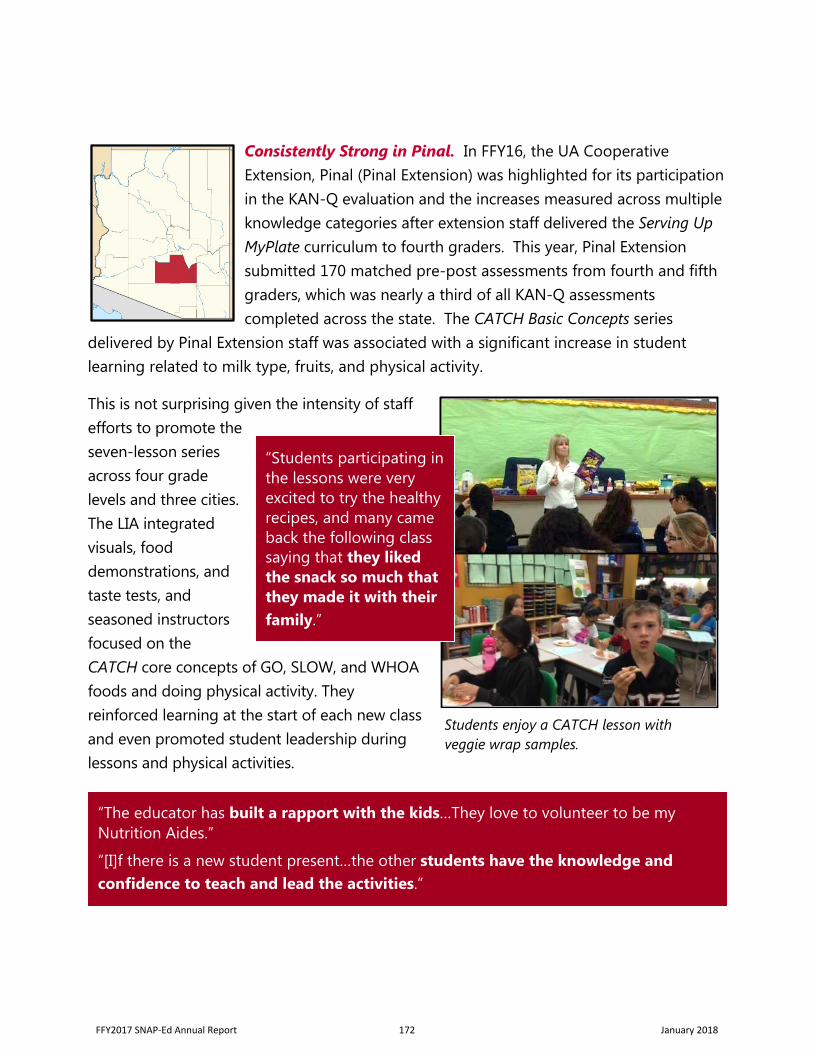
Consistently Strong in Pinal. In FFY16, the UA Cooperative Extension, Pinal (Pinal Extension) was highlighted for its participation in the KAN-Q evaluation and the increases measured across multiple knowledge categories after extension staff delivered the Serving Up MyPlate curriculum to fourth graders. This year, Pinal Extension submitted 170 matched pre-post assessments from fourth and fifth graders, which was nearly a third of all KAN-Q assessments completed across the state. The CATCH Basic Concepts series
delivered by Pinal Extension staff was associated with a significant increase in student learning related to milk type, fruits, and physical activity.
This is not surprising given the intensity of staff efforts to promote the seven-lesson series across four grade levels and three cities. The LIA integrated visuals, food demonstrations, and taste tests, and seasoned instructors focused on the CATCH core concepts of GO, SLOW, and WHOA foods and doing physical activity. They reinforced learning at the start of each new class and even promoted student leadership during lessons and physical activities.
Students enjoy a CATCH lesson with veggie wrap samples.
“Students participating in the lessons were very excited to try the healthy recipes, and many came back the following class saying that they liked the snack so much that they made it with their family.”
“The educator has built a rapport with the kids…They love to volunteer to be my Nutrition Aides.”
“[I]f there is a new student present…the other students have the knowledge and confidence to teach and lead the activities.”
FFY2017 SNAP-Ed Annual Report 172 January 2018
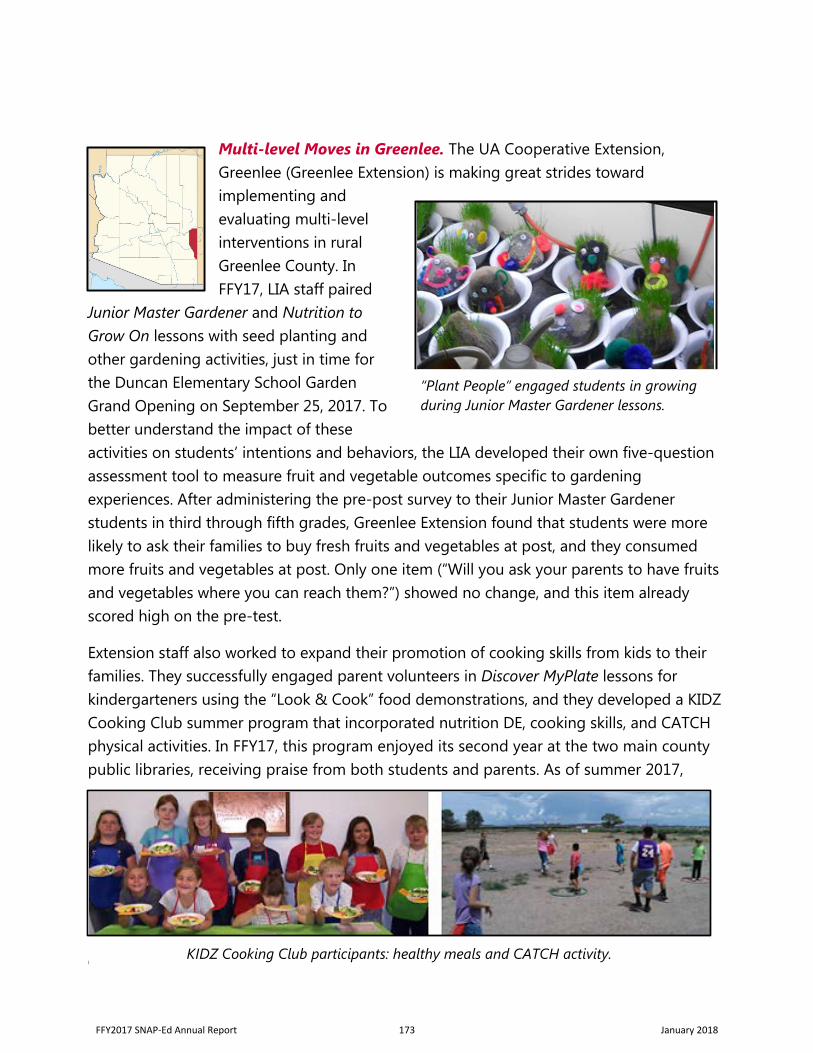
Multi-level Moves in Greenlee. The UA Cooperative Extension, Greenlee (Greenlee Extension) is making great strides toward implementing and evaluating multi-level interventions in rural Greenlee County. In FFY17, LIA staff paired
Junior Master Gardener and Nutrition to Grow On lessons with seed planting and other gardening activities, just in time for the Duncan Elementary School Garden Grand Opening on September 25, 2017. To better understand the impact of these activities on students’ intentions and behaviors, the LIA developed their own five-question assessment tool to measure fruit and vegetable outcomes specific to gardening experiences. After administering the pre-post survey to their Junior Master Gardener students in third through fifth grades, Greenlee Extension found that students were more likely to ask their families to buy fresh fruits and vegetables at post, and they consumed more fruits and vegetables at post. Only one item (“Will you ask your parents to have fruits and vegetables where you can reach them?”) showed no change, and this item already scored high on the pre-test.
Extension staff also worked to expand their promotion of cooking skills from kids to their families. They successfully engaged parent volunteers in Discover MyPlate lessons for kindergarteners using the “Look & Cook” food demonstrations, and they developed a KIDZ Cooking Club summer program that incorporated nutrition DE, cooking skills, and CATCH physical activities. In FFY17, this program enjoyed its second year at the two main county public libraries, receiving praise from both students and parents. As of summer 2017,
Greenlee Extension expanded this program by engaging families with adult DE using the
“Plant People” engaged students in growing during Junior Master Gardener lessons.
KIDZ Cooking Club participants: healthy meals and CATCH activity.
FFY2017 SNAP-Ed Annual Report 173 January 2018
MyPlate for My Family curriculum, and they have future plans to further integrate youth and adult education using Cooking Matters for Chefs and Kids.
“I’m going to tell my Girl Scout Leader that I can handle the snacks at our next meeting. I’ve got this!”
~ Eight-year-old member of the KIDZ Cooking Club
“This is really delicious. I’m pleasantly surprised!” ~KIDZ Cooking Club 6th grader after tasting a tuna boat
FFY2017 SNAP-Ed Annual Report 174 January 2018
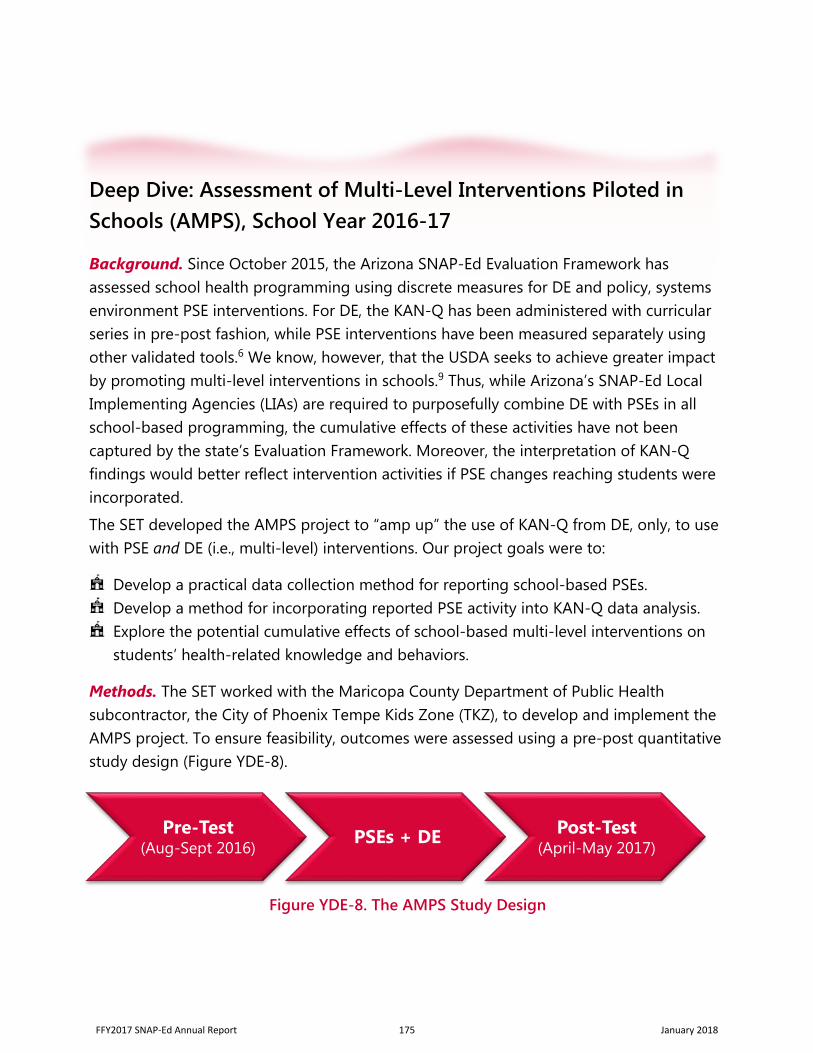
Deep Dive: Assessment of Multi-Level Interventions Piloted in Schools (AMPS), School Year 2016-17
Background. Since October 2015, the Arizona SNAP-Ed Evaluation Framework has assessed school health programming using discrete measures for DE and policy, systems environment PSE interventions. For DE, the KAN-Q has been administered with curricular series in pre-post fashion, while PSE interventions have been measured separately using other validated tools.6 We know, however, that the USDA seeks to achieve greater impact by promoting multi-level interventions in schools.9 Thus, while Arizona’s SNAP-Ed Local Implementing Agencies (LIAs) are required to purposefully combine DE with PSEs in all school-based programming, the cumulative effects of these activities have not been captured by the state’s Evaluation Framework. Moreover, the interpretation of KAN-Q findings would better reflect intervention activities if PSE changes reaching students were incorporated.
The SET developed the AMPS project to “amp up” the use of KAN-Q from DE, only, to use with PSE and DE (i.e., multi-level) interventions. Our project goals were to:
Develop a practical data collection method for reporting school-based PSEs. Develop a method for incorporating reported PSE activity into KAN-Q data analysis. Explore the potential cumulative effects of school-based multi-level interventions on students’ health-related knowledge and behaviors.
Methods. The SET worked with the Maricopa County Department of Public Health subcontractor, the City of Phoenix Tempe Kids Zone (TKZ), to develop and implement the AMPS project. To ensure feasibility, outcomes were assessed using a pre-post quantitative study design (Figure YDE-8).
Figure YDE-8. The AMPS Study Design
Pre-Test (Aug-Sept 2016) PSEs + DE Post-Test
(April-May 2017)
FFY2017 SNAP-Ed Annual Report 175 January 2018
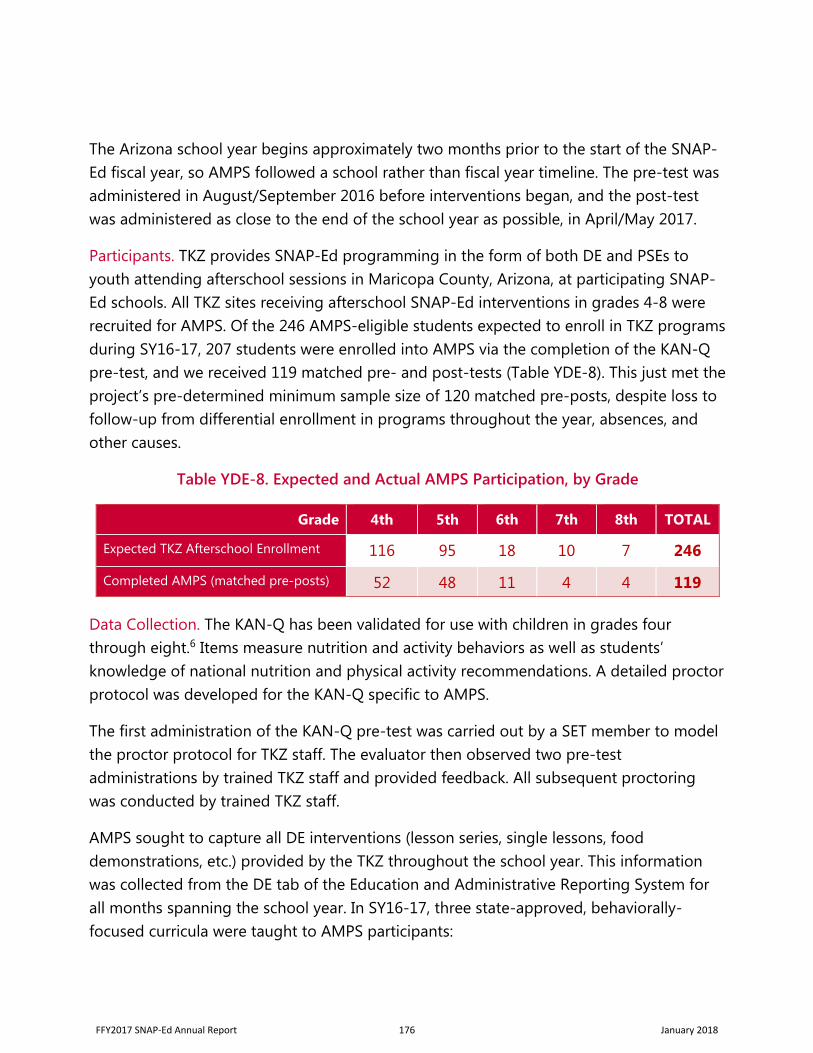
The Arizona school year begins approximately two months prior to the start of the SNAP-Ed fiscal year, so AMPS followed a school rather than fiscal year timeline. The pre-test was administered in August/September 2016 before interventions began, and the post-test was administered as close to the end of the school year as possible, in April/May 2017.
Participants. TKZ provides SNAP-Ed programming in the form of both DE and PSEs to youth attending afterschool sessions in Maricopa County, Arizona, at participating SNAP-Ed schools. All TKZ sites receiving afterschool SNAP-Ed interventions in grades 4-8 were recruited for AMPS. Of the 246 AMPS-eligible students expected to enroll in TKZ programs during SY16-17, 207 students were enrolled into AMPS via the completion of the KAN-Q pre-test, and we received 119 matched pre- and post-tests (Table YDE-8). This just met the project’s pre-determined minimum sample size of 120 matched pre-posts, despite loss to follow-up from differential enrollment in programs throughout the year, absences, and other causes.
Table YDE-8. Expected and Actual AMPS Participation, by Grade
Grade 4th 5th 6th 7th 8th TOTAL
Expected TKZ Afterschool Enrollment 116 95 18 10 7 246
Completed AMPS (matched pre-posts) 52 48 11 4 4 119
Data Collection. The KAN-Q has been validated for use with children in grades four through eight.6 Items measure nutrition and activity behaviors as well as students’ knowledge of national nutrition and physical activity recommendations. A detailed proctor protocol was developed for the KAN-Q specific to AMPS.
The first administration of the KAN-Q pre-test was carried out by a SET member to model the proctor protocol for TKZ staff. The evaluator then observed two pre-test administrations by trained TKZ staff and provided feedback. All subsequent proctoring was conducted by trained TKZ staff.
AMPS sought to capture all DE interventions (lesson series, single lessons, food demonstrations, etc.) provided by the TKZ throughout the school year. This information was collected from the DE tab of the Education and Administrative Reporting System for all months spanning the school year. In SY16-17, three state-approved, behaviorally-focused curricula were taught to AMPS participants:
FFY2017 SNAP-Ed Annual Report 176 January 2018
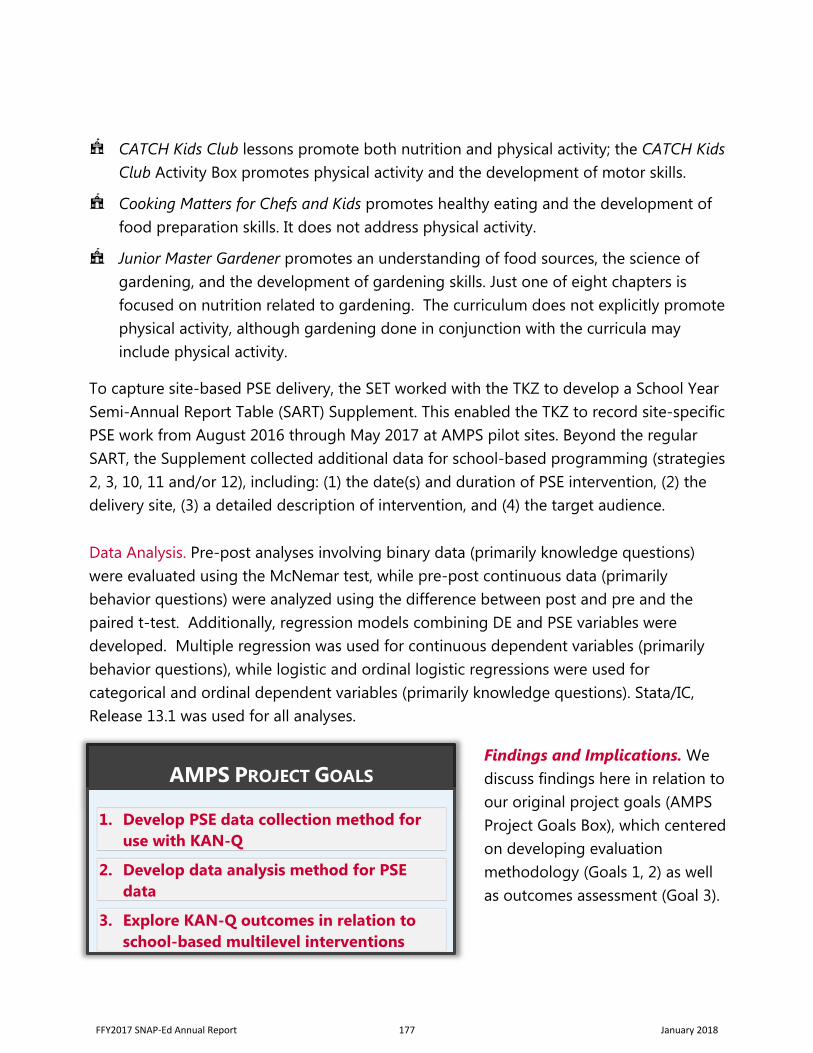
CATCH Kids Club lessons promote both nutrition and physical activity; the CATCH Kids Club Activity Box promotes physical activity and the development of motor skills.
Cooking Matters for Chefs and Kids promotes healthy eating and the development of food preparation skills. It does not address physical activity.
Junior Master Gardener promotes an understanding of food sources, the science of gardening, and the development of gardening skills. Just one of eight chapters is focused on nutrition related to gardening. The curriculum does not explicitly promote physical activity, although gardening done in conjunction with the curricula may include physical activity.
To capture site-based PSE delivery, the SET worked with the TKZ to develop a School Year Semi-Annual Report Table (SART) Supplement. This enabled the TKZ to record site-specific PSE work from August 2016 through May 2017 at AMPS pilot sites. Beyond the regular SART, the Supplement collected additional data for school-based programming (strategies 2, 3, 10, 11 and/or 12), including: (1) the date(s) and duration of PSE intervention, (2) the delivery site, (3) a detailed description of intervention, and (4) the target audience.
Data Analysis. Pre-post analyses involving binary data (primarily knowledge questions) were evaluated using the McNemar test, while pre-post continuous data (primarily behavior questions) were analyzed using the difference between post and pre and the paired t-test. Additionally, regression models combining DE and PSE variables were developed. Multiple regression was used for continuous dependent variables (primarily behavior questions), while logistic and ordinal logistic regressions were used for categorical and ordinal dependent variables (primarily knowledge questions). Stata/IC, Release 13.1 was used for all analyses.
Findings and Implications. We discuss findings here in relation to our original project goals (AMPS Project Goals Box), which centered on developing evaluation methodology (Goals 1, 2) as well as outcomes assessment (Goal 3).
AMPS PROJECT GOALS
1. Develop PSE data collection method for use with KAN-Q
2. Develop data analysis method for PSE data
3. Explore KAN-Q outcomes in relation to school-based multilevel interventions
FFY2017 SNAP-Ed Annual Report 177 January 2018
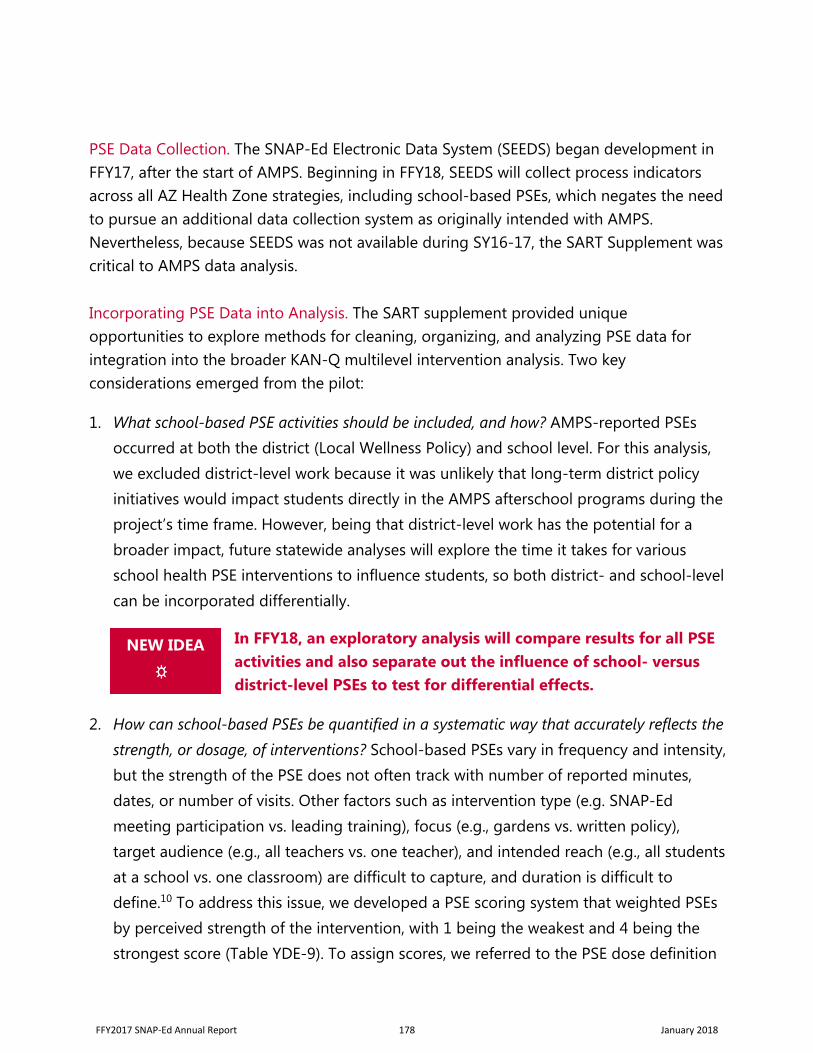
PSE Data Collection. The SNAP-Ed Electronic Data System (SEEDS) began development in FFY17, after the start of AMPS. Beginning in FFY18, SEEDS will collect process indicators across all AZ Health Zone strategies, including school-based PSEs, which negates the need to pursue an additional data collection system as originally intended with AMPS. Nevertheless, because SEEDS was not available during SY16-17, the SART Supplement was critical to AMPS data analysis.
Incorporating PSE Data into Analysis. The SART supplement provided unique opportunities to explore methods for cleaning, organizing, and analyzing PSE data for integration into the broader KAN-Q multilevel intervention analysis. Two key considerations emerged from the pilot:
1. What school-based PSE activities should be included, and how? AMPS-reported PSEs occurred at both the district (Local Wellness Policy) and school level. For this analysis, we excluded district-level work because it was unlikely that long-term district policy initiatives would impact students directly in the AMPS afterschool programs during the project’s time frame. However, being that district-level work has the potential for a broader impact, future statewide analyses will explore the time it takes for various school health PSE interventions to influence students, so both district- and school-level can be incorporated differentially.
In FFY18, an exploratory analysis will compare results for all PSE activities and also separate out the influence of school- versus district-level PSEs to test for differential effects.
2. How can school-based PSEs be quantified in a systematic way that accurately reflects the strength, or dosage, of interventions? School-based PSEs vary in frequency and intensity, but the strength of the PSE does not often track with number of reported minutes, dates, or number of visits. Other factors such as intervention type (e.g. SNAP-Ed meeting participation vs. leading training), focus (e.g., gardens vs. written policy), target audience (e.g., all teachers vs. one teacher), and intended reach (e.g., all students at a school vs. one classroom) are difficult to capture, and duration is difficult to define.10 To address this issue, we developed a PSE scoring system that weighted PSEs by perceived strength of the intervention, with 1 being the weakest and 4 being the strongest score (Table YDE-9). To assign scores, we referred to the PSE dose definition
NEW IDEA
☼
FFY2017 SNAP-Ed Annual Report 178 January 2018
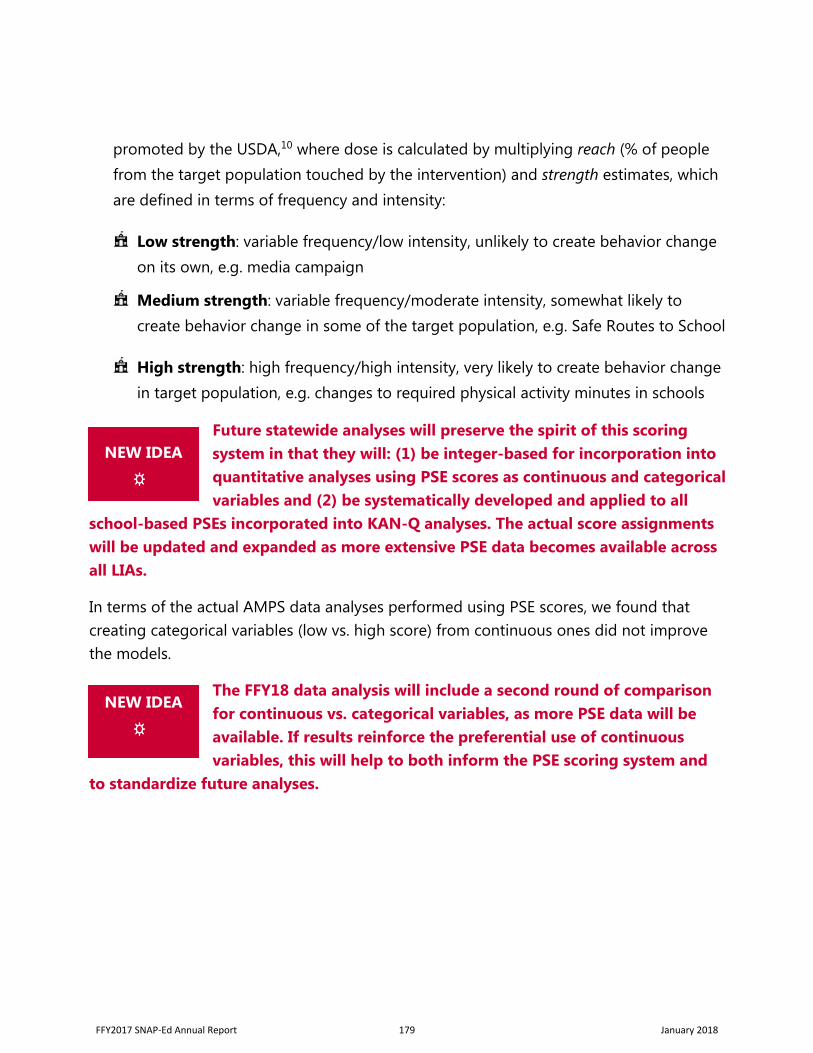
promoted by the USDA,10 where dose is calculated by multiplying reach (% of people from the target population touched by the intervention) and strength estimates, which are defined in terms of frequency and intensity:
Low strength: variable frequency/low intensity, unlikely to create behavior change on its own, e.g. media campaign
Medium strength: variable frequency/moderate intensity, somewhat likely to create behavior change in some of the target population, e.g. Safe Routes to School
High strength: high frequency/high intensity, very likely to create behavior change in target population, e.g. changes to required physical activity minutes in schools
Future statewide analyses will preserve the spirit of this scoring system in that they will: (1) be integer-based for incorporation into quantitative analyses using PSE scores as continuous and categorical variables and (2) be systematically developed and applied to all
school-based PSEs incorporated into KAN-Q analyses. The actual score assignments will be updated and expanded as more extensive PSE data becomes available across all LIAs.
In terms of the actual AMPS data analyses performed using PSE scores, we found that creating categorical variables (low vs. high score) from continuous ones did not improve the models.
The FFY18 data analysis will include a second round of comparison for continuous vs. categorical variables, as more PSE data will be available. If results reinforce the preferential use of continuousvariables, this will help to both inform the PSE scoring system and
to standardize future analyses.
NEW IDEA
☼
NEW IDEA
☼
FFY2017 SNAP-Ed Annual Report 179 January 2018
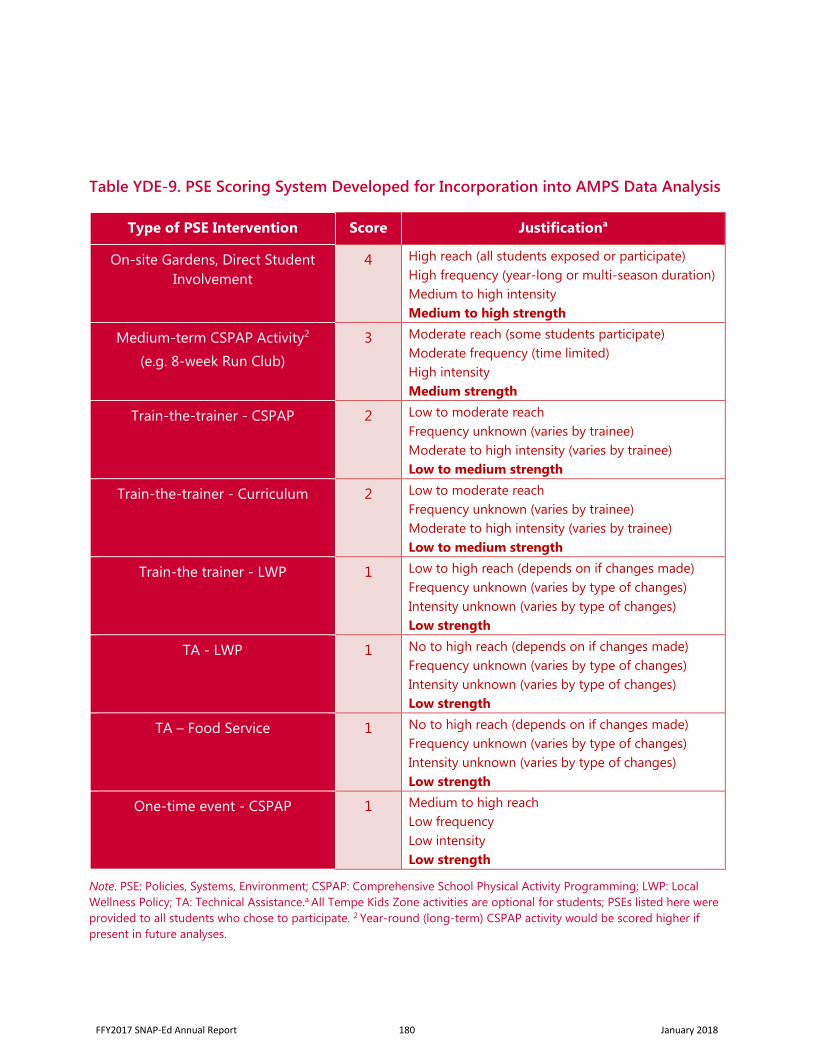
Table YDE-9. PSE Scoring System Developed for Incorporation into AMPS Data Analysis
Type of PSE Intervention Score Justificationa
On-site Gardens, Direct Student Involvement
4 High reach (all students exposed or participate) High frequency (year-long or multi-season duration) Medium to high intensity Medium to high strength
Medium-term CSPAP Activity2 (e.g. 8-week Run Club)
3 Moderate reach (some students participate) Moderate frequency (time limited) High intensity Medium strength
Train-the-trainer - CSPAP 2 Low to moderate reach Frequency unknown (varies by trainee) Moderate to high intensity (varies by trainee) Low to medium strength
Train-the-trainer - Curriculum 2 Low to moderate reach Frequency unknown (varies by trainee) Moderate to high intensity (varies by trainee) Low to medium strength
Train-the trainer - LWP 1 Low to high reach (depends on if changes made) Frequency unknown (varies by type of changes) Intensity unknown (varies by type of changes) Low strength
TA - LWP 1 No to high reach (depends on if changes made) Frequency unknown (varies by type of changes) Intensity unknown (varies by type of changes) Low strength
TA – Food Service 1 No to high reach (depends on if changes made) Frequency unknown (varies by type of changes) Intensity unknown (varies by type of changes) Low strength
One-time event - CSPAP 1 Medium to high reach Low frequency Low intensity Low strength
Note. PSE: Policies, Systems, Environment; CSPAP: Comprehensive School Physical Activity Programming; LWP: Local Wellness Policy; TA: Technical Assistance.a All Tempe Kids Zone activities are optional for students; PSEs listed here were provided to all students who chose to participate. 2 Year-round (long-term) CSPAP activity would be scored higher if present in future analyses.
FFY2017 SNAP-Ed Annual Report 180 January 2018
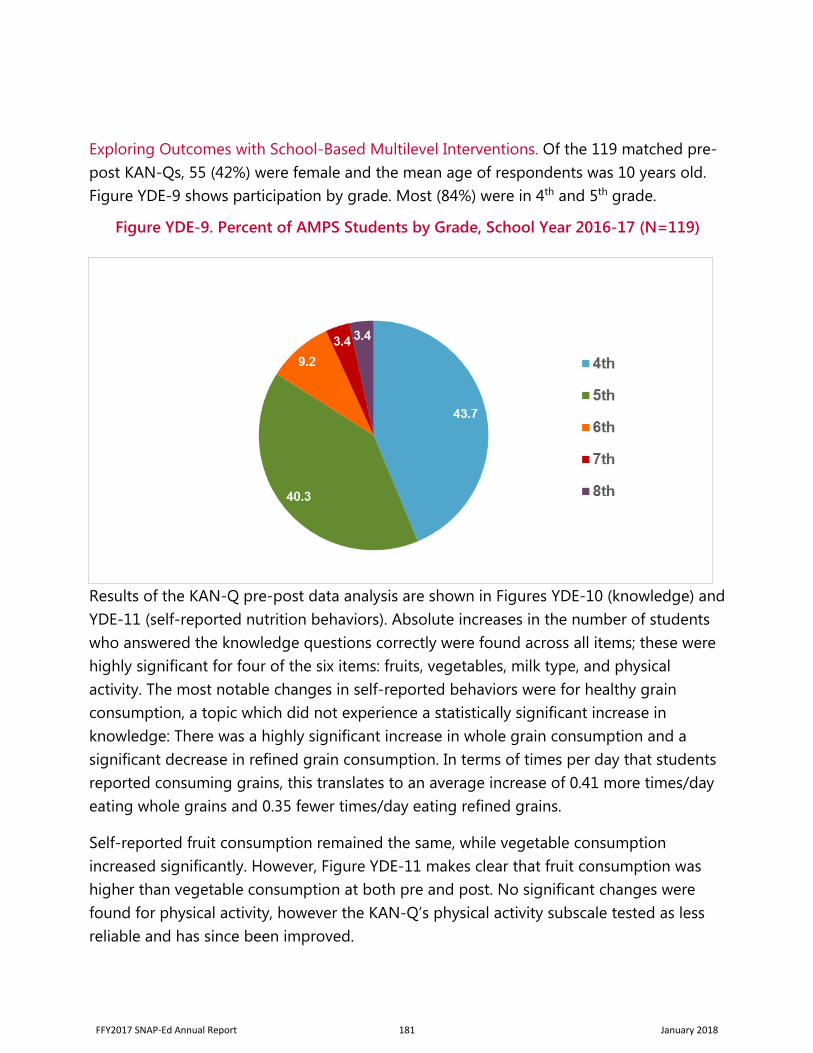
Exploring Outcomes with School-Based Multilevel Interventions. Of the 119 matched pre-post KAN-Qs, 55 (42%) were female and the mean age of respondents was 10 years old. Figure YDE-9 shows participation by grade. Most (84%) were in 4th and 5th grade.
Figure YDE-9. Percent of AMPS Students by Grade, School Year 2016-17 (N=119)
Results of the KAN-Q pre-post data analysis are shown in Figures YDE-10 (knowledge) and YDE-11 (self-reported nutrition behaviors). Absolute increases in the number of students who answered the knowledge questions correctly were found across all items; these were highly significant for four of the six items: fruits, vegetables, milk type, and physical activity. The most notable changes in self-reported behaviors were for healthy grain consumption, a topic which did not experience a statistically significant increase in knowledge: There was a highly significant increase in whole grain consumption and a significant decrease in refined grain consumption. In terms of times per day that students reported consuming grains, this translates to an average increase of 0.41 more times/day eating whole grains and 0.35 fewer times/day eating refined grains.
Self-reported fruit consumption remained the same, while vegetable consumption increased significantly. However, Figure YDE-11 makes clear that fruit consumption was higher than vegetable consumption at both pre and post. No significant changes were found for physical activity, however the KAN-Q’s physical activity subscale tested as less reliable and has since been improved.
FFY2017 SNAP-Ed Annual Report 181 January 2018
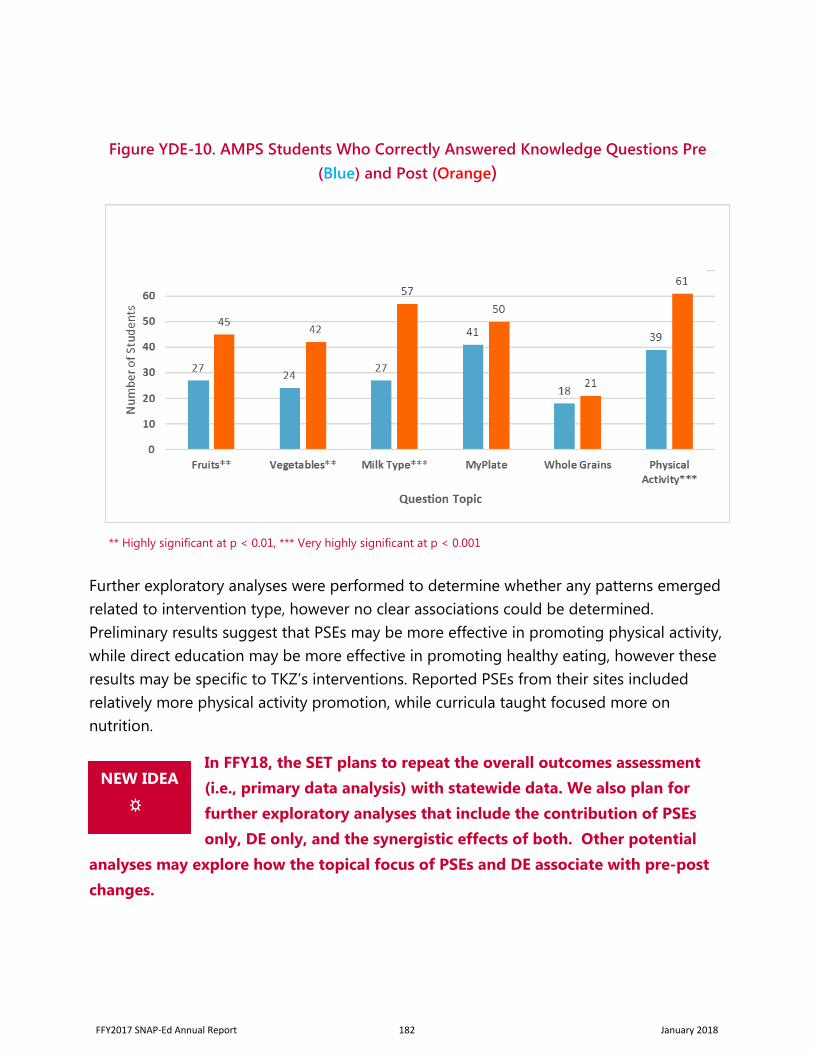
Figure YDE-10. AMPS Students Who Correctly Answered Knowledge Questions Pre (Blue) and Post (Orange)
** Highly significant at p < 0.01, *** Very highly significant at p < 0.001
Further exploratory analyses were performed to determine whether any patterns emerged related to intervention type, however no clear associations could be determined. Preliminary results suggest that PSEs may be more effective in promoting physical activity, while direct education may be more effective in promoting healthy eating, however these results may be specific to TKZ’s interventions. Reported PSEs from their sites included relatively more physical activity promotion, while curricula taught focused more on nutrition.
In FFY18, the SET plans to repeat the overall outcomes assessment (i.e., primary data analysis) with statewide data. We also plan forfurther exploratory analyses that include the contribution of PSEsonly, DE only, and the synergistic effects of both. Other potential
analyses may explore how the topical focus of PSEs and DE associate with pre-post changes.
NEW IDEA
☼
FFY2017 SNAP-Ed Annual Report 182 January 2018
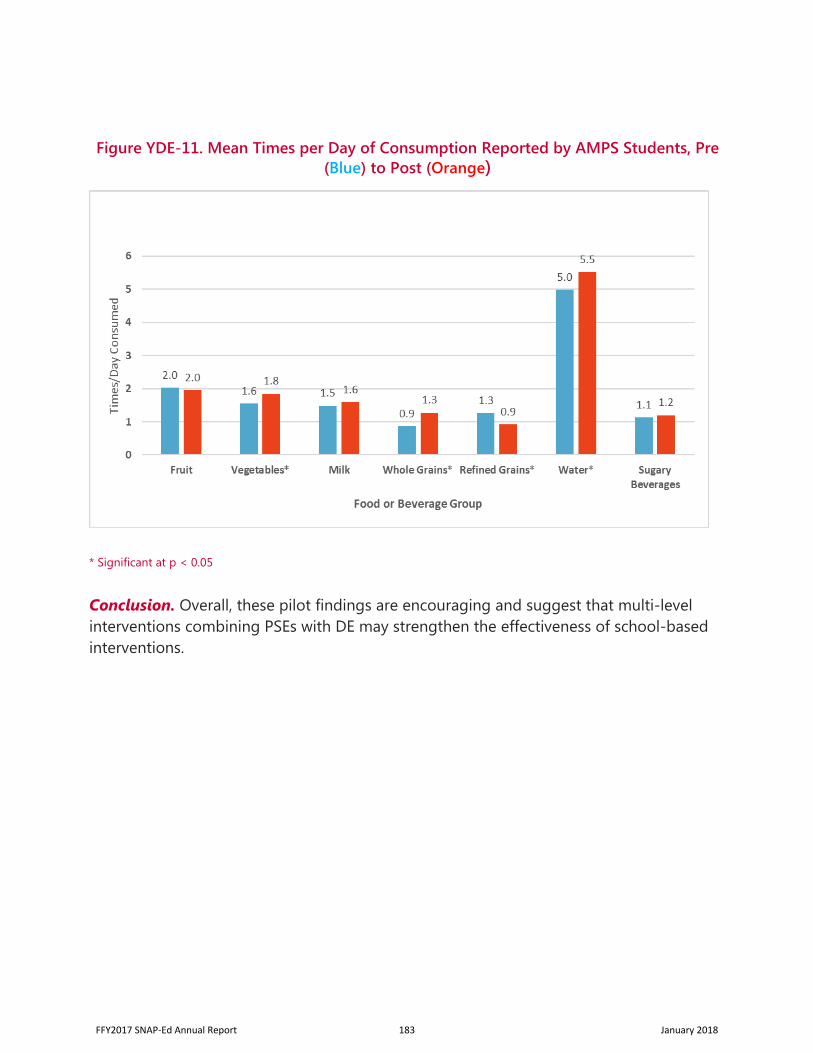
Figure YDE-11. Mean Times per Day of Consumption Reported by AMPS Students, Pre (Blue) to Post (Orange)
* Significant at p < 0.05
Conclusion. Overall, these pilot findings are encouraging and suggest that multi-level interventions combining PSEs with DE may strengthen the effectiveness of school-based interventions.
FFY2017 SNAP-Ed Annual Report 183 January 2018
KEY FINDINGS AND RECOMMENDATIONS
In FFY17, LIAs successfully delivered a wider variety of behaviorally-focused DE curricula with PSE programming compared to the previous year.
As in FFY16, the FFY17 outcomes evaluation of the CATCH Basic Concepts series, Serving Up MyPlate, and Nutrition Voyage revealed some knowledge gains but little behavior change beyond healthier milk intake. The recent revisions made to the KAN-Q for FFY18 should improve the AZ Health Zone’s understanding of attitudes and physical activity behaviors.
The categories in which change was measured varied somewhat from FFY16. This was likely due to the widespread use of CATCH with the KAN-Q in FFY17, which appears to have influenced milk knowledge and healthier milk consumption and may have promoted physical activity knowledge.
There is widespread support from LIAs for the new KAN-Q administration model successfully piloted in FFY17, which enables more time for change to occur and captures the influence of multi-level interventions. Given that LIAs are planning more robust multi-level interventions in schools, the new model is timely.
As LIAs expand DE into higher grades, the AZ Health Zone should consider adding new curricula for middle and high-school-aged students.
FFY2017 SNAP-Ed Annual Report 184 January 2018
References 1. Segal, LM, Rayburn, J, and A Martin. The state of obesity: Better policies for a healthier
America, 2017. Trust for America's Health and Robert Wood Johnson Foundation; 2017.Available at: https://stateofobesity.org/files/stateofobesity2017.pdf.
2. Centers for Disease Control and Prevention. The association between school basedphysical activity, including physical education, and academic performance. Atlanta, GA:U.S. Department of Health and Human Services; 2010.
3. Halfon N, Larson K, Slusser W: Associations between obesity and comorbid mentalhealth, developmental, and physical health conditions in a nationally representativesample of US children aged 10 to 17. Acad Pediatr. 2013, 13 (1): 6-13.doi:10.1016/j.acap.2012.10.007.
4. Ramaswamy R, Mirochna M, Perlmuter LC. The negative association of BMI with class-roomeffort in elementary school children. J Child Health Care. 2010, 14 (2): 161-169. doi:10.1177/13674935093592223.
5. Shore SM, Sachs ML, Lidicker JR, Brett SN, Wright AR, Libonati JR. Decreased scholasticachievement in overweight middle school students. Obesity. 2008;16(7): 1535=1538. doi:10.1038/oby.2008.254.
6. Jacobs L, LeGros T, Orzech K. Arizona Nutrition Network FFY16 Annual Evaluation Report,January 2017. The University of Arizona SNAP-Ed Evaluation Team; 2017.
7. LeGros, T, Hartz, VL, Jacobs, LE. Reliability of a Kid's Activity and Nutrition Questionnaire forSchool-Based SNAP-Ed Interventions as Part of a Tiered Development Process. J of Nutr Edand Behav. (2016) Available at: http://dx.doi.org/10.1016/j.jneb.2016.10.003.
8. U.S. Department of Health and Human Services and USDA. 2015 – 2020 Dietary Guidelines forAmericans. 8th Edition. December 2015. Available athttp://health.gov/dietaryguidelines/2015/guidelines/.
9. USDA, Food and Nutrition Service. Supplemental Nutrition Assistance Program Educationguidance: Nutrition education and obesity prevention grant program. 2017. Available at:https://snaped.fns.usda.gov/snap/Guidance/FY_2017_SNAP-Ed_Guidance_%20508-Compliant.pdf.
10. Center of Community Health and Evaluation, Kaiser Permanente. Measuring and Increasingthe “Dose” of Community Health Interventions. June 2012. Available at:
http://www.nwcphp.org/documents/training/hot-topics-1/CHIdoseguide.pdf.
FFY2017 SNAP-Ed Annual Report 185 January 2018
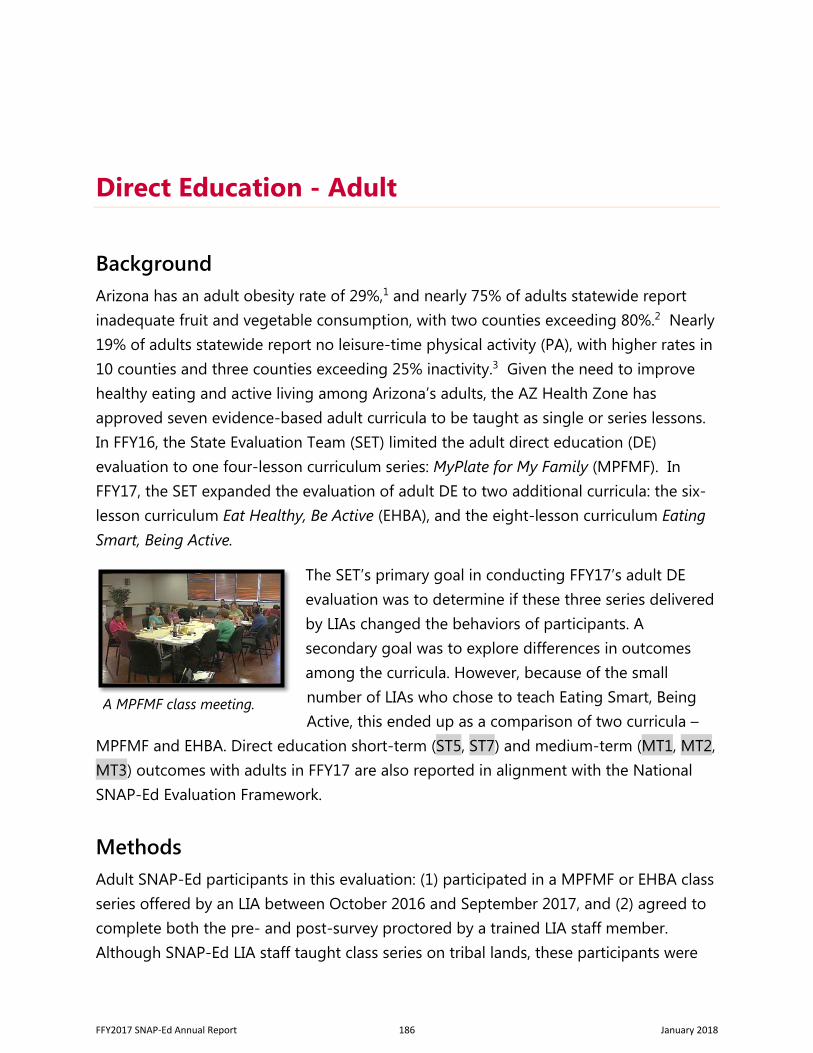
Direct Education - Adult
Background Arizona has an adult obesity rate of 29%,1 and nearly 75% of adults statewide report inadequate fruit and vegetable consumption, with two counties exceeding 80%.2 Nearly 19% of adults statewide report no leisure-time physical activity (PA), with higher rates in 10 counties and three counties exceeding 25% inactivity.3 Given the need to improve healthy eating and active living among Arizona’s adults, the AZ Health Zone has approved seven evidence-based adult curricula to be taught as single or series lessons. In FFY16, the State Evaluation Team (SET) limited the adult direct education (DE) evaluation to one four-lesson curriculum series: MyPlate for My Family (MPFMF). In FFY17, the SET expanded the evaluation of adult DE to two additional curricula: the six-lesson curriculum Eat Healthy, Be Active (EHBA), and the eight-lesson curriculum Eating Smart, Being Active.
The SET’s primary goal in conducting FFY17’s adult DE evaluation was to determine if these three series delivered by LIAs changed the behaviors of participants. A secondary goal was to explore differences in outcomes among the curricula. However, because of the small number of LIAs who chose to teach Eating Smart, BeingActive, this ended up as a comparison of two curricula –
MPFMF and EHBA. Direct education short-term (ST5, ST7) and medium-term (MT1, MT2, MT3) outcomes with adults in FFY17 are also reported in alignment with the National SNAP-Ed Evaluation Framework.
Methods Adult SNAP-Ed participants in this evaluation: (1) participated in a MPFMF or EHBA class series offered by an LIA between October 2016 and September 2017, and (2) agreed to complete both the pre- and post-survey proctored by a trained LIA staff member. Although SNAP-Ed LIA staff taught class series on tribal lands, these participants were
A MPFMF class meeting.
FFY2017 SNAP-Ed Annual Report 186 January 2018
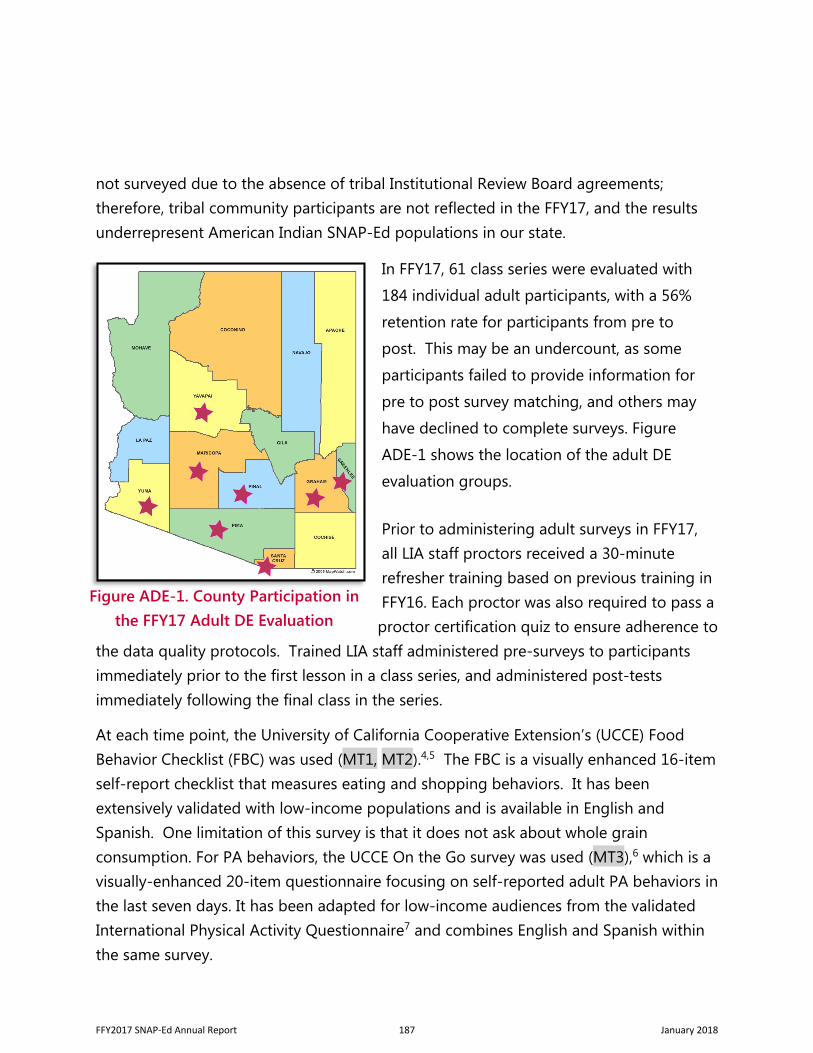
not surveyed due to the absence of tribal Institutional Review Board agreements; therefore, tribal community participants are not reflected in the FFY17, and the results underrepresent American Indian SNAP-Ed populations in our state.
In FFY17, 61 class series were evaluated with
184 individual adult participants, with a 56%
retention rate for participants from pre to
post. This may be an undercount, as some
participants failed to provide information for
pre to post survey matching, and others may
have declined to complete surveys. Figure
ADE-1 shows the location of the adult DE
evaluation groups.
Prior to administering adult surveys in FFY17, all LIA staff proctors received a 30-minute refresher training based on previous training in FFY16. Each proctor was also required to pass a proctor certification quiz to ensure adherence to
the data quality protocols. Trained LIA staff administered pre-surveys to participants immediately prior to the first lesson in a class series, and administered post-tests immediately following the final class in the series.
At each time point, the University of California Cooperative Extension’s (UCCE) Food Behavior Checklist (FBC) was used (MT1, MT2).4,5 The FBC is a visually enhanced 16-item self-report checklist that measures eating and shopping behaviors. It has been extensively validated with low-income populations and is available in English and Spanish. One limitation of this survey is that it does not ask about whole grain consumption. For PA behaviors, the UCCE On the Go survey was used (MT3),6 which is a visually-enhanced 20-item questionnaire focusing on self-reported adult PA behaviors in the last seven days. It has been adapted for low-income audiences from the validated International Physical Activity Questionnaire7 and combines English and Spanish within the same survey.
Figure ADE-1. County Participation in the FFY17 Adult DE Evaluation
FFY2017 SNAP-Ed Annual Report 187 January 2018
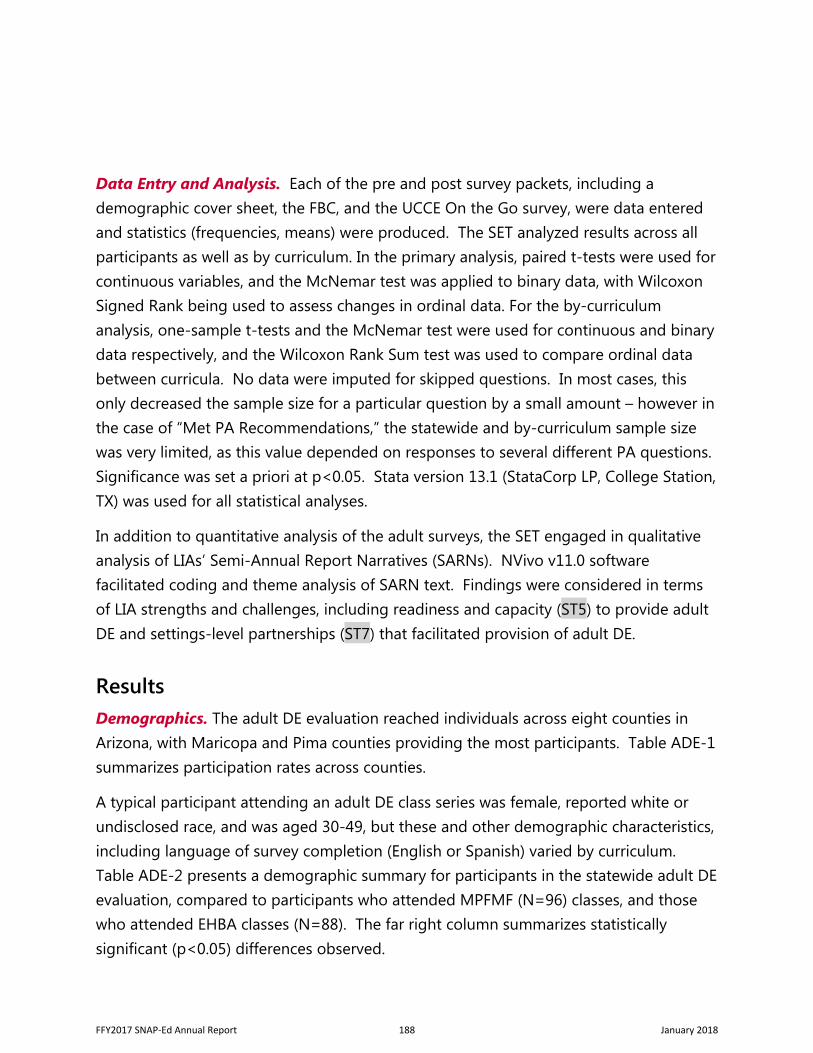
Data Entry and Analysis. Each of the pre and post survey packets, including a demographic cover sheet, the FBC, and the UCCE On the Go survey, were data entered and statistics (frequencies, means) were produced. The SET analyzed results across all participants as well as by curriculum. In the primary analysis, paired t-tests were used for continuous variables, and the McNemar test was applied to binary data, with Wilcoxon Signed Rank being used to assess changes in ordinal data. For the by-curriculum analysis, one-sample t-tests and the McNemar test were used for continuous and binary data respectively, and the Wilcoxon Rank Sum test was used to compare ordinal data between curricula. No data were imputed for skipped questions. In most cases, this only decreased the sample size for a particular question by a small amount – however in the case of “Met PA Recommendations,” the statewide and by-curriculum sample size was very limited, as this value depended on responses to several different PA questions. Significance was set a priori at p<0.05. Stata version 13.1 (StataCorp LP, College Station, TX) was used for all statistical analyses.
In addition to quantitative analysis of the adult surveys, the SET engaged in qualitative analysis of LIAs’ Semi-Annual Report Narratives (SARNs). NVivo v11.0 software facilitated coding and theme analysis of SARN text. Findings were considered in terms of LIA strengths and challenges, including readiness and capacity (ST5) to provide adult DE and settings-level partnerships (ST7) that facilitated provision of adult DE.
Results Demographics. The adult DE evaluation reached individuals across eight counties in Arizona, with Maricopa and Pima counties providing the most participants. Table ADE-1 summarizes participation rates across counties.
A typical participant attending an adult DE class series was female, reported white or undisclosed race, and was aged 30-49, but these and other demographic characteristics, including language of survey completion (English or Spanish) varied by curriculum. Table ADE-2 presents a demographic summary for participants in the statewide adult DE evaluation, compared to participants who attended MPFMF (N=96) classes, and those who attended EHBA classes (N=88). The far right column summarizes statistically significant (p<0.05) differences observed.
FFY2017 SNAP-Ed Annual Report 188 January 2018
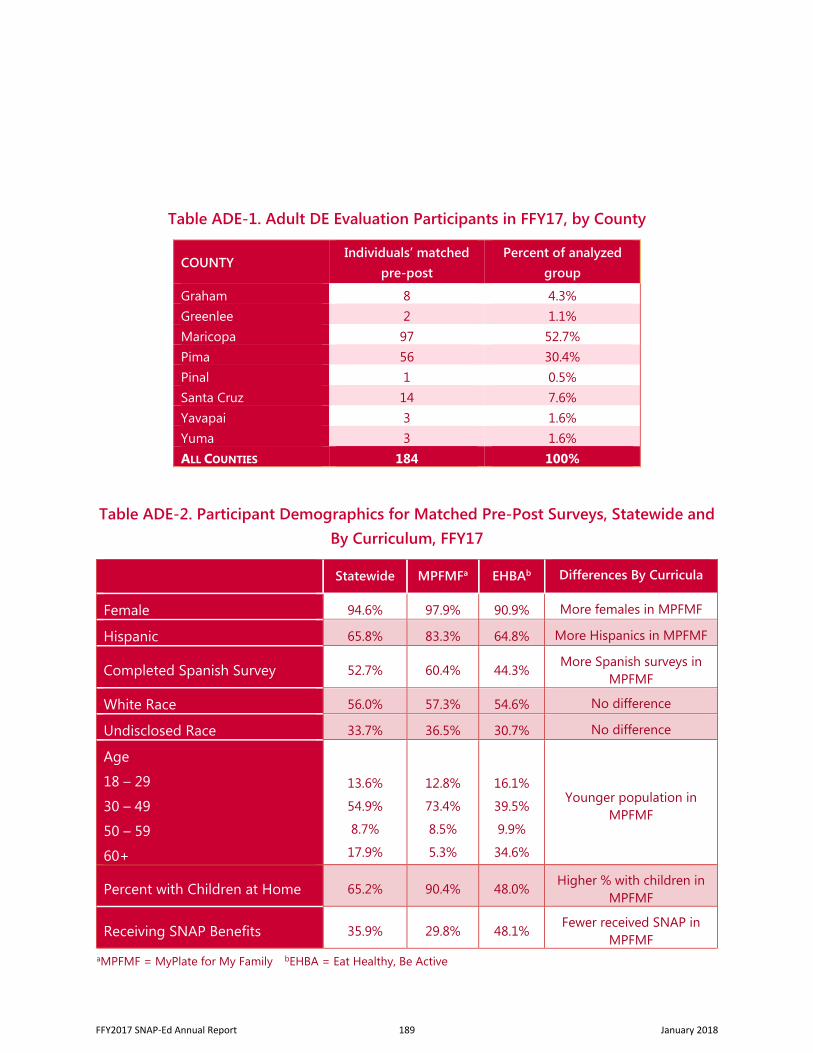
Table ADE-1. Adult DE Evaluation Participants in FFY17, by County
COUNTY Individuals’ matched
pre-post Percent of analyzed
group
Graham 8 4.3% Greenlee 2 1.1% Maricopa 97 52.7% Pima 56 30.4% Pinal 1 0.5% Santa Cruz 14 7.6% Yavapai 3 1.6% Yuma 3 1.6% ALL COUNTIES 184 100%
Table ADE-2. Participant Demographics for Matched Pre-Post Surveys, Statewide and By Curriculum, FFY17
Statewide MPFMFa EHBAb Differences By Curricula
Female 94.6% 97.9% 90.9% More females in MPFMF
Hispanic 65.8% 83.3% 64.8% More Hispanics in MPFMF
Completed Spanish Survey 52.7% 60.4% 44.3% More Spanish surveys in
MPFMF
White Race 56.0% 57.3% 54.6% No difference
Undisclosed Race 33.7% 36.5% 30.7% No difference
Age
18 – 29
30 – 49
50 – 59
60+
13.6%
54.9%
8.7%
17.9%
12.8%
73.4%
8.5%
5.3%
16.1%
39.5%
9.9%
34.6%
Younger population in MPFMF
Percent with Children at Home 65.2% 90.4% 48.0% Higher % with children in
MPFMF
Receiving SNAP Benefits 35.9% 29.8% 48.1% Fewer received SNAP in
MPFMF aMPFMF = MyPlate for My Family bEHBA = Eat Healthy, Be Active
FFY2017 SNAP-Ed Annual Report 189 January 2018
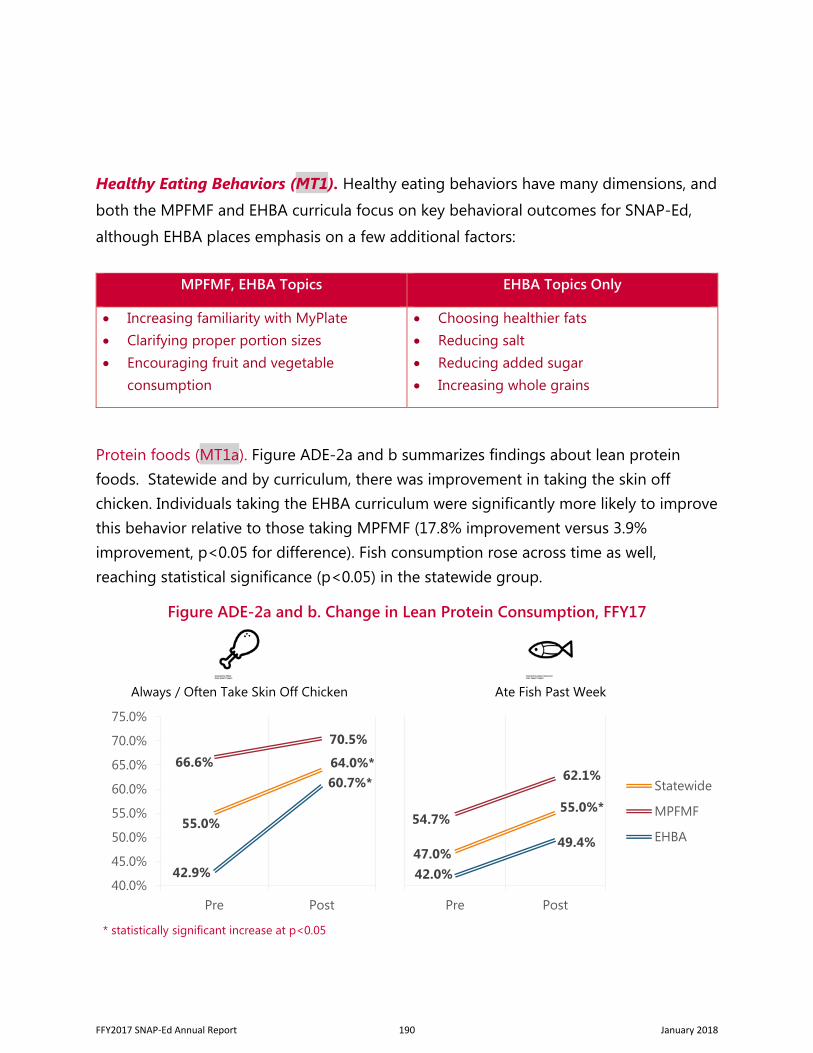
Healthy Eating Behaviors (MT1). Healthy eating behaviors have many dimensions, and
both the MPFMF and EHBA curricula focus on key behavioral outcomes for SNAP-Ed,
although EHBA places emphasis on a few additional factors:
MPFMF, EHBA Topics EHBA Topics Only
• Increasing familiarity with MyPlate • Clarifying proper portion sizes • Encouraging fruit and vegetable
consumption
• Choosing healthier fats • Reducing salt • Reducing added sugar • Increasing whole grains
Protein foods (MT1a). Figure ADE-2a and b summarizes findings about lean protein foods. Statewide and by curriculum, there was improvement in taking the skin off chicken. Individuals taking the EHBA curriculum were significantly more likely to improve this behavior relative to those taking MPFMF (17.8% improvement versus 3.9% improvement, p<0.05 for difference). Fish consumption rose across time as well, reaching statistical significance (p<0.05) in the statewide group.
Figure ADE-2a and b. Change in Lean Protein Consumption, FFY17
Always / Often Take Skin Off Chicken Ate Fish Past Week
* statistically significant increase at p<0.05
55.0%
64.0%*66.6%
70.5%
42.9%
60.7%*
40.0%
45.0%
50.0%
55.0%
60.0%
65.0%
70.0%
75.0%
Pre Post
47.0%
55.0%*54.7%
62.1%
42.0%
49.4%
Pre Post
Statewide
MPFMF
EHBA
FFY2017 SNAP-Ed Annual Report 190 January 2018
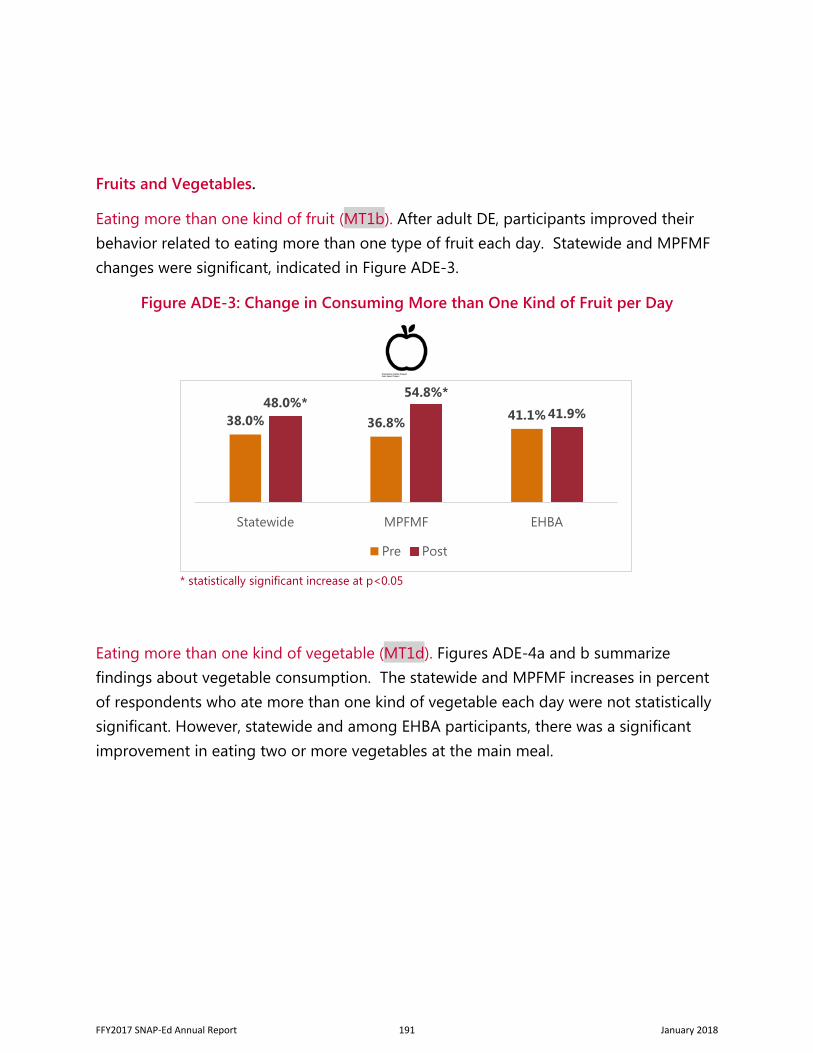
Fruits and Vegetables.
Eating more than one kind of fruit (MT1b). After adult DE, participants improved their behavior related to eating more than one type of fruit each day. Statewide and MPFMF changes were significant, indicated in Figure ADE-3.
Figure ADE-3: Change in Consuming More than One Kind of Fruit per Day
Eating more than one kind of vegetable (MT1d). Figures ADE-4a and b summarize findings about vegetable consumption. The statewide and MPFMF increases in percent of respondents who ate more than one kind of vegetable each day were not statistically significant. However, statewide and among EHBA participants, there was a significant improvement in eating two or more vegetables at the main meal.
* statistically significant increase at p<0.05
38.0% 36.8% 41.1%48.0%*
54.8%*41.9%
Statewide MPFMF EHBA
Pre Post
FFY2017 SNAP-Ed Annual Report 191 January 2018
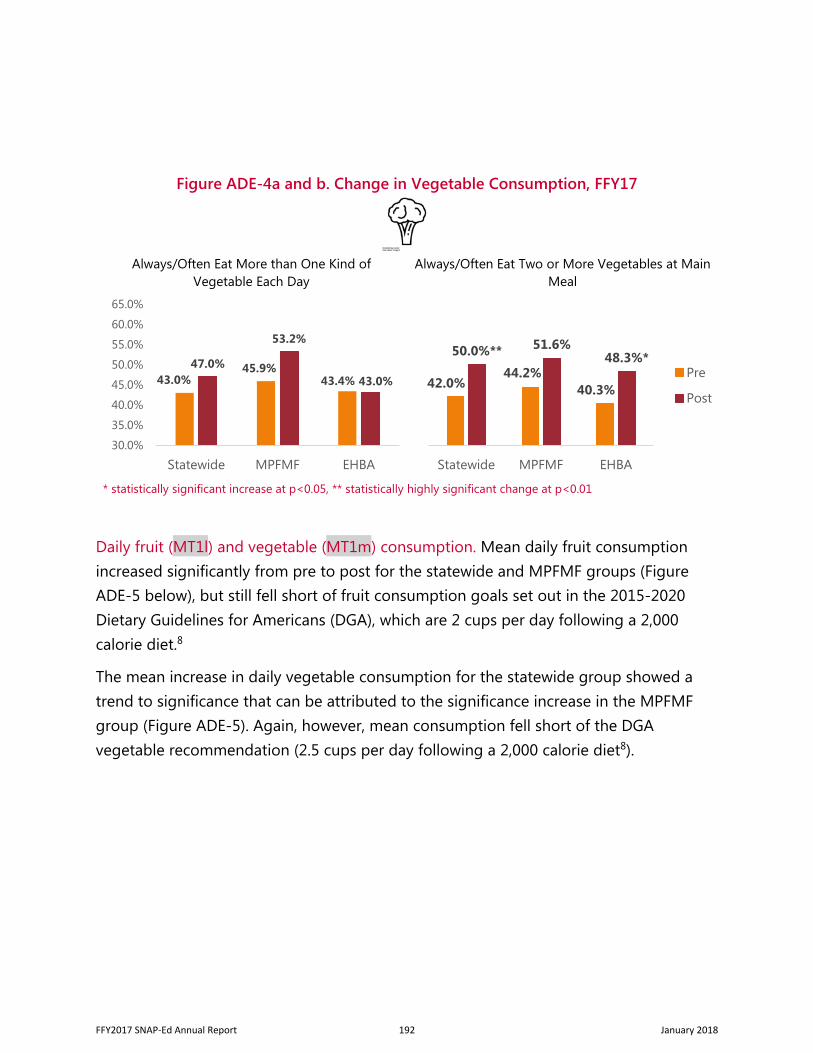
Figure ADE-4a and b. Change in Vegetable Consumption, FFY17
Always/Often Eat More than One Kind of Vegetable Each Day
Always/Often Eat Two or More Vegetables at Main Meal
* statistically significant increase at p<0.05, ** statistically highly significant change at p<0.01
Daily fruit (MT1l) and vegetable (MT1m) consumption. Mean daily fruit consumption increased significantly from pre to post for the statewide and MPFMF groups (Figure ADE-5 below), but still fell short of fruit consumption goals set out in the 2015-2020 Dietary Guidelines for Americans (DGA), which are 2 cups per day following a 2,000 calorie diet.8
The mean increase in daily vegetable consumption for the statewide group showed a trend to significance that can be attributed to the significance increase in the MPFMF group (Figure ADE-5). Again, however, mean consumption fell short of the DGA vegetable recommendation (2.5 cups per day following a 2,000 calorie diet8).
43.0%45.9%
43.4%47.0%
53.2%
43.0%
30.0%
35.0%
40.0%
45.0%
50.0%
55.0%
60.0%
65.0%
Statewide MPFMF EHBA
42.0%44.2%
40.3%
50.0%** 51.6%48.3%*
Statewide MPFMF EHBA
Pre
Post
FFY2017 SNAP-Ed Annual Report 192 January 2018
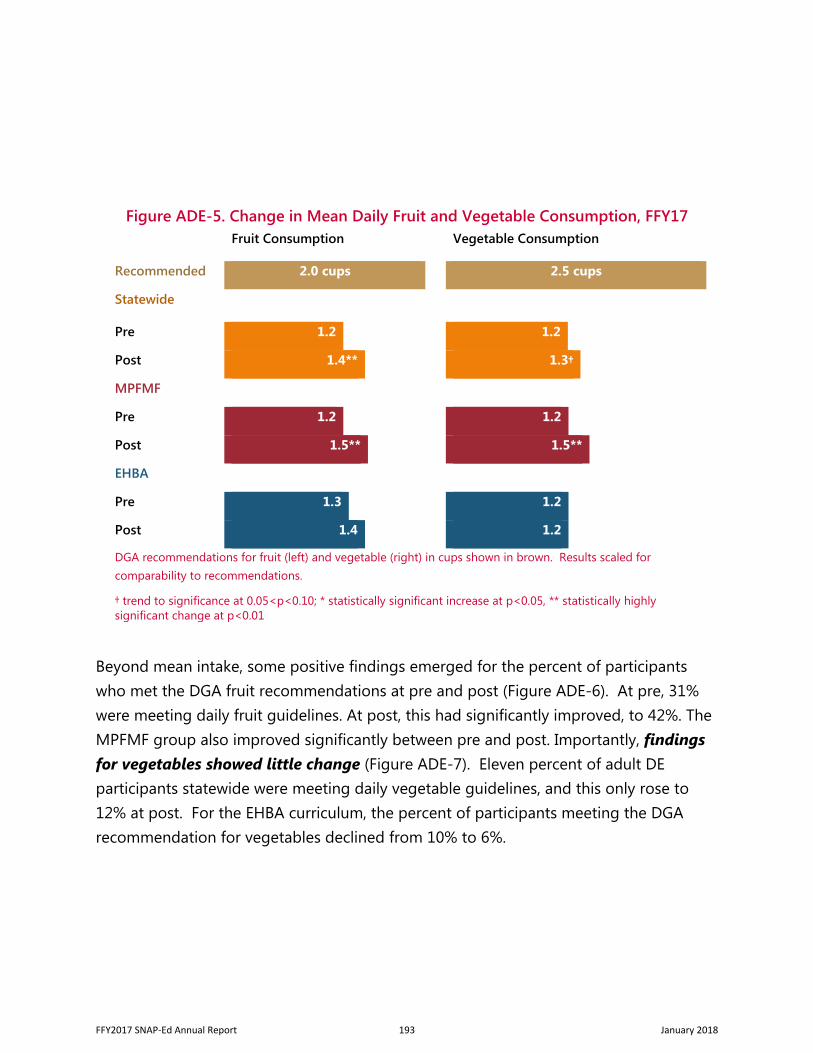
Figure ADE-5. Change in Mean Daily Fruit and Vegetable Consumption, FFY17 Fruit Consumption Vegetable Consumption
Recommended 2.0 cups 2.5 cups
Statewide
Pre 1.2 1.2
Post 1.4** 1.3†
MPFMF
Pre 1.2 1.2
Post 1.5** 1.5**
EHBA
Pre 1.3 1.2
Post 1.4 1.2
DGA recommendations for fruit (left) and vegetable (right) in cups shown in brown. Results scaled for comparability to recommendations.
† trend to significance at 0.05<p<0.10; * statistically significant increase at p<0.05, ** statistically highly significant change at p<0.01
Beyond mean intake, some positive findings emerged for the percent of participants who met the DGA fruit recommendations at pre and post (Figure ADE-6). At pre, 31% were meeting daily fruit guidelines. At post, this had significantly improved, to 42%. The MPFMF group also improved significantly between pre and post. Importantly, findings for vegetables showed little change (Figure ADE-7). Eleven percent of adult DE participants statewide were meeting daily vegetable guidelines, and this only rose to 12% at post. For the EHBA curriculum, the percent of participants meeting the DGA recommendation for vegetables declined from 10% to 6%.
FFY2017 SNAP-Ed Annual Report 193 January 2018
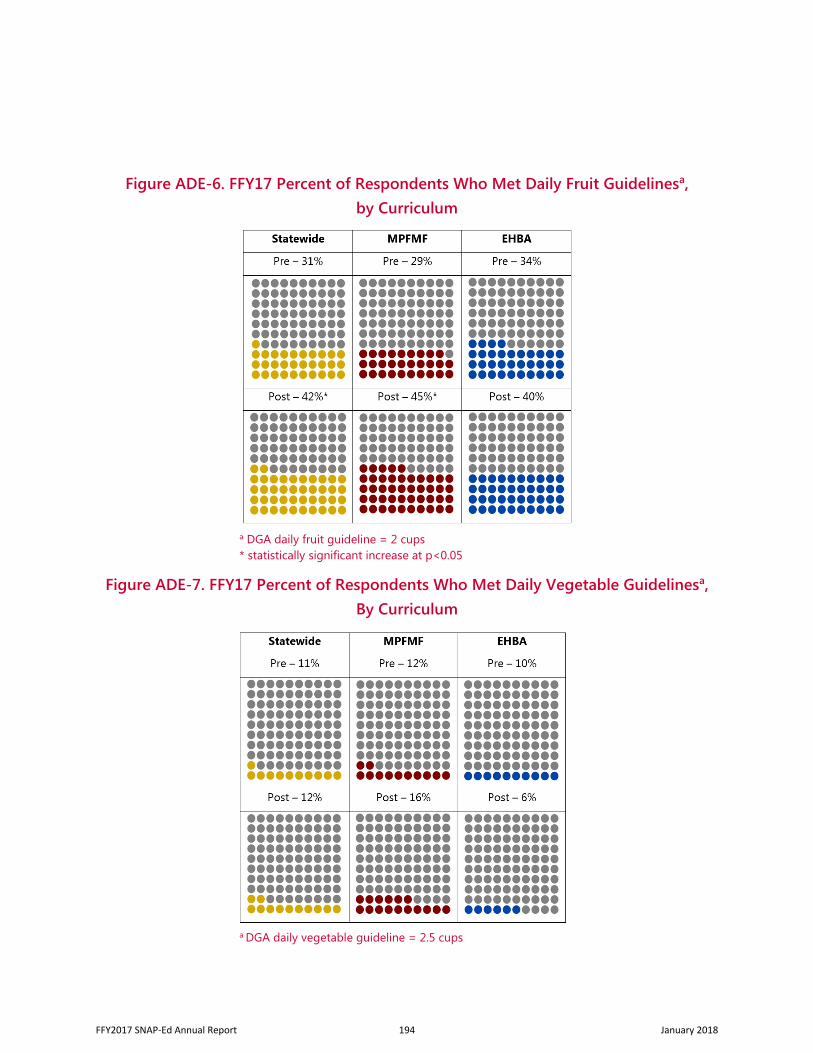
Figure ADE-6. FFY17 Percent of Respondents Who Met Daily Fruit Guidelinesa, by Curriculum
a DGA daily fruit guideline = 2 cups * statistically significant increase at p<0.05
Figure ADE-7. FFY17 Percent of Respondents Who Met Daily Vegetable Guidelinesa, By Curriculum
a DGA daily vegetable guideline = 2.5 cups
FFY2017 SNAP-Ed Annual Report 194 January 2018
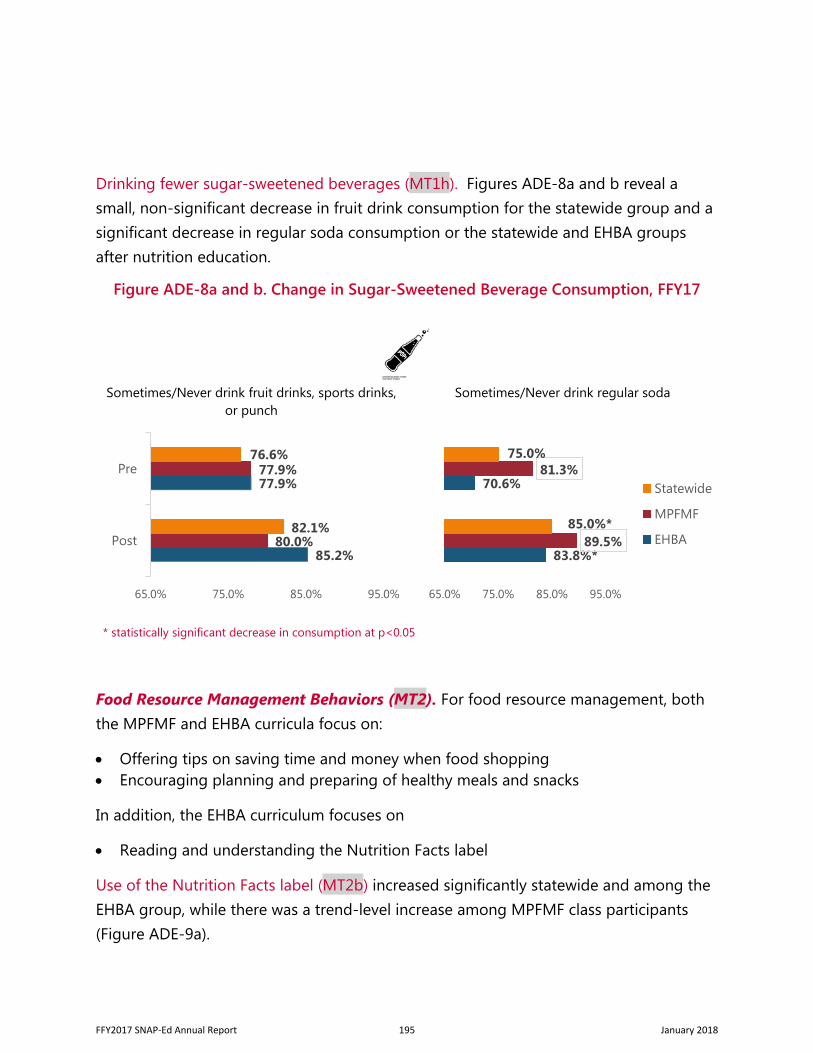
Drinking fewer sugar-sweetened beverages (MT1h). Figures ADE-8a and b reveal a small, non-significant decrease in fruit drink consumption for the statewide group and a significant decrease in regular soda consumption or the statewide and EHBA groups after nutrition education.
Figure ADE-8a and b. Change in Sugar-Sweetened Beverage Consumption, FFY17
Sometimes/Never drink fruit drinks, sports drinks, or punch
Sometimes/Never drink regular soda
* statistically significant decrease in consumption at p<0.05
Food Resource Management Behaviors (MT2). For food resource management, both the MPFMF and EHBA curricula focus on:
• Offering tips on saving time and money when food shopping• Encouraging planning and preparing of healthy meals and snacks
In addition, the EHBA curriculum focuses on
• Reading and understanding the Nutrition Facts label
Use of the Nutrition Facts label (MT2b) increased significantly statewide and among the EHBA group, while there was a trend-level increase among MPFMF class participants (Figure ADE-9a).
85.2%
77.9%
80.0%
77.9%
82.1%
76.6%
65.0% 75.0% 85.0% 95.0%
Post
Pre
83.8%*
70.6%
89.5%
81.3%
85.0%*
75.0%
65.0% 75.0% 85.0% 95.0%
Statewide
MPFMF
EHBA
FFY2017 SNAP-Ed Annual Report 195 January 2018
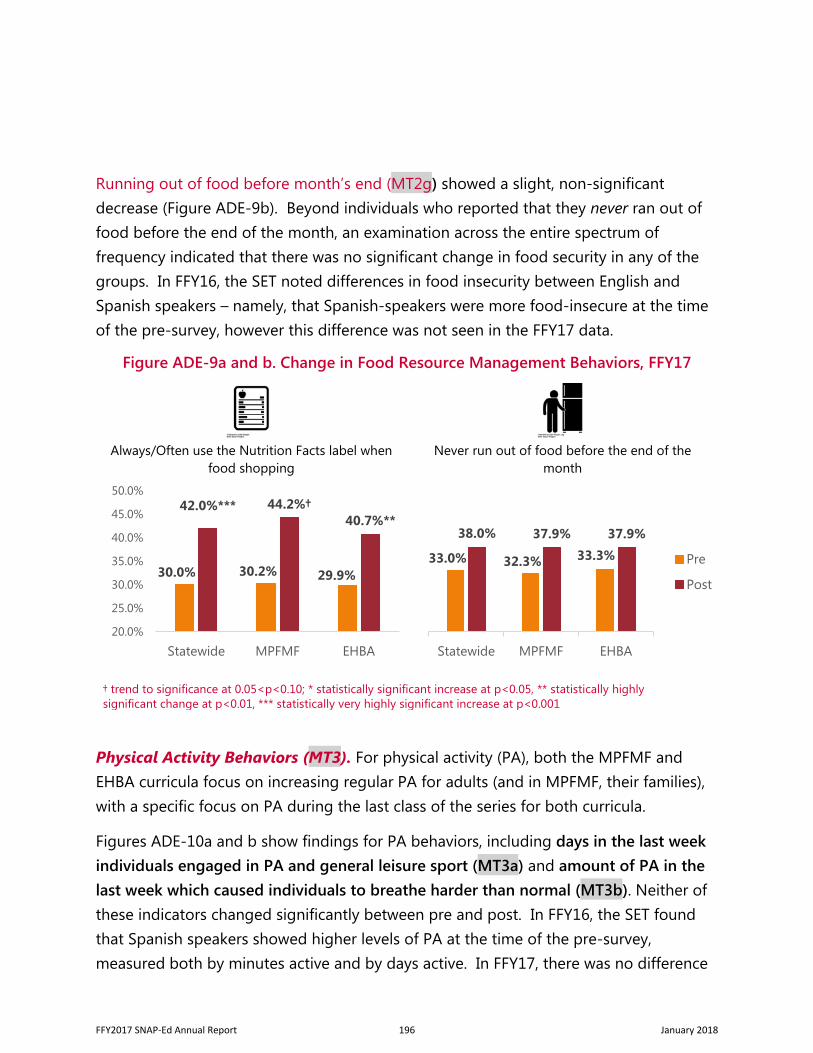
Running out of food before month’s end (MT2g) showed a slight, non-significant decrease (Figure ADE-9b). Beyond individuals who reported that they never ran out of food before the end of the month, an examination across the entire spectrum of frequency indicated that there was no significant change in food security in any of the groups. In FFY16, the SET noted differences in food insecurity between English and Spanish speakers – namely, that Spanish-speakers were more food-insecure at the time of the pre-survey, however this difference was not seen in the FFY17 data.
Figure ADE-9a and b. Change in Food Resource Management Behaviors, FFY17
Always/Often use the Nutrition Facts label when food shopping
Never run out of food before the end of the month
† trend to significance at 0.05<p<0.10; * statistically significant increase at p<0.05, ** statistically highly significant change at p<0.01, *** statistically very highly significant increase at p<0.001
Physical Activity Behaviors (MT3). For physical activity (PA), both the MPFMF and EHBA curricula focus on increasing regular PA for adults (and in MPFMF, their families), with a specific focus on PA during the last class of the series for both curricula.
Figures ADE-10a and b show findings for PA behaviors, including days in the last week individuals engaged in PA and general leisure sport (MT3a) and amount of PA in the last week which caused individuals to breathe harder than normal (MT3b). Neither of these indicators changed significantly between pre and post. In FFY16, the SET found that Spanish speakers showed higher levels of PA at the time of the pre-survey, measured both by minutes active and by days active. In FFY17, there was no difference
30.0% 30.2% 29.9%
42.0%*** 44.2%†40.7%**
20.0%
25.0%
30.0%
35.0%
40.0%
45.0%
50.0%
Statewide MPFMF EHBA
33.0% 32.3% 33.3%
38.0% 37.9% 37.9%
Statewide MPFMF EHBA
Pre
Post
FFY2017 SNAP-Ed Annual Report 196 January 2018
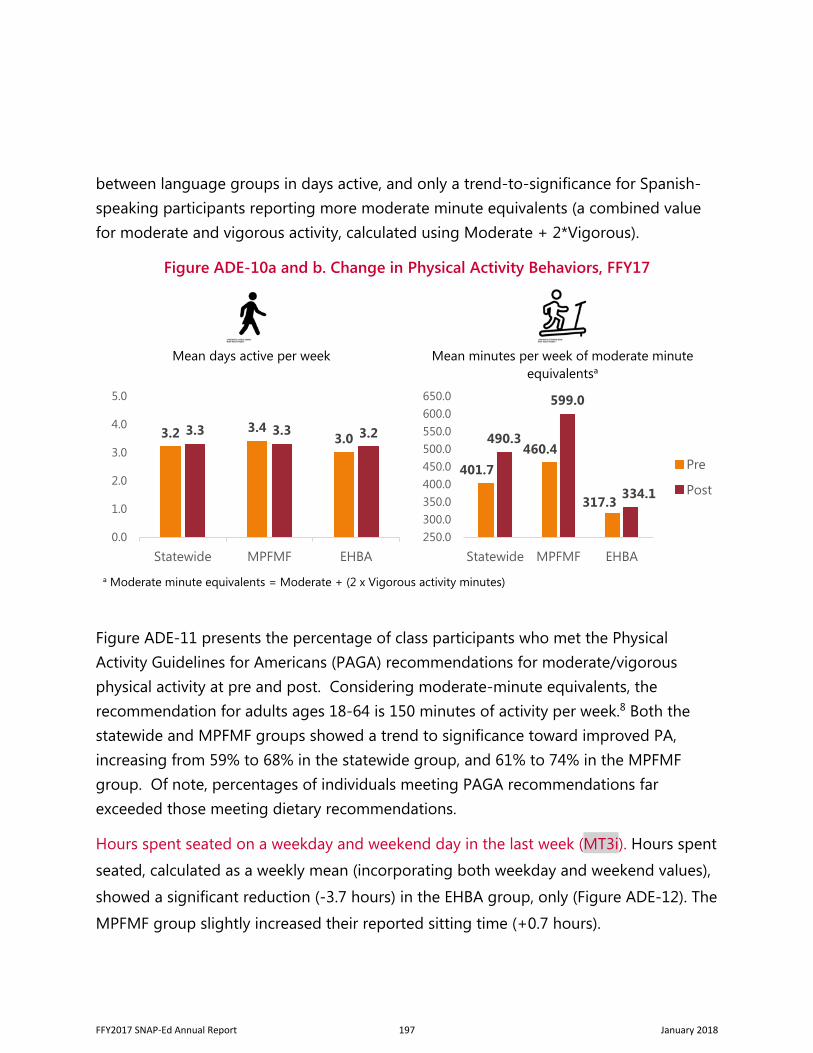
between language groups in days active, and only a trend-to-significance for Spanish-speaking participants reporting more moderate minute equivalents (a combined value for moderate and vigorous activity, calculated using Moderate + 2*Vigorous).
Figure ADE-10a and b. Change in Physical Activity Behaviors, FFY17
Mean days active per week Mean minutes per week of moderate minute
equivalentsa
a Moderate minute equivalents = Moderate + (2 x Vigorous activity minutes)
Figure ADE-11 presents the percentage of class participants who met the Physical Activity Guidelines for Americans (PAGA) recommendations for moderate/vigorous physical activity at pre and post. Considering moderate-minute equivalents, the recommendation for adults ages 18-64 is 150 minutes of activity per week.8 Both the statewide and MPFMF groups showed a trend to significance toward improved PA, increasing from 59% to 68% in the statewide group, and 61% to 74% in the MPFMF group. Of note, percentages of individuals meeting PAGA recommendations far exceeded those meeting dietary recommendations.
Hours spent seated on a weekday and weekend day in the last week (MT3i). Hours spent
seated, calculated as a weekly mean (incorporating both weekday and weekend values),
showed a significant reduction (-3.7 hours) in the EHBA group, only (Figure ADE-12). The
MPFMF group slightly increased their reported sitting time (+0.7 hours).
3.2 3.43.03.3 3.3 3.2
0.0
1.0
2.0
3.0
4.0
5.0
Statewide MPFMF EHBA
401.7460.4
317.3
490.3
599.0
334.1
250.0300.0350.0400.0450.0500.0550.0600.0650.0
Statewide MPFMF EHBA
Pre
Post
FFY2017 SNAP-Ed Annual Report 197 January 2018
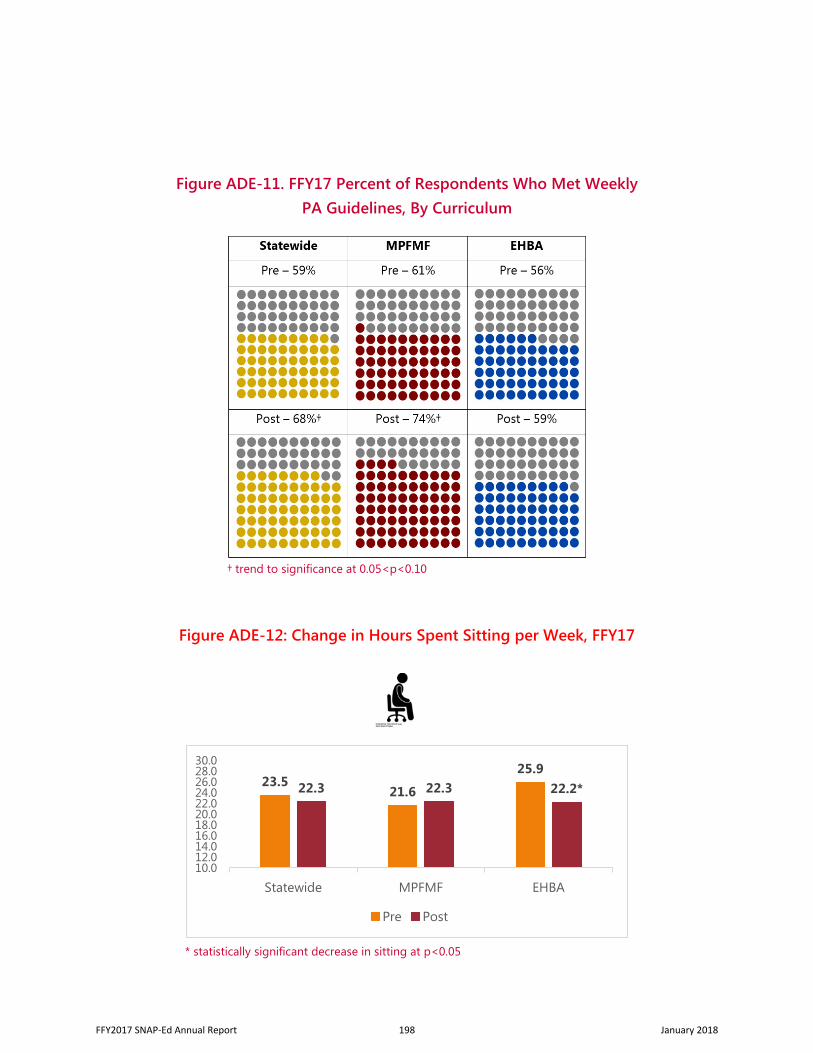
Figure ADE-11. FFY17 Percent of Respondents Who Met Weekly PA Guidelines, By Curriculum
† trend to significance at 0.05<p<0.10
Figure ADE-12: Change in Hours Spent Sitting per Week, FFY17
* statistically significant decrease in sitting at p<0.05
23.521.6
25.922.3 22.3 22.2*
10.012.014.016.018.020.022.024.026.028.030.0
Statewide MPFMF EHBA
Pre Post
FFY2017 SNAP-Ed Annual Report 198 January 2018
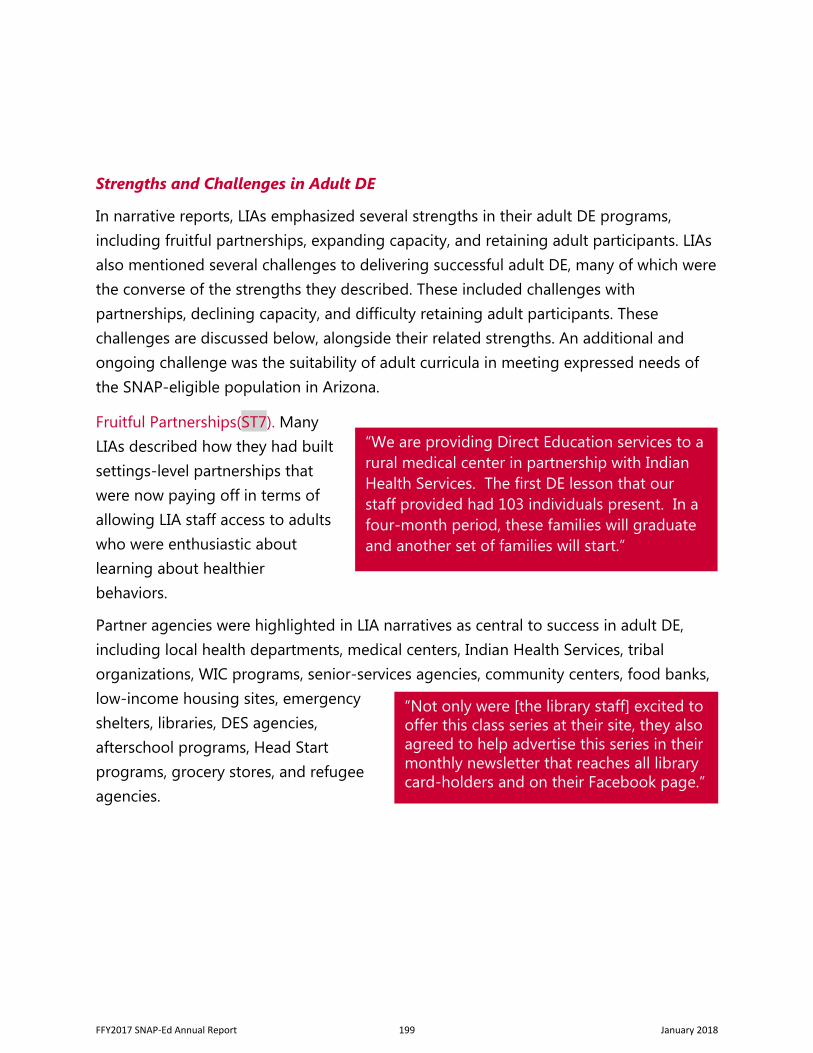
Strengths and Challenges in Adult DE
In narrative reports, LIAs emphasized several strengths in their adult DE programs, including fruitful partnerships, expanding capacity, and retaining adult participants. LIAs also mentioned several challenges to delivering successful adult DE, many of which were the converse of the strengths they described. These included challenges with partnerships, declining capacity, and difficulty retaining adult participants. These challenges are discussed below, alongside their related strengths. An additional and ongoing challenge was the suitability of adult curricula in meeting expressed needs of the SNAP-eligible population in Arizona.
Fruitful Partnerships(ST7). Many LIAs described how they had built settings-level partnerships that were now paying off in terms of allowing LIA staff access to adults who were enthusiastic about learning about healthier behaviors.
Partner agencies were highlighted in LIA narratives as central to success in adult DE, including local health departments, medical centers, Indian Health Services, tribal organizations, WIC programs, senior-services agencies, community centers, food banks, low-income housing sites, emergency shelters, libraries, DES agencies, afterschool programs, Head Start programs, grocery stores, and refugee agencies.
“We are providing Direct Education services to a rural medical center in partnership with Indian Health Services. The first DE lesson that our staff provided had 103 individuals present. In a four-month period, these families will graduate and another set of families will start.”
“Not only were [the library staff] excited to offer this class series at their site, they also agreed to help advertise this series in their monthly newsletter that reaches all library card-holders and on their Facebook page.”
FFY2017 SNAP-Ed Annual Report 199 January 2018
Expanding Capacity. LIA staff expanded capacity for adult DE in a number of ways (ST5). These included reaching out to additional eligible sites and increasing classes offered at existing sites. LIA staff also excelled at building opportunities for adults to interact with SNAP-Ed in new ways, including: 1) offering classes to adults and children together, 2) reaching parents through Head Start parent meetings or parent-teacher organizations, 3) responding directly to participants’ requests related to education, and 4) training tribal community members to provide DE lessons at youth and adult sites.
Challenges with Partnerships and Declining Capacity. In contrast, LIAs that described partnership challenges and declining capacity often referenced staff turnover and the resultant need for rebuilding relationships. In some cases, site partner schedules were at odds with LIA plans for adult DE. For example, a class scheduled at lunchtime at a senior site was good for nutrition education, but precluded active engagement in physical activities because the seniors were eating lunch.
Retaining Adult Participants. As LIAs expanded their capacity to offer adult DE, they were also often more successful in recruiting and retaining adults for a full class series. Both urban and rural LIAs showed this improvement. Common success factors included:
• Increasing awareness of SNAP-Ed within communities.• Stronger personal relationships between SNAP-Ed instructors and participants or site
staff.• Increased interest in healthy living topics as a result of participating in DE.• Individuals with friends engaging in SNAP-Ed (gardening, food demonstration) were
more likely to join in, especially when coupled with a personal recommendation ortestimonial.
“We have learned what works and what does not concerning scheduling, marketing, delivery, and general success of our [adult] series. Pairing a food demonstration with a recipe from the curriculum or the state agency website has helped us with better retention for our series.”
FFY2017 SNAP-Ed Annual Report 200 January 2018
Success in retaining adults also led to more opportunities to learn the changes that they had made as a result of participating in SNAP-Ed.
Although increasing adult participation was a strength for some LIAs, in other counties the LIAs perceived themselves as falling short in reaching adults with respect to initial recruitment, retention, and evaluation. Common challenges expressed were:
• Difficulty recruiting participants because of: o limitations in who was reached by certain types of publicity o the advent of people singing up but not showing up for a class o LIAs’ inability to meet participants’ requests for add-on activities, such as a
hands-on cooking class • Difficulty retaining, and thus evaluating, the same participants across a class
series due to participants’ work schedules and/or transportation difficulties. • Limited variability in adult curricula, leading to duplication of significant
information for those attending multiple class series. • Challenges with partner sites in moving beyond single-session lessons.
Challenge of suitable adult curricula. LIA staff noted that approved adult curricula did not necessarily meet the expressed needs of their adult participants. For example, adults desired hands-on instruction on cooking and gardening, which had limited or no SNAP-Ed curricular support in FFY17. In addition, the AZ Health Zone’s approved adult curricula were not always deemed appropriate for Latino/a or tribal audiences. Similar curricular needs and barriers were expressed by LIAs via the AZ Health Zone partner support and services evaluation in July 2017.
“The challenge of providing culturally relevant education to our many predominantly Latino and Native American sites continues. Approved curricula do not necessarily meet the needs of these sites.”
“One participant from the senior center shared that since he tried hummus at a food demonstration; he has replaced his sour cream dip with it and is now using carrot instead of chips for his evening snack. That change alone has helped him drop five pounds.”
FFY2017 SNAP-Ed Annual Report 201 January 2018
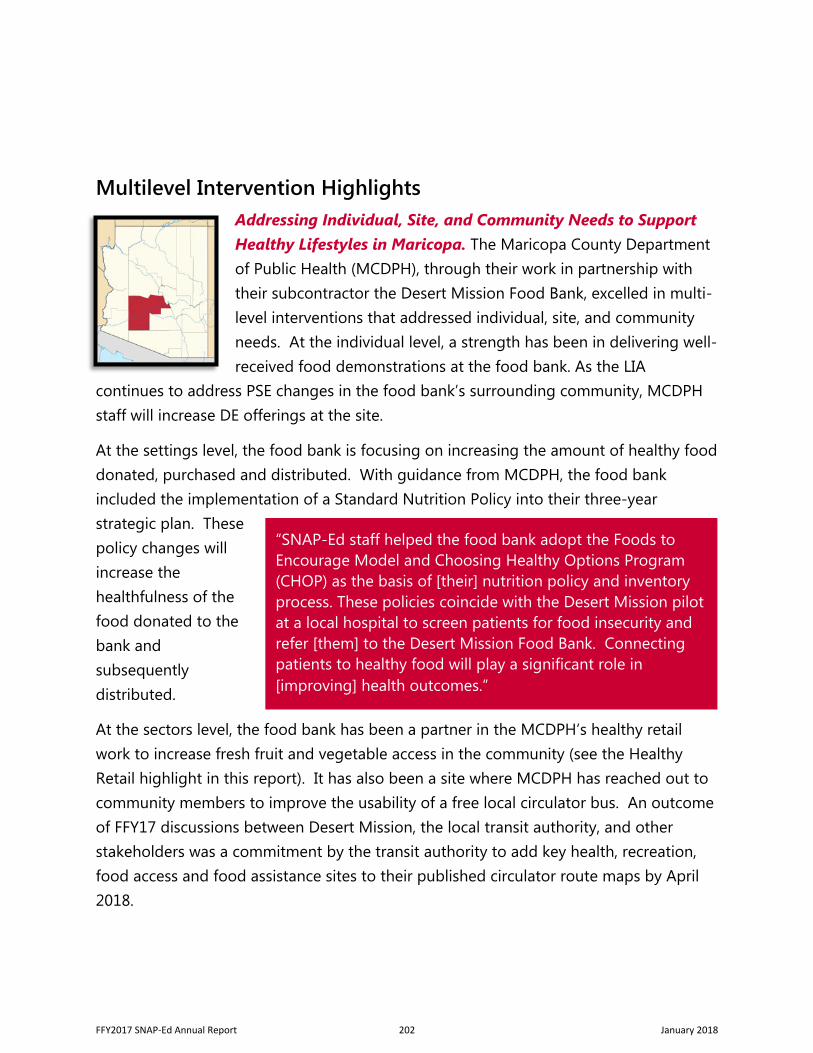
Multilevel Intervention Highlights Addressing Individual, Site, and Community Needs to Support Healthy Lifestyles in Maricopa. The Maricopa County Department of Public Health (MCDPH), through their work in partnership with their subcontractor the Desert Mission Food Bank, excelled in multi-level interventions that addressed individual, site, and community needs. At the individual level, a strength has been in delivering well-received food demonstrations at the food bank. As the LIA
continues to address PSE changes in the food bank’s surrounding community, MCDPH staff will increase DE offerings at the site.
At the settings level, the food bank is focusing on increasing the amount of healthy food donated, purchased and distributed. With guidance from MCDPH, the food bank included the implementation of a Standard Nutrition Policy into their three-year strategic plan. These policy changes will increase the healthfulness of the food donated to the bank and subsequently distributed.
At the sectors level, the food bank has been a partner in the MCDPH’s healthy retail work to increase fresh fruit and vegetable access in the community (see the Healthy Retail highlight in this report). It has also been a site where MCDPH has reached out to community members to improve the usability of a free local circulator bus. An outcome of FFY17 discussions between Desert Mission, the local transit authority, and other stakeholders was a commitment by the transit authority to add key health, recreation, food access and food assistance sites to their published circulator route maps by April 2018.
“SNAP-Ed staff helped the food bank adopt the Foods to Encourage Model and Choosing Healthy Options Program (CHOP) as the basis of [their] nutrition policy and inventory process. These policies coincide with the Desert Mission pilot at a local hospital to screen patients for food insecurity and refer [them] to the Desert Mission Food Bank. Connecting patients to healthy food will play a significant role in [improving] health outcomes.”
FFY2017 SNAP-Ed Annual Report 202 January 2018
KEY FINDINGS AND RECOMMENDATIONS
Adult DE participants showed more improvement in food behaviors than in PA behaviors, in contrast to FFY16, when PA improved more.
The two assessed curricula reached different audiences, with MPFMF participants significantly more likely to be female, Hispanic, under 50 years old, and less likely to receive SNAP benefits than EHBA participants.
MPFMF series attendance increased daily fruit and vegetable consumption. EHBA series attendance improved lean protein consumption, vegetable consumption, and nutrition label use. EHBA participants also decreased soda consumption and time spent sitting. LIAs may consider offering both of these series to the same audiences, as they appear to affect different behaviors.
More adult DE participants were able to meet the DGA goals for fruit than for vegetables. The AZ Health Zone should consider investigating specific barriers to vegetable consumption in order to enhance DE efforts.*
LIAs have made progress since FFY16 in linking DE to PSEs, but there are still unexplored opportunities to connect participants to local healthy eating and active living resources and opportunities as PSE work gains momentum.
Spanish speakers reported somewhat higher levels of PA at baseline. LIAs should consider how to tailor DE interventions with Spanish-speaking audiences to address maintenance as well as preparation and action related to PA.*
*Recurring recommendation from FFY16
FFY2017 SNAP-Ed Annual Report 203 January 2018
References 1. Trust for America’s Health and the Robert Wood Johnson Foundation. Arizona State Obesity
Data, Rates and Trends: The State of Obesity. http://stateofobesity.org/states/az/. Accessed November 27, 2017.
2. Community Commons. Community Health Needs Assessment Health Indicators Report: Fruit/Vegetable Consumption. https://assessment.communitycommons.org/CHNA/report?page=5&id=301&reporttype=libraryCHNA. Accessed November 27, 2017.
3. Community Commons. Community Health Needs Assessment Health Indicators Report: Physical Inactivity. https://assessment.communitycommons.org/CHNA/report?page=5&id=306&reporttype=libraryCHNA. Accessed November 27, 2017.
4. Sylva, K, Townsend, MS, Martin, A, Metz, D. UCCE Food Behavior Checklist. 2006. https://ucdavis.app.box.com/s/udpvemp1be2ijniejhe6. Accessed November 20, 2017.
5. Banna, J, Townsend, MS, Sylva, K. Lista de Habitos Alimenticos (UCCE Food Behavior Checklist). 2007. https://ucdavis.app.box.com/s/qq3ir1xwzs6olq7ro8i1. Accessed November 20, 2017.
6. Banna, J, Townsend, MS. University of California On the Go! [Physical Activity [PA] assessment for low-income communities]. 2006. https://ucdavis.app.box.com/s/dlrlkv50ls9vec691ajv. Accessed November 20, 2017.
7. Craig CL, Marshall AL, Sjöström M, et al. International physical activity questionnaire: 12-country reliability and validity. Med Sci Sports Exerc. 2003;35(8):1381-1395. doi:10.1249/01.MSS.0000078924.61453.FB.
8. U.S. Department of Health and Human Services, U.S. Department of Agriculture. 2015–2020 Dietary Guidelines for Americans. Washington, D.C.: U.S. Department of Health and Human Services and U.S. Department of Agriculture; 2015. https://health.gov/dietaryguidelines/2015/. Accessed April 20, 2017.
Icon Credits All downloaded from Noun Project (https://thenounproject.com/) as community commons images, requiring attribution to the creators. The icons contain the creator names but as they are too small to read. They are, in the order in which they appear in the chapter: Chicken leg: Miko, Fish: Alena Artemova, Apple fruit: Adrien Coquet, Broccoli: Iconic, Soda: Blaise Sewell, Nutritional Facts: Iulia Streja, Refrigerator: Gan Khoon Lay, Woman Walking: corpus delicti, Treadmill: Creative Stall, Sitting: Gan Khoon Lay.
FFY2017 SNAP-Ed Annual Report 204 January 2018
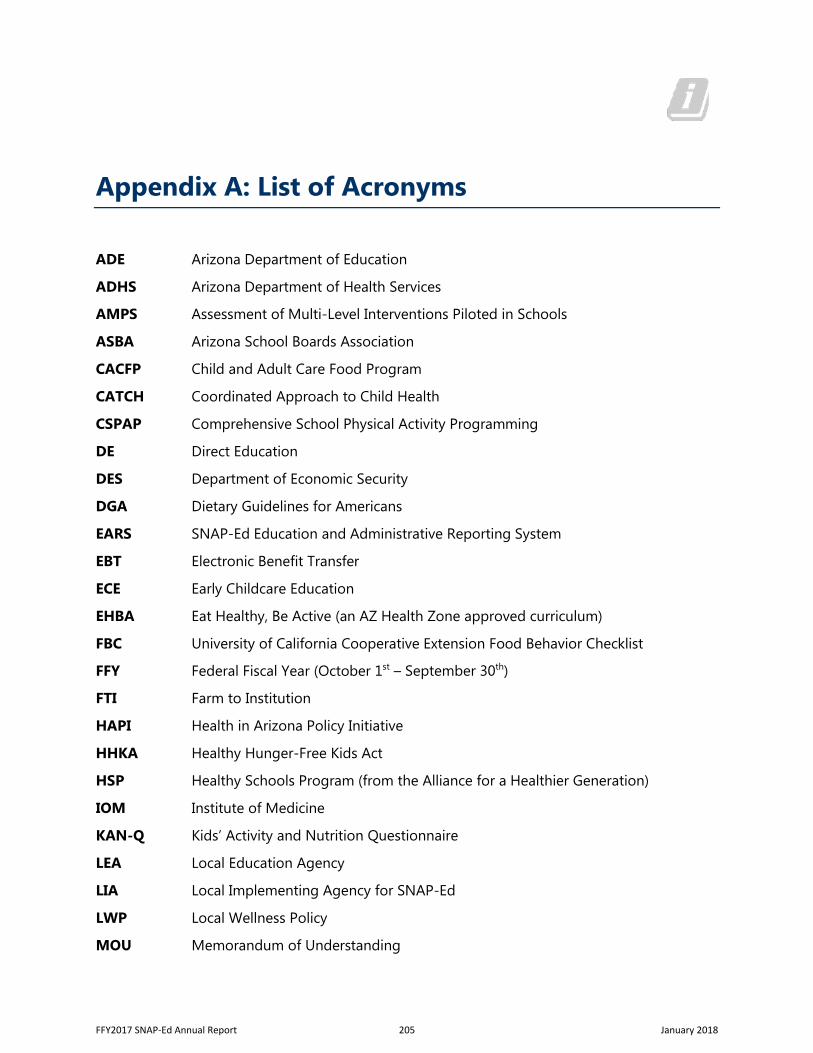
Appendix A: List of Acronyms
ADE Arizona Department of Education
ADHS Arizona Department of Health Services
AMPS Assessment of Multi-Level Interventions Piloted in Schools
ASBA Arizona School Boards Association
CACFP Child and Adult Care Food Program
CATCH Coordinated Approach to Child Health
CSPAP Comprehensive School Physical Activity Programming
DE Direct Education
DES Department of Economic Security
DGA Dietary Guidelines for Americans
EARS SNAP-Ed Education and Administrative Reporting System
EBT Electronic Benefit Transfer
ECE Early Childcare Education
EHBA Eat Healthy, Be Active (an AZ Health Zone approved curriculum)
FBC University of California Cooperative Extension Food Behavior Checklist
FFY Federal Fiscal Year (October 1st – September 30th)
FTI Farm to Institution
HAPI Health in Arizona Policy Initiative
HHKA Healthy Hunger-Free Kids Act
HSP Healthy Schools Program (from the Alliance for a Healthier Generation)
IOM Institute of Medicine
KAN-Q Kids’ Activity and Nutrition Questionnaire
LEA Local Education Agency
LIA Local Implementing Agency for SNAP-Ed
LWP Local Wellness Policy
MOU Memorandum of Understanding
FFY2017 SNAP-Ed Annual Report 205 January 2018
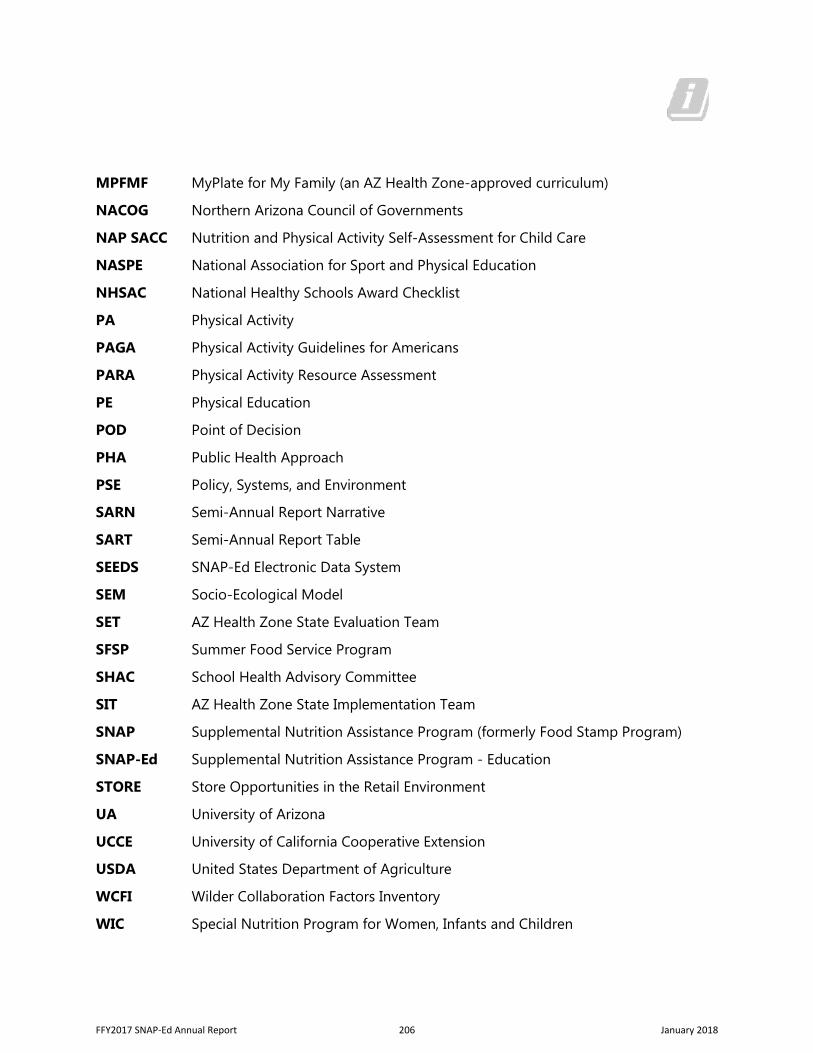
MPFMF MyPlate for My Family (an AZ Health Zone-approved curriculum)
NACOG Northern Arizona Council of Governments
NAP SACC Nutrition and Physical Activity Self-Assessment for Child Care
NASPE National Association for Sport and Physical Education
NHSAC National Healthy Schools Award Checklist
PA Physical Activity
PAGA Physical Activity Guidelines for Americans
PARA Physical Activity Resource Assessment
PE Physical Education
POD Point of Decision
PHA Public Health Approach
PSE Policy, Systems, and Environment
SARN Semi-Annual Report Narrative
SART Semi-Annual Report Table
SEEDS SNAP-Ed Electronic Data System
SEM Socio-Ecological Model
SET AZ Health Zone State Evaluation Team
SFSP Summer Food Service Program
SHAC School Health Advisory Committee
SIT AZ Health Zone State Implementation Team
SNAP Supplemental Nutrition Assistance Program (formerly Food Stamp Program)
SNAP-Ed Supplemental Nutrition Assistance Program - Education
STORE Store Opportunities in the Retail Environment
UA University of Arizona
UCCE University of California Cooperative Extension
USDA United States Department of Agriculture
WCFI Wilder Collaboration Factors Inventory
WIC Special Nutrition Program for Women, Infants and Children
FFY2017 SNAP-Ed Annual Report 206 January 2018
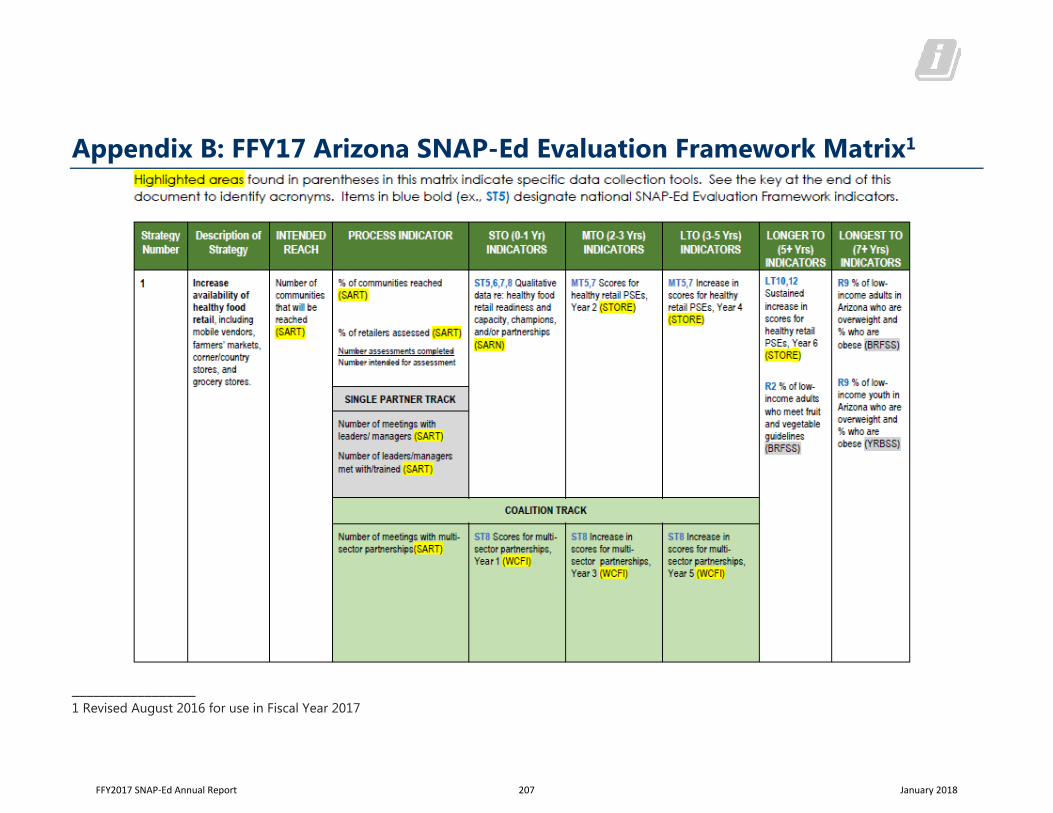
Appendix B: FFY17 Arizona SNAP-Ed Evaluation Framework Matrix1
_________________ 1 Revised August 2016 for use in Fiscal Year 2017
FFY2017 SNAP-Ed Annual Report 207 January 2018
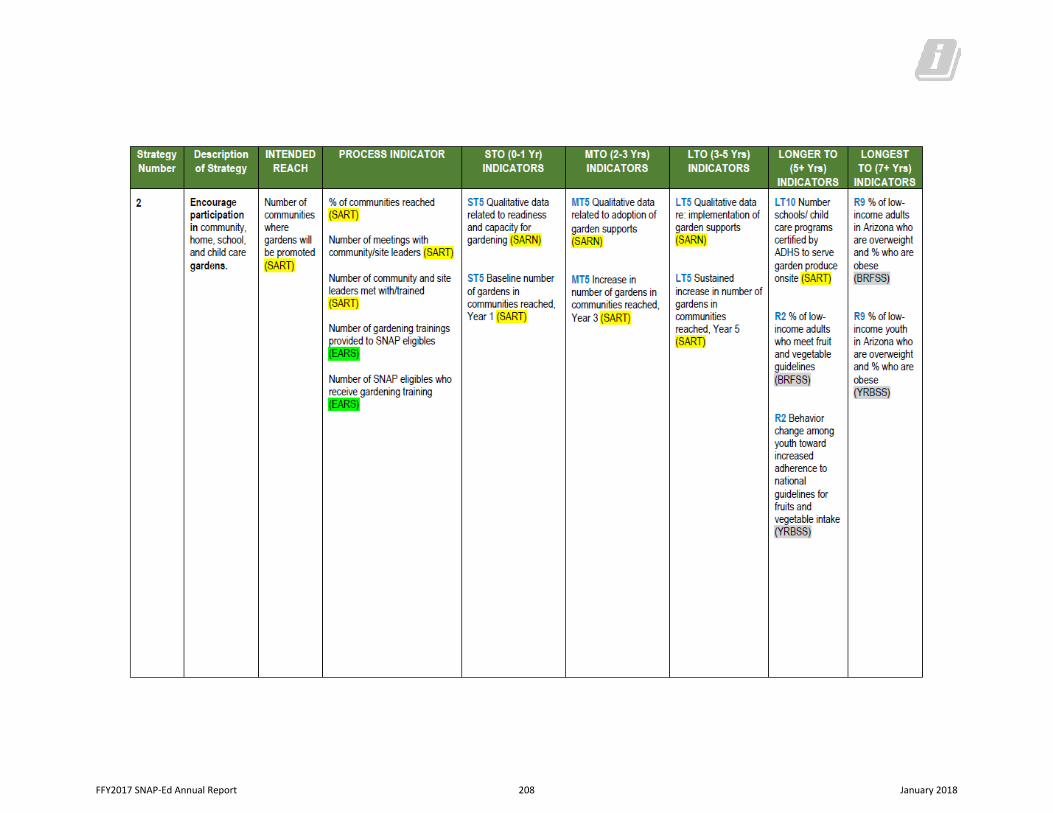
FFY2017 SNAP-Ed Annual Report 208 January 2018
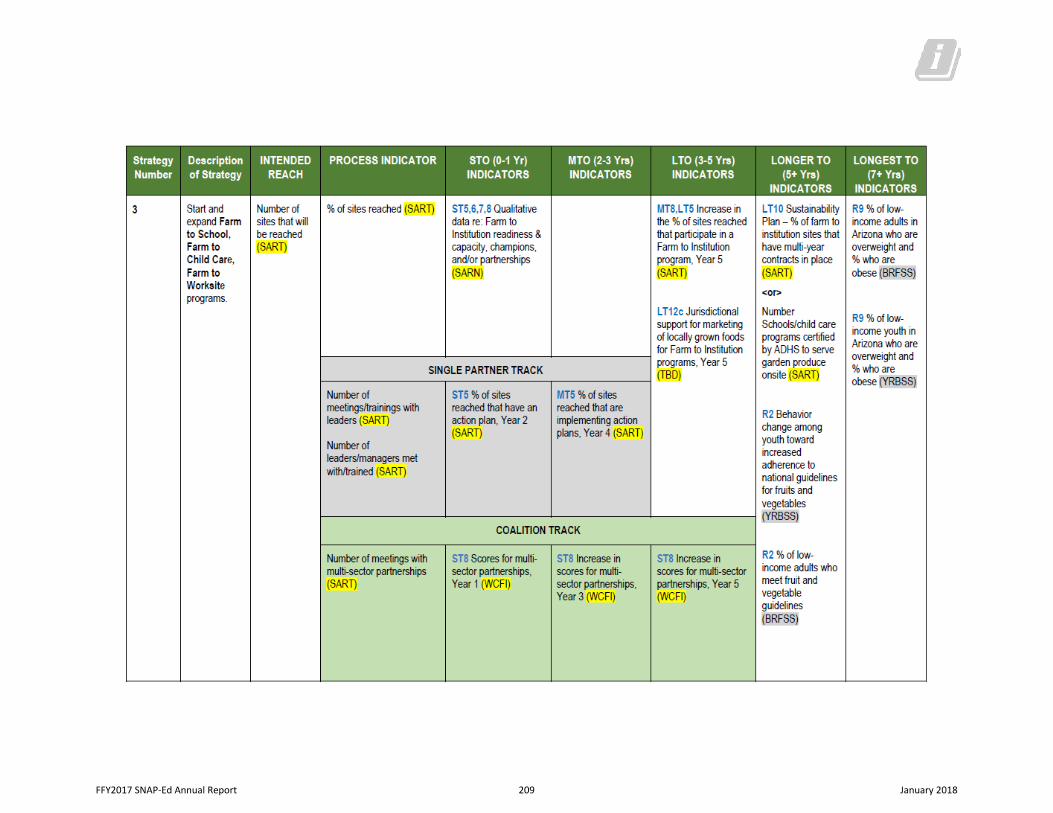
FFY2017 SNAP-Ed Annual Report 209 January 2018
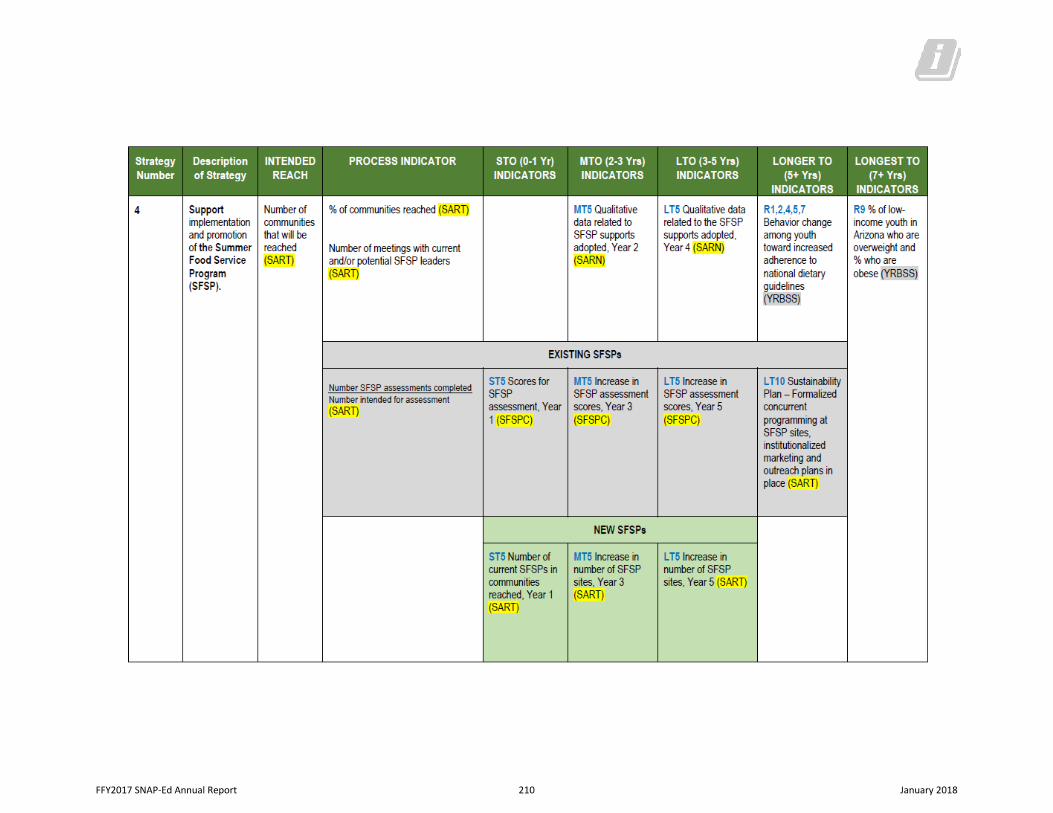
FFY2017 SNAP-Ed Annual Report 210 January 2018
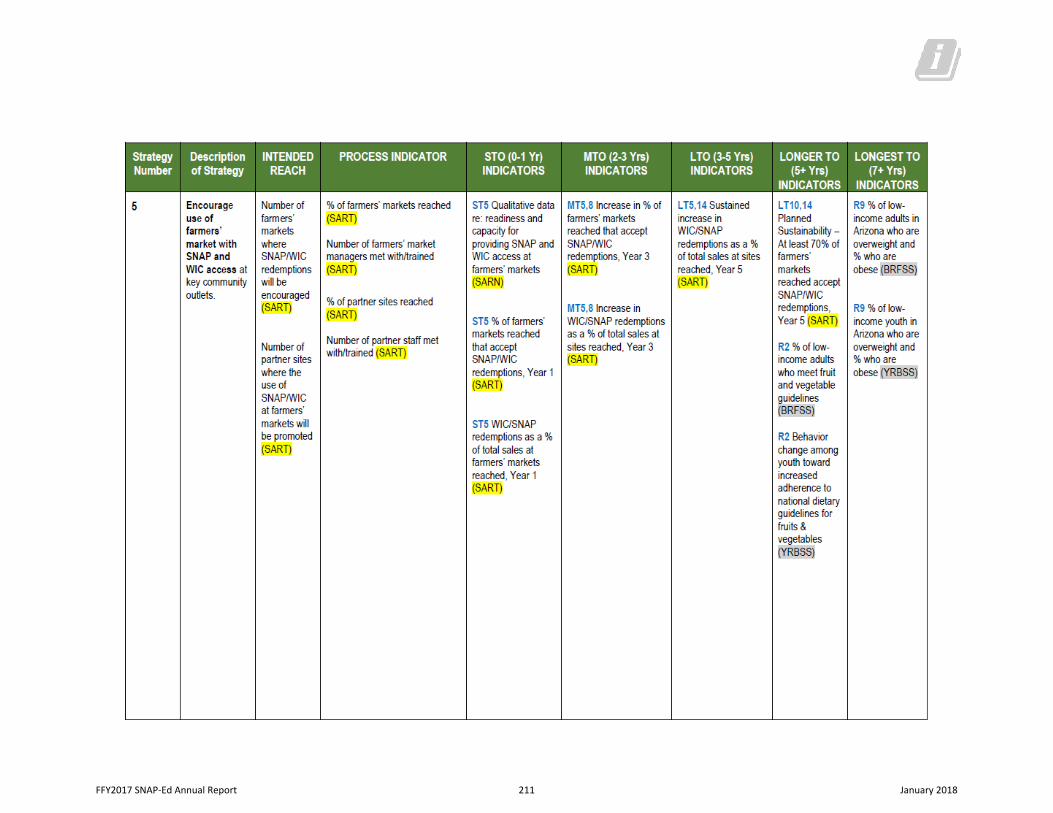
FFY2017 SNAP-Ed Annual Report 211 January 2018
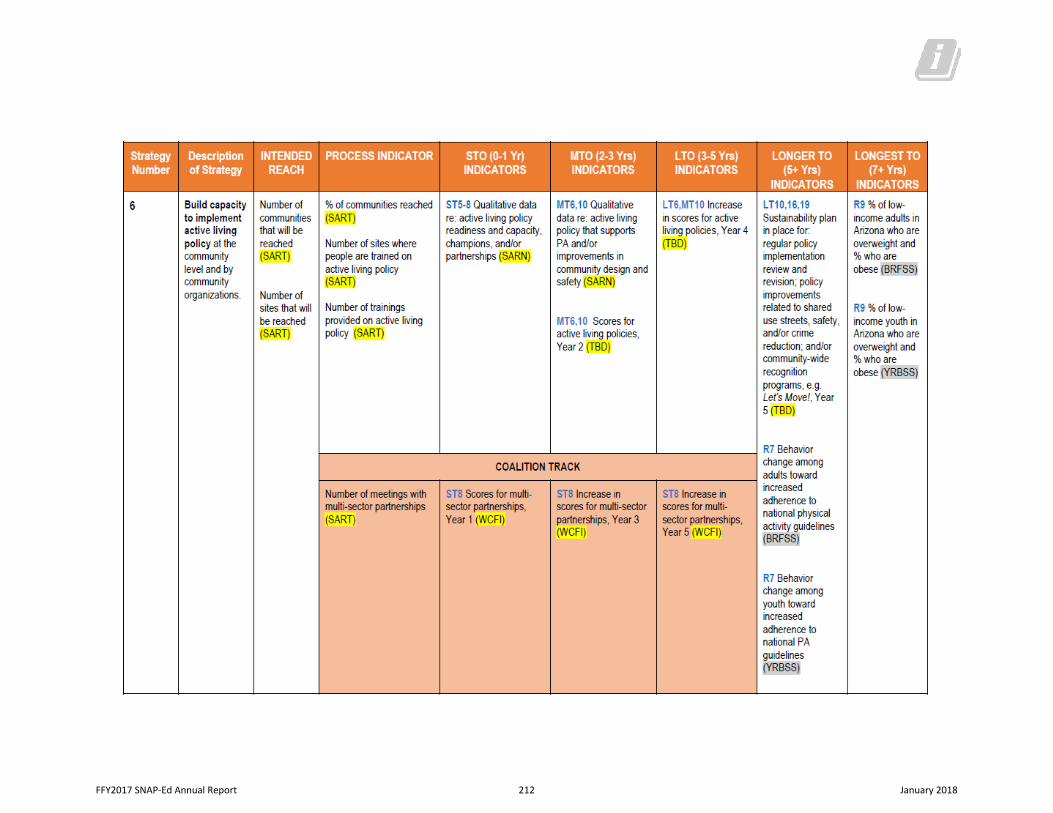
FFY2017 SNAP-Ed Annual Report 212 January 2018
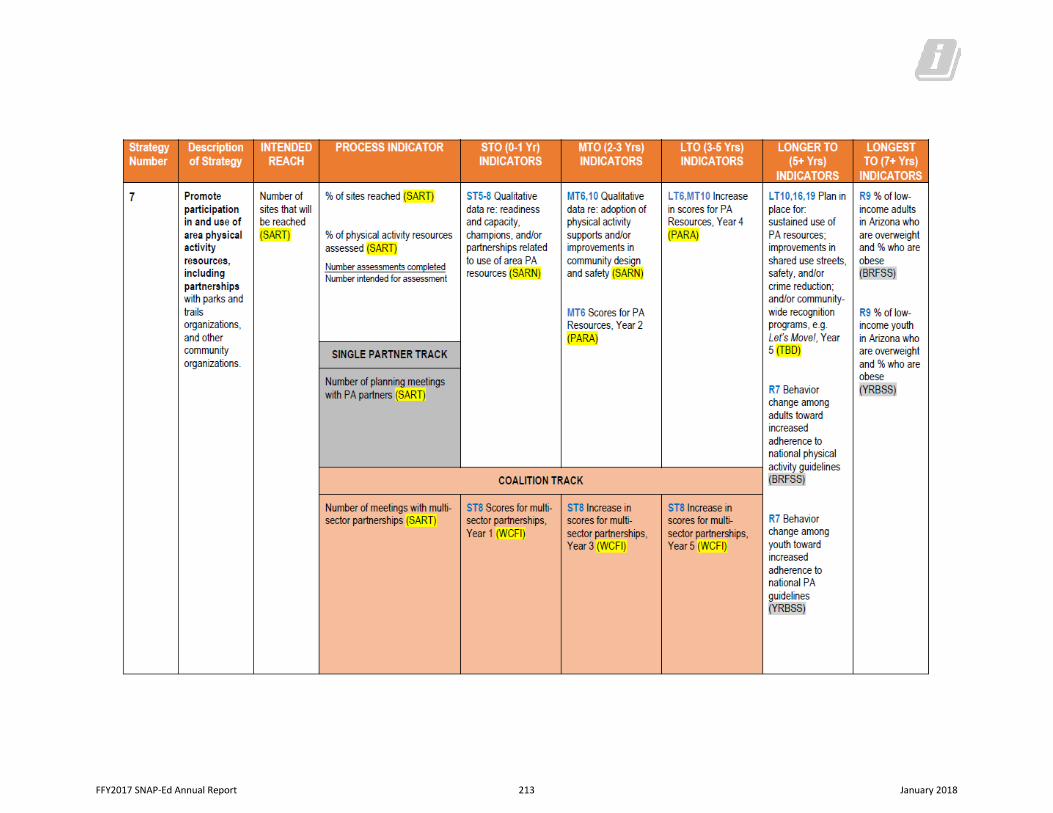
FFY2017 SNAP-Ed Annual Report 213 January 2018
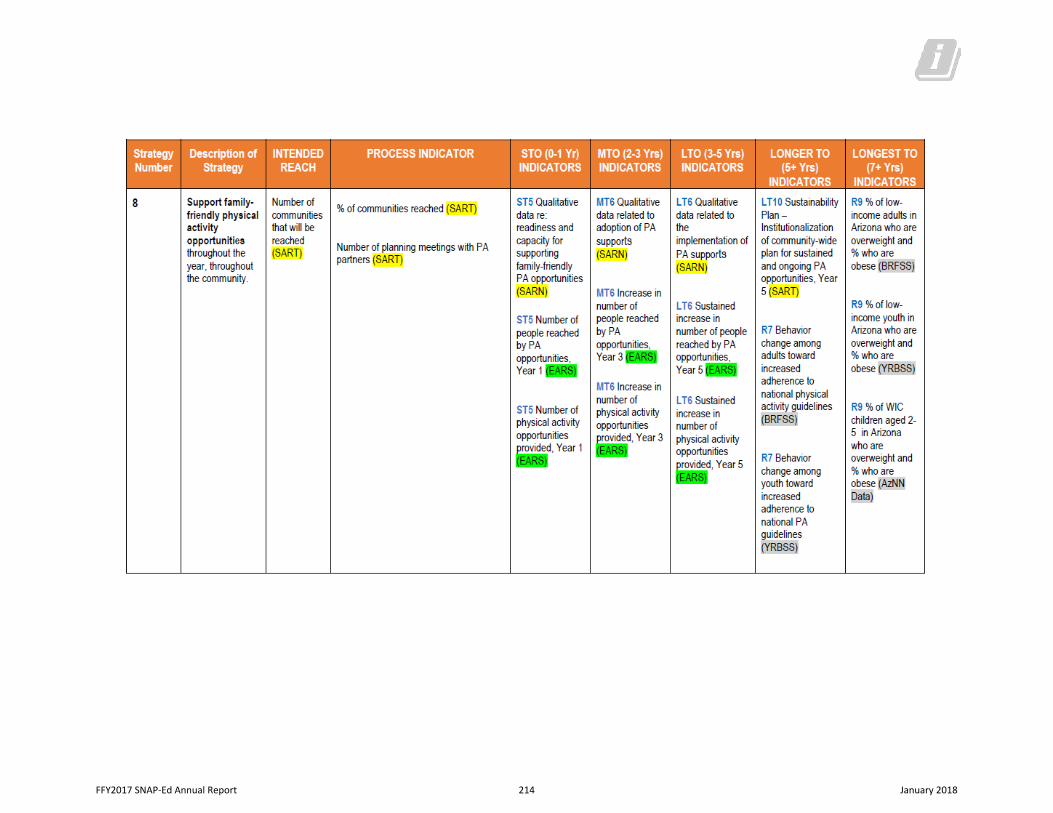
FFY2017 SNAP-Ed Annual Report 214 January 2018
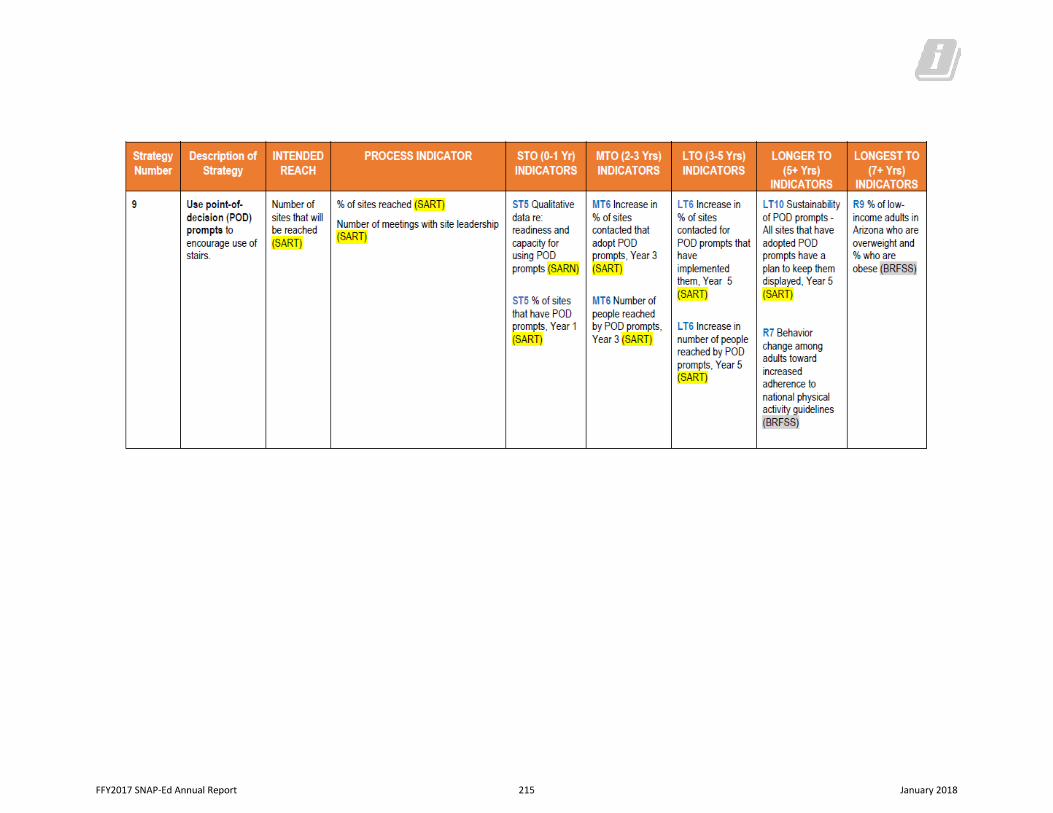
FFY2017 SNAP-Ed Annual Report 215 January 2018
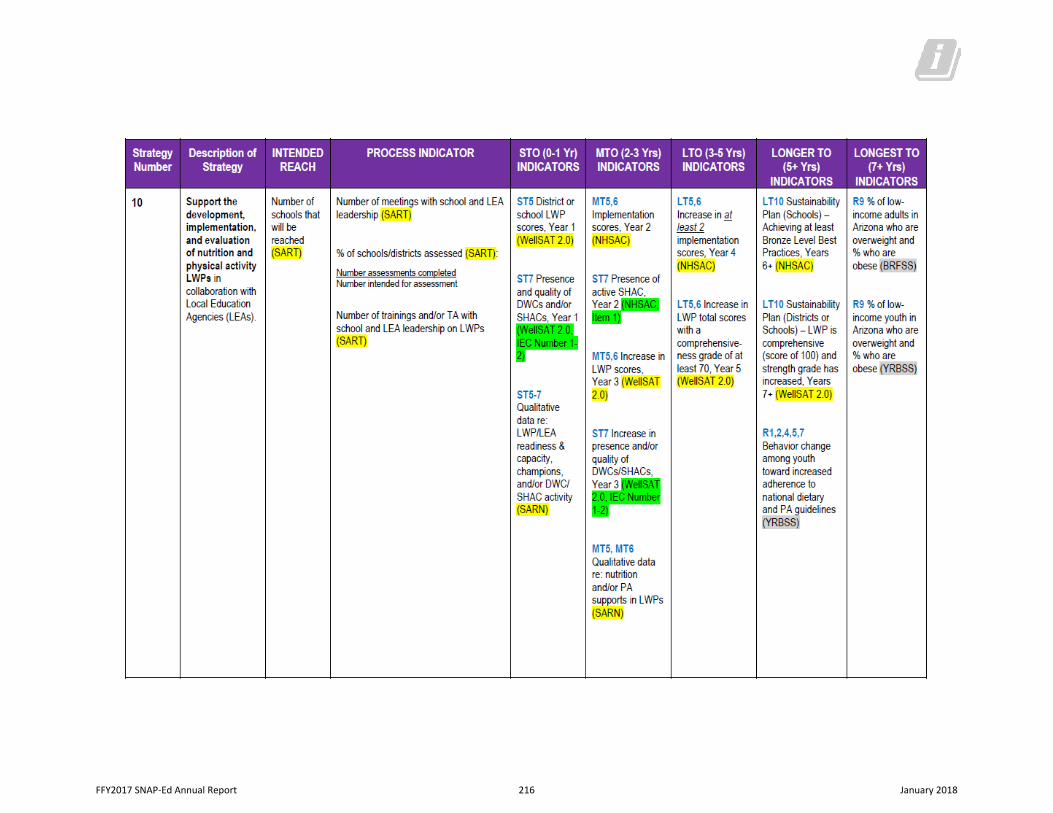
FFY2017 SNAP-Ed Annual Report 216 January 2018
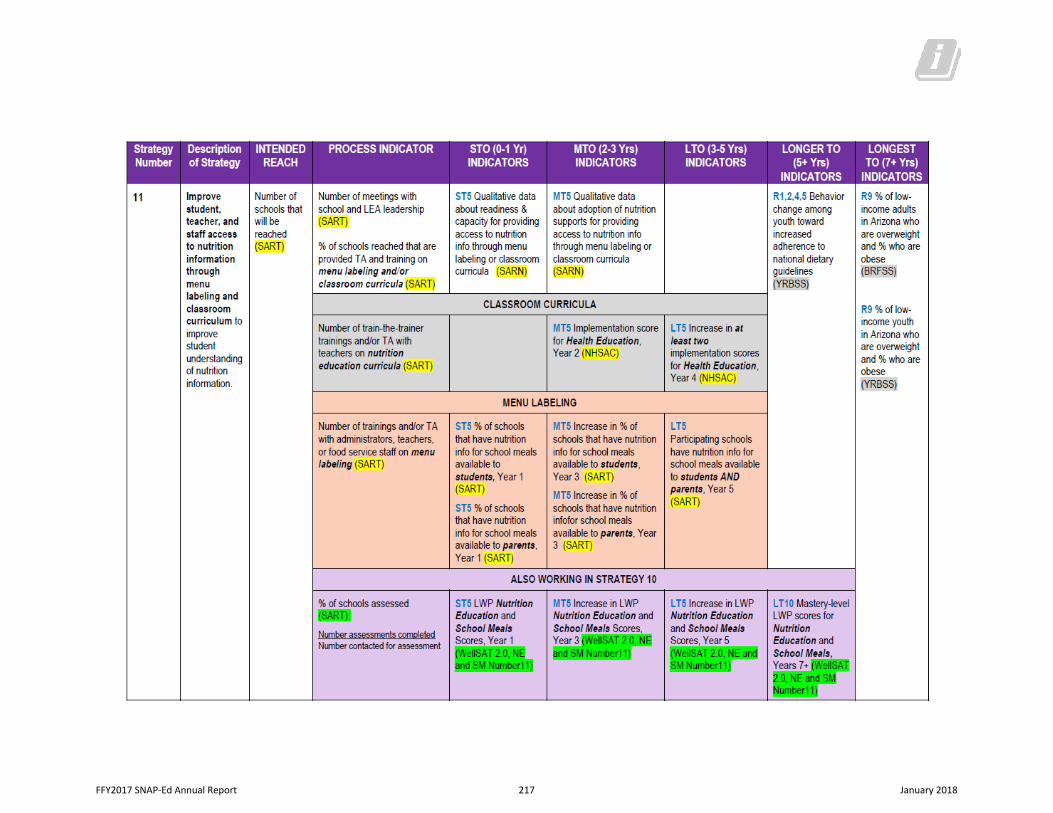
FFY2017 SNAP-Ed Annual Report 217 January 2018
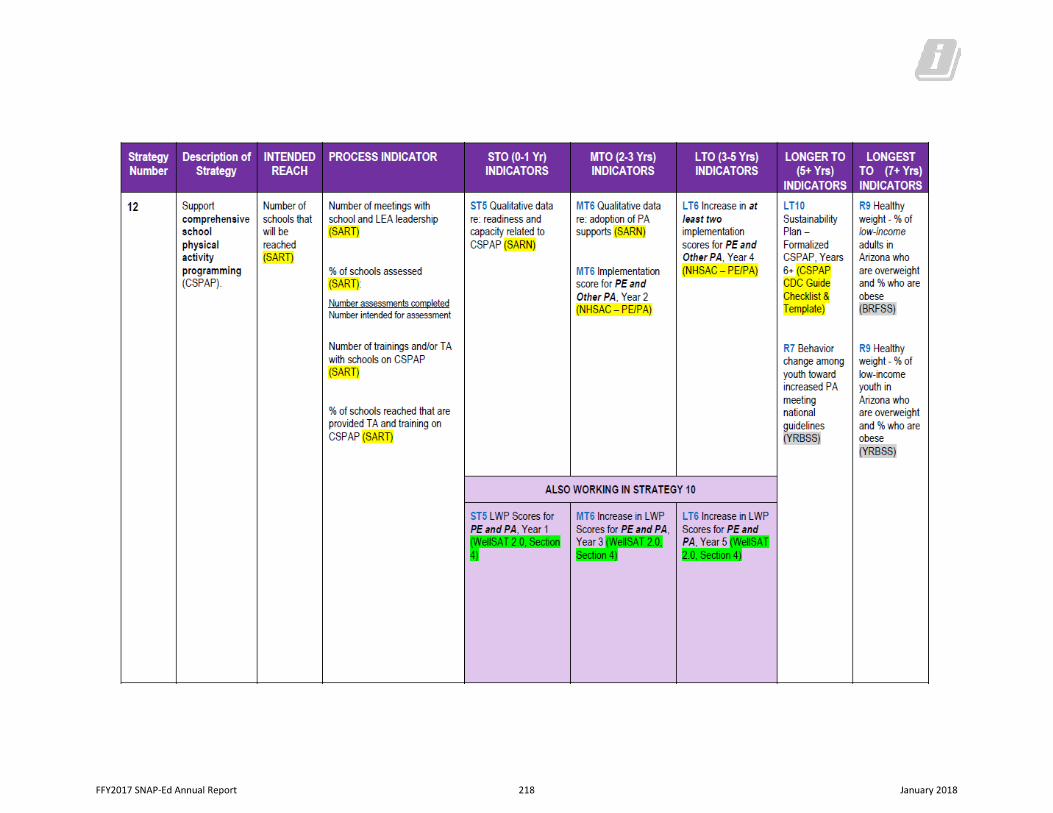
FFY2017 SNAP-Ed Annual Report 218 January 2018
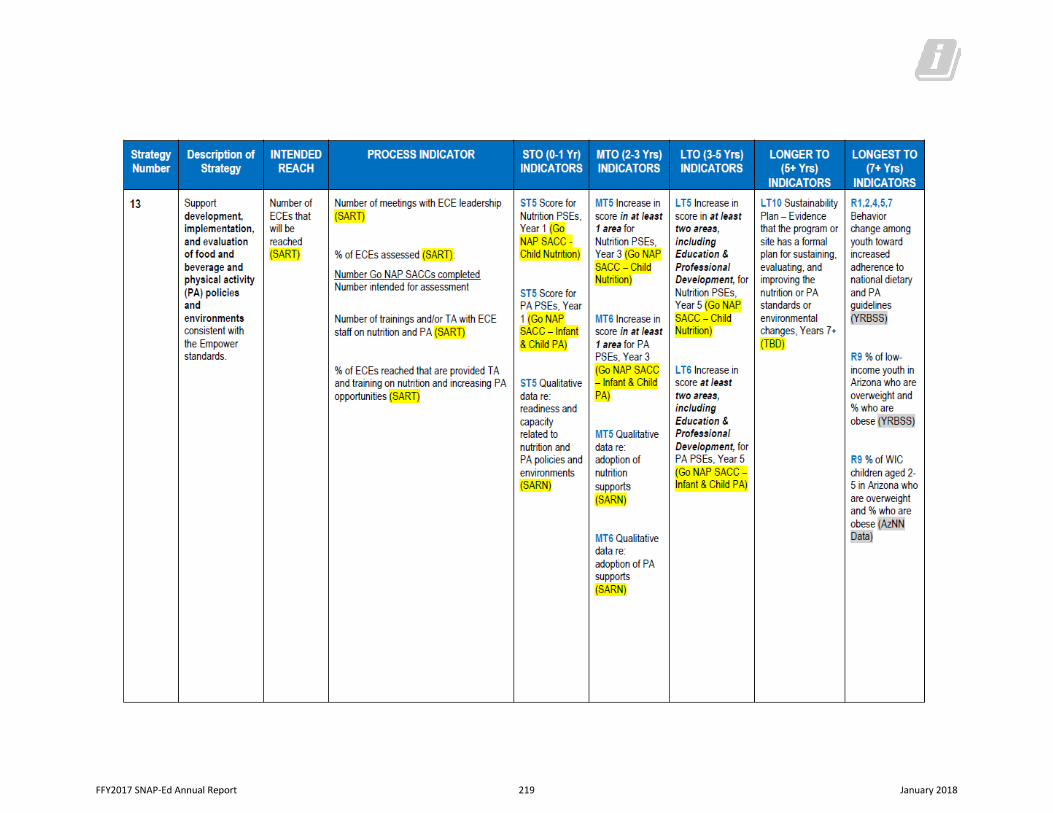
FFY2017 SNAP-Ed Annual Report 219 January 2018
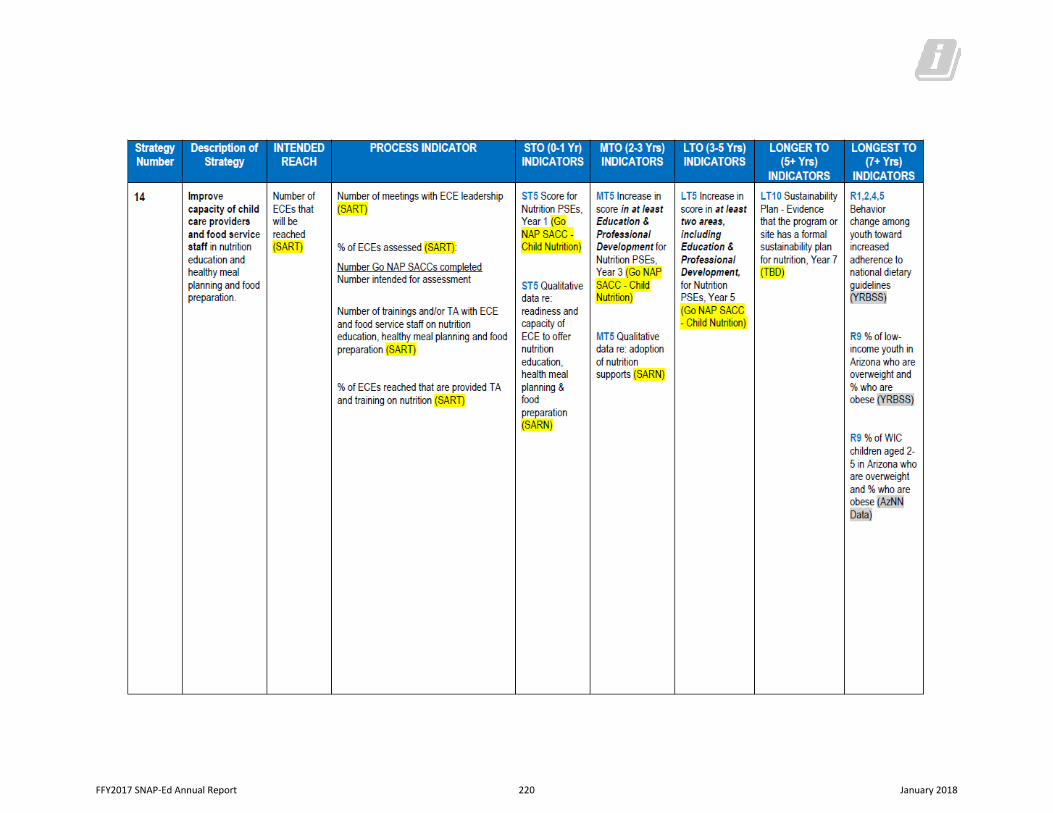
FFY2017 SNAP-Ed Annual Report 220 January 2018
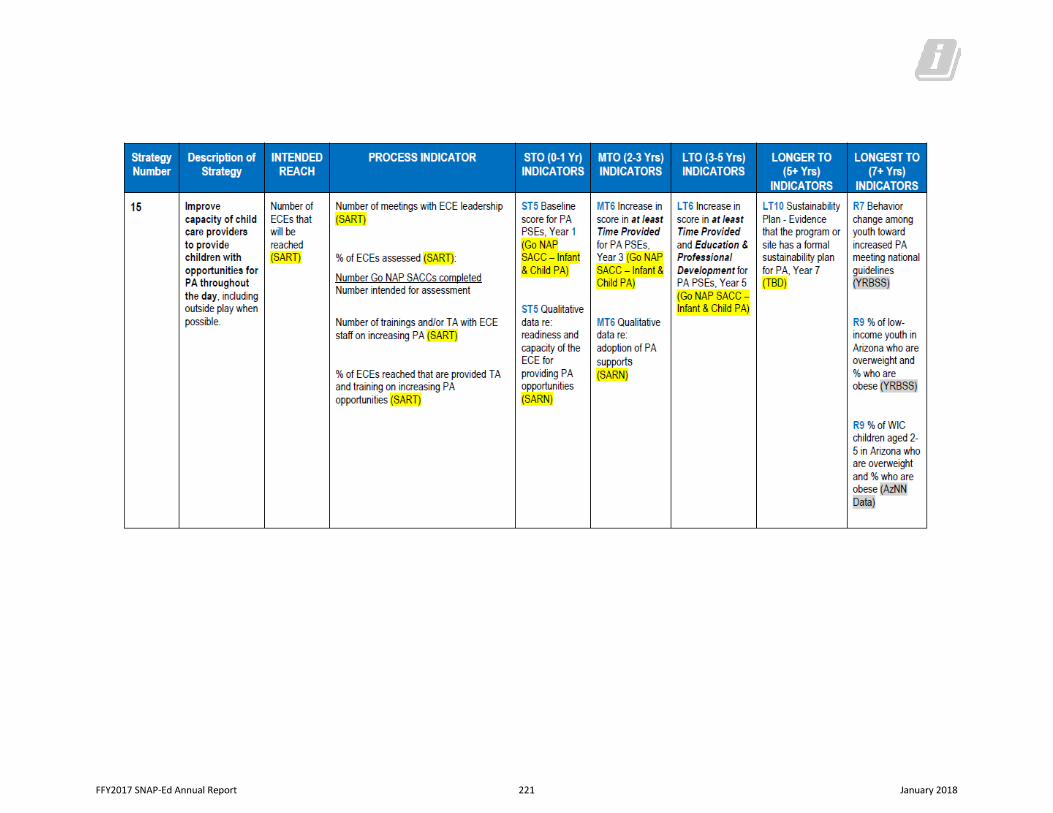
FFY2017 SNAP-Ed Annual Report 221 January 2018
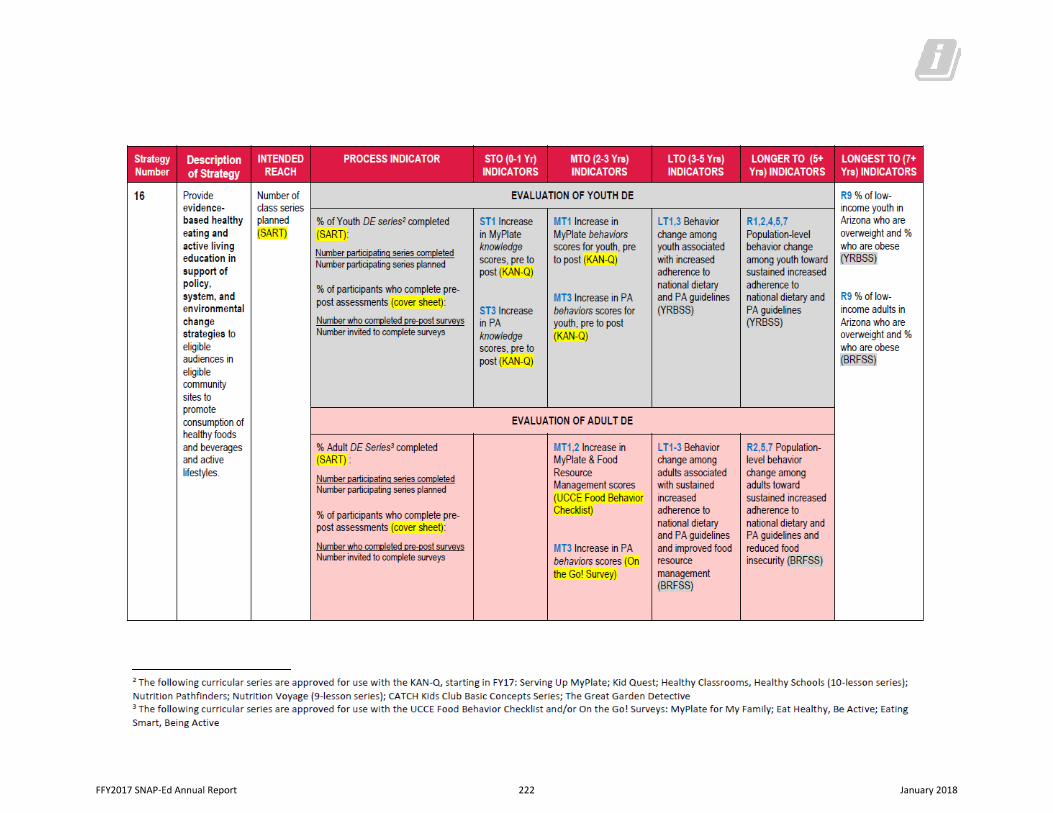
FFY2017 SNAP-Ed Annual Report 222 January 2018
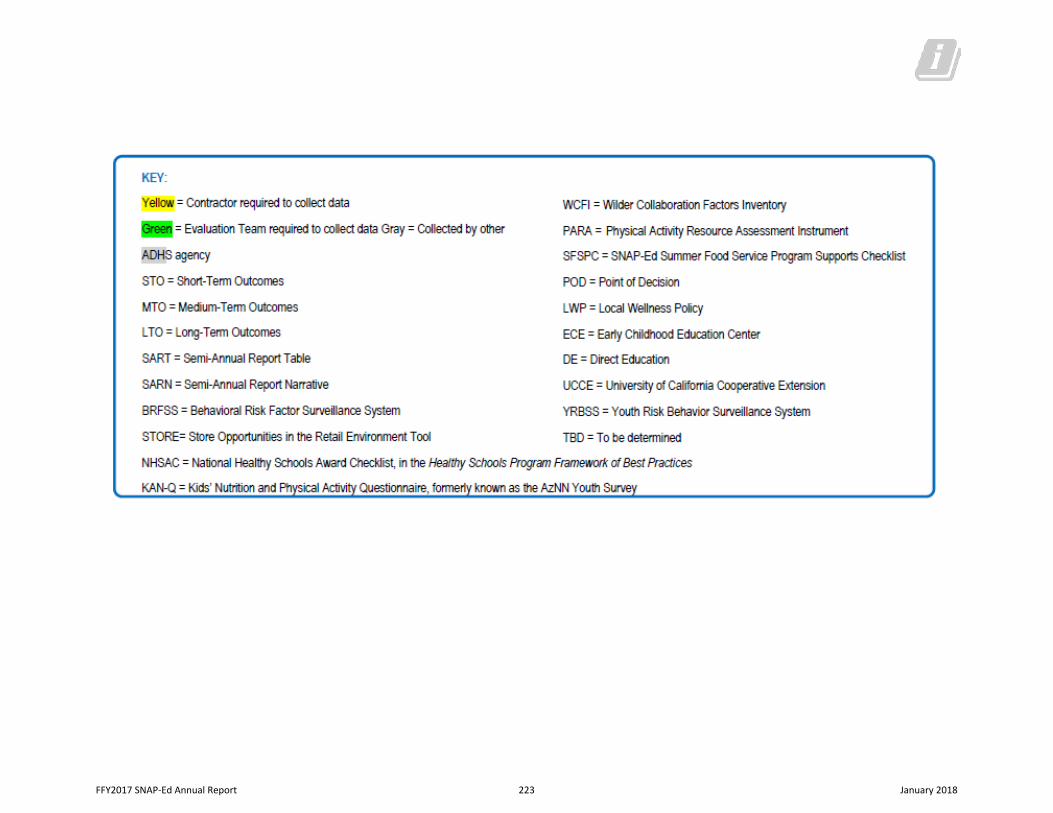
FFY2017 SNAP-Ed Annual Report 223 January 2018
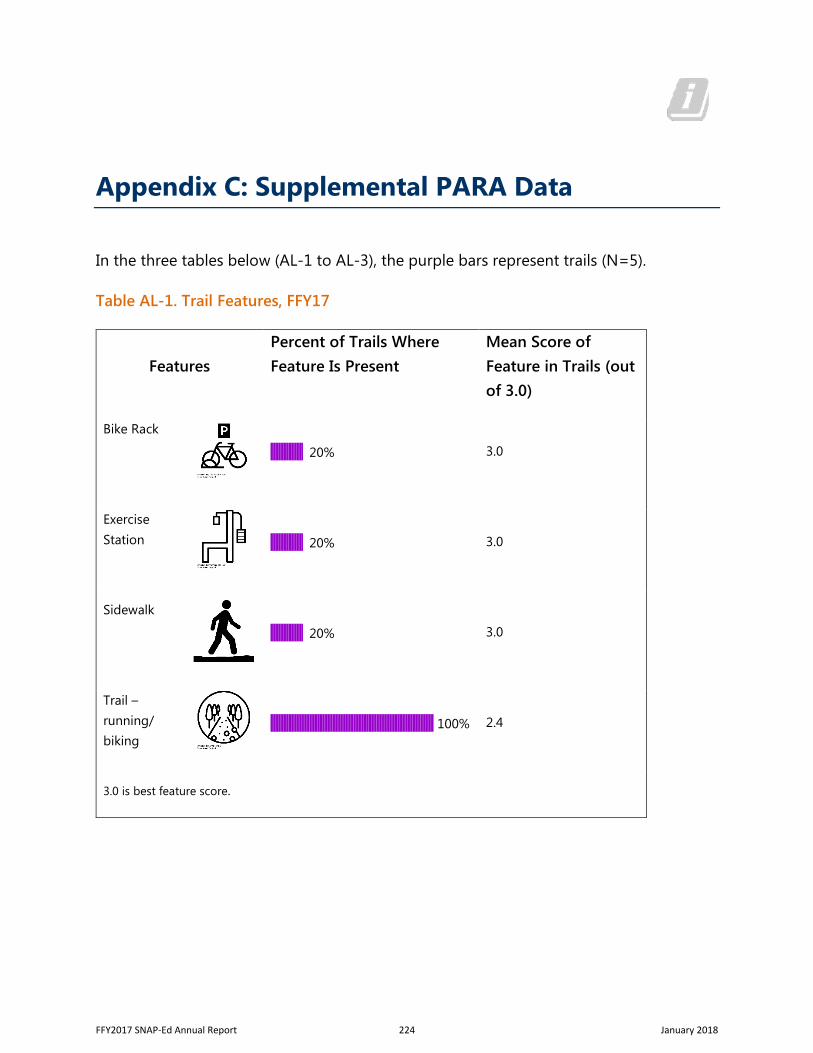
Appendix C: Supplemental PARA Data
In the three tables below (AL-1 to AL-3), the purple bars represent trails (N=5).
Table AL-1. Trail Features, FFY17
Features Percent of Trails Where Feature Is Present
Mean Score of Feature in Trails (out of 3.0)
Bike Rack
|||||||||||||||||||| 20% 3.0
Exercise Station |||||||||||||||||||| 20% 3.0
Sidewalk
|||||||||||||||||||| 20% 3.0
Trail – running/ biking
|||||||||||||||||||||||||||||||||||||||||||||||||||||||||||||||||||||||||||||||||||||||||||||||||||| 100% 2.4
3.0 is best feature score.
FFY2017 SNAP-Ed Annual Report 224 January 2018
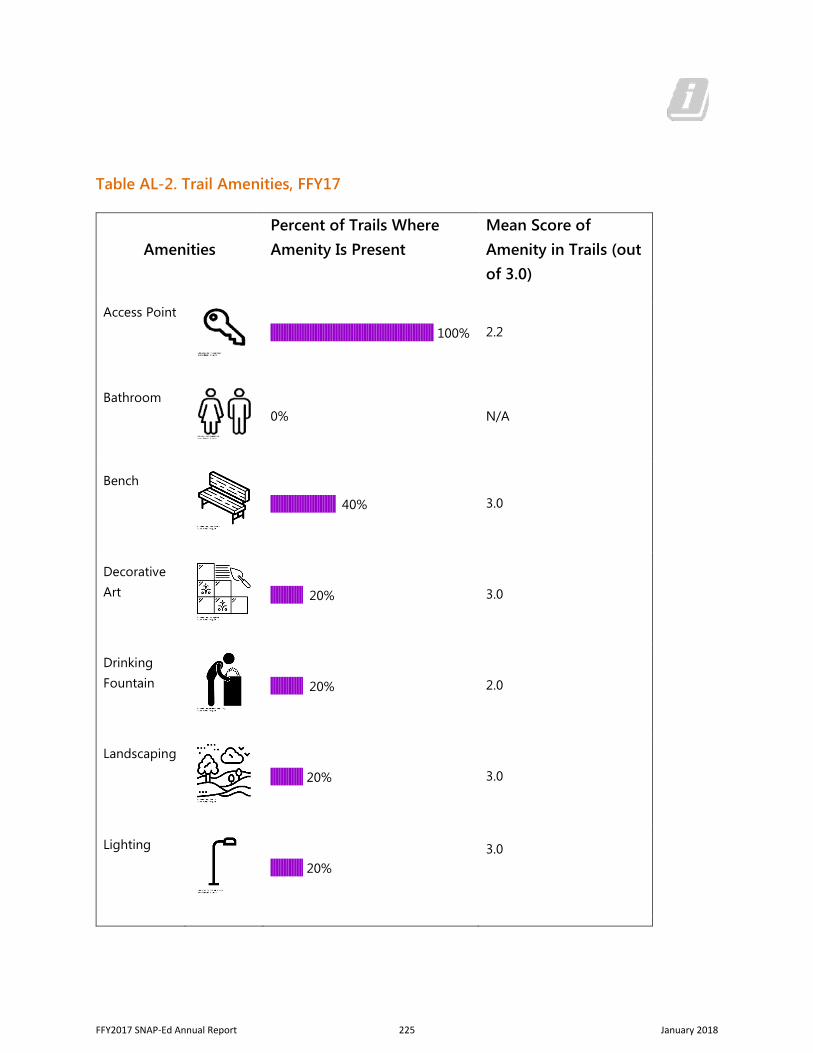
Table AL-2. Trail Amenities, FFY17
Amenities Percent of Trails Where Amenity Is Present
Mean Score of Amenity in Trails (out of 3.0)
Access Point
|||||||||||||||||||||||||||||||||||||||||||||||||||||||||||||||||||||||||||||||||||||||||||||||||||| 100% 2.2
Bathroom
0% N/A
Bench
|||||||||||||||||||||||||||||||||||||||| 40% 3.0
Decorative Art
|||||||||||||||||||| 20% 3.0
Drinking Fountain
|||||||||||||||||||| 20% 2.0
Landscaping
|||||||||||||||||||| 20% 3.0
Lighting
|||||||||||||||||||| 20% 3.0
FFY2017 SNAP-Ed Annual Report 225 January 2018
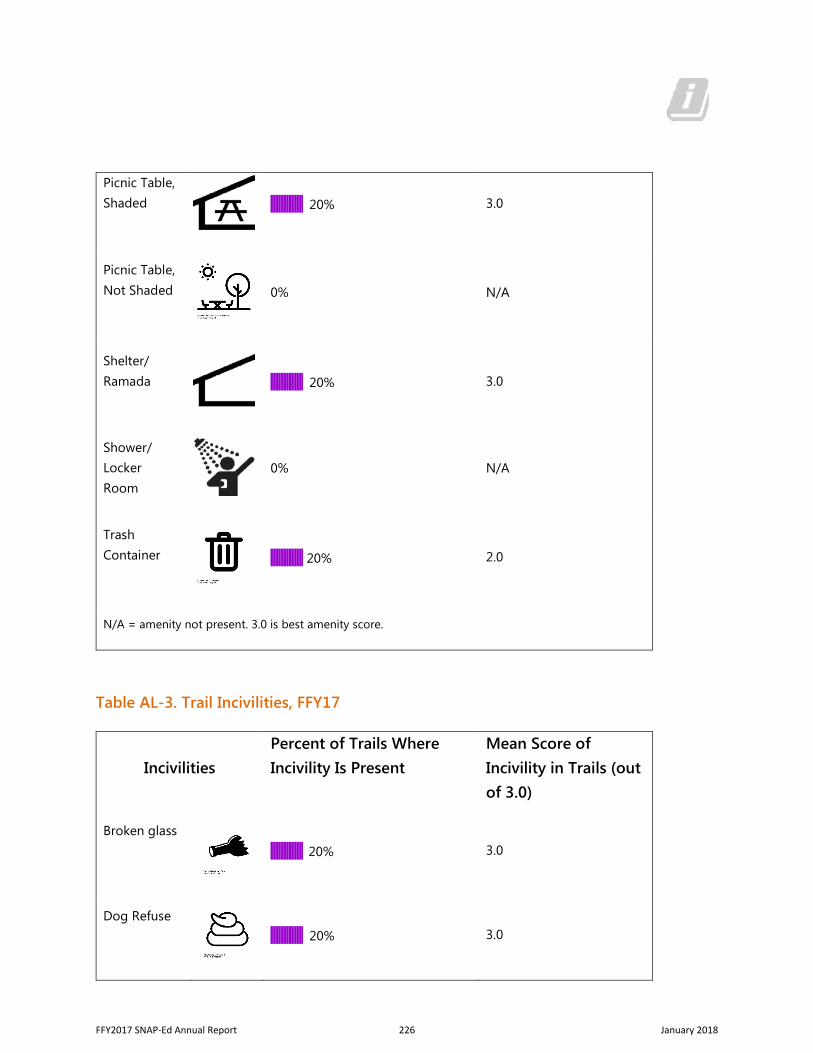
Picnic Table, Shaded |||||||||||||||||||| 20% 3.0
Picnic Table, Not Shaded 0% N/A
Shelter/ Ramada |||||||||||||||||||| 20% 3.0
Shower/ Locker Room
0% N/A
Trash Container |||||||||||||||||||| 20% 2.0
N/A = amenity not present. 3.0 is best amenity score.
Table AL-3. Trail Incivilities, FFY17
Incivilities Percent of Trails Where Incivility Is Present
Mean Score of Incivility in Trails (out of 3.0)
Broken glass |||||||||||||||||||| 20% 3.0
Dog Refuse |||||||||||||||||||| 20% 3.0
FFY2017 SNAP-Ed Annual Report 226 January 2018
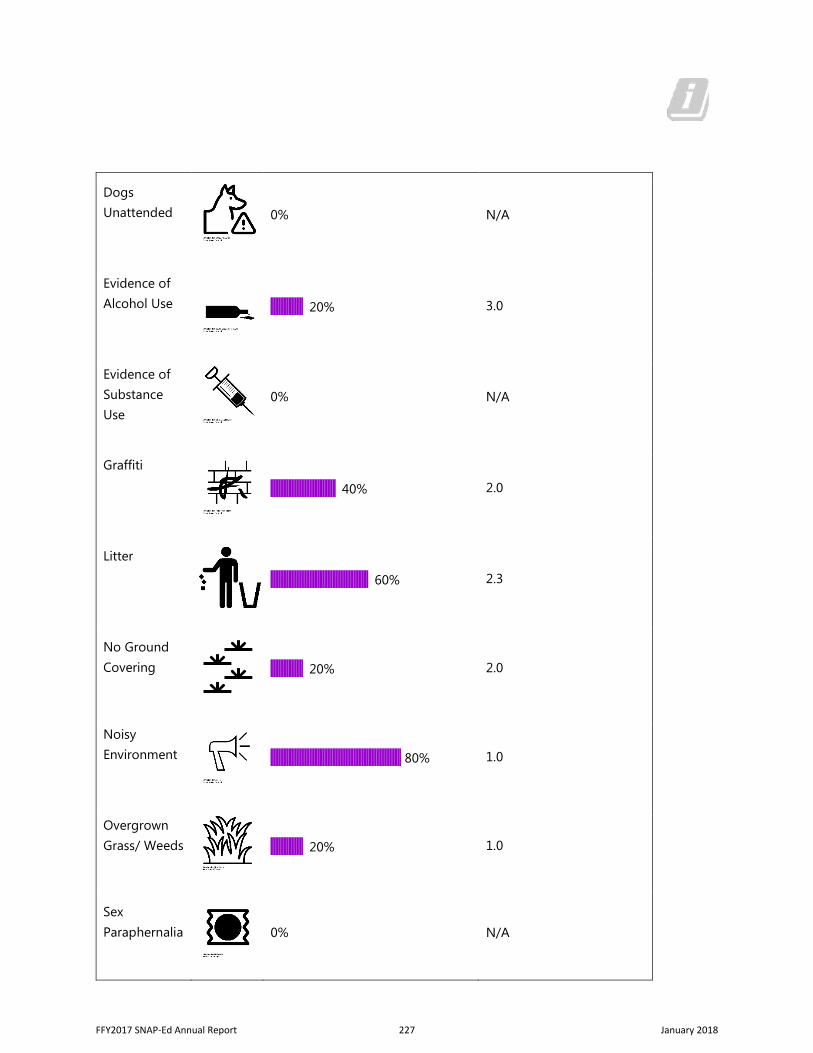
Dogs Unattended
0% N/A
Evidence of Alcohol Use
|||||||||||||||||||| 20% 3.0
Evidence of Substance Use
0% N/A
Graffiti
|||||||||||||||||||||||||||||||||||||||| 40% 2.0
Litter
|||||||||||||||||||||||||||||||||||||||||||||||||||||||||||| 60% 2.3
No Ground Covering
|||||||||||||||||||| 20% 2.0
Noisy Environment
|||||||||||||||||||||||||||||||||||||||||||||||||||||||||||||||||||||||||||||||| 80% 1.0
Overgrown Grass/ Weeds
|||||||||||||||||||| 20% 1.0
Sex Paraphernalia
0% N/A
FFY2017 SNAP-Ed Annual Report 227 January 2018
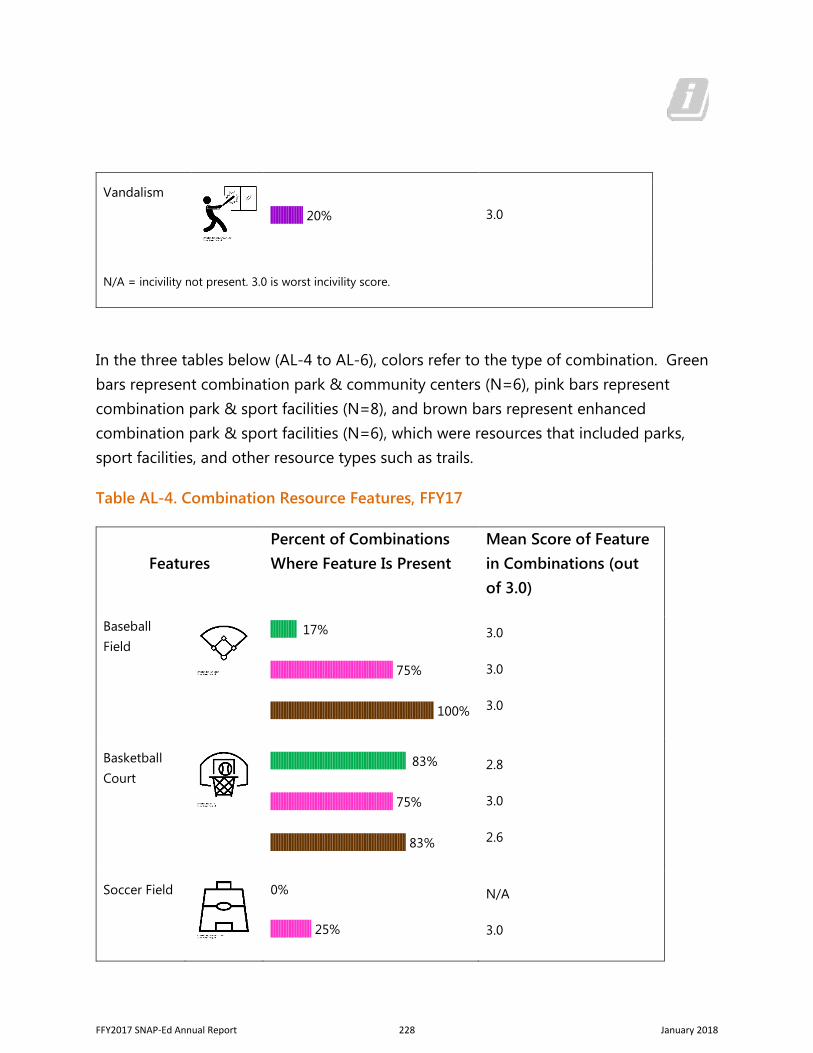
Vandalism
|||||||||||||||||||| 20% 3.0
N/A = incivility not present. 3.0 is worst incivility score.
In the three tables below (AL-4 to AL-6), colors refer to the type of combination. Green bars represent combination park & community centers (N=6), pink bars represent combination park & sport facilities (N=8), and brown bars represent enhanced combination park & sport facilities (N=6), which were resources that included parks, sport facilities, and other resource types such as trails.
Table AL-4. Combination Resource Features, FFY17
Features Percent of Combinations Where Feature Is Present
Mean Score of Feature in Combinations (out of 3.0)
Baseball Field
|||||||||||||||| 17%
||||||||||||||||||||||||||||||||||||||||||||||||||||||||||||||||||||||||||| 75%
|||||||||||||||||||||||||||||||||||||||||||||||||||||||||||||||||||||||||||||||||||||||||||||||||||| 100%
3.0
3.0
3.0
Basketball Court
||||||||||||||||||||||||||||||||||||||||||||||||||||||||||||||||||||||||||||||||||| 83%
||||||||||||||||||||||||||||||||||||||||||||||||||||||||||||||||||||||||||| 75%
||||||||||||||||||||||||||||||||||||||||||||||||||||||||||||||||||||||||||||||||||| 83%
2.8
3.0
2.6
Soccer Field 0%
||||||||||||||||||||||||| 25%
N/A
3.0
FFY2017 SNAP-Ed Annual Report 228 January 2018
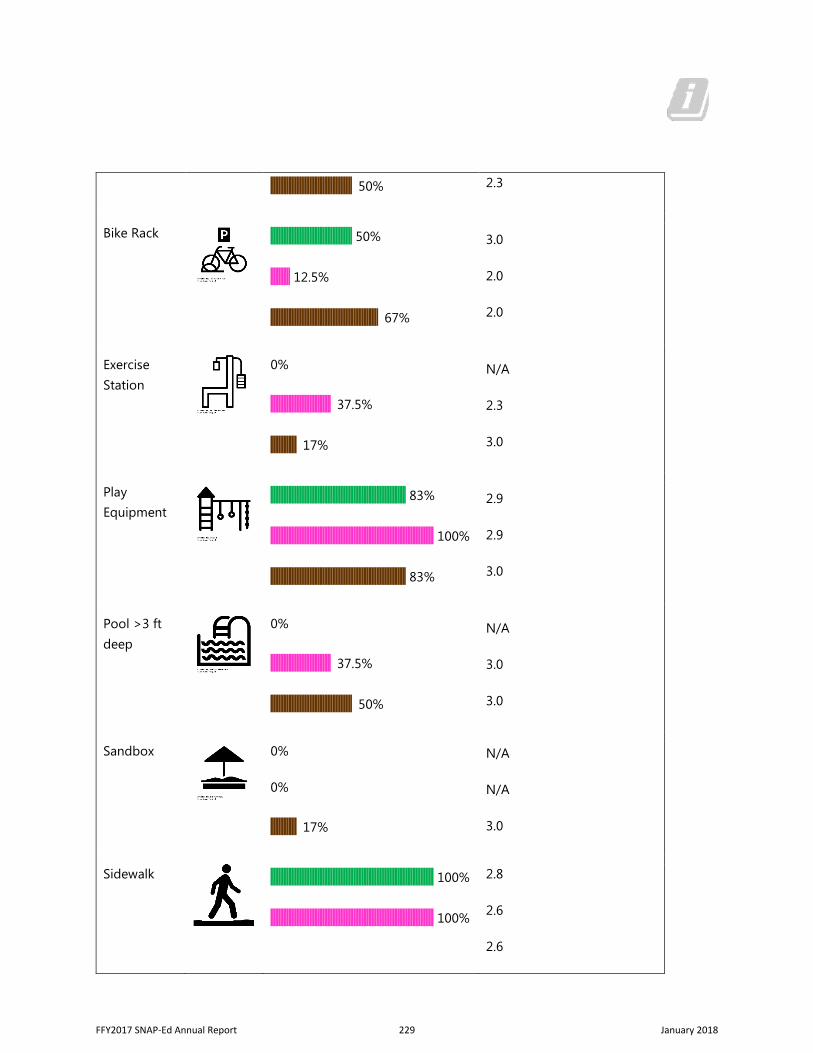
|||||||||||||||||||||||||||||||||||||||||||||||||| 50% 2.3
Bike Rack |||||||||||||||||||||||||||||||||||||||||||||||||| 50%
|||||||||||| 12.5%
|||||||||||||||||||||||||||||||||||||||||||||||||||||||||||||||||| 67%
3.0
2.0
2.0
Exercise Station
0%
||||||||||||||||||||||||||||||||||||| 37.5%
|||||||||||||||| 17%
N/A
2.3
3.0
Play Equipment
||||||||||||||||||||||||||||||||||||||||||||||||||||||||||||||||||||||||||||||||||| 83%
|||||||||||||||||||||||||||||||||||||||||||||||||||||||||||||||||||||||||||||||||||||||||||||||||||| 100%
||||||||||||||||||||||||||||||||||||||||||||||||||||||||||||||||||||||||||||||||||| 83%
2.9
2.9
3.0
Pool >3 ft deep
0%
||||||||||||||||||||||||||||||||||||| 37.5%
|||||||||||||||||||||||||||||||||||||||||||||||||| 50%
N/A
3.0
3.0
Sandbox 0%
0%
|||||||||||||||| 17%
N/A
N/A
3.0
Sidewalk |||||||||||||||||||||||||||||||||||||||||||||||||||||||||||||||||||||||||||||||||||||||||||||||||||| 100%
|||||||||||||||||||||||||||||||||||||||||||||||||||||||||||||||||||||||||||||||||||||||||||||||||||| 100%
2.8
2.6
2.6
FFY2017 SNAP-Ed Annual Report 229 January 2018
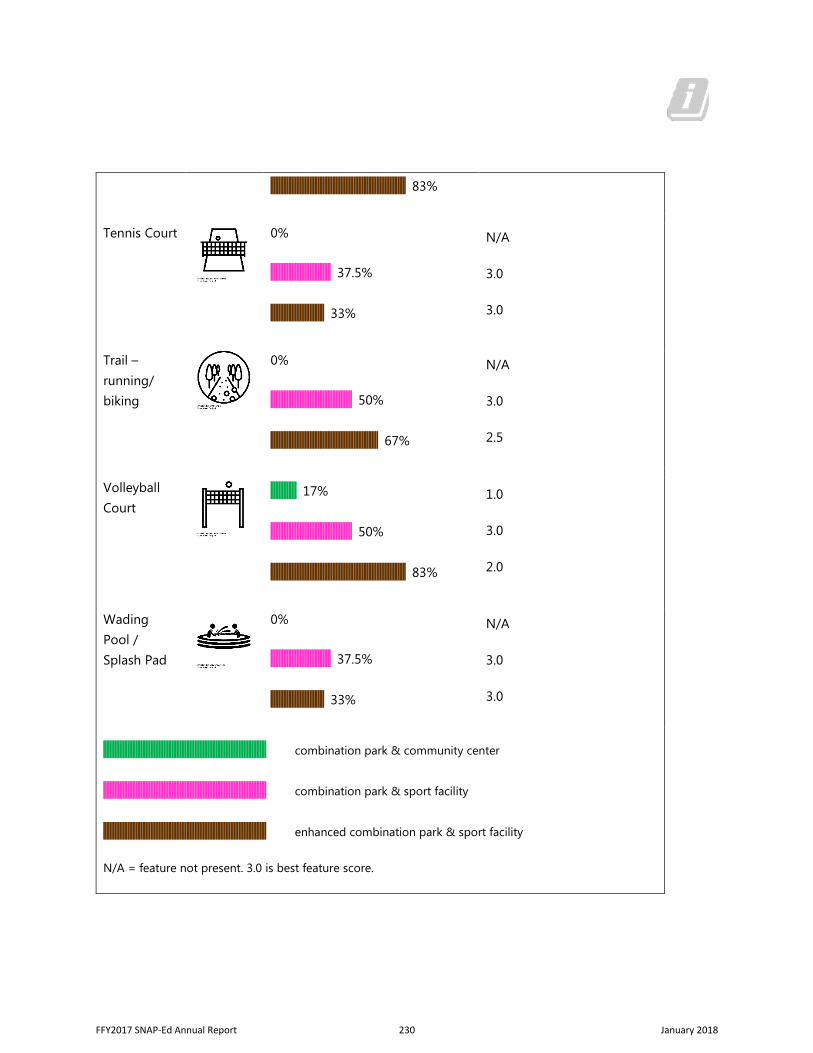
||||||||||||||||||||||||||||||||||||||||||||||||||||||||||||||||||||||||||||||||||| 83%
Tennis Court 0%
||||||||||||||||||||||||||||||||||||| 37.5%
||||||||||||||||||||||||||||||||| 33%
N/A
3.0
3.0
Trail – running/ biking
0%
|||||||||||||||||||||||||||||||||||||||||||||||||| 50%
|||||||||||||||||||||||||||||||||||||||||||||||||||||||||||||||||| 67%
N/A
3.0
2.5
Volleyball Court
|||||||||||||||| 17%
|||||||||||||||||||||||||||||||||||||||||||||||||| 50%
||||||||||||||||||||||||||||||||||||||||||||||||||||||||||||||||||||||||||||||||||| 83%
1.0
3.0
2.0
Wading Pool / Splash Pad
0%
||||||||||||||||||||||||||||||||||||| 37.5%
||||||||||||||||||||||||||||||||| 33%
N/A
3.0
3.0
|||||||||||||||||||||||||||||||||||||||||||||||||||||||||||||||||||||||||||||||||||||||||||||||||||| combination park & community center
|||||||||||||||||||||||||||||||||||||||||||||||||||||||||||||||||||||||||||||||||||||||||||||||||||| combination park & sport facility
|||||||||||||||||||||||||||||||||||||||||||||||||||||||||||||||||||||||||||||||||||||||||||||||||||| enhanced combination park & sport facility
N/A = feature not present. 3.0 is best feature score.
FFY2017 SNAP-Ed Annual Report 230 January 2018
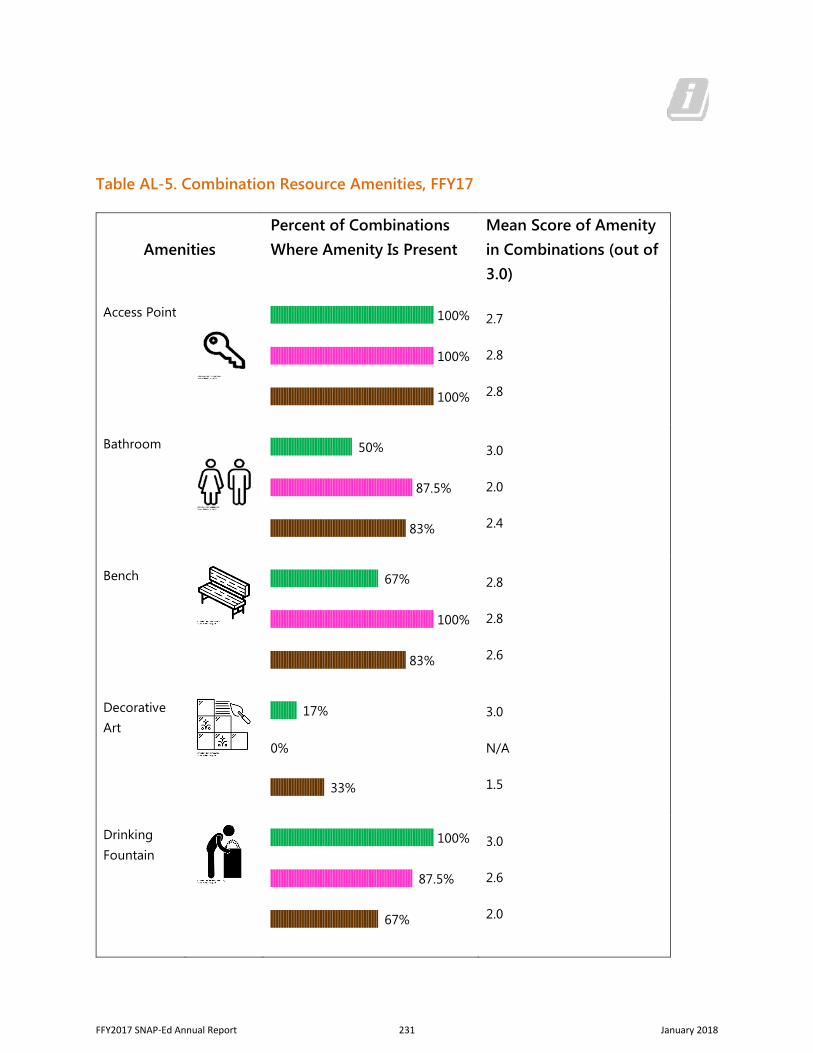
Table AL-5. Combination Resource Amenities, FFY17
Amenities Percent of Combinations Where Amenity Is Present
Mean Score of Amenity in Combinations (out of 3.0)
Access Point
|||||||||||||||||||||||||||||||||||||||||||||||||||||||||||||||||||||||||||||||||||||||||||||||||||| 100%
|||||||||||||||||||||||||||||||||||||||||||||||||||||||||||||||||||||||||||||||||||||||||||||||||||| 100%
|||||||||||||||||||||||||||||||||||||||||||||||||||||||||||||||||||||||||||||||||||||||||||||||||||| 100%
2.7
2.8
2.8
Bathroom
|||||||||||||||||||||||||||||||||||||||||||||||||| 50%
||||||||||||||||||||||||||||||||||||||||||||||||||||||||||||||||||||||||||||||||||||||| 87.5%
||||||||||||||||||||||||||||||||||||||||||||||||||||||||||||||||||||||||||||||||||| 83%
3.0
2.0
2.4
Bench
|||||||||||||||||||||||||||||||||||||||||||||||||||||||||||||||||| 67%
|||||||||||||||||||||||||||||||||||||||||||||||||||||||||||||||||||||||||||||||||||||||||||||||||||| 100%
||||||||||||||||||||||||||||||||||||||||||||||||||||||||||||||||||||||||||||||||||| 83%
2.8
2.8
2.6
Decorative Art
|||||||||||||||| 17%
0%
||||||||||||||||||||||||||||||||| 33%
3.0
N/A
1.5
Drinking Fountain
|||||||||||||||||||||||||||||||||||||||||||||||||||||||||||||||||||||||||||||||||||||||||||||||||||| 100%
||||||||||||||||||||||||||||||||||||||||||||||||||||||||||||||||||||||||||||||||||||||| 87.5%
|||||||||||||||||||||||||||||||||||||||||||||||||||||||||||||||||| 67%
3.0
2.6
2.0
FFY2017 SNAP-Ed Annual Report 231 January 2018
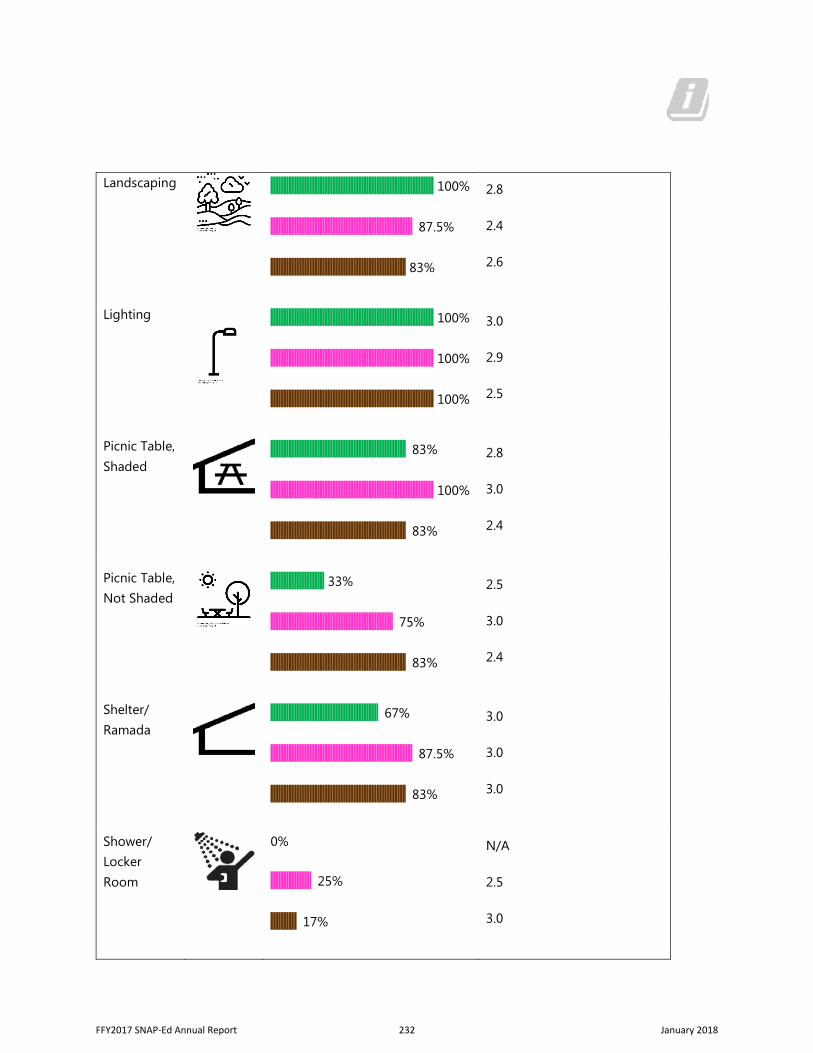
Landscaping
|||||||||||||||||||||||||||||||||||||||||||||||||||||||||||||||||||||||||||||||||||||||||||||||||||| 100%
||||||||||||||||||||||||||||||||||||||||||||||||||||||||||||||||||||||||||||||||||||||| 87.5%
||||||||||||||||||||||||||||||||||||||||||||||||||||||||||||||||||||||||||||||||||| 83%
2.8
2.4
2.6
Lighting
|||||||||||||||||||||||||||||||||||||||||||||||||||||||||||||||||||||||||||||||||||||||||||||||||||| 100%
|||||||||||||||||||||||||||||||||||||||||||||||||||||||||||||||||||||||||||||||||||||||||||||||||||| 100%
|||||||||||||||||||||||||||||||||||||||||||||||||||||||||||||||||||||||||||||||||||||||||||||||||||| 100%
3.0
2.9
2.5
Picnic Table, Shaded
||||||||||||||||||||||||||||||||||||||||||||||||||||||||||||||||||||||||||||||||||| 83%
|||||||||||||||||||||||||||||||||||||||||||||||||||||||||||||||||||||||||||||||||||||||||||||||||||| 100%
||||||||||||||||||||||||||||||||||||||||||||||||||||||||||||||||||||||||||||||||||| 83%
2.8
3.0
2.4
Picnic Table, Not Shaded
||||||||||||||||||||||||||||||||| 33%
||||||||||||||||||||||||||||||||||||||||||||||||||||||||||||||||||||||||||| 75%
||||||||||||||||||||||||||||||||||||||||||||||||||||||||||||||||||||||||||||||||||| 83%
2.5
3.0
2.4
Shelter/ Ramada
|||||||||||||||||||||||||||||||||||||||||||||||||||||||||||||||||| 67%
||||||||||||||||||||||||||||||||||||||||||||||||||||||||||||||||||||||||||||||||||||||| 87.5%
||||||||||||||||||||||||||||||||||||||||||||||||||||||||||||||||||||||||||||||||||| 83%
3.0
3.0
3.0
Shower/ Locker Room
0%
||||||||||||||||||||||||| 25%
|||||||||||||||| 17%
N/A
2.5
3.0
FFY2017 SNAP-Ed Annual Report 232 January 2018
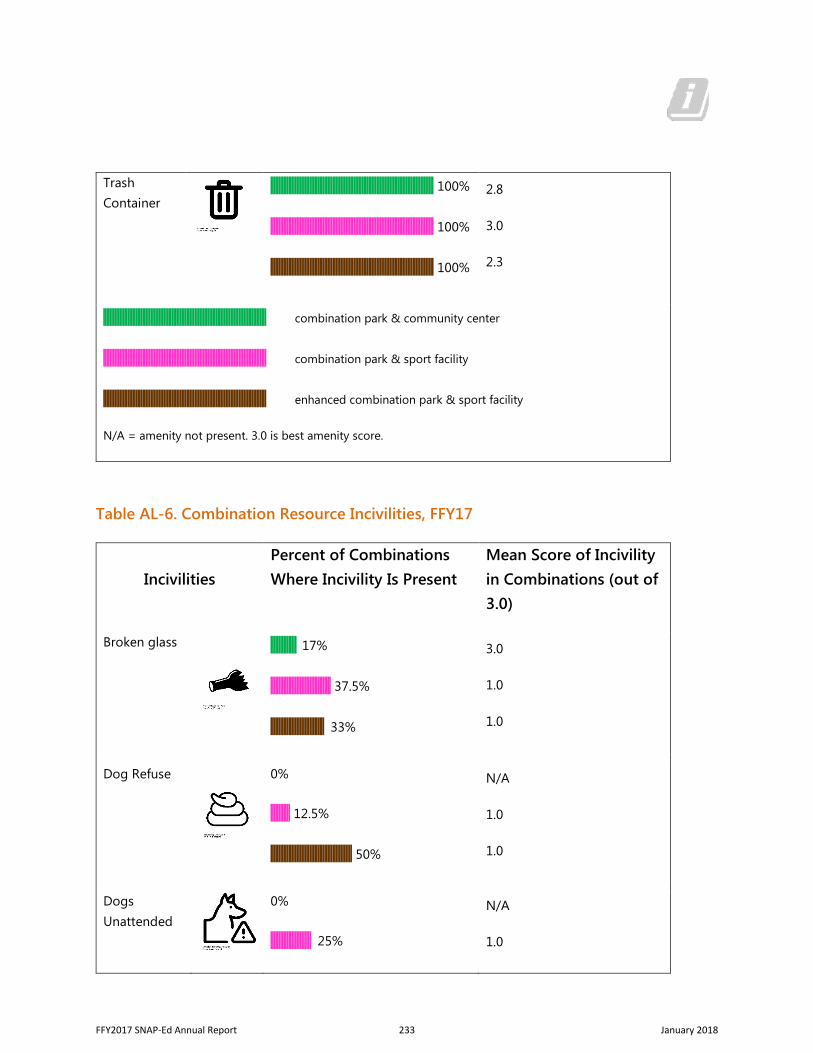
Trash Container
|||||||||||||||||||||||||||||||||||||||||||||||||||||||||||||||||||||||||||||||||||||||||||||||||||| 100%
|||||||||||||||||||||||||||||||||||||||||||||||||||||||||||||||||||||||||||||||||||||||||||||||||||| 100%
|||||||||||||||||||||||||||||||||||||||||||||||||||||||||||||||||||||||||||||||||||||||||||||||||||| 100%
2.8
3.0
2.3
|||||||||||||||||||||||||||||||||||||||||||||||||||||||||||||||||||||||||||||||||||||||||||||||||||| combination park & community center
|||||||||||||||||||||||||||||||||||||||||||||||||||||||||||||||||||||||||||||||||||||||||||||||||||| combination park & sport facility
|||||||||||||||||||||||||||||||||||||||||||||||||||||||||||||||||||||||||||||||||||||||||||||||||||| enhanced combination park & sport facility
N/A = amenity not present. 3.0 is best amenity score.
Table AL-6. Combination Resource Incivilities, FFY17
Incivilities Percent of Combinations Where Incivility Is Present
Mean Score of Incivility in Combinations (out of 3.0)
Broken glass
|||||||||||||||| 17%
||||||||||||||||||||||||||||||||||||| 37.5%
||||||||||||||||||||||||||||||||| 33%
3.0
1.0
1.0
Dog Refuse
0%
|||||||||||| 12.5%
|||||||||||||||||||||||||||||||||||||||||||||||||| 50%
N/A
1.0
1.0
Dogs Unattended
0%
||||||||||||||||||||||||| 25%
N/A
1.0
FFY2017 SNAP-Ed Annual Report 233 January 2018
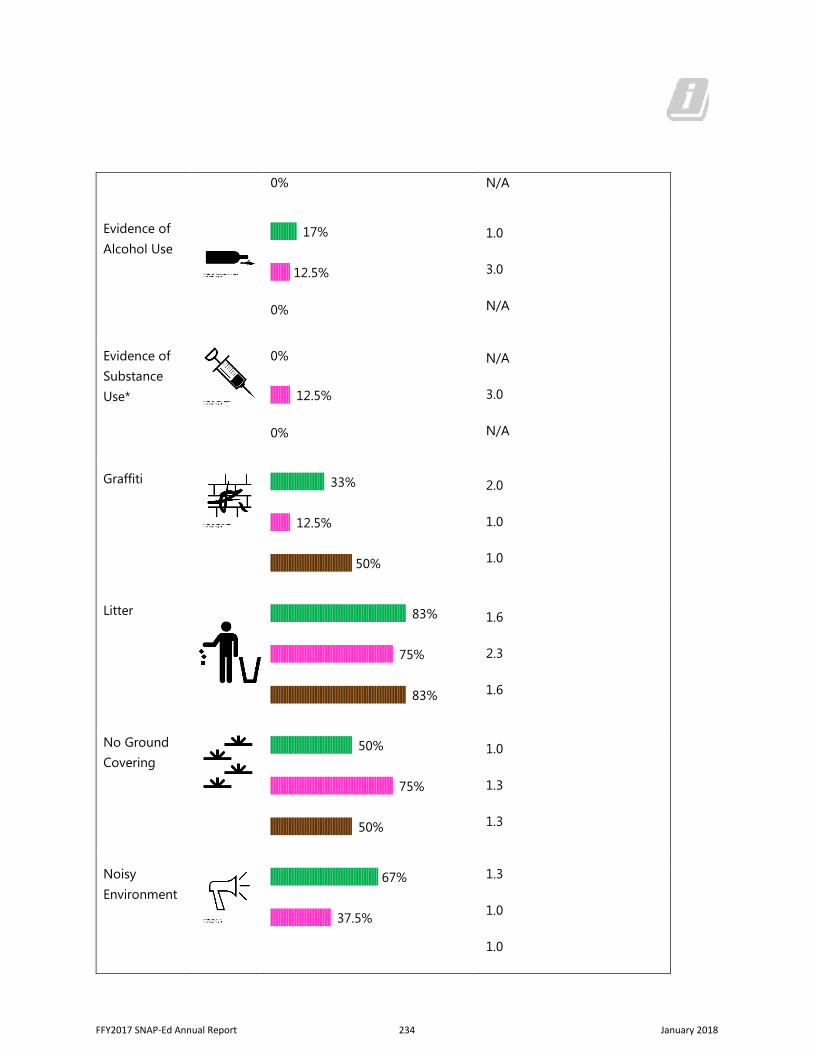
0% N/A
Evidence of Alcohol Use
|||||||||||||||| 17%
|||||||||||| 12.5%
0%
1.0
3.0
N/A
Evidence of Substance Use*
0%
|||||||||||| 12.5%
0%
N/A
3.0
N/A
Graffiti ||||||||||||||||||||||||||||||||| 33%
|||||||||||| 12.5%
|||||||||||||||||||||||||||||||||||||||||||||||||| 50%
2.0
1.0
1.0
Litter ||||||||||||||||||||||||||||||||||||||||||||||||||||||||||||||||||||||||||||||||||| 83%
||||||||||||||||||||||||||||||||||||||||||||||||||||||||||||||||||||||||||| 75%
||||||||||||||||||||||||||||||||||||||||||||||||||||||||||||||||||||||||||||||||||| 83%
1.6
2.3
1.6
No Ground Covering
|||||||||||||||||||||||||||||||||||||||||||||||||| 50%
||||||||||||||||||||||||||||||||||||||||||||||||||||||||||||||||||||||||||| 75%
|||||||||||||||||||||||||||||||||||||||||||||||||| 50%
1.0
1.3
1.3
Noisy Environment
|||||||||||||||||||||||||||||||||||||||||||||||||||||||||||||||||| 67%
||||||||||||||||||||||||||||||||||||| 37.5%
1.3
1.0
1.0
FFY2017 SNAP-Ed Annual Report 234 January 2018
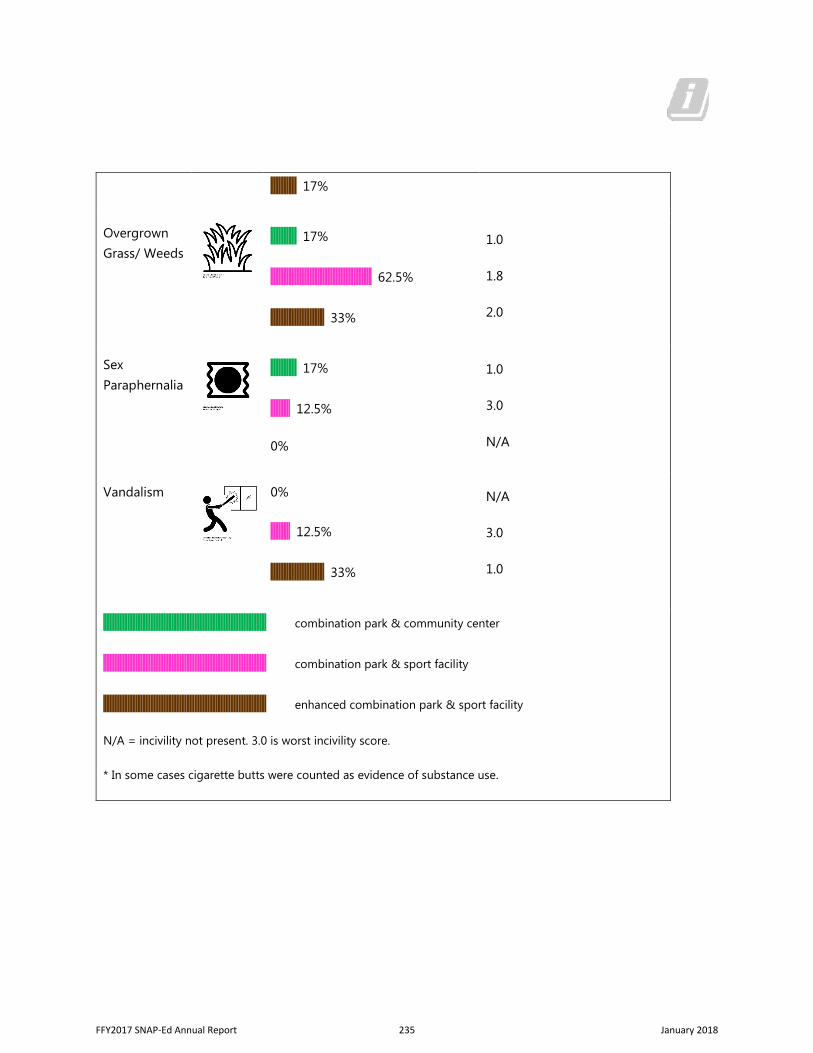
|||||||||||||||| 17%
Overgrown Grass/ Weeds
|||||||||||||||| 17%
|||||||||||||||||||||||||||||||||||||||||||||||||||||||||||||| 62.5%
||||||||||||||||||||||||||||||||| 33%
1.0
1.8
2.0
Sex Paraphernalia
|||||||||||||||| 17%
|||||||||||| 12.5%
0%
1.0
3.0
N/A
Vandalism
0%
|||||||||||| 12.5%
||||||||||||||||||||||||||||||||| 33%
N/A
3.0
1.0
|||||||||||||||||||||||||||||||||||||||||||||||||||||||||||||||||||||||||||||||||||||||||||||||||||| combination park & community center
|||||||||||||||||||||||||||||||||||||||||||||||||||||||||||||||||||||||||||||||||||||||||||||||||||| combination park & sport facility
|||||||||||||||||||||||||||||||||||||||||||||||||||||||||||||||||||||||||||||||||||||||||||||||||||| enhanced combination park & sport facility
N/A = incivility not present. 3.0 is worst incivility score.
* In some cases cigarette butts were counted as evidence of substance use.
FFY2017 SNAP-Ed Annual Report 235 January 2018
Appendix D: KAN-Q SURVEY
The following is a sample of the Kids’ Activity and Nutrition Questionnaire (KAN-Q). Any questions regarding use of the KAN-Q should be directed to Theresa LeGros of the University of Arizona’s SNAP-Ed Evaluation Team at [email protected], 520-626-8766.
FFY2017 SNAP-Ed Annual Report 236 January 2018
FFY2017 SNAP-Ed Annual Report 237 January 2018
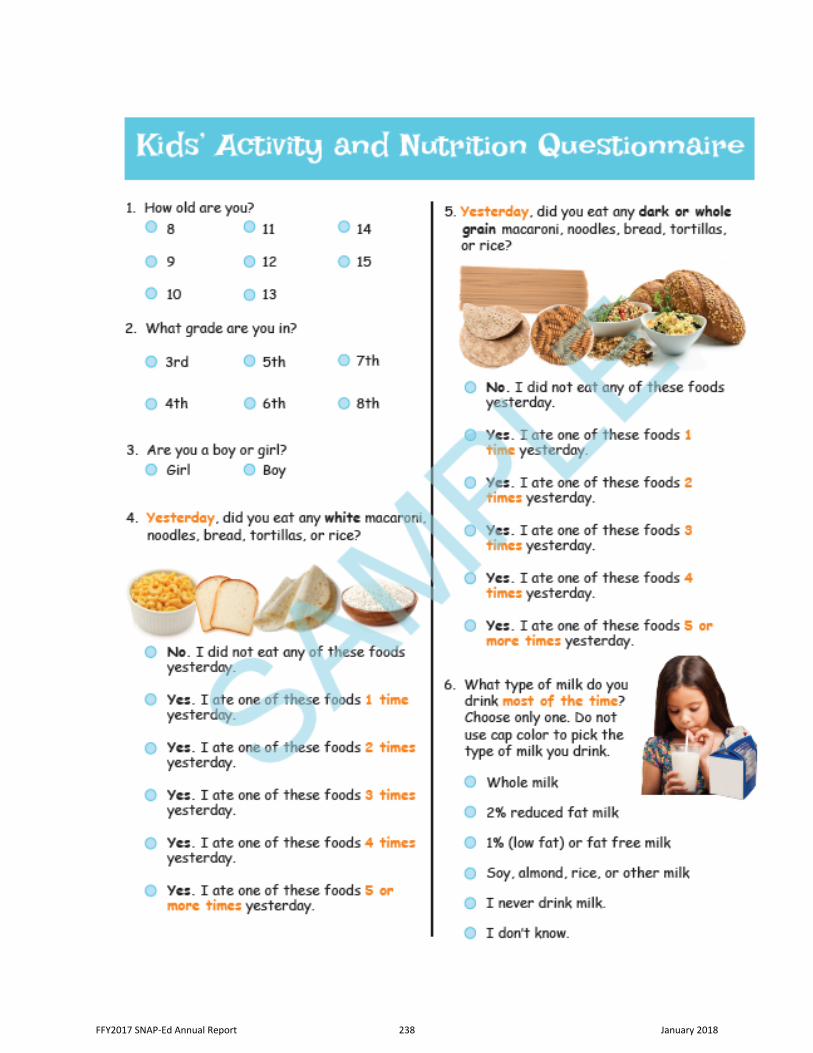
FFY2017 SNAP-Ed Annual Report 238 January 2018
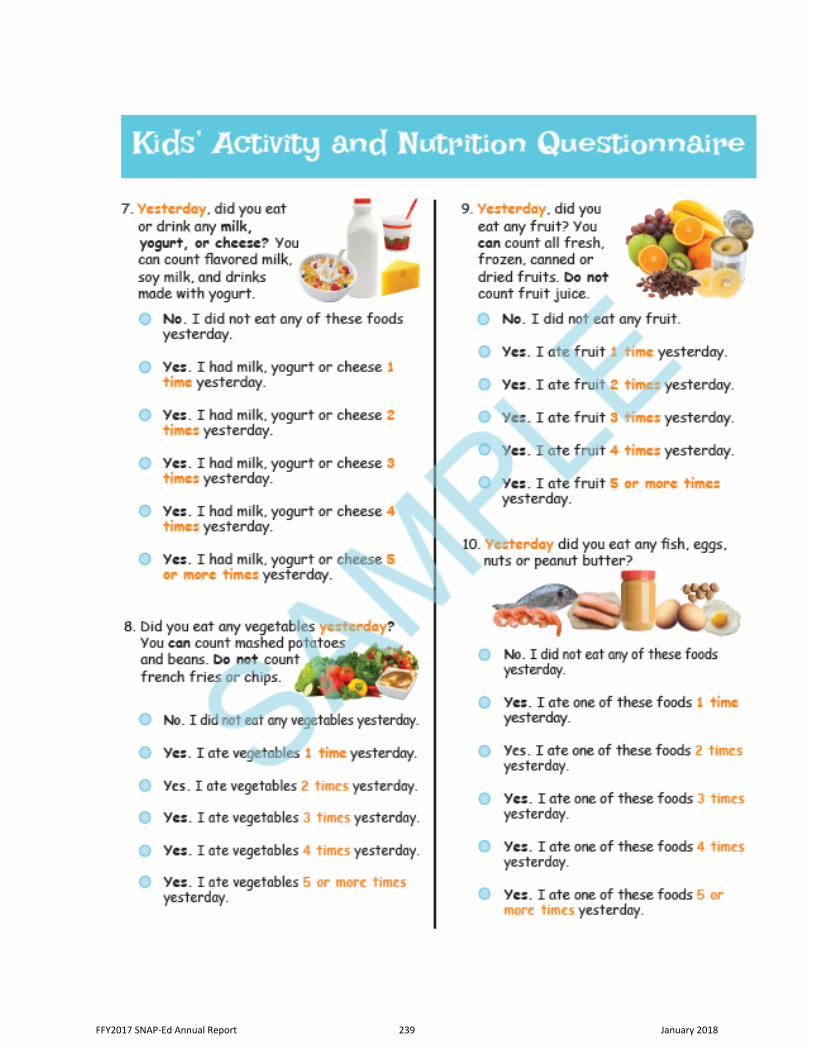
FFY2017 SNAP-Ed Annual Report 239 January 2018
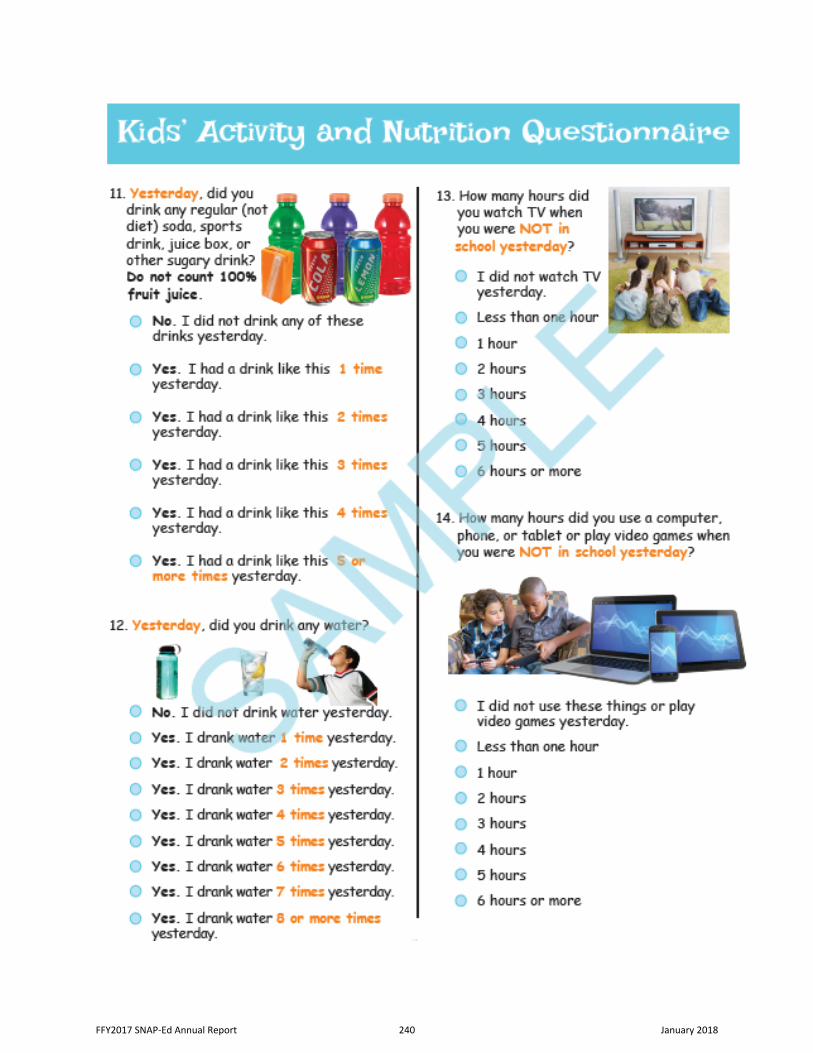
FFY2017 SNAP-Ed Annual Report 240 January 2018
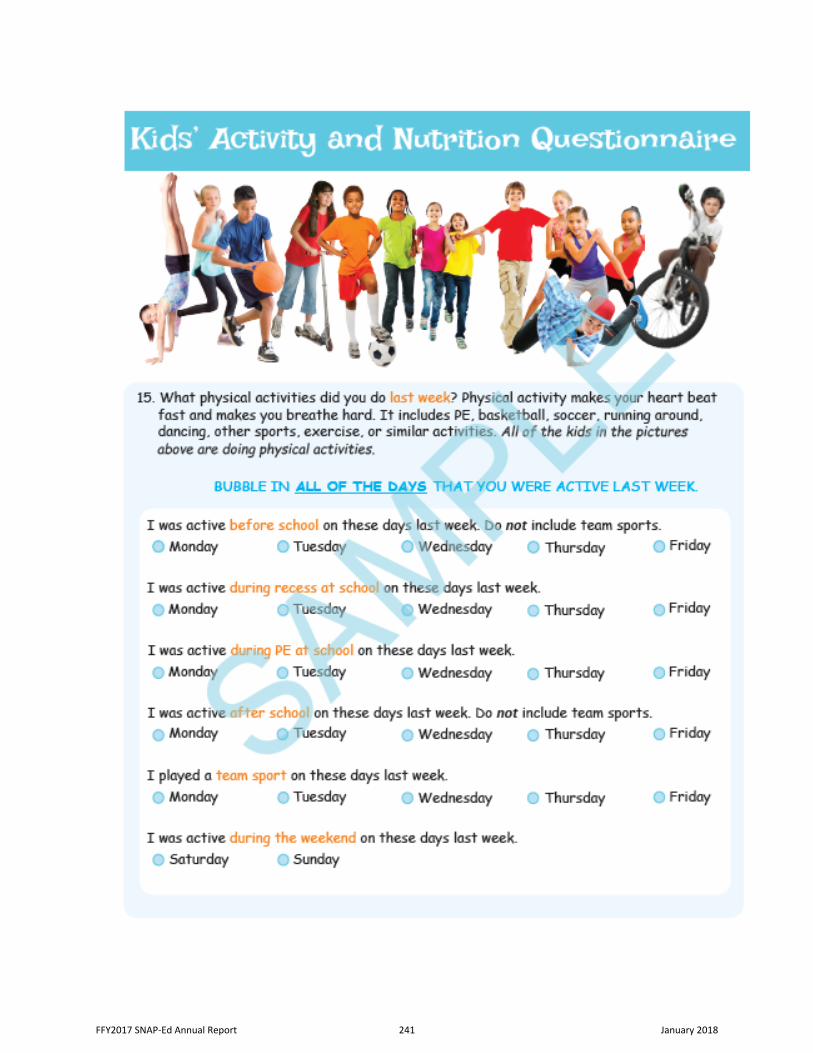
FFY2017 SNAP-Ed Annual Report 241 January 2018
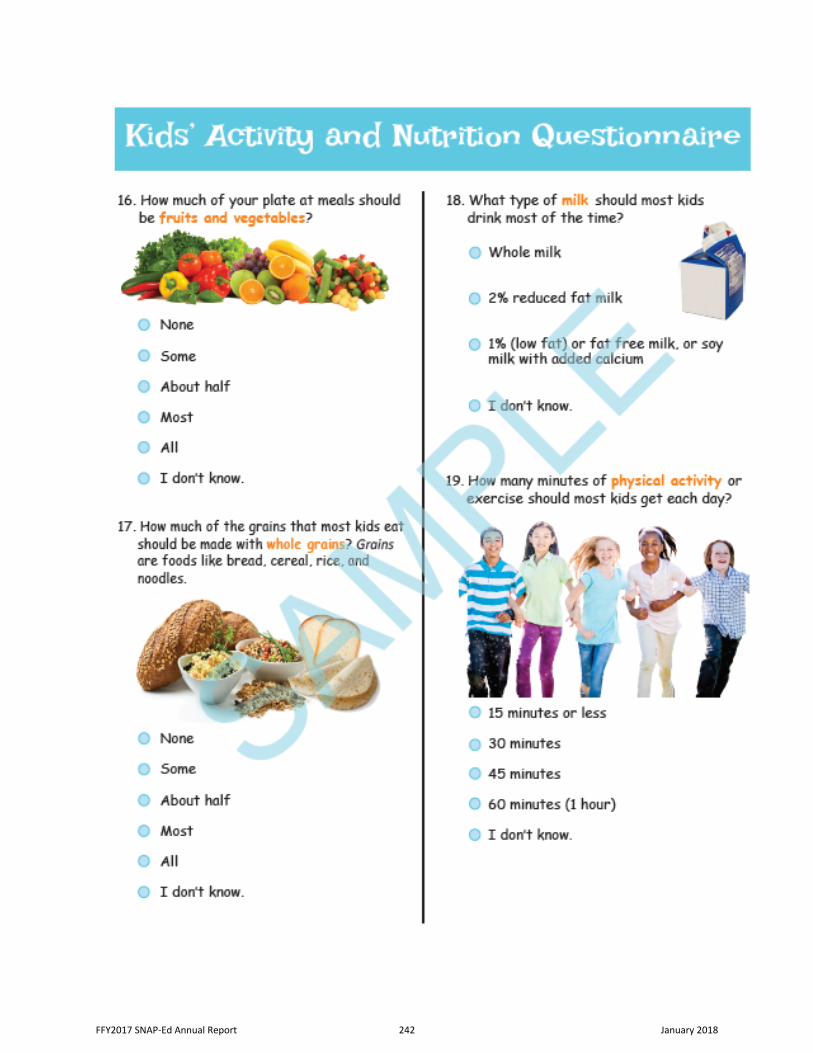
FFY2017 SNAP-Ed Annual Report 242 January 2018
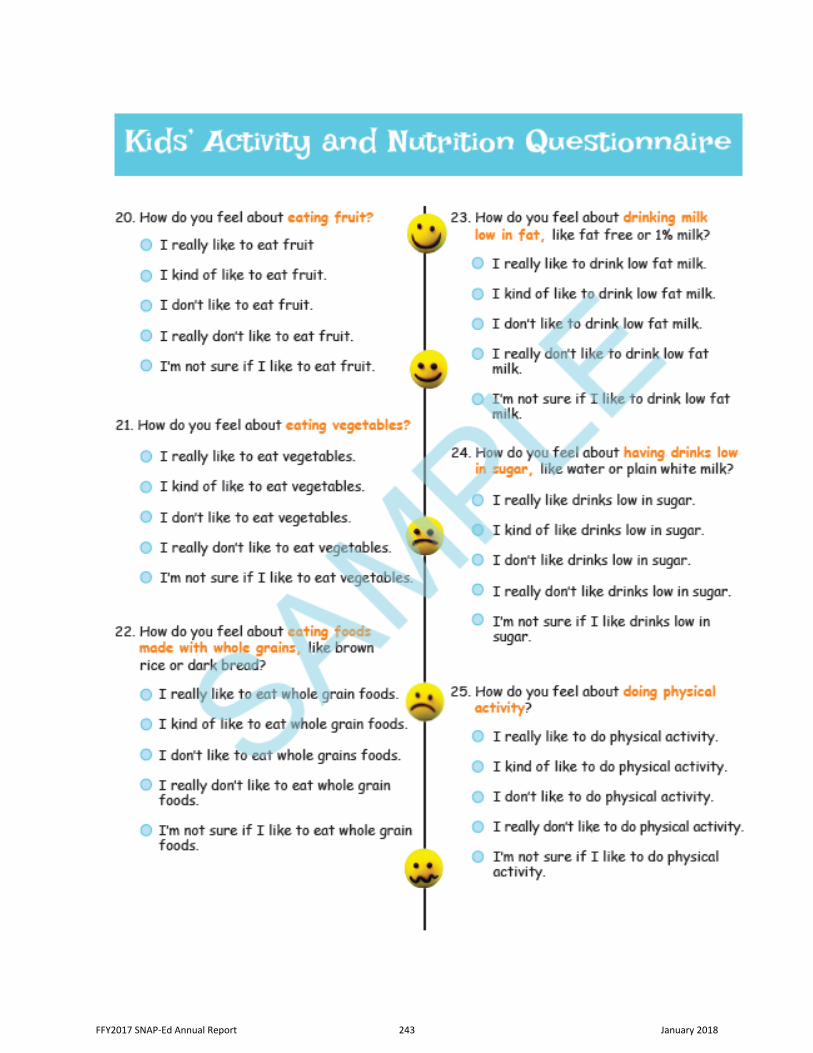
FFY2017 SNAP-Ed Annual Report 243 January 2018
FFY2017 SNAP-Ed Annual Report 244 January 2018
Appendix C
Partner Support and Services Report
FFY2017 SNAP-Ed Annual Report 245 January 2018
FFY2017 SNAP-Ed Annual Report 246 January 2018
Table of Contents
Table of Contents .......................................................................................................................................................2
Background .................................................................................................................................................................3
Methods .....................................................................................................................................................................3
Key Findings ................................................................................................................................................................4
Participants .............................................................................................................................................................4
Services and Support ..............................................................................................................................................5
Planning and Implementation ................................................................................................................................7
Technical Assistance from the State Implementation Team ..................................................................................9
Technical Assistance from the State Evaluation Team ........................................................................................ 11
Training ................................................................................................................................................................ 13
Communication ................................................................................................................................................... 14
Social Marketing .................................................................................................................................................. 17
Limitations ............................................................................................................................................................... 17
Recommendations ................................................................................................................................................... 18
Communication ................................................................................................................................................... 18
Training ................................................................................................................................................................ 18
Implementation ................................................................................................................................................... 19
Conclusion ............................................................................................................................................................... 19
Appendix A .............................................................................................................................................................. 20
FFY2017 SNAP-Ed Annual Report 247 January 2018
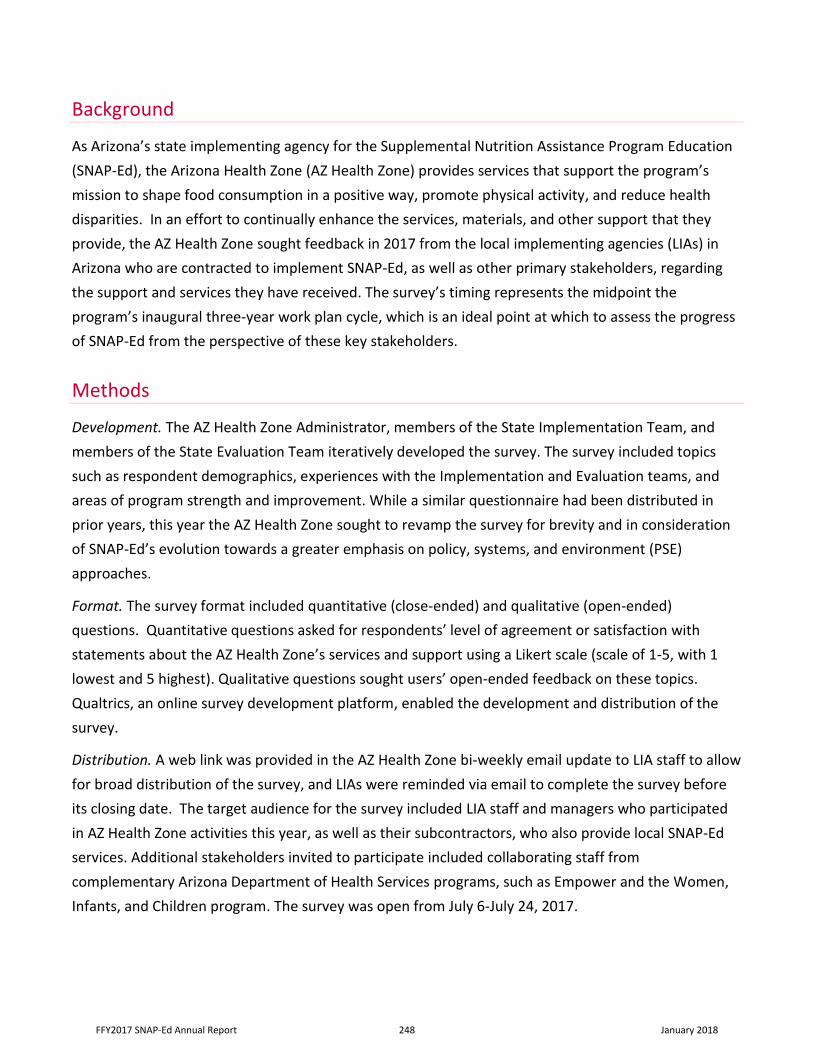
Background
As Arizona’s state implementing agency for the Supplemental Nutrition Assistance Program Education
(SNAP-Ed), the Arizona Health Zone (AZ Health Zone) provides services that support the program’s
mission to shape food consumption in a positive way, promote physical activity, and reduce health
disparities. In an effort to continually enhance the services, materials, and other support that they
provide, the AZ Health Zone sought feedback in 2017 from the local implementing agencies (LIAs) in
Arizona who are contracted to implement SNAP-Ed, as well as other primary stakeholders, regarding
the support and services they have received. The survey’s timing represents the midpoint the
program’s inaugural three-year work plan cycle, which is an ideal point at which to assess the progress
of SNAP-Ed from the perspective of these key stakeholders.
Methods
Development. The AZ Health Zone Administrator, members of the State Implementation Team, and
members of the State Evaluation Team iteratively developed the survey. The survey included topics
such as respondent demographics, experiences with the Implementation and Evaluation teams, and
areas of program strength and improvement. While a similar questionnaire had been distributed in
prior years, this year the AZ Health Zone sought to revamp the survey for brevity and in consideration
of SNAP-Ed’s evolution towards a greater emphasis on policy, systems, and environment (PSE)
approaches.
Format. The survey format included quantitative (close-ended) and qualitative (open-ended)
questions. Quantitative questions asked for respondents’ level of agreement or satisfaction with
statements about the AZ Health Zone’s services and support using a Likert scale (scale of 1-5, with 1
lowest and 5 highest). Qualitative questions sought users’ open-ended feedback on these topics.
Qualtrics, an online survey development platform, enabled the development and distribution of the
survey.
Distribution. A web link was provided in the AZ Health Zone bi-weekly email update to LIA staff to allow
for broad distribution of the survey, and LIAs were reminded via email to complete the survey before
its closing date. The target audience for the survey included LIA staff and managers who participated
in AZ Health Zone activities this year, as well as their subcontractors, who also provide local SNAP-Ed
services. Additional stakeholders invited to participate included collaborating staff from
complementary Arizona Department of Health Services programs, such as Empower and the Women,
Infants, and Children program. The survey was open from July 6-July 24, 2017.
FFY2017 SNAP-Ed Annual Report 248 January 2018
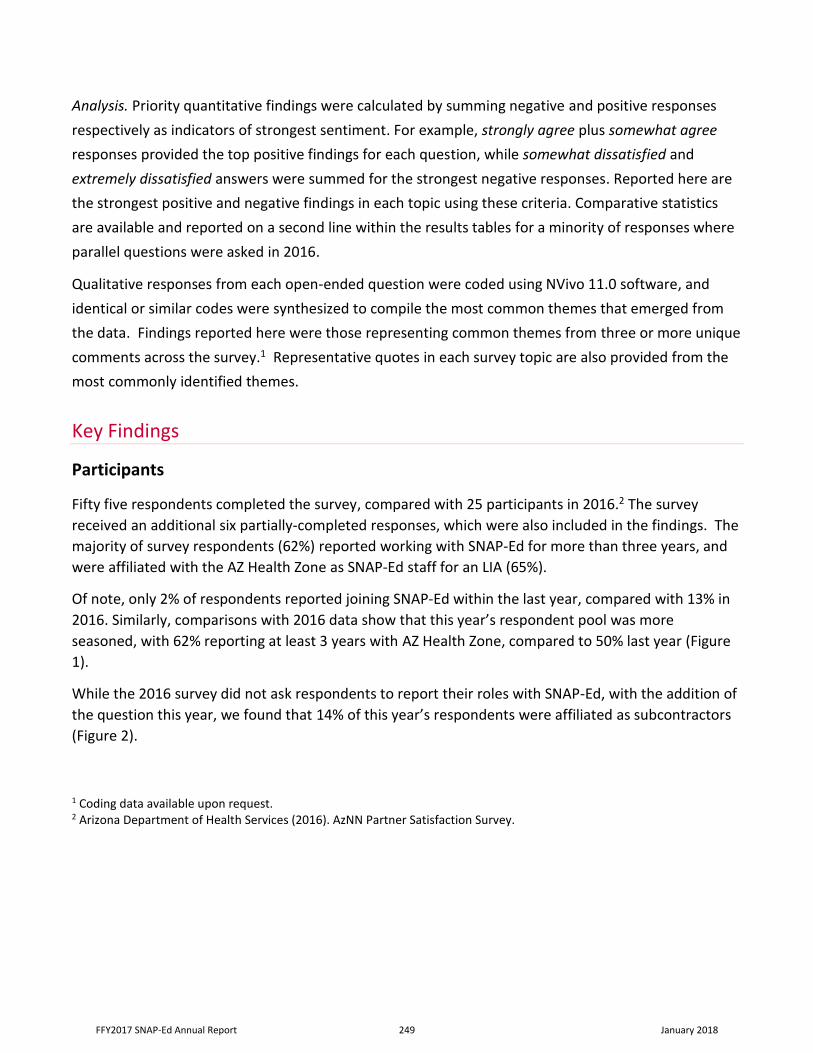
Analysis. Priority quantitative findings were calculated by summing negative and positive responses
respectively as indicators of strongest sentiment. For example, strongly agree plus somewhat agree
responses provided the top positive findings for each question, while somewhat dissatisfied and
extremely dissatisfied answers were summed for the strongest negative responses. Reported here are
the strongest positive and negative findings in each topic using these criteria. Comparative statistics
are available and reported on a second line within the results tables for a minority of responses where
parallel questions were asked in 2016.
Qualitative responses from each open-ended question were coded using NVivo 11.0 software, and
identical or similar codes were synthesized to compile the most common themes that emerged from
the data. Findings reported here were those representing common themes from three or more unique
comments across the survey.1 Representative quotes in each survey topic are also provided from the
most commonly identified themes.
Key Findings
Participants
Fifty five respondents completed the survey, compared with 25 participants in 2016.2 The survey
received an additional six partially-completed responses, which were also included in the findings. The
majority of survey respondents (62%) reported working with SNAP-Ed for more than three years, and
were affiliated with the AZ Health Zone as SNAP-Ed staff for an LIA (65%).
Of note, only 2% of respondents reported joining SNAP-Ed within the last year, compared with 13% in
2016. Similarly, comparisons with 2016 data show that this year’s respondent pool was more
seasoned, with 62% reporting at least 3 years with AZ Health Zone, compared to 50% last year (Figure
1).
While the 2016 survey did not ask respondents to report their roles with SNAP-Ed, with the addition of
the question this year, we found that 14% of this year’s respondents were affiliated as subcontractors
(Figure 2).
1 Coding data available upon request. 2 Arizona Department of Health Services (2016). AzNN Partner Satisfaction Survey.
FFY2017 SNAP-Ed Annual Report 249 January 2018
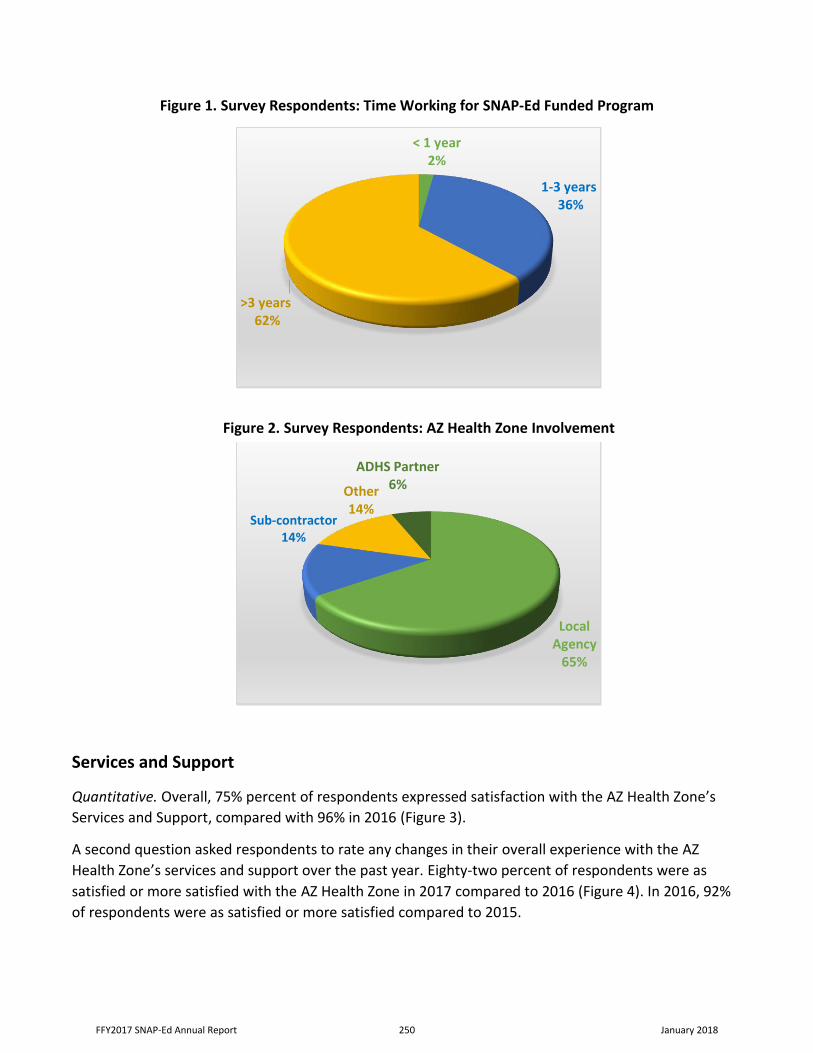
Figure 1. Survey Respondents: Time Working for SNAP-Ed Funded Program
Figure 2. Survey Respondents: AZ Health Zone Involvement
Services and Support
Quantitative. Overall, 75% percent of respondents expressed satisfaction with the AZ Health Zone’s
Services and Support, compared with 96% in 2016 (Figure 3).
A second question asked respondents to rate any changes in their overall experience with the AZ
Health Zone’s services and support over the past year. Eighty-two percent of respondents were as
satisfied or more satisfied with the AZ Health Zone in 2017 compared to 2016 (Figure 4). In 2016, 92%
of respondents were as satisfied or more satisfied compared to 2015.
< 1 year2%
1-3 years36%
>3 years62%
Local Agency
65%
Sub-contractor14%
Other14%
ADHS Partner6%
FFY2017 SNAP-Ed Annual Report 250 January 2018
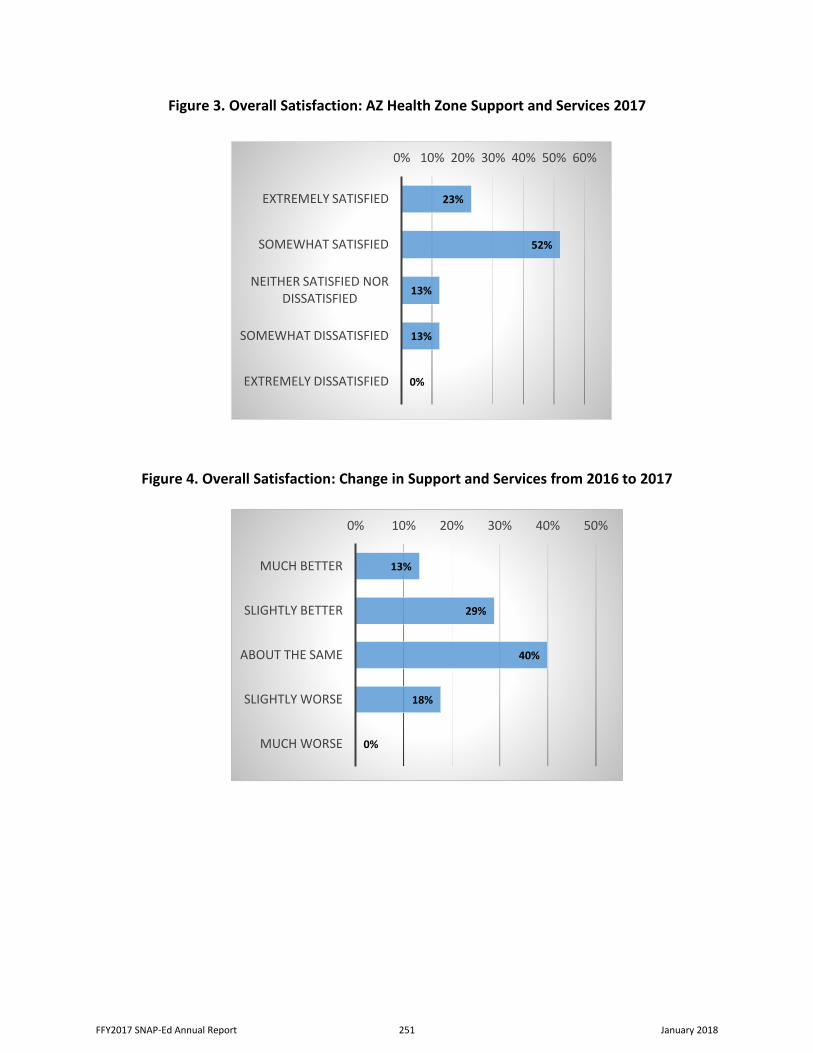
Figure 3. Overall Satisfaction: AZ Health Zone Support and Services 2017
Figure 4. Overall Satisfaction: Change in Support and Services from 2016 to 2017
13%
29%
40%
18%
0%
MUCH BETTER
SLIGHTLY BETTER
ABOUT THE SAME
SLIGHTLY WORSE
MUCH WORSE
0% 10% 20% 30% 40% 50%
23%
52%
13%
13%
0%
0% 10% 20% 30% 40% 50% 60%
EXTREMELY SATISFIED
SOMEWHAT SATISFIED
NEITHER SATISFIED NOR DISSATISFIED
SOMEWHAT DISSATISFIED
EXTREMELY DISSATISFIED
FFY2017 SNAP-Ed Annual Report 251 January 2018
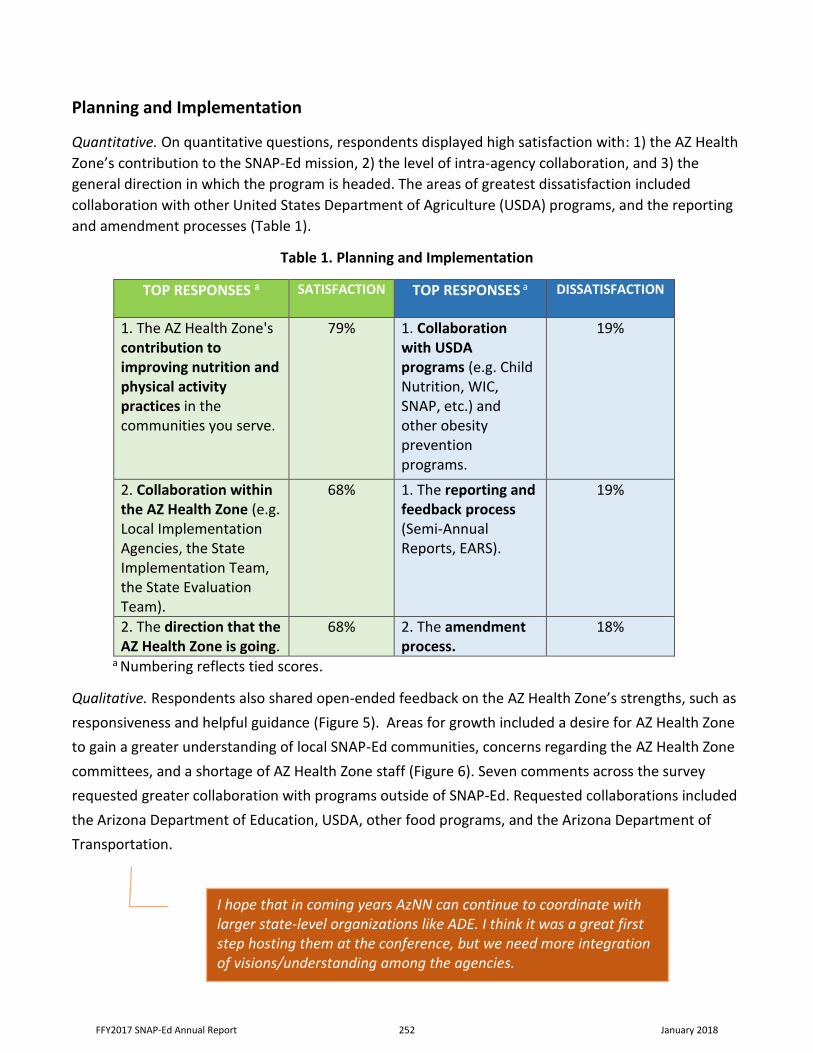
Planning and Implementation
Quantitative. On quantitative questions, respondents displayed high satisfaction with: 1) the AZ Health
Zone’s contribution to the SNAP-Ed mission, 2) the level of intra-agency collaboration, and 3) the
general direction in which the program is headed. The areas of greatest dissatisfaction included
collaboration with other United States Department of Agriculture (USDA) programs, and the reporting
and amendment processes (Table 1).
Table 1. Planning and Implementation
TOP RESPONSES a SATISFACTION
TOP RESPONSES a DISSATISFACTION
1. The AZ Health Zone's contribution to improving nutrition and physical activity practices in the communities you serve.
79%
1. Collaboration with USDA programs (e.g. Child Nutrition, WIC, SNAP, etc.) and other obesity prevention programs.
19%
2. Collaboration within the AZ Health Zone (e.g. Local Implementation Agencies, the State Implementation Team, the State Evaluation Team).
68%
1. The reporting and feedback process (Semi-Annual Reports, EARS).
19%
2. The direction that the AZ Health Zone is going.
68% 2. The amendment process.
18%
a Numbering reflects tied scores.
Qualitative. Respondents also shared open-ended feedback on the AZ Health Zone’s strengths, such as
responsiveness and helpful guidance (Figure 5). Areas for growth included a desire for AZ Health Zone
to gain a greater understanding of local SNAP-Ed communities, concerns regarding the AZ Health Zone
committees, and a shortage of AZ Health Zone staff (Figure 6). Seven comments across the survey
requested greater collaboration with programs outside of SNAP-Ed. Requested collaborations included
the Arizona Department of Education, USDA, other food programs, and the Arizona Department of
Transportation.
I hope that in coming years AzNN can continue to coordinate with larger state-level organizations like ADE. I think it was a great first step hosting them at the conference, but we need more integration of visions/understanding among the agencies.
FFY2017 SNAP-Ed Annual Report 252 January 2018
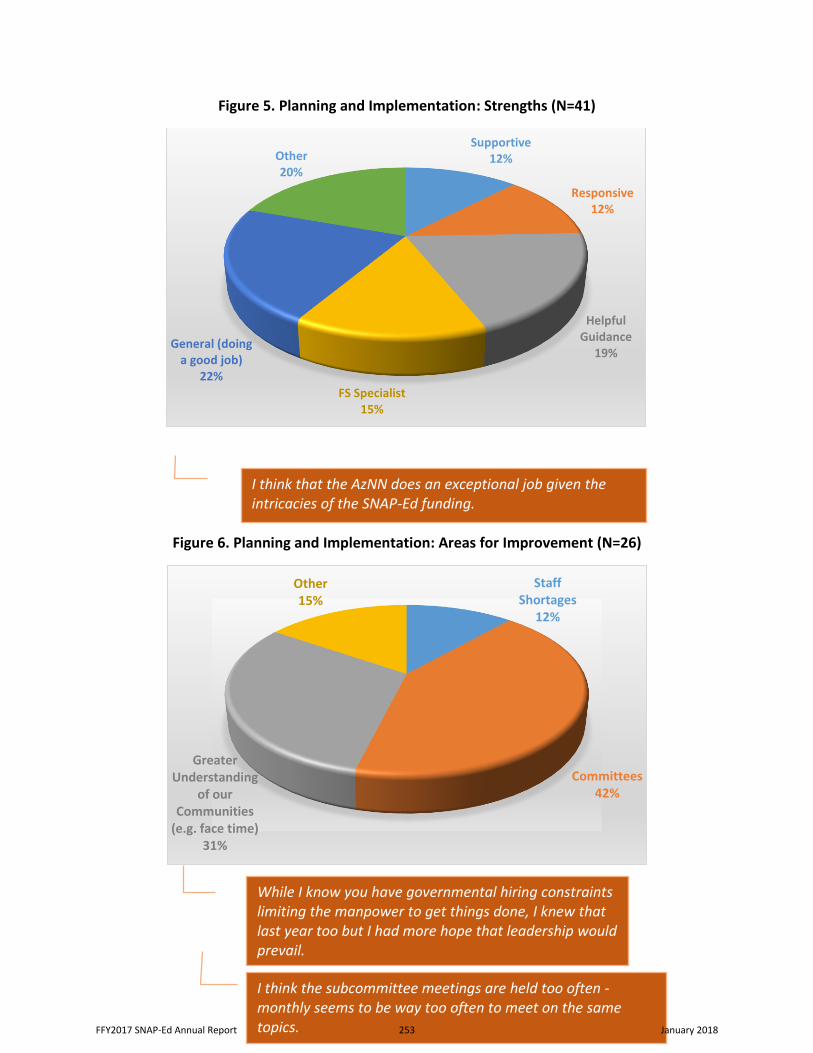
Figure 5. Planning and Implementation: Strengths (N=41)
Figure 6. Planning and Implementation: Areas for Improvement (N=26)
Supportive12%
Responsive 12%
Helpful Guidance
19%
FS Specialist15%
General (doing a good job)
22%
Other20%
I think that the AzNN does an exceptional job given the intricacies of the SNAP-Ed funding.
I think the subcommittee meetings are held too often - monthly seems to be way too often to meet on the same topics.
Staff Shortages
12%
Committees42%
Greater Understanding
of our Communities
(e.g. face time)31%
Other15%
While I know you have governmental hiring constraints limiting the manpower to get things done, I knew that last year too but I had more hope that leadership would prevail.
FFY2017 SNAP-Ed Annual Report 253 January 2018
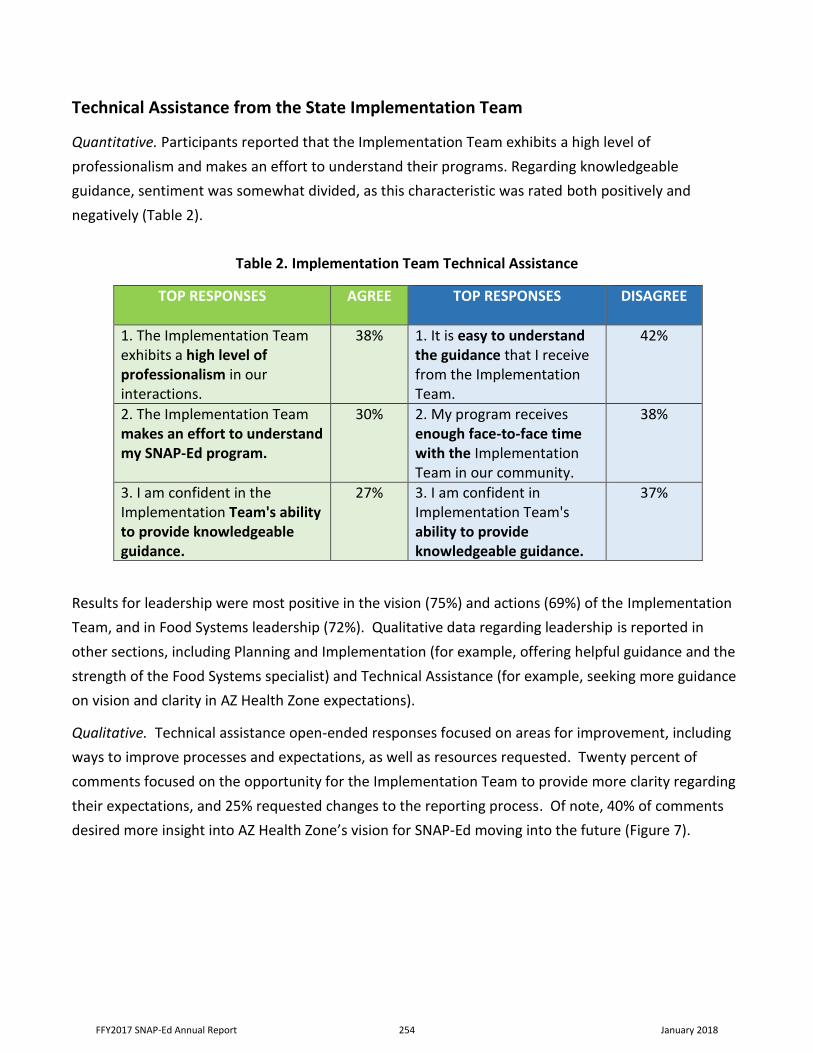
Technical Assistance from the State Implementation Team
Quantitative. Participants reported that the Implementation Team exhibits a high level of
professionalism and makes an effort to understand their programs. Regarding knowledgeable
guidance, sentiment was somewhat divided, as this characteristic was rated both positively and
negatively (Table 2).
Table 2. Implementation Team Technical Assistance
TOP RESPONSES AGREE TOP RESPONSES DISAGREE
1. The Implementation Teamexhibits a high level ofprofessionalism in ourinteractions.
38% 1. It is easy to understandthe guidance that I receivefrom the ImplementationTeam.
42%
2. The Implementation Teammakes an effort to understandmy SNAP-Ed program.
30% 2. My program receivesenough face-to-face timewith the ImplementationTeam in our community.
38%
3. I am confident in theImplementation Team's abilityto provide knowledgeableguidance.
27% 3. I am confident inImplementation Team'sability to provideknowledgeable guidance.
37%
Results for leadership were most positive in the vision (75%) and actions (69%) of the Implementation
Team, and in Food Systems leadership (72%). Qualitative data regarding leadership is reported in
other sections, including Planning and Implementation (for example, offering helpful guidance and the
strength of the Food Systems specialist) and Technical Assistance (for example, seeking more guidance
on vision and clarity in AZ Health Zone expectations).
Qualitative. Technical assistance open-ended responses focused on areas for improvement, including
ways to improve processes and expectations, as well as resources requested. Twenty percent of
comments focused on the opportunity for the Implementation Team to provide more clarity regarding
their expectations, and 25% requested changes to the reporting process. Of note, 40% of comments
desired more insight into AZ Health Zone’s vision for SNAP-Ed moving into the future (Figure 7).
FFY2017 SNAP-Ed Annual Report 254 January 2018
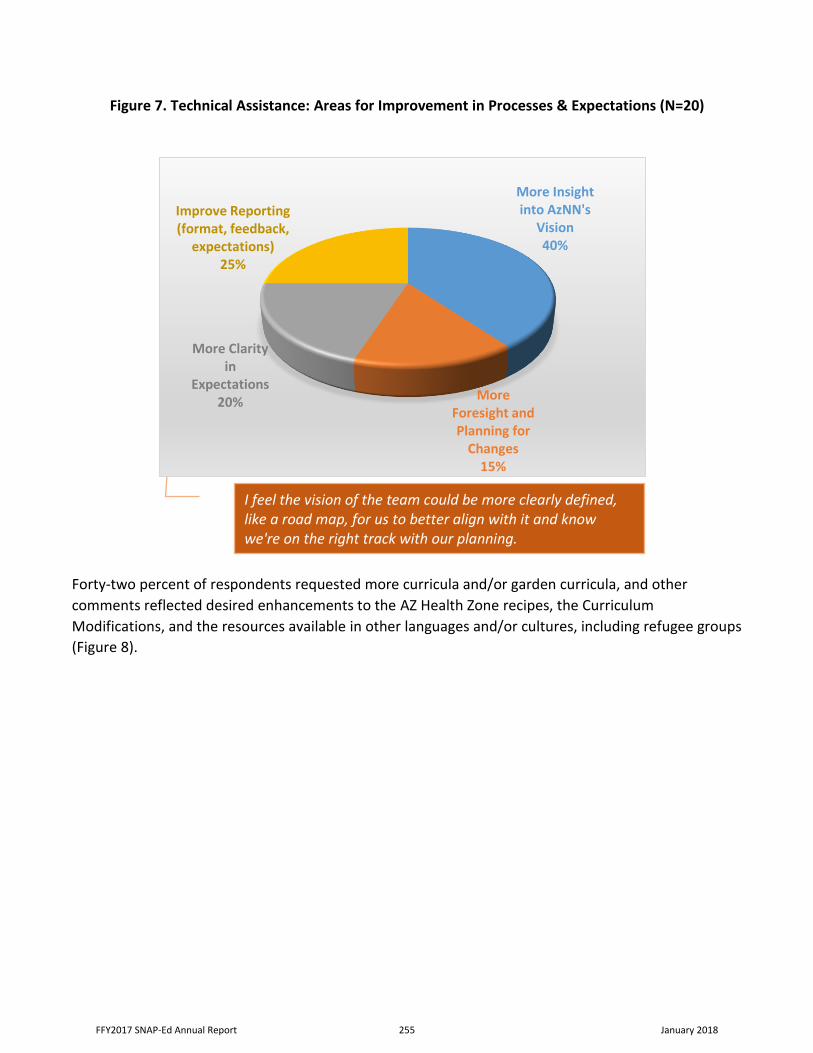
Figure 7. Technical Assistance: Areas for Improvement in Processes & Expectations (N=20)
Forty-two percent of respondents requested more curricula and/or garden curricula, and other
comments reflected desired enhancements to the AZ Health Zone recipes, the Curriculum
Modifications, and the resources available in other languages and/or cultures, including refugee groups
(Figure 8).
I feel the vision of the team could be more clearly defined, like a road map, for us to better align with it and know we're on the right track with our planning.
More Insight into AzNN's
Vision40%
More Foresight and Planning for
Changes15%
More Clarity in
Expectations20%
Improve Reporting (format, feedback,
expectations) 25%
FFY2017 SNAP-Ed Annual Report 255 January 2018
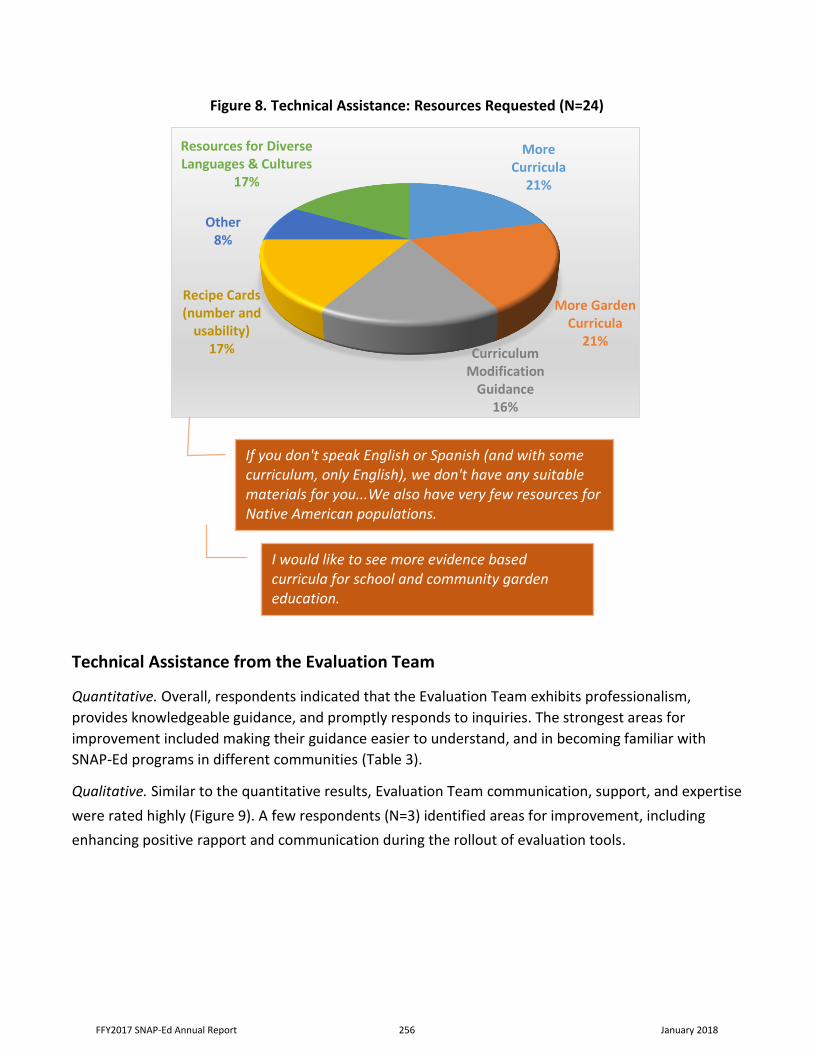
Figure 8. Technical Assistance: Resources Requested (N=24)
Technical Assistance from the Evaluation Team
Quantitative. Overall, respondents indicated that the Evaluation Team exhibits professionalism,
provides knowledgeable guidance, and promptly responds to inquiries. The strongest areas for
improvement included making their guidance easier to understand, and in becoming familiar with
SNAP-Ed programs in different communities (Table 3).
Qualitative. Similar to the quantitative results, Evaluation Team communication, support, and expertise
were rated highly (Figure 9). A few respondents (N=3) identified areas for improvement, including
enhancing positive rapport and communication during the rollout of evaluation tools.
More Curricula
21%
More Garden Curricula
21%Curriculum
Modification Guidance
16%
Recipe Cards (number and
usability)17%
Other8%
Resources for Diverse Languages & Cultures
17%
If you don't speak English or Spanish (and with some curriculum, only English), we don't have any suitable materials for you...We also have very few resources for Native American populations.
I would like to see more evidence based curricula for school and community garden education.
FFY2017 SNAP-Ed Annual Report 256 January 2018
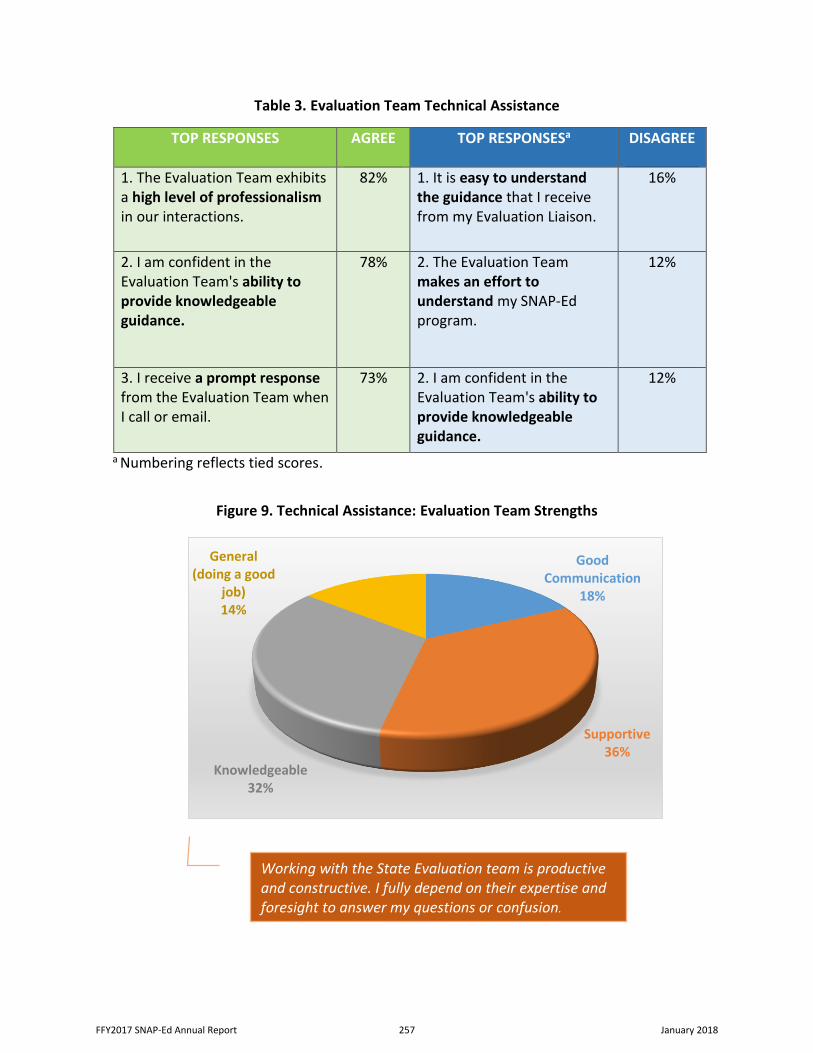
Table 3. Evaluation Team Technical Assistance
TOP RESPONSES AGREE TOP RESPONSESa DISAGREE
1. The Evaluation Team exhibitsa high level of professionalismin our interactions.
82% 1. It is easy to understandthe guidance that I receivefrom my Evaluation Liaison.
16%
2. I am confident in theEvaluation Team's ability toprovide knowledgeableguidance.
78% 2. The Evaluation Teammakes an effort tounderstand my SNAP-Edprogram.
12%
3. I receive a prompt responsefrom the Evaluation Team whenI call or email.
73% 2. I am confident in theEvaluation Team's ability toprovide knowledgeableguidance.
12%
a Numbering reflects tied scores.
Figure 9. Technical Assistance: Evaluation Team Strengths
Working with the State Evaluation team is productive and constructive. I fully depend on their expertise and foresight to answer my questions or confusion.
Good Communication
18%
Supportive36%
Knowledgeable32%
General (doing a good
job)14%
FFY2017 SNAP-Ed Annual Report 257 January 2018
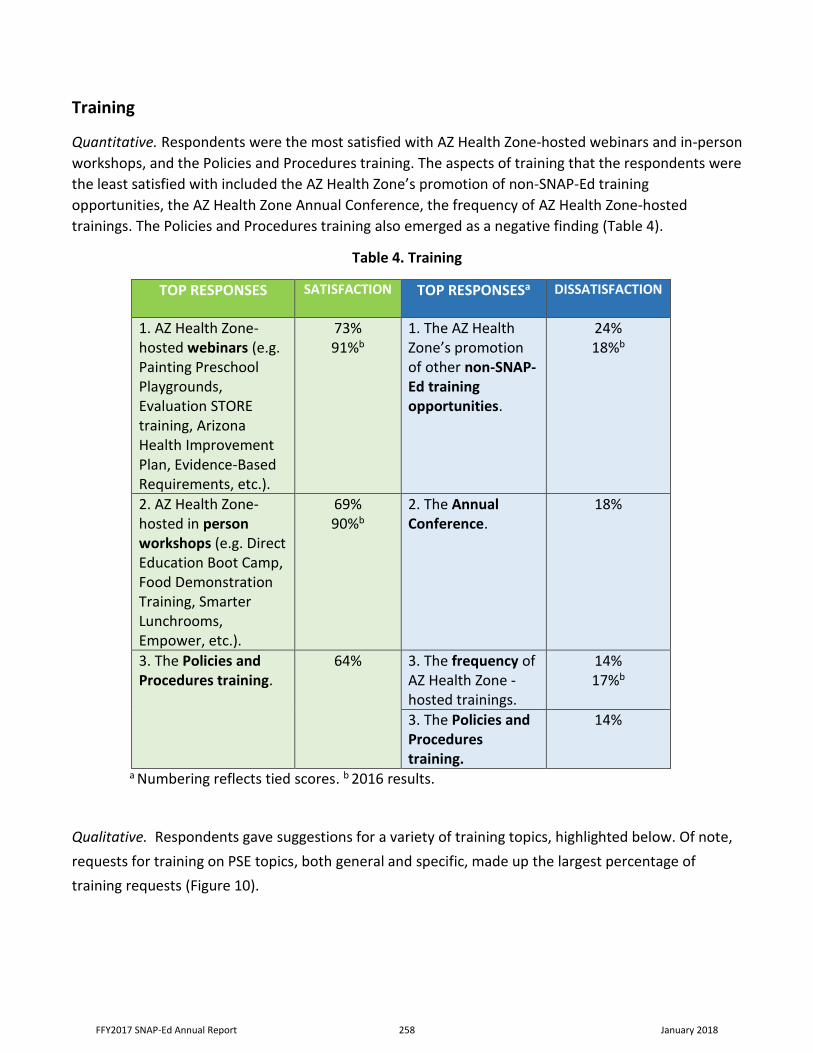
Training
Quantitative. Respondents were the most satisfied with AZ Health Zone-hosted webinars and in-person
workshops, and the Policies and Procedures training. The aspects of training that the respondents were
the least satisfied with included the AZ Health Zone’s promotion of non-SNAP-Ed training
opportunities, the AZ Health Zone Annual Conference, the frequency of AZ Health Zone-hosted
trainings. The Policies and Procedures training also emerged as a negative finding (Table 4).
Table 4. Training
TOP RESPONSES SATISFACTION TOP RESPONSESa DISSATISFACTION
1. AZ Health Zone-hosted webinars (e.g.Painting PreschoolPlaygrounds,Evaluation STOREtraining, ArizonaHealth ImprovementPlan, Evidence-BasedRequirements, etc.).
73% 91%b
1. The AZ HealthZone’s promotionof other non-SNAP-Ed trainingopportunities.
24% 18%b
2. AZ Health Zone-hosted in personworkshops (e.g. DirectEducation Boot Camp,Food DemonstrationTraining, SmarterLunchrooms,Empower, etc.).
69% 90%b
2. The AnnualConference.
18%
3. The Policies andProcedures training.
64% 3. The frequency ofAZ Health Zone -hosted trainings.
14% 17%b
3. The Policies andProcedurestraining.
14%
a Numbering reflects tied scores. b 2016 results.
Qualitative. Respondents gave suggestions for a variety of training topics, highlighted below. Of note,
requests for training on PSE topics, both general and specific, made up the largest percentage of
training requests (Figure 10).
FFY2017 SNAP-Ed Annual Report 258 January 2018
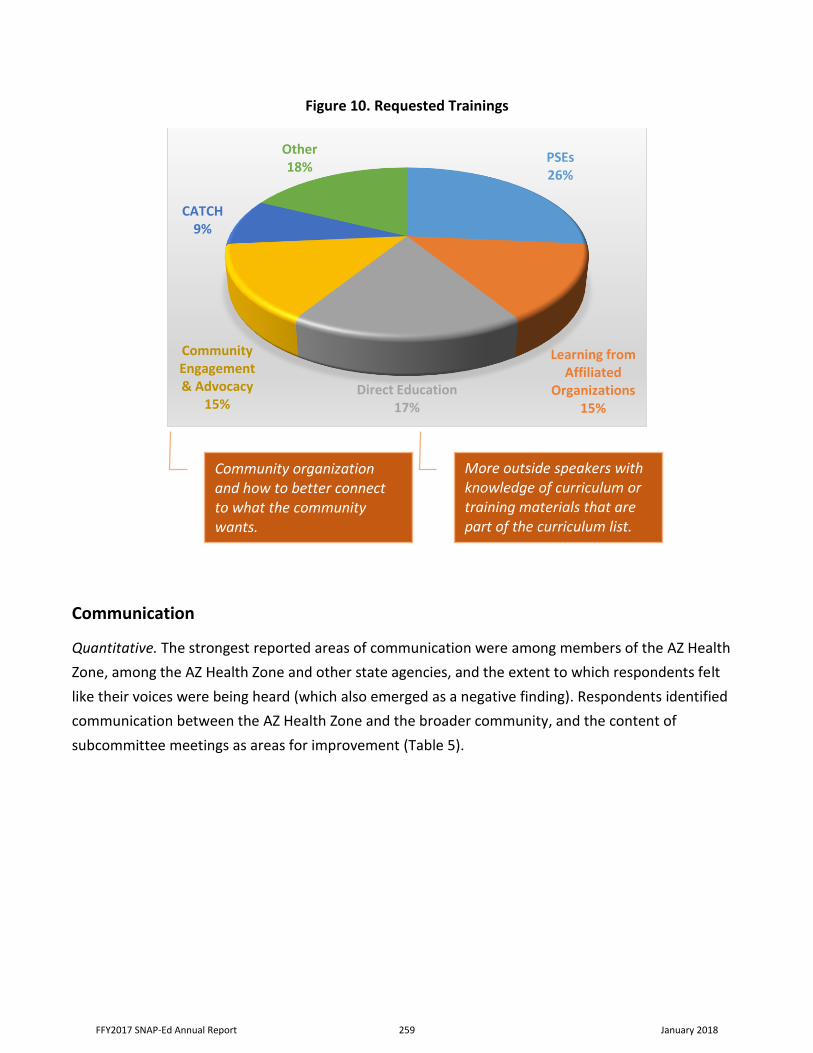
Figure 10. Requested Trainings
Communication
Quantitative. The strongest reported areas of communication were among members of the AZ Health
Zone, among the AZ Health Zone and other state agencies, and the extent to which respondents felt
like their voices were being heard (which also emerged as a negative finding). Respondents identified
communication between the AZ Health Zone and the broader community, and the content of
subcommittee meetings as areas for improvement (Table 5).
PSEs26%
Learning from Affiliated
Organizations15%
Direct Education17%
Community Engagement & Advocacy
15%
CATCH9%
Other18%
More outside speakers with knowledge of curriculum or training materials that are part of the curriculum list.
Community organization and how to better connect to what the community wants.
FFY2017 SNAP-Ed Annual Report 259 January 2018
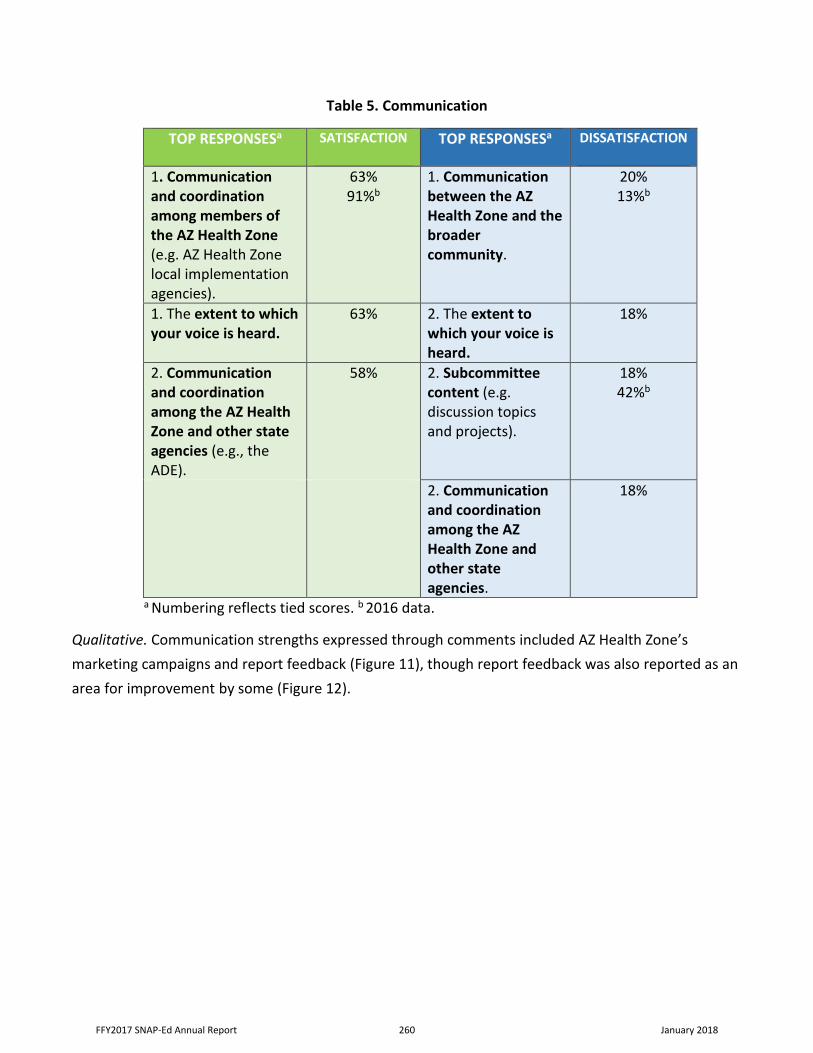
Table 5. Communication
TOP RESPONSESa SATISFACTION TOP RESPONSESa DISSATISFACTION
1. Communicationand coordinationamong members ofthe AZ Health Zone(e.g. AZ Health Zonelocal implementationagencies).
63% 91%b
1. Communicationbetween the AZHealth Zone and thebroadercommunity.
20% 13%b
1. The extent to whichyour voice is heard.
63% 2. The extent towhich your voice isheard.
18%
2. Communicationand coordinationamong the AZ HealthZone and other stateagencies (e.g., theADE).
58% 2. Subcommitteecontent (e.g.discussion topicsand projects).
18% 42%b
2. Communicationand coordinationamong the AZHealth Zone andother stateagencies.
18%
a Numbering reflects tied scores. b 2016 data.
Qualitative. Communication strengths expressed through comments included AZ Health Zone’s
marketing campaigns and report feedback (Figure 11), though report feedback was also reported as an
area for improvement by some (Figure 12).
FFY2017 SNAP-Ed Annual Report 260 January 2018
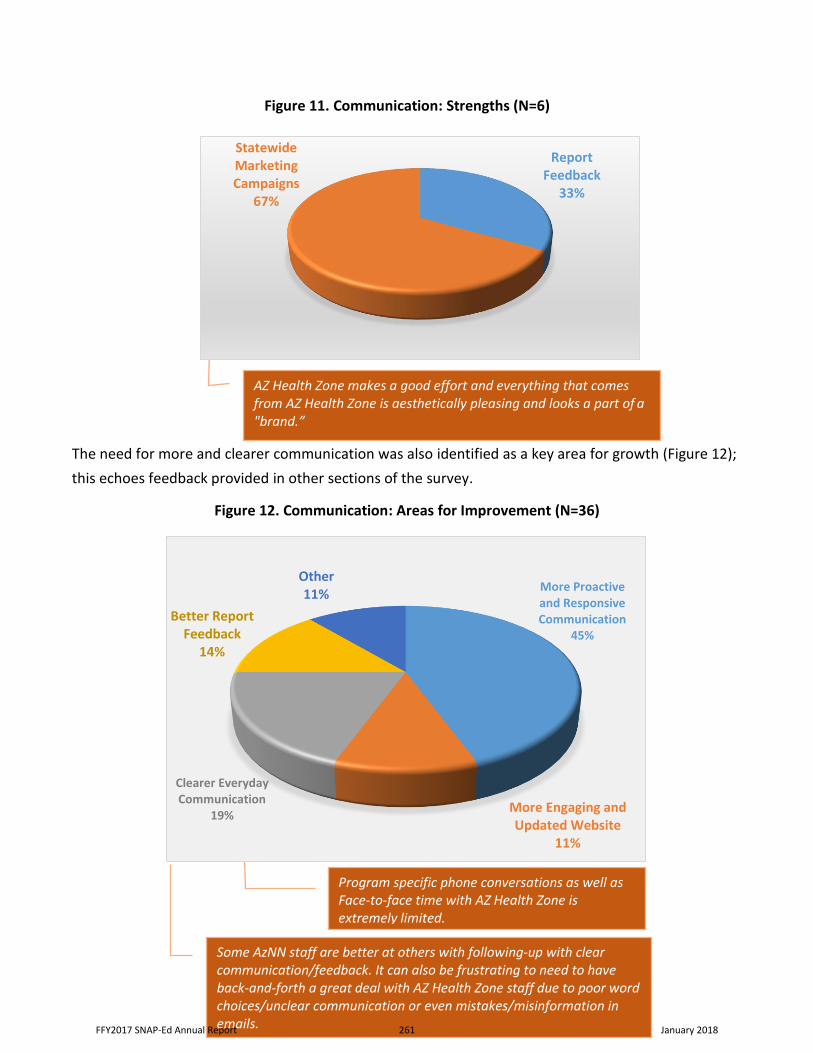
Figure 11. Communication: Strengths (N=6)
The need for more and clearer communication was also identified as a key area for growth (Figure 12);
this echoes feedback provided in other sections of the survey.
Figure 12. Communication: Areas for Improvement (N=36)
Some AzNN staff are better at others with following-up with clear communication/feedback. It can also be frustrating to need to have back-and-forth a great deal with AZ Health Zone staff due to poor word choices/unclear communication or even mistakes/misinformation in emails.
Program specific phone conversations as well as Face-to-face time with AZ Health Zone is extremely limited.
More Proactive and Responsive Communication
45%
More Engaging and Updated Website
11%
Clearer Everyday Communication
19%
Better Report Feedback
14%
Other11%
AZ Health Zone makes a good effort and everything that comes from AZ Health Zone is aesthetically pleasing and looks a part of a "brand.”
Report Feedback
33%
Statewide Marketing Campaigns
67%
FFY2017 SNAP-Ed Annual Report 261 January 2018
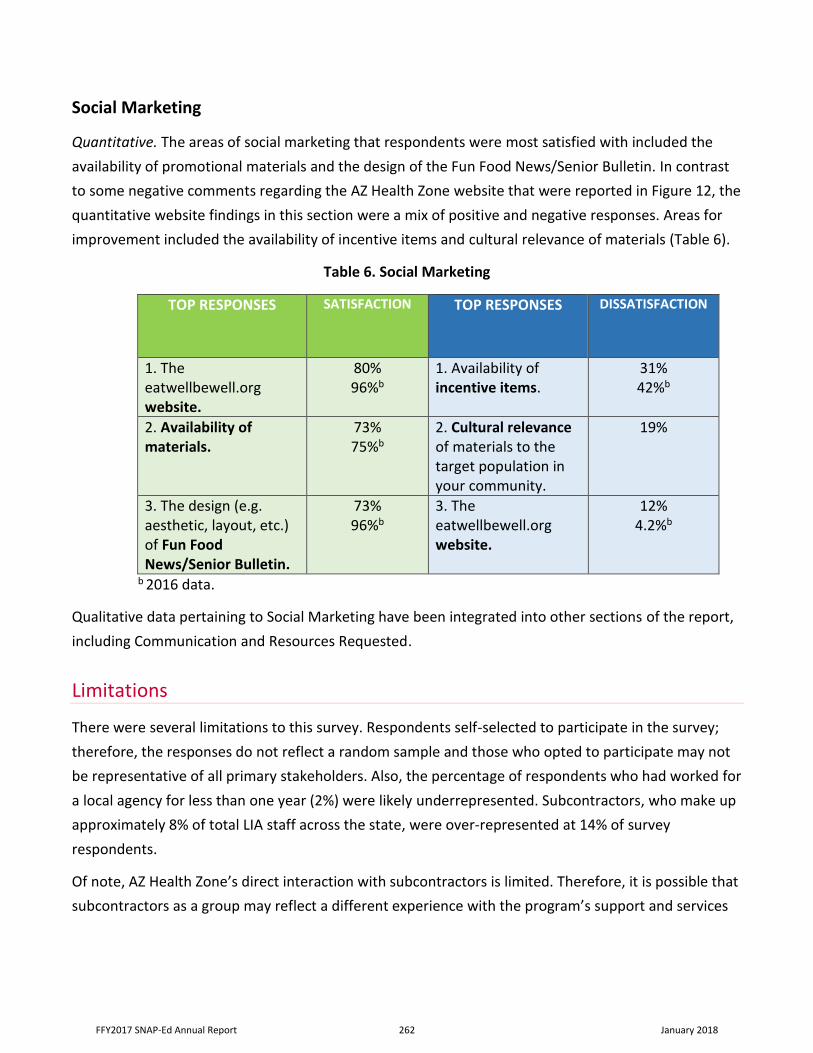
Social Marketing
Quantitative. The areas of social marketing that respondents were most satisfied with included the
availability of promotional materials and the design of the Fun Food News/Senior Bulletin. In contrast
to some negative comments regarding the AZ Health Zone website that were reported in Figure 12, the
quantitative website findings in this section were a mix of positive and negative responses. Areas for
improvement included the availability of incentive items and cultural relevance of materials (Table 6).
Table 6. Social Marketing
TOP RESPONSES SATISFACTION TOP RESPONSES DISSATISFACTION
1. Theeatwellbewell.orgwebsite.
80% 96%b
1. Availability ofincentive items.
31% 42%b
2. Availability ofmaterials.
73% 75%b
2. Cultural relevanceof materials to thetarget population inyour community.
19%
3. The design (e.g.aesthetic, layout, etc.)of Fun FoodNews/Senior Bulletin.
73% 96%b
3. Theeatwellbewell.orgwebsite.
12% 4.2%b
b 2016 data.
Qualitative data pertaining to Social Marketing have been integrated into other sections of the report,
including Communication and Resources Requested.
Limitations
There were several limitations to this survey. Respondents self-selected to participate in the survey;
therefore, the responses do not reflect a random sample and those who opted to participate may not
be representative of all primary stakeholders. Also, the percentage of respondents who had worked for
a local agency for less than one year (2%) were likely underrepresented. Subcontractors, who make up
approximately 8% of total LIA staff across the state, were over-represented at 14% of survey
respondents.
Of note, AZ Health Zone’s direct interaction with subcontractors is limited. Therefore, it is possible that
subcontractors as a group may reflect a different experience with the program’s support and services
FFY2017 SNAP-Ed Annual Report 262 January 2018
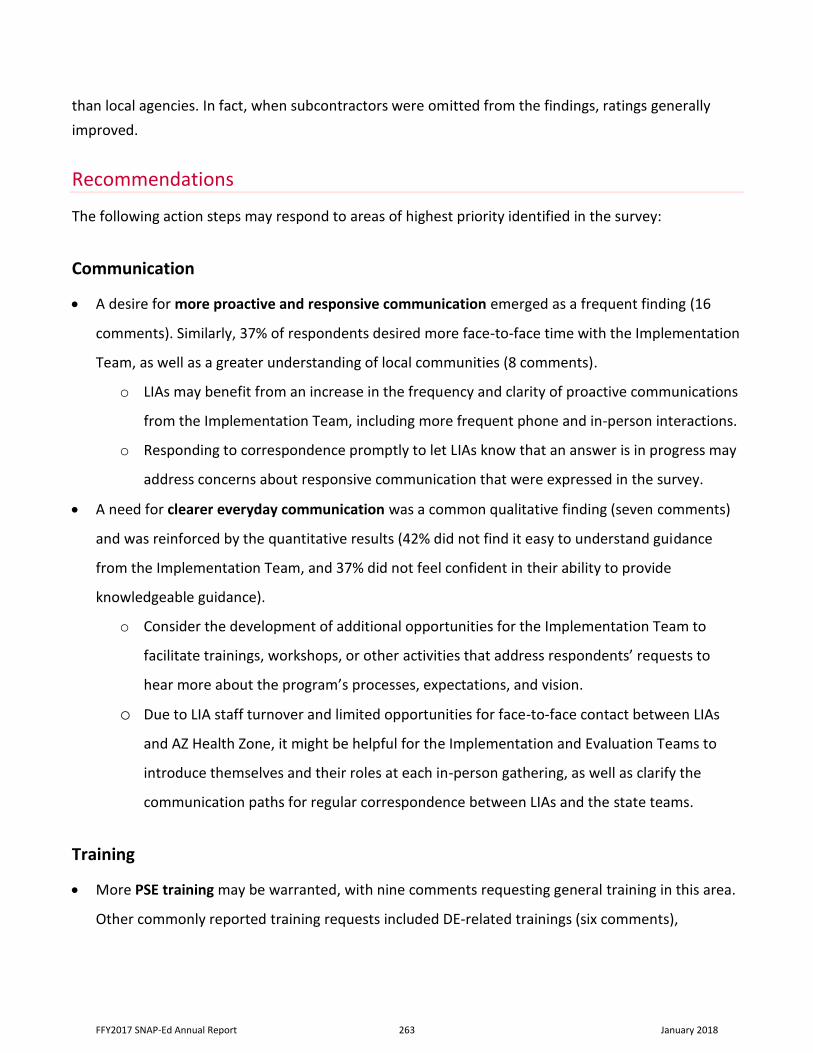
than local agencies. In fact, when subcontractors were omitted from the findings, ratings generally
improved.
Recommendations
The following action steps may respond to areas of highest priority identified in the survey:
Communication
A desire for more proactive and responsive communication emerged as a frequent finding (16
comments). Similarly, 37% of respondents desired more face-to-face time with the Implementation
Team, as well as a greater understanding of local communities (8 comments).
o LIAs may benefit from an increase in the frequency and clarity of proactive communications
from the Implementation Team, including more frequent phone and in-person interactions.
o Responding to correspondence promptly to let LIAs know that an answer is in progress may
address concerns about responsive communication that were expressed in the survey.
A need for clearer everyday communication was a common qualitative finding (seven comments)
and was reinforced by the quantitative results (42% did not find it easy to understand guidance
from the Implementation Team, and 37% did not feel confident in their ability to provide
knowledgeable guidance).
o Consider the development of additional opportunities for the Implementation Team to
facilitate trainings, workshops, or other activities that address respondents’ requests to
hear more about the program’s processes, expectations, and vision.
o Due to LIA staff turnover and limited opportunities for face-to-face contact between LIAs
and AZ Health Zone, it might be helpful for the Implementation and Evaluation Teams to
introduce themselves and their roles at each in-person gathering, as well as clarify the
communication paths for regular correspondence between LIAs and the state teams.
Training
More PSE training may be warranted, with nine comments requesting general training in this area.
Other commonly reported training requests included DE-related trainings (six comments),
FFY2017 SNAP-Ed Annual Report 263 January 2018
community engagement/advocacy (five comments), and opportunities to learn from other
affiliated agencies (five comments).
o It may be beneficial to communicate to LIAs why trainings have been prioritized in the
manner chosen, and/or why certain trainings are not able to be offered at this time.
o Consider annual conference grand sessions and/or workshops that address high priority
areas, such as:
Describing AZ Health Zone’s vision for the program
Community engagement, advocacy and how to work with policy makers
Enhancing communication and clarity around procedures
Curricula training
Implementation
Respondents expressed a strong desire to receive more insight into the vision for the program (8
comments) and to see changes regarding the committees (11 comments), including a stronger
purpose for committee work and a decreased frequency of meetings.
o Consider reducing committee meetings to bi-monthly or adopt a frequency that is preferred
among members of each committee.
o Consider the purpose of each committee in FY18, perhaps with members’ support in
defining an action plan for each year’s committee work.
Conclusion
The 2017 Partner Support and Services Survey yielded rich information regarding program processes
and considerations to continue to enhance the progress of SNAP-Ed in Arizona. The survey benefitted
from an increased response rate compared to 2016, and revisions to the questionnaire provided rich
quantitative and qualitative data. Should the survey be replicated in future years, it will allow for year
over year comparisons as the program responds to this year’s findings and continues to evolve in
SNAP-Ed’s mission to shape food consumption in a positive way, promote physical activity and health,
and reduce health disparities.
FFY2017 SNAP-Ed Annual Report 264 January 2018
Appendix A
2017 AzNN Partner Support and Services Survey .
WELCOME MESSAGE
Welcome to the FY17 Partner Support and Satisfaction Survey! Your responses will help us to understand what we are doing well, and where we can improve. We value your input.
Please be sure to write in comments in the text boxes provided in each section to tell us more about your responses.
Thank you!
PLANNING AND IMPLEMENTATION 1. How satisfied are you with:
A. The AzNN's contribution to improving nutrition and physical activity practices in the communitiesyou serve?
B. The AzNN Resource Guide?C. The AzNN Curriculum Modification Guidelines?D. The reporting and feedback process (Semi-Annual Reports, EARS)?E. The amendment process?F. Collaboration within the AzNN (e.g. AzNN Local Implementation Agencies, the AzNN State
Implementation Team, the AzNN State Evaluation Team)?G. Collaboration with USDA programs (e.g. Child Nutrition, WIC, SNAP, etc.) and other obesity
prevention programs?H. The direction that the AzNN is going?
2. Comments:
TECHNICAL ASSISTANCE Please state your level of agreement with the following statements about the AzNN State Implementation Team.
A. I receive a prompt response from the AzNN State Implementation Team when I call or email.B. The AzNN State Implementation Team is proactive in offering assistance and support.C. The AzNN State Implementation Team makes an effort to understand my SNAP-Ed program.D. It is easy to understand the guidance that I receive from the AzNN State Implementation Team.
FFY2017 SNAP-Ed Annual Report 265 January 2018
E. I am confident in the AzNN State Implementation Team’s ability to provide knowledgeableguidance.
F. The AzNN site visits are useful to my work.G. My program receives enough face-to-face time with the AzNN State Implementation Team in
our community.H. The AzNN State Implementation Team exhibits a high level of professionalism in our
interactions.
2. Comments:
Please state your level of agreement with the following statements about the AzNN State Evaluation Team.
A. I receive a prompt response from the AzNN State Evaluation Team when I call or email.B. The AzNN State Evaluation Team is proactive in offering assistance and support.C. The AzNN State Evaluation Team makes an effort to understand my SNAP-Ed program.D. It is easy to understand the guidance that I receive from my AzNN State Evaluation Liaison.E. I am confident in the AzNN State Evaluation Team's ability to provide knowledgeable guidance.F. Evaluation site visits are useful to my work.G. My program receives enough face-to-face time with the AzNN State Evaluation Team in our
community.H. The AzNN State Evaluation Team exhibits a high level of professionalism in our interactions.
Comments:
TRAINING 1. How satisfied are you with:
A. The Policies and Procedures training?B. The AzNN Annual Conference?C. AzNN-hosted webinars (e.g. Painting Preschool Playgrounds, Evaluation STORE training,
Arizona Health Improvement Plan, Evidence-Based Requirements, etc.)?D. AzNN-hosted in person workshops (e.g. Direct Education Boot Camp, Food Demonstration
Training, Smarter Lunchrooms, Empower, etc.)?E. The frequency of AzNN-hosted trainings?F. The AzNN’s promotion of other non-SNAP-Ed training opportunities?
2. What training topics would you like to see in the future?
3. Comments:
LEADERSHIP 1. How satisfied are you with:
A. The vision of AzNN’s Leadership Team?
B. The actions taken by AzNN’s Leadership Team?
C. The AzNN Administrator’s leadership?D. The AzNN Operations Manager’s leadership?E. Leadership in Food Systems?
FFY2017 SNAP-Ed Annual Report 266 January 2018
F. Leadership in Active Living?G. Leadership in School Health?H. Leadership in Early Childhood?I. Leadership in Direct Education?J. Leadership in Evaluation?
2. Comments:
COMMUNICATION 1. How satisfied are you with:
A. Communication and coordination among members of the AzNN (e.g. AzNN localimplementation agencies)?
B. Communication and coordination among the AzNN and other state agencies (e.g., the ADE)?C. Communication between the AzNN and the broader community?D. Extent to which your voice is heard?E. Subcommittee content (e.g. discussion topics and projects)?F. Communication among subcommittee members, for those in which you are involved?
2. Do you have any suggestions to improve the subcommittees?
3. Comments:
SOCIAL MARKETING 1. How satisfied are you with:
A. Use of the media (TV and web ads, billboards, etc.) to promote the AzNN's messages?B. Availability of materials?C. Availability of incentive items?D. The online distribution system?E. Cultural relevance of materials to the target population in your community?F. The design (e.g. aesthetic, layout, etc.) of Fun Food News/Senior Bulletin?G. The design (e.g. aesthetic, layout, etc.) of Posters?H. The design (e.g. aesthetic, layout, etc.) of Recipe Cards?I. The eatwellbewell.org website?
3. Comments:
SERVICES AND SUPPORT 1. How satisfied are you with the overall services and support you have received from AzNN over thelast year?
2. How has your overall satisfaction changed from FY2016 to FY2017?
Much betterSlightly better About the same Slightly worse Much worse I'm not sure
FFY2017 SNAP-Ed Annual Report 267 January 2018
3. Are there any services and/or support the AzNN provides especially well?
4. Are there any services and/or support the AzNN could improve?
5. Is there anything else you'd like to share?
TELL US ABOUT YOU 1. What is your involvement with the AzNN (check all that apply)?
AzNN Local Implementation AgencyAzNN Local Implementation Agency Subcontractor State Level Collaborative Partner Other (please specify):___________
2. How long have you worked for a program that is funded by Arizona SNAP-Ed (AzNN)?
This is my first year1-3 yearsMore than 3 yearsI am not sureNot applicable
FFY2017 SNAP-Ed Annual Report 268 January 2018
Appendix D
White Mountain Apache Project
FFY2017 SNAP-Ed Annual Report 269 January 2018
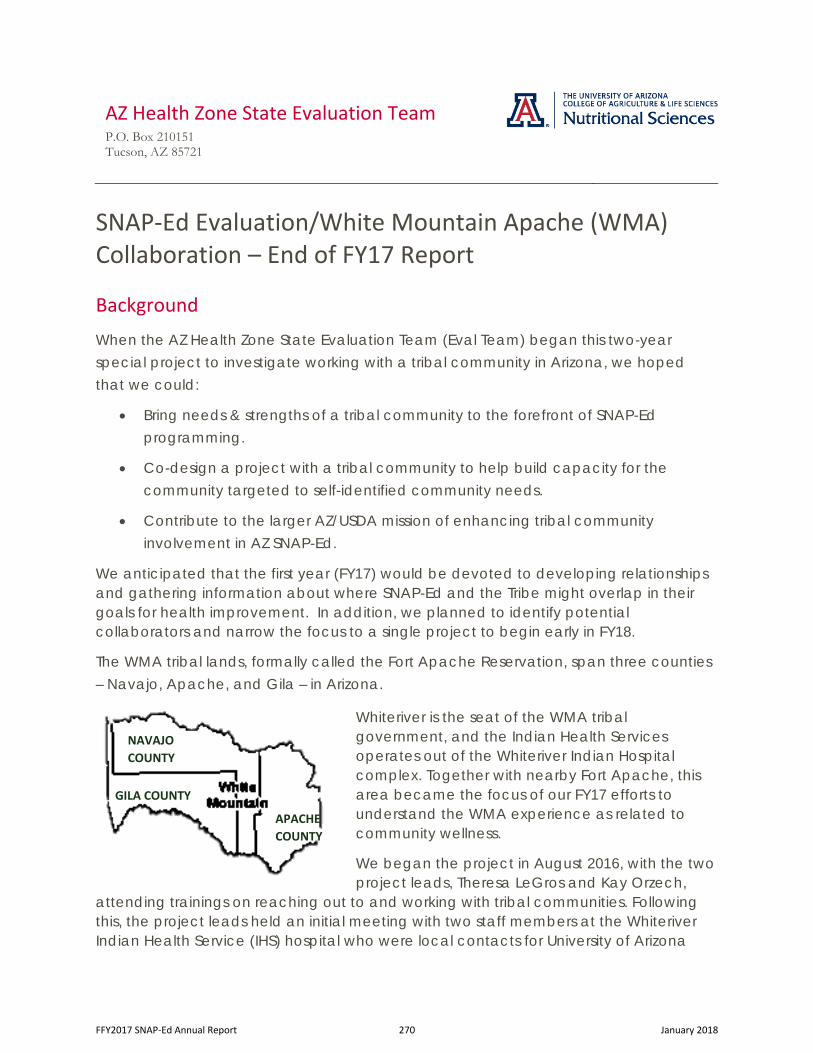
AZ Health Zone State Evaluation Team P.O. Box 210151 Tucson, AZ 85721
SNAP-Ed Evaluation/White Mountain Apache (WMA) Collaboration – End of FY17 Report
Background When the AZ Health Zone State Evaluation Team (Eval Team) began this two-year special project to investigate working with a tribal community in Arizona, we hoped that we could:
• Bring needs & strengths of a tribal community to the forefront of SNAP-Edprogramming.
• Co-design a project with a tribal community to help build capacity for thecommunity targeted to self-identified community needs.
• Contribute to the larger AZ/USDA mission of enhancing tribal communityinvolvement in AZ SNAP-Ed.
We anticipated that the first year (FY17) would be devoted to developing relationships and gathering information about where SNAP-Ed and the Tribe might overlap in their goals for health improvement. In addition, we planned to identify potential collaborators and narrow the focus to a single project to begin early in FY18.
The WMA tribal lands, formally called the Fort Apache Reservation, span three counties – Navajo, Apache, and Gila – in Arizona.
Whiteriver is the seat of the WMA tribal government, and the Indian Health Services operates out of the Whiteriver Indian Hospital complex. Together with nearby Fort Apache, this area became the focus of our FY17 efforts to understand the WMA experience as related to community wellness.
We began the project in August 2016, with the two project leads, Theresa LeGros and Kay Orzech,
attending trainings on reaching out to and working with tribal communities. Following this, the project leads held an initial meeting with two staff members at the Whiteriver Indian Health Service (IHS) hospital who were local contacts for University of Arizona
GILA COUNTY
APACHE COUNTY
NAVAJO COUNTY
FFY2017 SNAP-Ed Annual Report 270 January 2018
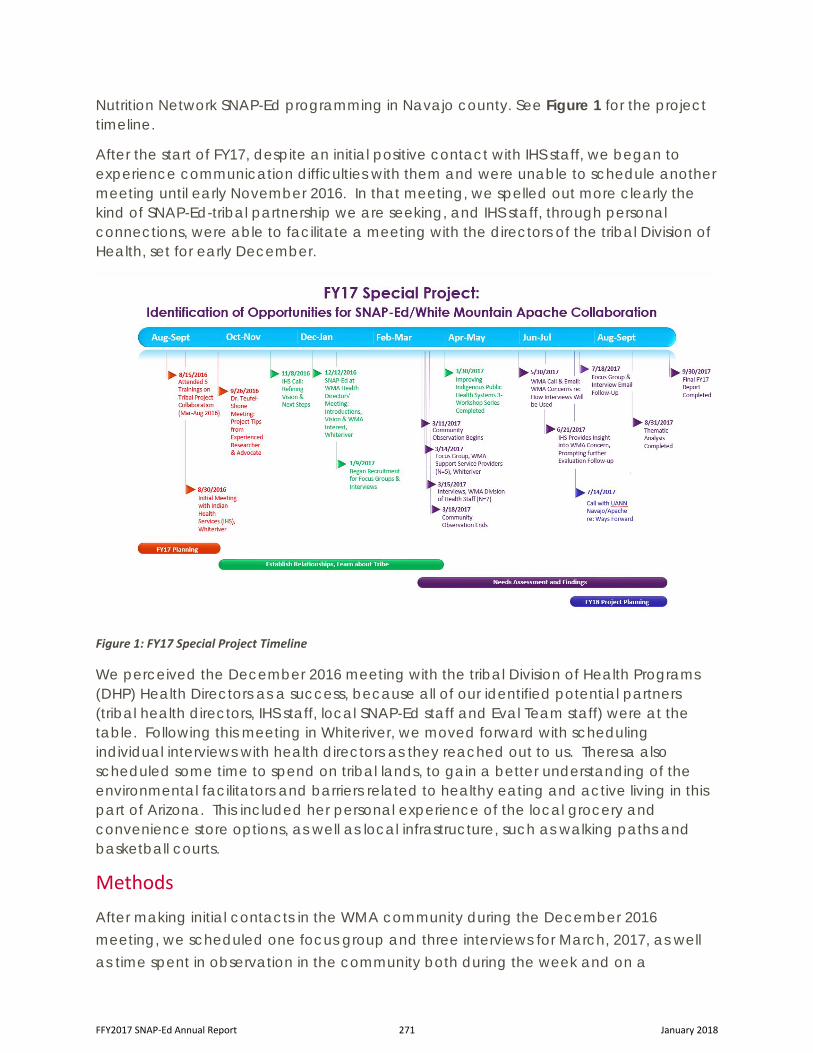
Nutrition Network SNAP-Ed programming in Navajo county. See Figure 1 for the project timeline.
After the start of FY17, despite an initial positive contact with IHS staff, we began to experience communication difficulties with them and were unable to schedule another meeting until early November 2016. In that meeting, we spelled out more clearly the kind of SNAP-Ed-tribal partnership we are seeking, and IHS staff, through personal connections, were able to facilitate a meeting with the directors of the tribal Division of Health, set for early December.
Figure 1: FY17 Special Project Timeline
We perceived the December 2016 meeting with the tribal Division of Health Programs (DHP) Health Directors as a success, because all of our identified potential partners (tribal health directors, IHS staff, local SNAP-Ed staff and Eval Team staff) were at the table. Following this meeting in Whiteriver, we moved forward with scheduling individual interviews with health directors as they reached out to us. Theresa also scheduled some time to spend on tribal lands, to gain a better understanding of the environmental facilitators and barriers related to healthy eating and active living in this part of Arizona. This included her personal experience of the local grocery and convenience store options, as well as local infrastructure, such as walking paths and basketball courts.
Methods After making initial contacts in the WMA community during the December 2016 meeting, we scheduled one focus group and three interviews for March, 2017, as well as time spent in observation in the community both during the week and on a
FFY2017 SNAP-Ed Annual Report 271 January 2018
weekend. The focus group, interviews, and the observations were conducted during one week spent visiting the White Mountain Apache tribal lands (primarily Whiteriver). Details about the individuals who spoke with us are summarized below.
• Focus group attendees - WMA Support Services Providers:o 2 Whiteriver Indian Health Service (IHS) community outreach staff from the
Nutrition Department (one a tribal member)o 2 SNAP-Ed LIA staff with the University of Arizona Nutrition Network, Navajo
Countyo 1 Tribal Farm representative who works on community outreach and
development• Interviewees – all were WMA tribal members:
o One who works for the Nutrition Department at the IHS Hospital (alsopresent at the focus group)
o One who has worked for the DHP for 20 years in several capacities, mostrecently grant-writing and administration A health educator also took part in this interview The Head of DHP also stopped by and contributed
o One who is has worked for DHP for about 1.5 years, focused on diabetesprevention Two other staff from the diabetes prevention arm of DHP also took
part in this interview
Our general impressions from these interactions were that Service Providers, Health Directors, and other staff we spoke with were realistic and forthcoming about the challenges facing the WMA, but they also offered information and opinions about opportunities. Many also offered personal stories that helped us to understand healthy options available in/near the town of Whiteriver, and gain insights about WMA culture.
The Data Gathered
Why Data Cannot Be Reported (Ethically)
It was our intention that the focus group and interviews would be one of the first steps in a collaboration with the Division of Health Programs staff of the White Mountain Apache Tribe, to determine an appropriate direction for our SNAP-Ed evaluation special project in the White Mountain Apache community. It was important that such a project was valued by both Arizona SNAP-Ed Evaluation and our tribal collaborators. After an initial positive response, however, the cautious openness we experienced when talking to people in interviews and focus groups changed to a closed door from our potential collaborators at the tribal Division of Health. We are still not entirely sure
FFY2017 SNAP-Ed Annual Report 272 January 2018
what went wrong. We can speculate about differing priorities, communication styles, and the difficulty of maintaining a long-distance relationship (Tucson is located almost 200 miles from Whiteriver). From the absence of communication, we also lost our ability to check in with our interviewees and focus group attendees to receive their approval to move forward with presenting their data. Without ongoing communication with tribal members, we cannot presume consent to share their insights and perspectives. Therefore, we are not able to include the findings as a part of this report.
Lessons Learned • Cultural difference makes a difference.
Although our team came in knowing that lack of understanding of and respect for anticipated cultural differences was a key reason why cross-cultural collaborations may fail, we still made assumptions that may have contributed to the failure of this project to progress. For example, we assumed that forthright communication styles and consistent communication by email or phone would be the norm. We also believed our background in SNAP-Ed evaluation and research would be assets, when in fact they may have increased suspicion about our motives.
• Building trust is critical.
From what we understood from our interactions with WMA individuals, trust is best built face-to-face and is not easy to establish without a long-term relationship with members of the community. One disadvantage we had was our physical distance from the White Mountain Apache tribal lands; we were unable to have regular face-to-face communication with our collaborators. Another disadvantage was our role as state-level evaluators for SNAP-Ed. While we wanted to be fully involved in a local project, SNAP-Ed local agency liaisons were not the ones directing efforts, which was likely to have been confusing for potential tribal collaborators, and did not aid in the building of trust.
• A different kind of relationship building that puts community needs and capacitybuilding at the center requires more time and flexibility than what SNAP-Edcurrently allows.
With consistent, long-term commitment to relationship building by the right people, relationships have been built between tribal communities and SNAP-Ed local staff. Tribes vary widely in their desire to enter into such relationships. Sometimes, there may be divisions in priorities - the tribal council may prefer one direction, but health workers or concerned citizens within the tribe may prefer another. Successful relationships between tribes and SNAP-Ed will depend upon being able to meet tribes where they are and tailor their SNAP-Ed experience to meet their desires and expectations.
FFY2017 SNAP-Ed Annual Report 273 January 2018

PAGE INTENTIONALLY BLANK
FFY2017 SNAP-Ed Annual Report 274 January 2018
Appendix E
Effect of SNAP on Fruit and VegetableConsumption in AZ
FFY2017 SNAP-Ed Annual Report 275 January 2018
THE EFFECT OF SUPPLEMENTAL NUTRITION ASSISTANCE PROGRAM ON FRUIT
AND VEGETABLE CONSUMPTION IN ARIZONA
by
Asumi Saito
____________________________
Copyright © Asumi Saito 2017
A Thesis Submitted to the Faculty of the
DEPARTMENT OF AGRICULTURAL AND RESOURCE ECONOMICS
In Partial Fulfillment of the Requirements
For the Degree of
MASTER OF SCIENCE
In the Graduate College
THE UNIVERSITY OF ARIZONA
2017
FFY2017 SNAP-Ed Annual Report 276 January 2018
STATEMENT BY AUTHOR
The thesis titled The Effect of Supplemental Nutrition Assistance Program on Fruits
and Vegetables Consumption in Arizona prepared by Asumi Saito has been submitted in
partial fulfillment of requirements for a master’s degree at the University of Arizona and is
deposited in the University Library to be made available to borrowers under rules of the
Library.
Brief quotations from this thesis are allowable without special permission,
provided that an accurate acknowledgement of the source is made. Requests for
permission for extended quotation from or reproduction of this manuscript in whole or in
part may be granted by the copyright holder.
SIGNED: Asumi Saito
APPROVAL BY THESIS DIRECTOR
This thesis has been approved on the date shown below:
5/12/2017
Dr. George Frisvold Date
(Professor and Extension Specialist)
FFY2017 SNAP-Ed Annual Report 277 January 2018
ACKNOWLEDGEMENTS
First and foremost, I sincerely express my deep sense of indebtedness to my thesis director Dr.
George Frisvold. I was privileged to experience a sustained enthusiastic and involved interest
from his side which fueled my enthusiasm even further and encouraged me to boldly step into
a challenging and hardly explored field.
I wish to record my sincere gratitude to thesis committee member Dr. Gary Thompson and Dr.
Laurel Jacobs for their precise and insightful comments and valuable advice which helped me
to enhance my overall perspective on the topic and in making my thesis a more complete one.
I am heartily thankful to all my classmates for helping me throughout my thesis. My sincere
thanks are due to my parents for their constant encouragement, support and for standing by me
always. Lastly, I offer my regards and blessings to all of those who supported me during the
completion of my thesis, especially my best friends Lauren K Beall and Chihiro Goto.
FFY2017 SNAP-Ed Annual Report 278 January 2018
Table of Contents
Abstract ...................................................................................................................................... 6
Chapter 1 Introduction ............................................................................................................... 7
Chapter2 Literature Review ..................................................................................................... 11
Chapter3 Data and Variables ................................................................................................... 16
Chapter4 Analysis Settings and Descriptive Statistics ............................................................ 21
Chapter5 Who Are the SNAP Participants? ............................................................................ 24
Chapter 6 The Effect of SNAP and SNAP-Ed on Fruit and Vegetable Consumption ............ 26
Chapter 7 Conclusion and Future Works ................................................................................. 28
References ................................................................................................................................ 41
FFY2017 SNAP-Ed Annual Report 279 January 2018
List of Tables
Table 3-1: Description of fruits and vegetables variables ....................................................... 31
Table 3-2: Categories for each variable from BRFSS ............................................................. 32
Table 4-1: Eligibility criteria ................................................................................................... 33
Table 4-2: Eligibility and SNAP participation......................................................................... 33
Table 4-3: Estimated means, minimum, and maximum of fruits and vegetables consumption
by whole sample and by eligible group ................................................................................... 34
Table 4-4: t-test for the estimated means of fruits and vegetable consumptions ..................... 34
Table 4-5: t-test for the estimated means of independent variables for whole sample by
eligible and ineligible ............................................................................................................... 35
Table 4-6: t-test for the estimated means of independent variables for eligible group by SNAP
pariticipants and nonparticipants ............................................................................................. 36
Table 5-1: Probit model results ............................................................................................... 38
Table 5-2: Prediction of SNAP participation ........................................................................... 39
Table 6-1: OLS results for demographic variables .................................................................. 39
Table 6-2: OLS results for non-demopgraphic variables ......................................................... 40
Table 6-3: Robustness check on the effect of SNAP ............................................................... 40
FFY2017 SNAP-Ed Annual Report 280 January 2018
Abstract
The Supplemental Nutrition Assistance Program (SNAP) is the largest domestic hunger safety
net program in the United States. It has been shown that SNAP increases households’ purchasing
power. However, only a quarter of Americans follow recommended healthy eating patterns.
Hence, there is a question whether the additional income from SNAP transfers to healthier eating.
This paper addresses three questions. First, what factors explain SNAP participation of
low income individuals in addition to basic income eligibility requirements? Second, does SNAP
participation increase fruit and vegetable consumption? Third, what effect does the Supplemental
Nutrition Assistance Program Education (SNAP-Ed) in Arizona have on fruit and vegetable
consumption for low-income households? The data used in this study were drawn from two
waves of the Arizona Behavioral Risk Factor Surveillance System survey.
The study found people in Arizona ate fruits, on average 1.4 times per day and vegetables
1.6 times per day. Marital and household arrangement status significantly affected both SNAP
participation and fruit and vegetable consumption, but effects for men and women differed.
Distance from services assisting with SNAP enrollment appeared to have no negative effect on
eligible respondent enrollment. Three variables were considered separately to measure
respondent exposure to SNAP-Ed. The first was a simple dummy variable for presence or
absence of a SNAP-Ed program in the respondent’s county. The second was the number of
SNAP-Ed contractors per square mile in the county and the third was the number of SNAP-Ed
contractors per thousand persons under 125% poverty line in the county. The first two SNAP-Ed
variables were not statistically significant, while the third – SNAP-Ed contractors per thousand
persons under 125% poverty line in the county – was significant at the 10% level (two-tailed t-
test). This suggests some (mild) evidence that increasing SNAP-Ed contractors per poor person
in a county could increase fruit and vegetables servings consumed by this population. Future
research should consider obtaining more precise measures of SNAP-Ed reach.
FFY2017 SNAP-Ed Annual Report 281 January 2018
Chapter 1 Introduction
Healthy Eating
Eating enough fruits and vegetables is linked to a lower risk of many chronic diseases. Fruits
and vegetables are important source of many nutrients that are required for a healthy life such
as potassium, dietary fiber, and wide variety of vitamins. The Dietary Guidelines for
Americans 2015-2020 (U.S.D.H.H.S, 2015) (1) recommends eating, “A variety of vegetables
from all of the subgroups – dark green, red and orange, legumes (beans and peas), starchy,
and other” and “Fruits, especially whole fruits”. However, the Dietary Guidelines for
Americans reported that about three-fourth of the people in the United States have eating
patterns that are lower in fruits and vegetables than the recommended volume. The
Supplemental Nutrition Assistance Program (SNAP) and Supplemental Nutrition Assistance
Program Education (SNAP-Ed) are two programs intended to improve the nutrition of lower
income Americans.
Supplemental Nutrition Assistance Program (SNAP)
SNAP, formerly known as ‘Food Stamp Program (FSP)’, is the largest program in the
domestic hunger safety net provided by Food and Nutrition Service (FNS) of the United
States Department of Agriculture (USDA). During fiscal year 2016, the program served over
44 million people in an average month at a total annual cost of nearly $67 billion in benefits
(USDA, 2017). The average monthly benefit a SNAP participant receives is $126.81 in fiscal
year 2015. Because of SNAP’s massive scope and scale, it is one of the most important
topics of discussion by nutrition policy makers and researchers.
The main goal of SNAP is to permit low-income households to achieve a more nutritious diet
through providing additional purchasing power (USDA, 2017; Gregory et al., 2013; Fox et
al., 2004). Since the program started in 1964 as the FSP, SNAP has demonstrated a
remarkable antipoverty effect in the U.S. For example, USDA (2015) revealed that the
FFY2017 SNAP-Ed Annual Report 282 January 2018
program shifted the participants above the poverty line by 10 percent. In addition, several
studies have shown that participating in the FSP has had a positive impact on household food
expenditure (Meyerhoefer, and Yang, 2011).
Supplemental Nutrition Assistance Program –Education (SNAP-Ed)
SNAP-Ed works with partners to provide food and nutrition education to support SNAP’s
role in addressing food insecurity. The SNAP-Ed goal is to improve the likelihood that
persons eligible for SNAP will make healthy food choices within a limited budget and choose
physically active lifestyles consistent with the current Dietary Guidelines for Americans and
the USDA food guidance.
The population eligible for SNAP-Ed includes people eligible for the other food benefit
programs, but also targets people residing in low-income communities. SNAP-Ed is
administrated by state agencies that administer and implement SNAP as well as sub-
contractors authorized by the state agencies. Each SNAP-Ed program is designed by the
agencies and follows each state’s State Agency Goals and Objectives.
SNAP-Ed Evaluation
While the evaluation of SNAP has a long history in broad disciplines, the evaluation of
SNAP-Ed started in 2013 for eight states. Currently, there are priority outcome indicators that
the SNAP-Ed Evaluation Framework encourages states to measure. For instance, the four
core indicators are healthy eating behaviors, food resource management behaviors, physical
activity and reduced sedentary behaviors, and nutrition supports adopted in environmental
settings. The evaluation measures the individual behavioral changes, the environmental
changes in schools and local communities, and other corresponding factors to the evaluation
framework goals.
One of the behavioral measurements is the change of the eating patterns of individuals who
participate in SNAP-Ed. Limiting the behavioral change to the eating pattern of fruits and
FFY2017 SNAP-Ed Annual Report 283 January 2018
vegetables for the sake of argument, the ideal study will be designed with a dataset that
includes SNAP-Ed intervention and participants, their characteristics, and their intake. For
instance, Molitor et al (2015) has studied SNAP-Ed intervention on nutrition and physical
activity in California using the Californian Health Interview Survey (CHIS). Also, Molitor et
al (2016) has studied the nutrition intake of SNAP-Ed eligible mothers using survey data
collected by Automated Self-administered 24-Hour Recall. The survey respondents were
selected from the California Department of Social Services, Medi-Cal Eligibility Data
System. The further detail about the two papers is discussed in Chapter 2.
SNAP-Ed evaluation in Arizona and the study goal
In Arizona, the evaluation plan focuses on five areas: food systems, active learning, school
health, early childhood, and direct education. The research of this paper is led by the Arizona
Nutrition Network (AzNN), which administers SNAP-Ed in Arizona. The purpose of study is
to evaluate the effect of SNAP-Ed intervention on nutrition intake since the five areas of
focus give nutrition education to the participants.
However, due to the availability of dataset, this study focuses on measuring the effect of
SNAP-Ed intervention on the county level behavioral change instead of individual level. The
outcome variables to measure the nutrition intake are estimated fruits and vegetables intake
from Arizona Behavioral Risk Factor Surveillance System (BRFSS) conducted by Center for
Disease Control and Prevention (CDC) for the waive of 2011 and 2013 which were collected
through phone interviews.
Purposes of the study
To carefully measure the effect of SNAP-Ed, it is important to understand both SNAP and
SNAP-Ed since SNAP has been found to affect food consumption patterns in past studies.
Therefore, this paper has three purposes: to understand the fruits and vegetable consumption
of people in Arizona, to investigate the characteristics of people participate in SNAP, and to
FFY2017 SNAP-Ed Annual Report 284 January 2018
examine the effect of SNAP and SNAP-Ed on fruits and vegetables consumption.
Firstly, fruit and vegetable consumption are briefly discussed to understand the eating
patterns of people in Arizona.
Secondly, the factors of SNAP participation are going to be examined using probit model.
According to the American Community Survey (ACS), 10.6% of population in Arizona were
receiving SNAP benefits in 2011, and 13.1% of population were receiving SNAP benefits in
2013. However, we found there are significant amount of people who do not participate in
SNAP even they are eligible to participate based on the eligibility screening. This means that
SNAP and SNAP-Ed might not sufficiently reach out to the people in need. Therefore, this
study researches the demographic difference of people who participate in SNAP and people
who do not among SNAP eligible people. Further detail of eligibility is discussed in Chapter
4. Also, understanding SNAP participants is helpful to learn SNAP-Ed reach in future work.
Finally, the effect of SNAP on fruits and vegetables is analyzed using OLS. Although the
study has limited information about SNAP-Ed, the study of SNAP itself is meaningful since
the effect of SNAP on diet and nutrition intake is still ambiguous even this area has been
studied by many researches. The detail of literature review of the effect of SNAP will be
discussed in chapter 2.
To study the three goals of this research, this paper briefly reviews the literature in Chapter 2,
describes the dataset and variables in Chapter 3, presents the basic descriptive statistics and
the addresses to the eating pattern of people in Arizona in Chapter 4, examines factor
affecting SNAP participation in Chapter 5, examines the factors affecting fruits and vegetable
consumption in Chapter 6, and concludes the discussion at Chapter 7.
FFY2017 SNAP-Ed Annual Report 285 January 2018
Chapter2 Literature Review
Studies on SNAP and health/income related outcome
The effect of SNAP on low-income households in US has been widely researched to examine
the attainment of program’s goal: income assistance and access to adequate diet.
SNAP performs significant contribution to improving food expenditure and decreasing food
insecurity, which are the part of primary goals of the program. There is a large body of
evidence that shows SNAP and FSP contributed more to increasing household food
expenditure than when the household receives the same amount of assistance as a cash grant
(Fox et al., 2004, Meyerhoefer and Yang., 2010). Likewise, existing researches showed
consistent results on the relationship between SNAP and improvement of food insecurity
when the selection bias is controlled (Fox et al., 2004). Mykerezi and Mills (2010) used
simultaneous model, and Yen (2008) used instrumental variable to conclude FSP has
negative and significant effect on food insecurity. The fact that SNAP sustains income level
and food security for low-income households is supported by significant and consistent
studies.
However, there is an unfavorable consequence too. Meyerhoefer and Yang (2010) found
there is a consistent and positive influence of FSP participation on obesity among women
when it is examined with selection model. Zagorsky et al (2009) showed the typical female
FSP participant has a one-unit larger Body Mass Index than nonparticipants with the same
socioeconomic characteristics. Yen et al (2012) reported an inverse relationship between
SNAP participation and self-assessed health. It is doubtful whether the additional income
effect of SNAP relates to positive health outcomes.
Importance of the study of the effect on diet and nutrient intake
Considering that FSP has positive impact on improving food expenditure as well as negative
FFY2017 SNAP-Ed Annual Report 286 January 2018
impact on health outcome, it is ambiguous whether the extra income on food transfers to
purchasing healthy diet or not. Therefore, it is undoubtedly important to study the effect of
program participation on diet and nutrient intake. However, even though offering a better diet
is another important objective of the program, there is no clear answer for the question
whether SNAP gives positive influence on diet and nutrient intake for the participants (Fox et
al., 2004, Meyerhoefer and Yang. 2010). Hence, this area of study needs further attention and
deeper focus than other impacts the program gives.
Literature review on dietary and nutrient intake
The impact of the program on diet and nutrient intake has been studied for decades.
There are several studies with consistent results. For example, as Wilde et al (1999) and
Cason et al (2002) observed, the program participants consumed more meat than
nonparticipants. Gregory et al (2013) and Wolfson and Bleich (2015) reported the
participants consumed fewer servings of vegetables than nonparticipants with same
socioeconomic status. Similarly, Yen (2010), Gregory et al (2013), and Butler and Raymond
(1996) concluded negative association between the participation and nutrient intake such as
fiber and sodium.
On the contrary, some studies gave contradicting results to each other. While Gregory et al
(2013) noted that the participants consumed less saturated fat, Wilde et al (1999) and Cason
et al (2002) claimed a positive relationship between the participation and fat intake. Also,
Wolfson and Bleich (2015) reported the participants consumed less fruits than SNAP
ineligible group whereas Gregory et al (2013) found positive impact of the program on whole
fruits consumption.
Now the question is; what causes this inconsistence?
FFY2017 SNAP-Ed Annual Report 287 January 2018
What causes inconsistence of the studies?
This weaker evidence on the program influence on diet and nutrient consumption is attributed
on three reasons: Measurement error, regional difference, and model design.
Firstly, although most of the studies used data from National Health and Nutrition
Examination Survey (NHANES) and Continuing Survey of Food Intakes by Individuals
(CSFII), other studies conducted their analysis on different surveys with different
measurement of diet and nutrient. Even within the same source of data, obviously there are
too many types of diet and nutrient information to choose for one research. Hence, there are
few studies targeted at exact same outcome variables. The variations in data source and type
of food and nutrition are one of the reasons of inconsistent results from previous studies.
The second point is that the affordability of food varies across the areas and states. As
Wolfson and Bleich (2015) emphasized, food price is one of the most important value for
program eligible group when they make decision on purchasing food. However, the program
benefits are based on national average prices except for Hawaii and Alaska. According to
Guthrie et al (2007), the price difference across the country is statistically significant. While
“about 17 percent of participants live in area where the cost of enough food is 10 percent
above the national average or higher”, “14 percent of participants live in an area with 10
percent below or lower” than national average price. Moreover, Yen (2010) addressed that
residing regions have significant effects on the amount of food consumption. The areas
selected in NHANES or CSFII change every time the surveys were conducted. Overall, there
is a significant difference in food price by region, which is not neglectable to consider food
consumption pattern.
Finally, self-selection into the program inevitably impacts on one’s choice of diet and
nutrient. Meyerhoefer and Yang (2012) acknowledged that “household with either stronger
preference for food in general or greater biological need of food self-select into SNAP”.
FFY2017 SNAP-Ed Annual Report 288 January 2018
Therefore, it is understandable that studies with selection model have different results from
the studies without controlling the selection bias. Although a lot of studies did not control for
selection, some recent studies constructed rigorous models. For instance, Butler and
Raymond (1996) found that the number of children, health status and asset change the
likelihood of participation for elderly. Also, the study reported lower participation rate for
those who live alone, and who have more education, assets, and income. The researchers
should carefully examine the treatment effect controlling the bias.
How this paper overcomes the biases?
The outcome measurement is the daily servings of fruits and vegetables consumption, which
would not be considerably affected by measurement error compared with nutrition. Also
fruits and vegetable consumption are one of the most frequently used type of food for
researches in dietary and nutrition intake. Secondly, this study uses data from Behavioral
Risk Factor Surveillance System (BRFSS) to focus on the population in Arizona to eliminate
any bias caused by state specific issues. Hence, this study is different from the literature using
nationwide dataset, as well as the other local studies using business data that only available in
specific regions. It is comparable to other states since BRFSS is conducted by Center for
Disease Control (CDC) in all 50 states with taking account of region-based price difference.
Finally, self-selection will be controlled by selection model once the study finds statistically
significant effect of SNAP on fruits and vegetable servings.
Study on SNAP-Ed on nutrient intake and the measurement of the effect
There are fewer researches on the effect of SNAP-Ed on nutrient intake than the researches
on the effect of SNAP. Molitor et al (2015) studied the effect of SNAP-Ed intervention on
nutrition and physical activity for adults, teenagers, and children who were SNAP-Ed eligible
in California. The study found adults and children with high-level intervention ate more fruits
and vegetables than adult and children with no intervention. Also, adults with low, moderate,
FFY2017 SNAP-Ed Annual Report 289 January 2018
or high levels of reach reported eating fast food less often than adults with no-intervention.
Molitor et al (2016) examined the effect of SNAP-Ed on nutrition intake for mothers in
California. The study found mothers with high-SNAP-Ed reach ate more cups of fruits and
vegetables, consumed fewer calories from high-fat foods, and drank fewer cups of sugar-
sweetened beverages. From the two studies, it is concluded that SNAP-Ed intervention has
positive impact on fruits and vegetable consumption in California.
Molitor et al (2015) and Molitor et al (2016) measured the effect of SNAP-Ed intervention by
creating the variable to capture the extent of the intervention reach by census tract. The
intervention reach was determined the number of SNAP-Ed participants divided by the
number of SNAP-Ed eligible people. In Molitor et al (2015), the number used to calculate
intervention reach was obtained from the USDA’s Education and Administrative Reporting
System (EARS) and from the Nutrition Education and Obesity Prevention Branch (NEOPB)
of the California Department of Public Health, the US Census and the American Community
Survey. In Molitor et al (2016), SNAP-Ed participants were reported by EARS and SNAP-Ed
eligible persons were computed based on the data from the US Census and American
Community Survey. The intervention reach by census tract was a continuous variable,
however, both studies created a categorical variable that describes the intervention reach from
high, moderate, and low-level intervention to no intervention and was assigned to each
observation geocoded to each census tract.
How this paper works on SNAP-Ed evaluation?
Due to the data availability, this study examines the effect of SNAP-Ed intervention by
county level instead of census tract. This study uses the number of SNAP-Ed contractors as a
nominator of the reach, and uses the population under 125% poverty line as a denominator to
compute the intervention reach. Further detail about the intervention reach in this study is
discussed in Chapter 3.
FFY2017 SNAP-Ed Annual Report 290 January 2018
Chapter3 Data and Variables
Primary Data
Data was used from two waves of Arizona Behavioral Risk Factor Surveillance System
(BRFSS): 2011 and 2013. BRFSS is a national health-related survey that collects state-level
data about health-related risk behaviors, chronic health conditions, and use of preventive
services. It is a useful source to examine health- related issues such as measuring progress
toward state and national health objectives.
The Center for Disease Control and Prevention (CDC) annually conducts BRFSS in 50 states,
the District of Columbia, and three U.S. territories. The survey collects data by phone
interview including both landline and cell-phone with respondents in Arizona. Since BRFSS
is a phone survey, it is self-reported data.
The sample is drawn from 2011 and 2013 with 6,489 and 4,252 for each year.
Outcome variable
The dependent variable is the total fruits and vegetables consumption per day. There were
two questions regarding fruits, 100% pure fruit juice and fresh, frozen, or canned fruit, and
four questions regarding vegetables, cooked or canned beans, dark green vegetables, orange-
colored vegetables, and other vegetables in BRFSS. The total fruits variable is an aggregated
variable of two fruit variables and the total vegetables is an aggregated variable of four
vegetable variables.
The questions asked for fruits were
• “During the past month, how many times per day, week or month did you drink 100%
PURE fruit juices? Do not include fruit-flavored drinks with added sugar or fruit juice
you made at home and added sugar to. Only include 100% juice” and
• “During the past month, not counting juice, how many times per day, week, or month did
you eat fruit? Count fresh, frozen, or canned fruit”.
FFY2017 SNAP-Ed Annual Report 291 January 2018
The questions asked for vegetables were
• “During the past month, how many times per day, week, or month did you eat cooked or
canned beans, such as refried, baked, black, garbanzo beans, beans in soup, soybeans,
edamame, tofu or lentils. Do NOT include long green beans”,
• “During the past month, how many times per day, week, or month did you eat dark green
vegetables for example broccoli or dark leafy greens including romaine, chard, collard
greens or spinach?”,
• “During the past month, how many times per day, week, or month did you eat orange-
colored vegetables such as sweet potatoes, pumpkin, winter squash, or carrots?”, and
• “Not counting what you just told me about, during the past month, about how many times
per day, week, or month did you eat OTHER vegetables? Examples of other vegetables
include tomatoes, tomato juice or V-8 juice, corn, eggplant, peas, lettuce, cabbage, and
white potatoes that are not fried such as baked or mashed potatoes”.
The supplemental descriptions fruit and vegetable categories is shown in table 3-1.
The variables, total fruits and total vegetables, were “the calculated variable for total fruits
consumed per day” derived from the two fruits variables and “the calculated variable for total
vegetables consumed per day” derived from four vegetables variables. Therefore, the
variables, total fruits and total vegetables, are the count variables of the time each respondent
ate fruits and vegetables per day. The variables specify the frequency of consumption and
they are not related to the quantity of consumption. Also, the variables include two decimal
places. Hence, “300 total fruits” means “three servings consumed per day”.
Independent variables
SNAP participation
The main indicator to measure the effect of SNAP is SNAP participation variable.
FFY2017 SNAP-Ed Annual Report 292 January 2018
The question asked was “In the past 12 months, did you or anyone in your household get
food stamps or a food stamp benefit card?” Since this study focuses on the effect of SNAP
participation, only those respondents who clearly stated their participation status by
answering “yes” or “no” are included in the study. The respondents who answered, “don’t
know/ not sure” and “refused” are excluded from the sample.
Demographic variables
Individual sociodemographic variables such as age, county, marital, education, employment,
sex, race, and income are used as independent variables from BRFSS. The variables except
for age are categorical variables (table3-2) and are converted to dummy variables for
analysis. Also, a variable of number of household members are created by using variables,
number of adults and number of children, from BRFSS. To capture the difference in effect of
marital status by sex, the interaction term of marital status by sex were created.
Economic characteristics variables from ACS and NAICS
The amount of fruits and vegetables consumption depends on the area of residence.
Therefore, some neighborhood characteristics are selected as independent variables.
Population and Economic characteristics such as median household income by zip code area
are selected from the American Community Survey (ACS) administered by the Bureau of the
Census. The information about size and amount of grocery stores by zip code is selected from
the North American Industry Classification System (NAICS). Both 2011 and 2013 data were
used for ACS and NAICS.
SNAP and SNAP-Ed related variables
DES office distance
As one of the proxy of SNAP participation, the distance from each zip code to Arizona
Department of Economic Security (DES) office that a person can register SNAP participation
FFY2017 SNAP-Ed Annual Report 293 January 2018
was used. The data for the distance between a DES office and the respondent’s zip code area
(“distance”) was taken from both the DES office locator on the DES website and Google
Map. Since DES office locator lacked or gave wrong results to some zip code, the following
steps were taken to determine the distance variable. First, search the distance on DES office
locator, and use it if it is smaller than 60 miles. Second, if it is larger than 60 miles, search the
same distance on Google Map and take the smaller distance. Third, if the DES office locator
did not return the results, take the distance between the DES office of the nearest zip code
and the zip code on Google Map.
SNAP partnerships
The Arizona Community Action Association (ACAA) is the entity contracting with the
Arizona DES responsible for enrolling and supporting SNAP partnerships. SNAP
partnerships provide low-income households with information about the availability,
eligibility requirements, application procedures, and benefits of SNAP. Data on SNAP
partnership provided by the Arizona DES and ACAA includes the zip codes of SNAP
partnerships sites providing SNAP enrollment information and coded as dummy variable.
SNAP-Ed intervention
Data about SNAP-Ed intervention, provided by Arizona Nutrition Network (AzNN), includes
the number of SNAP-Ed contractors by county in Arizona in 2011 and 2013. Although each
SNAP-Ed contractor aims at different goals and the scale and scope of the intervention varies
by each contractor, this research uses only the number of SNAP-Ed contractors as SNAP-Ed
variable and ignored other aspects of the intervention due to the lack of dataset.
This study created two variables to measure the SNAP-Ed intervention reach. The first
variable is the number of contractors per poor population in a county. The number of
contractors is divided by the population under 125% poverty line, which is a proxy for
FFY2017 SNAP-Ed Annual Report 294 January 2018
SNAP-Ed eligibility. The second variable is the number of contractors per square mile, which
suggests the geographical reach of the intervention. Both variables are numerical variables.
Data merging steps
Datasets from BRFSS, ACS, NAICS, and ACAA are merged by zip code. When there is no
matching zip code in ACS, NAICS, and ACAA, the following steps were taken to match
dataset. First, if the zip code answered in BRFSS indicated a Post Office Box, the zip code
was replaced with the zip code of the post office. Second, if the zip code indicates a specific
place such as 86339, Sedona, the zip code is replaced by the zip code of nearest location such
as 86336, Sedona, which exists in ACS, NAICS, and ACAA. The data of SNAP partnership
was merged by county to BRFSS dataset.
The final sample size
The observations that have missing in SNAP status, age, marital status, income, education,
employment, and county were dropped from the sample. The final sample is consisted of
7,521 observations: 4,667 from 2011 and 2,854 from 2013.
FFY2017 SNAP-Ed Annual Report 295 January 2018
Chapter4 Analysis Settings and Descriptive Statistics
Analysis settings
Eligibility
Molitor et al (2015) and Molitor et al (2016) used only SNAP-Ed eligible sample to measure
the effect of the intervention. Similarly, this study narrowed down the sample to respondents
who are eligible to participate to SNAP to research the effect of SNAP. The eligibility
screening was designed based on the SNAP eligibility that USDA determined
(https://www.fns.usda.gov/snap/eligibility). This study took the upper limit of categorical
income variable (income2) as one’s income and ruled the eligibility as combination of
income and the number of household members (table4-1).
The number of observations about eligibility and actual participation in SNAP is shown at
table4-2. There are 127 people who are not eligible but are getting SNAP benefit. Those
people are not included for analysis due to the following reasons. Firstly, they are small
portion of sample, which is 2.6% of total sample size. Secondly, some responds are not
realistic such as a person with more than $75,000 income and “unable to work”. Hence,
although they are getting SNAP benefits, the analysis targets only at eligible people.
Survey Outliers
CDC noted the responds with more than 16 servings of fruits and 23 servings of vegetables as
survey outliers. Therefore, this study excluded those outliers.
Survey Weighting
BRFSS uses complex survey sampling design that requires a technique to make proper
inferences from dataset. Although the survey aims at collecting a sample that completely
represents the population, it is difficult to conduct a survey in such way. Hence the survey
sample must be interpreted under a correct weighting scheme that represents the full
population.
FFY2017 SNAP-Ed Annual Report 296 January 2018
BRFSS utilizes the ranking weighting methodology. Hence, the analysis must account for the
sampling design using sampling design variables. The variables are _STSTR which accounts
for differences in the basic probability of selection among strata, _LLCPWT which is the
final weight, and _PST which accounts for primary sampling unit. The variables are assigned
to each observation. All the analysis in the following chapters is conducted by SAS
University edition using proc surveymeans, proc surveyfreq, proc surveyreg, or proc
surveylogistic. Since the sample is weighted, means are estimated means with standard error
and 95% confidence interval.
Descriptive statistics
Fruits and vegetable servings by whole sample and the eligible group
Table 4-3 shows the estimated means and standard error of fruits, vegetables, and total
servings for whole sample and eligible group. The t-test is conducted in table 4-4 for the
difference in estimated means between eligible and ineligible groups for whole sample, and
between SNAP participants and nonparticipants for eligible group.
Fruits consumption and vegetable consumption are larger in whole sample than the eligible
group, and the difference between eligible and ineligible groups are statistically significant in
both fruits and vegetables. Among the eligible group, there is no statistical difference in fruits
and vegetable consumption between SNAP participants and nonparticipants.
The eligible group has lower means than whole sample by 7.2 point for fruits consumptions,
13.5 points for vegetables consumptions, and 20.9 points for total servings.
Independent variables by whole sample
In the whole sample (n=7516), SNAP eligible people (n=2408) are more likely to be young,
female, American Indian or Hispanic, and single (divorced, widowed, separated, or never
married) than married with no job (unemployed or unable to work) (table4-5). Also, their
educational statuses are lower than college degree and their income is lower than ineligible
FFY2017 SNAP-Ed Annual Report 297 January 2018
group. Geographically, they are more likely to live in Apache, La Paz, Mohave, and Yuma
than ineligible group. There are more grocery stores in their zip code areas and the population
density per zip code is higher. Also, the areas they live have more SNAP participation
partners who help them sign up to participate in SNAP than the areas that ineligible group
live as well as more SNAP-Ed contractors per person.
Independent variables by eligible group
In our sample, SNAP participants (n=815) among SNAP eligible people are more likely to be
young, American Indian, separated, unable to work, and more likely to live in Apache county
(table4-6). They have lower income than nonparticipants. However, there are no significant
differences in educational status, and availability of grocery stores between SNAP
participants and no participants.
FFY2017 SNAP-Ed Annual Report 298 January 2018
Chapter 5 Who Are the SNAP Participants?
To examine the determinants of SNAP participation among eligible people, the eligible group
was used for the analysis with probit model. Table 5-1 shows the coefficient and t-value. The
coefficients of probit model do not describe the magnitude of the likeliness of SNAP
participation but describe the sign of the probability to participate in SNAP compared to the
default person. In this model, the default person is set as age over 65, college graduate,
retired, White, married female. The characteristics of default person are chosen based on the
demographic of whole sample. They are the most frequent categories appeared in the sample.
For example, “retired” was the category that appeared most in the employment variable.
Demographic variables
People who are younger than 65 and who have lower education than college graduate are
more likely to participate in SNAP. Also, people who are unable to work are more likely to
participate than retired people. American Indians are more likely to participate than White.
Unmarried couple regardless of sex, and divorced, separated, and never married female are
more likely to participate in SNAP than married female.
SNAP related variables
Two variables, distance and SNAP partnership, were examined for the participation to SNAP.
The distance variable was positive and significant, which means if the person lives further
from the DES office, he or she is more likely to participate in SNAP. This was an unexpected
finding since it was assumed that if the person lives closer to the office, he or she is more
likely to participate. SNAP partner variable was not significant, which means whether the zip
code site has SNAP partnerships or not does not affect SNAP participation.
FFY2017 SNAP-Ed Annual Report 299 January 2018
Prediction table
Table 5-2 shows the prediction accuracy from the probit model. The correct prediction rate is
71.8% including 73.6% true negative prediction and 64.3% true positive prediction.
FFY2017 SNAP-Ed Annual Report 300 January 2018
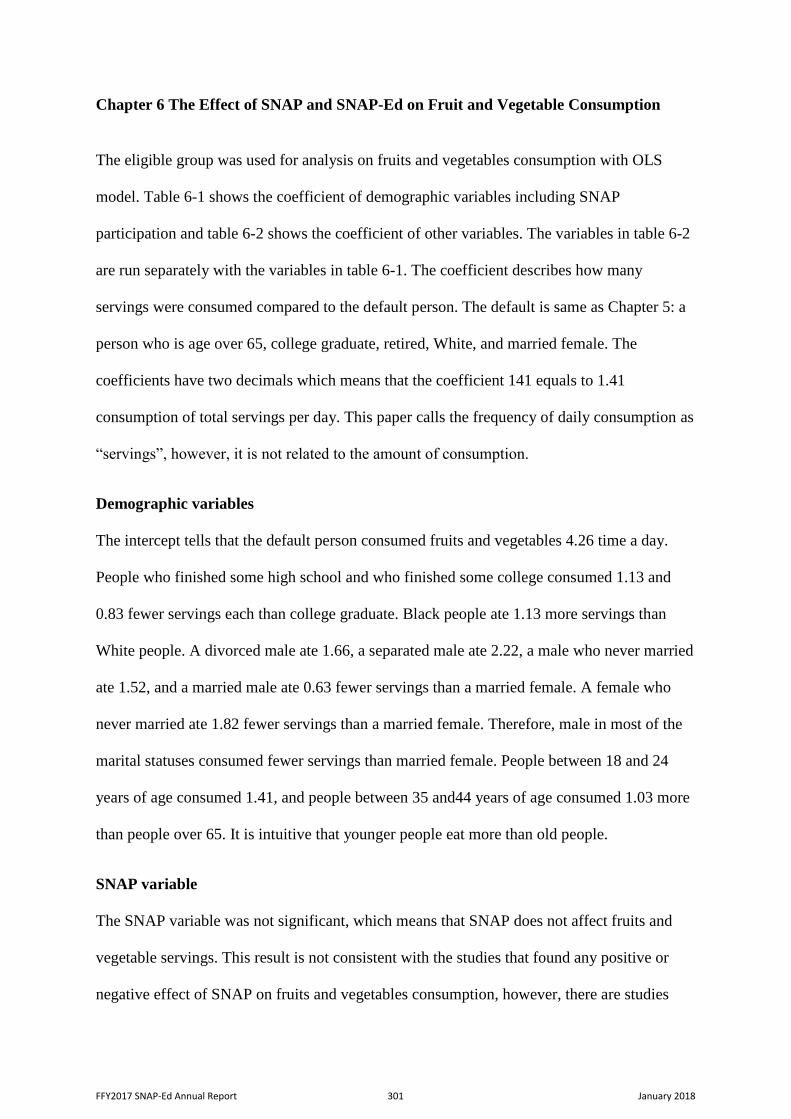
Chapter 6 The Effect of SNAP and SNAP-Ed on Fruit and Vegetable Consumption
The eligible group was used for analysis on fruits and vegetables consumption with OLS
model. Table 6-1 shows the coefficient of demographic variables including SNAP
participation and table 6-2 shows the coefficient of other variables. The variables in table 6-2
are run separately with the variables in table 6-1. The coefficient describes how many
servings were consumed compared to the default person. The default is same as Chapter 5: a
person who is age over 65, college graduate, retired, White, and married female. The
coefficients have two decimals which means that the coefficient 141 equals to 1.41
consumption of total servings per day. This paper calls the frequency of daily consumption as
“servings”, however, it is not related to the amount of consumption.
Demographic variables
The intercept tells that the default person consumed fruits and vegetables 4.26 time a day.
People who finished some high school and who finished some college consumed 1.13 and
0.83 fewer servings each than college graduate. Black people ate 1.13 more servings than
White people. A divorced male ate 1.66, a separated male ate 2.22, a male who never married
ate 1.52, and a married male ate 0.63 fewer servings than a married female. A female who
never married ate 1.82 fewer servings than a married female. Therefore, male in most of the
marital statuses consumed fewer servings than married female. People between 18 and 24
years of age consumed 1.41, and people between 35 and44 years of age consumed 1.03 more
than people over 65. It is intuitive that younger people eat more than old people.
SNAP variable
The SNAP variable was not significant, which means that SNAP does not affect fruits and
vegetable servings. This result is not consistent with the studies that found any positive or
negative effect of SNAP on fruits and vegetables consumption, however, there are studies
FFY2017 SNAP-Ed Annual Report 301 January 2018
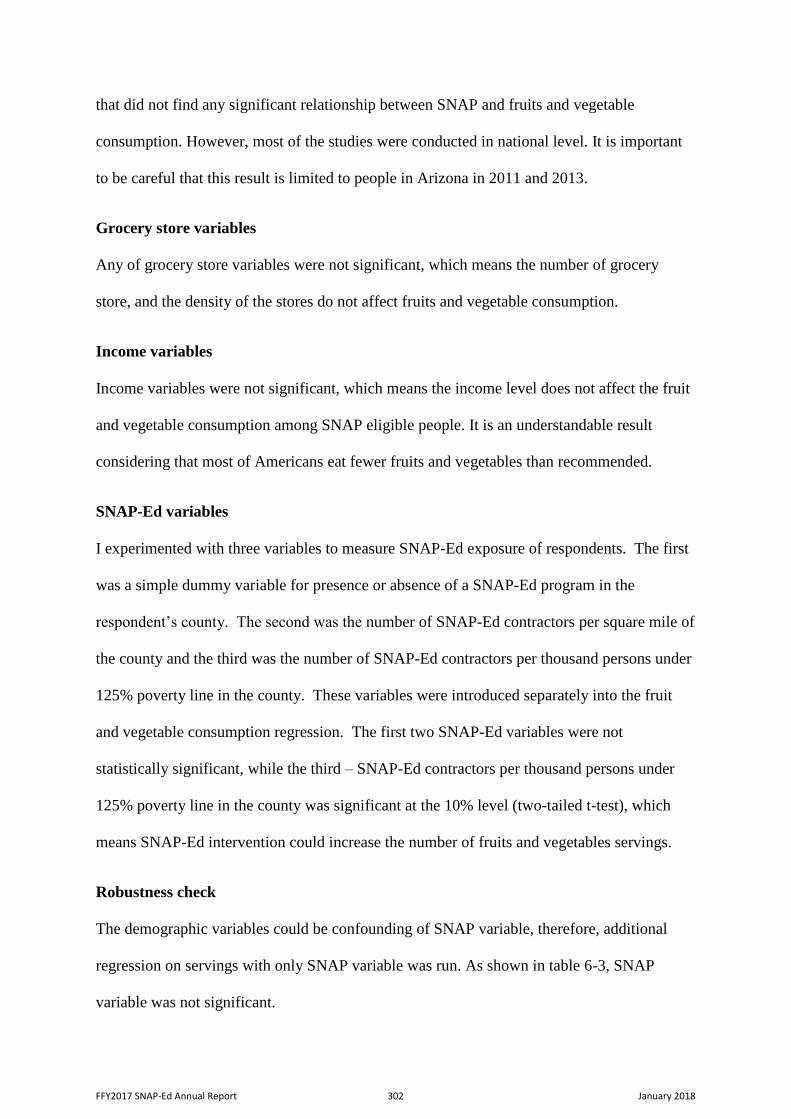
that did not find any significant relationship between SNAP and fruits and vegetable
consumption. However, most of the studies were conducted in national level. It is important
to be careful that this result is limited to people in Arizona in 2011 and 2013.
Grocery store variables
Any of grocery store variables were not significant, which means the number of grocery
store, and the density of the stores do not affect fruits and vegetable consumption.
Income variables
Income variables were not significant, which means the income level does not affect the fruit
and vegetable consumption among SNAP eligible people. It is an understandable result
considering that most of Americans eat fewer fruits and vegetables than recommended.
SNAP-Ed variables
I experimented with three variables to measure SNAP-Ed exposure of respondents. The first
was a simple dummy variable for presence or absence of a SNAP-Ed program in the
respondent’s county. The second was the number of SNAP-Ed contractors per square mile of
the county and the third was the number of SNAP-Ed contractors per thousand persons under
125% poverty line in the county. These variables were introduced separately into the fruit
and vegetable consumption regression. The first two SNAP-Ed variables were not
statistically significant, while the third – SNAP-Ed contractors per thousand persons under
125% poverty line in the county was significant at the 10% level (two-tailed t-test), which
means SNAP-Ed intervention could increase the number of fruits and vegetables servings.
Robustness check
The demographic variables could be confounding of SNAP variable, therefore, additional
regression on servings with only SNAP variable was run. As shown in table 6-3, SNAP
variable was not significant.
FFY2017 SNAP-Ed Annual Report 302 January 2018
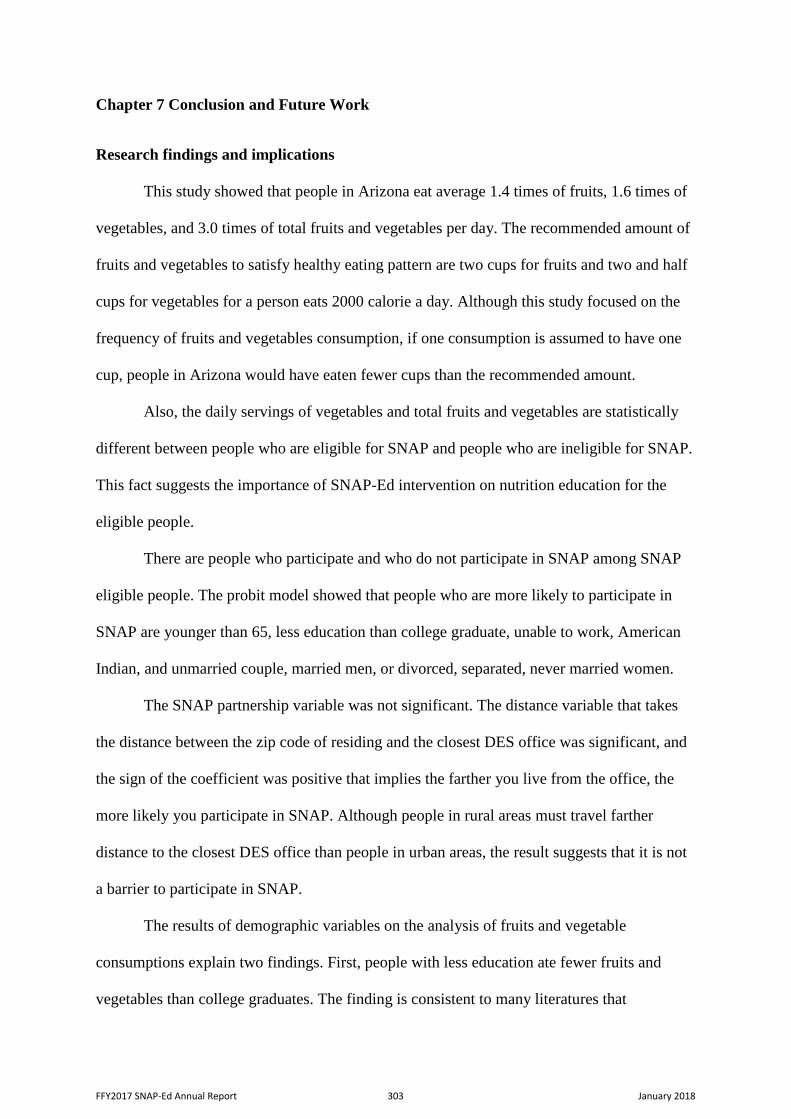
Chapter 7 Conclusion and Future Work
Research findings and implications
This study showed that people in Arizona eat average 1.4 times of fruits, 1.6 times of
vegetables, and 3.0 times of total fruits and vegetables per day. The recommended amount of
fruits and vegetables to satisfy healthy eating pattern are two cups for fruits and two and half
cups for vegetables for a person eats 2000 calorie a day. Although this study focused on the
frequency of fruits and vegetables consumption, if one consumption is assumed to have one
cup, people in Arizona would have eaten fewer cups than the recommended amount.
Also, the daily servings of vegetables and total fruits and vegetables are statistically
different between people who are eligible for SNAP and people who are ineligible for SNAP.
This fact suggests the importance of SNAP-Ed intervention on nutrition education for the
eligible people.
There are people who participate and who do not participate in SNAP among SNAP
eligible people. The probit model showed that people who are more likely to participate in
SNAP are younger than 65, less education than college graduate, unable to work, American
Indian, and unmarried couple, married men, or divorced, separated, never married women.
The SNAP partnership variable was not significant. The distance variable that takes
the distance between the zip code of residing and the closest DES office was significant, and
the sign of the coefficient was positive that implies the farther you live from the office, the
more likely you participate in SNAP. Although people in rural areas must travel farther
distance to the closest DES office than people in urban areas, the result suggests that it is not
a barrier to participate in SNAP.
The results of demographic variables on the analysis of fruits and vegetable
consumptions explain two findings. First, people with less education ate fewer fruits and
vegetables than college graduates. The finding is consistent to many literatures that
FFY2017 SNAP-Ed Annual Report 303 January 2018
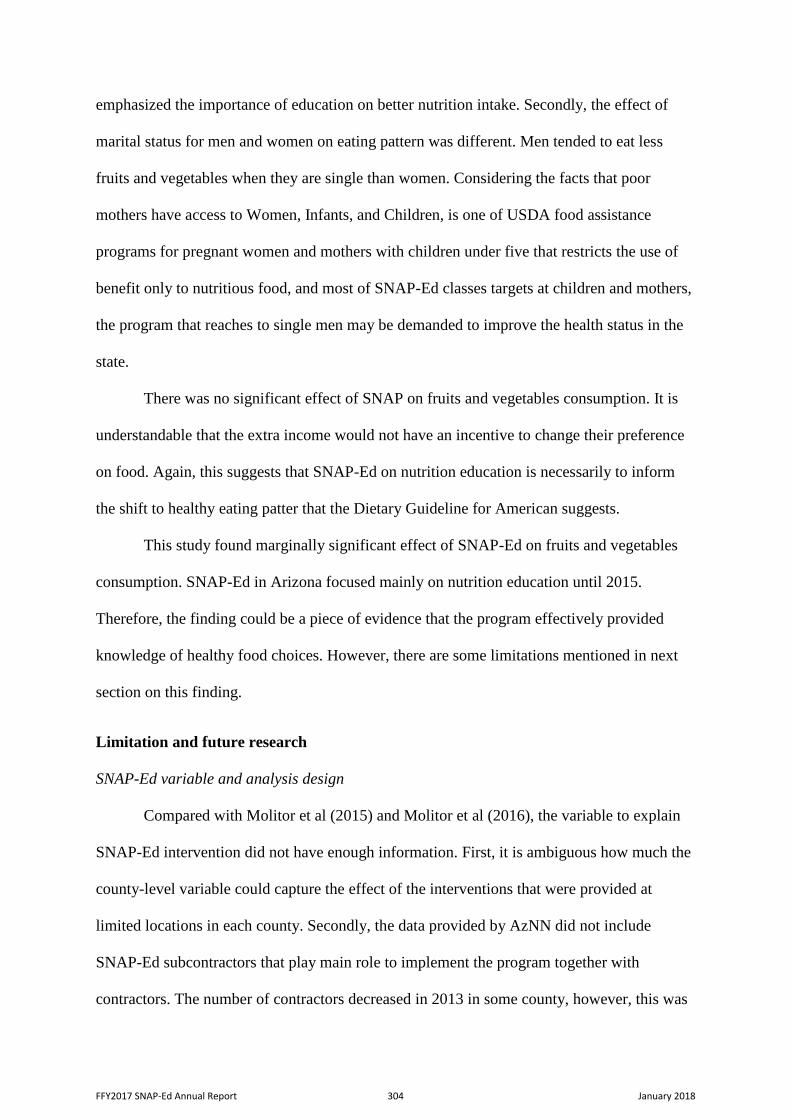
emphasized the importance of education on better nutrition intake. Secondly, the effect of
marital status for men and women on eating pattern was different. Men tended to eat less
fruits and vegetables when they are single than women. Considering the facts that poor
mothers have access to Women, Infants, and Children, is one of USDA food assistance
programs for pregnant women and mothers with children under five that restricts the use of
benefit only to nutritious food, and most of SNAP-Ed classes targets at children and mothers,
the program that reaches to single men may be demanded to improve the health status in the
state.
There was no significant effect of SNAP on fruits and vegetables consumption. It is
understandable that the extra income would not have an incentive to change their preference
on food. Again, this suggests that SNAP-Ed on nutrition education is necessarily to inform
the shift to healthy eating patter that the Dietary Guideline for American suggests.
This study found marginally significant effect of SNAP-Ed on fruits and vegetables
consumption. SNAP-Ed in Arizona focused mainly on nutrition education until 2015.
Therefore, the finding could be a piece of evidence that the program effectively provided
knowledge of healthy food choices. However, there are some limitations mentioned in next
section on this finding.
Limitation and future research
SNAP-Ed variable and analysis design
Compared with Molitor et al (2015) and Molitor et al (2016), the variable to explain
SNAP-Ed intervention did not have enough information. First, it is ambiguous how much the
county-level variable could capture the effect of the interventions that were provided at
limited locations in each county. Secondly, the data provided by AzNN did not include
SNAP-Ed subcontractors that play main role to implement the program together with
contractors. The number of contractors decreased in 2013 in some county, however, this was
FFY2017 SNAP-Ed Annual Report 304 January 2018
because the contracts were taken over by the subcontractors and it did not mean the number
of intervention decreased. For future work, the data that represents individual SNAP-Ed
participation and comprehensive SNAP-Ed interventions by census tracts or zip code area are
essential to evaluate the effect accurately and to have better understanding on the intervention
consequences. The data from EARS would be ideal for the evaluation.
In addition to the variable itself, there are two points to mention on the analysis of
SNAP-Ed. Firstly, this study did not test the selection bias of SNAP-Ed among adults who
chosen to attend the classes by themselves. This is related with the second point that the
analysis should be conducted to the target population of SNAP-Ed interventions which are
mainly mothers and children in poor neighborhood for current intervention reach. To sum up,
the analysis design should incorporate the characteristics of SNAP-Ed participants and should
address a possible selection bias.
Outcome variable
This study used the aggregated variable of fruits and vegetables consumption,
however, it could be more intuitive to run the regression separately on fruits and vegetables.
Fruits are easier to intake than vegetables because some fruits such as apples and bananas are
available at most of the small grocery stores and they do not need preparation before eating.
Therefore, the effect of nutrition education may be reflected more on fruits consumption than
vegetables.
Also, the selection of outcome variables should be carefully examined to reflect the focus
of SNAP-Ed in each year. For example, SNAP-Ed in Arizona shifted the programs from nutrition
education to active exercise since 2014. In this case, the outcome variable will be related with the
body conditions or exercise time and frequency rather than the food intake.
FFY2017 SNAP-Ed Annual Report 305 January 2018
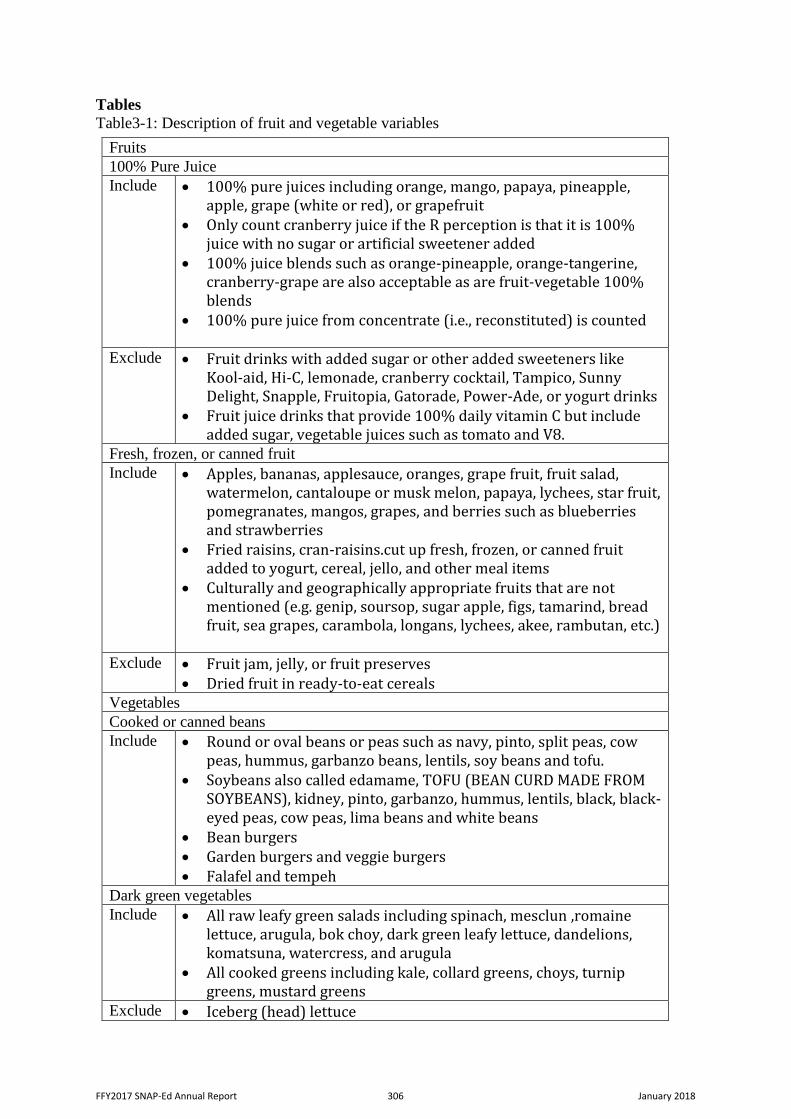
Tables
Table3-1: Description of fruit and vegetable variables
Fruits
100% Pure Juice
Include • 100% pure juices including orange, mango, papaya, pineapple, apple, grape (white or red), or grapefruit
• Only count cranberry juice if the R perception is that it is 100% juice with no sugar or artificial sweetener added
• 100% juice blends such as orange-pineapple, orange-tangerine, cranberry-grape are also acceptable as are fruit-vegetable 100% blends
• 100% pure juice from concentrate (i.e., reconstituted) is counted
Exclude • Fruit drinks with added sugar or other added sweeteners like Kool-aid, Hi-C, lemonade, cranberry cocktail, Tampico, Sunny Delight, Snapple, Fruitopia, Gatorade, Power-Ade, or yogurt drinks
• Fruit juice drinks that provide 100% daily vitamin C but include added sugar, vegetable juices such as tomato and V8.
Fresh, frozen, or canned fruit
Include • Apples, bananas, applesauce, oranges, grape fruit, fruit salad, watermelon, cantaloupe or musk melon, papaya, lychees, star fruit, pomegranates, mangos, grapes, and berries such as blueberries and strawberries
• Fried raisins, cran-raisins.cut up fresh, frozen, or canned fruit added to yogurt, cereal, jello, and other meal items
• Culturally and geographically appropriate fruits that are not mentioned (e.g. genip, soursop, sugar apple, figs, tamarind, bread fruit, sea grapes, carambola, longans, lychees, akee, rambutan, etc.)
Exclude • Fruit jam, jelly, or fruit preserves • Dried fruit in ready-to-eat cereals
Vegetables
Cooked or canned beans
Include • Round or oval beans or peas such as navy, pinto, split peas, cow peas, hummus, garbanzo beans, lentils, soy beans and tofu.
• Soybeans also called edamame, TOFU (BEAN CURD MADE FROM SOYBEANS), kidney, pinto, garbanzo, hummus, lentils, black, black-eyed peas, cow peas, lima beans and white beans
• Bean burgers • Garden burgers and veggie burgers • Falafel and tempeh
Dark green vegetables
Include • All raw leafy green salads including spinach, mesclun ,romaine lettuce, arugula, bok choy, dark green leafy lettuce, dandelions, komatsuna, watercress, and arugula
• All cooked greens including kale, collard greens, choys, turnip greens, mustard greens
Exclude • Iceberg (head) lettuce
FFY2017 SNAP-Ed Annual Report 306 January 2018
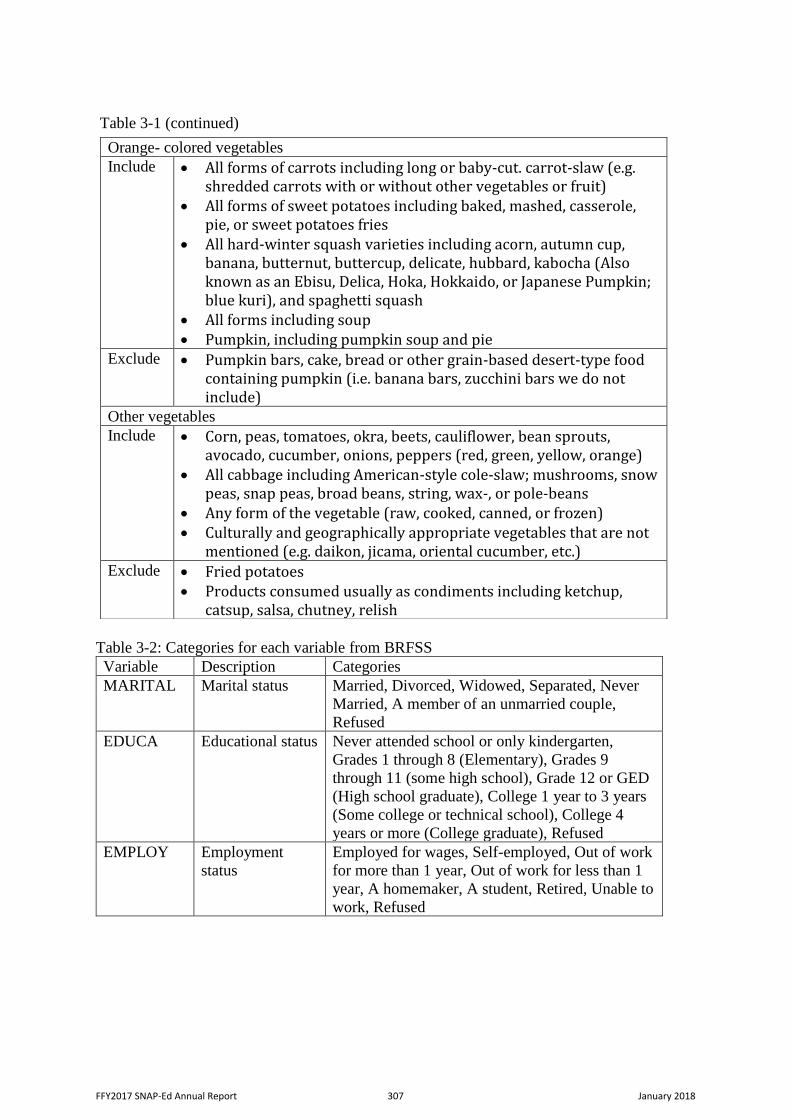
Table 3-1 (continued)
Table 3-2: Categories for each variable from BRFSS
Variable Description Categories
MARITAL Marital status Married, Divorced, Widowed, Separated, Never
Married, A member of an unmarried couple,
Refused
EDUCA Educational status Never attended school or only kindergarten,
Grades 1 through 8 (Elementary), Grades 9
through 11 (some high school), Grade 12 or GED
(High school graduate), College 1 year to 3 years
(Some college or technical school), College 4
years or more (College graduate), Refused
EMPLOY Employment
status
Employed for wages, Self-employed, Out of work
for more than 1 year, Out of work for less than 1
year, A homemaker, A student, Retired, Unable to
work, Refused
Orange- colored vegetables
Include • All forms of carrots including long or baby-cut. carrot-slaw (e.g. shredded carrots with or without other vegetables or fruit)
• All forms of sweet potatoes including baked, mashed, casserole, pie, or sweet potatoes fries
• All hard-winter squash varieties including acorn, autumn cup, banana, butternut, buttercup, delicate, hubbard, kabocha (Also known as an Ebisu, Delica, Hoka, Hokkaido, or Japanese Pumpkin; blue kuri), and spaghetti squash
• All forms including soup • Pumpkin, including pumpkin soup and pie
Exclude • Pumpkin bars, cake, bread or other grain-based desert-type food containing pumpkin (i.e. banana bars, zucchini bars we do not include)
Other vegetables
Include • Corn, peas, tomatoes, okra, beets, cauliflower, bean sprouts, avocado, cucumber, onions, peppers (red, green, yellow, orange)
• All cabbage including American-style cole-slaw; mushrooms, snow peas, snap peas, broad beans, string, wax-, or pole-beans
• Any form of the vegetable (raw, cooked, canned, or frozen) • Culturally and geographically appropriate vegetables that are not
mentioned (e.g. daikon, jicama, oriental cucumber, etc.) Exclude • Fried potatoes
• Products consumed usually as condiments including ketchup, catsup, salsa, chutney, relish
FFY2017 SNAP-Ed Annual Report 307 January 2018
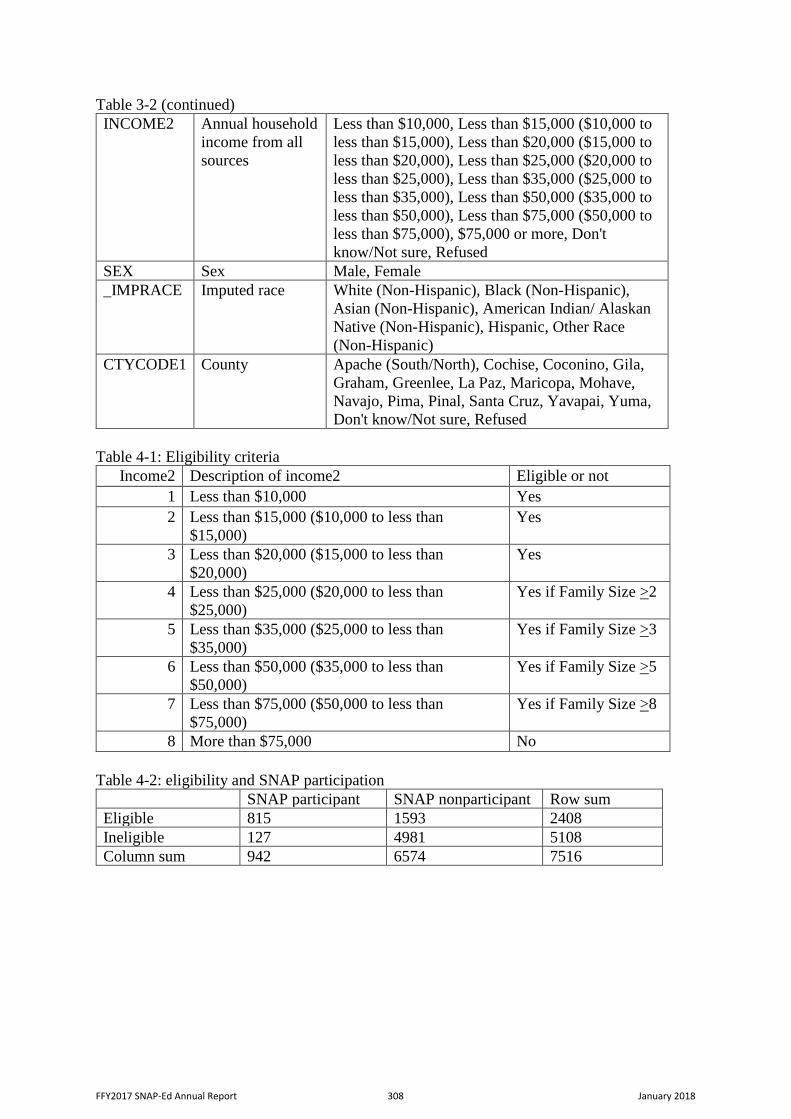
Table 3-2 (continued)
INCOME2 Annual household
income from all
sources
Less than $10,000, Less than $15,000 ($10,000 to
less than $15,000), Less than $20,000 ($15,000 to
less than $20,000), Less than $25,000 ($20,000 to
less than $25,000), Less than $35,000 ($25,000 to
less than $35,000), Less than $50,000 ($35,000 to
less than $50,000), Less than $75,000 ($50,000 to
less than $75,000), $75,000 or more, Don't
know/Not sure, Refused
SEX Sex Male, Female
_IMPRACE Imputed race White (Non-Hispanic), Black (Non-Hispanic),
Asian (Non-Hispanic), American Indian/ Alaskan
Native (Non-Hispanic), Hispanic, Other Race
(Non-Hispanic)
CTYCODE1 County Apache (South/North), Cochise, Coconino, Gila,
Graham, Greenlee, La Paz, Maricopa, Mohave,
Navajo, Pima, Pinal, Santa Cruz, Yavapai, Yuma,
Don't know/Not sure, Refused
Table 4-1: Eligibility criteria
Income2 Description of income2 Eligible or not
1 Less than $10,000 Yes
2 Less than $15,000 ($10,000 to less than
$15,000)
Yes
3 Less than $20,000 ($15,000 to less than
$20,000)
Yes
4 Less than $25,000 ($20,000 to less than
$25,000)
Yes if Family Size >2
5 Less than $35,000 ($25,000 to less than
$35,000)
Yes if Family Size >3
6 Less than $50,000 ($35,000 to less than
$50,000)
Yes if Family Size >5
7 Less than $75,000 ($50,000 to less than
$75,000)
Yes if Family Size >8
8 More than $75,000 No
Table 4-2: eligibility and SNAP participation
SNAP participant SNAP nonparticipant Row sum
Eligible 815 1593 2408
Ineligible 127 4981 5108
Column sum 942 6574 7516
FFY2017 SNAP-Ed Annual Report 308 January 2018
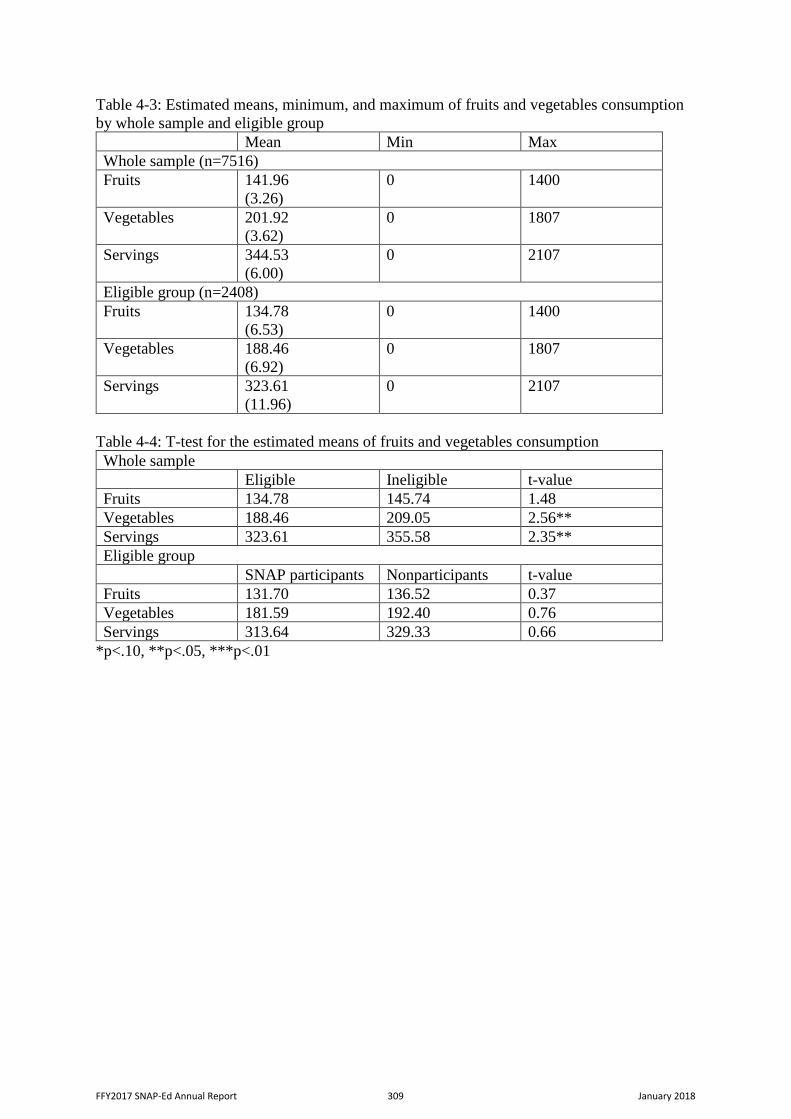
Table 4-3: Estimated means, minimum, and maximum of fruits and vegetables consumption
by whole sample and eligible group
Mean Min Max
Whole sample (n=7516)
Fruits 141.96
(3.26)
0 1400
Vegetables 201.92
(3.62)
0 1807
Servings 344.53
(6.00)
0 2107
Eligible group (n=2408)
Fruits 134.78
(6.53)
0 1400
Vegetables 188.46
(6.92)
0 1807
Servings 323.61
(11.96)
0 2107
Table 4-4: T-test for the estimated means of fruits and vegetables consumption
Whole sample
Eligible Ineligible t-value
Fruits 134.78 145.74 1.48
Vegetables 188.46 209.05 2.56**
Servings 323.61 355.58 2.35**
Eligible group
SNAP participants Nonparticipants t-value
Fruits 131.70 136.52 0.37
Vegetables 181.59 192.40 0.76
Servings 313.64 329.33 0.66
*p<.10, **p<.05, ***p<.01
FFY2017 SNAP-Ed Annual Report 309 January 2018
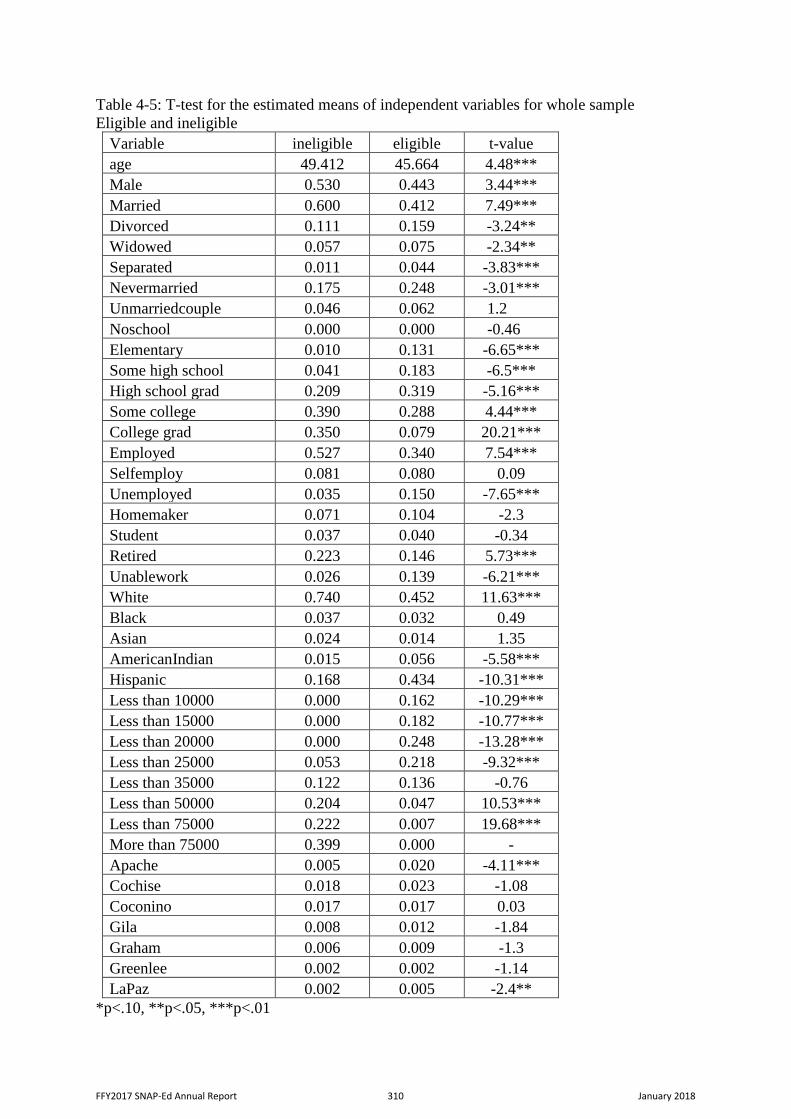
Table 4-5: T-test for the estimated means of independent variables for whole sample
Eligible and ineligible
Variable ineligible eligible t-value
age 49.412 45.664 4.48***
Male 0.530 0.443 3.44***
Married 0.600 0.412 7.49***
Divorced 0.111 0.159 -3.24**
Widowed 0.057 0.075 -2.34**
Separated 0.011 0.044 -3.83***
Nevermarried 0.175 0.248 -3.01***
Unmarriedcouple 0.046 0.062 1.2
Noschool 0.000 0.000 -0.46
Elementary 0.010 0.131 -6.65***
Some high school 0.041 0.183 -6.5***
High school grad 0.209 0.319 -5.16***
Some college 0.390 0.288 4.44***
College grad 0.350 0.079 20.21***
Employed 0.527 0.340 7.54***
Selfemploy 0.081 0.080 0.09
Unemployed 0.035 0.150 -7.65***
Homemaker 0.071 0.104 -2.3
Student 0.037 0.040 -0.34
Retired 0.223 0.146 5.73***
Unablework 0.026 0.139 -6.21***
White 0.740 0.452 11.63***
Black 0.037 0.032 0.49
Asian 0.024 0.014 1.35
AmericanIndian 0.015 0.056 -5.58***
Hispanic 0.168 0.434 -10.31***
Less than 10000 0.000 0.162 -10.29***
Less than 15000 0.000 0.182 -10.77***
Less than 20000 0.000 0.248 -13.28***
Less than 25000 0.053 0.218 -9.32***
Less than 35000 0.122 0.136 -0.76
Less than 50000 0.204 0.047 10.53***
Less than 75000 0.222 0.007 19.68***
More than 75000 0.399 0.000 -
Apache 0.005 0.020 -4.11***
Cochise 0.018 0.023 -1.08
Coconino 0.017 0.017 0.03
Gila 0.008 0.012 -1.84
Graham 0.006 0.009 -1.3
Greenlee 0.002 0.002 -1.14
LaPaz 0.002 0.005 -2.4**
*p<.10, **p<.05, ***p<.01
FFY2017 SNAP-Ed Annual Report 310 January 2018
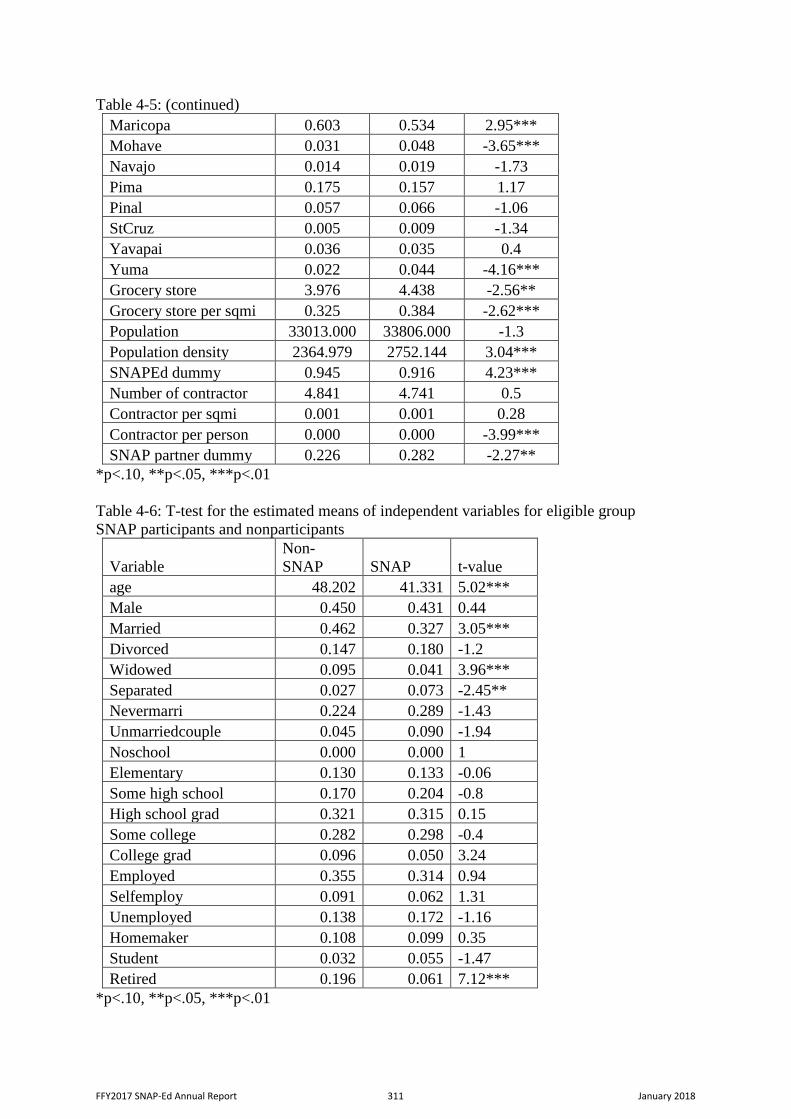
Table 4-5: (continued)
Maricopa 0.603 0.534 2.95***
Mohave 0.031 0.048 -3.65***
Navajo 0.014 0.019 -1.73
Pima 0.175 0.157 1.17
Pinal 0.057 0.066 -1.06
StCruz 0.005 0.009 -1.34
Yavapai 0.036 0.035 0.4
Yuma 0.022 0.044 -4.16***
Grocery store 3.976 4.438 -2.56**
Grocery store per sqmi 0.325 0.384 -2.62***
Population 33013.000 33806.000 -1.3
Population density 2364.979 2752.144 3.04***
SNAPEd dummy 0.945 0.916 4.23***
Number of contractor 4.841 4.741 0.5
Contractor per sqmi 0.001 0.001 0.28
Contractor per person 0.000 0.000 -3.99***
SNAP partner dummy 0.226 0.282 -2.27**
*p<.10, **p<.05, ***p<.01
Table 4-6: T-test for the estimated means of independent variables for eligible group
SNAP participants and nonparticipants
Variable
Non-
SNAP SNAP t-value
age 48.202 41.331 5.02***
Male 0.450 0.431 0.44
Married 0.462 0.327 3.05***
Divorced 0.147 0.180 -1.2
Widowed 0.095 0.041 3.96***
Separated 0.027 0.073 -2.45**
Nevermarri 0.224 0.289 -1.43
Unmarriedcouple 0.045 0.090 -1.94
Noschool 0.000 0.000 1
Elementary 0.130 0.133 -0.06
Some high school 0.170 0.204 -0.8
High school grad 0.321 0.315 0.15
Some college 0.282 0.298 -0.4
College grad 0.096 0.050 3.24
Employed 0.355 0.314 0.94
Selfemploy 0.091 0.062 1.31
Unemployed 0.138 0.172 -1.16
Homemaker 0.108 0.099 0.35
Student 0.032 0.055 -1.47
Retired 0.196 0.061 7.12***
*p<.10, **p<.05, ***p<.01
FFY2017 SNAP-Ed Annual Report 311 January 2018
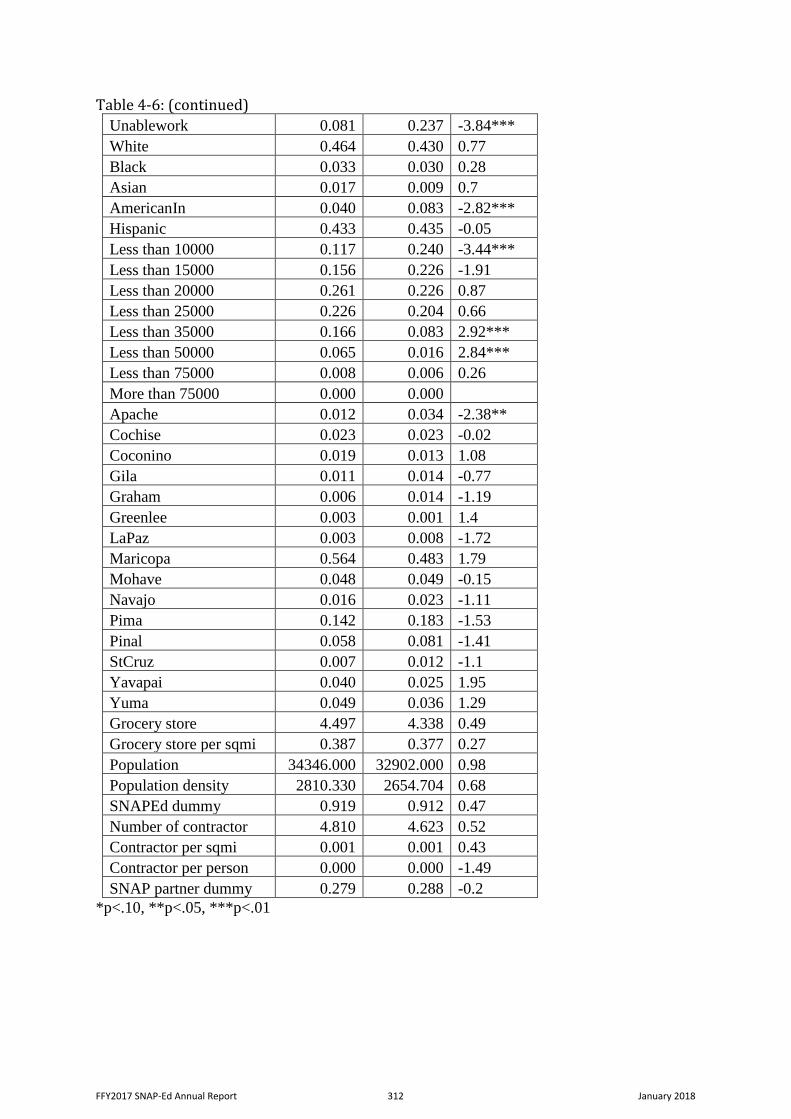
Table 4-6: (continued)
Unablework 0.081 0.237 -3.84***
White 0.464 0.430 0.77
Black 0.033 0.030 0.28
Asian 0.017 0.009 0.7
AmericanIn 0.040 0.083 -2.82***
Hispanic 0.433 0.435 -0.05
Less than 10000 0.117 0.240 -3.44***
Less than 15000 0.156 0.226 -1.91
Less than 20000 0.261 0.226 0.87
Less than 25000 0.226 0.204 0.66
Less than 35000 0.166 0.083 2.92***
Less than 50000 0.065 0.016 2.84***
Less than 75000 0.008 0.006 0.26
More than 75000 0.000 0.000
Apache 0.012 0.034 -2.38**
Cochise 0.023 0.023 -0.02
Coconino 0.019 0.013 1.08
Gila 0.011 0.014 -0.77
Graham 0.006 0.014 -1.19
Greenlee 0.003 0.001 1.4
LaPaz 0.003 0.008 -1.72
Maricopa 0.564 0.483 1.79
Mohave 0.048 0.049 -0.15
Navajo 0.016 0.023 -1.11
Pima 0.142 0.183 -1.53
Pinal 0.058 0.081 -1.41
StCruz 0.007 0.012 -1.1
Yavapai 0.040 0.025 1.95
Yuma 0.049 0.036 1.29
Grocery store 4.497 4.338 0.49
Grocery store per sqmi 0.387 0.377 0.27
Population 34346.000 32902.000 0.98
Population density 2810.330 2654.704 0.68
SNAPEd dummy 0.919 0.912 0.47
Number of contractor 4.810 4.623 0.52
Contractor per sqmi 0.001 0.001 0.43
Contractor per person 0.000 0.000 -1.49
SNAP partner dummy 0.279 0.288 -0.2
*p<.10, **p<.05, ***p<.01
FFY2017 SNAP-Ed Annual Report 312 January 2018
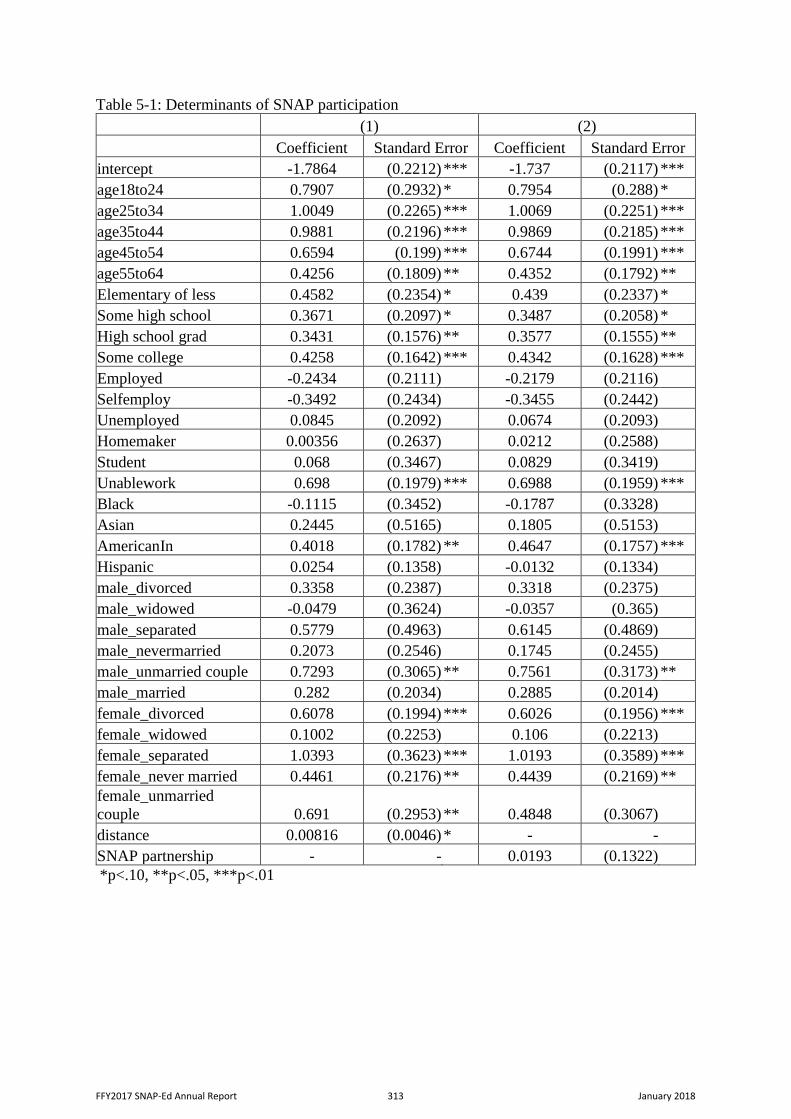
Table 5-1: Determinants of SNAP participation
(1) (2)
Coefficient Standard Error Coefficient Standard Error
intercept -1.7864 (0.2212) *** -1.737 (0.2117) ***
age18to24 0.7907 (0.2932) * 0.7954 (0.288) *
age25to34 1.0049 (0.2265) *** 1.0069 (0.2251) ***
age35to44 0.9881 (0.2196) *** 0.9869 (0.2185) ***
age45to54 0.6594 (0.199) *** 0.6744 (0.1991) ***
age55to64 0.4256 (0.1809) ** 0.4352 (0.1792) **
Elementary of less 0.4582 (0.2354) * 0.439 (0.2337) *
Some high school 0.3671 (0.2097) * 0.3487 (0.2058) *
High school grad 0.3431 (0.1576) ** 0.3577 (0.1555) **
Some college 0.4258 (0.1642) *** 0.4342 (0.1628) ***
Employed -0.2434 (0.2111) -0.2179 (0.2116)
Selfemploy -0.3492 (0.2434) -0.3455 (0.2442)
Unemployed 0.0845 (0.2092) 0.0674 (0.2093)
Homemaker 0.00356 (0.2637) 0.0212 (0.2588)
Student 0.068 (0.3467) 0.0829 (0.3419)
Unablework 0.698 (0.1979) *** 0.6988 (0.1959) ***
Black -0.1115 (0.3452) -0.1787 (0.3328)
Asian 0.2445 (0.5165) 0.1805 (0.5153)
AmericanIn 0.4018 (0.1782) ** 0.4647 (0.1757) ***
Hispanic 0.0254 (0.1358) -0.0132 (0.1334)
male_divorced 0.3358 (0.2387) 0.3318 (0.2375)
male_widowed -0.0479 (0.3624) -0.0357 (0.365)
male_separated 0.5779 (0.4963) 0.6145 (0.4869)
male_nevermarried 0.2073 (0.2546) 0.1745 (0.2455)
male_unmarried couple 0.7293 (0.3065) ** 0.7561 (0.3173) **
male_married 0.282 (0.2034) 0.2885 (0.2014)
female_divorced 0.6078 (0.1994) *** 0.6026 (0.1956) ***
female_widowed 0.1002 (0.2253) 0.106 (0.2213)
female_separated 1.0393 (0.3623) *** 1.0193 (0.3589) ***
female_never married 0.4461 (0.2176) ** 0.4439 (0.2169) **
female_unmarried
couple 0.691 (0.2953) ** 0.4848 (0.3067)
distance 0.00816 (0.0046) * - -
SNAP partnership - - 0.0193 (0.1322)
*p<.10, **p<.05, ***p<.01
FFY2017 SNAP-Ed Annual Report 313 January 2018
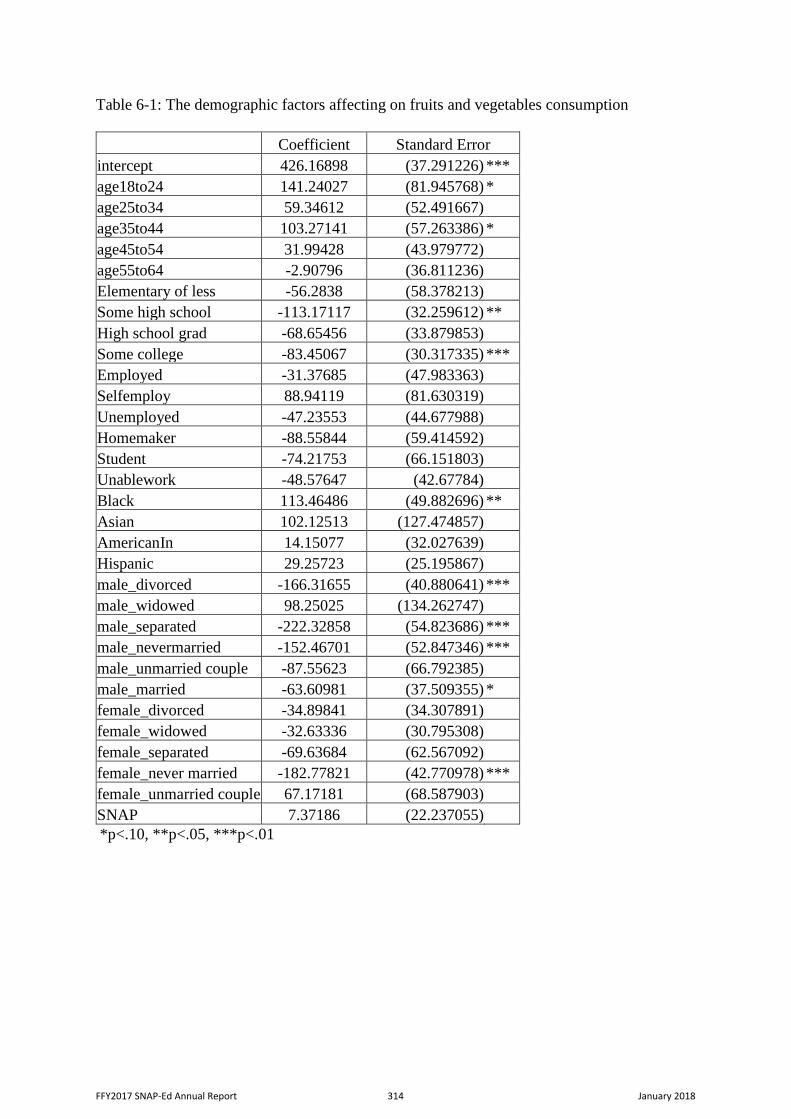
Table 6-1: The demographic factors affecting on fruits and vegetables consumption
Coefficient Standard Error
intercept 426.16898 (37.291226) ***
age18to24 141.24027 (81.945768) *
age25to34 59.34612 (52.491667)
age35to44 103.27141 (57.263386) *
age45to54 31.99428 (43.979772)
age55to64 -2.90796 (36.811236)
Elementary of less -56.2838 (58.378213)
Some high school -113.17117 (32.259612) **
High school grad -68.65456 (33.879853)
Some college -83.45067 (30.317335) ***
Employed -31.37685 (47.983363)
Selfemploy 88.94119 (81.630319)
Unemployed -47.23553 (44.677988)
Homemaker -88.55844 (59.414592)
Student -74.21753 (66.151803)
Unablework -48.57647 (42.67784)
Black 113.46486 (49.882696) **
Asian 102.12513 (127.474857)
AmericanIn 14.15077 (32.027639)
Hispanic 29.25723 (25.195867)
male_divorced -166.31655 (40.880641) ***
male_widowed 98.25025 (134.262747)
male_separated -222.32858 (54.823686) ***
male_nevermarried -152.46701 (52.847346) ***
male_unmarried couple -87.55623 (66.792385)
male_married -63.60981 (37.509355) *
female_divorced -34.89841 (34.307891)
female_widowed -32.63336 (30.795308)
female_separated -69.63684 (62.567092)
female_never married -182.77821 (42.770978) ***
female_unmarried couple 67.17181 (68.587903)
SNAP 7.37186 (22.237055)
*p<.10, **p<.05, ***p<.01
FFY2017 SNAP-Ed Annual Report 314 January 2018
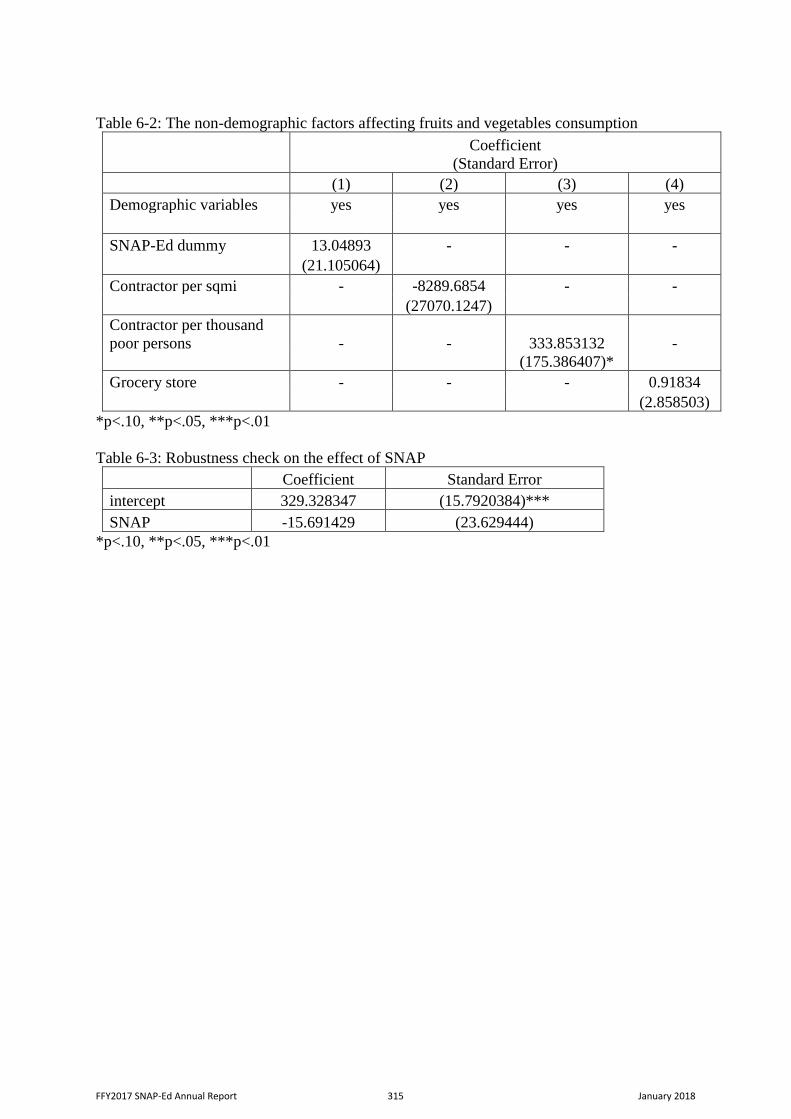
Table 6-2: The non-demographic factors affecting fruits and vegetables consumption
Coefficient
(Standard Error)
(1) (2) (3) (4)
Demographic variables yes yes yes yes
SNAP-Ed dummy 13.04893 - - -
(21.105064)
Contractor per sqmi - -8289.6854 - -
(27070.1247)
Contractor per thousand
poor persons - - 333.853132 -
(175.386407)*
Grocery store - - - 0.91834
(2.858503)
*p<.10, **p<.05, ***p<.01
Table 6-3: Robustness check on the effect of SNAP
Coefficient Standard Error
intercept 329.328347 (15.7920384)***
SNAP -15.691429 (23.629444)
*p<.10, **p<.05, ***p<.01
FFY2017 SNAP-Ed Annual Report 315 January 2018
References
Butler, John S., and Jennie E. Raymond. "The effect of the Food Stamp Program on nutrient
intake." Economic Inquiry 34.4 (1996): 781.
Cason, Katherine L., et al. "Do food stamps without education improve the nutrient intake of
recipients?" Topics in Clinical Nutrition 17.4 (2002): 74-82.
Centers for Disease Control and Prevention. (2013). "Weighting the Data (2011 Weighting
Formula)", Behavioral Risk Factor Surveillance System. 19 Jul. 2013,
<https://www.cdc.gov/brfss/annual_data/2011/2011_weighting.htm>
Centers for Disease Control and Prevention (CDC). Behavioral Risk Factor Surveillance
System Survey Questionnaire. Atlanta, Georgia: U.S. Department of Health and Human
Services, Centers for Disease Control and Prevention, 2011.
Fox, Mary Kay, William Hamilton, and Biing-Hwan Lin. "Effects of food assistance and
nutrition programs on nutrition and health." Food Assistance and Nutrition Research
Report 19-3 (2004).
Garasky, Steven, Kassim Mbwana, Andres Romualdo, Alex Tenaglio and Manan Roy. Foods
Typically Purchased by SNAP Households. Prepared by IMPAQ International, LLC for
USDA, Food and Nutrition Service, November 2016.
Gregory, Christian, et al. "Supplemental Nutrition Assistance Program (SNAP) participation
leads to modest changes in diet quality." Economic Research Report 147 (2013).
Guthrie, Joanne F., et al. "Can food stamps do more to improve food choices." Econ Inform
Bull 29.1 (2007).
Guthrie, Joanne F., et al. "Improving food choices-can Food Stamps do more." Amber
Waves 5 (2007): 46.
Lewis, Taylor H. Complex Survey Data Analysis with SAS. CRC Press, 2016.
Liu, Jane, et al. "Food and drink consumption among 1–5-year-old Los Angeles County
children from households receiving dual SNAP and WIC v. only WIC benefits." Public
Health Nutrition (2016): 1-8.
Long-term Benefits of the Supplemental Nutrition Assistance Program, 2015. Web. 10 May.
2017 <
https://obamawhitehouse.archives.gov/sites/obamawhitehouse.archives.gov/files/documents/
SNAP_report_final_nonembargo.pdf>
FFY2017 SNAP-Ed Annual Report 316 January 2018
Meyerhoefer, Chad D., and Muzhe Yang. "The relationship between food assistance and
health: a review of the literature and empirical strategies for identifying program
effects." Applied Economic Perspectives and Policy (2011): ppr023.
Molitor, Fred, et al. "Peer Reviewed: Reach of Supplemental Nutrition Assistance Program–
Education (SNAP–Ed) Interventions and Nutrition and Physical Activity-Related Outcomes,
California, 2011–2012." Preventing chronic disease 12 (2015).
Molitor, Fred, Sharon B. Sugerman, and Stan Sciortino. "Fruit and Vegetable, Fat, and Sugar-
Sweetened Beverage Intake Among Low-Income Mothers Living in Neighborhoods With
Supplemental Nutrition Assistance Program–Education." Journal of Nutrition Education and
Behavior 48.10 (2016): 683-690.
Mykerezi, Elton, and Bradford Mills. "The impact of food stamp program participation on
household food insecurity." American Journal of Agricultural Economics (2010): aaq072.
Ratcliffe, Caroline, Signe-Mary McKernan, and Sisi Zhang. "How much does the
Supplemental Nutrition Assistance Program reduce food insecurity." American journal of
agricultural economics (2011): aar026.
Subar, Amy F., et al. "Fruit and vegetable intake in the United States: the baseline survey of
the Five A Day for Better Health Program." American Journal of Health Promotion 9.5
(1995): 352-360.
U.S. Department of Agriculture, Estimates of State Supplemental Nutrition Assistance
Program Participation Rate in 2014, by Cunnyngham, Karen. Washington, DC, Jan.2017.
U.S. Department of Agriculture, Food and Nutrition Service, Office of Policy Support,
Characteristics of Supplemental Nutrition Assistance Program Households: Fiscal Year 2015,
by Kelsey Farson Gray, Sarah Fisher, and Sarah Lauffer. Project Officer, Jenny Genser.
Alexandria, VA, 2016.
U.S. Department of Health and Human Services and U.S. Department of Agriculture. 2015–
2020 Dietary Guidelines for Americans. 8th Edition. December 2015.
<http://health.gov/dietaryguidelines/2015/guidelines/>
Ver Ploeg, Michele L., and Katherine L. Ralston. "Food Stamps and obesity: What do we
know." (2008).
Wilde, Parke E., Paul E. McNamara, and Christine K. Ranney. "The effect of income and
food programs on dietary quality: A seemingly unrelated regression analysis with error
components." American Journal of Agricultural Economics (1999): 959-971.
FFY2017 SNAP-Ed Annual Report 317 January 2018
Wolfson, Julia A., and Sara N. Bleich. "Fruit and vegetable consumption and food values:
National patterns in the United States by Supplemental Nutrition Assistance Program
eligibility and cooking frequency." Preventive medicine 76 (2015): 1-7.
Yen, Steven T. "The effects of SNAP and WIC programs on nutrient intakes of
children." Food Policy 35.6 (2010): 576-583.
Yen, Steven T., Donald J. Bruce, and Lisa Jahns. "Supplemental nutrition assistance program
participation and health: Evidence from low‐income individuals in Tennessee."
Contemporary Economic Policy 30.1 (2012): 1-12.
Yen, Steven T., et al. "Food Stamp Program participation and food insecurity: an
instrumental variables approach." American Journal of Agricultural Economics 90.1 (2008):
117-132.
Zagorsky, Jay L., and Patricia K. Smith. "Does the US Food Stamp Program contribute to
adult weight gain?" Economics & Human Biology 7.2 (2009): 246-258.
FFY2017 SNAP-Ed Annual Report 318 January 2018
Appendix F
Social Media and Technology Report
FFY2017 SNAP-Ed Annual Report 319 January 2018
Arizona Department of Health Services (ADHS) /
Arizona Nutrition Network (AzNN)
Social Media &
Technology Research
October 31, 2017
FFY2017 SNAP-Ed Annual Report 320 January 2018
Table of Contents
I. Background & Methodology .................................................... 1 II. Respondent Profile ................................................................... 4
III. Executive Summary ................................................................. 5
IV. Summary of Findings ............................................................... 7
A. Device Ownership & Use .................................................... 7
B. Internet Use .......................................................................... 9
C. Cell Phone Use ................................................................... 13
D. Video Viewing Habits ......................................................... 16
E. Social Media Use ................................................................ 17
F. Music Preferences ............................................................. 20
G. Information and Communications Preferences ............... 22
H. Health Related Device Ownership .................................... 23
I. Eat Well Be Well Website .................................................. 24
Appendix:
A. List of Brands / People Followed on Social Media
B. Questionnaire
FFY2017 SNAP-Ed Annual Report 321 January 2018
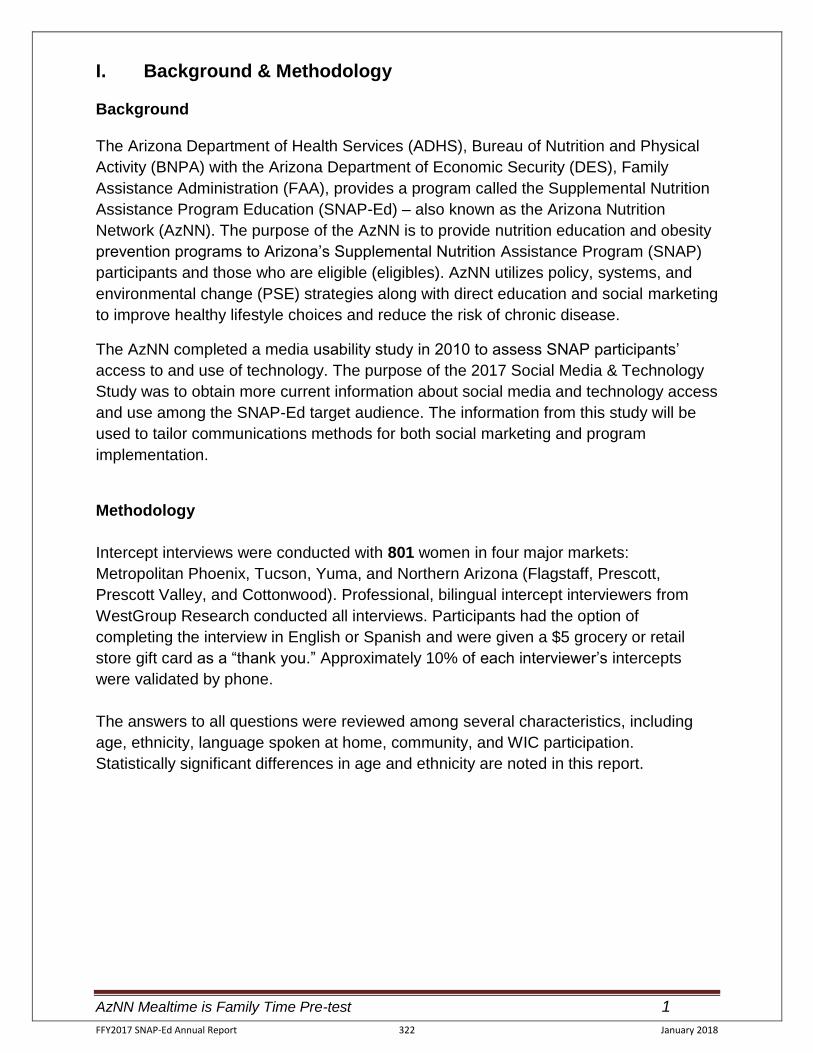
AzNN Mealtime is Family Time Pre-test 1
I. Background & Methodology
Background
The Arizona Department of Health Services (ADHS), Bureau of Nutrition and Physical
Activity (BNPA) with the Arizona Department of Economic Security (DES), Family
Assistance Administration (FAA), provides a program called the Supplemental Nutrition
Assistance Program Education (SNAP-Ed) – also known as the Arizona Nutrition
Network (AzNN). The purpose of the AzNN is to provide nutrition education and obesity
prevention programs to Arizona’s Supplemental Nutrition Assistance Program (SNAP)
participants and those who are eligible (eligibles). AzNN utilizes policy, systems, and
environmental change (PSE) strategies along with direct education and social marketing
to improve healthy lifestyle choices and reduce the risk of chronic disease.
The AzNN completed a media usability study in 2010 to assess SNAP participants’
access to and use of technology. The purpose of the 2017 Social Media & Technology
Study was to obtain more current information about social media and technology access
and use among the SNAP-Ed target audience. The information from this study will be
used to tailor communications methods for both social marketing and program
implementation.
Methodology
Intercept interviews were conducted with 801 women in four major markets:
Metropolitan Phoenix, Tucson, Yuma, and Northern Arizona (Flagstaff, Prescott,
Prescott Valley, and Cottonwood). Professional, bilingual intercept interviewers from
WestGroup Research conducted all interviews. Participants had the option of
completing the interview in English or Spanish and were given a $5 grocery or retail
store gift card as a “thank you.” Approximately 10% of each interviewer’s intercepts
were validated by phone.
The answers to all questions were reviewed among several characteristics, including
age, ethnicity, language spoken at home, community, and WIC participation.
Statistically significant differences in age and ethnicity are noted in this report.
FFY2017 SNAP-Ed Annual Report 322 January 2018
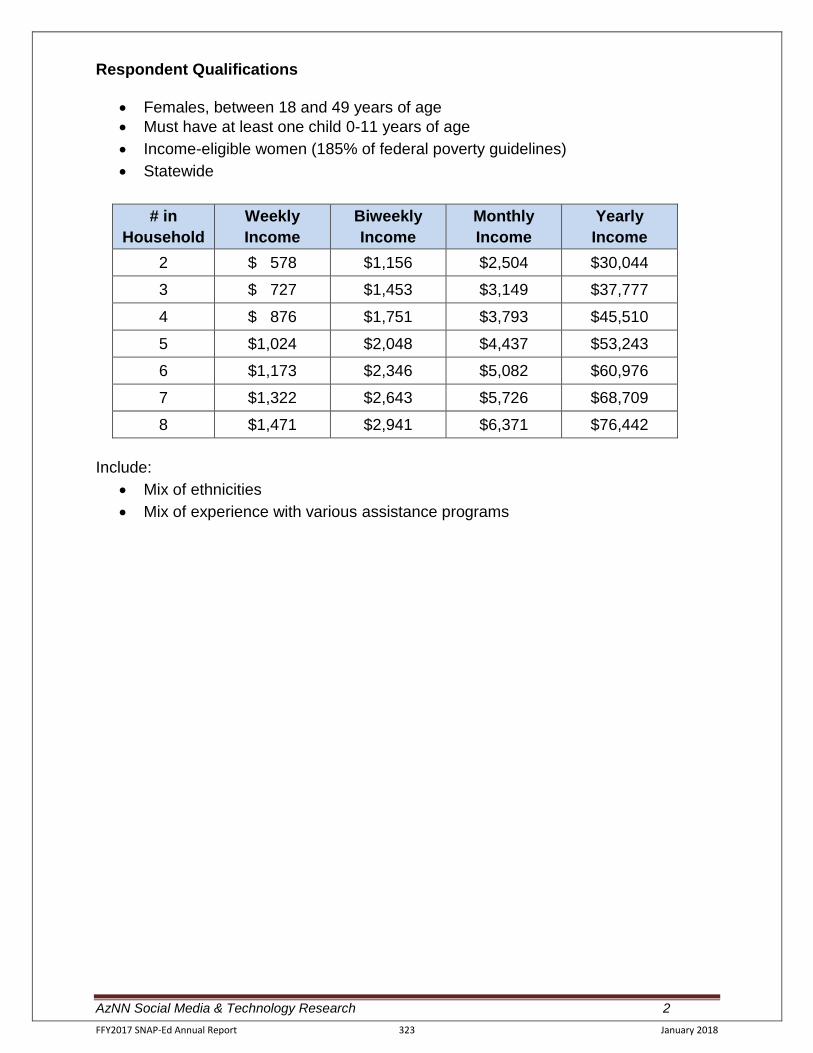
AzNN Social Media & Technology Research 2
Respondent Qualifications
Females, between 18 and 49 years of age
Must have at least one child 0-11 years of age
Income-eligible women (185% of federal poverty guidelines)
Statewide
# in
Household
Weekly
Income
Biweekly
Income
Monthly
Income
Yearly
Income
2 $ 578 $1,156 $2,504 $30,044
3 $ 727 $1,453 $3,149 $37,777
4 $ 876 $1,751 $3,793 $45,510
5 $1,024 $2,048 $4,437 $53,243
6 $1,173 $2,346 $5,082 $60,976
7 $1,322 $2,643 $5,726 $68,709
8 $1,471 $2,941 $6,371 $76,442
Include:
Mix of ethnicities
Mix of experience with various assistance programs
FFY2017 SNAP-Ed Annual Report 323 January 2018
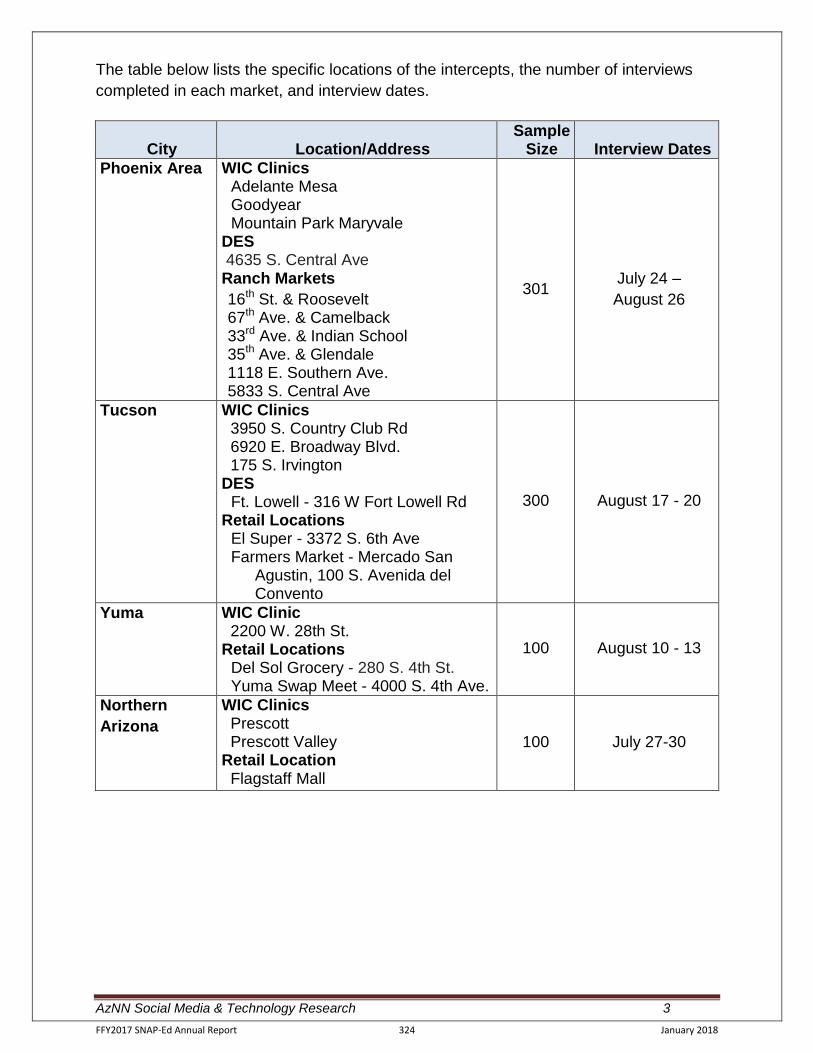
AzNN Social Media & Technology Research 3
The table below lists the specific locations of the intercepts, the number of interviews
completed in each market, and interview dates.
City Location/Address Sample
Size Interview Dates
Phoenix Area WIC Clinics Adelante Mesa Goodyear Mountain Park Maryvale
DES 4635 S. Central Ave Ranch Markets
16th St. & Roosevelt 67th Ave. & Camelback 33rd Ave. & Indian School 35th Ave. & Glendale 1118 E. Southern Ave. 5833 S. Central Ave
301
July 24 –
August 26
Tucson WIC Clinics 3950 S. Country Club Rd 6920 E. Broadway Blvd. 175 S. Irvington DES
Ft. Lowell - 316 W Fort Lowell Rd Retail Locations
El Super - 3372 S. 6th Ave Farmers Market - Mercado San
Agustin, 100 S. Avenida del Convento
300
August 17 - 20
Yuma WIC Clinic 2200 W. 28th St. Retail Locations
Del Sol Grocery - 280 S. 4th St. Yuma Swap Meet - 4000 S. 4th Ave.
100 August 10 - 13
Northern
Arizona
WIC Clinics Prescott Prescott Valley Retail Location Flagstaff Mall
100 July 27-30
FFY2017 SNAP-Ed Annual Report 324 January 2018
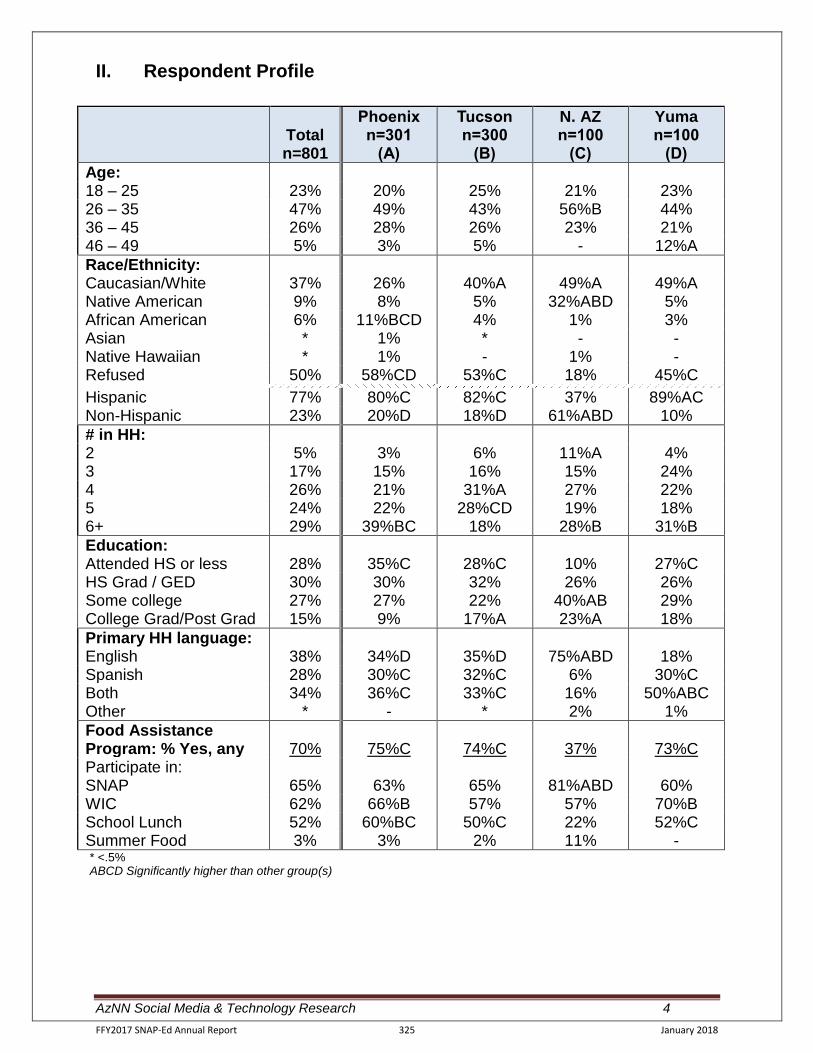
AzNN Social Media & Technology Research 4
II. Respondent Profile
Total n=801
Phoenix n=301
(A)
Tucson n=300
(B)
N. AZ n=100
(C)
Yuma n=100
(D)
Age: 18 – 25 23% 20% 25% 21% 23% 26 – 35 47% 49% 43% 56%B 44% 36 – 45 26% 28% 26% 23% 21% 46 – 49 5% 3% 5% - 12%A
Race/Ethnicity: Caucasian/White 37% 26% 40%A 49%A 49%A Native American 9% 8% 5% 32%ABD 5% African American 6% 11%BCD 4% 1% 3% Asian * 1% * - - Native Hawaiian * 1% - 1% - Refused 50% 58%CD 53%C 18% 45%C
Hispanic 77% 80%C 82%C 37% 89%AC Non-Hispanic 23% 20%D 18%D 61%ABD 10%
# in HH: 2 5% 3% 6% 11%A 4% 3 17% 15% 16% 15% 24% 4 26% 21% 31%A 27% 22% 5 24% 22% 28%CD 19% 18% 6+ 29% 39%BC 18% 28%B 31%B
Education: Attended HS or less 28% 35%C 28%C 10% 27%C
HS Grad / GED 30% 30% 32% 26% 26%
Some college 27% 27% 22% 40%AB 29%
College Grad/Post Grad 15% 9% 17%A 23%A 18%
Primary HH language: English 38% 34%D 35%D 75%ABD 18% Spanish 28% 30%C 32%C 6% 30%C Both 34% 36%C 33%C 16% 50%ABC Other * - * 2% 1%
Food Assistance Program: % Yes, any 70% 75%C 74%C 37% 73%C Participate in: SNAP 65% 63% 65% 81%ABD 60% WIC 62% 66%B 57% 57% 70%B School Lunch 52% 60%BC 50%C 22% 52%C Summer Food 3% 3% 2% 11% - * <.5% ABCD Significantly higher than other group(s)
FFY2017 SNAP-Ed Annual Report 325 January 2018
AzNN Social Media & Technology Research 5
III. Executive Summary
The vast majority of moms – 92% of those meeting the requirements of this
study - own a smartphone. This is true across all demographic groups. In contrast, just one in ten study participants have a landline, with those 18 to 25 least likely to have such a phone (5%). o Laptop and tablet ownership are similar - four in ten own these devices. The
youngest group of moms was least likely to own a laptop / desktop computer. o Hispanic moms are more likely than non-Hispanics to own a smart TV (37% vs.
27%). Samsung is the cell phone of choice for four in ten moms. One-quarter report
owning an iPhone.
Moms are most likely to access the Internet using their cell phones, regardless of age and ethnicity. Those 18 to 25 were even more likely to access the Internet with a smartphone than their older counterparts – 93% compared to 84% among those between 46 and 49 years.
Once online, study participants are most likely to go to social media sites (83%).
This is followed by emailing family and friends (63%) and getting recipes (54%). Moms 46 to 49 are more likely than those 45 and younger to get recipes online – 76% and 53%, respectively.
Facebook is the most frequently visited website among all age groups, with two-
thirds of study participants naming this site. Google follows, with just over half naming this search engine.
o Facebook was also the most frequently downloaded app, with over eight in ten
smartphone owners saying they have this app on their phone. o When asked about social media sites, again, Facebook surfaces as the most
popular, with two-thirds using this site on a daily basis. When asked about their favorite site for recipes, Google was named most often
(17%). Food Network, the most frequently mentioned recipe website, was named by just 5% of moms.
o One in five moms indicated they have visited the Eat Well Be Well website - 3%
report doing so on an unaided basis plus 16% when prompted. Half of study participants are not very (25%) or not at all likely (25%) to follow a
government entity or program on social media. In contrast, 46% maintain they are very (14%) or somewhat likely (32%) to do so. Four percent (4%) are unsure.
Most (9 in 10) moms watch TV on a regular or smart TV. One-quarter watch TV
on their smartphone. This increases to one-third among those 18 to 25 who report watching TV on their smartphone.
FFY2017 SNAP-Ed Annual Report 326 January 2018
AzNN Social Media & Technology Research 6
Netflix is the most popular video type, with over half saying they have watched these programs. Younger moms (<35) are more likely than those 35+ to watch Netflix.
Three-quarters of moms recall Internet advertising, with one-quarter having
clicked on a particular ad. Approximately half agree they are more likely to notice Internet advertising than ads on radio and TV.
Pandora appears as the most popular way to listen to music, with half of those
interviewed choosing to listen to this format. One-third named radio, and one in six have listened to music on Spotify. This increases to one in four among moms ages 18 to 25.
Television leads as the source of news and information with nearly six in ten
preferring this source. The Internet follows at 52%. Four in ten get their news and information from social media, with just one in ten saying they get their news and information from a newspaper.
Communications preferences are mixed. Text and email are each mentioned by one-third of all respondents, with one-quarter naming telephone. This is fairly consistent among all demographic categories.
Just one in ten own a health-related device, with Fitbit leading in this category (6% ownership.
Interest in new technology concepts is limited. Three of the four concepts (Snapchat glasses, virtual reality, Google glasses) were of interest to about one in five moms.
Following is a question-by-question review of the results.
FFY2017 SNAP-Ed Annual Report 327 January 2018
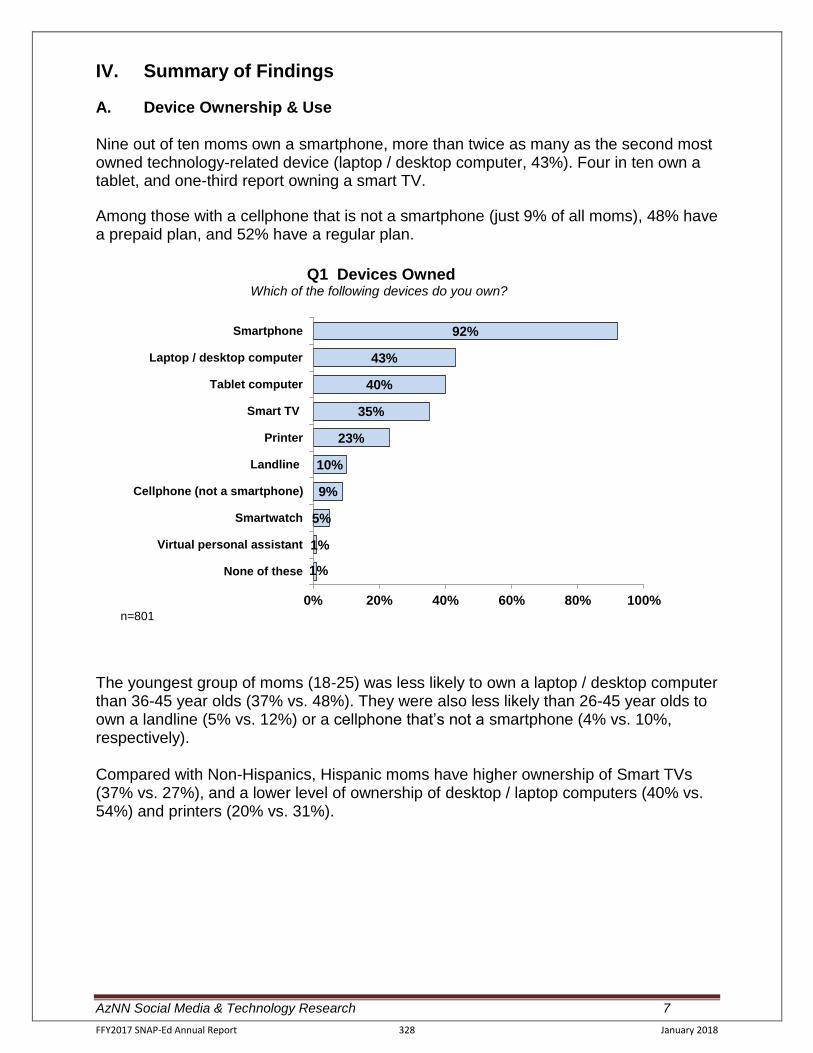
AzNN Social Media & Technology Research 7
IV. Summary of Findings
A. Device Ownership & Use Nine out of ten moms own a smartphone, more than twice as many as the second most owned technology-related device (laptop / desktop computer, 43%). Four in ten own a tablet, and one-third report owning a smart TV.
Among those with a cellphone that is not a smartphone (just 9% of all moms), 48% have a prepaid plan, and 52% have a regular plan.
The youngest group of moms (18-25) was less likely to own a laptop / desktop computer than 36-45 year olds (37% vs. 48%). They were also less likely than 26-45 year olds to own a landline (5% vs. 12%) or a cellphone that’s not a smartphone (4% vs. 10%, respectively). Compared with Non-Hispanics, Hispanic moms have higher ownership of Smart TVs (37% vs. 27%), and a lower level of ownership of desktop / laptop computers (40% vs. 54%) and printers (20% vs. 31%).
1%
1%
5%
9%
10%
23%
35%
40%
43%
92%
0% 20% 40% 60% 80% 100%
None of these
Virtual personal assistant
Smartwatch
Cellphone (not a smartphone)
Landline
Printer
Smart TV
Tablet computer
Laptop / desktop computer
Smartphone
Q1 Devices Owned Which of the following devices do you own?
n=801
FFY2017 SNAP-Ed Annual Report 328 January 2018
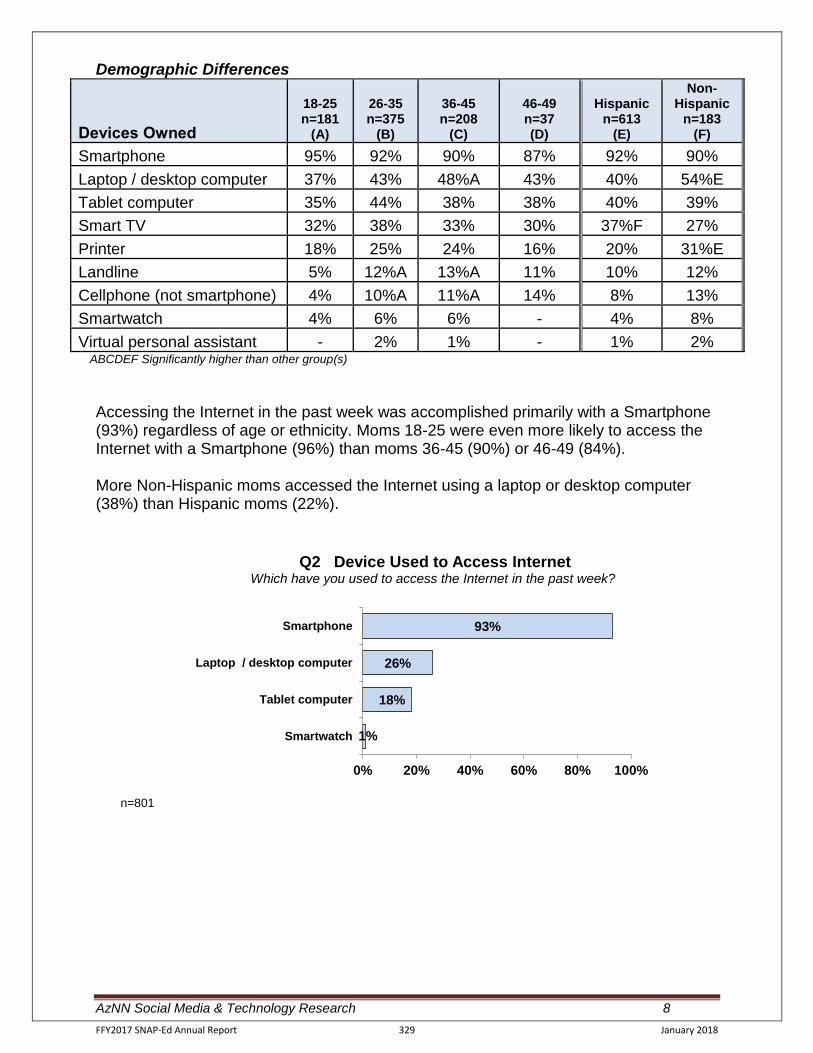
AzNN Social Media & Technology Research 8
Demographic Differences
Devices Owned
18-25 n=181
(A)
26-35 n=375
(B)
36-45 n=208
(C)
46-49 n=37 (D)
Hispanic n=613
(E)
Non-Hispanic
n=183 (F)
Smartphone 95% 92% 90% 87% 92% 90%
Laptop / desktop computer 37% 43% 48%A 43% 40% 54%E
Tablet computer 35% 44% 38% 38% 40% 39%
Smart TV 32% 38% 33% 30% 37%F 27%
Printer 18% 25% 24% 16% 20% 31%E
Landline 5% 12%A 13%A 11% 10% 12%
Cellphone (not smartphone) 4% 10%A 11%A 14% 8% 13%
Smartwatch 4% 6% 6% - 4% 8%
Virtual personal assistant - 2% 1% - 1% 2% ABCDEF Significantly higher than other group(s)
Accessing the Internet in the past week was accomplished primarily with a Smartphone (93%) regardless of age or ethnicity. Moms 18-25 were even more likely to access the Internet with a Smartphone (96%) than moms 36-45 (90%) or 46-49 (84%). More Non-Hispanic moms accessed the Internet using a laptop or desktop computer (38%) than Hispanic moms (22%).
1%
18%
26%
93%
0% 20% 40% 60% 80% 100%
Smartwatch
Tablet computer
Laptop / desktop computer
Smartphone
Q2 Device Used to Access Internet Which have you used to access the Internet in the past week?
n=801
FFY2017 SNAP-Ed Annual Report 329 January 2018
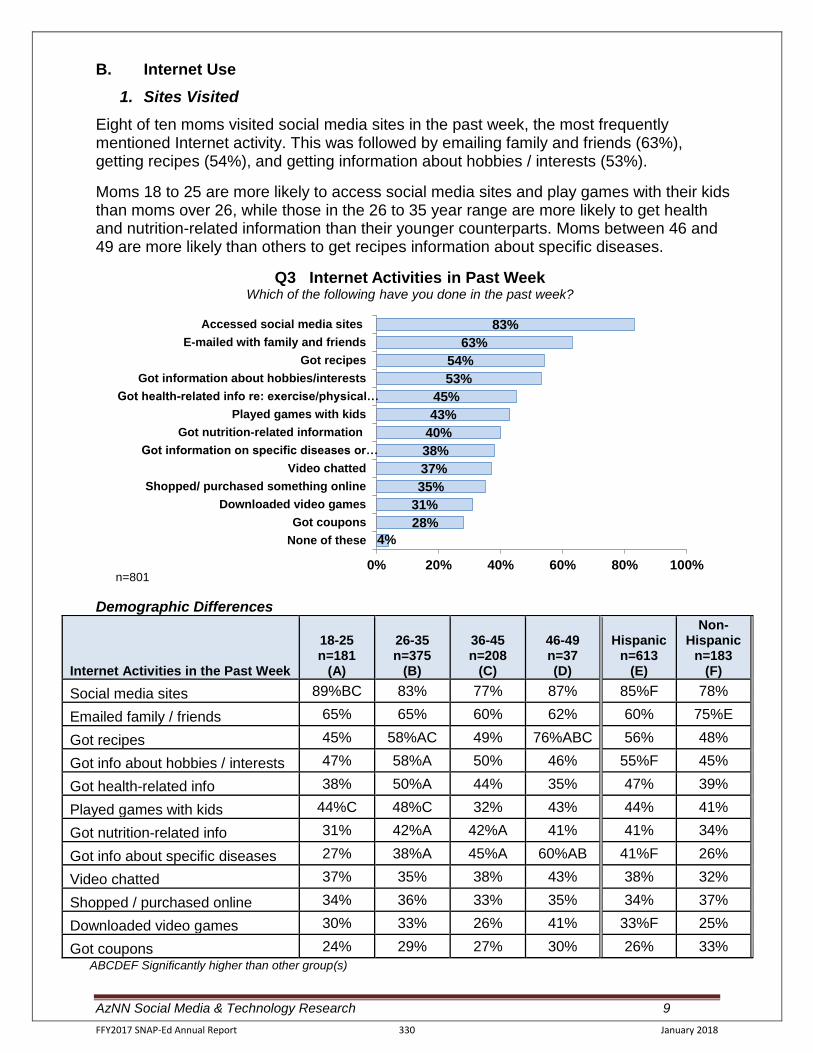
AzNN Social Media & Technology Research 9
B. Internet Use
1. Sites Visited
Eight of ten moms visited social media sites in the past week, the most frequently mentioned Internet activity. This was followed by emailing family and friends (63%), getting recipes (54%), and getting information about hobbies / interests (53%).
Moms 18 to 25 are more likely to access social media sites and play games with their kids than moms over 26, while those in the 26 to 35 year range are more likely to get health and nutrition-related information than their younger counterparts. Moms between 46 and 49 are more likely than others to get recipes information about specific diseases.
Demographic Differences
Internet Activities in the Past Week
18-25 n=181
(A)
26-35 n=375
(B)
36-45 n=208
(C)
46-49 n=37 (D)
Hispanic n=613
(E)
Non-Hispanic
n=183 (F)
Social media sites 89%BC 83% 77% 87% 85%F 78%
Emailed family / friends 65% 65% 60% 62% 60% 75%E
Got recipes 45% 58%AC 49% 76%ABC 56% 48%
Got info about hobbies / interests 47% 58%A 50% 46% 55%F 45%
Got health-related info 38% 50%A 44% 35% 47% 39%
Played games with kids 44%C 48%C 32% 43% 44% 41%
Got nutrition-related info 31% 42%A 42%A 41% 41% 34%
Got info about specific diseases 27% 38%A 45%A 60%AB 41%F 26%
Video chatted 37% 35% 38% 43% 38% 32%
Shopped / purchased online 34% 36% 33% 35% 34% 37%
Downloaded video games 30% 33% 26% 41% 33%F 25%
Got coupons 24% 29% 27% 30% 26% 33%
ABCDEF Significantly higher than other group(s)
4%
28%
31%
35%
37%
38%
40%
43%
45%
53%
54%
63%
83%
0% 20% 40% 60% 80% 100%
None of these
Got coupons
Downloaded video games
Shopped/ purchased something online
Video chatted
Got information on specific diseases or…
Got nutrition-related information
Played games with kids
Got health-related info re: exercise/physical…
Got information about hobbies/interests
Got recipes
E-mailed with family and friends
Accessed social media sites
Q3 Internet Activities in Past Week Which of the following have you done in the past week?
n=801
FFY2017 SNAP-Ed Annual Report 330 January 2018
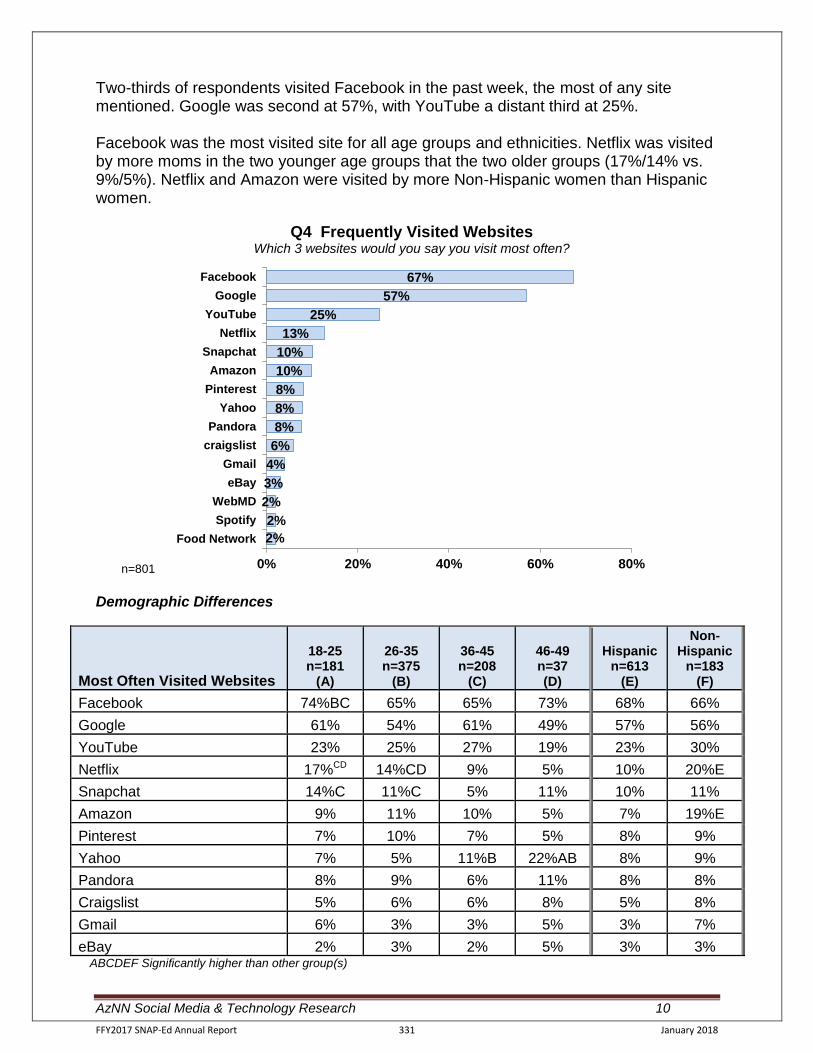
AzNN Social Media & Technology Research 10
Two-thirds of respondents visited Facebook in the past week, the most of any site mentioned. Google was second at 57%, with YouTube a distant third at 25%. Facebook was the most visited site for all age groups and ethnicities. Netflix was visited by more moms in the two younger age groups that the two older groups (17%/14% vs. 9%/5%). Netflix and Amazon were visited by more Non-Hispanic women than Hispanic women.
Demographic Differences
Most Often Visited Websites
18-25 n=181
(A)
26-35 n=375
(B)
36-45 n=208
(C)
46-49 n=37 (D)
Hispanic n=613
(E)
Non-Hispanic
n=183 (F)
Facebook 74%BC 65% 65% 73% 68% 66%
Google 61% 54% 61% 49% 57% 56%
YouTube 23% 25% 27% 19% 23% 30%
Netflix 17%CD 14%CD 9% 5% 10% 20%E
Snapchat 14%C 11%C 5% 11% 10% 11%
Amazon 9% 11% 10% 5% 7% 19%E
Pinterest 7% 10% 7% 5% 8% 9%
Yahoo 7% 5% 11%B 22%AB 8% 9%
Pandora 8% 9% 6% 11% 8% 8%
Craigslist 5% 6% 6% 8% 5% 8%
Gmail 6% 3% 3% 5% 3% 7%
eBay 2% 3% 2% 5% 3% 3% ABCDEF Significantly higher than other group(s)
2%
2%
2%
3%
4%
6%
8%
8%
8%
10%
10%
13%
25%
57%
67%
0% 20% 40% 60% 80%
Food Network
Spotify
WebMD
eBay
Gmail
craigslist
Pandora
Yahoo
Amazon
Snapchat
Netflix
YouTube
Q4 Frequently Visited Websites Which 3 websites would you say you visit most often?
n=801
FFY2017 SNAP-Ed Annual Report 331 January 2018
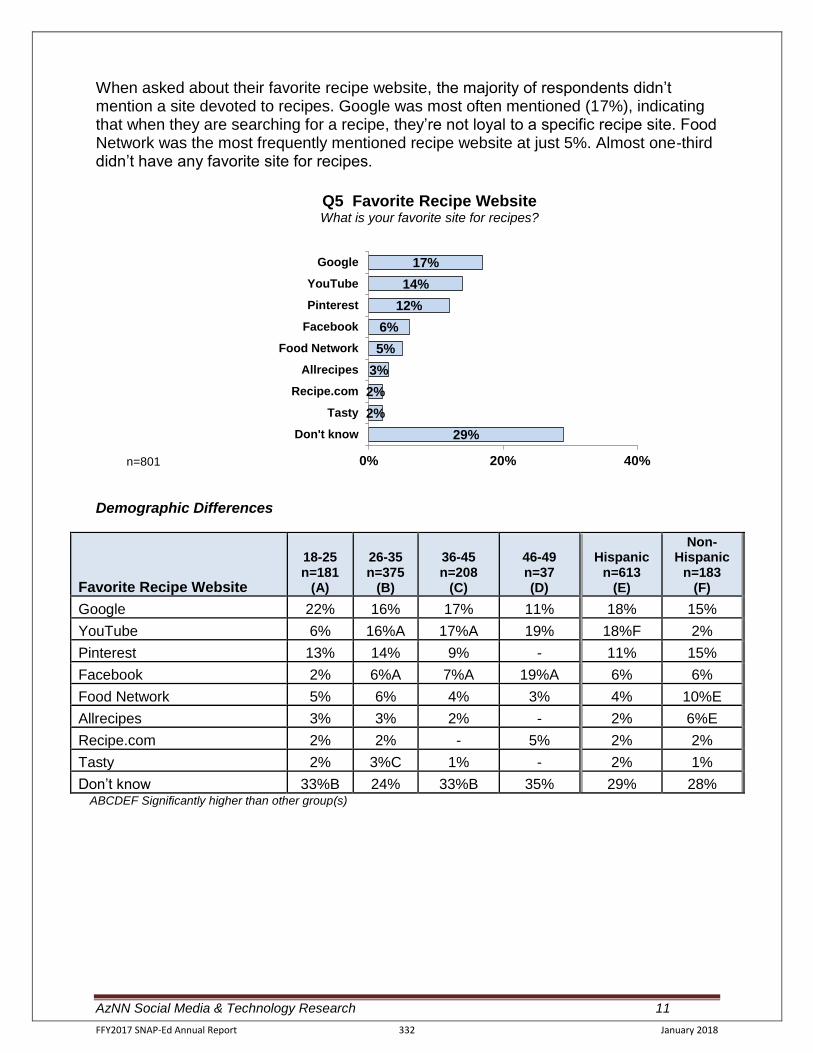
AzNN Social Media & Technology Research 11
When asked about their favorite recipe website, the majority of respondents didn’t mention a site devoted to recipes. Google was most often mentioned (17%), indicating that when they are searching for a recipe, they’re not loyal to a specific recipe site. Food Network was the most frequently mentioned recipe website at just 5%. Almost one-third didn’t have any favorite site for recipes.
Demographic Differences
Favorite Recipe Website
18-25 n=181
(A)
26-35 n=375
(B)
36-45 n=208
(C)
46-49 n=37 (D)
Hispanic n=613
(E)
Non-Hispanic
n=183 (F)
Google 22% 16% 17% 11% 18% 15%
YouTube 6% 16%A 17%A 19% 18%F 2%
Pinterest 13% 14% 9% - 11% 15%
Facebook 2% 6%A 7%A 19%A 6% 6%
Food Network 5% 6% 4% 3% 4% 10%E
Allrecipes 3% 3% 2% - 2% 6%E
Recipe.com 2% 2% - 5% 2% 2%
Tasty 2% 3%C 1% - 2% 1%
Don’t know 33%B 24% 33%B 35% 29% 28% ABCDEF Significantly higher than other group(s)
29%
2%
2%
3%
5%
6%
12%
14%
17%
0% 20% 40%
Don't know
Tasty
Recipe.com
Allrecipes
Food Network
YouTube
Q5 Favorite Recipe Website What is your favorite site for recipes?
n=801
FFY2017 SNAP-Ed Annual Report 332 January 2018
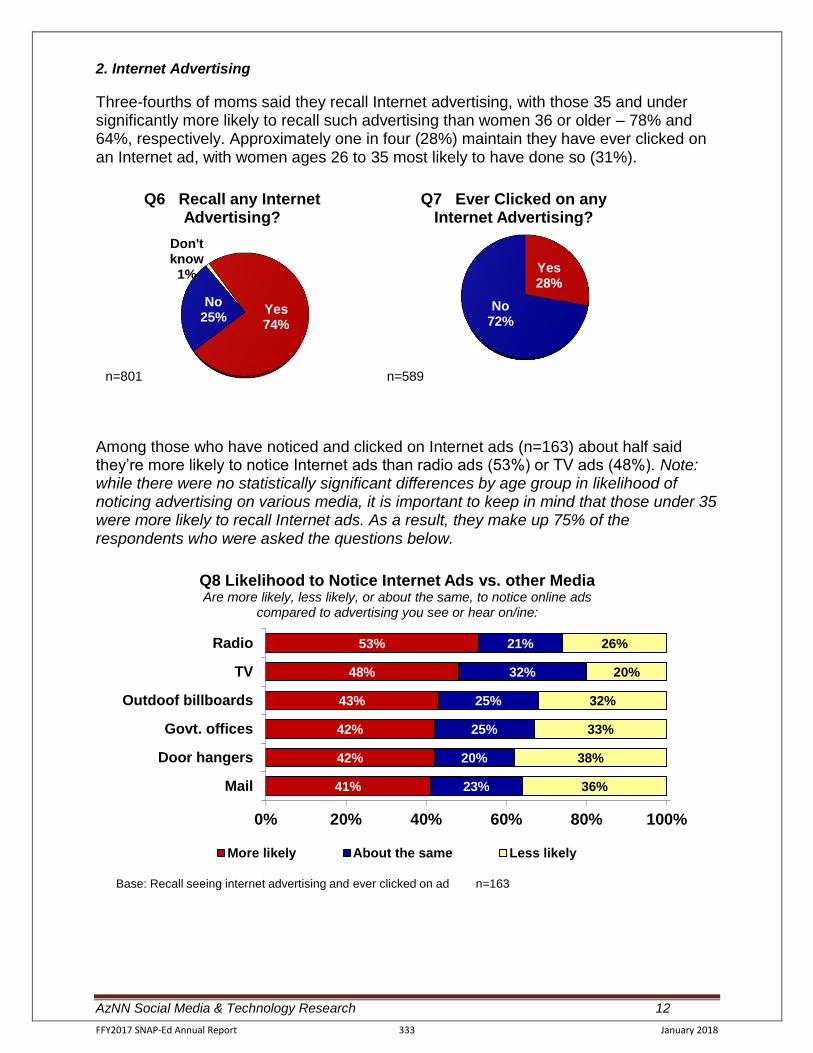
AzNN Social Media & Technology Research 12
2. Internet Advertising
Three-fourths of moms said they recall Internet advertising, with those 35 and under significantly more likely to recall such advertising than women 36 or older – 78% and 64%, respectively. Approximately one in four (28%) maintain they have ever clicked on an Internet ad, with women ages 26 to 35 most likely to have done so (31%).
Among those who have noticed and clicked on Internet ads (n=163) about half said they’re more likely to notice Internet ads than radio ads (53%) or TV ads (48%). Note: while there were no statistically significant differences by age group in likelihood of noticing advertising on various media, it is important to keep in mind that those under 35 were more likely to recall Internet ads. As a result, they make up 75% of the respondents who were asked the questions below.
Don't know
1%
Yes 74%
No 25%
Q6 Recall any Internet Advertising?
n=801
Yes 28%
No 72%
Q7 Ever Clicked on any Internet Advertising?
n=589
41%
42%
42%
43%
48%
53%
23%
20%
25%
25%
32%
21%
36%
38%
33%
32%
20%
26%
0% 20% 40% 60% 80% 100%
Door hangers
Govt. offices
Outdoof billboards
TV
Radio
Q8 Likelihood to Notice Internet Ads vs. other Media Are more likely, less likely, or about the same, to notice online ads
compared to advertising you see or hear on/ine:
More likely About the same Less likely
Base: Recall seeing internet advertising and ever clicked on ad n=163
FFY2017 SNAP-Ed Annual Report 333 January 2018
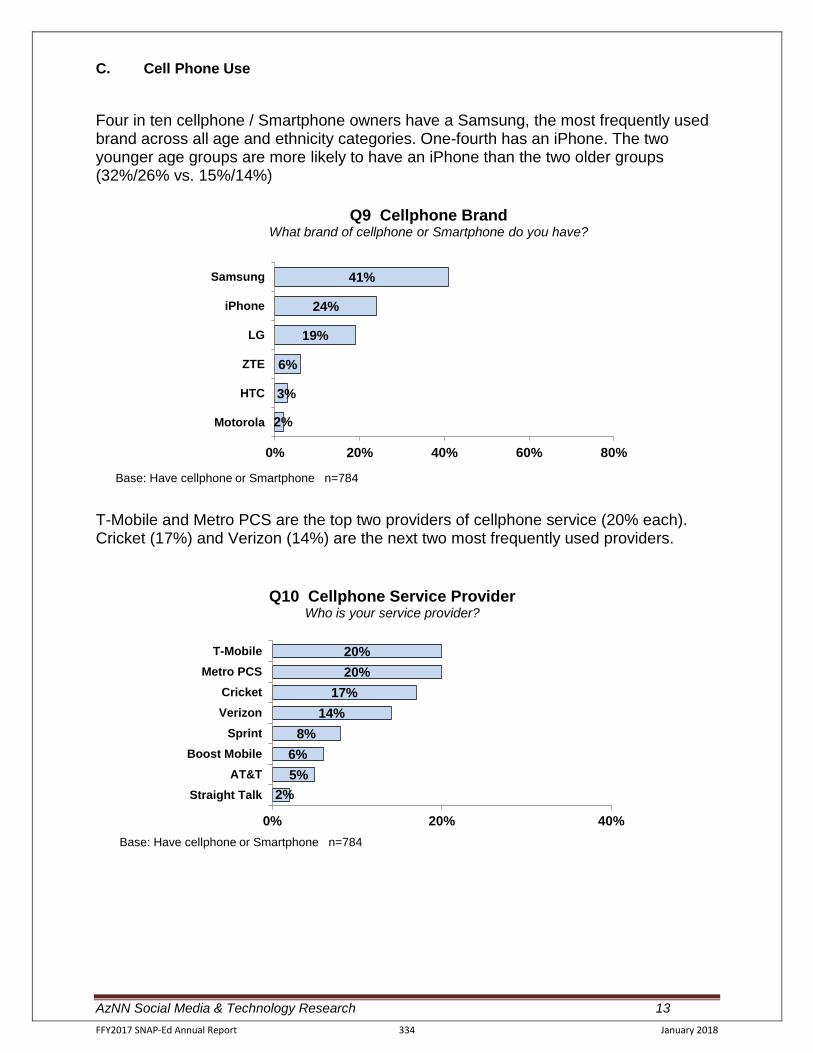
AzNN Social Media & Technology Research 13
C. Cell Phone Use
Four in ten cellphone / Smartphone owners have a Samsung, the most frequently used brand across all age and ethnicity categories. One-fourth has an iPhone. The two younger age groups are more likely to have an iPhone than the two older groups (32%/26% vs. 15%/14%)
T-Mobile and Metro PCS are the top two providers of cellphone service (20% each). Cricket (17%) and Verizon (14%) are the next two most frequently used providers.
2%
3%
6%
19%
24%
41%
0% 20% 40% 60% 80%
Motorola
HTC
ZTE
LG
iPhone
Samsung
Q9 Cellphone Brand What brand of cellphone or Smartphone do you have?
Base: Have cellphone or Smartphone n=784
2%
5%
6%
8%
14%
17%
20%
20%
0% 20% 40%
Straight Talk
AT&T
Boost Mobile
Sprint
Verizon
Cricket
Metro PCS
T-Mobile
Q10 Cellphone Service Provider Who is your service provider?
Base: Have cellphone or Smartphone n=784
FFY2017 SNAP-Ed Annual Report 334 January 2018
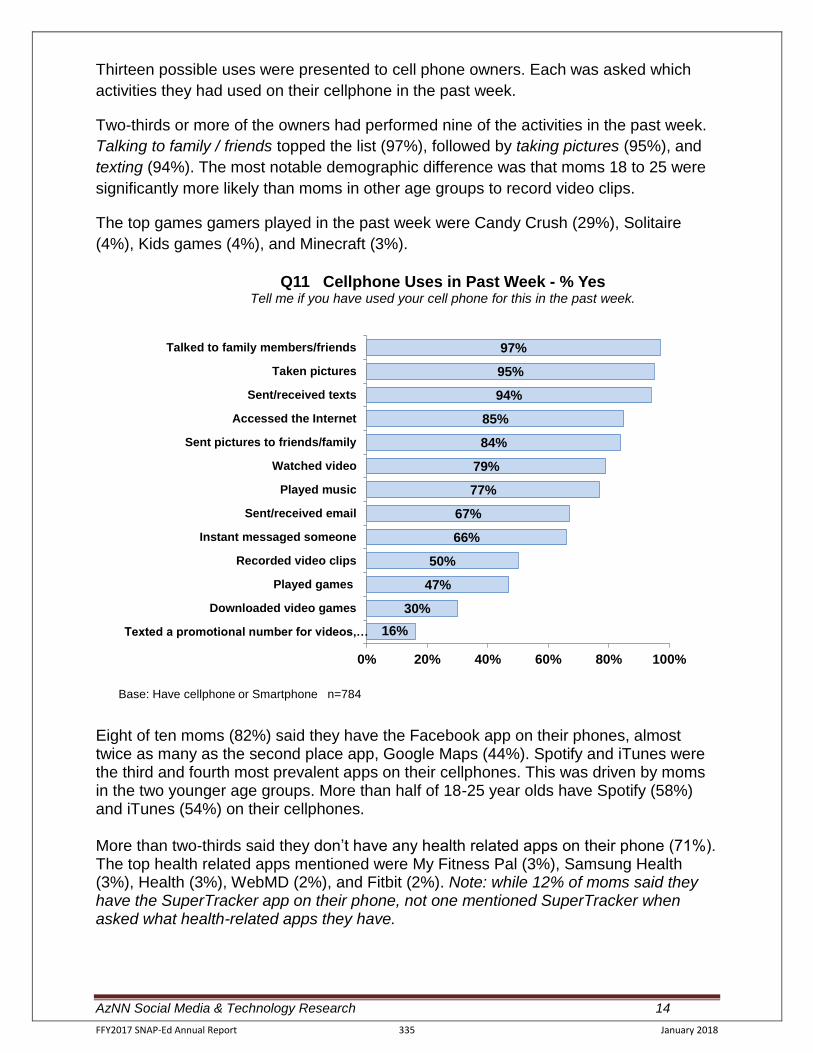
AzNN Social Media & Technology Research 14
Thirteen possible uses were presented to cell phone owners. Each was asked which
activities they had used on their cellphone in the past week.
Two-thirds or more of the owners had performed nine of the activities in the past week.
Talking to family / friends topped the list (97%), followed by taking pictures (95%), and
texting (94%). The most notable demographic difference was that moms 18 to 25 were
significantly more likely than moms in other age groups to record video clips.
The top games gamers played in the past week were Candy Crush (29%), Solitaire
(4%), Kids games (4%), and Minecraft (3%).
Eight of ten moms (82%) said they have the Facebook app on their phones, almost twice as many as the second place app, Google Maps (44%). Spotify and iTunes were the third and fourth most prevalent apps on their cellphones. This was driven by moms in the two younger age groups. More than half of 18-25 year olds have Spotify (58%) and iTunes (54%) on their cellphones. More than two-thirds said they don’t have any health related apps on their phone (71%). The top health related apps mentioned were My Fitness Pal (3%), Samsung Health (3%), Health (3%), WebMD (2%), and Fitbit (2%). Note: while 12% of moms said they have the SuperTracker app on their phone, not one mentioned SuperTracker when asked what health-related apps they have.
16%
30%
47%
50%
66%
67%
77%
79%
84%
85%
94%
95%
97%
0% 20% 40% 60% 80% 100%
Texted a promotional number for videos,…
Downloaded video games
Played games
Recorded video clips
Instant messaged someone
Sent/received email
Played music
Watched video
Sent pictures to friends/family
Accessed the Internet
Sent/received texts
Taken pictures
Talked to family members/friends
Q11 Cellphone Uses in Past Week - % Yes Tell me if you have used your cell phone for this in the past week.
Base: Have cellphone or Smartphone n=784
FFY2017 SNAP-Ed Annual Report 335 January 2018
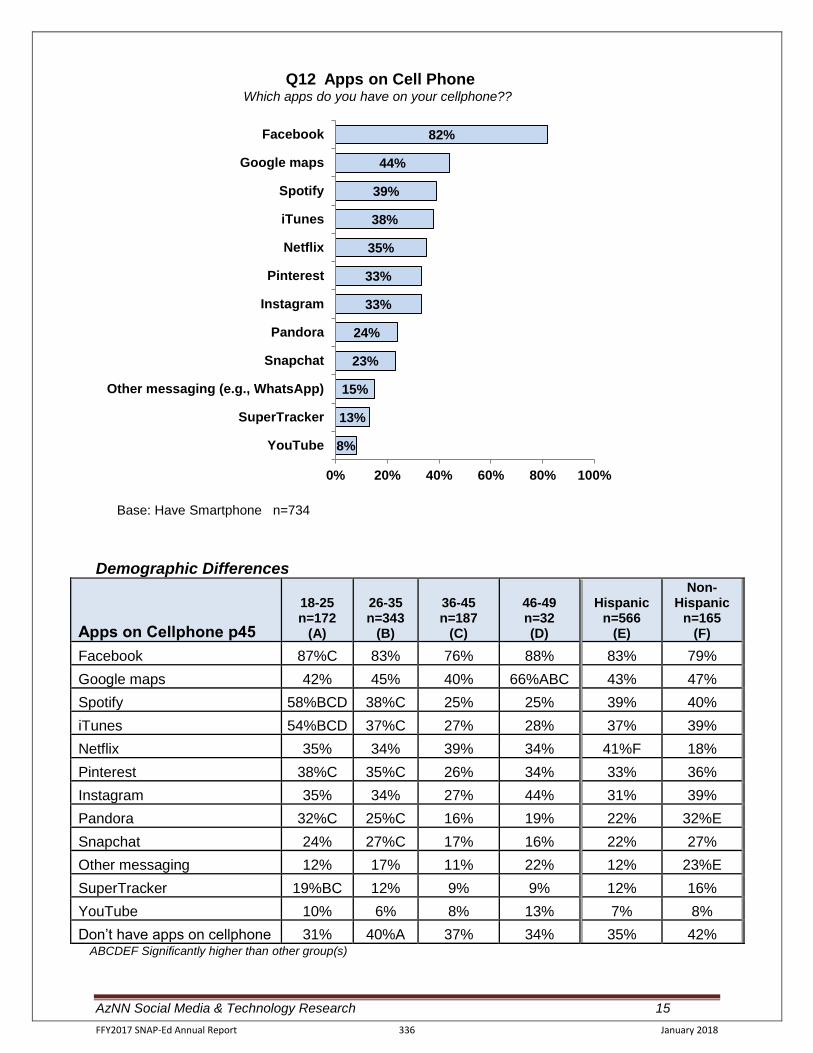
AzNN Social Media & Technology Research 15
Demographic Differences
Apps on Cellphone p45
18-25 n=172
(A)
26-35 n=343
(B)
36-45 n=187
(C)
46-49 n=32 (D)
Hispanic n=566
(E)
Non-Hispanic
n=165 (F)
Facebook 87%C 83% 76% 88% 83% 79%
Google maps 42% 45% 40% 66%ABC 43% 47%
Spotify 58%BCD 38%C 25% 25% 39% 40%
iTunes 54%BCD 37%C 27% 28% 37% 39%
Netflix 35% 34% 39% 34% 41%F 18%
Pinterest 38%C 35%C 26% 34% 33% 36%
Instagram 35% 34% 27% 44% 31% 39%
Pandora 32%C 25%C 16% 19% 22% 32%E
Snapchat 24% 27%C 17% 16% 22% 27%
Other messaging 12% 17% 11% 22% 12% 23%E
SuperTracker 19%BC 12% 9% 9% 12% 16%
YouTube 10% 6% 8% 13% 7% 8%
Don’t have apps on cellphone 31% 40%A 37% 34% 35% 42% ABCDEF Significantly higher than other group(s)
8%
13%
15%
23%
24%
33%
33%
35%
38%
39%
44%
82%
0% 20% 40% 60% 80% 100%
YouTube
SuperTracker
Other messaging (e.g., WhatsApp)
Snapchat
Pandora
Netflix
iTunes
Spotify
Google maps
Q12 Apps on Cell Phone Which apps do you have on your cellphone??
Base: Have Smartphone n=734
FFY2017 SNAP-Ed Annual Report 336 January 2018
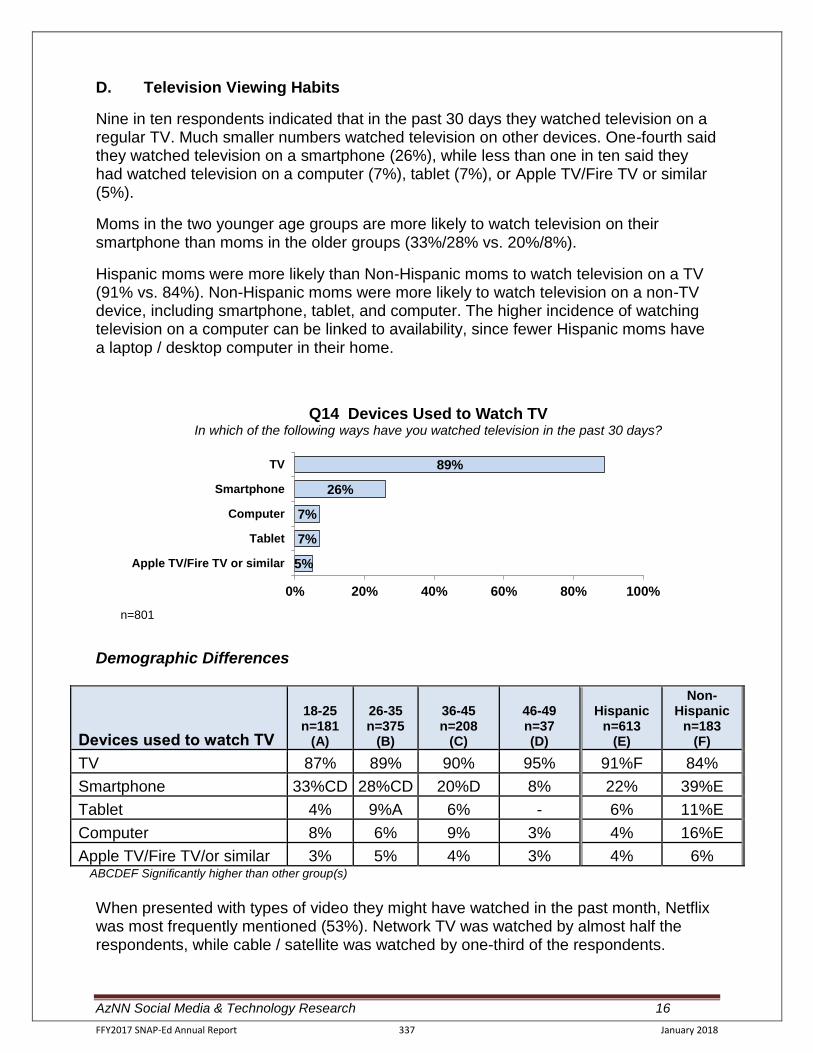
AzNN Social Media & Technology Research 16
D. Television Viewing Habits
Nine in ten respondents indicated that in the past 30 days they watched television on a regular TV. Much smaller numbers watched television on other devices. One-fourth said they watched television on a smartphone (26%), while less than one in ten said they had watched television on a computer (7%), tablet (7%), or Apple TV/Fire TV or similar (5%).
Moms in the two younger age groups are more likely to watch television on their smartphone than moms in the older groups (33%/28% vs. 20%/8%).
Hispanic moms were more likely than Non-Hispanic moms to watch television on a TV (91% vs. 84%). Non-Hispanic moms were more likely to watch television on a non-TV device, including smartphone, tablet, and computer. The higher incidence of watching television on a computer can be linked to availability, since fewer Hispanic moms have a laptop / desktop computer in their home.
Demographic Differences
Devices used to watch TV
18-25 n=181
(A)
26-35 n=375
(B)
36-45 n=208
(C)
46-49 n=37 (D)
Hispanic n=613
(E)
Non-Hispanic
n=183 (F)
TV 87% 89% 90% 95% 91%F 84%
Smartphone 33%CD 28%CD 20%D 8% 22% 39%E
Tablet 4% 9%A 6% - 6% 11%E
Computer 8% 6% 9% 3% 4% 16%E
Apple TV/Fire TV/or similar 3% 5% 4% 3% 4% 6% ABCDEF Significantly higher than other group(s)
When presented with types of video they might have watched in the past month, Netflix was most frequently mentioned (53%). Network TV was watched by almost half the respondents, while cable / satellite was watched by one-third of the respondents.
5%
7%
7%
26%
89%
0% 20% 40% 60% 80% 100%
Apple TV/Fire TV or similar
Tablet
Computer
Smartphone
TV
Q14 Devices Used to Watch TV In which of the following ways have you watched television in the past 30 days?
n=801
FFY2017 SNAP-Ed Annual Report 337 January 2018
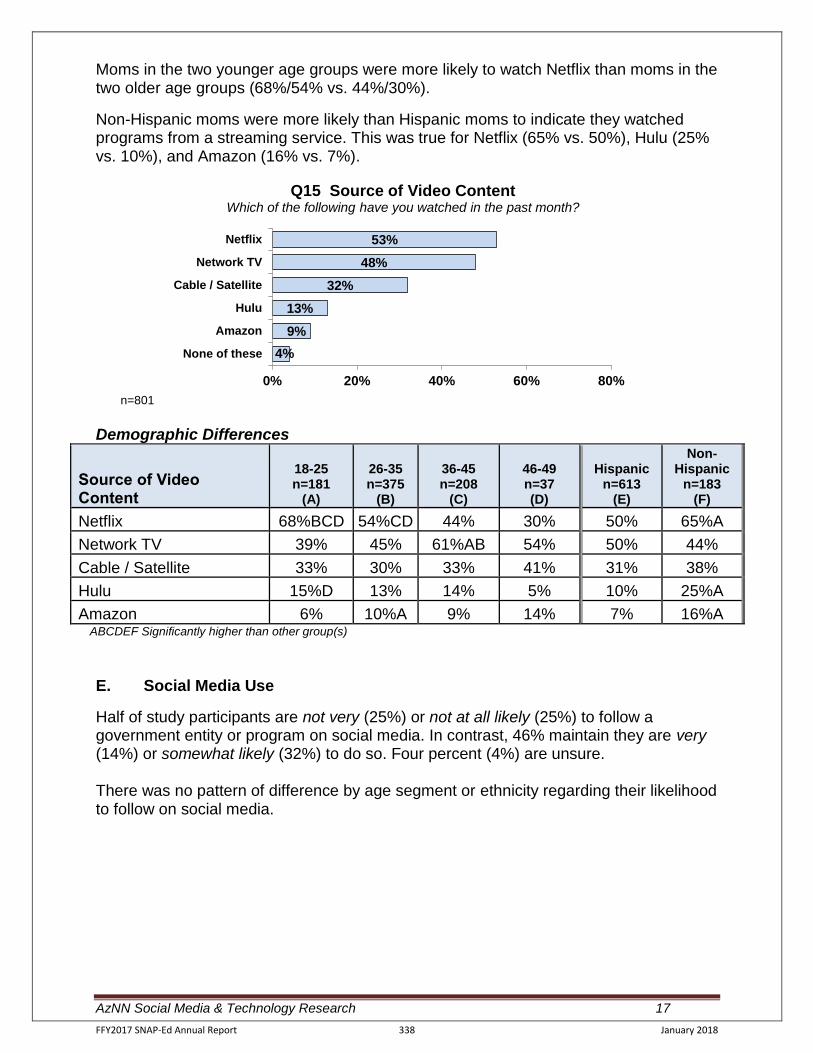
AzNN Social Media & Technology Research 17
Moms in the two younger age groups were more likely to watch Netflix than moms in the two older age groups (68%/54% vs. 44%/30%).
Non-Hispanic moms were more likely than Hispanic moms to indicate they watched programs from a streaming service. This was true for Netflix (65% vs. 50%), Hulu (25% vs. 10%), and Amazon (16% vs. 7%).
Demographic Differences
Source of Video Content
18-25 n=181
(A)
26-35 n=375
(B)
36-45 n=208
(C)
46-49 n=37 (D)
Hispanic n=613
(E)
Non-Hispanic
n=183 (F)
Netflix 68%BCD 54%CD 44% 30% 50% 65%A
Network TV 39% 45% 61%AB 54% 50% 44%
Cable / Satellite 33% 30% 33% 41% 31% 38%
Hulu 15%D 13% 14% 5% 10% 25%A
Amazon 6% 10%A 9% 14% 7% 16%A ABCDEF Significantly higher than other group(s)
E. Social Media Use
Half of study participants are not very (25%) or not at all likely (25%) to follow a government entity or program on social media. In contrast, 46% maintain they are very (14%) or somewhat likely (32%) to do so. Four percent (4%) are unsure.
There was no pattern of difference by age segment or ethnicity regarding their likelihood to follow on social media.
4%
9%
13%
32%
48%
53%
0% 20% 40% 60% 80%
None of these
Amazon
Hulu
Cable / Satellite
Network TV
Netflix
Q15 Source of Video Content Which of the following have you watched in the past month?
n=801
FFY2017 SNAP-Ed Annual Report 338 January 2018
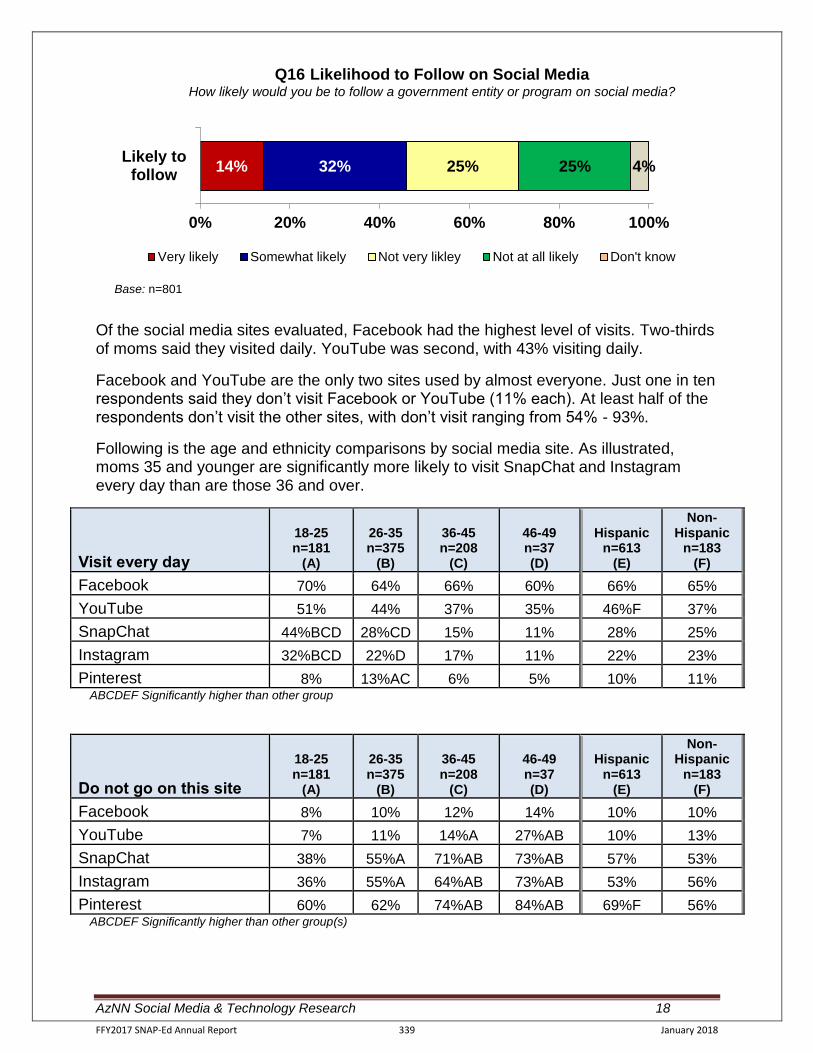
AzNN Social Media & Technology Research 18
Of the social media sites evaluated, Facebook had the highest level of visits. Two-thirds of moms said they visited daily. YouTube was second, with 43% visiting daily.
Facebook and YouTube are the only two sites used by almost everyone. Just one in ten respondents said they don’t visit Facebook or YouTube (11% each). At least half of the respondents don’t visit the other sites, with don’t visit ranging from 54% - 93%.
Following is the age and ethnicity comparisons by social media site. As illustrated, moms 35 and younger are significantly more likely to visit SnapChat and Instagram every day than are those 36 and over.
Visit every day
18-25 n=181
(A)
26-35 n=375
(B)
36-45 n=208
(C)
46-49 n=37 (D)
Hispanic n=613
(E)
Non-Hispanic
n=183 (F)
Facebook 70% 64% 66% 60% 66% 65%
YouTube 51% 44% 37% 35% 46%F 37%
SnapChat 44%BCD 28%CD 15% 11% 28% 25%
Instagram 32%BCD 22%D 17% 11% 22% 23%
Pinterest 8% 13%AC 6% 5% 10% 11% ABCDEF Significantly higher than other group
Do not go on this site
18-25 n=181
(A)
26-35 n=375
(B)
36-45 n=208
(C)
46-49 n=37 (D)
Hispanic n=613
(E)
Non-Hispanic
n=183 (F)
Facebook 8% 10% 12% 14% 10% 10%
YouTube 7% 11% 14%A 27%AB 10% 13%
SnapChat 38% 55%A 71%AB 73%AB 57% 53%
Instagram 36% 55%A 64%AB 73%AB 53% 56%
Pinterest 60% 62% 74%AB 84%AB 69%F 56% ABCDEF Significantly higher than other group(s)
14% 32% 25% 25% 4%
0% 20% 40% 60% 80% 100%
Likely tofollow
Q16 Likelihood to Follow on Social Media How likely would you be to follow a government entity or program on social media?
Very likely Somewhat likely Not very likley Not at all likely Don't know
Base: n=801
FFY2017 SNAP-Ed Annual Report 339 January 2018
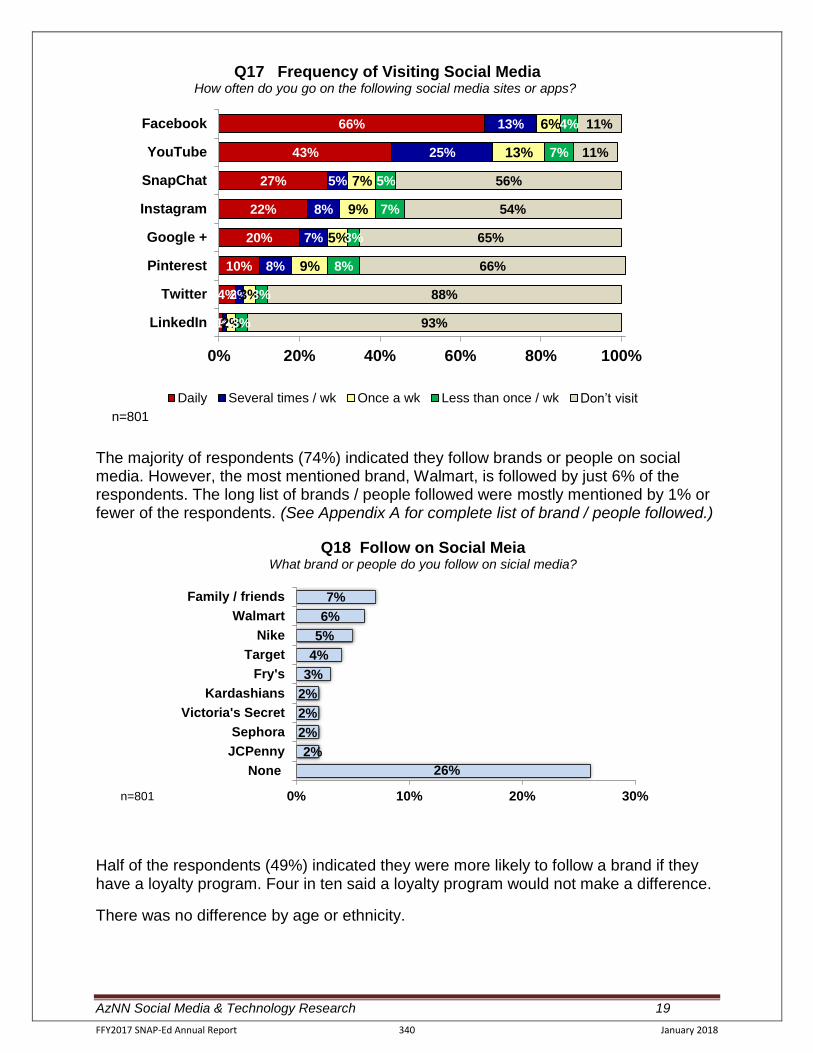
AzNN Social Media & Technology Research 19
The majority of respondents (74%) indicated they follow brands or people on social media. However, the most mentioned brand, Walmart, is followed by just 6% of the respondents. The long list of brands / people followed were mostly mentioned by 1% or fewer of the respondents. (See Appendix A for complete list of brand / people followed.)
Half of the respondents (49%) indicated they were more likely to follow a brand if they have a loyalty program. Four in ten said a loyalty program would not make a difference.
There was no difference by age or ethnicity.
1%
4%
10%
20%
22%
27%
43%
66%
1%
2%
8%
7%
8%
5%
25%
13%
2%
3%
9%
5%
9%
7%
13%
6%
3%
3%
8%
3%
7%
5%
7%
4%
93%
88%
66%
65%
54%
56%
11%
11%
0% 20% 40% 60% 80% 100%
Google +
SnapChat
YouTube
Q17 Frequency of Visiting Social Media How often do you go on the following social media sites or apps?
Daily Several times / wk Once a wk Less than once / wk Don’t visit
n=801
26%
2%
2%
2%
2%
3%
4%
5%
6%
7%
0% 10% 20% 30%
None
JCPenny
Sephora
Victoria's Secret
Kardashians
Fry's
Target
Nike
Walmart
Family / friends
Q18 Follow on Social Meia What brand or people do you follow on sicial media?
n=801
FFY2017 SNAP-Ed Annual Report 340 January 2018
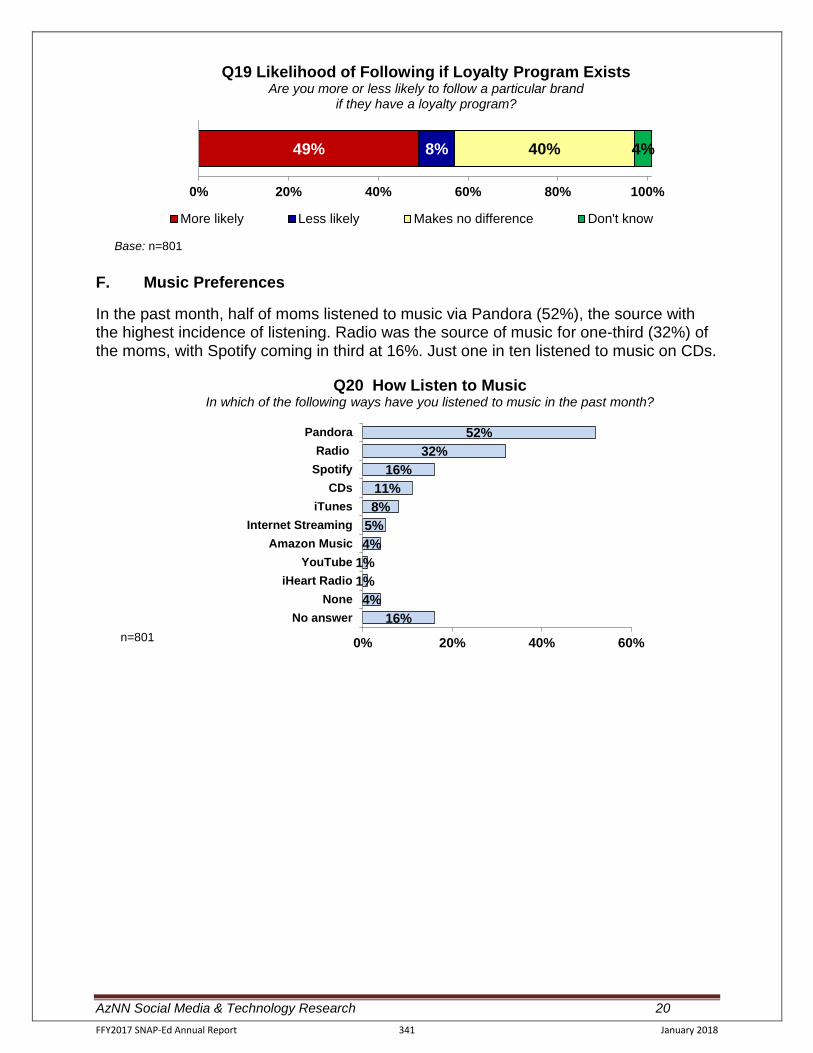
AzNN Social Media & Technology Research 20
F. Music Preferences
In the past month, half of moms listened to music via Pandora (52%), the source with the highest incidence of listening. Radio was the source of music for one-third (32%) of the moms, with Spotify coming in third at 16%. Just one in ten listened to music on CDs.
49% 8% 40% 4%
0% 20% 40% 60% 80% 100%
Q19 Likelihood of Following if Loyalty Program Exists Are you more or less likely to follow a particular brand
if they have a loyalty program?
More likely Less likely Makes no difference Don't know
Base: n=801
16%
4%
1%
1%
4%
5%
8%
11%
16%
32%
52%
0% 20% 40% 60%
No answer
None
iHeart Radio
YouTube
Amazon Music
Internet Streaming
iTunes
CDs
Spotify
Radio
Pandora
Q20 How Listen to Music In which of the following ways have you listened to music in the past month?
n=801
FFY2017 SNAP-Ed Annual Report 341 January 2018
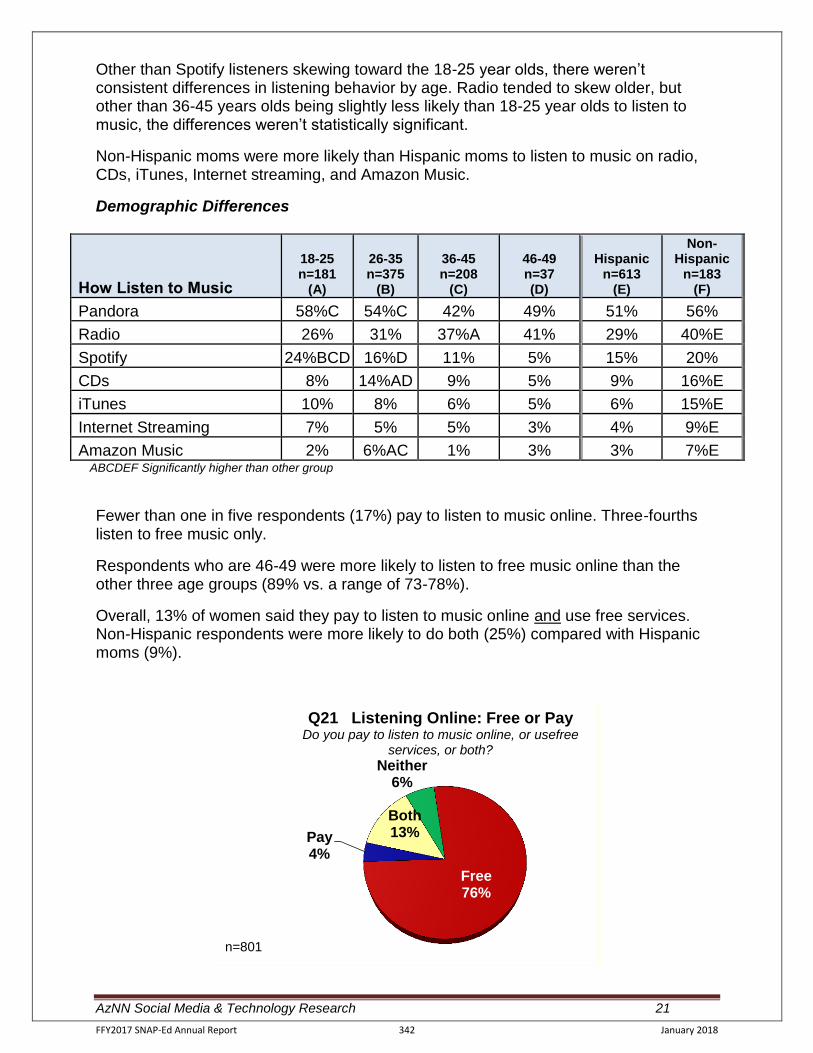
AzNN Social Media & Technology Research 21
Other than Spotify listeners skewing toward the 18-25 year olds, there weren’t consistent differences in listening behavior by age. Radio tended to skew older, but other than 36-45 years olds being slightly less likely than 18-25 year olds to listen to music, the differences weren’t statistically significant.
Non-Hispanic moms were more likely than Hispanic moms to listen to music on radio, CDs, iTunes, Internet streaming, and Amazon Music.
Demographic Differences
How Listen to Music
18-25 n=181
(A)
26-35 n=375
(B)
36-45 n=208
(C)
46-49 n=37 (D)
Hispanic n=613
(E)
Non-Hispanic
n=183 (F)
Pandora 58%C 54%C 42% 49% 51% 56%
Radio 26% 31% 37%A 41% 29% 40%E
Spotify 24%BCD 16%D 11% 5% 15% 20%
CDs 8% 14%AD 9% 5% 9% 16%E
iTunes 10% 8% 6% 5% 6% 15%E
Internet Streaming 7% 5% 5% 3% 4% 9%E
Amazon Music 2% 6%AC 1% 3% 3% 7%E ABCDEF Significantly higher than other group
Fewer than one in five respondents (17%) pay to listen to music online. Three-fourths listen to free music only.
Respondents who are 46-49 were more likely to listen to free music online than the other three age groups (89% vs. a range of 73-78%).
Overall, 13% of women said they pay to listen to music online and use free services. Non-Hispanic respondents were more likely to do both (25%) compared with Hispanic moms (9%).
Neither 6%
Free 76%
Pay 4%
Both 13%
Q21 Listening Online: Free or Pay Do you pay to listen to music online, or usefree
services, or both?
n=801
FFY2017 SNAP-Ed Annual Report 342 January 2018
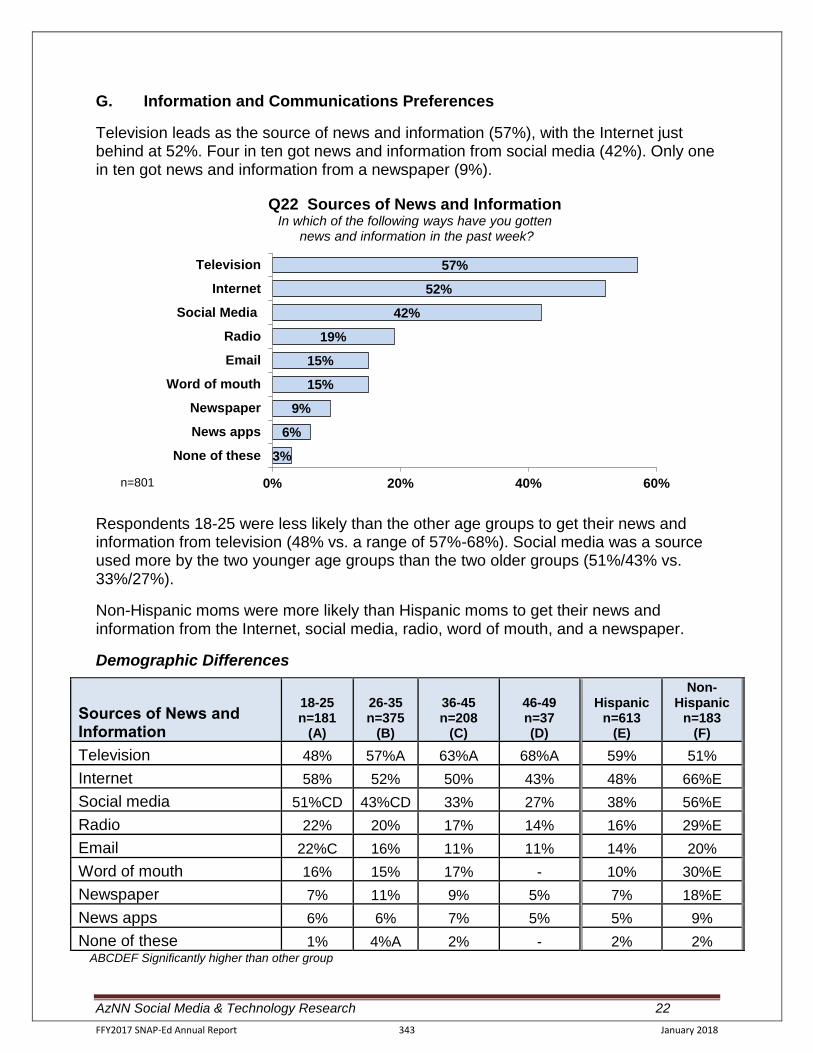
AzNN Social Media & Technology Research 22
G. Information and Communications Preferences
Television leads as the source of news and information (57%), with the Internet just behind at 52%. Four in ten got news and information from social media (42%). Only one in ten got news and information from a newspaper (9%).
Respondents 18-25 were less likely than the other age groups to get their news and information from television (48% vs. a range of 57%-68%). Social media was a source used more by the two younger age groups than the two older groups (51%/43% vs. 33%/27%).
Non-Hispanic moms were more likely than Hispanic moms to get their news and information from the Internet, social media, radio, word of mouth, and a newspaper.
Demographic Differences
Sources of News and Information
18-25 n=181
(A)
26-35 n=375
(B)
36-45 n=208
(C)
46-49 n=37 (D)
Hispanic n=613
(E)
Non-Hispanic
n=183 (F)
Television 48% 57%A 63%A 68%A 59% 51%
Internet 58% 52% 50% 43% 48% 66%E
Social media 51%CD 43%CD 33% 27% 38% 56%E
Radio 22% 20% 17% 14% 16% 29%E
Email 22%C 16% 11% 11% 14% 20%
Word of mouth 16% 15% 17% - 10% 30%E
Newspaper 7% 11% 9% 5% 7% 18%E
News apps 6% 6% 7% 5% 5% 9%
None of these 1% 4%A 2% - 2% 2% ABCDEF Significantly higher than other group
3%
6%
9%
15%
15%
19%
42%
52%
57%
0% 20% 40% 60%
None of these
News apps
Newspaper
Word of mouth
Radio
Social Media
Internet
Television
Q22 Sources of News and Information In which of the following ways have you gotten
news and information in the past week?
n=801
FFY2017 SNAP-Ed Annual Report 343 January 2018
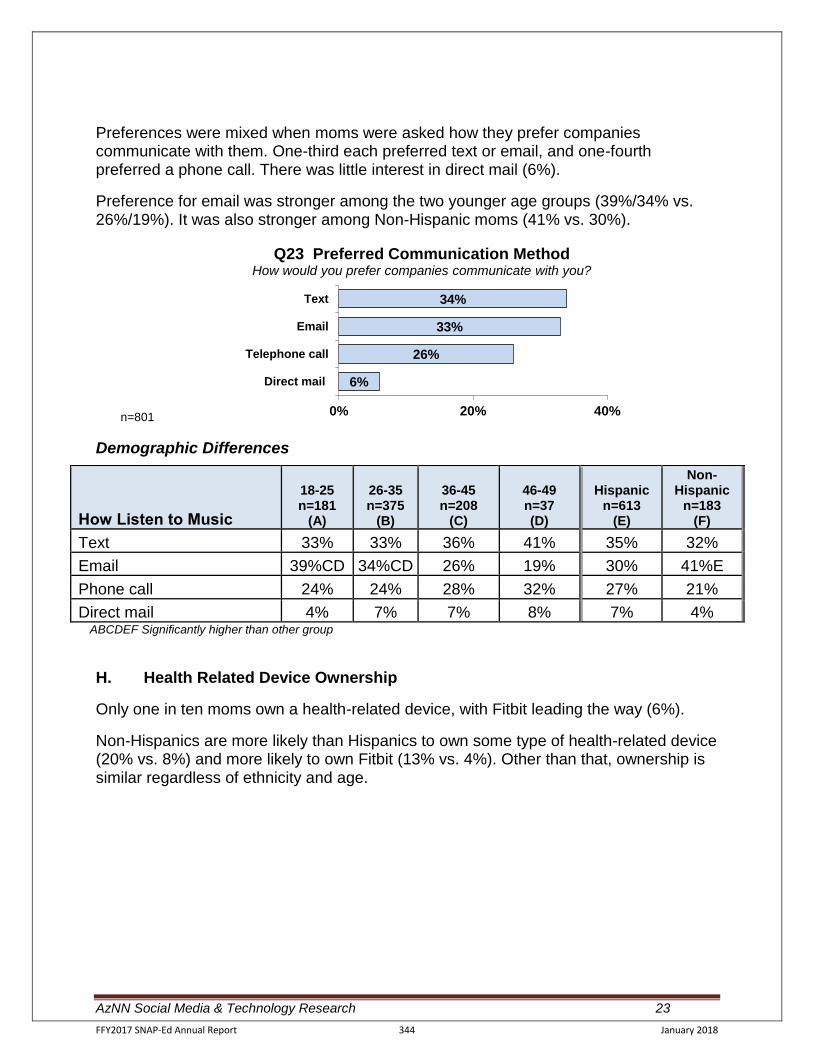
AzNN Social Media & Technology Research 23
Preferences were mixed when moms were asked how they prefer companies communicate with them. One-third each preferred text or email, and one-fourth preferred a phone call. There was little interest in direct mail (6%).
Preference for email was stronger among the two younger age groups (39%/34% vs. 26%/19%). It was also stronger among Non-Hispanic moms (41% vs. 30%).
Demographic Differences
How Listen to Music
18-25 n=181
(A)
26-35 n=375
(B)
36-45 n=208
(C)
46-49 n=37 (D)
Hispanic n=613
(E)
Non-Hispanic
n=183 (F)
Text 33% 33% 36% 41% 35% 32%
Email 39%CD 34%CD 26% 19% 30% 41%E
Phone call 24% 24% 28% 32% 27% 21%
Direct mail 4% 7% 7% 8% 7% 4% ABCDEF Significantly higher than other group
H. Health Related Device Ownership
Only one in ten moms own a health-related device, with Fitbit leading the way (6%).
Non-Hispanics are more likely than Hispanics to own some type of health-related device (20% vs. 8%) and more likely to own Fitbit (13% vs. 4%). Other than that, ownership is similar regardless of ethnicity and age.
6%
26%
33%
34%
0% 20% 40%
Direct mail
Telephone call
Text
Q23 Preferred Communication Method How would you prefer companies communicate with you?
n=801
FFY2017 SNAP-Ed Annual Report 344 January 2018
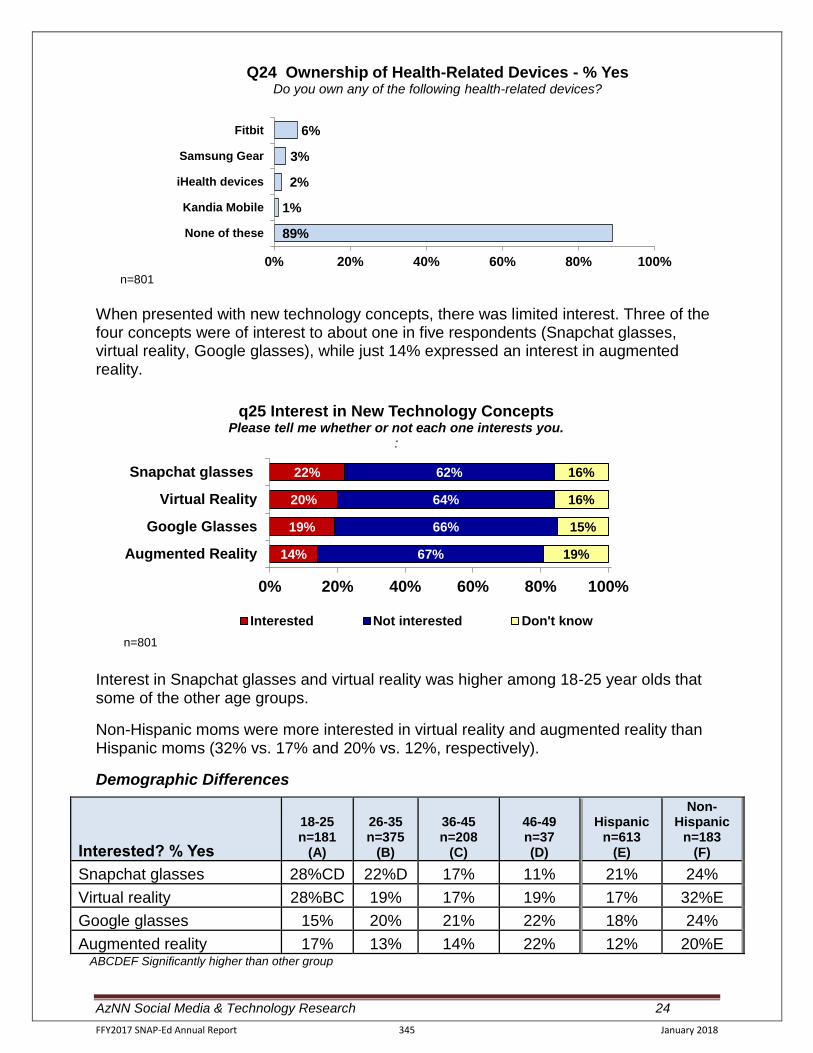
AzNN Social Media & Technology Research 24
When presented with new technology concepts, there was limited interest. Three of the four concepts were of interest to about one in five respondents (Snapchat glasses, virtual reality, Google glasses), while just 14% expressed an interest in augmented reality.
Interest in Snapchat glasses and virtual reality was higher among 18-25 year olds that some of the other age groups.
Non-Hispanic moms were more interested in virtual reality and augmented reality than Hispanic moms (32% vs. 17% and 20% vs. 12%, respectively).
Demographic Differences
Interested? % Yes
18-25 n=181
(A)
26-35 n=375
(B)
36-45 n=208
(C)
46-49 n=37 (D)
Hispanic n=613
(E)
Non-Hispanic
n=183 (F)
Snapchat glasses 28%CD 22%D 17% 11% 21% 24%
Virtual reality 28%BC 19% 17% 19% 17% 32%E
Google glasses 15% 20% 21% 22% 18% 24%
Augmented reality 17% 13% 14% 22% 12% 20%E ABCDEF Significantly higher than other group
89%
1%
2%
3%
6%
0% 20% 40% 60% 80% 100%
None of these
Kandia Mobile
iHealth devices
Samsung Gear
Fitbit
Q24 Ownership of Health-Related Devices - % Yes Do you own any of the following health-related devices?
n=801
14%
19%
20%
22%
67%
66%
64%
62%
19%
15%
16%
16%
0% 20% 40% 60% 80% 100%
Augmented Reality
Google Glasses
Virtual Reality
Snapchat glasses
q25 Interest in New Technology Concepts Please tell me whether or not each one interests you.
:
Interested Not interested Don't know
n=801
FFY2017 SNAP-Ed Annual Report 345 January 2018
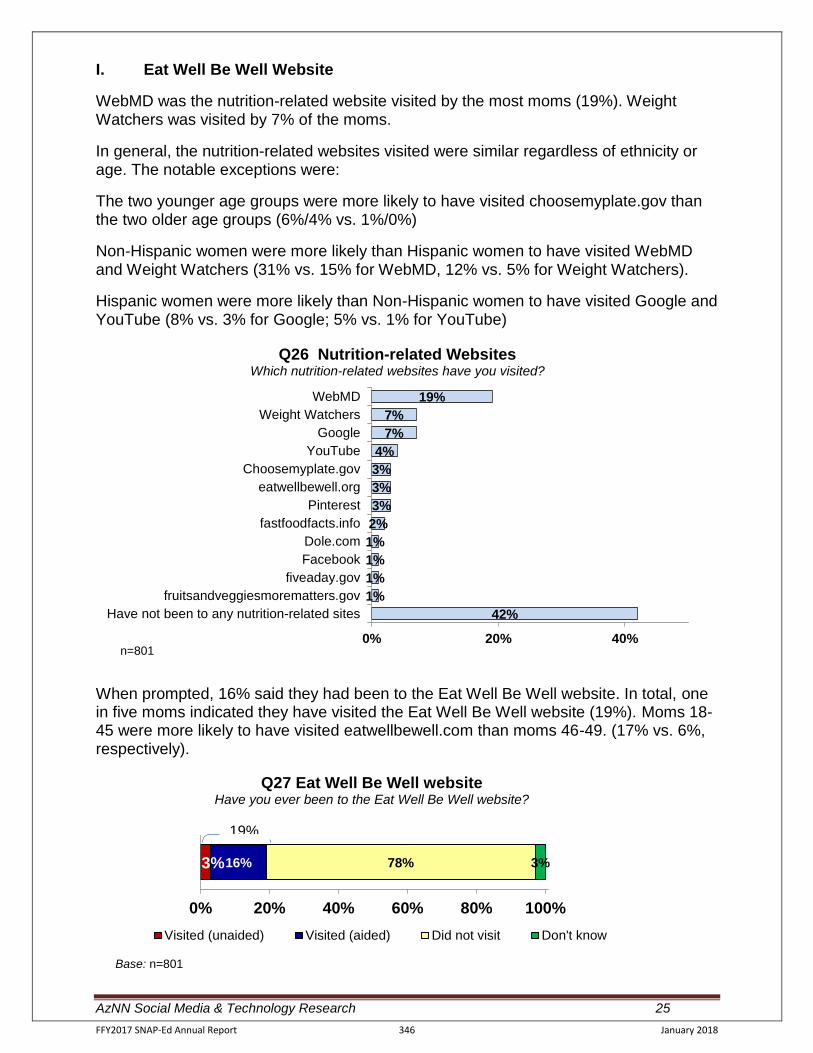
AzNN Social Media & Technology Research 25
I. Eat Well Be Well Website
WebMD was the nutrition-related website visited by the most moms (19%). Weight Watchers was visited by 7% of the moms.
In general, the nutrition-related websites visited were similar regardless of ethnicity or age. The notable exceptions were:
The two younger age groups were more likely to have visited choosemyplate.gov than the two older age groups (6%/4% vs. 1%/0%)
Non-Hispanic women were more likely than Hispanic women to have visited WebMD and Weight Watchers (31% vs. 15% for WebMD, 12% vs. 5% for Weight Watchers).
Hispanic women were more likely than Non-Hispanic women to have visited Google and YouTube (8% vs. 3% for Google; 5% vs. 1% for YouTube)
When prompted, 16% said they had been to the Eat Well Be Well website. In total, one in five moms indicated they have visited the Eat Well Be Well website (19%). Moms 18-45 were more likely to have visited eatwellbewell.com than moms 46-49. (17% vs. 6%, respectively).
42%
1%
1%
1%
1%
2%
3%
3%
3%
4%
7%
7%
19%
0% 20% 40%
Have not been to any nutrition-related sites
fruitsandveggiesmorematters.gov
fiveaday.gov
Dole.com
fastfoodfacts.info
eatwellbewell.org
Choosemyplate.gov
YouTube
Weight Watchers
WebMD
Q26 Nutrition-related Websites Which nutrition-related websites have you visited?
n=801
3% 16% 78% 3%
0% 20% 40% 60% 80% 100%
Q27 Eat Well Be Well website Have you ever been to the Eat Well Be Well website?
Visited (unaided) Visited (aided) Did not visit Don't know
Base: n=801
19%
FFY2017 SNAP-Ed Annual Report 346 January 2018
AzNN Social Media & Technology Research 26
Appendix A: Brands / People
Followed on Social Media
FFY2017 SNAP-Ed Annual Report 347 January 2018
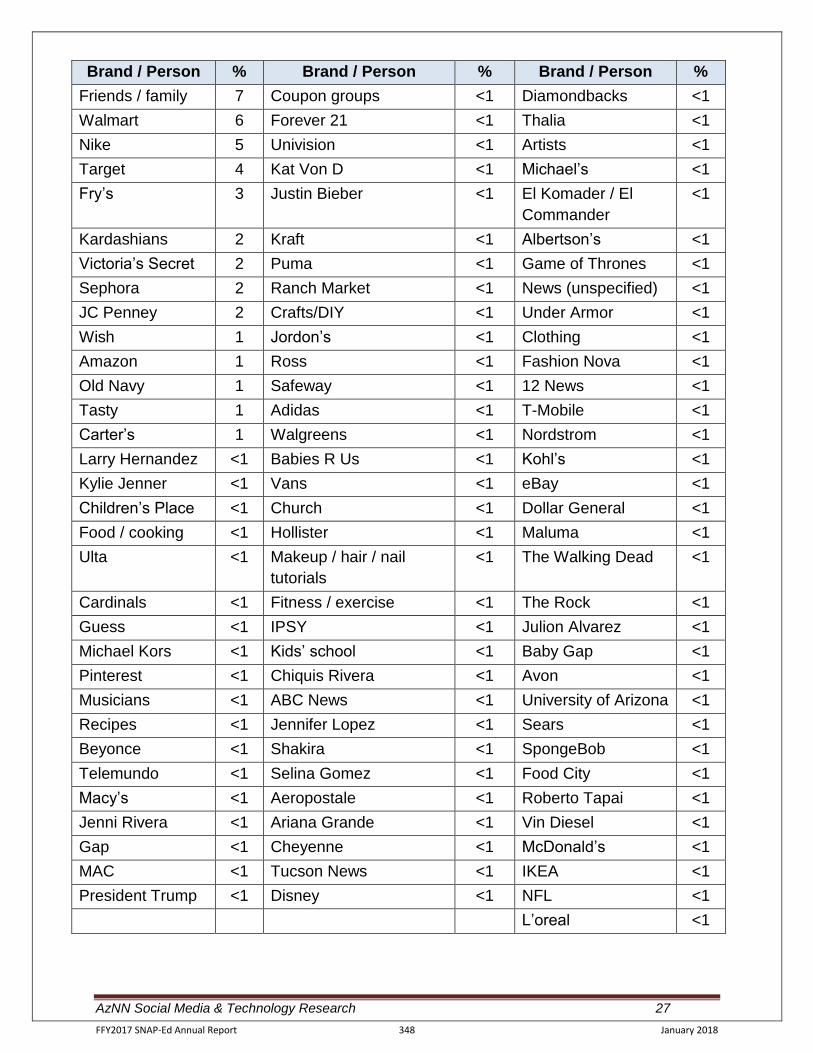
AzNN Social Media & Technology Research 27
Brand / Person % Brand / Person % Brand / Person %
Friends / family 7 Coupon groups <1 Diamondbacks <1
Walmart 6 Forever 21 <1 Thalia <1
Nike 5 Univision <1 Artists <1
Target 4 Kat Von D <1 Michael’s <1
Fry’s 3 Justin Bieber <1 El Komader / El
Commander
<1
Kardashians 2 Kraft <1 Albertson’s <1
Victoria’s Secret 2 Puma <1 Game of Thrones <1
Sephora 2 Ranch Market <1 News (unspecified) <1
JC Penney 2 Crafts/DIY <1 Under Armor <1
Wish 1 Jordon’s <1 Clothing <1
Amazon 1 Ross <1 Fashion Nova <1
Old Navy 1 Safeway <1 12 News <1
Tasty 1 Adidas <1 T-Mobile <1
Carter’s 1 Walgreens <1 Nordstrom <1
Larry Hernandez <1 Babies R Us <1 Kohl’s <1
Kylie Jenner <1 Vans <1 eBay <1
Children’s Place <1 Church <1 Dollar General <1
Food / cooking <1 Hollister <1 Maluma <1
Ulta <1 Makeup / hair / nail
tutorials
<1 The Walking Dead <1
Cardinals <1 Fitness / exercise <1 The Rock <1
Guess <1 IPSY <1 Julion Alvarez <1
Michael Kors <1 Kids’ school <1 Baby Gap <1
Pinterest <1 Chiquis Rivera <1 Avon <1
Musicians <1 ABC News <1 University of Arizona <1
Recipes <1 Jennifer Lopez <1 Sears <1
Beyonce <1 Shakira <1 SpongeBob <1
Telemundo <1 Selina Gomez <1 Food City <1
Macy’s <1 Aeropostale <1 Roberto Tapai <1
Jenni Rivera <1 Ariana Grande <1 Vin Diesel <1
Gap <1 Cheyenne <1 McDonald’s <1
MAC <1 Tucson News <1 IKEA <1
President Trump <1 Disney <1 NFL <1
L’oreal <1
FFY2017 SNAP-Ed Annual Report 348 January 2018
AzNN Social Media & Technology Research 28
Appendix B: Questionnaire
FFY2017 SNAP-Ed Annual Report 349 January 2018
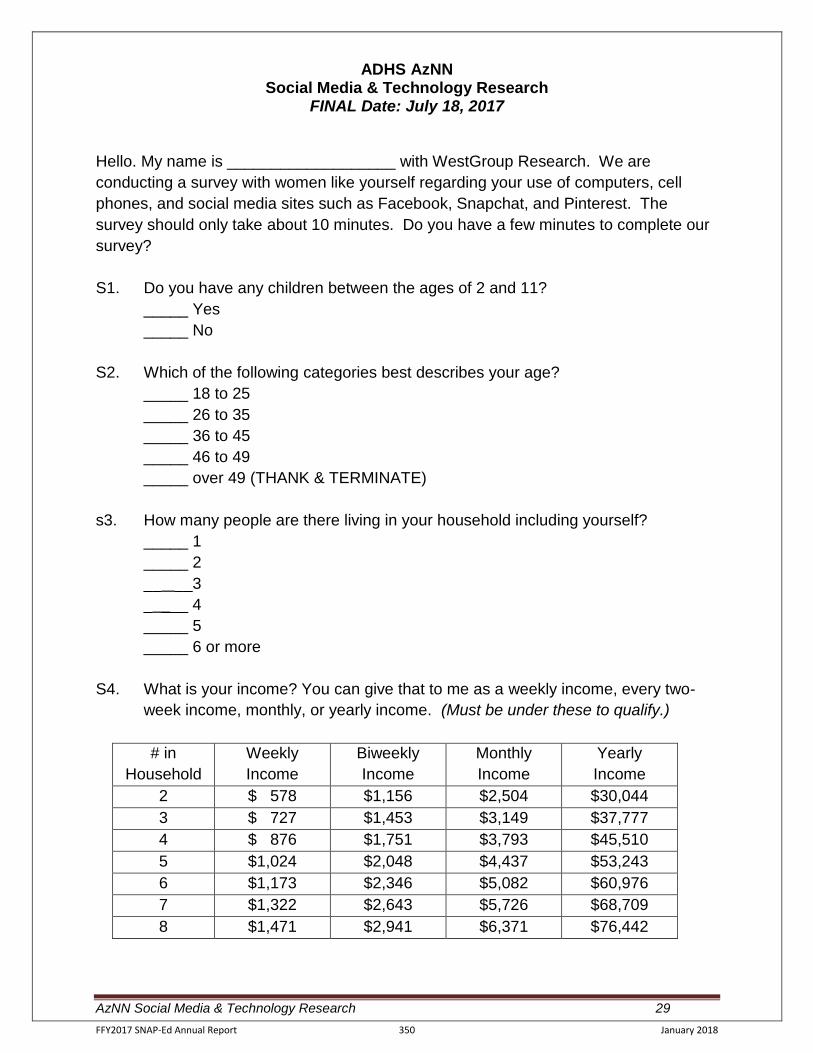
AzNN Social Media & Technology Research 29
ADHS AzNN Social Media & Technology Research
FINAL Date: July 18, 2017 Hello. My name is ___________________ with WestGroup Research. We are
conducting a survey with women like yourself regarding your use of computers, cell
phones, and social media sites such as Facebook, Snapchat, and Pinterest. The
survey should only take about 10 minutes. Do you have a few minutes to complete our
survey?
S1. Do you have any children between the ages of 2 and 11?
_____ Yes
_____ No
S2. Which of the following categories best describes your age?
_____ 18 to 25
_____ 26 to 35
_____ 36 to 45
_____ 46 to 49
_____ over 49 (THANK & TERMINATE)
s3. How many people are there living in your household including yourself?
_____ 1
_____ 2
__ __3
_ ___ 4
_____ 5
_____ 6 or more
S4. What is your income? You can give that to me as a weekly income, every two-
week income, monthly, or yearly income. (Must be under these to qualify.)
# in
Household
Weekly
Income
Biweekly
Income
Monthly
Income
Yearly
Income
2 $ 578 $1,156 $2,504 $30,044
3 $ 727 $1,453 $3,149 $37,777
4 $ 876 $1,751 $3,793 $45,510
5 $1,024 $2,048 $4,437 $53,243
6 $1,173 $2,346 $5,082 $60,976
7 $1,322 $2,643 $5,726 $68,709
8 $1,471 $2,941 $6,371 $76,442
FFY2017 SNAP-Ed Annual Report 350 January 2018
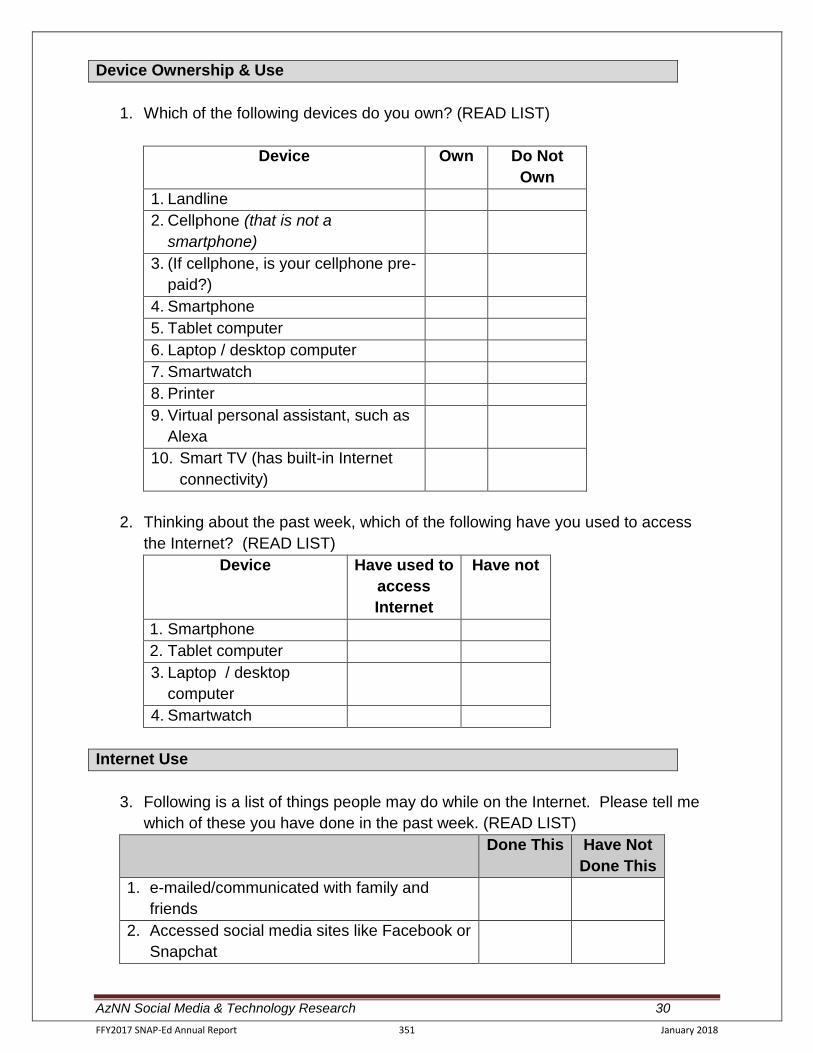
AzNN Social Media & Technology Research 30
Device Ownership & Use
1. Which of the following devices do you own? (READ LIST)
Device Own Do Not
Own
1. Landline
2. Cellphone (that is not a
smartphone)
3. (If cellphone, is your cellphone pre-
paid?)
4. Smartphone
5. Tablet computer
6. Laptop / desktop computer
7. Smartwatch
8. Printer
9. Virtual personal assistant, such as
Alexa
10. Smart TV (has built-in Internet
connectivity)
2. Thinking about the past week, which of the following have you used to access
the Internet? (READ LIST)
Device Have used to
access
Internet
Have not
1. Smartphone
2. Tablet computer
3. Laptop / desktop
computer
4. Smartwatch
Internet Use
3. Following is a list of things people may do while on the Internet. Please tell me
which of these you have done in the past week. (READ LIST)
Done This Have Not
Done This
1. e-mailed/communicated with family and
friends
2. Accessed social media sites like Facebook or
Snapchat
FFY2017 SNAP-Ed Annual Report 351 January 2018
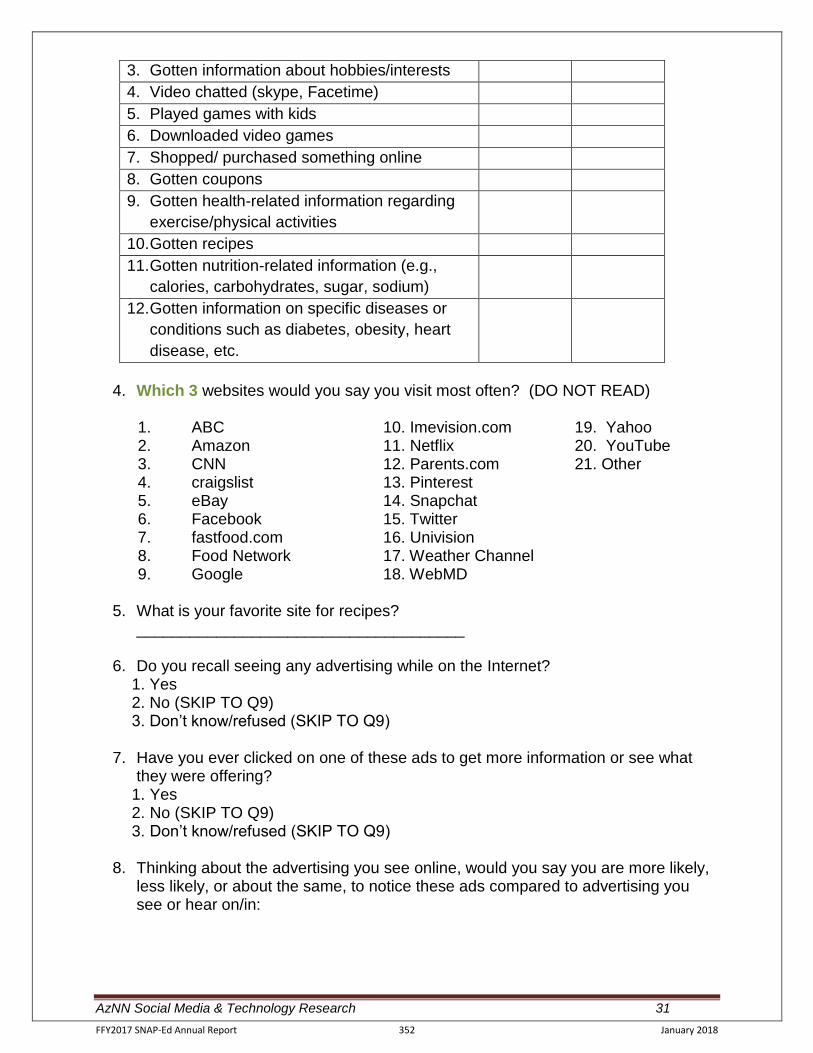
AzNN Social Media & Technology Research 31
3. Gotten information about hobbies/interests
4. Video chatted (skype, Facetime)
5. Played games with kids
6. Downloaded video games
7. Shopped/ purchased something online
8. Gotten coupons
9. Gotten health-related information regarding
exercise/physical activities
10. Gotten recipes
11. Gotten nutrition-related information (e.g.,
calories, carbohydrates, sugar, sodium)
12. Gotten information on specific diseases or
conditions such as diabetes, obesity, heart
disease, etc.
4. Which 3 websites would you say you visit most often? (DO NOT READ)
1. ABC 10. Imevision.com 19. Yahoo 2. Amazon 11. Netflix 20. YouTube 3. CNN 12. Parents.com 21. Other 4. craigslist 13. Pinterest 5. eBay 14. Snapchat 6. Facebook 15. Twitter 7. fastfood.com 16. Univision 8. Food Network 17. Weather Channel 9. Google 18. WebMD
5. What is your favorite site for recipes? _____________________________________
6. Do you recall seeing any advertising while on the Internet?
1. Yes 2. No (SKIP TO Q9) 3. Don’t know/refused (SKIP TO Q9)
7. Have you ever clicked on one of these ads to get more information or see what they were offering?
1. Yes 2. No (SKIP TO Q9) 3. Don’t know/refused (SKIP TO Q9)
8. Thinking about the advertising you see online, would you say you are more likely,
less likely, or about the same, to notice these ads compared to advertising you see or hear on/in:
FFY2017 SNAP-Ed Annual Report 352 January 2018
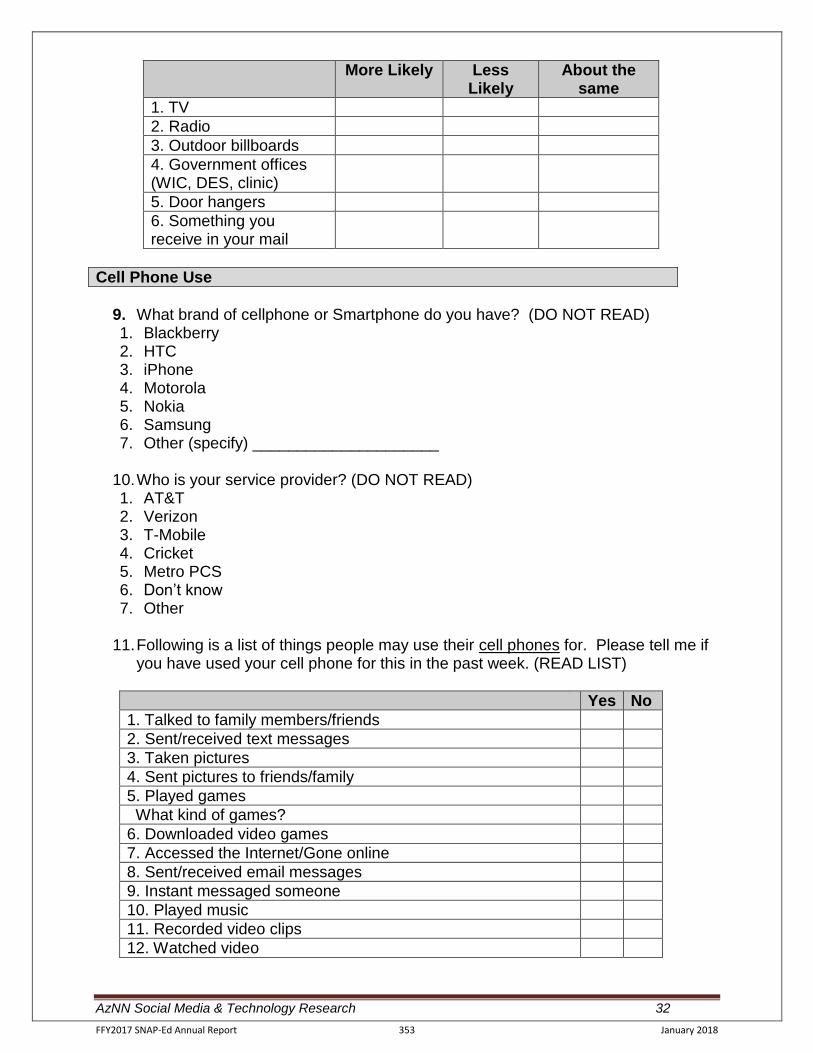
AzNN Social Media & Technology Research 32
More Likely Less Likely
About the same
1. TV
2. Radio
3. Outdoor billboards
4. Government offices(WIC, DES, clinic)
5. Door hangers
6. Something youreceive in your mail
Cell Phone Use
9. What brand of cellphone or Smartphone do you have? (DO NOT READ)1. Blackberry2. HTC3. iPhone4. Motorola5. Nokia6. Samsung7. Other (specify) _____________________
10. Who is your service provider? (DO NOT READ)1. AT&T2. Verizon3. T-Mobile4. Cricket5. Metro PCS6. Don’t know7. Other
11. Following is a list of things people may use their cell phones for. Please tell me ifyou have used your cell phone for this in the past week. (READ LIST)
Yes No
1. Talked to family members/friends
2. Sent/received text messages
3. Taken pictures
4. Sent pictures to friends/family
5. Played games
What kind of games?
6. Downloaded video games
7. Accessed the Internet/Gone online
8. Sent/received email messages
9. Instant messaged someone
10. Played music
11. Recorded video clips
12. Watched video
FFY2017 SNAP-Ed Annual Report 353 January 2018
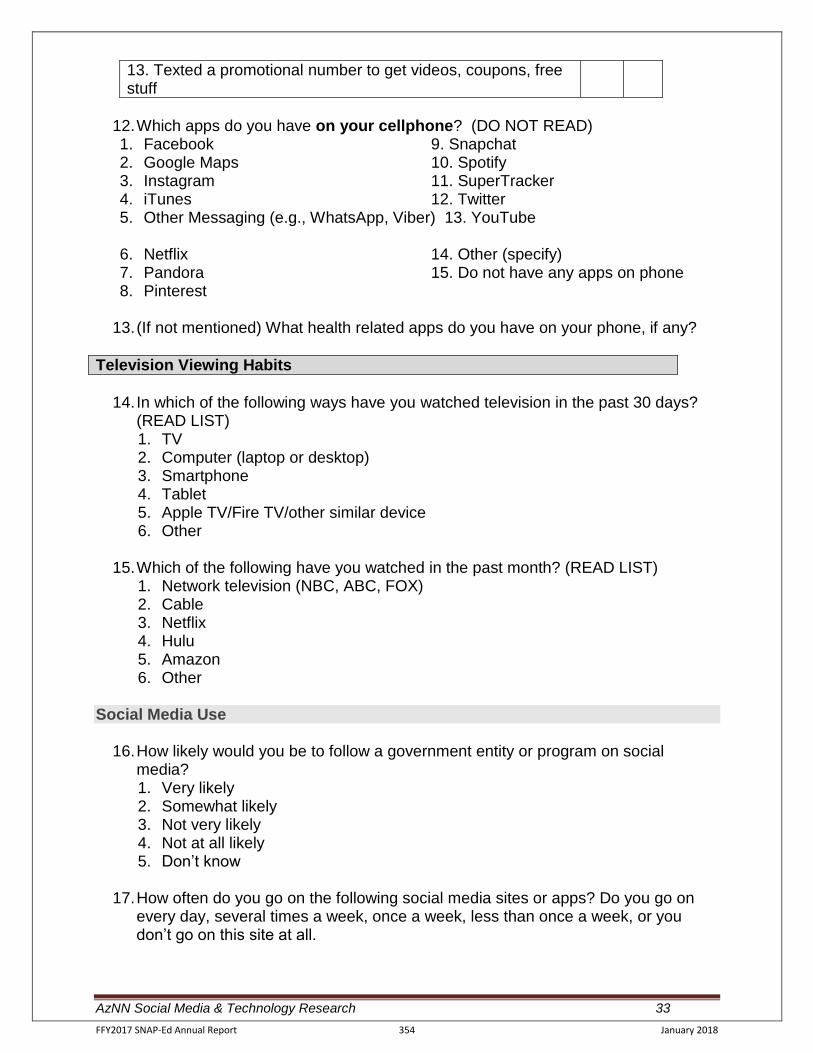
AzNN Social Media & Technology Research 33
13. Texted a promotional number to get videos, coupons, free stuff
12. Which apps do you have on your cellphone? (DO NOT READ) 1. Facebook 9. Snapchat 2. Google Maps 10. Spotify 3. Instagram 11. SuperTracker 4. iTunes 12. Twitter 5. Other Messaging (e.g., WhatsApp, Viber) 13. YouTube
6. Netflix 14. Other (specify) 7. Pandora 15. Do not have any apps on phone 8. Pinterest
13. (If not mentioned) What health related apps do you have on your phone, if any?
Television Viewing Habits
14. In which of the following ways have you watched television in the past 30 days?
(READ LIST) 1. TV 2. Computer (laptop or desktop) 3. Smartphone 4. Tablet 5. Apple TV/Fire TV/other similar device 6. Other
15. Which of the following have you watched in the past month? (READ LIST)
1. Network television (NBC, ABC, FOX) 2. Cable 3. Netflix 4. Hulu 5. Amazon 6. Other
Social Media Use
16. How likely would you be to follow a government entity or program on social media? 1. Very likely 2. Somewhat likely 3. Not very likely 4. Not at all likely 5. Don’t know
17. How often do you go on the following social media sites or apps? Do you go on
every day, several times a week, once a week, less than once a week, or you don’t go on this site at all.
FFY2017 SNAP-Ed Annual Report 354 January 2018
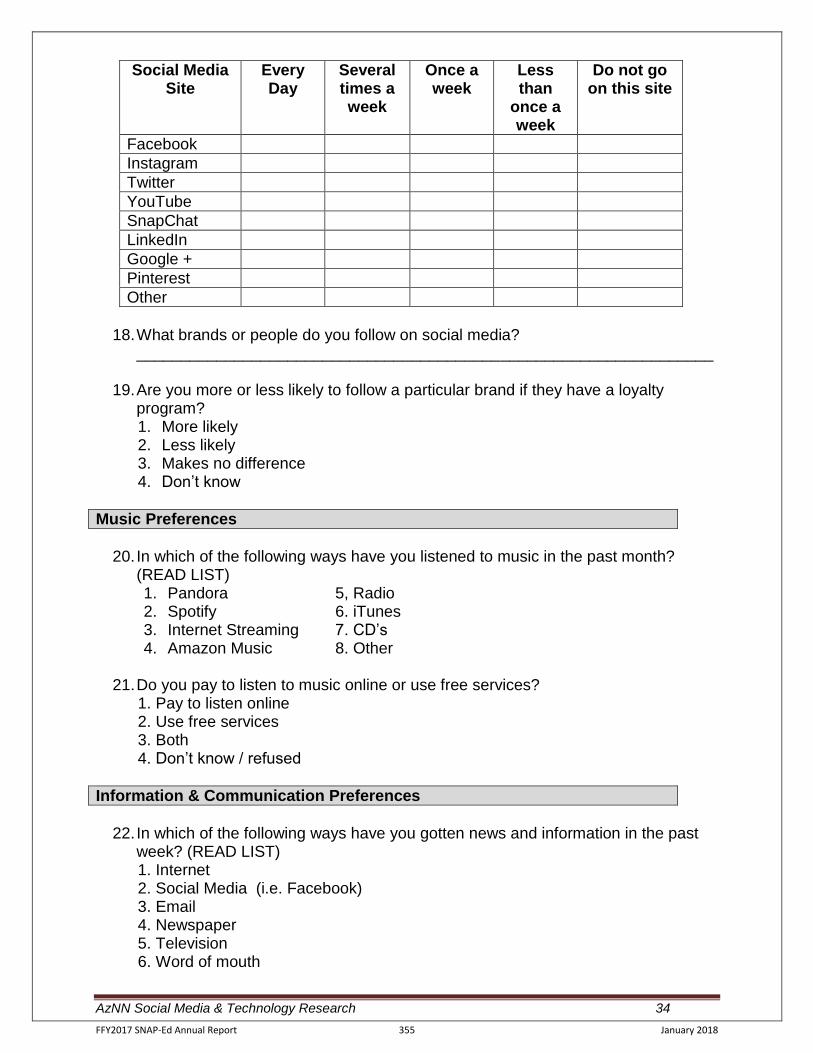
AzNN Social Media & Technology Research 34
Social Media Site
Every Day
Several times a week
Once a week
Less than
once a week
Do not go on this site
YouTube
SnapChat
Google +
Other
18. What brands or people do you follow on social media?_________________________________________________________________
19. Are you more or less likely to follow a particular brand if they have a loyaltyprogram?1. More likely2. Less likely3. Makes no difference4. Don’t know
Music Preferences
20. In which of the following ways have you listened to music in the past month?(READ LIST)1. Pandora 5, Radio 2. Spotify 6. iTunes3. Internet Streaming 7. CD’s4. Amazon Music 8. Other
21. Do you pay to listen to music online or use free services?1. Pay to listen online2. Use free services3. Both4. Don’t know / refused
Information & Communication Preferences
22. In which of the following ways have you gotten news and information in the pastweek? (READ LIST)1. Internet2. Social Media (i.e. Facebook)3. Email4. Newspaper5. Television6. Word of mouth
FFY2017 SNAP-Ed Annual Report 355 January 2018
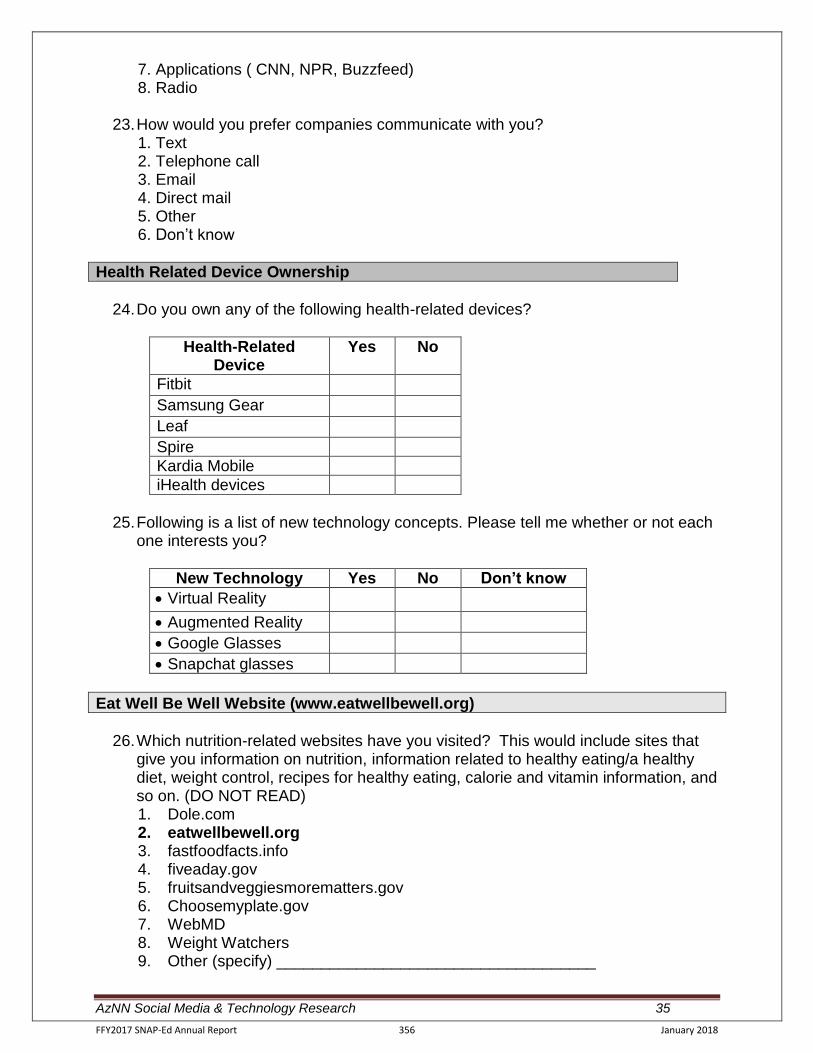
AzNN Social Media & Technology Research 35
7. Applications ( CNN, NPR, Buzzfeed)8. Radio
23. How would you prefer companies communicate with you?1. Text2. Telephone call3. Email4. Direct mail5. Other6. Don’t know
Health Related Device Ownership
24. Do you own any of the following health-related devices?
Health-Related Device
Yes No
Fitbit
Samsung Gear
Leaf
Spire
Kardia Mobile
iHealth devices
25. Following is a list of new technology concepts. Please tell me whether or not eachone interests you?
New Technology Yes No Don’t know
Virtual Reality
Augmented Reality
Google Glasses
Snapchat glasses
Eat Well Be Well Website (www.eatwellbewell.org)
26. Which nutrition-related websites have you visited? This would include sites thatgive you information on nutrition, information related to healthy eating/a healthydiet, weight control, recipes for healthy eating, calorie and vitamin information, andso on. (DO NOT READ)1. Dole.com2. eatwellbewell.org3. fastfoodfacts.info4. fiveaday.gov5. fruitsandveggiesmorematters.gov6. Choosemyplate.gov7. WebMD8. Weight Watchers9. Other (specify) ____________________________________
FFY2017 SNAP-Ed Annual Report 356 January 2018
AzNN Social Media & Technology Research 36
10. Don’t know11. Have not been to any nutrition-related sites
27. (If not mentioned in Q26) Have you ever been to the Eat Well Be Well website(www.eatwellbewell.org)?
1. Yes2. No3. Don’t know
Demographics
D1a. Do you consider yourself to be: 1. Hispanic 2. Non-Hispanic 3. Refused
D1b. And, do you consider yourself: 1. American Indian/Alaskan Native/Native American2. Asian3. Black or African American4. Native Hawaiian or Other Pacific Islander5. White6. Don’t know / Refused
D2. What is the highest level of education you have had the opportunity to complete? 1 Less than 8th grade 5 High school graduate 2 8th grade 6 Some college 3 Some high school 7 College graduate 4 GED completed 8 Masters Degree
D3. Do you or anyone in your family participate in food assistance programs? 1 Yes 2 No
D4. If Yes, which ones? 1 CSFP 5 Summer Food Program 2 Food Stamps/SNAP 6 School Lunch/School Breakfast 3 WIC 4 Other
D5. What is the primary language spoken in your household? 1 English 3 Both English 2 Spanish 4 Other
Thank you very much!
FFY2017 SNAP-Ed Annual Report 357 January 2018

PAGE INTENTIONALLY BLANK
FFY2017 SNAP-Ed Annual Report 358 January 2018
Appendix G
Recipe Research
FFY2017 SNAP-Ed Annual Report 359 January 2018
Arizona Nutrition Network
Recipe Project
Report
July 13, 2017
1102 E Ina RD • Tucson AZ • 85718 • (520)873-8562
www.evaluationstrategies.net
FFY2017 SNAP-Ed Annual Report 360 January 2018
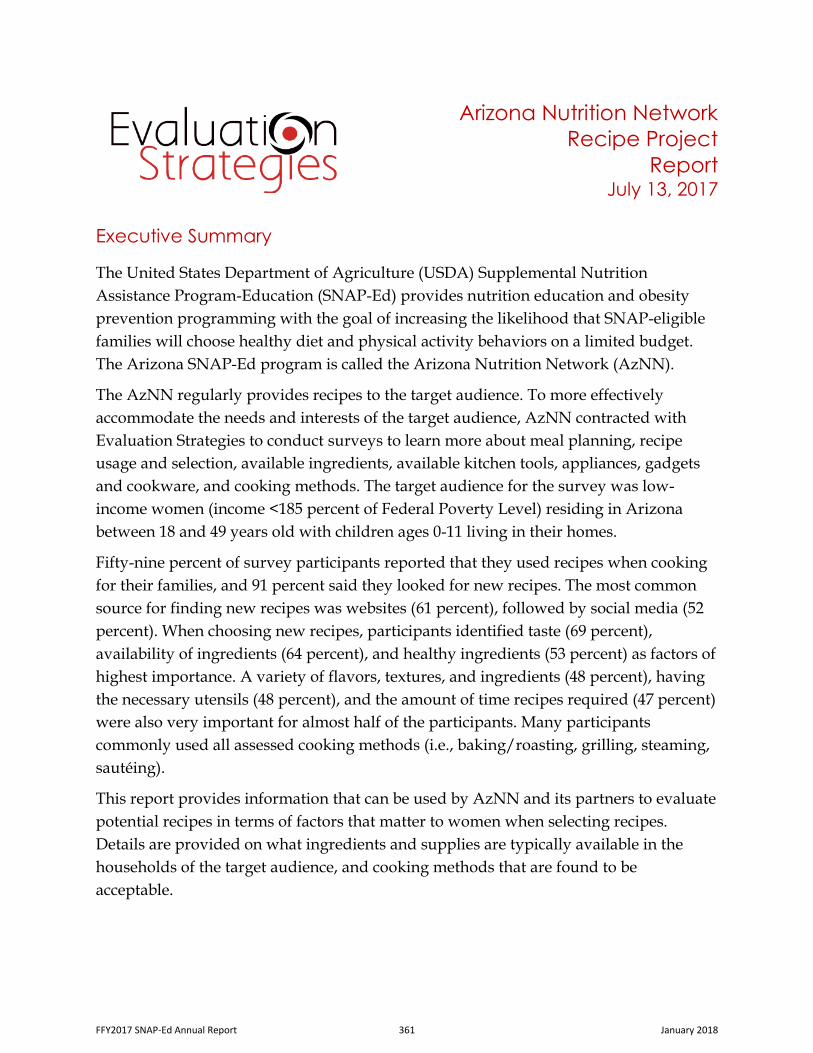
Arizona Nutrition Network
Recipe Project
Report July 13, 2017
Executive Summary
The United States Department of Agriculture (USDA) Supplemental Nutrition
Assistance Program-Education (SNAP-Ed) provides nutrition education and obesity
prevention programming with the goal of increasing the likelihood that SNAP-eligible
families will choose healthy diet and physical activity behaviors on a limited budget.
The Arizona SNAP-Ed program is called the Arizona Nutrition Network (AzNN).
The AzNN regularly provides recipes to the target audience. To more effectively
accommodate the needs and interests of the target audience, AzNN contracted with
Evaluation Strategies to conduct surveys to learn more about meal planning, recipe
usage and selection, available ingredients, available kitchen tools, appliances, gadgets
and cookware, and cooking methods. The target audience for the survey was low-
income women (income <185 percent of Federal Poverty Level) residing in Arizona
between 18 and 49 years old with children ages 0-11 living in their homes.
Fifty-nine percent of survey participants reported that they used recipes when cooking
for their families, and 91 percent said they looked for new recipes. The most common
source for finding new recipes was websites (61 percent), followed by social media (52
percent). When choosing new recipes, participants identified taste (69 percent),
availability of ingredients (64 percent), and healthy ingredients (53 percent) as factors of
highest importance. A variety of flavors, textures, and ingredients (48 percent), having
the necessary utensils (48 percent), and the amount of time recipes required (47 percent)
were also very important for almost half of the participants. Many participants
commonly used all assessed cooking methods (i.e., baking/roasting, grilling, steaming,
sautéing).
This report provides information that can be used by AzNN and its partners to evaluate
potential recipes in terms of factors that matter to women when selecting recipes.
Details are provided on what ingredients and supplies are typically available in the
households of the target audience, and cooking methods that are found to be
acceptable.
FFY2017 SNAP-Ed Annual Report 361 January 2018
Section 1: Introduction and Background
The United States Department of Agriculture (USDA) Supplemental Nutrition
Assistance Program-Education (SNAP-Ed) provides nutrition education and obesity
prevention programming with the goal of increasing the likelihood that SNAP-eligible
families will choose healthy diet and physical activity behaviors on a limited budget.
Through the Arizona Department of Health Services (ADHS), the Arizona SNAP-Ed
program, called the Arizona Nutrition Network, coordinates initiatives with state-level
partners and eight local implementing agencies to encourage behavioral outcomes that
include increased fruit and vegetable consumption, regular physical activity, and
caloric balance throughout the life cycle.
The AzNN regularly provides recipes to the target audience using multiple methods,
including distribution of printed recipe cards/handouts, a recipe database on the
eatwellbewell.org website, Pinterest, and email distribution. Material distribution
occurs simultaneously with direct education efforts (e.g., curriculum delivery, food
demonstration/taste testing, informational booths at health fairs, etc.).
Past research has explored participant and partner agency satisfaction with recipes and
other social marketing materials, but has not delved into criteria to consider when
creating and/or selecting recipes for use with the target audience. To more effectively
accommodate the needs and interests of the target audience, AzNN contracted with
Evaluation Strategies to conduct surveys to learn more about meal planning, recipe
usage and selection, available ingredients, available kitchen tools, appliances, gadgets
and cookware, and cooking methods. The target audience for the survey was low-
income women (income <185 percent of Federal Poverty Level) residing in Arizona
between 18 and 49 years old with children ages 0-11 living in their homes.
The remainder of this report is organized into two sections, methodology and results. In
addition, Appendix A presents a list of detailed data tables showing the number and
percent for responses to all survey questions. All tables referenced throughout the
document can be found in Appendix A. Appendix B presents copies of the survey tools
in English and Spanish, including screening questions and picture prompts.
FFY2017 SNAP-Ed Annual Report 362 January 2018
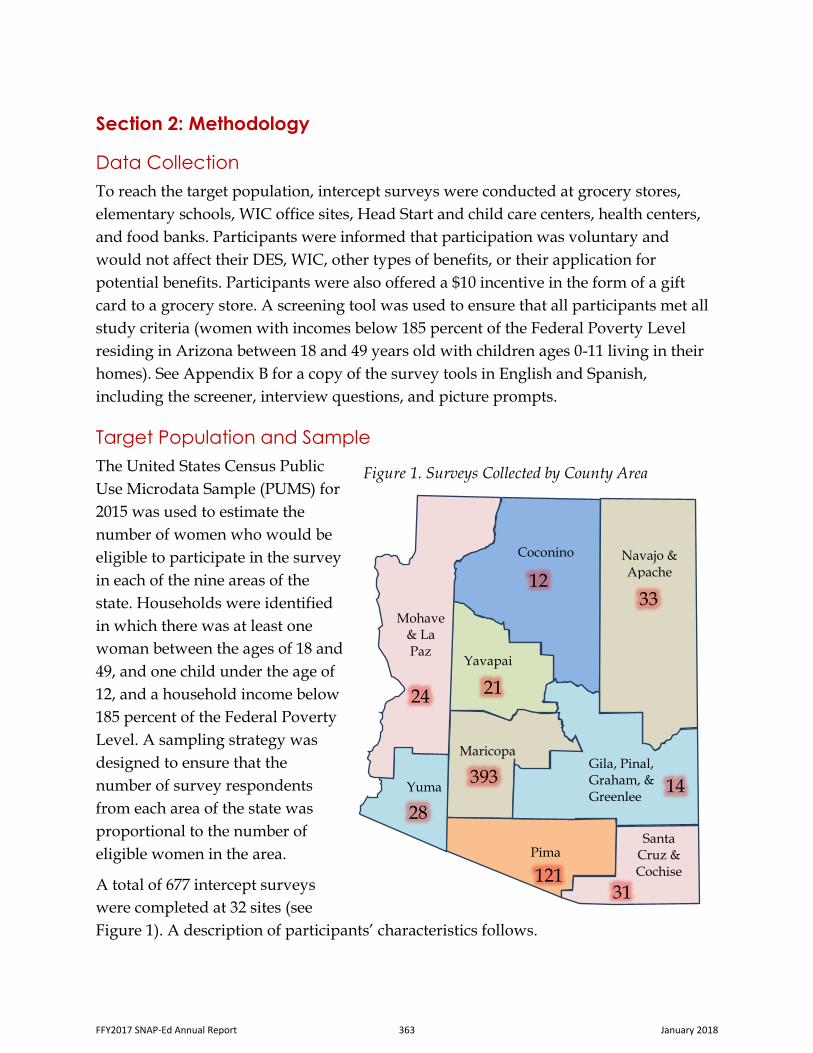
Section 2: Methodology
Data Collection
To reach the target population, intercept surveys were conducted at grocery stores,
elementary schools, WIC office sites, Head Start and child care centers, health centers,
and food banks. Participants were informed that participation was voluntary and
would not affect their DES, WIC, other types of benefits, or their application for
potential benefits. Participants were also offered a $10 incentive in the form of a gift
card to a grocery store. A screening tool was used to ensure that all participants met all
study criteria (women with incomes below 185 percent of the Federal Poverty Level
residing in Arizona between 18 and 49 years old with children ages 0-11 living in their
homes). See Appendix B for a copy of the survey tools in English and Spanish,
including the screener, interview questions, and picture prompts.
Target Population and Sample
The United States Census Public
Use Microdata Sample (PUMS) for
2015 was used to estimate the
number of women who would be
eligible to participate in the survey
in each of the nine areas of the
state. Households were identified
in which there was at least one
woman between the ages of 18 and
49, and one child under the age of
12, and a household income below
185 percent of the Federal Poverty
Level. A sampling strategy was
designed to ensure that the
number of survey respondents
from each area of the state was
proportional to the number of
eligible women in the area.
A total of 677 intercept surveys
were completed at 32 sites (see
Figure 1). A description of participants’ characteristics follows.
24
Gila, Pinal, Graham, & Greenlee
14
Maricopa
393
Pima
121
Santa
Cruz & Cochise
31
Coconino
12
Navajo & Apache
33
Yuma
28
Yavapai
21
Mohave
& La Paz
Figure 1. Surveys Collected by County Area
FFY2017 SNAP-Ed Annual Report 363 January 2018
Household Size
The average household size of survey participants was 4.5. Twenty-eight percent
reported a household size (including themselves) of four people. About two-thirds
reported a household size of three to five people including themselves (71 percent) (see
Table 1).
Participants’ and Children’s Ages
The average age of participants was 32, with one-quarter between 33 and 38 years old,
24 percent between 28 to 32 years old, and 22 percent between 23 to 27 years old (see
Table 2). Thirty-two percent of participants reported that they had at least one child
under the age of 12 months; 59 percent reported they had at least one child between 1
and 4 years of age; and 64 percent of participants reported that they had at least one
child between 5 and 11 years of age (see Table 3).
Ethnic and Racial Identification
Almost three fourths (73 percent) of participants identified as White; 6 percent
identified as Black or African American; 3 percent identified as American
Indian/Alaskan Native/Native American; 1 percent identified as Native Hawaiian or
Other Pacific Islander; less than 1 percent identified as Multi-racial and as Asian (see
Table 4). Two-thirds of survey participants reported that they identified as Hispanic (67
percent) (see Table 4).
Monthly Household Income
Average monthly household income of participants was reported as $2,079.68. About
one half of participants (49 percent) reported a monthly household income of $2,470 or
less, followed by 16 percent who reported between $2,471 and $3,108, and 4 percent
who reported between $3,109 and $3,747 (see Table 5).
Food Assistance Programs
Overall, 78 percent of participants reported that someone in their family received food
assistance of some kind (see Table 6). Forty-six percent of participants received WIC, 44
percent received SNAP, and 37 percent had a child on the Free and Reduced-Price
School Meal program. Three percent reported receiving some other kind of food
assistance (see Table 7).
FFY2017 SNAP-Ed Annual Report 364 January 2018
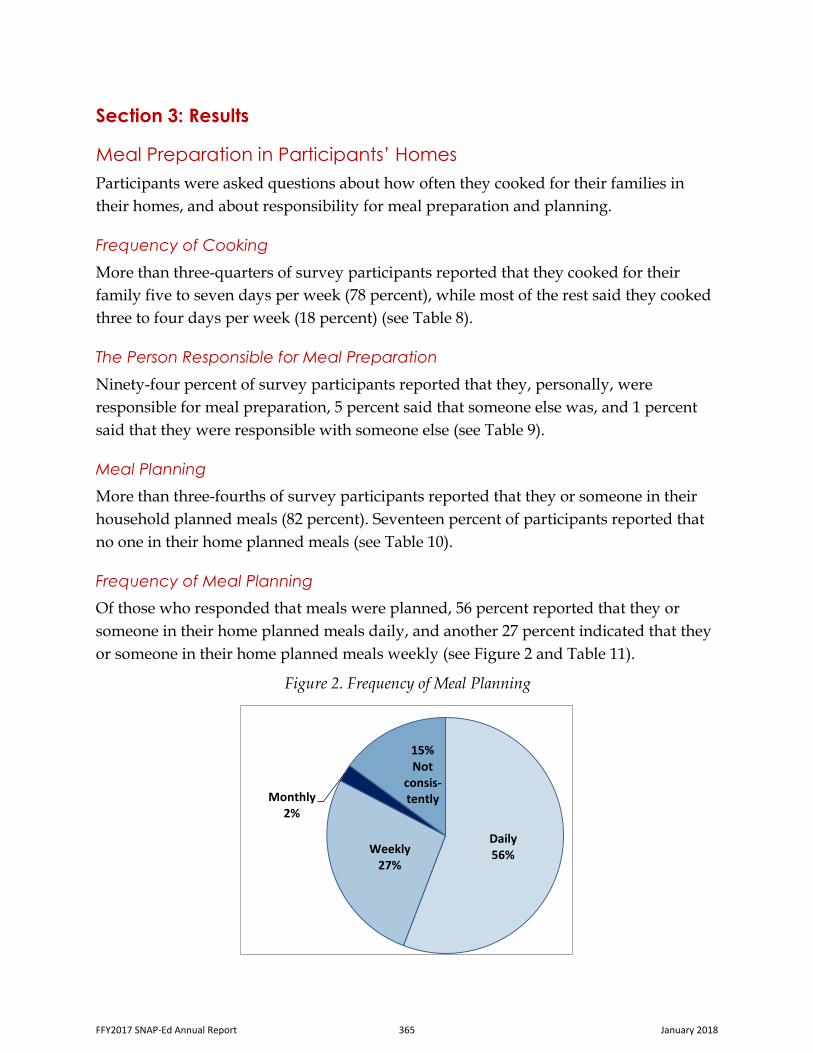
Section 3: Results
Meal Preparation in Participants’ Homes
Participants were asked questions about how often they cooked for their families in
their homes, and about responsibility for meal preparation and planning.
Frequency of Cooking
More than three-quarters of survey participants reported that they cooked for their
family five to seven days per week (78 percent), while most of the rest said they cooked
three to four days per week (18 percent) (see Table 8).
The Person Responsible for Meal Preparation
Ninety-four percent of survey participants reported that they, personally, were
responsible for meal preparation, 5 percent said that someone else was, and 1 percent
said that they were responsible with someone else (see Table 9).
Meal Planning
More than three-fourths of survey participants reported that they or someone in their
household planned meals (82 percent). Seventeen percent of participants reported that
no one in their home planned meals (see Table 10).
Frequency of Meal Planning
Of those who responded that meals were planned, 56 percent reported that they or
someone in their home planned meals daily, and another 27 percent indicated that they
or someone in their home planned meals weekly (see Figure 2 and Table 11).
Daily56%Weekly
27%
Monthly2%
15%Not
consis-tently
Figure 2. Frequency of Meal Planning
FFY2017 SNAP-Ed Annual Report 365 January 2018
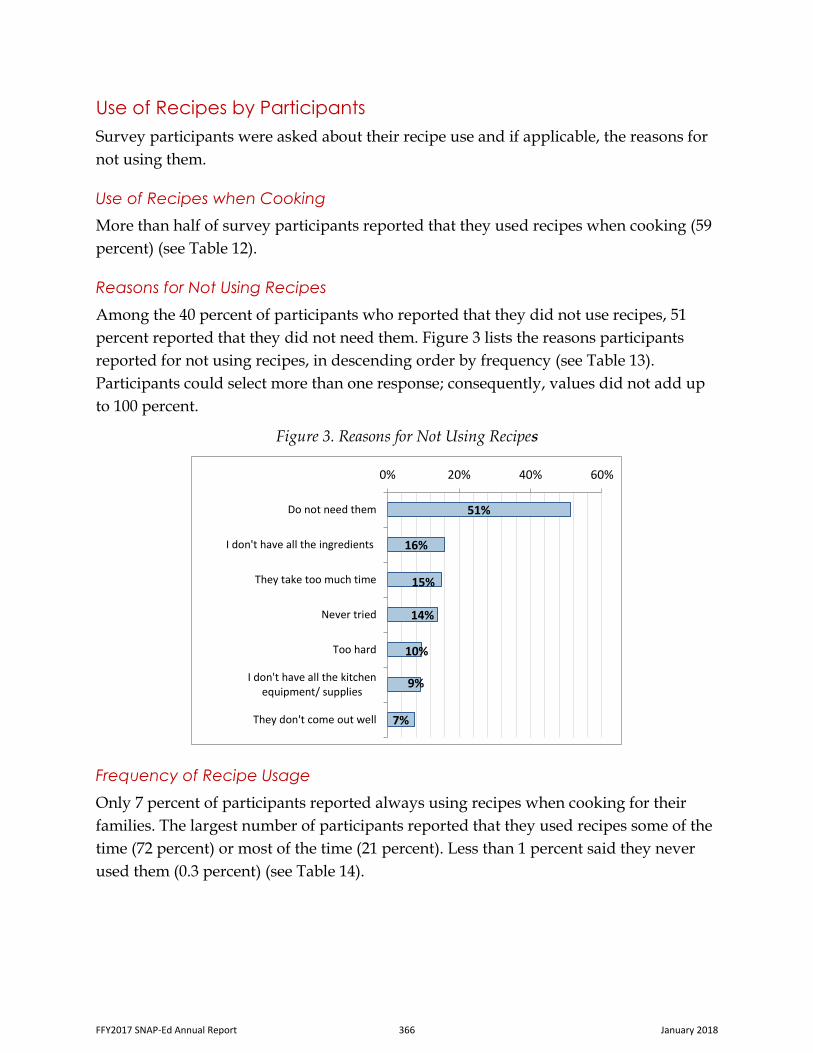
Use of Recipes by Participants
Survey participants were asked about their recipe use and if applicable, the reasons for
not using them.
Use of Recipes when Cooking
More than half of survey participants reported that they used recipes when cooking (59
percent) (see Table 12).
Reasons for Not Using Recipes
Among the 40 percent of participants who reported that they did not use recipes, 51
percent reported that they did not need them. Figure 3 lists the reasons participants
reported for not using recipes, in descending order by frequency (see Table 13).
Participants could select more than one response; consequently, values did not add up
to 100 percent.
Figure 3. Reasons for Not Using Recipes
Frequency of Recipe Usage
Only 7 percent of participants reported always using recipes when cooking for their
families. The largest number of participants reported that they used recipes some of the
time (72 percent) or most of the time (21 percent). Less than 1 percent said they never
used them (0.3 percent) (see Table 14).
51%
16%
15%
14%
10%
9%
7%
0% 20% 40% 60%
Do not need them
I don't have all the ingredients
They take too much time
Never tried
Too hard
I don't have all the kitchenequipment/ supplies
They don't come out well
FFY2017 SNAP-Ed Annual Report 366 January 2018
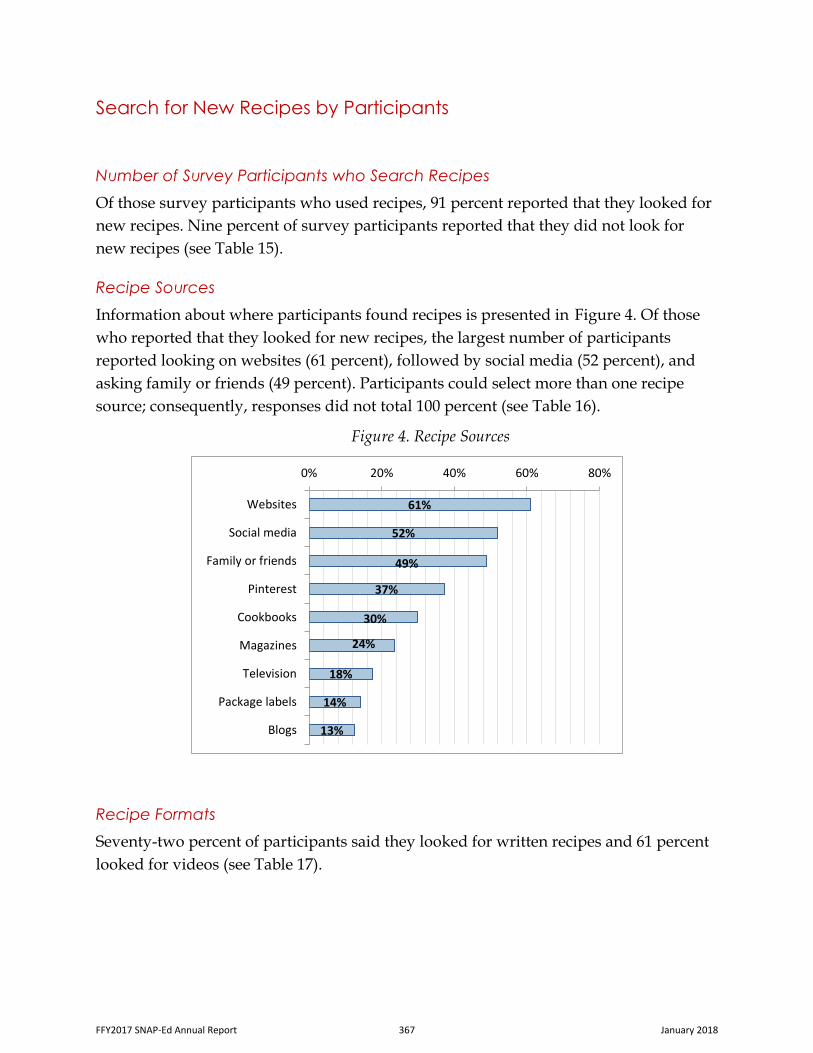
Search for New Recipes by Participants
Number of Survey Participants who Search Recipes
Of those survey participants who used recipes, 91 percent reported that they looked for
new recipes. Nine percent of survey participants reported that they did not look for
new recipes (see Table 15).
Recipe Sources
Information about where participants found recipes is presented in Figure 4. Of those
who reported that they looked for new recipes, the largest number of participants
reported looking on websites (61 percent), followed by social media (52 percent), and
asking family or friends (49 percent). Participants could select more than one recipe
source; consequently, responses did not total 100 percent (see Table 16).
Figure 4. Recipe Sources
Recipe Formats
Seventy-two percent of participants said they looked for written recipes and 61 percent
looked for videos (see Table 17).
61%
52%
49%
37%
30%
24%
18%
14%
13%
0% 20% 40% 60% 80%
Websites
Social media
Family or friends
Cookbooks
Magazines
Television
Package labels
Blogs
FFY2017 SNAP-Ed Annual Report 367 January 2018

Factors in Recipe Selection
Participants who reported that they used recipes were asked to rate certain factors in
terms of how important they were in selecting a recipe. Taste was most often rated as
either very important or important, followed by availability of ingredients, and healthy
ingredients. Figure 5 shows the percent of participants who said that each of the factors
rated was very important or important, sorted in descending order by the sum of those
two ratings (see Table 18).
Figure 5. Importance of Factors in Recipe Selection
Comfort with Ingredient Substitutions
Of those participants that used recipes, 90 percent reported that they were either very
comfortable with substituting ingredients (49 percent) or somewhat comfortable (41
percent) (see Table 19).
69%
64%
53%
48%
46%
48%
43%
47%
46%
38%
33%
34%
29%
33%
17%
18%
21%
27%
29%
30%
28%
32%
28%
26%
26%
29%
23%
23%
11%
9%
0% 20% 40% 60% 80% 100%
Taste
Availability of ingredients
Healthy ingredients
Variety of flavors, textures, ingredients
Ingredients you already have
Have the needed utensils
MyPlate food groups
Amount of time to prepare
Cost of ingredients
Includes picture of food
Difficulty or ease in making
Number of ingredients
Video is available
WIC foods are included
Vegetarian
Very important Important
FFY2017 SNAP-Ed Annual Report 368 January 2018
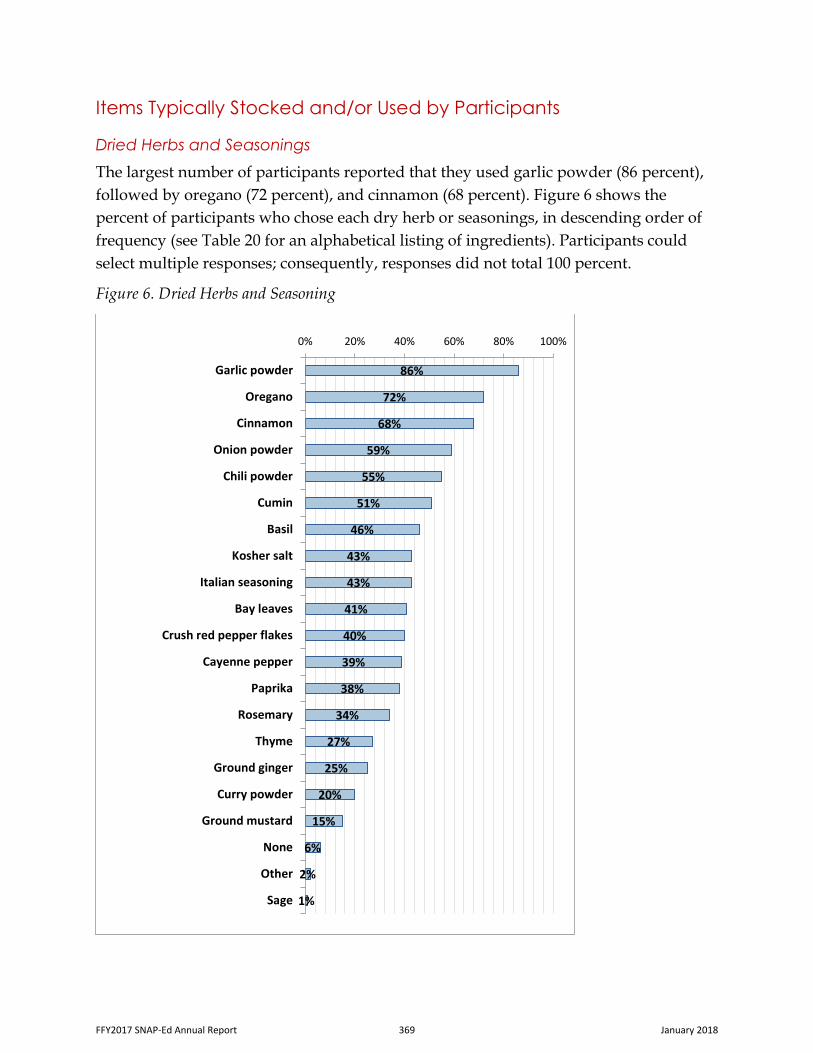
Items Typically Stocked and/or Used by Participants
Dried Herbs and Seasonings
The largest number of participants reported that they used garlic powder (86 percent),
followed by oregano (72 percent), and cinnamon (68 percent). Figure 6 shows the
percent of participants who chose each dry herb or seasonings, in descending order of
frequency (see Table 20 for an alphabetical listing of ingredients). Participants could
select multiple responses; consequently, responses did not total 100 percent.
Figure 6. Dried Herbs and Seasoning
86%
72%
68%
59%
55%
51%
46%
43%
43%
41%
40%
39%
38%
34%
27%
25%
20%
15%
6%
2%
1%
0% 20% 40% 60% 80% 100%
Garlic powder
Oregano
Cinnamon
Onion powder
Chili powder
Cumin
Basil
Kosher salt
Italian seasoning
Bay leaves
Crush red pepper flakes
Cayenne pepper
Paprika
Rosemary
Thyme
Ground ginger
Curry powder
Ground mustard
None
Other
Sage
FFY2017 SNAP-Ed Annual Report 369 January 2018
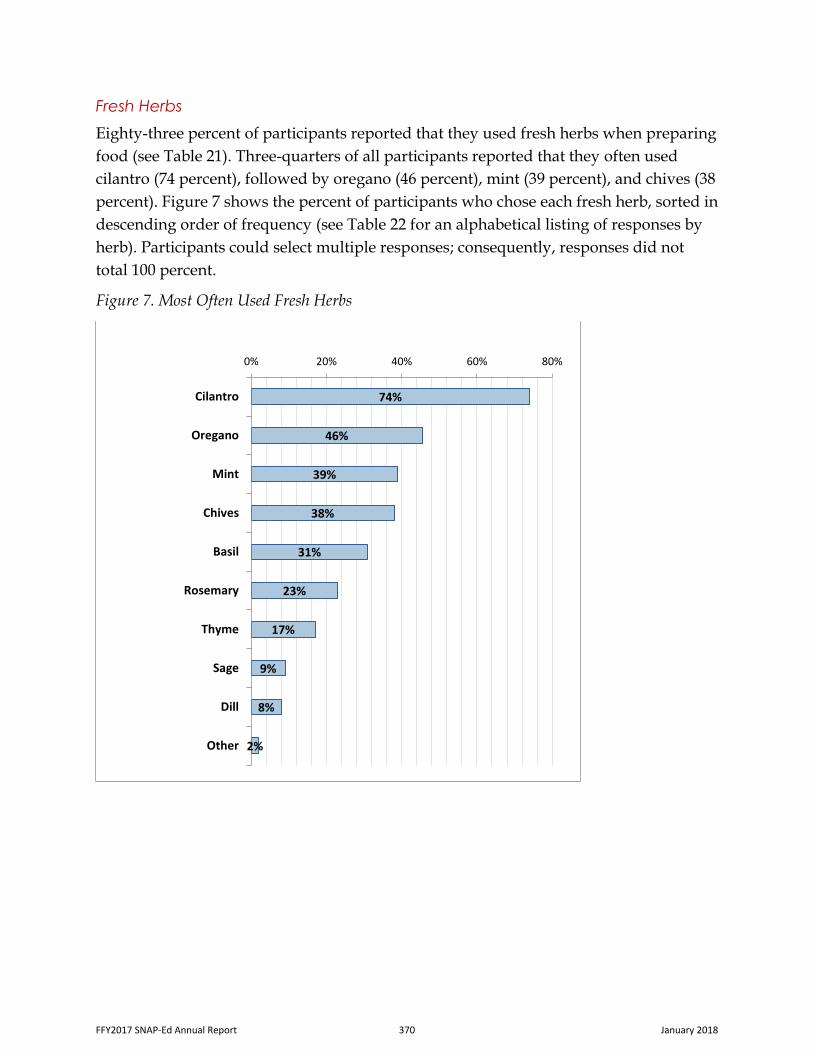
Fresh Herbs
Eighty-three percent of participants reported that they used fresh herbs when preparing
food (see Table 21). Three-quarters of all participants reported that they often used
cilantro (74 percent), followed by oregano (46 percent), mint (39 percent), and chives (38
percent). Figure 7 shows the percent of participants who chose each fresh herb, sorted in
descending order of frequency (see Table 22 for an alphabetical listing of responses by
herb). Participants could select multiple responses; consequently, responses did not
total 100 percent.
Figure 7. Most Often Used Fresh Herbs
74%
46%
39%
38%
31%
23%
17%
9%
8%
2%
0% 20% 40% 60% 80%
Cilantro
Oregano
Mint
Chives
Basil
Rosemary
Thyme
Sage
Dill
Other
FFY2017 SNAP-Ed Annual Report 370 January 2018
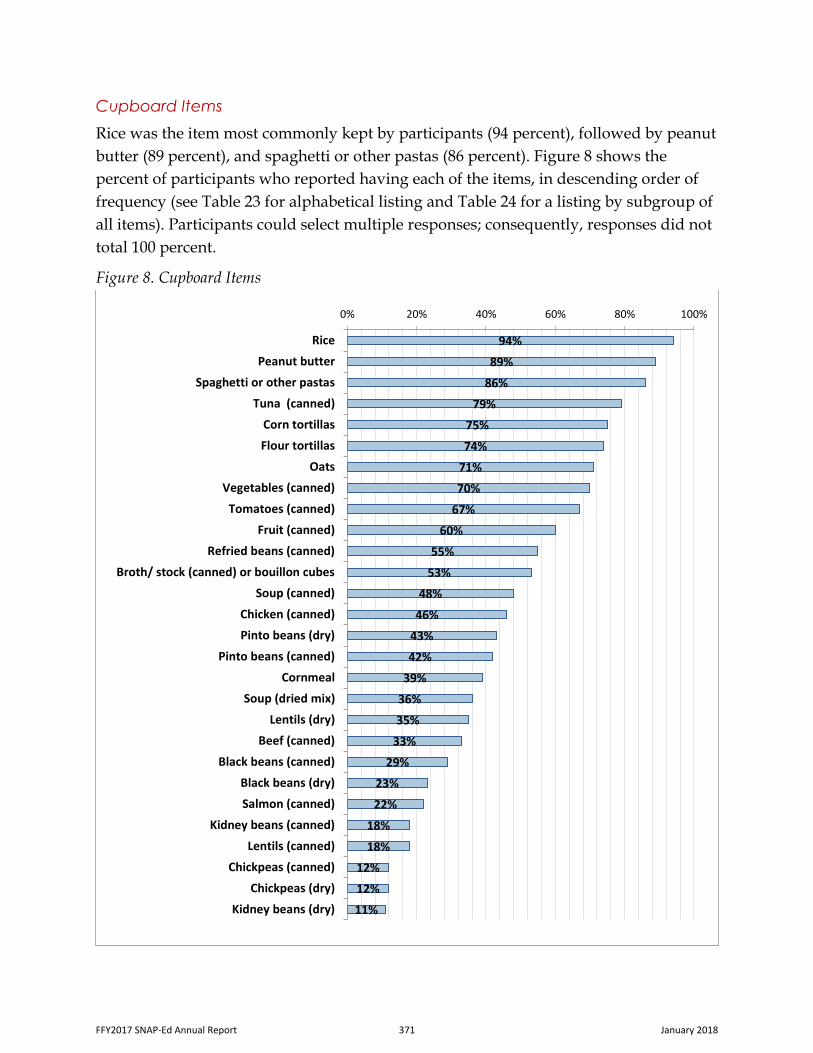
Cupboard Items
Rice was the item most commonly kept by participants (94 percent), followed by peanut
butter (89 percent), and spaghetti or other pastas (86 percent). Figure 8 shows the
percent of participants who reported having each of the items, in descending order of
frequency (see Table 23 for alphabetical listing and Table 24 for a listing by subgroup of
all items). Participants could select multiple responses; consequently, responses did not
total 100 percent.
Figure 8. Cupboard Items
94%
89%
86%
79%
75%
74%
71%
70%
67%
60%
55%
53%
48%
46%
43%
42%
39%
36%
35%
33%
29%
23%
22%
18%
18%
12%
12%
11%
0% 20% 40% 60% 80% 100%
Rice
Peanut butter
Spaghetti or other pastas
Tuna (canned)
Corn tortillas
Flour tortillas
Oats
Vegetables (canned)
Tomatoes (canned)
Fruit (canned)
Refried beans (canned)
Broth/ stock (canned) or bouillon cubes
Soup (canned)
Chicken (canned)
Pinto beans (dry)
Pinto beans (canned)
Cornmeal
Soup (dried mix)
Lentils (dry)
Beef (canned)
Black beans (canned)
Black beans (dry)
Salmon (canned)
Kidney beans (canned)
Lentils (canned)
Chickpeas (canned)
Chickpeas (dry)
Kidney beans (dry)
FFY2017 SNAP-Ed Annual Report 371 January 2018
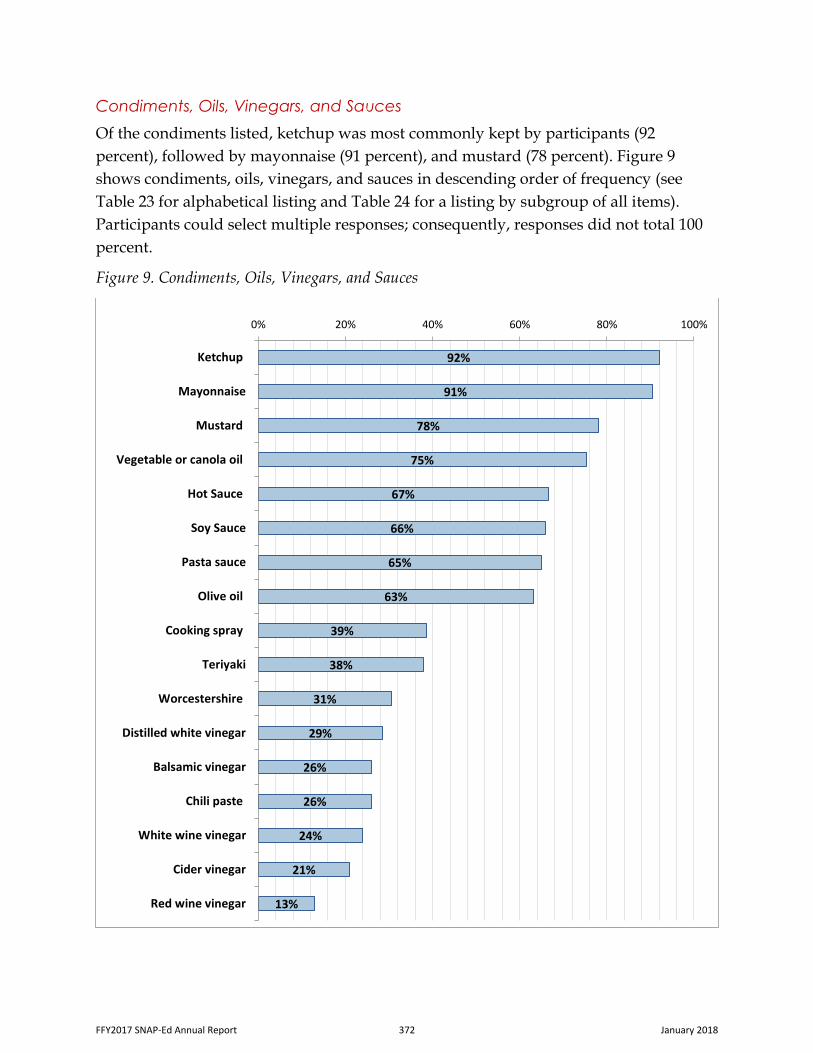
Condiments, Oils, Vinegars, and Sauces
Of the condiments listed, ketchup was most commonly kept by participants (92
percent), followed by mayonnaise (91 percent), and mustard (78 percent). Figure 9
shows condiments, oils, vinegars, and sauces in descending order of frequency (see
Table 23 for alphabetical listing and Table 24 for a listing by subgroup of all items).
Participants could select multiple responses; consequently, responses did not total 100
percent.
Figure 9. Condiments, Oils, Vinegars, and Sauces
92%
91%
78%
75%
67%
66%
65%
63%
39%
38%
31%
29%
26%
26%
24%
21%
13%
0% 20% 40% 60% 80% 100%
Ketchup
Mayonnaise
Mustard
Vegetable or canola oil
Hot Sauce
Soy Sauce
Pasta sauce
Olive oil
Cooking spray
Teriyaki
Worcestershire
Distilled white vinegar
Balsamic vinegar
Chili paste
White wine vinegar
Cider vinegar
Red wine vinegar
FFY2017 SNAP-Ed Annual Report 372 January 2018
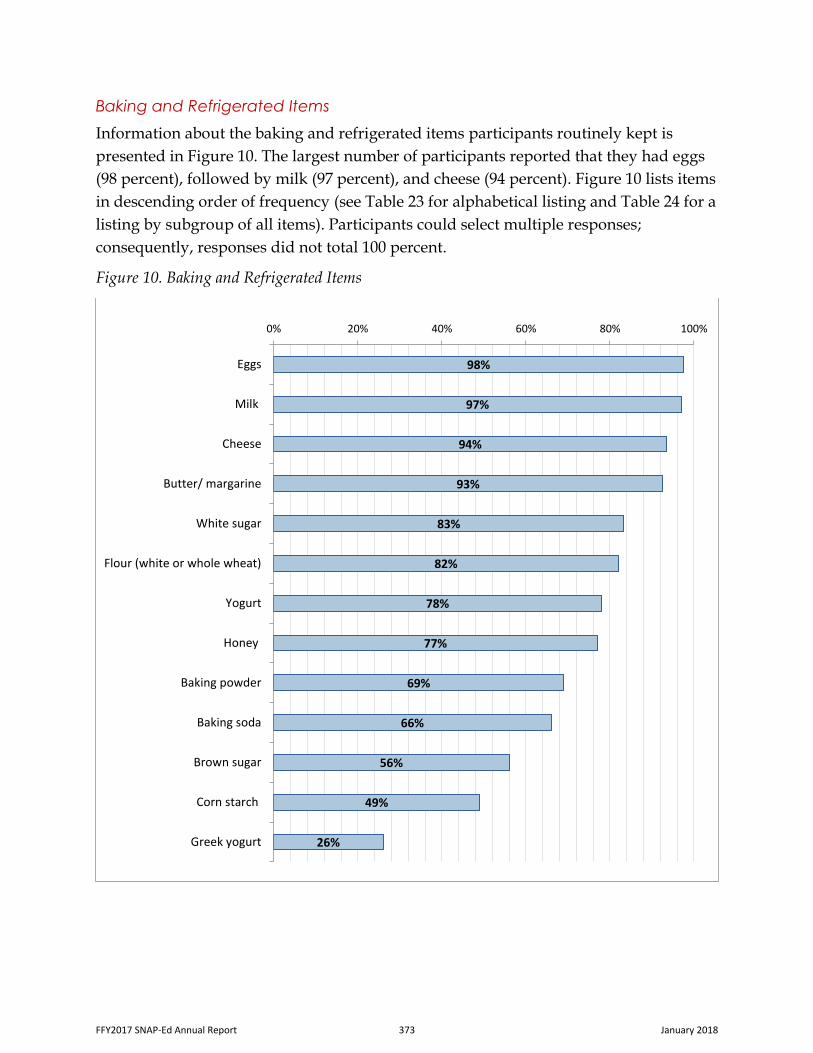
Baking and Refrigerated Items
Information about the baking and refrigerated items participants routinely kept is
presented in Figure 10. The largest number of participants reported that they had eggs
(98 percent), followed by milk (97 percent), and cheese (94 percent). Figure 10 lists items
in descending order of frequency (see Table 23 for alphabetical listing and Table 24 for a
listing by subgroup of all items). Participants could select multiple responses;
consequently, responses did not total 100 percent.
Figure 10. Baking and Refrigerated Items
98%
97%
94%
93%
83%
82%
78%
77%
69%
66%
56%
49%
26%
0% 20% 40% 60% 80% 100%
Eggs
Milk
Cheese
Butter/ margarine
White sugar
Flour (white or whole wheat)
Yogurt
Honey
Baking powder
Baking soda
Brown sugar
Corn starch
Greek yogurt
FFY2017 SNAP-Ed Annual Report 373 January 2018
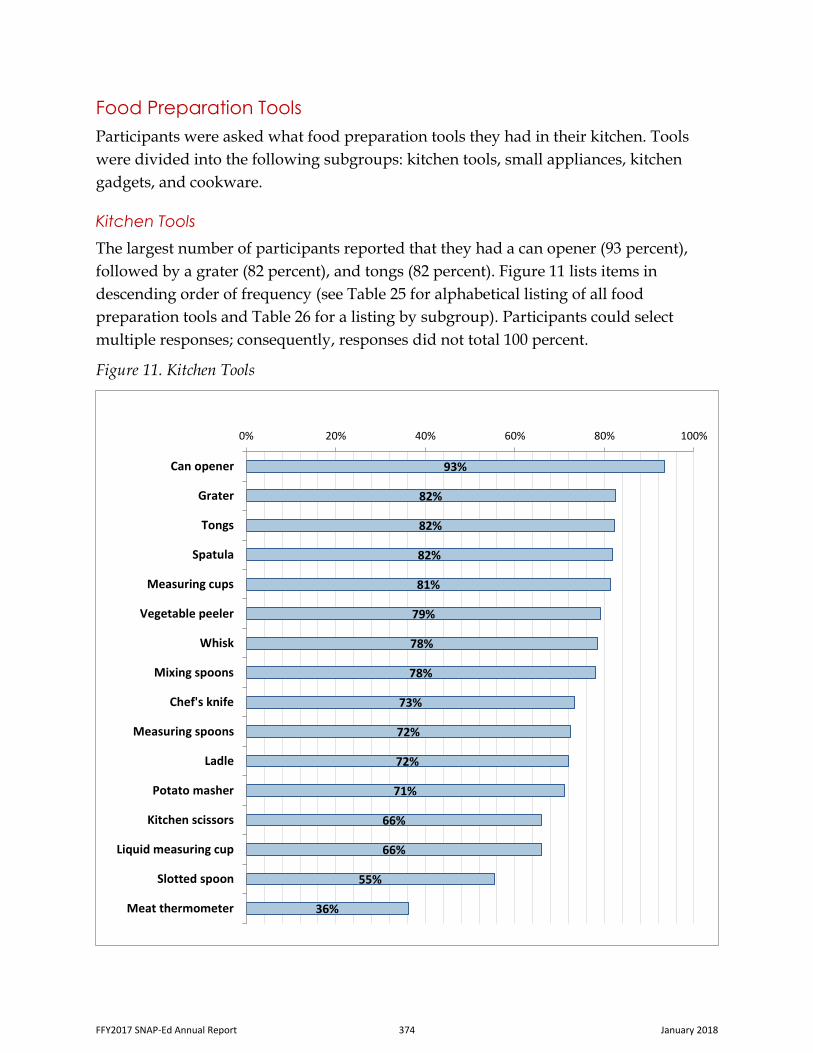
Food Preparation Tools
Participants were asked what food preparation tools they had in their kitchen. Tools
were divided into the following subgroups: kitchen tools, small appliances, kitchen
gadgets, and cookware.
Kitchen Tools
The largest number of participants reported that they had a can opener (93 percent),
followed by a grater (82 percent), and tongs (82 percent). Figure 11 lists items in
descending order of frequency (see Table 25 for alphabetical listing of all food
preparation tools and Table 26 for a listing by subgroup). Participants could select
multiple responses; consequently, responses did not total 100 percent.
Figure 11. Kitchen Tools
93%
82%
82%
82%
81%
79%
78%
78%
73%
72%
72%
71%
66%
66%
55%
36%
0% 20% 40% 60% 80% 100%
Can opener
Grater
Tongs
Spatula
Measuring cups
Vegetable peeler
Whisk
Mixing spoons
Chef's knife
Measuring spoons
Ladle
Potato masher
Kitchen scissors
Liquid measuring cup
Slotted spoon
Meat thermometer
FFY2017 SNAP-Ed Annual Report 374 January 2018
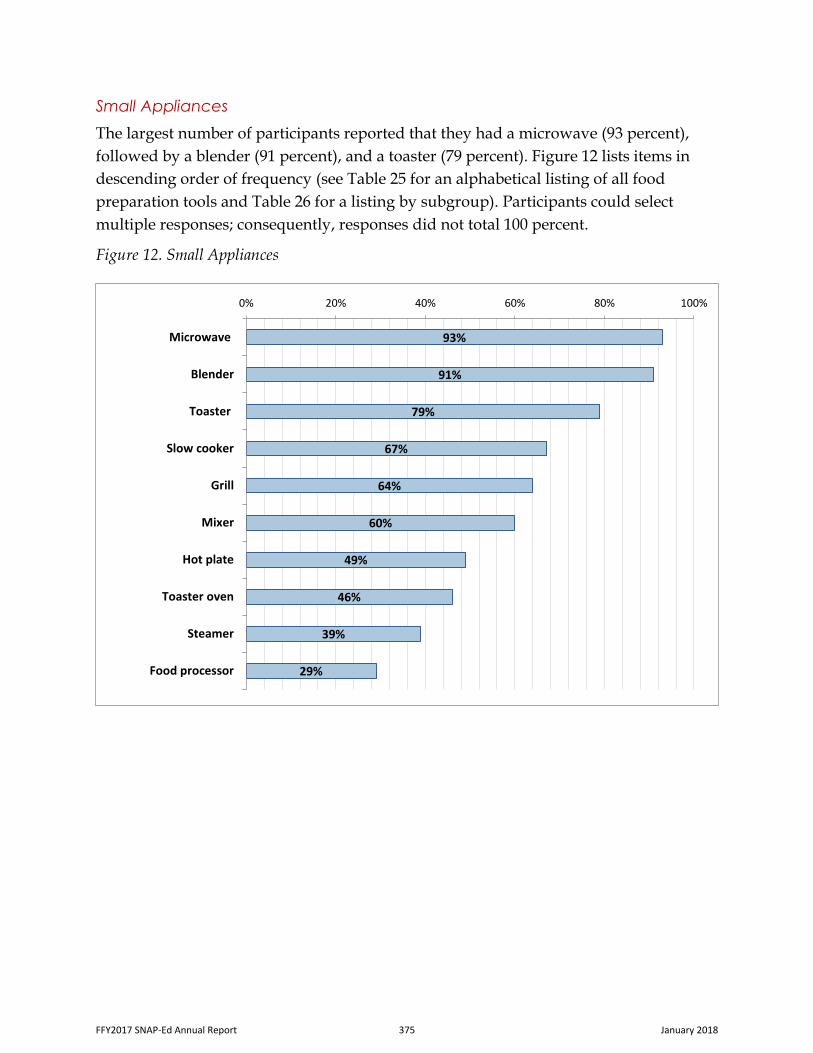
Small Appliances
The largest number of participants reported that they had a microwave (93 percent),
followed by a blender (91 percent), and a toaster (79 percent). Figure 12 lists items in
descending order of frequency (see Table 25 for an alphabetical listing of all food
preparation tools and Table 26 for a listing by subgroup). Participants could select
multiple responses; consequently, responses did not total 100 percent.
Figure 12. Small Appliances
93%
91%
79%
67%
64%
60%
49%
46%
39%
29%
0% 20% 40% 60% 80% 100%
Microwave
Blender
Toaster
Slow cooker
Grill
Mixer
Hot plate
Toaster oven
Steamer
Food processor
FFY2017 SNAP-Ed Annual Report 375 January 2018
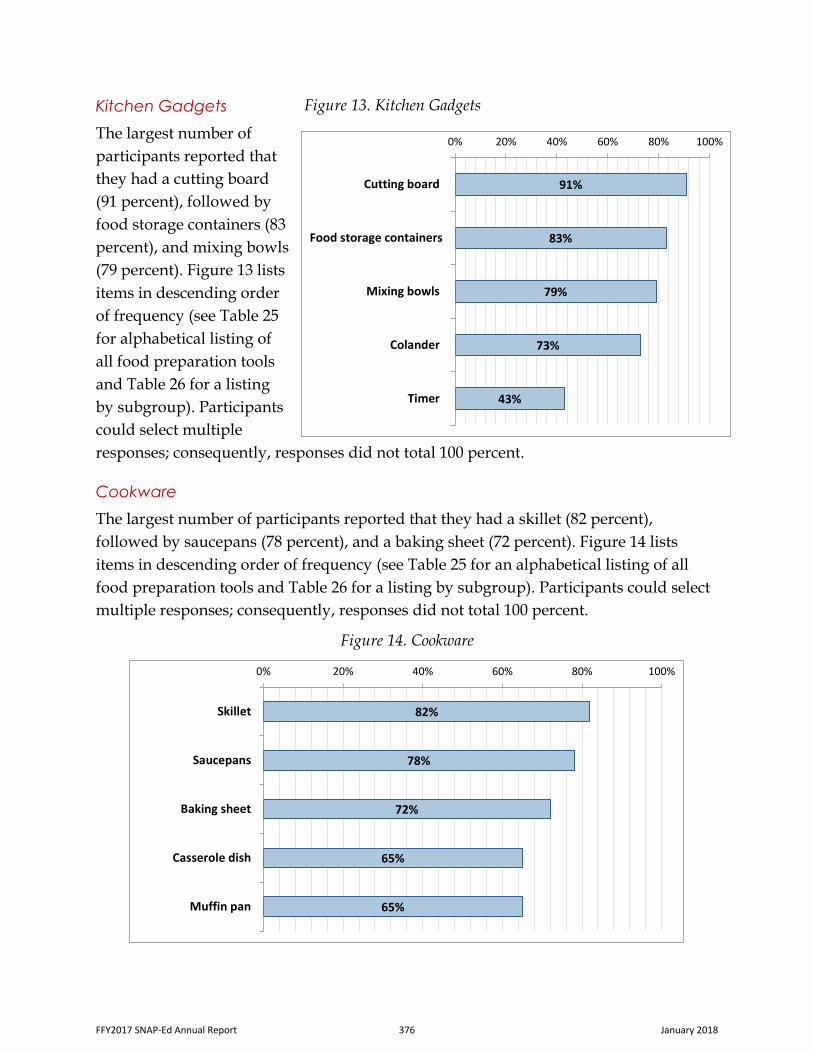
Kitchen Gadgets
The largest number of
participants reported that
they had a cutting board
(91 percent), followed by
food storage containers (83
percent), and mixing bowls
(79 percent). Figure 13 lists
items in descending order
of frequency (see Table 25
for alphabetical listing of
all food preparation tools
and Table 26 for a listing
by subgroup). Participants
could select multiple
responses; consequently, responses did not total 100 percent.
Cookware
The largest number of participants reported that they had a skillet (82 percent),
followed by saucepans (78 percent), and a baking sheet (72 percent). Figure 14 lists
items in descending order of frequency (see Table 25 for an alphabetical listing of all
food preparation tools and Table 26 for a listing by subgroup). Participants could select
multiple responses; consequently, responses did not total 100 percent.
Figure 14. Cookware
82%
78%
72%
65%
65%
0% 20% 40% 60% 80% 100%
Skillet
Saucepans
Baking sheet
Casserole dish
Muffin pan
Figure 13. Kitchen Gadgets
91%
83%
79%
73%
43%
0% 20% 40% 60% 80% 100%
Cutting board
Food storage containers
Mixing bowls
Colander
Timer
FFY2017 SNAP-Ed Annual Report 376 January 2018
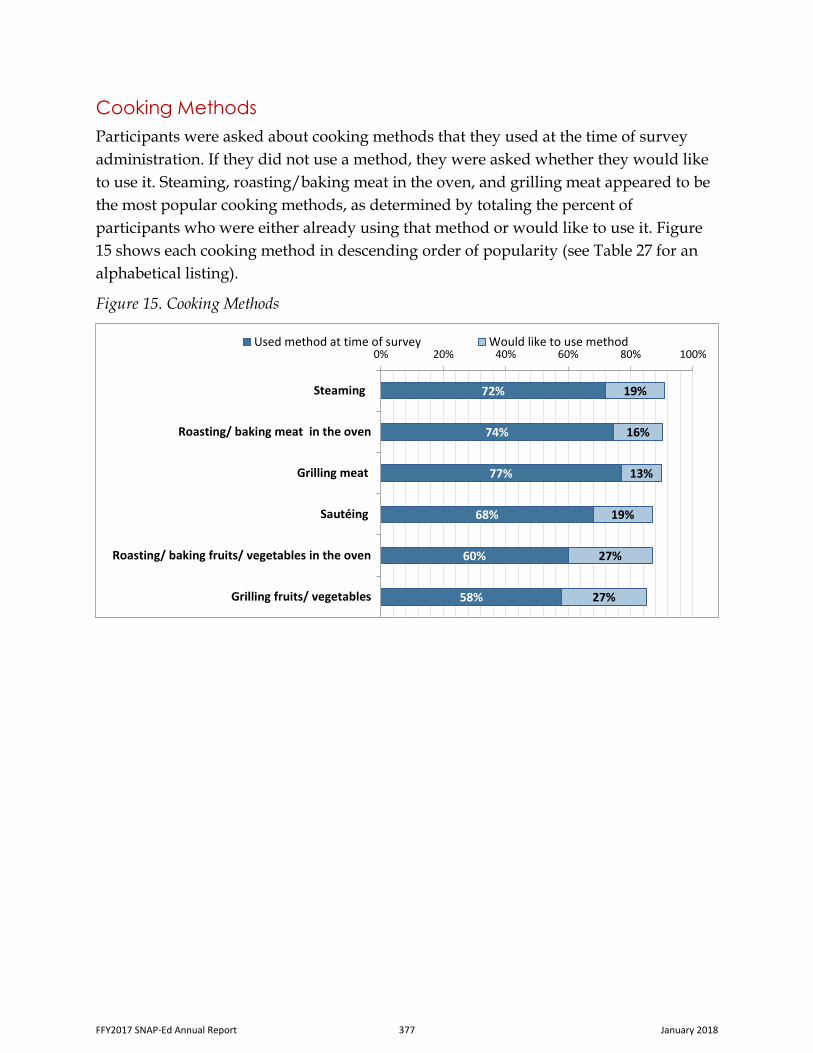
Cooking Methods
Participants were asked about cooking methods that they used at the time of survey
administration. If they did not use a method, they were asked whether they would like
to use it. Steaming, roasting/baking meat in the oven, and grilling meat appeared to be
the most popular cooking methods, as determined by totaling the percent of
participants who were either already using that method or would like to use it. Figure
15 shows each cooking method in descending order of popularity (see Table 27 for an
alphabetical listing).
Figure 15. Cooking Methods
72%
74%
77%
68%
60%
58%
19%
16%
13%
19%
27%
27%
0% 20% 40% 60% 80% 100%
Steaming
Roasting/ baking meat in the oven
Grilling meat
Sautéing
Roasting/ baking fruits/ vegetables in the oven
Grilling fruits/ vegetables
Used method at time of survey Would like to use method
FFY2017 SNAP-Ed Annual Report 377 January 2018
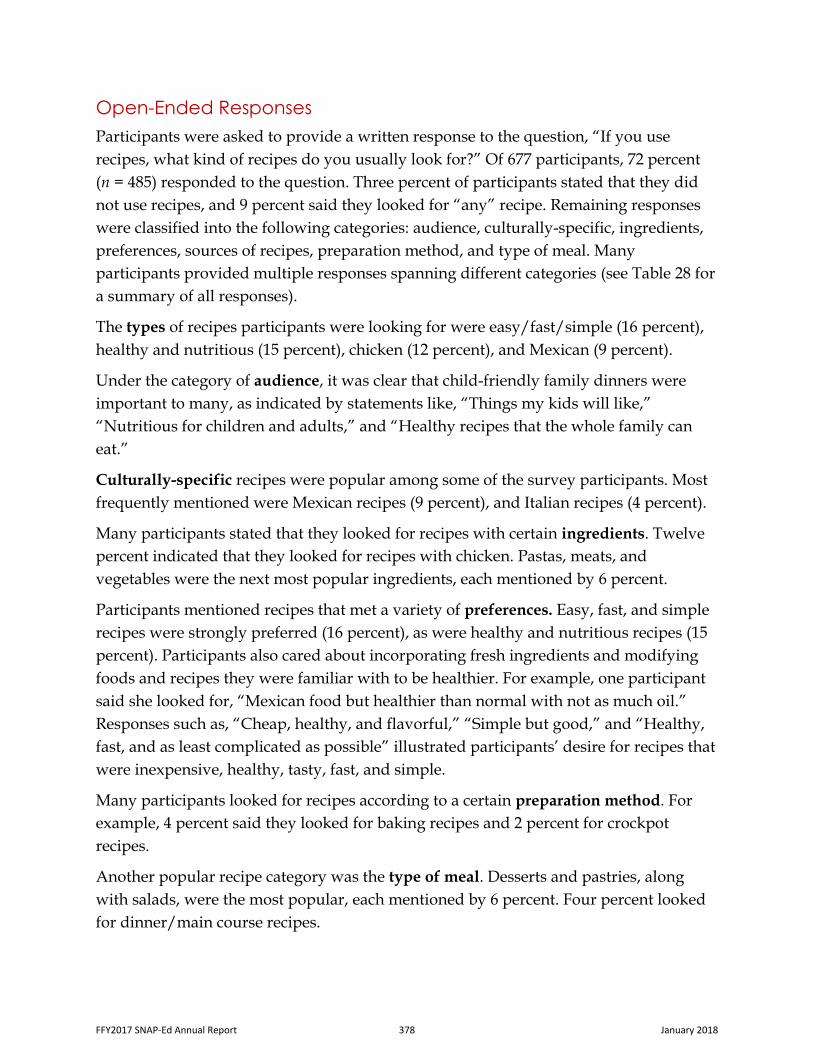
Open-Ended Responses
Participants were asked to provide a written response to the question, “If you use
recipes, what kind of recipes do you usually look for?” Of 677 participants, 72 percent
(n = 485) responded to the question. Three percent of participants stated that they did
not use recipes, and 9 percent said they looked for “any” recipe. Remaining responses
were classified into the following categories: audience, culturally-specific, ingredients,
preferences, sources of recipes, preparation method, and type of meal. Many
participants provided multiple responses spanning different categories (see Table 28 for
a summary of all responses).
The types of recipes participants were looking for were easy/fast/simple (16 percent),
healthy and nutritious (15 percent), chicken (12 percent), and Mexican (9 percent).
Under the category of audience, it was clear that child-friendly family dinners were
important to many, as indicated by statements like, “Things my kids will like,”
“Nutritious for children and adults,” and “Healthy recipes that the whole family can
eat.”
Culturally-specific recipes were popular among some of the survey participants. Most
frequently mentioned were Mexican recipes (9 percent), and Italian recipes (4 percent).
Many participants stated that they looked for recipes with certain ingredients. Twelve
percent indicated that they looked for recipes with chicken. Pastas, meats, and
vegetables were the next most popular ingredients, each mentioned by 6 percent.
Participants mentioned recipes that met a variety of preferences. Easy, fast, and simple
recipes were strongly preferred (16 percent), as were healthy and nutritious recipes (15
percent). Participants also cared about incorporating fresh ingredients and modifying
foods and recipes they were familiar with to be healthier. For example, one participant
said she looked for, “Mexican food but healthier than normal with not as much oil.”
Responses such as, “Cheap, healthy, and flavorful,” “Simple but good,” and “Healthy,
fast, and as least complicated as possible” illustrated participants’ desire for recipes that
were inexpensive, healthy, tasty, fast, and simple.
Many participants looked for recipes according to a certain preparation method. For
example, 4 percent said they looked for baking recipes and 2 percent for crockpot
recipes.
Another popular recipe category was the type of meal. Desserts and pastries, along
with salads, were the most popular, each mentioned by 6 percent. Four percent looked
for dinner/main course recipes.
FFY2017 SNAP-Ed Annual Report 378 January 2018
Appendix H
Sunnyslope Focus Group Report
FFY2017 SNAP-Ed Annual Report 379 January 2018
SNAP-ED Sunnyslope Focus Group Report
September 2017
for
FFY2017 SNAP-Ed Annual Report 380 January 2018
Table of Contents
Section: Page #:
Executive Summary...................................................................................................................... 3
Conclusions ......................................................................................................................................... 4
I. Introduction .......................................................................................................................... 6 A. Background and Methodology .................................................................................... 6
II. Grocery Shopping Habits and Healthy Eating .......................................... 8 A. Grocery Shopping Routine ............................................................................................ 8 B. Healthy Food Perceptions ............................................................................................. 9 C. Grocery Stores ................................................................................................................ 11
III. Corner Store Impressions ....................................................................................... 12
IV. Corner Store Initiative ............................................................................................... 13 A. General Reactions ......................................................................................................... 13 B. Corner Store Thoughts and Suggestions .............................................................. 13
V. Communication Channels ....................................................................................... 15 A. Current Communications ........................................................................................... 15 B. Community Events........................................................................................................ 16
Appendix A: Discussion Guide ........................................................................................................ 17
FFY2017 SNAP-Ed Annual Report 381 January 2018
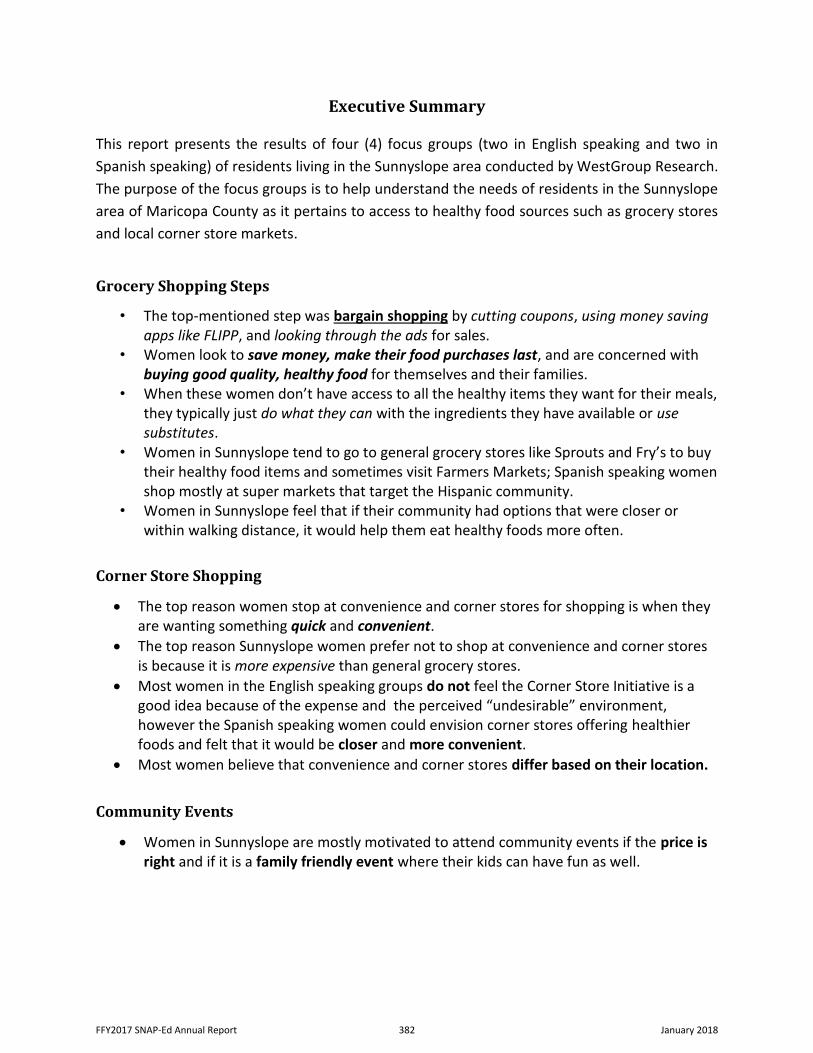
Executive Summary
This report presents the results of four (4) focus groups (two in English speaking and two in
Spanish speaking) of residents living in the Sunnyslope area conducted by WestGroup Research.
The purpose of the focus groups is to help understand the needs of residents in the Sunnyslope
area of Maricopa County as it pertains to access to healthy food sources such as grocery stores
and local corner store markets.
Grocery Shopping Steps
• The top-mentioned step was bargain shopping by cutting coupons, using money savingapps like FLIPP, and looking through the ads for sales.
• Women look to save money, make their food purchases last, and are concerned withbuying good quality, healthy food for themselves and their families.
• When these women don’t have access to all the healthy items they want for their meals,they typically just do what they can with the ingredients they have available or usesubstitutes.
• Women in Sunnyslope tend to go to general grocery stores like Sprouts and Fry’s to buytheir healthy food items and sometimes visit Farmers Markets; Spanish speaking womenshop mostly at super markets that target the Hispanic community.
• Women in Sunnyslope feel that if their community had options that were closer orwithin walking distance, it would help them eat healthy foods more often.
Corner Store Shopping
The top reason women stop at convenience and corner stores for shopping is when theyare wanting something quick and convenient.
The top reason Sunnyslope women prefer not to shop at convenience and corner storesis because it is more expensive than general grocery stores.
Most women in the English speaking groups do not feel the Corner Store Initiative is agood idea because of the expense and the perceived “undesirable” environment,however the Spanish speaking women could envision corner stores offering healthierfoods and felt that it would be closer and more convenient.
Most women believe that convenience and corner stores differ based on their location.
Community Events
Women in Sunnyslope are mostly motivated to attend community events if the price isright and if it is a family friendly event where their kids can have fun as well.
FFY2017 SNAP-Ed Annual Report 382 January 2018
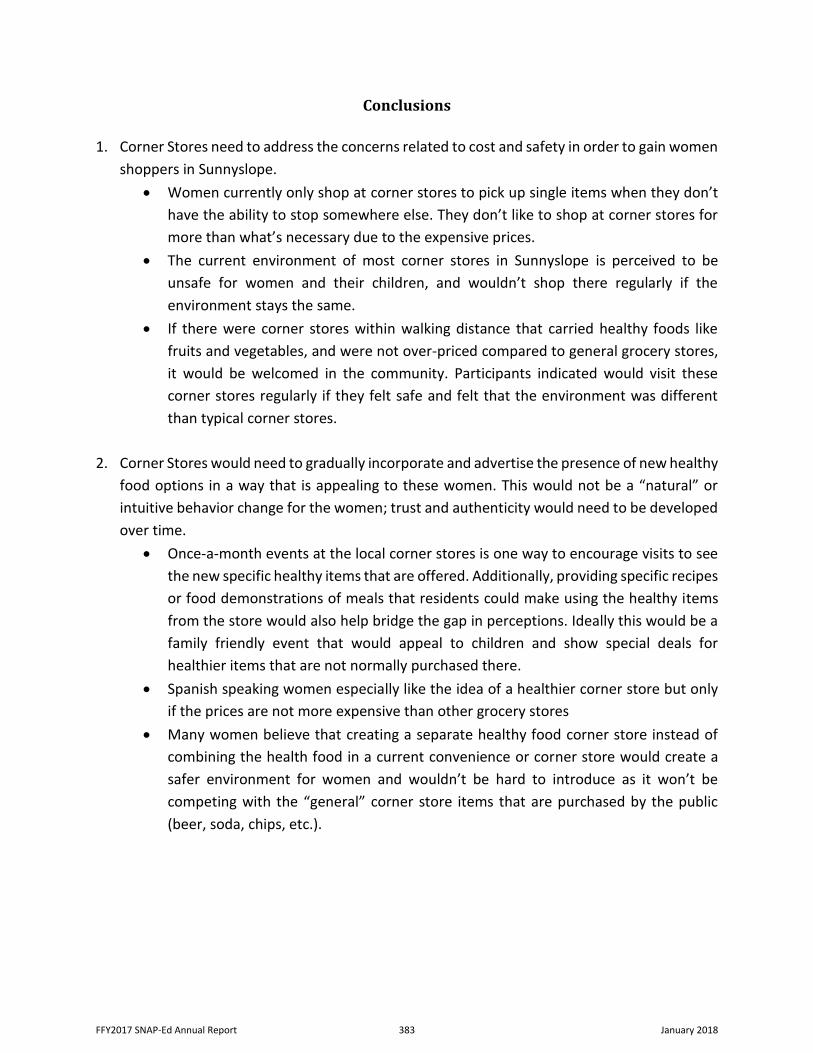
Conclusions
1. Corner Stores need to address the concerns related to cost and safety in order to gain women
shoppers in Sunnyslope.
Women currently only shop at corner stores to pick up single items when they don’t
have the ability to stop somewhere else. They don’t like to shop at corner stores for
more than what’s necessary due to the expensive prices.
The current environment of most corner stores in Sunnyslope is perceived to be
unsafe for women and their children, and wouldn’t shop there regularly if the
environment stays the same.
If there were corner stores within walking distance that carried healthy foods like
fruits and vegetables, and were not over-priced compared to general grocery stores,
it would be welcomed in the community. Participants indicated would visit these
corner stores regularly if they felt safe and felt that the environment was different
than typical corner stores.
2. Corner Stores would need to gradually incorporate and advertise the presence of new healthy
food options in a way that is appealing to these women. This would not be a “natural” or
intuitive behavior change for the women; trust and authenticity would need to be developed
over time.
Once-a-month events at the local corner stores is one way to encourage visits to see
the new specific healthy items that are offered. Additionally, providing specific recipes
or food demonstrations of meals that residents could make using the healthy items
from the store would also help bridge the gap in perceptions. Ideally this would be a
family friendly event that would appeal to children and show special deals for
healthier items that are not normally purchased there.
Spanish speaking women especially like the idea of a healthier corner store but only
if the prices are not more expensive than other grocery stores
Many women believe that creating a separate healthy food corner store instead of
combining the health food in a current convenience or corner store would create a
safer environment for women and wouldn’t be hard to introduce as it won’t be
competing with the “general” corner store items that are purchased by the public
(beer, soda, chips, etc.).
FFY2017 SNAP-Ed Annual Report 383 January 2018
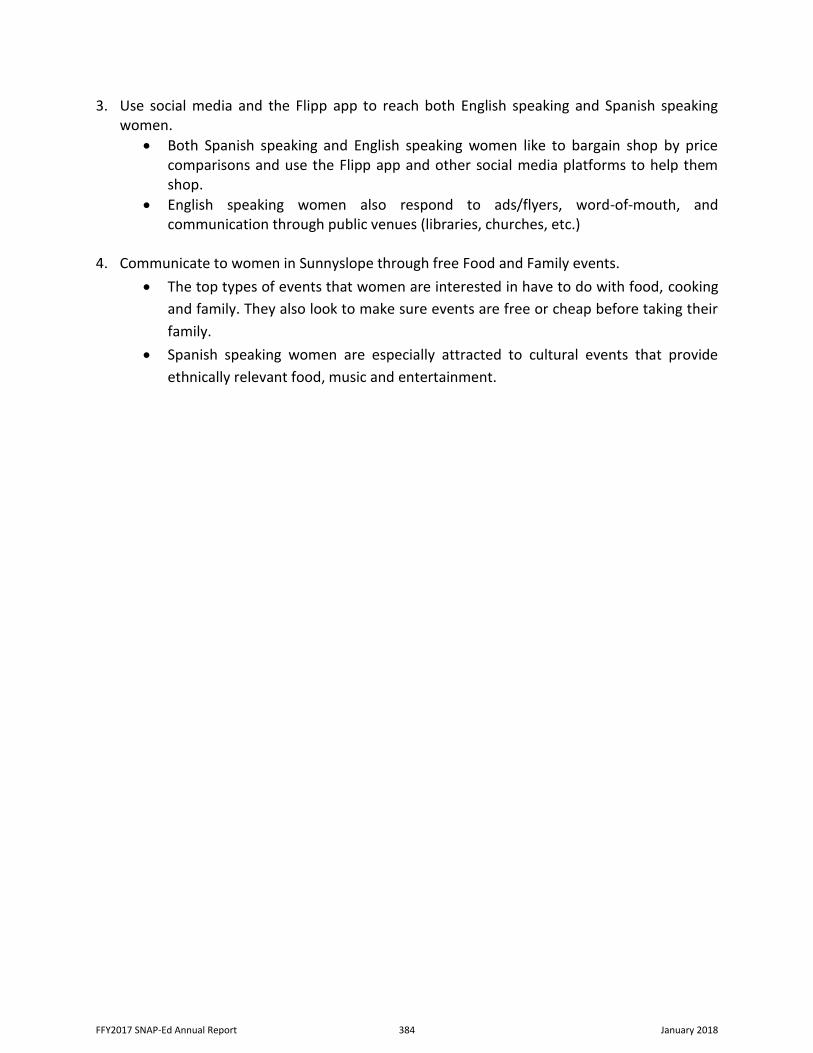
3. Use social media and the Flipp app to reach both English speaking and Spanish speakingwomen.
Both Spanish speaking and English speaking women like to bargain shop by pricecomparisons and use the Flipp app and other social media platforms to help themshop.
English speaking women also respond to ads/flyers, word-of-mouth, andcommunication through public venues (libraries, churches, etc.)
4. Communicate to women in Sunnyslope through free Food and Family events.
The top types of events that women are interested in have to do with food, cooking
and family. They also look to make sure events are free or cheap before taking their
family.
Spanish speaking women are especially attracted to cultural events that provide
ethnically relevant food, music and entertainment.
FFY2017 SNAP-Ed Annual Report 384 January 2018
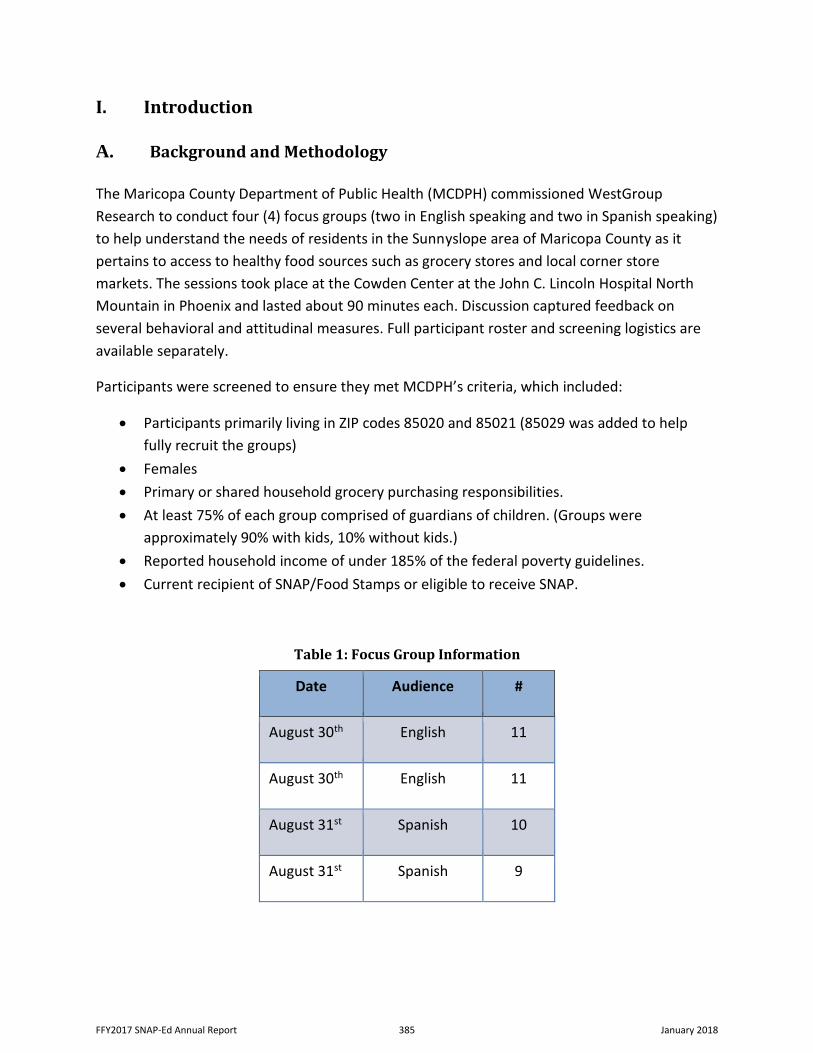
I. Introduction
A. Background and Methodology
The Maricopa County Department of Public Health (MCDPH) commissioned WestGroup
Research to conduct four (4) focus groups (two in English speaking and two in Spanish speaking)
to help understand the needs of residents in the Sunnyslope area of Maricopa County as it
pertains to access to healthy food sources such as grocery stores and local corner store
markets. The sessions took place at the Cowden Center at the John C. Lincoln Hospital North
Mountain in Phoenix and lasted about 90 minutes each. Discussion captured feedback on
several behavioral and attitudinal measures. Full participant roster and screening logistics are
available separately.
Participants were screened to ensure they met MCDPH’s criteria, which included:
Participants primarily living in ZIP codes 85020 and 85021 (85029 was added to help
fully recruit the groups)
Females
Primary or shared household grocery purchasing responsibilities.
At least 75% of each group comprised of guardians of children. (Groups were
approximately 90% with kids, 10% without kids.)
Reported household income of under 185% of the federal poverty guidelines.
Current recipient of SNAP/Food Stamps or eligible to receive SNAP.
Table 1: Focus Group Information
Date Audience #
August 30th English 11
August 30th English 11
August 31st Spanish 10
August 31st Spanish 9
FFY2017 SNAP-Ed Annual Report 385 January 2018
The discussion guide (full document can be found in the appendix) focused on the following
topics:
Participants’ descriptions of and responses to a variety of grocery shopping topics
including where and how they shop for healthy foods, and what they perceive to be
“healthy” foods.
Participants’ thoughts/perceptions pertaining to corner and convenience stores,
including why they do or don’t shop at these stores.
Participants thoughts/perceptions around the concept of joining together community
organizations and their local corner stores to make healthy food available at a great
price and to make them a convenient place to shop for healthy foods.
Lastly, participants were asked what communication channels work for them when it
comes to grocery shopping.
Note: Focus groups are a qualitative method of gathering information not a quantitative
method. What this means is that the study results are “directional” but not statistically reliable
or defensible. This means the discussion provides insight into the range of opinions that may
exist in the population, but are not projectable to population as a whole.
FFY2017 SNAP-Ed Annual Report 386 January 2018
II. Grocery Shopping Habits and Healthy Eating
A. Grocery Shopping Routine
At the beginning of all four focus groups, participants were asked to explain their grocery shopping process by writing out each step between “needing food” and “having food” at home. The most commonly mentioned first step of grocery shopping was bargain shopping by cutting coupons, using money saving apps like FLIPP, and looking through the ads for sales. Most women also make a list ahead of time, whether that’s throughout their week or right before they leave for the store. There was an even mixture of women in the English speaking groups who only shop at one store for all their groceries, and women who stop at multiple stores because one store didn’t have all items needed or didn’t have all the cheapest prices. However, most Spanish speaking women shop at a variety of stores depending on price and quality of products. They primarily shop according to daily preparation of meals, although some planned ahead for the week. After planning, they chart their course for purchasing products at each corresponding store.
Lastly, some of the women explained that part of their process included asking their family members if they would like anything specific from the store, and planning their grocery shopping around meal plans. There are two top priorities for Sunnyslope women during their grocery shopping routine. First, women look to save money and make their food purchases last. Many women do their shopping at the beginning of the month and try to make it all last as long as possible, especially if they are using food stamps. Several Spanish speaking women mentioned a well-known Spanish phrase – “Bueno, Bonito y Barato” (Good, Pretty(Nice) & Inexpensive) to convey
Second, women are concerned with buying good quality, healthy food for themselves and their families. They want their families to have well-balanced diets and look for labels like organic, or non-GMO. Hispanic women are specifically concerned that their children do not eat well at school due to lack of nutritious menus in cafeterias, so they want to provide good meals at home.
FFY2017 SNAP-Ed Annual Report 387 January 2018
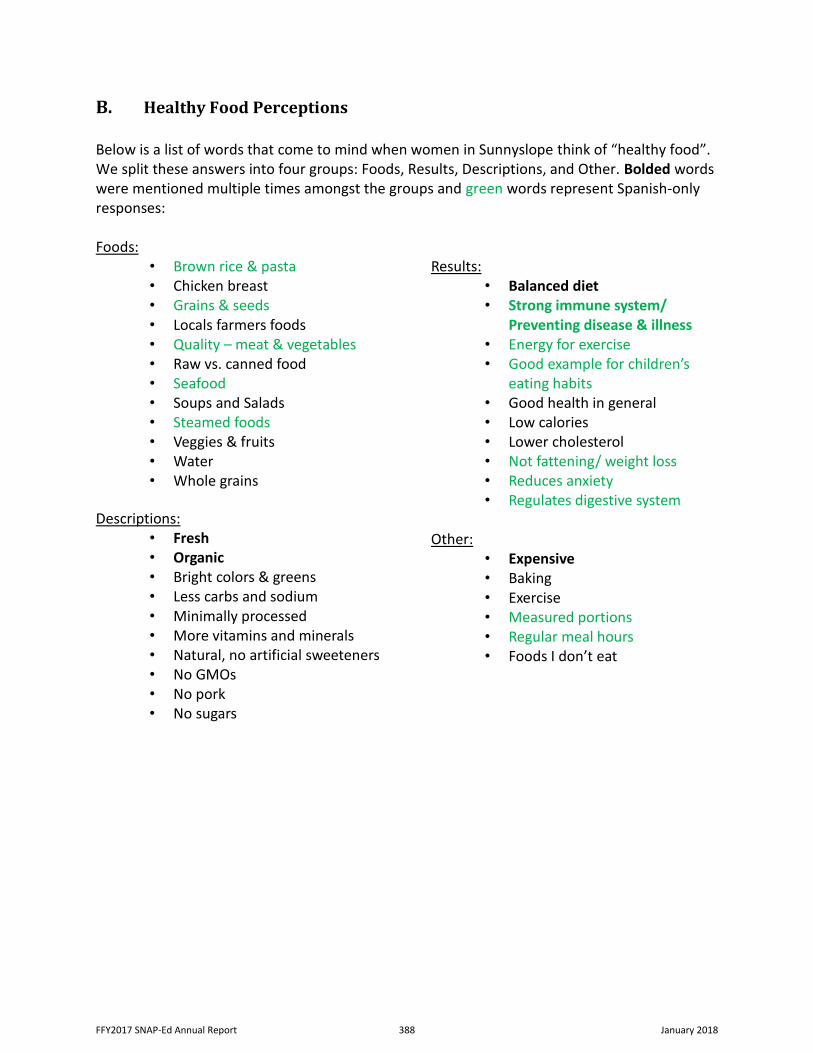
B. Healthy Food Perceptions
Below is a list of words that come to mind when women in Sunnyslope think of “healthy food”. We split these answers into four groups: Foods, Results, Descriptions, and Other. Bolded words were mentioned multiple times amongst the groups and green words represent Spanish-only responses: Foods:
• Brown rice & pasta
• Chicken breast • Grains & seeds
• Locals farmers foods
• Quality – meat & vegetables
• Raw vs. canned food
• Seafood
• Soups and Salads
• Steamed foods
• Veggies & fruits
• Water • Whole grains
Descriptions: • Fresh • Organic • Bright colors & greens • Less carbs and sodium • Minimally processed • More vitamins and minerals • Natural, no artificial sweeteners • No GMOs • No pork • No sugars
Results:
• Balanced diet • Strong immune system/
Preventing disease & illness
• Energy for exercise
• Good example for children’s eating habits
• Good health in general • Low calories • Lower cholesterol • Not fattening/ weight loss • Reduces anxiety • Regulates digestive system
Other:
• Expensive • Baking • Exercise • Measured portions • Regular meal hours • Foods I don’t eat
FFY2017 SNAP-Ed Annual Report 388 January 2018
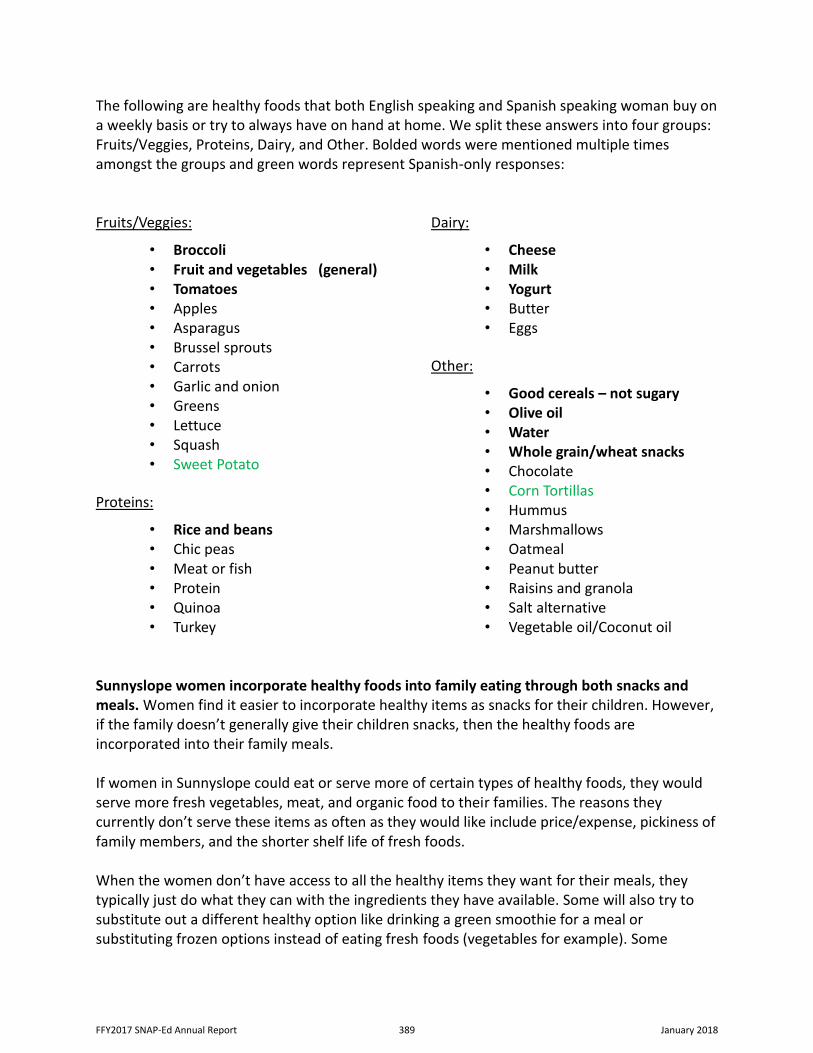
The following are healthy foods that both English speaking and Spanish speaking woman buy on a weekly basis or try to always have on hand at home. We split these answers into four groups: Fruits/Veggies, Proteins, Dairy, and Other. Bolded words were mentioned multiple times amongst the groups and green words represent Spanish-only responses: Fruits/Veggies:
• Broccoli • Fruit and vegetables (general) • Tomatoes
• Apples
• Asparagus
• Brussel sprouts
• Carrots
• Garlic and onion
• Greens
• Lettuce
• Squash
• Sweet Potato
Proteins:
• Rice and beans
• Chic peas
• Meat or fish
• Protein
• Quinoa
• Turkey
Dairy:
• Cheese
• Milk
• Yogurt • Butter • Eggs
Other:
• Good cereals – not sugary
• Olive oil • Water • Whole grain/wheat snacks
• Chocolate
• Corn Tortillas
• Hummus
• Marshmallows
• Oatmeal • Peanut butter • Raisins and granola
• Salt alternative
• Vegetable oil/Coconut oil Sunnyslope women incorporate healthy foods into family eating through both snacks and meals. Women find it easier to incorporate healthy items as snacks for their children. However, if the family doesn’t generally give their children snacks, then the healthy foods are incorporated into their family meals. If women in Sunnyslope could eat or serve more of certain types of healthy foods, they would serve more fresh vegetables, meat, and organic food to their families. The reasons they currently don’t serve these items as often as they would like include price/expense, pickiness of family members, and the shorter shelf life of fresh foods. When the women don’t have access to all the healthy items they want for their meals, they typically just do what they can with the ingredients they have available. Some will also try to substitute out a different healthy option like drinking a green smoothie for a meal or substituting frozen options instead of eating fresh foods (vegetables for example). Some
FFY2017 SNAP-Ed Annual Report 389 January 2018
examples of this for Spanish speaking women would be using corn instead of flour tortillas and using sweet potatoes instead of french fries.
C. Grocery Stores
Women in Sunnyslope tend to go to general grocery stores like Sprouts and Fry’s to buy their healthy food items and will also go to Food City when they are on a tighter budget. Because Spanish speaking women have a formulaic way of purchasing groceries that may take them to several stores for specific items on different days, they like to go to Wal-Mart for their price-matching benefits, including personal, non-food items.
Some women also go to the local farmers market for their healthy items, because they know it’s fresh. However, few Spanish speaking women mentioned visiting farmer’s markets but mentioned local churches that give out fresh fruit and vegetables monthly.
A small percentage of women go to a local store, like Ranch Market, for their healthy food purchases. Other places women are aware of to shop for healthier items, but tend not to, are Trader Joes, Fresh & Easy, food banks, and local mom and pop shops. In contrast, most Spanish speaking women in Sunnyslope will go to Hispanic supermarkets like El Rancho and El Super or “carnicerias”(butcher shops) for meat. They also practice bulk buying at Costco and Sam’s Club. Both English speaking and Spanish speaking women in Sunnyslope feel that if their community had options that were closer or within walking distance, it would help them eat healthy foods more often. They also feel that if their community had a farmers market, community garden, or lower prices in general, then it would help them to eat healthier.
FFY2017 SNAP-Ed Annual Report 390 January 2018
III. Corner Store Impressions
The top reason women stop at convenience and corner stores for shopping is when they want something quick and convenient. They also go there if other stores are already closed and it’s their only option; if it’s close or on the way to their destination. Generally, when they stop at convenience stores, it’s for a single item, such as one ingredient they are missing for a meal. Generally, the top items women buy at convenience and corner stores are drinks, snacks, or dairy items. Below is a list of “go-to” items the women mentioned for when they shop at a convenience or corner store. Green words represent Spanish speaking only responses: Multiple mentions:
• Beer • Cigarettes • Chips • Cream • Fountain drink/Sodas • Milk
Single mentions: • Bananas • Bread • Candy • Cup of fruit • Hot dog • Ice cream • Water/Drink
The top reason Sunnyslope women prefer not to shop at convenience and corner stores is because it is more expensive than general grocery stores. This may explain why they only buy
the one or two items when visiting the stores. Another reason women don’t shop at
convenience stores, is because they don’t feel safe around “intimidating” or “undesirable”
strangers hanging around the area. They don’t want to take their kids to stores like that.
Lastly, some women feel that the food at convenience stores isn’t always the best quality and
they don’t have good choices at small corner stores. The Spanish speaking women in
Sunnyslope especially feel there is a lack of selection and fresh foods at these stores.
Generally, women don’t see convenience stores and corner stores as places to pick up healthy
foods unless it is fruit. Women feel that the only healthy foods that are currently available at
corner stores are meats, crackers and cheese, juice, or foreign foods. If fruits or vegetables are
sold at corner stores, the participants wonder about the quality and freshness of the items.
Women would like to see more healthy foods offered at their local corner stores if they were at
reasonable prices. Fruits, vegetables, bread, and pure juice are items they would be most likely
to purchase if they felt they were not overly priced at corner stores.
FFY2017 SNAP-Ed Annual Report 391 January 2018
IV. Corner Store Initiative
A. General Reactions
In the next part of the focus groups, the women were asked how they felt about the idea of community organizations partnering with corner stores to make more healthy food available while making their local corner stores a convenient place to shop for those items. Most women in the English speaking groups do not feel this is a good idea because of the current environment associated with corner stores. Current corner and convenient stores are known for selling items such as beer, cigarettes, and junk food (e.g., chips and candy). They feel it wouldn’t make sense to try and add in healthy food to the existing environment. Also, there is the perception that these types of stores in the Sunnyslope area are typically not a safe area for women and their children, which keeps them from shopping there at times. On the flip side, Spanish speaking women could envision corner stores offering healthier foods and felt that it would be closer and more convenient. However, they worried about the price that would be associated with anything healthy sold at these stores, since they already believe the prices at these establishments are expensive. Participants also expressed a desire to be treated well as customers. Even though they frequent the larger grocery stores, they feel that customer service could be much better and this may be an area to leverage in the new concept. In particular the Spanish speaking women indicated they will go out of their way and patronize a specific establishment, and even pay a little more, if they feel like they are respected.
B. Corner Store Thoughts and Suggestions
The women provided some suggestions on how they feel healthy foods could successfully be incorporated to corner stores. They suggest trying out a once-a-month idea of getting the community together with those who want healthy foods and promoting healthy items from the corner stores. They could also provide specific recipes that they could make using the healthy items from the store. This could be a more family friendly approach that could include children as well. Another suggestion was to create a separate little healthy food corner store instead of combining the health food in a current convenience or corner store. Spanish speaking women specifically suggested food purchase programs like loyalty programs and special deals at corner store as well as increasing food selection at these stores.
FFY2017 SNAP-Ed Annual Report 392 January 2018
Most women believe that convenience and corner stores differ based on their location. Other than chain convenience stores (Circle K, Etc.), they note that the corner markets will differ on their inventory based on what’s selling or not selling, and their surrounding culture. For example, in Sunnyslope, they see lots of Hispanic style junk foods sold in corner stores. Some women stated that the corner stores differ in price as well to make more money and are not focused on health. The top items that catch women’s attention are signs and flyers promoting sales for the corner store. Women also notice the smell of the store, how clean it’s kept and how fresh the foods are by noticing bugs and gnats. Others note the security of the store and how other shoppers look through the foods. Spanish speaking women especially notice the cleanliness of the environment in and out of the store and indicate it is a very important factor in their decision whether or not to shop at the store.
FFY2017 SNAP-Ed Annual Report 393 January 2018
V. Communication Channels
A. Current Communications
Below is a list of ways that women in Sunnyslope receive communications related to grocery
shopping and community events. Bolded items were mentioned more than once amongst
groups and words in green represent the Spanish speaking groups top responses:
• Ads/Flyers in mail • Church
• Flipp app
• Food bank
• Library
• Internet/websites (general) • New item displays/signs in stores
• Social media (Facebook, etc.) • TV/News Channels
• Word of mouth
Family
Friends
• AZparenting website and magazine - calendar of events
• Community center • Coupon website
• Fry’s emails • Kids school • Newspapers
• People at the stores/cashiers
• Radio
The Flipp app was used by nearly every woman in the Spanish speaking group as a primary
source of deals on food purchases. They also suggested Facebook and other social media
channels to communicate specials more easily on smartphones.
When asked if they follow grocery stores online through social media or apps, the women
mentioned specific stores and apps like Fry’s, Urban Farming, Amazon, and the Salvation army.
In addition to following stores, they also are involved in couponing groups and parenting groups
online.
FFY2017 SNAP-Ed Annual Report 394 January 2018
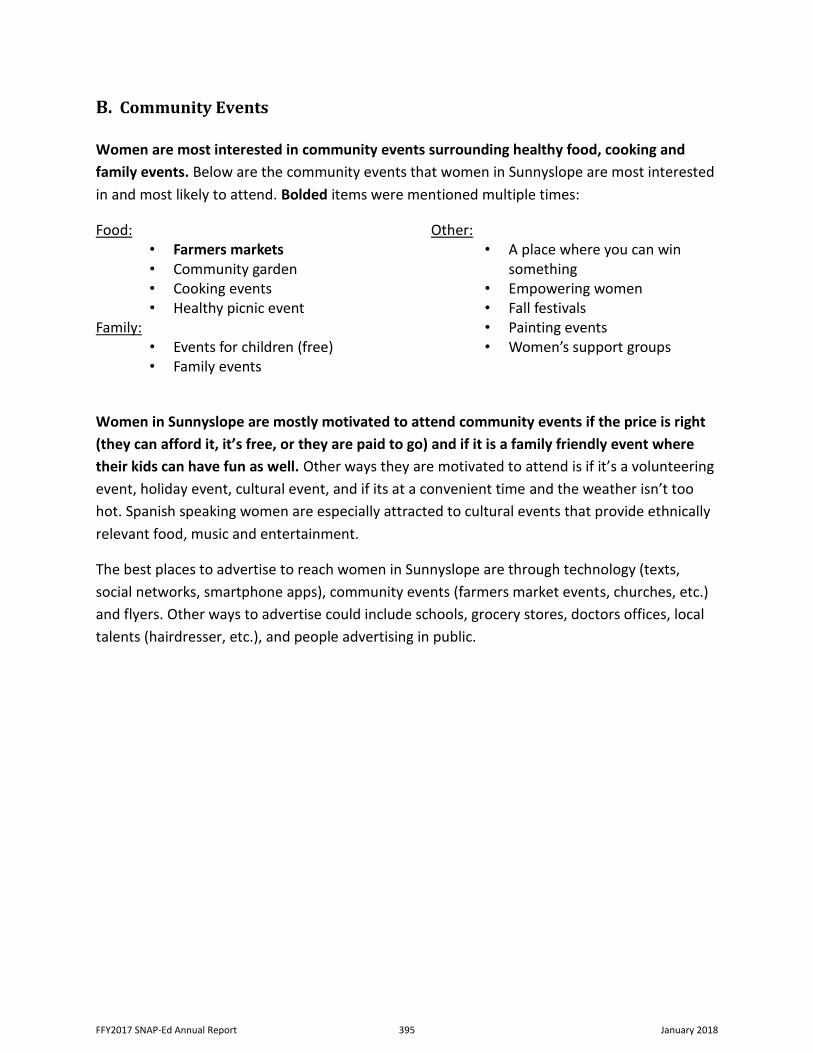
B. Community Events
Women are most interested in community events surrounding healthy food, cooking and family events. Below are the community events that women in Sunnyslope are most interested
in and most likely to attend. Bolded items were mentioned multiple times:
Food: • Farmers markets
• Community garden
• Cooking events
• Healthy picnic event Family:
• Events for children (free) • Family events
Other: • A place where you can win
something
• Empowering women
• Fall festivals
• Painting events
• Women’s support groups
Women in Sunnyslope are mostly motivated to attend community events if the price is right (they can afford it, it’s free, or they are paid to go) and if it is a family friendly event where their kids can have fun as well. Other ways they are motivated to attend is if it’s a volunteering
event, holiday event, cultural event, and if its at a convenient time and the weather isn’t too
hot. Spanish speaking women are especially attracted to cultural events that provide ethnically
relevant food, music and entertainment.
The best places to advertise to reach women in Sunnyslope are through technology (texts,
social networks, smartphone apps), community events (farmers market events, churches, etc.)
and flyers. Other ways to advertise could include schools, grocery stores, doctors offices, local
talents (hairdresser, etc.), and people advertising in public.
FFY2017 SNAP-Ed Annual Report 395 January 2018
Appendix A
Discussion Guide
FFY2017 SNAP-Ed Annual Report 396 January 2018
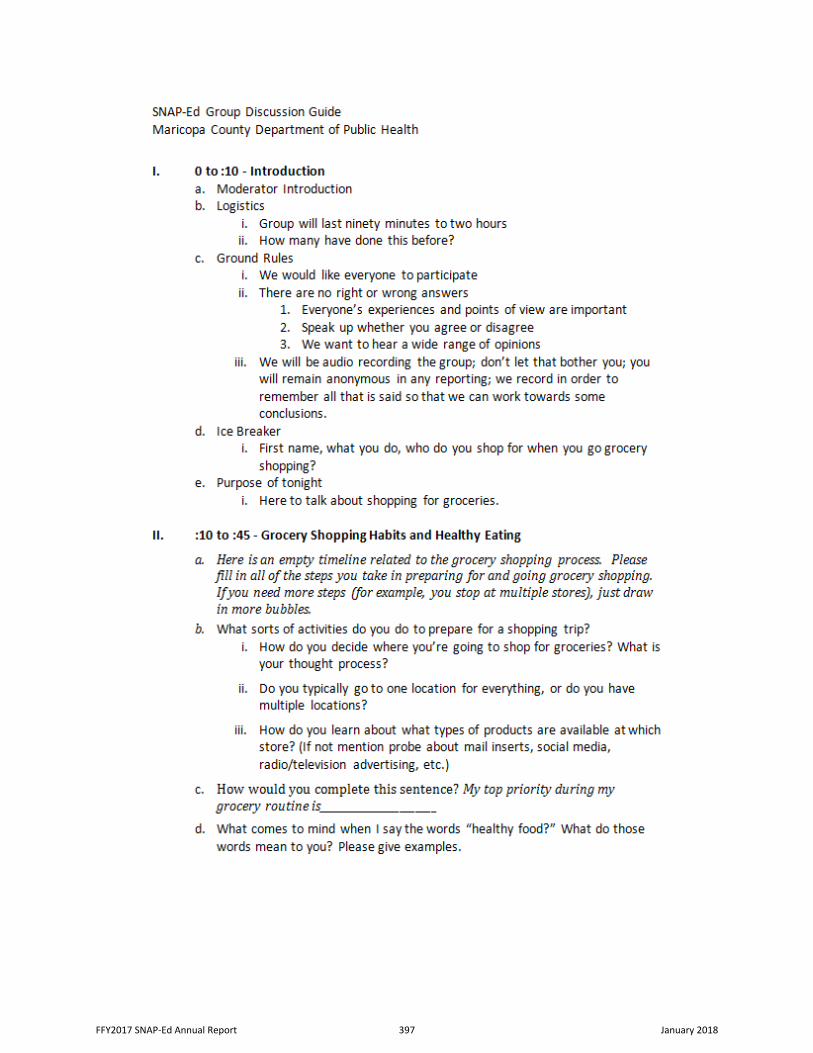
FFY2017 SNAP-Ed Annual Report 397 January 2018
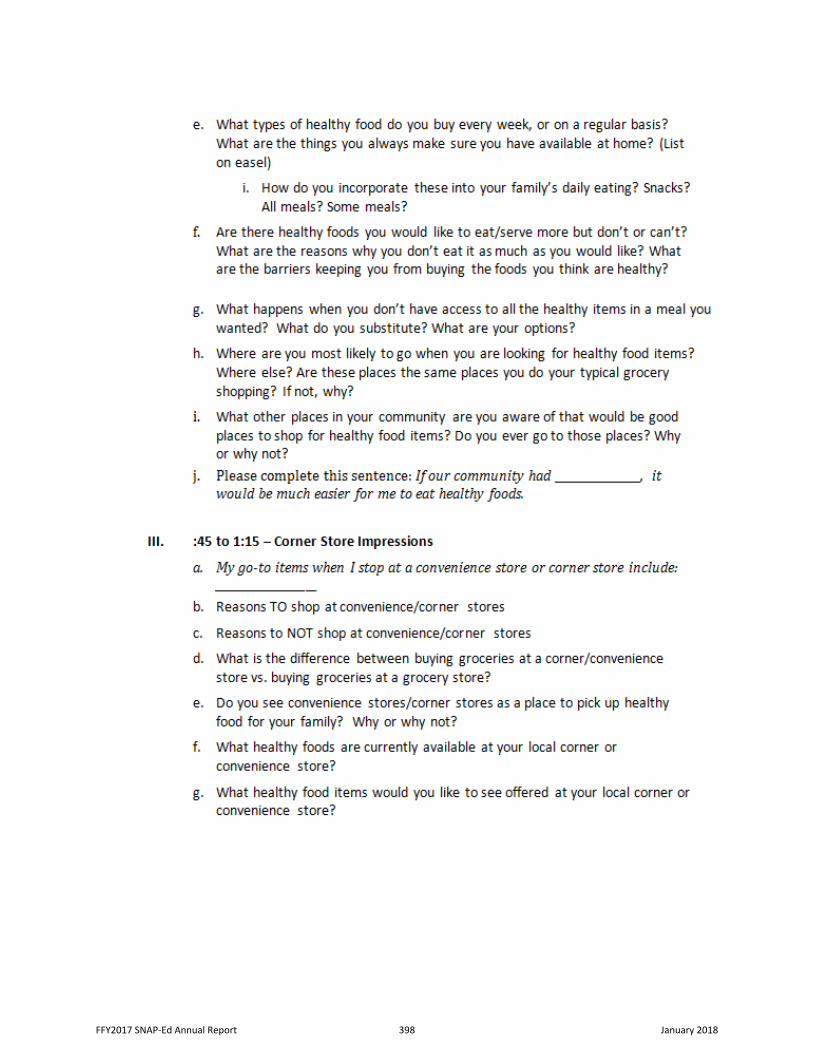
FFY2017 SNAP-Ed Annual Report 398 January 2018
FFY2017 SNAP-Ed Annual Report 399 January 2018

PAGE INTENTIONALLY BLANK
FFY2017 SNAP-Ed Annual Report 400 January 2018
Appendix I
Finding Winnable Strategies to Expand Reach of FFVP Beyond School Settings Report
FFY2017 SNAP-Ed Annual Report 401 January 2018
Finding Winnable Strategies to Expand the Reach of the Fresh Fruit and Vegetable Program Beyond School Settings
2016
Jessie Gruner, MS, RDN Robin DeWeese, PhD, RDN
Punam Ohri-Vachaspati, PhD, RDN Arizona State University
School of Nutrition and Health Promotion
Kristi Mollner, MS, RDN Gina Lacagnina, MS, RDN
Maricopa County Department of Public Health
FFY2017 SNAP-Ed Annual Report 402 January 2018
Finding Winnable Strategies to Expand the Reach of the Fresh Fruit and Vegetable Program Beyond School Settings
ACKNOWLEDGEMENTS:
This project was funded by The Arizona Nutrition Network (AZNN) under the United States Department of Agriculture’s (USDA) Supplemental Nutrition Assistance Program: Nutrition Education and Obesity Prevention Grant Program. We would like to thank the district food service directors and supervisors, kitchen managers, teachers, principals, public relations directors, grocery store managers, produce managers and the staff at the Maricopa County Department of Public Health who made this project possible by dedicating their time to participate in interviews, arranging project logistics, and for sharing their expert advice, opinions and stories. A special thanks to Michael Soto, the Fresh Fruit and Vegetable Program Specialist at the Arizona Department of Education for his support and guidance. Suggested Citation: Gruner J, DeWeese R, Ohri-Vachaspati P. Finding Winnable Strategies to Expand the Reach of the Fresh Fruit and Vegetable Program Beyond School Settings. Phoenix, AZ: School of Nutrition and Health Promotion, Arizona State University; 2016.
FFY2017 SNAP-Ed Annual Report 403 January 2018
TABLE OF CONTENTS
PAGE
EXECUTIVE SUMMARY 4 INTRODUCTION 6 METHODS 9 Sample Selection 9 Table 1: Number of interviews by stakeholder type 10
Interview Procedures 10
Analysis 10 RESULTS 11 Retail Managers 11 School Districts 15
Schools 18
Parents 22
Role of SNAP-Ed 24
CONCLUSION AND PRACTICAL APPLICATIONS 25 Limitations 27
Next steps 27
REFERENCES 29 APENDICES 31 Appendix A: Selection of FFVP-Participating Schools to Serve as Study Locations 32 Appendix B: Retail Interview Guide 33
Appendix C: District FFVP Interview Guide 38
Appendix D: School FFVP Interview Guide 42
Appendix E: Focus Group Interview Guide 46
FFY2017 SNAP-Ed Annual Report 404 January 2018
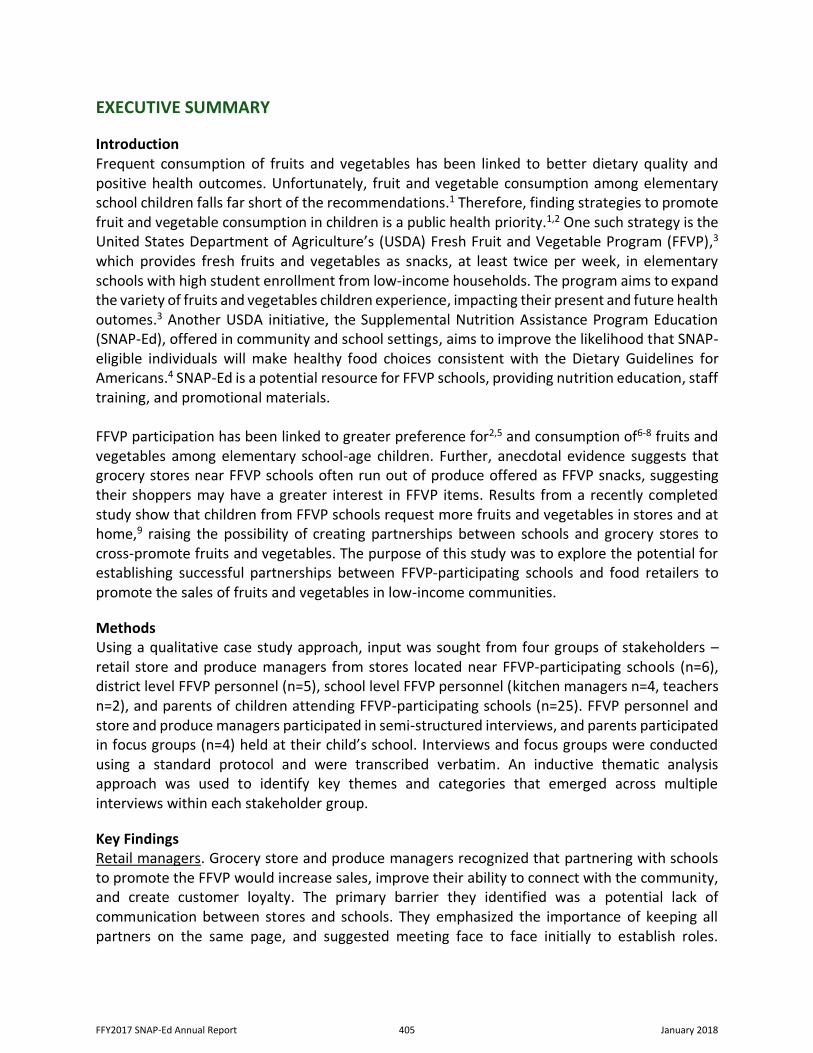
EXECUTIVE SUMMARY
Introduction Frequent consumption of fruits and vegetables has been linked to better dietary quality and positive health outcomes. Unfortunately, fruit and vegetable consumption among elementary school children falls far short of the recommendations.1 Therefore, finding strategies to promote fruit and vegetable consumption in children is a public health priority.1,2 One such strategy is the United States Department of Agriculture’s (USDA) Fresh Fruit and Vegetable Program (FFVP),3 which provides fresh fruits and vegetables as snacks, at least twice per week, in elementary schools with high student enrollment from low-income households. The program aims to expand the variety of fruits and vegetables children experience, impacting their present and future health outomes.3 Another USDA initiative, the Supplemental Nutrition Assistance Program Education (SNAP-Ed), offered in community and school settings, aims to improve the likelihood that SNAP-eligible individuals will make healthy food choices consistent with the Dietary Guidelines for Americans.4 SNAP-Ed is a potential resource for FFVP schools, providing nutrition education, staff training, and promotional materials. FFVP participation has been linked to greater preference for2,5 and consumption of6-8 fruits and vegetables among elementary school-age children. Further, anecdotal evidence suggests that grocery stores near FFVP schools often run out of produce offered as FFVP snacks, suggesting their shoppers may have a greater interest in FFVP items. Results from a recently completed study show that children from FFVP schools request more fruits and vegetables in stores and at home,9 raising the possibility of creating partnerships between schools and grocery stores to cross-promote fruits and vegetables. The purpose of this study was to explore the potential for establishing successful partnerships between FFVP-participating schools and food retailers to promote the sales of fruits and vegetables in low-income communities.
Methods Using a qualitative case study approach, input was sought from four groups of stakeholders – retail store and produce managers from stores located near FFVP-participating schools (n=6), district level FFVP personnel (n=5), school level FFVP personnel (kitchen managers n=4, teachers n=2), and parents of children attending FFVP-participating schools (n=25). FFVP personnel and store and produce managers participated in semi-structured interviews, and parents participated in focus groups (n=4) held at their child’s school. Interviews and focus groups were conducted using a standard protocol and were transcribed verbatim. An inductive thematic analysis approach was used to identify key themes and categories that emerged across multiple interviews within each stakeholder group.
Key Findings Retail managers. Grocery store and produce managers recognized that partnering with schools to promote the FFVP would increase sales, improve their ability to connect with the community, and create customer loyalty. The primary barrier they identified was a potential lack of communication between stores and schools. They emphasized the importance of keeping all partners on the same page, and suggested meeting face to face initially to establish roles.
FFY2017 SNAP-Ed Annual Report 405 January 2018
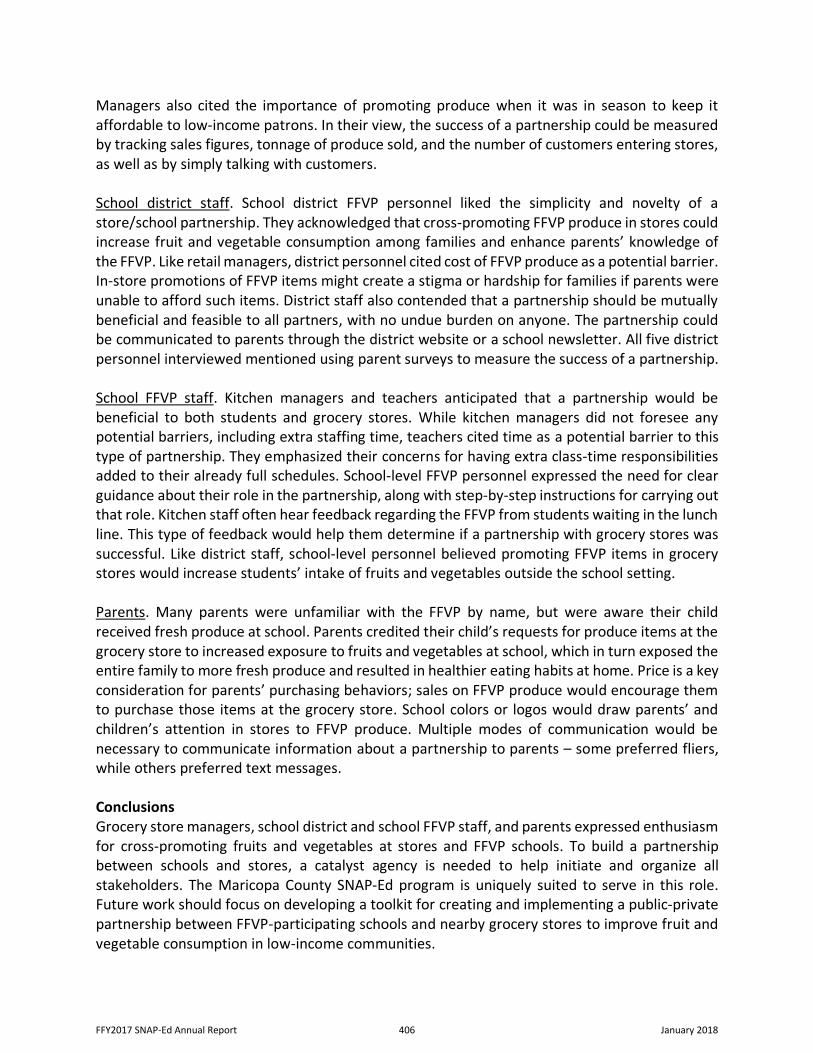
Managers also cited the importance of promoting produce when it was in season to keep it affordable to low-income patrons. In their view, the success of a partnership could be measured by tracking sales figures, tonnage of produce sold, and the number of customers entering stores, as well as by simply talking with customers. School district staff. School district FFVP personnel liked the simplicity and novelty of a store/school partnership. They acknowledged that cross-promoting FFVP produce in stores could increase fruit and vegetable consumption among families and enhance parents’ knowledge of the FFVP. Like retail managers, district personnel cited cost of FFVP produce as a potential barrier. In-store promotions of FFVP items might create a stigma or hardship for families if parents were unable to afford such items. District staff also contended that a partnership should be mutually beneficial and feasible to all partners, with no undue burden on anyone. The partnership could be communicated to parents through the district website or a school newsletter. All five district personnel interviewed mentioned using parent surveys to measure the success of a partnership. School FFVP staff. Kitchen managers and teachers anticipated that a partnership would be beneficial to both students and grocery stores. While kitchen managers did not foresee any potential barriers, including extra staffing time, teachers cited time as a potential barrier to this type of partnership. They emphasized their concerns for having extra class-time responsibilities added to their already full schedules. School-level FFVP personnel expressed the need for clear guidance about their role in the partnership, along with step-by-step instructions for carrying out that role. Kitchen staff often hear feedback regarding the FFVP from students waiting in the lunch line. This type of feedback would help them determine if a partnership with grocery stores was successful. Like district staff, school-level personnel believed promoting FFVP items in grocery stores would increase students’ intake of fruits and vegetables outside the school setting. Parents. Many parents were unfamiliar with the FFVP by name, but were aware their child received fresh produce at school. Parents credited their child’s requests for produce items at the grocery store to increased exposure to fruits and vegetables at school, which in turn exposed the entire family to more fresh produce and resulted in healthier eating habits at home. Price is a key consideration for parents’ purchasing behaviors; sales on FFVP produce would encourage them to purchase those items at the grocery store. School colors or logos would draw parents’ and children’s attention in stores to FFVP produce. Multiple modes of communication would be necessary to communicate information about a partnership to parents – some preferred fliers, while others preferred text messages.
Conclusions Grocery store managers, school district and school FFVP staff, and parents expressed enthusiasm for cross-promoting fruits and vegetables at stores and FFVP schools. To build a partnership between schools and stores, a catalyst agency is needed to help initiate and organize all stakeholders. The Maricopa County SNAP-Ed program is uniquely suited to serve in this role. Future work should focus on developing a toolkit for creating and implementing a public-private partnership between FFVP-participating schools and nearby grocery stores to improve fruit and vegetable consumption in low-income communities.
FFY2017 SNAP-Ed Annual Report 406 January 2018
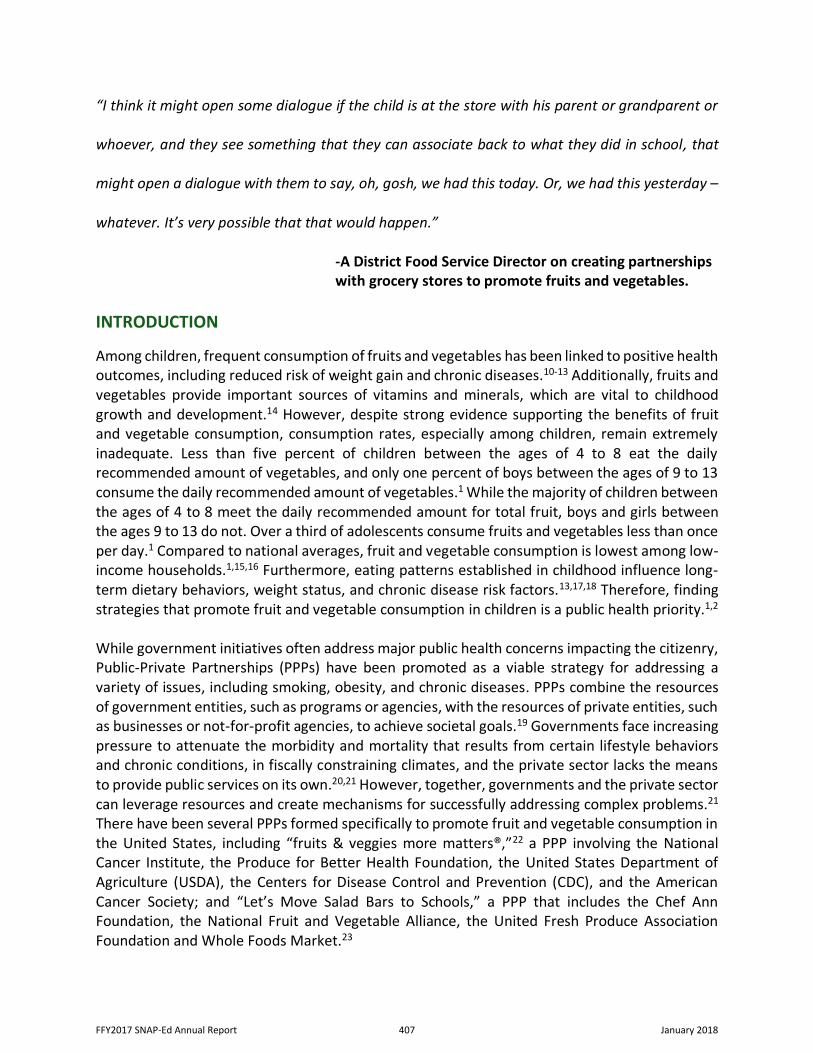
“I think it might open some dialogue if the child is at the store with his parent or grandparent or
whoever, and they see something that they can associate back to what they did in school, that
might open a dialogue with them to say, oh, gosh, we had this today. Or, we had this yesterday –
whatever. It’s very possible that that would happen.”
-A District Food Service Director on creating partnerships with grocery stores to promote fruits and vegetables.
INTRODUCTION
Among children, frequent consumption of fruits and vegetables has been linked to positive health outcomes, including reduced risk of weight gain and chronic diseases.10-13 Additionally, fruits and vegetables provide important sources of vitamins and minerals, which are vital to childhood growth and development.14 However, despite strong evidence supporting the benefits of fruit and vegetable consumption, consumption rates, especially among children, remain extremely inadequate. Less than five percent of children between the ages of 4 to 8 eat the daily recommended amount of vegetables, and only one percent of boys between the ages of 9 to 13 consume the daily recommended amount of vegetables.1 While the majority of children between the ages of 4 to 8 meet the daily recommended amount for total fruit, boys and girls between the ages 9 to 13 do not. Over a third of adolescents consume fruits and vegetables less than once per day.1 Compared to national averages, fruit and vegetable consumption is lowest among low-income households.1,15,16 Furthermore, eating patterns established in childhood influence long-term dietary behaviors, weight status, and chronic disease risk factors.13,17,18 Therefore, finding strategies that promote fruit and vegetable consumption in children is a public health priority.1,2 While government initiatives often address major public health concerns impacting the citizenry, Public-Private Partnerships (PPPs) have been promoted as a viable strategy for addressing a variety of issues, including smoking, obesity, and chronic diseases. PPPs combine the resources of government entities, such as programs or agencies, with the resources of private entities, such as businesses or not-for-profit agencies, to achieve societal goals.19 Governments face increasing pressure to attenuate the morbidity and mortality that results from certain lifestyle behaviors and chronic conditions, in fiscally constraining climates, and the private sector lacks the means to provide public services on its own.20,21 However, together, governments and the private sector can leverage resources and create mechanisms for successfully addressing complex problems.21 There have been several PPPs formed specifically to promote fruit and vegetable consumption in the United States, including “fruits & veggies more matters®,”22 a PPP involving the National Cancer Institute, the Produce for Better Health Foundation, the United States Department of Agriculture (USDA), the Centers for Disease Control and Prevention (CDC), and the American Cancer Society; and “Let’s Move Salad Bars to Schools,” a PPP that includes the Chef Ann Foundation, the National Fruit and Vegetable Alliance, the United Fresh Produce Association Foundation and Whole Foods Market.23
FFY2017 SNAP-Ed Annual Report 407 January 2018
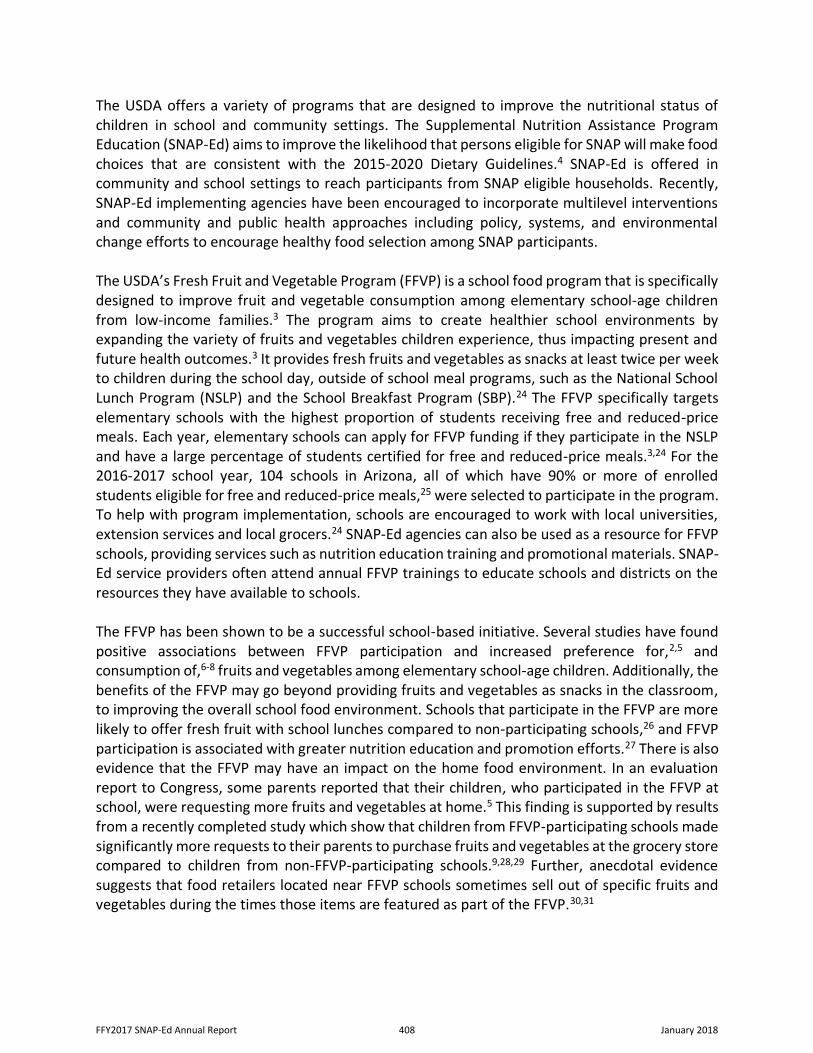
The USDA offers a variety of programs that are designed to improve the nutritional status of children in school and community settings. The Supplemental Nutrition Assistance Program Education (SNAP-Ed) aims to improve the likelihood that persons eligible for SNAP will make food choices that are consistent with the 2015-2020 Dietary Guidelines.4 SNAP-Ed is offered in community and school settings to reach participants from SNAP eligible households. Recently, SNAP-Ed implementing agencies have been encouraged to incorporate multilevel interventions and community and public health approaches including policy, systems, and environmental change efforts to encourage healthy food selection among SNAP participants. The USDA’s Fresh Fruit and Vegetable Program (FFVP) is a school food program that is specifically designed to improve fruit and vegetable consumption among elementary school-age children from low-income families.3 The program aims to create healthier school environments by expanding the variety of fruits and vegetables children experience, thus impacting present and future health outcomes.3 It provides fresh fruits and vegetables as snacks at least twice per week to children during the school day, outside of school meal programs, such as the National School Lunch Program (NSLP) and the School Breakfast Program (SBP).24 The FFVP specifically targets elementary schools with the highest proportion of students receiving free and reduced-price meals. Each year, elementary schools can apply for FFVP funding if they participate in the NSLP and have a large percentage of students certified for free and reduced-price meals.3,24 For the 2016-2017 school year, 104 schools in Arizona, all of which have 90% or more of enrolled students eligible for free and reduced-price meals,25 were selected to participate in the program. To help with program implementation, schools are encouraged to work with local universities, extension services and local grocers.24 SNAP-Ed agencies can also be used as a resource for FFVP schools, providing services such as nutrition education training and promotional materials. SNAP-Ed service providers often attend annual FFVP trainings to educate schools and districts on the resources they have available to schools. The FFVP has been shown to be a successful school-based initiative. Several studies have found positive associations between FFVP participation and increased preference for,2,5 and consumption of,6-8 fruits and vegetables among elementary school-age children. Additionally, the benefits of the FFVP may go beyond providing fruits and vegetables as snacks in the classroom, to improving the overall school food environment. Schools that participate in the FFVP are more likely to offer fresh fruit with school lunches compared to non-participating schools,26 and FFVP participation is associated with greater nutrition education and promotion efforts.27 There is also evidence that the FFVP may have an impact on the home food environment. In an evaluation report to Congress, some parents reported that their children, who participated in the FFVP at school, were requesting more fruits and vegetables at home.5 This finding is supported by results from a recently completed study which show that children from FFVP-participating schools made significantly more requests to their parents to purchase fruits and vegetables at the grocery store compared to children from non-FFVP-participating schools.9,28,29 Further, anecdotal evidence suggests that food retailers located near FFVP schools sometimes sell out of specific fruits and vegetables during the times those items are featured as part of the FFVP.30,31
FFY2017 SNAP-Ed Annual Report 408 January 2018
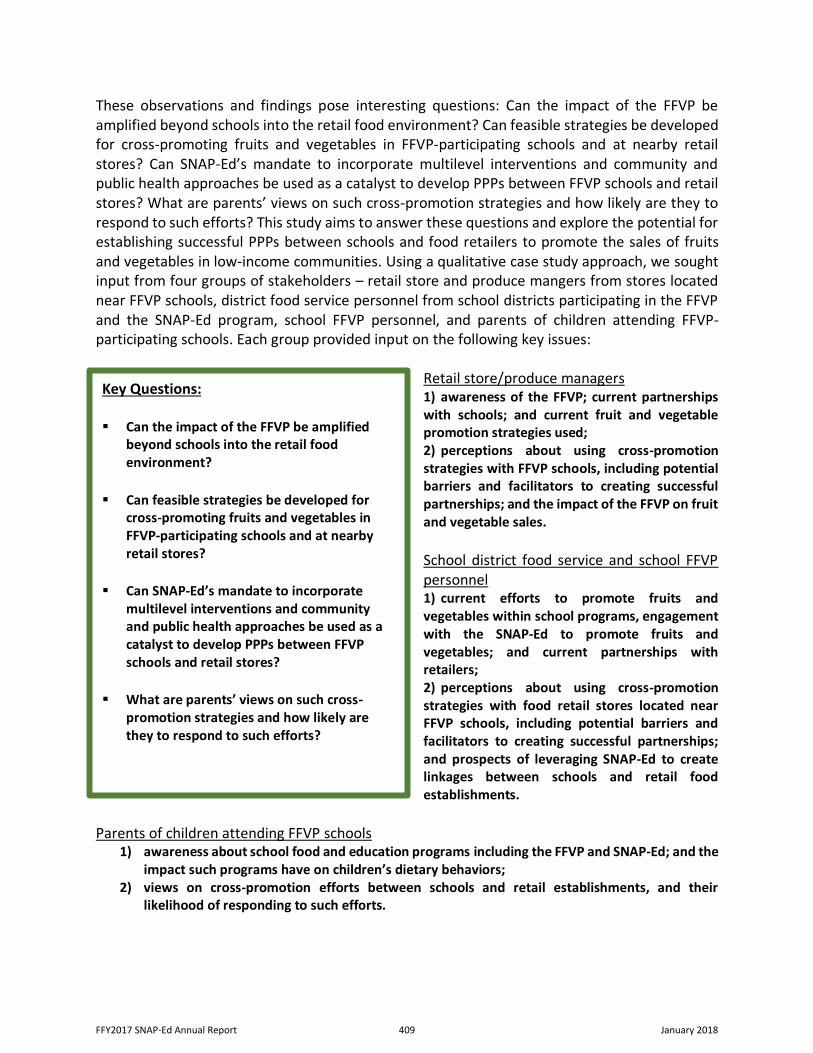
These observations and findings pose interesting questions: Can the impact of the FFVP be amplified beyond schools into the retail food environment? Can feasible strategies be developed for cross-promoting fruits and vegetables in FFVP-participating schools and at nearby retail stores? Can SNAP-Ed’s mandate to incorporate multilevel interventions and community and public health approaches be used as a catalyst to develop PPPs between FFVP schools and retail stores? What are parents’ views on such cross-promotion strategies and how likely are they to respond to such efforts? This study aims to answer these questions and explore the potential for establishing successful PPPs between schools and food retailers to promote the sales of fruits and vegetables in low-income communities. Using a qualitative case study approach, we sought input from four groups of stakeholders – retail store and produce mangers from stores located near FFVP schools, district food service personnel from school districts participating in the FFVP and the SNAP-Ed program, school FFVP personnel, and parents of children attending FFVP-participating schools. Each group provided input on the following key issues:
Retail store/produce managers 1) awareness of the FFVP; current partnerships with schools; and current fruit and vegetable promotion strategies used; 2) perceptions about using cross-promotion strategies with FFVP schools, including potential barriers and facilitators to creating successful partnerships; and the impact of the FFVP on fruit and vegetable sales. School district food service and school FFVP personnel 1) current efforts to promote fruits and vegetables within school programs, engagement with the SNAP-Ed to promote fruits and vegetables; and current partnerships with retailers; 2) perceptions about using cross-promotion strategies with food retail stores located near FFVP schools, including potential barriers and facilitators to creating successful partnerships; and prospects of leveraging SNAP-Ed to create linkages between schools and retail food establishments.
Parents of children attending FFVP schools
1) awareness about school food and education programs including the FFVP and SNAP-Ed; and the impact such programs have on children’s dietary behaviors;
2) views on cross-promotion efforts between schools and retail establishments, and their likelihood of responding to such efforts.
Key Questions: ▪ Can the impact of the FFVP be amplified
beyond schools into the retail food environment?
▪ Can feasible strategies be developed for
cross-promoting fruits and vegetables in FFVP-participating schools and at nearby retail stores?
▪ Can SNAP-Ed’s mandate to incorporate
multilevel interventions and community and public health approaches be used as a catalyst to develop PPPs between FFVP schools and retail stores?
▪ What are parents’ views on such cross-
promotion strategies and how likely are they to respond to such efforts?
FFY2017 SNAP-Ed Annual Report 409 January 2018
METHODS
Sample Selection The study setting consisted of schools and grocery stores in the Phoenix metropolitan area. A two-stage sampling procedure was used, first selecting schools within school districts (Appendix A), and then selecting grocery stores near FFVP schools. The Arizona Department of Education (ADE) provided a list of 104 elementary schools across the state that were selected for participation in the FFVP for SY 2016-17.25 One of the aims of the study was to investigate if SNAP-Ed, offered through Maricopa County Department of Public Health (MCDPH) as a case in point, could be used as a catalyst for creating partnerships between schools and retailers. Therefore, only schools that participated in the FFVP and SNAP-Ed through MCDPH were eligible for the study. Forty-one schools met the criteria of offering the FFVP and participating in SNAP-Ed through MCDPH. Of these schools, 3 schools were new to the FFVP, 10 schools had participated in the FFVP for only one year, and 28 schools had participated in the FFVP for four or more years. A decision was made to include only schools that had prior multi-year experience working with the FFVP so they were familiar with program implementation. Therefore, only the 28 schools (schools with four or more years of experience) were eligible for the study. Once the sampling frame was set, one school from each district was randomly selected to participate in the study. One district had 12 schools (approximately 43% of the sampling frame) that met inclusion criteria; therefore, two schools were randomly selected from that district, resulting in a sample of 6 schools from five school districts. MCDPH’s Office of Epidemiology utilized the Near tool in the ArcGIS Toolbox to determine the first, second and third closest grocery stores to each FFVP school included in the sampling frame. The closest grocery store to each selected school was invited to participate in the study. If the closest store was not available to participate (n=5), the second closest was considered for participation, followed by the third closest (n=4). In 4 cases, the second or third closest store included in the study was the closest store to another non-selected FFVP school. A total of 6 stores were interviewed for the study and they were located between 0.4 and 1.5 miles from a FFVP-participating school. In stores, corporate office personnel assisted the research team in arranging interviews with the store and produce managers at each selected store. In schools, recruitment began by sending e-mails to Food Service Directors (FSD) at each district. A list of contacts at each school district was provided by ADE. The FFVP Specialist at ADE also sent e-mails to FSDs informing them of the study and encouraging their participation. FSDs in each of the five school districts connected the research team to FFVP staff members at each selected school. FFVP staff members consisted of kitchen managers (n=4) or teachers (n=2). The FSD and the FFVP staff member at each school then assisted the research team in organizing focus groups, for which parents were recruited by school staff. In retail stores, recruitment began by contacting district managers and public relations specialists at each grocery chain. A list of interviews completed by each stakeholder type, including retail personnel, school personnel, and parents, is summarized in Table 1. Retail
FFY2017 SNAP-Ed Annual Report 410 January 2018
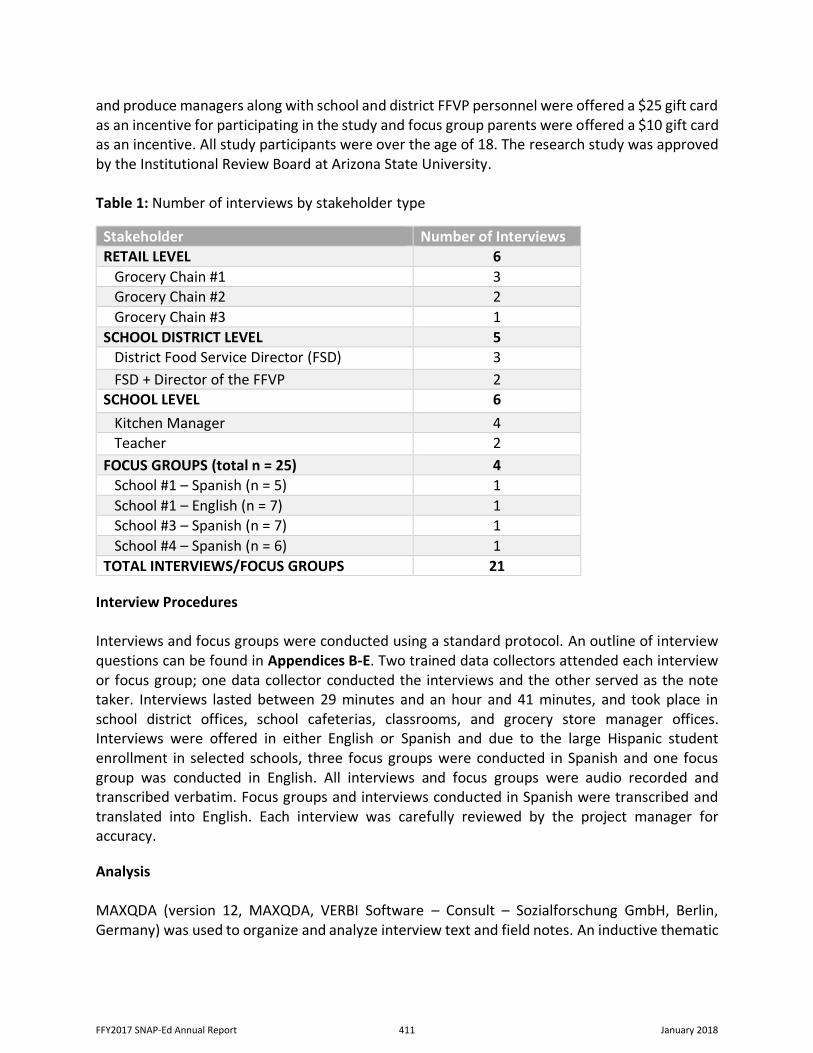
and produce managers along with school and district FFVP personnel were offered a $25 gift card as an incentive for participating in the study and focus group parents were offered a $10 gift card as an incentive. All study participants were over the age of 18. The research study was approved by the Institutional Review Board at Arizona State University. Table 1: Number of interviews by stakeholder type
Stakeholder Number of Interviews RETAIL LEVEL 6 Grocery Chain #1 3 Grocery Chain #2 2 Grocery Chain #3 1 SCHOOL DISTRICT LEVEL 5 District Food Service Director (FSD) 3
FSD + Director of the FFVP 2 SCHOOL LEVEL 6 Kitchen Manager 4 Teacher 2
FOCUS GROUPS (total n = 25) 4
School #1 – Spanish (n = 5) 1
School #1 – English (n = 7) 1 School #3 – Spanish (n = 7) 1
School #4 – Spanish (n = 6) 1
TOTAL INTERVIEWS/FOCUS GROUPS 21
Interview Procedures Interviews and focus groups were conducted using a standard protocol. An outline of interview questions can be found in Appendices B-E. Two trained data collectors attended each interview or focus group; one data collector conducted the interviews and the other served as the note taker. Interviews lasted between 29 minutes and an hour and 41 minutes, and took place in school district offices, school cafeterias, classrooms, and grocery store manager offices. Interviews were offered in either English or Spanish and due to the large Hispanic student enrollment in selected schools, three focus groups were conducted in Spanish and one focus group was conducted in English. All interviews and focus groups were audio recorded and transcribed verbatim. Focus groups and interviews conducted in Spanish were transcribed and translated into English. Each interview was carefully reviewed by the project manager for accuracy.
Analysis MAXQDA (version 12, MAXQDA, VERBI Software – Consult – Sozialforschung GmbH, Berlin, Germany) was used to organize and analyze interview text and field notes. An inductive thematic
FFY2017 SNAP-Ed Annual Report 411 January 2018
analysis approach was used to identify key themes and categories that emerged across multiple interviews within each stakeholder group (store/produce managers, FFVP personnel and parents). Two coders were used for coding. Coding for each stakeholder group began with both coders openly coding each transcript to identify main topics. Researchers compared open codes, discussed topic discrepancies, and created a final codebook to capture and summarize emerging themes within each stakeholder group. Once all themes were summarized, the summary statements were checked for duplicates and grouped to reduce the number of categories. The data were then coded a second time to fit into one of the emerging categories. After the second round of coding, discrepancies were again discussed and resolved. The number of final coded statements for each category and subcategory were reviewed to identify predominant themes.
RESULTS
This report focuses on the themes that emerged from the data addressing key aims of the study including perceptions about partnerships, barriers to creating partnerships, implementation strategies, and signs of success. The themes are summarized below, stratified by stakeholder type.
Retail Managers A total of six interviews were conducted with store and produce managers at six stores representing three different grocery chains. Three stores from a local grocery chain, two stores from a grocery chain with locations in the southwest part of the United States, and one store from a larger, national grocery chain were included. In general, managers were familiar with the NSLP and the SBP. A few were familiar with a school snack program but were unsure if it was the FFVP specifically. Managers learned about school food programs through family members, such as nieces and nephews, or their own children. Most managers were aware of nearby schools, although they did not know them by name specifically. They were aware that there were elementary schools in the area, and were sometimes able to provide the cross-streets of specific schools. A partnership with schools would be a good idea Store and produce managers interviewed unanimously believed that creating partnerships with nearby schools to promote fruit and vegetable consumption in children was a worthwhile idea. Other than providing schools with donations for events, holiday drives and sports teams, no formal partnerships between retailers and local schools were in place. Managers expressed interest in learning how they could be involved in such a partnership and were eager to offer their help in creating and carrying out partnerships with schools.
“If you ever decide to get the program running and you wanna work with us, we would love to help you guys out.” (Store 610)
FFY2017 SNAP-Ed Annual Report 412 January 2018
They immediately recognized the benefits a partnership would offer to stores, including the ability to connect stores to the communities in which they serve, and a possible increase in sales, not only now, but in the future.
“It’s not just because we want free publicity. It’s because we want them to understand that companies do have values and do care for our communities.” (Store 611) “I think it would have a big impact on sales because if they [customers] were shopping somewhere else, and they see what we’re doing as an organization to help the community, I can see them supporting us to make sure that we stay in the community. I mean, customers already give us credit for a lot of stuff that we do as far as donating to the homeless, all the donations we do, all the promotions we do. This would be just another step in the right direction with being involved with our community in the area.” (Store 605) “It would be very effective because these children would be our future clients.” (Store 603)
Barriers to partnering with schools Store and produce managers indicated that a partnership with schools would be fairly easy to implement, with few hurdles. The primary potential obstacle cited was communication between partners (schools and stores) to make sure that all parties were on the same page. Managers consistently expressed that the success of the partnership would be tied to adequate communication between involved parties. Some had experienced programs breaking down in the past due to lack of communication and suggested that if both parties were actively involved in the partnership, it would lead to success.
“I really don’t see any barriers just as long as the communication between the stores and the principal and our office, make sure everybody’s in line to make it happen if that’s the way it’s going to work. . . That’s the only concern I might have, someone dropping the ball and not having the communication.” (Store 605) “If the school is not motivated and really pushing it and they don’t communicate with our company, then you can see the program start here, then start to trend down because of the lack of communication. And when you have a partnership with a school or company or someone, then they have to be involved. They can’t be, okay, this is what we want to do now take care of it and let me know if you have any problems.” (Store 601)
Managers specifically mentioned the need to coordinate with schools to ensure that the store could offer, at a decent price, the produce served in schools. The principal consideration in this regard was the importance of serving in-season produce as FFVP snack items.
“In a lower income family it makes a big difference. They probably love strawberries as much when it’s $4.99, [as] when it’s $1.50, but [during the winter they may think], ‘Oh, my God, I’ve got to make my dollar last,’ so they’ll probably shy away from it.” (Store 603)
FFY2017 SNAP-Ed Annual Report 413 January 2018
Strategies for implementing a successful partnership with schools Interviewers explained to managers that they were exploring collaborations between schools and retailers to promote fruits and vegetables. Managers were given a possible scenario of what such a collaboration might look like. In the example provided, the schools would inform retailers about the FFVP snack schedule in schools, and then those items would be promoted in stores. The idea would be to increase children’s exposure to fruits and vegetables, as they try fruits and vegetables at school, see fruits and vegetables at the grocery store, and eat fruits and vegetables at home when their parents purchase FFVP items. Managers were then asked for their ideas about how specifically this type of partnership might work. In terms of promoting FFVP items in stores, managers offered a wide variety of implementation strategies. The most common idea was to have signage promoting the FFVP items that had been served in schools that week, and even offer samples. Some suggested using school logos and school colors to appeal to students.
“If we get together with school districts and we kinda designate what schools are near my store, we can go and make some big signs for Monday is gonna be banana. So we can put so-and-so elementary school is gonna be doing banana this week or this day. And so-and-so elementary school is gonna do apples, red apples, red Delicious apples, or nectarines, oranges, whatever it is. And we can put the school name in. And since they are in our neighborhood, they will be coming to our school. Look mom, that’s my school and this is what we’re eating.” (Store 611)
“One thing we can do, too, for example, we’re promoting cantaloupe in the store, let us know, ‘hey we’re looking for more cantaloupe,’ so when you come here, we have cantaloupe, we can cut one up, little squares with little tooth picks, and each kid can come and taste it including the parents.” (Store 603)
Managers explained that establishing a partnership would best be accomplished by an initial face-to-face meeting of all involved parties, including a corporate representative, store personnel, and school personnel to establish the relationship and ensure that everyone was on the same page. School personnel could come to stores or managers could go to schools to initiate the partnership.
“The main thing is just the relationship and visiting with everybody. Contact the principal, and teachers and principals will come to the store, and we’ll work with them and us as directors and produce managers [knowing] what the idea is and the whole group working together. And that’s the best way to develop something.” (Store 602)
Maintaining the partnership could be accomplished by regular brief calls and/or emails to confirm agreement on implementation details.
FFY2017 SNAP-Ed Annual Report 414 January 2018
“Email’s the best way that we all get the best communication. Once in a while, probably a phone call. At the beginning of the week, beginning of the month saying this is what I’m going to do. Actually, if you’re doing something for the month, here’s our 20-minute conference call between the warehouse, the involved store, with the schools. This is what we’re doing. This is how we’re going to go about it, and we’re on the same page. Then after that, it’s just a little reminder email. Hey, this is what you’re going to get. This is where it’s going. They already know it’s coming.” (Store 605)
Measuring the success of a partnership
Most managers mentioned that increases in key store metrics could be used as objective indicators of a successful partnership. Sales figures, tonnage of produce sold, and number of customers entering stores are routinely tracked using software programs at both the store and corporate levels. Increases in any of these metrics after implementation of a partnership could demonstrate success.
“We could tell you what we sell. I could tell you [our produce manager] sold 15 pounds of Roma tomatoes on the vine yesterday. We can tell you how many customers walked in our door yesterday. Technology will tell us – I can look at my computer right now telling me I had 55 more customers ring up through my front registers than I did last year.” (Store 605).
Managers also mentioned communication with customers as a subjective way to determine if the partnership was working. Customers noticing signs in stores promoting items children were offered in schools and asking about the program would be a way to track the success of the partnership.
“If they see the signs and they ask. It shows that they're interested or they wanna know more…” (Store 610)
Motivation to create partnerships with schools Most managers indicated that the primary factor that would motivate them to form a partnership with schools would be the potential of the partnership to positively impact children’s health by promoting healthier eating.
“To me, being a father, it’s just seeing kids eat healthier. I see parents buying junk food galore, and then they’re wondering why some of the kids are heavy set, and we struggle as a nation. We don’t have that education to break that old habit.” (Store 603) “Just the fact that it’s for kids. We all have kids. . . I think that’s a good idea to promote good eating.” (Store 605)
FFY2017 SNAP-Ed Annual Report 415 January 2018
School Districts A total of seven FFVP personnel in the five participating school districts completed semi-structured interviews for the study. In two districts, interviews were conducted with the district FSD; in one district, an interview was conducted with the child nutritionist overseeing the FFVP program; and in the remaining two districts, interviews were conducted with the district FSD and the individual overseeing the FFVP. District personnel had between two months and 29 years of experience in their current positions, and between 3 and 29 years of general school food service experience. It would be great to partner with grocery stores When responding to the idea of developing partnerships with nearby grocery stores to promote fruit and vegetable consumption by identifying and promoting FFVP items in stores, school district staff were unanimously supportive. They perceived implementation of such a partnership to be feasible and liked the simplicity of the idea.
“That’d be a really easy collaboration, honestly.” (District 500) “The ideas you pose I think are great. They sound simple and achievable, which is definitely what we need. Simple and achievable. (District 300)
The district staff enjoyed the novelty of the idea and expressed that this type of PPP could provide the necessary linkages to connect retail stores, schools and parents, and increase the potential for families to choose fruits and vegetables at the store, as well as expanding parents’ knowledge of the program.
“I really like the idea of connecting all of those dots because I think you would probably see some going ahead and making that choice to choose that [fruit or vegetable] item. I think it could be a great partnership.” (District 300)
“It would definitely help us because one of the goals is to increase their consumption, and then be able to recognize that fruit or vegetable at a grocery store. So if you would have a partnership with the grocery store, you can pretty much tie those two together. If they’re working to make sure that those fruits and vegetables are identified for the program, and then you have announcements, and you have teachers encouraging, staff encouraging the consumption, I feel like those two collaborations could be a possibly beneficial one for the students.” (District 400) “I think that’d be cool to expand the parent connection to the program.” (District 500)
FFY2017 SNAP-Ed Annual Report 416 January 2018
Barriers to partnering with retailers District level staff believed there would be few barriers to partnering with grocery stores. Cost of produce was a potential issue mentioned in various contexts. District personnel stated that partnerships might create a stigma or hardships for families if children were to request FFVP items they saw promoted in grocery stores and parents were unable to afford such items, particularly the rare or unusual ones.
“I think probably the biggest barrier for this demographic might be financial. So depending on the cost of that item, [parents] may or may not be able to choose it.” (District 300)
Recognizing the business goals of retailers, FFVP staff wanted to ensure that a partnership would be mutually beneficial and feasible, with neither the stores nor schools carrying an undue financial burden.
"I think it could be a great partnership between the grocery store and us, trying to find items that fit both our needs because I mean they’re a business too. So they may not choose to want to purchase some of these items, like rambutans. Knowing that’s probably not gonna fly off the shelf. And it’s quite costly.” (District 300) “I would hope if it’s a cost, depending on what the cost is, it would be something they would absorb and not the school district. That would be a factor.” (District 100)
As the FFVP is designed to target schools in low-income areas, these schools are often located in food deserts, giving parents limited access to fresh foods such as fruits and vegetables. Although all schools included in the sample were located within 1.5 miles of a grocery store, one district staff person did bring up the issue of access to grocery stores in the general area covered by the school district.
“Just being in central Phoenix, it’s food desert. The only grocery store that I know in this area is [name of non-participating grocery store] . . . So us being in a food desert is probably an issue.” (District 400)
It should be noted that staff indicated that barriers could be easily overcome, often offering strategies to overcome obstacles. Some staff were initially unable to identify potential barriers to a partnership, and required additionally probing. Strategies for implementing a successful partnership with retailers FFVP district personnel explained that implementing partnerships in grocery stores would be a fairly easy process, requiring approval from the superintendent or school board to initiate.
FFY2017 SNAP-Ed Annual Report 417 January 2018
“So it would just probably be following the chain of command. So myself to my supervisor. That supervisor would go to the superintendent. And the superintendent would run it by the governing board. And then if approved, then we would start the process.” (District 100)
An initial meeting with store managers would be required to agree upon each partner’s role and understand how FFVP produce would be promoted in stores. District FFVP personnel would then send produce managers the weekly schedule for serving the FFVP fruits and vegetables in schools.
“We need to talk basically, to see how we can do it and how we can partner. I’m willing to try anything. So it’s more for [store managers] to talk to me to see how we could make it happen.” (District 200) “Probably supply them with my menu. See if they’re willing to participate, and see what strategies they would use as far as signage.” (Store 400)
District personnel also suggested using the district website or school newsletter as a strategy to communicate the partnership to parents and encourage them to shop at the partnering grocery store.
“I think we could probably do something on our website, or maybe on our Nutrition Express, hey, we’re now partnering with such and such shopping center. So kids, when you have your FFVP, you can also find it in a place like this.” (District 100)
Extending the reach of the FFVP When asked about the impact of a partnership with grocery stores, FFVP staff indicated that it could help to expand the goals of the FFVP to the home environment, including increasing fruit and vegetable consumption at home. It could also help make parents more aware of the types of fruits and vegetables that students are trying in schools.
“I think it might open some dialogue if the child is at the store with his parent or grandparent or whoever, and they see something that they can associate back to what they did in school that might open a dialogue with them to say, oh, gosh, we had this today. Or, we had this yesterday – whatever. It’s very possible that that would happen.” (District 500)
Measuring the success of a partnership All five district personnel interviewed mentioned using surveys as a method to measure the success of a partnership. Interviewing all parties involved, including students, parents, and store managers would provide information on all aspects of the partnership.
FFY2017 SNAP-Ed Annual Report 418 January 2018
"Maybe surveys. Speak to parents. Ask if they’ve noticed a difference in their child when they go grocery shopping. If they’re saying, oh, this is the fruit or vegetable that was served at school. Can we buy it? So something like that, probably a survey.” (District 400) “You'd have to probably maybe survey the store and see if they had any comments back.” (District 500)
Another proposal was to use a token or ticket system in which tickets would be counted to assess how many FFVP items had been purchased from partner stores.
"We might be able to create some fun games or something like that, tokens where kids drop off a token in a bucket someplace in the produce section. We could create contests I’m sure along the way. Like if we provided our teachers with the tickets that they can give to the kids and if the kids go to the grocery store with mom or dad and put it in a bucket, if it just has – we don’t want an identifier obviously related to the kid for security reasons. But a ticket that you know is a [name of school] student.” (District 300)
Motivation to create partnerships with retailers FFVP district personnel were asked what would motivate them to create partnerships with retailers. Similar to retail managers, district personnel stated that they were motivated by the possibility of the partnership improving the health and lives of students and families.
“We know that what we’re doing makes a difference for kids and for families. If we can get them eating healthier, we all benefit.” (District 500) “Just seeing the students get excited about the fresh fruit and vegetables, knowing that they’re getting proper nutrition.” (District 400)
Schools The stakeholder group for school-level FFVP personnel consisted of kitchen managers and teachers. Two teachers and four kitchen managers from six schools in three school districts completed interviews. Kitchen managers had between 3 and 17 years of experience managing school food programs, and teachers had taught in their respective schools for 3 and 5 years. In addition to having experience in their current positions, school FFVP staff were very familiar with the community surrounding their schools. During interviews, they shared characteristics of students and parents, including shopping practices and socioeconomic issues, including hunger. The FFVP is designed to target schools in low-income communities; FFVP school staff explained that families in these communities often deal with issues of hunger and limited food budgets.
“[We have] a lot of homeless children here. We classify homeless, they’re living in shelters here, or maybe with other family members. We’re probably 90 percent Hispanic and English is a second language.” (School 502)
FFY2017 SNAP-Ed Annual Report 419 January 2018
“And we do have – I’m guessing almost 20 kids that I know of in this school that do not have a meal when they go home at night. Because either their parent works or there just isn’t anything there, especially at the end of the month.” (School 101)
Interested in creating partnerships with retailers When asked their thoughts about creating a partnership with grocery stores to promote fruit and vegetable consumption among students, school staff expressed interest and support. They anticipated that a partnership would be beneficial to both students and grocery stores.
“I think it would be really cool if like a lot of these people shop, let’s say at [name of non-participating grocery store], and they maybe have a sign up saying at your local school you’re serving this, this week. You know kiwi, try it when it’s on sale or you know we do mangos and stuff. We try to pick fruits and vegetables that are – like a lot of Hispanic children love the mango and the papaya you know and stuff like that. Pineapple, they love pineapple and certain things. That would be cool if they advertised it that weekend. I think it would…bring them business.” (School 502)
Barriers to partnering with retailers Teachers cited time as potentially a major barrier to this type of partnership. They emphasized the importance of not adding extra class-time responsibilities to their already full teaching schedules. Any tasks associated with the partnership should be straightforward, simple, and planned out for them.
“It’s not gonna work if I have to make activities around it. Something quick and easy that is clear, concise, to the point.” (School 201)
Kitchen managers indicated that time, including staffing time, would not be a barrier for creating a partnership. School FFVP staff perceived that the time and labor demands for a partnership would burden stores more than it would burden schools. Stores would be in charge of tagging FFVP items and for setting out promotional materials; school staff perceived their role to be supplying FFVP schedule information to the stores.
“So [school kitchen staff] prepare the item and they put it in the bags. Usually two of them but if they need help I also have another person that’s available. So extra staffing isn’t a problem.” (School 102)
“It seems like it would be more on their side than our side, but I’m sure there are some business aspect that I don’t know about.” (School 202)
FFY2017 SNAP-Ed Annual Report 420 January 2018
Strategies for implementing a successful partnership with retailers School staff are responsible for carrying out district or school-level policies and practices but are rarely responsible for creating these programs and practices. For example, districts decide which items will be offered for the FFVP during a given week. Kitchen managers are responsible for supplying FFVP snacks to teachers, and teachers are tasked with incorporating snack distribution into their daily schedules. Therefore, developing a partnership with grocery stores would need to follow a similar chain of command, where district staff would take the lead on initiating and developing these partnerships. In terms of implementing a partnership at the school level, FFVP staff expressed the need for clear details about their role in the partnership, along with step-by-step instructions for how to carry out their role in their schools.
So it would definitely need to probably come from a district level, somebody in charge that does stuff with the food in the cafeteria that has that time and resources to go talk to the grocery stores and what could they do. [And] then they would just relay what are we doing to us.” (School 201)
Although school FFVP staff need to receive approval and instructions from the district in order to facilitate a partnership with grocery stores, they presented some innovative partnership ideas, including using the partnership for school fundraisers.
“Like Target does, you spend so much, you can donate so much money to the school. So instead, maybe so much produce sales, if the school comes in and they bring in a coupon or say, we belong in the [name of school district], or a tag, keychain, something, they scan it, and a percentage of the produce sales goes back into the [district].” (School 202)
Signs of a successful partnership with retailers Kitchen staff are in a unique position to receive feedback directly from students because they are some of the only school employees who have the opportunity to connect with the majority of students multiple times every day, particularly in schools where most students participate in breakfast and lunch programs. Staff often hear feedback regarding the FFVP when they walk through the cafeteria during meal times and while students wait in the lunch line. Therefore, it is not surprising that FFVP school staff indicated that they would rely on these same feedback channels to determine if a partnership with grocery stores was successful.
“We hear all the gossip. I always say, you want to know something, come to the cafeteria. They tell you everything and they don’t censor. You gotta love it because they’re just telling you from their heart whether it’s good or bad. You just listen.” (School 502) “Probably just the feedback that I get from them or the parents that they come in and they mention it.” (School 102)
FFY2017 SNAP-Ed Annual Report 421 January 2018
Food waste is also an effective indicator of which items are well-received by students, and could be used to detect any changes in the amounts of fruits and vegetables students consume after initiation of a partnership.
“…what’s not being thrown away, what is being thrown away.” (School 101) Impact a partnership with retailers could have on exposure The FFVP aims to improve children’s overall diet and to create healthier eating habits by increasing awareness and exposure to fruits and vegetables at school. When asked about the impact of a FFVP partnership, school staff agreed that exposing children to fruits and vegetables outside of school settings, such as in grocery stores, may increase the impact of the FFVP on diet quality and eating habits. FFVP staff reflected that a partnership could help increase awareness of FFVP items in the grocery stores and get students more involved in the grocery shopping experience.
“I think it would make them more aware of where the item comes from. You know like farm to school, or farm to store, from store to home. I don’t think some of the kids understand that concept. It comes from the ground and then it goes –“ (School 101)
“I think it would work [to increase] fruits and vegetables consumption.” (School 501)
Motivation to create partnerships with retailers When asked what would motivate them to create partnerships with grocery stores, school FFVP staff cited student enjoyment of the program as their primary motivator.
“Probably just the experience for the kids, that would be my motivation. Because I know that from this area that they’re in they don’t get opportunities like that. So they would probably really like it.” (School 102) “If the kids enjoyed it, it would motive me more to do it. If I heard positive feedback, then I would be like oh, okay. The other kids will like it. So I’ll be more motivated to say something about it because it worked out well.” (School 201)
Since kitchen managers rely on teachers to carry out the FFVP in their classrooms, managers would also rely on teachers’ motivation to achieve the maximum potential of a partnership. If teachers are not interested in or do not see the benefit in a school food program, it will be difficult to implement.
“Interest from teachers. Or from the district office of Child Nutrition. If they’re not interested, then there’s no reason for me to even attempt it.” (School 101)
FFY2017 SNAP-Ed Annual Report 422 January 2018
Parents Four parent focus groups were conducted in three schools across two districts. Participant numbers ranged from five to seven per focus group, with a total of 25 parents. One focus group was conducted in English and three were conducted in Spanish. All but two participants were female; the majority of parents (n=15) were in the 35-50 year-old age range; and four parents had a bachelor’s degree or higher. When asked if anyone in the household participated in a list of food programs over the past year, 10 participants reported participating in SNAP and five reported participating in the Special Supplemental Nutrition Program for Women, Infants and Children (WIC). FFVP knowledge and awareness Parents were asked if and what they knew about the FFVP program at their child’s school. Most had a general knowledge that their child received fruits and vegetables at school, but did not distinguish between the FFVP and other school food programs such as the NSLP or SBP. When filling out a pre-focus group questionnaire, about half of parents selected the FFVP as one of the school food programs available to their child.
“And also they eat well here, they talk, ‘Mommy, it was so good.’ They like everything, both of them. They like whatever is given to them. And their milk, or snacks, and my daughter also says they eat a lot of fruits and vegetables.” (Focus group 3)
“They’re always proud of what they come home and tell me what they’re eating, especially the salad bar. My son tells me. He brags about it every day about eating there. It makes it easier to stay with the healthy eating habit.” (Focus group 1)
FFVP impacting home environment Although parents were not necessarily familiar with the name of the program providing their child with fruits and vegetables as snacks, they were keenly aware of its impact not only on the child, but on the entire family as well. Parents reported that their child sometimes tells them about a fruit or vegetable they have eaten at school, or they recognize it in the grocery store and request that the parent buy it. Parents also shared stories of their children bringing home unique fruits or vegetables to show them. As a result, the entire family is exposed to more fresh produce. In some cases purchasing the requested fruit or vegetable is a parent’s first experience with the produce item, particularly the more exotic ones, creating a learning experience for the entire family. Parents further described transformations to their child’s eating habits as a result of increased exposure to fruits and vegetables at school.
FFY2017 SNAP-Ed Annual Report 423 January 2018
“It changes the way we eat. It influences in a way in which we learn, and we begin to change the routine we have all the time with tortilla, meat, beans, and rice. We begin to use vegetables. They say, ‘I don’t want the chicken, I just want the vegetables and rice.’ Those are things that we see, changes in them, and we have to do it. If we aren’t used to eating that way, we then learn.” (Focus group 3)
“I have a daughter in high school right now, and every time I go to the store, she likes the mixed fruit cups a lot. And she gets home from school, and if she sees there are no fruits in the refrigerator, ‘Mommy, there aren’t even fruit cups.’ But every time she gets home from school, ‘Mom, are there any apples? Are there pears? Or grapes?’ The one that’s in high school. Since she came to school here, she began to eat, and eat that. She would get home from school, and she wouldn’t eat, but the first thing she would eat was a fruit. I would tell her, ‘Stop – eat first.’ ‘No, first, I’ll eat a fruit, and then I’ll eat.’ Always.” (Focus group 3)
I was telling them that she gets home and she tells me, “Mom, I brought a new fruit.” And she took home a fruit I never saw before, and it’s called star fruit, and it was a star, it was cut in the shape of the star. . .” (Focus group 4)
Positive perceptions about a partnership Focus group participants perceived the potential for a partnership between schools and nearby grocery stores as positive overall. They emphasized that the promotions they primarily consider when making purchasing decisions are price promotions; therefore, any promotions that are part of the proposed partnership should take price into account.
“I would like it, especially if it was a sale. That would really – A weekly sale. Yeah, that would be great. Yeah, that would really encourage me to buy that.” (Focus group 1)
Parents further explained that their children have a great deal of pride in their school, and that connecting the FFVP items in the store to the school by using school colors or logos would effectively catch their attention and that of their children.
“If it's a local store, it would almost seem like a good idea if they mentioned the school like [name of participating school]. So then the kids would be like oh, that's my school, and they'd be proud of their school – and to see outside of school, see it at the grocery store.” (Focus group 1)
“Some logos they can recognize, for example, we go to the store and the labels have – for example some cereals or the gummies have the logo of some of the channels they watch . . . so they see it and say, ‘Mom, this is what I watch on TV.’ And they remember, so if they link it to something about the school…they still get excited when remembering or finding a link.” (Focus group 4)
FFY2017 SNAP-Ed Annual Report 424 January 2018
Communicating with parents Focus group participants were asked how the partnership should be communicated to parents so they would know what fruits and vegetables were being promoted at which stores and on what days. Multiple modes of communication would be necessary, as parents have different preferences for receiving information about school events. For example, some parents believed fliers would be the most effective and mentioned that, although the school website is an efficient way of communicating, not all parents have access to the Internet and would, therefore, not have access to the partnership information. Some parents mentioned that their children were unreliable at showing them fliers received at school, and text messages would be more effective.
“With fliers sent home from the school promoting the store.” (Focus group 3)
“My daughter comes with the paper on hand and tells me, ‘Mom.’ And my son in 6th grade doesn’t do it, ‘What happened? Where is it?’ ‘In my backpack.’ And [my daughter] told me, ‘Here it is Mom.’ I knew the schedule for her. (Focus group 4)
“The text message is very convenient because it’s instant and you see the message and what you need to know and you can answer right away.” (Focus group 4)
Role of SNAP-Ed
In addition to their perceptions and ideas about a partnership with grocery stores, district and school FFVP personnel were asked about their familiarity with SNAP-Ed, any SNAP-Ed services they were currently using or had used in the past, and the potential support SNAP-Ed could provide in creating partnerships with retailers. Some district FFVP personnel were well aware of the SNAP-Ed program and the resources available through MCDPH and were also able to provide the names of specific individuals they were currently working with or who they had worked with in the past.
[Name of MCDPH staff member] and I, I know communicate frequently. I’m very familiar of their office and their resources that they provide us.” (District 300)
Other FFVP district staff had heard of the SNAP-Ed program but were unable to identify program specifics such as services and resources.
“I’ve heard of it, but I’m not really familiar with it. (District 100) One staff member mentioned the information they received about SNAP-Ed resources at their FFVP training.
FFY2017 SNAP-Ed Annual Report 425 January 2018
“And I know that we can use some of their supplies, but I went to training for the Fresh Fruit and Vegetable Program. They have blow-up balloons, jumping machines, and all this other neat stuff that was only for the schools that participated in the Fresh Fruit and Vegetable Program.” (District 400)
School personnel were less aware of SNAP-Ed resources and were unsure if there were any teachers or individuals at their school taking advantage of such resources. Additionally, school FFVP personnel had difficulty differentiating between materials and support provided through SNAP-Ed, and materials provided and offered by the district. Some districts provide their own nutrition education materials, such as FFVP nutrition education cards and nutrition education posters, which are likely similar in content to SNAP-Ed materials, making it difficult to distinguish between the two programs.
“I never heard of the SNAP-Ed. I’m not saying we don’t have it. Maybe in some of our schools, but none of the schools I’ve ever worked at.” (School 502)
“Not from SNAP-Ed, but I know our school district does it. Our dietitians teach in our classrooms three to four days a week.” (School 502)
Schools and districts receive promotional materials such as FFVP snack bags and posters from ADE as well. Since educational materials and support are coming from multiple sources, branding may help FFVP staff identify which support is being offered through the district and which resources are available through the SNAP-Ed program at the MCDPH. While more awareness is needed regarding the services offered through SNAP-Ed, there is great potential for SNAP-Ed to serve as a partner and/or a facilitator in extending the reach of the FFVP by partnering schools with nearby grocery stores. SNAP-Ed could serve as a linking partner, helping connect schools and stores by locating potential partnership sites, facilitating partnership introductions, assisting in forming partner roles, helping to delegate partner responsibilities, establishing channels of communication, and ensuring that schools and stores remain connected and have adequate resources for carrying out partnership goals. Additionally, as suggested by a district FFVP staff member, SNAP-Ed could provide store signage or other promotional materials to market the FFVP in stores, and promote retail stores in FFVP schools.
“If they could provide some funding for the signage or things like that. That would be great. They're always willing to help, which is nice.” (District 500)
CONCLUSION AND PRACTICAL IMPLICATIONS
Using a qualitative case study approach, this project aimed to explore the potential for establishing successful PPPs between FFVP-participating schools and nearby retailers to promote fruit and vegetable consumption in low-income communities. Our research revealed three key findings: 1) Stakeholders collectively support forming PPPs; 2) Overcoming communication between partners and price barriers for FFVP items is necessary for creating and sustaining
FFY2017 SNAP-Ed Annual Report 426 January 2018
successful partnerships; and 3) Partnerships between FFVP schools and retailers can be mutually beneficial and have a positive impact on the community.
Unanimous support for creating partnerships between schools and nearby retailers Stakeholders from each group unanimously supported the idea of creating PPPs between schools and grocery stores. Store and produce managers were eager to learn how they could be involved and are ready and willing to begin partnerships now. Schools are equally prepared to participate in partnerships if they receive the appropriate guidance from the school district. Teachers may need added support and resources to ensure that promotional efforts are carried out successfully in the classroom. Discussions with additional teachers could ensure that their concerns are adequately captured and mitigate barriers for this unique stakeholder group, as they will be key players in promoting the partnership in schools. Clear, concise, and easy-to-implement instructions on executing the partnership in classrooms can ease potential burdens and reduce the chances of a partnership cutting into already limited class time.
Overcoming communication and price barriers In order to ensure successful initial and ongoing implementation of a PPP between grocery stores and schools, all partners must engage in open communication. An initial face-to-face meeting to review the goal of the partnerships, to establish partner roles and responsibilities, and to create a plan for maintaining regular communication, such as through monthly calls and/or weekly e-mails, will facilitate the successful initiation of a partnership. Identifying a community organization to help establish a connection between stores and FFVP schools and to facilitate regular communication between partners may help reduce potential barrier expressed by key stakeholders. Offering FFVP produce in schools when it is in-season will aid stores in selling such items to patrons at reasonable (and discounted) prices. Selecting items that are out of season may impact the ability of parents to purchase FFVP fruits and vegetables for their families. District personnel stated that in-season produce is offered as part of the FFVP whenever possible, and store personnel stated that they promote fruits and vegetables when they are in-season; therefore, providing families with fresh produce at the lowest possible prices should be feasible except in instances when more exotic options are selected as FFVP snacks.
Mutually beneficial and a positive impact on the community School/store partnerships would bring multiple benefits to schools, stores and families. Not only would customer traffic increase in stores, but produce and overall sales would both rise. A partnership with schools would increase opportunities for grocery stores to foster connections to the community and cultivate customer loyalty among current and future shoppers. Further, increasing children’s exposure to fruits and vegetables would encourage healthier eating habits, thereby achieving the overall goal of the FFVP. Schools are also required to have wellness policies; a partnership could help participating schools achieve the goals of these policies by improving
FFY2017 SNAP-Ed Annual Report 427 January 2018
the overall health of students. Partnerships may increase the likelihood of parents purchasing produce items if they know their kids are eating and enjoying them at school. All family members of a child in an FFVP-participating school would therefore be exposed to new fruits and vegetables, resulting in healthier eating habits at home. Evaluating success Both objective and subjective measures could be used to evaluate the success of partnerships to ensure they are mutually beneficial and are positively impacting the surrounding community. Key store metrics such as sales figures, tonnage of produce sold, and customer traffic will objectively inform store personnel of the partnership’s impact. Additionally, store employees can ask patrons their opinions of FFVP promotions, and school staff members can listen to feedback from students. Results or changes should be shared among partners to determine program success and areas for improvement.
Limitations This project has a few limitations. The research was conducted in one city, Phoenix, limiting the generalizability of the study. Schools and grocery stores located in rural areas may have identified very different issues and barriers for creating and implementing such a partnership. Additionally, only schools from five school districts were represented in the sample, and only districts that participated in the FFVP and SNAP-Ed through the MCDPH were eligible for inclusion. Further, in schools, a variety of staff members are responsible for coordinating the FFVP. It is possible that we did not capture an adequate variety and number of FFVP personnel to achieve representative views of everyone involved in the organization, preparation and distribution of the FFVP. Finally, kitchen managers’ views of the FFVP were markedly different from those of teachers. Therefore, teachers should have been included as a separate group with a unique set of interview questions that were more specific to the teaching environment.
Next steps All parties that would be involved in a partnership between schools and grocery stores expressed interest and enthusiasm about developing a PPP for cross-promoting fruits and vegetables. Many retailers indicated they were ready to begin immediately. The missing piece is someone to initiate and organize the partnership, a role that fits the purpose and mission of the SNAP-Ed program, which aims to use policy, systems, and environmental changes to promote healthy eating. The Maricopa County SNAP-Ed program is uniquely suited to serve as a liaison between grocery stores and schools in implementation of a partnership and to help disseminate the information to parents. Based on the findings of the current project, we recommend that SNAP-Ed take the following next steps:
1. Create a clearly defined partnership goal. 2. Initiate a pilot program with one of the schools that has been part of the current project
and its closest grocery store.
FFY2017 SNAP-Ed Annual Report 428 January 2018
3. Organize a meeting with district and school level FFVP personnel and retail store and produce managers. Include the school principal and superintendent, if necessary, and, if possible, include one teacher in addition to other school level FFVP personnel.
4. Establish the roles of all involved parties, including: a. How/when the school FFVP schedule will be communicated to stores. b. Types of in-store promotions that will be used; who will be responsible for
creating and funding those promotions. c. How the partnership will be communicated and promoted in schools and to
parents. 5. Determine the optimal method and timing of communication for all involved parties. 6. Maintain ongoing communication among partners and troubleshoot issues as they arise. 7. Based on outcomes after a school year of piloting the program, develop a tool kit for
schools and grocery stores to use in establishing their own partnerships.
FFY2017 SNAP-Ed Annual Report 429 January 2018
REFERENCES
1. US Department of Health and Human Services. Scientific Report of the 2015 Dietary
Guidelines Advisory Committee. Washington (DC): USDA and US Department of Health and Human Services. http://health.gov/dietaryguidelines/2015-scientific-report/PDFs/Scientific-Report-of-the-2015-Dietary-Guidelines-Advisory-Committee.pdf. Accessed August 17, 2015.
2. Jamelske E, Bica LA, McCarty DJ, Meinen A. Preliminary findings from an evaluation of the USDA fresh fruit and vegetable program in Wisconsin schools. Wis Med J. 2008;107(5):225.
3. US Department of Agriculture. Fresh Fruit and Vegetable Program: A Handbook for Schools. 2010; http://www.fns.usda.gov/sites/default/files/handbook.pdf. Accessed August 17, 2015.
4. US Department of Agriculture. Supplemental Nutrition Assistance Program Education Plan Guideance FY 2017. 2015; https://snaped.fns.usda.gov/sites/default/files/uploads/Final FY 2017 SNAP-Ed Plan Guidance 04-04-2016.pdf.
5. Buzby J, Guthrie J, Kantor LS. Evaluation of the USDA Fruit and Vegetable Pilot Program: Report to Congress. Food Assistance & Nutrition Research Program: United States Department of Agriculture; 2012-08-29T17:23:01 2003.
6. Jamelske EM, Bica LA. Impact of the USDA Fresh Fruit and Vegetable Program on Children's Consumption. J Child Nutr Manag. 2012;36(1):n1.
7. Olsho L, Klerman J, Bartlett S, Castellanos-Brown K. Evaluation of the Fresh Fruit and Vegetable Program (FFVP): Interim Evaluation Report. Office of Research and Analysis 2011; http://www.fns.usda.gov/sites/default/files/FFVPInterim_Summary.pdf. Accessed November 23, 2015.
8. Olsho LE, Klerman JA, Ritchie L, Wakimoto P, Webb KL, Bartlett S. Increasing Child Fruit and Vegetable Intake: Findings from the US Department of Agriculture Fresh Fruit and Vegetable Program. J Acad Nutr Diet. 2015(115):1283-1290.
9. Ohri-Vachaspati P, Dachenhaus E, Green J, et al. Can school food programs have a reach beyond schools? American Public Health Assocaition's Annual Meeting and Expo; October 29 - November 2, 2016; Denver, CO. Abstract 359073.
10. Bradlee ML, Singer MR, Qureshi MM, Moore LL. Food group intake and central obesity among children and adolescents in the Third National Health and Nutrition Examination Survey (NHANES III). Public Health Nutr. 2010;13(06):797-805.
11. Cullen KW, Baranowski T, Klesges LM, et al. Anthropometric, Parental, and Psychosocial Correlates of Dietary Intake of African‐American Girls. Obes Res. 2004;12(S9):20S-31S.
12. Roseman MG, Yeung WK, Nickelsen J. Examination of weight status and dietary behaviors of middle school students in Kentucky. J Am Diet Assoc. 2007;107(7):1139-1145.
13. Moore LL, Singer MR, Bradlee ML, et al. Intake of fruits, vegetables, and dairy products in early childhood and subsequent blood pressure change. Epidemiology (Cambridge, Mass). 2005;16(1):4-11.
FFY2017 SNAP-Ed Annual Report 430 January 2018
14. Prentice A, Schoenmakers I, Ann Laskey M, de Bono S, Ginty F, Goldberg GR. Symposium on ‘Nutrition and health in children and adolescents’ Session 1: Nutrition in growth and development Nutrition and bone growth and development. Proc Nutr Soc. 2006;65(04):348-360.
15. Lin B-H. Diet quality usually varies by income status. Amber Waves. 2005;3(4):4–5. 16. Lorson BA, Melgar-Quinonez HR, Taylor CA. Correlates of fruit and vegetable intakes in
US children. J Am Diet Assoc. 2009;109(3):474-478. 17. Birch LL, Fisher JO. Development of eating behaviors among children and adolescents.
Pediatrics. 1998;101(Supplement 2):539-549. 18. Moore LL, Singer MR, Bradlee ML, Daniels SR. Adolescent dietary intakes predict
cardiometabolic risk clustering. European Journal of Nutrition. 2015:1-8. 19. Ferlie E, Lynn L, Pollitt C. The Oxford Handbook of Public Management. New York:
Oxford University Press, Inc.; 2005. 20. Healthy People and Communities - Steering Committee. Discussion Paper: Public-Private
Partnerships with the Food Industry. 2013. Accessed January 11, 2017. 21. Nishtar S. Public – private 'partnerships' in health – a global call to action. Health
Research Policy and Systems. 2004;2:5-5. 22. Produce for Better Health Foundation and Centers for Disease Control and Prevention.
Fruits and Veggies More Matters. http://www.fruitsandveggiesmorematters.org/. Accessed November 3, 2016.
23. Chef Ann Foundation. Let's Move Salad Bars to Schools. http://www.saladbars2schools.org/about-us/. Accessed July 21, 2016.
24. United States Department of Agriculture. Fresh Fruit and Vegetable Program. 2013; http://www.fns.usda.gov/sites/default/files/FFVPFactSheet.pdf. Accessed August 17, 2015.
25. Arizona Department of Education. Fresh Fruit and Vegetable Program. 2016; http://www.azed.gov/health-nutrition/fresh-fruit-program/. Accessed August 1, 2016.
26. Ohri-Vachaspati P. Parental perception of the nutritional quality of school meals and its association with students’ school lunch participation. Appetite. 2014;74:44-47.
27. Bartlett S, Olsho L, Klerman J, et al. Evaluation of the fresh fruit and vegetable program (FFVP): final evaluation report. Prepared by Abt Associates under contract no. AG-3198-D-09-0053. Alexandria, VA: US Department of Agriculture, Food and Nutrition Service;2013.
28. Dachenhaus E. Associations between Fresh Fruit and Vegetable Program Participation and Students' Home Food Environment and Faimly Food Shopping Practices: A Student's Perspective. [master's thesis]. Phoenix, AZ: Arizona State University. 2015.
29. Mollner K. Associations between Fresh Fruit and Vegetable Program Participants and Students' Home Food Environment and Family Food Shopping Practices. [master's thesis]. Phoenix, AZ: Arizona State University. 2015.
30. Pimenta E. Personal Communication with Ellen Pimental, School Foods Director Arizona Phoenix, AZ 2014.
31. Concannon K. Personal Communication with USDA Undersecretary Kevin Concannon. Phoenix, AZ 2014.
FFY2017 SNAP-Ed Annual Report 431 January 2018
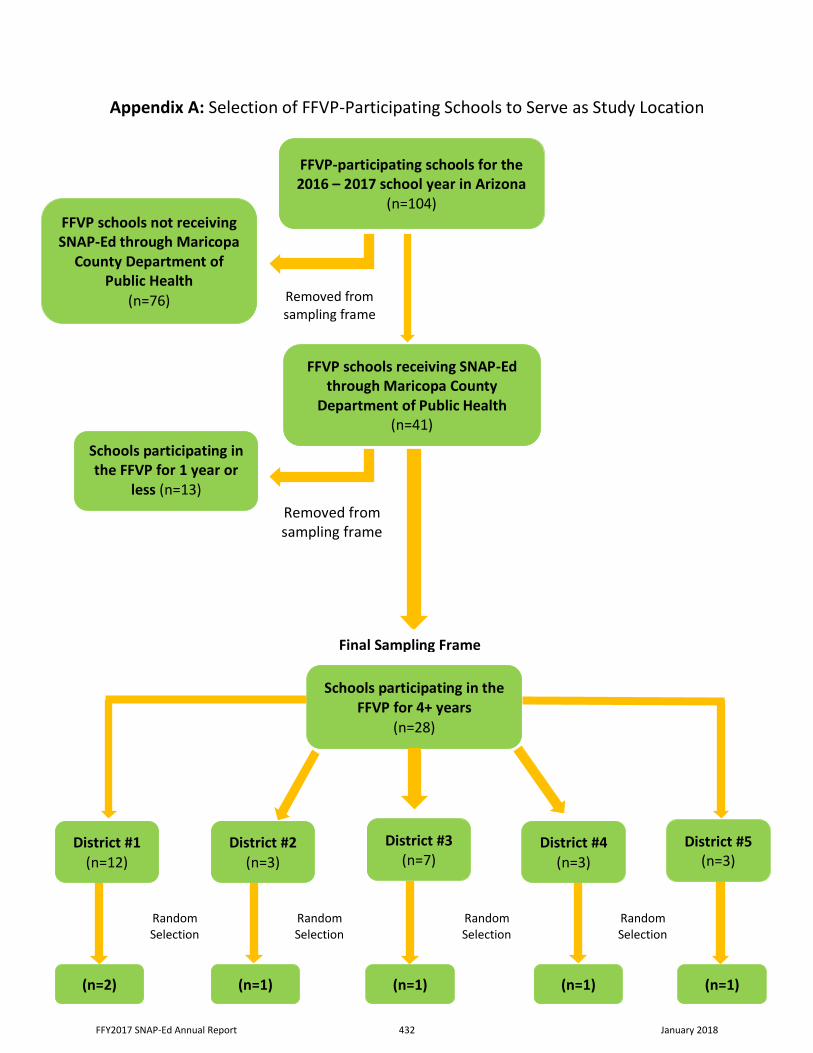
Appendix A: Selection of FFVP-Participating Schools to Serve as Study Location
District #3 (n=7)
FFVP-participating schools for the 2016 – 2017 school year in Arizona
(n=104)
FFVP schools receiving SNAP-Ed through Maricopa County
Department of Public Health (n=41)
FFVP schools not receiving SNAP-Ed through Maricopa
County Department of Public Health
(n=76)
Schools participating in the FFVP for 4+ years
(n=28)
Removed from sampling frame
Removed from sampling frame
Schools participating in the FFVP for 1 year or
less (n=13) (n=13)
Final Sampling Frame
(n=2)
Random Selection
(n=1) (n=1) (n=1) (n=1)
District #1 (n=12)
District #2 (n=3)
District #4 (n=3)
District #5 (n=3)
Random Selection
Random Selection
Random Selection
FFY2017 SNAP-Ed Annual Report 432 January 2018
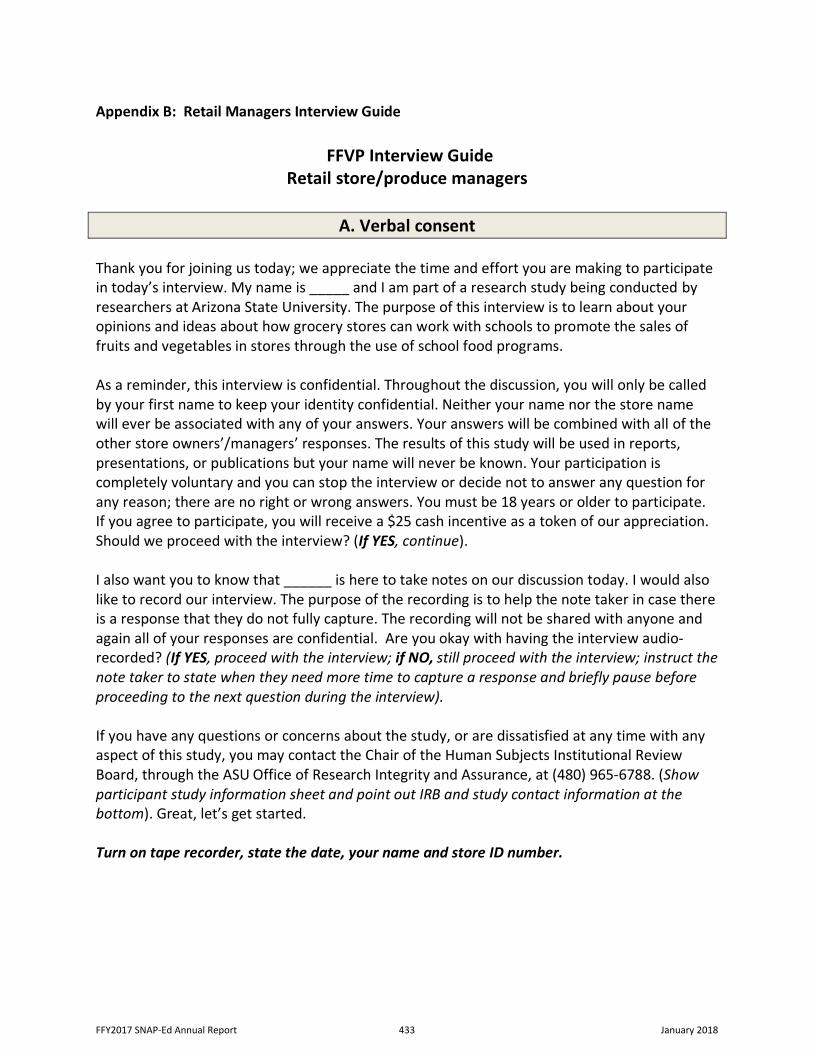
Appendix B: Retail Managers Interview Guide
FFVP Interview Guide Retail store/produce managers
A. Verbal consent
Thank you for joining us today; we appreciate the time and effort you are making to participate in today’s interview. My name is _____ and I am part of a research study being conducted by researchers at Arizona State University. The purpose of this interview is to learn about your opinions and ideas about how grocery stores can work with schools to promote the sales of fruits and vegetables in stores through the use of school food programs. As a reminder, this interview is confidential. Throughout the discussion, you will only be called by your first name to keep your identity confidential. Neither your name nor the store name will ever be associated with any of your answers. Your answers will be combined with all of the other store owners’/managers’ responses. The results of this study will be used in reports, presentations, or publications but your name will never be known. Your participation is completely voluntary and you can stop the interview or decide not to answer any question for any reason; there are no right or wrong answers. You must be 18 years or older to participate. If you agree to participate, you will receive a $25 cash incentive as a token of our appreciation. Should we proceed with the interview? (If YES, continue). I also want you to know that ______ is here to take notes on our discussion today. I would also like to record our interview. The purpose of the recording is to help the note taker in case there is a response that they do not fully capture. The recording will not be shared with anyone and again all of your responses are confidential. Are you okay with having the interview audio-recorded? (If YES, proceed with the interview; if NO, still proceed with the interview; instruct the note taker to state when they need more time to capture a response and briefly pause before proceeding to the next question during the interview). If you have any questions or concerns about the study, or are dissatisfied at any time with any aspect of this study, you may contact the Chair of the Human Subjects Institutional Review Board, through the ASU Office of Research Integrity and Assurance, at (480) 965-6788. (Show participant study information sheet and point out IRB and study contact information at the bottom). Great, let’s get started. Turn on tape recorder, state the date, your name and store ID number.
FFY2017 SNAP-Ed Annual Report 433 January 2018
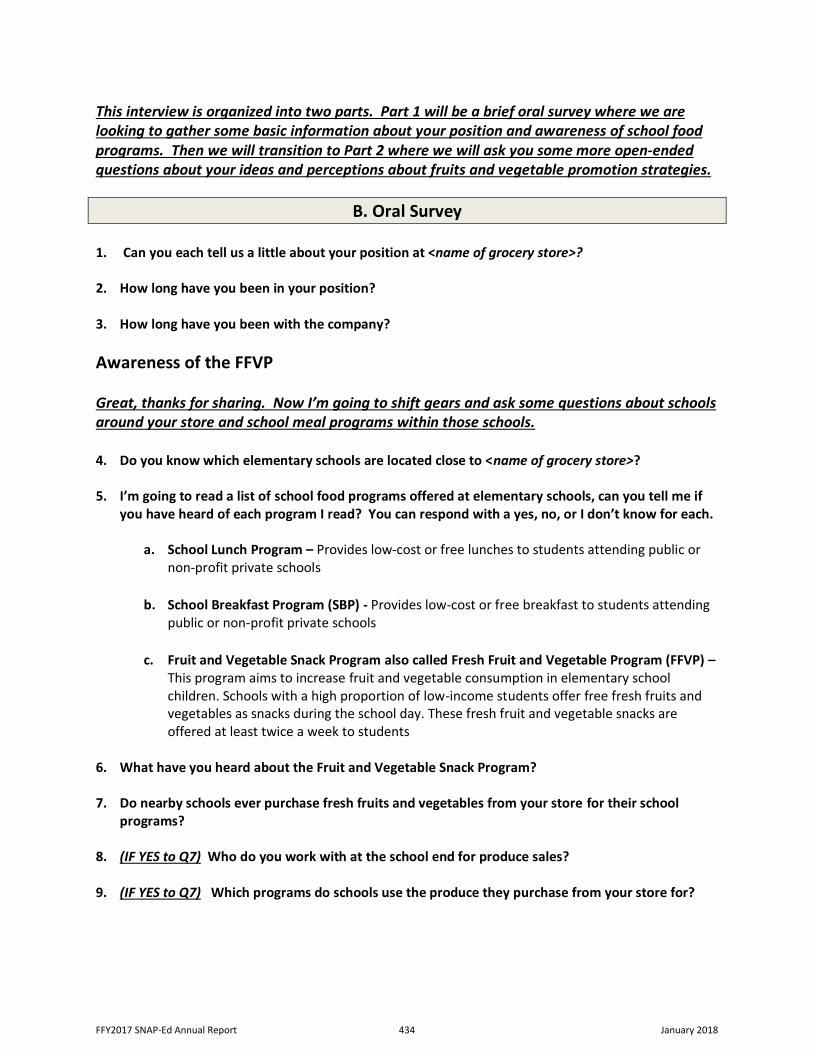
This interview is organized into two parts. Part 1 will be a brief oral survey where we are looking to gather some basic information about your position and awareness of school food programs. Then we will transition to Part 2 where we will ask you some more open-ended questions about your ideas and perceptions about fruits and vegetable promotion strategies.
B. Oral Survey 1. Can you each tell us a little about your position at <name of grocery store>? 2. How long have you been in your position? 3. How long have you been with the company?
Awareness of the FFVP Great, thanks for sharing. Now I’m going to shift gears and ask some questions about schools around your store and school meal programs within those schools. 4. Do you know which elementary schools are located close to <name of grocery store>?
5. I’m going to read a list of school food programs offered at elementary schools, can you tell me if
you have heard of each program I read? You can respond with a yes, no, or I don’t know for each.
a. School Lunch Program – Provides low-cost or free lunches to students attending public or non-profit private schools
b. School Breakfast Program (SBP) - Provides low-cost or free breakfast to students attending public or non-profit private schools
c. Fruit and Vegetable Snack Program also called Fresh Fruit and Vegetable Program (FFVP) – This program aims to increase fruit and vegetable consumption in elementary school children. Schools with a high proportion of low-income students offer free fresh fruits and vegetables as snacks during the school day. These fresh fruit and vegetable snacks are offered at least twice a week to students
6. What have you heard about the Fruit and Vegetable Snack Program? 7. Do nearby schools ever purchase fresh fruits and vegetables from your store for their school
programs? 8. (IF YES to Q7) Who do you work with at the school end for produce sales? 9. (IF YES to Q7) Which programs do schools use the produce they purchase from your store for?
FFY2017 SNAP-Ed Annual Report 434 January 2018
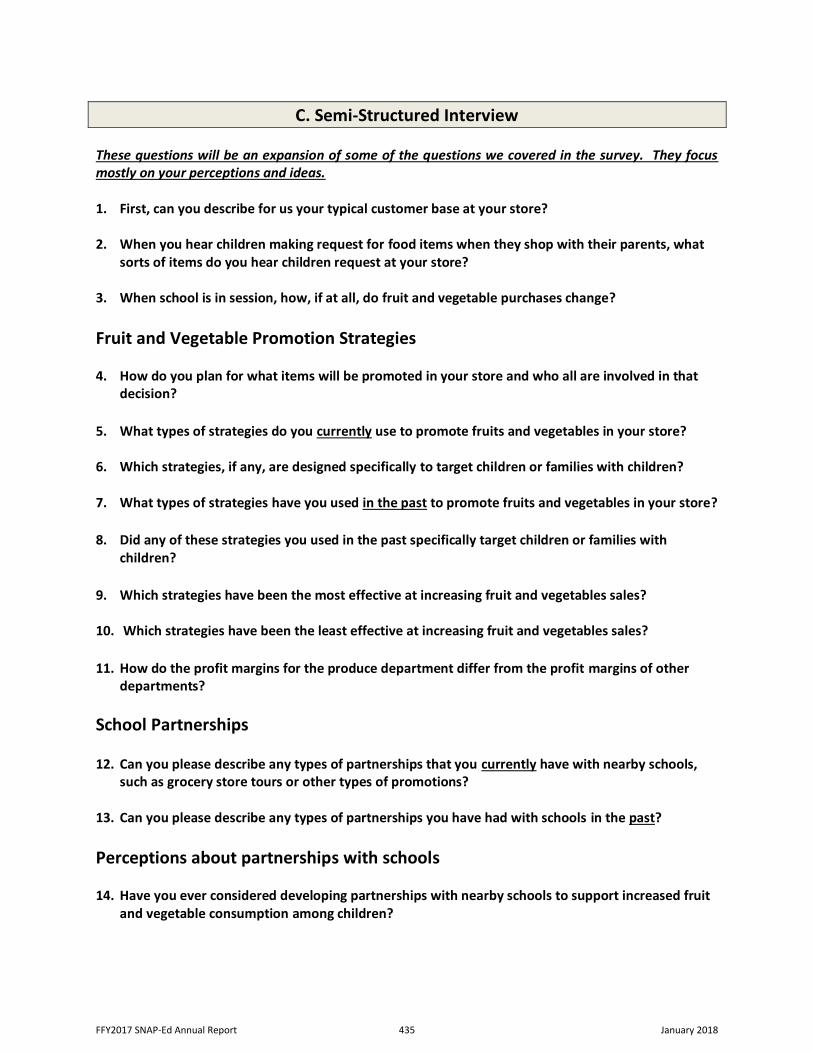
C. Semi-Structured Interview These questions will be an expansion of some of the questions we covered in the survey. They focus mostly on your perceptions and ideas. 1. First, can you describe for us your typical customer base at your store? 2. When you hear children making request for food items when they shop with their parents, what
sorts of items do you hear children request at your store? 3. When school is in session, how, if at all, do fruit and vegetable purchases change? Fruit and Vegetable Promotion Strategies 4. How do you plan for what items will be promoted in your store and who all are involved in that
decision?
5. What types of strategies do you currently use to promote fruits and vegetables in your store?
6. Which strategies, if any, are designed specifically to target children or families with children? 7. What types of strategies have you used in the past to promote fruits and vegetables in your store?
8. Did any of these strategies you used in the past specifically target children or families with
children?
9. Which strategies have been the most effective at increasing fruit and vegetables sales? 10. Which strategies have been the least effective at increasing fruit and vegetables sales?
11. How do the profit margins for the produce department differ from the profit margins of other
departments? School Partnerships 12. Can you please describe any types of partnerships that you currently have with nearby schools,
such as grocery store tours or other types of promotions? 13. Can you please describe any types of partnerships you have had with schools in the past? Perceptions about partnerships with schools 14. Have you ever considered developing partnerships with nearby schools to support increased fruit
and vegetable consumption among children?
FFY2017 SNAP-Ed Annual Report 435 January 2018
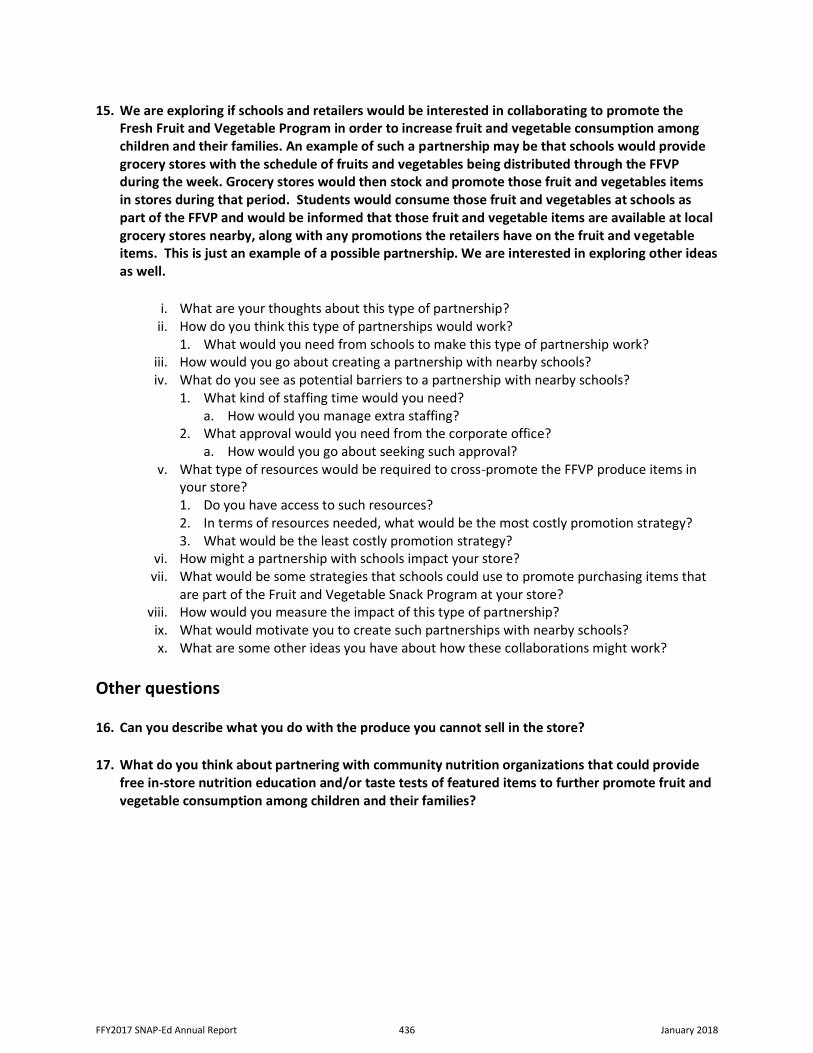
15. We are exploring if schools and retailers would be interested in collaborating to promote the Fresh Fruit and Vegetable Program in order to increase fruit and vegetable consumption among children and their families. An example of such a partnership may be that schools would provide grocery stores with the schedule of fruits and vegetables being distributed through the FFVP during the week. Grocery stores would then stock and promote those fruit and vegetables items in stores during that period. Students would consume those fruit and vegetables at schools as part of the FFVP and would be informed that those fruit and vegetable items are available at local grocery stores nearby, along with any promotions the retailers have on the fruit and vegetable items. This is just an example of a possible partnership. We are interested in exploring other ideas as well.
i. What are your thoughts about this type of partnership?
ii. How do you think this type of partnerships would work? 1. What would you need from schools to make this type of partnership work?
iii. How would you go about creating a partnership with nearby schools? iv. What do you see as potential barriers to a partnership with nearby schools?
1. What kind of staffing time would you need? a. How would you manage extra staffing?
2. What approval would you need from the corporate office? a. How would you go about seeking such approval?
v. What type of resources would be required to cross-promote the FFVP produce items in your store? 1. Do you have access to such resources? 2. In terms of resources needed, what would be the most costly promotion strategy? 3. What would be the least costly promotion strategy?
vi. How might a partnership with schools impact your store? vii. What would be some strategies that schools could use to promote purchasing items that
are part of the Fruit and Vegetable Snack Program at your store? viii. How would you measure the impact of this type of partnership?
ix. What would motivate you to create such partnerships with nearby schools? x. What are some other ideas you have about how these collaborations might work?
Other questions 16. Can you describe what you do with the produce you cannot sell in the store?
17. What do you think about partnering with community nutrition organizations that could provide
free in-store nutrition education and/or taste tests of featured items to further promote fruit and vegetable consumption among children and their families?
FFY2017 SNAP-Ed Annual Report 436 January 2018
D. Closing Well, that brings us to the end of all my questions. If you could just give me a few minutes to make sure we captured everything we needed to. Moderator checks with note taker to and list of questions to make sure everything has been asked and recorded properly. Thank you for sharing your time and providing such valuable information. Our study team is extremely grateful for your participation in the study. Before I leave, is there anything else you would like to share with us today? Are there any questions you would like to ask us? I have left you with my name and the study team’s contact information. If you think of something later that you would like to add to what was discussed today OR if you have a question that you’d like to ask us, please feel free to contact us. Your name will not be connected with any answers or comments you have given today or may give in the future. As a gesture of our appreciation for your participation, we have a $25 cash incentive for each of you. Thank you so much again! Turn off tape recorder.
FFY2017 SNAP-Ed Annual Report 437 January 2018
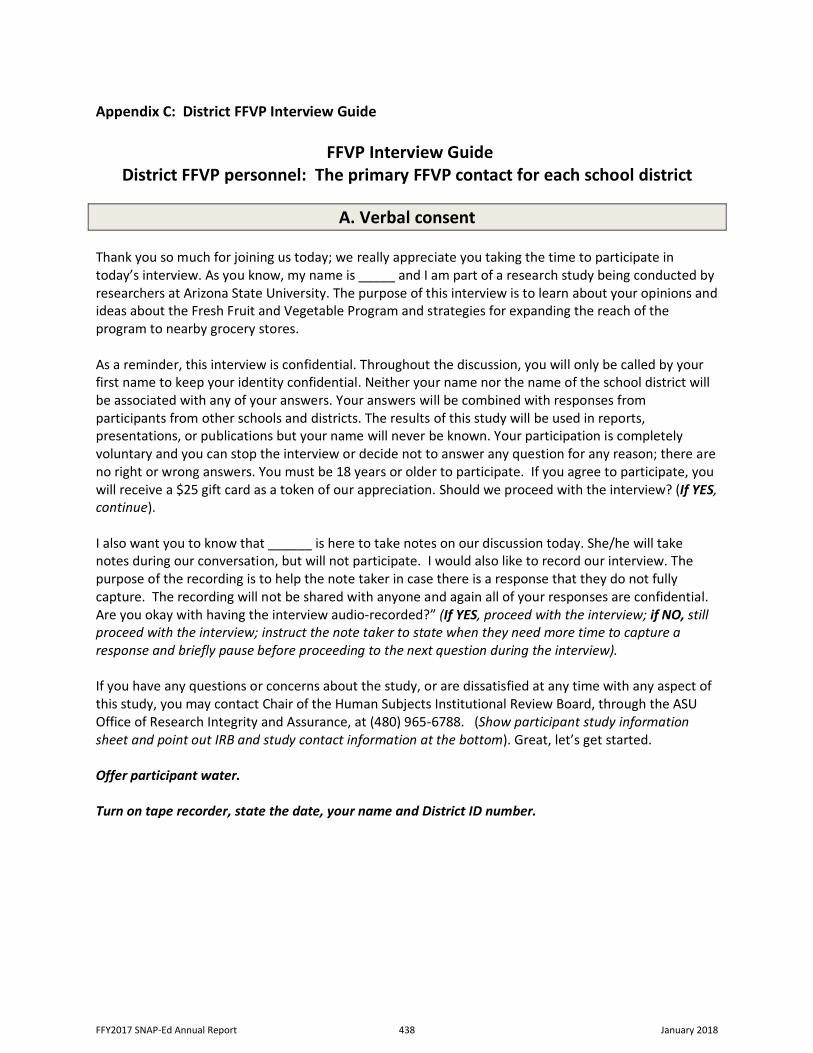
Appendix C: District FFVP Interview Guide
FFVP Interview Guide District FFVP personnel: The primary FFVP contact for each school district
A. Verbal consent Thank you so much for joining us today; we really appreciate you taking the time to participate in today’s interview. As you know, my name is _____ and I am part of a research study being conducted by researchers at Arizona State University. The purpose of this interview is to learn about your opinions and ideas about the Fresh Fruit and Vegetable Program and strategies for expanding the reach of the program to nearby grocery stores. As a reminder, this interview is confidential. Throughout the discussion, you will only be called by your first name to keep your identity confidential. Neither your name nor the name of the school district will be associated with any of your answers. Your answers will be combined with responses from participants from other schools and districts. The results of this study will be used in reports, presentations, or publications but your name will never be known. Your participation is completely voluntary and you can stop the interview or decide not to answer any question for any reason; there are no right or wrong answers. You must be 18 years or older to participate. If you agree to participate, you will receive a $25 gift card as a token of our appreciation. Should we proceed with the interview? (If YES, continue). I also want you to know that ______ is here to take notes on our discussion today. She/he will take notes during our conversation, but will not participate. I would also like to record our interview. The purpose of the recording is to help the note taker in case there is a response that they do not fully capture. The recording will not be shared with anyone and again all of your responses are confidential. Are you okay with having the interview audio-recorded?” (If YES, proceed with the interview; if NO, still proceed with the interview; instruct the note taker to state when they need more time to capture a response and briefly pause before proceeding to the next question during the interview). If you have any questions or concerns about the study, or are dissatisfied at any time with any aspect of this study, you may contact Chair of the Human Subjects Institutional Review Board, through the ASU Office of Research Integrity and Assurance, at (480) 965-6788. (Show participant study information sheet and point out IRB and study contact information at the bottom). Great, let’s get started. Offer participant water. Turn on tape recorder, state the date, your name and District ID number.
FFY2017 SNAP-Ed Annual Report 438 January 2018
Current efforts to promote fruits and vegetables
1. What strategies do elementary schools in your district currently use to promote fruit and vegetable consumption?
2. What strategies have schools in your district used in the past to promote fruit and vegetable
consumption?
3. (If past strategies mentioned (Q1) are not currently being offered (response from Q2) then ask):
I heard you say that _________strategy (strategies) was used in the past but is not currently being used for fruit and vegetable consumption. Can you describe some of the reasons that schools in your district are not continuing to use this as a strategy?
4. Which strategies, in your opinion, are the most effective for promoting fruit and vegetable consumption to elementary school kids in your district?
5. Which strategies, in your opinion, are the least effective in promoting fruit and vegetable
consumption to elementary school kids in your district?
6. Tell me how the Fresh Fruit and Vegetable Program is typically carried out in schools in your district.
7. How does the implementation of the FFVP vary among elementary schools participating in the
FFVP in your district?
8. How does the implementation of the FFVP differ by grade levels within schools? 9. Describe the level of support or buy-in that school administrators, such as principals or other
staff members, and teachers have for the FFVP?
10. Can you describe types of educational activities, if any, that teachers incorporate around the FFVP in their classrooms?
11. Can you describe any instances where someone at the district or at the school level had to
shop at a nearby grocery store for produce items if you were, for example, running low on certain fruit and vegetable items for the FFVP?
12. How do you think left over produce from the FFVP could be used?
13. How is the Maricopa County SNAP-Ed program used to promote fruits and vegetables within elementary schools?
14. How does SNAP-Ed work with the Fresh Fruit and Vegetable Program?
FFY2017 SNAP-Ed Annual Report 439 January 2018
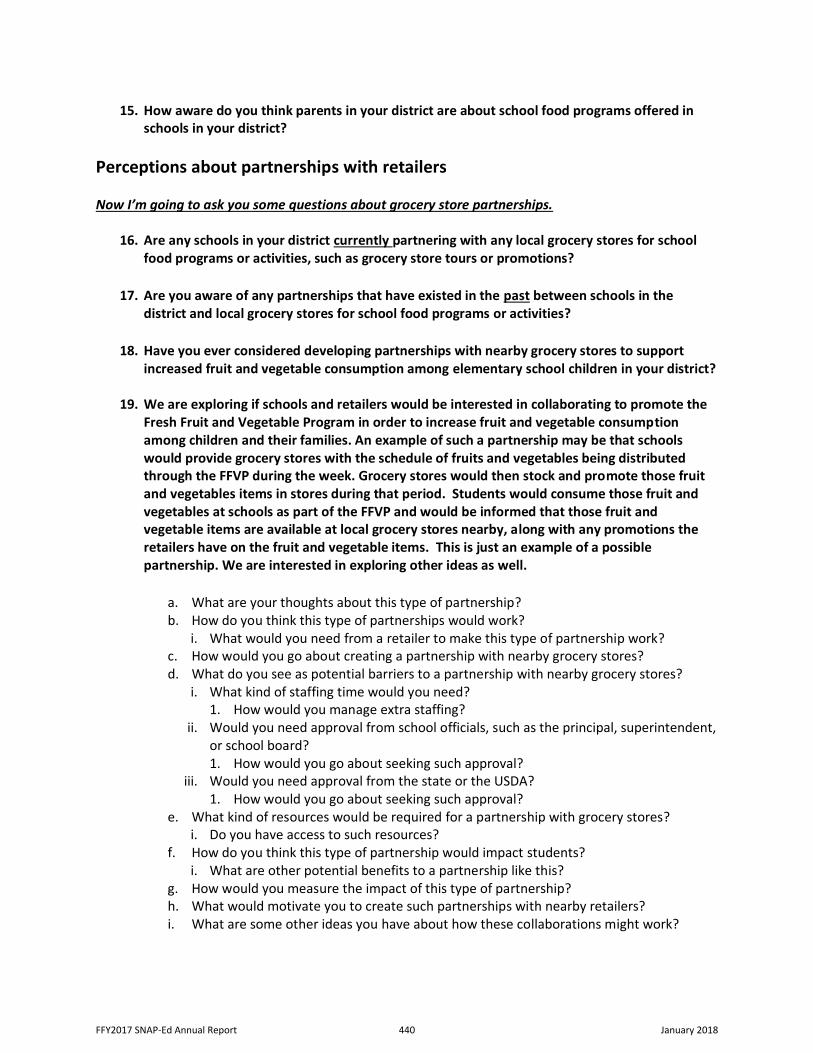
15. How aware do you think parents in your district are about school food programs offered in schools in your district?
Perceptions about partnerships with retailers Now I’m going to ask you some questions about grocery store partnerships.
16. Are any schools in your district currently partnering with any local grocery stores for school food programs or activities, such as grocery store tours or promotions?
17. Are you aware of any partnerships that have existed in the past between schools in the
district and local grocery stores for school food programs or activities?
18. Have you ever considered developing partnerships with nearby grocery stores to support increased fruit and vegetable consumption among elementary school children in your district?
19. We are exploring if schools and retailers would be interested in collaborating to promote the
Fresh Fruit and Vegetable Program in order to increase fruit and vegetable consumption among children and their families. An example of such a partnership may be that schools would provide grocery stores with the schedule of fruits and vegetables being distributed through the FFVP during the week. Grocery stores would then stock and promote those fruit and vegetables items in stores during that period. Students would consume those fruit and vegetables at schools as part of the FFVP and would be informed that those fruit and vegetable items are available at local grocery stores nearby, along with any promotions the retailers have on the fruit and vegetable items. This is just an example of a possible partnership. We are interested in exploring other ideas as well.
a. What are your thoughts about this type of partnership? b. How do you think this type of partnerships would work?
i. What would you need from a retailer to make this type of partnership work? c. How would you go about creating a partnership with nearby grocery stores? d. What do you see as potential barriers to a partnership with nearby grocery stores?
i. What kind of staffing time would you need? 1. How would you manage extra staffing?
ii. Would you need approval from school officials, such as the principal, superintendent, or school board? 1. How would you go about seeking such approval?
iii. Would you need approval from the state or the USDA? 1. How would you go about seeking such approval?
e. What kind of resources would be required for a partnership with grocery stores? i. Do you have access to such resources?
f. How do you think this type of partnership would impact students? i. What are other potential benefits to a partnership like this?
g. How would you measure the impact of this type of partnership? h. What would motivate you to create such partnerships with nearby retailers? i. What are some other ideas you have about how these collaborations might work?
FFY2017 SNAP-Ed Annual Report 440 January 2018
j. How do you think you could use the Maricopa County SNAP-Ed program to create linkages between schools and food retailers? i. How do you feel about working with Maricopa County SNAP-Ed for this idea?
20. How would you describe your experience with the Fresh Fruit and Vegetable Program?
21. In your opinion, what types of support the can Maricopa County SNAP-Ed program provide to
school food programs and local wellness policy efforts in your school district?
B. Closing Well, that brings us to the end of all my questions. If you could just give me a few minutes to make sure we captured everything we needed to. Moderator checks with note taker to and list of questions to make sure everything has been asked and recorded properly. Would it be possible to get a copy of the FFVP schedule you are using for this school year? Would it be possible to observe the FFVP program in some schools in your district? If needed, would you be willing to let us interview additional FFVP staff members, from schools other than the ones we previously mentioned? Thank you for sharing your time and providing such valuable information. Our study team is extremely grateful for your participation in the study. Before I leave, is there anything else you would like to share with us today? Are there any questions you would like to ask us? I have left you with my name and the study team’s contact information. If you think of something later that you would like to add to what was discussed today OR if you have a question that you’d like to ask us, please feel free to contact us. Your name will not be connected with any answers or comments you have given today or may give in the future. As a gesture of our appreciation for your participation, we have a $25 VISA gift card for you. Thank you so much again! Turn off tape recorder.
FFY2017 SNAP-Ed Annual Report 441 January 2018
Appendix D: School FFVP Interview Guide
FFVP Interview Guide School FFVP personnel: The primary FFVP contact for each school
A. Verbal consent Thank you for joining us today; we appreciate the time and effort you are making to participate in today’s interview. My name is _____ and I am part of a research study being conducted by researchers at Arizona State University. The purpose of this interview is to learn about your opinions and ideas about the Fresh Fruit and Vegetable Program and strategies for expanding the reach of the program to nearby grocery stores. As a reminder, this interview is confidential. Throughout the discussion, you will only be called by your first name to keep your identity confidential. Neither your name nor the name of the school will be associated with any of your answers. Your answers will be combined with responses from participants from other schools and districts. The results of this study will be used in reports, presentations, or publications but your name will never be known. Your participation is completely voluntary and you can stop the interview or decide not to answer any question for any reason; there are no right or wrong answers. You must be 18 years or older to participate. If you agree to participate, you will receive a $25 gift card as a token of our appreciation. Should we proceed with the interview? (If YES, continue).
I also want you to know that ______ is here to take notes on our discussion today. She/he will take notes during our conversation, but will not participate. I would also like to record our interview. The purpose of the recording is to help the note taker in case there is a response that they do not fully capture. The recording will not be shared with anyone and again all of your responses are confidential. Are you okay with having the interview audio-recorded?” (If YES, proceed with the interview; if NO, still proceed with the interview; instruct the note taker to state when they need more time to capture a response and briefly pause before proceeding to the next question during the interview). If you have any questions or concerns about the study, or are dissatisfied at any time with any aspect of this study, you may contact Chair of the Human Subjects Institutional Review Board, through the ASU Office of Research Integrity and Assurance, at (480) 965-6788. (Show participant study information sheet and point out IRB and study contact information at the bottom). Great, let’s get started. Turn on tape recorder, state the date, your name and school ID number.
FFY2017 SNAP-Ed Annual Report 442 January 2018
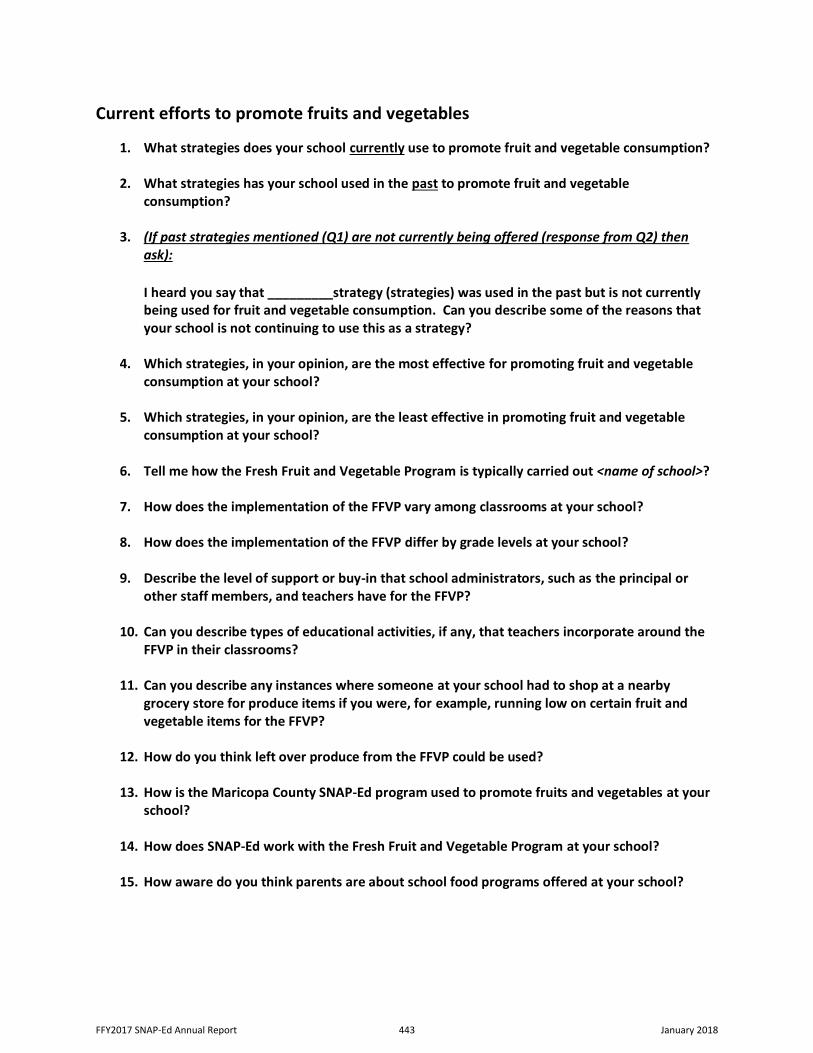
Current efforts to promote fruits and vegetables
1. What strategies does your school currently use to promote fruit and vegetable consumption?
2. What strategies has your school used in the past to promote fruit and vegetable consumption?
3. (If past strategies mentioned (Q1) are not currently being offered (response from Q2) then ask):
I heard you say that _________strategy (strategies) was used in the past but is not currently being used for fruit and vegetable consumption. Can you describe some of the reasons that your school is not continuing to use this as a strategy?
4. Which strategies, in your opinion, are the most effective for promoting fruit and vegetable consumption at your school?
5. Which strategies, in your opinion, are the least effective in promoting fruit and vegetable
consumption at your school?
6. Tell me how the Fresh Fruit and Vegetable Program is typically carried out <name of school>?
7. How does the implementation of the FFVP vary among classrooms at your school?
8. How does the implementation of the FFVP differ by grade levels at your school? 9. Describe the level of support or buy-in that school administrators, such as the principal or
other staff members, and teachers have for the FFVP?
10. Can you describe types of educational activities, if any, that teachers incorporate around the FFVP in their classrooms?
11. Can you describe any instances where someone at your school had to shop at a nearby
grocery store for produce items if you were, for example, running low on certain fruit and vegetable items for the FFVP?
12. How do you think left over produce from the FFVP could be used?
13. How is the Maricopa County SNAP-Ed program used to promote fruits and vegetables at your school?
14. How does SNAP-Ed work with the Fresh Fruit and Vegetable Program at your school?
15. How aware do you think parents are about school food programs offered at your school?
FFY2017 SNAP-Ed Annual Report 443 January 2018
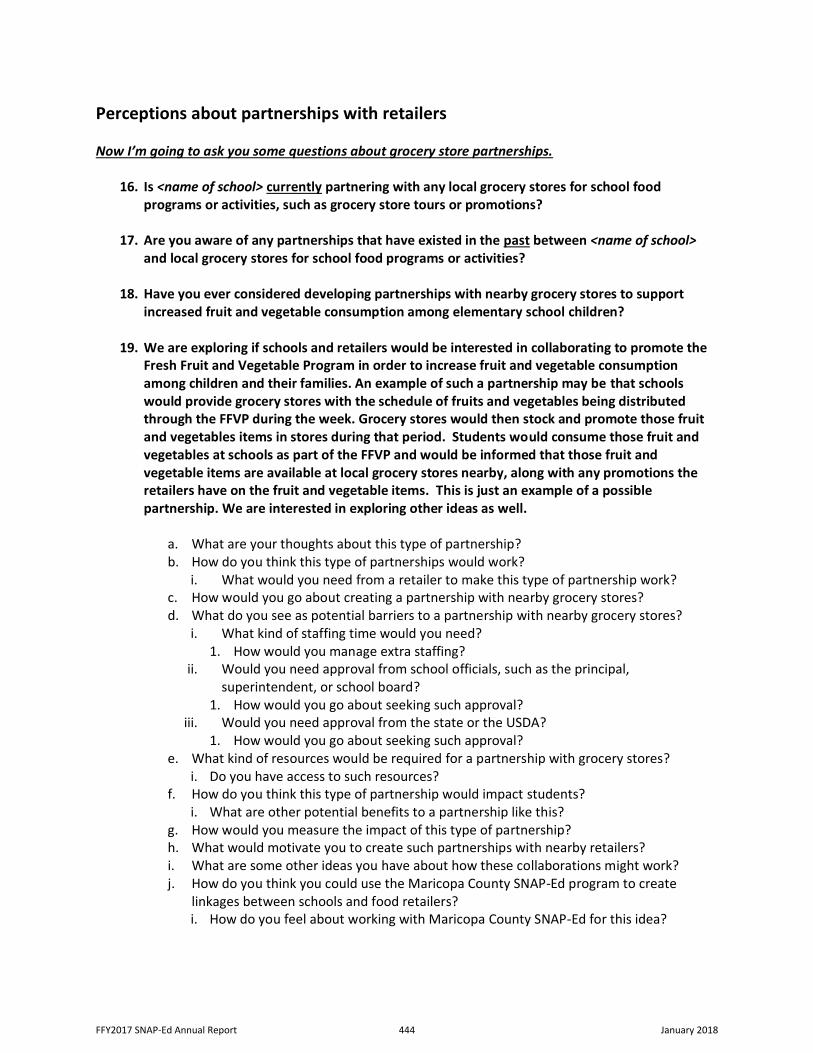
Perceptions about partnerships with retailers Now I’m going to ask you some questions about grocery store partnerships.
16. Is <name of school> currently partnering with any local grocery stores for school food programs or activities, such as grocery store tours or promotions?
17. Are you aware of any partnerships that have existed in the past between <name of school>
and local grocery stores for school food programs or activities?
18. Have you ever considered developing partnerships with nearby grocery stores to support increased fruit and vegetable consumption among elementary school children?
19. We are exploring if schools and retailers would be interested in collaborating to promote the
Fresh Fruit and Vegetable Program in order to increase fruit and vegetable consumption among children and their families. An example of such a partnership may be that schools would provide grocery stores with the schedule of fruits and vegetables being distributed through the FFVP during the week. Grocery stores would then stock and promote those fruit and vegetables items in stores during that period. Students would consume those fruit and vegetables at schools as part of the FFVP and would be informed that those fruit and vegetable items are available at local grocery stores nearby, along with any promotions the retailers have on the fruit and vegetable items. This is just an example of a possible partnership. We are interested in exploring other ideas as well.
a. What are your thoughts about this type of partnership? b. How do you think this type of partnerships would work?
i. What would you need from a retailer to make this type of partnership work? c. How would you go about creating a partnership with nearby grocery stores? d. What do you see as potential barriers to a partnership with nearby grocery stores?
i. What kind of staffing time would you need? 1. How would you manage extra staffing?
ii. Would you need approval from school officials, such as the principal, superintendent, or school board?
1. How would you go about seeking such approval? iii. Would you need approval from the state or the USDA?
1. How would you go about seeking such approval? e. What kind of resources would be required for a partnership with grocery stores?
i. Do you have access to such resources? f. How do you think this type of partnership would impact students?
i. What are other potential benefits to a partnership like this? g. How would you measure the impact of this type of partnership? h. What would motivate you to create such partnerships with nearby retailers? i. What are some other ideas you have about how these collaborations might work? j. How do you think you could use the Maricopa County SNAP-Ed program to create
linkages between schools and food retailers? i. How do you feel about working with Maricopa County SNAP-Ed for this idea?
FFY2017 SNAP-Ed Annual Report 444 January 2018
20. How would you describe your experience with the Fresh Fruit and Vegetable Program?
21. In your opinion, what types of support the can Maricopa County SNAP-Ed program provide to school food programs and local wellness policy efforts at your school?
B. Closing Well, that brings us to the end of all my questions. If you could just give me a few minutes to make sure we captured everything we needed to. Moderator checks with note taker to and list of questions to make sure everything has been asked and recorded properly. Would it be possible to observe the FFVP program at your school? Thank you for sharing your time and providing such valuable information. Our study team is extremely grateful for your participation in the study. Before I leave, is there anything else you would like to share with us today? Are there any questions you would like to ask us? I have left you with my name and the study team’s contact information. If you think of something later that you would like to add to what was discussed today OR if you have a question that you’d like to ask us, please feel free to contact us. Your name will not be connected with any answers or comments you have given today or may give in the future. As a gesture of our appreciation for your participation, we have a $25 VISA gift card for you. Thank you so much again! Turn off tape recorder.
FFY2017 SNAP-Ed Annual Report 445 January 2018
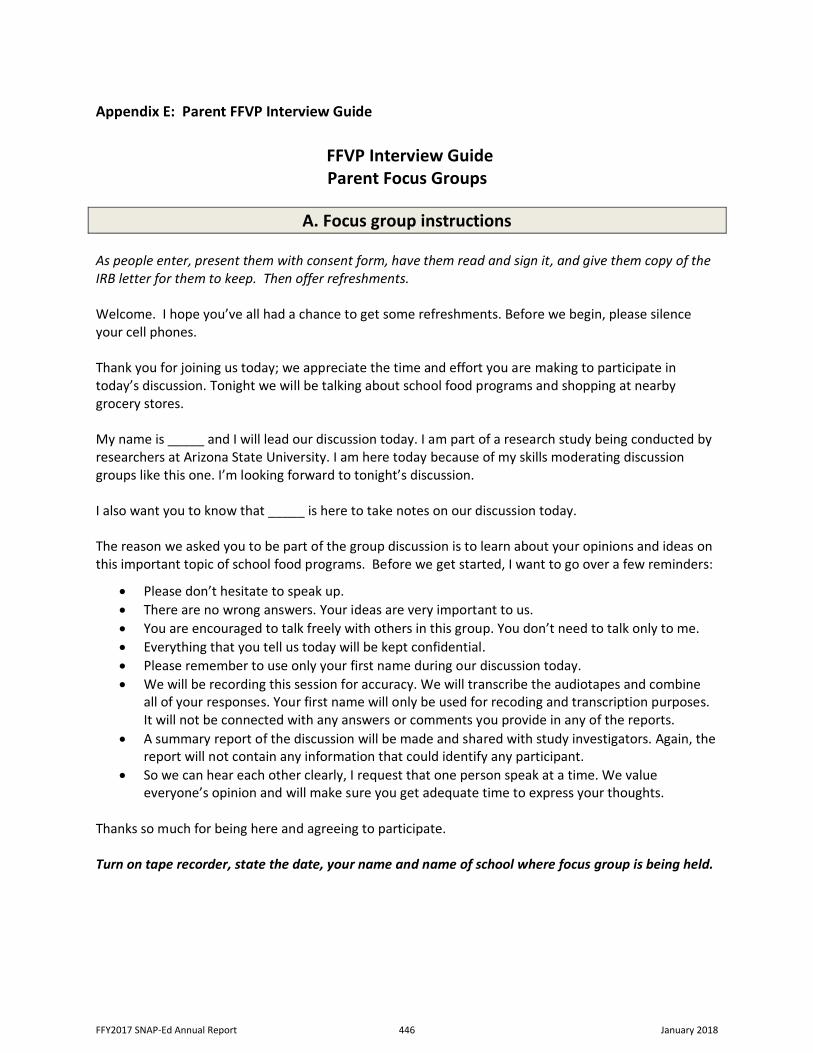
Appendix E: Parent FFVP Interview Guide
FFVP Interview Guide Parent Focus Groups
A. Focus group instructions As people enter, present them with consent form, have them read and sign it, and give them copy of the IRB letter for them to keep. Then offer refreshments. Welcome. I hope you’ve all had a chance to get some refreshments. Before we begin, please silence your cell phones. Thank you for joining us today; we appreciate the time and effort you are making to participate in today’s discussion. Tonight we will be talking about school food programs and shopping at nearby grocery stores. My name is _____ and I will lead our discussion today. I am part of a research study being conducted by researchers at Arizona State University. I am here today because of my skills moderating discussion groups like this one. I’m looking forward to tonight’s discussion. I also want you to know that _____ is here to take notes on our discussion today. The reason we asked you to be part of the group discussion is to learn about your opinions and ideas on this important topic of school food programs. Before we get started, I want to go over a few reminders:
• Please don’t hesitate to speak up.
• There are no wrong answers. Your ideas are very important to us.
• You are encouraged to talk freely with others in this group. You don’t need to talk only to me.
• Everything that you tell us today will be kept confidential.
• Please remember to use only your first name during our discussion today.
• We will be recording this session for accuracy. We will transcribe the audiotapes and combine all of your responses. Your first name will only be used for recoding and transcription purposes. It will not be connected with any answers or comments you provide in any of the reports.
• A summary report of the discussion will be made and shared with study investigators. Again, the report will not contain any information that could identify any participant.
• So we can hear each other clearly, I request that one person speak at a time. We value everyone’s opinion and will make sure you get adequate time to express your thoughts.
Thanks so much for being here and agreeing to participate. Turn on tape recorder, state the date, your name and name of school where focus group is being held.
FFY2017 SNAP-Ed Annual Report 446 January 2018
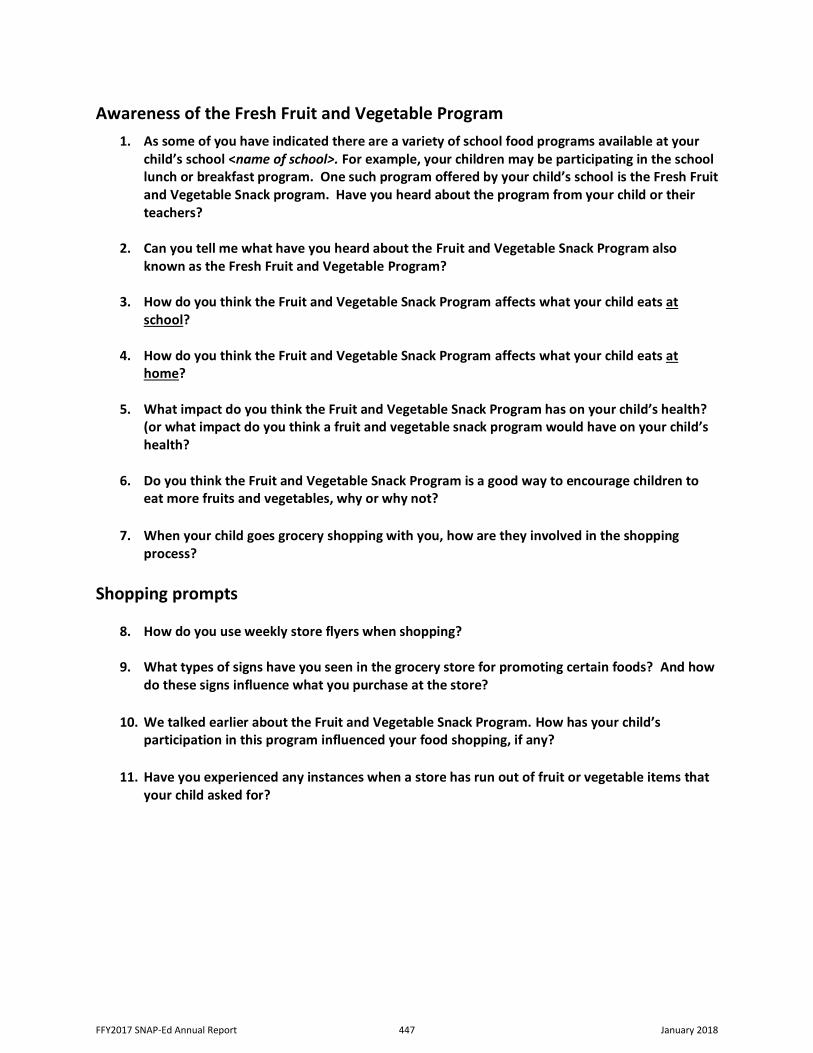
Awareness of the Fresh Fruit and Vegetable Program 1. As some of you have indicated there are a variety of school food programs available at your
child’s school <name of school>. For example, your children may be participating in the school lunch or breakfast program. One such program offered by your child’s school is the Fresh Fruit and Vegetable Snack program. Have you heard about the program from your child or their teachers?
2. Can you tell me what have you heard about the Fruit and Vegetable Snack Program also
known as the Fresh Fruit and Vegetable Program?
3. How do you think the Fruit and Vegetable Snack Program affects what your child eats at school?
4. How do you think the Fruit and Vegetable Snack Program affects what your child eats at
home?
5. What impact do you think the Fruit and Vegetable Snack Program has on your child’s health? (or what impact do you think a fruit and vegetable snack program would have on your child’s health?
6. Do you think the Fruit and Vegetable Snack Program is a good way to encourage children to
eat more fruits and vegetables, why or why not?
7. When your child goes grocery shopping with you, how are they involved in the shopping process?
Shopping prompts
8. How do you use weekly store flyers when shopping?
9. What types of signs have you seen in the grocery store for promoting certain foods? And how do these signs influence what you purchase at the store?
10. We talked earlier about the Fruit and Vegetable Snack Program. How has your child’s participation in this program influenced your food shopping, if any?
11. Have you experienced any instances when a store has run out of fruit or vegetable items that your child asked for?
FFY2017 SNAP-Ed Annual Report 447 January 2018
Views on cross-promotion between schools and retail
12. What do you think about the idea of grocery stores near your child’s school promoting the fruits or vegetables in the store that your children try at school as part of the Fruit and Vegetable Snack Program each week? For example, tagging fruits and vegetables in the grocery store that are part of the Fruit and Vegetable Snack Program, to let parents know which items students are getting at school? They could also advertise these items in weekly flyers, coupons, sales, in-store nutrition education activities.
13. In your opinion, what would be the best way for the school to let parents know about grocery stores that are promoting the Fruit and Vegetable Snack Program and fruits and vegetables?
Likelihood of responding to cross-promotion
14. If the stores were to promote these specific fruits and vegetables (that your children try at school as part of the Fruit and Vegetable Snack Program), what would your likely response be if you saw promotions in the grocery store?
15. Which types of promotions would make you the most likely to purchase the fruit or vegetable
being promoted?
Awareness of SNAP-Ed
16. How familiar are you with SNAP-Ed, the nutrition education program offered at <name of school>?
FFY2017 SNAP-Ed Annual Report 448 January 2018
B. Closing Well, that brings us to the end of all my questions. If you could just give me a few minutes to make sure we have everything ready for you. Moderator checks with note taker to see if they have additional questions or comments. Check to make sure the demographic surveys have been collected. Thank you for sharing your time and providing such valuable information. Our study team is extremely grateful for your participation in this study. Before I leave, is there anything else you would like to share with us today? Are there any questions you would like to ask us? I have left you with my name and the study team’s contact information. If you think of something later that you would like to add to what was discussed today OR if you have a question that you’d like to ask us, please feel free to contact us. Your name will not be connected with any answers or comments you have given today or may give in the future. As a gesture of our appreciation for your participation, you will all receive a $10 Walmart gift card. Thank you so much again! Turn off tape recorder.
FFY2017 SNAP-Ed Annual Report 449 January 2018
PAGE INTENTIONALLY BLANK
FFY2017 SNAP-Ed Annual Report 450 January 2018
Appendix J
Miami Junior and Senior High Food Services Survey Report
FFY2017 SNAP-Ed Annual Report 451 January 2018
Miami Junior and Senior High School Food Services Student Survey Results
May 2017
Implemented and Administered with Support of the Gila County
SNAP-Education Program
FFY2017 SNAP-Ed Annual Report 452 January 2018
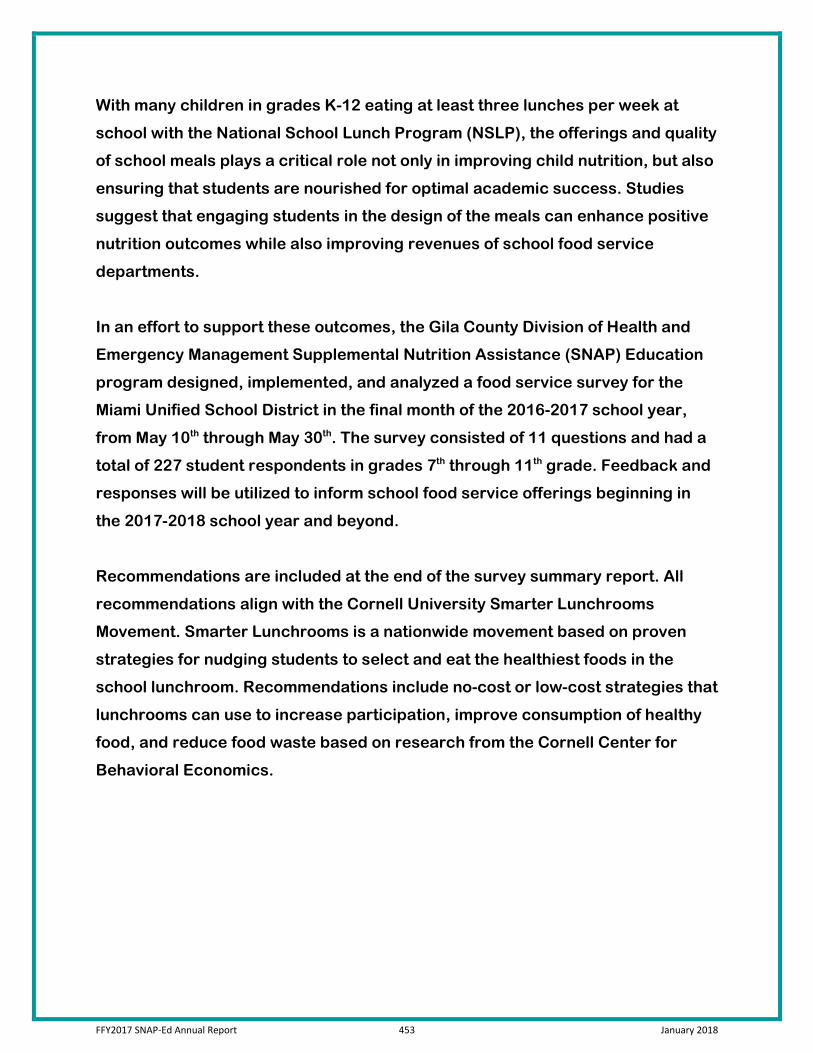
With many children in grades K-12 eating at least three lunches per week at
school with the National School Lunch Program (NSLP), the offerings and quality
of school meals plays a critical role not only in improving child nutrition, but also
ensuring that students are nourished for optimal academic success. Studies
suggest that engaging students in the design of the meals can enhance positive
nutrition outcomes while also improving revenues of school food service
departments.
In an effort to support these outcomes, the Gila County Division of Health and
Emergency Management Supplemental Nutrition Assistance (SNAP) Education
program designed, implemented, and analyzed a food service survey for the
Miami Unified School District in the final month of the 2016-2017 school year,
from May 10th through May 30th. The survey consisted of 11 questions and had a
total of 227 student respondents in grades 7th through 11th grade. Feedback and
responses will be utilized to inform school food service offerings beginning in
the 2017-2018 school year and beyond.
Recommendations are included at the end of the survey summary report. All
recommendations align with the Cornell University Smarter Lunchrooms
Movement. Smarter Lunchrooms is a nationwide movement based on proven
strategies for nudging students to select and eat the healthiest foods in the
school lunchroom. Recommendations include no-cost or low-cost strategies that
lunchrooms can use to increase participation, improve consumption of healthy
food, and reduce food waste based on research from the Cornell Center for
Behavioral Economics.
FFY2017 SNAP-Ed Annual Report 453 January 2018
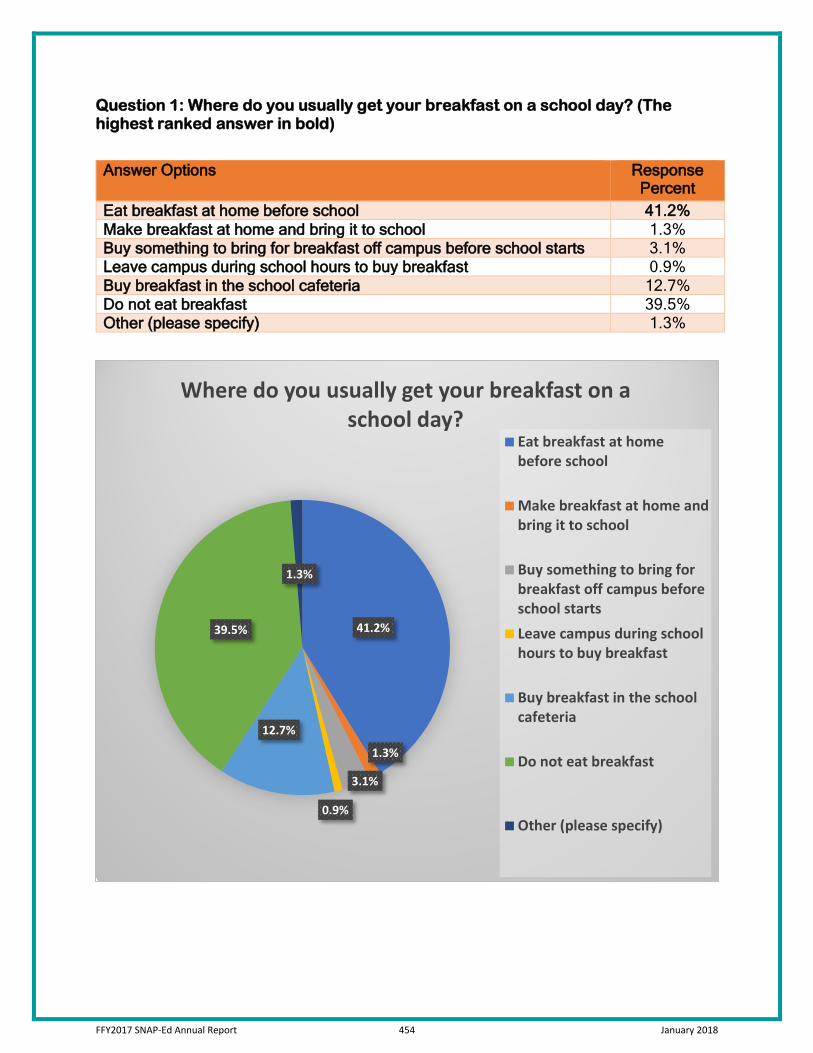
Question 1: Where do you usually get your breakfast on a school day? (The highest ranked answer in bold)
Answer Options Response Percent
Eat breakfast at home before school 41.2% Make breakfast at home and bring it to school 1.3% Buy something to bring for breakfast off campus before school starts 3.1% Leave campus during school hours to buy breakfast 0.9% Buy breakfast in the school cafeteria 12.7% Do not eat breakfast 39.5% Other (please specify) 1.3%
41.2%
1.3%
3.1%
0.9%
12.7%
39.5%
1.3%
Where do you usually get your breakfast on a school day?
Eat breakfast at homebefore school
Make breakfast at home andbring it to school
Buy something to bring forbreakfast off campus beforeschool startsLeave campus during schoolhours to buy breakfast
Buy breakfast in the schoolcafeteria
Do not eat breakfast
Other (please specify)
FFY2017 SNAP-Ed Annual Report 454 January 2018
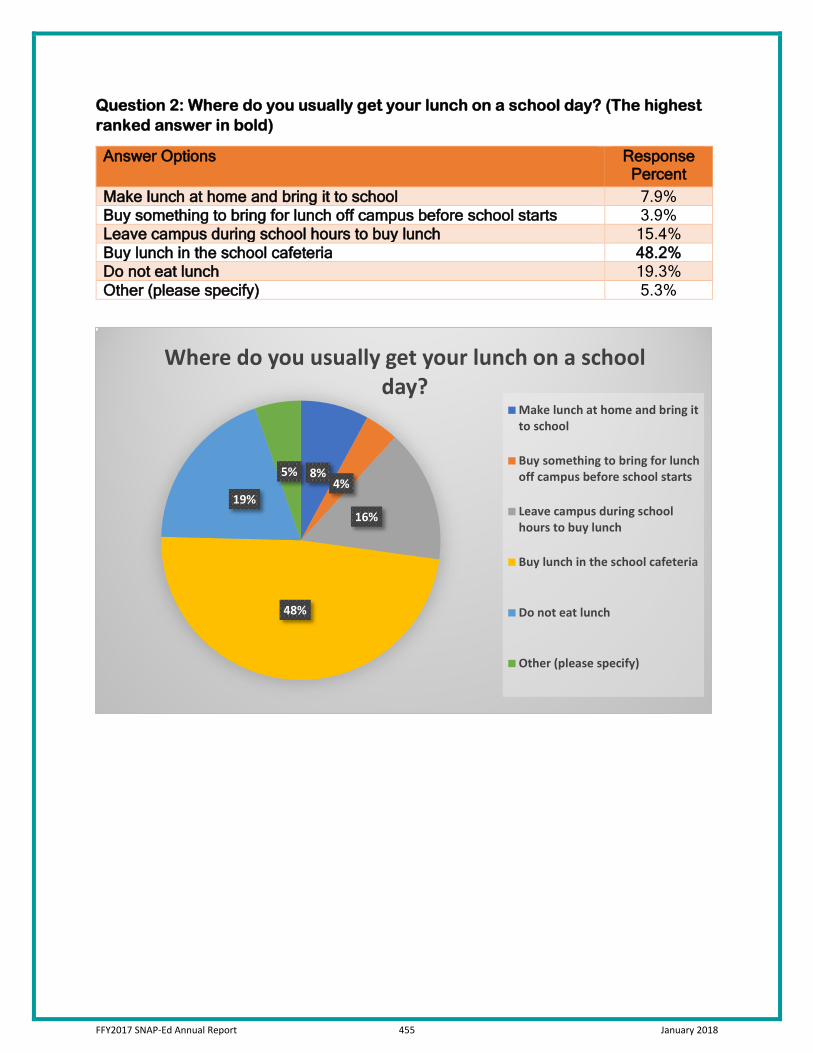
Question 2: Where do you usually get your lunch on a school day? (The highest ranked answer in bold)
Answer Options Response Percent
Make lunch at home and bring it to school 7.9% Buy something to bring for lunch off campus before school starts 3.9% Leave campus during school hours to buy lunch 15.4% Buy lunch in the school cafeteria 48.2% Do not eat lunch 19.3% Other (please specify) 5.3%
8%4%
16%
48%
19%
5%
Where do you usually get your lunch on a school day?
Make lunch at home and bring itto school
Buy something to bring for lunchoff campus before school starts
Leave campus during schoolhours to buy lunch
Buy lunch in the school cafeteria
Do not eat lunch
Other (please specify)
FFY2017 SNAP-Ed Annual Report 455 January 2018
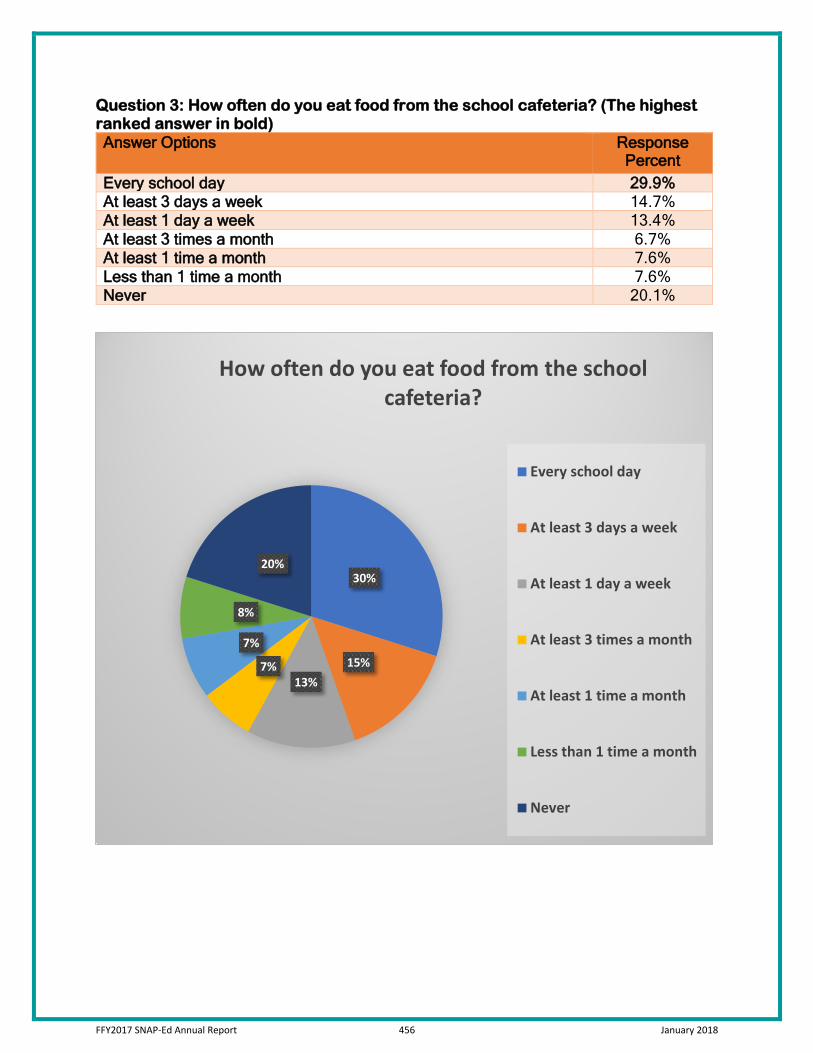
Question 3: How often do you eat food from the school cafeteria? (The highest ranked answer in bold) Answer Options Response
Percent Every school day 29.9% At least 3 days a week 14.7% At least 1 day a week 13.4% At least 3 times a month 6.7% At least 1 time a month 7.6% Less than 1 time a month 7.6% Never 20.1%
30%
15%13%
7%
7%
8%
20%
How often do you eat food from the school cafeteria?
Every school day
At least 3 days a week
At least 1 day a week
At least 3 times a month
At least 1 time a month
Less than 1 time a month
Never
FFY2017 SNAP-Ed Annual Report 456 January 2018
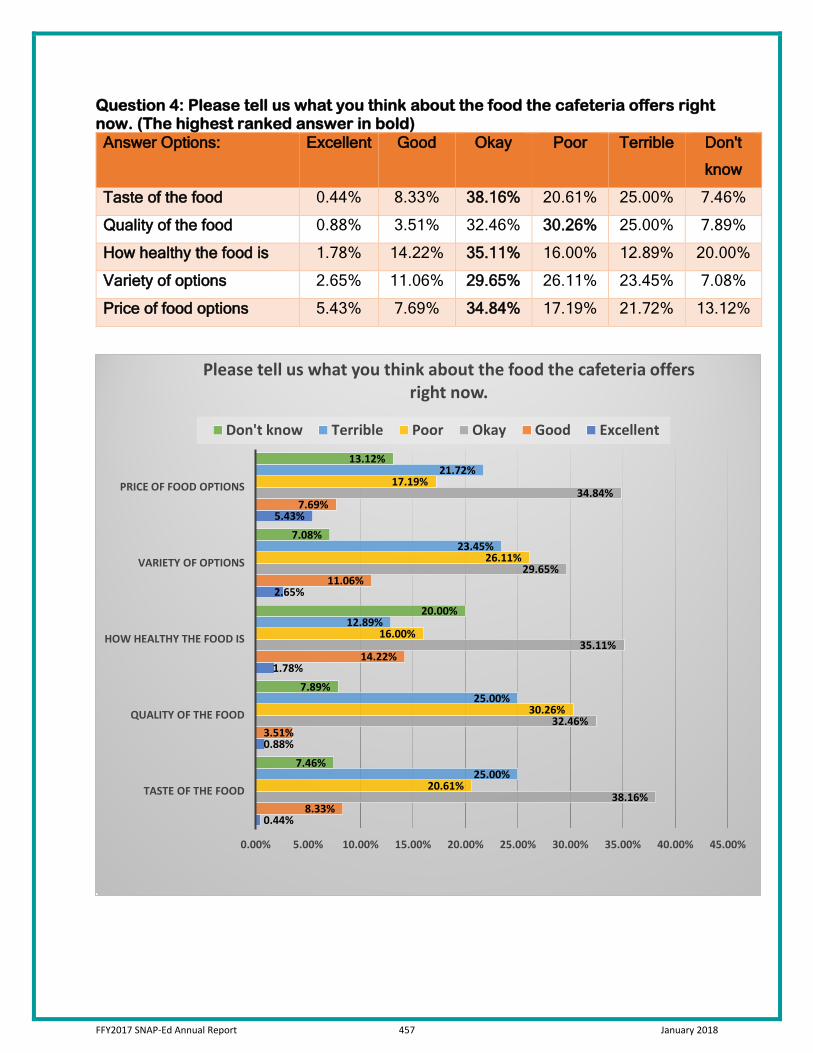
Question 4: Please tell us what you think about the food the cafeteria offers right now. (The highest ranked answer in bold) Answer Options: Excellent Good Okay Poor Terrible Don't
know
Taste of the food 0.44% 8.33% 38.16% 20.61% 25.00% 7.46%
Quality of the food 0.88% 3.51% 32.46% 30.26% 25.00% 7.89%
How healthy the food is 1.78% 14.22% 35.11% 16.00% 12.89% 20.00%
Variety of options 2.65% 11.06% 29.65% 26.11% 23.45% 7.08%
Price of food options 5.43% 7.69% 34.84% 17.19% 21.72% 13.12%
0.44%
0.88%
1.78%
2.65%
5.43%
8.33%
3.51%
14.22%
11.06%
7.69%
38.16%
32.46%
35.11%
29.65%
34.84%
20.61%
30.26%
16.00%
26.11%
17.19%
25.00%
25.00%
12.89%
23.45%
21.72%
7.46%
7.89%
20.00%
7.08%
13.12%
0.00% 5.00% 10.00% 15.00% 20.00% 25.00% 30.00% 35.00% 40.00% 45.00%
TASTE OF THE FOOD
QUALITY OF THE FOOD
HOW HEALTHY THE FOOD IS
VARIETY OF OPTIONS
PRICE OF FOOD OPTIONS
Please tell us what you think about the food the cafeteria offers right now.
Don't know Terrible Poor Okay Good Excellent
FFY2017 SNAP-Ed Annual Report 457 January 2018
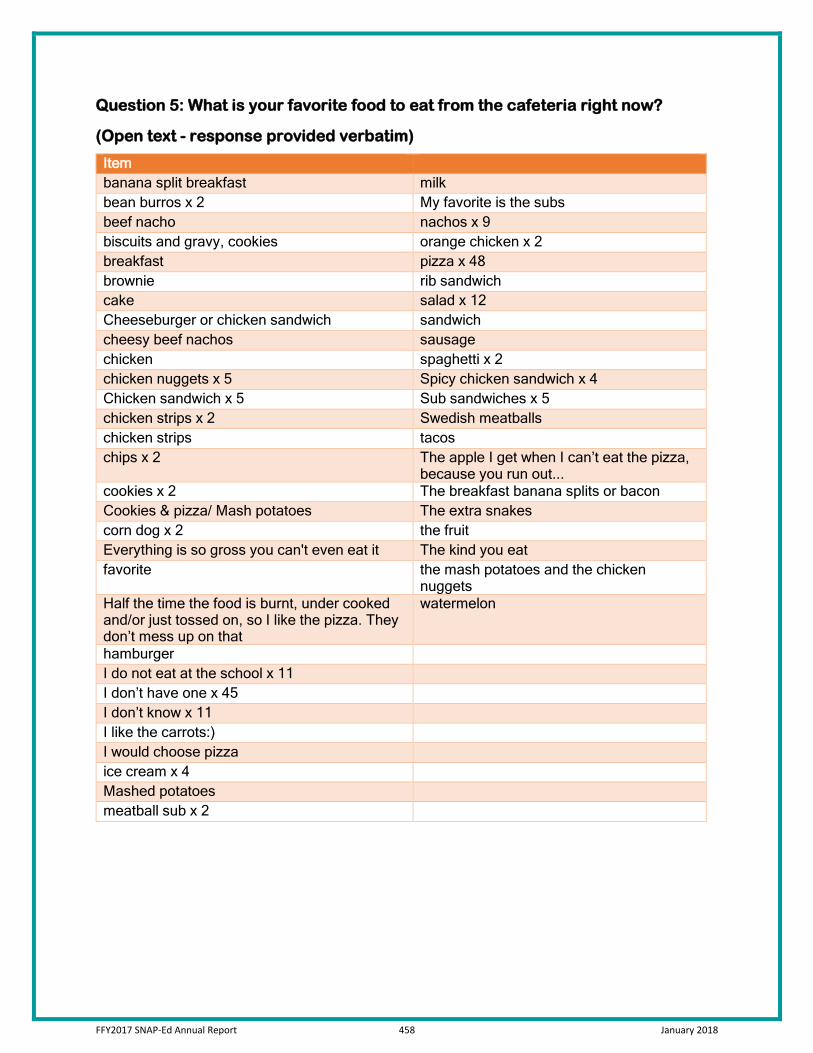
Question 5: What is your favorite food to eat from the cafeteria right now?
(Open text - response provided verbatim)
Item banana split breakfast milk bean burros x 2 My favorite is the subs beef nacho nachos x 9 biscuits and gravy, cookies orange chicken x 2 breakfast pizza x 48 brownie rib sandwich cake salad x 12 Cheeseburger or chicken sandwich sandwich cheesy beef nachos sausage chicken spaghetti x 2 chicken nuggets x 5 Spicy chicken sandwich x 4 Chicken sandwich x 5 Sub sandwiches x 5 chicken strips x 2 Swedish meatballs chicken strips tacos chips x 2 The apple I get when I can’t eat the pizza,
because you run out... cookies x 2 The breakfast banana splits or bacon Cookies & pizza/ Mash potatoes The extra snakes corn dog x 2 the fruit Everything is so gross you can't even eat it The kind you eat favorite the mash potatoes and the chicken
nuggets Half the time the food is burnt, under cooked and/or just tossed on, so I like the pizza. They don’t mess up on that
watermelon
hamburger I do not eat at the school x 11 I don’t have one x 45 I don’t know x 11 I like the carrots:) I would choose pizza ice cream x 4 Mashed potatoes meatball sub x 2
FFY2017 SNAP-Ed Annual Report 458 January 2018
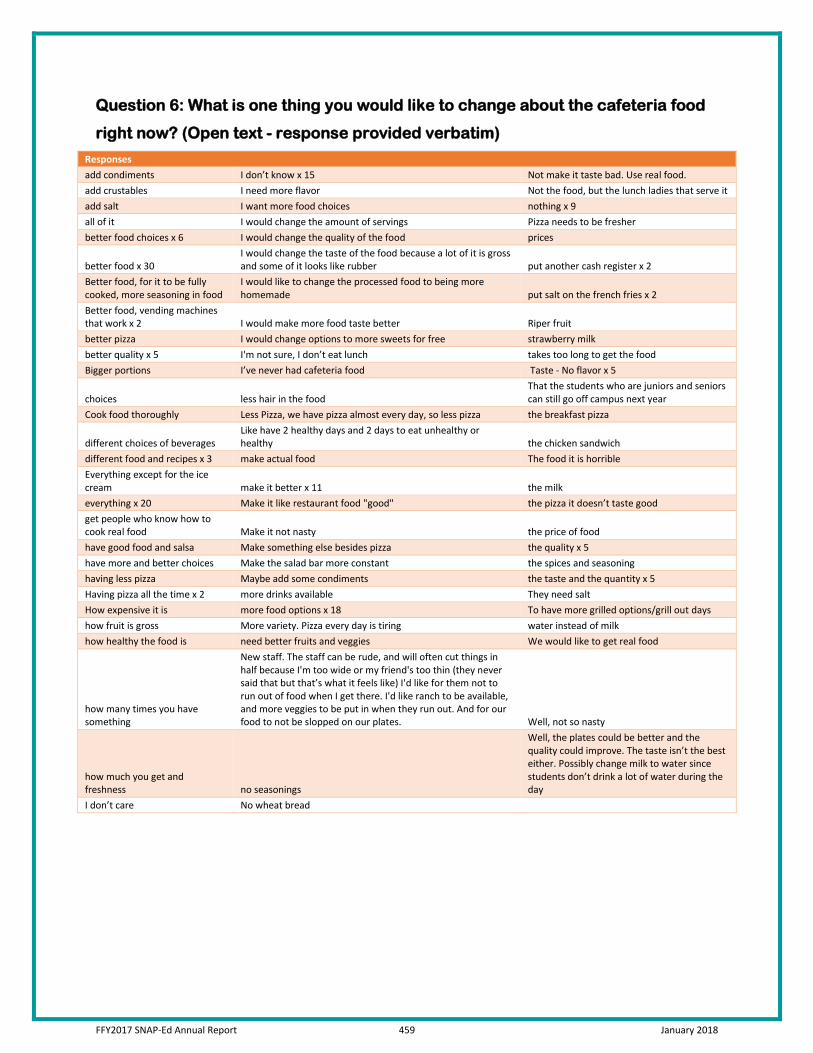
Question 6: What is one thing you would like to change about the cafeteria food
right now? (Open text - response provided verbatim)
Responses add condiments I don’t know x 15 Not make it taste bad. Use real food. add crustables I need more flavor Not the food, but the lunch ladies that serve it add salt I want more food choices nothing x 9 all of it I would change the amount of servings Pizza needs to be fresher better food choices x 6 I would change the quality of the food prices
better food x 30 I would change the taste of the food because a lot of it is gross and some of it looks like rubber put another cash register x 2
Better food, for it to be fully cooked, more seasoning in food
I would like to change the processed food to being more homemade put salt on the french fries x 2
Better food, vending machines that work x 2 I would make more food taste better Riper fruit better pizza I would change options to more sweets for free strawberry milk better quality x 5 I'm not sure, I don’t eat lunch takes too long to get the food Bigger portions I’ve never had cafeteria food Taste - No flavor x 5
choices less hair in the food That the students who are juniors and seniors can still go off campus next year
Cook food thoroughly Less Pizza, we have pizza almost every day, so less pizza the breakfast pizza
different choices of beverages Like have 2 healthy days and 2 days to eat unhealthy or healthy the chicken sandwich
different food and recipes x 3 make actual food The food it is horrible Everything except for the ice cream make it better x 11 the milk everything x 20 Make it like restaurant food "good" the pizza it doesn’t taste good get people who know how to cook real food Make it not nasty the price of food have good food and salsa Make something else besides pizza the quality x 5 have more and better choices Make the salad bar more constant the spices and seasoning having less pizza Maybe add some condiments the taste and the quantity x 5 Having pizza all the time x 2 more drinks available They need salt How expensive it is more food options x 18 To have more grilled options/grill out days how fruit is gross More variety. Pizza every day is tiring water instead of milk how healthy the food is need better fruits and veggies We would like to get real food
how many times you have something
New staff. The staff can be rude, and will often cut things in half because I'm too wide or my friend's too thin (they never said that but that’s what it feels like) I'd like for them not to run out of food when I get there. I'd like ranch to be available, and more veggies to be put in when they run out. And for our food to not be slopped on our plates. Well, not so nasty
how much you get and freshness no seasonings
Well, the plates could be better and the quality could improve. The taste isn’t the best either. Possibly change milk to water since students don’t drink a lot of water during the day
I don’t care No wheat bread
FFY2017 SNAP-Ed Annual Report 459 January 2018
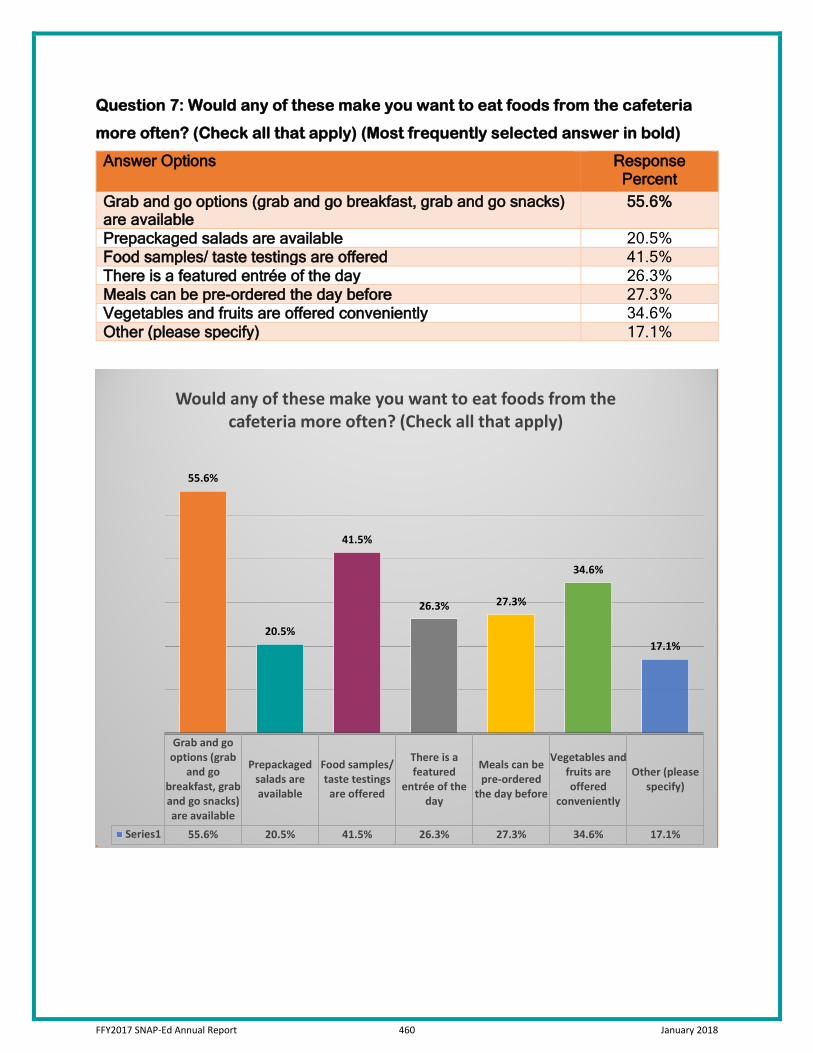
Question 7: Would any of these make you want to eat foods from the cafeteria
more often? (Check all that apply) (Most frequently selected answer in bold)
Answer Options Response Percent
Grab and go options (grab and go breakfast, grab and go snacks) are available
55.6%
Prepackaged salads are available 20.5% Food samples/ taste testings are offered 41.5% There is a featured entrée of the day 26.3% Meals can be pre-ordered the day before 27.3% Vegetables and fruits are offered conveniently 34.6% Other (please specify) 17.1%
Grab and gooptions (grab
and gobreakfast, graband go snacks)are available
Prepackagedsalads areavailable
Food samples/taste testings
are offered
There is afeatured
entrée of theday
Meals can bepre-ordered
the day before
Vegetables andfruits areoffered
conveniently
Other (pleasespecify)
Series1 55.6% 20.5% 41.5% 26.3% 27.3% 34.6% 17.1%
55.6%
20.5%
41.5%
26.3% 27.3%
34.6%
17.1%
Would any of these make you want to eat foods from the cafeteria more often? (Check all that apply)
FFY2017 SNAP-Ed Annual Report 460 January 2018
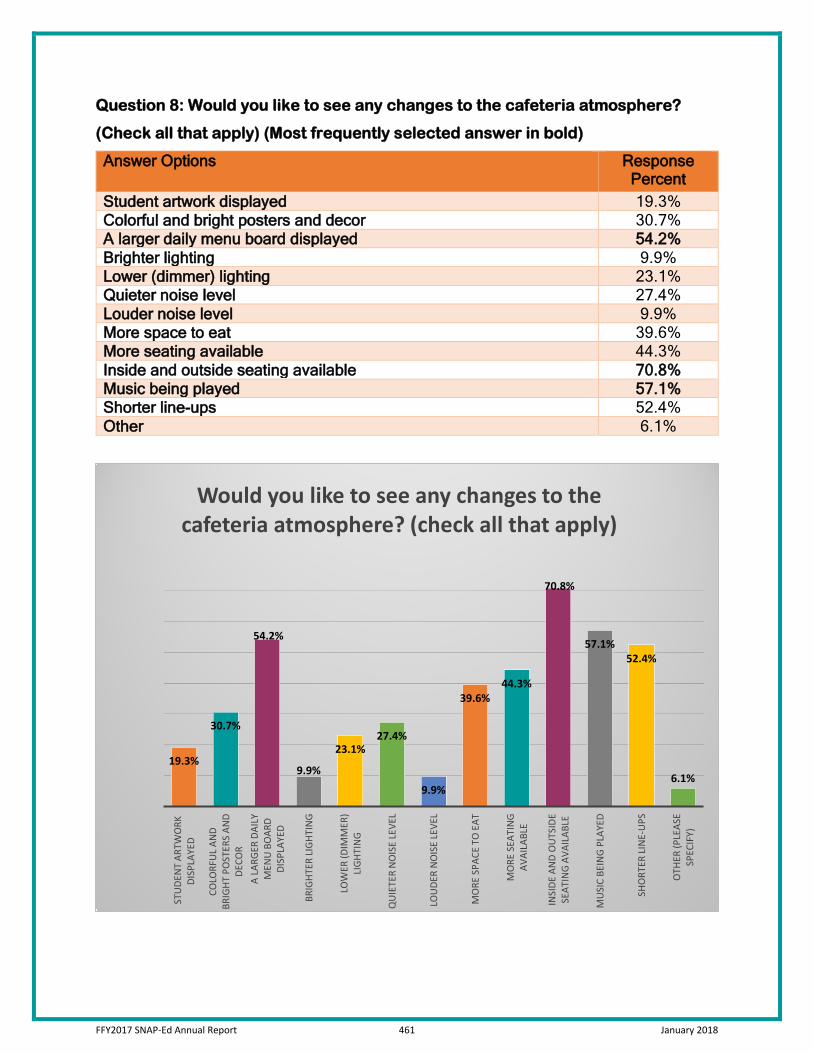
Question 8: Would you like to see any changes to the cafeteria atmosphere?
(Check all that apply) (Most frequently selected answer in bold)
Answer Options Response Percent
Student artwork displayed 19.3% Colorful and bright posters and decor 30.7% A larger daily menu board displayed 54.2% Brighter lighting 9.9% Lower (dimmer) lighting 23.1% Quieter noise level 27.4% Louder noise level 9.9% More space to eat 39.6% More seating available 44.3% Inside and outside seating available 70.8% Music being played 57.1% Shorter line-ups 52.4% Other 6.1%
19.3%
30.7%
54.2%
9.9%
23.1%27.4%
9.9%
39.6%44.3%
70.8%
57.1%52.4%
6.1%
STU
DEN
T AR
TWO
RK
DISP
LAYE
D
COLO
RFU
L AN
D BR
IGHT
PO
STER
S AN
D DE
COR
A LA
RGER
DAI
LY
MEN
U B
OAR
D DI
SPLA
YED
BRIG
HTER
LIGH
TIN
G
LOW
ER (D
IMM
ER)
LIGH
TIN
G
QU
IETE
R N
OIS
E LE
VEL
LOU
DER
NO
ISE
LEVE
L
MO
RE S
PACE
TO
EAT
MO
RE S
EATI
NG
AVAI
LABL
E
INSI
DE A
ND
OU
TSID
E SE
ATIN
G AV
AILA
BLE
MU
SIC
BEIN
G PL
AYED
SHO
RTER
LIN
E-U
PS
OTH
ER (P
LEAS
E SP
ECIF
Y)
Would you like to see any changes to the cafeteria atmosphere? (check all that apply)
FFY2017 SNAP-Ed Annual Report 461 January 2018
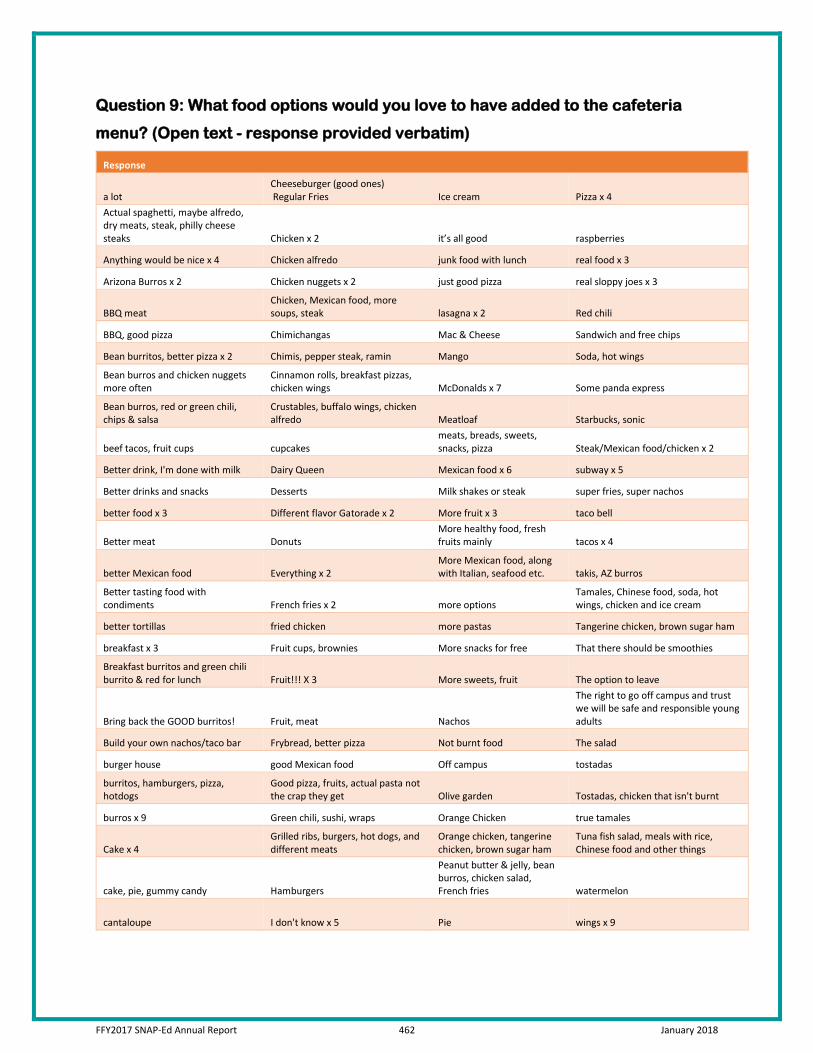
Question 9: What food options would you love to have added to the cafeteria
menu? (Open text - response provided verbatim)
Response
a lot Cheeseburger (good ones) Regular Fries Ice cream Pizza x 4
Actual spaghetti, maybe alfredo, dry meats, steak, philly cheese steaks Chicken x 2 it’s all good raspberries
Anything would be nice x 4 Chicken alfredo junk food with lunch real food x 3
Arizona Burros x 2 Chicken nuggets x 2 just good pizza real sloppy joes x 3
BBQ meat Chicken, Mexican food, more soups, steak lasagna x 2 Red chili
BBQ, good pizza Chimichangas Mac & Cheese Sandwich and free chips
Bean burritos, better pizza x 2 Chimis, pepper steak, ramin Mango Soda, hot wings
Bean burros and chicken nuggets more often
Cinnamon rolls, breakfast pizzas, chicken wings McDonalds x 7 Some panda express
Bean burros, red or green chili, chips & salsa
Crustables, buffalo wings, chicken alfredo Meatloaf Starbucks, sonic
beef tacos, fruit cups cupcakes meats, breads, sweets, snacks, pizza Steak/Mexican food/chicken x 2
Better drink, I'm done with milk Dairy Queen Mexican food x 6 subway x 5
Better drinks and snacks Desserts Milk shakes or steak super fries, super nachos
better food x 3 Different flavor Gatorade x 2 More fruit x 3 taco bell
Better meat Donuts More healthy food, fresh fruits mainly tacos x 4
better Mexican food Everything x 2 More Mexican food, along with Italian, seafood etc. takis, AZ burros
Better tasting food with condiments French fries x 2 more options
Tamales, Chinese food, soda, hot wings, chicken and ice cream
better tortillas fried chicken more pastas Tangerine chicken, brown sugar ham
breakfast x 3 Fruit cups, brownies More snacks for free That there should be smoothies
Breakfast burritos and green chili burrito & red for lunch Fruit!!! X 3 More sweets, fruit The option to leave
Bring back the GOOD burritos! Fruit, meat Nachos
The right to go off campus and trust we will be safe and responsible young adults
Build your own nachos/taco bar Frybread, better pizza Not burnt food The salad
burger house good Mexican food Off campus tostadas
burritos, hamburgers, pizza, hotdogs
Good pizza, fruits, actual pasta not the crap they get Olive garden Tostadas, chicken that isn't burnt
burros x 9 Green chili, sushi, wraps Orange Chicken true tamales
Cake x 4 Grilled ribs, burgers, hot dogs, and different meats
Orange chicken, tangerine chicken, brown sugar ham
Tuna fish salad, meals with rice, Chinese food and other things
cake, pie, gummy candy Hamburgers
Peanut butter & jelly, bean burros, chicken salad, French fries watermelon
cantaloupe I don't know x 5 Pie wings x 9
FFY2017 SNAP-Ed Annual Report 462 January 2018
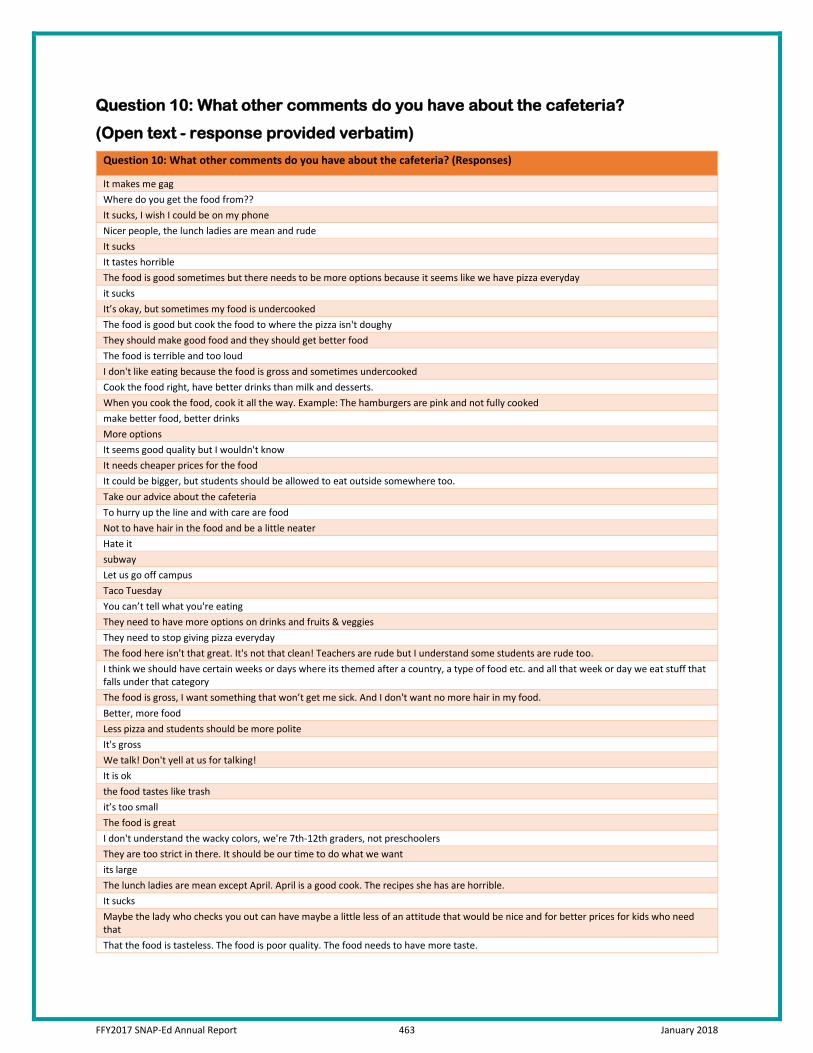
Question 10: What other comments do you have about the cafeteria?
(Open text - response provided verbatim)
Question 10: What other comments do you have about the cafeteria? (Responses)
It makes me gag Where do you get the food from?? It sucks, I wish I could be on my phone Nicer people, the lunch ladies are mean and rude It sucks It tastes horrible The food is good sometimes but there needs to be more options because it seems like we have pizza everyday it sucks It’s okay, but sometimes my food is undercooked The food is good but cook the food to where the pizza isn't doughy They should make good food and they should get better food The food is terrible and too loud I don't like eating because the food is gross and sometimes undercooked Cook the food right, have better drinks than milk and desserts. When you cook the food, cook it all the way. Example: The hamburgers are pink and not fully cooked make better food, better drinks More options It seems good quality but I wouldn't know It needs cheaper prices for the food It could be bigger, but students should be allowed to eat outside somewhere too. Take our advice about the cafeteria To hurry up the line and with care are food Not to have hair in the food and be a little neater Hate it subway Let us go off campus Taco Tuesday You can’t tell what you're eating They need to have more options on drinks and fruits & veggies They need to stop giving pizza everyday The food here isn't that great. It's not that clean! Teachers are rude but I understand some students are rude too. I think we should have certain weeks or days where its themed after a country, a type of food etc. and all that week or day we eat stuff that falls under that category The food is gross, I want something that won’t get me sick. And I don't want no more hair in my food. Better, more food Less pizza and students should be more polite It's gross We talk! Don't yell at us for talking! It is ok the food tastes like trash it’s too small The food is great I don't understand the wacky colors, we're 7th-12th graders, not preschoolers They are too strict in there. It should be our time to do what we want its large The lunch ladies are mean except April. April is a good cook. The recipes she has are horrible. It sucks Maybe the lady who checks you out can have maybe a little less of an attitude that would be nice and for better prices for kids who need that That the food is tasteless. The food is poor quality. The food needs to have more taste.
FFY2017 SNAP-Ed Annual Report 463 January 2018
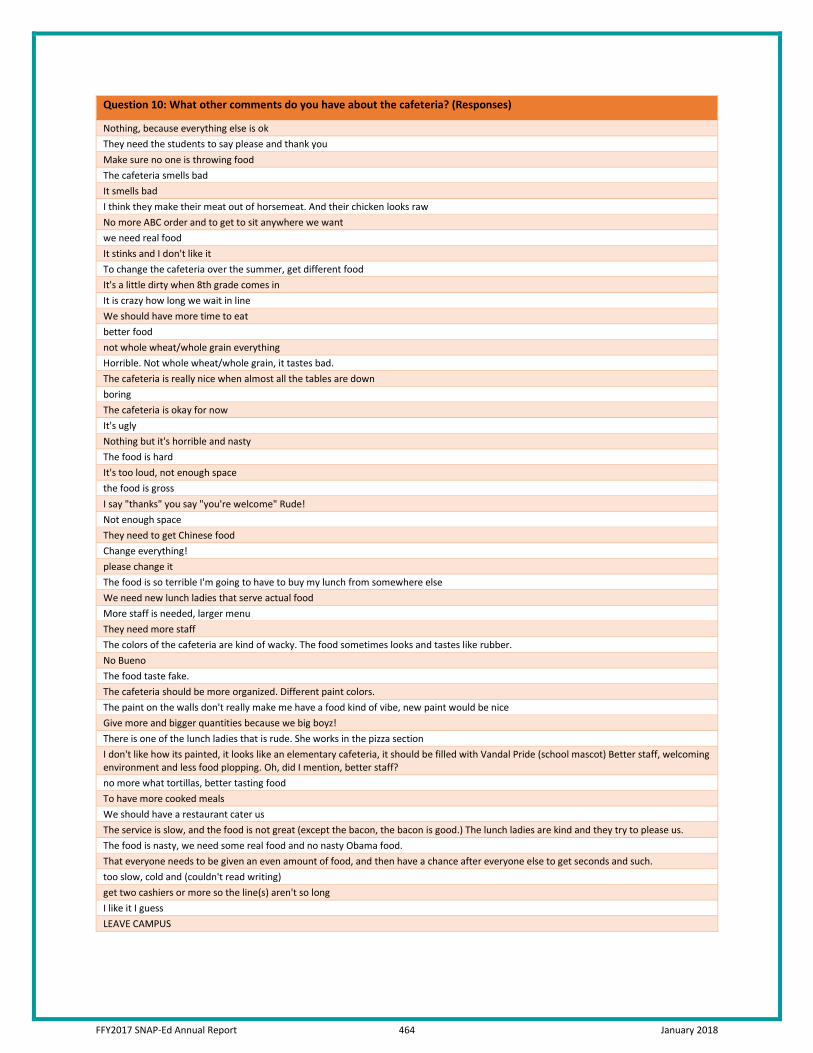
Question 10: What other comments do you have about the cafeteria? (Responses)
Nothing, because everything else is ok They need the students to say please and thank you Make sure no one is throwing food The cafeteria smells bad It smells bad I think they make their meat out of horsemeat. And their chicken looks raw No more ABC order and to get to sit anywhere we want we need real food It stinks and I don't like it To change the cafeteria over the summer, get different food It's a little dirty when 8th grade comes in It is crazy how long we wait in line We should have more time to eat better food not whole wheat/whole grain everything Horrible. Not whole wheat/whole grain, it tastes bad. The cafeteria is really nice when almost all the tables are down boring The cafeteria is okay for now It's ugly Nothing but it's horrible and nasty The food is hard It's too loud, not enough space the food is gross I say "thanks" you say "you're welcome" Rude! Not enough space They need to get Chinese food Change everything! please change it The food is so terrible I'm going to have to buy my lunch from somewhere else We need new lunch ladies that serve actual food More staff is needed, larger menu They need more staff The colors of the cafeteria are kind of wacky. The food sometimes looks and tastes like rubber. No Bueno The food taste fake. The cafeteria should be more organized. Different paint colors. The paint on the walls don't really make me have a food kind of vibe, new paint would be nice Give more and bigger quantities because we big boyz! There is one of the lunch ladies that is rude. She works in the pizza section I don't like how its painted, it looks like an elementary cafeteria, it should be filled with Vandal Pride (school mascot) Better staff, welcoming environment and less food plopping. Oh, did I mention, better staff? no more what tortillas, better tasting food To have more cooked meals We should have a restaurant cater us The service is slow, and the food is not great (except the bacon, the bacon is good.) The lunch ladies are kind and they try to please us. The food is nasty, we need some real food and no nasty Obama food. That everyone needs to be given an even amount of food, and then have a chance after everyone else to get seconds and such. too slow, cold and (couldn't read writing) get two cashiers or more so the line(s) aren't so long I like it I guess LEAVE CAMPUS
FFY2017 SNAP-Ed Annual Report 464 January 2018
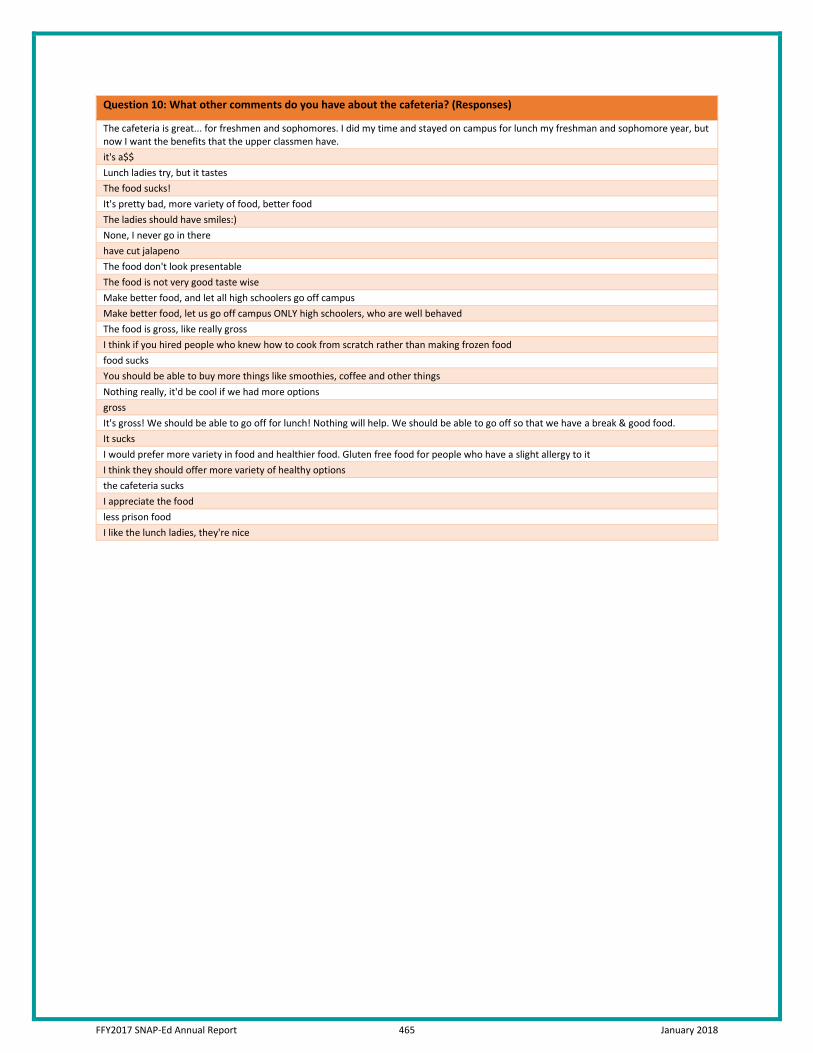
Question 10: What other comments do you have about the cafeteria? (Responses)
The cafeteria is great... for freshmen and sophomores. I did my time and stayed on campus for lunch my freshman and sophomore year, but now I want the benefits that the upper classmen have. it's a$$ Lunch ladies try, but it tastes The food sucks! It's pretty bad, more variety of food, better food The ladies should have smiles:) None, I never go in there have cut jalapeno The food don't look presentable The food is not very good taste wise Make better food, and let all high schoolers go off campus Make better food, let us go off campus ONLY high schoolers, who are well behaved The food is gross, like really gross I think if you hired people who knew how to cook from scratch rather than making frozen food food sucks You should be able to buy more things like smoothies, coffee and other things Nothing really, it'd be cool if we had more options gross It's gross! We should be able to go off for lunch! Nothing will help. We should be able to go off so that we have a break & good food. It sucks I would prefer more variety in food and healthier food. Gluten free food for people who have a slight allergy to it I think they should offer more variety of healthy options the cafeteria sucks I appreciate the food less prison food I like the lunch ladies, they're nice
FFY2017 SNAP-Ed Annual Report 465 January 2018
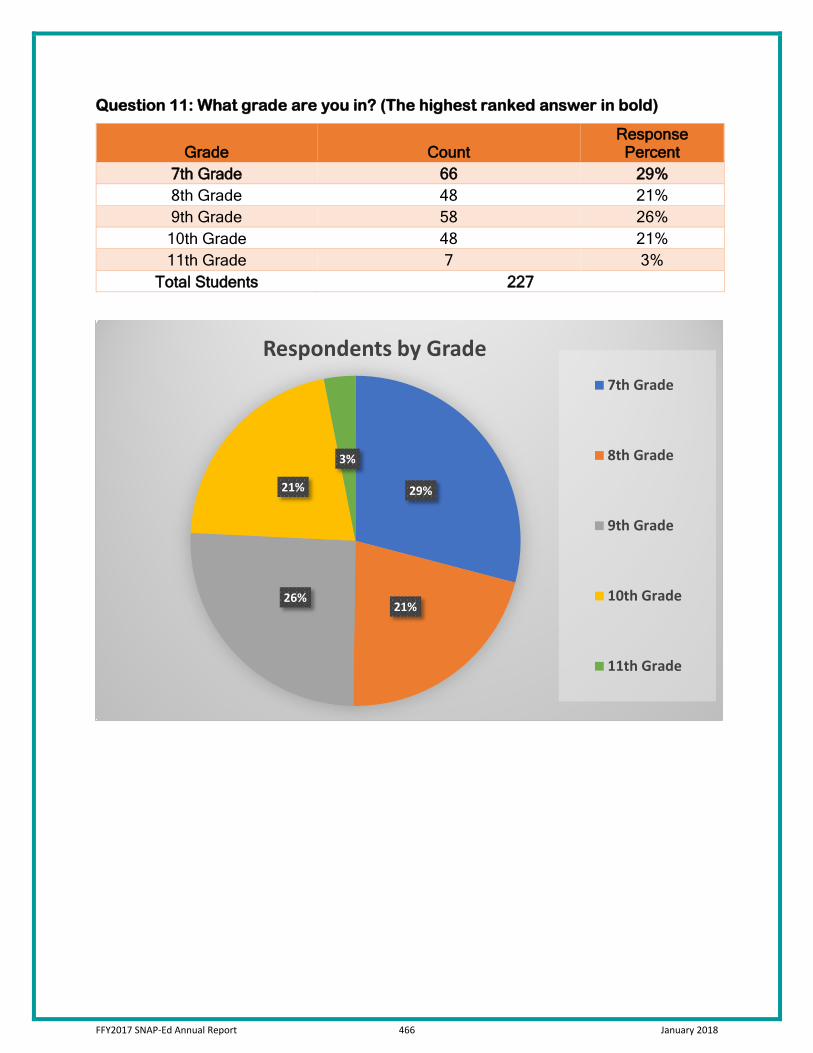
Question 11: What grade are you in? (The highest ranked answer in bold)
Grade Count Response Percent
7th Grade 66 29% 8th Grade 48 21% 9th Grade 58 26%
10th Grade 48 21% 11th Grade 7 3%
Total Students 227
29%
21%26%
21%
3%
Respondents by Grade7th Grade
8th Grade
9th Grade
10th Grade
11th Grade
FFY2017 SNAP-Ed Annual Report 466 January 2018
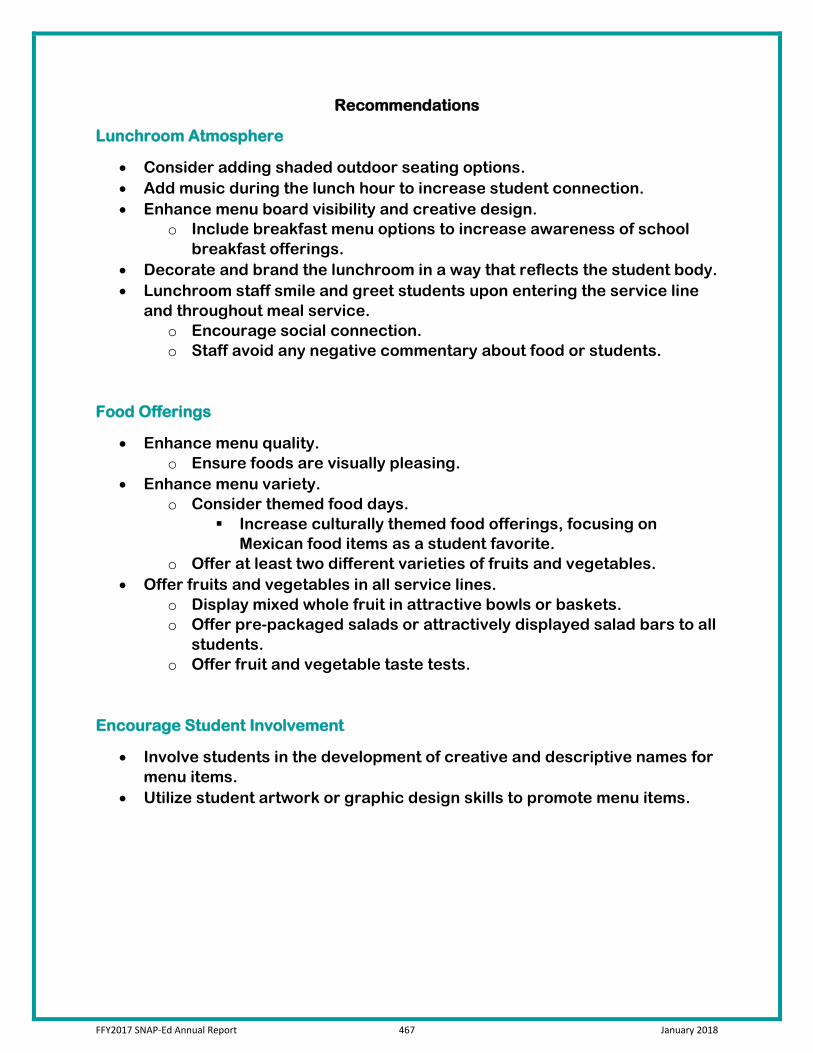
Recommendations
Lunchroom Atmosphere
• Consider adding shaded outdoor seating options. • Add music during the lunch hour to increase student connection. • Enhance menu board visibility and creative design.
o Include breakfast menu options to increase awareness of school breakfast offerings.
• Decorate and brand the lunchroom in a way that reflects the student body. • Lunchroom staff smile and greet students upon entering the service line
and throughout meal service. o Encourage social connection. o Staff avoid any negative commentary about food or students.
Food Offerings
• Enhance menu quality. o Ensure foods are visually pleasing.
• Enhance menu variety. o Consider themed food days.
Increase culturally themed food offerings, focusing on Mexican food items as a student favorite.
o Offer at least two different varieties of fruits and vegetables. • Offer fruits and vegetables in all service lines.
o Display mixed whole fruit in attractive bowls or baskets. o Offer pre-packaged salads or attractively displayed salad bars to all
students. o Offer fruit and vegetable taste tests.
Encourage Student Involvement
• Involve students in the development of creative and descriptive names for menu items.
• Utilize student artwork or graphic design skills to promote menu items.
FFY2017 SNAP-Ed Annual Report 467 January 2018
For any questions about this survey please contact:
Bethany Cheney, SNAP-Ed
Gila County Division of Health and Emergency Management
or Pinnacle Prevention
FFY2017 SNAP-Ed Annual Report 468 January 2018
Appendix K
UA Nutrition Network Teacher Survey Report
FFY2017 SNAP-Ed Annual Report 469 January 2018
The University of Arizona Nutrition Network Teacher Survey for the School Year 2016-2017
Executive Summary
Background
The University of Arizona Nutrition Network (UANN) Teacher Survey is a standardized, brief (15-question) survey that can be used by county units who work with schools, Headstarts, or other school health or early child care education settings. The School Year 2016-2017 (SY16-17) version of the Teacher Survey is: Aligned with Federal Fiscal Year 2016 frameworks. Intended to help units gauge program successes and areas for improvement. A UANN internal evaluation effort (not required by the Arizona Nutrition Network).
The Teacher Survey is intended to reach teachers who have engaged with the UANN program at some point during the SY16-17. However, because the UANN uses a multi-level approach within the school, which includes policy, systems, and environmental (PSE) strategies, a surveyed teacher may not have received direct nutrition and physical activity education in their classroom. Other interventions may have included support for wellness weeks, gardening support, technical assistance for Local Wellness Policies, or some other PSE support service. The teacher observations reported here can help to illuminate changes in students’ knowledge, students’ behaviors, and school-wide changes related to nutrition and physical activity.
The Summary
The questions of the UANN Teacher Survey were divided into the eight topical areas to create this summary report:
Section Survey Questions Who took the survey? 1, 13, and 14 What did they appreciate about the UANN? 2 and 4 What motivates teachers to participate in the UANN program? 3 (open-ended) What barriers exist to make it difficult for teachers to participate in the UANN program?
9 (open-ended)
What changes did teachers observe in students’ knowledge and behaviors?
5 and 6
Where was the UANN program successful? 7 and 8 (open-ended) Where can the UANN program improve? 10 (open-ended) Conclusions 2, 3, 4, 7, 8, 9, and 10
FFY2017 SNAP-Ed Annual Report 470 January 2018
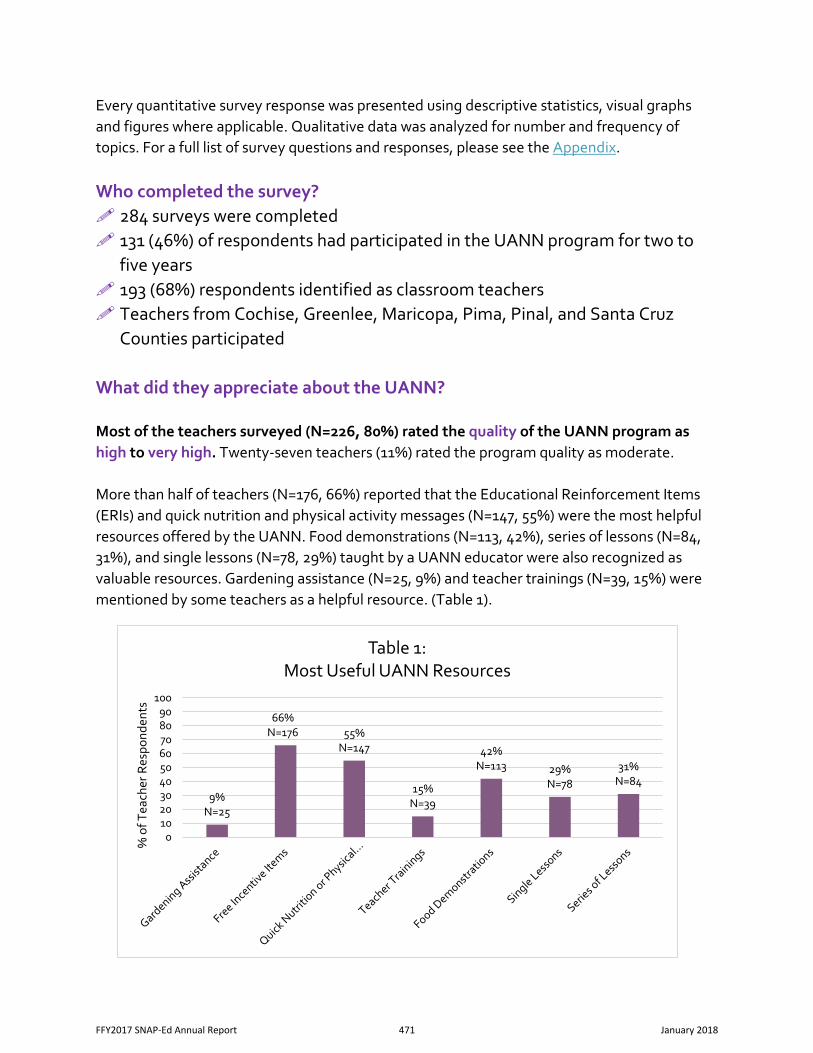
Every quantitative survey response was presented using descriptive statistics, visual graphs and figures where applicable. Qualitative data was analyzed for number and frequency of topics. For a full list of survey questions and responses, please see the Appendix.
Who completed the survey? 284 surveys were completed 131 (46%) of respondents had participated in the UANN program for two to
five years 193 (68%) respondents identified as classroom teachers Teachers from Cochise, Greenlee, Maricopa, Pima, Pinal, and Santa Cruz
Counties participated What did they appreciate about the UANN? Most of the teachers surveyed (N=226, 80%) rated the quality of the UANN program as high to very high. Twenty-seven teachers (11%) rated the program quality as moderate. More than half of teachers (N=176, 66%) reported that the Educational Reinforcement Items (ERIs) and quick nutrition and physical activity messages (N=147, 55%) were the most helpful resources offered by the UANN. Food demonstrations (N=113, 42%), series of lessons (N=84, 31%), and single lessons (N=78, 29%) taught by a UANN educator were also recognized as valuable resources. Gardening assistance (N=25, 9%) and teacher trainings (N=39, 15%) were mentioned by some teachers as a helpful resource. (Table 1).
9%N=25
66% N=176 55%
N=147
15%N=39
42%N=113 29%
N=7831%
N=84
0102030405060708090
100
% o
f Tea
cher
Res
pond
ents
Table 1: Most Useful UANN Resources
FFY2017 SNAP-Ed Annual Report 471 January 2018
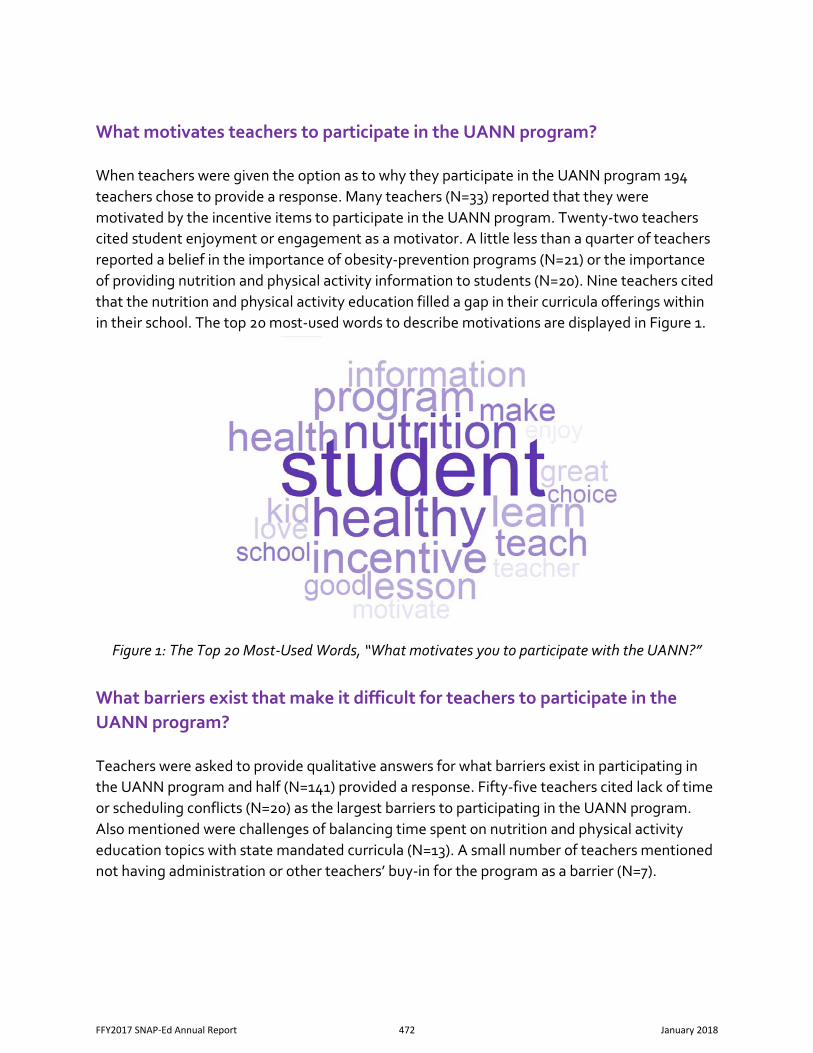
What motivates teachers to participate in the UANN program? When teachers were given the option as to why they participate in the UANN program 194 teachers chose to provide a response. Many teachers (N=33) reported that they were motivated by the incentive items to participate in the UANN program. Twenty-two teachers cited student enjoyment or engagement as a motivator. A little less than a quarter of teachers reported a belief in the importance of obesity-prevention programs (N=21) or the importance of providing nutrition and physical activity information to students (N=20). Nine teachers cited that the nutrition and physical activity education filled a gap in their curricula offerings within in their school. The top 20 most-used words to describe motivations are displayed in Figure 1.
Figure 1: The Top 20 Most-Used Words, “What motivates you to participate with the UANN?”
What barriers exist that make it difficult for teachers to participate in the UANN program? Teachers were asked to provide qualitative answers for what barriers exist in participating in the UANN program and half (N=141) provided a response. Fifty-five teachers cited lack of time or scheduling conflicts (N=20) as the largest barriers to participating in the UANN program. Also mentioned were challenges of balancing time spent on nutrition and physical activity education topics with state mandated curricula (N=13). A small number of teachers mentioned not having administration or other teachers’ buy-in for the program as a barrier (N=7).
FFY2017 SNAP-Ed Annual Report 472 January 2018
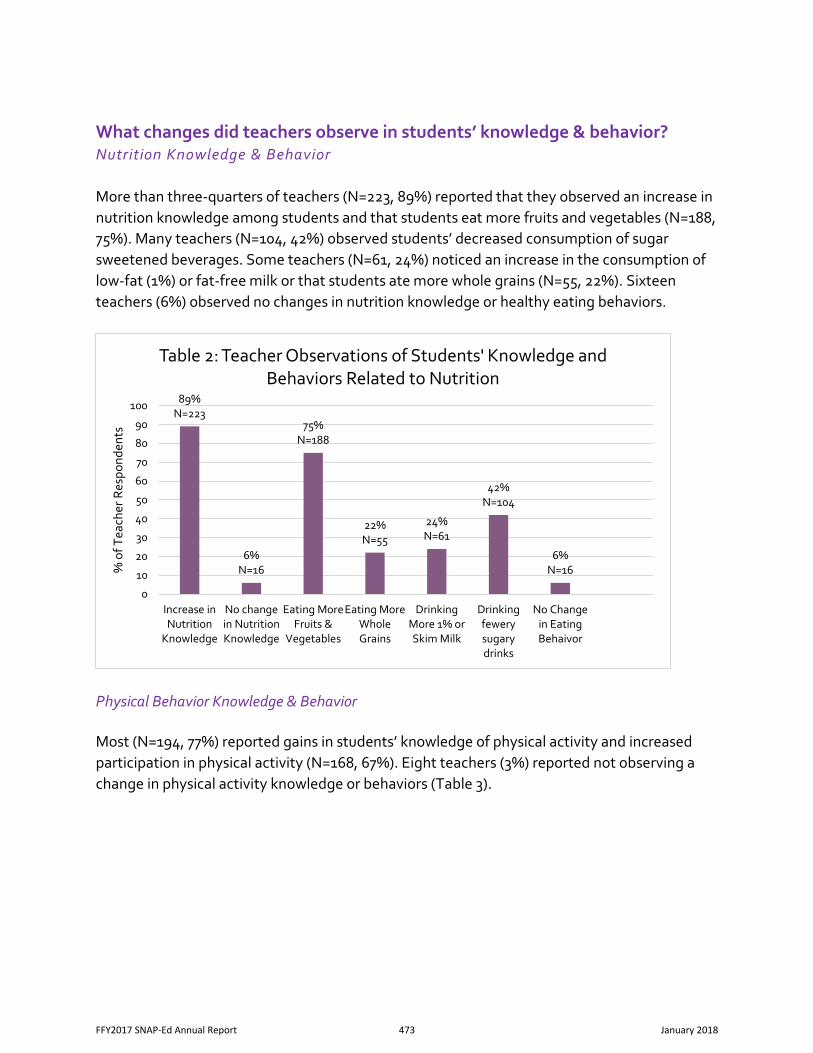
What changes did teachers observe in students’ knowledge & behavior? Nutrition Knowledge & Behavior More than three-quarters of teachers (N=223, 89%) reported that they observed an increase in nutrition knowledge among students and that students eat more fruits and vegetables (N=188, 75%). Many teachers (N=104, 42%) observed students’ decreased consumption of sugar sweetened beverages. Some teachers (N=61, 24%) noticed an increase in the consumption of low-fat (1%) or fat-free milk or that students ate more whole grains (N=55, 22%). Sixteen teachers (6%) observed no changes in nutrition knowledge or healthy eating behaviors.
Physical Behavior Knowledge & Behavior Most (N=194, 77%) reported gains in students’ knowledge of physical activity and increased participation in physical activity (N=168, 67%). Eight teachers (3%) reported not observing a change in physical activity knowledge or behaviors (Table 3).
89% N=223
6%N=16
75%N=188
22%N=55
24%N=61
42%N=104
6%N=16
0
10
20
30
40
50
60
70
80
90
100
Increase inNutrition
Knowledge
No changein NutritionKnowledge
Eating MoreFruits &
Vegetables
Eating MoreWholeGrains
DrinkingMore 1% orSkim Milk
Drinkingfewerysugarydrinks
No Changein EatingBehaivor
% o
f Tea
cher
Res
pond
ents
Table 2: Teacher Observations of Students' Knowledge and Behaviors Related to Nutrition
FFY2017 SNAP-Ed Annual Report 473 January 2018
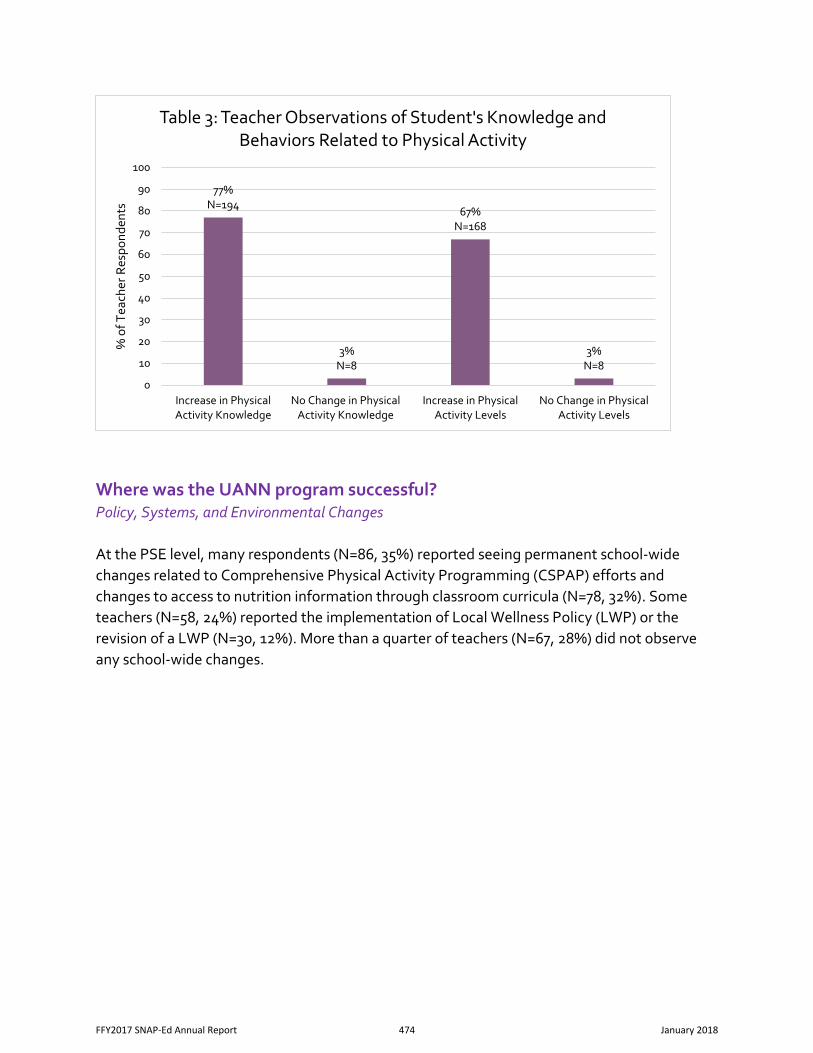
Where was the UANN program successful? Policy, Systems, and Environmental Changes At the PSE level, many respondents (N=86, 35%) reported seeing permanent school-wide changes related to Comprehensive Physical Activity Programming (CSPAP) efforts and changes to access to nutrition information through classroom curricula (N=78, 32%). Some teachers (N=58, 24%) reported the implementation of Local Wellness Policy (LWP) or the revision of a LWP (N=30, 12%). More than a quarter of teachers (N=67, 28%) did not observe any school-wide changes.
77%N=194
3%N=8
67%N=168
3%N=8
0
10
20
30
40
50
60
70
80
90
100
Increase in PhysicalActivity Knowledge
No Change in PhysicalActivity Knowledge
Increase in PhysicalActivity Levels
No Change in PhysicalActivity Levels
% o
f Tea
cher
Res
pond
ents
Table 3: Teacher Observations of Student's Knowledge and Behaviors Related to Physical Activity
FFY2017 SNAP-Ed Annual Report 474 January 2018
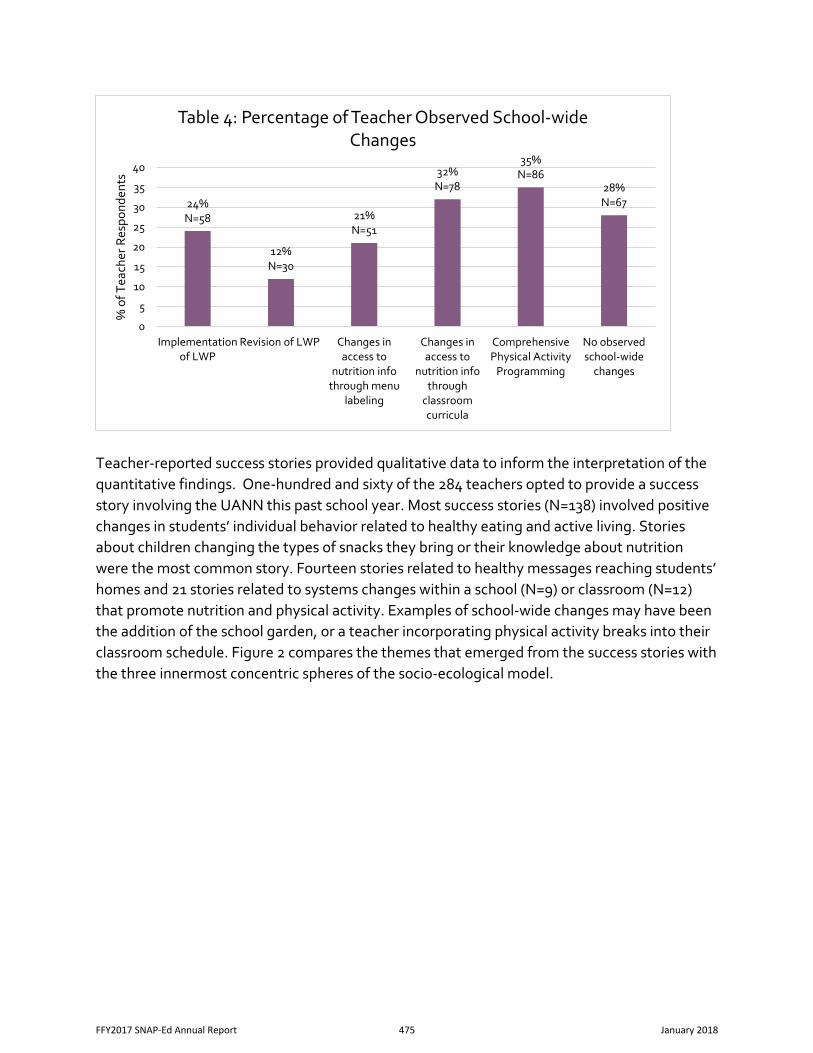
Teacher-reported success stories provided qualitative data to inform the interpretation of the quantitative findings. One-hundred and sixty of the 284 teachers opted to provide a success story involving the UANN this past school year. Most success stories (N=138) involved positive changes in students’ individual behavior related to healthy eating and active living. Stories about children changing the types of snacks they bring or their knowledge about nutrition were the most common story. Fourteen stories related to healthy messages reaching students’ homes and 21 stories related to systems changes within a school (N=9) or classroom (N=12) that promote nutrition and physical activity. Examples of school-wide changes may have been the addition of the school garden, or a teacher incorporating physical activity breaks into their classroom schedule. Figure 2 compares the themes that emerged from the success stories with the three innermost concentric spheres of the socio-ecological model.
24%N=58
12%N=30
21%N=51
32%N=78
35% N=86
28%N=67
0
5
10
15
20
25
30
35
40
Implementationof LWP
Revision of LWP Changes inaccess to
nutrition infothrough menu
labeling
Changes inaccess to
nutrition infothrough
classroomcurricula
ComprehensivePhysical Activity
Programming
No observedschool-wide
changes
% o
f Tea
cher
Res
pond
ents
Table 4: Percentage of Teacher Observed School-wide Changes
FFY2017 SNAP-Ed Annual Report 475 January 2018
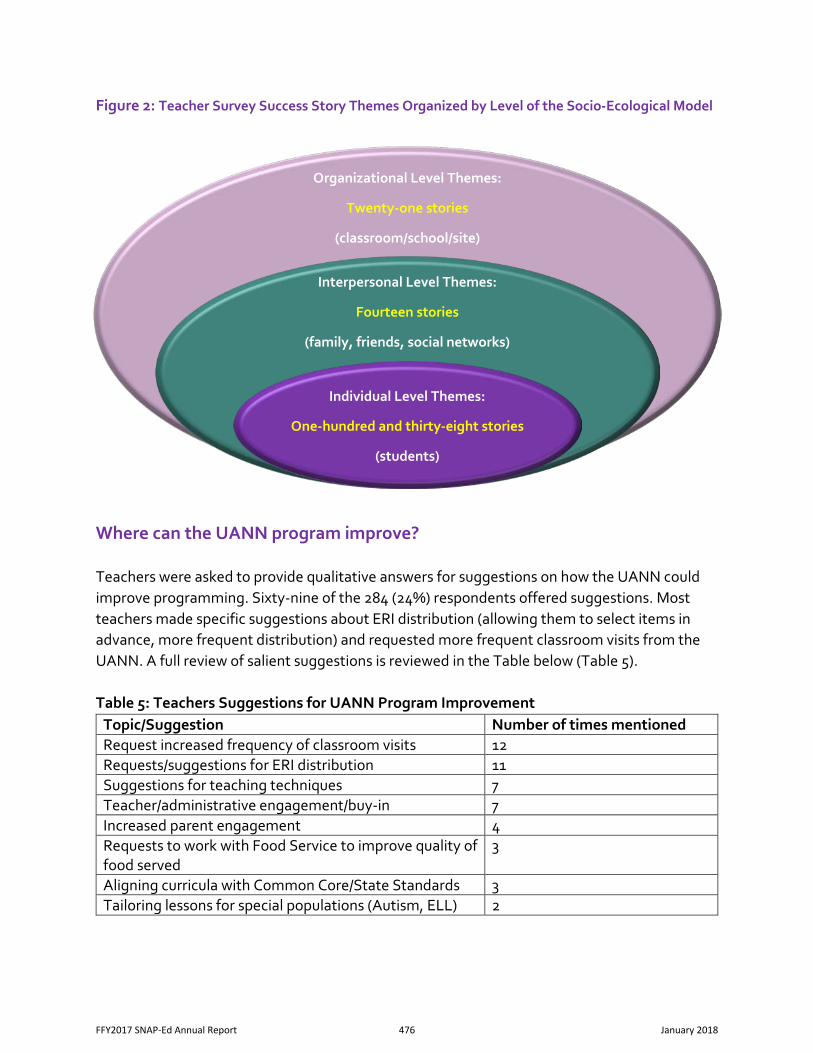
Figure 2: Teacher Survey Success Story Themes Organized by Level of the Socio-Ecological Model
Where can the UANN program improve? Teachers were asked to provide qualitative answers for suggestions on how the UANN could improve programming. Sixty-nine of the 284 (24%) respondents offered suggestions. Most teachers made specific suggestions about ERI distribution (allowing them to select items in advance, more frequent distribution) and requested more frequent classroom visits from the UANN. A full review of salient suggestions is reviewed in the Table below (Table 5). Table 5: Teachers Suggestions for UANN Program Improvement
Topic/Suggestion Number of times mentioned Request increased frequency of classroom visits 12 Requests/suggestions for ERI distribution 11 Suggestions for teaching techniques 7 Teacher/administrative engagement/buy-in 7 Increased parent engagement 4 Requests to work with Food Service to improve quality of food served
3
Aligning curricula with Common Core/State Standards 3 Tailoring lessons for special populations (Autism, ELL) 2
Interpersonal Level Themes:
Fourteen stories
(family, friends, social networks)
Organizational Level Themes:
Twenty-one stories
(classroom/school/site)
Individual Level Themes:
One-hundred and thirty-eight stories
(students)
FFY2017 SNAP-Ed Annual Report 476 January 2018
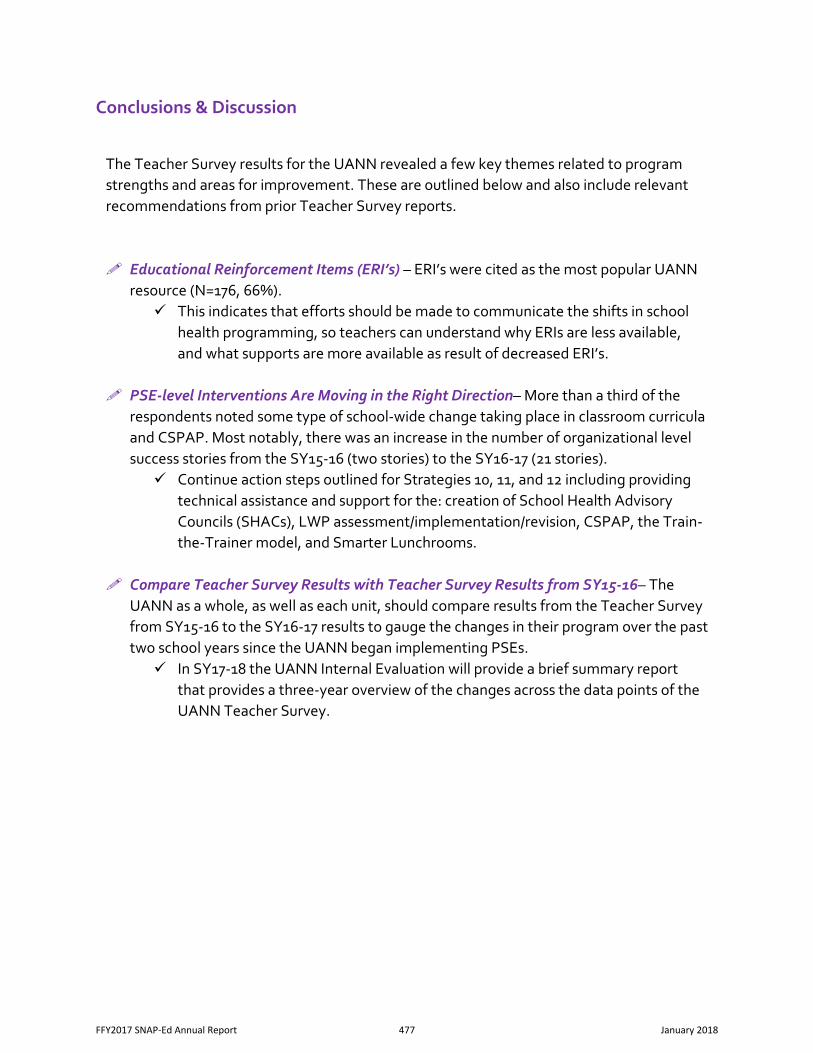
Conclusions & Discussion
The Teacher Survey results for the UANN revealed a few key themes related to program strengths and areas for improvement. These are outlined below and also include relevant recommendations from prior Teacher Survey reports.
Educational Reinforcement Items (ERI’s) – ERI’s were cited as the most popular UANN resource (N=176, 66%). This indicates that efforts should be made to communicate the shifts in school
health programming, so teachers can understand why ERIs are less available, and what supports are more available as result of decreased ERI’s.
PSE-level Interventions Are Moving in the Right Direction– More than a third of the respondents noted some type of school-wide change taking place in classroom curricula and CSPAP. Most notably, there was an increase in the number of organizational level success stories from the SY15-16 (two stories) to the SY16-17 (21 stories). Continue action steps outlined for Strategies 10, 11, and 12 including providing
technical assistance and support for the: creation of School Health Advisory Councils (SHACs), LWP assessment/implementation/revision, CSPAP, the Train-the-Trainer model, and Smarter Lunchrooms.
Compare Teacher Survey Results with Teacher Survey Results from SY15-16– The UANN as a whole, as well as each unit, should compare results from the Teacher Survey from SY15-16 to the SY16-17 results to gauge the changes in their program over the past two school years since the UANN began implementing PSEs. In SY17-18 the UANN Internal Evaluation will provide a brief summary report
that provides a three-year overview of the changes across the data points of the UANN Teacher Survey.
FFY2017 SNAP-Ed Annual Report 477 January 2018
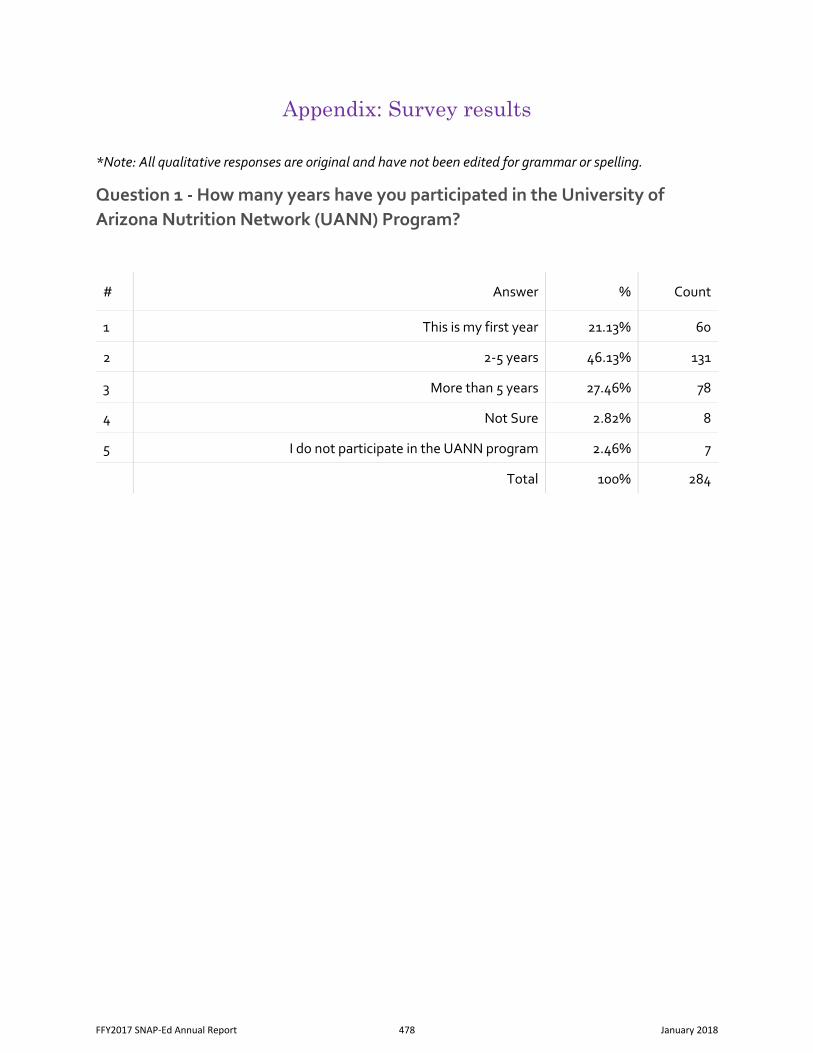
Appendix: Survey results
*Note: All qualitative responses are original and have not been edited for grammar or spelling.
Question 1 - How many years have you participated in the University of Arizona Nutrition Network (UANN) Program?
# Answer % Count
1 This is my first year 21.13% 60
2 2-5 years 46.13% 131
3 More than 5 years 27.46% 78
4 Not Sure 2.82% 8
5 I do not participate in the UANN program 2.46% 7
Total 100% 284
FFY2017 SNAP-Ed Annual Report 478 January 2018
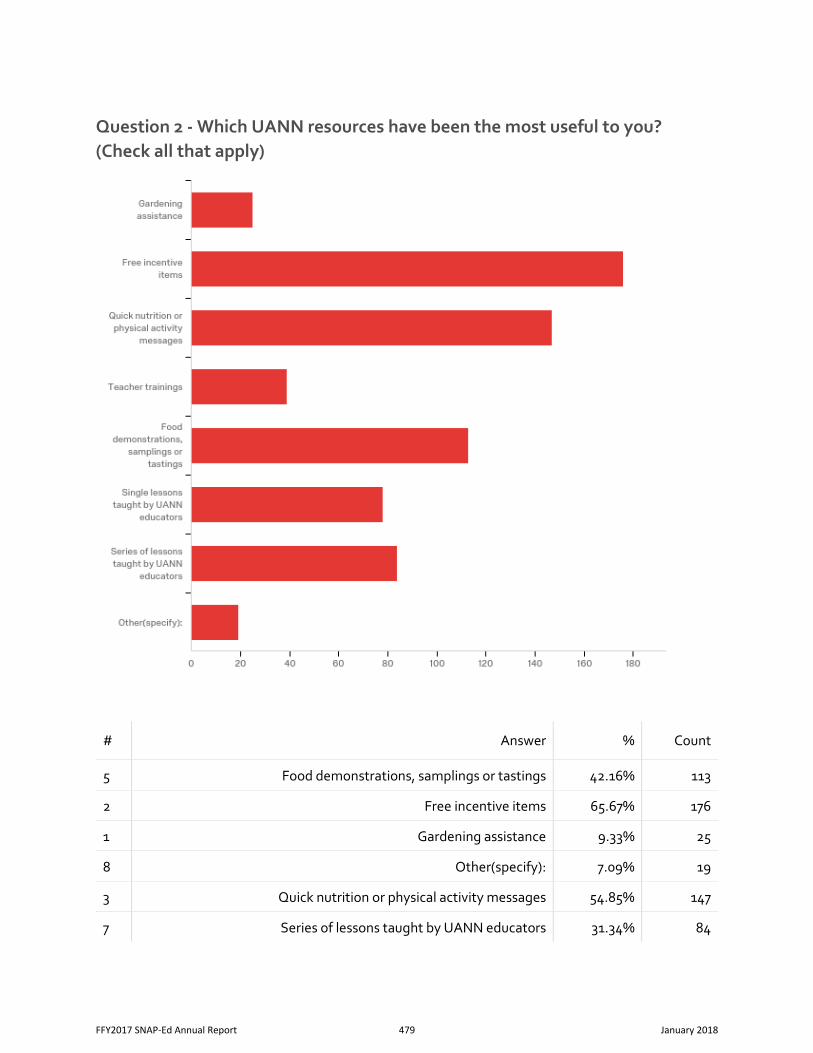
Question 2 - Which UANN resources have been the most useful to you? (Check all that apply)
# Answer % Count
5 Food demonstrations, samplings or tastings 42.16% 113
2 Free incentive items 65.67% 176
1 Gardening assistance 9.33% 25
8 Other(specify): 7.09% 19
3 Quick nutrition or physical activity messages 54.85% 147
7 Series of lessons taught by UANN educators 31.34% 84
FFY2017 SNAP-Ed Annual Report 479 January 2018
6 Single lessons taught by UANN educators 29.10% 78
4 Teacher trainings 14.55% 39
Total 100% 268
Other(specify):
Other(specify):
Guidance by UANN staff
help students to understand the value of what they eat
Lending Library
Material given such as food chart, make my plate chart, visual food manipulatives
Lesson activity cards
FitBit Games
This year we only had UANN educators give short presentations. I found the booklet given to us at the beginning of the year useful.
none
Assistance with our SHAC
Students reaction when they see these ladies arrive, they love having them in our class. Very educational and hands on approach. Coming in and showing what else the students, parents and teachers can do with the U of A walk at the u, the agriculture garden
food demo kit
website - kinder mini books
Nutritional Resources I found online that I can use with my reading groups. We only have 30 minutes each, so I try to keep the content short and something they can read and discuss.
I have not had contact this year.
Links and Lessons provided on the website
Wellness Week support
Volunteer at school and community events
classroom materials
FFY2017 SNAP-Ed Annual Report 480 January 2018
Question 3 - What motivates you to participate in the UANN program?
What motivates you to participate in the UANN program?
health
To give my students time to educate them how to eat right and stay fit
Schoolwide Program My kinders love the individual lessons taught by UANN when you bring in food :)
The free items my students can take home and use in the course of the year.
The materials are high quality and well thought out for student health and wellness education.
I love how excited the kids get about trying food they would never try otherwise and liking them.
My students enjoy the program immensely. They learn so many valuable life skills from the program.
The assistance with the Gardening Program. Also having curriculum on health and wellness for our self contained special education program The students are motivated to learn about health topics because of the free things that are sent to for us to give them. Giving my student free literature about nutrition issues, suggesting quick and fun exercises and items that promotes better health.
The awesome materials ans support provided.
The lessons are easy and great knowledge for areas that need fill-ins.
Great incentives for students
Promoting healthy habits for the students and the teacher.
Lesson and necessary things to tach with.
The information that is available to use in my classroom and share with other teachers at my school site. Great information for students about healthy choices, which doesn't often get discussed in schools, but is so important
it helps kids
I want to promote healthy eating for my students. Many have never tried eating different kinds of fruits or vegetables.
Wellness. Incentives.
The excitement my students have when tasting new/different vegetables than what they have experience with.
the health and wellbeing of my students
Our population needs to learn facts about nutrition
FFY2017 SNAP-Ed Annual Report 481 January 2018
Teaching the students about good nutrition
My students love the the items. As an incentive, these items are very motivating.
Helps our students to lead healthier lives!
The incentives remind me to keep talking to the kids. The informative emails are helpful as well. Knowing these kids are our future is motivation for me. It is just hard to remember to keep encouraging.
The exposure my students get to healthy eating choices.
kids enjoy looking forward to fun incentives which makes the lessons even more enjoyable
My weight struggles.
Need to establish good nutrition for our kiddos
The incentives
I believe that it is extremely important that the students know about nutrition.
It was receiving different fruits and vegetables but we didn't receive them this year.
I like teaching about how to stay healthy and active.
gifts, booklets
The incentives. I didn't realize that someone could come and teach a lesson in the classroom. I would like more information on that.
Monthly incentives and access to the lending library
Students love to interact and learn new things that are helpful from an adult, this takes them away from the regular class routine.
Being able to have a healthy, nutrition, and food component to my curriculum.
Fun free activities
My students are interested so it motivates me to get them the information.
I participate in the UANN program because students need health lessons that are not being taught anywhere else. Also because kids need to know that importance of taking care physically and mentally.
Teaching importance of healthy and regarding nutrition to students.
just wanted to
The positive effects it has on my students
Students are not as active as they used to be. Another concern is the junk that students bring as snacks. Most do not have healthy eating habits, so we need to teach them and guide them into making their own choices.
The knowledge and demonstrations provided to the students
FFY2017 SNAP-Ed Annual Report 482 January 2018
The easy, ready-made lesson plans, fun activities and incentives available to students
All the ideas they have to share.
The need for our students to be healthly and knowlegdeable reqarding the choices they make.
I am learning as well as my students. Students are engaged in the activities and the food suggestions and ways to prepare are very helpful.
quick and easy
The kids enjoy the prizes and like the Fit Bit lessons.
seeing my students learn about ways to stay healthy.
Building a relationship with the community and using their resources to develop nutritional awareness among our diversified school population.
It's availability.
We have representatives who come in to do the lessons with the students.
I enjoy seeing my students grow in their understanding of health and sustainable living.
The opportunity for my students to have out of the classroom routine experiences.
I think it is important for our students to learn about nutrition and physical activity.
Teaching Children about good eating and excerise.
My school offwrs this opportuniry for our curriculum.
I feel that nutrition and healthy lifestyle choices are important to teach early
I believe that it is important for our students to learn about nutrition.
I enjoy having my students learn how to live a healthy life.
My students' healthy conditions.
The UANN teachers teaching.
the excitement from my students when they know Ms. Casi will be coming to teach a lesson.
The main motivation is to keep the important ideas of nutrition and healthy living as a consistent topic and message that is being discussed and presented in the classroom.
nutrition education
What motivates me to participate in the UANN program is that I am a U of A Grad and I know students are learning life skill that will benefit their well-being. The students get so excited when they know they are going to recieve good healthy information and little tid bits at the end makes it rewarding
Student health education is important.
Wellness for the students
FFY2017 SNAP-Ed Annual Report 483 January 2018
The expertise of the Instructors and a change of pace for my Students.
I love to bring in new material to the classroom.
The instructors are amazing and motivating. I've worked with Lizzy for a number of fine years!
Students will get additional nutrition information
Great program very helpful
Students receive good nutritional, heath information
This is a good program for students.
Anything to help Bisbee High!
The quality of the lessons.
Resources and physical fitness opportunities for children.
Concern that students receive accurate nutrition and health information.
Love the motivation that these ladies create in our learning environment with our kids.
It motivates me to learn and teach my students on how to be healthy and do exercise.
I like my students to be exposed to different topics and by different people.
The way my students react. They absolutely love it.
More knowlege on healthy eating for my students.
We don't have a "health" program (other than PE) and I know students need education in this area
Quality of program
Promote change and healthy lifestyles
the incentives
The Garden
lifelong interest in nutrition so teaching students is natural
This program is a great way to incorporate life sciences into our students academic knowledge.
Quick questionnaires at the end of each month. Don't have to keep track of a lot of information
What motivates me to participate in the UANN program is that there is so much our students can learn from these nutrition lessons Great lessons taught by the staff! Children look forward to the group coming and putting on the presentations.
Love teaching students importance of balance, life skills
FFY2017 SNAP-Ed Annual Report 484 January 2018
Help the children which for whatever reason, did not have their morning breakfast.
Its good to have an established program to define health guidelines.
increase knowledge for parents
My students' health! And they are so excited to learn lessons about eating right, the importance of exercise and drinking water, etc.
Great for kids
The extra gardening help has been key to getting our Garden started at Holiday Park. The supplies and garden boxes are so helpful and have been truly a blessing for our LFI Garden Program. the program is give teacher flexibility to implement the program since teacher have an open range of topics to discuss through the day/year. Information and incentives sent by the UANN program also motive student and teachers to keep active and follow a more nutritional meal plan
resources available for staff children and parents.
Good information to share with parents participating in Head Start Program
Making sure to get kids and myself healthy. Learning about new recipes and getting incentives when we do things with the U of A.
The students enjoy it and I love the online resources
We almost have to.
Educating students about living healthier lifestyles...the incentives motivate the students to want to learn more Co-workers and a visit by one of your educators to a Professional Development at the beginning of the year.
lessons by uann representatives and incentives for students
Looking for real life activities that students can use in their own homes.
It is very motivating to use healthy food options when discussing any subject. I have changed my way of thinking when explaining various subjects--instead of cookies and cakes as examples, I now use fruits and veggies. I have also encouraged students to bring healthier lunch items throughout the year. Teacher motivation to educate students on healthy habits. Helping out children grow up and learn healthy habits. Incentives are always nice:-)
I know I will get timely assistance from the office staff as well as my requests filled
I want my students to have this information so they are more likely to make better choices in the future. My students are intrinsically motivated so having the prizes gets the kids excited and reminds me that I can integrate health concepts in my curriculum.
As Physical Educator I see the importance of my students knowing why they need to healthy.
kids love it because its stuff they can relate to
Making sure that I am talking to my students about the importance of health and healthy eating. Incentives
FFY2017 SNAP-Ed Annual Report 485 January 2018
To continue to incooperate the free the incentives into my Health Units all throughout the school year. The variety of health topics that can be covered over a long period of time during the school year.
it is there
The look on the children's face when we introduce new foods to the students.
I just learned about it this year. It sounded easy to add to my day and is important information for my students.
informing the students of how to live a healthy life
The students enjoy it and I enjoy the gardening aspect and relating it to content in the classroom.
ctrating healthy and happy students.
The students get excited when we talk about eating healthy.
The importance of children making positive nutritional choices and physical activities. Many of our students do not eat properly and don't have a place to play that is safe. Knowing what they can eat and do to stay healthy is beneficial.
My students
Chance to share nutritional information with my students and "cool" rewards that they look forward to seeing what we have earned.
The students really like it.
Teaching students how to eat better and learn more about nutrition.
Giving my students the incentives.
Incentives for student
This is the only way our students learn about health.
great resource
free stuff :)
Guest speaker coming in to teach my students about nutrition and freebies.
Normally, student incentives. Prior years UANN's contribution to our field day.
learning and teaching on how to improve our healthy eating
The children need to gain knowledge of the different food groups and fun ways to exercise.
Healthy eating
School wide
Helping my 1st graders make healthy choices
Good for students.
FFY2017 SNAP-Ed Annual Report 486 January 2018
requirement
the health and wellness of the students and families in our community.
Students need to learn about proper nutrition so they can educate themselves and their families. The UANN instructors are very knowledgeable and are sending a great message to the youth.
the idea of being active and healthy
Resources provided to teachers, incentives
Trying to keep myself fit and to show the students how they can stay fit as well.
The UANN program provides extra resources to teach about nutrition and physical activity.
healthy eating for students
Free incentives
have always been interested in nutrition and have incorporated in all interaction when appliable to students and adults Helping students understand how important maintaining healthy living styles now will help them maintain those choices in the future.
To help out our site facilitator, Debbie Garcia
Free incentives, student competitions, lessons provided
I appreciate the support the program gives us in fulfilling our school's wellness goals.
It is supplemental to gaps in our curriculum.
Grant opportunities for teachers.
Breakfast in the classroom since we are a Title 1 school and so many students are hungry.
The good information about health and nutrition. The support staff available which makes the program easy to use. Want to provide my students with nutrition lessons early in life that they can use make healthy food choices.
Having students understand the tenets of good nutrition.
All of the helpful and useful info
It helps the students be more aware of nutrition
I enjoy helping students lead healthier lives.
I think it's important that I reach out to my students and teach them about health and nutrition.
Every little bit helps. I know that if I log hours our school might earn small incentives.
Reminders of living a healthy lifestyle.
The knowledge my students gain from Jennifer Staples. She is an amazing presenter! the kids love her and cant wait for her to come to our school!
FFY2017 SNAP-Ed Annual Report 487 January 2018
getting the kids involved in eating well
It is fun for the kids. It makes a great filler on not so busy or test days. The information is good and the activities are educational and entertaining. Jennifer Staples makes nutrient fun and a great learning experience for students, teachers and parents. Mrs. Staples comes in and gives lessons on nutrition and gives examples and samples of nutritious snacks. We all (staff and students) love the experience. Jennifer Staples is awesome! Teachers and students absolutely LOVE when she comes. She is extremely knowledgable and always makes the lessons fun!
I enjoy learning new things about nutrition and sharing them with my students.
it is a great tool for an educator to use when teaching students about nutrition
Watching my students try food they would have never tried is pretty fun to see.
Connie Lorenz has always encouraged teachers to participate. She always so helpful and motivates my students to want to continue the program.
That class gets to participate.
Helping students understand there is a healthy alternative for their snacks and teaching them that activity is as much fun as video games.
Great information
The kids do like the book.
Food
Elba Lorenz personality
FFY2017 SNAP-Ed Annual Report 488 January 2018
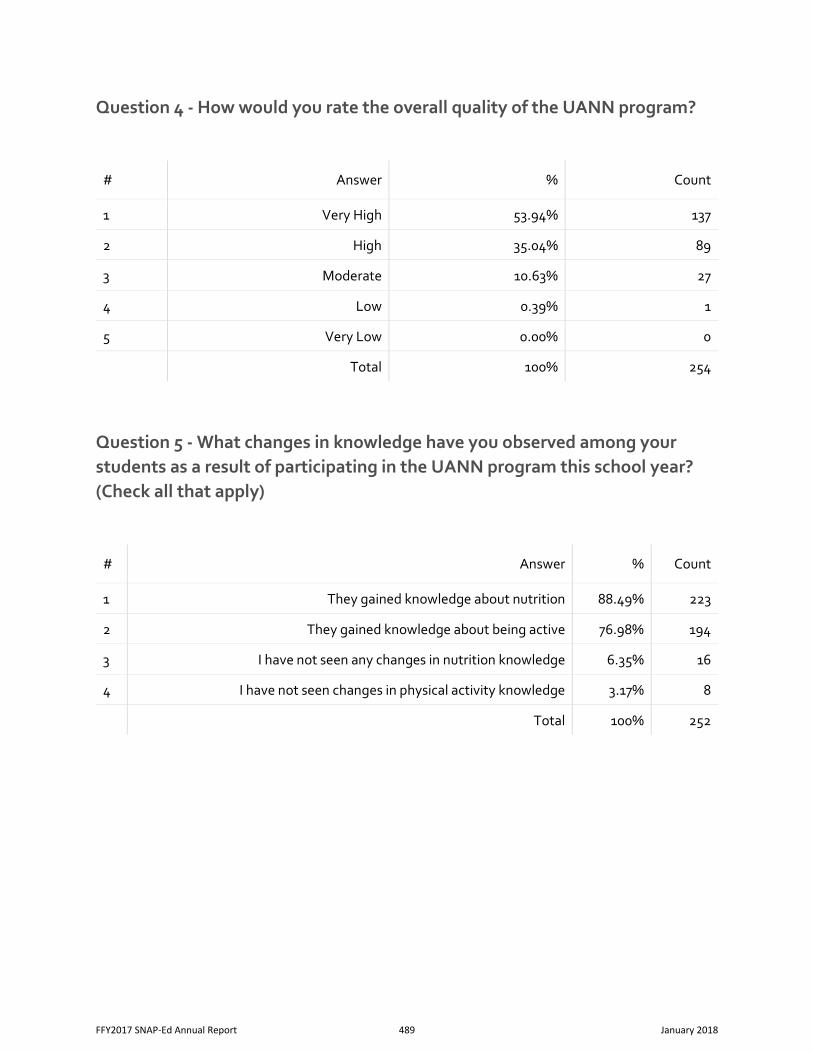
Question 4 - How would you rate the overall quality of the UANN program?
# Answer % Count
1 Very High 53.94% 137
2 High 35.04% 89
3 Moderate 10.63% 27
4 Low 0.39% 1
5 Very Low 0.00% 0
Total 100% 254
Question 5 - What changes in knowledge have you observed among your students as a result of participating in the UANN program this school year? (Check all that apply)
# Answer % Count
1 They gained knowledge about nutrition 88.49% 223
2 They gained knowledge about being active 76.98% 194
3 I have not seen any changes in nutrition knowledge 6.35% 16
4 I have not seen changes in physical activity knowledge 3.17% 8
Total 100% 252
FFY2017 SNAP-Ed Annual Report 489 January 2018
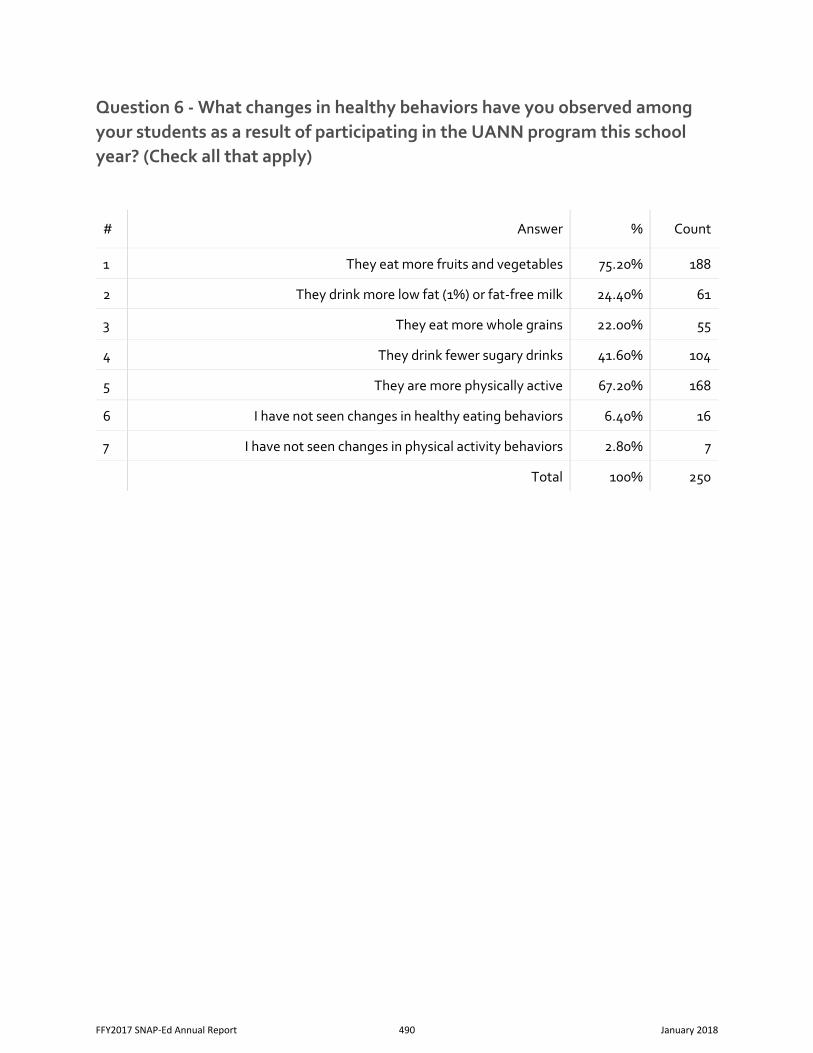
Question 6 - What changes in healthy behaviors have you observed among your students as a result of participating in the UANN program this school year? (Check all that apply)
# Answer % Count
1 They eat more fruits and vegetables 75.20% 188
2 They drink more low fat (1%) or fat-free milk 24.40% 61
3 They eat more whole grains 22.00% 55
4 They drink fewer sugary drinks 41.60% 104
5 They are more physically active 67.20% 168
6 I have not seen changes in healthy eating behaviors 6.40% 16
7 I have not seen changes in physical activity behaviors 2.80% 7
Total 100% 250
FFY2017 SNAP-Ed Annual Report 490 January 2018
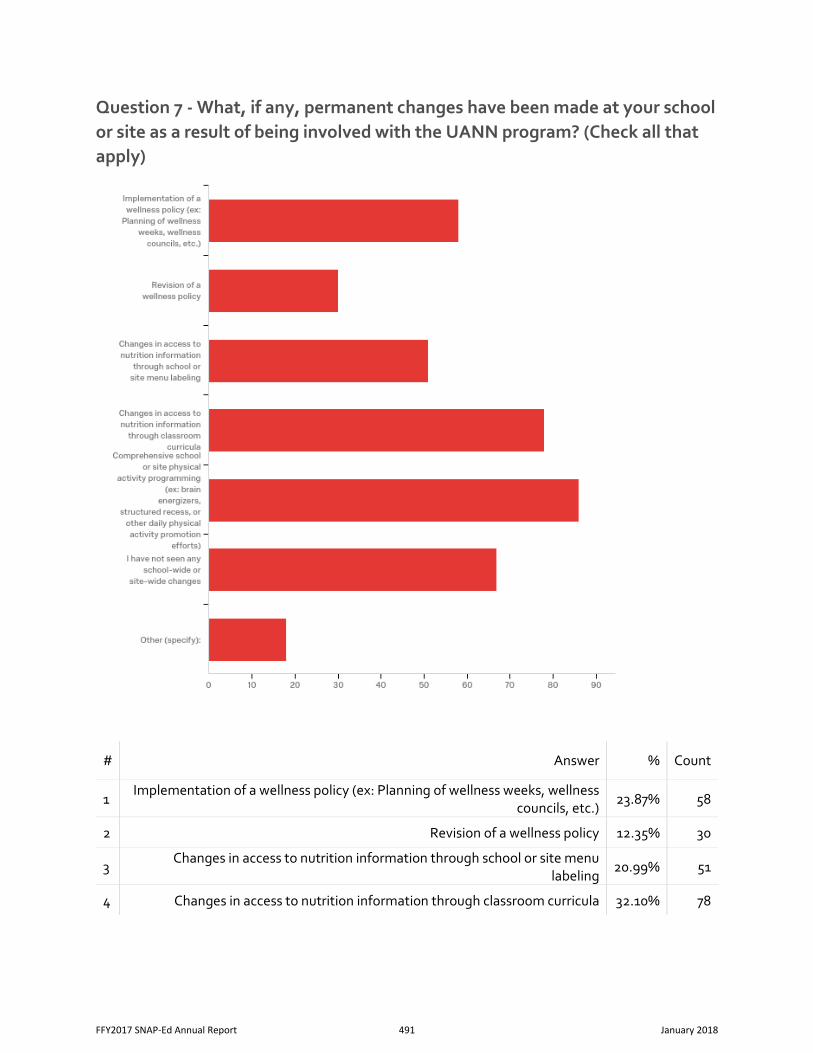
Question 7 - What, if any, permanent changes have been made at your school or site as a result of being involved with the UANN program? (Check all that apply)
# Answer % Count
1 Implementation of a wellness policy (ex: Planning of wellness weeks, wellness
councils, etc.) 23.87% 58
2 Revision of a wellness policy 12.35% 30
3 Changes in access to nutrition information through school or site menu
labeling 20.99% 51
4 Changes in access to nutrition information through classroom curricula 32.10% 78
FFY2017 SNAP-Ed Annual Report 491 January 2018
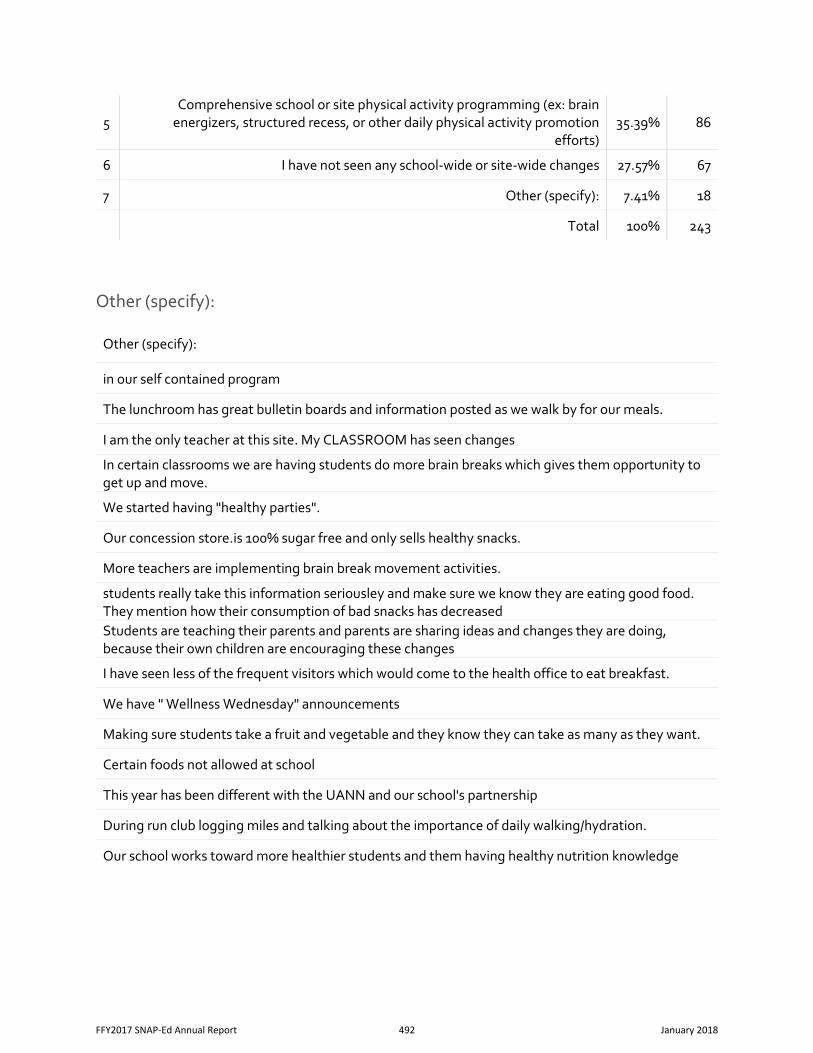
5 Comprehensive school or site physical activity programming (ex: brain
energizers, structured recess, or other daily physical activity promotion efforts)
35.39% 86
6 I have not seen any school-wide or site-wide changes 27.57% 67
7 Other (specify): 7.41% 18
Total 100% 243
Other (specify):
Other (specify):
in our self contained program
The lunchroom has great bulletin boards and information posted as we walk by for our meals.
I am the only teacher at this site. My CLASSROOM has seen changes
In certain classrooms we are having students do more brain breaks which gives them opportunity to get up and move.
We started having "healthy parties".
Our concession store.is 100% sugar free and only sells healthy snacks.
More teachers are implementing brain break movement activities.
students really take this information seriousley and make sure we know they are eating good food. They mention how their consumption of bad snacks has decreased Students are teaching their parents and parents are sharing ideas and changes they are doing, because their own children are encouraging these changes
I have seen less of the frequent visitors which would come to the health office to eat breakfast.
We have " Wellness Wednesday" announcements
Making sure students take a fruit and vegetable and they know they can take as many as they want.
Certain foods not allowed at school
This year has been different with the UANN and our school's partnership
During run club logging miles and talking about the importance of daily walking/hydration.
Our school works toward more healthier students and them having healthy nutrition knowledge
FFY2017 SNAP-Ed Annual Report 492 January 2018
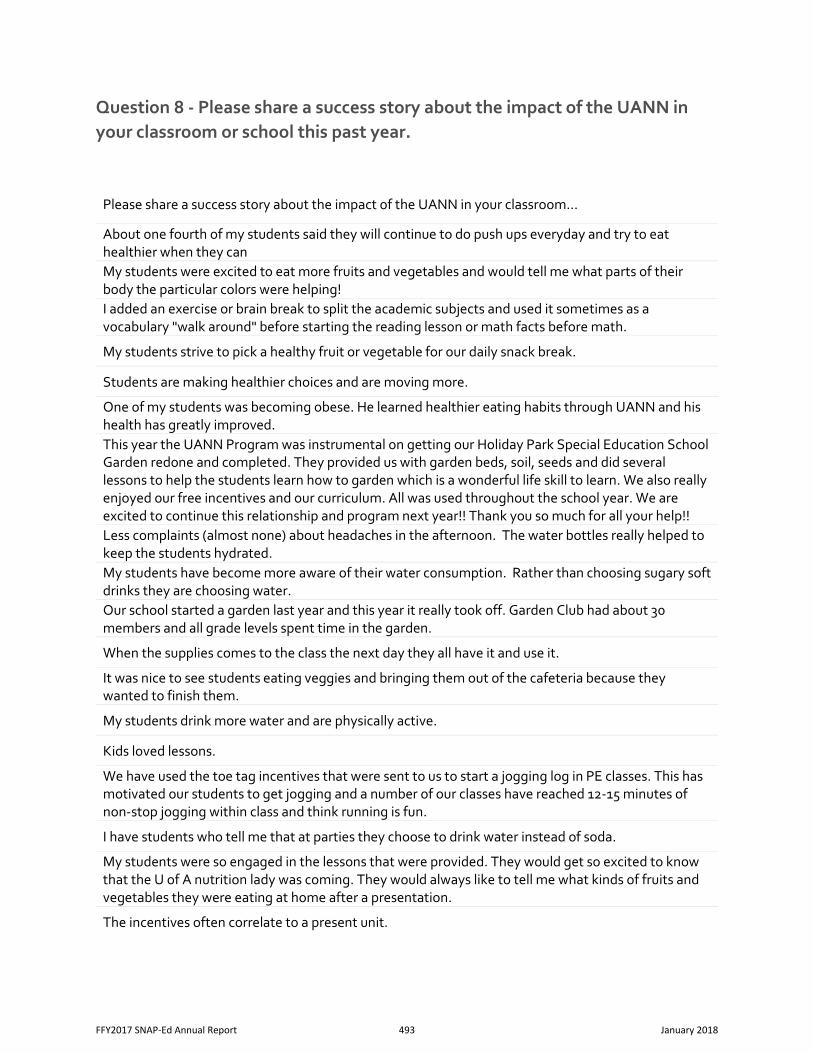
Question 8 - Please share a success story about the impact of the UANN in your classroom or school this past year.
Please share a success story about the impact of the UANN in your classroom...
About one fourth of my students said they will continue to do push ups everyday and try to eat healthier when they can My students were excited to eat more fruits and vegetables and would tell me what parts of their body the particular colors were helping! I added an exercise or brain break to split the academic subjects and used it sometimes as a vocabulary "walk around" before starting the reading lesson or math facts before math.
My students strive to pick a healthy fruit or vegetable for our daily snack break.
Students are making healthier choices and are moving more.
One of my students was becoming obese. He learned healthier eating habits through UANN and his health has greatly improved. This year the UANN Program was instrumental on getting our Holiday Park Special Education School Garden redone and completed. They provided us with garden beds, soil, seeds and did several lessons to help the students learn how to garden which is a wonderful life skill to learn. We also really enjoyed our free incentives and our curriculum. All was used throughout the school year. We are excited to continue this relationship and program next year!! Thank you so much for all your help!! Less complaints (almost none) about headaches in the afternoon. The water bottles really helped to keep the students hydrated. My students have become more aware of their water consumption. Rather than choosing sugary soft drinks they are choosing water. Our school started a garden last year and this year it really took off. Garden Club had about 30 members and all grade levels spent time in the garden.
When the supplies comes to the class the next day they all have it and use it.
It was nice to see students eating veggies and bringing them out of the cafeteria because they wanted to finish them.
My students drink more water and are physically active.
Kids loved lessons.
We have used the toe tag incentives that were sent to us to start a jogging log in PE classes. This has motivated our students to get jogging and a number of our classes have reached 12-15 minutes of non-stop jogging within class and think running is fun.
I have students who tell me that at parties they choose to drink water instead of soda.
My students were so engaged in the lessons that were provided. They would get so excited to know that the U of A nutrition lady was coming. They would always like to tell me what kinds of fruits and vegetables they were eating at home after a presentation.
The incentives often correlate to a present unit.
FFY2017 SNAP-Ed Annual Report 493 January 2018
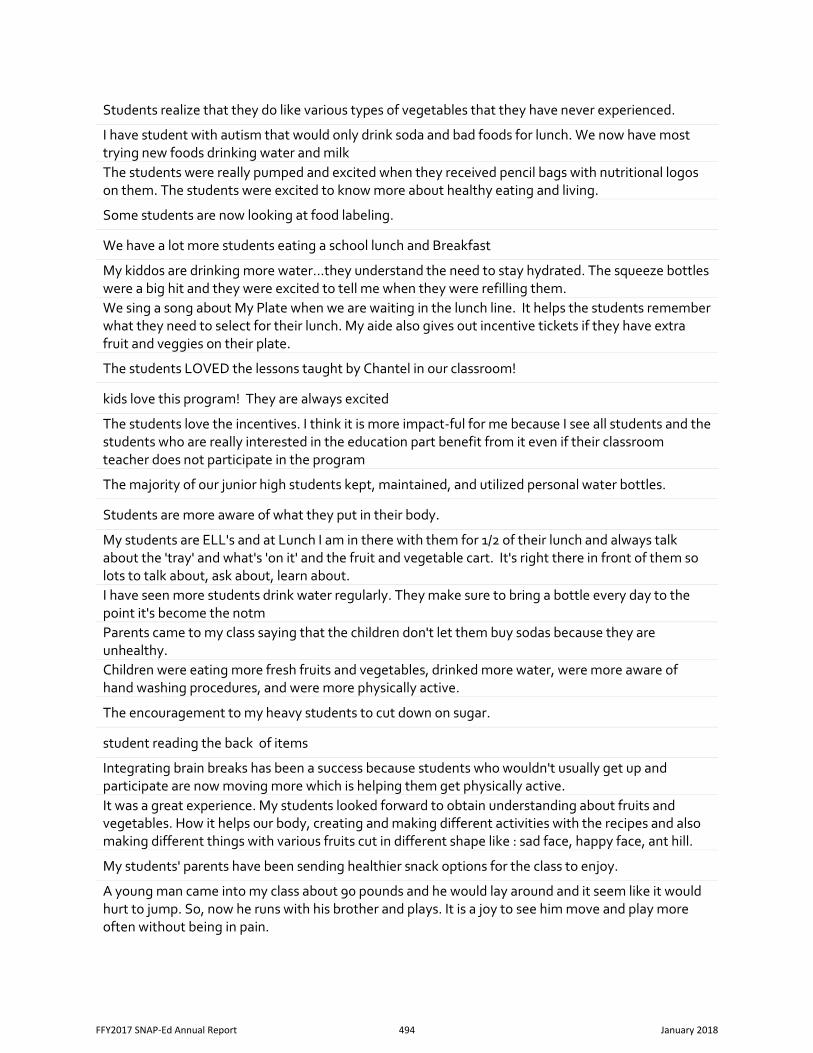
Students realize that they do like various types of vegetables that they have never experienced.
I have student with autism that would only drink soda and bad foods for lunch. We now have most trying new foods drinking water and milk The students were really pumped and excited when they received pencil bags with nutritional logos on them. The students were excited to know more about healthy eating and living.
Some students are now looking at food labeling.
We have a lot more students eating a school lunch and Breakfast
My kiddos are drinking more water...they understand the need to stay hydrated. The squeeze bottles were a big hit and they were excited to tell me when they were refilling them. We sing a song about My Plate when we are waiting in the lunch line. It helps the students remember what they need to select for their lunch. My aide also gives out incentive tickets if they have extra fruit and veggies on their plate.
The students LOVED the lessons taught by Chantel in our classroom!
kids love this program! They are always excited
The students love the incentives. I think it is more impact-ful for me because I see all students and the students who are really interested in the education part benefit from it even if their classroom teacher does not participate in the program
The majority of our junior high students kept, maintained, and utilized personal water bottles.
Students are more aware of what they put in their body.
My students are ELL's and at Lunch I am in there with them for 1/2 of their lunch and always talk about the 'tray' and what's 'on it' and the fruit and vegetable cart. It's right there in front of them so lots to talk about, ask about, learn about. I have seen more students drink water regularly. They make sure to bring a bottle every day to the point it's become the notm Parents came to my class saying that the children don't let them buy sodas because they are unhealthy. Children were eating more fresh fruits and vegetables, drinked more water, were more aware of hand washing procedures, and were more physically active.
The encouragement to my heavy students to cut down on sugar.
student reading the back of items
Integrating brain breaks has been a success because students who wouldn't usually get up and participate are now moving more which is helping them get physically active. It was a great experience. My students looked forward to obtain understanding about fruits and vegetables. How it helps our body, creating and making different activities with the recipes and also making different things with various fruits cut in different shape like : sad face, happy face, ant hill.
My students' parents have been sending healthier snack options for the class to enjoy.
A young man came into my class about 90 pounds and he would lay around and it seem like it would hurt to jump. So, now he runs with his brother and plays. It is a joy to see him move and play more often without being in pain.
FFY2017 SNAP-Ed Annual Report 494 January 2018
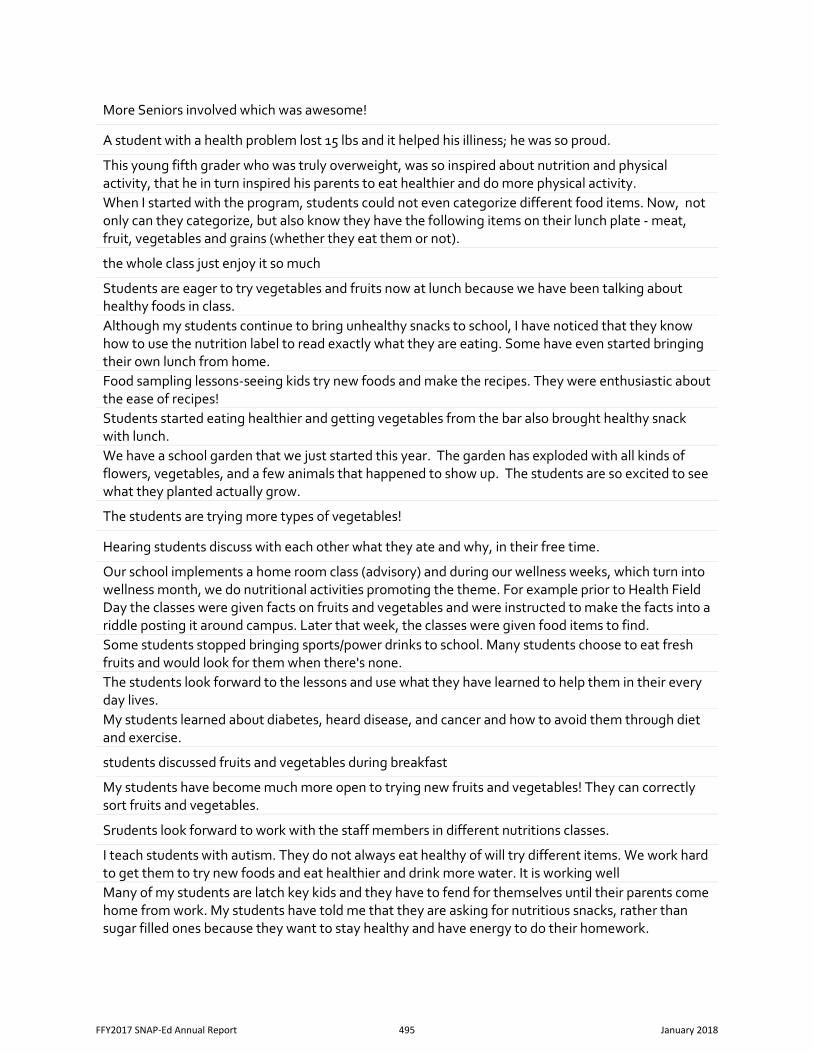
More Seniors involved which was awesome!
A student with a health problem lost 15 lbs and it helped his illiness; he was so proud.
This young fifth grader who was truly overweight, was so inspired about nutrition and physical activity, that he in turn inspired his parents to eat healthier and do more physical activity. When I started with the program, students could not even categorize different food items. Now, not only can they categorize, but also know they have the following items on their lunch plate - meat, fruit, vegetables and grains (whether they eat them or not).
the whole class just enjoy it so much
Students are eager to try vegetables and fruits now at lunch because we have been talking about healthy foods in class. Although my students continue to bring unhealthy snacks to school, I have noticed that they know how to use the nutrition label to read exactly what they are eating. Some have even started bringing their own lunch from home. Food sampling lessons-seeing kids try new foods and make the recipes. They were enthusiastic about the ease of recipes! Students started eating healthier and getting vegetables from the bar also brought healthy snack with lunch. We have a school garden that we just started this year. The garden has exploded with all kinds of flowers, vegetables, and a few animals that happened to show up. The students are so excited to see what they planted actually grow.
The students are trying more types of vegetables!
Hearing students discuss with each other what they ate and why, in their free time.
Our school implements a home room class (advisory) and during our wellness weeks, which turn into wellness month, we do nutritional activities promoting the theme. For example prior to Health Field Day the classes were given facts on fruits and vegetables and were instructed to make the facts into a riddle posting it around campus. Later that week, the classes were given food items to find. Some students stopped bringing sports/power drinks to school. Many students choose to eat fresh fruits and would look for them when there's none. The students look forward to the lessons and use what they have learned to help them in their every day lives. My students learned about diabetes, heard disease, and cancer and how to avoid them through diet and exercise.
students discussed fruits and vegetables during breakfast
My students have become much more open to trying new fruits and vegetables! They can correctly sort fruits and vegetables.
Srudents look forward to work with the staff members in different nutritions classes.
I teach students with autism. They do not always eat healthy of will try different items. We work hard to get them to try new foods and eat healthier and drink more water. It is working well Many of my students are latch key kids and they have to fend for themselves until their parents come home from work. My students have told me that they are asking for nutritious snacks, rather than sugar filled ones because they want to stay healthy and have energy to do their homework.
FFY2017 SNAP-Ed Annual Report 495 January 2018
We didn't get many visits this year and when we did it was only lecture.
Students know the benefits of each veggie and fruit by their colors.
My students are washing their hands more, drinking more water, and being more active. I loved the lesson about using an old toothbrush to wash under their nails.
All of my students are trying fruits and vegetables more often.
Children are excited to have Ms. case come and teach a lesson.
I have seen students take more responsibility for making healthy choices when it comes to nutrition and what they are eating on a daily basis.
Kids love when the teachers from UANN come in. They learn a lot.
One of my students has changed the way he packs his snacks. Before the UANN and at the beginning of the year this particular student would pack chips and cookies for his snack, as the year progressed and the program implementation continued I noticed he started packing fruits and grain crackers instead of chips and cookies.
When the student brings strawberries in her lunch instead of hot cheetoes
One student said her mom doesn't let her play outside much because she cannot watch her. So exercises to do inside the house in a small space were very beneficial to the girl. One Students was absent on the day the "95210" Lesson was present and his classmates were able to tell him "almost word for word" what the presentation was and ask him what changes would he make. A success story is that I had a student tell me that because of what he has learned this year, he is being more active and eating more healthy. My students always look forward to the "nutrition ladies" coming for a lesson because they make it real and interesting for them. The kids are engaged, smiling, sharing, and learning in a fun way.
Students learn to try new foods, that they would not eat before
Students do not bring as many unhealthy snacks. They share about what healthy snacks they eat at home or bring to schoo.
The students are motivated to learn about foods and exercise.
the teachers Loved Mrs. Ruffo
N/A
My students now remind me of drinking water.
students enjoying and requesting physical activity programs
Plates and portions have helped one family research and educate themselves of appropriate portions and that research lead to finding healthy recipes and various options available. The success story in this year is that my students got the opportunity to plant a seed and they are learning the process how plants grow. Also they used a water bottle to recycle and there they put there seed to grow. Also my students are doing more physical activities in class while we are saying the high frequency words while they are doing jumping jacks.
FFY2017 SNAP-Ed Annual Report 496 January 2018
During testing sessions I used you tube and showed them some exercises, we did them and they kept asking for them during regular time.
The students in my class are very selective on the snacks they bring to class.
Our Birthday celebration snack are mostly healthy, very diffrent from when I started teaching.
After Ms. Casi's visits' I love to hear students scolding each other,"Remember what Ms. Casi said about....(eating too much sweet things....getting up and moving around")
The kids love it and gain so much knowledge. They are soaking up information so readily.
My athletes see the impact of sugary drinks and screen time on their performance.
The children love Marla & Marla shares about good sugars & not good sugars. I love that it aligns with Head Start's curriculum.
model and discuss nutrition with students-most feel motivated to try harder
One of my students went home and shared the plate activity with their parents and the students informed me that they were going to eat healthier at home! In our classroom, students remind each other almost daily about different item that have been previously discussed in our class during the nutrition lesson.
Students actually telling each other what is healthy and not healthy.
Heather has a way of teaching the kids that some healthy foods that they have never tried before can actually be tasty and successfully getting them to try new healthy food as well as liking it. I have a noticed a big change with my students this year with their snack choices! When they get to bring a snack of their choice for special occasions, it's amazing how many of them talk about wanting to bring something healthy that they still really enjoy. This year the UANN has come into our 3 self contained life skills classes and taught lessons on nutrition as well as gardening with the students. This has been so amazing and helpful for our program. They have provided us with nutritional curriculum that we have all 3 incorporated into our daily routines to improve healthy eating and healthy habits and fitness. The 1 minute fitness exercises have been very fun for the kids to complete daily. We have had so much amazing help with starting our school garden. This includes planter boxes, soil, seeds, and mini pots to plant. They have come in 4 times to help us with lessons and planting. the students are more aware of health for example during our Jump for heart week, or during walk a thon day, the students are aware of keeping hydrated and the importance of exercising
Children love Ms. Nichole
Parents have shared that they have made changes to the diet
Students are more aware of healthy eating.
The students eat more fruits and veggies at school.
I LOVE seeing students choosing healthier lunch options (ex: salads) and explaining to me why they are choosing the healthier options! students enjoying the guess the fruit game provided by uann - one of their faves to play on rainy day schedules
FFY2017 SNAP-Ed Annual Report 497 January 2018
I have added physical activity into my daily lesson pans. Students walk around the room in a circle at a good brisk tempo as I read a poem about the next text. We stop and I ask a question about what they heard. It has become a great activity and a mental stimulator.
Students are proud choices and are proud of their decision-making.
I have two students that are really in bad health. They are both overweight and one is already pre-diabetic. Thanks to our class discussions, my class has created a walking schedule and students rotate walking with the students at recess. It has been a team building activity based on nutrition and wellness.
My students like the lessons and have used their water bottles every day.
When I walk into the cafeteria during lunch kids always
my kids go home and tell their parents about what they learned with nutrition
Once I have taught a lesson on what the healthy foods are that you should be eating, some of the students actually go home and tell their parents what healthy foods they should be eating. Students that did not drink milk at all starting to drink milk when informed about the benefits milk has on their bodies. My students use to not want to eat or even try their healthy snack but now I have more students eating them!
about a fourth of the students maintain their weight and increase their pushups count
My students could talk about healthy eating. :)
The students are taking initiative to be more active and make healthier choices. They drink more water each day. Before the lady came in and talked about it and we talked to the kids about eating healthy it was a struggle just getting the kids to grab a fruit and vegetable. Now 90% are excited to take each of them and some take more than one fruit or vegetable.
As we go through the program and activities, students start to talk about healthier choices.
Students excited to come to school to participate in school events.
Students have been looking at the nutrition labels on school food (if there are any) and also options that they can purchase at the store. We are doing nutrition and economic units rights now and the students are having to plan healthful meals while still staying in budget.
My students are more aware of the basic food groups and the size of their servings.
The kids talk about what is a fruit or vegetable.
A few students have used the information to make better food choices, this has led to weight loss and overall improved health
I have seen a great many kids drinking more water.
The children have a better understanding of go and whoa foods. They are more willing to try different foods. They loved the exercises.
More fruits and snacks in classroom
FFY2017 SNAP-Ed Annual Report 498 January 2018
My 1st graders bring snacks every day to share with the class. After 2 nutrition classes, my students started bringing in healthier choices and asking what would be a good snack for the class.
Students asking for a "brain break" or "movement break" to help them concentrate
We taste tested foods at our Family Nights at our school. Both nights were a great success with large numbers of participants and many families verbally praising our school for our continued support and education in Nutrition and physical activities. We were working on an opinion piece for writing and started with a healthy debate: banana vs. cucumber. I was so impressed with how much the students knew about nutrition and how they used their knowledge to "defend" the fruit of choice. Students are constantly trying and tasting vegetables, fruits and grains that they were not familiar to them. Students seem to be more aware of how much sugar/fat is in the snacks they consume on a daily basis after a presentation that was given in class by SNAP ed representative.
I have noticed that more families are helping with that at home fitness part.
Our students always enjoy the healthy snack and recipes that Mrs. Staples provides for us. I hear people say they are going to try the recipe at home.
n/a
model through my own eating, students who garden have a better understanding of nutrition and when asked many can elborate
Healthier students eating healthier
Our AZNN representative aided us greatly during our first wellness week. We were able to offer students great incentives for participating throughout the week and in our Walk-to-school event. I have personally given my students frequent brain breaks throughout the day with structured indoor recess like Go Noodle. Students look forward to it and I can often use it as an incentive in the afternoon for completing work. More students are participating and it gives them a much needed boost at the end of the day. J have a student with serious health issues related to obesity who talks much more clearly about health food choices and physical activity. We were planning our first party and I told the students that we should a healthy food. They groaned but day of the party they enjoyed the fruit, veggies, healthy chips, sandwiches, and juice. Not everthing was healthy but the majority of it was. The next da we discussed how they felt after eating and most students said they felt better. We had a great class discussion about sugar highs and how you can crash after processed sugars. Now I have more students bringing healthy snacks to not only parties but to school in their lunches.
Students are having more conversations about holiday and the "food" we use to celebrate it.
I have students who are eating more fruits and are engaging in more exercise activities.
One overweight student is now a vegeterian because it's healthier and he wants to lose weight.
More emphasis on physical activities during recess, healthy fruits and vegetables
Having Joanie come teach lessons to our students.
Our 5th graders can now all correctly read a food label!
FFY2017 SNAP-Ed Annual Report 499 January 2018
kids are more involved in trying new foods
Each year, I give a healthy eating lesson in my class at the beginning of the year. I insist that all my boys and girls eat fruit and vegetables from the salad bar every day. At the beginning of the year, they try to fake me out and try to tell me that they don't like fruits and veggies. By the middle od the year, everyone always gets fruits and vegetables every day --and they love it! The taste it Tuesday's have been a success, mainly because students are tasting and then letting us know that really wasn't bad and I will try at home. "I am going to tell mom this is healthier," is what some students have said. Students are excited about the recipes that are left. I have had several students come to school a day or two after a presentation and tell me they made the recipe at home.
My students are more aware of what are going into their bodies
I had students ask about washing their hands more often because they don't want to spread germs.
I see lots of students (school wide) being more active
Students are more active and complain less about staying active.
We no longer allow students to bring chips from home to eat on the playground after lunch.
Students discussing how important it is to eat healthy instead of eating just Hot Cheetos for lunch.
I was provides with a lot of materials for our students which they loved. They called their book the farm book.
Healthier kids
I am a diet soda drinker. My students now comment that I am drinking an unhealthy drink when they see it. They comment that I should choose water or something healthy. My students are Self-Contained Special Ed. students. They are encouraging as I have declared I am giving up diet soda starting April 1st (no joke).
FFY2017 SNAP-Ed Annual Report 500 January 2018
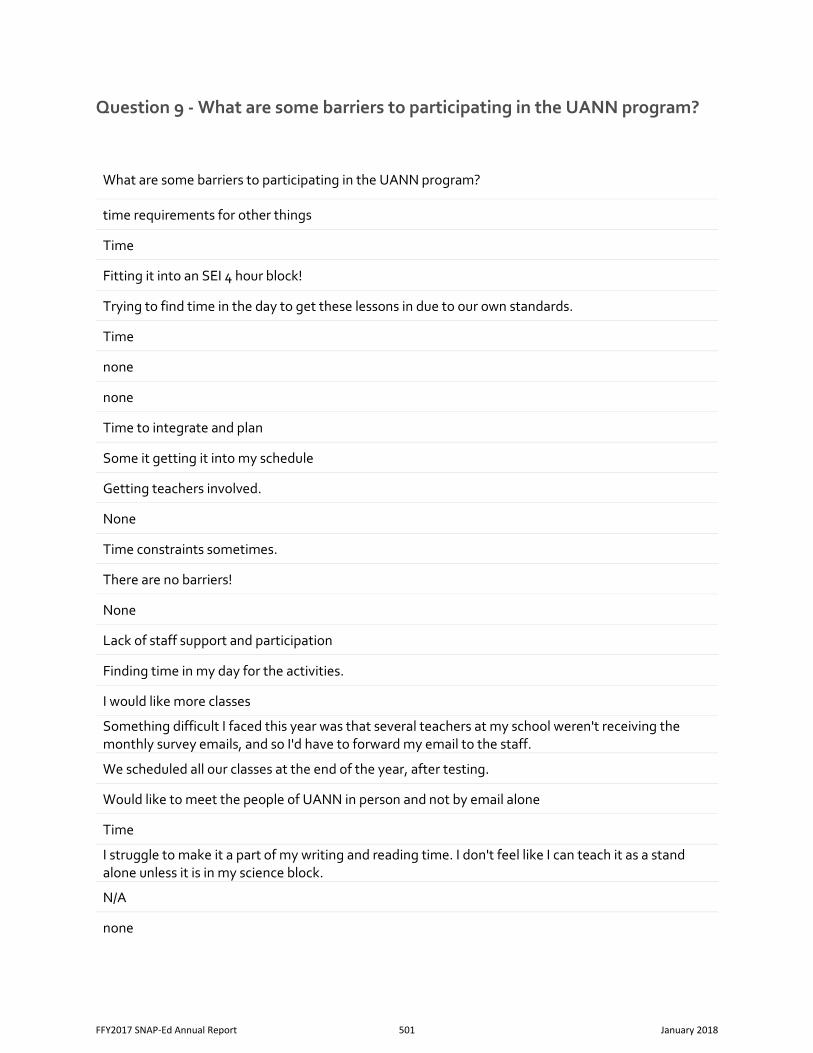
Question 9 - What are some barriers to participating in the UANN program?
What are some barriers to participating in the UANN program?
time requirements for other things
Time
Fitting it into an SEI 4 hour block!
Trying to find time in the day to get these lessons in due to our own standards.
Time
none
none
Time to integrate and plan
Some it getting it into my schedule
Getting teachers involved.
None
Time constraints sometimes.
There are no barriers!
None
Lack of staff support and participation
Finding time in my day for the activities.
I would like more classes
Something difficult I faced this year was that several teachers at my school weren't receiving the monthly survey emails, and so I'd have to forward my email to the staff.
We scheduled all our classes at the end of the year, after testing.
Would like to meet the people of UANN in person and not by email alone
Time
I struggle to make it a part of my writing and reading time. I don't feel like I can teach it as a stand alone unless it is in my science block.
N/A
none
FFY2017 SNAP-Ed Annual Report 501 January 2018
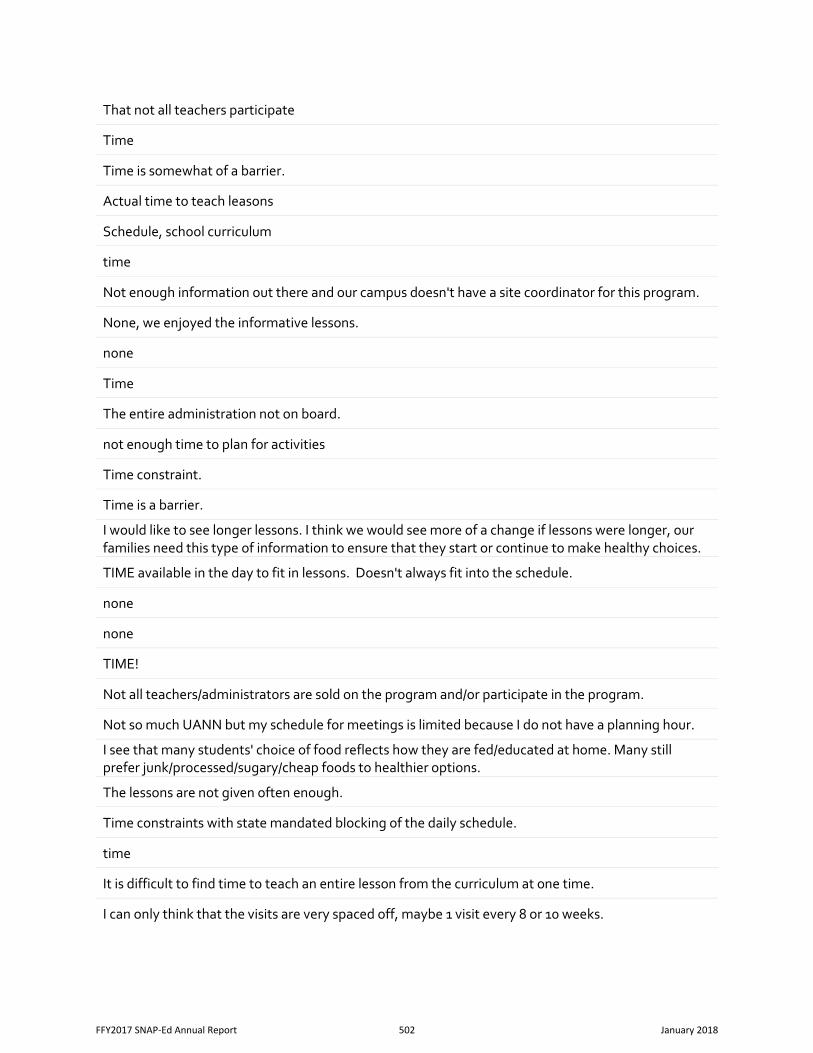
That not all teachers participate
Time
Time is somewhat of a barrier.
Actual time to teach leasons
Schedule, school curriculum
time
Not enough information out there and our campus doesn't have a site coordinator for this program.
None, we enjoyed the informative lessons.
none
Time
The entire administration not on board.
not enough time to plan for activities
Time constraint.
Time is a barrier.
I would like to see longer lessons. I think we would see more of a change if lessons were longer, our families need this type of information to ensure that they start or continue to make healthy choices.
TIME available in the day to fit in lessons. Doesn't always fit into the schedule.
none
none
TIME!
Not all teachers/administrators are sold on the program and/or participate in the program.
Not so much UANN but my schedule for meetings is limited because I do not have a planning hour.
I see that many students' choice of food reflects how they are fed/educated at home. Many still prefer junk/processed/sugary/cheap foods to healthier options.
The lessons are not given often enough.
Time constraints with state mandated blocking of the daily schedule.
time
It is difficult to find time to teach an entire lesson from the curriculum at one time.
I can only think that the visits are very spaced off, maybe 1 visit every 8 or 10 weeks.
FFY2017 SNAP-Ed Annual Report 502 January 2018
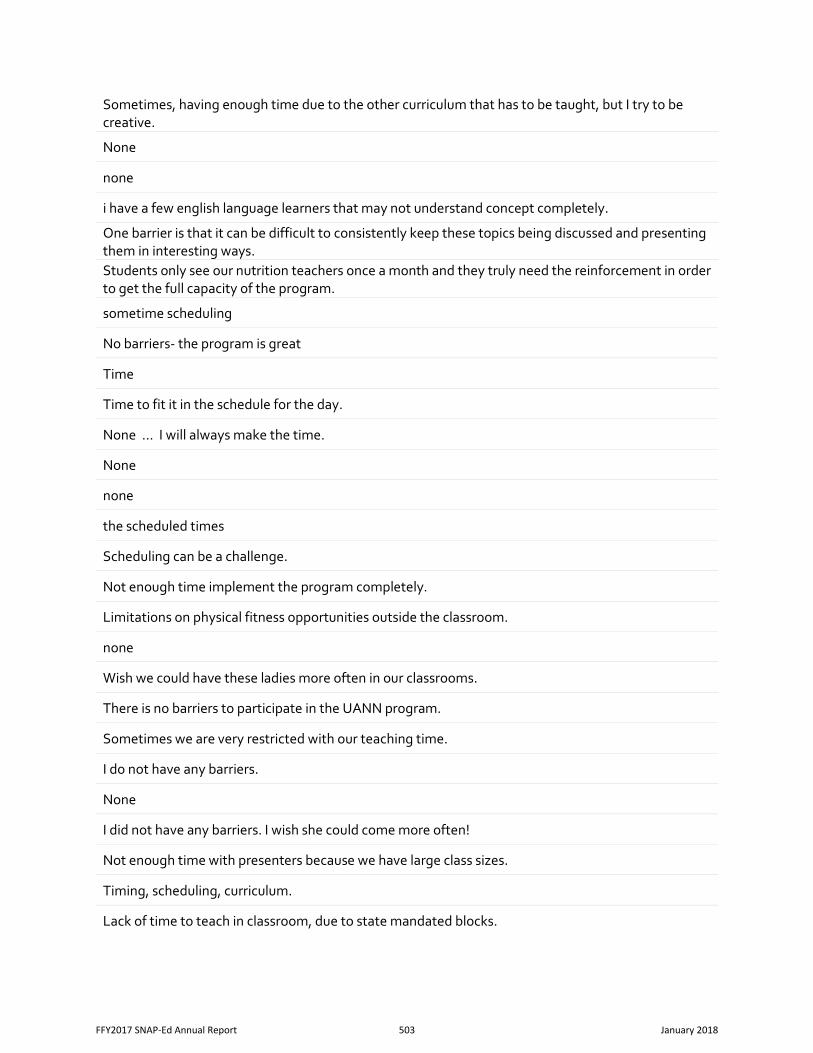
Sometimes, having enough time due to the other curriculum that has to be taught, but I try to be creative.
None
none
i have a few english language learners that may not understand concept completely.
One barrier is that it can be difficult to consistently keep these topics being discussed and presenting them in interesting ways. Students only see our nutrition teachers once a month and they truly need the reinforcement in order to get the full capacity of the program.
sometime scheduling
No barriers- the program is great
Time
Time to fit it in the schedule for the day.
None ... I will always make the time.
None
none
the scheduled times
Scheduling can be a challenge.
Not enough time implement the program completely.
Limitations on physical fitness opportunities outside the classroom.
none
Wish we could have these ladies more often in our classrooms.
There is no barriers to participate in the UANN program.
Sometimes we are very restricted with our teaching time.
I do not have any barriers.
None
I did not have any barriers. I wish she could come more often!
Not enough time with presenters because we have large class sizes.
Timing, scheduling, curriculum.
Lack of time to teach in classroom, due to state mandated blocks.
FFY2017 SNAP-Ed Annual Report 503 January 2018
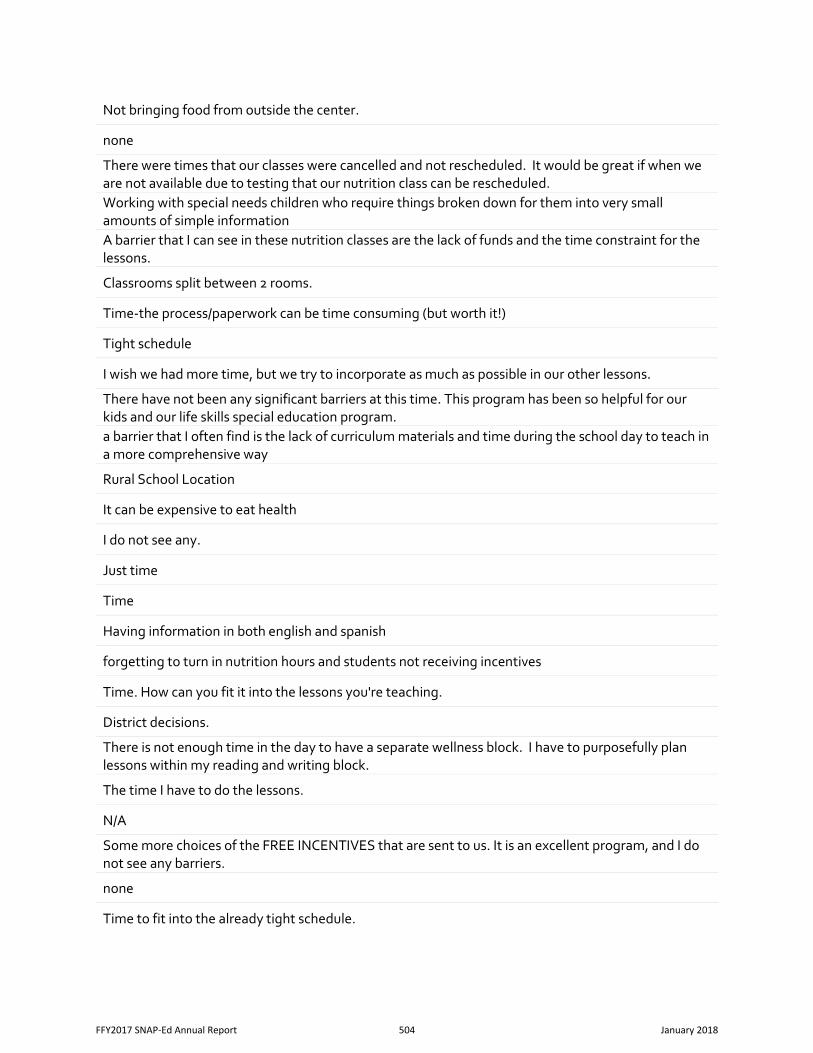
Not bringing food from outside the center.
none
There were times that our classes were cancelled and not rescheduled. It would be great if when we are not available due to testing that our nutrition class can be rescheduled. Working with special needs children who require things broken down for them into very small amounts of simple information A barrier that I can see in these nutrition classes are the lack of funds and the time constraint for the lessons.
Classrooms split between 2 rooms.
Time-the process/paperwork can be time consuming (but worth it!)
Tight schedule
I wish we had more time, but we try to incorporate as much as possible in our other lessons.
There have not been any significant barriers at this time. This program has been so helpful for our kids and our life skills special education program. a barrier that I often find is the lack of curriculum materials and time during the school day to teach in a more comprehensive way
Rural School Location
It can be expensive to eat health
I do not see any.
Just time
Time
Having information in both english and spanish
forgetting to turn in nutrition hours and students not receiving incentives
Time. How can you fit it into the lessons you're teaching.
District decisions.
There is not enough time in the day to have a separate wellness block. I have to purposefully plan lessons within my reading and writing block.
The time I have to do the lessons.
N/A
Some more choices of the FREE INCENTIVES that are sent to us. It is an excellent program, and I do not see any barriers.
none
Time to fit into the already tight schedule.
FFY2017 SNAP-Ed Annual Report 504 January 2018
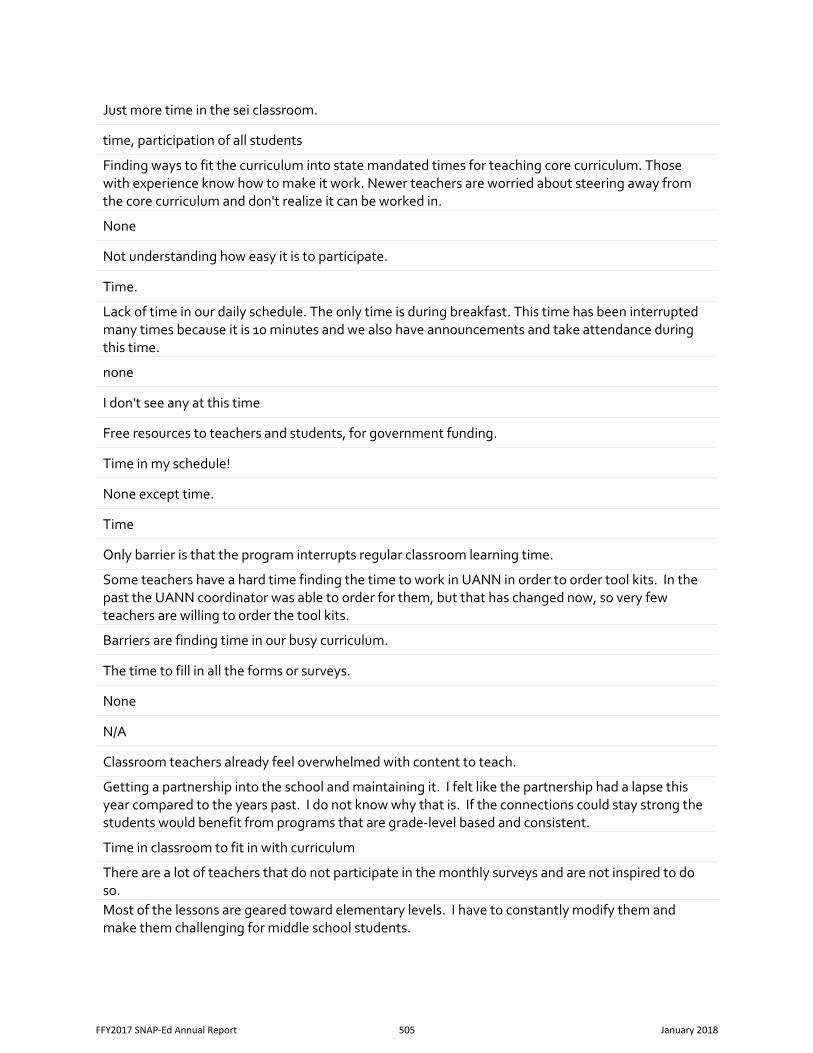
Just more time in the sei classroom.
time, participation of all students
Finding ways to fit the curriculum into state mandated times for teaching core curriculum. Those with experience know how to make it work. Newer teachers are worried about steering away from the core curriculum and don't realize it can be worked in.
None
Not understanding how easy it is to participate.
Time.
Lack of time in our daily schedule. The only time is during breakfast. This time has been interrupted many times because it is 10 minutes and we also have announcements and take attendance during this time.
none
I don't see any at this time
Free resources to teachers and students, for government funding.
Time in my schedule!
None except time.
Time
Only barrier is that the program interrupts regular classroom learning time.
Some teachers have a hard time finding the time to work in UANN in order to order tool kits. In the past the UANN coordinator was able to order for them, but that has changed now, so very few teachers are willing to order the tool kits.
Barriers are finding time in our busy curriculum.
The time to fill in all the forms or surveys.
None
N/A
Classroom teachers already feel overwhelmed with content to teach.
Getting a partnership into the school and maintaining it. I felt like the partnership had a lapse this year compared to the years past. I do not know why that is. If the connections could stay strong the students would benefit from programs that are grade-level based and consistent.
Time in classroom to fit in with curriculum
There are a lot of teachers that do not participate in the monthly surveys and are not inspired to do so. Most of the lessons are geared toward elementary levels. I have to constantly modify them and make them challenging for middle school students.
FFY2017 SNAP-Ed Annual Report 505 January 2018
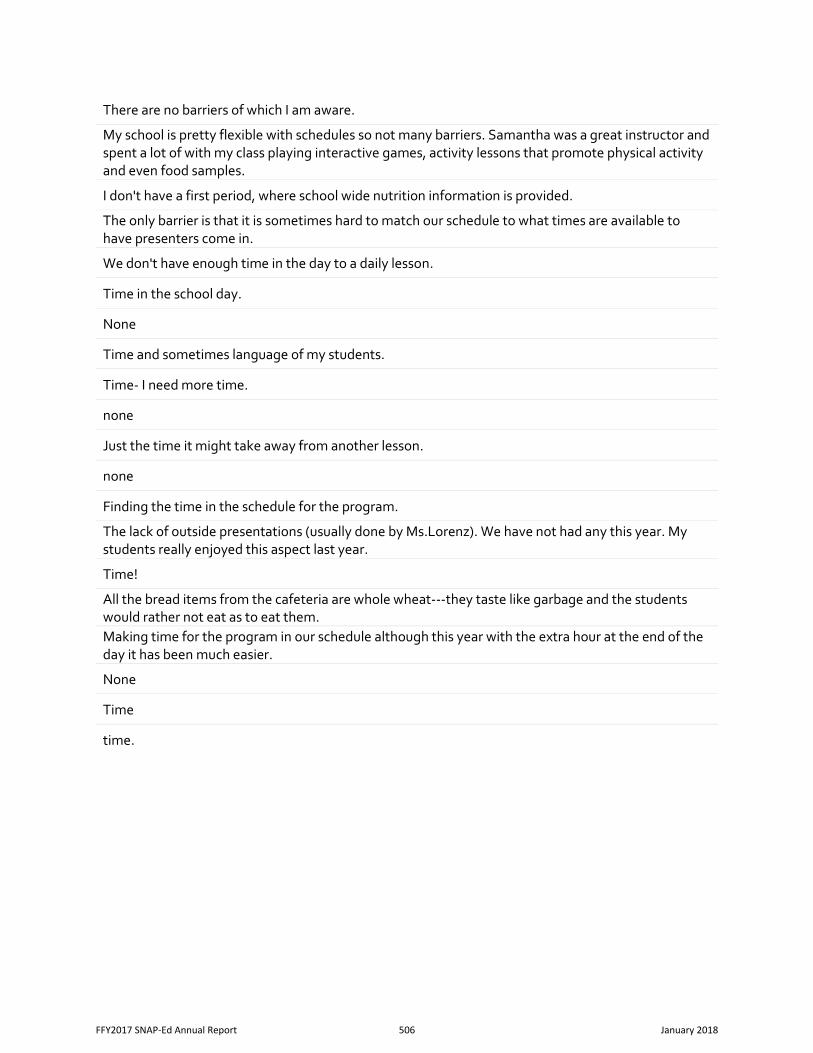
There are no barriers of which I am aware.
My school is pretty flexible with schedules so not many barriers. Samantha was a great instructor and spent a lot of with my class playing interactive games, activity lessons that promote physical activity and even food samples.
I don't have a first period, where school wide nutrition information is provided.
The only barrier is that it is sometimes hard to match our schedule to what times are available to have presenters come in.
We don't have enough time in the day to a daily lesson.
Time in the school day.
None
Time and sometimes language of my students.
Time- I need more time.
none
Just the time it might take away from another lesson.
none
Finding the time in the schedule for the program.
The lack of outside presentations (usually done by Ms.Lorenz). We have not had any this year. My students really enjoyed this aspect last year.
Time!
All the bread items from the cafeteria are whole wheat---they taste like garbage and the students would rather not eat as to eat them. Making time for the program in our schedule although this year with the extra hour at the end of the day it has been much easier.
None
Time
time.
FFY2017 SNAP-Ed Annual Report 506 January 2018
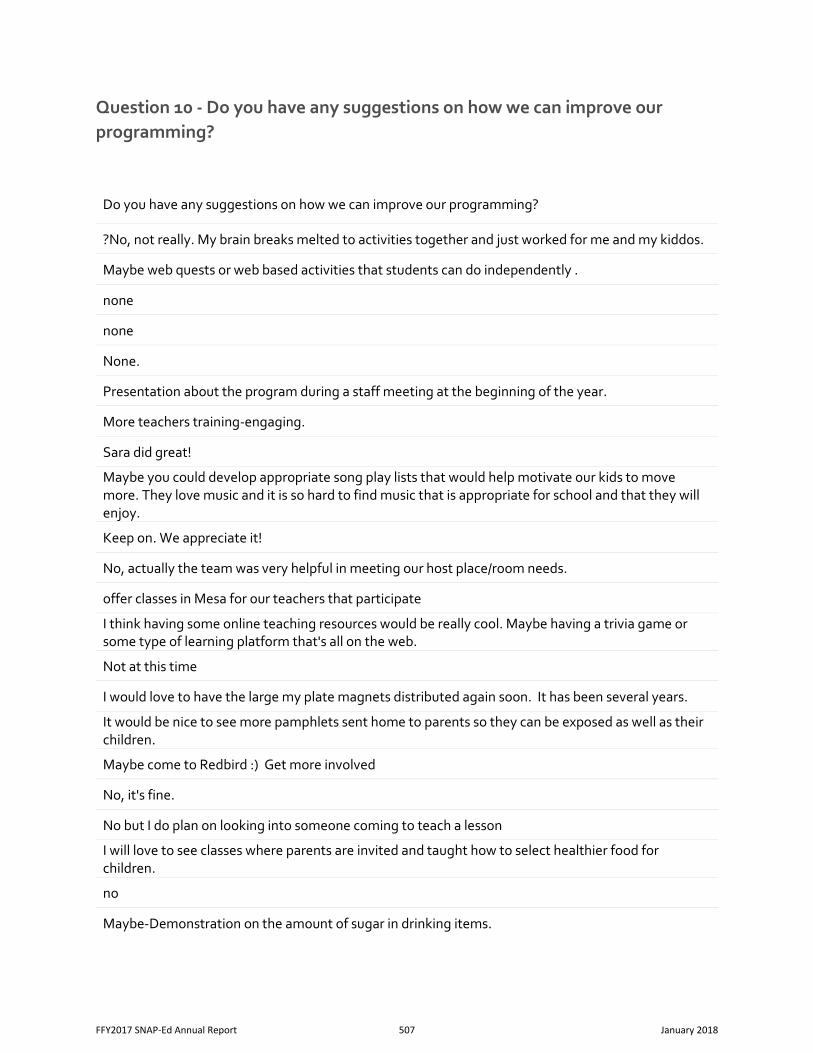
Question 10 - Do you have any suggestions on how we can improve our programming?
Do you have any suggestions on how we can improve our programming?
?No, not really. My brain breaks melted to activities together and just worked for me and my kiddos.
Maybe web quests or web based activities that students can do independently .
none
none
None.
Presentation about the program during a staff meeting at the beginning of the year.
More teachers training-engaging.
Sara did great!
Maybe you could develop appropriate song play lists that would help motivate our kids to move more. They love music and it is so hard to find music that is appropriate for school and that they will enjoy.
Keep on. We appreciate it!
No, actually the team was very helpful in meeting our host place/room needs.
offer classes in Mesa for our teachers that participate
I think having some online teaching resources would be really cool. Maybe having a trivia game or some type of learning platform that's all on the web.
Not at this time
I would love to have the large my plate magnets distributed again soon. It has been several years.
It would be nice to see more pamphlets sent home to parents so they can be exposed as well as their children.
Maybe come to Redbird :) Get more involved
No, it's fine.
No but I do plan on looking into someone coming to teach a lesson
I will love to see classes where parents are invited and taught how to select healthier food for children.
no
Maybe-Demonstration on the amount of sugar in drinking items.
FFY2017 SNAP-Ed Annual Report 507 January 2018
keep doing it . thanks
Give more info on how we can have someone come and teach lessons in our classes.
No, just visit again next session and educate new set of students.
Do the lessons have common core standards alignment?
I love it
More activities or games
Get the administration to buy in on it.
sending some more strategies on how we can blend in nutrition and physical activity into our curriculm It will be nice if there are some in class demonstration - nutrition and physical activity related topics. Maybe bring some sample of vegetables and fruits that are not common such as egg plant, zucchini, turnips, mango, papaya etc. This way they can see what they look and taste like.
not all classes have only 25 students I had 30 so i was not able to give them workbooks
No, it is a great program!
One of the biggest things I have seen in the last two years is that lessons need to be at the student's level. I have for a long time taught the ELL population, the person coming in needs to understand that a lot of these students lack the language necessary to complete the lesson at times. I also think it would be a great idea if we had field day once every semester...students loved it.
Making- following directions from recipe to make a healthy snack.
no
I think it would help if there was a way to do lessons in the garden to assist with a more interactive approach.
I would like to see the special projects not so restricted. In the past I was able to receive water bottles.
We need to have the lessons more often. Students forget what they are taught when they only get them once every few months. More online resources and materials made available to educators that are aligned to state mandated curriculum, along with the mapping for those standards (i.e. 4.RL.4).
More clasrroms visits and perhaps physical activities for the students.
I would like classes on some of the newer programs
I enjoy the program, my students love it.
I think making a part of it lecture and the other part having students work on a activity.
My students enjoyed the lesson, the coloring books and the gifts.
none
no
FFY2017 SNAP-Ed Annual Report 508 January 2018
parent education is needed.
I do not have any suggestions at this time.
Maybe nutritional videos teachers can show to students on a weekly basis.
Would love a lesson every month for the entire school year!
None at this time.
Sometimes the scheduling is uncertain when they are coming for a lesson, but I will always remain flexible for this program. I think starting a lesson with a short read aloud really gets them engaged and help build their comprehension.
none
get the class schedules from school secretary or from teachers
more training on it.
Cafeteria food for students need a change and students waste food.
Implementing wellness policy.
It's great!
You are doing a wonderful job and students are enjoying it!
I don't have any suggestions.
I noticed during this school year the lack of commitment with scheduling.
Not at this time.
We were so use to so many incentives will we continue with this or do you have less funding?
come more often for reinforcement...?
Send more presenters or come more often. :)
N/A
Maybe have specials teachers ( Library, P.E. & Music) help implement some of these items.
Love it! Love planning with Marla; is has really helped out.
keep up the great work...will there be a wellness conference this summer?
I love the program! Thank you!
Provide adapted materials for special education children.
Yes. To improve this program and make it more efficient, I feel that the lesson should be more activity oriented instead of just listening to the presenter. It would be great if the presenters would bring materials to make this a fun, hands-on lesson. There are many activities that can be
FFY2017 SNAP-Ed Annual Report 509 January 2018
implemented and executed in a 30 minute period. Most of the time the presenters have very useful information, but if there was a physical activity attached to it, it would be so much more interesting for our students. They are still young and they enjoy working with visuals, instead of just listening to the presenter talk about the concept being taught.
Maybe more personnel.
A flip book, or some kind of easy reference for available resources, directions, etc. all in one place
I am not in the classroom therefore, I am not aware of your activities in the classrooms. I am sure that a few students learn from any information you teach them.
It is pretty great as it is.
Maybe send out monthly links to videos that we can use to help teach the importance of making healthy choices?
Nothing at this time. YOU ALL HAVE TRULY BLESSED OUR PROGRAM!!
Would like more scheduled lessons
None
More professional development for teachers to be able to teach in their classrooms. More incentives. More assemblies for students from the U of A
no
this is a great program! keep up the great work!
not at this time
Look at Common Core Standards and see how they might fit in.
No, to be honest, your program has alway surpassed our expecations. Whenever we have a questions, are in need of some assistance your staff is always willing to help out. On one of the surveys it said lesson plans and food demonstrations. I am not sure how to access those.
Keep it up :)
Having more information available on through email. Help to implement more active approach to teaching/learning health and a healthy lifestyle. Maybe a choice of FREE INCENTIVES that are sent to us. More of a variety of Health Units that we can choose to teach each month. More units on hygeine, safety, dental care.
n/a
I didn't realize about the programs avail on your site until recently. Maybe just make sure teachers know there are things you can print from there
Unsure right now
Maybe if you were to come out quarterly or once a semester but not just once a year.
Keep the good work up
I was never contacted about people coming to campus to teach some lessons to our students.
FFY2017 SNAP-Ed Annual Report 510 January 2018
Keep providing quick fact cards on a ring. I use them in the hallway and read some during our breakfast in the classroom program.
no
Its a great program
More resources available for teachers and students
Offer a few more hands-on/game type lessons. Those worked really well with my 1st graders...worksheets were tough Allow UANN Coordinators to order kits for the teachers at their school, and it would be nice if we were able to order more than just 2 tool kits. It would also really help if there was a nutrition tool kit that was one we could customize to get the items we actually need and not those nutrition resources we already have at our school. It would be nice to have folders or notebooks to save their notes. They can have an organized place to review their materials for lessons.
Involve the families and parents to participate
I feel the program is great!
Everything is great maybe a year long incentive for students and families.
See above
Maybe advertise the benefits of participating in the program more ($$ for school, classroom incentive prizes) at a staff meeting. If all of your trainers are like Samantha they are very competent. You are doing a great job. Keep practicing classroom management techniques.
None
None
Offer suggestions for our breakfast program
none
To continue with the taste days and keep the educational booklets.
Mrs. Connie does an excellent job.
Same as the barrier
Schedule lessons taught ahead of time.
Teach food directors that food still has to be appetizing for students to want to eat it. Too much food is not eaten but, they continue to serve it to meet government standards. So very sad for these young people who are hungry!
None, it is super just the way it is. Mrs. Connie is great and wonderful with the students.
No you have a very good program.
not at this time
FFY2017 SNAP-Ed Annual Report 511 January 2018
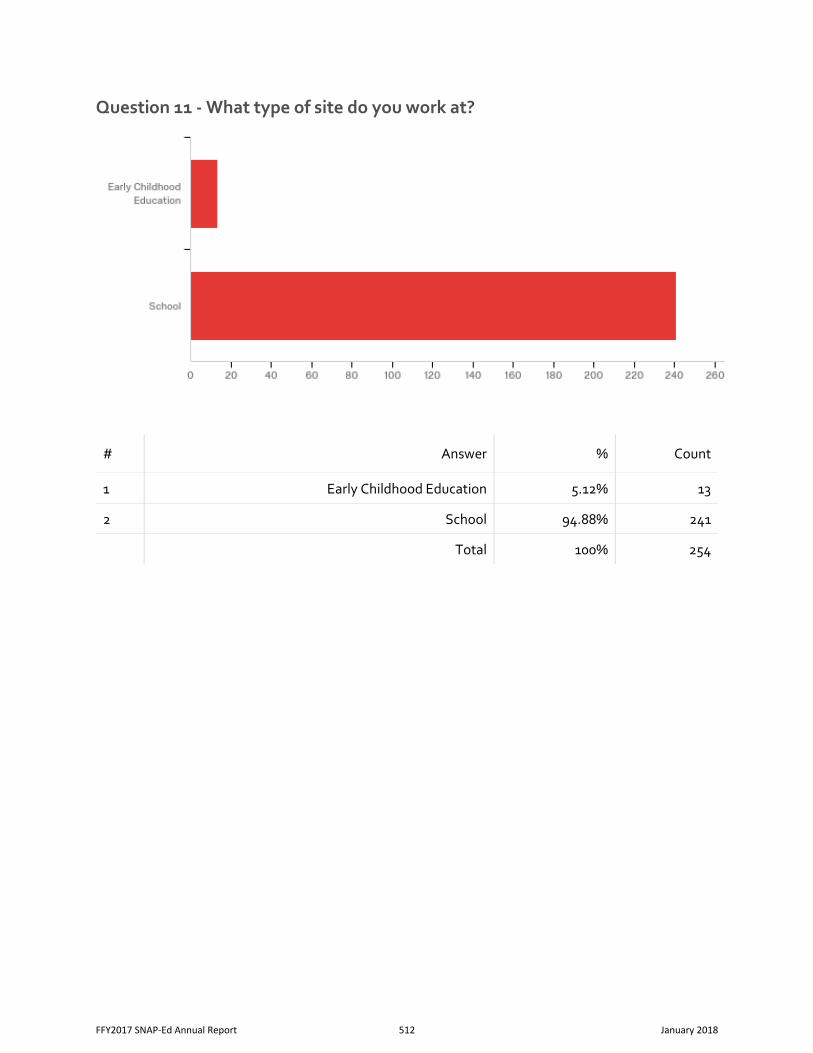
Question 11 - What type of site do you work at?
# Answer % Count
1 Early Childhood Education 5.12% 13
2 School 94.88% 241
Total 100% 254
FFY2017 SNAP-Ed Annual Report 512 January 2018
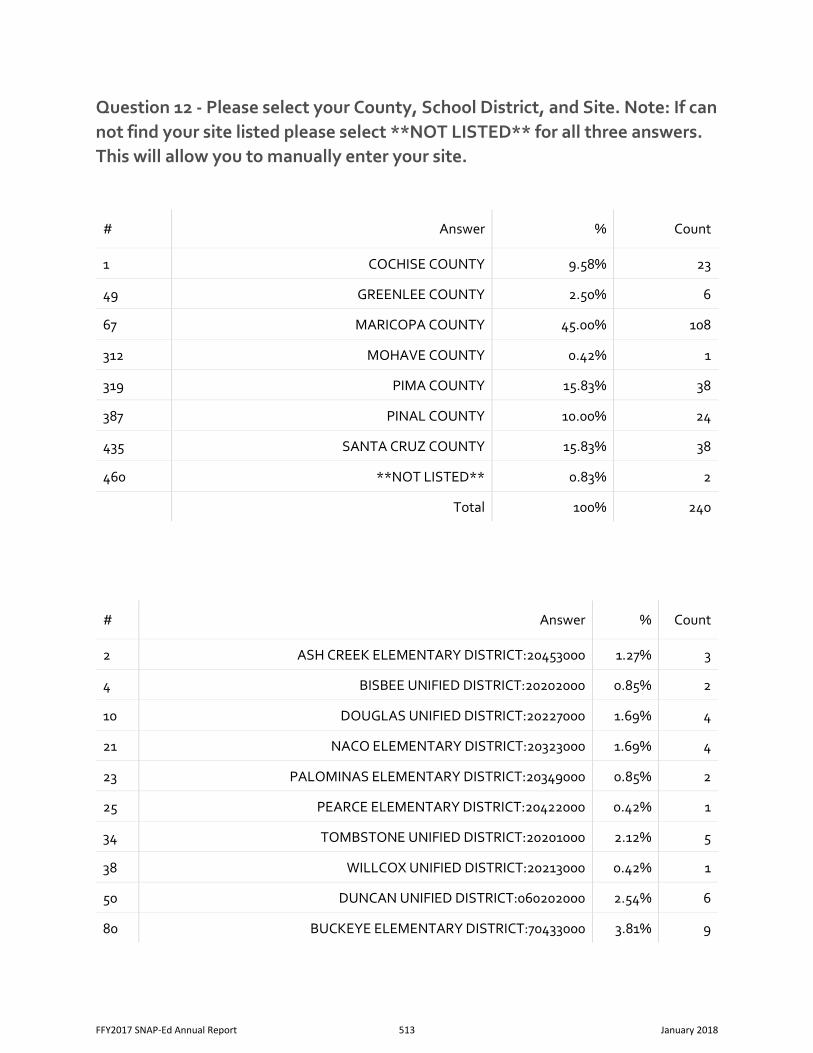
Question 12 - Please select your County, School District, and Site. Note: If can not find your site listed please select **NOT LISTED** for all three answers. This will allow you to manually enter your site.
# Answer % Count
1 COCHISE COUNTY 9.58% 23
49 GREENLEE COUNTY 2.50% 6
67 MARICOPA COUNTY 45.00% 108
312 MOHAVE COUNTY 0.42% 1
319 PIMA COUNTY 15.83% 38
387 PINAL COUNTY 10.00% 24
435 SANTA CRUZ COUNTY 15.83% 38
460 **NOT LISTED** 0.83% 2
Total 100% 240
# Answer % Count
2 ASH CREEK ELEMENTARY DISTRICT:20453000 1.27% 3
4 BISBEE UNIFIED DISTRICT:20202000 0.85% 2
10 DOUGLAS UNIFIED DISTRICT:20227000 1.69% 4
21 NACO ELEMENTARY DISTRICT:20323000 1.69% 4
23 PALOMINAS ELEMENTARY DISTRICT:20349000 0.85% 2
25 PEARCE ELEMENTARY DISTRICT:20422000 0.42% 1
34 TOMBSTONE UNIFIED DISTRICT:20201000 2.12% 5
38 WILLCOX UNIFIED DISTRICT:20213000 0.42% 1
50 DUNCAN UNIFIED DISTRICT:060202000 2.54% 6
80 BUCKEYE ELEMENTARY DISTRICT:70433000 3.81% 9
FFY2017 SNAP-Ed Annual Report 513 January 2018
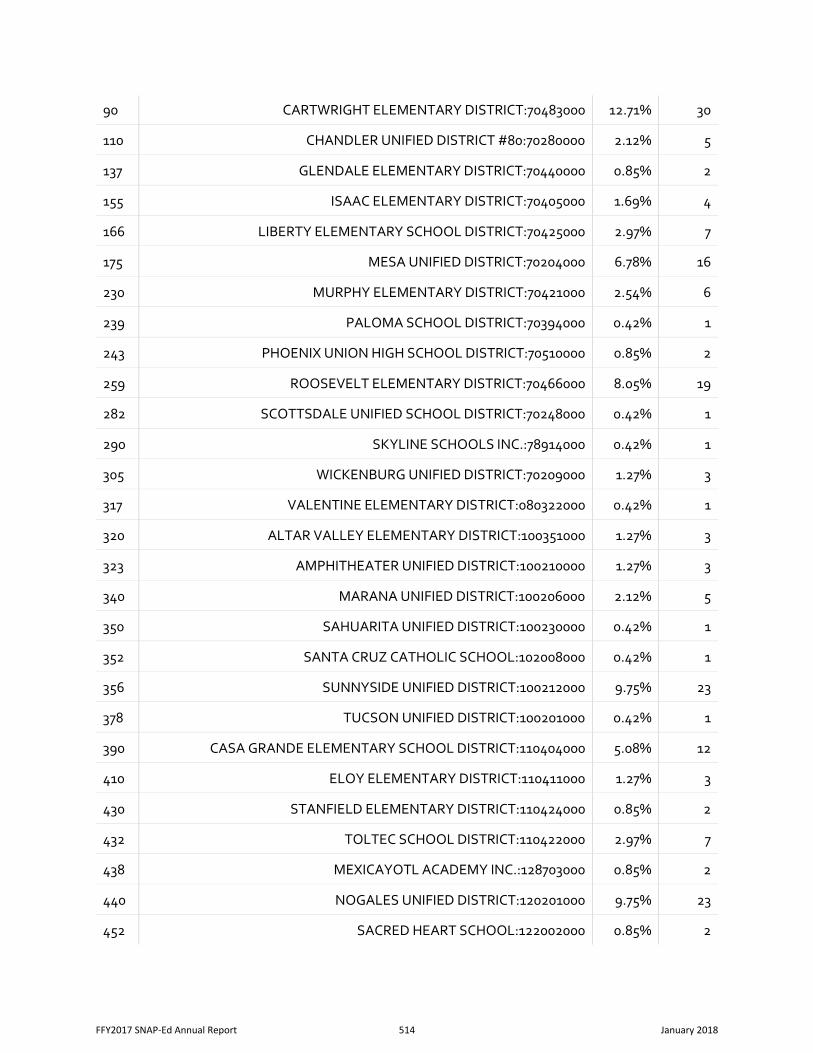
90 CARTWRIGHT ELEMENTARY DISTRICT:70483000 12.71% 30
110 CHANDLER UNIFIED DISTRICT #80:70280000 2.12% 5
137 GLENDALE ELEMENTARY DISTRICT:70440000 0.85% 2
155 ISAAC ELEMENTARY DISTRICT:70405000 1.69% 4
166 LIBERTY ELEMENTARY SCHOOL DISTRICT:70425000 2.97% 7
175 MESA UNIFIED DISTRICT:70204000 6.78% 16
230 MURPHY ELEMENTARY DISTRICT:70421000 2.54% 6
239 PALOMA SCHOOL DISTRICT:70394000 0.42% 1
243 PHOENIX UNION HIGH SCHOOL DISTRICT:70510000 0.85% 2
259 ROOSEVELT ELEMENTARY DISTRICT:70466000 8.05% 19
282 SCOTTSDALE UNIFIED SCHOOL DISTRICT:70248000 0.42% 1
290 SKYLINE SCHOOLS INC.:78914000 0.42% 1
305 WICKENBURG UNIFIED DISTRICT:70209000 1.27% 3
317 VALENTINE ELEMENTARY DISTRICT:080322000 0.42% 1
320 ALTAR VALLEY ELEMENTARY DISTRICT:100351000 1.27% 3
323 AMPHITHEATER UNIFIED DISTRICT:100210000 1.27% 3
340 MARANA UNIFIED DISTRICT:100206000 2.12% 5
350 SAHUARITA UNIFIED DISTRICT:100230000 0.42% 1
352 SANTA CRUZ CATHOLIC SCHOOL:102008000 0.42% 1
356 SUNNYSIDE UNIFIED DISTRICT:100212000 9.75% 23
378 TUCSON UNIFIED DISTRICT:100201000 0.42% 1
390 CASA GRANDE ELEMENTARY SCHOOL DISTRICT:110404000 5.08% 12
410 ELOY ELEMENTARY DISTRICT:110411000 1.27% 3
430 STANFIELD ELEMENTARY DISTRICT:110424000 0.85% 2
432 TOLTEC SCHOOL DISTRICT:110422000 2.97% 7
438 MEXICAYOTL ACADEMY INC.:128703000 0.85% 2
440 NOGALES UNIFIED DISTRICT:120201000 9.75% 23
452 SACRED HEART SCHOOL:122002000 0.85% 2
FFY2017 SNAP-Ed Annual Report 514 January 2018
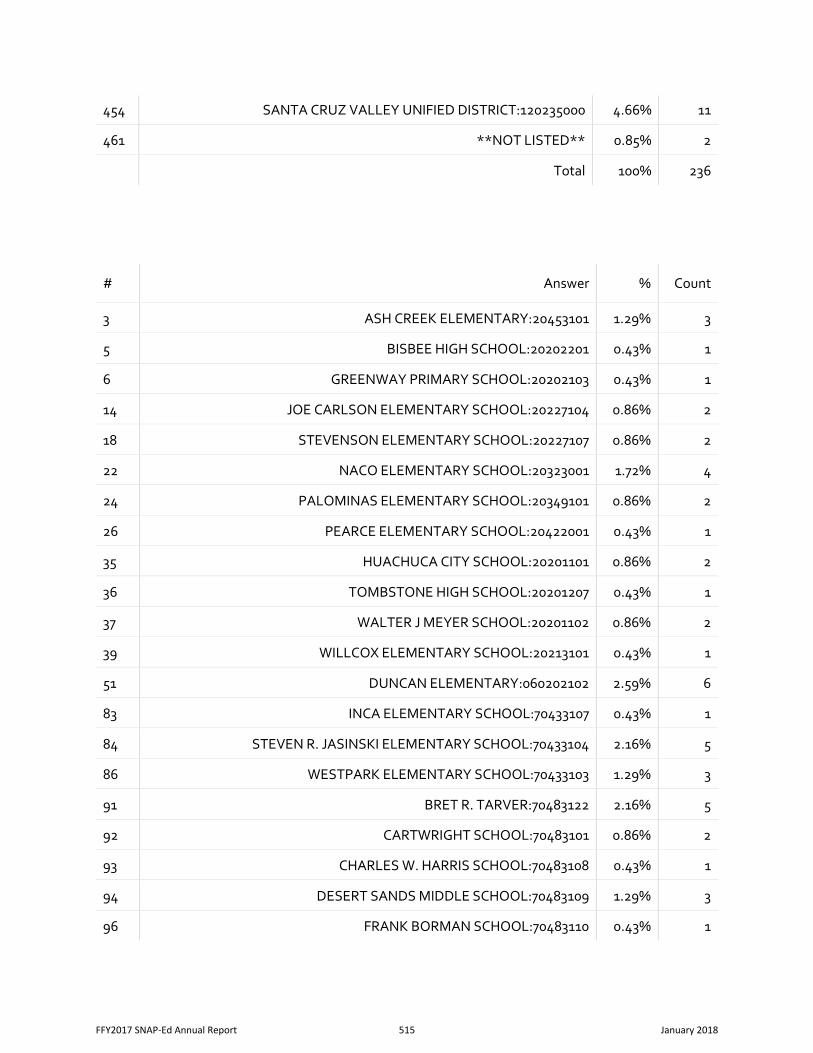
454 SANTA CRUZ VALLEY UNIFIED DISTRICT:120235000 4.66% 11
461 **NOT LISTED** 0.85% 2
Total 100% 236
# Answer % Count
3 ASH CREEK ELEMENTARY:20453101 1.29% 3
5 BISBEE HIGH SCHOOL:20202201 0.43% 1
6 GREENWAY PRIMARY SCHOOL:20202103 0.43% 1
14 JOE CARLSON ELEMENTARY SCHOOL:20227104 0.86% 2
18 STEVENSON ELEMENTARY SCHOOL:20227107 0.86% 2
22 NACO ELEMENTARY SCHOOL:20323001 1.72% 4
24 PALOMINAS ELEMENTARY SCHOOL:20349101 0.86% 2
26 PEARCE ELEMENTARY SCHOOL:20422001 0.43% 1
35 HUACHUCA CITY SCHOOL:20201101 0.86% 2
36 TOMBSTONE HIGH SCHOOL:20201207 0.43% 1
37 WALTER J MEYER SCHOOL:20201102 0.86% 2
39 WILLCOX ELEMENTARY SCHOOL:20213101 0.43% 1
51 DUNCAN ELEMENTARY:060202102 2.59% 6
83 INCA ELEMENTARY SCHOOL:70433107 0.43% 1
84 STEVEN R. JASINSKI ELEMENTARY SCHOOL:70433104 2.16% 5
86 WESTPARK ELEMENTARY SCHOOL:70433103 1.29% 3
91 BRET R. TARVER:70483122 2.16% 5
92 CARTWRIGHT SCHOOL:70483101 0.86% 2
93 CHARLES W. HARRIS SCHOOL:70483108 0.43% 1
94 DESERT SANDS MIDDLE SCHOOL:70483109 1.29% 3
96 FRANK BORMAN SCHOOL:70483110 0.43% 1
FFY2017 SNAP-Ed Annual Report 515 January 2018
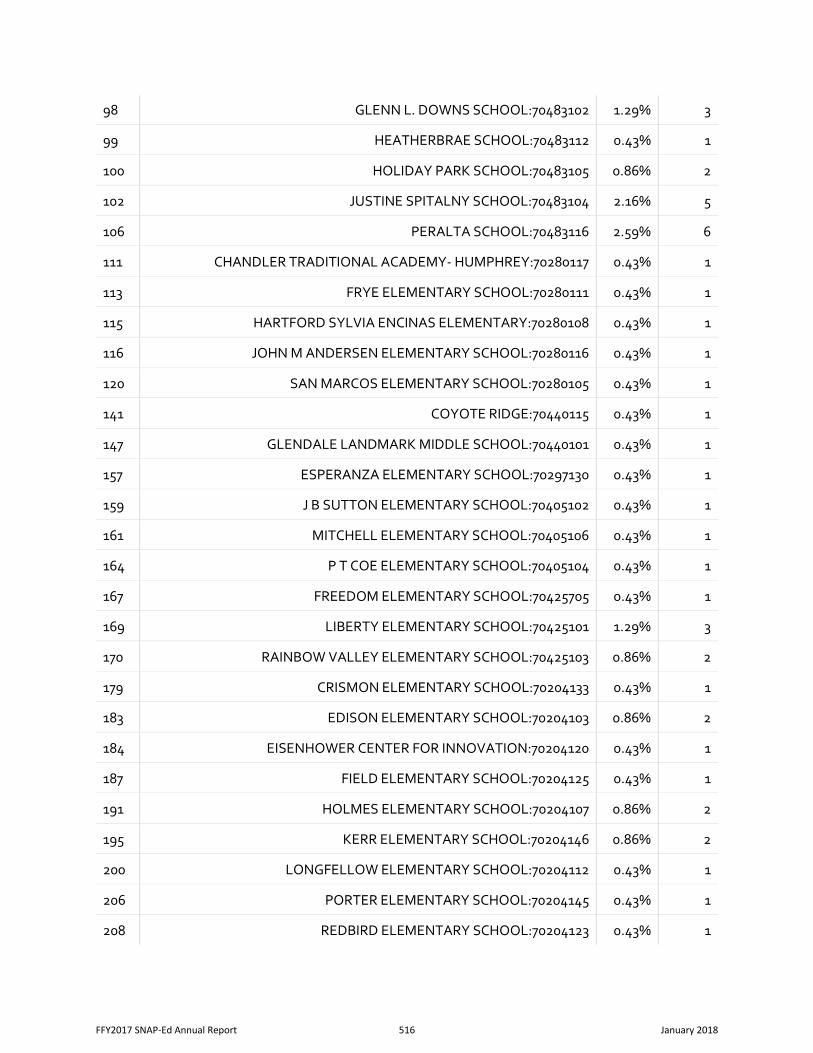
98 GLENN L. DOWNS SCHOOL:70483102 1.29% 3
99 HEATHERBRAE SCHOOL:70483112 0.43% 1
100 HOLIDAY PARK SCHOOL:70483105 0.86% 2
102 JUSTINE SPITALNY SCHOOL:70483104 2.16% 5
106 PERALTA SCHOOL:70483116 2.59% 6
111 CHANDLER TRADITIONAL ACADEMY- HUMPHREY:70280117 0.43% 1
113 FRYE ELEMENTARY SCHOOL:70280111 0.43% 1
115 HARTFORD SYLVIA ENCINAS ELEMENTARY:70280108 0.43% 1
116 JOHN M ANDERSEN ELEMENTARY SCHOOL:70280116 0.43% 1
120 SAN MARCOS ELEMENTARY SCHOOL:70280105 0.43% 1
141 COYOTE RIDGE:70440115 0.43% 1
147 GLENDALE LANDMARK MIDDLE SCHOOL:70440101 0.43% 1
157 ESPERANZA ELEMENTARY SCHOOL:70297130 0.43% 1
159 J B SUTTON ELEMENTARY SCHOOL:70405102 0.43% 1
161 MITCHELL ELEMENTARY SCHOOL:70405106 0.43% 1
164 P T COE ELEMENTARY SCHOOL:70405104 0.43% 1
167 FREEDOM ELEMENTARY SCHOOL:70425705 0.43% 1
169 LIBERTY ELEMENTARY SCHOOL:70425101 1.29% 3
170 RAINBOW VALLEY ELEMENTARY SCHOOL:70425103 0.86% 2
179 CRISMON ELEMENTARY SCHOOL:70204133 0.43% 1
183 EDISON ELEMENTARY SCHOOL:70204103 0.86% 2
184 EISENHOWER CENTER FOR INNOVATION:70204120 0.43% 1
187 FIELD ELEMENTARY SCHOOL:70204125 0.43% 1
191 HOLMES ELEMENTARY SCHOOL:70204107 0.86% 2
195 KERR ELEMENTARY SCHOOL:70204146 0.86% 2
200 LONGFELLOW ELEMENTARY SCHOOL:70204112 0.43% 1
206 PORTER ELEMENTARY SCHOOL:70204145 0.43% 1
208 REDBIRD ELEMENTARY SCHOOL:70204123 0.43% 1
FFY2017 SNAP-Ed Annual Report 516 January 2018
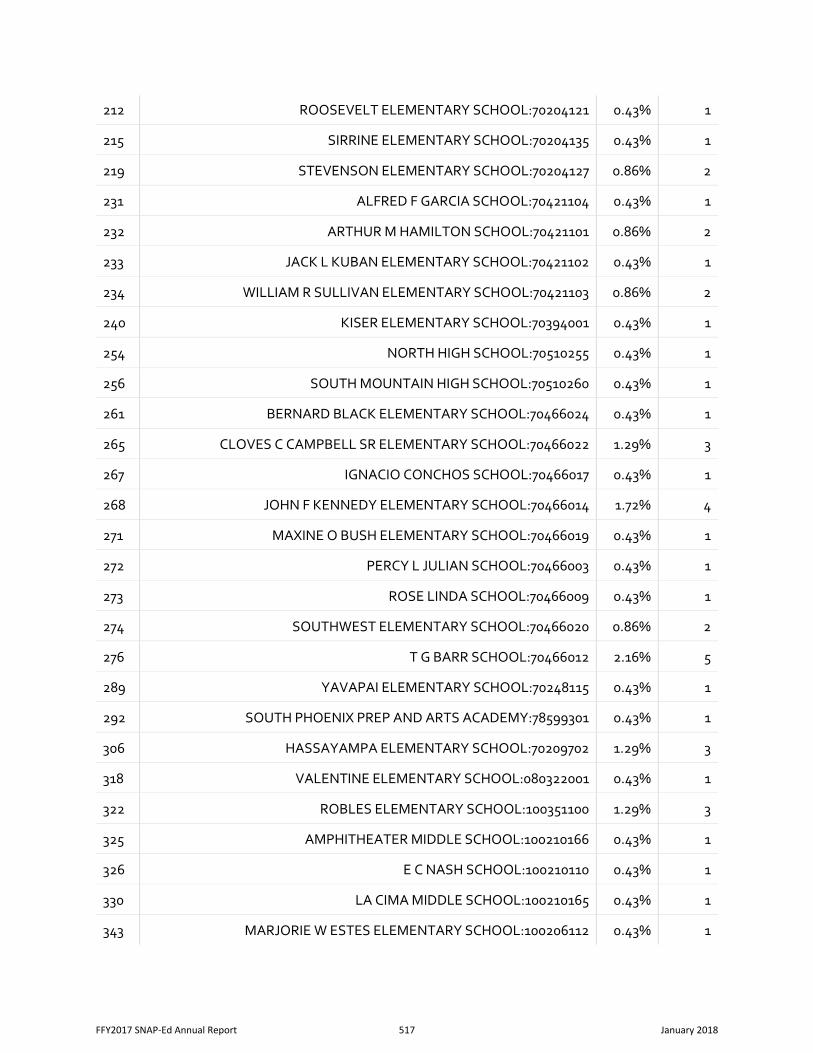
212 ROOSEVELT ELEMENTARY SCHOOL:70204121 0.43% 1
215 SIRRINE ELEMENTARY SCHOOL:70204135 0.43% 1
219 STEVENSON ELEMENTARY SCHOOL:70204127 0.86% 2
231 ALFRED F GARCIA SCHOOL:70421104 0.43% 1
232 ARTHUR M HAMILTON SCHOOL:70421101 0.86% 2
233 JACK L KUBAN ELEMENTARY SCHOOL:70421102 0.43% 1
234 WILLIAM R SULLIVAN ELEMENTARY SCHOOL:70421103 0.86% 2
240 KISER ELEMENTARY SCHOOL:70394001 0.43% 1
254 NORTH HIGH SCHOOL:70510255 0.43% 1
256 SOUTH MOUNTAIN HIGH SCHOOL:70510260 0.43% 1
261 BERNARD BLACK ELEMENTARY SCHOOL:70466024 0.43% 1
265 CLOVES C CAMPBELL SR ELEMENTARY SCHOOL:70466022 1.29% 3
267 IGNACIO CONCHOS SCHOOL:70466017 0.43% 1
268 JOHN F KENNEDY ELEMENTARY SCHOOL:70466014 1.72% 4
271 MAXINE O BUSH ELEMENTARY SCHOOL:70466019 0.43% 1
272 PERCY L JULIAN SCHOOL:70466003 0.43% 1
273 ROSE LINDA SCHOOL:70466009 0.43% 1
274 SOUTHWEST ELEMENTARY SCHOOL:70466020 0.86% 2
276 T G BARR SCHOOL:70466012 2.16% 5
289 YAVAPAI ELEMENTARY SCHOOL:70248115 0.43% 1
292 SOUTH PHOENIX PREP AND ARTS ACADEMY:78599301 0.43% 1
306 HASSAYAMPA ELEMENTARY SCHOOL:70209702 1.29% 3
318 VALENTINE ELEMENTARY SCHOOL:080322001 0.43% 1
322 ROBLES ELEMENTARY SCHOOL:100351100 1.29% 3
325 AMPHITHEATER MIDDLE SCHOOL:100210166 0.43% 1
326 E C NASH SCHOOL:100210110 0.43% 1
330 LA CIMA MIDDLE SCHOOL:100210165 0.43% 1
343 MARJORIE W ESTES ELEMENTARY SCHOOL:100206112 0.43% 1
FFY2017 SNAP-Ed Annual Report 517 January 2018
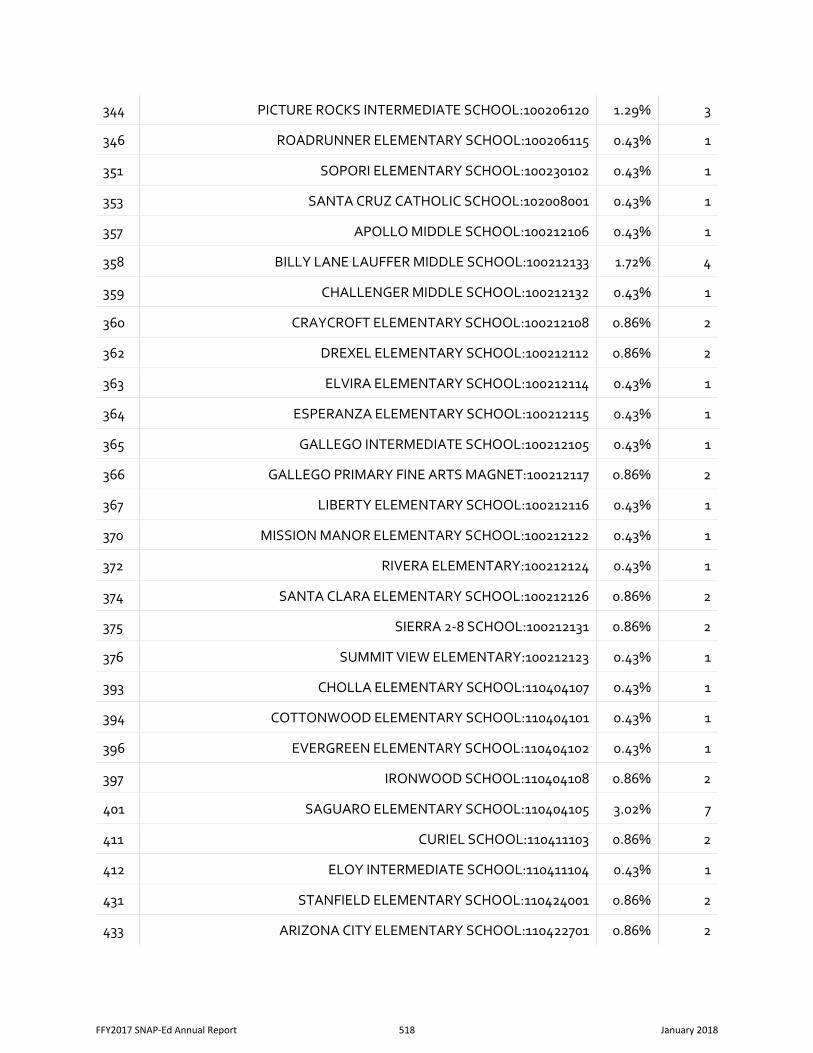
344 PICTURE ROCKS INTERMEDIATE SCHOOL:100206120 1.29% 3
346 ROADRUNNER ELEMENTARY SCHOOL:100206115 0.43% 1
351 SOPORI ELEMENTARY SCHOOL:100230102 0.43% 1
353 SANTA CRUZ CATHOLIC SCHOOL:102008001 0.43% 1
357 APOLLO MIDDLE SCHOOL:100212106 0.43% 1
358 BILLY LANE LAUFFER MIDDLE SCHOOL:100212133 1.72% 4
359 CHALLENGER MIDDLE SCHOOL:100212132 0.43% 1
360 CRAYCROFT ELEMENTARY SCHOOL:100212108 0.86% 2
362 DREXEL ELEMENTARY SCHOOL:100212112 0.86% 2
363 ELVIRA ELEMENTARY SCHOOL:100212114 0.43% 1
364 ESPERANZA ELEMENTARY SCHOOL:100212115 0.43% 1
365 GALLEGO INTERMEDIATE SCHOOL:100212105 0.43% 1
366 GALLEGO PRIMARY FINE ARTS MAGNET:100212117 0.86% 2
367 LIBERTY ELEMENTARY SCHOOL:100212116 0.43% 1
370 MISSION MANOR ELEMENTARY SCHOOL:100212122 0.43% 1
372 RIVERA ELEMENTARY:100212124 0.43% 1
374 SANTA CLARA ELEMENTARY SCHOOL:100212126 0.86% 2
375 SIERRA 2-8 SCHOOL:100212131 0.86% 2
376 SUMMIT VIEW ELEMENTARY:100212123 0.43% 1
393 CHOLLA ELEMENTARY SCHOOL:110404107 0.43% 1
394 COTTONWOOD ELEMENTARY SCHOOL:110404101 0.43% 1
396 EVERGREEN ELEMENTARY SCHOOL:110404102 0.43% 1
397 IRONWOOD SCHOOL:110404108 0.86% 2
401 SAGUARO ELEMENTARY SCHOOL:110404105 3.02% 7
411 CURIEL SCHOOL:110411103 0.86% 2
412 ELOY INTERMEDIATE SCHOOL:110411104 0.43% 1
431 STANFIELD ELEMENTARY SCHOOL:110424001 0.86% 2
433 ARIZONA CITY ELEMENTARY SCHOOL:110422701 0.86% 2
FFY2017 SNAP-Ed Annual Report 518 January 2018
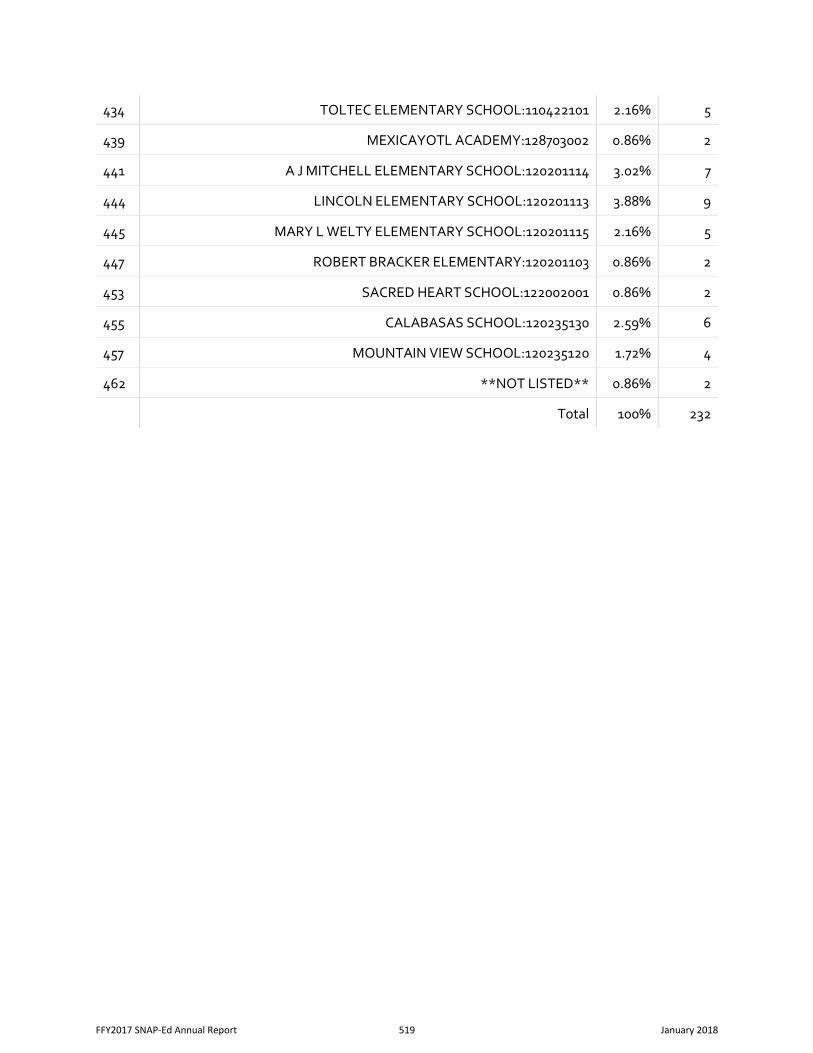
434 TOLTEC ELEMENTARY SCHOOL:110422101 2.16% 5
439 MEXICAYOTL ACADEMY:128703002 0.86% 2
441 A J MITCHELL ELEMENTARY SCHOOL:120201114 3.02% 7
444 LINCOLN ELEMENTARY SCHOOL:120201113 3.88% 9
445 MARY L WELTY ELEMENTARY SCHOOL:120201115 2.16% 5
447 ROBERT BRACKER ELEMENTARY:120201103 0.86% 2
453 SACRED HEART SCHOOL:122002001 0.86% 2
455 CALABASAS SCHOOL:120235130 2.59% 6
457 MOUNTAIN VIEW SCHOOL:120235120 1.72% 4
462 **NOT LISTED** 0.86% 2
Total 100% 232
FFY2017 SNAP-Ed Annual Report 519 January 2018
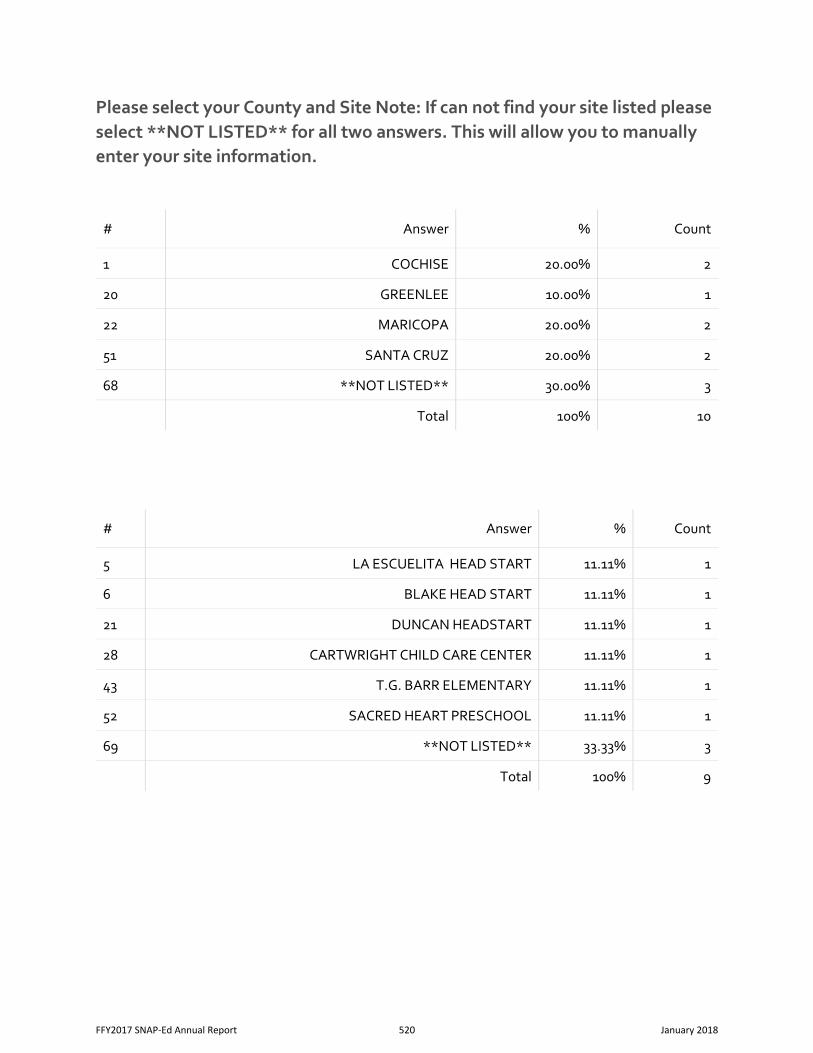
Please select your County and Site Note: If can not find your site listed please select **NOT LISTED** for all two answers. This will allow you to manually enter your site information.
# Answer % Count
1 COCHISE 20.00% 2
20 GREENLEE 10.00% 1
22 MARICOPA 20.00% 2
51 SANTA CRUZ 20.00% 2
68 **NOT LISTED** 30.00% 3
Total 100% 10
# Answer % Count
5 LA ESCUELITA HEAD START 11.11% 1
6 BLAKE HEAD START 11.11% 1
21 DUNCAN HEADSTART 11.11% 1
28 CARTWRIGHT CHILD CARE CENTER 11.11% 1
43 T.G. BARR ELEMENTARY 11.11% 1
52 SACRED HEART PRESCHOOL 11.11% 1
69 **NOT LISTED** 33.33% 3
Total 100% 9
FFY2017 SNAP-Ed Annual Report 520 January 2018
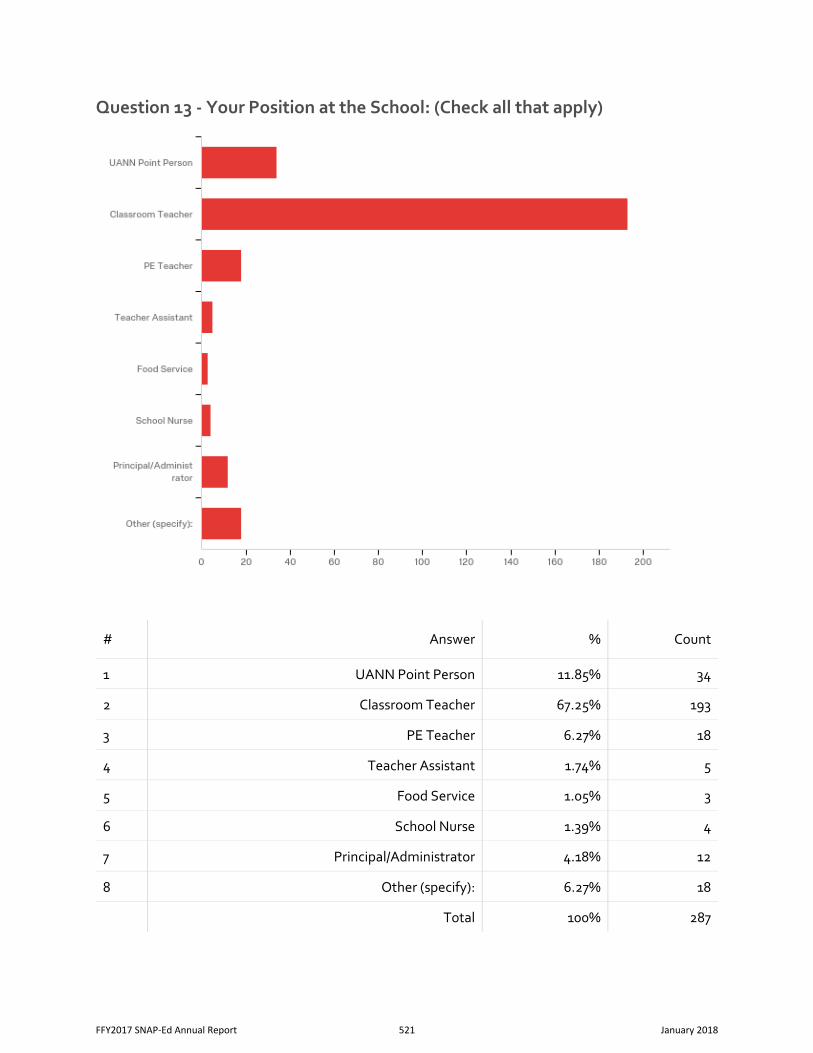
Question 13 - Your Position at the School: (Check all that apply)
# Answer % Count
1 UANN Point Person 11.85% 34
2 Classroom Teacher 67.25% 193
3 PE Teacher 6.27% 18
4 Teacher Assistant 1.74% 5
5 Food Service 1.05% 3
6 School Nurse 1.39% 4
7 Principal/Administrator 4.18% 12
8 Other (specify): 6.27% 18
Total 100% 287
FFY2017 SNAP-Ed Annual Report 521 January 2018
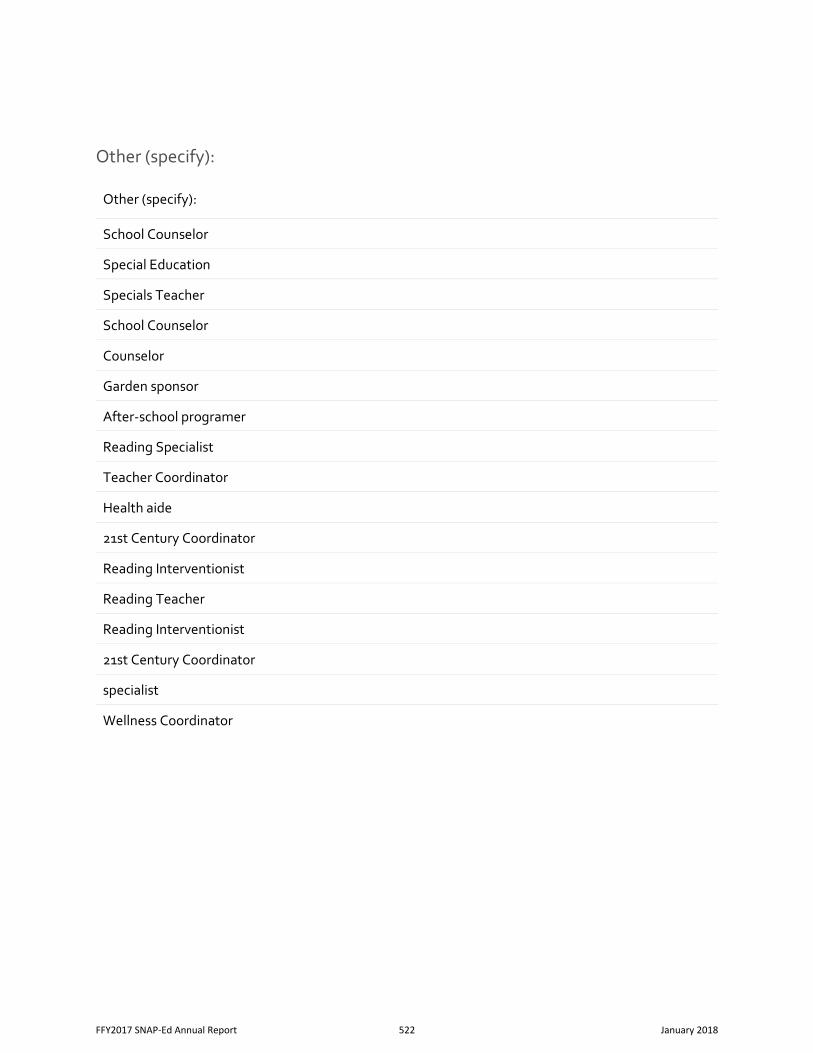
Other (specify):
Other (specify):
School Counselor
Special Education
Specials Teacher
School Counselor
Counselor
Garden sponsor
After-school programer
Reading Specialist
Teacher Coordinator
Health aide
21st Century Coordinator
Reading Interventionist
Reading Teacher
Reading Interventionist
21st Century Coordinator
specialist
Wellness Coordinator
FFY2017 SNAP-Ed Annual Report 522 January 2018
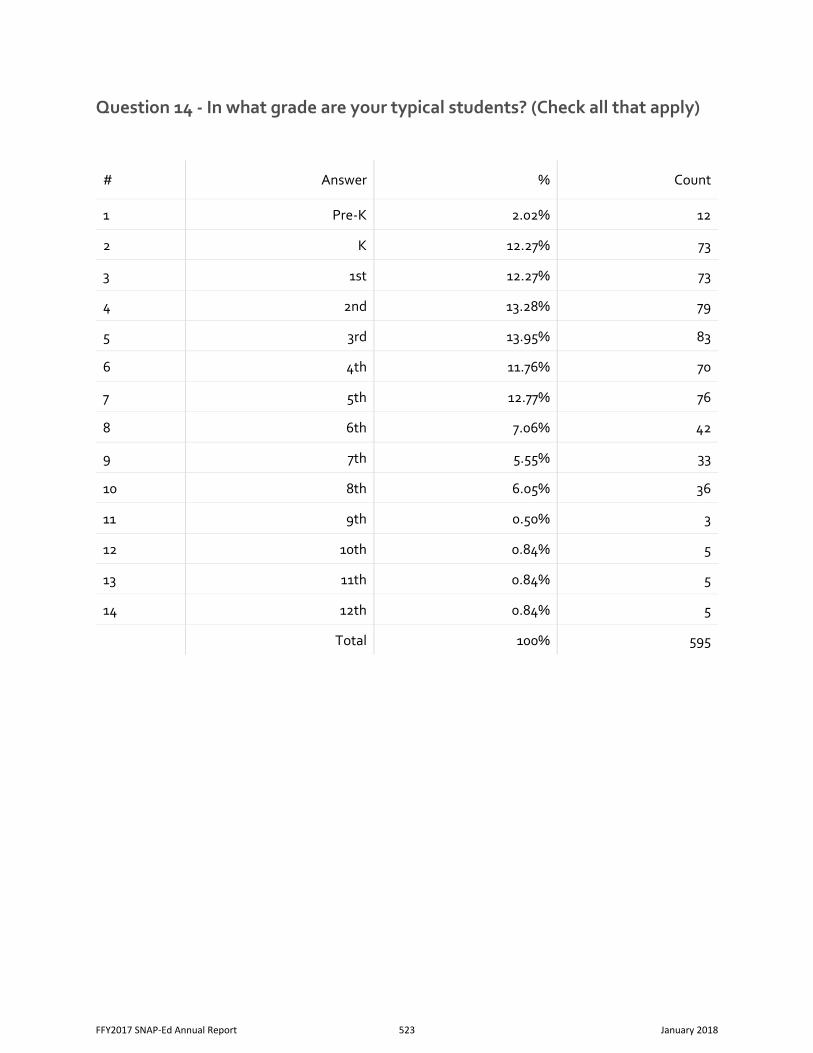
Question 14 - In what grade are your typical students? (Check all that apply)
# Answer % Count
1 Pre-K 2.02% 12
2 K 12.27% 73
3 1st 12.27% 73
4 2nd 13.28% 79
5 3rd 13.95% 83
6 4th 11.76% 70
7 5th 12.77% 76
8 6th 7.06% 42
9 7th 5.55% 33
10 8th 6.05% 36
11 9th 0.50% 3
12 10th 0.84% 5
13 11th 0.84% 5
14 12th 0.84% 5
Total 100% 595
FFY2017 SNAP-Ed Annual Report 523 January 2018

PPAGE INTENTIONALLY BLANK
FFY2017 SNAP-Ed Annual Report 524 January 2018
Appendix L
Healthy Behavior Campaign Results
FFY2017 SNAP-Ed Annual Report 525 January 2018
Arizona Department of Health Services (ADHS) /
Arizona Nutrition Network (AzNN)
Mealtime is Family Time Research Report
Report Prepared for: Owens Harkey /
Arizona Department of Health Services / AzNN May 3, 2017
FFY2017 SNAP-Ed Annual Report 526 January 2018
Table of Contents
I. Background & Methodology ..................................................... 1 II. Respondent Profile .................................................................... 5 III. Executive Summary ................................................................... 6 IV. Mealtime is Family Time Campaign ......................................... 7 A. Advertising Awareness ......................................................... 7 1. Unaided ............................................................................. 7 2. Total ................................................................................... 9 B. Source of Awareness ......................................................... 10 C. Main Message .................................................................... 12 D. Perceptions of Advertising .................................................. 13 Appendix:
A. Questionnaire
FFY2017 SNAP-Ed Annual Report 527 January 2018
AzNN Mealtime is Family Time Campaign Research 1
I. Background & Methodology Background The Arizona Department of Health Services (ADHS) Bureau of Nutrition and Physical Activity (BNPA), produces many innovative and diverse marketing and public education campaigns designed to promote healthy eating and active living to reduce the burden of obesity among low income individuals with incomes <185% of the Federal Poverty Level (FPL).
The Arizona Nutrition Network (AzNN) promotes the 2015-2020 Dietary Guidelines for Americans’ recommendations to follow eating and physical activity patterns that promote health and well-being. These recommendations focus on a need to increase specific foods, such as fruits and vegetables, fat-free or low-fat milk, and whole grains, as well as physical activity. Each of these has been shown to aid in the maintenance of a healthy body weight, reduce the risk of many chronic diseases such as heart disease, type two diabetes and certain types of cancer, and promote overall health. Their focus is on low- income residents who are eligible or potentially eligible for the Supplemental Nutrition Assistance Program (SNAP). AzNN promotes basic, consistent messages that help the target audience choose diets rich in nutrients, which include increased consumption of fruits and vegetables, whole grain foods, and low-fat dairy.
Social marketing campaigns have been developed around these messages. These campaigns are designed to inform and educate the target market about the importance and benefits of living a healthier lifestyle with a goal to influence their nutrition choices. Campaign materials are created in both English and Spanish.
This research report provides results for both the pre and post-tests of the 2017 Healthy Behaviors Campaign – Mealtime is Family Time, which ran from January 23, 2017 through March 26, 2017, was statewide and included the following media: TV, radio, digital, outdoor, posters, and newsletters.
It is important to note that this campaign also ran June 1, 2015 through September 27, 2015.
Study Objectives The overall objective of this research was to measure awareness of the Mealtime is Family Time campaign prior to and after, the January 23, 2017 launch. In addition, the pre-test indicates residual impact of the previous use of the campaign.
FFY2017 SNAP-Ed Annual Report 528 January 2018
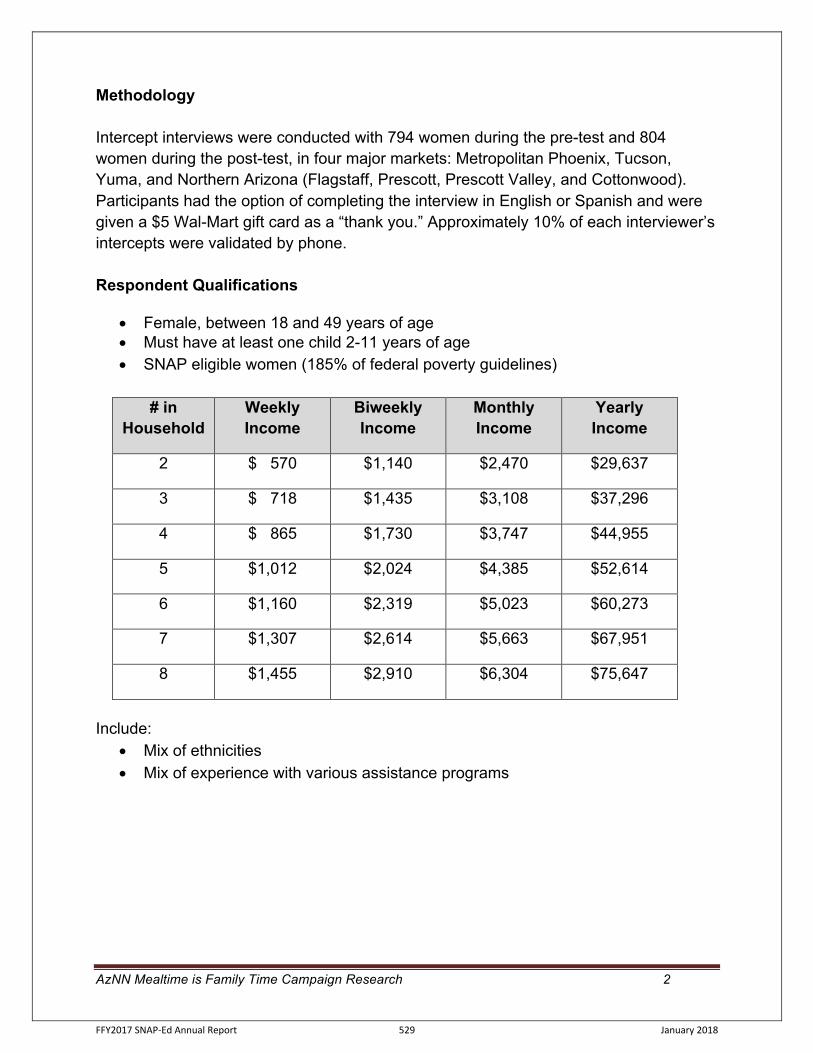
AzNN Mealtime is Family Time Campaign Research 2
Methodology Intercept interviews were conducted with 794 women during the pre-test and 804 women during the post-test, in four major markets: Metropolitan Phoenix, Tucson, Yuma, and Northern Arizona (Flagstaff, Prescott, Prescott Valley, and Cottonwood). Participants had the option of completing the interview in English or Spanish and were given a $5 Wal-Mart gift card as a “thank you.” Approximately 10% of each interviewer’s intercepts were validated by phone. Respondent Qualifications
• Female, between 18 and 49 years of age • Must have at least one child 2-11 years of age • SNAP eligible women (185% of federal poverty guidelines)
# in
Household Weekly Income
Biweekly Income
Monthly Income
Yearly Income
2 $ 570 $1,140 $2,470 $29,637
3 $ 718 $1,435 $3,108 $37,296
4 $ 865 $1,730 $3,747 $44,955
5 $1,012 $2,024 $4,385 $52,614
6 $1,160 $2,319 $5,023 $60,273
7 $1,307 $2,614 $5,663 $67,951
8 $1,455 $2,910 $6,304 $75,647
Include:
• Mix of ethnicities • Mix of experience with various assistance programs
FFY2017 SNAP-Ed Annual Report 529 January 2018
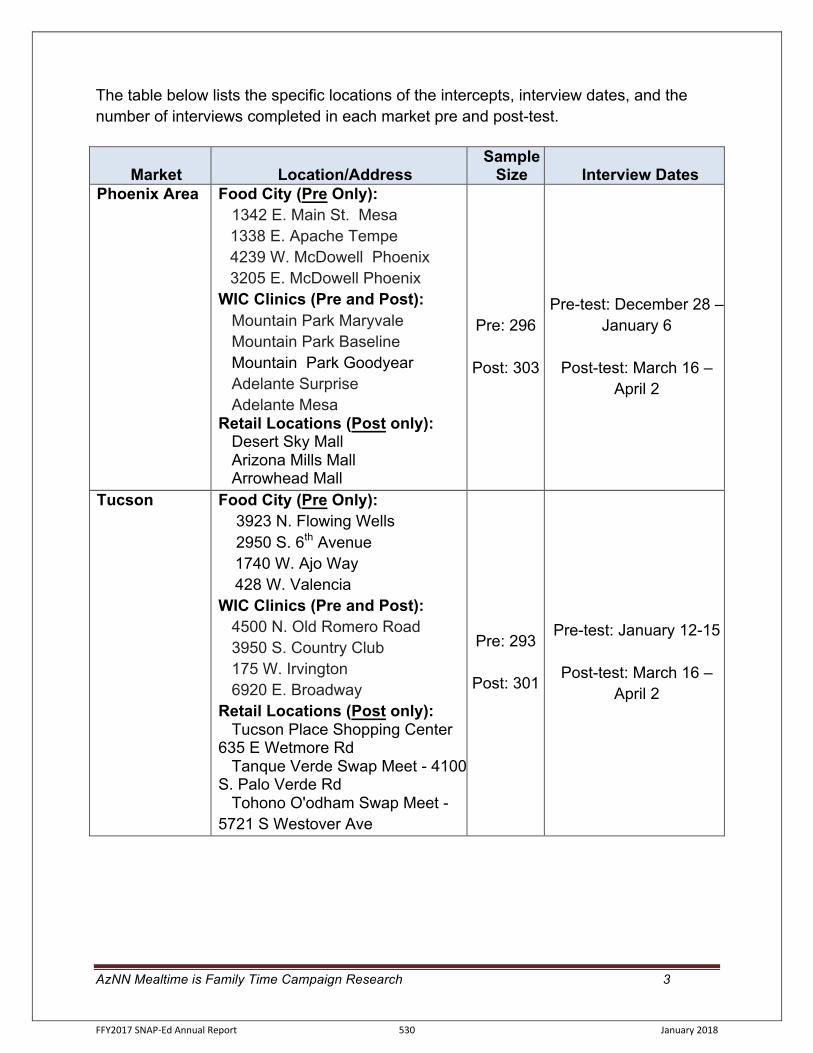
AzNN Mealtime is Family Time Campaign Research 3
The table below lists the specific locations of the intercepts, interview dates, and the number of interviews completed in each market pre and post-test.
Market Location/Address Sample
Size Interview Dates Phoenix Area Food City (Pre Only):
1342 E. Main St. Mesa 1338 E. Apache Tempe 4239 W. McDowell Phoenix 3205 E. McDowell Phoenix WIC Clinics (Pre and Post): Mountain Park Maryvale Mountain Park Baseline Mountain Park Goodyear Adelante Surprise Adelante Mesa Retail Locations (Post only): Desert Sky Mall Arizona Mills Mall Arrowhead Mall
Pre: 296
Post: 303
Pre-test: December 28 –
January 6
Post-test: March 16 – April 2
Tucson Food City (Pre Only): 3923 N. Flowing Wells 2950 S. 6th Avenue
1740 W. Ajo Way 428 W. Valencia
WIC Clinics (Pre and Post): 4500 N. Old Romero Road 3950 S. Country Club 175 W. Irvington 6920 E. Broadway Retail Locations (Post only): Tucson Place Shopping Center 635 E Wetmore Rd Tanque Verde Swap Meet - 4100 S. Palo Verde Rd Tohono O'odham Swap Meet - 5721 S Westover Ave
Pre: 293
Post: 301
Pre-test: January 12-15
Post-test: March 16 – April 2
FFY2017 SNAP-Ed Annual Report 530 January 2018
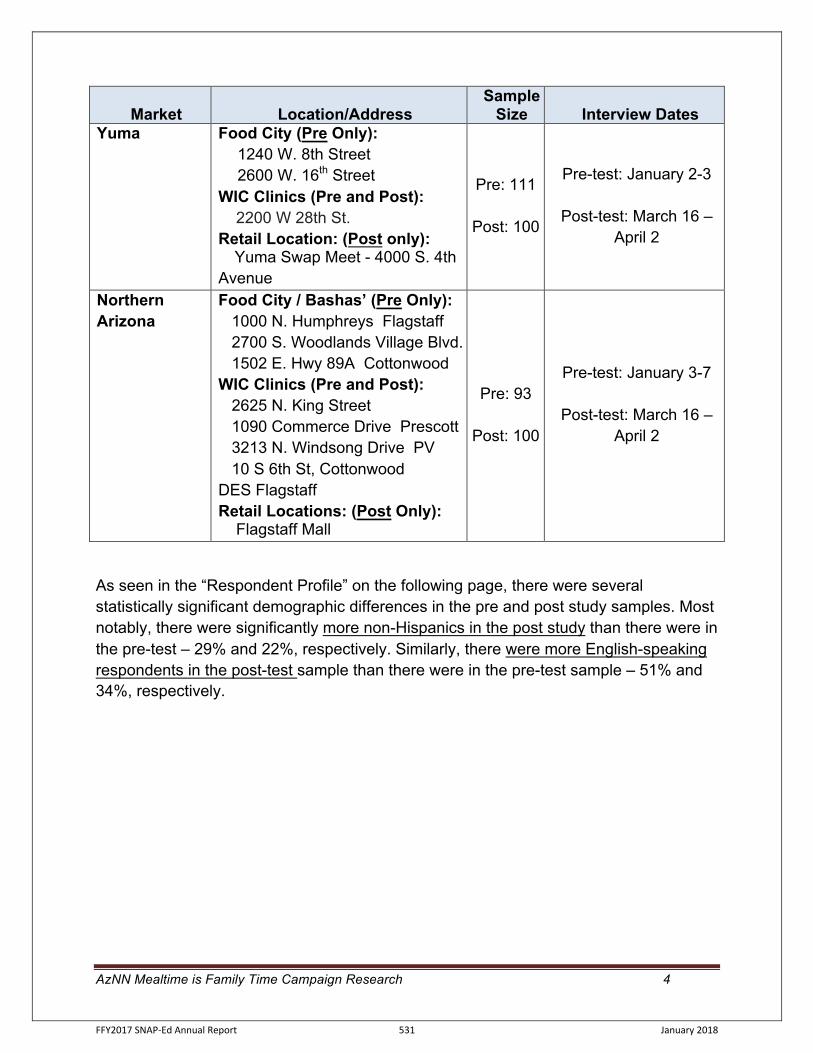
AzNN Mealtime is Family Time Campaign Research 4
Market Location/Address Sample
Size Interview Dates Yuma Food City (Pre Only):
1240 W. 8th Street 2600 W. 16th Street
WIC Clinics (Pre and Post): 2200 W 28th St. Retail Location: (Post only): Yuma Swap Meet - 4000 S. 4th Avenue
Pre: 111
Post: 100
Pre-test: January 2-3
Post-test: March 16 –
April 2
Northern Arizona
Food City / Bashas’ (Pre Only): 1000 N. Humphreys Flagstaff 2700 S. Woodlands Village Blvd. 1502 E. Hwy 89A Cottonwood WIC Clinics (Pre and Post): 2625 N. King Street 1090 Commerce Drive Prescott 3213 N. Windsong Drive PV 10 S 6th St, Cottonwood DES Flagstaff Retail Locations: (Post Only): Flagstaff Mall
Pre: 93
Post: 100
Pre-test: January 3-7
Post-test: March 16 – April 2
As seen in the “Respondent Profile” on the following page, there were several statistically significant demographic differences in the pre and post study samples. Most notably, there were significantly more non-Hispanics in the post study than there were in the pre-test – 29% and 22%, respectively. Similarly, there were more English-speaking respondents in the post-test sample than there were in the pre-test sample – 51% and 34%, respectively.
FFY2017 SNAP-Ed Annual Report 531 January 2018
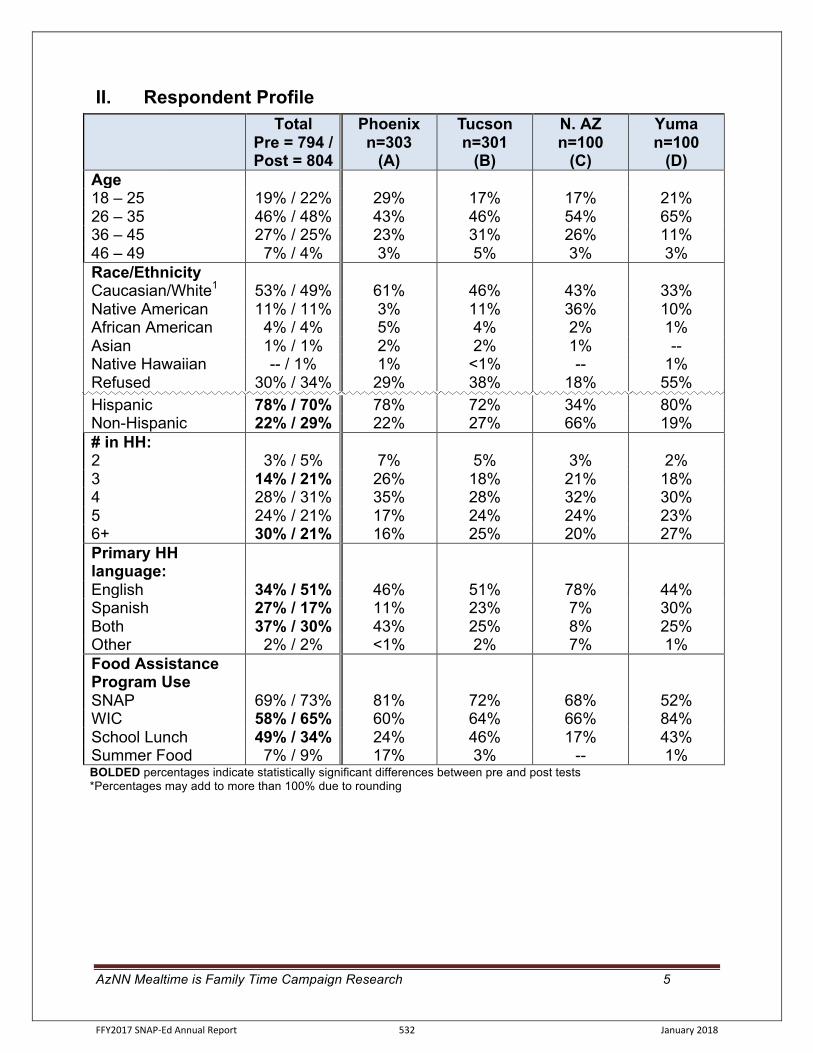
AzNN Mealtime is Family Time Campaign Research 5
II. Respondent Profile
Total Pre = 794 / Post = 804
Phoenix n=303
(A)
Tucson n=301
(B)
N. AZ n=100
(C)
Yuma n=100
(D) Age 18 – 25 19% / 22% 29% 17% 17% 21% 26 – 35 46% / 48% 43% 46% 54% 65% 36 – 45 27% / 25% 23% 31% 26% 11% 46 – 49 7% / 4% 3% 5% 3% 3%
Race/Ethnicity Caucasian/White1 53% / 49% 61% 46% 43% 33% Native American 11% / 11% 3% 11% 36% 10% African American 4% / 4% 5% 4% 2% 1% Asian 1% / 1% 2% 2% 1% -- Native Hawaiian -- / 1% 1% <1% -- 1% Refused 30% / 34% 29% 38% 18% 55% Hispanic 78% / 70% 78% 72% 34% 80% Non-Hispanic 22% / 29% 22% 27% 66% 19% # in HH: 2 3% / 5% 7% 5% 3% 2% 3 14% / 21% 26% 18% 21% 18% 4 28% / 31% 35% 28% 32% 30% 5 24% / 21% 17% 24% 24% 23% 6+ 30% / 21% 16% 25% 20% 27% Primary HH language: English 34% / 51% 46% 51% 78% 44% Spanish 27% / 17% 11% 23% 7% 30% Both 37% / 30% 43% 25% 8% 25% Other 2% / 2% <1% 2% 7% 1% Food Assistance Program Use SNAP 69% / 73% 81% 72% 68% 52% WIC 58% / 65% 60% 64% 66% 84% School Lunch 49% / 34% 24% 46% 17% 43% Summer Food 7% / 9% 17% 3% -- 1% BOLDED percentages indicate statistically significant differences between pre and post tests *Percentages may add to more than 100% due to rounding
FFY2017 SNAP-Ed Annual Report 532 January 2018
AzNN Mealtime is Family Time Campaign Research 6
III. Executive Summary § Unaided awareness was unchanged between the pre and post test studies.
Approximately one in three respondents recalled the campaign without being prompted both pre and post research.
§ Total campaign awareness decreased between the pre-test (58%) and post-test (45%), driven by the decrease in awareness in both Phoenix and Tucson. Total awareness among English-speaking participants decreased from 49% in the pre-campaign test to 36% in the post-test, a decrease of 36%. Among Hispanic respondents, total awareness decreased from 67% to 55%, a decrease of 22%.
§ A strong majority of respondents (84%) maintain they saw the advertising on TV. The next most frequently cited source was government offices, which include WIC clinics and DES offices (70%). Note: It is important to keep in mind that respondents of all ages tend to default to TV when they are unsure of where they have seen or heard advertising.
§ Bonding with family / family time together was the dominant message, with
seven in ten identifying this theme. The secondary message has to do with cooking healthy foods / teaching kids to cook/eat healthy, with more than half mentioning this message.
§ Perceptions of this campaign were high across the attributes measured. The
overwhelming majority of respondents strongly agree/agree the Mealtime is Family Time advertising is a good way to get people to eat fruits and veggies, makes me want to serve more fruits and veggies, and is believable and memorable. In addition, nearly nine in ten strongly agree/agree the advertising is entertaining and applies to them.
FFY2017 SNAP-Ed Annual Report 533 January 2018
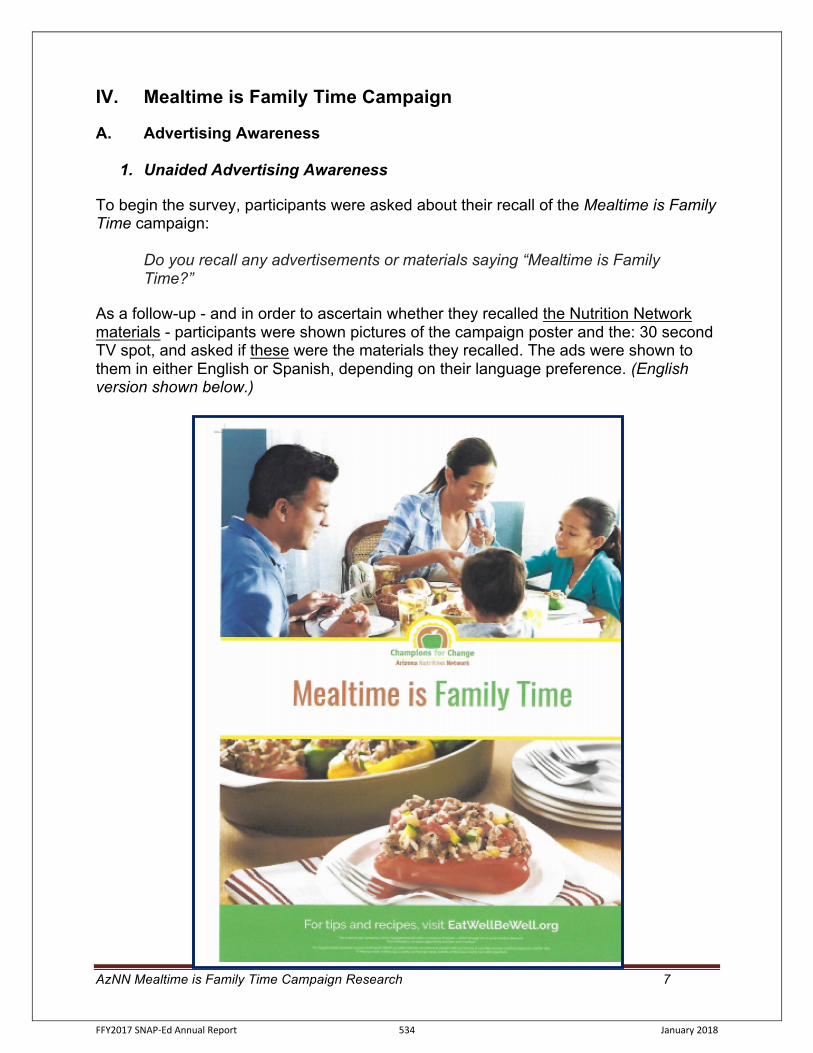
AzNN Mealtime is Family Time Campaign Research 7
IV. Mealtime is Family Time Campaign
A. Advertising Awareness
1. Unaided Advertising Awareness To begin the survey, participants were asked about their recall of the Mealtime is Family Time campaign:
Do you recall any advertisements or materials saying “Mealtime is Family Time?”
As a follow-up - and in order to ascertain whether they recalled the Nutrition Network materials - participants were shown pictures of the campaign poster and the: 30 second TV spot, and asked if these were the materials they recalled. The ads were shown to them in either English or Spanish, depending on their language preference. (English version shown below.)
FFY2017 SNAP-Ed Annual Report 534 January 2018
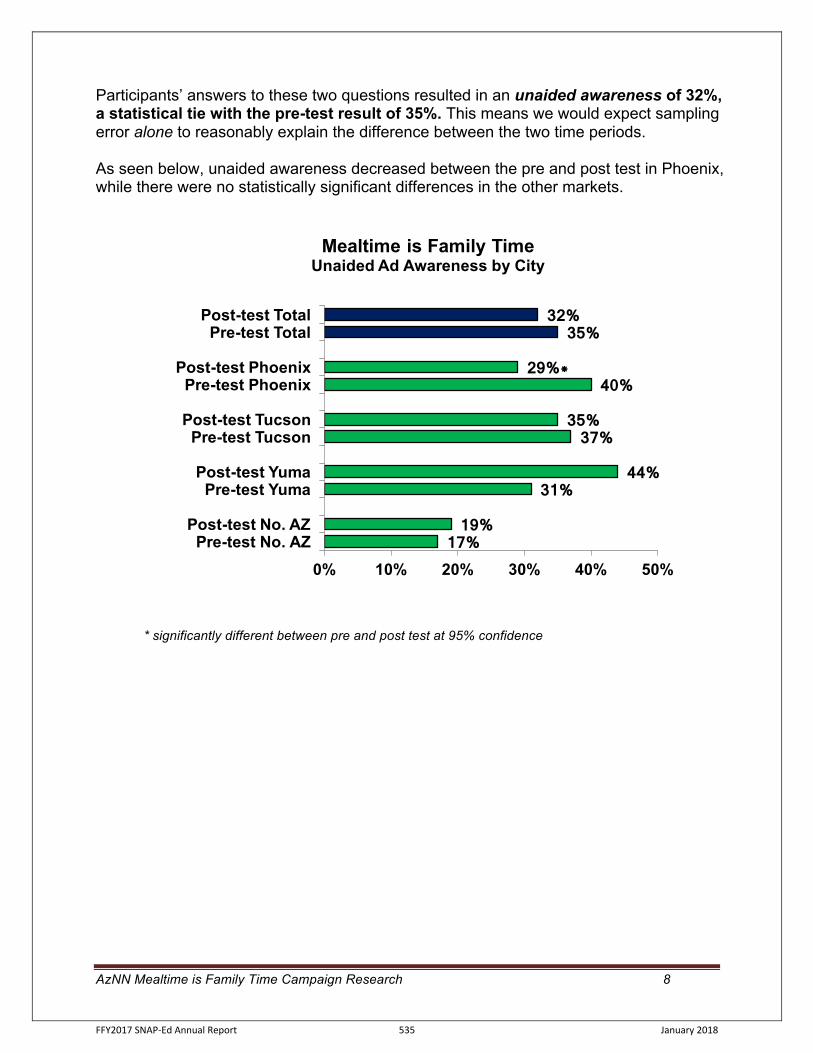
AzNN Mealtime is Family Time Campaign Research 8
Participants’ answers to these two questions resulted in an unaided awareness of 32%, a statistical tie with the pre-test result of 35%. This means we would expect sampling error alone to reasonably explain the difference between the two time periods. As seen below, unaided awareness decreased between the pre and post test in Phoenix, while there were no statistically significant differences in the other markets.
* significantly different between pre and post test at 95% confidence
17% 19%
31% 44%
37% 35%
40% 29%*
35% 32%
0% 10% 20% 30% 40% 50%Pre-test No. AZ
Post-test No. AZ
Pre-test YumaPost-test Yuma
Pre-test TucsonPost-test Tucson
Pre-test PhoenixPost-test Phoenix
Pre-test TotalPost-test Total
Mealtime is Family Time Unaided Ad Awareness by City
FFY2017 SNAP-Ed Annual Report 535 January 2018
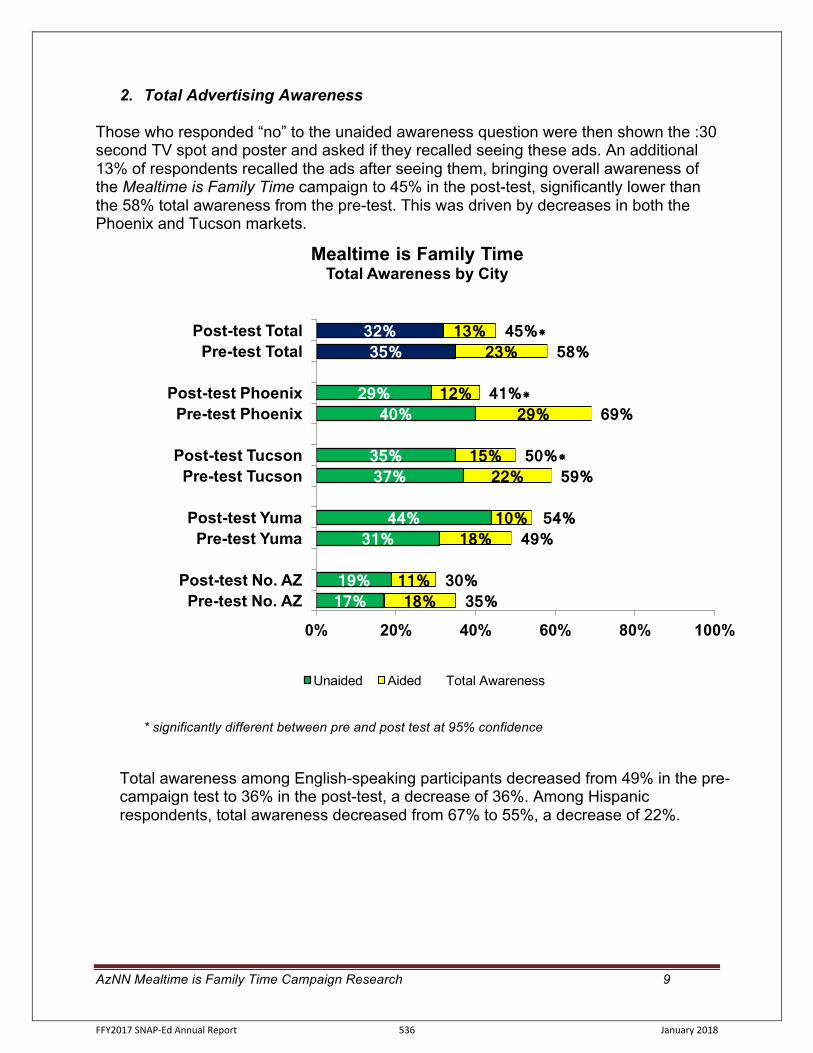
AzNN Mealtime is Family Time Campaign Research 9
2. Total Advertising Awareness Those who responded “no” to the unaided awareness question were then shown the :30 second TV spot and poster and asked if they recalled seeing these ads. An additional 13% of respondents recalled the ads after seeing them, bringing overall awareness of the Mealtime is Family Time campaign to 45% in the post-test, significantly lower than the 58% total awareness from the pre-test. This was driven by decreases in both the Phoenix and Tucson markets.
* significantly different between pre and post test at 95% confidence
Total awareness among English-speaking participants decreased from 49% in the pre-campaign test to 36% in the post-test, a decrease of 36%. Among Hispanic respondents, total awareness decreased from 67% to 55%, a decrease of 22%.
17% 19%
31% 44%
37% 35%
40% 29%
35% 32%
18% 11%
18% 10%
22% 15%
29% 12%
23% 13%
35% 30%
49% 54%
59% 50%*
69% 41%*
58% 45%*
0% 20% 40% 60% 80% 100%
Pre-test No. AZPost-test No. AZ
Pre-test YumaPost-test Yuma
Pre-test TucsonPost-test Tucson
Pre-test PhoenixPost-test Phoenix
Pre-test TotalPost-test Total
Mealtime is Family Time Total Awareness by City
Unaided Aided Total Awareness
FFY2017 SNAP-Ed Annual Report 536 January 2018
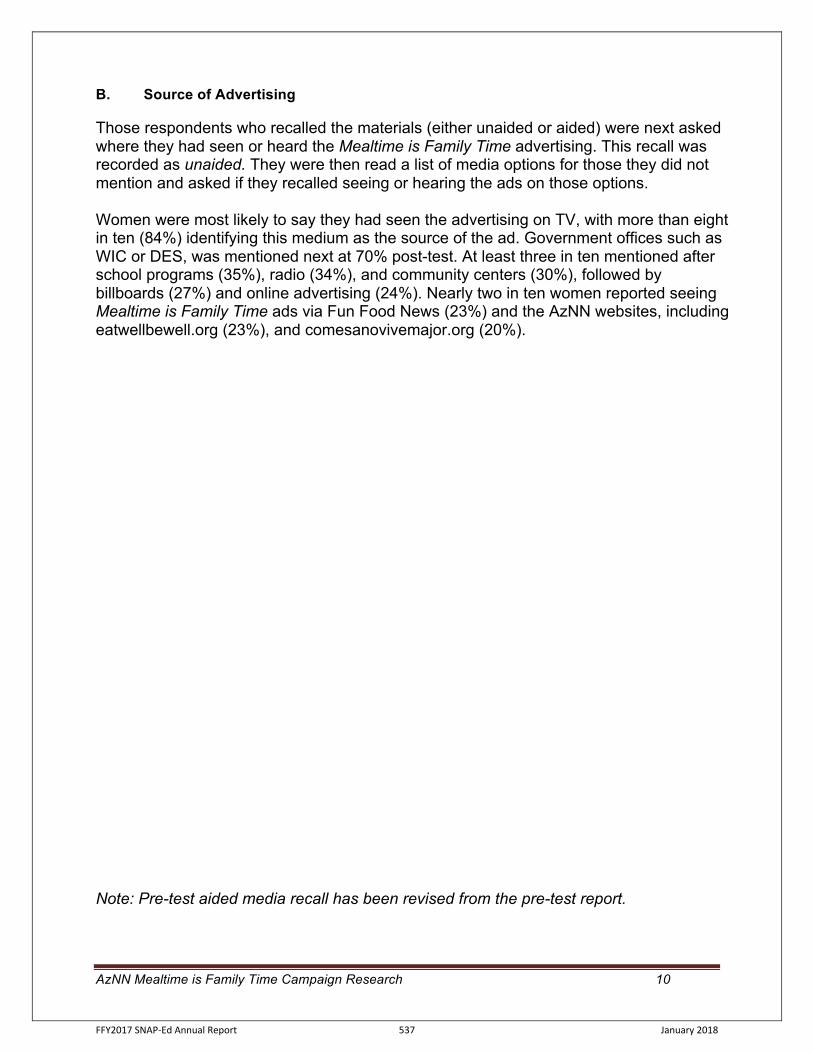
AzNN Mealtime is Family Time Campaign Research 10
B. Source of Advertising
Those respondents who recalled the materials (either unaided or aided) were next asked where they had seen or heard the Mealtime is Family Time advertising. This recall was recorded as unaided. They were then read a list of media options for those they did not mention and asked if they recalled seeing or hearing the ads on those options. Women were most likely to say they had seen the advertising on TV, with more than eight in ten (84%) identifying this medium as the source of the ad. Government offices such as WIC or DES, was mentioned next at 70% post-test. At least three in ten mentioned after school programs (35%), radio (34%), and community centers (30%), followed by billboards (27%) and online advertising (24%). Nearly two in ten women reported seeing Mealtime is Family Time ads via Fun Food News (23%) and the AzNN websites, including eatwellbewell.org (23%), and comesanovivemajor.org (20%). Note: Pre-test aided media recall has been revised from the pre-test report.
FFY2017 SNAP-Ed Annual Report 537 January 2018
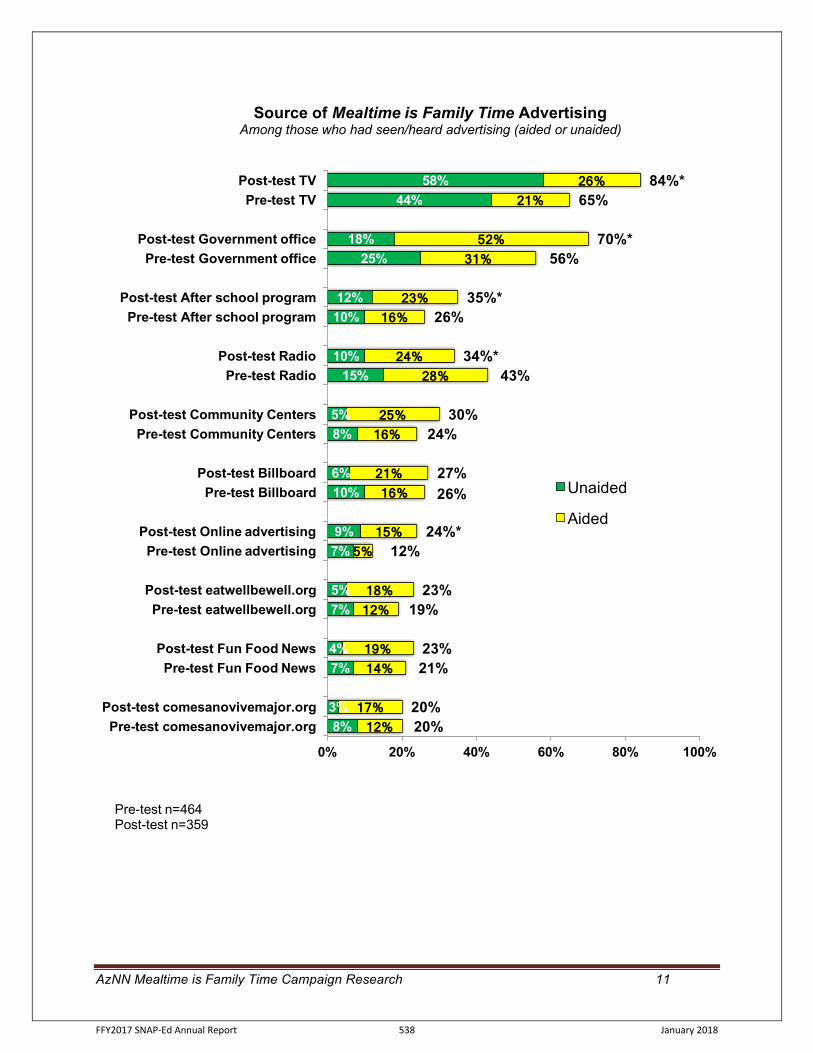
AzNN Mealtime is Family Time Campaign Research 11
8%3%
7%4%
7%5%
7%9%
10%6%
8%5%
15%10%
10%12%
25%18%
44%58%
12% 17%
14% 19%
12% 18%
5% 15%
16% 21%
16% 25%
28% 24%
16% 23%
31% 52%
21% 26%
20%20%
21%23%
19%23%
12%24%*
26%27%
24%30%
43%34%*
26%35%*
56%70%*
65%84%*
0% 20% 40% 60% 80% 100%
Pre-test comesanovivemajor.orgPost-test comesanovivemajor.org
Pre-test Fun Food NewsPost-test Fun Food News
Pre-test eatwellbewell.orgPost-test eatwellbewell.org
Pre-test Online advertisingPost-test Online advertising
Pre-test BillboardPost-test Billboard
Pre-test Community CentersPost-test Community Centers
Pre-test RadioPost-test Radio
Pre-test After school programPost-test After school program
Pre-test Government officePost-test Government office
Pre-test TVPost-test TV
Source of Mealtime is Family Time AdvertisingAmong those who had seen/heard advertising (aided or unaided)
Unaided
Aided
Pre-test n=464Post-test n=359
FFY2017 SNAP-Ed Annual Report 538 January 2018
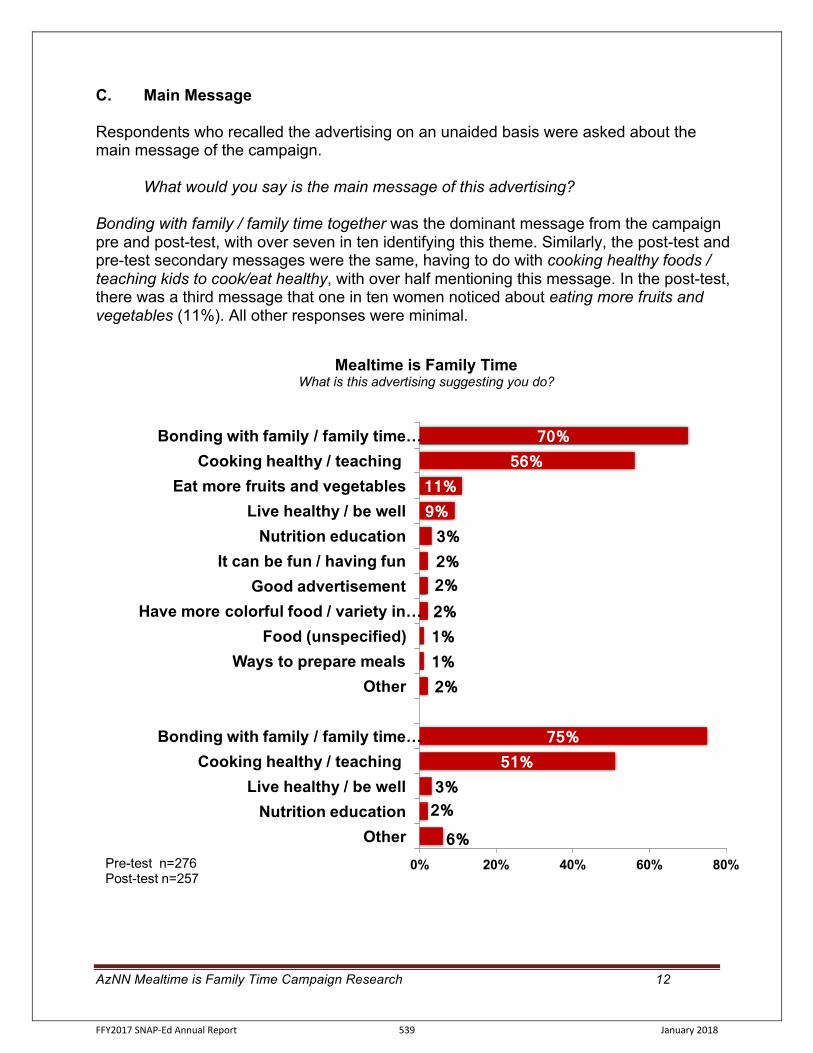
AzNN Mealtime is Family Time Campaign Research 12
C. Main Message Respondents who recalled the advertising on an unaided basis were asked about the main message of the campaign.
What would you say is the main message of this advertising? Bonding with family / family time together was the dominant message from the campaign pre and post-test, with over seven in ten identifying this theme. Similarly, the post-test and pre-test secondary messages were the same, having to do with cooking healthy foods / teaching kids to cook/eat healthy, with over half mentioning this message. In the post-test, there was a third message that one in ten women noticed about eating more fruits and vegetables (11%). All other responses were minimal.
6% 2% 3%
51% 75%
2% 1% 1% 2% 2% 2% 3%
9% 11%
56% 70%
0% 20% 40% 60% 80%
OtherNutrition education
Live healthy / be wellCooking healthy / teaching
Bonding with family / family time …
OtherWays to prepare meals
Food (unspecified)Have more colorful food / variety in …
Good advertisementIt can be fun / having fun
Nutrition educationLive healthy / be well
Eat more fruits and vegetablesCooking healthy / teaching
Bonding with family / family time …
Mealtime is Family TimeWhat is this advertising suggesting you do?
Pre-test n=276Post-test n=257
FFY2017 SNAP-Ed Annual Report 539 January 2018
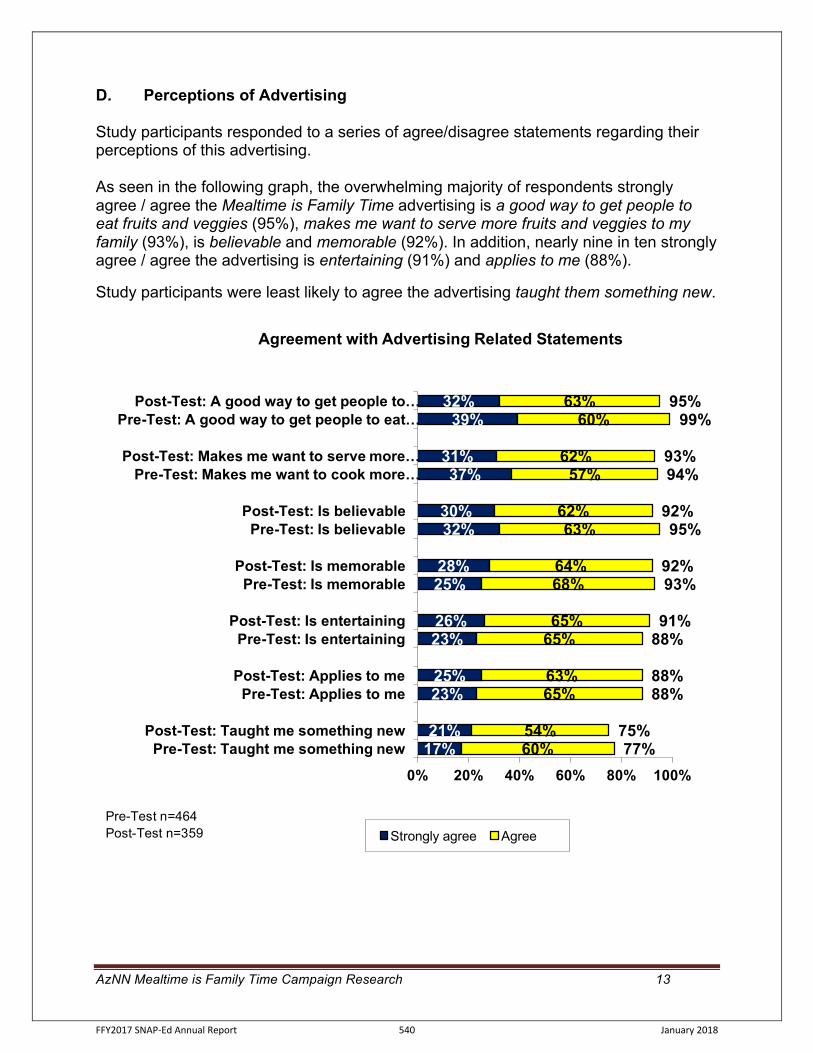
AzNN Mealtime is Family Time Campaign Research 13
D. Perceptions of Advertising Study participants responded to a series of agree/disagree statements regarding their perceptions of this advertising. As seen in the following graph, the overwhelming majority of respondents strongly agree / agree the Mealtime is Family Time advertising is a good way to get people to eat fruits and veggies (95%), makes me want to serve more fruits and veggies to my family (93%), is believable and memorable (92%). In addition, nearly nine in ten strongly agree / agree the advertising is entertaining (91%) and applies to me (88%).
Study participants were least likely to agree the advertising taught them something new.
17%21%
23%25%
23%26%
25%28%
32%30%
37%31%
39%32%
60%54%
65%63%
65%65%
68%64%
63%62%
57%62%
60%63%
77%75%
88%88%
88%91%
93%92%
95%92%
94%93%
99%95%
0% 20% 40% 60% 80% 100%
Pre-Test: Taught me something newPost-Test: Taught me something new
Pre-Test: Applies to mePost-Test: Applies to me
Pre-Test: Is entertainingPost-Test: Is entertaining
Pre-Test: Is memorablePost-Test: Is memorable
Pre-Test: Is believablePost-Test: Is believable
Pre-Test: Makes me want to cook more …Post-Test: Makes me want to serve more …
Pre-Test: A good way to get people to eat …Post-Test: A good way to get people to …
Agreement with Advertising Related Statements
Strongly agree AgreePre-Test n=464 Post-Test n=359
FFY2017 SNAP-Ed Annual Report 540 January 2018
AzNN Mealtime is Family Time Campaign Research 14
Appendix: Questionnaire
FFY2017 SNAP-Ed Annual Report 541 January 2018
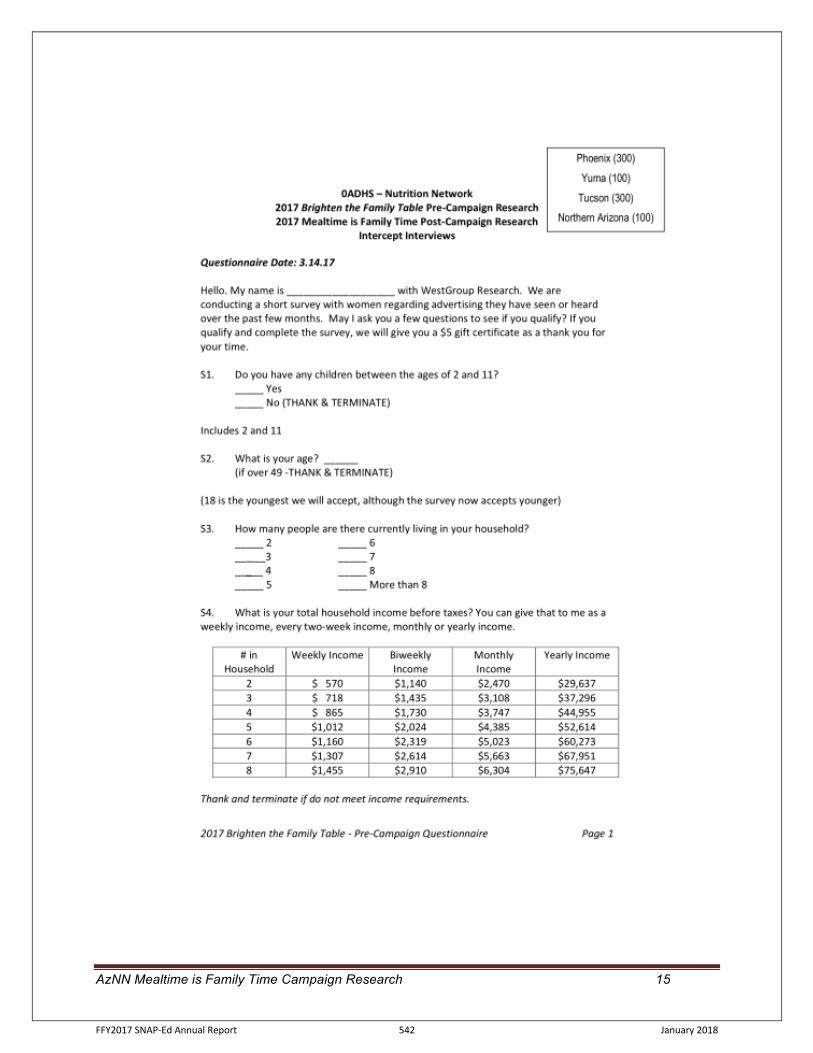
AzNN Mealtime is Family Time Campaign Research 15
FFY2017 SNAP-Ed Annual Report 542 January 2018
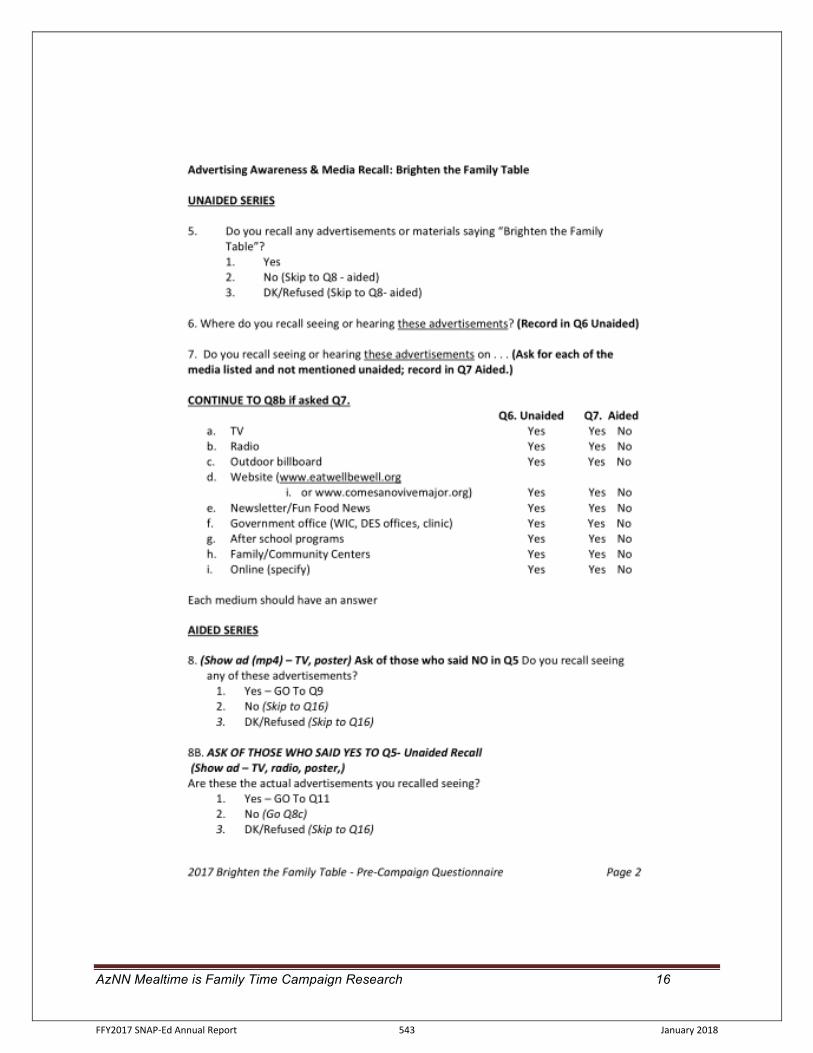
AzNN Mealtime is Family Time Campaign Research 16
FFY2017 SNAP-Ed Annual Report 543 January 2018
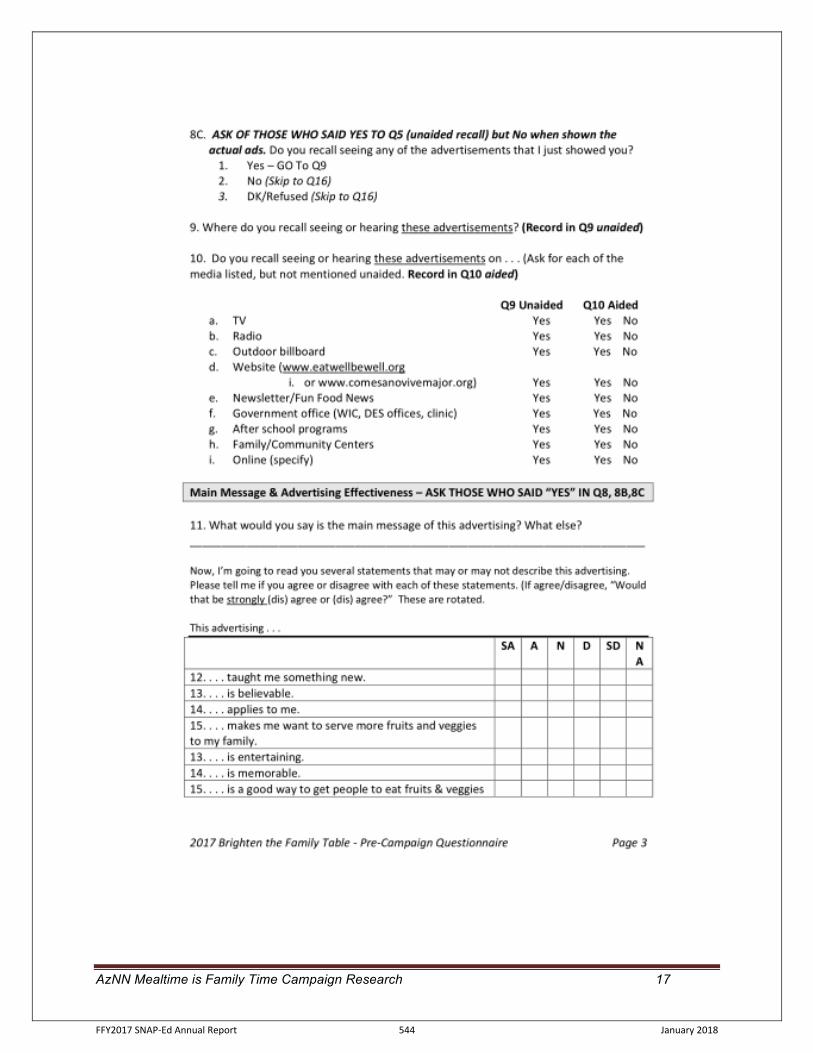
AzNN Mealtime is Family Time Campaign Research 17
FFY2017 SNAP-Ed Annual Report 544 January 2018
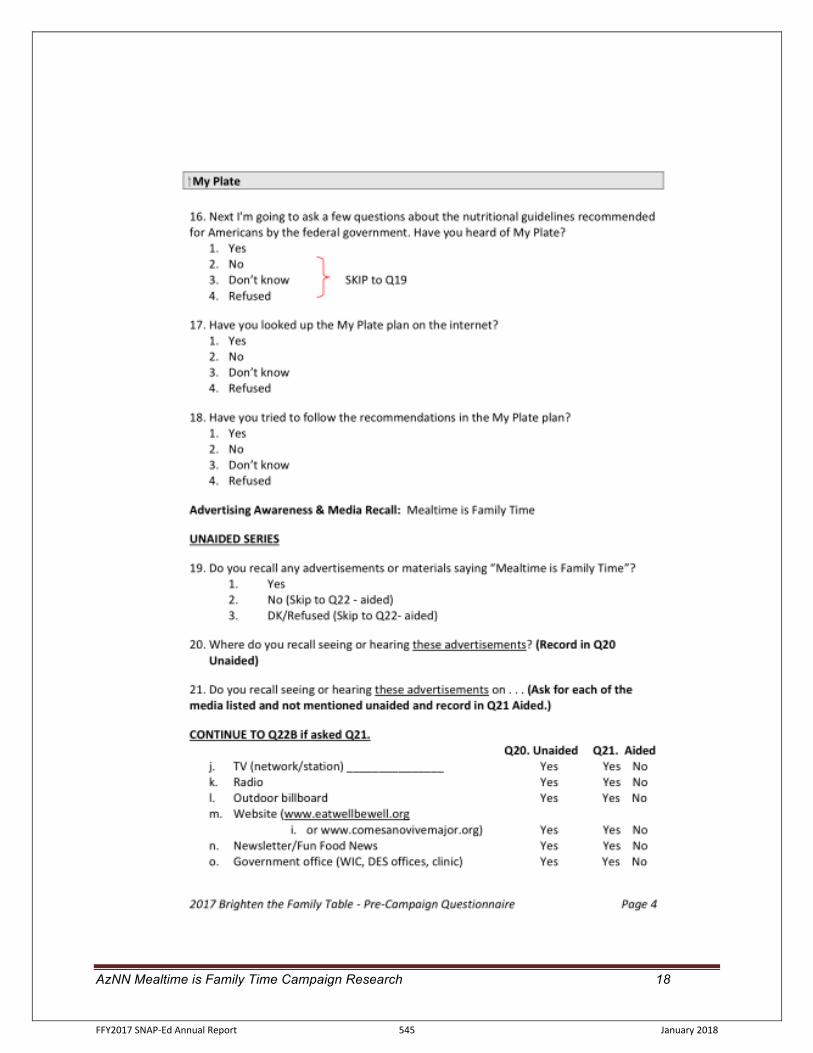
AzNN Mealtime is Family Time Campaign Research 18
FFY2017 SNAP-Ed Annual Report 545 January 2018
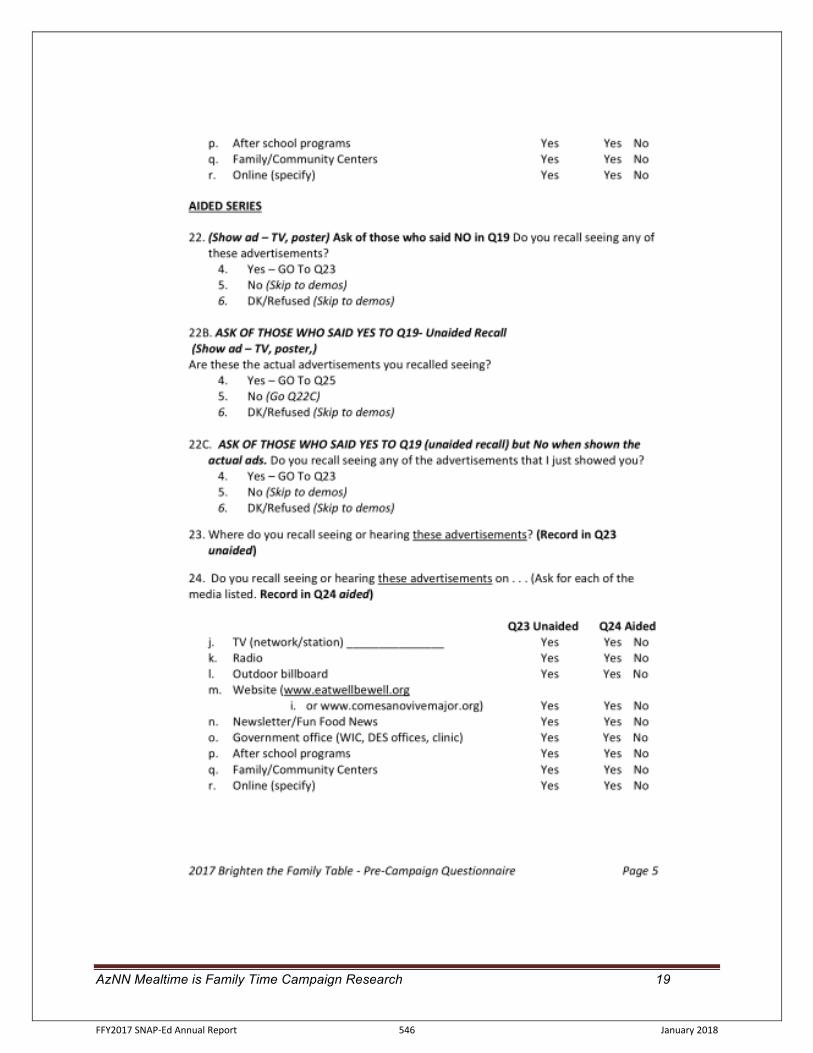
AzNN Mealtime is Family Time Campaign Research 19
FFY2017 SNAP-Ed Annual Report 546 January 2018
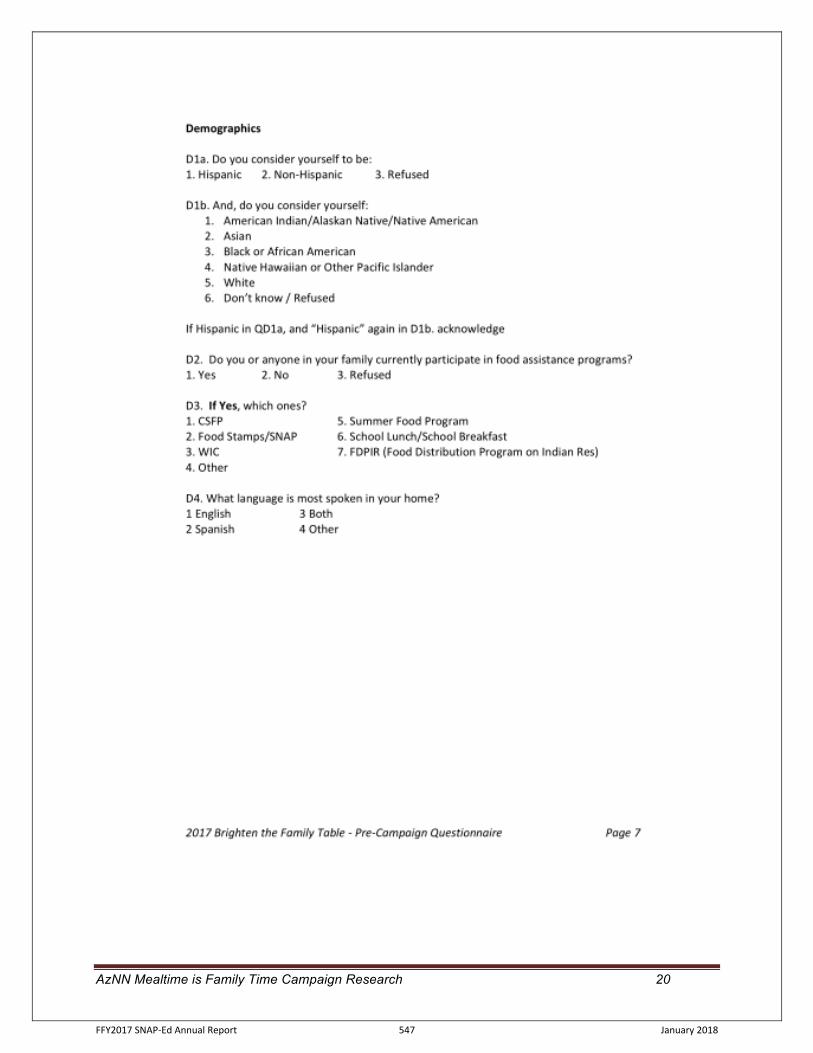
AzNN Mealtime is Family Time Campaign Research 20
FFY2017 SNAP-Ed Annual Report 547 January 2018

PAGE LEFT BLANK INTENTIONALLY
FFY2017 SNAP-Ed Annual Report 548 January 2018

Appendix M
New Materials
FFY2017 SNAP-Ed Annual Report 549 January 2018
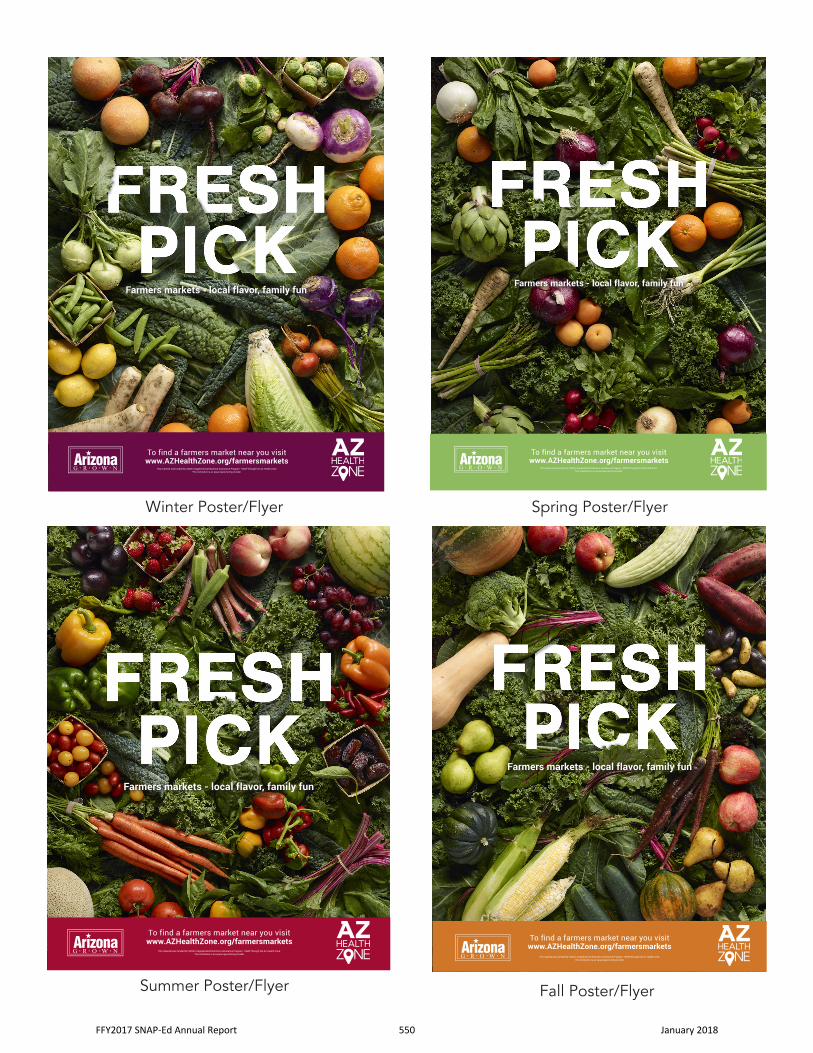
Fall Poster/Flyer
Winter Poster/Flyer Spring Poster/Flyer
Summer Poster/Flyer
Farmers markets - local flavor, family fun
To find a farmers market near you visit www.AZHealthZone.org/farmersmarkets
This material was funded by USDA’s Supplemental Nutrition Assistance Program - SNAP through the AZ Health Zone.This institution is an equal opportunity provider.
To find a farmers market near you visit www.AZHealthZone.org/farmersmarkets
This material was funded by USDA’s Supplemental Nutrition Assistance Program - SNAP through the AZ Health Zone.This institution is an equal opportunity provider.
Farmers markets - local flavor, family fun
To find a farmers market near you visit www.AZHealthZone.org/farmersmarkets
This material was funded by USDA’s Supplemental Nutrition Assistance Program - SNAP through the AZ Health Zone.This institution is an equal opportunity provider.
Farmers markets - local flavor, family fun
Farmers markets - local flavor, family fun
To find a farmers market near you visit www.AZHealthZone.org/farmersmarkets
This material was funded by USDA’s Supplemental Nutrition Assistance Program - SNAP through the AZ Health Zone.This institution is an equal opportunity provider.
FFY2017 SNAP-Ed Annual Report 550 January 2018
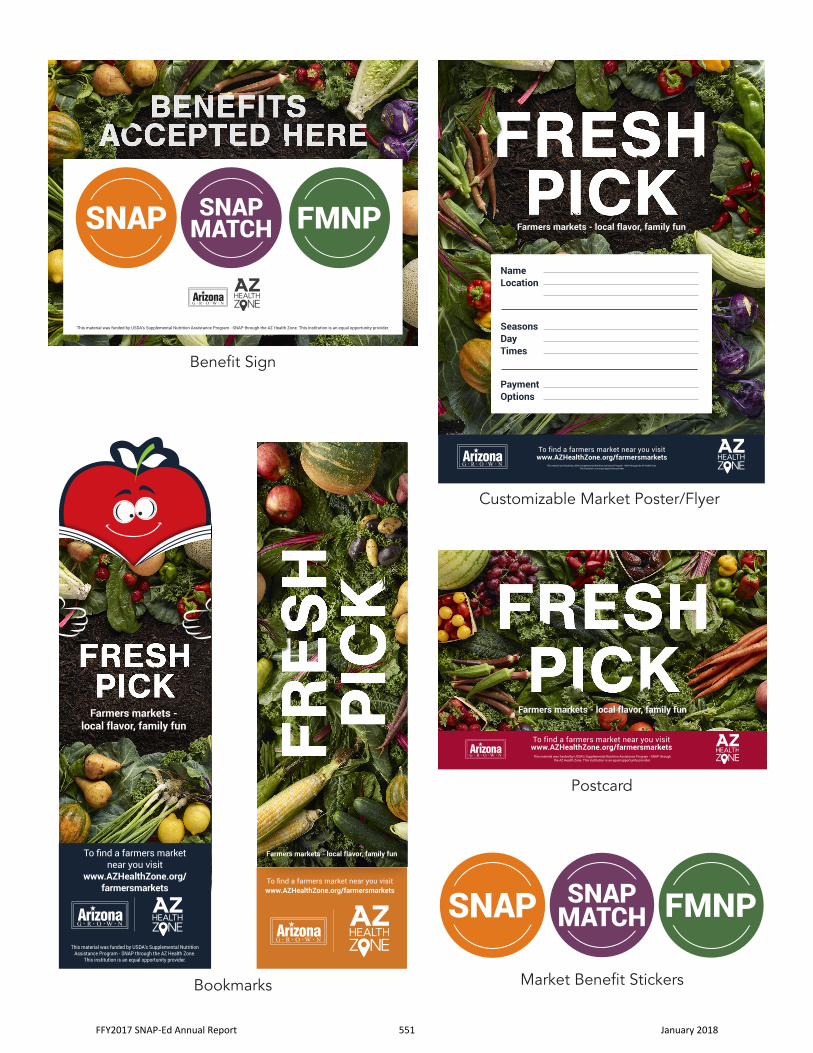
This material was funded by USDA’s Supplemental Nutrition Assistance Program - SNAP through the AZ Health Zone. This institution is an equal opportunity provider.
Benefit Sign
Farmers markets - local flavor, family fun
To find a farmers market near you visit
www.AZHealthZone.org/ farmersmarkets
This material was funded by USDA’s Supplemental Nutrition Assistance Program - SNAP through the AZ Health Zone.
This institution is an equal opportunity provider.
Bookmarks
To find a farmers market near you visit www.AZHealthZone.org/farmersmarkets
Farmers markets - local flavor, family fun
Farmers markets - local flavor, family fun
SeasonsDayTimes
Payment Options
NameLocation
To find a farmers market near you visit www.AZHealthZone.org/farmersmarkets
This material was funded by USDA’s Supplemental Nutrition Assistance Program - SNAP through the AZ Health Zone.This institution is an equal opportunity provider.
Customizable Market Poster/Flyer
Farmers markets - local flavor, family fun
To find a farmers market near you visit www.AZHealthZone.org/farmersmarkets
This material was funded by USDA’s Supplemental Nutrition Assistance Program - SNAP through the AZ Health Zone. This institution is an equal opportunity provider.
Postcard
Market Benefit Stickers
FFY2017 SNAP-Ed Annual Report 551 January 2018
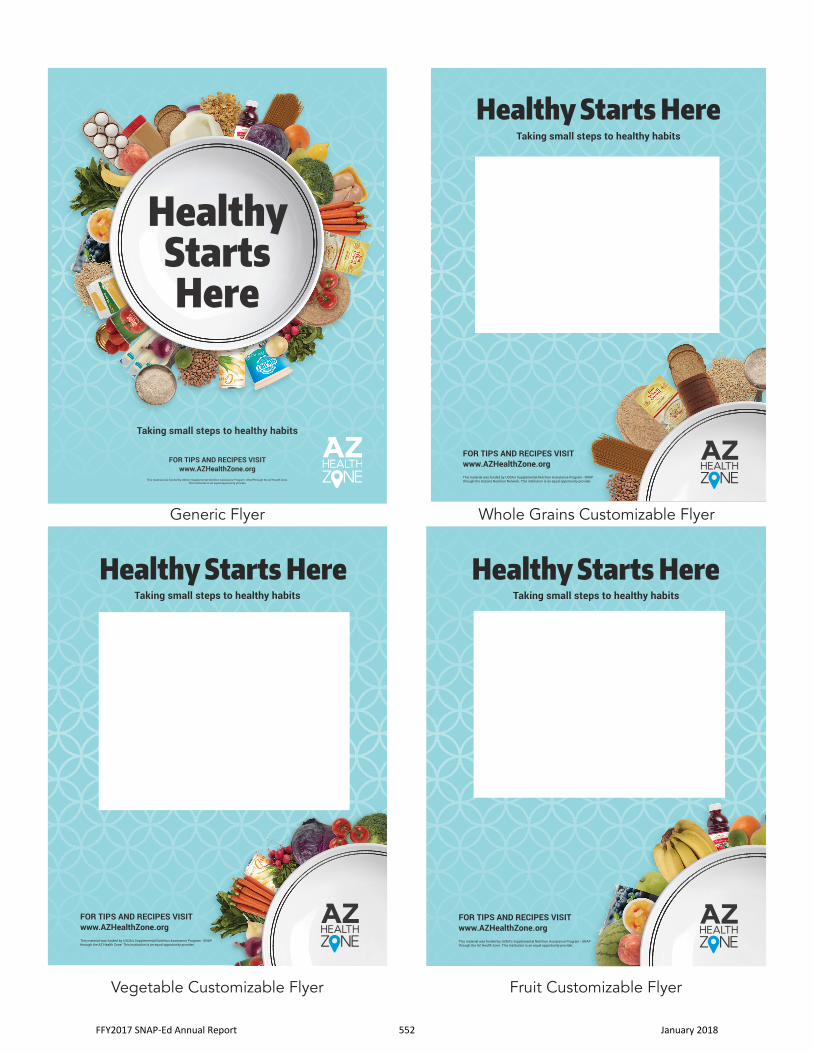
HealthyStartsHere
FOR TIPS AND RECIPES VISITwww.AZHealthZone.org
Taking small steps to healthy habits
This material was funded by USDA’s Supplemental Nutrition Assistance Program - SNAPthrough the AZ Health Zone. This institution is an equal opportunity provider.
Generic Flyer
Taking small steps to healthy habits
FOR TIPS AND RECIPES VISITwww.AZHealthZone.orgThis material was funded by USDA’s Supplemental Nutrition Assistance Program - SNAP through the AZ Health Zone. This institution is an equal opportunity provider.
Vegetable Customizable Flyer
Taking small steps to healthy habits
FOR TIPS AND RECIPES VISITwww.AZHealthZone.orgThis material was funded by USDA’s Supplemental Nutrition Assistance Program - SNAP through the AZ Health Zone. This institution is an equal opportunity provider.
Fruit Customizable Flyer
Healthy Starts HereTaking small steps to healthy habits
FOR TIPS AND RECIPES VISITwww.AZHealthZone.orgThis material was funded by USDA’s Supplemental Nutrition Assistance Program - SNAP through the Arizona Nutrition Network. This institution is an equal opportunity provider.
Whole Grains Customizable Flyer
FFY2017 SNAP-Ed Annual Report 552 January 2018
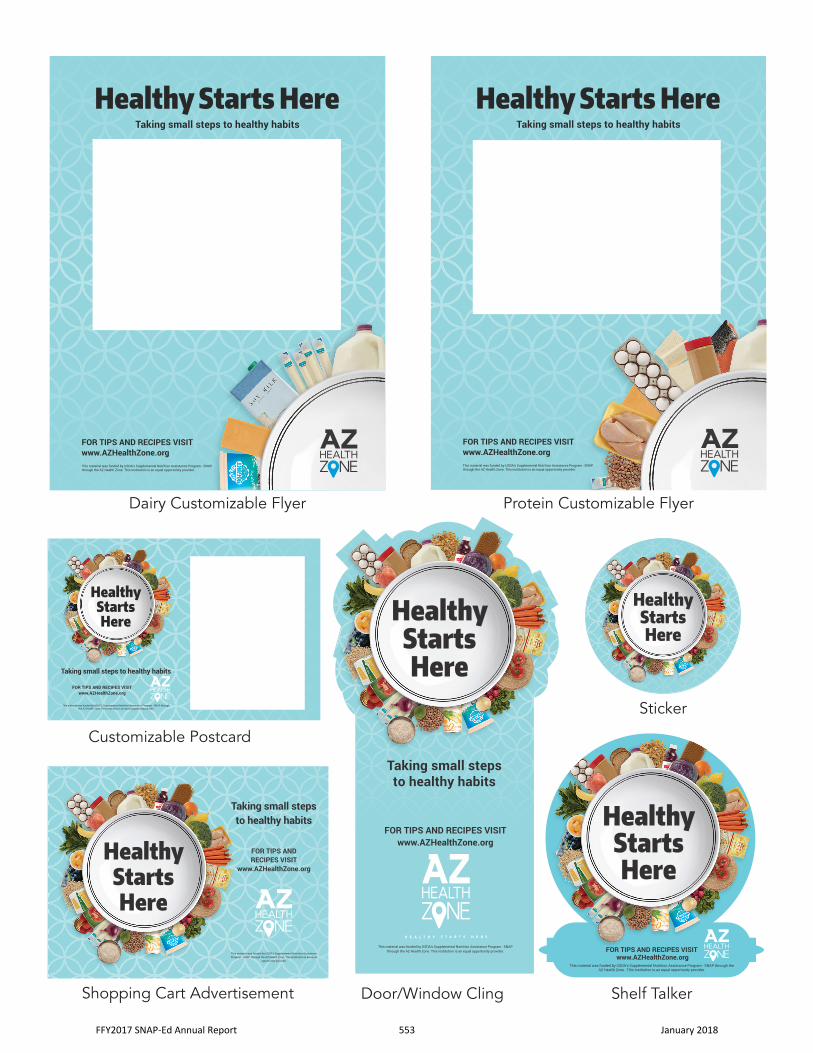
Taking small steps to healthy habits
This material was funded by USDA’s Supplemental Nutrition Assistance Program - SNAP through the AZ Health Zone. This institution is an equal opportunity provider.
HealthyStartsHere
FOR TIPS AND RECIPES VISITwww.AZHealthZone.org
Customizable Postcard
Taking small steps to healthy habits
FOR TIPS AND RECIPES VISITwww.AZHealthZone.orgThis material was funded by USDA’s Supplemental Nutrition Assistance Program - SNAP through the AZ Health Zone. This institution is an equal opportunity provider.
Dairy Customizable Flyer
Taking small steps to healthy habits
FOR TIPS AND RECIPES VISITwww.AZHealthZone.orgThis material was funded by USDA’s Supplemental Nutrition Assistance Program - SNAP through the AZ Health Zone. This institution is an equal opportunity provider.
Protein Customizable Flyer
FOR TIPS AND RECIPES VISITwww.AZHealthZone.org
Taking small steps to healthy habits
This material was funded by USDA’s Supplemental Nutrition Assistance Program - SNAP through the AZ Health Zone. This institution is an equal opportunity provider. FOR TIPS AND RECIPES VISIT
www.AZHealthZone.orgThis material was funded by USDA’s Supplemental Nutrition Assistance Program - SNAP through the
AZ Health Zone. This institution is an equal opportunity provider.
Shelf TalkerDoor/Window Cling
HealthyStartsHere
FOR TIPS AND RECIPES VISIT
www.AZHealthZone.org
Taking small steps to healthy habits
This material was funded by USDA’s Supplemental Nutrition Assistance Program - SNAP through the AZ Health Zone. This institution is an equal
opportunity provider.
Shopping Cart Advertisement
Sticker
FFY2017 SNAP-Ed Annual Report 553 January 2018
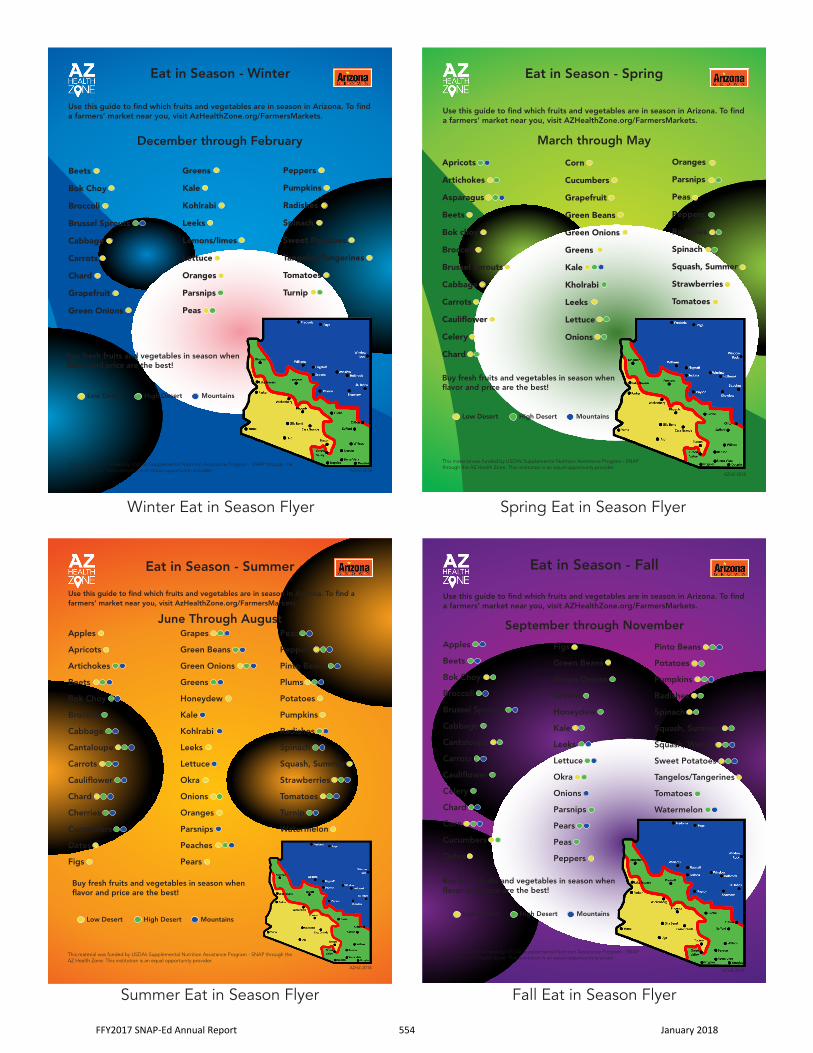
Fall Eat in Season Flyer
Winter Eat in Season Flyer Spring Eat in Season Flyer
Summer Eat in Season Flyer
Use this guide to find which fruits and vegetables are in season in Arizona. To find a farmers’ market near you, visit AZHealthZone.org/FarmersMarkets.
Eat in Season - Spring
March through May
Apricots
Artichokes
Asparagus
Beets
Bok choy
Broccoli
Brussel sprouts
Cabbage
Carrots
Cauliflower
Celery
Chard
Buy fresh fruits and vegetables in season when flavor and price are the best!
Corn
Cucumbers
Grapefruit
Green Beans
Green Onions
Greens
Kale
Kholrabi
Leeks
Lettuce
Onions
Oranges
Parsnips
Peas
Peppers
Radishes
Spinach
Squash, Summer
Strawberries
Tomatoes
Low Desert MountainsHigh Desert
This material was funded by USDA’s Supplemental Nutrition Assistance Program - SNAP through the AZ Health Zone. This institution is an equal opportunity provider.
AZHZ-2018
Eat in Season - Winter
December through February
Use this guide to find which fruits and vegetables are in season in Arizona. To find a farmers’ market near you, visit AzHealthZone.org/FarmersMarkets.
Beets
Bok Choy
Broccoli
Brussel Sprouts
Cabbage
Carrots
Chard
Grapefruit
Green Onions
Buy fresh fruits and vegetables in season when flavor and price are the best!
Greens
Kale
Kohlrabi
Leeks
Lemons/limes
Lettuce
Oranges
Parsnips
Peas
Peppers
Pumpkins
Radishes
Spinach
Sweet Potatoes
Tangelos/Tangerines
Tomatoes
Turnip
Low Desert MountainsHigh Desert
This material was funded by USDA’s Supplemental Nutrition Assistance Program - SNAP through the AZ Health Zone. This institution is an equal opportunity provider. AZHZ-2018
Eat in Season - Summer
June Through AugustApples
Apricots
Artichokes
Beets
Bok Choy
Broccoli
Cabbage
Cantaloupe
Carrots
Cauliflower
Chard
Cherries
Cucumbers
Dates
Figs
Use this guide to find which fruits and vegetables are in season in Arizona. To find a farmers’ market near you, visit AzHealthZone.org/FarmersMarkets.
Buy fresh fruits and vegetables in season when flavor and price are the best!
Grapes
Green Beans
Green Onions
Greens
Honeydew
Kale
Kohlrabi
Leeks
Lettuce
Okra
Onions
Oranges
Parsnips
Peaches
Pears
Peas
Peppers
Pinto Beans
Plums
Potatoes
Pumpkins
Radishes
Spinach
Squash, Summer
Strawberries
Tomatoes
Turnip
Watermelon
Low Desert MountainsHigh Desert
This material was funded by USDA’s Supplemental Nutrition Assistance Program - SNAP through the AZ Health Zone. This institution is an equal opportunity provider.
AZHZ-2018
Eat in Season - Fall
September through November
Use this guide to find which fruits and vegetables are in season in Arizona. To find a farmers’ market near you, visit AZHealthZone.org/FarmersMarkets.
Buy fresh fruits and vegetables in season when flavor and price are the best!
Apples
Beets
Bok Choy
Broccoli
Brussel Sprouts
Cabbage
Cantaloupe
Carrots
Cauliflower
Celery
Chard
Corn
Cucumbers
Dates
Low Desert MountainsHigh Desert
Figs
Green Beans
Green Onions
Greens
Honeydew
Kale
Leeks
Lettuce
Okra
Onions
Parsnips
Pears
Peas
Peppers
Pinto Beans
Potatoes
Pumpkins
Radishes
Spinach
Squash, Summer
Squash, Winter
Sweet Potatoes
Tangelos/Tangerines
Tomatoes
Watermelon
AZHZ-2018
This material was funded by USDA’s Supplemental Nutrition Assistance Program - SNAP through the AZ Health Zone. This institution is an equal opportunity provider.
FFY2017 SNAP-Ed Annual Report 554 January 2018
Appendix N
Community Profiles
FFY2017 SNAP-Ed Annual Report 555 January 2018
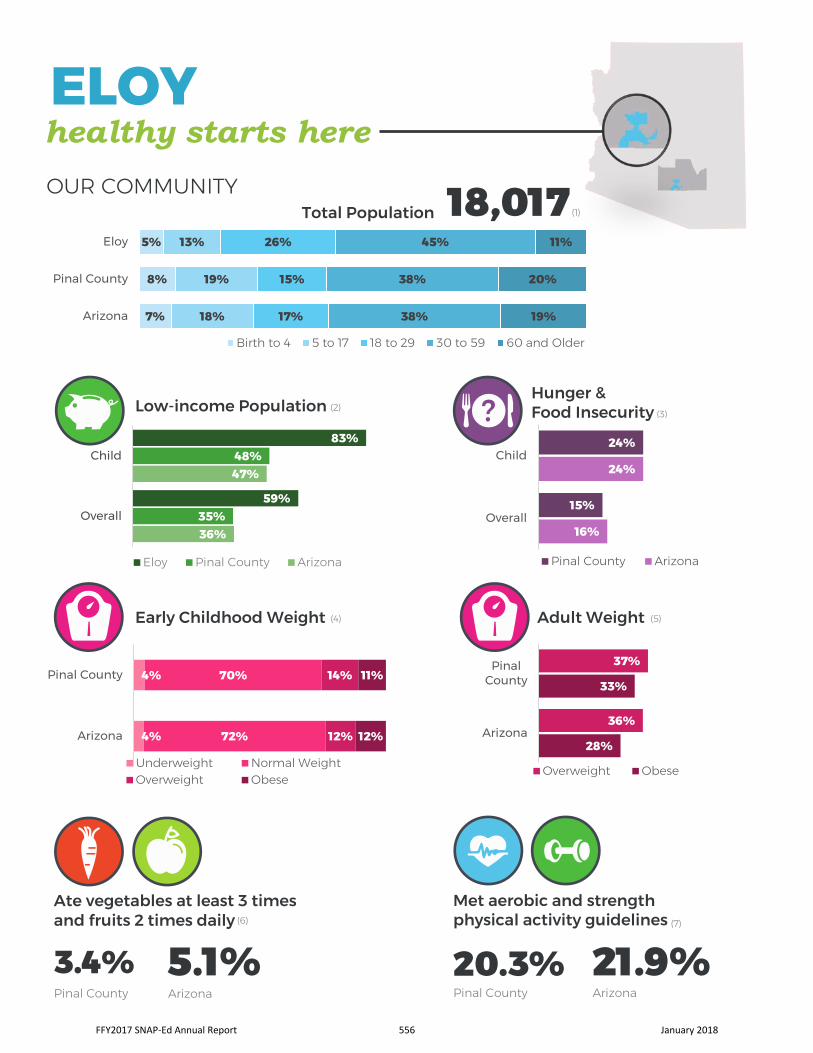
OUR COMMUNITY Total Population 18,017
(1)
Low-income Population (2) Hunger & Food Insecurity
(3)
Early Childhood Weight (4) Adult Weight (5)
Met aerobic and strength physical activity guidelines
20.3%
21.9%
Pinal County Arizona
(7)
5.1% Ate vegetables at least 3 times and fruits 2 times daily
3.4% Pinal County Arizona
(6)
ELOY healthy starts here
5%
8%
7%
13%
19%
18%
26%
15%
17%
45%
38%
38%
11%
20%
19%
Eloy
Pinal County
Arizona
Birth to 4 5 to 17 18 to 29 30 to 59 60 and Older
83%
59%
48%
35%
47%
36%
Child
Overall
Eloy Pinal County Arizona
4%
4%
70%
72%
14%
12%
11%
12%
Pinal County
Arizona
Underweight Normal WeightOverweight Obese
37%
36%
33%
28%
PinalCounty
Arizona
Overweight Obese
24%
15%
24%
16%
Child
Overall
Pinal County Arizona
FFY2017 SNAP-Ed Annual Report 556 January 2018
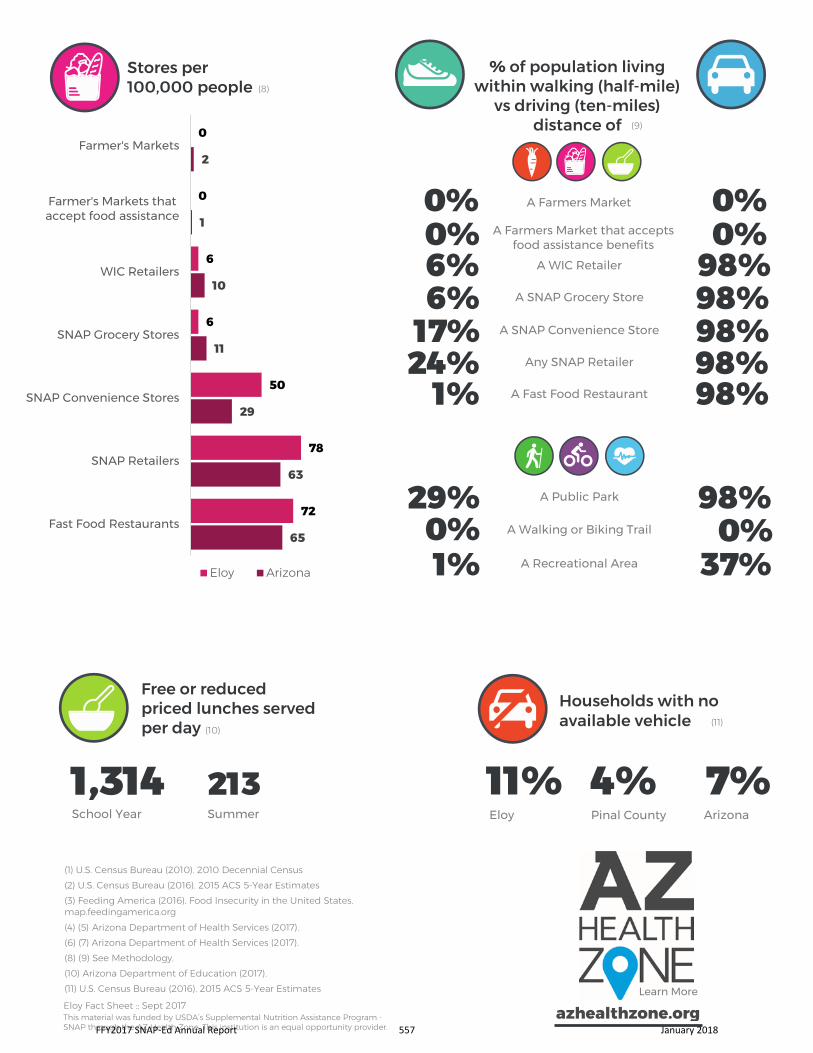
azhealthzone.org
(1) U.S. Census Bureau (2010). 2010 Decennial Census (2) U.S. Census Bureau (2016). 2015 ACS 5-Year Estimates (3) Feeding America (2016). Food Insecurity in the United States. map.feedingamerica.org (4) (5) Arizona Department of Health Services (2017). (6) (7) Arizona Department of Health Services (2017). (8) (9) See Methodology. (10) Arizona Department of Education (2017). (11) U.S. Census Bureau (2016). 2015 ACS 5-Year Estimates
Eloy Fact Sheet :: Sept 2017 Learn More
Stores per 100,000 people (8)
A WIC Retailer
A Farmers Market
A Farmers Market that accepts food assistance benefits
A SNAP Grocery Store
A SNAP Convenience Store
Any SNAP Retailer
A Fast Food Restaurant
% of population living within walking (half-mile)
vs driving (ten-miles) distance of
0% 0%
0% 0% 98% 6% 98% 6% 98% 17% 98% 24% 98% 1%
A Public Park
A Walking or Biking Trail
A Recreational Area
29% 98% 0% 0% 1% 37%
(9)
Free or reduced priced lunches served per day
213
1,314
Summer School Year
(10)
Households with no available vehicle
7% 4%
Arizona Pinal County
11% Eloy
(11)
0
0
6
6
50
78
72
2
1
10
11
29
63
65
Farmer's Markets
Farmer's Markets thataccept food assistance
WIC Retailers
SNAP Grocery Stores
SNAP Convenience Stores
SNAP Retailers
Fast Food Restaurants
Eloy Arizona
This material was funded by USDA’s Supplemental Nutrition Assistance Program - SNAP through the AZ Health Zone. This institution is an equal opportunity provider. FFY2017 SNAP-Ed Annual Report 557 January 2018
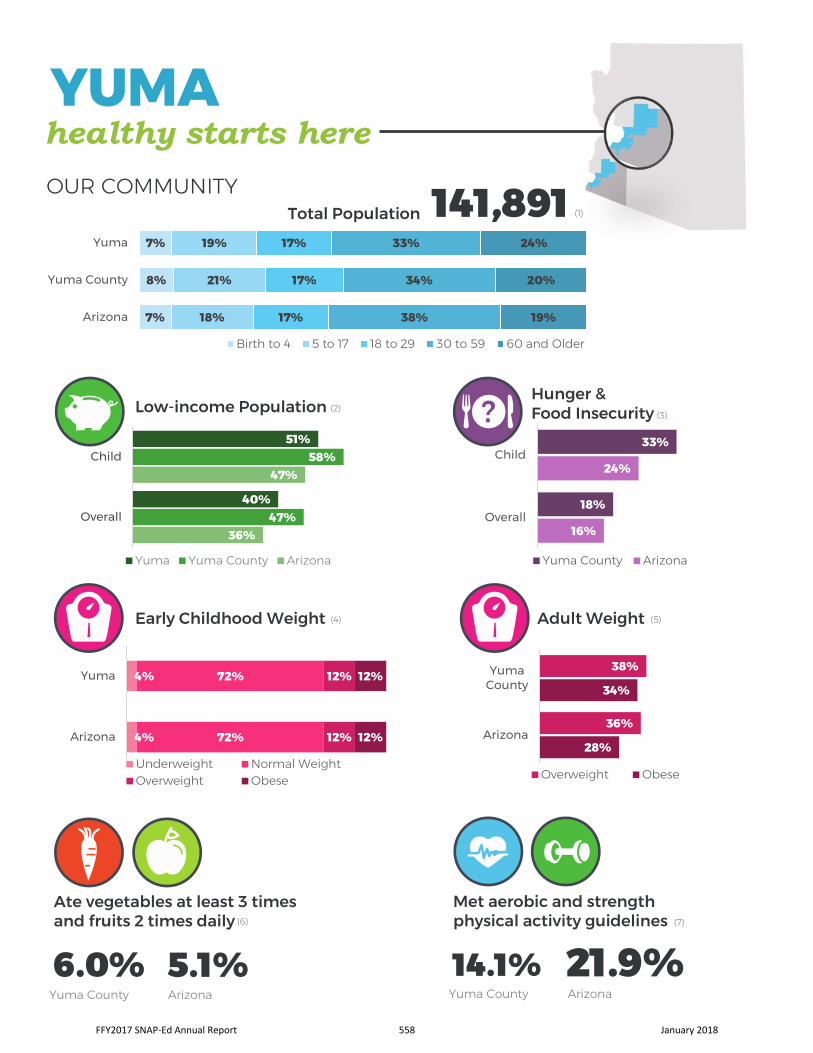
OUR COMMUNITY Total Population 141,891
(1)
Low-income Population (2) Hunger & Food Insecurity
(3)
Early Childhood Weight (4) Adult Weight (5)
Met aerobic and strength physical activity guidelines
14.1%
21.9%
Yuma County Arizona
(7)
5.1%
Ate vegetables at least 3 times and fruits 2 times daily
6.0%
Yuma County Arizona
(6)
YUMA healthy starts here
7%
8%
7%
19%
21%
18%
17%
17%
17%
33%
34%
38%
24%
20%
19%
Yuma
Yuma County
Arizona
Birth to 4 5 to 17 18 to 29 30 to 59 60 and Older
51%
40%
58%
47%
47%
36%
Child
Overall
Yuma Yuma County Arizona
4%
4%
72%
72%
12%
12%
12%
12%
Yuma
Arizona
Underweight Normal WeightOverweight Obese
38%
36%
34%
28%
YumaCounty
Arizona
Overweight Obese
33%
18%
24%
16%
Child
Overall
Yuma County Arizona
FFY2017 SNAP-Ed Annual Report 558 January 2018
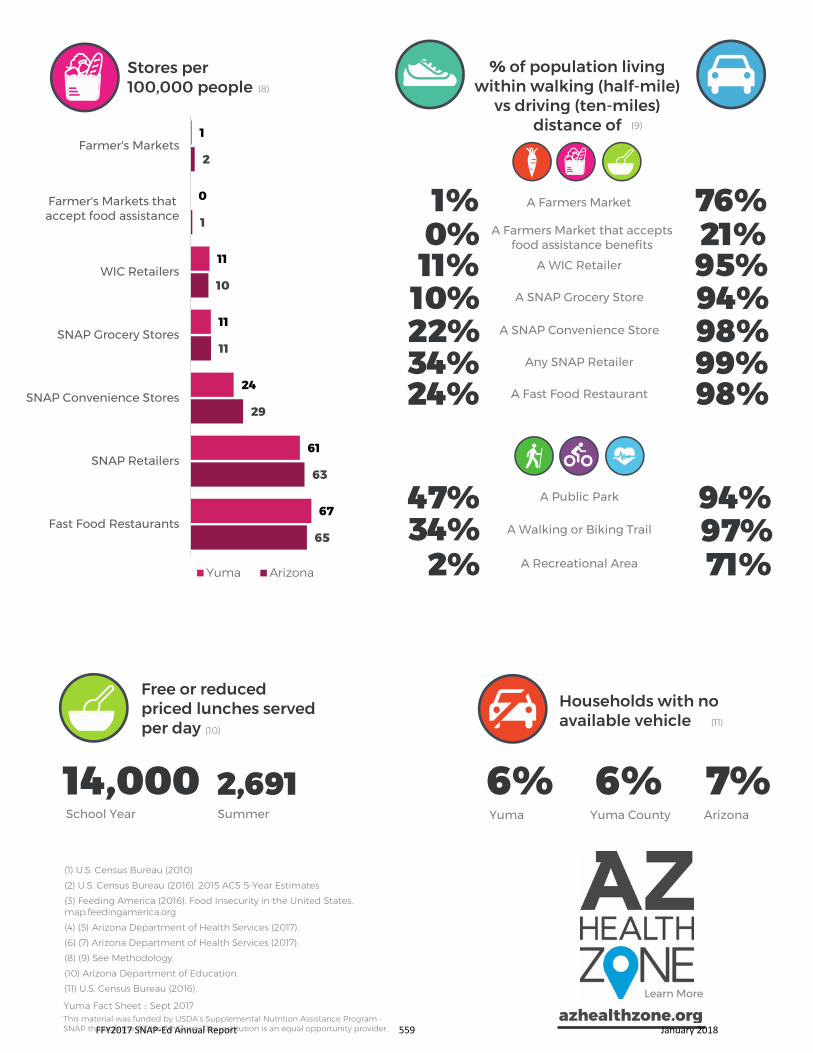
(1) U.S. Census Bureau (2010) (2) U.S. Census Bureau (2016). 2015 ACS 5-Year Estimates (3) Feeding America (2016). Food Insecurity in the United States. map.feedingamerica.org (4) (5) Arizona Department of Health Services (2017). (6) (7) Arizona Department of Health Services (2017). (8) (9) See Methodology. (10) Arizona Department of Education. (11) U.S. Census Bureau (2016).
Yuma Fact Sheet :: Sept 2017
Stores per 100,000 people (8)
A WIC Retailer
A Farmers Market
A Farmers Market that accepts food assistance benefits
A SNAP Grocery Store
A SNAP Convenience Store
Any SNAP Retailer
A Fast Food Restaurant
% of population living within walking (half-mile)
vs driving (ten-miles) distance of
76% 1%
21% 0% 95% 11% 94% 10% 98% 22% 99% 34% 98% 24%
A Public Park
A Walking or Biking Trail
A Recreational Area
47% 94% 34% 97%
2% 71%
(9)
Free or reduced priced lunches served per day
2,691
14,000
Summer School Year
(10)
Households with no available vehicle
7% 6%
Arizona Yuma County
6% Yuma
(11)
1
0
11
11
24
61
67
2
1
10
11
29
63
65
Farmer's Markets
Farmer's Markets thataccept food assistance
WIC Retailers
SNAP Grocery Stores
SNAP Convenience Stores
SNAP Retailers
Fast Food Restaurants
Yuma Arizona
azhealthzone.org Learn More
This material was funded by USDA’s Supplemental Nutrition Assistance Program - SNAP through the AZ Health Zone. This institution is an equal opportunity provider. FFY2017 SNAP-Ed Annual Report 559 January 2018
METHODOLOGY AZ Health Zone Community Fact Sheets
The aim of this project was to synthesize data from an array of publicly available sources into one, easily accessible and actionable document on access to healthy food and opportunities for physical activity at the community level. Communities were defined using zip codes and census tracts in coordination with SNAP-Ed Contractors. Data for this project were drawn from the sources detailed below.
(1) Community by age
The proportion of the community population falling within certain age groups. Data on community populations by age were drawn from the 2010 U.S. Decennial Census, Summary File 1, Table P14 accessed on American FactFinder (https://factfinder.census.gov/) in June 2017.
(2) Low-income population
The proportion of the total population and child population (0-17) living in households with incomes at or below 185 percent of the federal poverty level. Data on low-income populations were drawn from the 2011-2015 American Community Survey 5-Year Estimates, Table B17024, accessed on American FactFinder in June 2017. Data were normalized to community geographies using population-based apportioning when necessary, such as when a community contained part, but not all of a zip code or census tract.
(3) Hunger & food insecurity
The proportion of the total population and child population (0-17) who are food insecure. Food insecurity refers to a measurement by the United States Department of Agriculture (USDA) of access to food; food insecure populations have limited or uncertain access to sufficient food for all members of their household. Food insecurity estimates were drawn from the 2015 Map the Meal Gap project by Feeding America, accessed at http://map.feedingamerica.org/ in June 2017.
(4) Early childhood weight
The weight status of children ages 2 to 4 who were enrolled in the Special Supplemental Nutrition Program for Women, Infants, and Children (WIC) in calendar year 2016. WIC Early Childhood Weight data was provided by community and county by the Arizona Department of Health Services WIC Program. In communities where there were too few children enrolled in WIC to provide a reliable estimate of weight status, weight status at the county level is provided instead.
FFY2017 SNAP-Ed Annual Report 560 January 2018
(5) Adult weight
The weight status of adults by county in Arizona. Data on adult weight status were obtained from a combined weighted sample of 2013-2015 Arizona Behavioral Risk Factor Surveillance System (BRFSS) data. Three years of survey data were combined to provide more reliable estimates for all counties in Arizona. Data were provided by the Arizona Department of Health Services.
(6) Fruit and vegetable consumption
The proportion of adults by county who are meeting the dietary recommendation of two servings of fruit and three servings of vegetables per day in Arizona. Data on adult fruit and vegetable consumption were obtained from a combined weighted sample of 2013 and 2015 Arizona Behavioral Risk Factor Surveillance System (BRFSS) data. Two years of survey data were combined to provide more reliable estimates for all counties in Arizona. Data were provided by the Arizona Department of Health Services.
(7) Physical activity
The share of adults by county who are meeting the aerobic and strengthening physical activity guidelines in Arizona. Data on physical activity were obtained from a combined weighted sample of 2013 and 2015 Arizona Behavioral Risk Factor Surveillance System (BRFSS) data. Two years of survey data were combined to provide more reliable estimates for all counties in Arizona. Data were provided by the Arizona Department of Health Services.
(8) Stores per 100,000 people
The number of food retail stores per 100,000 people living in a given community. This metric shows the relative availability of food retail opportunities compared to the population; larger numbers represent higher availability relative to the population. The per capita measure was calculated by dividing the count of retailers of a certain type located within a community’s boundaries by the total population of the community and multiplying the result by 100,000.
The locations of SNAP retailers were obtained from the USDA SNAP Retailer Locator, accessed at https://www.fns.usda.gov/snap/retailerlocator in May 2017. These retailers were coded as convenience stores, grocery stores, or other retailers by matching the USDA retailer dataset with data drawn from ReferenceUSA that includes information on North American Industry Classification System (NAICS) codes and location sales volumes. Following definitions used in the USDA Food Environment Atlas (https://www.ers.usda.gov/data-products/food-environment-atlas), convenience stores were defined as those with NAICS codes 44520 and 447110. Grocery stores were defined as large supermarkets with NAICS code 445110 or superstores with NAICS code 452910 with annual sales volume of two million dollars or more. Stores for whom NAICS codes or sales volume could not be found were coded based on store name and data available online and cross-validated by a second coder to identify full-service grocery stores.
The locations of WIC retailers were obtained from the ADHS WIC Vendor List, accessed at http://azdhs.gov/prevention/azwic/families/index.php#vendors in July 2017, as well as the Inter Tribal Council of Arizona WIC Program Find a Store tool, accessed at http://itcaonline.com/?page_id=1064 in July 2017.
FFY2017 SNAP-Ed Annual Report 561 January 2018
The locations of fast food restaurants were obtained from ReferenceUSA by querying all businesses with the NAICS code 722211.
The location of Farmer’s Markets were compiled from multiple sources, including the USDA National Farmers Market Directory (https://www.ams.usda.gov/local-food-directories/farmersmarkets); the Local First Arizona Good Food Finder Tool (http://goodfoodfinderaz.com/); Farmers Markets listed as SNAP Retailers in the SNAP Retailer dataset; and the Arizona Department of Agriculture’s list of Farmers Markets by County. These datasets were accessed in June 2017 and cross-referenced to obtain a list of unduplicated farmers markets and farm stands. Farmers Markets were counted as accepting food assistance benefits if they accepted one of the following: WIC; WICcash; Senior’s Farmers Market Nutrition Program; Farmers Market Nutrition Program (FMNP); Double-up Bucks; or SNAP. Information on what kind of benefits were accepted by each market were obtained from the USDA National Farmers Market Directory, the Local First Arizona Good Food Finder, and market websites and Facebook pages.
Given the unreliable nature of certain retailer datasets, particularly in rural areas, all locations were mapped and checked for accuracy against satellite imagery. Locations were corrected where needed.
(9) Percent of population living within walking or driving distance of food retail and physical activity opportunities
The proportion of the total population living within walking distance (a half mile) or driving distance (ten miles) of a given kind of retailer or physical activity opportunity. Walking and driving distances follow distance measures used in the USDA Food Access Research Atlas (https://www.ers.usda.gov/data-products/food-access-research-atlas/go-to-the-atlas.aspx). The proportion of the population living within these distance thresholds was calculated by using ESRI Network Analyst to generate service areas and identifying census blocks with mean centers within these service areas.
Food retail locations were identified and mapped using the methods listed above in (8) Stores per 100,000 people.
Locations of public parks were obtained by combining data on local and regional parks from the ESRI USA Parks dataset, accessed at http://www.arcgis.com in June 2017, and the Central Arizona Project parks dataset accessed at https://azgeo.az.gov/ in June 2017. Given the poor coverage by these sources of parks in certain areas of the state, public parks in La Paz County, Greenlee County, and the Navajo Nation were digitized from satellite imagery on Google Maps.
Recreation areas were defined as National Park and National Monument lands, U.S. Forest Service Land, and public recreation sites such as picnic areas and campgrounds. These locations were obtained from the ESRI USA Parks dataset and the U.S. Forest Service Recreation Facility dataset, accessed at https://data.fs.usda.gov/geodata/ in June 2017.
Trails were obtained from the Arizona Trail shapefile and BLM Routes datastets, accessed at https://azgeo.az.gov/ in June 2017; the National Forest Service Trails, Transport, and Motor Vehicle Use shapefiles, accessed at https://data.fs.usda.gov/geodata/; and trails in the National Parks identified in the National Park Service Data Store https://irma.nps.gov/DataStore/. Trailheads from the US
FFY2017 SNAP-Ed Annual Report 562 January 2018
Forest Service Recreation Facility data set were also integrated into the trail dataset used in this project.
All polygon features, such as parks and recreation areas, and line features, such as trails, were converted to points for the creation of service areas. Points were set along boundaries in order to most accurately represent accessibility.
(10) Free or reduced price lunches served
The average number of free and reduced price lunches served on a given day during the school year compared to in the summer. Data on meals served through the Free and Reduced Price Lunch (FRPL) program in the 2015-2016 School Year and the Summer Food Service Program (SFSP) in the summer of 2015 were obtained from the Arizona Department of Education. To obtain community level estimates, all FRPL and SFSP sites were mapped and assigned to the community in which they were located. The total number of sites, meals served, and days of meal service were then summarized by community. The average number of meals served in a day were determined by dividing the total number of meals served in the community by the average days of meal service in that same community.
(11) Households with no available vehicle
The proportion of households that have no available vehicles. Data vehicle availability were drawn from the 2011-2015 American Community Survey 5-Year Estimates, Table B25044, accessed on American FactFinder in June 2017. Data were normalized to community geographies using population-based apportioning when necessary such as when a community contained part, but not all of a zip code or census tract.
FFY2017 SNAP-Ed Annual Report 563 January 2018

PPAGE INTENTIONALLY BLANK
FFY2017 SNAP-Ed Annual Report 564 January 2018
Appendix O
Rebranding Research
FFY2017 SNAP-Ed Annual Report 565 January 2018
3033 North 44th Street, Ste. 150 Phoenix, AZ 85018
Owens Harkey / AzNN State & Local Messaging
Date: May 9, 2017
FFY2017 SNAP-Ed Annual Report 566 January 2018
Table of Contents
Research Goal & Methodology 3 Executive Summary 4 AzNN Headlines 6 AzNN Identity Elements 12 Aspirational AzNN 26 Key Messages 37 Key Findings & Recommendations 40
FFY2017 SNAP-Ed Annual Report 567 January 2018
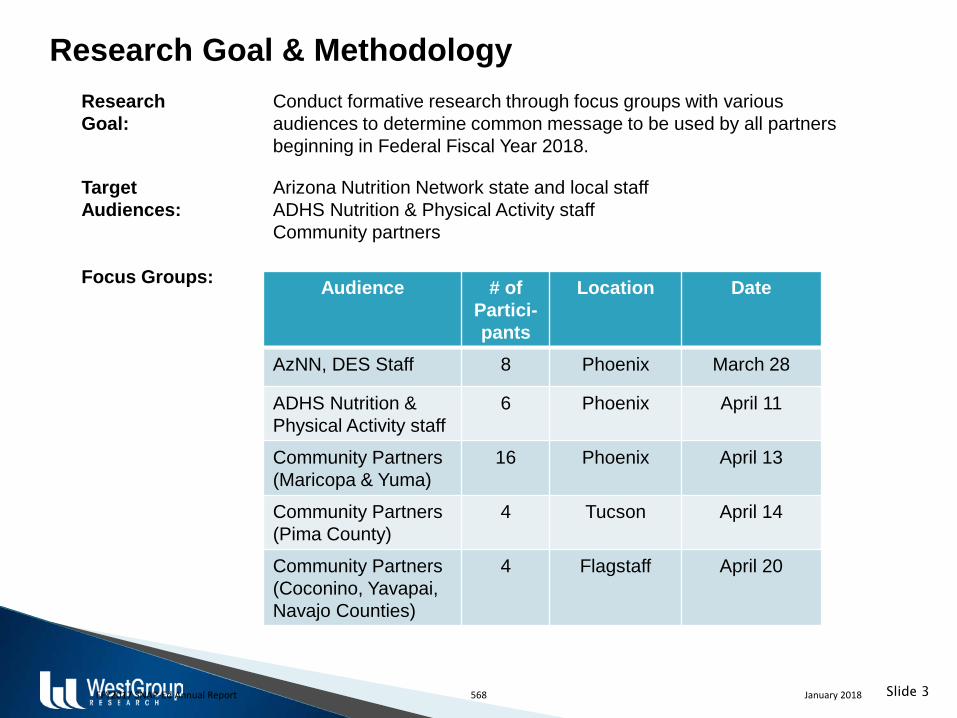
Research Goal & Methodology Research Conduct formative research through focus groups with various Goal: audiences to determine common message to be used by all partners beginning in Federal Fiscal Year 2018. Target Arizona Nutrition Network state and local staff Audiences: ADHS Nutrition & Physical Activity staff Community partners Focus Groups:
Slide 3
Audience # of Partici-pants
Location Date
AzNN, DES Staff 8 Phoenix March 28
ADHS Nutrition & Physical Activity staff
6 Phoenix April 11
Community Partners (Maricopa & Yuma)
16 Phoenix April 13
Community Partners (Pima County)
4 Tucson April 14
Community Partners (Coconino, Yavapai, Navajo Counties)
4 Flagstaff April 20
FFY2017 SNAP-Ed Annual Report 568 January 2018
Executive Summary • The lack of consistency among AZNN identity elements is confusing to everyone. The
biggest complaint about the program name, logo, theme, and website address (collectively) is that there are multiple monikers for the same program. This confusion starts within ADHS and continues through to sister-programs, community partners, service providers, and clients.
• Existing “visual assets” may no longer be appropriate for the AzNN of the future. In general, focus group participants agreed that the current name, logo, and theme (Champions for Change) seem dated and no longer reflective of the program. The addition of physical activity to their message as well as the addition of PSE to their approach, causes a disconnect between what they actually do and the various identity elements.
• The line up of multiple logos on materials is confusing, but many believe, unavoidable. While most agree it would be nice to have a single identity among all Network participants, many argue it’s not possible. A few explained that several of the logos (e.g., USDA, ADHS, DES) have to be there, with others arguing that “their” logo means the most to their clients.
• Those from the University of Arizona Extension Program maintain the “A” trumps all
other logos, insisting it is what gives them credibility among their various clients and partners. Several from county health departments agree, claiming their logo is what their clients relate to.
• The Maricopa County Department of Public Health logo – “Maricopa Healthy” –
effectively combines a nutrition and physical activity message. Several group participants suggested “Arizona Healthy” as a possible common message for AzNN.
Slide 4 FFY2017 SNAP-Ed Annual Report 569 January 2018
Executive Summary • While www.eatwellbewell.org doesn’t completely encompass all that AzNN does
(missing the physical activity component), focus group participants agree it’s catchy, easy to remember, and relevant. One group suggested that adding “play well” to the URL would make it work for AzNN.
• The Arizona Nutrition Network (AzNN) will continue to evolve. The goal is loftier and the
approach more systemic when comparing the AzNN of the future to the current program. The specific, very targeted goal of decreasing obesity among SNAP-eligible participants is expanding to encompass improving the overall health of all citizens in Arizona, according to many focus group participants. While teaching people about good nutrition and how to make their food dollars stretch further is still important, there has been an increased focus on physical activity. And to do this. . . “policy change” is replacing “classes” and “programming.” The future AzNN will continue to focus on collaborating with others to accomplish this goal, however, the partnerships will become stronger and more cohesive, and the efforts more “environmental.”
• The aspirational AzNN is THE go-to source for growing and maintaining healthy communities. They do this through strong partnerships with community organizations and through policy, systems and environmental change. They are supportive and encouraging and equip families and communities with the tools, knowledge, and skills for living a healthy life. Through their efforts, all members of the community have equal access to healthy food & safe places to be active.
Slide 5 FFY2017 SNAP-Ed Annual Report 570 January 2018
AzNN Headlines
FFY2017 SNAP-Ed Annual Report 571 January 2018
AzNN Headlines: Current Prior to the discussion, participants were given this assignment: If an article were written about the Arizona Nutrition Network in the New York Times today, what would the headline be, and what would the highlights of the story be about? Headlines focused on an overall goal of decreasing obesity among SNAP or SNAP-eligible families, through education centered on nutrition and physical activity. Many highlights identified the way in which the Arizona Nutrition Network does this, i.e., through state and local partners, such as schools, grocery stores, county health departments, and others. In addition, phrases such as “evidenced-based,” “emphasis on evaluation,” “healthy lifestyles,” and “healthy communities,” surfaced, with several participants mentioning an increased focus on PSE (Policy, Systems, and Environment).
Slide 7 FFY2017 SNAP-Ed Annual Report 572 January 2018
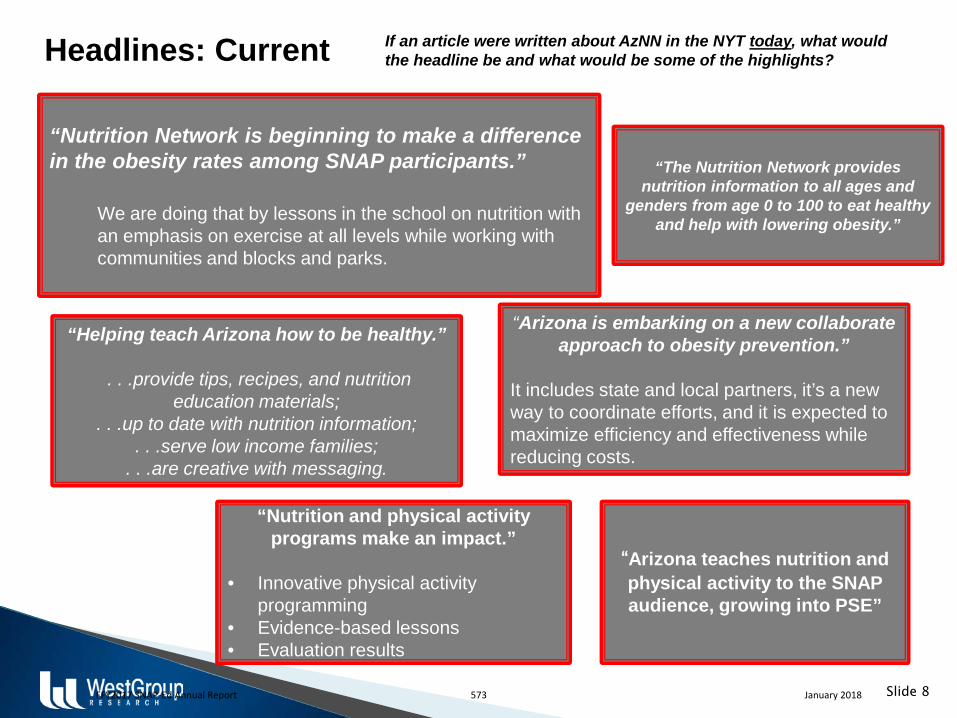
Headlines: Current
Slide 8
“Nutrition Network is beginning to make a difference in the obesity rates among SNAP participants.”
We are doing that by lessons in the school on nutrition with an emphasis on exercise at all levels while working with communities and blocks and parks.
“Arizona is embarking on a new collaborate approach to obesity prevention.”
It includes state and local partners, it’s a new way to coordinate efforts, and it is expected to maximize efficiency and effectiveness while reducing costs.
“The Nutrition Network provides nutrition information to all ages and
genders from age 0 to 100 to eat healthy and help with lowering obesity.”
“Helping teach Arizona how to be healthy.”
. . .provide tips, recipes, and nutrition education materials;
. . .up to date with nutrition information; . . .serve low income families;
. . .are creative with messaging.
“Nutrition and physical activity programs make an impact.”
• Innovative physical activity
programming • Evidence-based lessons • Evaluation results
“Arizona teaches nutrition and physical activity to the SNAP audience, growing into PSE”
If an article were written about AzNN in the NYT today, what would the headline be and what would be some of the highlights?
FFY2017 SNAP-Ed Annual Report 573 January 2018
AzNN Headlines: Future When asked to look ahead 5 to 10 years from now and do the same assignment, the picture looked different for many. The specific, very targeted goal of decreasing obesity among SNAP-eligible participants had broadened to encompass improving the overall health of all citizens in Arizona. And, while there was still a focus on collaborating with others to accomplish this goal, the partnerships appeared stronger and more coordinated, and the efforts more “environmental.” Several participants agreed that the current headlines focused more on goals while the future headlines were much more outcome-focused. “Policy change” began to replace “nutrition classes.” Community gardens, access to walking paths and other physical activity opportunities, and “multi-level interventions to improve the health of all Arizonans,” surfaced to a much greater extent than “nutrition classes,” “online recipes,” and “eat more fruits and veggies.” In addition, several participants included statements about Arizona leading the nation in reducing obesity and overall health.
Slide 9 FFY2017 SNAP-Ed Annual Report 574 January 2018
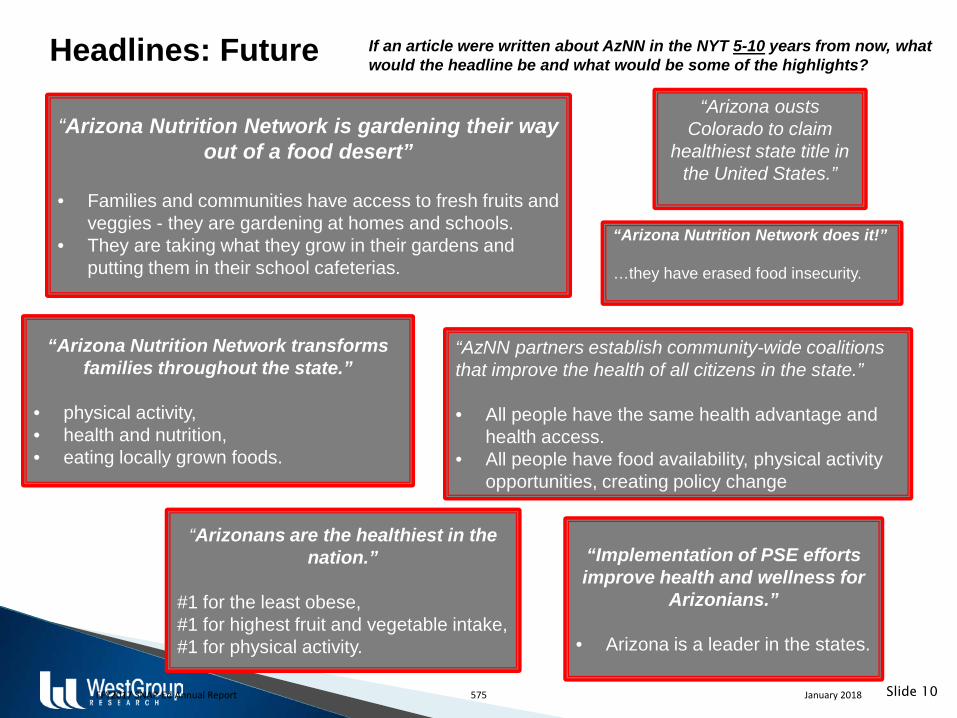
Headlines: Future
Slide 10
“Arizona Nutrition Network is gardening their way out of a food desert”
• Families and communities have access to fresh fruits and
veggies - they are gardening at homes and schools. • They are taking what they grow in their gardens and
putting them in their school cafeterias.
“AzNN partners establish community-wide coalitions that improve the health of all citizens in the state.” • All people have the same health advantage and
health access. • All people have food availability, physical activity
opportunities, creating policy change
“Arizona ousts Colorado to claim
healthiest state title in the United States.”
“Arizona Nutrition Network transforms families throughout the state.”
• physical activity, • health and nutrition, • eating locally grown foods.
“Arizonans are the healthiest in the nation.”
#1 for the least obese, #1 for highest fruit and vegetable intake, #1 for physical activity.
“Implementation of PSE efforts improve health and wellness for
Arizonians.” • Arizona is a leader in the states.
If an article were written about AzNN in the NYT 5-10 years from now, what would the headline be and what would be some of the highlights?
“Arizona Nutrition Network does it!” …they have erased food insecurity.
FFY2017 SNAP-Ed Annual Report 575 January 2018
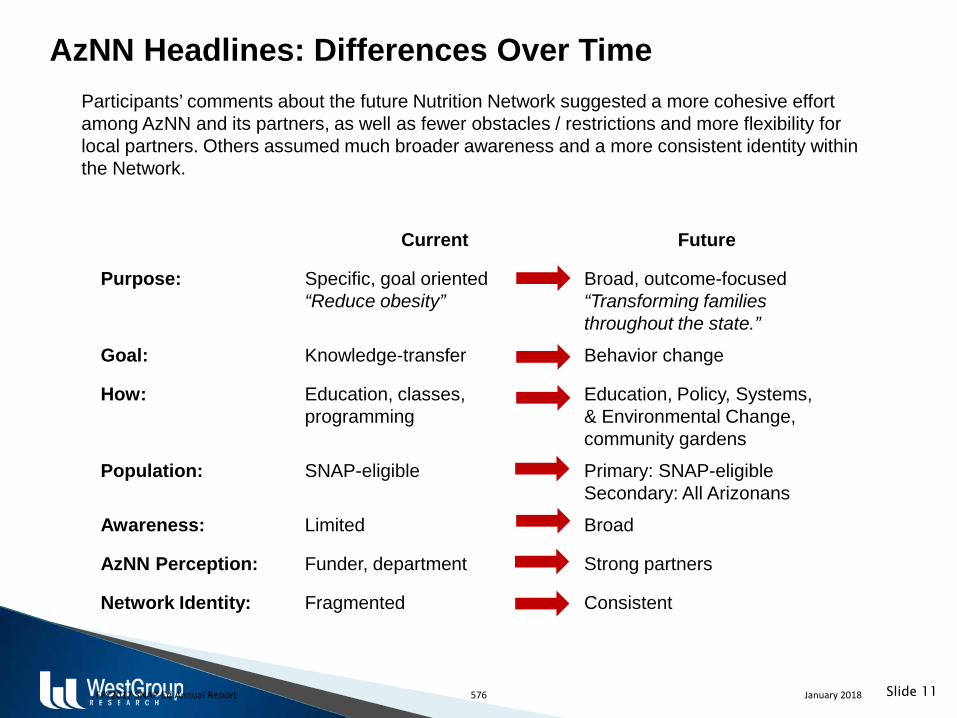
AzNN Headlines: Differences Over Time
Slide 11
Current Future
Purpose: Specific, goal oriented “Reduce obesity”
Broad, outcome-focused “Transforming families throughout the state.”
Goal: Knowledge-transfer Behavior change
How: Education, classes, programming
Education, Policy, Systems, & Environmental Change, community gardens
Population: SNAP-eligible Primary: SNAP-eligible Secondary: All Arizonans
Awareness: Limited Broad
AzNN Perception: Funder, department Strong partners
Network Identity: Fragmented Consistent
Participants’ comments about the future Nutrition Network suggested a more cohesive effort among AzNN and its partners, as well as fewer obstacles / restrictions and more flexibility for local partners. Others assumed much broader awareness and a more consistent identity within the Network.
FFY2017 SNAP-Ed Annual Report 576 January 2018
AzNN Identity Elements
FFY2017 SNAP-Ed Annual Report 577 January 2018
“Logo Lineup” – Vast Array Used on Materials Overwhelmingly, participants in all groups agree the line up of logos that is often present on their materials is confusing to everyone. . . that is, if they even SEE the logos. Several explained that many of the logos (e.g., USDA, ADHS, DES) have to be there, with others arguing that “their” logo means the most to their clients. For example, Tucson participants (all of who were from the “University of Arizona Nutrition Network”) maintain the “A” trumps all other logos, insisting it is what gives them credibility among their various clients and partners. Several from county health departments agree, claiming their logo is what their clients relate to. • There are some things that are required, like the USDA likes to see the DES logo and the
DHS logo on the written material, but I know the USDA requires certain things like sponsored by or whatever, certain things that are mandatory and others that are not.
• All these logos from a public health standpoint, this is why public health to me is always confusing the people. The message here is what? And what is the change that we are wanting? None of these logos mean anything.
• The A takes precedence over anything, it doesn’t matter where you are from. If you see the A, that is a university project, it doesn’t matter what department you are in.
• We use the Champions for Change logo on things that we print out or things that we create, but otherwise the nutrition curriculum has the discrimination information, and then we use the Arizona Nutrition Network with Yuma County, and when people see the Yuma County they relate to that.
Slide 13 FFY2017 SNAP-Ed Annual Report 578 January 2018
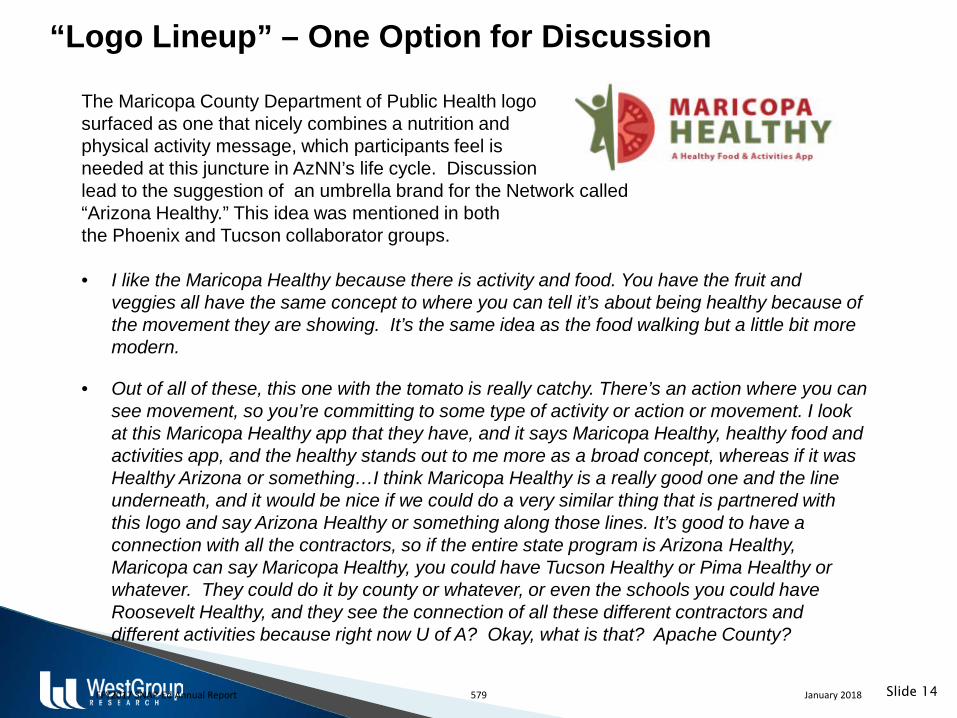
“Logo Lineup” – One Option for Discussion
The Maricopa County Department of Public Health logo surfaced as one that nicely combines a nutrition and physical activity message, which participants feel is needed at this juncture in AzNN’s life cycle. Discussion lead to the suggestion of an umbrella brand for the Network called “Arizona Healthy.” This idea was mentioned in both the Phoenix and Tucson collaborator groups. • I like the Maricopa Healthy because there is activity and food. You have the fruit and
veggies all have the same concept to where you can tell it’s about being healthy because of the movement they are showing. It’s the same idea as the food walking but a little bit more modern.
• Out of all of these, this one with the tomato is really catchy. There’s an action where you can see movement, so you’re committing to some type of activity or action or movement. I look at this Maricopa Healthy app that they have, and it says Maricopa Healthy, healthy food and activities app, and the healthy stands out to me more as a broad concept, whereas if it was Healthy Arizona or something…I think Maricopa Healthy is a really good one and the line underneath, and it would be nice if we could do a very similar thing that is partnered with this logo and say Arizona Healthy or something along those lines. It’s good to have a connection with all the contractors, so if the entire state program is Arizona Healthy, Maricopa can say Maricopa Healthy, you could have Tucson Healthy or Pima Healthy or whatever. They could do it by county or whatever, or even the schools you could have Roosevelt Healthy, and they see the connection of all these different contractors and different activities because right now U of A? Okay, what is that? Apache County?
Slide 14 FFY2017 SNAP-Ed Annual Report 579 January 2018
AzNN / Champions for Change Logo: Overall Reactions In general, participants agreed the current Arizona Nutrition Network logo looks dated, with one participant stating, “It looks like it was made for an old person. The colors just seem like the 1970s and older.” Many others suggested that it’s not very descriptive saying it doesn’t tell people all that AzNN does. Still others argue the logo no longer represents the mission of AzNN as it doesn’t illustrate the physical activity component of the program’s message. A few noted it was “stolen from California.” • The messaging is nondescript, so it’s not giving you that exact focus and maybe it’s not very
descriptive of what we do and not very encompassing in that way, but the message itself is very positive. If they just made one change in their life in a positive matter, it would be great.
• The colors are terrible. Not that this is necessarily a bad thing, but we had taken it from California, so it was like copying another one, it doesn’t say our own.
• I agree that the whole thing looks old. The graphic really doesn’t signify anything to me.
• It doesn’t really encompass our program anymore with our change to physical activity as well
as nutrition and obesity prevention that we’ve gone to on a bigger scale.
Slide 15 FFY2017 SNAP-Ed Annual Report 580 January 2018
AzNN / Champions for Change Logo: Overall Reactions On a positive note, a few commented that the colors are bright and that the sun and the apple suggest a health-related message. Several others said the logo is widely recognized among service providers and clients. • This logo is bright, but it’s also a soft color palette at the same time, so it helps to build trust
and things, but I think where I’m at right now with this in particular, all I see is lost potential because we don’t use it as much as we can because our local agencies don’t relate to it, so that’s what I see are opportunities that have been missed.
• I think the one value that I see having multiple agencies across the state, this is the only
thing that is consistent because we all have our own logos and branding that we already do, and this is one thing regardless if it is good or bad is that it’s consistent.
• I think everyone recognizes it, but I’m not sure they identify with it.
Slide 16 FFY2017 SNAP-Ed Annual Report 581 January 2018
AzNN / Champions for Change Logo - Who is it for? In addition to these overall reactions to the logo, participants discussed both the purpose of and the audience for, the logo. Most presumed the primary audience for the logo is the moms; however, those who don’t provide direct service (to moms) also rely on it for awareness and credibility among their respective clients and partners, so it has to have meaning to them as well. • If Arizona Nutrition Network is trying to create a new website or revamp or whatever, I think
going in a direction that is just…who is the website for? The website currently is for collaborators where we go and there are administrative forms, there’s a special login and stuff, and we use that. I don’t care what the website looks like as long as I can get to that collaborators page, and then the target population however they want to engage with that website.
• I think it needs to resonate most with the moms because that is our true audience we’re
trying to influence, but it has to be something that our partners, our local agencies are willing to get behind and use and that they will identify with as well.
• So champion is that person who is going to go that extra mile, start the garden, but that’s not our target population either, so again the question is drawn back to who is this logo for because the teacher, while very underpaid, is not technically a SNAP recipient.
• What does “Champions for Change” mean if they don’t even know that I’m there offering SNAP Education? I think it’s important for them to understand what that logo means for one and that I might be in different places, like I might be at a fun walk in the community and I have on that logo and they understand that also means (SNAP-Ed).
Slide 17 FFY2017 SNAP-Ed Annual Report 582 January 2018
“Champions for Change” – Reactions to Line / Name Aside from the logo itself, there was considerable discussion about “Champions for Change.” Many participants (both internal and external) do not know the genesis of the line and find it confusing and vague. Who’s the “champion,” and what “change” is it referring to? While a few long-time staff members know the origin, those who don’t assumed AzNN and / or the partners are the champions. Others maintain “champion” suggests some kind of competition or has a sports connotation. Similar to the logo, there were a few participants who have a favorable opinion of “Champions for Change,” saying they are indeed “agents” for change and that they do want people to change their eating habits. Others suggested that “champion” can apply to everyone who is advocating the AzNN message. • I might think that the Arizona Nutrition Network were Champions for Change as opposed to
me as a mom being a Champion for Change if I wasn’t familiar with the brand and didn’t know anything about it.
• Champions feels vague to me, like I don’t really know who the champions are if I was just looking at this.
• Champions has a sports connotation, so it sounds competitive like you won something.
• It says we want to change eating habits with nutrition and change. That stands out to me; that there’s a group of people involved in doing that, like multiple champions in a network.
• I still like the champions for change tagline. I feel like that translates to all the work that we do, but I wonder if that is still fresh enough.
Slide 18 FFY2017 SNAP-Ed Annual Report 583 January 2018
“Champions for Change” – Reactions to Line / Name Interestingly, although “Champions for Change” is considered somewhat vague, many partners maintain they are known by this moniker rather than the Arizona Nutrition Network. Some even refer to themselves as representing “Champions for Change.” This is true among those who provide direct services as well as those who work with retailers, farmers’ markets, and other service providers. As one participant stated, “The funny thing is that all the partners recognize and call us Champions for Change. They don’t know we are Arizona Nutrition Network, they don’t know we’re U of A or SNAP-Ed. They say, oh you’re the Champions for Change.” • I think people definitely recognize the logo. We do a lot of work with messaging materials to
come from a place of empowering moms to make changes in their families, so I feel like I think everyone recognizes it, but I’m not sure they identify with it. . .
Also of interest, several group members pointed out that because the logo has been around for quite a while, it provides some consistency to an otherwise ever-changing department and initiative. • I would say the longevity of this (is valuable). This hasn’t changed in quite a while. A lot of
things under this umbrella have changed, but that has not. • . . .everybody says Champions for Change, yes we are because we change every year. It’s
an inside joke. I’ve been here for 7 years and it has changed every year. Policy implementation, what you’re allowed to do, and they are following USDA guidelines and we understand that they’re not the drivers of the change, but it has changed every single year.
Slide 19 FFY2017 SNAP-Ed Annual Report 584 January 2018

“Arizona Nutrition Network” – Reactions to Name Focus group participants were also asked to react to the name “Arizona Nutrition Network.” The most frequently mentioned criticism of the name is that it no longer accurately reflects the program’s mission as it doesn’t say anything about physical activity. “It doesn’t encompass everything. That’s the most narrow thing is our program title,” commented one staff member. Reactions by individuals in sister programs and community partners were similar. • I feel like with you talking about the physical activity component being left to the wayside,
maybe it should be incorporated somewhere along with the title. It’s a network, but maybe Arizona Nutrition is not the most precise way of saying it.
• It’s very nutrition driven, so we do a lot more than nutrition now. If I saw this, I would think
it’s a nutrition program with straight nutrition and that’s all, no physical activity or anything else.
• I think it limits what we’re doing now, especially going into policy systems, environment
change, and so forth. We do way more than nutrition. Before, no matter what we were doing there had to be a nutrition message, so if we were focusing on physical activity you had to have some nutrition in there which was easy to do, but now that we’re doing policy stuff, I think it’s too narrow.
A few others contend it sounds too much like a government program and may turn people off, as suggested by this participant – “I feel like Arizona Nutrition Network seems very formal, and it’s kind of affiliated with government, so I think looking for a different name might help.”
Slide 20 FFY2017 SNAP-Ed Annual Report 585 January 2018
“Arizona Nutrition Network” – Reactions to Name Though many agreed the name is limiting, there was a fairly large contingent that are of the opinion that the name doesn’t matter all that much due to reasons identified earlier. That is, many identify more with “Champions for Change” than “Arizona Nutrition Network,” and their clients relate more to their respective county or agency logos than the AzNN logo. • I think partners don’t even care if we get a new name because they already have their own
name.
• I think they think of it as their own program and it’s just funded by the Department of Health Services. There doesn’t seem to be a real tie there with the name.
• I say that it’s the educational component of SNAP. And then people ask what SNAP is, so you have to say the food stamp thing.
• But to the target population, what does that matter, who cares? They don’t care.
• AzNN is just a department within the bureau of nutrition and physical activity in ADHS, so
it’s just a name they came up with to differentiate themselves that basically says, okay, this is who administers the SNAP-Ed funding, this little department does SNAP-Ed.
• I also think that’s the thing you can toss out the quickest because our moms, I don’t think
they relate to that name at all. Even when you go to our website, I don’t even know if “Arizona Nutrition Network “appears anywhere.
Slide 21 FFY2017 SNAP-Ed Annual Report 586 January 2018
www.eatwellbewell.org – Reactions to Website Name Participants are generally positive with regard to the www.eatwellbewell.org web address, maintaining it’s easy to remember and is a good descriptor. However, as was true with the logo and the program name, several found the URL limiting since it doesn’t include a reference to physical activity. A couple of others thought it sounded somewhat generic. • I feel like their website www.eatwellbewell.org is actually really good. I like that. I think it’s
catchy and cute and easy to remember.
• If somebody says check out this website www.eatwellbewell.org without giving me a card, I think the next day they could remember the website, and that’s really what it’s all about it. It’s about driving them to there and they can find whatever they are looking for.
• It’s similar to the logo from my perspective in just kind of having more of a physical activity perspective. I think it really kind of represents a nutrition side where our program was before focusing on nutrition, but now that we’ve kind of evolved and we’re focusing on a lot of other things, I don’t think that is captured or represented by the eat well be well.
• It’s catchy and right to the point, if you eat well then you will feel better, so it’s catchy, but as he said, the network has expanded into so much more now that it isn’t capturing everything that we do.
The idea of “eatwellplaywellbewell.org” also got some traction in the sister organization focus group. • Yeah, eat well, be well was missing that physical activity piece, so that’s good.
• And eat well, play well, be well is easy to remember. I like it.
Slide 22 FFY2017 SNAP-Ed Annual Report 587 January 2018
Visual Assets, Collectively – Overall Reactions Throughout the discussions regarding the logo, “Champions for Change,” the name “Arizona Nutrition Network,” and the www.eatwellbewell.org web address, participants commented about how confusing it is to have several different names for essentially the same program. Many stated they don’t even know how to refer to themselves when they’re out in the community. • My understanding of the gist of why we are here is a branding kind of thing, and I think that
is one of the weaknesses of the program is that we have Champions for Change, we have AzNN, we have eatwellbewell.org and we have all this stuff, but there’s no common theme for the public to understand that we are all one entity trying to work towards the same goals.
• I think it’s kind of confusing to have Champions for Change and eatwellbewell.org. I think you have to choose one, and they have Arizona Nutrition Network, which is also confusing.
• A lot of the stuff we do as far as the collaborators, I’m always thinking AzNN and not eatwellbewell.org, so it’s just a discombobulated way of getting there.
• The redundancy is mind boggling, and it just drives me nuts. Champions for Change, it
never said anything to me. I know they used it a lot in the schools I guess, and I guess the schools know it. And then the Arizona Nutrition Network, that has always been the name, so it has just been the logo that has changed throughout the years.
• It has never made any sense to me as an employee having all these different names and
identities, so I can only imagine how confusing it is for the public. • Yeah, too many different things going on. It all means the same, but it’s not connected.
Slide 23 FFY2017 SNAP-Ed Annual Report 588 January 2018
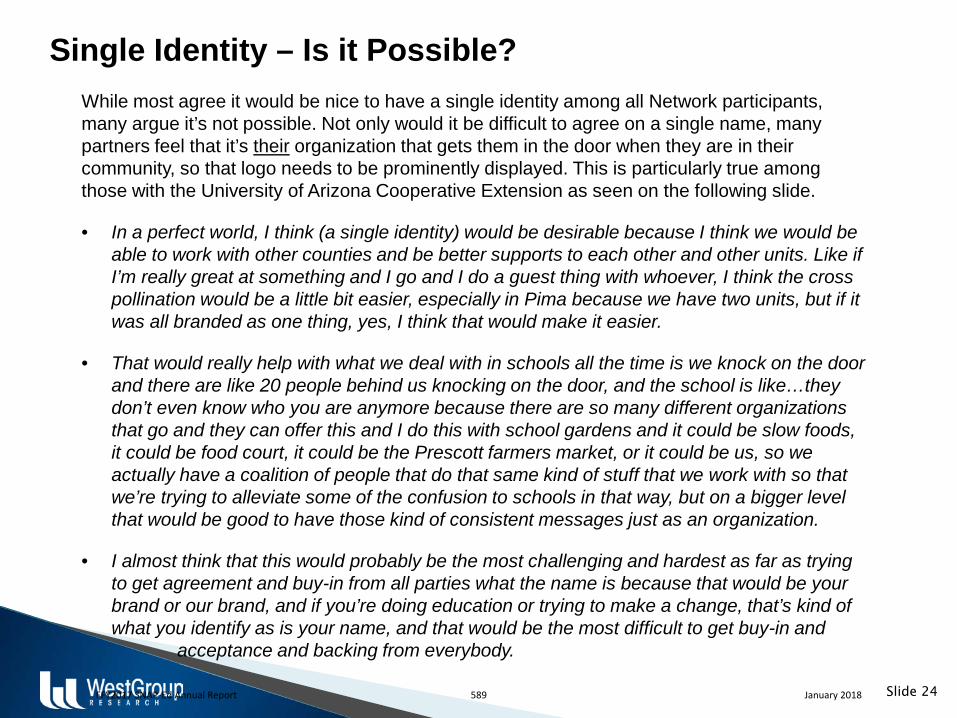
Single Identity – Is it Possible? While most agree it would be nice to have a single identity among all Network participants, many argue it’s not possible. Not only would it be difficult to agree on a single name, many partners feel that it’s their organization that gets them in the door when they are in their community, so that logo needs to be prominently displayed. This is particularly true among those with the University of Arizona Cooperative Extension as seen on the following slide. • In a perfect world, I think (a single identity) would be desirable because I think we would be
able to work with other counties and be better supports to each other and other units. Like if I’m really great at something and I go and I do a guest thing with whoever, I think the cross pollination would be a little bit easier, especially in Pima because we have two units, but if it was all branded as one thing, yes, I think that would make it easier.
• That would really help with what we deal with in schools all the time is we knock on the door and there are like 20 people behind us knocking on the door, and the school is like…they don’t even know who you are anymore because there are so many different organizations that go and they can offer this and I do this with school gardens and it could be slow foods, it could be food court, it could be the Prescott farmers market, or it could be us, so we actually have a coalition of people that do that same kind of stuff that we work with so that we’re trying to alleviate some of the confusion to schools in that way, but on a bigger level that would be good to have those kind of consistent messages just as an organization.
• I almost think that this would probably be the most challenging and hardest as far as trying to get agreement and buy-in from all parties what the name is because that would be your brand or our brand, and if you’re doing education or trying to make a change, that’s kind of what you identify as is your name, and that would be the most difficult to get buy-in and acceptance and backing from everybody.
Slide 24 FFY2017 SNAP-Ed Annual Report 589 January 2018
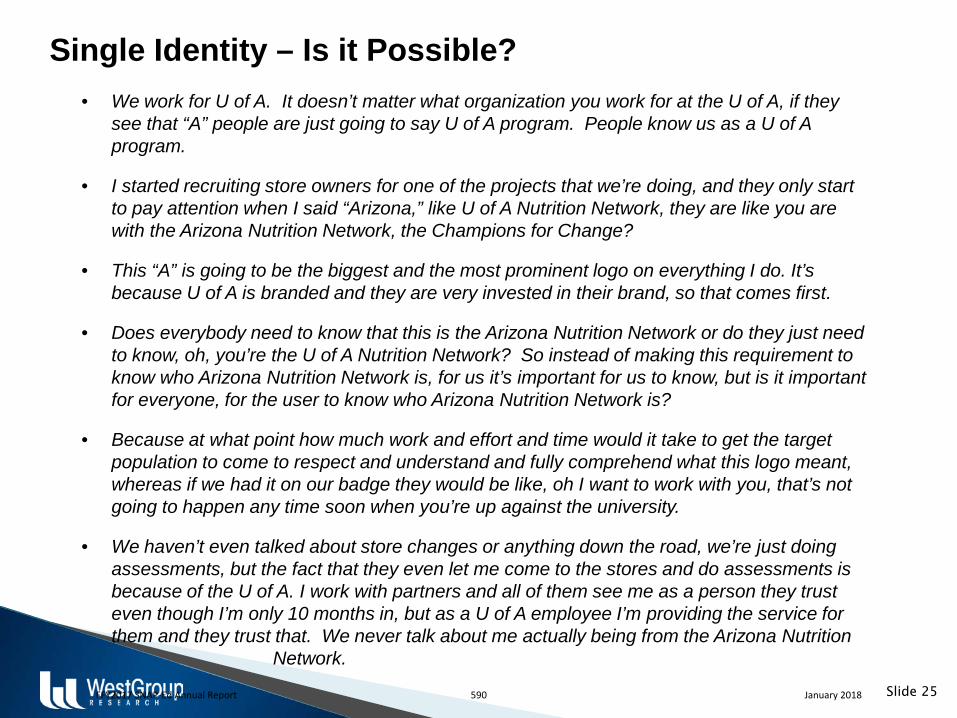
Single Identity – Is it Possible? • We work for U of A. It doesn’t matter what organization you work for at the U of A, if they
see that “A” people are just going to say U of A program. People know us as a U of A program.
• I started recruiting store owners for one of the projects that we’re doing, and they only start to pay attention when I said “Arizona,” like U of A Nutrition Network, they are like you are with the Arizona Nutrition Network, the Champions for Change?
• This “A” is going to be the biggest and the most prominent logo on everything I do. It’s because U of A is branded and they are very invested in their brand, so that comes first.
• Does everybody need to know that this is the Arizona Nutrition Network or do they just need to know, oh, you’re the U of A Nutrition Network? So instead of making this requirement to know who Arizona Nutrition Network is, for us it’s important for us to know, but is it important for everyone, for the user to know who Arizona Nutrition Network is?
• Because at what point how much work and effort and time would it take to get the target population to come to respect and understand and fully comprehend what this logo meant, whereas if we had it on our badge they would be like, oh I want to work with you, that’s not going to happen any time soon when you’re up against the university.
• We haven’t even talked about store changes or anything down the road, we’re just doing assessments, but the fact that they even let me come to the stores and do assessments is because of the U of A. I work with partners and all of them see me as a person they trust even though I’m only 10 months in, but as a U of A employee I’m providing the service for them and they trust that. We never talk about me actually being from the Arizona Nutrition Network.
Slide 25 FFY2017 SNAP-Ed Annual Report 590 January 2018
Aspirational AzNN
FFY2017 SNAP-Ed Annual Report 591 January 2018
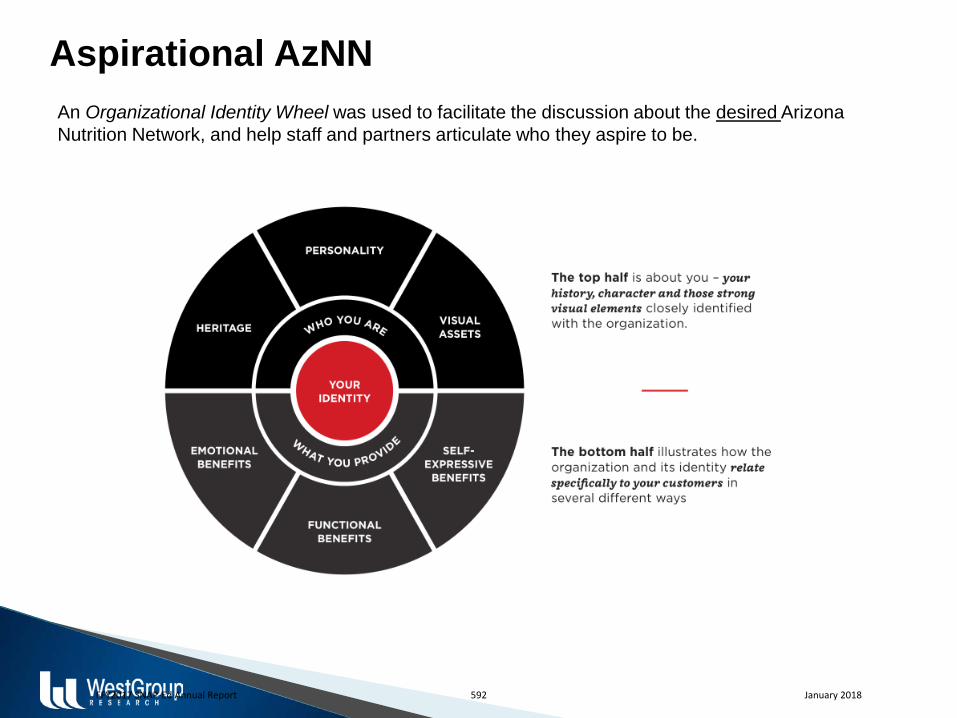
An Organizational Identity Wheel was used to facilitate the discussion about the desired Arizona Nutrition Network, and help staff and partners articulate who they aspire to be.
Aspirational AzNN
FFY2017 SNAP-Ed Annual Report 592 January 2018
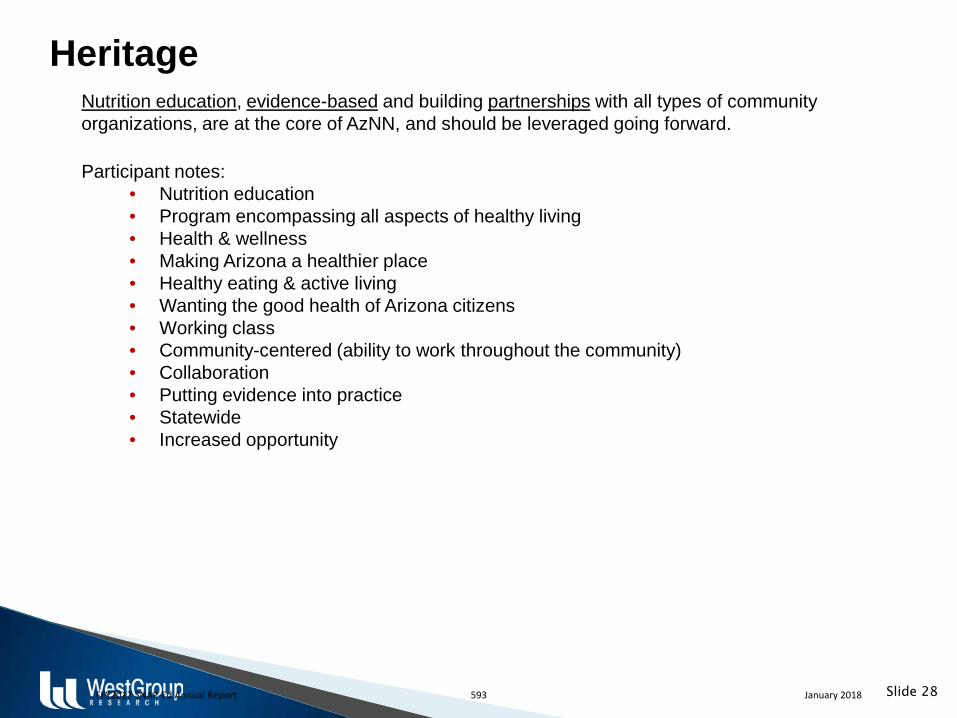
Heritage Nutrition education, evidence-based and building partnerships with all types of community organizations, are at the core of AzNN, and should be leveraged going forward. Participant notes:
• Nutrition education • Program encompassing all aspects of healthy living • Health & wellness • Making Arizona a healthier place • Healthy eating & active living • Wanting the good health of Arizona citizens • Working class • Community-centered (ability to work throughout the community) • Collaboration • Putting evidence into practice • Statewide • Increased opportunity
Slide 28 FFY2017 SNAP-Ed Annual Report 593 January 2018
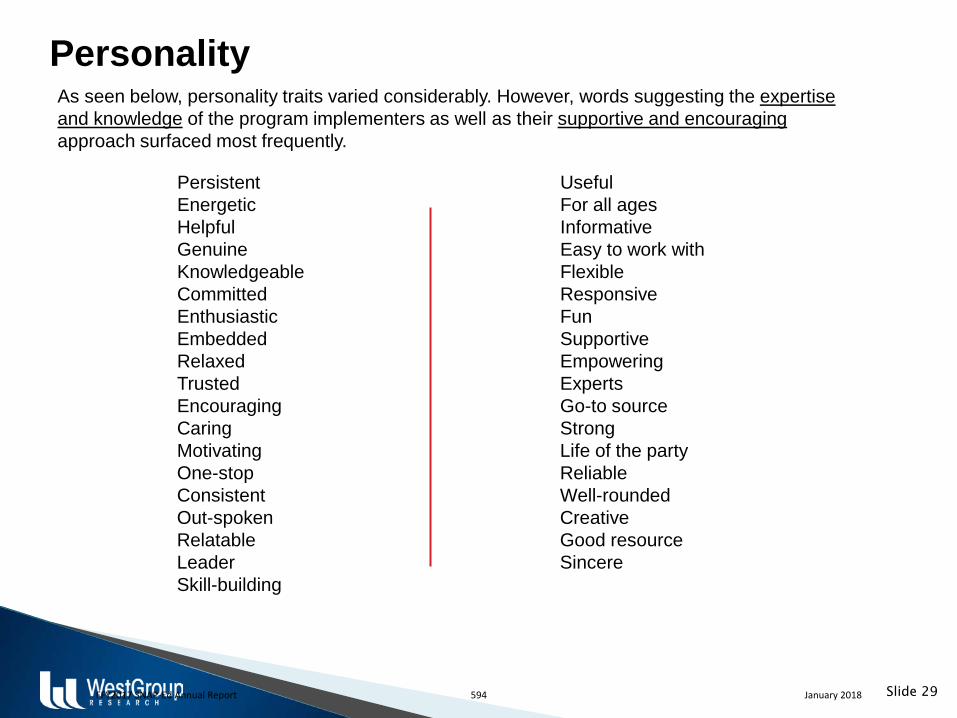
Personality
Persistent Useful Energetic For all ages Helpful Informative Genuine Easy to work with Knowledgeable Flexible Committed Responsive Enthusiastic Fun Embedded Supportive Relaxed Empowering Trusted Experts Encouraging Go-to source Caring Strong Motivating Life of the party One-stop Reliable Consistent Well-rounded Out-spoken Creative Relatable Good resource Leader Sincere Skill-building
Slide 29
As seen below, personality traits varied considerably. However, words suggesting the expertise and knowledge of the program implementers as well as their supportive and encouraging approach surfaced most frequently.
FFY2017 SNAP-Ed Annual Report 594 January 2018
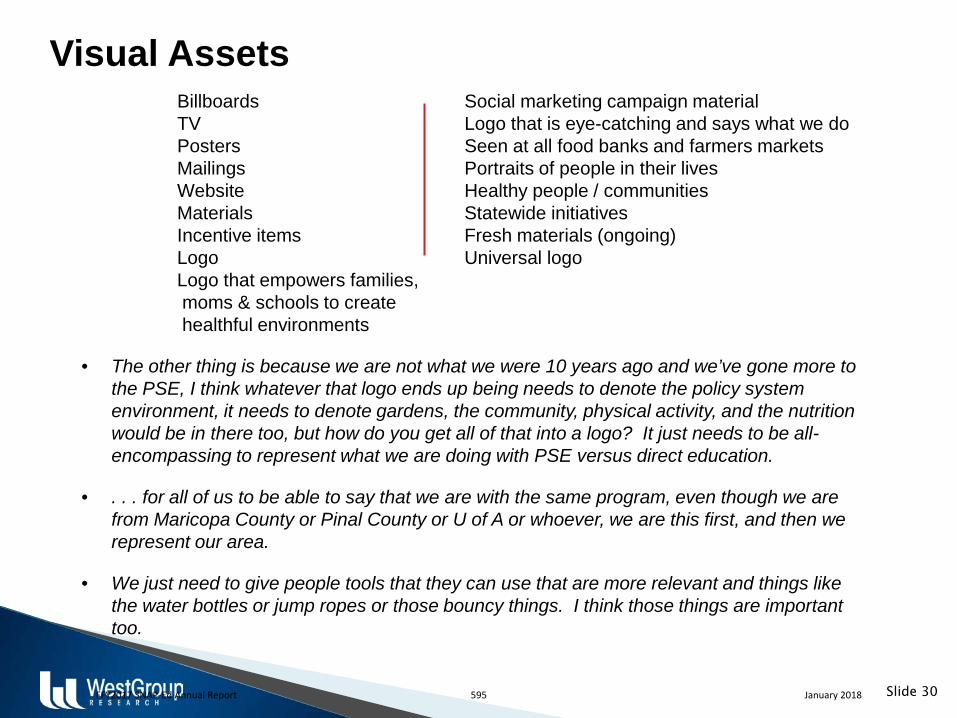
Visual Assets Billboards Social marketing campaign material TV Logo that is eye-catching and says what we do Posters Seen at all food banks and farmers markets Mailings Portraits of people in their lives Website Healthy people / communities Materials Statewide initiatives Incentive items Fresh materials (ongoing) Logo Universal logo Logo that empowers families, moms & schools to create healthful environments • The other thing is because we are not what we were 10 years ago and we’ve gone more to
the PSE, I think whatever that logo ends up being needs to denote the policy system environment, it needs to denote gardens, the community, physical activity, and the nutrition would be in there too, but how do you get all of that into a logo? It just needs to be all-encompassing to represent what we are doing with PSE versus direct education.
• . . . for all of us to be able to say that we are with the same program, even though we are from Maricopa County or Pinal County or U of A or whoever, we are this first, and then we represent our area.
• We just need to give people tools that they can use that are more relevant and things like the water bottles or jump ropes or those bouncy things. I think those things are important too.
Slide 30 FFY2017 SNAP-Ed Annual Report 595 January 2018
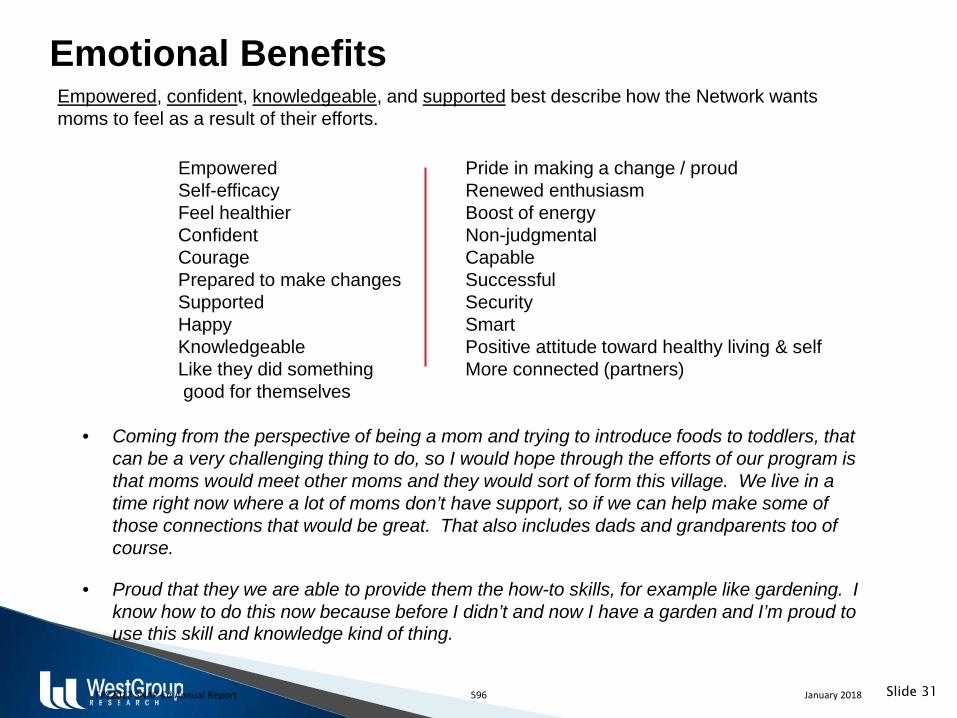
Emotional Benefits
Empowered Pride in making a change / proud Self-efficacy Renewed enthusiasm Feel healthier Boost of energy Confident Non-judgmental Courage Capable Prepared to make changes Successful Supported Security Happy Smart Knowledgeable Positive attitude toward healthy living & self Like they did something More connected (partners) good for themselves • Coming from the perspective of being a mom and trying to introduce foods to toddlers, that
can be a very challenging thing to do, so I would hope through the efforts of our program is that moms would meet other moms and they would sort of form this village. We live in a time right now where a lot of moms don’t have support, so if we can help make some of those connections that would be great. That also includes dads and grandparents too of course.
• Proud that they we are able to provide them the how-to skills, for example like gardening. I know how to do this now because before I didn’t and now I have a garden and I’m proud to use this skill and knowledge kind of thing.
Slide 31
Empowered, confident, knowledgeable, and supported best describe how the Network wants moms to feel as a result of their efforts.
FFY2017 SNAP-Ed Annual Report 596 January 2018
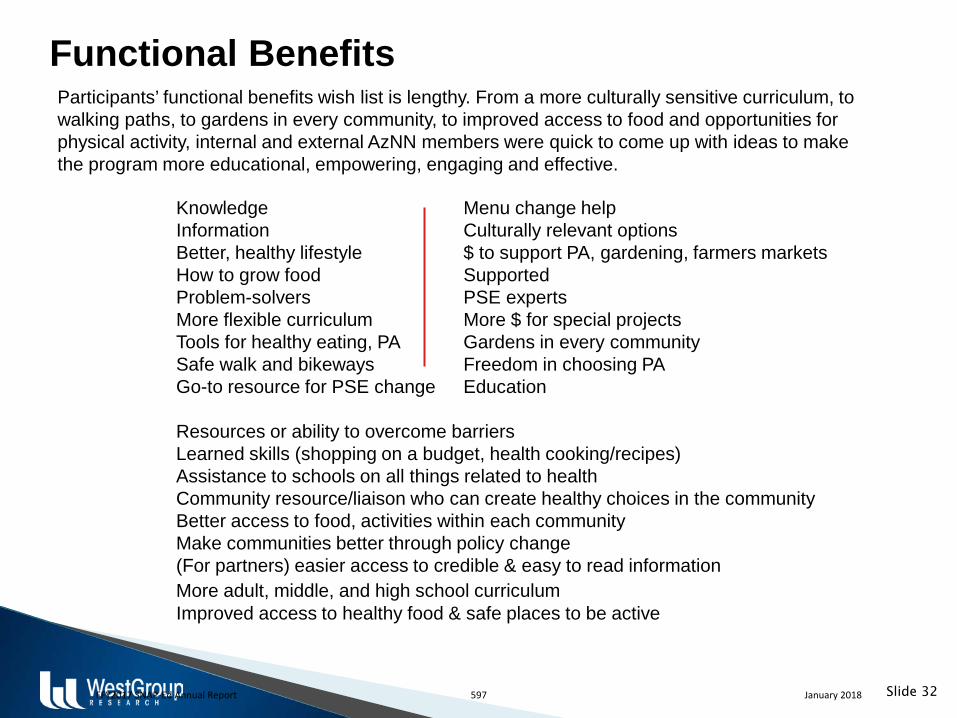
Functional Benefits
Knowledge Menu change help Information Culturally relevant options Better, healthy lifestyle $ to support PA, gardening, farmers markets How to grow food Supported Problem-solvers PSE experts More flexible curriculum More $ for special projects Tools for healthy eating, PA Gardens in every community Safe walk and bikeways Freedom in choosing PA Go-to resource for PSE change Education
Resources or ability to overcome barriers Learned skills (shopping on a budget, health cooking/recipes) Assistance to schools on all things related to health Community resource/liaison who can create healthy choices in the community Better access to food, activities within each community Make communities better through policy change (For partners) easier access to credible & easy to read information More adult, middle, and high school curriculum Improved access to healthy food & safe places to be active
Slide 32
Participants’ functional benefits wish list is lengthy. From a more culturally sensitive curriculum, to walking paths, to gardens in every community, to improved access to food and opportunities for physical activity, internal and external AzNN members were quick to come up with ideas to make the program more educational, empowering, engaging and effective.
FFY2017 SNAP-Ed Annual Report 597 January 2018
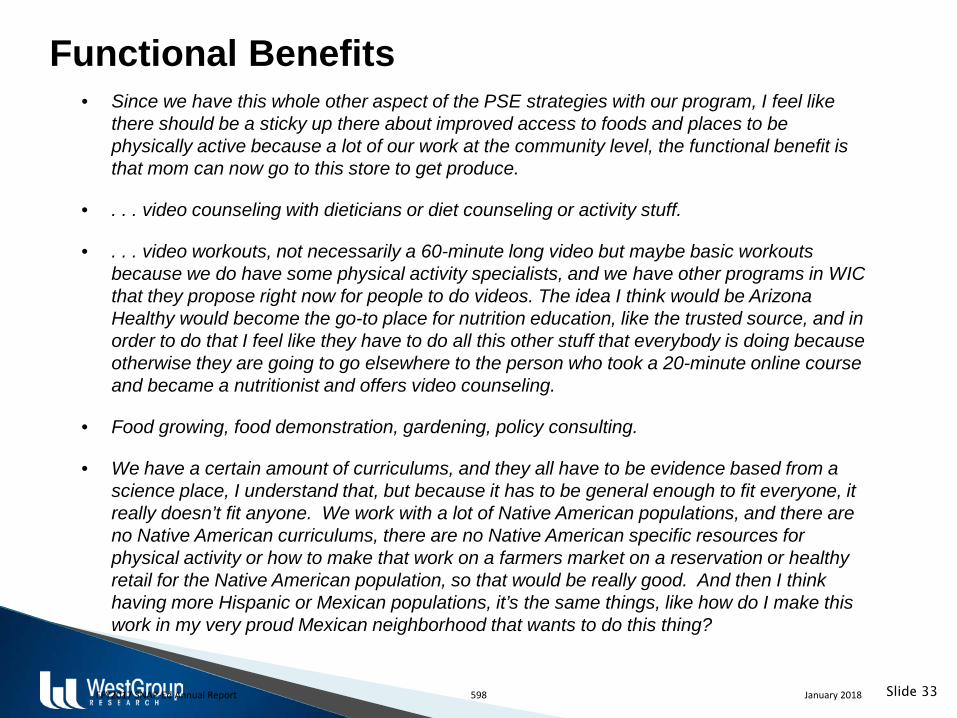
Functional Benefits • Since we have this whole other aspect of the PSE strategies with our program, I feel like
there should be a sticky up there about improved access to foods and places to be physically active because a lot of our work at the community level, the functional benefit is that mom can now go to this store to get produce.
• . . . video counseling with dieticians or diet counseling or activity stuff.
• . . . video workouts, not necessarily a 60-minute long video but maybe basic workouts because we do have some physical activity specialists, and we have other programs in WIC that they propose right now for people to do videos. The idea I think would be Arizona Healthy would become the go-to place for nutrition education, like the trusted source, and in order to do that I feel like they have to do all this other stuff that everybody is doing because otherwise they are going to go elsewhere to the person who took a 20-minute online course and became a nutritionist and offers video counseling.
• Food growing, food demonstration, gardening, policy consulting.
• We have a certain amount of curriculums, and they all have to be evidence based from a science place, I understand that, but because it has to be general enough to fit everyone, it really doesn’t fit anyone. We work with a lot of Native American populations, and there are no Native American curriculums, there are no Native American specific resources for physical activity or how to make that work on a farmers market on a reservation or healthy retail for the Native American population, so that would be really good. And then I think having more Hispanic or Mexican populations, it’s the same things, like how do I make this work in my very proud Mexican neighborhood that wants to do this thing?
Slide 33 FFY2017 SNAP-Ed Annual Report 598 January 2018
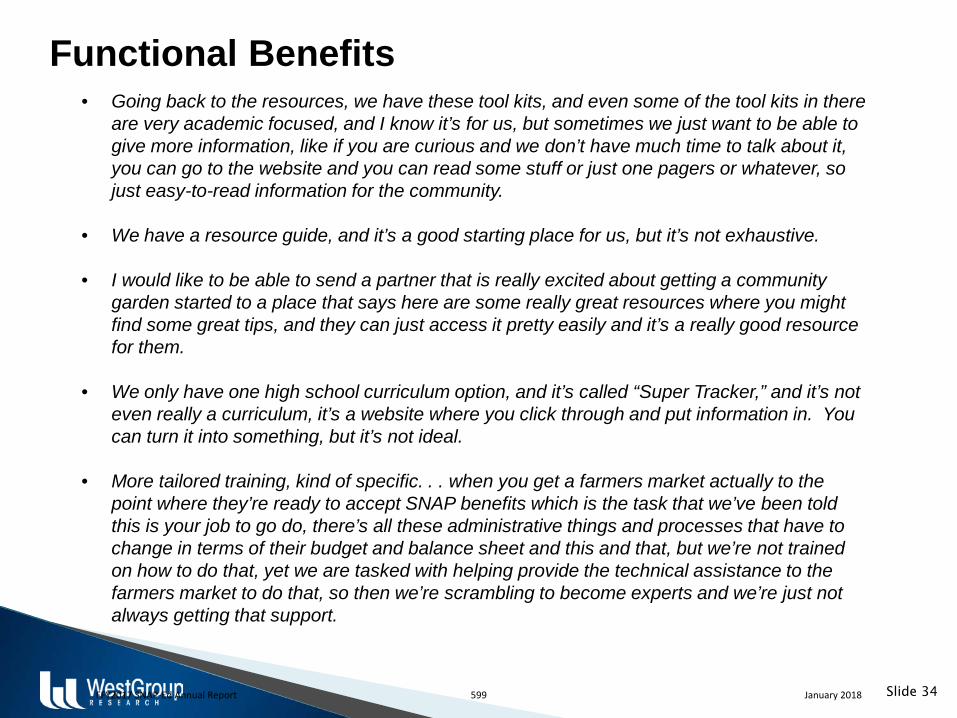
Functional Benefits • Going back to the resources, we have these tool kits, and even some of the tool kits in there
are very academic focused, and I know it’s for us, but sometimes we just want to be able to give more information, like if you are curious and we don’t have much time to talk about it, you can go to the website and you can read some stuff or just one pagers or whatever, so just easy-to-read information for the community.
• We have a resource guide, and it’s a good starting place for us, but it’s not exhaustive. • I would like to be able to send a partner that is really excited about getting a community
garden started to a place that says here are some really great resources where you might find some great tips, and they can just access it pretty easily and it’s a really good resource for them.
• We only have one high school curriculum option, and it’s called “Super Tracker,” and it’s not even really a curriculum, it’s a website where you click through and put information in. You can turn it into something, but it’s not ideal.
• More tailored training, kind of specific. . . when you get a farmers market actually to the point where they’re ready to accept SNAP benefits which is the task that we’ve been told this is your job to go do, there’s all these administrative things and processes that have to change in terms of their budget and balance sheet and this and that, but we’re not trained on how to do that, yet we are tasked with helping provide the technical assistance to the farmers market to do that, so then we’re scrambling to become experts and we’re just not always getting that support.
Slide 34 FFY2017 SNAP-Ed Annual Report 599 January 2018
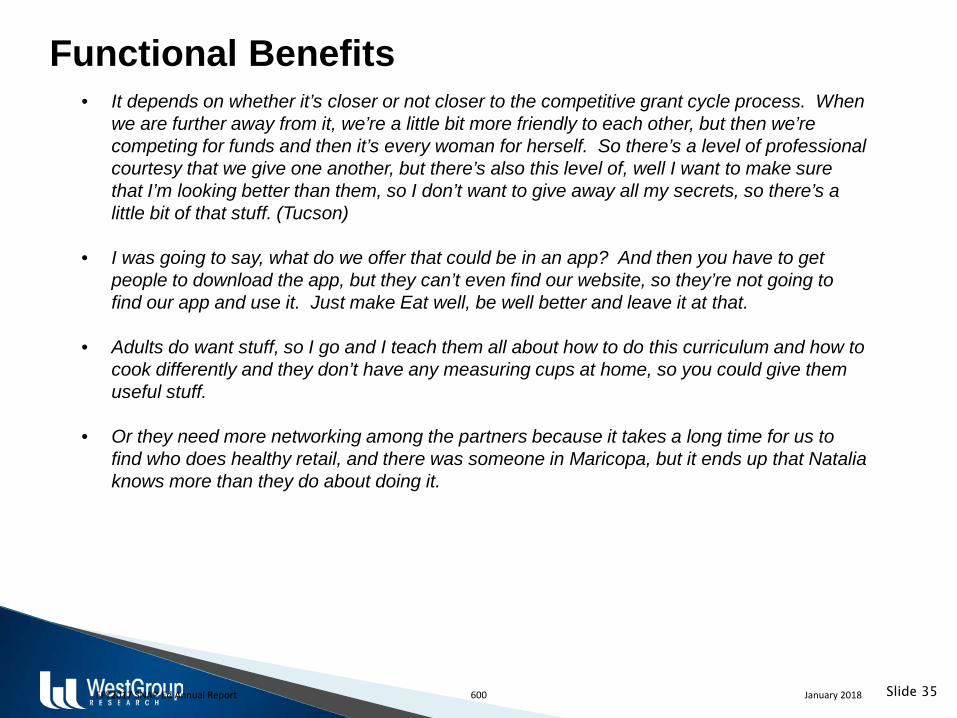
Functional Benefits • It depends on whether it’s closer or not closer to the competitive grant cycle process. When
we are further away from it, we’re a little bit more friendly to each other, but then we’re competing for funds and then it’s every woman for herself. So there’s a level of professional courtesy that we give one another, but there’s also this level of, well I want to make sure that I’m looking better than them, so I don’t want to give away all my secrets, so there’s a little bit of that stuff. (Tucson)
• I was going to say, what do we offer that could be in an app? And then you have to get people to download the app, but they can’t even find our website, so they’re not going to find our app and use it. Just make Eat well, be well better and leave it at that.
• Adults do want stuff, so I go and I teach them all about how to do this curriculum and how to cook differently and they don’t have any measuring cups at home, so you could give them useful stuff.
• Or they need more networking among the partners because it takes a long time for us to
find who does healthy retail, and there was someone in Maricopa, but it ends up that Natalia knows more than they do about doing it.
Slide 35 FFY2017 SNAP-Ed Annual Report 600 January 2018
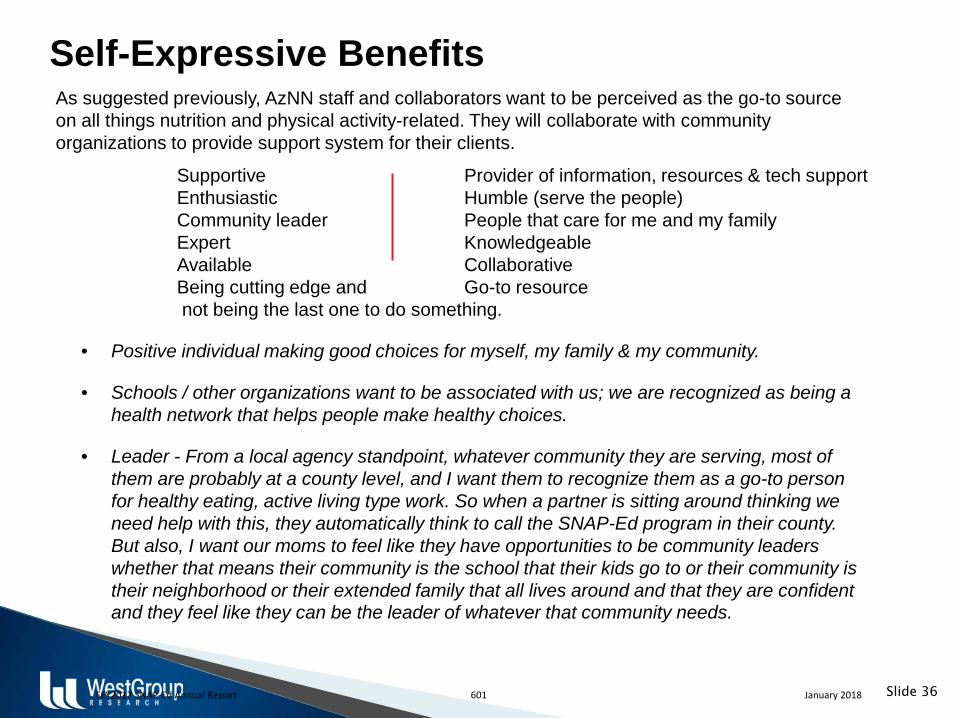
Self-Expressive Benefits
Supportive Provider of information, resources & tech support Enthusiastic Humble (serve the people) Community leader People that care for me and my family Expert Knowledgeable Available Collaborative Being cutting edge and Go-to resource not being the last one to do something. • Positive individual making good choices for myself, my family & my community.
• Schools / other organizations want to be associated with us; we are recognized as being a
health network that helps people make healthy choices.
• Leader - From a local agency standpoint, whatever community they are serving, most of them are probably at a county level, and I want them to recognize them as a go-to person for healthy eating, active living type work. So when a partner is sitting around thinking we need help with this, they automatically think to call the SNAP-Ed program in their county. But also, I want our moms to feel like they have opportunities to be community leaders whether that means their community is the school that their kids go to or their community is their neighborhood or their extended family that all lives around and that they are confident and they feel like they can be the leader of whatever that community needs.
Slide 36
As suggested previously, AzNN staff and collaborators want to be perceived as the go-to source on all things nutrition and physical activity-related. They will collaborate with community organizations to provide support system for their clients.
FFY2017 SNAP-Ed Annual Report 601 January 2018
Key Messages
FFY2017 SNAP-Ed Annual Report 602 January 2018
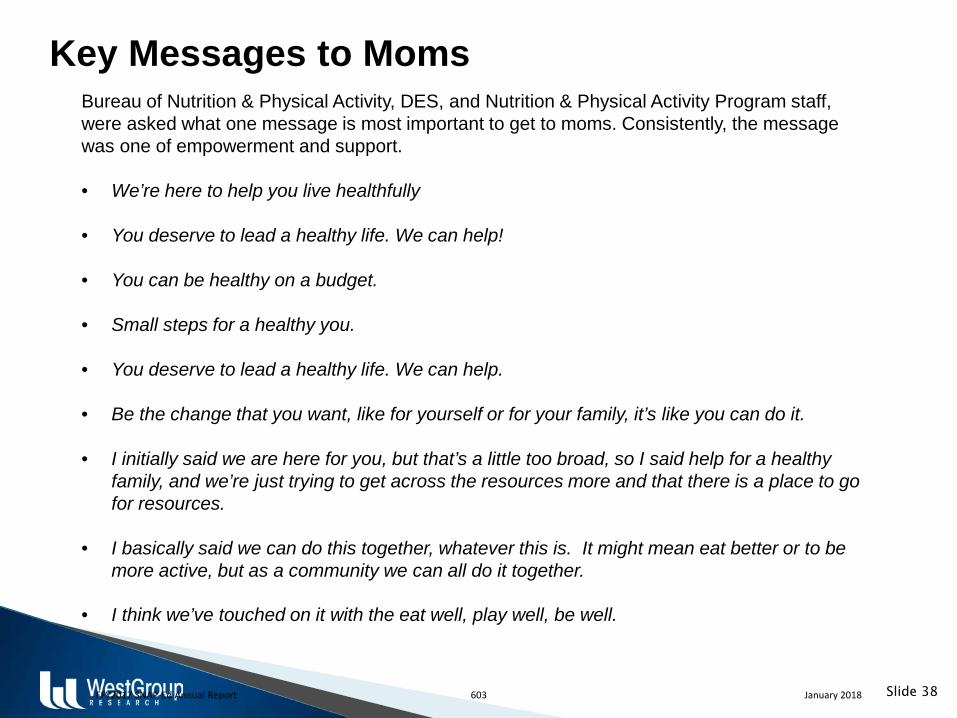
Key Messages to Moms Bureau of Nutrition & Physical Activity, DES, and Nutrition & Physical Activity Program staff, were asked what one message is most important to get to moms. Consistently, the message was one of empowerment and support. • We’re here to help you live healthfully
• You deserve to lead a healthy life. We can help!
• You can be healthy on a budget.
• Small steps for a healthy you.
• You deserve to lead a healthy life. We can help.
• Be the change that you want, like for yourself or for your family, it’s like you can do it.
• I initially said we are here for you, but that’s a little too broad, so I said help for a healthy
family, and we’re just trying to get across the resources more and that there is a place to go for resources.
• I basically said we can do this together, whatever this is. It might mean eat better or to be more active, but as a community we can all do it together.
• I think we’ve touched on it with the eat well, play well, be well.
Slide 38 FFY2017 SNAP-Ed Annual Report 603 January 2018
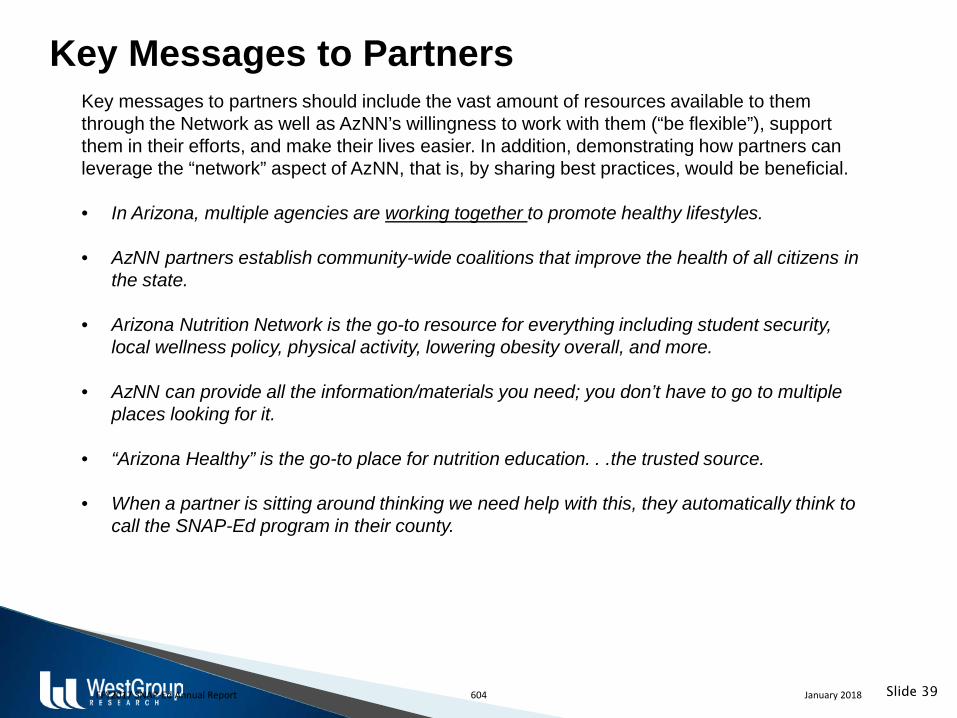
Key Messages to Partners Key messages to partners should include the vast amount of resources available to them through the Network as well as AzNN’s willingness to work with them (“be flexible”), support them in their efforts, and make their lives easier. In addition, demonstrating how partners can leverage the “network” aspect of AzNN, that is, by sharing best practices, would be beneficial. • In Arizona, multiple agencies are working together to promote healthy lifestyles.
• AzNN partners establish community-wide coalitions that improve the health of all citizens in
the state.
• Arizona Nutrition Network is the go-to resource for everything including student security, local wellness policy, physical activity, lowering obesity overall, and more.
• AzNN can provide all the information/materials you need; you don’t have to go to multiple places looking for it.
• “Arizona Healthy” is the go-to place for nutrition education. . .the trusted source.
• When a partner is sitting around thinking we need help with this, they automatically think to call the SNAP-Ed program in their county.
Slide 39 FFY2017 SNAP-Ed Annual Report 604 January 2018
Key Findings & Recommendations
FFY2017 SNAP-Ed Annual Report 605 January 2018
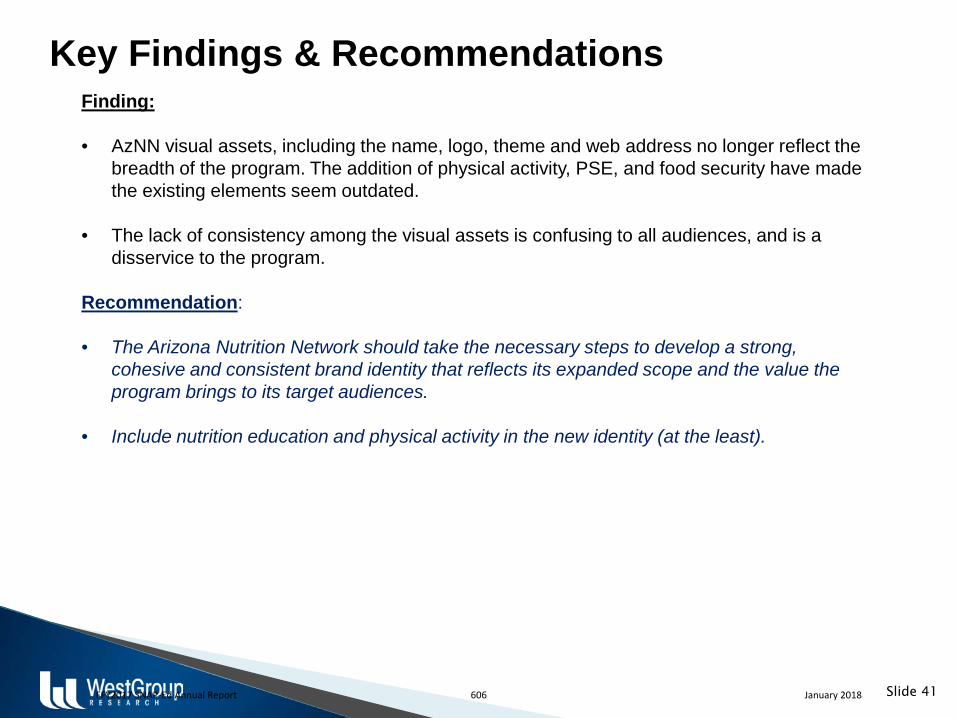
Key Findings & Recommendations Finding:
• AzNN visual assets, including the name, logo, theme and web address no longer reflect the
breadth of the program. The addition of physical activity, PSE, and food security have made the existing elements seem outdated.
• The lack of consistency among the visual assets is confusing to all audiences, and is a disservice to the program.
Recommendation: • The Arizona Nutrition Network should take the necessary steps to develop a strong,
cohesive and consistent brand identity that reflects its expanded scope and the value the program brings to its target audiences.
• Include nutrition education and physical activity in the new identity (at the least).
Slide 41 FFY2017 SNAP-Ed Annual Report 606 January 2018
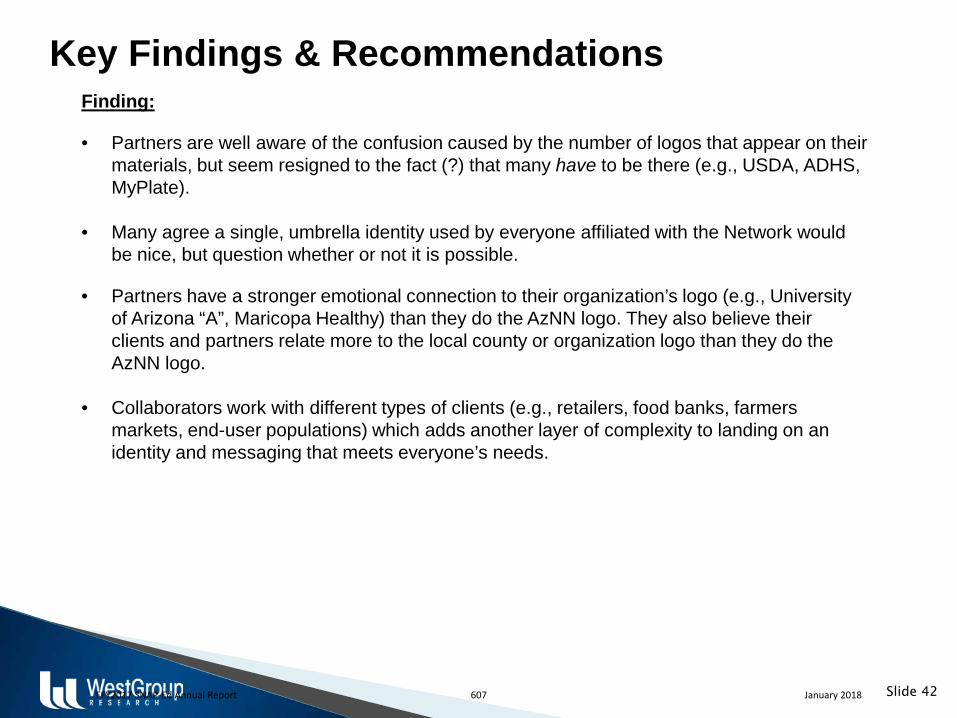
Key Findings & Recommendations Finding: • Partners are well aware of the confusion caused by the number of logos that appear on their
materials, but seem resigned to the fact (?) that many have to be there (e.g., USDA, ADHS, MyPlate).
• Many agree a single, umbrella identity used by everyone affiliated with the Network would be nice, but question whether or not it is possible.
• Partners have a stronger emotional connection to their organization’s logo (e.g., University
of Arizona “A”, Maricopa Healthy) than they do the AzNN logo. They also believe their clients and partners relate more to the local county or organization logo than they do the AzNN logo.
• Collaborators work with different types of clients (e.g., retailers, food banks, farmers markets, end-user populations) which adds another layer of complexity to landing on an identity and messaging that meets everyone’s needs.
Slide 42 FFY2017 SNAP-Ed Annual Report 607 January 2018
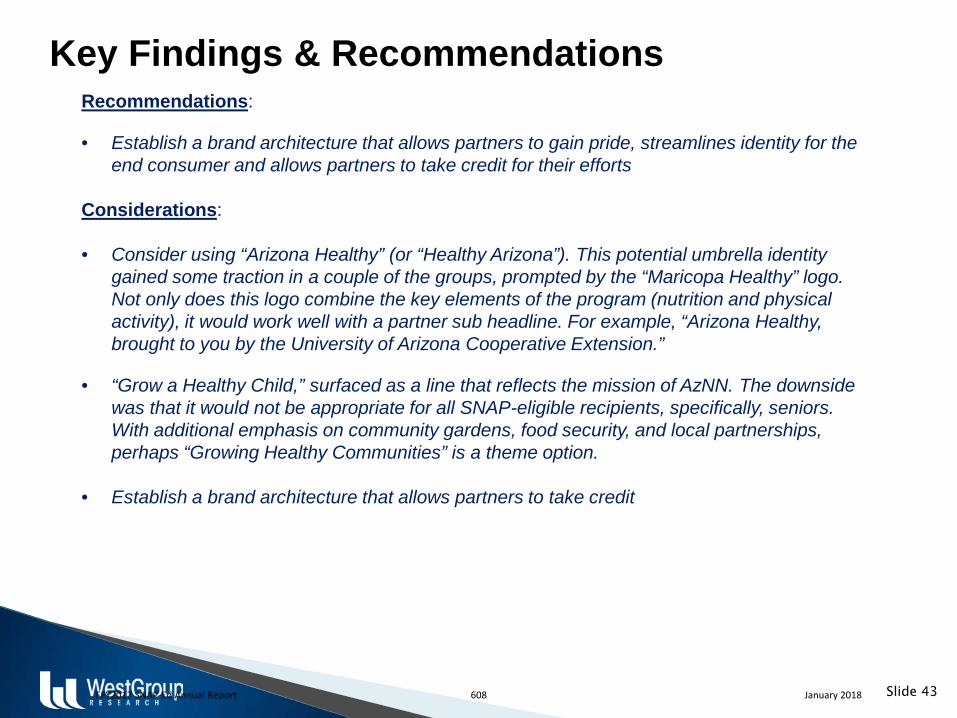
Key Findings & Recommendations Recommendations: • Establish a brand architecture that allows partners to gain pride, streamlines identity for the
end consumer and allows partners to take credit for their efforts
Considerations:
• Consider using “Arizona Healthy” (or “Healthy Arizona”). This potential umbrella identity gained some traction in a couple of the groups, prompted by the “Maricopa Healthy” logo. Not only does this logo combine the key elements of the program (nutrition and physical activity), it would work well with a partner sub headline. For example, “Arizona Healthy, brought to you by the University of Arizona Cooperative Extension.”
• “Grow a Healthy Child,” surfaced as a line that reflects the mission of AzNN. The downside
was that it would not be appropriate for all SNAP-eligible recipients, specifically, seniors. With additional emphasis on community gardens, food security, and local partnerships, perhaps “Growing Healthy Communities” is a theme option.
• Establish a brand architecture that allows partners to take credit
Slide 43 FFY2017 SNAP-Ed Annual Report 608 January 2018
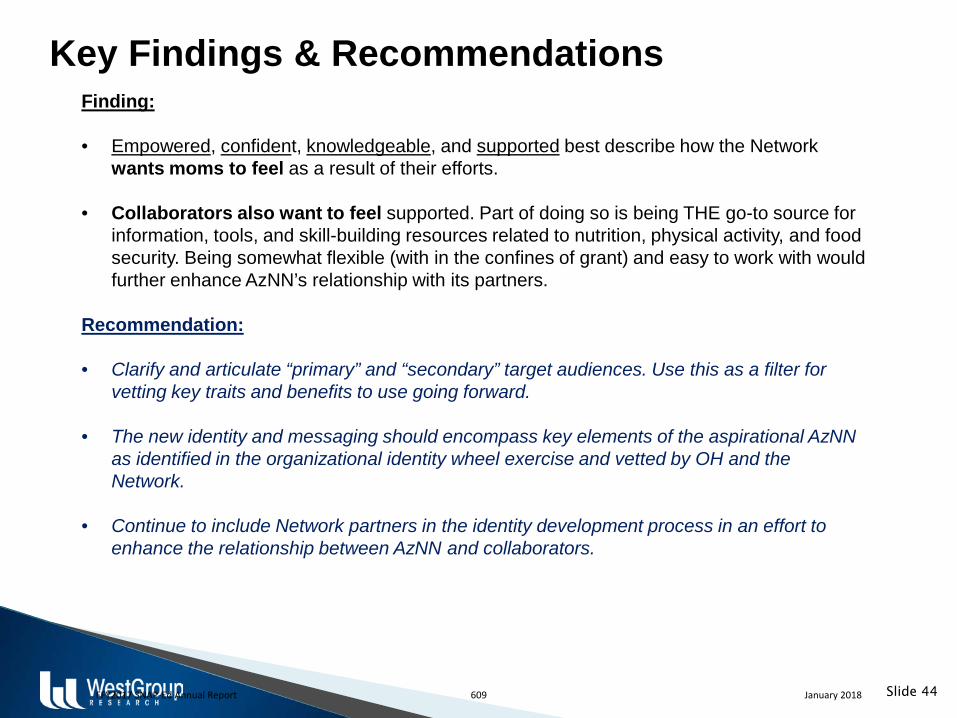
Key Findings & Recommendations Finding:
• Empowered, confident, knowledgeable, and supported best describe how the Network
wants moms to feel as a result of their efforts.
• Collaborators also want to feel supported. Part of doing so is being THE go-to source for information, tools, and skill-building resources related to nutrition, physical activity, and food security. Being somewhat flexible (with in the confines of grant) and easy to work with would further enhance AzNN’s relationship with its partners.
Recommendation: • Clarify and articulate “primary” and “secondary” target audiences. Use this as a filter for
vetting key traits and benefits to use going forward.
• The new identity and messaging should encompass key elements of the aspirational AzNN as identified in the organizational identity wheel exercise and vetted by OH and the Network.
• Continue to include Network partners in the identity development process in an effort to enhance the relationship between AzNN and collaborators.
Slide 44 FFY2017 SNAP-Ed Annual Report 609 January 2018
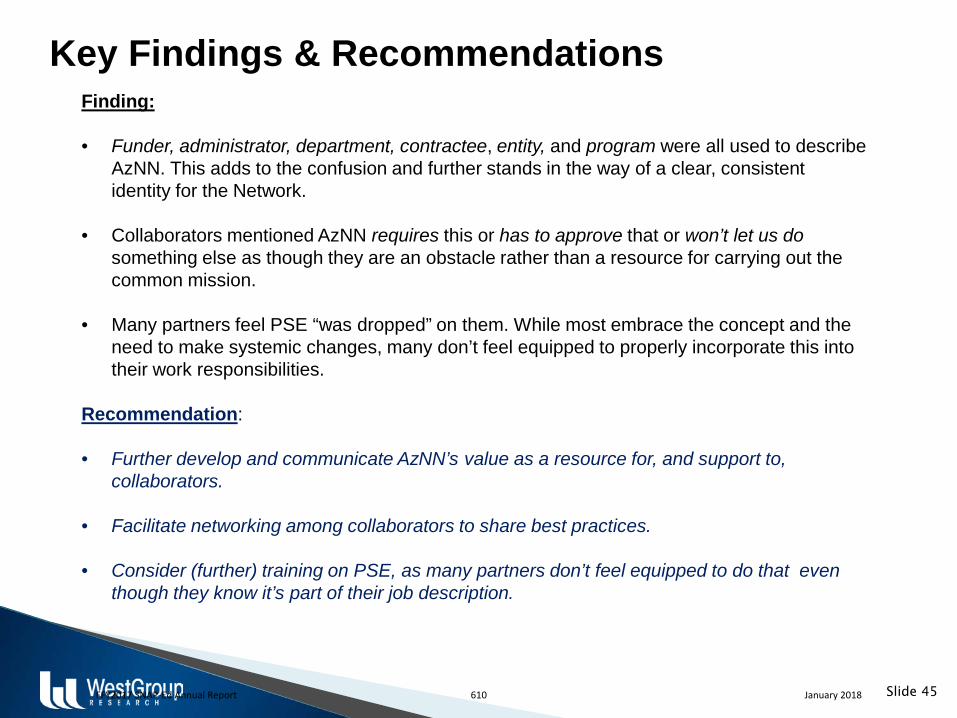
Key Findings & Recommendations Finding: • Funder, administrator, department, contractee, entity, and program were all used to describe
AzNN. This adds to the confusion and further stands in the way of a clear, consistent identity for the Network.
• Collaborators mentioned AzNN requires this or has to approve that or won’t let us do something else as though they are an obstacle rather than a resource for carrying out the common mission.
• Many partners feel PSE “was dropped” on them. While most embrace the concept and the need to make systemic changes, many don’t feel equipped to properly incorporate this into their work responsibilities.
Recommendation: • Further develop and communicate AzNN’s value as a resource for, and support to,
collaborators.
• Facilitate networking among collaborators to share best practices.
• Consider (further) training on PSE, as many partners don’t feel equipped to do that even though they know it’s part of their job description.
Slide 45 FFY2017 SNAP-Ed Annual Report 610 January 2018
3033 North 44th Street, Ste. 150 Phoenix, AZ 85018
AzNN State & Local Messaging:
External Audience June 2017
Report Date: July 17, 2017
FFY2017 SNAP-Ed Annual Report 611 January 2018
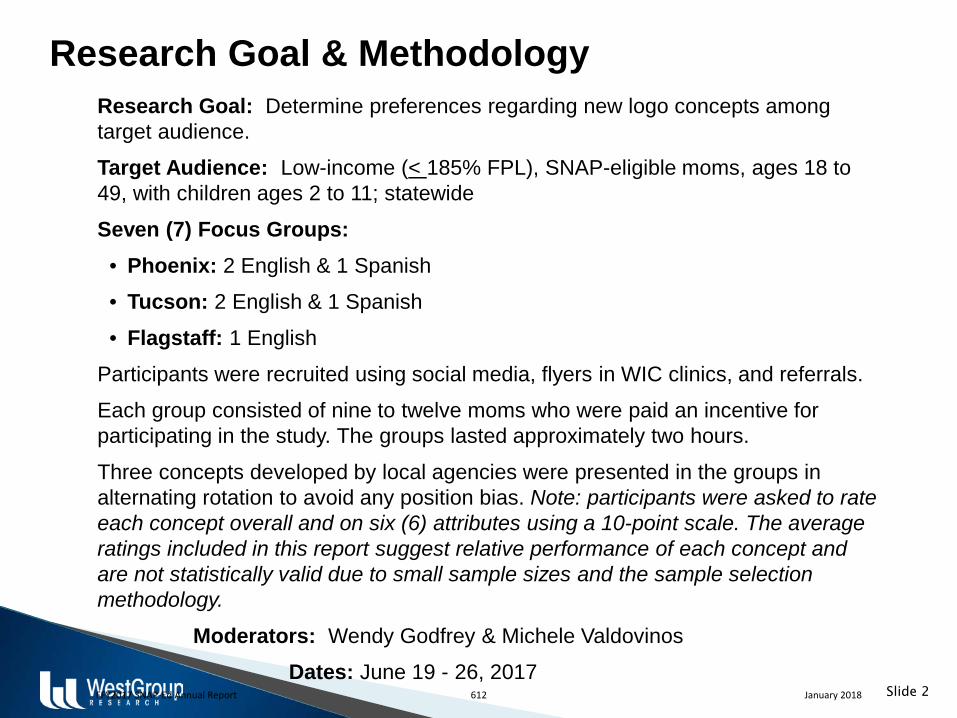
Research Goal & Methodology Research Goal: Determine preferences regarding new logo concepts among target audience. Target Audience: Low-income (< 185% FPL), SNAP-eligible moms, ages 18 to 49, with children ages 2 to 11; statewide
Seven (7) Focus Groups: • Phoenix: 2 English & 1 Spanish • Tucson: 2 English & 1 Spanish
• Flagstaff: 1 English Participants were recruited using social media, flyers in WIC clinics, and referrals. Each group consisted of nine to twelve moms who were paid an incentive for participating in the study. The groups lasted approximately two hours.
Three concepts developed by local agencies were presented in the groups in alternating rotation to avoid any position bias. Note: participants were asked to rate each concept overall and on six (6) attributes using a 10-point scale. The average ratings included in this report suggest relative performance of each concept and are not statistically valid due to small sample sizes and the sample selection methodology.
Moderators: Wendy Godfrey & Michele Valdovinos Dates: June 19 - 26, 2017
Slide 2 FFY2017 SNAP-Ed Annual Report 612 January 2018
Executive Summary bewell.arizona does the best job communicating the dual message of nutrition and physical activity. Many women suggested that the orange as the “o” in the word “Arizona” represents eating healthy and that the running figure over the words represents being active and exercising. Other positive aspects of the logo included the attractive colors, it shows movement, and it is self-explanatory. Negative responses revolved around not understanding the orange, not liking the running figure and its placement on top of the two “l’s,” or just not liking the two elements together in one logo. Because of the multiple elements, some felt that the logo was too large and busy. In addition, Spanish-language participants suggested that the figure running should include more people or a family to better align with their preference for group activities. AZ Health Zone was the favorite among Spanish dominant participants, with many liking that the logo resembled a piece of fruit. The bullseye in the center added to the message by emphasizing a focus on healthy initiatives. The most frequently cited positive response among English-speakers was that the logo was clear and simple and made sense to them. They understood the fruit and target together, and knew they would gain information on healthy living from it. Negative comments about this logo had to do with the color (a deeper shade of green would be more appealing) and that it looks too much like the logo for Target stores. Respondents liked having the tag line – Good health starts here - on this logo option as it provided more clarity as to the purpose of the program.
Slide 3 FFY2017 SNAP-Ed Annual Report 613 January 2018
Executive Summary Reshape Arizona was the least favorite of the three logo concepts. The majority of the comments from the groups were negative, indicating the target audience didn’t connect with this logo and / or associate it with a healthy living message. While most liked the colors, most also agreed combining green with the arrow suggested recycling. In the Spanish groups, the image of the arrow was noticed but not well understood. Respondents were not able to connect it with a concept related to health. Further, the lowercase letters were confusing to these moms. Finally, many women felt that “reshape” has a negative connotation, suggesting that there is something wrong with their shape (as well as other people’s shapes) which they found somewhat offensive. • Obstacles to a Healthy Lifestyle
• Moms maintain they need more time, education and help with meal planning to get their family’s healthy lifestyle rating to a “10.” Others need motivation, discipline and ideas for physical activity, ideally, ideas that families can do together.
• Features of “Ideal” Healthy Lifestyles Website
• Top responses included offering healthy recipes and help with meal planning. Moms also would like to see information on local events and activities they can go to with their kids that are not costly (i.e., free) and would get them all moving as a family.
Slide 4 FFY2017 SNAP-Ed Annual Report 614 January 2018

Concept Evaluation
FFY2017 SNAP-Ed Annual Report 615 January 2018
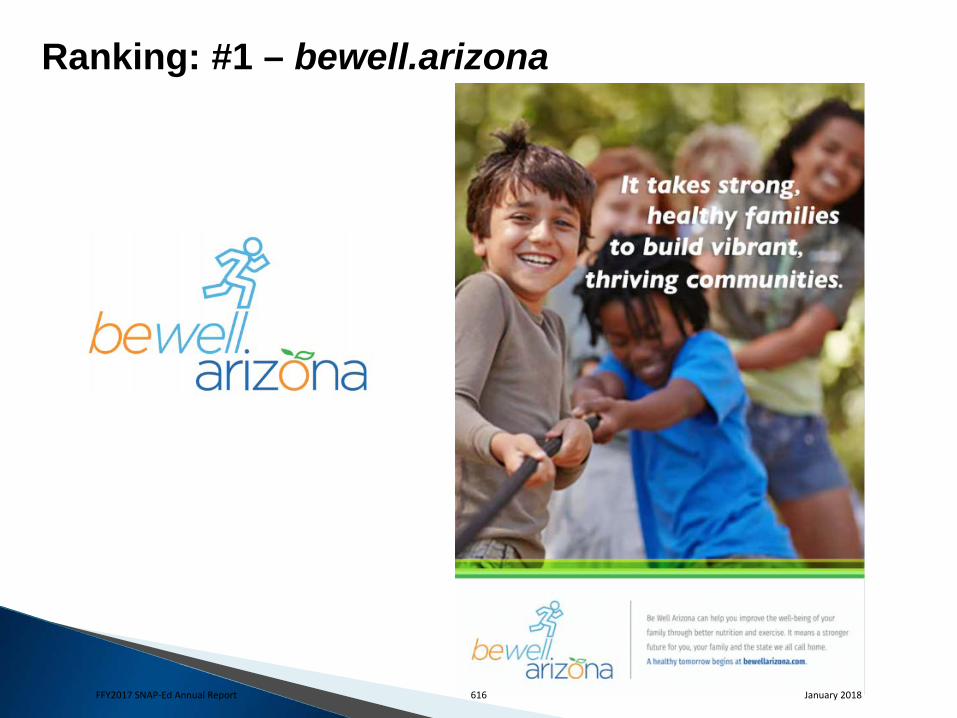
Ranking: #1 – bewell.arizona
FFY2017 SNAP-Ed Annual Report 616 January 2018
bewell.arizona bewell.arizona had the highest average rating among the three concepts when
English-speaking participants were asked to rate each on a 10-point scale, with “10” meaning they “loved it.” While it was not necessarily everyone’s favorite, it was consistently well-received and was thought to be the most effective in getting across the dual message of healthy eating and physical activity.
Most women agreed that the orange as the “o” in the word “Arizona” represents
eating healthy and that the running figure over the words represents being active and exercising. In addition, many moms liked the colors used in the logo as well as the lowercase font. Several also commented that the logo represents a positive message to the public.
While rating this logo slightly lower, Spanish-speakers found the imagery of the
orange in the word “Arizona” very appealing and attention-getting, suggesting it aligns with their natural focus on fresh, organic foods and bright, vibrant colors. It has additional leverage as representing a unique agricultural aspect of Arizona and calls many of them pleasantly to their rural roots.
FFY2017 SNAP-Ed Annual Report 617 January 2018
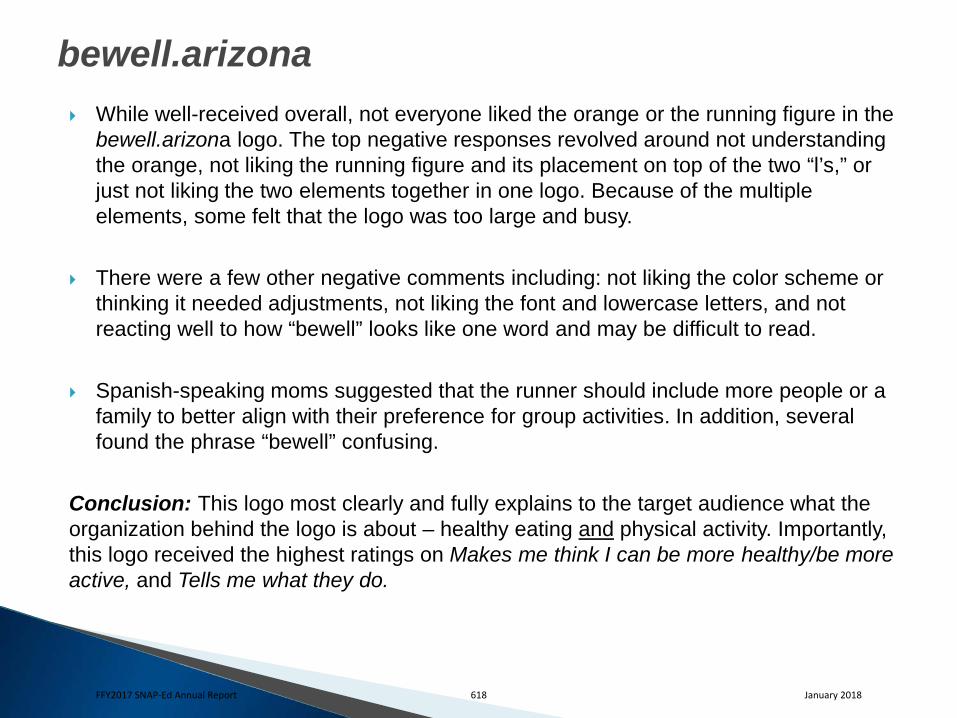
bewell.arizona While well-received overall, not everyone liked the orange or the running figure in the
bewell.arizona logo. The top negative responses revolved around not understanding the orange, not liking the running figure and its placement on top of the two “l’s,” or just not liking the two elements together in one logo. Because of the multiple elements, some felt that the logo was too large and busy.
There were a few other negative comments including: not liking the color scheme or
thinking it needed adjustments, not liking the font and lowercase letters, and not reacting well to how “bewell” looks like one word and may be difficult to read.
Spanish-speaking moms suggested that the runner should include more people or a family to better align with their preference for group activities. In addition, several found the phrase “bewell” confusing.
Conclusion: This logo most clearly and fully explains to the target audience what the organization behind the logo is about – healthy eating and physical activity. Importantly, this logo received the highest ratings on Makes me think I can be more healthy/be more active, and Tells me what they do.
FFY2017 SNAP-Ed Annual Report 618 January 2018
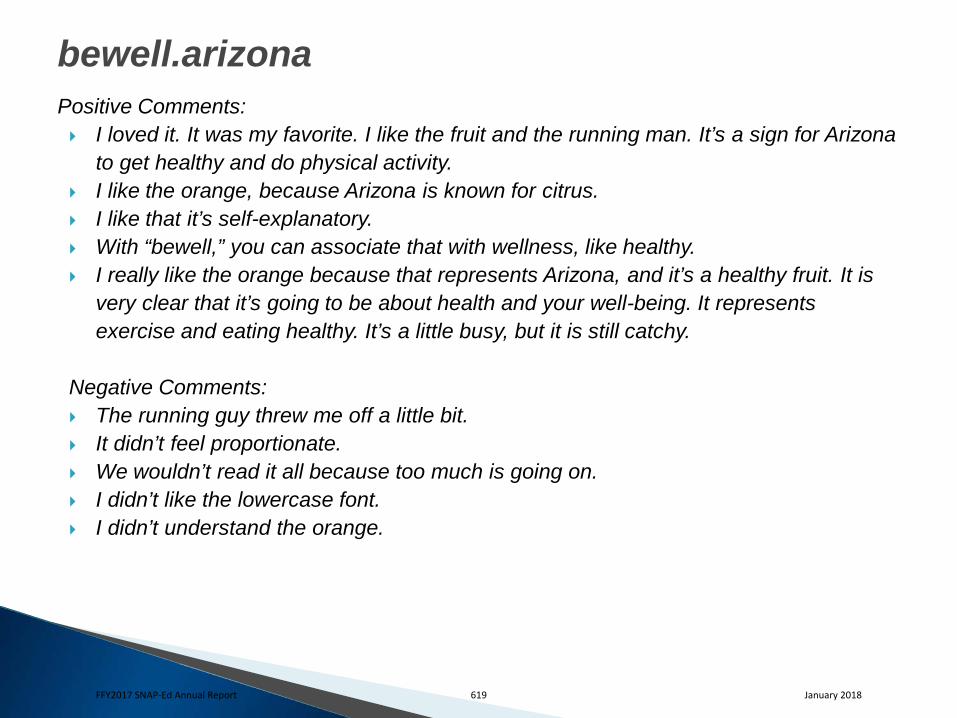
bewell.arizona Positive Comments: I loved it. It was my favorite. I like the fruit and the running man. It’s a sign for Arizona
to get healthy and do physical activity. I like the orange, because Arizona is known for citrus. I like that it’s self-explanatory. With “bewell,” you can associate that with wellness, like healthy. I really like the orange because that represents Arizona, and it’s a healthy fruit. It is
very clear that it’s going to be about health and your well-being. It represents exercise and eating healthy. It’s a little busy, but it is still catchy.
Negative Comments: The running guy threw me off a little bit. It didn’t feel proportionate. We wouldn’t read it all because too much is going on. I didn’t like the lowercase font. I didn’t understand the orange.
FFY2017 SNAP-Ed Annual Report 619 January 2018
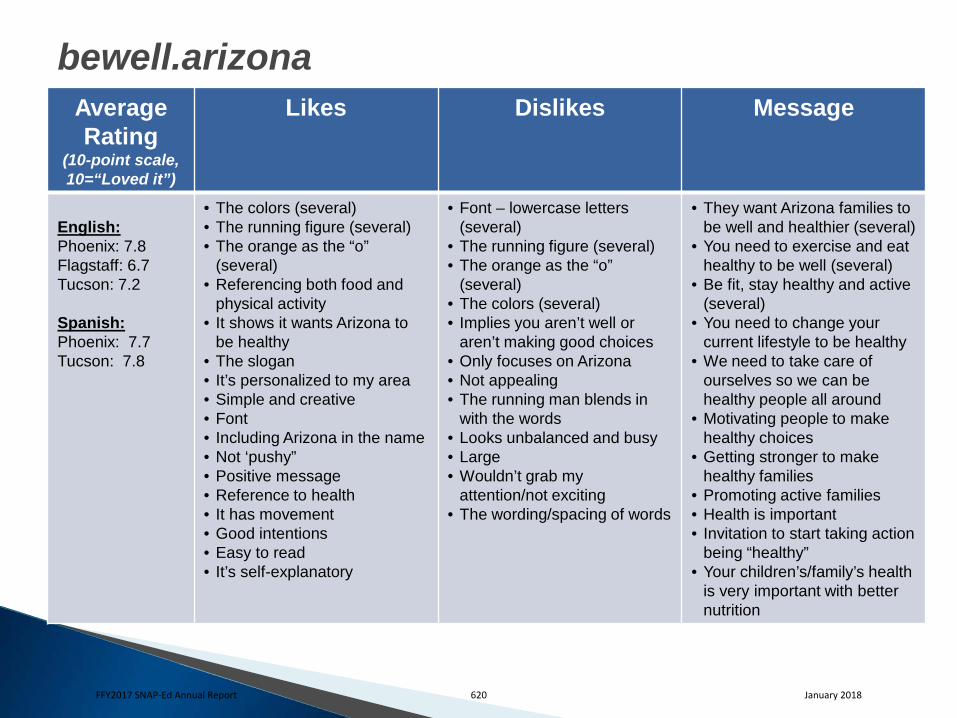
bewell.arizona Average Rating
(10-point scale, 10=“Loved it”)
Likes Dislikes Message
English: Phoenix: 7.8 Flagstaff: 6.7 Tucson: 7.2 Spanish: Phoenix: 7.7 Tucson: 7.8
• The colors (several) • The running figure (several) • The orange as the “o”
(several) • Referencing both food and
physical activity • It shows it wants Arizona to
be healthy • The slogan • It’s personalized to my area • Simple and creative • Font • Including Arizona in the name • Not ‘pushy” • Positive message • Reference to health • It has movement • Good intentions • Easy to read • It’s self-explanatory
• Font – lowercase letters (several)
• The running figure (several) • The orange as the “o”
(several) • The colors (several) • Implies you aren’t well or
aren’t making good choices • Only focuses on Arizona • Not appealing • The running man blends in
with the words • Looks unbalanced and busy • Large • Wouldn’t grab my
attention/not exciting • The wording/spacing of words
• They want Arizona families to be well and healthier (several)
• You need to exercise and eat healthy to be well (several)
• Be fit, stay healthy and active (several)
• You need to change your current lifestyle to be healthy
• We need to take care of ourselves so we can be healthy people all around
• Motivating people to make healthy choices
• Getting stronger to make healthy families
• Promoting active families • Health is important • Invitation to start taking action
being “healthy” • Your children’s/family’s health
is very important with better nutrition
FFY2017 SNAP-Ed Annual Report 620 January 2018
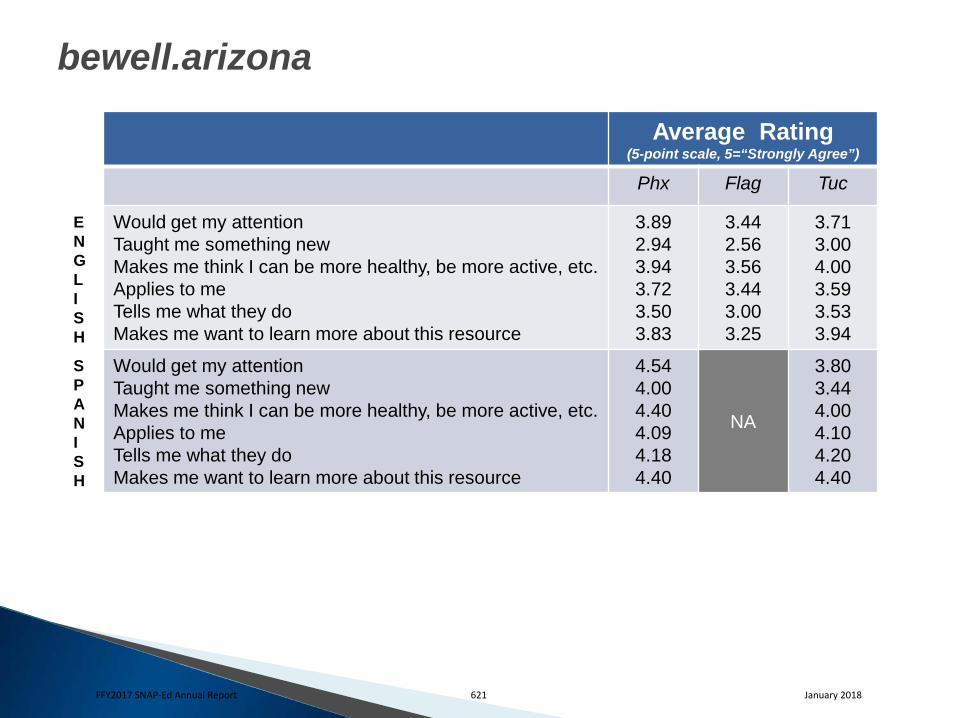
bewell.arizona
Average Rating (5-point scale, 5=“Strongly Agree”)
Phx Flag Tuc
Would get my attention Taught me something new Makes me think I can be more healthy, be more active, etc. Applies to me Tells me what they do Makes me want to learn more about this resource
3.89 2.94 3.94 3.72 3.50 3.83
3.44 2.56 3.56 3.44 3.00 3.25
3.71 3.00 4.00 3.59 3.53 3.94
Would get my attention Taught me something new Makes me think I can be more healthy, be more active, etc. Applies to me Tells me what they do Makes me want to learn more about this resource
4.54 4.00 4.40 4.09 4.18 4.40
NA
3.80 3.44 4.00 4.10 4.20 4.40
E N G L I S H
S P A N I S H
FFY2017 SNAP-Ed Annual Report 621 January 2018
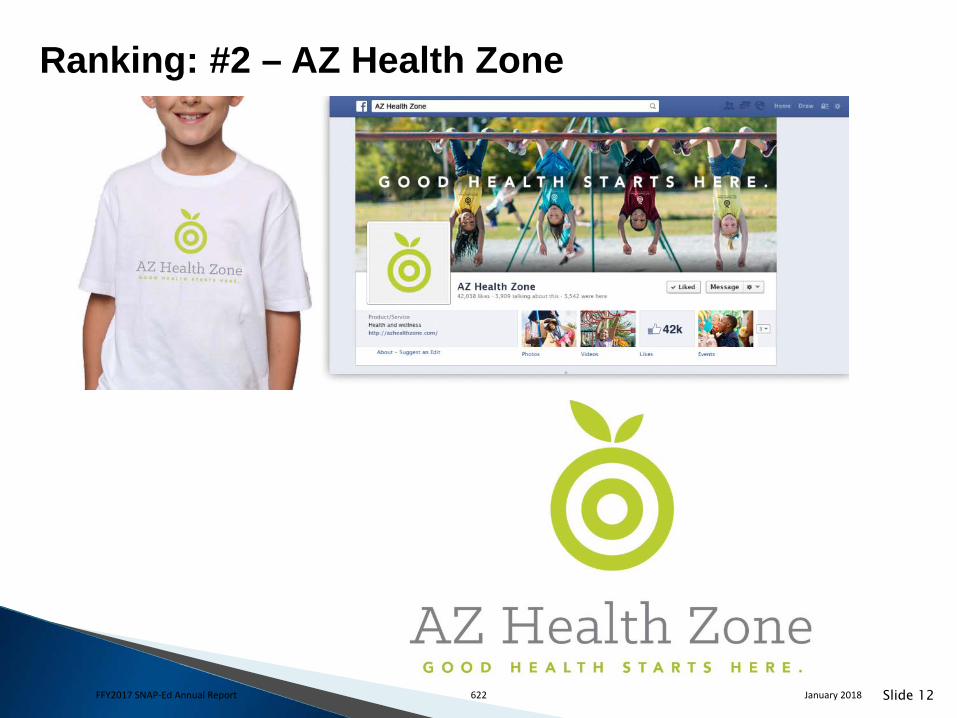
Slide 12
Ranking: #2 – AZ Health Zone
FFY2017 SNAP-Ed Annual Report 622 January 2018
AZ Health Zone AZ Health Zone came in second among English-speakers and first among Spanish-
speakers when comparing ratings of how much moms “liked” the concepts. The most often mentioned positive responses for AZ Health Zone included it was a clear and simple logo and made sense to them. Moms liked the fruit and target together, and knew they would gain information on healthy living from this website. Along with this, many also liked the wording on the logo “good health starts here.” They felt it was easy to understand and clever. Several mentioned they would click on it if they saw it online.
Although many thought AZ Health Zone was a clear logo, others were confused by it and didn’t understand what they were looking at. Several said it reminded them of the Target store logo, or that it belongs to some other business, like a hospital. Because of this, some women felt a disconnect between the logo and the message it was trying to convey.
Another frequently mentioned criticism of AZ Health Zone was that the logo was too plain and boring and would not stand out to them. Still others disliked the color of the logo saying it was hard to see and read. However, some said they would like it better if it was a different color, a deeper green, for example.
FFY2017 SNAP-Ed Annual Report 623 January 2018
AZ Health Zone Conclusion: AZ Health Zone had issues with being too plain, being difficult to read because of the bright yellow/green color and looking very similar to the Target store logo. However, the words included in the logo (“good health starts here”) helped clear up some of the confusion. A brighter color – one that provides more contrast against a white background – would add to the appeal of this logo.
FFY2017 SNAP-Ed Annual Report 624 January 2018
AZ Health Zone Positive Comments: If it was on a computer, it would make me want to click it. It stands out and is simple. The name makes you think you’ll find information about being healthy. The target makes sense because of the “zone.” I like the “good health starts here.” It sends a clear message. I thought of a green apple with a target, so I thought making eating healthy the target
of staying healthy. I would like it way better if it was a different color so you could read that last line.
Negative Comments: I didn’t like the color green, it was hard to see, including the tagline. It was boring to me. The colors and the font for AZ Health Zone are boring, so I just
didn’t like it. It didn’t pop out at all to me and wasn’t appealing. It looks like a green Target, so I thought that Target was putting on a healthy thing, like
it was part of Target going green maybe. If you didn’t have those words, I would think Target was going green.
When I think of zone, I think of a kid’s zone, so health zone makes you wonder what kind of health zone are we talking about. Having the green leaf may help, but I feel like it should have a different logo, and with that name it might be a little bit more clear than Target going green, but then it’s health zone, so it was all just so confusing. FFY2017 SNAP-Ed Annual Report 625 January 2018
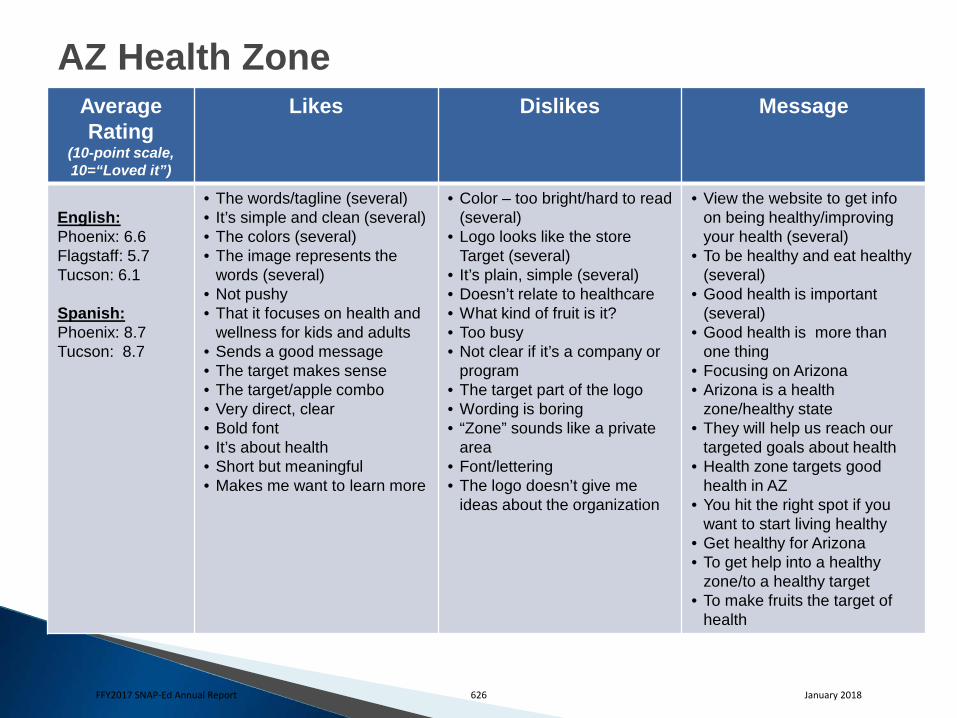
AZ Health Zone Average Rating
(10-point scale, 10=“Loved it”)
Likes Dislikes Message
English: Phoenix: 6.6 Flagstaff: 5.7 Tucson: 6.1 Spanish: Phoenix: 8.7 Tucson: 8.7
• The words/tagline (several) • It’s simple and clean (several) • The colors (several) • The image represents the
words (several) • Not pushy • That it focuses on health and
wellness for kids and adults • Sends a good message • The target makes sense • The target/apple combo • Very direct, clear • Bold font • It’s about health • Short but meaningful • Makes me want to learn more
• Color – too bright/hard to read (several)
• Logo looks like the store Target (several)
• It’s plain, simple (several) • Doesn’t relate to healthcare • What kind of fruit is it? • Too busy • Not clear if it’s a company or
program • The target part of the logo • Wording is boring • “Zone” sounds like a private
area • Font/lettering • The logo doesn’t give me
ideas about the organization
• View the website to get info on being healthy/improving your health (several)
• To be healthy and eat healthy (several)
• Good health is important (several)
• Good health is more than one thing
• Focusing on Arizona • Arizona is a health
zone/healthy state • They will help us reach our
targeted goals about health • Health zone targets good
health in AZ • You hit the right spot if you
want to start living healthy • Get healthy for Arizona • To get help into a healthy
zone/to a healthy target • To make fruits the target of
health
FFY2017 SNAP-Ed Annual Report 626 January 2018
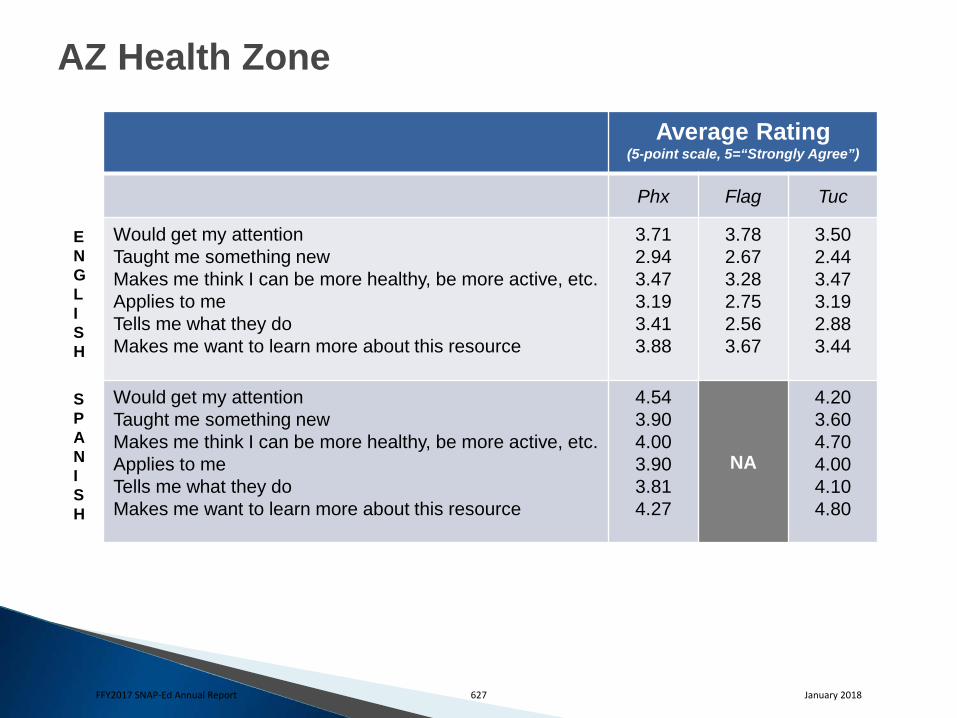
AZ Health Zone
Average Rating (5-point scale, 5=“Strongly Agree”)
Phx Flag Tuc
Would get my attention Taught me something new Makes me think I can be more healthy, be more active, etc. Applies to me Tells me what they do Makes me want to learn more about this resource
3.71 2.94 3.47 3.19 3.41 3.88
3.78 2.67 3.28 2.75 2.56 3.67
3.50 2.44 3.47 3.19 2.88 3.44
Would get my attention Taught me something new Makes me think I can be more healthy, be more active, etc. Applies to me Tells me what they do Makes me want to learn more about this resource
4.54 3.90 4.00 3.90 3.81 4.27
NA
4.20 3.60 4.70 4.00 4.10 4.80
E N G L I S H
S P A N I S H
FFY2017 SNAP-Ed Annual Report 627 January 2018
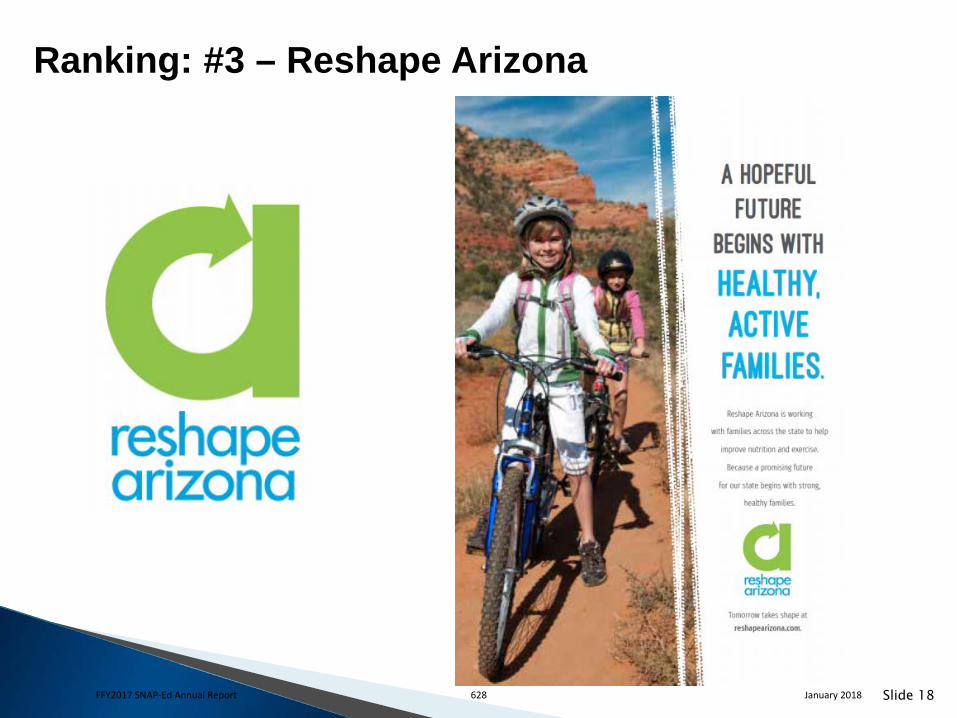
Slide 18
Ranking: #3 – Reshape Arizona
FFY2017 SNAP-Ed Annual Report 628 January 2018
Reshape Arizona Reshape Arizona was the least favorite of all three logo concepts. While the majority
of the comments from the groups were negative, there were many women who had both positive and negative comments about Reshape Arizona. For example, they liked the colors, but not the logo itself, or they might have liked the logo, but did not think it related well to the intended message.
The most liked attribute of Reshape Arizona was that it was a simple, clear and clean design. Moms felt it was easy to digest and was not cluttered. Some of the women also liked the message itself. They liked the idea of “reshape” to represent restarting or changing the way you look.
Additionally, the women liked the use of the creative “a” in the logo, and the blue and green colors. Lastly, a few women thought the logo was catchy and said it would get their attention, while a couple of others said that it seems to represent recycling, which they also see as a heathy concept.
FFY2017 SNAP-Ed Annual Report 629 January 2018
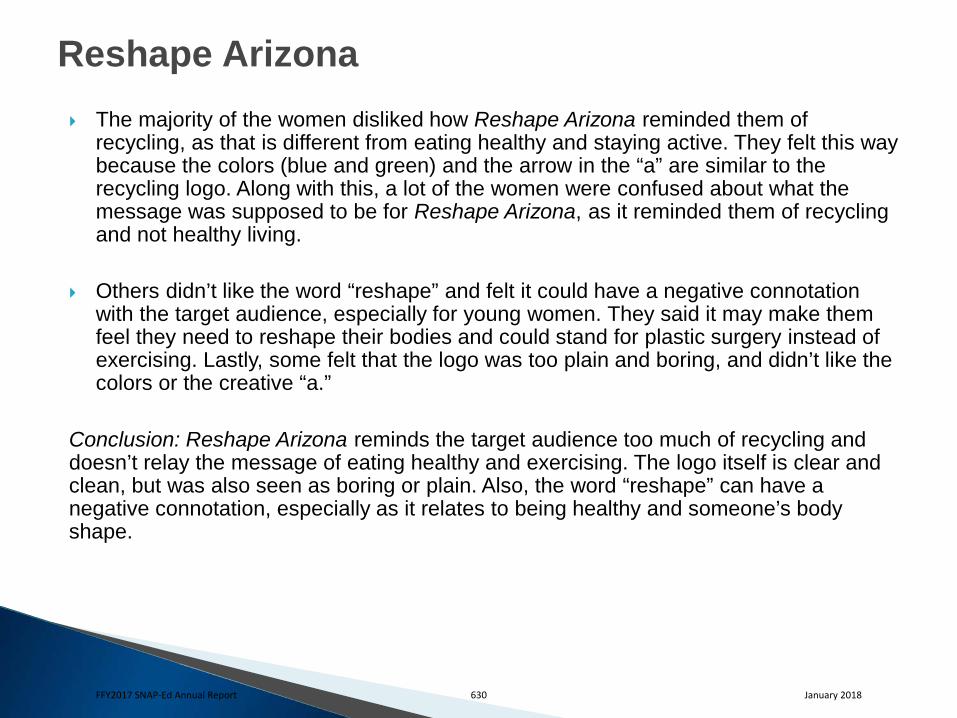
Reshape Arizona The majority of the women disliked how Reshape Arizona reminded them of
recycling, as that is different from eating healthy and staying active. They felt this way because the colors (blue and green) and the arrow in the “a” are similar to the recycling logo. Along with this, a lot of the women were confused about what the message was supposed to be for Reshape Arizona, as it reminded them of recycling and not healthy living.
Others didn’t like the word “reshape” and felt it could have a negative connotation with the target audience, especially for young women. They said it may make them feel they need to reshape their bodies and could stand for plastic surgery instead of exercising. Lastly, some felt that the logo was too plain and boring, and didn’t like the colors or the creative “a.”
Conclusion: Reshape Arizona reminds the target audience too much of recycling and doesn’t relay the message of eating healthy and exercising. The logo itself is clear and clean, but was also seen as boring or plain. Also, the word “reshape” can have a negative connotation, especially as it relates to being healthy and someone’s body shape.
FFY2017 SNAP-Ed Annual Report 630 January 2018
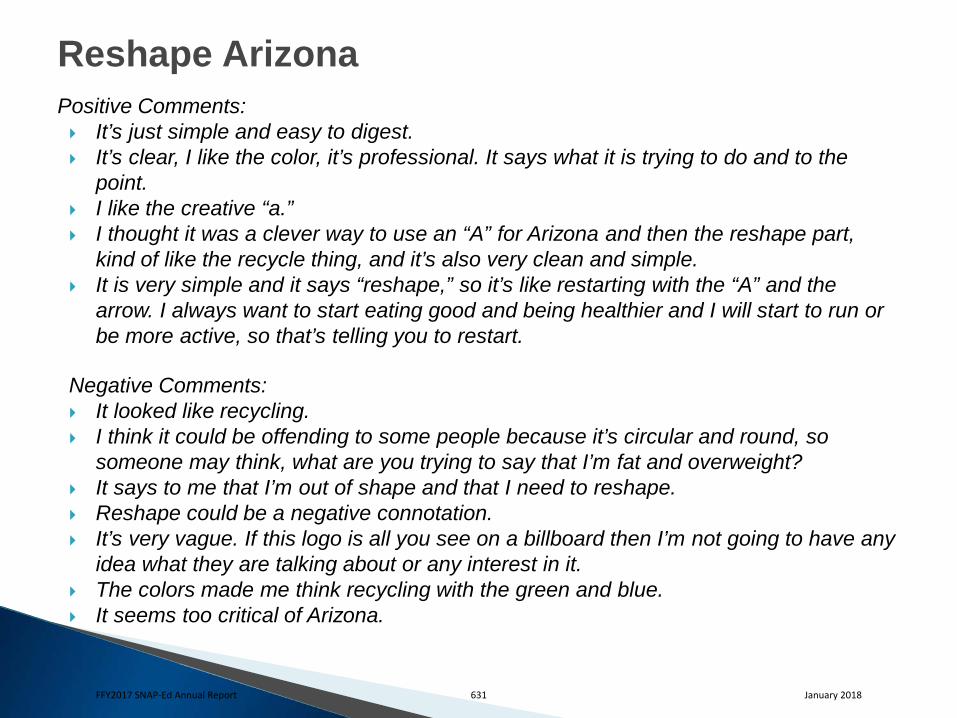
Reshape Arizona Positive Comments: It’s just simple and easy to digest. It’s clear, I like the color, it’s professional. It says what it is trying to do and to the
point. I like the creative “a.” I thought it was a clever way to use an “A” for Arizona and then the reshape part,
kind of like the recycle thing, and it’s also very clean and simple. It is very simple and it says “reshape,” so it’s like restarting with the “A” and the
arrow. I always want to start eating good and being healthier and I will start to run or be more active, so that’s telling you to restart.
Negative Comments: It looked like recycling. I think it could be offending to some people because it’s circular and round, so
someone may think, what are you trying to say that I’m fat and overweight? It says to me that I’m out of shape and that I need to reshape. Reshape could be a negative connotation. It’s very vague. If this logo is all you see on a billboard then I’m not going to have any
idea what they are talking about or any interest in it. The colors made me think recycling with the green and blue. It seems too critical of Arizona.
FFY2017 SNAP-Ed Annual Report 631 January 2018
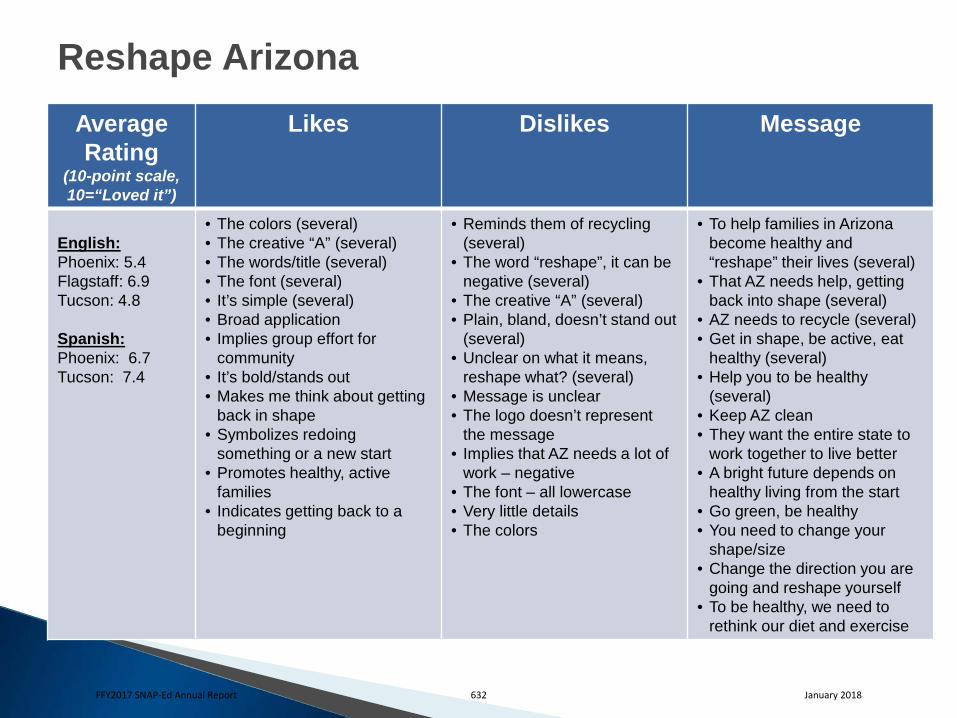
Reshape Arizona Average Rating
(10-point scale, 10=“Loved it”)
Likes Dislikes Message
English: Phoenix: 5.4 Flagstaff: 6.9 Tucson: 4.8 Spanish: Phoenix: 6.7 Tucson: 7.4
• The colors (several) • The creative “A” (several) • The words/title (several) • The font (several) • It’s simple (several) • Broad application • Implies group effort for
community • It’s bold/stands out • Makes me think about getting
back in shape • Symbolizes redoing
something or a new start • Promotes healthy, active
families • Indicates getting back to a
beginning
• Reminds them of recycling (several)
• The word “reshape”, it can be negative (several)
• The creative “A” (several) • Plain, bland, doesn’t stand out
(several) • Unclear on what it means,
reshape what? (several) • Message is unclear • The logo doesn’t represent
the message • Implies that AZ needs a lot of
work – negative • The font – all lowercase • Very little details • The colors
• To help families in Arizona become healthy and “reshape” their lives (several)
• That AZ needs help, getting back into shape (several)
• AZ needs to recycle (several) • Get in shape, be active, eat
healthy (several) • Help you to be healthy
(several) • Keep AZ clean • They want the entire state to
work together to live better • A bright future depends on
healthy living from the start • Go green, be healthy • You need to change your
shape/size • Change the direction you are
going and reshape yourself • To be healthy, we need to
rethink our diet and exercise
FFY2017 SNAP-Ed Annual Report 632 January 2018

Reshape Arizona
Average Rating (5-point scale, 5=“Strongly Agree”)
Phx Flag Tuc
Would get my attention Taught me something new Makes me think I can be more healthy, be more active, etc. Applies to me Tells me what they do Makes me want to learn more about this resource
2.84 2.42 2.86 3.21 2.63 2.89
3.44 2.67 3.67 3.44 3.00 3.50
2.89 2.22 2.56 2.56 2.33 2.83
Would get my attention Taught me something new Makes me think I can be more healthy, be more active, etc. Applies to me Tells me what they do Makes me want to learn more about this resource
3.54 3.12 3.72 3.30 3.40 3.90
NA
4.80 4.00 4.66 4.30 4.50 4.40
E N G L I S H
S P A N I S H
FFY2017 SNAP-Ed Annual Report 633 January 2018
Eating and Physical Activity
FFY2017 SNAP-Ed Annual Report 634 January 2018
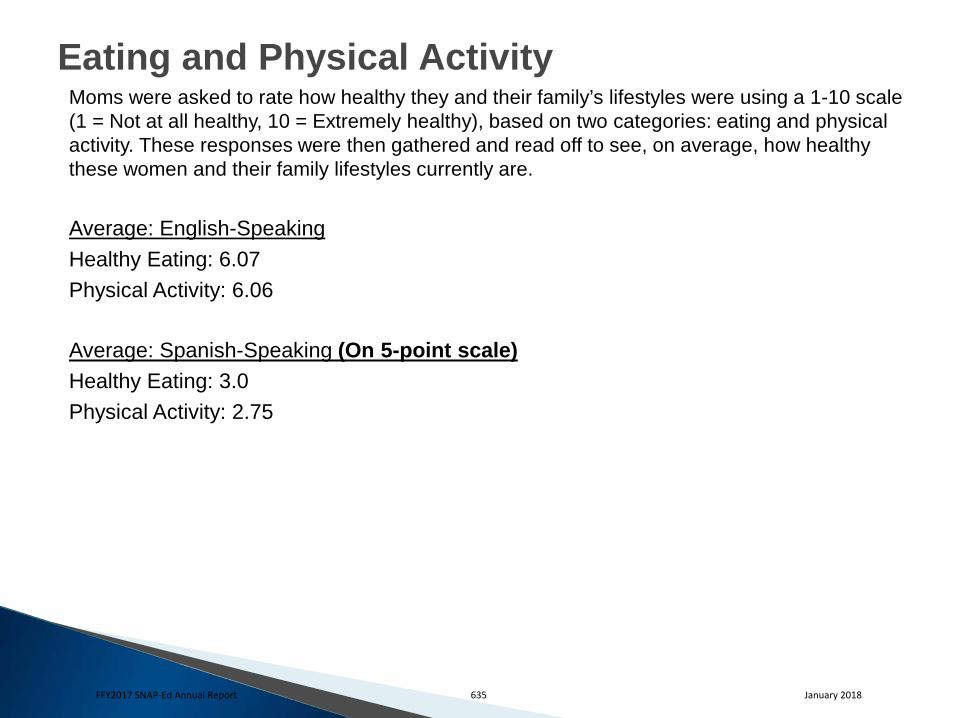
Eating and Physical Activity Moms were asked to rate how healthy they and their family’s lifestyles were using a 1-10 scale (1 = Not at all healthy, 10 = Extremely healthy), based on two categories: eating and physical activity. These responses were then gathered and read off to see, on average, how healthy these women and their family lifestyles currently are. Average: English-Speaking Healthy Eating: 6.07 Physical Activity: 6.06 Average: Spanish-Speaking (On 5-point scale) Healthy Eating: 3.0 Physical Activity: 2.75
FFY2017 SNAP-Ed Annual Report 635 January 2018
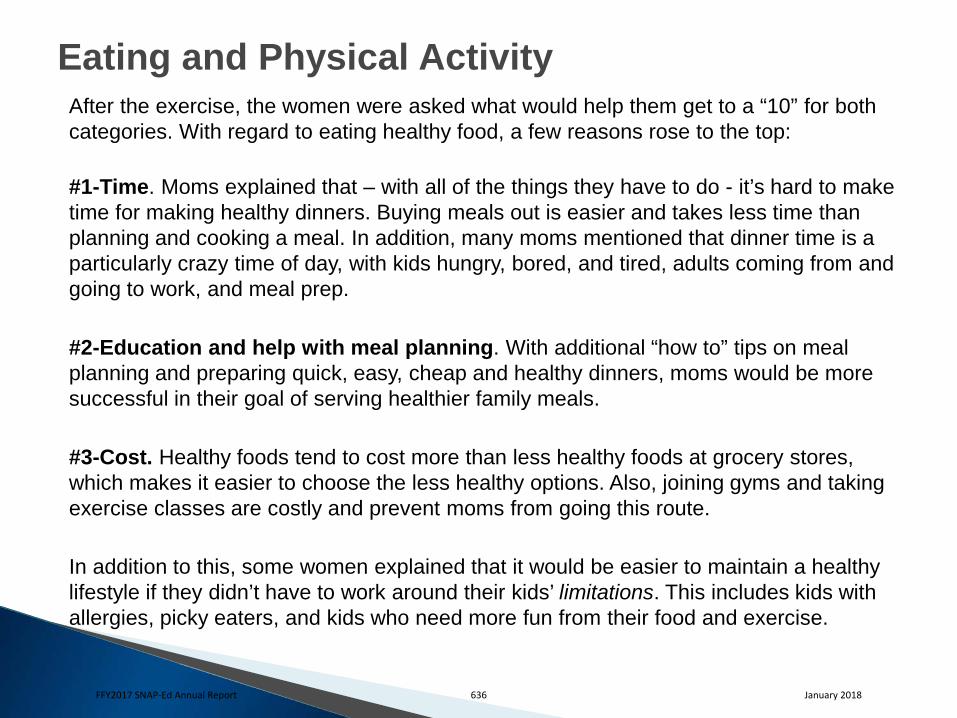
Eating and Physical Activity After the exercise, the women were asked what would help them get to a “10” for both categories. With regard to eating healthy food, a few reasons rose to the top:
#1-Time. Moms explained that – with all of the things they have to do - it’s hard to make time for making healthy dinners. Buying meals out is easier and takes less time than planning and cooking a meal. In addition, many moms mentioned that dinner time is a particularly crazy time of day, with kids hungry, bored, and tired, adults coming from and going to work, and meal prep. #2-Education and help with meal planning. With additional “how to” tips on meal planning and preparing quick, easy, cheap and healthy dinners, moms would be more successful in their goal of serving healthier family meals. #3-Cost. Healthy foods tend to cost more than less healthy foods at grocery stores, which makes it easier to choose the less healthy options. Also, joining gyms and taking exercise classes are costly and prevent moms from going this route. In addition to this, some women explained that it would be easier to maintain a healthy lifestyle if they didn’t have to work around their kids’ limitations. This includes kids with allergies, picky eaters, and kids who need more fun from their food and exercise.
FFY2017 SNAP-Ed Annual Report 636 January 2018
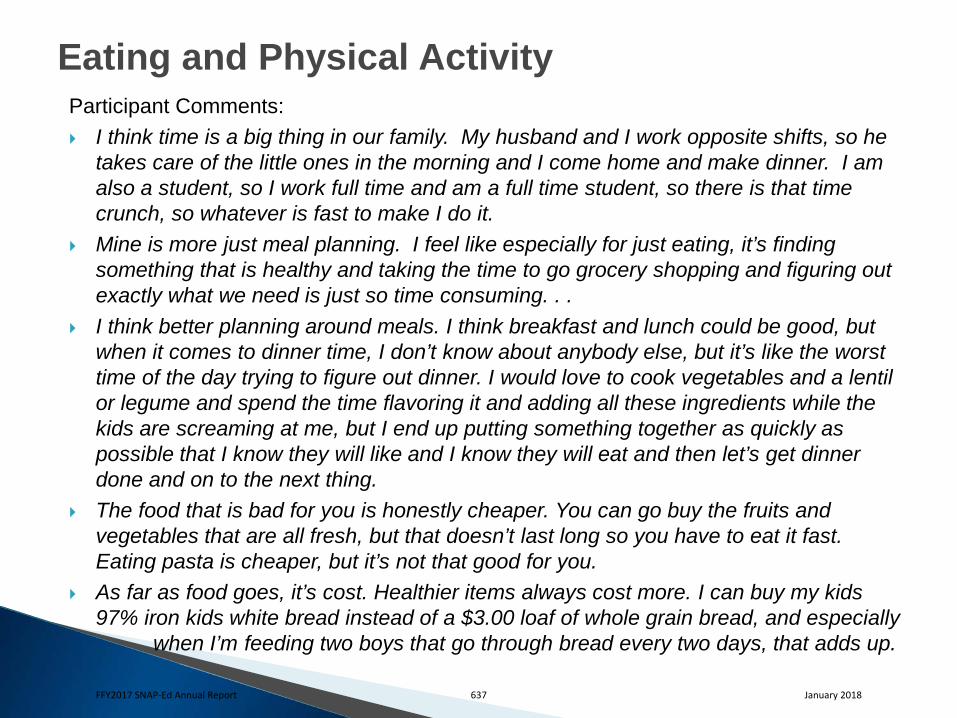
Eating and Physical Activity Participant Comments: I think time is a big thing in our family. My husband and I work opposite shifts, so he
takes care of the little ones in the morning and I come home and make dinner. I am also a student, so I work full time and am a full time student, so there is that time crunch, so whatever is fast to make I do it.
Mine is more just meal planning. I feel like especially for just eating, it’s finding something that is healthy and taking the time to go grocery shopping and figuring out exactly what we need is just so time consuming. . .
I think better planning around meals. I think breakfast and lunch could be good, but when it comes to dinner time, I don’t know about anybody else, but it’s like the worst time of the day trying to figure out dinner. I would love to cook vegetables and a lentil or legume and spend the time flavoring it and adding all these ingredients while the kids are screaming at me, but I end up putting something together as quickly as possible that I know they will like and I know they will eat and then let’s get dinner done and on to the next thing.
The food that is bad for you is honestly cheaper. You can go buy the fruits and vegetables that are all fresh, but that doesn’t last long so you have to eat it fast. Eating pasta is cheaper, but it’s not that good for you.
As far as food goes, it’s cost. Healthier items always cost more. I can buy my kids 97% iron kids white bread instead of a $3.00 loaf of whole grain bread, and especially when I’m feeding two boys that go through bread every two days, that adds up.
FFY2017 SNAP-Ed Annual Report 637 January 2018
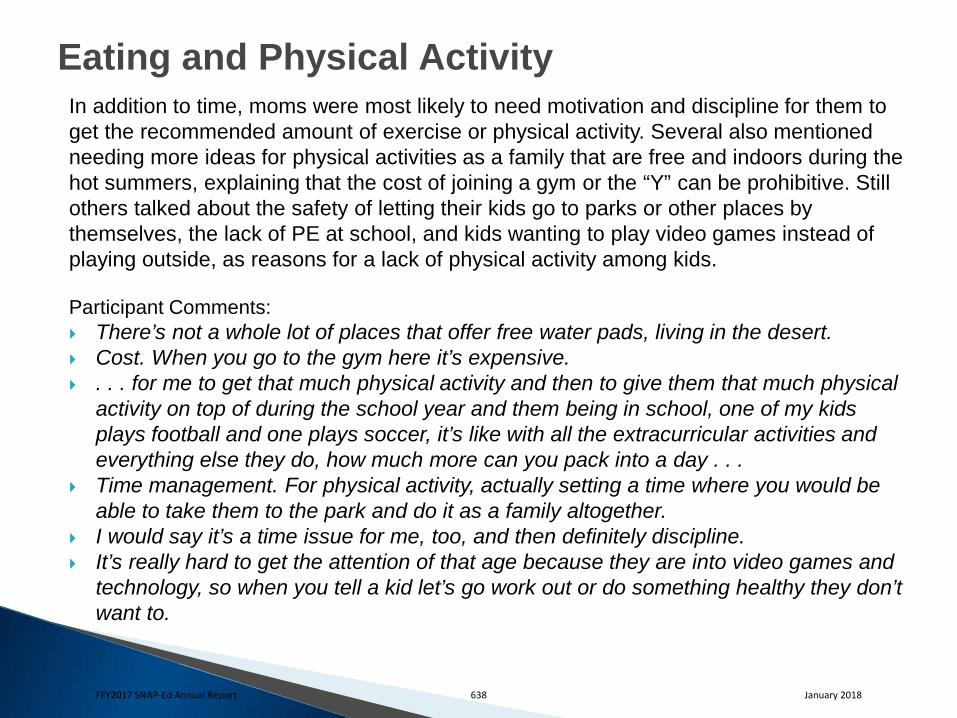
Eating and Physical Activity In addition to time, moms were most likely to need motivation and discipline for them to get the recommended amount of exercise or physical activity. Several also mentioned needing more ideas for physical activities as a family that are free and indoors during the hot summers, explaining that the cost of joining a gym or the “Y” can be prohibitive. Still others talked about the safety of letting their kids go to parks or other places by themselves, the lack of PE at school, and kids wanting to play video games instead of playing outside, as reasons for a lack of physical activity among kids.
Participant Comments: There’s not a whole lot of places that offer free water pads, living in the desert. Cost. When you go to the gym here it’s expensive. . . . for me to get that much physical activity and then to give them that much physical
activity on top of during the school year and them being in school, one of my kids plays football and one plays soccer, it’s like with all the extracurricular activities and everything else they do, how much more can you pack into a day . . .
Time management. For physical activity, actually setting a time where you would be able to take them to the park and do it as a family altogether.
I would say it’s a time issue for me, too, and then definitely discipline. It’s really hard to get the attention of that age because they are into video games and
technology, so when you tell a kid let’s go work out or do something healthy they don’t want to.
FFY2017 SNAP-Ed Annual Report 638 January 2018
Potential Website Offerings
FFY2017 SNAP-Ed Annual Report 639 January 2018
Potential Website Offerings Each group was asked what they would like to see on an ideal website for the brand they are evaluating. There were a few top responses from the women, the first being offering healthy recipes online and help with meal planning. The women also would like to see information on local activities they can go to with their kids that are not costly and get them all moving as a family. This is important in Arizona as many moms can’t find indoor activities during the hot summers. Also, the groups would like to see short videos on this website, whether it’s recipes, exercises, or even cooking classes. Some less frequently mentioned responses included offering education information about food and health, providing coupons for healthy ingredients or alerting them when healthy ingredients are on sale. Also, they would like to see some sort of interactive program on the website that records their progress and can help motivate them with new challenges. A few women would like to have some sort of online community group among moms that is local and has information for their specific area. Lastly, they would like a website that’s easy to use, organized and possibly has an app to download for quicker access.
FFY2017 SNAP-Ed Annual Report 640 January 2018
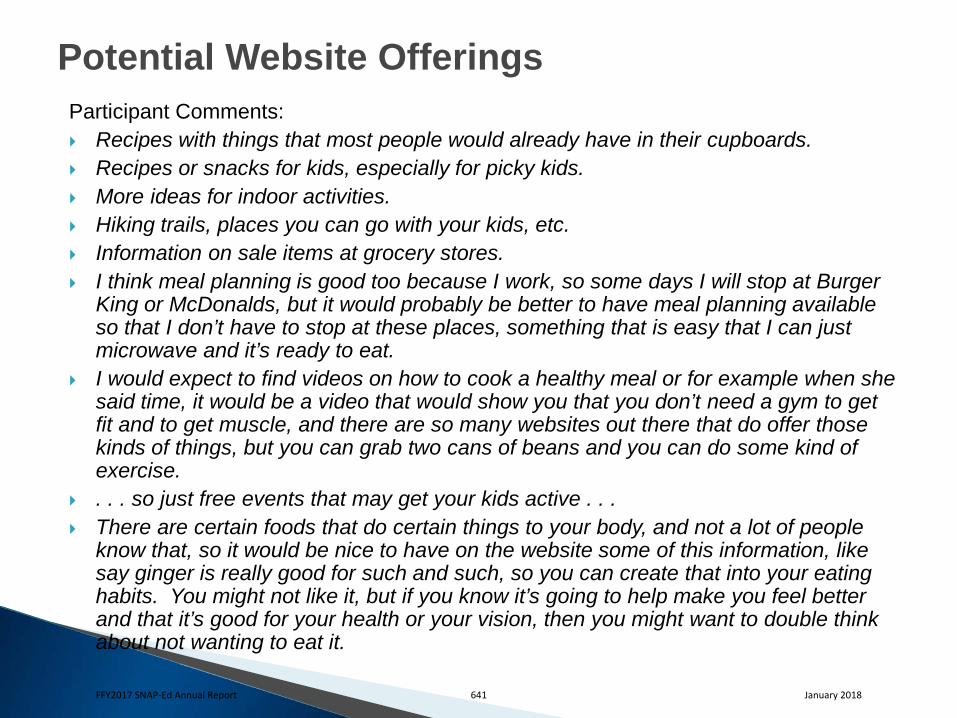
Potential Website Offerings Participant Comments: Recipes with things that most people would already have in their cupboards. Recipes or snacks for kids, especially for picky kids. More ideas for indoor activities. Hiking trails, places you can go with your kids, etc. Information on sale items at grocery stores. I think meal planning is good too because I work, so some days I will stop at Burger
King or McDonalds, but it would probably be better to have meal planning available so that I don’t have to stop at these places, something that is easy that I can just microwave and it’s ready to eat.
I would expect to find videos on how to cook a healthy meal or for example when she said time, it would be a video that would show you that you don’t need a gym to get fit and to get muscle, and there are so many websites out there that do offer those kinds of things, but you can grab two cans of beans and you can do some kind of exercise.
. . . so just free events that may get your kids active . . . There are certain foods that do certain things to your body, and not a lot of people
know that, so it would be nice to have on the website some of this information, like say ginger is really good for such and such, so you can create that into your eating habits. You might not like it, but if you know it’s going to help make you feel better and that it’s good for your health or your vision, then you might want to double think about not wanting to eat it. FFY2017 SNAP-Ed Annual Report 641 January 2018
Appendix
FFY2017 SNAP-Ed Annual Report 642 January 2018
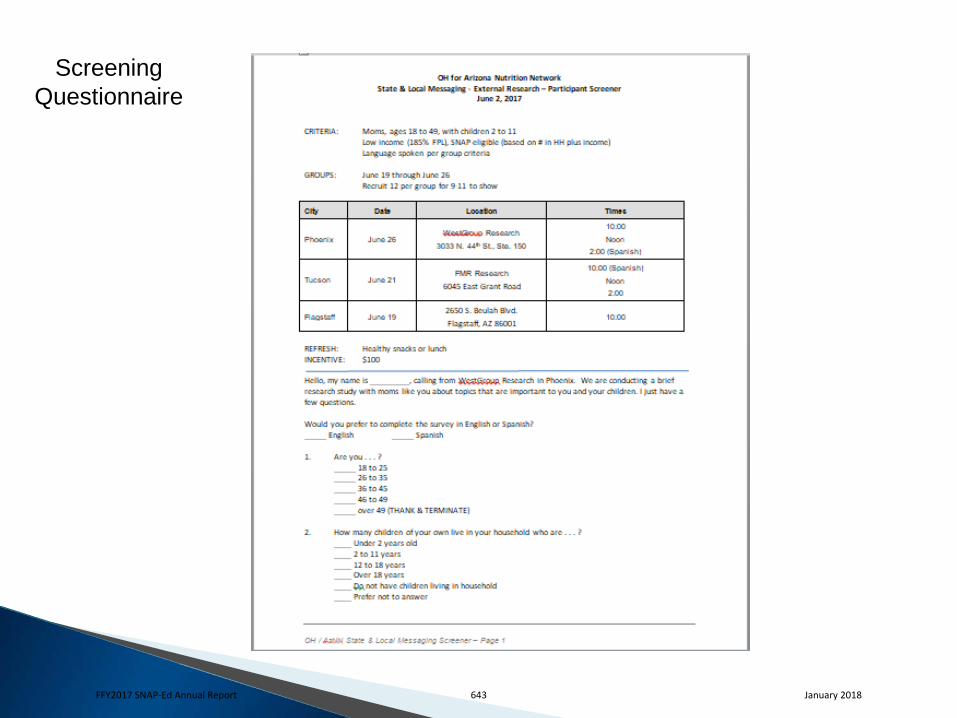
Screening Questionnaire
FFY2017 SNAP-Ed Annual Report 643 January 2018
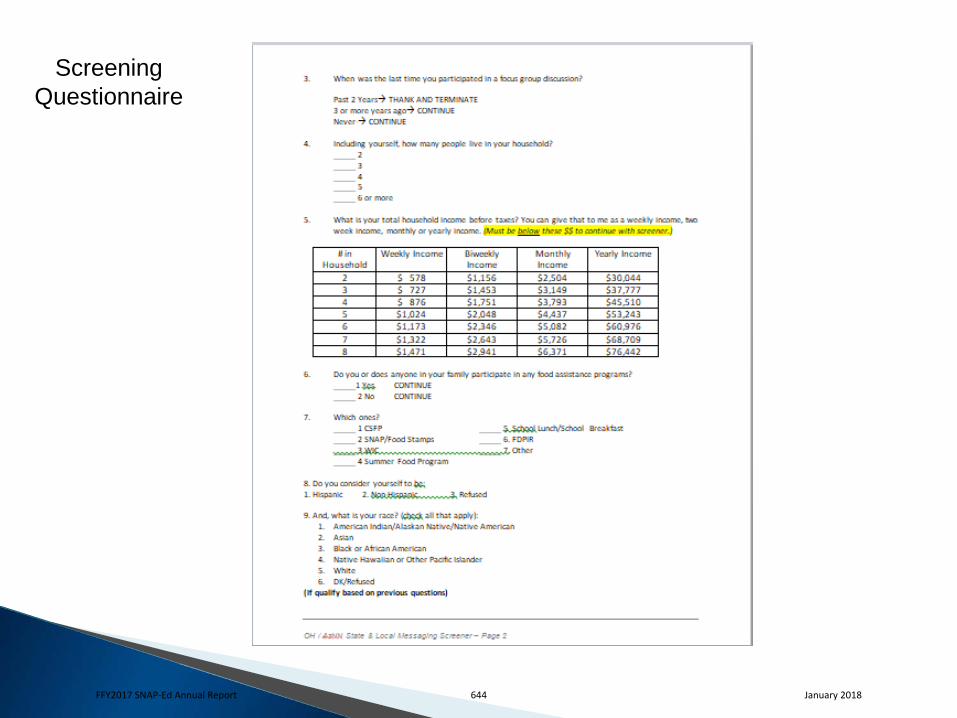
Screening Questionnaire
FFY2017 SNAP-Ed Annual Report 644 January 2018
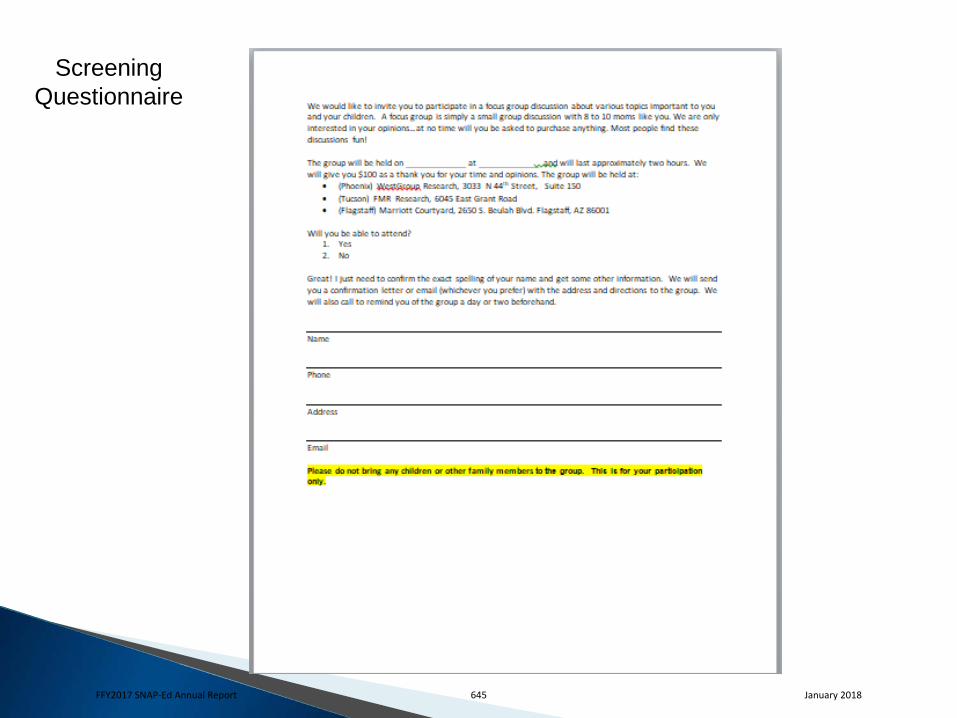
Screening Questionnaire
FFY2017 SNAP-Ed Annual Report 645 January 2018
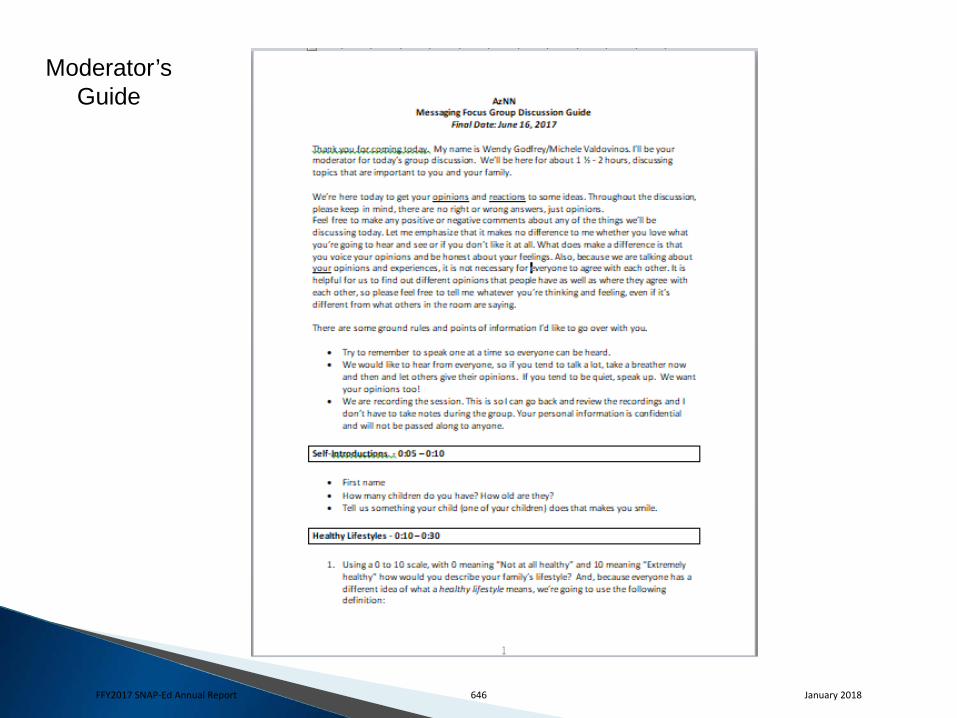
Moderator’s Guide
FFY2017 SNAP-Ed Annual Report 646 January 2018
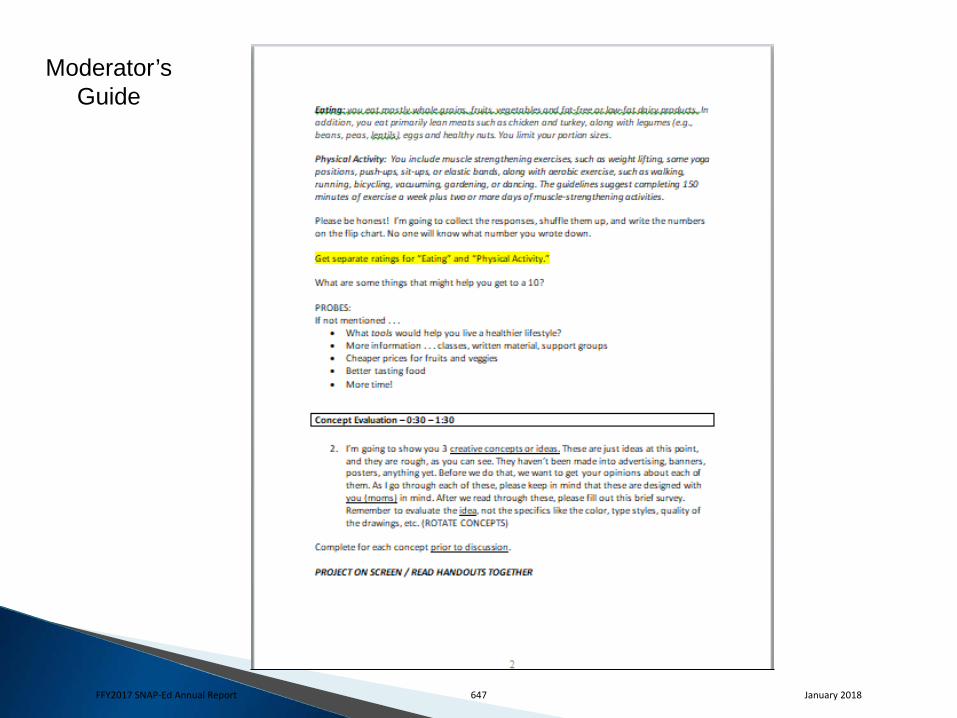
Moderator’s Guide
FFY2017 SNAP-Ed Annual Report 647 January 2018
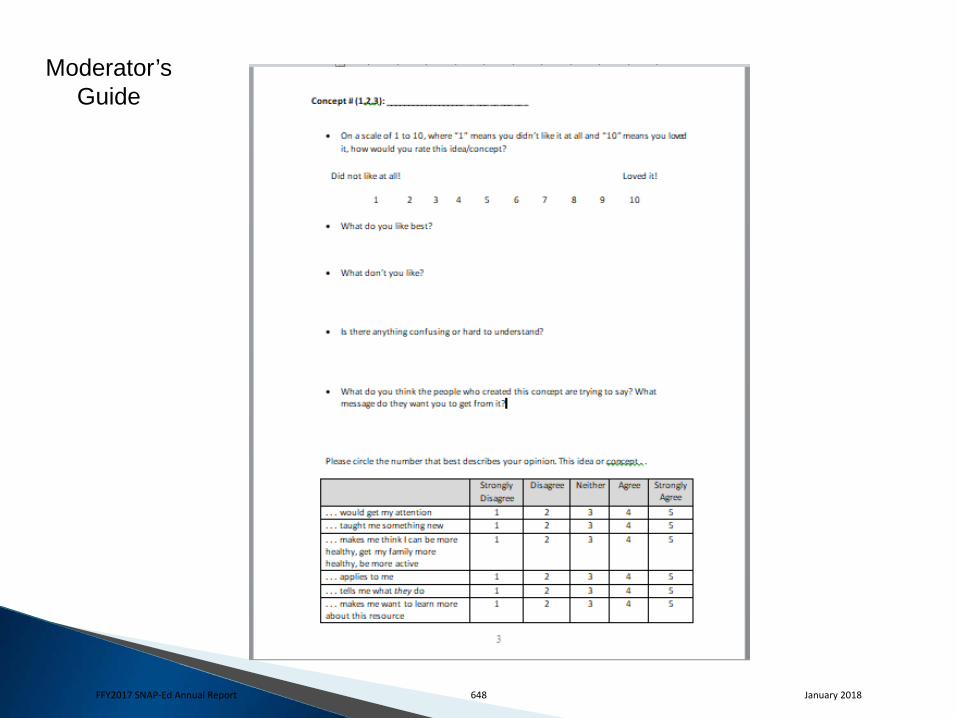
Moderator’s Guide
FFY2017 SNAP-Ed Annual Report 648 January 2018
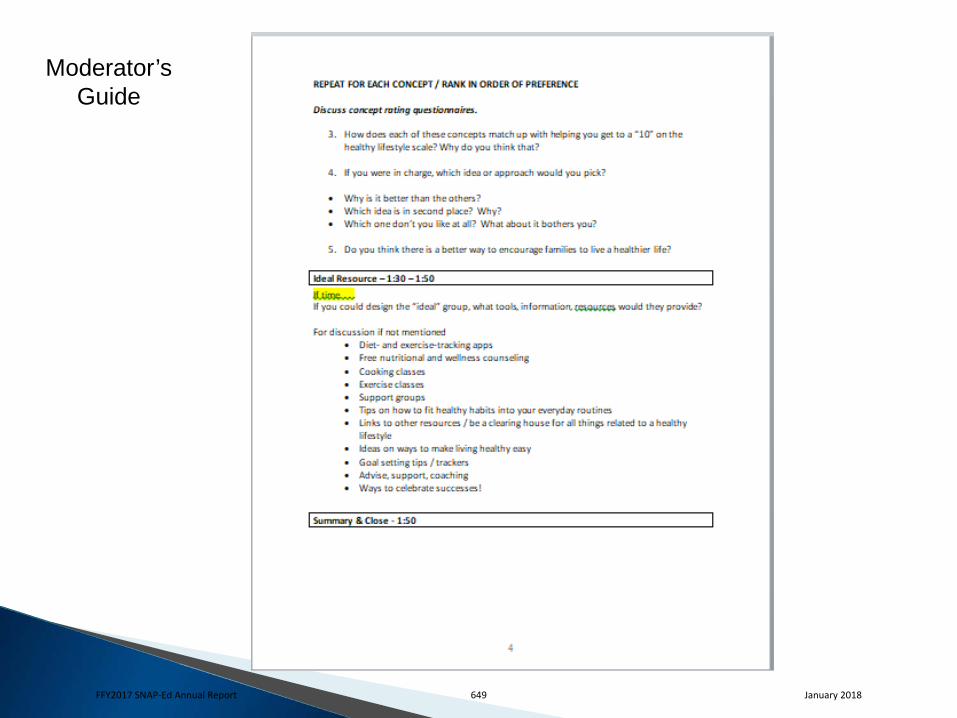
Moderator’s Guide
FFY2017 SNAP-Ed Annual Report 649 January 2018
PAGE LEFT BLANK INTENTIONALLY
FFY2017 SNAP-Ed Annual Report 650 January 2018
Appendix P
Farmers Market Map
FFY2017 SNAP-Ed Annual Report 651 January 2018
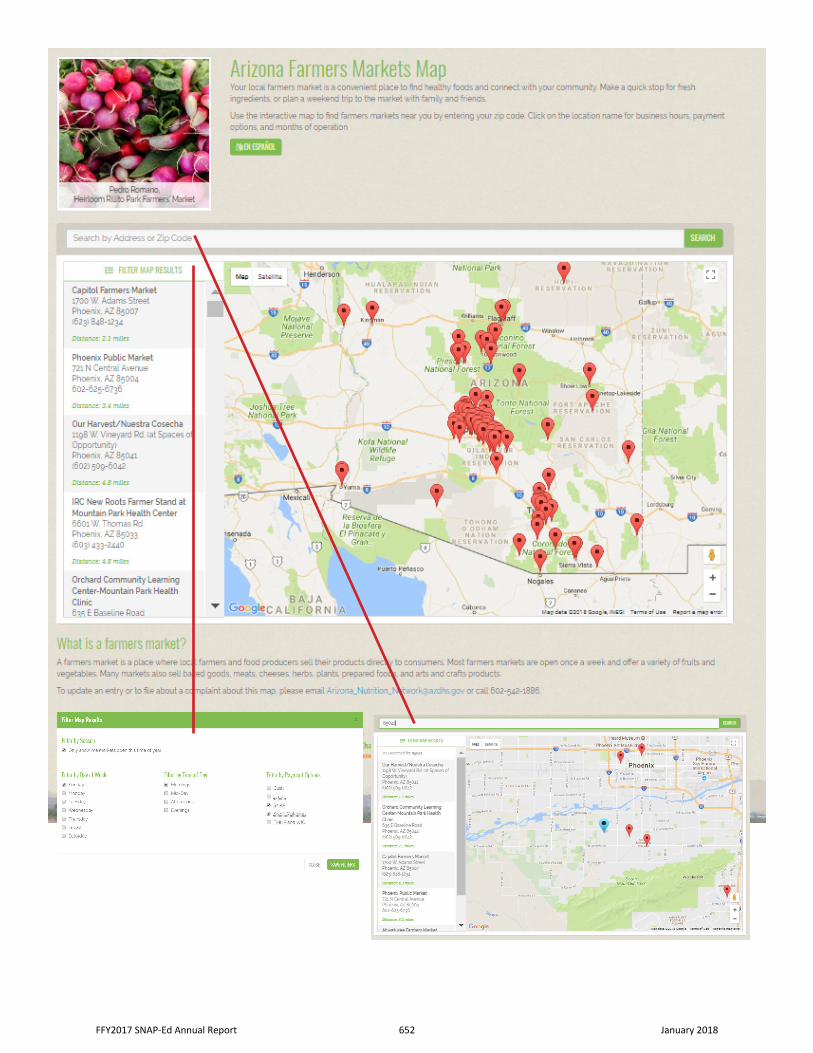
FFY2017 SNAP-Ed Annual Report 652 January 2018
Appendix Q
Annual Training Plan
FFY2017 SNAP-Ed Annual Report 653 January 2018
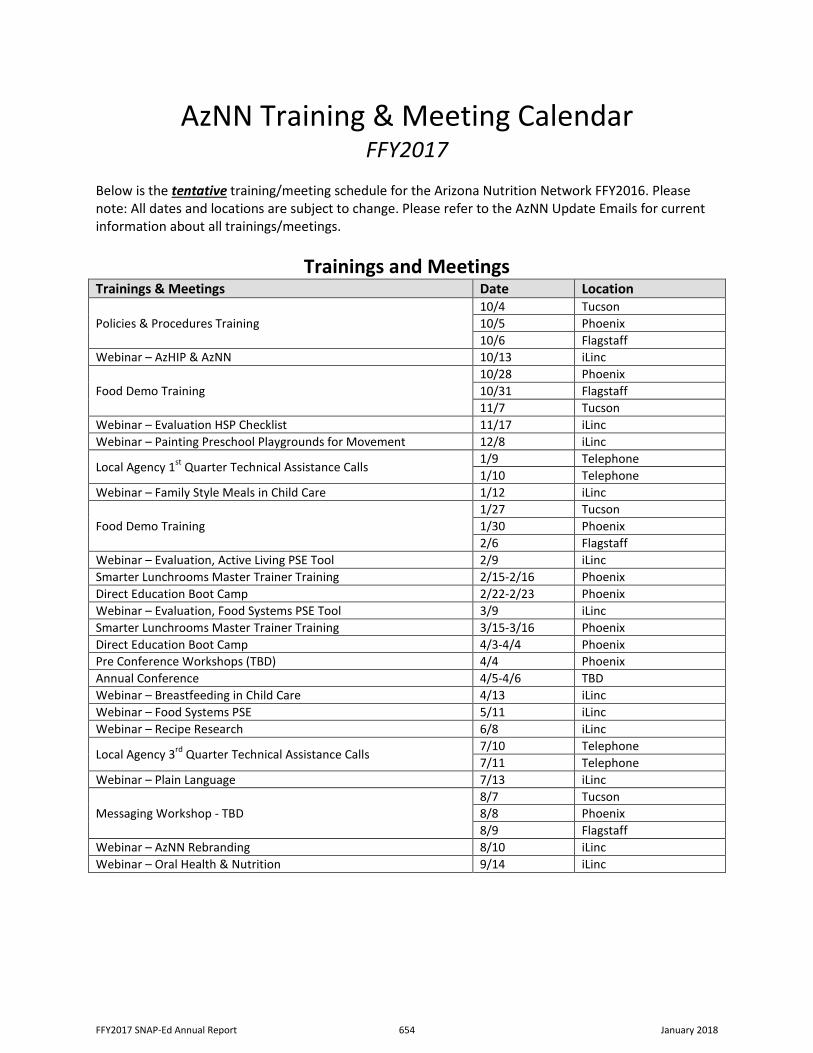
AzNN Training & Meeting Calendar FFY2017
Below is the tentative training/meeting schedule for the Arizona Nutrition Network FFY2016. Please note: All dates and locations are subject to change. Please refer to the AzNN Update Emails for current information about all trainings/meetings.
Trainings and Meetings Trainings & Meetings Date Location
Policies & Procedures Training 10/4 Tucson 10/5 Phoenix 10/6 Flagstaff
Webinar – AzHIP & AzNN 10/13 iLinc
Food Demo Training 10/28 Phoenix 10/31 Flagstaff 11/7 Tucson
Webinar – Evaluation HSP Checklist 11/17 iLinc Webinar – Painting Preschool Playgrounds for Movement 12/8 iLinc
Local Agency 1st Quarter Technical Assistance Calls 1/9 Telephone 1/10 Telephone
Webinar – Family Style Meals in Child Care 1/12 iLinc
Food Demo Training 1/27 Tucson 1/30 Phoenix 2/6 Flagstaff
Webinar – Evaluation, Active Living PSE Tool 2/9 iLinc Smarter Lunchrooms Master Trainer Training 2/15-2/16 Phoenix Direct Education Boot Camp 2/22-2/23 Phoenix Webinar – Evaluation, Food Systems PSE Tool 3/9 iLinc Smarter Lunchrooms Master Trainer Training 3/15-3/16 Phoenix Direct Education Boot Camp 4/3-4/4 Phoenix Pre Conference Workshops (TBD) 4/4 Phoenix Annual Conference 4/5-4/6 TBD Webinar – Breastfeeding in Child Care 4/13 iLinc Webinar – Food Systems PSE 5/11 iLinc Webinar – Recipe Research 6/8 iLinc
Local Agency 3rd Quarter Technical Assistance Calls 7/10 Telephone 7/11 Telephone
Webinar – Plain Language 7/13 iLinc
Messaging Workshop - TBD 8/7 Tucson 8/8 Phoenix 8/9 Flagstaff
Webinar – AzNN Rebranding 8/10 iLinc Webinar – Oral Health & Nutrition 9/14 iLinc
FFY2017 SNAP-Ed Annual Report 654 January 2018
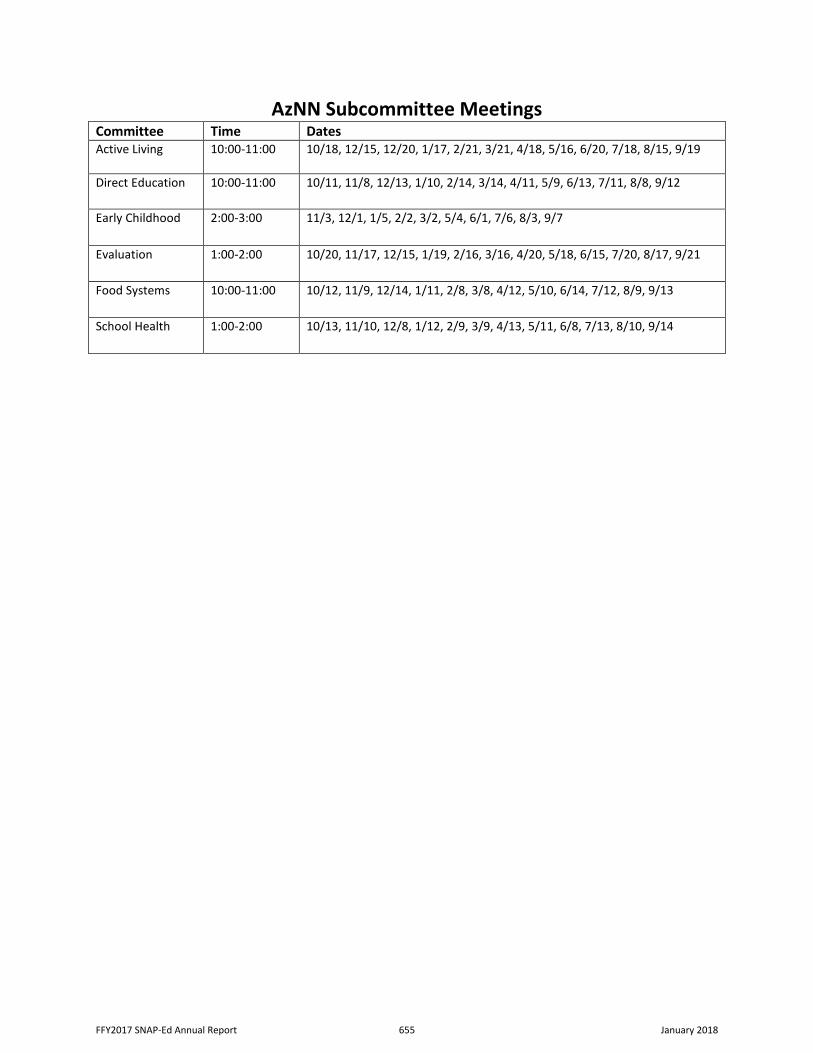
AzNN Subcommittee Meetings Committee Time Dates Active Living 10:00-11:00 10/18, 12/15, 12/20, 1/17, 2/21, 3/21, 4/18, 5/16, 6/20, 7/18, 8/15, 9/19
Direct Education 10:00-11:00 10/11, 11/8, 12/13, 1/10, 2/14, 3/14, 4/11, 5/9, 6/13, 7/11, 8/8, 9/12
Early Childhood 2:00-3:00 11/3, 12/1, 1/5, 2/2, 3/2, 5/4, 6/1, 7/6, 8/3, 9/7
Evaluation 1:00-2:00 10/20, 11/17, 12/15, 1/19, 2/16, 3/16, 4/20, 5/18, 6/15, 7/20, 8/17, 9/21
Food Systems 10:00-11:00 10/12, 11/9, 12/14, 1/11, 2/8, 3/8, 4/12, 5/10, 6/14, 7/12, 8/9, 9/13
School Health 1:00-2:00 10/13, 11/10, 12/8, 1/12, 2/9, 3/9, 4/13, 5/11, 6/8, 7/13, 8/10, 9/14
FFY2017 SNAP-Ed Annual Report 655 January 2018