Embed Size (px)
Citation preview
Aerosol Science 39 (2008) 1040–1054www.elsevier.com/locate/jaerosci
Fibrous particle deposition in human nasal passage: The influenceof particle length, flow rate, and geometry of nasal airway
Zuocheng Wanga, Philip K. Hopkea,∗, Goodarz Ahmadia, Yung-Sung Chengb,Paul A. Baronc
aCenter for Air Resources Engineering and Science, Clarkson University, Potsdam, NY, USAbLovelace Respiratory Research Institute, Albuquerque, NM, USA
cNational Institute for Occupational Safety and Health, Cincinnati, OH, USA
Received 23 January 2008; received in revised form 23 July 2008; accepted 25 July 2008
Abstract
Man-made vitreous fibers (MMVFs) have been used as a substitute for asbestos in industrial and residential applications. This shifthas raised the concerns of the potential hazards associated with inhalation of these fibers. The human nose is an important protectiveorgan that captures harmful particles and then clears them from human respiratory tract. However, studies have shown that some oreven most of the inhalable fibrous particles can penetrate human nose and deposit into the deep lung. The understanding of fibrousparticle deposition in the human nasal passage has important occupational health and possible drug delivery applications. To studythe deposition pattern and influential factors, three realistic human nasal models were used and a dielectrophoretic classifier wasapplied to generate test aerosol of glass fibers with a narrow length distribution. These models were made by using stereolithographybased on MRI data from two human subjects. Regional and total deposition efficiencies were measured for five different flowrates: 4, 8, 12, 15, and 18Lpm and four different fiber length ranges: 10–19, 20–29, 30–39, and 40–49�m. This study found thatdeposition of glass fibers (with about 1�m diameter) in human nasal passage is mainly due to inertial impaction and these fibersorientated themselves normal to the flow direction before deposition occurs. An effective aerodynamic diameter is defined such thatthe deposition efficiencies of glass fibers are comparable with those of spherical particles. Non-dimensional parameters were definedand an empirical model based on the experimental results is proposed to calculate fibrous particle deposition efficiency in humannose. Empirical expressions were also developed to estimate the pressure drop across the nasal model. Thus, empirical equationsare now available for the prediction of total deposition in the human nasal tract for the fibrous particles under constant inspiring flowrates. In addition, this study suggested that these equations can also be used to predict the deposition of spherical particles.� 2008 Elsevier Ltd. All rights reserved.
Keywords: Nasal deposition; Glass fiber; Realistic nasal model; Relaxation time; Particle deposition efficiency; Pressure drop; Friction coefficient
1. Introduction
Man-made vitreous fibers (MMVFs) are a class of insulating materials used widely in residential and industrialsettings. In some situations, these materials can release fine, airborne fibrous particles, some of which are small enough
∗Corresponding author. Tel.: +13152683861.E-mail address: [email protected] (P.K. Hopke).
0021-8502/$ - see front matter � 2008 Elsevier Ltd. All rights reserved.doi:10.1016/j.jaerosci.2008.07.008

Z. Wang et al. / Aerosol Science 39 (2008) 1040–1054 1041
Nomenclature
Amin minimal nasal cross-sectional areaAentrance cross-sectional area of nostrildh average hydraulic diameter of nasal cavityd ′h hydraulic diameter of nasal valve
da aerodynamic equivalent diameterdei//, dei⊥,deir impaction equivalent diameters for fibrous particleswith parallel alignment, perpendicular align-
ment, and random alignment to the primary direction or airflow, respectivelydes//, des⊥, desr sedimentation equivalent diameters for fibrous particles with parallel alignment, perpendicular
alignment, and random alignment to the primary direction or airflow, respectivelydf diameter of glass fibersds diameter of spherical particlesf friction coefficientL axial length of nasal modelL ′ axial length from nasal valve to the end of the nasal model�P pressure drop across nasal modelQ flow rate through nasal modelR resistance constantRe Reynolds numberStk Stokes numberU air flow velocityum average velocity across nasal modelV air flow velocity� aspect ratio of glass fiber, fiber length/fiber diameter� total displacement of spherical particle from its original streamline�0 density of water�air density of air�f density of glass fiber�s density of spherical particle� dynamic viscosity� relaxation time�+ dimensionless relaxation time
to be respirable. The potential hazards of these fibrous particles have drawn considerable concerns in recent years(Brown, 1994; Cavallo et al., 2004; LeMasters et al., 2003; Marsh et al., 2001).
Inhalation of MMVF is the dominant route of concern although effects on the skin and eyes are experienced whenhandling MMVF (Paananen et al., 2004). Fibrous particles having long, thin geometry present problems to the respira-tory tract and also to particle deposition research. The elongated geometry cause fibrous particles to behave significantlydifferent from isotropic spherical particles. The end-over-end rotation can give rise to interception deposition. The in-teraction between wall and fibrous particle has a strong potential for slowing the movement of the particle towards thewall and reduce the deposition probability. Fibers that are 200�m long had been found in human pulmonary spaces(Vorwald, Durkin, & Pratt, 1951). A recent study has shown that the deposition efficiency of fibers in a human nasalcast is generally lower than that of spherical particles (Su & Cheng, 2005). Thus, fibrous particles have an increasedprobability of penetrating into human lung. Studies on the toxicity of fibers indicate that fiber dose, fiber dimension,chemical composition, and fiber solubility in lung fluid are the primary factors determining fiber toxicity (Fubini, 1996;Hill, Beswick, & Donaldson, 1995; Lippmann, 1990, 1993).
The deposition probability for airborne fibers in a region of the respiratory tract is clearly an important factor indetermining the likelihood of disease. The results of in vitro and inhalation studies suggest that longer and thinnerfibers have great toxicity (Blake et al., 1998; Everitt, 1994). Fibers longer than 20�m are thought to be more toxic
1042 Z. Wang et al. / Aerosol Science 39 (2008) 1040–1054
because they are longer than the macrophage diameter (about 17�m) and can damage and kill macrophages (Baron,Sorensen, & Brockmann, 2001). Champion and Mitragotri (2006) have shown that particle shape, not size, plays adominant role in phagocytosis. Fibrous particles might cause macrophages to simply spread around them since theycannot fully internalize the elongated particle.
Studies of spherical particle deposition with human volunteers, physical casts, and computational fluid dynamic(CFD) simulation have been performed intensively during past three decades to understand the mechanisms andpatterns of deposition. However, limited recent studies have indicated that the deposition efficiency of fibrous particleis generally lower than that of spherical particles of comparable size (Su&Cheng, 2005). It was shown in an early study(Beeckmans, 1972) that the deposition results for spherical particles could not be applied directly to that of fibrousparticles by means of an equivalent spherical particle diameter.
Experimental studies have been performed either in vivo (human subject exposure) or in vitro (using airway replica).The deposition efficiency was generally expressed as a function of impaction parameter, d2a Q. However, Stahlhofen,Rudolf, and James (1989) studied aerosol deposition data from several laboratories on small groups of volunteers andconcluded that using the trans-nasal pressure drop instead of flow rate can better explain and eliminate some of theintra- and inter-individual scatter of the data. Swift’s group (Kesavanathan, Bascom, & Swift, 1998; Kesavanathan &Swift, 1998) used more than 10 human subjects to investigate the effects of particle size, flow rates, nostril shape,and nasal passage geometry on human nasal particle deposition with aerodynamic regime particles. They showed that,besides particle diameter and air flow rates, nostril dimensions, and minimum nasal cross-sectional area (Amin) alsosignificantly affected the particle deposition efficiency (PDE). However, even after inclusion of ellipticity of nostril(nostril length towidth ratio) and Amin in PDE equations, there still remained a large intersubject variation in deposition.They concluded that aerosol deposition in the nasal passage has been difficult to predict and suggested further studiesshould evaluate the effect of other parts of the nose in deposition.
Physical models using realistic replicas of the nasal passage based on MRI files have become an accepted methodin particle deposition study in recent years. Such models can accurately replicate the nasal vestibule, nasal valve, theanterior nasal chamber, the main chamber with the turbinates, and the nasopharynx. Physical models can be challengedby various experimental conditions without raising human subjects issues. Another advantage of using physical modelsis that it is possible to investigate morphological factors with fixed geometry size and shape of each model. Multiplemodels are necessary to achieve this goal.
Although several studies of fibrous particle deposition have been performed with human nasal casts, further experi-mental studies are necessary to include different kinds of particles and a variety of nasal models. Gradon and Podgorski(1992) used a head airway cast prepared from a three-dimensional (3D) tomographic picture of a healthy human adult.The cast consisted of two longitudinal sections. Monodisperse glass fibers with diameter 0.8�m and aspect ratios,� = 10, 20, and 40, were used. Their results showed that total deposition fractions increased with the fiber length andflow rate. The orientation of deposited fibers mostly followed the direction of gas flow. Secondary flow was observedin the main passage (the turbinate region) where the orientation of deposited fibers was random.
Fibrous particle deposition in humannasalmodelwas also investigated by other researchers (Su&Cheng, 2005). Totaldeposition efficiency for both the carbon fibers and spherical particles were measured producing two distinguishablecurves. Kelly, Asgharian, Kimbell, andWong (2004) used a nasal model that was also derived from the sameMRI scansas the one used by Su and Cheng (2005). However, the Su and Cheng (2005) carbon fiber deposition values generallycan be made to match with the spherical particle values reported by Kelly et al. (2004) if an aerodynamic equivalentdiameter is calculated for the carbon fibers using the equation suggested later in this report.
The purpose of the present study is to investigate the transport and deposition efficiencies of glass fibers in threehuman nasal models. Influential factors were investigated and empirical expressions are proposed to better predictparticle deposition. Several sized spherical particles were used to compare with the glass fiber results and with theempirical equation.
2. Nasal model
Human nasal models (models I–III) were developed from MRI images into the computer-aided design (CAD)drawings needed for stereolithography. The geometry of first model (model I) has been used in a CFD simulationof nasal deposition (Zamankhan et al., 2006). These models extend from the nostril entrance to the beginning of thenasopharyngeal passage. Each model has only one of the two nasal cavities. Model I represents the right side nasal

Z. Wang et al. / Aerosol Science 39 (2008) 1040–1054 1043
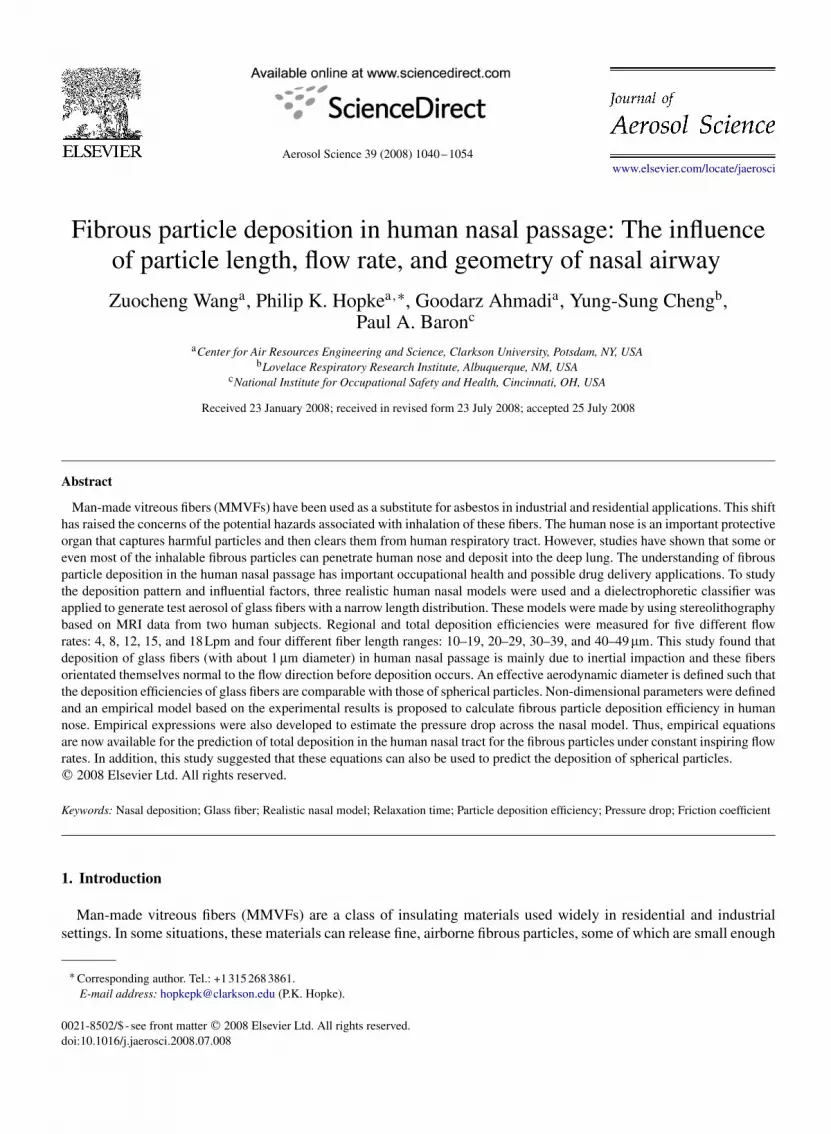
Fig. 1. Rendered image of nasal models II and III showing passage contours.
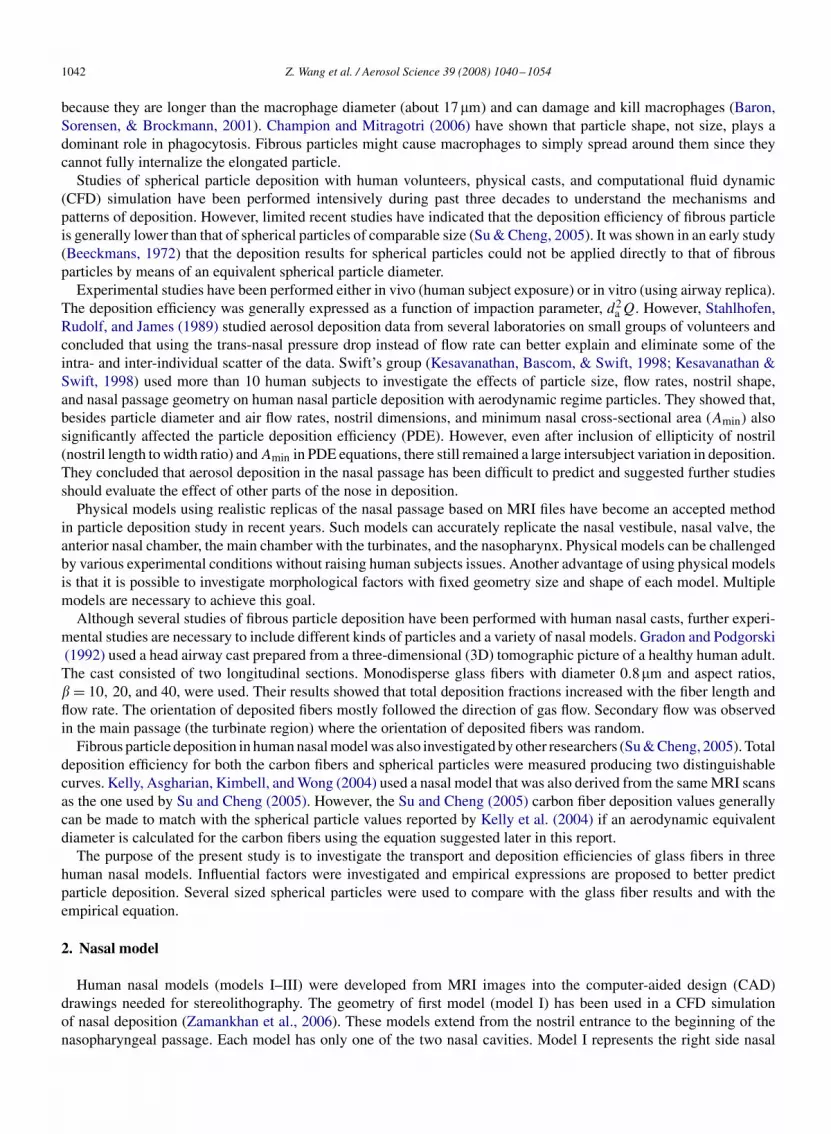
Fig. 2. Completed nasal model II showing deposition of the sodium fluoroscein particles.
cavity of an adult subject while models II and III represent the left and right sides, respectively, of another adultsubject.
The data files contained cross-sectional profiles with a 3mm distance between adjacent profiles. Commercial 3Dsurface reconstruction software was tried initially, but it was found that the surfaces were either not smooth or notcontinuous because of the 3mm gap between neighboring layers. Thus, the detail design had to be done manuallyand the software was used to assist in creating the surfaces and volumes. The surface of human nasal cavity can beapproximated by free-form body shapes. The fundamental way to construct a free-form surface is to construct a setof wires that depict the profile and silhouette of surface and then let software generate surfaces on the frameworkof wires. The MRI coronal profiles were first imported into Gambit and then these curves were smoothed by usingthe non-uniform rational B-spline (NURBS) line command. About 25 control points were determined on each layer.

1044 Z. Wang et al. / Aerosol Science 39 (2008) 1040–1054
Wherever there was a singular structure in any profile, that singular point was a control point in this profile and anyother layers should have a corresponding point. This is the criteria for the control points. Because of the complexityof the main airway, the identification of control points in this part proved to be critical and difficult. After all controlpoints had been chosen, axial wires were generated by connecting corresponding points from layer one to the last layerusing NURBS lines. Modification were performed in several points where some curves crossed with each other. Toaccurately represent free-form smooth surfaces in 3D, a higher order spline surface called NURBS surface is used.A NURBS surface uses NURBS mathematics to define a set of control vertices and a set of parameters. The mosttime-consuming job in surface regeneration from MRI files is making the wires. After the surface regeneration, all thesurfaces were stitched into a volume. The negative cavity images of models II and III are shown in Fig. 1. Nasal hairsthat normally line a human’s nostrils were omitted. The solid image data becomes a cavity when subtracted from asolid volume. Entrance and exit adaptors were also designed for the connection to the tubes for experiments.
The volume with internal cavity is then converted into a standard triangulation language (STL) file. A 3D Sys-tems Viper Si2� SLA system at Clarkson was used to construct these physical models, each of which has threesections (Fig. 2). The nasal models were manufactured at high resolution with the build layers (lateral resolution)of 0.051mm, dual-spot laser diameters (coronal resolution) of 0.102mm. The material used for the model is DSMSomos� Watershed � 11120, a low viscosity photopolymer.
3. Experiment description
3.1. Pressure drop measurement
The pressure drop across each model was measured in two flow directions: inhalation and exhalation. Under constantflowmeasured with a Gilibrator 2 (Gilian Instrument Corp.), the pressure difference wasmeasured using capillary tubesinserted through adaptors into the entrance and exit of the nasal model. A pressure transducer (AutoTran IncorporatedModel 860) was used to measure the pressure difference. The transducer was calibrated using a “C” type micromanometer (E. Vernon Hill & Co.).
3.2. Nasal deposition
Glass fibers of 1�m diameter were used to generate the aerosol. A dielectrophoresic fiber classifier (Wang et al.,2005) was used to narrow the length distribution of fibrous particles and highly charged particles were removed by thestrong electric field within the classifier.
The experimental system included the glass fiber aerosol generator, air humidification system, the fiber lengthclassifier, and the nasal model. A schematic of the experimental setup is shown in Fig. 3. JM-100 glass fibers wereused in the study that were made of JM-475 glass (Johns Manville Corporation). The average diameter of the fiber is1.03 ± 0.45�m. The density of the glass is 2.56g/cm3. The preparation and generation of the glass fiber aerosol wasdescribed by Wang et al. (2005). Length classified glass fibers exit the fiber classifier and were then introduced into adiluter where additional clean air was added to reach desired flow rate passing through the nasal model. A leak test wasperformed before each experiment to assure the proper seal of the nasal model. The relative humidity of the air wascontrolled at 30–40%. A thin layer of silicon oil (Dow Corning 550 by Dow Corning Co.) was applied to the inner wallof each nasal model to capture any deposited fibers. A membrane filter was placed at the exit of the model to collecttransmitted fibers. After each runs, the nasal models were divided into sections and washed with isopropanol undersonication. The resulting solution was filtered through a Millipore AA type membrane. The membrane was opticallycleared by vaporized acetone. The quantity of the deposited fibers was ascertained using phase contrast microscopyfollowing NIOSHmethod 7400 (Baron, 1994). Each section was washed twice using same amount solvent. The numberof fibers in the second wash was less than 5% of the first wash.
210Po ionizing units (Staticmaster) were used in to neutralize the glass fibers before they entered the classifier. Thefibrous particle aerosol from fiber classifier was also conducted into a aerosol electrometer (TSImodel 3068) to quantifythe static charge carried by the particles. However, there was no current detected. The charges carried by test fibersshould be minimum and have little influence on the deposition efficiency.
Glass fiber deposition was studied at five flow rates: 4, 8, 12, 15, and 18Lpm and four fiber length range: 10–19,20–29, 30–39, and 40–49�m. Different ranges of fiber length were achieved by adjusting the operational parameters of

Z. Wang et al. / Aerosol Science 39 (2008) 1040–1054 1045
Hopper
HygrometerProbe
A1
Flexible Tubing
PowderOverflow
Humidifier System
VacuumControl To Vacuum
Source
V1
V2
V1
A3Air Source
B1
B2
A1
A2
A3
A4FlowControl
AgingChamber
F1
B3 F2
Neutralizer
A2
FiberLengthClassifier
Dilutor
NasalModel
Sampler
V2
A4
FiberGenerator
Fig. 3. Schematic diagram of experimental setup.
the fiber classifier. Flow rates greater than 18Lpm were not studied since people generally switch from nasal breathingto oronasal breathing when breathing rate exceeds 18Lpm per nostril.
Monodisperse uniform latex microspheres of 3.09�m in diameter (Duke Scientific) were also used to investigatethe deposition of spherical particles in these nasal models. A tri-jet aerosol generator (TSI 3460) was used for theaerosol generation. In addition, sodium fluorescein particles with the aerodynamic diameters between 4 and 6�mwere generated using a vibrating orifice aerosol generator (TSI 3450) for challenging nasal model II. Total depositionefficiencies were measured for flow rates of 10, 15, and 20Lpm. Two particle counters, one Climet CI-226/CI-210 andone TSI 3321, were used to detect the particle number concentration before and after each nasal model. These twoparticle counters were carefully calibrated at different flow rates.
4. Results and data analysis
4.1. Pressure drop and deposition efficiency
The pressure drops across each nasal model for constant inspiratory flow are shown in Fig. 4. The measured valuesfor model I are much higher compared to models II and III. The sizes of profiles in each of the 3mm thick slices in

1046 Z. Wang et al. / Aerosol Science 39 (2008) 1040–1054
Fig. 4. Measured pressure drop across each of the nasal models as a function of flow rate.
the MRI image were used to define the general size of the nasal model. The average hydraulic diameters of each MRIprofile were calculated. The hydraulic diameter of each profile is defined as four times of cross-sectional-area of eachlayer divided by the perimeter of that profile. Comparing hydraulic diameters among the nasal models, it was foundthat the passage in model I was much narrower: model I has a hydraulic diameter of 1.9mm while models II and IIIdiameters are 2.46 and 2.36mm, respectively. The values for inspiration and expiration do not differ significantly. Thepressure drop data of each model can be readily fit by Rohrer equation:
�P = k1Q + k2Q2 (1)
where k1, k2 are empirical constants. The first term on the right-hand side of Eq. (1) represents the pressure dropresulting from viscous resistance. The second term arises from convective acceleration (Otis et al., 1956). Morerecently, it has been suggested that the first term represents the contribution of laminar flow and the second termrepresents the contribution of turbulent flow (Solow & Sandham, 1991). If flow rate Q is in units of Lpm and �P inPa, Rohrer coefficients k1 and k2 for models I, II and III are 131 and 1712Pa/Lpm; 141 and 625; 156 and 684Pa/Lpm2,respectively. The first coefficients of all three models have very similar values while the second coefficient for model Iis considerably larger than those of the other two. This difference implies that the flow in nasal model I is more turbulentthan in the other two.
The deposition efficiencies were very low at flow rate of 4Lpm inmodel I and 8Lpm inmodels II and III. Consideringthe particle counting errors, the results are essentially zero and are not reported here in detail. The three models showsimilar regional deposition patterns and results for model I are discussed here. The regional deposition efficienciesof model I are presented in Fig. 5. Regional deposition efficiency is defined as the ratio of the number of depositedfibers to the total fiber number entering that section. The results indicate that deposition efficiency is relative higher inregion II. Several factors might contribute to the enhancement of the deposition in this region, including the presenceof turbinate, the minimum nasal cross-sectional area, and the change of flow direction. A CFD study (Zamankhanet al., 2006) has shown that most of the flow occurs through the inferior meatus, middle meatus and the region betweenthe middle and the inferior meatus in the septum side of the section. According to the flow field simulation, most of theair flow enters the nostril in an almost vertical direction and then undergoes two distinct turns resulting in an almosthorizontal direction at the exit of the model. Thus, the airstream within the nasal model shows a somewhat downward“bend” as it traverses the passage. For particles in the inertial regime, it is anticipated that relative high depositionefficiency in this area will be caused by inertial impaction. The nasal valve, working as a orifice or Venturi throat,introduces flow disturbance to the downstream area. The accompanying inertial eddies between the nasal turbinatesand septum in a human nose will facilitate humidification of the air and particle capture.
The total deposition efficiencies of these three nasal models are shown in Fig. 6 as a function of flow rates. Thedeposition efficiency increases as the flow rate or fiber length increases. This trend of deposition indicates that inertia

Z. Wang et al. / Aerosol Science 39 (2008) 1040–1054 1047
Fig. 5. Deposition efficiency of each section of model I at different flow rates for the fiber lengths from: (a) 10 to 19�m, (b) 20 to 29�m, (c) 30 to39�m, and (d) 40 to 49�m.
impaction is the dominant mechanism. As mentioned previously, models II and III represent the two sides of the samehuman subject. The shape and geometry of these two cavities are not identical, but sufficiently close enough to givecomparable deposition efficiencies under similar conditions.
The deposition efficiency of model I is significantly higher than those of models II and III. At least two reasonscan explain these differences. One is the narrowness of the airway of model I, which gives rise to high flow velocityand more particle inertia as they separate from the airstream. The other possible reason is the sinusoidal surfaceprofile of model I. The undulating surface profile can enhance turbulence as well as providing more impaction surfacearea.
4.2. Aerodynamic diameter
For large particles where inertia is the primary deposition mechanism and molecular slip can be assumed to be in-significant, then the total radial displacement of the particle from its original streamline can be expressed approximately

1048 Z. Wang et al. / Aerosol Science 39 (2008) 1040–1054
Fig. 6. Total deposition efficiency of each model under different flow rates for the fiber length from: (a) 10 to 19�m, (b) 20 to 29�m, (c) 30 to 39�m,and (d) 40 to 49�m.
as follows (Hinds, 1999):
� = �
2�U = �sd
2s
18�· �U
2= �0d
2a
18�· �U
2(2)
Thus, the magnitude of inertial deposition is proportional to particle relaxation time. It also implies that the productof squared aerodynamic diameter and flow rate can be used in the analysis of particle impaction deposition in humanairway. For fibrous particle, similar results can be obtained with the inclusion of a shape factor.
For fibrous particle deposition, a simple way to model the real complex trajectories and predict the depositionefficiency is the application of equivalent particle diameters. In this study, the glass fiber loss within human nasalmodel was mainly caused by inertial impaction. Thus, equivalent diameter for impaction should be obtained andused for deposition prediction. However, according to the theoretical considerations of Harris and Fraser (1976) andYu, Asgharian, and Yen (1986), the inertial impaction equivalent diameters for fibrous particles were assumed the sameas the sedimentation equivalent diameters regarding the same fiber orientations with respect to the primary directionof airflow (Balásházy et al., 2005):
(I) parallel alignment, dei// = des//,(II) perpendicular alignment, dei⊥ = des⊥,(III) random alignment, deir = desr.
The sedimentation equivalent diameter was derived based on fiber settling in the gravity field, which is identical tothe aerodynamic diameter (Balásházy, Moustafa, & Hofmann, 1990). The concept of aerodynamic diameter was alsoused by other researchers in the studies of fibrous particle deposition in human airways (Myojo, 1987; Su & Cheng,2005). For simplification, the concept of aerodynamic diameter is also used in this study and equations of aerodynamicdiameters for glass fiber were obtained and used. The influence of the density of air and slip correction were neglectedconsidering the relative dense density and sizes of glass fibers. These equations were developed from the results of the

Z. Wang et al. / Aerosol Science 39 (2008) 1040–1054 1049
Fig. 7. Comparison of deposition efficiencies for glass fibers and spherical particles using the inertial parameter.
“point force approximation” technique that uses a polynomial approximation for the distributed line force along theaxis of a large aspect ratio body (Clift, Grace, & Weber, 1978).
For a fiber moving normal to the direction of flow,
da = 3df4
√2�f [ln(2�) + 0.19375]/�0 (3)
For a fiber moving parallel to the direction of flow,
da = 3df2
√� f [ln(2�) − 0.80685]/�0 (4)
For a fiber with random orientation,
da = df2
√6�f [ln(2�) − 0.30685]/�0 (5)
For the same material and diameter, particles with a cylindrical shape experience more resistance compared tospheroid with same aspect ratio for the same orientation because of the blunt ends. However, the resistance differencebetween these two particle types decreases as the aspect ratio increases because the influence of the blunt ends becomesrelatively insignificant.
From Eqs. (3)–(5), it can be seen that orientation is important in determining the aerodynamic diameter. Thus it iscritical to determine the orientation of glass fibers when impaction deposition occurs in the nasal models. The depositionof monodisperse spherical particles was also measured. The deposition efficiencies of both the glass fibers and sphericalparticles are plotted in Fig. 7 as a function of the impaction parameter, d2a Q. The aerodynamic diameters of glassfibers were calculated and used in the impaction parameter for an orientation of moving normal to the flow direction.Fig. 7 shows that the values for the glass fibers generally match those of spherical particles for each nasal model. Thisalignment of these data suggests that glass fibers orientated themselves normal to the flow direction before impactiondeposition happened. In addition, it appears that interception, which might be important in other situations, such asturbulent deposition, does not play an important role in glass fiber deposition in these models.
The phenomenon that, irrespective of the initial orientation, fibrous particles ultimately align their major axes nearlyparallel to the wall as previously observed by Fan and Ahmadi (1995) and Broday, Fichman, Shapiro, and Gutfinger(1997). Thus, it is reasonable to use an equivalent aerodynamic diameter to analyze the deposition efficiency ofnoninteracting fibrous particles.

1050 Z. Wang et al. / Aerosol Science 39 (2008) 1040–1054
4.3. Empirical equation for deposition of glass fibers
Many empirical equations of particle deposition in human nasal airway have been proposed. However, most of theexperimental investigations were performed on a single nasal model. These empirical equations normally contain onlythe inertia parameter, d2a Q. Nasal geometry has a significant influence on the flow field within the cavity and the flowfield determines the particle deposition pattern. An empirical equation including nasal anatomical information couldimprove the understanding of the factors affecting the particle deposition across a variety of geometries, and improvethe estimation of the delivered dose of particles to the lung. Cheng (2003) has shown that the area of nasal valve canbe used to explain the deposition difference between an adult and an infant.
According to Su and Cheng (2005), more than 40% of carbon fibers were deposited in the vestibule region forthe median inspiratory flow rate of 15Lpm. Thus, a Stokes number based on vestibule structure was chosen forparameterization and defined as
Stk = �0d2a Q
�A1.5entrance
(6)
where Aentrance is the cross-sectional area of nostril.The nasal valve is a unique structure in nasal passage. It can boost particle deposition dramatically due to wakes
and flow disturbance occurring behind the obstruction structure. According to the present research, PDE in this regionincreases with the increase in particle aerodynamic diameter and flow rates. Thus, a locally defined Stokes number canalso be used as a parameter to model particle deposition in the nasal valve region. However, it should be pointed outthat the “jet” flow after nasal valve is not directed immediately to an impaction surface and a Stokes number might notbe easily defined for different flow patterns within different nasal models. Kim, Lewars, Eldridge, and Sackner (1984)investigated particle deposition in a straight tube with obstructions such as orifice structure. They found a dimensionlessrelaxation time including pressure drop could be used to better define the deposition velocity despite the differences inflow structure. The pressure drop across the nasal model includes two effects: the kinetic energy change and total headloss. The total head loss is the sum of major loss due to frictional effects in fully developed flow in constant area tubes,and minor losses due to entrances, flow direction changes, area changes, and so on (Fox & McDonald, 1999). Thus,the pressure drop may indicate the nasal constriction and could be an index of PDE in nasal airway. Under normalconditions, the nasal valve is the smallest passage for total respiratory airflow in any part of the respiratory and it createsmuch of the pressure drop (Proctor & Andersen, 1982). According to Dishoek (1965), the nasal valve is responsiblefor 70% of nasal pressure drop. So a dimensionless relaxation time is defined here using the dimension of nasal valveand the pressure drop across the whole nasal model. This relaxation time as defined by
�+ = �0d2a D
′h�P
�2L ′ (7)
is taken as a parameter that defines particle deposition by the nasal valve.The two factors defined here only partially represent what is truly happening in the nasal airway. However, it is
found by this study that vestibule region and nasal valve region are critical for particle deposition; and the two factorsdefined based on these two structures can be used to provide the good empirical fit to all of the data obtained by thisstudy. These two important structures are sufficiently close to one another that a strong interaction between them canbe expected. Accordingly, it is reasonable to use a combination of these two factors to represent the ability of nasalpassage to capture particles. Thus, an empirical equation of PDE including a Stokes number and this dimensionlessrelaxation time is proposed as follows:
PDE = 1 − exp(a · Stk · �+) (8)
where a is an empirical constant. Gravitational settling and diffusion had little effect in this study and they are notincluded in the empirical equation. The deposition efficiency data for both the fibrous and spherical particle depositionand regression line for the proposed empirical equation are shown in Fig. 8. The total deposition efficiency values foronly the fibrous particles in all of the nasal model were regressed and yielded a parameter estimate of −0.0457 for awith an R2 value of 0.962.

Z. Wang et al. / Aerosol Science 39 (2008) 1040–1054 1051
Fig. 8. Comparison between experimental values and empirically estimated deposition efficiencies for both fibrous and spherical particles.
Eq. (8) can be modified into other forms under different situations. For a single nasal model, the pressure drop acrosscan be approximated by the following relationship:
�P = R · Q1.5 (9)
Thus, the PDE can be expressed as a function of (d2a Q)2P0.33. Kelly et al. (2004) showed that particle depositionefficiency in their models can be calculated as a function of (d2a Q)2.19 (for Viper replica) and (d2a Q)2.06 (for SLAreplica). Digitizing their results and fitting their data shows that their results could also be well fit by (d2a Q)2P0.33.
Particles �10�m under high inhalation flow rates tend to deposit in the vestibule region. In this case, the deposition“hot spot” will be the region before nasal valve and one term equation, only using Stokes’ number, should be adequateto estimate deposition efficiency.
There is significant inter-individual variability in nasal morphology. Some have wider and more forward facingnostrils than those that open downward. These structures allow inhaled air to pass directly to the nasal valve regionwithout a sharp turn. Particle inertial deposition in vestibule region would likely be insignificant and only one variablein equation (8), the relaxation time, would be needed for the deposition calculation. In reality, the nasal valve is likelyto be neither vertical nor planar. The air “jet” after nasal valve might be directed towards the inner wall or a structureof nasal cavity and a situation similar to an inertial impactor is created. Under these circumstances, a Stokes numberbased on the geometry of nasal valve might a better choice for Eq. (8). However, in the absence of models with thesecharacteristics, it is not possible to test these suggestions.
5. Spherical particle deposition
The development of the empirical models here makes full use of the data from the experimental study of particledeposition in human nasal models. It has been shown that glass fiber can be treated as a spherical particle by usingits aerodynamic equivalent diameter to approximate the deposition behavior. Thus, it is reasonable to propose that thedeposition of spherical particles can also follow Eq. (8) where the Stokes number Stk and relaxation time �+ should bedefined as follows:
Stk = �sd2s Q
�A1.5entrance
(10)
�+ = �sd2s D
′h�P
�2L ′ (11)
The regression of data of only the spherical particles yielded a value of a in Eq. (8) of −0.0467 with an R2 value of0.974. Fig. 8 displays the deposition efficiencies of the experimental data for both fibrous and spherical particles against

1052 Z. Wang et al. / Aerosol Science 39 (2008) 1040–1054
Fig. 9. Comparison of nasal friction coefficient estimates between the experimental values and empirical equation.
the product of the Stokes number and relaxation time. The regression for all of the points yields an overall estimate of aequal to −0.0463 with an R2 value of 0.977. The agreement between data points and regression line indicates that theproposed deposition model for human nasal airway can be used to predict particle deposition for both fibrous particlesand spherical particles.
5.1. Pressure drop estimation
The dimension of the nasal airway determines the pressure drop (flow resistance) across the passage. The relationshipof nasal pressure drop to nasal anatomy has been scrutinized for many years. Several models have been proposed butusually there does not exist a model in which the resistance in expressed in terms of the flow rate as well as thenasal anatomical features. Solow and Sandham (1991) used 20 human subjects and for the first time reported Rohrercoefficients for bilateral breathing. They found k1 and k2 values of 147.3 and 347.6 which are roughly similar to thevalues of models II and III of present study. In this research, D’Arcy–Weisbach equation, Eq. (12), was used to developthe equations for pressure drop estimation:
f = �P/�air(L/dh)u2m/2
(12)
D’Arcy–Weisbach equation expresses pressure drop across a flow device such as a pipe, tube, or duct. The frictioncoefficient depends on Re and surface conditions of the duct. The average hydraulic diameter across each model wasused to calculate the flow velocity and Reynolds number. The relationship between friction coefficient and Re wasdepicted by the following equation, where m1 and m2 are constants:
f = m1
Re(1 + m2Re) (13)
um = 4Q
�d2h(14)
Re = �airumdh�
(15)
Pressure drops across each nasal model under various flow rates were used in the regression according to Eq. (13). Theregression results showed that m1 and m2 were 49.3 and 1.92 × 10⁻⁴, respectively. The experimental data points andregression line are shown in Fig. 9, demonstrating that Eqs. (12) and (13) provide a good fit to the experimental data.

Z. Wang et al. / Aerosol Science 39 (2008) 1040–1054 1053
6. Conclusions
In this study, constant flow experiments of the deposition of glass fibers with different lengths were conducted usingthree realistic human nasal models. It was shown that flow rate and fiber length increased the total deposition efficiencyand thus, inertial impaction is primarily responsible for the deposition under the conditions of this study. For these glassfibers, the deposition mostly occurred in the middle part of the nasal model where both the nasal valve and turbinatesreside. It was found that glass fibers orientate their major axes parallel to the inner wall before deposition occurs. It wasfound that fibrous particle deposition could be calculated from spherical particle results using equations for impactionequivalent diameters of the fibers (cylinder shape) as given in this study. An empirical model developed using a Stokesnumber and a non-dimensional relaxation time fit the deposition data of both the fibrous and spherical particles quitewell. In addition, a method to estimate the pressure drop across the nasal models was also suggested. Thus, particledeposition in human nasal models can be predicted if the cavity dimensions of the model is known.
Acknowledgments
This research is supported by theNational Institute forOccupationalHealth andSafety throughGrantR01OH003900.The authors would like to thankMr. Gregory Deye at National Institute for Occupational Safety and Health for valuablediscussions and suggestions. The authors also appreciate Mr. Douglas Leonard’s work in the manufacture of the nasalmodels.
References
Balásházy, I., Moustafa, M., & Hofmann, W. (1990). Fiber deposition in airway bifurcations. Journal of Aerosol Medicine, 3, 243–260.Balásházy, I., Moustafa, M., Hofmann, W., Szöke, R., El-Hussein, A., & Shmed, A. (2005). Simulation of fiber deposition in bronchial airways.
Inhalation Toxicology, 17, 717–727.Baron, P. A. (1994). Asbestos and other fibers by PCM. In NIOSH manual of analytical methods (NMAM) (4th ed.).Baron, P. A., Sorensen, C. M., & Brockmann, J. B. (2001). Nonspherical particle measurements: Shape factors, fractals, and fibers. In: P. A. Baron,
& K. Willeke (Eds.), Aerosol measurement (2nd ed.), New York: Wiley-Interscience.Beeckmans, J. M. (1972). Deposition of ellipsoidal particles in the human respiratory tract. In: T. T. Mercer, P. E. Morrow, & W. T. Dtrober (Eds.),
Assessment of airborne particles IL: Springfield.Blake, T., Castranova, V., Schwegler-Berry, D., Baron, P., Deye, J. G., Li, C. et al. (1998). Effect of fiber length on glass microfiber cytotoxicity.
Journal of Toxicology and Environmental Health, Part A, 54, 243–259.Broday, D., Fichman,M., Shapiro,M., &Gutfinger, C. (1997).Motion of diffusionless particles in vertical stagnation flows—II. Deposition efficiency
of elongated particles. Journal of Aerosol Science, 28, 35–52.Brown, R. C. (1994). Man-made mineral fibers: hazard, risk, and regulation. Indoor Air, 3, 237–247.Cavallo, D., Campopiano, A., Cardinali, G., Casciardi, S., Simone, P. D., Kovacs, D. et al. (2004). Cytotoxic and oxidative effects induced by
man-made vitreous fibers (MMVFs) in a human mesothelial cell line. Toxicology, 201, 219–229.Champion, J. A., & Mitragotri, S. (2006). Role of target geometry in phagocytosis. Proceedings of the National Academy of Sciences of the United
States of America, 103, 4930–4934.Cheng, Y. S. (2003). Aerosol deposition in the extrathoracic region. Aerosol Science and Technology, 37, 659–671.Clift, R., Grace, J. R., & Weber, M. E. (1978). Bubbles, drops, and particles. New York: Academic Press.Dishoek, H. (1965). The part of the valve and turbinates in total nasal resistance. International Rhinology, 3, 19–26.Everitt, J. I. (1994). Mechanisms of fiber-induced diseases: Implications for safety evaluation of synthetic vitreous fiber. Regulatory Toxicology and
Pharmacology, 20, S68–S75.Fan, F.-G., & Ahmadi, G. (1995). A sublayer model for wall deposition of ellipsoidal particles in turbulent streams. Journal of Aerosol Science, 26,
813–840.Fox, R. W., & McDonald, A. T. (1999). Introduction to fluid mechanics. (5th ed.), NY: Wiley Incorporate.Fubini, B. (1996). Use of physico-chemical and cell-free assay to evaluate the potential carcinogenicity of fibers. Mechanisms of fibre
carcinogenesis:(pp. 35–54). Lyon, France: IARC Scientific Publications.Gradon, L., & Podgorski, A. (1992). Experimental study on fibrous particle deposition in the human nasal cast. Journal of Aerosol Science, 23,
S469–S472.Harris, R. L., & Fraser, D. A. (1976). A model for deposition of fibers in the human respiratory system. American Industrial Hygiene Association
Journal, 37, 73–89.Hill, I. M., Beswick, P. H., & Donaldson, K. (1995). Differential release of superoxide anions by macrophages treated with long and short fibre
amosite asbestos is a consequence of differential affinity for opsonin. Journal of Occupational and Environmental Medicine, 52, 92–95.Hinds, W. C. (1999). Aerosol technology: Properties, behavior, and measurement of airborne particles. (2nd ed.), New York: Wiley.Kelly, J. T., Asgharian, B., Kimbell, J., &Wong, B. A. (2004). Particle deposition in human nasal airway replicas manufactured by different methods,
Part I: Inertial regime particles. Aerosol Science and Technology, 38, 1036–1071.

1054 Z. Wang et al. / Aerosol Science 39 (2008) 1040–1054
Kesavanathan, J., Bascom, R., & Swift, D. L. (1998). The effect of nasal passage characteristics on particle deposition. Journal of Aerosol Medicine,11, 27–39.
Kesavanathan, J., & Swift, D. L. (1998). Human nasal passage particle deposition: The effect of particle size, flow rate, and anatomical factors.Aerosol Science and Technology, 28, 457–463.
Kim, C. S., Lewars, G. G., Eldridge, M. A., & Sackner, M. A. (1984). Deposition of aerosol particles in a straight tube with an abrupt obstruction.Journal of Aerosol Science, 15, 167–176.
LeMasters, G. K., Lockey, J. E., Yiin, J. H., Hilbert, T. J., Levin, L. S., & Rice, C. H. (2003). Mortality of workers occupationally exposed torefractory ceramic fibers. Journal of Occupational and Environmental Medicine, 45, 440–450.
Lippmann, M. (1990). Effects of fiber characteristics on lung deposition, retention, and disease. Environmental Health Perspectives, 88, 311–317.Lippmann, M. (1993). Biophysical factors affecting fiber toxicity. In D. B. Warheit (Ed.), Fiber toxicology (pp. 259–303). San Diego, CA:
Academic Press.Marsh, G. M., Youk, A. O., Stone, R. A., Buchanich, J. M., Churg, A., & Colby, T. V. (2001). Historical cohort study of US man-made vitreous fiber
production workers: Part II. Mortality from mesothelioma. Journal of Occupational and Environmental Medicine, 43, 757–766.Myojo, T. (1987). Deposition of fibrous aerosol in model bifurcating tubes. Journal of Aerosol Science, 18, 337–347.Otis, A. B., McKerrow, C. B., Bartlett, A., Mead, J., McIlroy, M. B., Selverstone, N. J. et al. (1956). Mechanical factors in distribution of pulmonary
ventilation. Journal of Applied Physiology, 8, 427–443.Paananen, H., Holopainen, M., Kalliokoski, P., Kangas, J., Kotilainen, M., Pennanen, S. et al. (2004). Evaluation of exposure to man-made vitreous
fibers by nasal lavage. Journal of Occupational and Environmental Hygiene, 1, 82–87.Proctor, D. F., & Andersen, I. (1982). The nose: Upper airway physiology and the atmospheric environment. Amsterdam: Elsevier Biomedical Press.Solow, B., & Sandham, A. (1991). Nasal airflow characteristics in a normal sample. European Journal of Orthodontics, 13, 1–6.Stahlhofen, W., Rudolf, G., & James, A. C. (1989). Intercomparison of experimental regional aerosol deposition data. Journal of Aerosol Medicine,
2, 285–308.Su, W. C., & Cheng, Y. S. (2005). Deposition of fiber in the human nasal airway. Aerosol Science and Technology, 39, 888–901.Vorwald, A. J., Durkin, T.M., & Pratt, P. C. (1951). Experimental studies of asbestosis. AmericanMedical Association Archives of Industrial Hygiene
and Occupational Medicine, 3, 1–43.Wang, Z., Hopke, P. K., Baron, P. A., Ahmadi, G., Cheng, Y. S., Deye, G. et al. (2005). Classification and the influence of average air humidity.
Aerosol Science and Technology, 39, 1056–1063.Yu, C. P., Asgharian, B., Yen, B. M. (1986). Impaction and sedimentation deposition of fibers in airways. American Industrial Hygiene Association
Journal, 42, 72–77.Zamankhan, P., Ahmadi, G., Wang, Z. C., Hopke, P. K., Cheng, Y. S., Su, W. C. et al. (2006). Airflow and deposition of nano-particles in a human
nasal cavity. Aerosol Science and Technology, 40, 463–476.