Embed Size (px)
Citation preview

Investigation on the pressure behavior of injectors influencedby waterflood-induced fractures: field cases in Huaqing reservoir,Changqing Oilfield, ChinaYang Wang1,*, Shiqing Cheng1, Kaidi Zhang2, and Xiaoping An3
1 State Key Laboratory of Petroleum Resources and Prospecting, China University of Petroleum, 102249 Beijing, China2 Lusheng Petroleum Development Company Limited, SINOPEC Shengli Oilfield Company, 257000 Dongying, China3 PetroChina Changqing Oilfield Company, 710018 Xi’an, China
Received: 20 July 2019 / Accepted: 20 February 2020
Abstract. Pressure transient behaviors of water injectors with the influence of Waterflood-Induced Fractures(WIFs) in unconventional tight oil reservoirs are much more complicated than hydraulic fracturing producersdue to the variation of the WIF properties in the field-testing period. In this paper, we present the interpreta-tion on five different types of Bottom-Hole Pressure (BHP) responses for water injectors by combining a com-mercial simulator tool and our proposed models, where the Shrinking Fracture Length (SFL) and DecreasingFracture Conductivity (DFC) effects are captured for single long WIF while the multiple fracture closures effectis characterized for multiple WIFs. Results show that the commonplace phenomena of prolonged storage effect,bi-storage effect, and interpreted considerably large storage coefficient suggest that WIF(s) may initiate bylong-time water injection. Based on this interpreted large storage coefficient, the fracture half-length can beestimated. The upward buckling of pressure derivative curve may not necessarily be caused by closed outerboundary condition, but the Decreasing of Fracture Conductivity (DFC). As for multiple WIFs, they wouldclose successively after shutting in the well due to the different stress conditions perpendicular to fracture walls,which behaves as several unit slopes on the pressure derivative curves in log–log plot. Aiming at different rep-resentative types of BHP responses cases in Huaqing reservoir, Changqing Oilfield, we innovatively analyzethem from a different perspective and get a new understanding of water injector behaviors, which provides aguideline for the interpretation of water injectors in tight oil reservoirs.
Nomenclature
A Fracture surface area, m2
Afb1, Afb2, Afb3
Surface area of three secondaryfractures, m2
Afrb1, Afrb2, Afrb3
Relative surface area of three secondaryfractures, dimensionless
Afm Surface area of main fracture at the end ofinjection, m2
B Water volume factorCw Wellbore-storage coefficient, m3/Pacf Fracture compliance, m/MPaCf Fracture-storage coefficient, m3/Pa
cfm Leak-off coefficient of main fracture,m/h0.5
CLb1, CLb2, CLb3
Leak-off coefficient of three secondaryfractures, m/h0.5
CLm Leak-off coefficient of main fracture,m/h0.5
CLm1, CLm2, CLm3, CLm4
Equivalent leak-off coefficient in thefractured falloff period, m/h0.5
ct Total compressibility, MPa�1
E Plane strain modulus, MPah Reservoir height, mk Permeability, 10�3lm2
p Pressure, 10�3lm2
pki Closure pressure in any direction, MPapnet Net pressure in the fracture, MPa* Corresponding author: [email protected]
This is an Open Access article distributed under the terms of the Creative Commons Attribution License (https://creativecommons.org/licenses/by/4.0),which permits unrestricted use, distribution, and reproduction in any medium, provided the original work is properly cited.
Oil & Gas Science and Technology – Rev. IFP Energies nouvelles 75, 20 (2020) Available online at:�Y. Wang et al., published by IFP Energies nouvelles, 2020 ogst.ifpenergiesnouvelles.fr
https://doi.org/10.2516/ogst/2020013
REGULAR ARTICLEREGULAR ARTICLE

pshut-in Bottom-hole pressure in the shut-inmoment, MPa
p0wD Dimensionless bottom-hole pressure whenfracture begins to shrink
q Water injection rate, m3/drp Ratio of permeable fracture surface area to
the gross fracture area, dimensionlessRF Fracture radius in radius fracture
model, mSchoke
Choked-fracture skinSfs Fracture-face skintp Fractured injection time at the end of
injection, hxF Fracture half-length, mxF0 Fracture half-length in the shut-in
moment, mVfrac Volume of the fracture, m3
Vfrac,mf Volume of main fracture, m3
Vfrac,b1, Vfrac,b2, Vfrac,b3
Volume of three secondary fractures, m3
Vl,bf1, Vl,bf2, Vl,bf3
Flow volume from three secondaryfractures into matrix, m3
Vl,mf
Flow volume from main fracture intomatrix, m3
Vp Accumulated volume of water injected infractured injection period, m3
�w Fracture width, mDt Time interval, hDtfc1, Dtfc2, Dtfc3
Fracture closure moment of three sec-ondary fractures, h
DtfcD1, DtfcD2, DtfcD3
Dimensionless fracture closure moment ofthree secondary fractures, dimensionless
a Area exponent, dimensionlessrmax Maximum principal stress, MParmin Minimum principal stress, MPah Included angle between the fracture
direction and maximum principal stress,radian
l Water viscosity, mPa s
Subscript
D DimensionlessF Fracturem Matrix
Superscript
� Laplace transform
1 Introduction
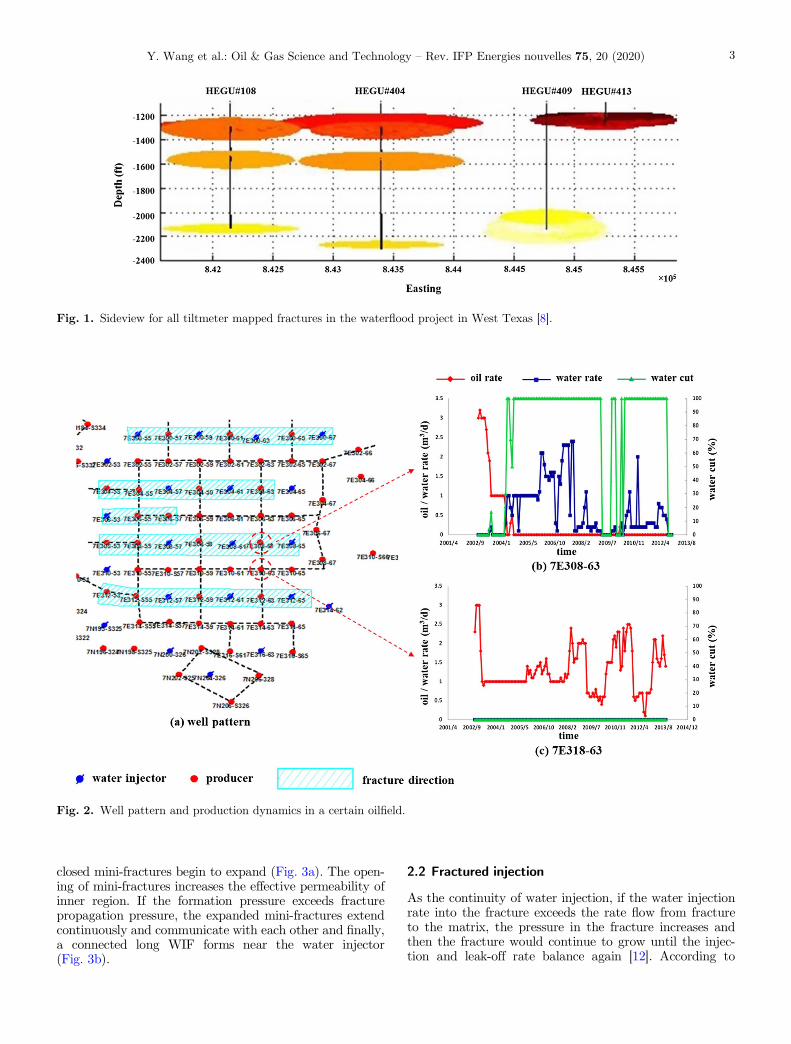
Waterflooding is one of the most commonly used develop-ment methods in the field of petroleum industry and thereare growing evidences showing that water injection mayinduce formation fracturing [1–5]. The long WIFs may becaused by plugging effects, depletion (poro-elastic), thermaleffects, and so on [6, 7]. As shown by Wright et al. [8] inWest Texas by tiltmeter data, the half-length of the WIFscan reach a surprising 450–650 ft (70–100% of well spacing)as seen in Figure 1.
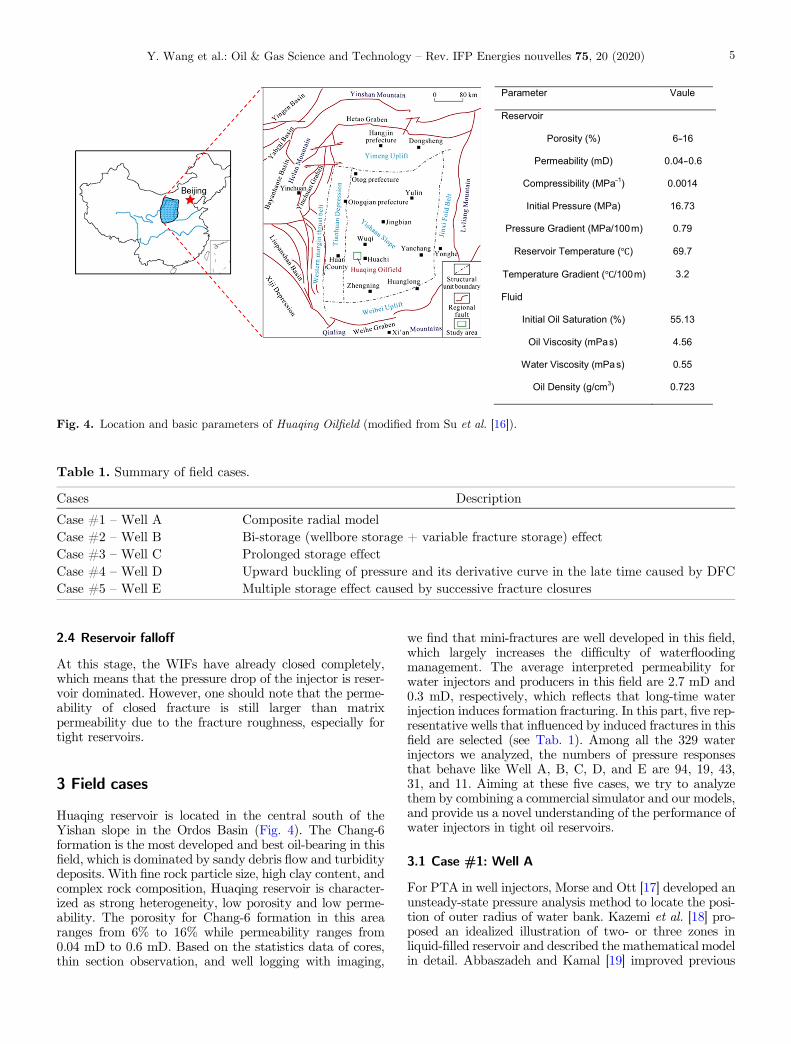
These WIFs may be beneficial in improving injectivityor injection rates. However, if they are not managedadequately, it could be of great disadvantage (e.g., pre-matured water breakthrough in producers, steep rise inoilfield overall water-cut profiles, unpredictable floodpattern, poor sweep), which would lead to undesired oilfieldperformance [9]. Figure 2 shows an example in a certainoilfield. The inverted nine-spot pattern is adopted in thisfield (Fig. 2a). Influenced by WIFs in West–East direction,the performances of production wells in different positionsare totally different. Quick water breakthrough, accompa-nied with low oil rate and high water cut, occurs in produc-ers along the WIF direction (Fig. 2b) while long-term lowproduction rate is sustained for producers that perpendicu-lar to WIF (Fig. 2c). Such dynamic behaviors of WIFs needto be timely and carefully evaluated in the waterfloodingprogram. Since it is difficult to detect the features of thereservoir and fractures underground, Pressure-TransientAnalysis (PTA) becomes a desirable choice to evaluate wellperformances and reservoir characteristics (i.e., averageformation permeability, wellbore-storage effects, skinfactor, fracture properties) on the basis of Bottom-HolePressure (BHP) data in a more economical and environ-mentally friendly way.
This paper aims at presenting several representativeBHP responses of water injectors with WIF(s). Firstly,the dynamic evolution of WIF(s) in water injector ispresented. After that, five common and typical pres-sure responses of water injectors in Huaqing reservoir,Changqing Oilfield, are interpreted by combining a commer-cial simulator (KAPPA Workstation 5.12) and models weproposed [10, 11] together to give us a new and comprehen-sive understanding of the BHP behaviors in water injectors.
2 The dynamic evolution of WIF(s) in waterinjector
We divide the whole water injection process into four stagesas following (Fig. 3).
2.1 Reservoir injection
Generally, there are lots of closed mini-fractures underreservoir condition in tight formation. Due to the limitedabsorption capacity, the BHP of water injector increasesrapidly as the process of water injection. When the forma-tion pressure exceeds fracture opening pressure, the original
Y. Wang et al.: Oil & Gas Science and Technology – Rev. IFP Energies nouvelles 75, 20 (2020)2
closed mini-fractures begin to expand (Fig. 3a). The open-ing of mini-fractures increases the effective permeability ofinner region. If the formation pressure exceeds fracturepropagation pressure, the expanded mini-fractures extendcontinuously and communicate with each other and finally,a connected long WIF forms near the water injector(Fig. 3b).
2.2 Fractured injection
As the continuity of water injection, if the water injectionrate into the fracture exceeds the rate flow from fractureto the matrix, the pressure in the fracture increases andthen the fracture would continue to grow until the injec-tion and leak-off rate balance again [12]. According to
Fig. 2. Well pattern and production dynamics in a certain oilfield.
Fig. 1. Sideview for all tiltmeter mapped fractures in the waterflood project in West Texas [8].
Y. Wang et al.: Oil & Gas Science and Technology – Rev. IFP Energies nouvelles 75, 20 (2020) 3

monitoring and analysis results in oilfields, two scenariosare given:
� Single WIF: Generally, the WIF seems to follow themaximum stress direction [13, 14], which can be easilyunderstood because the stress perpendicular to thefracture walls for maximum principal stress directionis least. This long fracture continues to grow as theprocess of water injection, which can even reachseveral times of well spacing. The waterfloods inWestern Canada [12] and Ordos basin in China vali-date this phenomena. This dynamic process issketched in Figures 3cI and 3dI.
� Multiple WIFs: The secondary fractures may alsoinitiate when the pressure in the fracture exceeds thestress perpendicular to fracture walls in specificdirection. As the continuously process of water injec-tion, both main fracture and secondary fracturescontinue to propagate, which shown in Figures 3cIIand 3dII.
2.3 Fracture falloff
Different with the propped (static) hydraulic fracturesaround producers, the WIF(s) around water injectorswould close gradually after shutting in the well becausethere are no proppants inside (full of water). Similarly,
two scenarios are shown for single WIF and multipleWIFs, respectively:
� Single WIF: One may easily imagine that the fracturewidth reduces as fracture closing, which results in theDFC effect. In the meantime, experiments from vanDam et al. [15] showed that the fracture surfaces makemechanical contact at the tip first, and then subse-quently towards the wellbore, which is called Shrink-ing Fracture Length (SFL) in this study. Thisdynamic process is shown in Figures 3eI and 3fI.
� Multiple WIFs: As for multiple fractures, due to thedifferent stress conditions in the WIFs, they maynot close at the same time, but successively. Thiscan be explained as the equation (1): the closure/opening pressure (pki) of WIFs in a specific direction,which depends on the maximum principal stress, rmax,minimum principal stress, rmin and included anglebetween the fracture direction and maximum princi-pal stress, h. Obviously, the closure pressure (pki)increases as the increase of included angel (h), andequal to rmin and rmax in maximum and minimumprincipal stress directions, respectively. Thus, theWIF with larger included angle closes first, and lastlyto the maximum principal direction. This dynamicprocess is shown in Figures 3eII and 3fII.
pki ¼ rmin þ rmax � rminð Þ sin h; ð1Þ
Fig. 3. Schematic of dynamic evolution of WIF in water injector.
Y. Wang et al.: Oil & Gas Science and Technology – Rev. IFP Energies nouvelles 75, 20 (2020)4
2.4 Reservoir falloff
At this stage, the WIFs have already closed completely,which means that the pressure drop of the injector is reser-voir dominated. However, one should note that the perme-ability of closed fracture is still larger than matrixpermeability due to the fracture roughness, especially fortight reservoirs.
3 Field cases
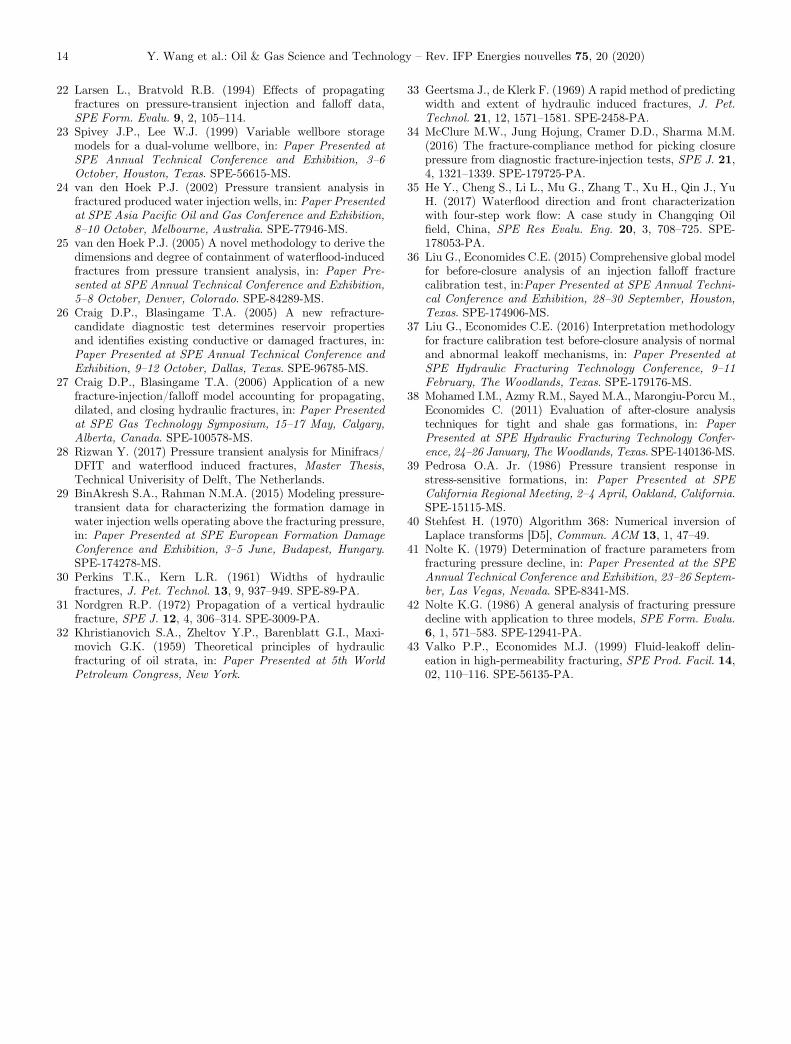
Huaqing reservoir is located in the central south of theYishan slope in the Ordos Basin (Fig. 4). The Chang-6formation is the most developed and best oil-bearing in thisfield, which is dominated by sandy debris flow and turbiditydeposits. With fine rock particle size, high clay content, andcomplex rock composition, Huaqing reservoir is character-ized as strong heterogeneity, low porosity and low perme-ability. The porosity for Chang-6 formation in this arearanges from 6% to 16% while permeability ranges from0.04 mD to 0.6 mD. Based on the statistics data of cores,thin section observation, and well logging with imaging,
we find that mini-fractures are well developed in this field,which largely increases the difficulty of waterfloodingmanagement. The average interpreted permeability forwater injectors and producers in this field are 2.7 mD and0.3 mD, respectively, which reflects that long-time waterinjection induces formation fracturing. In this part, five rep-resentative wells that influenced by induced fractures in thisfield are selected (see Tab. 1). Among all the 329 waterinjectors we analyzed, the numbers of pressure responsesthat behave like Well A, B, C, D, and E are 94, 19, 43,31, and 11. Aiming at these five cases, we try to analyzethem by combining a commercial simulator and our models,and provide us a novel understanding of the performance ofwater injectors in tight oil reservoirs.
3.1 Case #1: Well A
For PTA in well injectors, Morse and Ott [17] developed anunsteady-state pressure analysis method to locate the posi-tion of outer radius of water bank. Kazemi et al. [18] pro-posed an idealized illustration of two- or three zones inliquid-filled reservoir and described the mathematical modelin detail. Abbaszadeh and Kamal [19] improved previous
Parameter Vaule
Reservoir
Porosity (%) 6-16
Permeability (mD) 0.04-0.6
Compressibility (MPa-1) 0.0014
Initial Pressure (MPa) 16.73
Pressure Gradient (MPa/100 m) 0.79
Reservoir Temperature ( 69.7
Temperature Gradient ( /100 m) 3.2
Fluid
Initial Oil Saturation (%) 55.13
Oil Viscosity (mPa s) 4.56
Water Viscosity (mPa s) 0.55
Oil Density (g/cm3) 0.723
)
Fig. 4. Location and basic parameters of Huaqing Oilfield (modified from Su et al. [16]).
Table 1. Summary of field cases.
Cases Description
Case #1 – Well A Composite radial modelCase #2 – Well B Bi-storage (wellbore storage + variable fracture storage) effectCase #3 – Well C Prolonged storage effectCase #4 – Well D Upward buckling of pressure and its derivative curve in the late time caused by DFCCase #5 – Well E Multiple storage effect caused by successive fracture closures
Y. Wang et al.: Oil & Gas Science and Technology – Rev. IFP Energies nouvelles 75, 20 (2020) 5

models by taking the variation of fluid mobility and diffu-sivity in the reservoir into consideration. Then, Kong andLu [20] presented an interpretation method for water injec-tor and developed a solving process for two-bank systemsthat possessing sharp change in interface. The pressureand its derivative curves are plotted in log–log coordinate,which has been widely used nowadays.
Basic data of water injector Well A is shown in Table 2and the corresponding BHP responses in 2006 and 2008 arepresented in Figure 5, which behave as composite radialreservoir. We assume that the formation is homogeneousand isotropic with constant thickness, and the interfacelocation of the two-bank system is immobile during thefield-testing period. In addition, thermal and gravitationaleffects are ignored. The commercial simulator (KAPPAWorkstation 5.12) is adopted to match these BHPresponses. The matching and interpretation results areshown in Figure 5 and Table 3, respectively. Traditionally,the composite radial model in water injector is explained asthe fluid mobility contrast in each bank [19]. Based on thediscussion of “The Dynamic Evolution of WIF(s) in WaterInjector”, we think this mobility difference can be reflectedin two aspects:
� Water viscosity is generally smaller than oil underreservoir condition.
� Permeability in the inner region is larger than outerregion because of the long time water erosion andthe re-opening of original closed fractures (seeFig. 3a).
The increasing of inner radius from 42.9 m in 2006 to88 m in 2008 indicates the moving of waterflooding front.At the same time, the increase of permeability from1.06 mD to 4.48 mD illustrates that the re-activation oforiginal closed fractures improves the effective permeabilityin the inner region.
Since the field-testing pressure of Well A after 2008 isunavailable, we would like to analyze the performance ofthis well from dynamic production data to verify the varia-tion of flow pattern during water injection. There are sixproducers named B1, B2, B3, B4, B5, and B6 around injec-tor Well A (Fig. 6). The production histories of Well B1,B4, and B6 are given in Figure 7. It is shown that the watercut of Well B1 surged from 14.18% to 53.44% in December2009 (Fig. 7a) while the water cut of Well B4 soared from0% to 92.67% in October 2009 (Fig. 7b). The unexpectedand abrupt water breakthrough in B1 and B4 suggests thatthe WIF may be induced in B1–A–B4 direction, which isline with the maximum principle stress direction. The per-formances of the producers in the two sides of B1–A–B4are quite different with Well B1 and B4. Taking B6 as arepresentative, the production history is plotted inFigure 7c, which shows stable oil production and watercut. The distinct behaviors between these wells confirmthe existence of WIF in B1–A–B4 direction again. Theseperformances validate the evolution of WIF during waterinjection process in Figure 3.
One should note that well testing analysis is an inversequestion, which suffers from non-uniqueness. This non-uniqueness may come from the reservoir uncertainties itself,
Table 2. Basic data of Well A.
(1) Well data
Well name A Type of well Water injector
Water injection rate 25 m3/d Well bottom 2135.5 mWell radius 0.124 m Total compressibility 0.00178 MPa�1
(2) Oil horizon and perforation data
Horizon Reservoir interval(m–m)
Thickness (m) Porosity (%) Perforation(m–m)
Thickness (m)
C6
2069.5–2072.6 3.1
10.5
2072.6–2075.4 2.82075.4–2085.3 9.9 2076.0–2083.0 72086.4–2089.0 2.6
2087.0–2093.06
2089.0–2091.1 2.12091.1–2093.1 22093.1–2096.5 3.42097.4–2101.8 4.4 2097.0–2101.0 42102.6–2106.5 3.9 2103.0–2106.0 32107.4–2110.5 3.12110.5–2115.5 5
(3) Test modePressure falloff test
Y. Wang et al.: Oil & Gas Science and Technology – Rev. IFP Energies nouvelles 75, 20 (2020)6

pressure behavior matching, or the multiple solutions ofmathematical models. In this case, one of the disputesmay be the model selected for Figure 5b. Before applyingradial composite model, the vertical well + one fault andfracture-infinite conductivity models are tried, but unrea-sonable results are obtained. Therefore, we still use radialcomposite model to interpret it. In the actual field, differentmethods are strongly suggested together to lower the uncer-tainties and increase the confidence of the results.
3.2 Case #2: Well B
There are growing evidences, including step rate test,production history of water injector and producer, welltesting analysis, inter-connectivity analysis, indicate theinitiation of WIF in water injection process [21]. The funda-mental differences between propped hydraulic fracturesaround producer and WIFs around water injector are sum-marized in Table 4. Recently, we proposed a new “Fracture– SFL & DFC” model to characterize the BHP behaviors ofwater injector with single long WIF considering the fractureproperties variation in tight reservoir [10]. The flowbetween WIF and reservoir is characterized by fracture-sto-rage effect and fracture-face skin while the flow betweenwellbore and WIF is represented by wellbore storage effectand choked-fracture skin. Compared to the current models[22–27], the novelty of this model is that we take thedynamic variation effects of WIF (e.g., fracture storageeffect, SFL, and DFC) after shutting in the well into consid-eration, which makes our methodology more practical and
reliable. A brief introduction of this model is presented inAppendix A.
Case #2 examines a field case to demonstrate thecharacteristic of bi-storage (wellbore + variable fracturestorage) effect. The basic parameters for Well B is providedin Table 5 and its BHP response is shown in Figure 8. Thebi-storage phenomenon, which characterized by two unitslopes on the pressure derivative curve, dominates thewhole falloff period and masks the reservoir response.Similar pressure responses have also been found in theArabian Peninsula [29]. Using our “Fracture – SFL &DFC”model, we can obtain the matching result of this well,shown in Figure 8.
(a) (b)
Fig. 5. Pressure matching results of Well A in (a) 2006 and (b) 2008.
Table 3. Well testing interpretation results for Well A in 2006 and 2008.
Test time Reservoir model Permeability in theinner region (mD)
Radius (m) Skin Mobility ratio
2006.6 Radial composite 1.06 42.9 �4.39 6.32008.5 Radial composite 4.48 88 �4.42 6.62
Fig. 6. Well pattern of A.
Y. Wang et al.: Oil & Gas Science and Technology – Rev. IFP Energies nouvelles 75, 20 (2020) 7

The interpreted effective permeability is 2.91 mD andthe calculated storage coefficient from the long unit-slopeline in the pressure derivative curve is considerably largeas 8.92 m3/MPa. The significant large storage coefficientsuggests that the WIF(s) that extend to some distances inthe reservoir. After shutting the fractured well, the waterthat stored in the fracture is unloaded and squeezed intoreservoir, which is similar to the phenomenon of wellborestorage effect. We call it as fracture storage effect in this
paper. The relationship between fracture storage coefficientand fracture half-length is comprehensively discussed basedon three 2D models [10], which are,
C f ¼
pxFh2
E for PKN
2px2FhE for KGD
16R2F
3E for Radial
8>>><>>>:
; ð2Þ
Fig. 7. Production history curves. (a) B1, (b) B4, and (c) B6.
Table 4. Comparison of propped hydraulic fractures around producer and WIFs around water injector (modified fromRizwan [28]).
Propped fractures in producer Fractures in water injector
Type of fracture Static (non-shrinking) Non-static (shrinking)Type of PTA used Pressure build-up Injection fall-offFracture induced intentional or accidental? Intentional AccidentalProppant used? Yes NoFracture closure occurs? No YesFracture storage occurs? No YesClosure induced flow affects PTA? Not observed Strongly observed
Y. Wang et al.: Oil & Gas Science and Technology – Rev. IFP Energies nouvelles 75, 20 (2020)8

where Cf is fracture storage coefficient, xf is fracture half-length, h is fracture height, E is the plane-strain modulus,RF is the fracture radius of a radial fracture. PKN model isassumed by Perkins and Kern [30] and Nordgren [31],which denotes the fracture length is larger than the frac-ture height while KGD is abbreviation of Khristianovichet al. [32] and Geertsma and de Klerk [33], which assumesthat fracture height is more than the fracture length.Radial model occurs for fracture propagation from a pointsource of injection, as an intermediate condition betweenthe two limiting cases of the PKN and KGD models.
From equation (2), we find that the fracture storagecoefficient decreases with the SFL. Therefore, a slightly lar-ger than unit slope in the fracture storage is identified,which is a new flow regime – variable fracture storage - inwater injectors. In this field, the plane-strain modulus isapproximately 10 000 MPa, reservoir thickness is 23.9 m.
Therefore, the fracture half-length is estimated as 49.7 mby PKN model.
3.3 Case #3: Well C
This case examines a field case of Well C that seems quitecommon, but extremely easy to be misinterpreted if theWIF is not well realized or understood. The basic informa-tion of this well is given in Table 6 and its BHP behavior isshown in Figure 9. The pressure and its derivative curvescoincide as unit slope and last about three log cycles, whichsignifies the severe storage effect. Due to this long storageperiod, the true reservoir response is masked completely.A commercial simulator (KAPPA Workstation 5.12) isused to match this pressure behavior (see Fig. 9). The inter-preted reservoir permeability is 0.38 mD and the matchedstorage coefficient from this long unit-slope line in thepressure and its derivative curves is considerably large as22.7 m3/MPa. Similarly, we use the method in Case #2,the fracture half-length can also be estimated as 121.4 m.
Different with bi-storage effect in Case #2, the wellboreand fracture storage curve merge into single long unit slopein this case. This is because there is no extra pressure dropbetween wellbore and WIF, that is, the wellbore and WIFcan be considered as the whole system. Since the WIF isnot hold by proppant, but full of water, it would close grad-ually with the decreasing of BHP after shutting in the well.As a result, the water that stored in the WIF is squeezedinto the formation, behaving like storage effect. If there isno pressure drop between the wellbore and WIF, it hadbeen validated that the total storage coefficient is attribu-ted by four parts: compressibility of water in the wellbore,change rate of wellbore volume, compressibility of waterin the fracture, and change rate of fracture volume.Generally, the change rate of wellbore volume and com-pressibility of water in the fracture are negligible comparedto another two terms [10]. Thus, the interpreted storagecoefficient of 22.7 m3/MPa is actually the total storage coef-ficient, including wellbore and fracture. That is [10, 34],
Table 5. Basic data of Well B.
(1) Well data
Well name B Type of well Water injector
Water injection rate 40 m3/d Well bottom 2247.0 mWell radius 0.124 m Total compressibility 0.00138 MPa�1
(2) Oil horizon and perforation data
Horizon Reservoir interval(m–m)
Thickness (m) Porosity (%) Perforation(m–m)
Thickness (m)
C6
2194.6–2199.2 4.6
10.31
2195–2199 4.02199.9–2202.3 2.42202.6–2204.1 1.52207.7–2212.1 4.4 2208–2210 2.02216.6–2227.6 11 2217–2221 4.0
(3) Test modePressure falloff test
Fig. 8. History matching result of Well B by use of the modelwe proposed.
Y. Wang et al.: Oil & Gas Science and Technology – Rev. IFP Energies nouvelles 75, 20 (2020) 9

C s ¼ Cw þ C f ¼ cfluid � Vw þ C f ; ð3Þwhere Cs is total storage coefficient, Cw is wellbore storagecoefficient, Cf is fracture storage coefficient, cfluid is thefluid (water) compressibility, Vw is wellbore volume.
In most cases, fracture storage coefficient is severalorders of magnitude larger than wellbore storage [9]. There-fore, the wellbore storage coefficient can be ignored whencalculating the fracture half-length by total storagecoefficient.
3.4 Case #4: Well D
This case shows another “common and conventional” waterinjector Well D and provide us a new understanding on it.
The basic information of this well is presented in Table 7 andthe BHP response is shown in Figure 10. We find that thepressure and its derivative curve coincide in the early timeand then separate, followed by the upward buckling of pres-sure derivative curve in the late time, which is generally con-sidered as the existence of closed boundary near the well.This closed might be caused by sedimentary facies, lithologychange, the drainage areas of several other wells, and so on.Meanwhile, we found that the interpreted storage coefficientis very large, which is similar with Case #3. One of the big-gest differences of WIF and propped hydraulic fracture isthat it closes gradually as the decrease of BHP during thefield-testing period. As a result, the fracture conductivityis decreasing during the fracture closing process, which hasa big influence on BHP response. In our previous study[10], we have validated that the DFC effect would lead tothe upward buckling of pressure derivative curve in the latetime. Fracture linear and bi-linear flow characteristics corre-sponding to 0.5 and 0.25 slopes for different conductivitiesmay not be observed in water injectors with WIF becauseof the change of fracture geometry, which would not occurin producers with propped hydraulic fractures during welltesting period. Using “Fracture – SFL & DFC” model, weinterpreted the Well D, shown in Figure 10. The resultsare given in Table 8.
The interpreted permeability is 0.37 mD, suggesting thepoor flow condition around this well. The fracture-face skinis 1. This means that there exists pressure drop in the frac-ture face, which may be the reason of “filter cake”, caused bylong time water injection. As for fracture half-length, werecommend combine two methods to decrease the uncer-tainty of the analysis and double check the results. One isthe method presented in Case 2 by the matched consider-ably large storage coefficient value. The other one is conven-tional well testing analysis, that is, matching the typical
Table 6. Basic data of Well C.
(1) Well data
Well name C Type of well Water injector
Water injection rate 20 m3/d Well bottom 2221.63 mWell radius 0.12 m Total compressibility 0.00137 MPa�1
(2) Oil horizon and perforation data
Horizon Reservoir interval(m–m)
Thickness (m) Porosity (%) Perforation(m–m)
Thickness (m)
C6
1949.7–1954.2 4.5
13.14
1961.1–1965.0 3.9 1962–1965 3.01965.3–1966.3 1.02172.5–2175.7 3.2 2174–2178 4.02176.7–2180.2 3.52180.9–2185.1 4.22185.7–2188.1 2.42189.0–2190.7 1.7
(3) Test modePressure falloff test
Fig. 9. History matching result of Well C by use of the Saphir.
Y. Wang et al.: Oil & Gas Science and Technology – Rev. IFP Energies nouvelles 75, 20 (2020)10

curve with measured pressure data. In theory, the fracturehalf-length values estimated by these two methods shouldbe very close to each. However, due to the uncertainty offormation parameters and the non-uniqueness results ofpressure-transient analysis, neither of these methods arethat reliable for the field cases. For Well D, the matchedstorage coefficient is 43.3 m3/MPa, which should not bewellbore storage coefficient only that presented in Case#3. Anand and Subrahmanyam [9] demonstrated thatthe fracture storage coefficient � wellbore storagecoefficient. Therefore, Cf � 43.3 m3/MPa in this case, whichis used to calculate fracture half-length as 73.5 m viaequation (2). This is consistent with the fracture half-length(90 m) matched by “Fracture – SFL & DFC” model.
The meaning of this example is that it reminds us theupward buckling of pressure derivative of water injectorin the late time may not necessarily related to closed bound-ary, but the decreasing of fracture conductivity caused byfracture closing process.
3.5 Case #5: Well E
Some evidences show that waterflooding may also inducemultiple fractures during long time water injection [35].Compared with single fracture closure, the characterizationof the closure of multiple fractures is much more compli-cated. According to equation (1), we conclude that thefracture open/closure pressure varies in different directions,which increases with the increase of h. Specially, fractureclosure pressure is equal to rmin and rmax in maximumand minimum principal stress directions, respectively.Because the different stress condition perpendicular to thefracture walls, the WIFs would not close simultaneously,but successively. Assuming the same pressure system inthe fractures, Liu and Economides [36, 37] proposed amathematical model to describe the multiple closures inMini-Frac analysis based on the classical Carter’s model,which indicates that the rate of fluid loss decreases withtime at any point along the fracture. Leak-off coefficientis used to characterize the fluid loss ability from fractureinto matrix and the rate of fluid flow behavior can be rep-resented as qL ¼ 2CLAffiffiffiffiffi
t�sp , among which CL is leak-off coeffi-
cient, qL is fluid-loss rate, A is the element of the fracturearea, t is the time measured from the start of pumping,s is the time when fracture is created or opened. He assumedthat each fracture (main and secondary fractures) has ownleak-off coefficient and area, which makes his model verylimited due to too many unknown parameters need to besolved. Applying Liu’s research in Mini-Frac analysis towaterflooding field, we propose a new “Multiple Fracture
Table 7. Basic data of Well D.
(1) Well data
Well name D Type of well Water injector
Water injection rate 24 m3/d Well bottom 2159 mWell radius 0.108 m Total compressibility 0.001178 MPa�1
(2) Oil horizon and perforation data
Horizon Reservoir interval(m–m)
Thickness (m) Porosity (%) Perforation(m–m)
Thickness (m)
C6 2085.3–2135.9 41.6 9.18 – –
(3) Test modePressure falloff test
Fig. 10. History matching result of Well D by use of the modelwe proposed.
Table 8. Well testing interpretation results for Well D.
Well Storagecoefficient(m3/MPa)
Permeability(mD)
Fracture-faceskin
Fracturehalf-length(m)
Fracture –
SFL & DFC43.3 0.37 1 90
Y. Wang et al.: Oil & Gas Science and Technology – Rev. IFP Energies nouvelles 75, 20 (2020) 11

Closures” model, in which the closure of WIFs areequivalent to the decrease of leak-off rate (the rate at whicha fracturing fluid flows from the fracture into the surround-ing formation) in the main fracture (Appendix B) [11].We find that 3/2 slope recognized by Mohamed et al. [38]in Mini-Frac analysis would not appear in waterflooding,but unit slope instead, which can be interpreted as fracturestorage effect.
The basic information and the BHP responses of Well Eare shown in Table 9 and Figure 11, respectively. Severalcharacteristics are identified.
� The pressure drop slows down repeatedly and thepressure derivative shows multiple fluctuations.
� Several unit slopes in the pressure derivative areidentified.
� Storage coefficient interpreted by the commercialsimulator is considerably large as 7.93 m3/MPa, andthe interpreted permeability is 3.14 mD.
Firstly, a commercial simulator (KAPPA Workstation5.12) is used to interpret this pressure behavior and thematching result is shown in Figure 11a. We find that thefluctuations of pressure derivative curve cannot match bycurrent models. In our previous paper [11], we havecomprehensively discussed that such pressure characteris-tics shown above may be cause by multiple fracture closuresduring the shutting in period. In this case, five fractures areassumed since there are five unit slopes in the pressurederivative curve. Interpreted by our “Multiple FractureClosures” model, we match the pressure behavior, which isshown in Figure 11b. The interpretation results of leak-offcoefficient for each fracture are CLm1 = 0.4 m/h0.5, CLm2 =0.3 m/h0.5, CLm3 = 0.16 m/h0.5, CLm4 = 0.055 m/h0.5,CLm5 = 0.015 m/h0.5. By the equation CL ¼0:563�p
ffiffiffiffiffiffiffiffik/C tl
q[34], we can obtain the reservoir permeabil-
ity as 0.16 mD, which is consistent with the formationpermeability in this field.
Table 9. Basic data of Well E.
(1) Well data
Well name E Type of well Water injector
Water injection rate 45 m3/d Well bottom 2239.0 mWell radius 0.12 m Total compressibility 0.00132 MPa�1
(2) Oil horizon and perforation data
Horizon Reservoir interval(m–m)
Thickness (m) Porosity (%) Perforation(m–m)
Thickness (m)
C6 2197.4–2237.5 40.1 11.12 – –
(3) Test modePressure falloff test
(a) (b)
Fig. 11. Comparison of the matching results of Well E between (a) Saphir and (b) Model we proposed.
Y. Wang et al.: Oil & Gas Science and Technology – Rev. IFP Energies nouvelles 75, 20 (2020)12

4 Conclusion
This work intends to show a comprehensive analysis ofpressure responses in water injection wells considering theinfluence of WIF(s). After interpreting several hundredsof water injection wells in Changqing Oilfield, China, wefind that the BHP performances of water injectors withWIF(s) are much more complicated compared with frac-tured producers due to the variation of fracture properties.Aiming at five representative types of BHP responses, weinnovatively analyze them by combining a commercialsimulator (KAPPA Workstation 5.12) and our new modelsto get a new understanding of water injector behaviors.Results show that the closing of WIF(s) during the fieldtesting period should be paid particular attentions wheninterpreting the BHP behaviors. If they are not well realizedor characterized, misleading interpretation results may beobtained.
Acknowledgments. The authors thank the financial supportsfrom National Natural Science Foundation of China(No. 11872073) and National Science and Technology MajorProjects (No. 2017ZX05013002). We also would like to thankthe PetroChina Ltd. in Changqing Oilfield for providing data forour studies. An earlier version of this work was presented as aconference paper at the SPE Improved Oil Recovery Conferenceheld in Tulsa, Oklahoma, USA as SPE 190264 and the feedbackobtained from colleagues in this forum is greatly appreciated.
References
1 Koning E.J.L. (1988) Waterflooding under fracturing condi-tions, PhD Thesis, Technical Univerisity of Delft, TheNetherlands.
2 Ovens J.E.V., Larsen F.P., Cowie D.R. (1997) Making senseof water injection fractures in the Dan field, in: PaperPresented at SPE Annual Technical Conference and Exhi-bition, 5–8 October, San Antonio, Texas. SPE-38928-MS.
3 Izgec B., Kabir C.S. (2009) Real-time performance analysisof water-injection wells, SPE Res. Evalu. Eng. 12, 1, 116–123. SPE-109876-PA.
4 Wang Y., Cheng S., Feng N., He Y., Yu H. (2017) Thephysical process and pressure-transient analysis consideringfractures excessive extension in water injection wells, J. Pet.Sci. Eng. 151, 2017, 439–454.
5 He Y., Cheng S., Li S., Huang Y., Qin J., Hu L., Yu H. (2017)A semianalytical methodology to diagnose the locations ofunderperforming hydraulic fractures through pressure-tran-sient analysis in tight gas reservoir, SPE J. 22, 3, 924–939.SPE-185166-PA.
6 Gadde P.B., Sharma M.M. (2001) Growing injection wellfractures and their impact on waterflood performance, in:Paper Presented at SPE Annual Technical Conference andExhibition, 30 September–3 October, New Orleans, Louisi-ana. SPE-71614-MS.
7 Hustedt B., Zwarts D., Bjoerndal H.P. (2006) Inducedfracturing in reservoir simulations: Application of a newcoupled simulator to waterflooding field examples, in: PaperPresented at SPE Annual Technical Conference and Exhibi-tion, 24–27 September, San Antonio, Texas. SPE-102467-MS.
8 Wright C.A., Weijers L., Davis E.J., Mayerhofer M. (1999)Understanding hydraulic fracture growth: Tricky but nothopeless, in: Paper Presented at SPE Annual TechnicalConference and Exhibition, 3–6 October, Houston, Texas.SPE-56724-MS.
9 Anand A., Subrahmanyam S.G.V. (2014) Induced fracturemodelling and its integration with pressure transient anal-ysis: Study for Shallow-water Offshore Field, South-EastAsia – Part 1, in: Paper Presented at Abu Dhabi Interna-tional Petroleum Exhibition and Conference, 10–13 Novem-ber, Abu Dhabi, UAE. SPE-171882-MS.
10 Wang Y., Cheng S., Zhang K., Ayala L.F. (2019) Investiga-tion on the transient pressure response of water injectorcoupling the dynamic flow behaviors in the wellbore,waterflood-induced fracture and reservoir: Semi-analyticalmodeling and a field case, Int. J. Heat Mass Trans. 130,2019, 668–679.
11 Wang Y., Cheng S., Zhang K., He Y., Yu H. (2019) Pressure-transient analysis of water injectors considering the multipleclosures of waterflood-induced fractures in tight reservoir:Case studies in Changqing Oilfield, China, J. Pet. Sci. Eng.172, 2019, 643–653.
12 Baker R., Dieva R., Jobling R., Lok C. (2016) The mythsof waterfloods, EOR floods and how to optimize realinjection schemes, in: Paper Presented at SPE ImprovedOil Recovery Conference, 11–13 April, Tulsa, Oklahoma.SPE-179536-MS.
13 Morales R.H., Abou-Sayer A.S., Jones A.H., Al-Saffar A.(1986) Detection of a formation fracture in a waterfloodingexperiment, J. Pet. Technol. 38, 10, 1113–1121.
14 Heffer K.J., Fox R.J., McGill C.A., Koutsabeloulis N.C.(1997) Novel techniques show links between reservoir flowdirectionality, earth stress, fault structure and geomechan-ical changes in mature waterfloods, SPE J. 2, 2, 91–98. SPE-30711-PA.
15 van Dam D.B., Pater C.J., Romijn R. (1998) Analysis ofhydraulic fracture closure in laboratory experiments, in: PaperPresented at SPE/ISRM Rock Mechanics in PetroleumEngineering, 8–10 July, Trondheim, Norway. SPE-47380-MS.
16 Su H., Lei Z., Zhang D., Li J., Zhang Z., Ju B., Li Z. (2017)Dynamic and static comprehensive prediction method ofnatural fractures in fractured oil reservoirs: A case study ofTriassic Chang 63 reservoirs in Huaqing Oilfield, OrdosBasin, NW China, Petrol. Explor. Dev. 44, 6, 972–982.
17 Morse J.V., Ott III F. (1967) Field Application of unsteady-state pressure analyses in reservoir diagnosis, J. Pet. Tech-nol. 19, 7, 869–876. SPE-1514-PA.
18 Kazemi H., Merrill L.S., Jargon J.R. (1972) Problems ininterpretation of pressure fall-off tests in reservoirs with andwithout fluid banks, J. Pet. Technol. 24, 9, 1147–1156. SPE-3696-PA.
19 Abbaszadeh M., Kamal M. (1989) Pressure-transient testingof water-injection wells, SPE Res. Eng. 4, 1, 115–124. SPE-16744-PA.
20 Kong X., Lu D. (1991) Pressure falloff analysis of waterinjection well, Society of Petroleum Engineers. SPE-23419-MS.
21 Wang Y., Cheng S., Zhang K., He Y., Feng N., Qin J.,Luo L., Yu H. (2019) A comprehensive work flow tocharacterize waterflood-induced fracture by integratingreal-time monitoring, formation test, and dynamic produc-tion analysis applied to Changqing Oilfield, China, SPE Res.Evalu. Eng. 22, 692–708. Preprint. SPE-191370-PA.
Y. Wang et al.: Oil & Gas Science and Technology – Rev. IFP Energies nouvelles 75, 20 (2020) 13
22 Larsen L., Bratvold R.B. (1994) Effects of propagatingfractures on pressure-transient injection and falloff data,SPE Form. Evalu. 9, 2, 105–114.
23 Spivey J.P., Lee W.J. (1999) Variable wellbore storagemodels for a dual-volume wellbore, in: Paper Presented atSPE Annual Technical Conference and Exhibition, 3–6October, Houston, Texas. SPE-56615-MS.
24 van den Hoek P.J. (2002) Pressure transient analysis infractured produced water injection wells, in: Paper Presentedat SPE Asia Pacific Oil and Gas Conference and Exhibition,8–10 October, Melbourne, Australia. SPE-77946-MS.
25 van den Hoek P.J. (2005) A novel methodology to derive thedimensions and degree of containment of waterflood-inducedfractures from pressure transient analysis, in: Paper Pre-sented at SPE Annual Technical Conference and Exhibition,5–8 October, Denver, Colorado. SPE-84289-MS.
26 Craig D.P., Blasingame T.A. (2005) A new refracture-candidate diagnostic test determines reservoir propertiesand identifies existing conductive or damaged fractures, in:Paper Presented at SPE Annual Technical Conference andExhibition, 9–12 October, Dallas, Texas. SPE-96785-MS.
27 Craig D.P., Blasingame T.A. (2006) Application of a newfracture-injection/falloff model accounting for propagating,dilated, and closing hydraulic fractures, in: Paper Presentedat SPE Gas Technology Symposium, 15–17 May, Calgary,Alberta, Canada. SPE-100578-MS.
28 Rizwan Y. (2017) Pressure transient analysis for Minifracs/DFIT and waterflood induced fractures, Master Thesis,Technical Univerisity of Delft, The Netherlands.
29 BinAkresh S.A., Rahman N.M.A. (2015) Modeling pressure-transient data for characterizing the formation damage inwater injection wells operating above the fracturing pressure,in: Paper Presented at SPE European Formation DamageConference and Exhibition, 3–5 June, Budapest, Hungary.SPE-174278-MS.
30 Perkins T.K., Kern L.R. (1961) Widths of hydraulicfractures, J. Pet. Technol. 13, 9, 937–949. SPE-89-PA.
31 Nordgren R.P. (1972) Propagation of a vertical hydraulicfracture, SPE J. 12, 4, 306–314. SPE-3009-PA.
32 Khristianovich S.A., Zheltov Y.P., Barenblatt G.I., Maxi-movich G.K. (1959) Theoretical principles of hydraulicfracturing of oil strata, in: Paper Presented at 5th WorldPetroleum Congress, New York.
33 Geertsma J., de Klerk F. (1969) A rapid method of predictingwidth and extent of hydraulic induced fractures, J. Pet.Technol. 21, 12, 1571–1581. SPE-2458-PA.
34 McClure M.W., Jung Hojung, Cramer D.D., Sharma M.M.(2016) The fracture-compliance method for picking closurepressure from diagnostic fracture-injection tests, SPE J. 21,4, 1321–1339. SPE-179725-PA.
35 He Y., Cheng S., Li L., Mu G., Zhang T., Xu H., Qin J., YuH. (2017) Waterflood direction and front characterizationwith four-step work flow: A case study in Changqing Oilfield, China, SPE Res Evalu. Eng. 20, 3, 708–725. SPE-178053-PA.
36 Liu G., Economides C.E. (2015) Comprehensive global modelfor before-closure analysis of an injection falloff fracturecalibration test, in:Paper Presented at SPE Annual Techni-cal Conference and Exhibition, 28–30 September, Houston,Texas. SPE-174906-MS.
37 Liu G., Economides C.E. (2016) Interpretation methodologyfor fracture calibration test before-closure analysis of normaland abnormal leakoff mechanisms, in: Paper Presented atSPE Hydraulic Fracturing Technology Conference, 9–11February, The Woodlands, Texas. SPE-179176-MS.
38 Mohamed I.M., Azmy R.M., Sayed M.A., Marongiu-Porcu M.,Economides C. (2011) Evaluation of after-closure analysistechniques for tight and shale gas formations, in: PaperPresented at SPE Hydraulic Fracturing Technology Confer-ence, 24–26 January, TheWoodlands, Texas. SPE-140136-MS.
39 Pedrosa O.A. Jr. (1986) Pressure transient response instress-sensitive formations, in: Paper Presented at SPECalifornia Regional Meeting, 2–4 April, Oakland, California.SPE-15115-MS.
40 Stehfest H. (1970) Algorithm 368: Numerical inversion ofLaplace transforms [D5], Commun. ACM 13, 1, 47–49.
41 Nolte K. (1979) Determination of fracture parameters fromfracturing pressure decline, in: Paper Presented at the SPEAnnual Technical Conference and Exhibition, 23–26 Septem-ber, Las Vegas, Nevada. SPE-8341-MS.
42 Nolte K.G. (1986) A general analysis of fracturing pressuredecline with application to three models, SPE Form. Evalu.6, 1, 571–583. SPE-12941-PA.
43 Valko P.P., Economides M.J. (1999) Fluid-leakoff delin-eation in high-permeability fracturing, SPE Prod. Facil. 14,02, 110–116. SPE-56135-PA.
Y. Wang et al.: Oil & Gas Science and Technology – Rev. IFP Energies nouvelles 75, 20 (2020)14
Appendix A
Derivation of the closure of single WIF consideringproperties variations
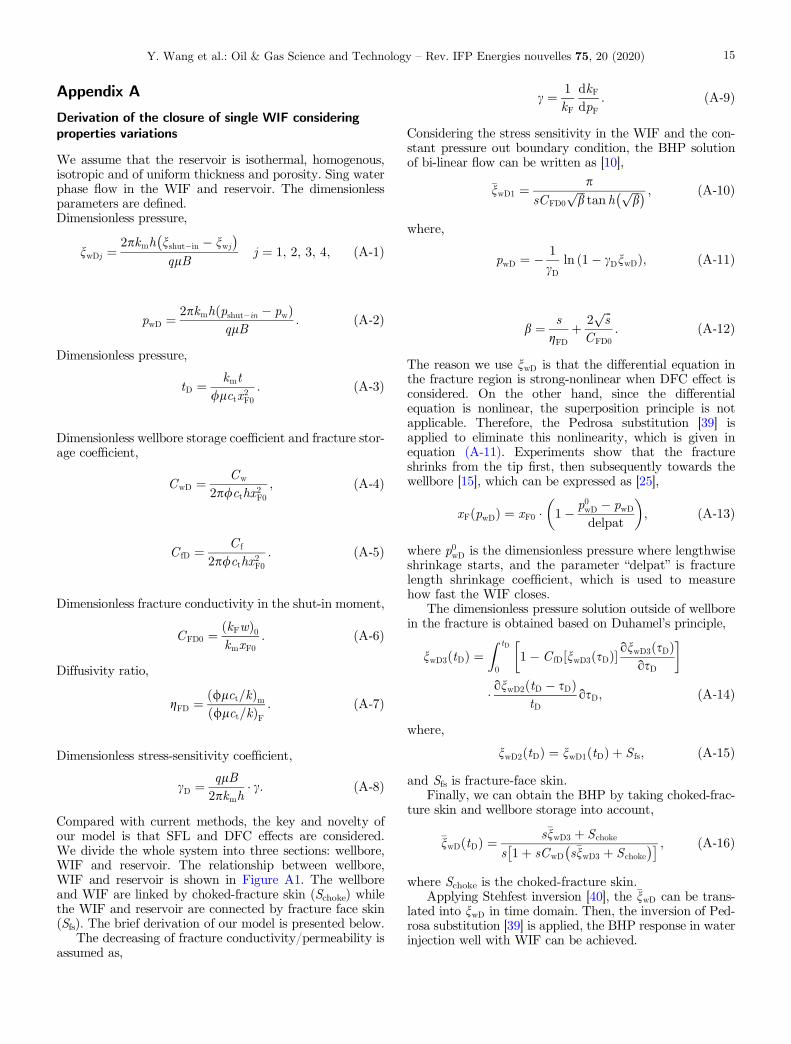
We assume that the reservoir is isothermal, homogenous,isotropic and of uniform thickness and porosity. Sing waterphase flow in the WIF and reservoir. The dimensionlessparameters are defined.Dimensionless pressure,
nwDj ¼2pkmh nshut�in � nwj
� �qlB
j ¼ 1; 2; 3; 4; ðA-1Þ
pwD ¼ 2pkmh pshut�in � pwð ÞqlB
: ðA-2Þ
Dimensionless pressure,
tD ¼ kmt/lctx2F0
: ðA-3Þ
Dimensionless wellbore storage coefficient and fracture stor-age coefficient,
CwD ¼ Cw
2p/cthx2F0; ðA-4Þ
C fD ¼ C f
2p/cthx2F0: ðA-5Þ
Dimensionless fracture conductivity in the shut-in moment,
CFD0 ¼ kFwð Þ0kmxF0
: ðA-6Þ
Diffusivity ratio,
gFD ¼ /lct=kð Þm/lct=kð ÞF
: ðA-7Þ
Dimensionless stress-sensitivity coefficient,
cD ¼ qlB2pkmh
� c: ðA-8Þ
Compared with current methods, the key and novelty ofour model is that SFL and DFC effects are considered.We divide the whole system into three sections: wellbore,WIF and reservoir. The relationship between wellbore,WIF and reservoir is shown in Figure A1. The wellboreand WIF are linked by choked-fracture skin (Schoke) whilethe WIF and reservoir are connected by fracture face skin(Sfs). The brief derivation of our model is presented below.
The decreasing of fracture conductivity/permeability isassumed as,
c ¼ 1kF
dkFdpF
: ðA-9Þ
Considering the stress sensitivity in the WIF and the con-stant pressure out boundary condition, the BHP solutionof bi-linear flow can be written as [10],
�nwD1 ¼ p
sCFD0ffiffiffib
ptan h
ffiffiffib
p� � ; ðA-10Þ
where,
pwD ¼ � 1cD
ln 1� cDnwDð Þ; ðA-11Þ
b ¼ sgFD
þ 2ffiffiffis
pCFD0
: ðA-12Þ
The reason we use nwD is that the differential equation inthe fracture region is strong-nonlinear when DFC effect isconsidered. On the other hand, since the differentialequation is nonlinear, the superposition principle is notapplicable. Therefore, the Pedrosa substitution [39] isapplied to eliminate this nonlinearity, which is given inequation (A-11). Experiments show that the fractureshrinks from the tip first, then subsequently towards thewellbore [15], which can be expressed as [25],
xF pwDð Þ ¼ xF0 � 1� p0wD � pwDdelpat
� �; ðA-13Þ
where p0wD is the dimensionless pressure where lengthwiseshrinkage starts, and the parameter “delpat” is fracturelength shrinkage coefficient, which is used to measurehow fast the WIF closes.
The dimensionless pressure solution outside of wellborein the fracture is obtained based on Duhamel’s principle,
nwD3 tDð Þ ¼Z tD
01� C fD nwD3 sDð Þ½ � onwD3 sDð Þ
osD
� �
� onwD2 tD � sDð ÞtD
osD; ðA-14Þ
where,
nwD2 tDð Þ ¼ nwD1 tDð Þ þ S fs; ðA-15Þand Sfs is fracture-face skin.
Finally, we can obtain the BHP by taking choked-frac-ture skin and wellbore storage into account,
�nwD tDð Þ ¼ s�nwD3 þ S choke
s 1þ sCwD s�nwD3 þ S choke
� � ; ðA-16Þ
where Schoke is the choked-fracture skin.Applying Stehfest inversion [40], the �nwD can be trans-
lated into nwD in time domain. Then, the inversion of Ped-rosa substitution [39] is applied, the BHP response in waterinjection well with WIF can be achieved.
Y. Wang et al.: Oil & Gas Science and Technology – Rev. IFP Energies nouvelles 75, 20 (2020) 15

Appendix B
Derivation of multiple closures of WIFs modelling
Weuse themodels presented by [41, 42], Liu andEconomides[36, 37] as a starting point. Mini-Frac analysis and mate-rial balance function are combined to derive the BHPresponse of water injector with multiple WIFs. We assumethe main and secondary fractures share the same pressuresystem.The abbreviatedderivation of themodel is developedbelow.
The relationship between fracture width and net pres-sure is defined as,
cf ¼ �wpnet
; ðB-1Þ
where cf is fracture compliance, m/MPa; �w is average frac-ture width, m; pnet is the net pressure on fracture surface,which can be calculated as,
pnet ¼ pfrac tð Þ � rresistant ¼ pw tð Þ � rresistant; ðB-2Þand rresistant is the confining stress on the fracture face,MPa.
Average fracture width is,
�w ¼ V frac
A: ðB-3Þ
For the falloff analysis, we define Dpw(t) as,
�pw tð Þ ¼ pws � pw tð Þ; ðB-4Þwhere pws is the BHP in the shut-in moment, MPa; pw isBHP, MPa.
Combining equations (B-1)–(B-4) yields,
d�pwdt
¼ � dpnet tð Þdt
¼ � ddt
�wcf
� �¼ � d
dtV frac
cfA
� �: ðB-5Þ
If a main fracture and three secondary fractures areassumed and each fracture has its flow coefficient and frac-ture area. The pressure drop in these fractures is ignored.According to material balance function, we have,
V l;mf þ V frac;mf þ V l;bf1 þ V frac;bf1 þ V l;bf2 þ V frac;bf2
þV l;bf3 þ V frac;bf3 ¼ V p: ðB-6ÞThe flow volume from main fracture and secondary frac-tures to matrix is [36],
V l;mf ¼ 4rpCLmffiffiffiffitp
pAfmg �tD; að Þ
V l;bf1 ¼ 4rpCLb1ffiffiffiffitp
pAfb1g �tD; að Þ
V l;bf2 ¼ 4rpCLb2ffiffiffiffitp
pAfb2g �tD; að Þ
V l;bf3 ¼ 4rpCLb3ffiffiffiffitp
pAfb3g �tD; að Þ
: ðB-7Þ
This g function is defined by [41] and later reformulatedby [43]. It gives the ratio of the flow rate from fracture intothe matrix to the quantity 4CLAftp
0.5, but now is valid forall times greater than the end of pumping while g0 gavethe ratio only at one time point, namely exactly at theend of pumping (Valko and Economides, 1999),
g �tD; að Þ ¼ 2Z 1
0
ffiffiffiffiffiffiffiffiffiffiffiffiffiffiffiffiffiffiffiffiffiffiffiffiffiffiffiffiffiffi1þ�tD � n1=a
qdn; ðB-8Þ
where a is area exponent, which ranges from 1/2 to 1.Combining equations (B-1) through (B-5) and integrat-
ing, yields,
See equation (9) below
where,
�tD ¼ �ttp
; ðB-10Þ
Afrbi ¼ Afbi
Afmi ¼ 1; 2; 3; ðB-11Þ
G �tDð Þ ¼ 4pg �tDð Þ � g0½ �; ðB-12Þ
pw �tð Þ ¼
pshut�in �prp
ffiffiffiffitp
pcfm
CLm þ CLb1Afrb1 þ CLb2Afrb2 þ CLb3Afrb3ð ÞG �tD; að Þ 0 � �t � �tfc1
pf1 �prp
ffiffiffiffitp
pcfm
CLm þ CLb1Afrb1 þ CLb2Afrb2ð Þ G �tD; að Þ �G �tfcD1; að Þ½ � �tfc1 � �t � �tfc2
pf2 �prp
ffiffiffitp
pcfm
CLm þ CLb1Afrb1ð Þ G �tD; að Þ �G �tfcD2; að Þ½ � �tfc2 � �t � �tfc3
pf3 �prp
ffiffiffitp
pCLm
cfmG �tD; að Þ �G �tfcD3; að ÞG �tD; að Þ �G �tfcD3; að Þ½ � �t �tfc3
8>>>>>>>>>>><>>>>>>>>>>>:
; ðB-9Þ
Fig. A1. Schematic of relationship between wellbore, WIF andreservoir.
Y. Wang et al.: Oil & Gas Science and Technology – Rev. IFP Energies nouvelles 75, 20 (2020)16

g0 ¼ g �tD ¼ 0ð Þ: ðB-13ÞEven though above model is more accurate, whichinvestigates the properties of main fracture and secondaryfracture separately. It is very limited because there aretoo many unknown parameters need to be determined.Thus, a simplified model is proposed based on Liu andEconomides [36]. The closure of fractures is considered asthe decreasing of leak-off coefficient in the main fracture.
Then, we can get
See equation (14) below
where CLm1, CLm2, CLm3, and CLm4 are the equivalent leak-off coefficient in the fractured falloff period, m/h0.5.
pw �tð Þ ¼
pshut�in �prp
ffiffiffiffitp
pCLm1
cfmG �tD; að Þ 0 � �t � �tfc1
pf1 �prp
ffiffiffiffitp
pCLm2
cfmG �tD; að Þ �G �tfcD1; að Þ½ � �tfc1 � �t � �tfc2
pf2 �prp
ffiffiffitp
pCLm3
cfmG �tD; að Þ �G �tfcD2; að Þ½ � �tfc2 � �t � �tfc3
pf3 �prp
ffiffiffitp
pCLm4
cfmG �tD; að Þ �G �tfcD3; að Þ½ � �t �tfc3
8>>>>>>>>>>><>>>>>>>>>>>:
; ðB-14Þ
Y. Wang et al.: Oil & Gas Science and Technology – Rev. IFP Energies nouvelles 75, 20 (2020) 17


